year-end holiday survey 2015 pinching pennies for presents · pdf fileyear-end holiday survey...
TRANSCRIPT

Year-end Holiday Survey 2015Pinching pennies for presents

About this surveyThe findings of this report are based on consumer data which has been collected in a survey conducted by Deloitte. This survey covered 14 countries from Western Europe, Eastern Europe, and South Africa, and included 14,065 consumers. A similar survey is conducted in Canada, the United States and Latin America.
The fieldwork was executed with respondents aged between 18 and 65 years old in the last week of September and the first two weeks of October 2015.
Information has been collected via the Internet, with a structured questionnaire for a sample of individuals, within controlled panels. Each consumer in the panel is identified through the following aspects:• Socio-demographics• Personal interests• Consumer behavior
To adjust the Internet sample to the population of each country, we used ex-post statistical weighting. The weighting is based on gender and age in each country.
For all the countries, the survey results were analysed and compared with previous years. The comparisons were only made for questions identical to those used during prior year surveys.
Geographic location of the 14 countries that participated in the survey

Year-end Holiday Survey 2015 Pinching pennies for presents 1
Content
Foreword 2
Key highlights of the 2015 survey 3
Economic outlook 3
Holiday spending 3
What’s in the stocking? 3
Purchasing behaviour 3
Where will South Africans shop this year? 4
Economic overview 5
Deepening consumer blues 6
Hope springs eternal 6
Reigning in the belt 6
Things can only get better 6
Holiday spending 7
Consumers continue cutting back on non-essentials 7
Economic uncertainty and debt drives the decision to spend less this year 8
Despite continued festive spending, retailers may still feel the pinch 8
What’s in the stocking? 9
You don’t always get what you want… 10
Video games and music – still a popular gift choice for SA teens 11
Innovate and educate 11
Purchasing behaviour 13
Savvy shoppers become more resourceful 13
Ethical preferences on the rise 14
What’s happening online? 14
Sticking to stores 15
Where will South Africans shop this year? 16
Physical stores trump online shopping for purchases this year 16
Physical stores … more than just a showroom? 16
Convenience stores start to make their mark 16
Times get tough, consumer expectations get tougher … 17
Africa Consumer Business team 19

2
Foreword
Dear reader,
Our long-standing annual year-end Holiday Survey report is now in its 18th year, and in light of the various challenges currently facing the South African economy, the relevance of this publication is greater than ever.
Annually, the festive season proves to be of significance to retailers, whose year-end financial results are often impacted by the last quarter’s sales performance. Although the festive season sees a peak in consumer spending compared to the rest of the year, the extent to which South African consumers will spend their share of wallet in the retail environment reflects the conservative spending sentiments for the 2015 holidays.
Growing demands are being placed on the wallets of consumers, with a weakening rand, rising inflation and accompanying hikes in interest rates, all affecting disposable incomes. Consumers are also becoming more conscious about social responsibility when it comes to the organisations that they support. Therefore, retailers are faced with the challenge of understanding how these and other factors may affect the shopping behaviour of consumers this season, and how they can meet their escalating needs in an ever-complex and connected world.
In an effort to shed light on consumption patterns, and assist retailers to reasonably predict and cater to holiday spend, we have sampled the spending plans and underlying moods of South African consumers
ahead of the 2015 festive season. We have looked at consumer sentiments about the economy, what consumers intend spending their money on this Christmas, what the top gifts to give and receive are this year, what is likely to influence their purchasing decisions (including the impact of promotions and loyalty programmes), as well as where and how consumers intend on doing their Christmas shopping in the midst of growing eCommerce activity. We’ve also looked at the use of social media in gathering and sharing product information.
Where relevant, Deloitte has compared results from this year, to those of 2014, to extract patterns and trends. Our results were also compared with those of a number of European countries, to identify any convergence or divergence of spending habits in the wake of globalisation.
We trust that the findings in this report will be of use and provide some important points to ponder on, and on behalf of the Deloitte firm, we wish you a successful trading season.
André DennisConsumer Business Industry Leader
Welcome to the 18th edition of the Deloitte year-end holiday survey

Year-end Holiday Survey 2015 Pinching pennies for presents 3
Economic outlookGrowth in 2015 has been weaker than expected both globally and locally. Despite recovery in the United States, slower growth seen in China and the continued woes in the Eurozone have put current estimates of global growth at just 2.5%. Challenges in South Africa have put National Treasury’s more recent forecast at a mere 1.4%. Consumer confidence in the country has also taken a hit, reaching a 15 year low in the second quarter of this year. The weakening rand, rising interest rates, increasing taxes, higher food and electricity prices and persistently high unemployment have all contributed to decreased consumer spending. The current view on the economic outlook overall is negative, with higher income brackets, females and the older age group falling on the less optimistic side. However, looking forward into 2016, South Africans seem to be more upbeat than their European counterparts hoping that, with all that has happened in our country in 2015, things can surely only get better.
Holiday spending Given the economic climate, it is not surprising that South Africans have been more conservative in their approach to spending this year. A large portion of consumers are cutting back on non-essentials such as furniture, home décor, holidays, entertainment and leisure. Similar to their European counterparts, the majority of South African consumers are not prepared to cut back spending on crucial products and services such as education, healthcare, energy, financial services, groceries and housing. Gender and age differences play a role in spending preferences, for example younger consumers are less likely to cut back on digital spending, clothing and footwear as they are likely to place greater importance on these categories (relative to others) than older age groups. Although South African consumers are more conservative with respect to holiday spending this year, most consumers are still willing to spend more during the festive season as they want to enjoy the holidays instead of focusing on the poor economic situation. This holds true especially for younger consumers aged 18 – 24 and below average income consumers.
What’s in the stocking?This year the top items consumers expect to receive as gifts are money, chocolates, gift vouchers, clothes and books. This is in line with previous years with gift vouchers gaining popularity versus 2014. These items feature in the top gifts for men, with cosmetics and perfumes and beauty/spa treatments also ranking high with women. The top 4 gifts for teenagers are video games, CDs, cash and clothing items. Educational toys are favoured as the gift of choice for children, a trend seen globally as well. Respondents aged 18 – 24 years are more likely to give innovative and trendy gifts as opposed to older groups who place a greater importance on the educative criterion.
Purchasing behaviourMost South Africans will continue to do their festive season shopping from as early as before November up until the 24th December. While most still brace the shops in the busy build up to Christmas, a significant portion of South Africans will do their festive season shopping before December. This year, savvy South African shoppers have become even more resourceful when making purchasing decisions. They are more likely to seek out a bargain and buy on sale, conduct more online research, make use of their loyalty points, manage their spend by preparing a budget and cut back on impulse buying. As a result, sales like ‘Black Friday’ have become entrenched in the South African retail scene. Loyalty programmes continue to play an important role in shoppers’ decision making process especially for females.
Over and above making their budgets stretch, South African shoppers are also increasingly concerned with the way in which their products are made. Respondents indicated that they will choose to stay away from products that are or have been perceived to be manufactured in a way that is unethical or harmful to the environment. The availability of product information on packaging is also a key motivating factor, with the majority of respondents indicating that this influences their purchase decision. In terms of behaviour when shopping either online or in store, when faced with difficulty in finding their desired product consumers tend to first stick to the channel they are currently using before switching. For example, when unable to find a product on their usual online shop of choice, consumers will first look on another online store or website before going into a store.
Key highlights of the 2015 survey
This year, savvy South African shoppers have become even more resourceful when making purchasing decisions.

4
Where will South Africans shop this year? Physical stores are still relevant for most of South African consumers’ shopping needs, especially for categories such as toys, fashion items, food and drinks, health and beauty and sports goods. A noticeable shift is taking place with products such as high tech products, video games, movies (DVD/Blu-Ray), music and books - which command a larger average share of consumers who will purchase these items online. The convenience factor offered by eCommerce is appealing to shoppers who want the experience of being able to shop 24/7, with readily available information on product availability, price and alternative product comparisons.
Although done to a lesser extent than in Europe, in some cases South Africans have started to use a physical store as a showroom in which to compare products before concluding the transaction online. Interestingly, this year has seen a slight shift from food and drink shopping in the traditional hypermarket sized stores and traditional food shops i.e. butcher, bakery etc. towards the convenience store format. While hypermarket and supermarket outlets remain the primary channel for food shopping, this could indicate consumers may not be stocking their pantries full this year, but rather doing the top-up shopping trips when needed. The in-store experience offered by retailers is just as important as ever, with shoppers expecting more and more from the environments they shop in and the staff they interact with. Retailers will continue to face the challenge of catering to a broad range of constantly evolving consumer needs: • They also need to be able to manage the optimal assortment of product offerings
while also leveraging loyalty programmes• provide an online presence• be able to provide their shoppers with great value for money.
It is clear that in the future, attracting foot traffic into stores will require a lot more than a friendly customer experience and discounted prices.

Year-end Holiday Survey 2015 Pinching pennies for presents 5
Economic overview
Global demand has been weaker than expected in 2015. In November 2014, The Economist Intelligence Unit forecast global growth at 2.9% for 2015, with current estimates at growth at 2.5%, anticipating a slight acceleration in 2016 and beyond. Growth has been supported by continued recovery in the United States, which makes up close to one quarter of global GDP. Other contributors are parts of Europe, notably the United Kingdom and Germany. However, slower growth in China (15% of global GDP) is expected to continue as the country adjusts the structure of its economy which will impact other emerging markets (including South Africa) due to a lower demand for the commodities they currently supply to China. Nevertheless, both China and India – where the economy is benefiting from lower oil prices – are expected to grow at around 7%. Europe in general continues to face a range of problems: from the refugee crisis, to Greek debt, and most recently, the terrorist attacks in Paris, which can be expected to impact ease of movement across borders, potentially dampening tourism spend over the forthcoming holiday season.
Meanwhile, on the home front, the challenges facing South Africa have deepened significantly over the last year. Growth prospects have, once again, been steadily revised downwards, from a bullish forecast above 2%, down to Treasury’s most recent forecast of 1.4%, even lower than the sluggish growth seen in 2014. In the second quarter, consumer confidence slumped to its lowest ebb in more than 15 years, lower even than it was during the wake of the global financial crisis. Although it has recovered somewhat, thanks largely to a moratorium on load-shedding, it remains fragile and negative; with looming industrial action, highly politicised student protests, and the worst drought in sixty years suggesting that it could slump again. At the same time, the weakening rand, rising interest rates (driven by the exchange rate and not an overheated economy), increasing taxes, higher food and electricity prices and persistently high unemployment are all contributing to weakening consumer spending.
Figure 1 I What do you think of the current state of the South African economy? (results by income bracket)
■ Positive ■ Neutral ■ Negative ■ I don’t know
Average Below average income Average income Above average income
7%
29%
61%
3%6%
32%
55%
7%
7%
34%
56%
3%7%
25%
67%
1%
...the challenges facing South Africa have deepened significantly over the last year.

6
Deepening consumer bluesNot surprisingly, this translates into a negative view of the current state of the economy, which is seen as negative by 61% of respondents (compared to 56% in last year and 53% in 2013). Also not surprising, higher income consumers are the most pessimistic: they are most vulnerable to rising interest rates, and have been highly exposed to job losses over the last year, with the decline in employment of managers and professionals exceeding that seen in the 2009 recession. In comparison with their European counterparts, South African consumers are not quite as gloomy about the state of the economy as the Greeks, but are definitely more pessimistic than the Portuguese and the Russians.
Hope springs eternalResults of the 2015 survey revealed that three in five South African respondents have a negative view of the current economy, with only 7% taking a positive view. Optimism seems to gain ground with the outlook for next year, where only two in five South African consumers are negative and 20% take a positive view. Male respondents were significantly more optimistic than women, and respondents under 35 years of age were the most optimistic – with that optimism waning as the age of respondents rises.
Reigning in the beltMore than half of South African respondents felt that their spending power has decreased since last year. In an environment where women are the primary purchase decision makers in many households, female respondents were significantly more downbeat than males (56% compared to 45% respectively), and there was a clear correlation between pessimism and respondents’ ages: 70% of respondents aged 55-64 claimed their spending power has declined, compared to 38% of those aged 18 – 24. Things can only get betterDespite this, 64% of respondents in South Africa believe that their spending power will improve or stay the same in 2016, making them more optimistic than the average European consumer (based on survey responses). Only respondents in the United Kingdom, Spain, The Netherlands and Denmark were more bullish.
Figure 2 I How would you describe your spending power today compared to last year? (results by age group)
■ You have more to spend ■ You have the same amount to spend ■ You have less to spend
Average 18-24 25-34 35-44 45-54 55-64
26%23%
51%
34%
28%
38%
31%
24%
45%
21% 20%
59%
18% 19%
63%
11%
19%
70%

Year-end Holiday Survey 2015 Pinching pennies for presents 7
Consumers continue cutting back on non-essentialsSouth African consumers are maintaining a conservative approach to holiday spending as living expenses continue to rise. This is similar to their European counterparts. When asked whether they anticipate spending more, the same or less on items this year versus last year, a large proportion of South African consumers admitted that they will be spending less on various categories of non-essential items, namely: • Furniture, home décor etc. (38% of consumers
spending less this year)• Holidays (35% spending less) • Entertainment and leisure (33% spending less)
As spending declines on non-essential items, consumers allocate more of their budget to necessities such as: • Groceries and energy (63% of consumers anticipate
spending more this year)• Healthcare (52% spending more)• Housing (49% spending more) and • Education (49% spending more)
South African consumers are also willing to cut spending on certain categories to help stretch their budgets, with 81% of South African consumers citing they are prepared to cut back on day-to-day spending such as lunch, travel, newspapers, snacks and tobacco.
In addition to this, when asked what items they would be willing to cut back spending on should the need arise, consumers cited furniture and home décor (84%), entertainment and leisure (82%), clothing and footwear (76%), holidays (74%) and digital/electronic spending such as TV, broadband and mobile phones (73%). Similar to their European counterparts, the majority of South African consumers are not prepared to cut back spending on crucial products/services such as education (73%), healthcare (72%), essentials such as groceries and energy (65%), financial services (64%) and housing (64%). Consumers’ preferences with respect to cutting back spending also differ by age and gender. Younger consumers between 18 and 24 years old are less likely to cut back on spending compared to consumers above 25 years old, especially on non-essential items such as digital, as well as clothing and footwear. This could be attributed to the fact that younger consumers place greater importance on these items and have less financial commitments than older age groups. South African men are less likely to cut spending on clothing and footwear and digital/electronic spending compared to South African women.
Holiday spending
Figure 3 I In the future, if required, which of these areas would you be prepared to cut back spending on?
■ Not prepared to cut back on ■ Prepared to cut back on
63%
70%
16%
18%
24%
26%
27%
19%
64%
44%
73%
64%
65%
72%
84%
82%
76%
74%
73%
81%
36%
56%
27%
36%
35%
28%
Irregular spending (furniture, do it yourself, decoration, etc.)
Entertainment / leisure (eating-out, gym, cinema, etc.)
Clothing / footwear
Holidays
Digital / electronic spending (TV, broadband, mobile phone etc.)
Day to day spending (lunch, travel, newspapers, snacks, tobacco)
Financial services (insurance, pensions)
Taxes (income taxes, property taxes...)
Education (school fees, private school, tutoring)
Housing (rent, mortgage)
Essentials such as groceries and energy bills
Health (doctor, health insurance)
8
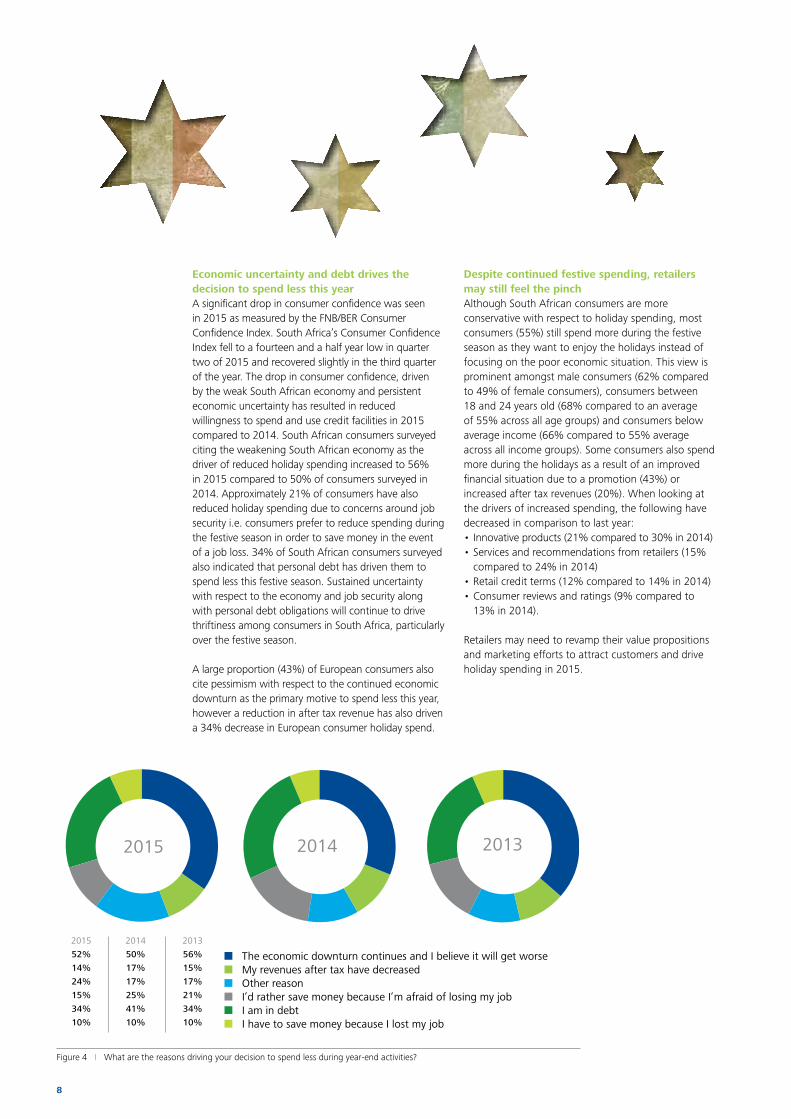
Economic uncertainty and debt drives the decision to spend less this yearA significant drop in consumer confidence was seen in 2015 as measured by the FNB/BER Consumer Confidence Index. South Africa’s Consumer Confidence Index fell to a fourteen and a half year low in quarter two of 2015 and recovered slightly in the third quarter of the year. The drop in consumer confidence, driven by the weak South African economy and persistent economic uncertainty has resulted in reduced willingness to spend and use credit facilities in 2015 compared to 2014. South African consumers surveyed citing the weakening South African economy as the driver of reduced holiday spending increased to 56% in 2015 compared to 50% of consumers surveyed in 2014. Approximately 21% of consumers have also reduced holiday spending due to concerns around job security i.e. consumers prefer to reduce spending during the festive season in order to save money in the event of a job loss. 34% of South African consumers surveyed also indicated that personal debt has driven them to spend less this festive season. Sustained uncertainty with respect to the economy and job security along with personal debt obligations will continue to drive thriftiness among consumers in South Africa, particularly over the festive season.
A large proportion (43%) of European consumers also cite pessimism with respect to the continued economic downturn as the primary motive to spend less this year, however a reduction in after tax revenue has also driven a 34% decrease in European consumer holiday spend.
Despite continued festive spending, retailers may still feel the pinchAlthough South African consumers are more conservative with respect to holiday spending, most consumers (55%) still spend more during the festive season as they want to enjoy the holidays instead of focusing on the poor economic situation. This view is prominent amongst male consumers (62% compared to 49% of female consumers), consumers between 18 and 24 years old (68% compared to an average of 55% across all age groups) and consumers below average income (66% compared to 55% average across all income groups). Some consumers also spend more during the holidays as a result of an improved financial situation due to a promotion (43%) or increased after tax revenues (20%). When looking at the drivers of increased spending, the following have decreased in comparison to last year: • Innovative products (21% compared to 30% in 2014)• Services and recommendations from retailers (15%
compared to 24% in 2014)• Retail credit terms (12% compared to 14% in 2014)• Consumer reviews and ratings (9% compared to
13% in 2014).
Retailers may need to revamp their value propositions and marketing efforts to attract customers and drive holiday spending in 2015.
2015 2014 2013
52% 50% 56%
14% 17% 15%
24% 17% 17%
15% 25% 21%
34% 41% 34%
10% 10% 10%
■ The economic downturn continues and I believe it will get worse■ My revenues after tax have decreased■ Other reason■ I’d rather save money because I’m afraid of losing my job■ I am in debt■ I have to save money because I lost my job
2015 2014 2013
Figure 4 I What are the reasons driving your decision to spend less during year-end activities?

Year-end Holiday Survey 2015 Pinching pennies for presents 9
What’s in the stocking? Cash please…In line with the trend over the past four years, cash has remained a popular gifting option and tops the list as the most anticipated gift of 2015. Unsurprisingly, chocolates, gift vouchers and clothing items take up second, third and fourth place respectively. The expectation of money is not only a local trend but is observed globally. Cash has come out tops in Europe as well (41% of respondents expect to receive a gift of cash) this is in contrast to 2014 when the majority of European respondents expected books to fill their festive stockings.
Smartphones have re-entered the top 10 this year, kicking ‘food and drink’ out of the top 10 from the 2014 results. Although cash remains at the top of their list, men, young adults (18-34), and average and below-average income groups would be delighted to receive this item as a gift this festive season. With new smartphone offerings being launched and smartphone penetration rising steadily, the level of interest in these items remains expectedly high, however given the still high product costs, this desired gift might not materialise in the Christmas stocking. Chocolates, cosmetics/perfumes and gift vouchers are firm favourites of female respondents this year having moved away slightly from the expectation of cash and beauty/spa treatments in 2014 while books and gift vouchers are anticipated by the more mature (35 – 64) and above average income groups.
2015ranking
Top 10 desired gifts: Adults (average)
2014ranking
1st 41.3% Money (cash) 1st 39.4%2nd 40.9% Chocolates 2nd 37.6%3rd 38.3% Gift vouchers 5th 31.9%4th 37.9% Clothes/shoes 4th 34.0%5th 36.9% Books 3rd 35.6%6th 33.6% Jewellery/watches 9th 24.9%7th 32.6% Cosmetics/Perfumes 8th 26.5%8th 29.5% CD 6th 29.1%
9th 28.5%Beauty care, massage,
spa treatment7th 27.9%
10th 25.5% Smartphone 11th 22.2%
Table 1 I What types of presents would you be most likely to receive?
■ 2013 ■ 2014 ■ 2015
63%
70%
52%58%55%
42%46%43%
23%18%20%
15%13%8%
23%16%19%
26%30%21%
21%24%15%
11%14%12%
12%13%9%
I want to enjoy life and avoid thinking about the bad economic situation too much
Promotions
My revenue after tax has increased
The economic situation is more secure
Other reason
Innovations (Products, services, selling methods etc.)
Services and recommendations from retailers
The credit terms offered by the retailers are good
Consumer reviews and ratings
Figure 5 I What are the reasons driving your decision to spend more during year-end activities?
10
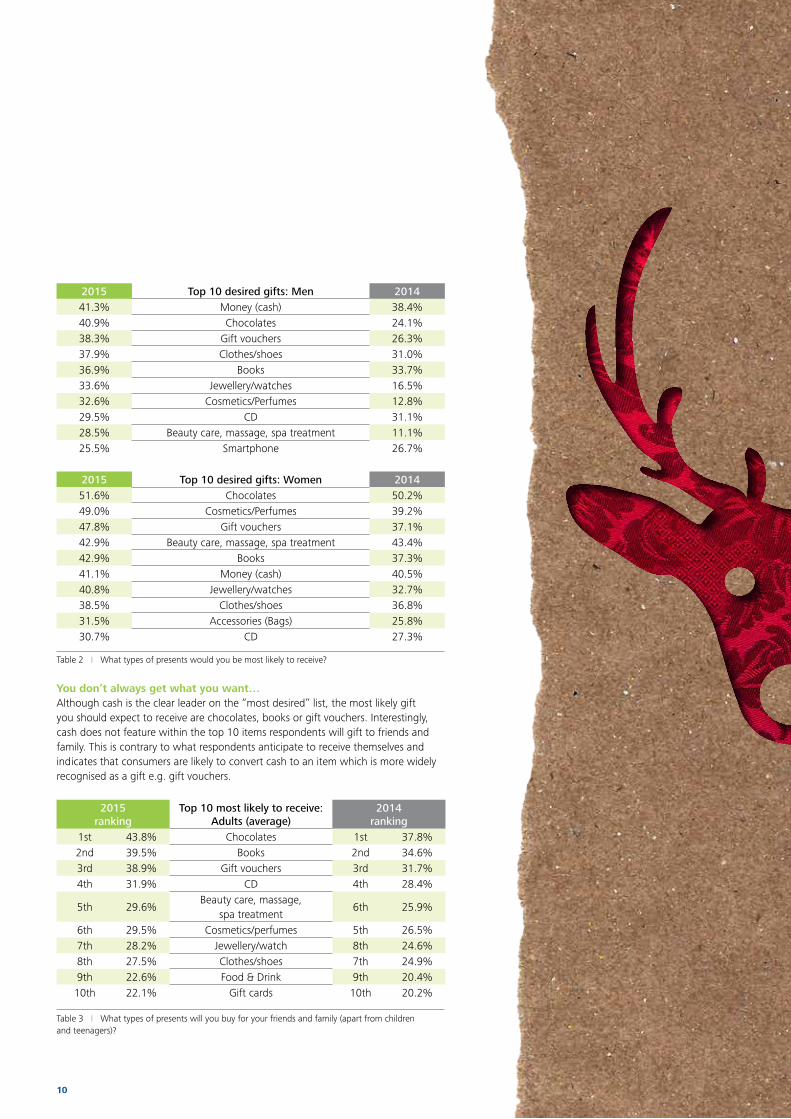
2015 Top 10 desired gifts: Men 201441.3% Money (cash) 38.4%40.9% Chocolates 24.1%38.3% Gift vouchers 26.3%37.9% Clothes/shoes 31.0%36.9% Books 33.7%33.6% Jewellery/watches 16.5%32.6% Cosmetics/Perfumes 12.8%29.5% CD 31.1%28.5% Beauty care, massage, spa treatment 11.1%25.5% Smartphone 26.7%
2015 Top 10 desired gifts: Women 201451.6% Chocolates 50.2%49.0% Cosmetics/Perfumes 39.2%47.8% Gift vouchers 37.1%42.9% Beauty care, massage, spa treatment 43.4%42.9% Books 37.3%41.1% Money (cash) 40.5%40.8% Jewellery/watches 32.7%38.5% Clothes/shoes 36.8%31.5% Accessories (Bags) 25.8%30.7% CD 27.3%
Table 2 I What types of presents would you be most likely to receive?
You don’t always get what you want…Although cash is the clear leader on the “most desired” list, the most likely gift you should expect to receive are chocolates, books or gift vouchers. Interestingly, cash does not feature within the top 10 items respondents will gift to friends and family. This is contrary to what respondents anticipate to receive themselves and indicates that consumers are likely to convert cash to an item which is more widely recognised as a gift e.g. gift vouchers.
2015ranking
Top 10 most likely to receive: Adults (average)
2014ranking
1st 43.8% Chocolates 1st 37.8%2nd 39.5% Books 2nd 34.6%3rd 38.9% Gift vouchers 3rd 31.7%4th 31.9% CD 4th 28.4%
5th 29.6%Beauty care, massage,
spa treatment6th 25.9%
6th 29.5% Cosmetics/perfumes 5th 26.5%7th 28.2% Jewellery/watch 8th 24.6%8th 27.5% Clothes/shoes 7th 24.9%9th 22.6% Food & Drink 9th 20.4%
10th 22.1% Gift cards 10th 20.2%
Table 3 I What types of presents will you buy for your friends and family (apart from children and teenagers)?

Year-end Holiday Survey 2015 Pinching pennies for presents 11
Video games and music – still a popular gift choice for SA teensThe top four gifts for teenagers are video games, CDs, cash and clothing items. Video games are the gift most likely to be given to teenagers both locally and in Europe. CDs are at number two in South Africa unlike in Europe where books are the second favoured option. Cash makes the list as number three both locally and in Europe and is preferred amongst both gift givers and receivers for the freedom of choice it allows recipients in this age group.
2015ranking
Top 10 most likely to receive: Teens (average)
2014ranking
1st 44.3% Games 1st 38.7%2nd 28.1% CD 2nd 25.6%3rd 27.6% Money (cash) 5th 23.2%4th 27.6% Clothes/shoes 6th 22.7%5th 27.1% Chocolates 4th 24.2%6th 24.3% Books 3rd 24.6%7th 23.6% Gift vouchers 9th 17.7%
8th 21.8%Games, role pays, games
accessories…13th 16.1%
9th 21.4% Tablets 14th 16.0%10th 21.3% Smartphone 12th 16.2%
Table 4 I What types of presents will you buy for a teen between the ages of 12 and 18?
Innovate and educateSouth African kids will be in for a treat as parents will most likely opt to buy educational toys, games, dolls and action toys for their children. The trend towards innovative and educational toys is both local and global.
Both men and women have a strong preference towards gifting educational games. Younger respondents (18 – 44) are more likely to give innovative and trendy gifts as opposed to older groups who place a greater importance on the educative criterion and therefore have a much stronger preference to stick with these types of toys.
2015ranking
Top 10 most likely to receive: Children (average)
2014ranking
1st 51.0% Educational toys - -
2nd 42.3% Games 1st 46.6%
3rd 40.7% Dolls & plush 3rd 36.4%
4th 40.4% Clothes/shoes 5th 29.9%
5th 33.0% Baby and infant articles 10th 24.9%
6th 31.4% Books 6th 29.5%
7th 30.2% Arts and crafts, creative design 7th 28.9%
8th 27.0% Model construction toys 8th 28.7%
9th 26.0% Action toys 2nd 36.9%
10th 25.0% Technical toys 9th 28.2%
Table 5 I What types of presents will you buy for anyone under the age of 12?

12
Figure 6 I What criteria do you favour when buying gifts for children?
■ Educative ■ Traditional ■ Green ■ Innovative ■ Trendy
70%
Europe
UK
France
Portugal
Spain
Italy
Greece
Germany
Belgium
Denmark
Poland
Russia
Slovenia
South Africa
54% 14% 8% 14% 10%
40% 22% 5% 18% 15%
55% 15% 7% 10% 13%
70% 7% 7% 10% 6%
71% 5% 6% 11% 7%
48% 20% 12% 17% 3%
69% 10% 3% 11% 7%
25% 23% 15% 24% 14%
62% 13% 6% 11% 8%
38% 21% 9% 11% 21%
62% 16% 2% 10% 10%
51% 15% 7% 7% 20%
59% 10% 7% 15% 9%
64% 8% 4% 17% 7%
The trend towards innovative and educational toys is both local and global.

Year-end Holiday Survey 2015 Pinching pennies for presents 13
For the 2015 festive season, most South Africans surveyed said that they prefer to purchase the majority of their gifts before December (40%) compared to 29% between the 1st and 15th of December and 31% after the 15th of December. In this regard, South African shopping patterns are similar to the UK and France where most consumers prefer to buy their gifts before the frantic December period.
Savvy shoppers become more resourceful In line with the negative economic outlook, South African consumers follow a more conservative approach and are far less likely to make use of loans from family, specialised consumer credit loans or credit offered by retailers. This trend is seen for both men and women of all ages and across income brackets. The “savvy shopper” trend continues, with more and more shoppers seeking out a bargain and buying on sale (57%), conducting more online research (49%)
and using their loyalty points (48%) more than last year. Average to above average income consumers are more likely to manage their spending by preparing a budget and cutting back on impulse buying. Consumers are also more likely to manage their money by buying for fewer people, buying less expensive gifts and shopping at less expensive stores. Buying useful gifts are also favoured this festive season. A total of 81% of South African shoppers will be influenced by promotions to some degree, with 17% indicating an influence on more than half of their spending and 16% indicating their influence on over 75% of their spending. This behaviour is more common in higher income brackets and in the 35-44 age group.
Loyalty programmes continue to play an important role in shoppers’ decision making process, with 69% indicating a medium to high influence on shopping behaviour. This is even higher amongst females (74%) and the 25 – 34 age group (73%). This tendency is well above the average European country with only 44% of respondents indicating a medium to high influence.
Purchasing behaviour
■ Before ■ November ■ 1-15 November December
■ 16-24 ■ 25-31 ■ January and December December After
2015
2014
1%
17%
23%
29%26%
4%
1%
15%
21%
33%
27%
3%
Figure 7 I When do you expect to purchase the majority of your gifts this year versus last year?
Figure 8 I What percent of your year-end spending will be influenced by promotions?
7% ■ None 21% ■ Between 1-25% 27% ■ Between 26-50% 17% ■ Between 51-75% 16% ■ Over 75% 12% ■ I don’t know
Loyalty programmes continue to play an important role in shoppers’ decision making process...

14
Ethical preferences on the rise South African consumer conscience influences their purchasing behaviour with 72% of respondents indicating that they do not buy products involving child labour in production. The availability of product information on packaging is also a key motivating factor, with 68% of respondents indicating that this influences their buying behaviour. Manufacturers whose products do not respect ecological and economical sustainability as well as products that are manufactured in substandard working conditions are often avoided by respondents. These trends indicate that manufacturing companies need to be cognisant that ethical and responsible practices have an impact on both the consumer’s perception of their products and their purchasing behaviour.
What’s happening online?The concept of using a smartphone or tablet as a means to purchase is not foreign to respondents. South Africa is ranked fourth in the countries surveyed of consumers who have used this channel before. Tablets are likely to overtake smartphones as the preferred device for purchases with 61% of respondents indicating that they would use tablets in the future compared to 58% for smartphones.
Social media continues to play a vital role in the South African consumer’s online shopping experience. Consumers mainly use social media to look for information/advice to check prices, research gift ideas, browse products and find discounts, coupons and sale information.
■ 2014 ■ 2015
66%
68%
72%
72%
55%
57%
54%
63%
58%
63%
56%
58%
57%
60%
56%
62%
46%
48%
I am careful about the information provided on the packaging
I do not buy products involving child labour
I will mainly buy products made either in my region or in my country
I avoid buying products that do not respect ecological sustainability
I do not buy products manufactured with bad working conditions in developing countries
I avoid buying products with a substantial carbon impact on the planet
I avoid buying products that do not respect social sustainability
I avoid buying products that do not respect economic sustainability
I avoid buying sustainable products because they are too expensive
Figure 9 I When buying gifts for Christmas, to what extent do these factors influence your buying decision?

Year-end Holiday Survey 2015 Pinching pennies for presents 15
Figure 10 I If a product is not available on your usual online store, what would you most likely do first?
28% ■ Go online to another online store 26% ■ Go online to another website (search engine, price comparison site...) 26% ■ Go to a physical store of a different chain 18% ■ Go to a physical store of the same chain 2% ■ Would not continue shopping for product
Figure 11 I If a product was not available at your usual physical store, what would you most likely do first?
44% ■ Go to another location of the same chain 23% ■ Go to another store of a different chain 13% ■ Go online to the same store’s website 11% ■ Go online to another website (search engine, price comparison...) 6% ■ Would not continue shopping for product 3% ■ Go online to another store’s website
When it comes to online shopping, South African online consumers show a bias towards this channel by first looking to another site (instead of a physical store) if they don’t find the product they are looking for. Of the total survey, 54% of respondents would go to another online store or online to another website (search engine etc.) if a product is not available on the online store that they usually shop at. In comparison, 44% of respondents would go to a physical store of a different chain or a physical store of the same chain. This trend is far more pronounced amongst European online consumers, with 70% of respondents preferring to go to another online store or online to another website.
Sticking to stores South African consumers that shop in physical stores are more likely to stick to this method of shopping than convert to online shopping if a product is not available in a physical store. Of the total survey responses, 67% of respondents would go to another location of the same chain or go to another store of a different chain if a product is not available in a physical store. Only 27% of these respondents would switch to an online platform.
This indicates that whether shopping online or in store, most consumers remain firmly entrenched in their preferred method of shopping. Retailers need to remain mindful of this and give due attention to both channels to fully capture the South African consumer’s purchasing decisions.
16
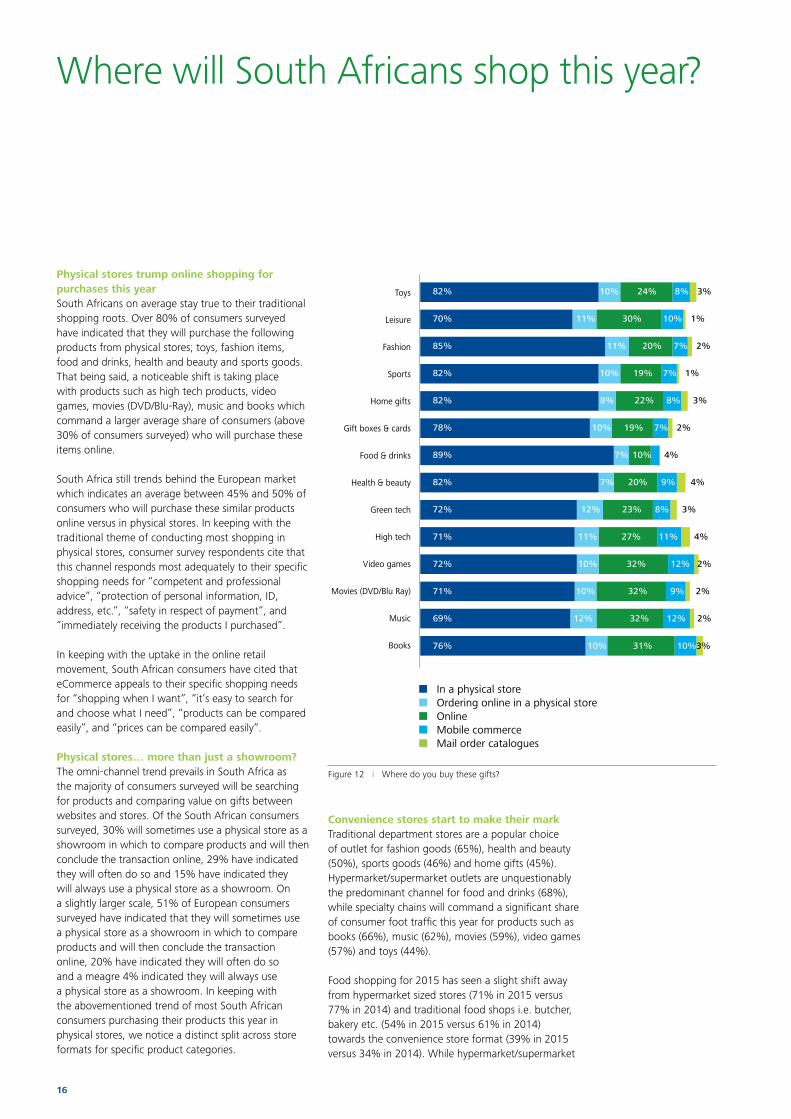
Physical stores trump online shopping for purchases this year South Africans on average stay true to their traditional shopping roots. Over 80% of consumers surveyed have indicated that they will purchase the following products from physical stores; toys, fashion items, food and drinks, health and beauty and sports goods. That being said, a noticeable shift is taking place with products such as high tech products, video games, movies (DVD/Blu-Ray), music and books which command a larger average share of consumers (above 30% of consumers surveyed) who will purchase these items online.
South Africa still trends behind the European market which indicates an average between 45% and 50% of consumers who will purchase these similar products online versus in physical stores. In keeping with the traditional theme of conducting most shopping in physical stores, consumer survey respondents cite that this channel responds most adequately to their specific shopping needs for “competent and professional advice”, “protection of personal information, ID, address, etc.”, “safety in respect of payment”, and “immediately receiving the products I purchased”.
In keeping with the uptake in the online retail movement, South African consumers have cited that eCommerce appeals to their specific shopping needs for “shopping when I want”, “it’s easy to search for and choose what I need”, “products can be compared easily”, and “prices can be compared easily”. Physical stores… more than just a showroom?The omni-channel trend prevails in South Africa as the majority of consumers surveyed will be searching for products and comparing value on gifts between websites and stores. Of the South African consumers surveyed, 30% will sometimes use a physical store as a showroom in which to compare products and will then conclude the transaction online, 29% have indicated they will often do so and 15% have indicated they will always use a physical store as a showroom. On a slightly larger scale, 51% of European consumers surveyed have indicated that they will sometimes use a physical store as a showroom in which to compare products and will then conclude the transaction online, 20% have indicated they will often do so and a meagre 4% indicated they will always use a physical store as a showroom. In keeping with the abovementioned trend of most South African consumers purchasing their products this year in physical stores, we notice a distinct split across store formats for specific product categories.
Convenience stores start to make their mark Traditional department stores are a popular choice of outlet for fashion goods (65%), health and beauty (50%), sports goods (46%) and home gifts (45%). Hypermarket/supermarket outlets are unquestionably the predominant channel for food and drinks (68%), while specialty chains will command a significant share of consumer foot traffic this year for products such as books (66%), music (62%), movies (59%), video games (57%) and toys (44%).
Food shopping for 2015 has seen a slight shift away from hypermarket sized stores (71% in 2015 versus 77% in 2014) and traditional food shops i.e. butcher, bakery etc. (54% in 2015 versus 61% in 2014) towards the convenience store format (39% in 2015 versus 34% in 2014). While hypermarket/supermarket
Where will South Africans shop this year?
■ In a physical store ■ Ordering online in a physical store ■ Online ■ Mobile commerce ■ Mail order catalogues
70%
Toys
Leisure
Fashion
Sports
Home gifts
Gift boxes & cards
Food & drinks
Health & beauty
Green tech
High tech
Video games
Movies (DVD/Blu Ray)
Music
Books
82% 10% 24% 8% 3%
70% 11% 30% 10% 1%
85% 11% 20% 7% 2%
82% 10% 19% 7% 1%
82% 8% 22% 8% 3%
78% 10% 19% 7% 2%
89% 7% 10% 4%
82% 7% 20% 9% 4%
72% 12% 23% 8% 3%
71% 11% 27% 11% 4%
72% 10% 32% 12% 2%
71% 10% 32% 9% 2%
69% 12% 32% 12% 2%
76% 10% 31% 10% 3%
Figure 12 I Where do you buy these gifts?

Year-end Holiday Survey 2015 Pinching pennies for presents 17
outlets remain the primary channel for food shopping, this could indicate consumers may not be stocking their pantries full this year, but rather purchasing on an as needed and more frequent basis, or topping-up essential items throughout the festive season.
Times get tough, consumer expectations get tougher… With the majority of South African consumers still choosing to shop in physical stores this festive season, customer service and in-store experience expectations are highly rated in favour of product knowledge and finding the best possible price. A total of 79% of South African consumers expect store assistants to be knowledgeable about products, while 64% of consumers expect store assistants to inform them on price discounts/offers. As a result retailers and their staff will need to up their game this festive season with their in-store shopping experience – 46% of consumers surveyed expect to be greeted promptly with a welcoming attitude upon entering the store and 40% of consumers expect store assistants to help them pay for their purchases quickly.
While consumers increasingly face the pressure of time constraints, consumers are not willing to forgo a convenient and pleasant shopping experience. In addition to a convenient and pleasant shopping experience, consumers will also look to shop assistants to help the consumer find gifts (35%) and have the ability to match other retailer’s prices (33%). One could argue that the value-for-money trade off against the scarcity of time, would drive consumer expectations to perhaps overlook the in-store experience. However, consumer expectations appear to become more and more demanding each year against factors that all retailers might not be able to compete on. In future, beyond the in-store experience, factors such as price negotiation ability and helping consumers make purchase decisions will become distinguishing factors on which consumers will choose where they do their festive season shopping.
Figure 13 I For the gifts you intend to buy in stores, where do you think you will buy them?
■ Traditional department stores ■ Luxury stores ■ Hypermarkets / supermarkets ■ Specialty chains ■ Traditional local shops■ Factory outlet stores
Toys
Leisure
Fashion
Sports
Home gifts
Gift boxes & cards
Food & drinks
Health & beauty
Green tech
High tech
Video games
Movies (DVD/Blu Ray)
Music
Books
15% 1% 29% 44% 7% 3%
35% 9% 26% 13% 12% 6%
65% 10% 8% 3% 5% 9%
46% 6% 15% 11% 12% 9%
45% 2% 37% 13% 7% 2%
39% 2% 37% 13% 7% 2%
22% 1% 68% 2% 6% 1%
50% 5% 28% 6% 10% 1%
27% 3% 28% 24% 16% 2%
20% 3% 25% 33% 12% 7%
14% 3% 15% 57% 10% 1%
14% 2% 17% 59% 7% 1%
13% 1% 16% 62% 6% 1%
13% 2% 12% 66% 6% 2%

18
Figure 14 I As a shopper, what are your expectations regarding interactions with store assistants?
■ Is knowledgeable about products ■ Assists me with finding gifts
■ Helps me pay quickly ■ Offers me a home delivery option
■ Lets me know about discounts / offers ■ Assists me with eCommerce
■ Greets me promptly with a welcoming attitude ■ None of these
■ Has the ability to match any other retailer’s price
79%
40%
64%
46%
33% 35%
17%
4%8%
Figure 15 I Which area would you expect retailers to invest in, in order to improve your shopping experience?
2.4
1.3
1.2
1.2
1.1
1.0
0.9
0.9
0.9
0.7
0.6
0.6
0.6
0.5
Lower prices
Customer relationship (advice, etc.)
Better integration of physical and online stores
Self scanning check outs
Provide the advantage of physical stores to online stores
Home delivery
Wi-Fi capabilities in store
Environmentally friendly
Online store
Better gift packaging service
Child care
Mobile commerce
Decoration to improve ambiance
Self-packaging system
Consumers want the best of both worlds this festive season. They will expect retailers to invest in lower prices while still offering a compelling in-store experience where they can receive advice and also indulge in time-saving services such as self-scan check out facilities. In keeping with the omni-channel trend, consumers are looking to retailers for a better integration between their online and physical stores, implying that consumers want to be able to find products in stock and find them as easily in-store as they can online. Although not as highly regarded as lower prices, home delivery and in-store Wi-Fi capabilities are making their mark on the list of expectations.
Retailers face the formidable challenge of catering to a wide array of consumer needs, and with the multitude of product offerings, online stores, loyalty programmes and discount activity happening in the South African market, attracting foot traffic into stores will require a lot more than a friendly customer experience and discounted prices in the future.

Year-end Holiday Survey 2015 Pinching pennies for presents 19
The Deloitte Africa Consumer Business team has extensive experience in retail, distribution and consumer product manufacturing. We provide innovative, industry-specific solutions to retailers and their suppliers across audit, tax, consulting and advisory services.
This team has delivered significant cross-border engagements into Africa where we have supported retailers and consumer product manufacturers with market entry and expansion strategies, market analysis and distribution optimisation.
If you would like to discuss any of the topics in this report, or our services to the consumer business industry across Africa, please contact:
André DennisConsumer Business Industry LeaderTel: +27 (0)82 566 3707Email: [email protected]
Rodger GeorgeEast Africa Advisory LeaderTel: +27 (0)83 226 4966Email: [email protected]
Diana GerrardWest Africa Consumer Business LeaderTel: +234 805 300 9379Email: [email protected]
Stelios MichaelPartner: ZimbabweTel: +263 867 700 0261Email: [email protected]
Mike Du ToitConsumer Business Consulting leaderTel: +27 (0)82 574 4723Email: [email protected]
Claire HoyConsumer Business Risk Advisory and Western Cape LeaderTel: +27 (0)83 410 2139Email: [email protected]
Africa Consumer Business team

20
Nisha DharamlallConsumer Business Corporate Finance LeaderTel: +27 (0)83 452 2981Email: [email protected]
Bernadette AbbottConsumer Business Tax LeaderTel: +27 (0)82 781 8435Email: [email protected]
Dylan PiattiConsumer Business Chief of StaffTel: +27 (0)82 267 6279Email: [email protected]
Antoinette ShandConsumer Business Marketing LeadTel: +27 (0)84 200 4422Email: [email protected]
Deloitte South Africa contributorsAnalysed and written by Deloitte South Africa
Key highlights about the 2015 survey Anamika Reddi
Economic overview Katharine Pulvermacher
Holiday spending Mayuree Chetty
Purchasing behaviour Anamika Reddi
Itumeleng Moabi-Makasi
What’s in the stocking? Pramesha Pillay
Where will South Africans shop? Michelle Kirkinis

Year-end Holiday Survey 2015 Pinching pennies for presents 21

Deloitte refers to one or more of Deloitte Touche Tohmatsu Limited, a UK private company limited by guarantee (DTTL), its network of member firms and their related entities. DTTL and each of its member firms are legally separate and independent entities. DTTL (also referred to as “Deloitte Global”) does not provide services to clients. Please see www.deloitte.com/about for a more detailed description of DTTL and its member firms.
Deloitte provides audit, consulting, financial advisory, risk management, tax and related services to public and private clients spanning multiple industries. With a globally connected network of member firms in more than 150 countries and territories, Deloitte brings world-class capabilities and high-quality service to clients, delivering the insights they need to address their most complex business challenges. Delolitte’s more than 225 000 professionals are committed to making an impact that matters. Deloitte serves 4 out of 5 Fortune Global 500® companies.
This communication contains general information only, and none of Deloitte Touche Tohmatsu Limited, its member firms or their related entities (collectively, the “Deloitte Network”) is, by means of this communication, rendering professional advice or services. Before making any decision or taking any action that may affect your finances or your business, you should consult a qualified professional adviser. No entity in the Deloitte network shall be responsible for any loss whatsoever sustained by any person who relies on this communication.
© 2015. For information, contact Deloitte Touche Tohmatsu Limited
Designed and produced by Creative Solutions at Deloitte, Johannesburg. (810986/lie)