year end report february 15, 2018 2017 - keyera.com · 2 keyera uses certain “non-gaap...
TRANSCRIPT

1 Realized margin is a “Non-GAAP Measure” and excludes the effect of non-cash gains and losses from risk management contracts.
2 Keyera uses certain “Non-GAAP Measures” such as Adjusted EBITDA, Distributable Cash Flow, Distributable Cash Flow per Share and Payout Ratio. See
section titled “Non-GAAP Financial Measures”, “Dividends: Distributable Cash Flow” and “EBITDA” of the MD&A for further details.
Year End Report February 15, 2018
2017 Year End Report
For the year ended December 31, 2017
HIGHLIGHTS
Keyera achieved record net earnings of $290 million ($1.53 per share) in 2017 compared to $217 million ($1.21 per share) in the prior year, mainly due to higher operating margins.
The Liquids Infrastructure segment once again generated record results with operating margin of $285 million in 2017 compared to $246 million in 2016. These results were driven by increased demand for our condensate services, the start of our Norlite take-or-pay contracts and incremental fractionation volumes.
The Gathering and Processing segment recorded operating margin of $275 million (2016 – $290 million). Gross processing throughput steadily increased throughout the year with volumes in the fourth quarter 12% higher than the same period in 2016.
The Marketing segment’s operating margin was $128 million (2016 – $101 million), while realized margin1,2
was also $128 million (2016 – $137 million). Marketing’s results were primarily affected by a lower contribution from iso-octane sales due to the unscheduled outage at Alberta EnviroFuels (“AEF”) in early 2017.
Adjusted earnings before interest, taxes, depreciation and amortization (“Adjusted EBITDA”)
2 was $617 million for
the year compared to $605 million in 2016.
Distributable cash flow2
was $510 million or $2.70 per share (2016 – $460 million or $2.56 per share), resulting in a payout ratio
2 of 61% for the year (2016 – 60%).
Growth capital invested in 2017 (excluding acquisitions) was $658 million, which included the completion of the Norlite pipeline in the second quarter. Construction also progressed on the Base Line Terminal crude oil storage facility where four of the twelve tanks were recently placed into service. Both of these projects are backed by long-term, take-or-pay contracts.
To support future growth, Keyera announced multiple growth capital projects in 2017 to serve producers that are active in the Montney and Duvernay geological zones in Northern Alberta. Projects include a number of enhancements at Keyera’s Simonette gas plant and construction of the first phase of the Wapiti gas plant complex as well as the North Wapiti Pipeline System.
Keyera expects to invest growth capital of between $800 million and $900 million in 2018, primarily for approved projects currently underway plus the acquisition of 50% of the South Grand Rapids diluent pipeline.
In the fourth quarter, Keyera strengthened its financial flexibility with two inaugural investment grade corporate credit ratings from DBRS Limited and S&P Global and a successful common share offering that generated gross proceeds of $494 million.

Keyera Corp. TSX: KEY 2017 Year End Report February 15, 2018
KEYERA CORP.
2
Three months ended
December 31, Twelve months ended
December 31, Summary of Key Measures (Thousands of Canadian dollars, except where noted)
2017
2016
2017
2016
Net earnings 88,052 34,621 289,920 216,851 Per share ($/share) – basic 0.45 0.19 1.53 1.21
Cash flow from operating activities 212,609 40,223 513,697 412,926
Distributable cash flow1 173,890 104,006 510,434 459,583
Per share ($/share)
1 0.90 0.56 2.70 2.56
Dividends declared 81,801 73,657 312,643 277,578 Per share
($/share) 0.42 0.40 1.65 1.54
Payout ratio %1 47% 71% 61% 60%
Adjusted EBITDA2 197,399 153,535 617,015 605,127
Gathering and Processing: Gross processing throughput (MMcf/d) 1,526 1,362 1,464 1,431 Net processing throughput (MMcf/d) 1,192 1,088 1,149 1,123 Liquids Infrastructure: Gross processing throughput
3 (Mbbl/d) 193 152 181 147
Net processing throughput3 (Mbbl/d) 76 50 67 53
AEF iso-octane production volumes (Mbbl/d) 15 9 12 11 Marketing: Inventory value 147,831 107,876 147,831 107,876 Sales volumes (Bbl/d) 164,900 134,600 143,000 129,300 Acquisitions — 8,033 61,122 190,375 Growth capital expenditures 189,706 119,018 657,944 501,503 Maintenance capital expenditures 7,119 29,305 41,048 65,539
Total capital expenditures 196,825 156,356 760,114 757,417
As at December 31,
2017 2016
Long-term debt 1,795,530 1,437,413
Credit facility — 235,000 Working capital surplus
4 (336,509) (46,322)
Net debt 1,459,021 1,626,091
Three months ended December 31,
2017 2016
Weighted average number of shares outstanding – basic 193,552 185,116 189,002 179,688 Weighted average number of shares outstanding – diluted 193,552 185,116 189,002 179,688 Common shares outstanding – end of period 204,547 185,683
Notes: 1 Payout ratio is defined as dividends declared to shareholders divided by distributable cash flow. Payout ratio and distributable cash flow are
not standard measures under Generally Accepted Accounting Principles (“GAAP”). See the section titled, “Dividends: Distributable Cash Flow”, for a reconciliation of distributable cash flow to its most closely related GAAP measure.
2 Adjusted EBITDA is defined as earnings before interest, taxes, depreciation, amortization, accretion, impairment expenses, unrealized
gains/losses and any other non-cash items such as gains/losses on the disposal of property, plant and equipment. EBITDA and Adjusted EBITDA are not standard measures under GAAP. See section of the MD&A titled “EBITDA” for a reconciliation of Adjusted EBITDA to its most closely related GAAP measure.
3 Fractionation throughput in the Liquids Infrastructure segment is the aggregation of volumes processed through the fractionators and the de-
ethanizers at the Keyera and Dow Fort Saskatchewan facilities. 4 Working capital is defined as current assets less current liabilities.

Keyera Corp. TSX: KEY 2017 Year End Report February 15, 2018
KEYERA CORP.
3
Message to Shareholders
On behalf of Keyera, I am pleased to share our 2017 financial results. Each of our key financial metrics increased over the prior year with Adjusted EBITDA of $617 million, distributable cash flow of $510 million and net earnings of $290 million. This strong performance was driven by our core fee-for-service businesses and contributions from our capital projects that have come into service over the last few years. With confidence in our business outlook, we increased our dividend by 6% while maintaining a conservative payout ratio.
I am proud of Keyera’s conservative management approach, which has served us well over the last few years. We take a long-term view of our business and continue to enhance our integrated network of assets and look for opportunities to expand our value chain. In 2017, we invested approximately $720 million in growth capital projects and acquisitions that align with our strategy to maximize utilization at our current facilities, increase our presence in the liquids-rich Montney and Duvernay development areas, enhance our condensate network and expand our storage facilities. In 2018, we will continue to execute on our strategy by investing another $800 million to $900 million, including the acquisition of a 50% interest in the South Grand Rapids diluent pipeline. We remain committed to growing shareholder value, balancing risk and return expectations.
Gathering and Processing Business Unit
The Gathering and Processing segment delivered operating margin of $275 million in 2017 with throughput steadily increasing throughout the year. In the fourth quarter, total gross processing throughput averaged 1,526 million cubic feet per day, a 12% increase compared to the same period in 2016. Although natural gas prices in Western Canada were weak in 2017, prices for crude oil and natural gas liquids strengthened in the second half of the year resulting in increased producer drilling activity in liquids-rich areas. For Keyera, this most notably resulted in new well tie-ins and increased utilization at our Simonette gas plant, which achieved record throughput volumes in 2017.
To meet the growing needs of producers in the liquids-rich Montney and Duvernay geological zones in Northern Alberta, we have multiple capital projects underway. At the Simonette gas plant, we are expanding our liquids handling capacity, enhancing our inlet liquids handling capabilities and adding acid gas injection facilities. These projects are expected to enhance producers’ netbacks while providing additional long-term growth opportunities for Keyera. We are also considering an expansion of the processing capacity of the Simonette gas plant and continue to have discussions with existing and new producers in the area to understand their development plans.
During the year, we began construction of the first phase of the Wapiti gas plant, near Grande Prairie, Alberta, and announced the North Wapiti Pipeline System that will extend the plant’s capture area north of the Wapiti River. Phase one of the Wapiti gas plant includes 150 million cubic feet per day of sour gas processing capacity and is backed by long-term agreements with Paramount Resources Ltd. The North Wapiti Pipeline System is underpinned by a long-term, take-or-pay agreement with privately-owned Pipestone Oil Corp. Both projects are expected to be in-service in 2019.
The approved projects at our Simonette and Wapiti gas plants total approximately $800 million and enhance our midstream service offering in one of the most exciting development areas in the Western Canada Sedimentary Basin.
Liquids Business Unit - Liquids Infrastructure Segment
The Liquids Infrastructure segment continued to generate record results, reporting operating margin of $285 million in 2017, a 16% increase over the $246 million reported in the prior year. These results were driven by increased demand for our condensate services, the startup of the Norlite pipeline and its associated take-or-pay contracts, as well as incremental fractionation volumes.
Keyera operates an industry-leading condensate system in Western Canada and we continue to enhance this network. In 2017, the Norlite pipeline was completed along with a connection to our existing infrastructure in Fort Saskatchewan, providing customers with access to multiple sources of diluent supply. We completed four condensate storage tanks at Keyera’s Edmonton Terminal to enhance our operational ability to deliver diluent to the oil sands in a reliable and efficient manner. We also added two new receipt
Keyera Corp. TSX: KEY 2017 Year End Report February 15, 2018
KEYERA CORP.
4
points allowing our network to receive diluent from the North West Sturgeon Refinery and Pembina Pipeline’s Canadian Diluent Hub. In 2018, we expect to complete the South Grand Rapids pipeline that will add additional capacity between Edmonton and Fort Saskatchewan to meet producers’ growing diluent needs.
In Alberta, demand for condensate has continued to grow as new oil sands projects and phased expansions of existing projects are completed. In the fourth quarter of 2017, we signed new long-term take-or-pay agreements with two oil sands customers to provide condensate storage services as of January 1, 2018. We also recently added two new shippers on both the Norlite pipeline and Keyera’s Fort Saskatchewan Condensate System. These long-term, take-or-pay contracts utilize existing capacity and are expected to begin generating incremental cash flow by mid-2018.
Also adding to this segment’s growth in 2018 will be the Base Line Terminal and Keylink NGL gathering system. The Base Line Terminal is an above ground crude oil storage facility developed with Kinder Morgan under a 50/50 joint venture arrangement. The first four tanks are now in service and the remaining eight tanks are expected to be phased into service throughout 2018. This new business provides Keyera with stable fee-for-service cash flows fully underpinned by take-or-pay agreements of up to 10 years in length. The Keylink NGL gathering system will allow us to deliver NGL mix from several Keyera facilities by pipeline to our Rimbey gas plant, or potentially Fort Saskatchewan, for fractionation. Upon completion, Keylink will provide producers with a safe, reliable and economically improved alternative to trucking NGL volumes across the region. Assuming construction schedules are maintained, Keylink is expected to be operational in the second quarter of 2018.
We continue to look for the right opportunities to expand our Liquids Infrastructure business. In 2017, we acquired 1,290 acres of undeveloped land strategically located in Alberta’s Industrial Heartland, continued to develop our underground storage capacity, and entered into a 20-year NGL handling agreement with Chevron Canada Limited to support their Kaybob Duvernay development. Assets and service agreements like these provide Keyera with a diverse and strong foundation for future growth.
Liquids Business Unit - Marketing Segment
The Marketing segment continued to contribute to Keyera’s integrated value chain in 2017, generating a realized margin of $128 million compared to $137 million in 2016. Results were lower than the prior year primarily due to a reduced iso-octane contribution, as a result of a nine-week unscheduled outage at AEF early in the year and higher average butane feedstock prices relative to the prior year. Since completing the necessary repairs at AEF, the facility has been operating very well.
As anticipated, propane generated strong margins in the fourth quarter, consistent with our strategy of utilizing our storage and transportation assets to take advantage of seasonal demand and pricing.
Outlook
We have been encouraged by producer activity in the Western Canada Sedimentary Basin over the past year and Keyera is well positioned for growth. Our gathering and processing assets are strategically located to support the development of Spirit River, Montney and Duvernay resources, some of the most economic liquids-rich geological zones in North America. And we are investing in new infrastructure at Simonette and Wapiti in a safe, cost-effective manner, supporting producer netbacks and respecting community and landowner interests. As oil sands production continues to increase, our extensive and reliable system provides producers with an effective way to source, store and transport their condensate. Recognizing the anticipated infrastructure demands and the dynamic environment in which we operate, we continue to maintain a strong balance sheet. This financial flexibility allows us to carry out our growth capital program while maintaining the ability to pursue opportunities as they arise.
On behalf of Keyera's board of directors and management team, I would like to thank our employees, customers, shareholders and other stakeholders for their continued support.
David G. Smith President & Chief Executive Officer Keyera Corp.
Keyera Corp. TSX: KEY 2017 Year End Report February 15, 2018
KEYERA CORP.
5
Management’s Discussion and Analysis The following management's discussion and analysis (“MD&A”) was prepared as of February 15, 2018, and is a review of the results of operations and the liquidity and capital resources of Keyera Corp. and its subsidiaries (collectively “Keyera”). The MD&A should be read in conjunction with the accompanying audited consolidated financial statements (“accompanying financial statements”) of Keyera Corp. for the years ended December 31, 2017 and 2016 and the notes thereto. The accompanying financial statements have been prepared in accordance with International Financial Reporting Standards (“IFRS”) also referred to as GAAP, and are stated in Canadian dollars. Additional information related to Keyera, including its Annual Information Form, is available on SEDAR at www.sedar.com or on Keyera’s website at www.keyera.com. This MD&A contains non-GAAP measures and forward-looking statements and readers are cautioned that the MD&A should be read in conjunction with Keyera’s disclosure under “NON-GAAP FINANCIAL MEASURES” and “FORWARD-LOOKING STATEMENTS” included at the end of this MD&A. Keyera’s Business Keyera operates an integrated Canadian-based midstream business with extensive interconnected assets and depth of expertise in delivering midstream energy solutions. Midstream entities operate in the oil and gas industry between the upstream sector, which includes oil and gas exploration and production, and the downstream sector, which includes the refining, distribution and marketing of finished products. Keyera is organized into two integrated business units:
1. Gathering and Processing Business Unit – Keyera owns and operates raw gas gathering pipelines and processing plants, which collect and process raw natural gas, remove waste products and separate the economic components, primarily natural gas liquids (“NGLs”), before the sales gas is delivered into long-distance pipeline systems for transportation to end-use markets.
2. Liquids Business Unit, consisting of the following operating segments:
Liquids Infrastructure – Keyera owns and operates a network of facilities for the processing, storage and transportation of the by-products of natural gas processing, including NGLs such as ethane, propane, butane and condensate. In addition, this segment includes Keyera’s iso-octane facilities at Alberta EnviroFuels (“AEF”) and facilities for handling crude oil.
Marketing – Keyera markets a range of products associated with its two infrastructure business lines, primarily propane, butane, condensate and iso-octane, and also engages in crude oil midstream activities.

Keyera Corp. TSX: KEY 2017 Year End Report February 15, 2018
KEYERA CORP.
6
CONSOLIDATED FINANCIAL RESULTS The following table highlights some of the key consolidated financial results for the years ended December 31, 2017 and 2016:
(Thousands of Canadian dollars, except per share data) 2017 2016
Net earnings 289,920 216,851
Earnings per share (basic) 1.53 1.21
Operating margin 703,541 646,173
Realized margin1 703,363 681,569
Adjusted EBITDA2 617,015 605,127
Cash flow from operating activities 513,697 412,926
Distributable cash flow3 510,434 459,583
Distributable cash flow per share3 (basic) 2.70 2.56
Dividends declared 312,643 277,578
Dividends declared per share 1.65 1.54
Payout ratio4 61% 60%
Notes: 1 Realized margin is defined as operating margin excluding unrealized gains and losses from risk management contracts from the Marketing
segment. Realized margin is not a standard measure under GAAP. See the section titled, “Results of Operations: Marketing”, for a reconciliation of Operating Margin to Realized Margin as it relates to the Marketing segment only.
2 Adjusted EBITDA is defined as earnings before interest, taxes, depreciation, amortization, accretion, impairment expenses, unrealized
gains/losses and any other non-cash items such as gains/losses on the disposal of property, plant and equipment. EBITDA and Adjusted EBITDA are not standard measures under GAAP. See the section titled “EBITDA” for a reconciliation of Adjusted EBITDA to its most closely related GAAP measure.
3 Distributable cash flow is not a standard measure under GAAP. See the section titled, “Dividends: Distributable Cash Flow”, for a
reconciliation of distributable cash flow to its most closely related GAAP measure. 4 Payout ratio is defined as dividends declared to shareholders divided by distributable cash flow and is not a standard measure under GAAP.
Keyera recorded strong financial results in 2017 despite a nine-week outage at AEF in the first half of the year that reduced iso-octane margins in the Marketing segment. The strong 2017 results stemmed from the record operating margin delivered from the Liquids Infrastructure segment and the solid results from the Gathering and Processing segment as described in more detail throughout this MD&A. The year ended December 31, 2017 was busy for Keyera as several new growth capital projects were sanctioned in the Gathering and Processing segment, including phase one of the Wapiti gas plant. In addition, several projects were completed in the Liquids Infrastructure segment, including the Norlite pipeline that began contributing incremental cash flow in the year. Net Earnings For the year ended December 31, 2017, net earnings were $290 million, $73 million higher than the prior year primarily due to:
$57 million in higher operating margin in 2017 compared to 2016; and
a net foreign currency gain of $11 million recorded in 2017 compared to a loss of $2 million in the prior year.
Included in net earnings for 2017 was a $20 million gain associated with the disposition of non-core assets, including the previously shut down Paddle River gas plant. This gain was partially offset by an impairment charge of $18 million to reduce the carrying value of the Caribou gas plant that ceased operation effective December 2015.

Keyera Corp. TSX: KEY 2017 Year End Report February 15, 2018
KEYERA CORP.
7
See the section of this MD&A titled, “Corporate and Other”, for more information related to these charges.
Operating Margin and Realized Margin For the year ended December 31, 2017, operating margin was $704 million, $57 million or 9% higher than 2016 largely due to:
the inclusion of an unrealized non-cash gain of virtually nil associated with risk management contracts from the Marketing segment in 2017 compared to a non-cash loss of $35 million in the 2016 financial results; and
$39 million in higher operating margin from the Liquids Infrastructure segment.
These positive variances were partly offset by lower operating margin from the Gathering and Processing and Marketing segments as discussed below.
The record financial results posted by the Liquids Infrastructure segment in 2017 stemmed from continued demand for Keyera’s diluent handling services, including storage and transportation services, and incremental take-or-pay revenue associated with the newly operational Norlite pipeline. The volume of condensate delivered through Keyera’s condensate system to the oil sands grew by 21% in 2017 compared to the prior year. Also contributing to the strong results from the Liquids Infrastructure segment was an increase in fractionation volumes at Keyera’s facility in Fort Saskatchewan compared to 2016, albeit at lower average fractionation fees. The Gathering and Processing segment delivered solid financial results in 2017 as processing throughput steadily increased in some areas. Overall gross average throughput was 12% higher in the fourth quarter of 2017 compared to the same period in 2016 as drilling activity continued to increase in the liquids-rich Montney and Duvernay geological zones. The majority of the increase in volumes was attributable to the Simonette gas plant that achieved record average throughput in 2017 despite completing its scheduled maintenance turnaround in August. Operating margin was $275 million in 2017, $15 million lower than the prior year primarily due to lower operating margin at the Rimbey, Strachan and Nevis gas plants. See the section of this MD&A titled, “Segmented Results of Operations: Gathering and Processing”, for more information related to the variance in operating margin at these facilities. Operating margin in the Marketing segment was $128 million, $27 million higher than 2016. Realized margin (excluding the effect of unrealized gains/losses from risk management contracts) was also $128 million, $8 million lower than 2016 largely due to:
$15 million in lower iso-octane margins in 2017 that resulted from: i) reduced sales volumes and the inclusion of an $8 million expense associated with the nine-week unscheduled outage at AEF. This outage extended into the third week in April, which is the commencement of the demand season for iso-octane; and ii) higher average butane feedstock costs relative to the prior year.
The 2016 Marketing results were also low due to the scheduled major turnaround at AEF in the second half of the year that resulted in the facility being off-line for approximately eight weeks.
See the section titled “Segmented Results of Operations” for more information on operating results by segment.
Cash Flow Metrics Cash flow from operating activities was $514 million in 2017, $101 million higher than 2016 due to: i) $39 million in higher operating margin from the Liquids Infrastructure segment in 2017; and ii) a $55 million cash payment in the fourth quarter of 2016 for the acquisition of land that closed in early 2017. In the determination of distributable cash flow, changes in non-cash working capital are excluded because they are primarily the result of seasonal fluctuations in product inventories. Also deducted from distributable cash
Keyera Corp. TSX: KEY 2017 Year End Report February 15, 2018
KEYERA CORP.
8
flow are maintenance capital expenditures and the long-term incentive plan expense, which are funded from current operating cash flow. Refer to the section of this MD&A titled, “Dividends: Distributable Cash Flow”, for a reconciliation of cash flow from operating activities to distributable cash flow. Distributable cash flow for 2017 was $510 million, $51 million higher than the prior year due to: i) $24 million in lower maintenance capital expenditures in 2017 as the prior year results included approximately $40 million of costs associated with the turnaround at AEF; and ii) record operating margin posted by the Liquids Infrastructure segment in 2017. See the section titled “Segmented Results of Operations: Liquids Infrastructure” for more information.
SEGMENTED RESULTS OF OPERATIONS Keyera is organized into two integrated businesses: the Gathering and Processing Business Unit and the Liquids Business Unit. The Liquids Business Unit consists of the Liquids Infrastructure and Marketing segments. A complete description of Keyera’s businesses by segment can be found in Keyera’s Annual Information Form, which is available at www.sedar.com. The discussion of the results of operations for each of the operating segments focuses on operating margin. Operating margin refers to operating revenues less operating expenses and does not include the elimination of inter-segment transactions. Management believes operating margin provides an accurate portrayal of operating profitability by segment. Keyera’s Gathering and Processing and Liquids Infrastructure segments charge Keyera’s Marketing segment for the use of facilities at market rates. These segment measures of profitability for the years ended December 31, 2017 and 2016 are reported in note 29, Segment Information, of the accompanying financial statements.
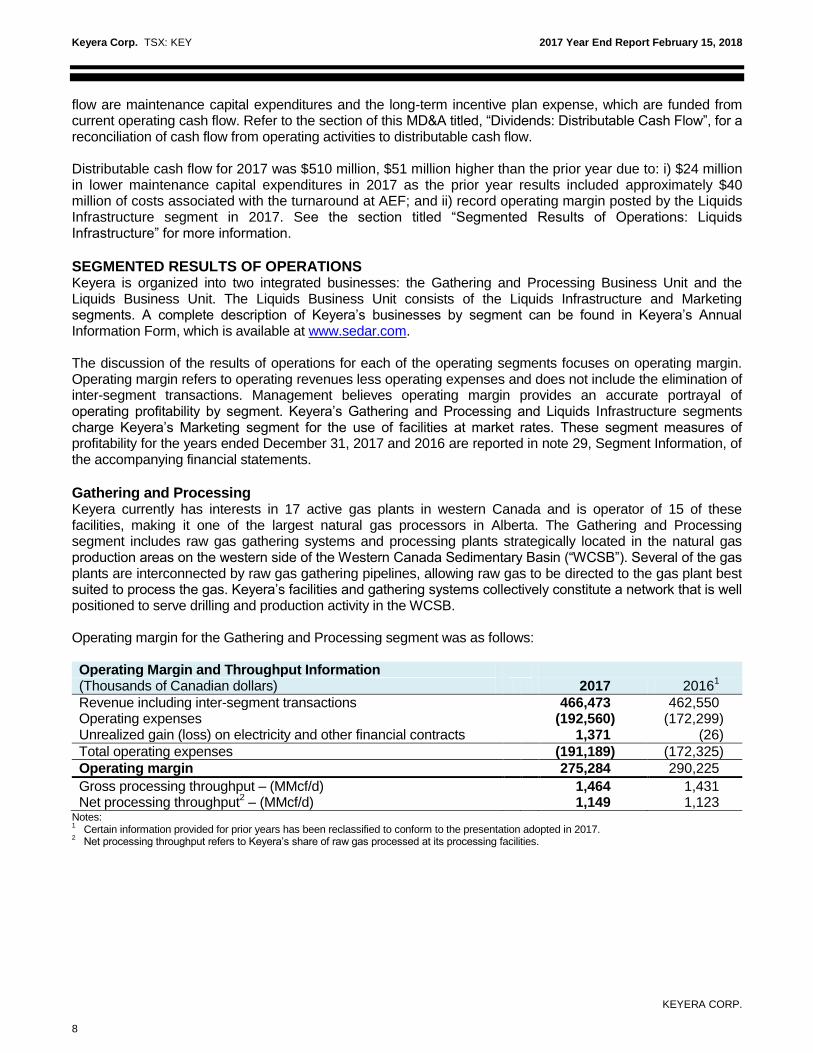
Gathering and Processing Keyera currently has interests in 17 active gas plants in western Canada and is operator of 15 of these facilities, making it one of the largest natural gas processors in Alberta. The Gathering and Processing segment includes raw gas gathering systems and processing plants strategically located in the natural gas production areas on the western side of the Western Canada Sedimentary Basin (“WCSB”). Several of the gas plants are interconnected by raw gas gathering pipelines, allowing raw gas to be directed to the gas plant best suited to process the gas. Keyera’s facilities and gathering systems collectively constitute a network that is well positioned to serve drilling and production activity in the WCSB. Operating margin for the Gathering and Processing segment was as follows: Operating Margin and Throughput Information
(Thousands of Canadian dollars) 2017 20161
Revenue including inter-segment transactions 466,473 462,550 Operating expenses (192,560) (172,299) Unrealized gain (loss) on electricity and other financial contracts 1,371 (26)
Total operating expenses (191,189) (172,325)
Operating margin 275,284 290,225
Gross processing throughput – (MMcf/d) 1,464 1,431 Net processing throughput
2 – (MMcf/d) 1,149 1,123
Notes: 1
Certain information provided for prior years has been reclassified to conform to the presentation adopted in 2017. 2
Net processing throughput refers to Keyera’s share of raw gas processed at its processing facilities.
Keyera Corp. TSX: KEY 2017 Year End Report February 15, 2018
KEYERA CORP.
9
Operating Margin and Revenues The Gathering and Processing segment recorded solid financial results in 2017 as drilling activity continued to increase in areas rich in natural gas liquids. Operating margin for the year ended December 31, 2017 was $275 million, $15 million lower than 2016 primarily due to:
lower operating margin from the Rimbey gas plant due to several factors including: i) reduced ethane sales volumes as the petrochemical company that purchases the ethane under a long term contract curtailed receipt of sales volumes during the second half of the year citing operational issues at their facility; and ii) increased operating costs, including property taxes. Operating costs at the Rimbey gas plant are recovered through higher fees on a four-year average basis as opposed to fully recovered in the current year like certain other Keyera facilities; and
lower operating margin at the Strachan and Nevis gas plants in the first half of 2017 compared to the same period in the prior year primarily due to reduced throughput volumes at these facilities during those periods.
These factors were partly offset by incremental cash flows from:
the acquisition of an additional 35% ownership interest in the Alder Flats gas plant and gathering pipeline in August 2016; and
record processing throughput and operating margin at the Simonette gas plant.
Gathering and Processing revenues for the year ended December 31, 2017 were $466 million, $4 million higher than in 2016. The higher revenues were largely the result of equalization adjustments recorded in the second quarter of 2017 that had minimal impact on operating margin due to the cost recovery flow-through model followed by most of Keyera’s gas processing facilities. Equalization adjustments are required from time to time to ensure revenue collected reflects the actual operating costs for the facility. Gathering and Processing Activity Despite weak natural gas prices in 2017, prices for crude oil and natural gas liquids strengthened in the second half of the year spurring producer drilling activity in liquids-rich areas, including the Montney and Duvernay geological zones. With the heightened drilling activity levels, total gross processing throughput for the Gathering and Processing segment steadily increased throughout the year and averaged 1,464 million cubic feet per day in 2017, a 2% increase over the prior year. Total gross processing throughput for the fourth quarter of 2017 was 1,526 million cubic feet per day, a 12% increase compared to the same period in 2016. The higher processing throughput was primarily attributable to the Simonette gas plant as the facility was able to achieve new record average throughput levels during each consecutive quarter of 2017. New well tie-ins brought in incremental volumes to the Simonette facility utilizing Keyera’s Wapiti gathering system and liquids handling infrastructure that was put into service in 2015. To meet the growing needs of producers in the liquids-rich Montney and Duvernay geological zones in Northern Alberta, Keyera announced multiple growth capital projects in 2017. For example, the Simonette liquids handling expansion project, announced in the first quarter of 2017, will expand the liquids handling capabilities of the facility, bringing its condensate operational capacity to approximately 27,000 barrels per day. This project will increase liquids recoveries at the facility which is intended to maximize producers’ netbacks and provide additional long-term growth opportunities for Keyera. In addition to the liquids handling expansion at the Simonette facility, Keyera also recently announced plans to enhance the plant’s operations with improved liquids handling inlet facilities and acid gas injection facilities. These investments are underpinned by 10-year gas handling agreements with Athabasca Oil Corporation and Murphy Oil Company Ltd. to process additional natural gas production from their Montney and Duvernay operations. The project is expected to cost between $85 million and $100 million and is anticipated to be operational in the first half of 2019. Both gas handling agreements include take-or-pay commitments and facility dedications.
Keyera Corp. TSX: KEY 2017 Year End Report February 15, 2018
KEYERA CORP.
10
In the second quarter of 2017, Keyera sanctioned the first phase of the Wapiti gas plant. Phase one of the project includes a 150 million cubic feet per day sour gas processing plant with acid gas injection capabilities and 25,000 barrels per day of condensate processing facilities, as well as a gathering pipeline system and field compressor stations. The primary customer for phase one is Paramount Resources Ltd. and Keyera is actively working with other producers in the area to commit additional volumes and permit sanctioning of the second phase of the project. Phase two would add an additional 150 million cubic feet per day of sour gas processing capacity.
Keyera also recently announced plans to construct the North Wapiti Pipeline System, providing infrastructure and services to producers developing the Montney geological zone north of the Wapiti River. This pipeline system which includes a 12-inch sour gas gathering pipeline, an 8-inch liquids pipeline, a 6-inch fuel gas line, and a compressor station will extend the capture area of Keyera's Wapiti gas plant north of the Wapiti River. The pipeline system is underpinned by a long-term, take-or-pay agreement with privately owned Pipestone Oil Corp. (“Pipestone”). Pipestone has also entered into a separate long-term agreement with Keyera to secure fractionation and marketing services for its natural gas liquids extracted at the Wapiti gas plant. The North Wapiti Pipeline System is estimated to cost approximately $120 million with an expected in-service date in the second half of 2019.
Keyera remains committed to working with its customers to deliver cost-effective and value-added services that enhance customer economics while, at the same time, maximizing throughput and efficiencies at its gathering and processing facilities. With this in mind, Keyera made a decision to shut down certain sour gas processing equipment at its Strachan gas plant as the volume of sour gas throughput has significantly declined. Shutting down this equipment is expected to increase efficiencies and reduce operating costs at the facility. Keyera is working with its customers at the plant to provide alternatives for the sour gas that the plant will no longer be able to handle. The modifications are expected to be completed in conjunction with the maintenance turnaround at the Strachan gas plant scheduled for mid-2018. Further supporting Keyera’s objective of maximizing throughput at its facilities, in late 2017 Keyera entered into an agreement with a producer for the construction of a new 10-inch sweet gas pipeline. This pipeline will effectively connect Keyera’s Strachan gas plant to its Ricinus gas plant, allowing incremental volumes to flow to Ricinus for processing under a long-term, take-or-pay arrangement. This project is expected to cost approximately $12 million to $14 million and is targeted for completion and start-up in the second quarter of 2018. The addition of the pipeline connection provides area producers who are actively drilling in the liquids-rich Glauconite geological zone added flexibility, efficiency and a low cost processing solution. This project also brings the Ricinus facility into Keyera’s network of interconnected gas plants in West Central Alberta. Maintenance turnarounds were completed on time and on budget during the second and third quarters of 2017 at the Gilby and Simonette gas plants. Keyera’s net share of these turnarounds was $15 million. The majority of these costs are recovered through processing fees over a four-year period. For 2018, maintenance turnarounds are scheduled to occur at the Strachan, Nevis and Brazeau North gas plants at a combined cost of approximately $25 million. The costs associated with maintenance turnarounds are capitalized for accounting purposes and do not have an effect on operating expenses in the Gathering and Processing segment. However, as many of Keyera’s facilities follow a flow-through operating cost structure, the cost of turnarounds will generally be recovered through higher operating fee revenue. Keyera expects to recover the majority of turnaround costs over varying periods depending on the fee arrangements at each plant. Distributable cash flow is reduced by Keyera’s share of the cost of the turnarounds, as these costs are included in its financial results as maintenance capital expenditures.

Keyera Corp. TSX: KEY 2017 Year End Report February 15, 2018
KEYERA CORP.
11
The table below provides more detail related to major projects in the Gathering and Processing segment:
Gathering and Processing – Capital Projects Status Update
Facility/Area Project Description Project Status Update
Simonette Simonette Liquids Handling Expansion Project: The project consists of construction of NGL mix and condensate above ground storage facilities, addition of a truck loading facility, redesign of the existing condensate stabilization facilities and the addition of new facilities to handle growing volumes of condensate and improve overall liquids recoveries. Upon completion of this project, the condensate operational capacity at Simonette is expected to be approximately 27,000 barrels per day. The project also includes a new pipeline connection from Keyera’s Simonette gas plant to the Peace pipeline system’s custody transfer point. This connection will provide Keyera’s customers with the flexibility to transport greater volumes of NGL mix and condensate by pipeline.
The connection to the Peace pipeline system’s custody transfer point was completed in the third quarter of 2017.
The installation of major equipment related to the redesign of existing and new condensate stabilization facilities commenced in the fourth quarter of 2017.
The overall project is expected to be complete in the second quarter of 2018.
Estimated total cost to complete:
Approximately $100 million including associated processing equipment, pumps and pipeline connections.
Total net costs to December 31, 2017:
$60 million for the year ended December 31, 2017
$62 million since inception
Wapiti Wapiti Gas Plant (Phase One): The first phase of the project is the construction of a 150 million cubic feet per day sour gas processing plant with acid gas injection capabilities and 25,000 barrels per day of condensate processing facilities, as well as a gathering pipeline system and field compressor stations.
Foundation work and fabrication of major equipment continues to progress.
The Wapiti gas plant (phase one) is expected to be complete by mid-2019.
Estimated total cost to complete:
Cost of phase one of the project is approximately $470 million.
Total net costs to December 31, 2017:
$140 million for the year ended December 31, 2017
$175 million since inception (including $19 million in 2016 to acquire the project and acid gas injection well)
Keyera Corp. TSX: KEY 2017 Year End Report February 15, 2018
KEYERA CORP.
12
Gathering and Processing – Capital Projects Status Update
Facility/Area Project Description Project Status Update
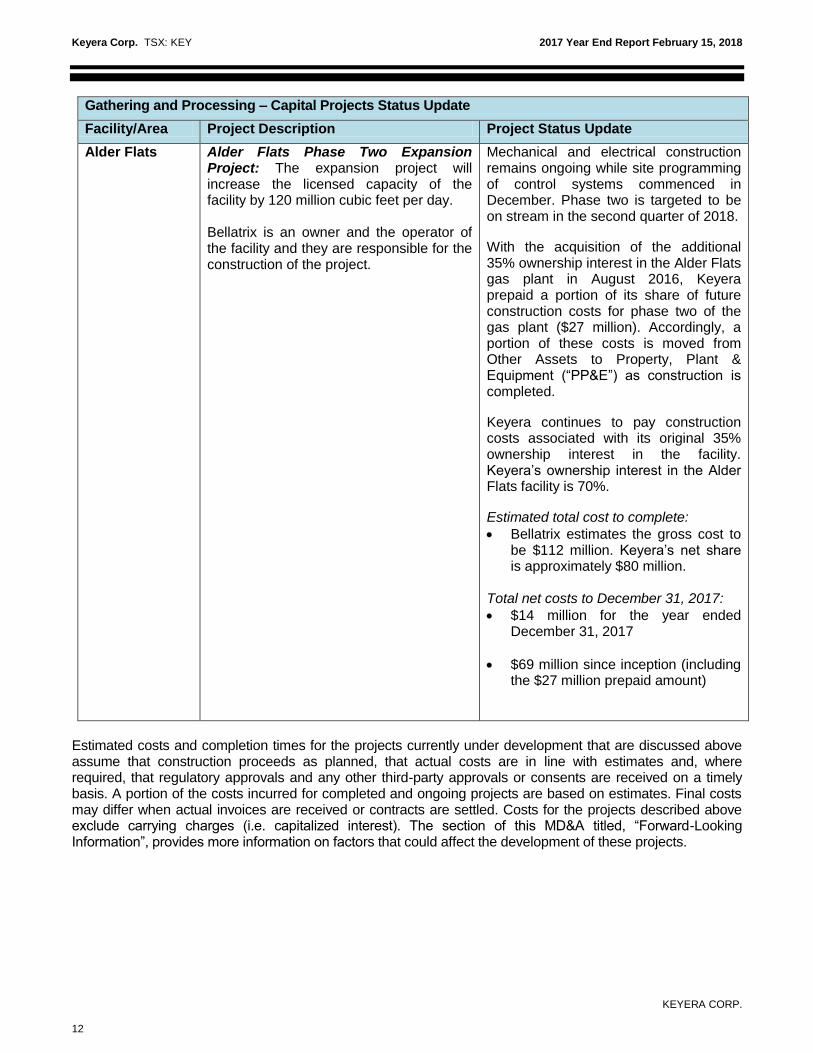
Alder Flats Alder Flats Phase Two Expansion Project: The expansion project will increase the licensed capacity of the facility by 120 million cubic feet per day. Bellatrix is an owner and the operator of the facility and they are responsible for the construction of the project.
Mechanical and electrical construction remains ongoing while site programming of control systems commenced in December. Phase two is targeted to be on stream in the second quarter of 2018.
With the acquisition of the additional 35% ownership interest in the Alder Flats gas plant in August 2016, Keyera prepaid a portion of its share of future construction costs for phase two of the gas plant ($27 million). Accordingly, a portion of these costs is moved from Other Assets to Property, Plant & Equipment (“PP&E”) as construction is completed.
Keyera continues to pay construction costs associated with its original 35% ownership interest in the facility. Keyera’s ownership interest in the Alder Flats facility is 70%.
Estimated total cost to complete:
Bellatrix estimates the gross cost to be $112 million. Keyera’s net share is approximately $80 million.
Total net costs to December 31, 2017:
$14 million for the year ended December 31, 2017
$69 million since inception (including the $27 million prepaid amount)
Estimated costs and completion times for the projects currently under development that are discussed above assume that construction proceeds as planned, that actual costs are in line with estimates and, where required, that regulatory approvals and any other third-party approvals or consents are received on a timely basis. A portion of the costs incurred for completed and ongoing projects are based on estimates. Final costs may differ when actual invoices are received or contracts are settled. Costs for the projects described above exclude carrying charges (i.e. capitalized interest). The section of this MD&A titled, “Forward-Looking Information”, provides more information on factors that could affect the development of these projects.
Keyera Corp. TSX: KEY 2017 Year End Report February 15, 2018
KEYERA CORP.
13
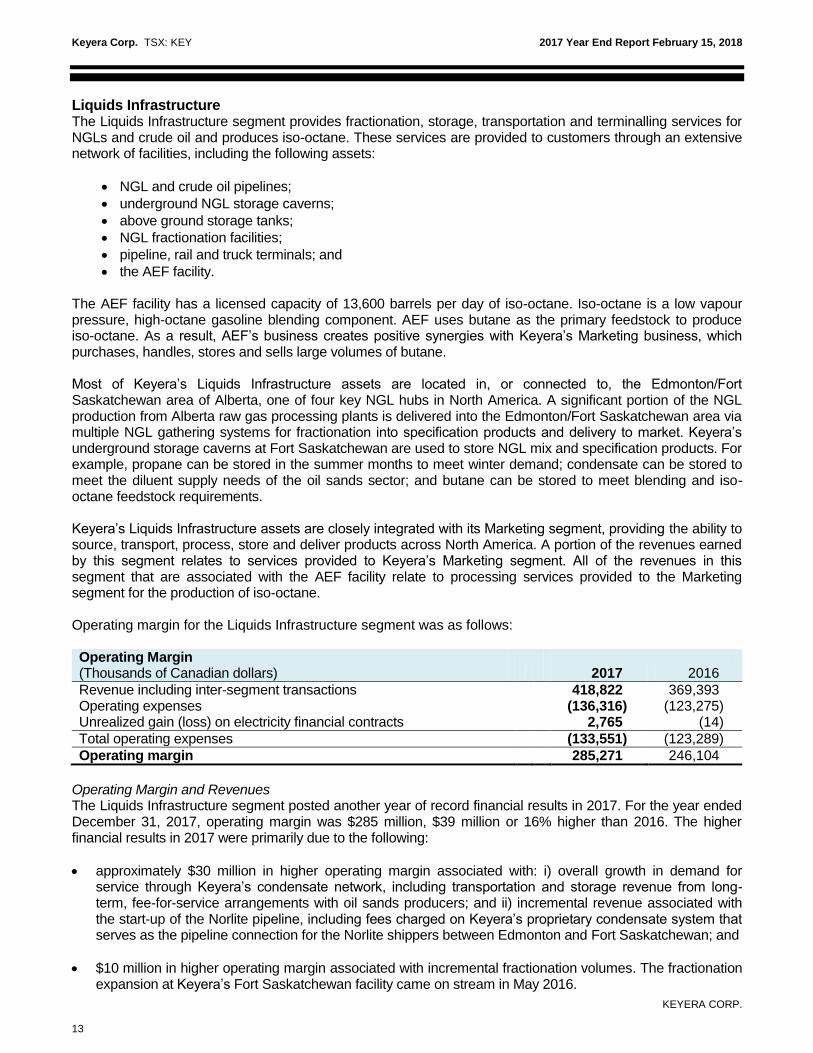
Liquids Infrastructure The Liquids Infrastructure segment provides fractionation, storage, transportation and terminalling services for NGLs and crude oil and produces iso-octane. These services are provided to customers through an extensive network of facilities, including the following assets:
NGL and crude oil pipelines;
underground NGL storage caverns;
above ground storage tanks;
NGL fractionation facilities;
pipeline, rail and truck terminals; and
the AEF facility.
The AEF facility has a licensed capacity of 13,600 barrels per day of iso-octane. Iso-octane is a low vapour pressure, high-octane gasoline blending component. AEF uses butane as the primary feedstock to produce iso-octane. As a result, AEF’s business creates positive synergies with Keyera’s Marketing business, which purchases, handles, stores and sells large volumes of butane. Most of Keyera’s Liquids Infrastructure assets are located in, or connected to, the Edmonton/Fort Saskatchewan area of Alberta, one of four key NGL hubs in North America. A significant portion of the NGL production from Alberta raw gas processing plants is delivered into the Edmonton/Fort Saskatchewan area via multiple NGL gathering systems for fractionation into specification products and delivery to market. Keyera’s underground storage caverns at Fort Saskatchewan are used to store NGL mix and specification products. For example, propane can be stored in the summer months to meet winter demand; condensate can be stored to meet the diluent supply needs of the oil sands sector; and butane can be stored to meet blending and iso-octane feedstock requirements. Keyera’s Liquids Infrastructure assets are closely integrated with its Marketing segment, providing the ability to source, transport, process, store and deliver products across North America. A portion of the revenues earned by this segment relates to services provided to Keyera’s Marketing segment. All of the revenues in this segment that are associated with the AEF facility relate to processing services provided to the Marketing segment for the production of iso-octane. Operating margin for the Liquids Infrastructure segment was as follows: Operating Margin (Thousands of Canadian dollars) 2017 2016
Revenue including inter-segment transactions 418,822 369,393 Operating expenses (136,316) (123,275) Unrealized gain (loss) on electricity financial contracts 2,765 (14)
Total operating expenses (133,551) (123,289)
Operating margin 285,271 246,104
Operating Margin and Revenues The Liquids Infrastructure segment posted another year of record financial results in 2017. For the year ended December 31, 2017, operating margin was $285 million, $39 million or 16% higher than 2016. The higher financial results in 2017 were primarily due to the following:
approximately $30 million in higher operating margin associated with: i) overall growth in demand for service through Keyera’s condensate network, including transportation and storage revenue from long-term, fee-for-service arrangements with oil sands producers; and ii) incremental revenue associated with the start-up of the Norlite pipeline, including fees charged on Keyera’s proprietary condensate system that serves as the pipeline connection for the Norlite shippers between Edmonton and Fort Saskatchewan; and
$10 million in higher operating margin associated with incremental fractionation volumes. The fractionation expansion at Keyera’s Fort Saskatchewan facility came on stream in May 2016.

Keyera Corp. TSX: KEY 2017 Year End Report February 15, 2018
KEYERA CORP.
14
These positive variances were partly offset by $6 million in lower operating margin associated with a fee reduction effective November 2016 for crude oil loading services at the Alberta Crude Terminal (50/50 joint venture with Kinder Morgan) in accordance with the terms of the agreement with the customer. Liquids Infrastructure revenues for the year ended December 31, 2017 were $49 million higher than 2016 due to the same factors that contributed to higher operating margin, as well as higher flow-through operating revenue charged to the Marketing segment to recover the unscheduled repair costs at AEF earlier this year. As these repair costs were recovered from the Marketing segment on a flow-through basis, there was minimal impact on operating margin for the Liquids Infrastructure segment. Liquids Infrastructure Activity It was a busy year for the Liquids Infrastructure segment as several capital projects were completed and put into service, including the Norlite pipeline which became operational at the end of June. The Norlite pipeline is operated by Enbridge and Keyera has a 30% non-operating ownership interest. Keyera’s Fort Saskatchewan condensate system expansion, a 24-inch pipeline and manifold that connects the Norlite pipeline to its existing condensate transportation infrastructure in Fort Saskatchewan, was also put into service in the second quarter of 2017. Keyera’s condensate network provides the Norlite shippers with the transportation required between Edmonton and Fort Saskatchewan, providing these customers with access to multiple sources of diluent supply. The Norlite pipeline’s anchor tenants are the owners of the Fort Hills oil sands project. Long-term, take-or-pay arrangements are in place with these shippers for the Norlite pipeline as well as Keyera’s proprietary condensate transportation network in Fort Saskatchewan. A portion of the take-or-pay fees associated with the Norlite pipeline and Keyera’s condensate system commenced May 1
st, and the remainder of fees were
effective August 1st. The Norlite shippers have elected a fee structure under which the tariffs are highest in
the first year and decline annually thereafter. In the fourth quarter of 2017, two additional long-term, take-or-pay agreements were executed that provide the shippers with transportation services on both the Norlite pipeline and Keyera’s Fort Saskatchewan Condensate System. Both of these contracts are expected to begin generating incremental revenue by mid-2018. Negotiations with other potential shippers are ongoing for available capacity on the pipeline. The demand for condensate, which is used as a diluent by bitumen producers, has continued to grow in Alberta as new oil sands projects and phased expansions of existing projects commence operation. Keyera operates an industry-leading condensate hub in Western Canada, with multiple receipt points including the Cochin pipeline and Enbridge’s Southern Lights pipeline and CRW pool. In early 2018, Keyera completed construction of a pipeline connection to Pembina Pipeline’s Canadian Diluent Hub which adds another receipt point into Keyera’s Fort Saskatchewan Condensate System. Accordingly, demand for Keyera’s diluent handling services has been strong and continues to grow. Keyera has long-term, take-or-pay arrangements in place with several major oil sands producers, including Imperial Oil, Husky, Suncor, Cenovus and CNRL. Under these agreements, Keyera provides a variety of services including diluent transportation, storage and rail offload services in the Edmonton/Fort Saskatchewan area. With condensate demand forecast to grow in Alberta over the next few years, Keyera continues to invest in its diluent handling network to provide its oil sands customers with comprehensive and reliable service solutions. In the fourth quarter of 2017, Keyera executed new agreements with two oil sands customers to provide condensate storage services under long-term, take-or-pay arrangements that came into effect January 1, 2018. Construction and commissioning of the four condensate storage tanks at Keyera’s Edmonton Terminal, each with working capacity of approximately 66,000 barrels, were completed in the third quarter of 2017. These storage tanks enhance Keyera’s operational ability to deliver diluent to the oil sands in a reliable and cost effective manner. In addition, a pipeline segment that Keyera acquired in 2016, referred to as the North Condensate Connector, was put into service in the fourth quarter of 2017. This pipeline was converted into condensate service in order to receive diluent from the North West Sturgeon Refinery under a long-term

Keyera Corp. TSX: KEY 2017 Year End Report February 15, 2018
KEYERA CORP.
15
diluent handling agreement. Refer to the table below, “Liquids Infrastructure – Completed Projects”, for more information related to these projects and other oil sands related projects. The Base Line Terminal, an above-ground crude oil storage terminal, commenced operation in mid-January with the first four tanks being put into service. The remaining eight tanks are expected to be phased into service throughout 2018. The Base Line Terminal is a 50/50 joint venture in affiliation with Kinder Morgan. The start-up of this terminal provides Keyera with fee-for-service cash flows that are underpinned by several take-or-pay agreements up to ten years in length. Utilization of the two fractionation units at Keyera’s Fort Saskatchewan complex steadily increased throughout 2017, averaging approximately 91% in 2017, an increase of 10% compared to 2016. Consequently, overall fractionation revenue in 2017 was higher relative to the prior year due to this increase in throughput, albeit at lower fractionation fees. Fractionation fees, on average, were lower in 2017 due to the competitive market for these services given the excess fractionation capacity existing in Alberta. In October, Keyera announced that it had entered into a 20-year midstream agreement with Chevron Canada Limited (“Chevron”) to fractionate and handle NGLs from Chevron’s Kaybob Duvernay operations near Fox Creek, Alberta. The agreement with Chevron includes an area of dedication in excess of 230,000 gross operated acres and also includes take-or-pay commitments. Under the terms of the agreement, Chevron will deliver approximately 50% of its NGLs from the area of dedication to Keyera for fractionation, storage and terminalling services on a fee-for-service basis. In early 2018, Keyera entered into an agreement with Chevron’s joint venture partner to provide fractionation, storage and terminalling services under substantially the same terms as the original Chevron agreement. Keyera expects to provide these services through its fractionation, storage and terminalling assets at its Fort Saskatchewan energy complex. Depending on the success and scale of Chevron and its joint venture partner’s Duvernay program, Keyera may need to expand its fractionation facilities in the future. The AEF facility is operated by the Liquids Infrastructure segment and provides iso-octane processing services to the Marketing segment on a fee-for-service basis. AEF was off-line for approximately nine weeks beginning in mid-February to repair one of the process reactors. Since completing the necessary repair work, the facility has been performing well and iso-octane production averaged slightly above its nameplate capacity in the second half of 2017. Comparatively, AEF operated at an average of 57% and 82% of its capacity during the first and second quarters of 2017 due to the outage. The total cost of the repair work was approximately $8 million and these costs were flowed through to the Marketing segment in the first half of the year as operating expenses and therefore did not have a significant impact on the financial results of the Liquids Infrastructure segment.
Keyera Corp. TSX: KEY 2017 Year End Report February 15, 2018
KEYERA CORP.
16
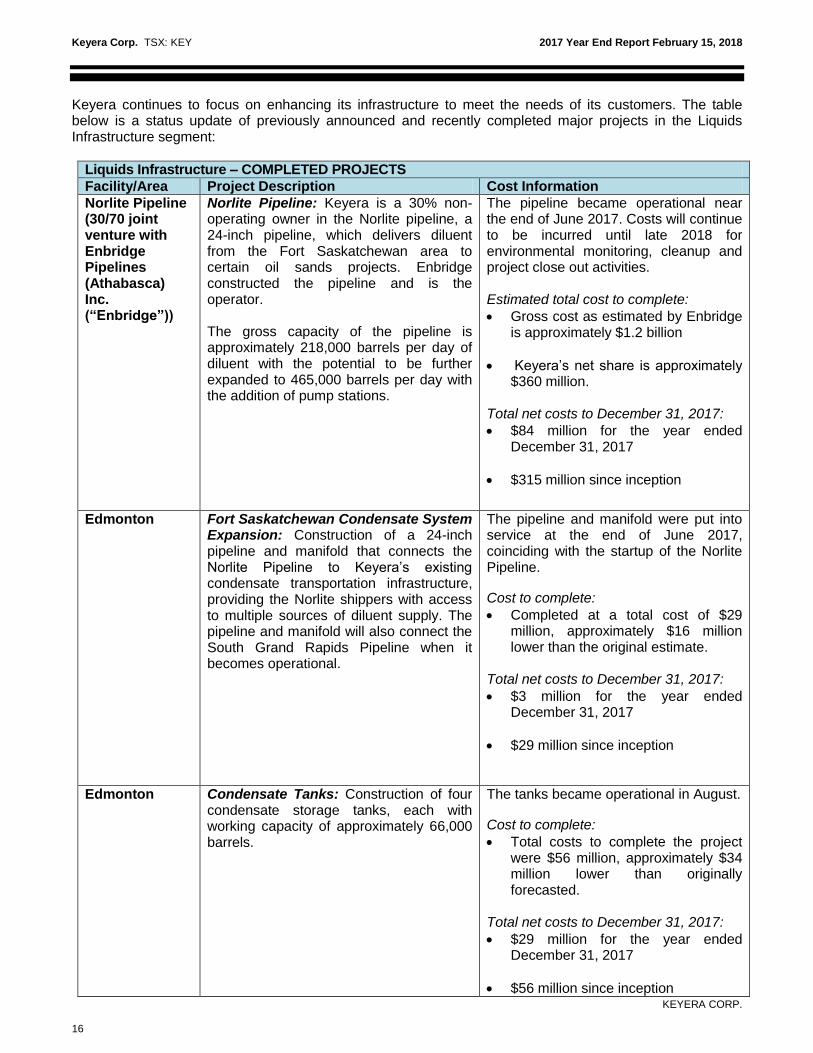
Keyera continues to focus on enhancing its infrastructure to meet the needs of its customers. The table below is a status update of previously announced and recently completed major projects in the Liquids Infrastructure segment:
Liquids Infrastructure – COMPLETED PROJECTS
Facility/Area Project Description Cost Information
Norlite Pipeline (30/70 joint venture with Enbridge Pipelines (Athabasca) Inc. (“Enbridge”))
Norlite Pipeline: Keyera is a 30% non-operating owner in the Norlite pipeline, a 24-inch pipeline, which delivers diluent from the Fort Saskatchewan area to certain oil sands projects. Enbridge constructed the pipeline and is the operator.
The gross capacity of the pipeline is approximately 218,000 barrels per day of diluent with the potential to be further expanded to 465,000 barrels per day with the addition of pump stations.
The pipeline became operational near the end of June 2017. Costs will continue to be incurred until late 2018 for environmental monitoring, cleanup and project close out activities. Estimated total cost to complete:
Gross cost as estimated by Enbridge is approximately $1.2 billion
Keyera’s net share is approximately $360 million.
Total net costs to December 31, 2017:
$84 million for the year ended December 31, 2017
$315 million since inception
Edmonton Fort Saskatchewan Condensate System Expansion: Construction of a 24-inch pipeline and manifold that connects the Norlite Pipeline to Keyera’s existing condensate transportation infrastructure, providing the Norlite shippers with access to multiple sources of diluent supply. The pipeline and manifold will also connect the South Grand Rapids Pipeline when it becomes operational.
The pipeline and manifold were put into service at the end of June 2017, coinciding with the startup of the Norlite Pipeline.
Cost to complete:
Completed at a total cost of $29 million, approximately $16 million lower than the original estimate.
Total net costs to December 31, 2017:
$3 million for the year ended December 31, 2017
$29 million since inception
Edmonton Condensate Tanks: Construction of four condensate storage tanks, each with working capacity of approximately 66,000 barrels.
The tanks became operational in August.
Cost to complete:
Total costs to complete the project were $56 million, approximately $34 million lower than originally forecasted.
Total net costs to December 31, 2017:
$29 million for the year ended December 31, 2017
$56 million since inception

Keyera Corp. TSX: KEY 2017 Year End Report February 15, 2018
KEYERA CORP.
17
Liquids Infrastructure – COMPLETED PROJECTS
Facility/Area Project Description Cost Information
Edmonton/Fort Saskatchewan
North Condensate Connector: Repurposing of a pipeline acquired in 2016 for approximately $18 million to be used to receive diluent from the North West Sturgeon Refinery under a long-term diluent handling agreement.
Construction of connections, completion of conversion work and line-fill were completed in the third quarter of 2017. The pipeline was put into service in the fourth quarter coinciding with the start-up of the North West Sturgeon Refinery. Cost to complete:
$19 million for connections and other conversion work required for the pipeline to be put in service.
Total net costs to December 31, 2017 for connections and conversion work:
$2 million for the year ended December 31, 2017
$19 million since inception
Edmonton/Fort Saskatchewan
Keyera Butane System (previously referred to as the South NGL Connector): Repurposing a pipeline between Edmonton and Fort Saskatchewan that was leased in December 2016 to provide Keyera with increased flexibility and capacity (up to 55,000 barrels per day) for NGL transportation services in the area.
The conversion work was completed in the fourth quarter of 2017, and the pipeline was put into service in January. This pipeline is being used to transport butane between Edmonton and Fort Saskatchewan and replaces a pipeline that was leased as part of the Fort Saskatchewan pipeline system and expires in 2018. Cost to complete:
Approximately $28 million Total net costs to December 31, 2017 for connections and conversion work:
$7 million for the year ended December 31, 2017
$26 million since inception
Keyera Corp. TSX: KEY 2017 Year End Report February 15, 2018
KEYERA CORP.
18
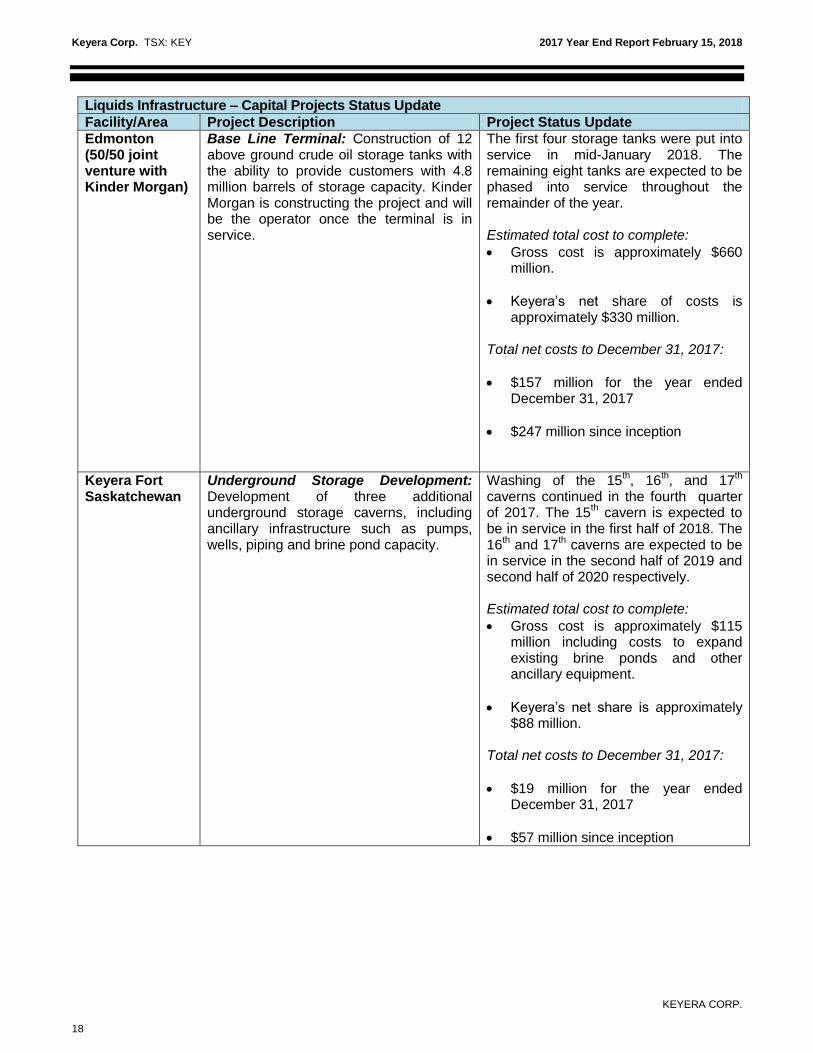
Liquids Infrastructure – Capital Projects Status Update
Facility/Area Project Description Project Status Update
Edmonton (50/50 joint venture with Kinder Morgan)
Base Line Terminal: Construction of 12 above ground crude oil storage tanks with the ability to provide customers with 4.8 million barrels of storage capacity. Kinder Morgan is constructing the project and will be the operator once the terminal is in service.
The first four storage tanks were put into service in mid-January 2018. The remaining eight tanks are expected to be phased into service throughout the remainder of the year. Estimated total cost to complete:
Gross cost is approximately $660 million.
Keyera’s net share of costs is approximately $330 million.
Total net costs to December 31, 2017:
$157 million for the year ended December 31, 2017
$247 million since inception
Keyera Fort Saskatchewan
Underground Storage Development: Development of three additional underground storage caverns, including ancillary infrastructure such as pumps, wells, piping and brine pond capacity.
Washing of the 15th, 16
th, and 17
th
caverns continued in the fourth quarter of 2017. The 15
th cavern is expected to
be in service in the first half of 2018. The 16
th and 17
th caverns are expected to be
in service in the second half of 2019 and second half of 2020 respectively. Estimated total cost to complete:
Gross cost is approximately $115 million including costs to expand existing brine ponds and other ancillary equipment.
Keyera’s net share is approximately $88 million.
Total net costs to December 31, 2017:
$19 million for the year ended December 31, 2017
$57 million since inception

Keyera Corp. TSX: KEY 2017 Year End Report February 15, 2018
KEYERA CORP.
19
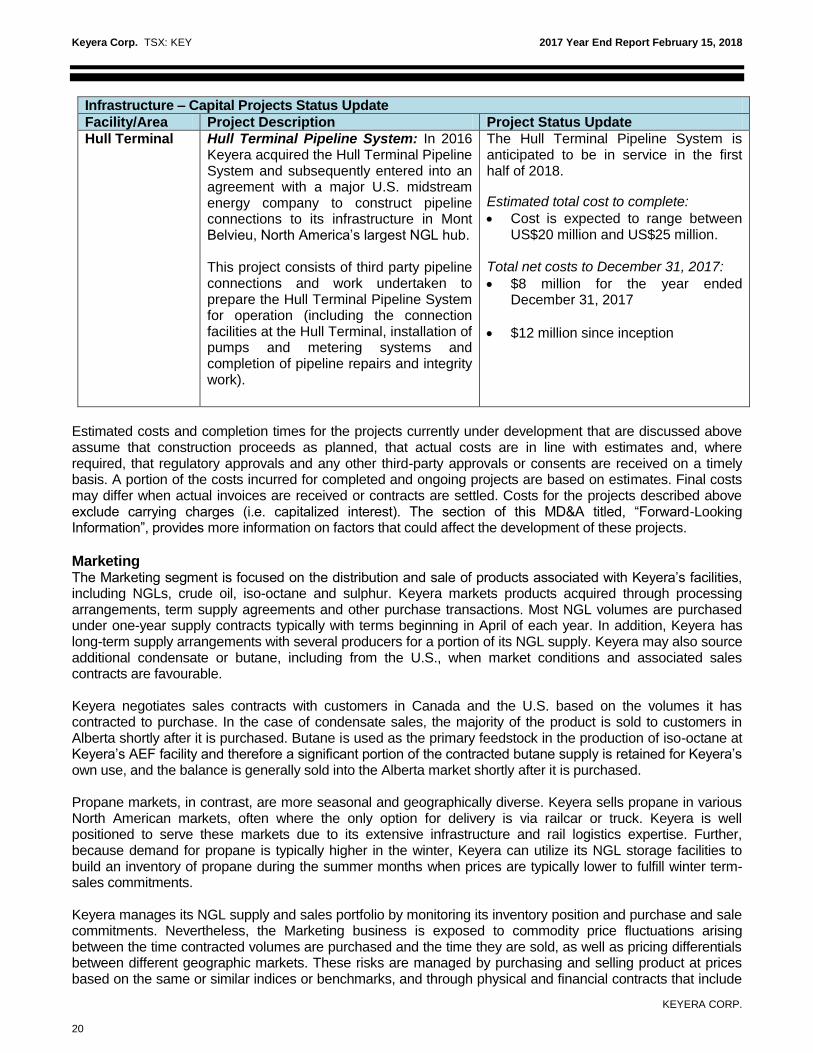
Infrastructure – Capital Projects Status Update
Facility/Area Project Description Project Status Update
West Central Alberta
Keylink Pipeline: The project consists of over 240 kilometres of newly constructed and repurposed existing pipelines that will transport NGL mix to the Rimbey gas plant for fractionation into specification products. Keylink will connect several Keyera gas plants, including Brazeau River, West Pembina and Minnehik Buck Lake.
Regulatory approvals were received early in the fourth quarter and construction has commenced. The pipeline system is expected to be operational by spring 2018.
Estimated total cost to complete:
approximately $147 million. Total net costs to December 31, 2017:
$50 million for the year ended December 31, 2017
$54 million since inception
Edmonton (50/50 joint venture with Grand Rapids Pipeline Limited Partnership)
South Grand Rapids Pipeline: Keyera has committed to acquire a 50% interest in the southern portion of the 20-inch, 45-kilometre diluent Grand Rapids Pipeline when it is completed. The pipeline is being constructed by Grand Rapids Pipeline Limited Partnership (“GRPLP”), an affiliate of TransCanada and PetroChina Canada. The pipeline will extend from Keyera’s Edmonton Terminal to TransCanada’s Heartland Terminal near Fort Saskatchewan. Keyera will be the operator of the pipeline. As part of this project, Keyera constructed a pump station at its Edmonton Terminal where the pipeline will connect. Keyera will sell a 50% ownership interest in the pump station to GRPLP once they initiate their own diluent movements on the pipeline.
Construction of the pump station was completed in the third quarter of 2017. Based on the new schedule provided by GRPLP, the pipeline is now expected to be in service mid-2018. Estimated total cost to complete:
Gross cost is approximately $240 million for the pipeline and $40 million for construction of the pump station.
Keyera’s 50% share is $120 million for acquisition of the pipeline and $20 million for the pump station for a total combined net cost of approximately $140 million.
The costs below represent 100% of the cost of construction incurred to date for the pumps.
Total costs to December 31, 2017:
$25 million for the year ended December 31, 2017
$38 million since inception
Keyera Corp. TSX: KEY 2017 Year End Report February 15, 2018
KEYERA CORP.
20
Infrastructure – Capital Projects Status Update
Facility/Area Project Description Project Status Update
Hull Terminal Hull Terminal Pipeline System: In 2016 Keyera acquired the Hull Terminal Pipeline System and subsequently entered into an agreement with a major U.S. midstream energy company to construct pipeline connections to its infrastructure in Mont Belvieu, North America’s largest NGL hub. This project consists of third party pipeline connections and work undertaken to prepare the Hull Terminal Pipeline System for operation (including the connection facilities at the Hull Terminal, installation of pumps and metering systems and completion of pipeline repairs and integrity work).
The Hull Terminal Pipeline System is anticipated to be in service in the first half of 2018.
Estimated total cost to complete:
Cost is expected to range between US$20 million and US$25 million.
Total net costs to December 31, 2017:
$8 million for the year ended December 31, 2017
$12 million since inception
Estimated costs and completion times for the projects currently under development that are discussed above assume that construction proceeds as planned, that actual costs are in line with estimates and, where required, that regulatory approvals and any other third-party approvals or consents are received on a timely basis. A portion of the costs incurred for completed and ongoing projects are based on estimates. Final costs may differ when actual invoices are received or contracts are settled. Costs for the projects described above exclude carrying charges (i.e. capitalized interest). The section of this MD&A titled, “Forward-Looking Information”, provides more information on factors that could affect the development of these projects.
Marketing The Marketing segment is focused on the distribution and sale of products associated with Keyera’s facilities, including NGLs, crude oil, iso-octane and sulphur. Keyera markets products acquired through processing arrangements, term supply agreements and other purchase transactions. Most NGL volumes are purchased under one-year supply contracts typically with terms beginning in April of each year. In addition, Keyera has long-term supply arrangements with several producers for a portion of its NGL supply. Keyera may also source additional condensate or butane, including from the U.S., when market conditions and associated sales contracts are favourable. Keyera negotiates sales contracts with customers in Canada and the U.S. based on the volumes it has contracted to purchase. In the case of condensate sales, the majority of the product is sold to customers in Alberta shortly after it is purchased. Butane is used as the primary feedstock in the production of iso-octane at Keyera’s AEF facility and therefore a significant portion of the contracted butane supply is retained for Keyera’s own use, and the balance is generally sold into the Alberta market shortly after it is purchased. Propane markets, in contrast, are more seasonal and geographically diverse. Keyera sells propane in various North American markets, often where the only option for delivery is via railcar or truck. Keyera is well positioned to serve these markets due to its extensive infrastructure and rail logistics expertise. Further, because demand for propane is typically higher in the winter, Keyera can utilize its NGL storage facilities to build an inventory of propane during the summer months when prices are typically lower to fulfill winter term-sales commitments. Keyera manages its NGL supply and sales portfolio by monitoring its inventory position and purchase and sale commitments. Nevertheless, the Marketing business is exposed to commodity price fluctuations arising between the time contracted volumes are purchased and the time they are sold, as well as pricing differentials between different geographic markets. These risks are managed by purchasing and selling product at prices based on the same or similar indices or benchmarks, and through physical and financial contracts that include
Keyera Corp. TSX: KEY 2017 Year End Report February 15, 2018
KEYERA CORP.
21
energy-related forward contracts, price swaps, forward currency contracts and other hedging instruments. A more detailed description of the risks associated with the Marketing segment is available in Keyera’s Annual Information Form, which is available at www.sedar.com. Keyera’s primary markets for iso-octane are in the Gulf Coast, Midwestern United States and Western Canada. Demand for iso-octane is seasonal, with higher demand in the spring and summer months resulting in higher sales prices. There can be significant variability in iso-octane margins. As with Keyera’s other marketing activities, various strategies are utilized to mitigate the risks associated with the commodity price exposure, including the use of financial contracts. The section of this MD&A titled “Risk Management” provides more information on the risks associated with the sale of iso-octane and Keyera’s related hedging strategy. Keyera also engages in crude oil midstream activities, where it operates facilities at various locations in Alberta that allow it to transport, process and blend various product streams. Crude oil midstream margins are earned by blending products of lower value into higher value product streams. As a result, these transactions are exposed to variability in price and quality differentials between various product streams. Keyera manages this risk by balancing its purchases and sales and locking in margins through its risk management strategies. Historically, a portion of Keyera’s crude oil midstream activities have been undertaken through joint venture arrangements. Recently, the nature of these joint ventures has evolved, and Keyera expects to be a less active participant in these joint venture operations. Keyera will be continuing to operate its other crude oil midstream facilities and exploring new opportunities. Overall, the integration of Keyera’s business lines means that its Marketing segment can draw on the resources available to it through its two facilities based operating segments (Liquids Infrastructure and Gathering and Processing), including access to NGL supply and key fractionation, storage and transportation infrastructure and logistics expertise.
Keyera Corp. TSX: KEY 2017 Year End Report February 15, 2018
KEYERA CORP.
22
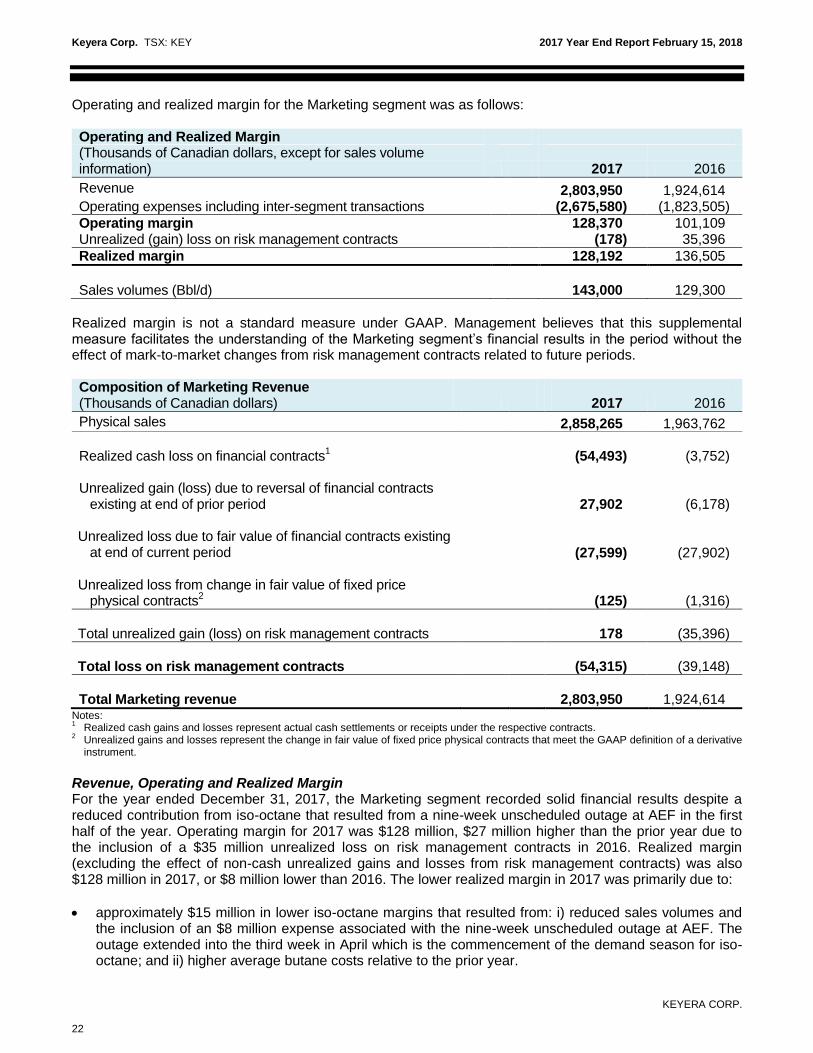
Operating and realized margin for the Marketing segment was as follows: Operating and Realized Margin (Thousands of Canadian dollars, except for sales volume information) 2017 2016
Revenue 2,803,950 1,924,614 Operating expenses including inter-segment transactions (2,675,580) (1,823,505)
Operating margin 128,370 101,109 Unrealized (gain) loss on risk management contracts (178) 35,396
Realized margin 128,192 136,505
Sales volumes (Bbl/d) 143,000 129,300
Realized margin is not a standard measure under GAAP. Management believes that this supplemental measure facilitates the understanding of the Marketing segment’s financial results in the period without the effect of mark-to-market changes from risk management contracts related to future periods. Composition of Marketing Revenue (Thousands of Canadian dollars) 2017 2016
Physical sales 2,858,265 1,963,762 Realized cash loss on financial contracts
1 (54,493) (3,752)
Unrealized gain (loss) due to reversal of financial contracts
existing at end of prior period 27,902 (6,178) Unrealized loss due to fair value of financial contracts existing
at end of current period (27,599) (27,902) Unrealized loss from change in fair value of fixed price
physical contracts2 (125) (1,316)
Total unrealized gain (loss) on risk management contracts
178
(35,396)
Total loss on risk management contracts
(54,315)
(39,148)
Total Marketing revenue 2,803,950 1,924,614
Notes: 1 Realized cash gains and losses represent actual cash settlements or receipts under the respective contracts.
2 Unrealized gains and losses represent the change in fair value of fixed price physical contracts that meet the GAAP definition of a derivative
instrument.
Revenue, Operating and Realized Margin For the year ended December 31, 2017, the Marketing segment recorded solid financial results despite a reduced contribution from iso-octane that resulted from a nine-week unscheduled outage at AEF in the first half of the year. Operating margin for 2017 was $128 million, $27 million higher than the prior year due to the inclusion of a $35 million unrealized loss on risk management contracts in 2016. Realized margin (excluding the effect of non-cash unrealized gains and losses from risk management contracts) was also $128 million in 2017, or $8 million lower than 2016. The lower realized margin in 2017 was primarily due to:
approximately $15 million in lower iso-octane margins that resulted from: i) reduced sales volumes and the inclusion of an $8 million expense associated with the nine-week unscheduled outage at AEF. The outage extended into the third week in April which is the commencement of the demand season for iso-octane; and ii) higher average butane costs relative to the prior year.

Keyera Corp. TSX: KEY 2017 Year End Report February 15, 2018
KEYERA CORP.
23
The financial effect of lower iso-octane margins in 2017 was partly offset by higher crude oil midstream margins compared to the prior year. Keyera’s crude oil midstream business contributed strong operating margin in 2017, particularly in the fourth quarter as blending volumes and crude oil prices increased compared to the same period in the prior year. The 2016 Marketing results also included the effect of lower iso-octane sales volumes in the second half of the year as a result of the scheduled turnaround at AEF that began in early September and concluded in early November. The turnaround was scheduled to be completed during the low demand season and therefore had a lower overall impact on the Marketing financial results compared to the outage that occurred in 2017. In general, gross revenue in the Marketing segment is influenced by NGL and iso-octane sales volumes as well as commodity prices. For the year ended December 31, 2017, revenue from physical sales was $895 million higher compared to 2016 due to higher average sales prices and higher sales volumes for NGLs and iso-octane. Market Overview Overall iso-octane margins in 2017 were lower than the prior year primarily due to the unscheduled outage at AEF in the first half of the year. Since completing the required repair work, AEF operated at slightly above its nameplate capacity during the second half of 2017 resulting in strong sales volumes. Although iso-octane sales volumes were approximately 15% higher in 2017 compared to the prior year, margins were lower partly due to higher average butane feedstock costs relative to 2016. Demand for iso-octane typically increases in the summer months as driving activity and gasoline demand increase, which generally translates into premium pricing for gasoline and iso-octane. According to the U.S. Energy Information Administration’s January 2018 report, overall gasoline consumption remained nearly flat from 2016 to 2017 resulting in comparable gasoline prices and premiums during the summer demand season. However, a short-term spike in gasoline prices occurred in September and continued into early December that resulted from refinery and transportation outages associated with Hurricane Harvey. This run-up in gasoline prices did not have a significant impact on Keyera’s iso-octane margins as the majority of sales in the third and fourth quarters of 2017 were already hedged. Since then, gasoline prices have returned to more seasonal norms. As Keyera relies on rail transportation to deliver iso-octane to its primary markets outside of Alberta, rail service levels are an important factor in managing inventories and deliveries. In early 2018, Keyera has experienced some rail service disruptions that resulted in AEF operating at reduced levels. Keyera is working closely with the railways to manage service levels in order to help mitigate the impact on operations at AEF. Margins from the sale of butane have become a smaller portion of Keyera’s overall Marketing strategy as most of the butane purchased is utilized for its internal requirements, including the feedstock necessary for the production of iso-octane. Because butane is the feedstock for AEF, butane costs directly affect iso-octane margins. As butane prices usually decline in the spring and summer months, Keyera utilizes its storage capabilities to build inventory to supply the needs of AEF during the winter months when butane prices are usually higher. Effective with the contract year that began on April 1
st, 2017, most of Keyera’s contracted propane supply
cost is based on market index prices, in response to more competitive dynamics. This strategy allowed Keyera to attract incremental volumes through its fractionation and storage facilities in the Liquids Infrastructure segment, but it resulted in lower propane margins during the spring and summer months when demand is seasonally low and costs such as storage and rail car lease charges continue to be expensed. Propane margins were strong in the fourth quarter of 2017 due to North American propane inventory levels remaining below the five-year average combined with cold winter weather. These factors contributed to strong demand and prices for propane in the fourth quarter and this trend continued into the early part of 2018. Keyera utilized its Josephburg Terminal, which was converted from a 12-hour to a 24-hour operation
Keyera Corp. TSX: KEY 2017 Year End Report February 15, 2018
KEYERA CORP.
24
in the fourth quarter, to export significantly higher volumes of propane by rail to meet the winter heating demand in markets across North America. On an annual basis, propane margins remained a relatively small contributor to Keyera’s overall Marketing operating margin, although with greater seasonal variation between the summer and winter months compared to previous years. As oil sands projects have come on stream over the past two years, bitumen production has increased along with demand for condensate that is used as a diluent. This demand for condensate is being met primarily by increased condensate production from the Western Canada Sedimentary Basin and pipeline deliveries. As a result, demand for rail imports has been limited. Keyera imports condensate into Alberta when demand fundamentals support positive operating margins. Contribution from the sale of condensate in 2017 was similar to that earned in the same period of 2016. Risk Management When possible, Keyera uses hedging strategies to mitigate risk in its Marketing business, including foreign currency exchange risk associated with the purchase and sale of NGLs and iso-octane. Keyera’s hedging objective for iso-octane is to secure attractive margins and mitigate the effect of iso-octane price fluctuations on its future operating margins. Iso-octane is generally priced at a premium to the price of Reformulated Blendstock for Oxygen Blending (“RBOB”). RBOB is the highest volume refined product sold in the U.S. and has the most liquid forward financial contracts. Accordingly, Keyera expects to continue to utilize RBOB-based financial contracts to hedge a portion of its iso-octane sales. To protect the value of its NGL inventory from fluctuations in commodity prices, Keyera typically uses physical and financial forward contracts. For propane inventory, contracts are generally put in place as inventory builds and may either: i) settle when products are expected to be withdrawn from inventory and sold; or ii) settle and reset on a month-to-month basis. The second strategy can result in differences in timing between when the contracts are settled and when the product is sold. In general, the increase or decrease in the fair value of the contracts is intended to mitigate fluctuations in the value of the inventories and protect operating margin. Keyera typically uses propane physical and financial forward contracts to hedge its propane inventory. Keyera may hold butane inventory to meet the feedstock requirements of the AEF facility. For condensate, most of the product purchased is sold within one month. The sales contracts for both butane and condensate are typically priced as a percentage of WTI crude oil and the supply cost in certain cases may be based on a hub posted or index price. To align the pricing terms of physical supply with the terms of contracted sales and to protect the value of butane and condensate inventory, the following hedging strategies may be utilized:
Keyera may enter into financial contracts to lock in the supply price at a specified percentage of WTI, as the sales contracts for butane and condensate are also generally priced in relation to WTI. When butane or condensate is physically purchased, the financial contract is settled and a realized gain or loss is recorded in income.
Once the product is in inventory, WTI financial forward contracts are generally used to protect the value of the inventory.
Within these hedging strategies, there may be differences in timing between when the financial contracts are settled and when the products are purchased and sold. There may also be basis risk between the prices of crude oil and the NGL products and therefore the financial contracts may not fully offset future butane and condensate price movements. For the year ended December 31, 2017, the total unrealized gain on risk management contracts was virtually nil. Further details are provided in the “Composition of Marketing Revenue” table above.

Keyera Corp. TSX: KEY 2017 Year End Report February 15, 2018
KEYERA CORP.
25
The fair value of outstanding risk management contracts as at December 31, 2017 resulted in an unrealized (non-cash) loss of $28 million that includes the following significant items:
a $25 million non-cash loss relating to butane, condensate and iso-octane risk management contracts;
a $5 million non-cash loss relating to propane risk management contracts; and
a $2 million non-cash gain relating to foreign currency and other financial contracts. The fair value of financial and fixed price physical contracts will vary as these contracts are marked-to-market at the end of each period. A summary of the financial contracts existing at December 31, 2017, and the sensitivity to earnings resulting from changes in commodity prices, can be found in note 21, Financial Instruments and Risk Management, of the accompanying financial statements. CORPORATE AND OTHER
Non-Operating Expenses and Other Income
(Thousands of Canadian dollars) 2017 2016
Other income (operating margin) 14,616 8,735 General and administrative (net of overhead recoveries on operated facilities)
(67,293)
(61,957)
Finance costs (72,393) (72,830) Depreciation, depletion and amortization expenses (165,978) (171,615) Net foreign currency gain (loss) on U.S. debt 11,131 (2,442) Long-term incentive plan expense (13,907) (16,840) Impairment expense (20,830) (12,270) Gain (loss) on disposal of property, plant and equipment 20,447 (890) Income tax expense (104,798) (90,478)
Other Income Keyera has acquired oil and gas reserves as part of the acquisition of ownership interests in the Minnehik Buck Lake, West Pembina, Bigoray and Cynthia facilities. Keyera reports operating margin (net of royalties and operating expenses) from the production associated with all of its reserves as other income as it has no plans to drill additional wells to offset natural production declines. Other income for the year ended December 31, 2017 was $15 million, $6 million higher than the prior year primarily due to higher average commodity prices in 2017. Production for the year ended December 31, 2017 averaged 4,107 barrels of oil equivalent per day compared to 4,505 barrels of oil equivalent per day in 2016. The reserves and production are not material to Keyera’s business and do not have a material effect on its financial results. General and Administrative Expenses General and administrative (“G&A”) expenses for 2017 were $67 million, $5 million higher than the prior year primarily due to higher salary and employee related costs. Finance Costs (including accretion) Finance costs for the year ended December 31, 2017 were $72 million, virtually unchanged from the prior year. The effect of higher interest expense charges in 2017 associated with long-term debt issued in the fourth quarter of 2016 and third quarter of 2017 was offset by higher interest capitalized on qualifying projects. Interest capitalized on qualifying projects was $27 million in 2017 compared to $14 million in the prior year. Depreciation, Depletion and Amortization Expenses Depreciation, depletion and amortization (“DD&A”) expenses were $166 million in 2017, $6 million lower than the prior year despite adding several new assets in 2017 including the Norlite pipeline and condensate tanks in Edmonton. In the fourth quarter of 2016, Keyera conducted a review of the useful life of its assets. Based on
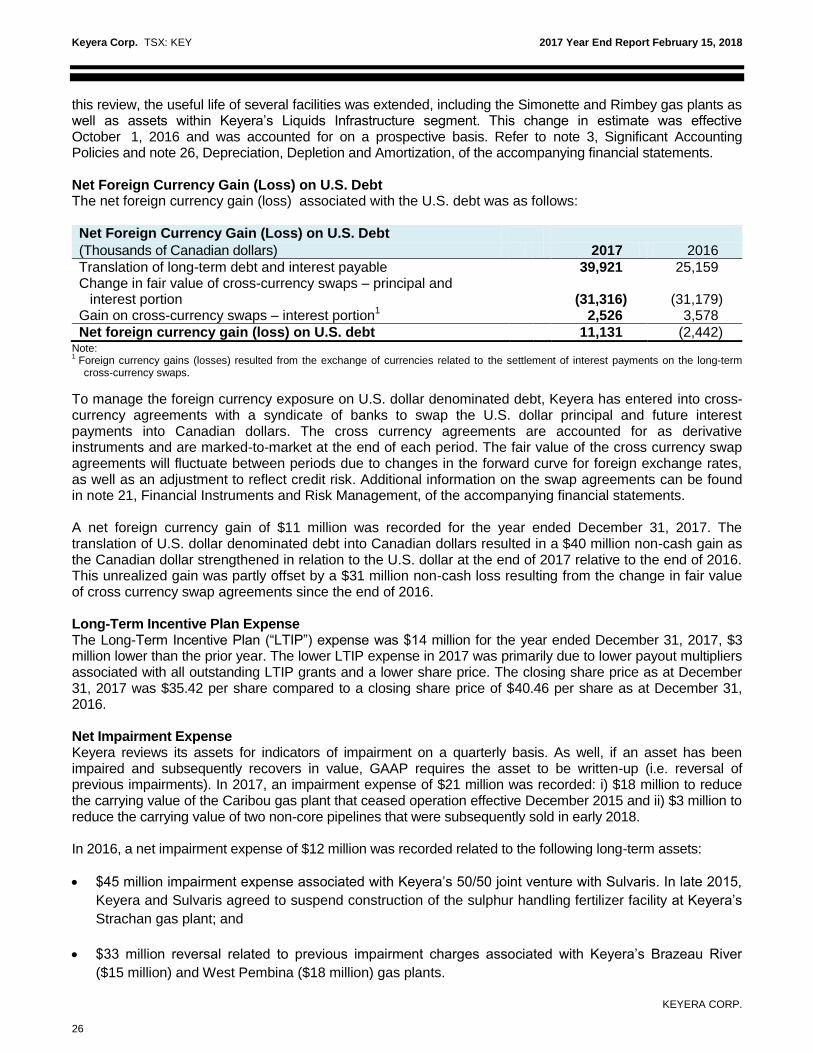
Keyera Corp. TSX: KEY 2017 Year End Report February 15, 2018
KEYERA CORP.
26
this review, the useful life of several facilities was extended, including the Simonette and Rimbey gas plants as well as assets within Keyera’s Liquids Infrastructure segment. This change in estimate was effective October 1, 2016 and was accounted for on a prospective basis. Refer to note 3, Significant Accounting Policies and note 26, Depreciation, Depletion and Amortization, of the accompanying financial statements. Net Foreign Currency Gain (Loss) on U.S. Debt The net foreign currency gain (loss) associated with the U.S. debt was as follows: Net Foreign Currency Gain (Loss) on U.S. Debt (Thousands of Canadian dollars) 2017 2016
Translation of long-term debt and interest payable 39,921 25,159 Change in fair value of cross-currency swaps – principal and
interest portion
(31,316)
(31,179) Gain on cross-currency swaps – interest portion
1 2,526 3,578
Net foreign currency gain (loss) on U.S. debt 11,131 (2,442) Note: 1
Foreign currency gains (losses) resulted from the exchange of currencies related to the settlement of interest payments on the long-term cross-currency swaps.
To manage the foreign currency exposure on U.S. dollar denominated debt, Keyera has entered into cross- currency agreements with a syndicate of banks to swap the U.S. dollar principal and future interest payments into Canadian dollars. The cross currency agreements are accounted for as derivative instruments and are marked-to-market at the end of each period. The fair value of the cross currency swap agreements will fluctuate between periods due to changes in the forward curve for foreign exchange rates, as well as an adjustment to reflect credit risk. Additional information on the swap agreements can be found in note 21, Financial Instruments and Risk Management, of the accompanying financial statements. A net foreign currency gain of $11 million was recorded for the year ended December 31, 2017. The translation of U.S. dollar denominated debt into Canadian dollars resulted in a $40 million non-cash gain as the Canadian dollar strengthened in relation to the U.S. dollar at the end of 2017 relative to the end of 2016. This unrealized gain was partly offset by a $31 million non-cash loss resulting from the change in fair value of cross currency swap agreements since the end of 2016. Long-Term Incentive Plan Expense The Long-Term Incentive Plan (“LTIP”) expense was $14 million for the year ended December 31, 2017, $3 million lower than the prior year. The lower LTIP expense in 2017 was primarily due to lower payout multipliers associated with all outstanding LTIP grants and a lower share price. The closing share price as at December 31, 2017 was $35.42 per share compared to a closing share price of $40.46 per share as at December 31, 2016. Net Impairment Expense Keyera reviews its assets for indicators of impairment on a quarterly basis. As well, if an asset has been impaired and subsequently recovers in value, GAAP requires the asset to be written-up (i.e. reversal of previous impairments). In 2017, an impairment expense of $21 million was recorded: i) $18 million to reduce the carrying value of the Caribou gas plant that ceased operation effective December 2015 and ii) $3 million to reduce the carrying value of two non-core pipelines that were subsequently sold in early 2018. In 2016, a net impairment expense of $12 million was recorded related to the following long-term assets:
$45 million impairment expense associated with Keyera’s 50/50 joint venture with Sulvaris. In late 2015,
Keyera and Sulvaris agreed to suspend construction of the sulphur handling fertilizer facility at Keyera’s
Strachan gas plant; and
$33 million reversal related to previous impairment charges associated with Keyera’s Brazeau River
($15 million) and West Pembina ($18 million) gas plants.

Keyera Corp. TSX: KEY 2017 Year End Report February 15, 2018
KEYERA CORP.
27
Impairment expenses are non-cash charges and do not affect operating margin, distributable cash flow,
EBITDA, or Adjusted EBITDA.
Gain on Disposal of Property, Plant and Equipment In the second quarter of 2017, Keyera sold the Paddle River gas plant and Judy Creek pipeline for proceeds of approximately $6 million. The sale of these non-core assets resulted in a gain of $20 million in the second quarter of 2017. Neither the Paddle River gas plant nor the Judy Creek pipeline were operational at the time of the sale.
Taxes In general, as earnings before taxes increase, total tax expense (current and deferred taxes) will also be higher. If sufficient tax pools exist, current taxes will be reduced and deferred income taxes will increase as these tax pools are utilized or drawn down. Other factors that affect the calculation of deferred income taxes include future income tax rate changes and permanent differences (i.e. accounting income or expenses that will never be taxed or deductible for income tax purposes). Current Income Taxes Current income tax expense for the year ended December 31, 2017 was $5 million, compared to an expense of $15 million in 2016. For 2018, current income tax expense is expected to range between $40 million and $45 million which is primarily based on the estimate of 2017 taxable income from Keyera Partnership. Keyera estimates its total tax pools at December 31, 2017 were approximately $2.2 billion. Deferred Income Taxes For the year ended December 31, 2017, deferred income tax expense was $99 million, $24 million higher than 2016. The increase in deferred income tax expense is primarily due to higher earnings before income taxes in 2017 relative to the prior year.
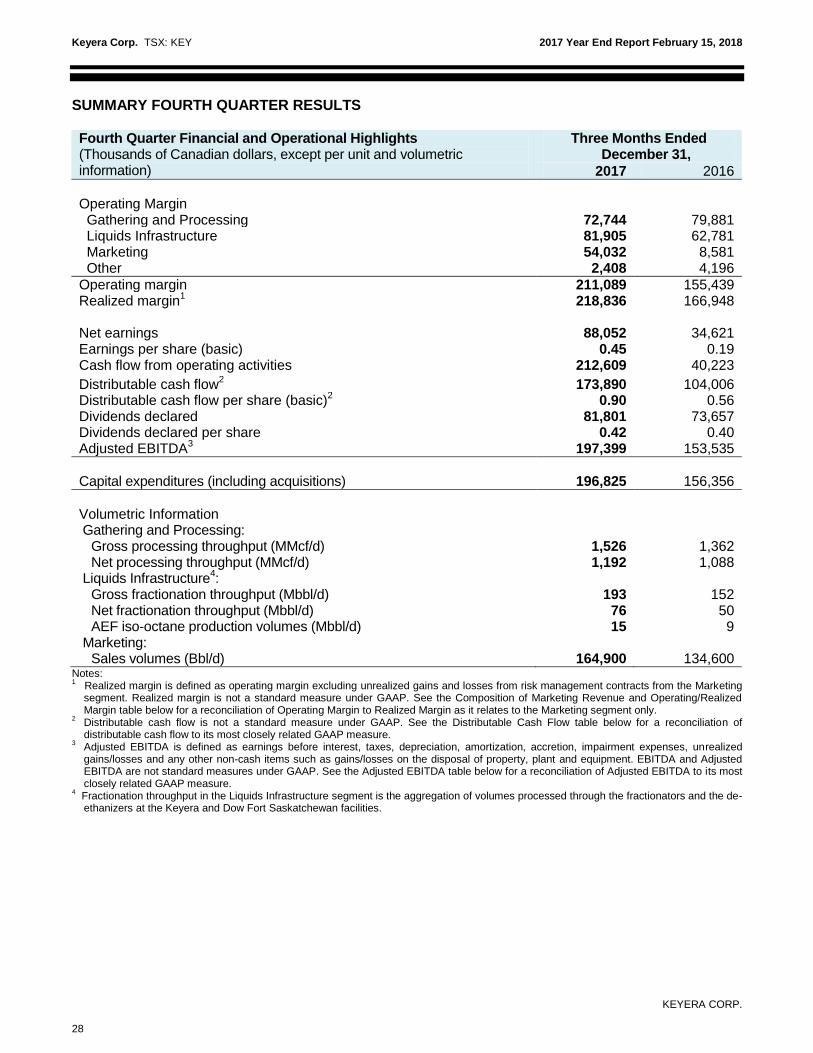
Keyera Corp. TSX: KEY 2017 Year End Report February 15, 2018
KEYERA CORP.
28
SUMMARY FOURTH QUARTER RESULTS Fourth Quarter Financial and Operational Highlights Three Months Ended
December 31, (Thousands of Canadian dollars, except per unit and volumetric information) 2017 2016
Operating Margin Gathering and Processing 72,744 79,881 Liquids Infrastructure 81,905 62,781 Marketing 54,032 8,581 Other 2,408 4,196
Operating margin 211,089 155,439 Realized margin
1
218,836
166,948
Net earnings 88,052 34,621 Earnings per share (basic) 0.45 0.19 Cash flow from operating activities 212,609 40,223
Distributable cash flow2 173,890 104,006
Distributable cash flow per share (basic)2
Dividends declared Dividends declared per share
0.90 81,801
0.42
0.56 73,657
0.40 Adjusted EBITDA
3 197,399 153,535
Capital expenditures (including acquisitions) 196,825 156,356
Volumetric Information Gathering and Processing: Gross processing throughput (MMcf/d) 1,526 1,362 Net processing throughput (MMcf/d) 1,192 1,088
Liquids Infrastructure4:
Gross fractionation throughput (Mbbl/d) 193 152 Net fractionation throughput (Mbbl/d) 76 50 AEF iso-octane production volumes (Mbbl/d) 15 9
Marketing: Sales volumes (Bbl/d) 164,900 134,600
Notes: 1
Realized margin is defined as operating margin excluding unrealized gains and losses from risk management contracts from the Marketing segment. Realized margin is not a standard measure under GAAP. See the Composition of Marketing Revenue and Operating/Realized Margin table below for a reconciliation of Operating Margin to Realized Margin as it relates to the Marketing segment only.
2 Distributable cash flow is not a standard measure under GAAP. See the Distributable Cash Flow table below for a reconciliation of distributable cash flow to its most closely related GAAP measure.
3 Adjusted EBITDA is defined as earnings before interest, taxes, depreciation, amortization, accretion, impairment expenses, unrealized gains/losses and any other non-cash items such as gains/losses on the disposal of property, plant and equipment. EBITDA and Adjusted EBITDA are not standard measures under GAAP. See the Adjusted EBITDA table below for a reconciliation of Adjusted EBITDA to its most closely related GAAP measure.
4 Fractionation throughput in the Liquids Infrastructure segment is the aggregation of volumes processed through the fractionators and the de-
ethanizers at the Keyera and Dow Fort Saskatchewan facilities.
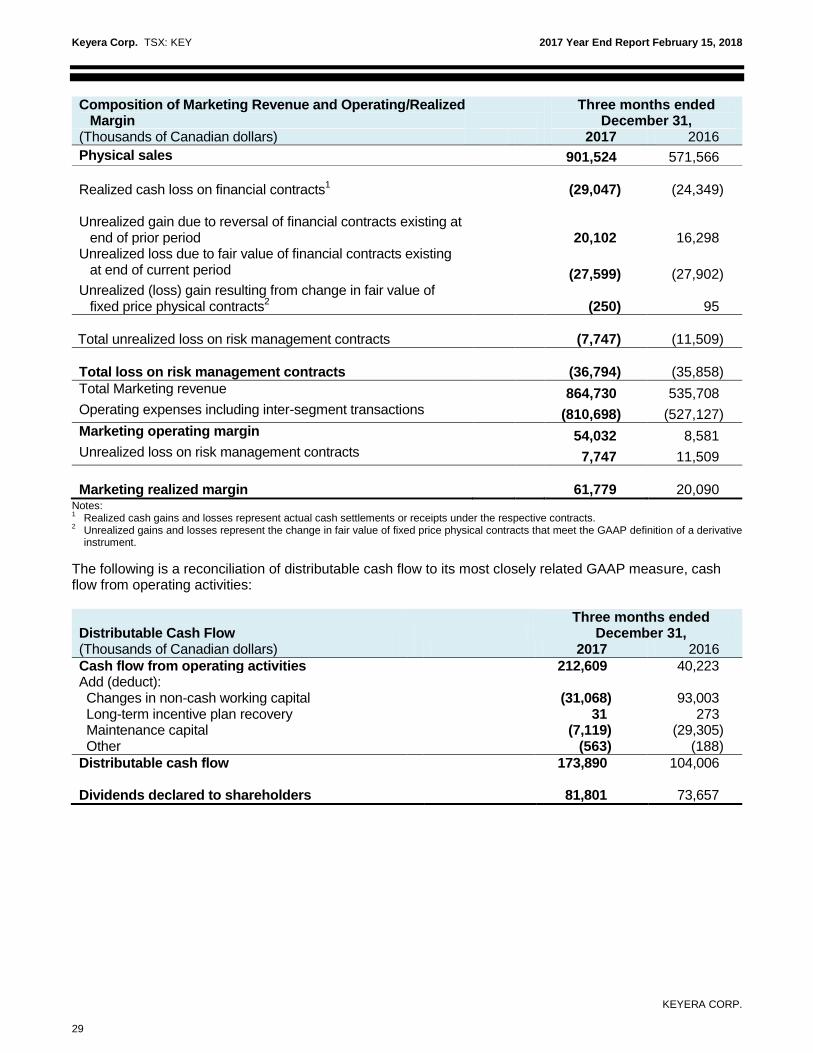
Keyera Corp. TSX: KEY 2017 Year End Report February 15, 2018
KEYERA CORP.
29
Composition of Marketing Revenue and Operating/Realized Margin
Three months ended December 31,
(Thousands of Canadian dollars) 2017 2016
Physical sales 901,524 571,566 Realized cash loss on financial contracts
1 (29,047) (24,349)
Unrealized gain due to reversal of financial contracts existing at
end of prior period
20,102
16,298 Unrealized loss due to fair value of financial contracts existing
at end of current period (27,599) (27,902) Unrealized (loss) gain resulting from change in fair value of
fixed price physical contracts2 (250) 95
Total unrealized loss on risk management contracts
(7,747)
(11,509)
Total loss on risk management contracts (36,794) (35,858)
Total Marketing revenue 864,730 535,708 Operating expenses including inter-segment transactions (810,698) (527,127)
Marketing operating margin 54,032 8,581 Unrealized loss on risk management contracts 7,747 11,509
Marketing realized margin 61,779 20,090
Notes: 1 Realized cash gains and losses represent actual cash settlements or receipts under the respective contracts.
2 Unrealized gains and losses represent the change in fair value of fixed price physical contracts that meet the GAAP definition of a derivative
instrument.
The following is a reconciliation of distributable cash flow to its most closely related GAAP measure, cash flow from operating activities:
Distributable Cash Flow Three months ended
December 31, (Thousands of Canadian dollars) 2017 2016
Cash flow from operating activities 212,609 40,223 Add (deduct): Changes in non-cash working capital (31,068) 93,003 Long-term incentive plan recovery 31 273 Maintenance capital (7,119) (29,305) Other (563) (188)
Distributable cash flow 173,890 104,006 Dividends declared to shareholders
81,801
73,657
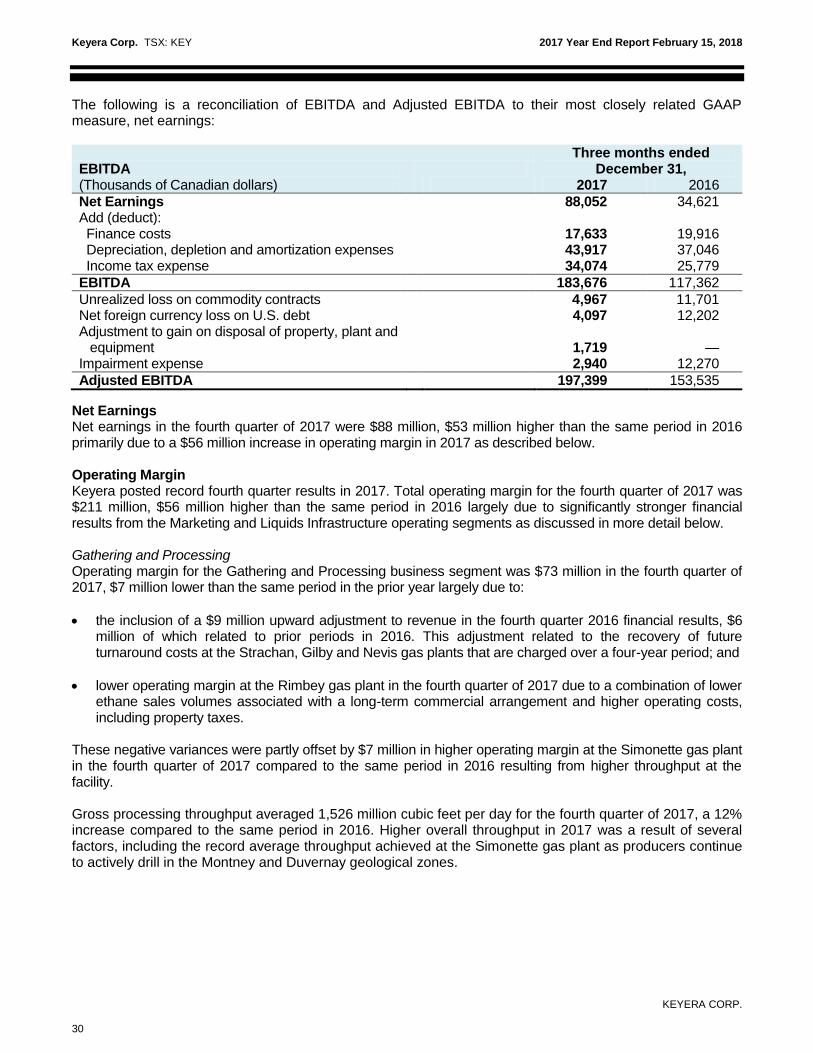
Keyera Corp. TSX: KEY 2017 Year End Report February 15, 2018
KEYERA CORP.
30
The following is a reconciliation of EBITDA and Adjusted EBITDA to their most closely related GAAP measure, net earnings:
EBITDA Three months ended
December 31, (Thousands of Canadian dollars) 2017 2016
Net Earnings 88,052 34,621 Add (deduct): Finance costs 17,633 19,916 Depreciation, depletion and amortization expenses 43,917 37,046 Income tax expense 34,074 25,779
EBITDA 183,676 117,362
Unrealized loss on commodity contracts 4,967 11,701 Net foreign currency loss on U.S. debt 4,097 12,202 Adjustment to gain on disposal of property, plant and
equipment 1,719 — Impairment expense 2,940 12,270
Adjusted EBITDA 197,399 153,535
Net Earnings Net earnings in the fourth quarter of 2017 were $88 million, $53 million higher than the same period in 2016 primarily due to a $56 million increase in operating margin in 2017 as described below. Operating Margin Keyera posted record fourth quarter results in 2017. Total operating margin for the fourth quarter of 2017 was $211 million, $56 million higher than the same period in 2016 largely due to significantly stronger financial results from the Marketing and Liquids Infrastructure operating segments as discussed in more detail below. Gathering and Processing Operating margin for the Gathering and Processing business segment was $73 million in the fourth quarter of 2017, $7 million lower than the same period in the prior year largely due to:
the inclusion of a $9 million upward adjustment to revenue in the fourth quarter 2016 financial results, $6 million of which related to prior periods in 2016. This adjustment related to the recovery of future turnaround costs at the Strachan, Gilby and Nevis gas plants that are charged over a four-year period; and
lower operating margin at the Rimbey gas plant in the fourth quarter of 2017 due to a combination of lower ethane sales volumes associated with a long-term commercial arrangement and higher operating costs, including property taxes.
These negative variances were partly offset by $7 million in higher operating margin at the Simonette gas plant in the fourth quarter of 2017 compared to the same period in 2016 resulting from higher throughput at the facility. Gross processing throughput averaged 1,526 million cubic feet per day for the fourth quarter of 2017, a 12% increase compared to the same period in 2016. Higher overall throughput in 2017 was a result of several factors, including the record average throughput achieved at the Simonette gas plant as producers continue to actively drill in the Montney and Duvernay geological zones.
Keyera Corp. TSX: KEY 2017 Year End Report February 15, 2018
KEYERA CORP.
31
Liquids Infrastructure Operating margin from the Liquids Infrastructure segment was $82 million in the fourth quarter of 2017, $19 million higher than the same period in 2016. The higher financial results for the quarter were largely due to the following:
$12 million in higher operating margin resulting from incremental revenue associated with the start-up of the Norlite Pipeline, including fees charged on Keyera’s proprietary condensate system;
higher operating margin associated with incremental fractionation volumes; and
the inclusion of certain adjustments to operating margin including: i) a non-cash gain of $2 million associated with the change in fair value of risk management contracts; and ii) a $2 million one-time increase to revenue associated with the cash recovery of capitalized project costs.
Marketing Operating margin from the Marketing segment was $54 million in the fourth quarter of 2017, $45 million higher than the same period in 2016. Realized margin (excluding the effect of non-cash gains and losses from risk management contracts) was $62 million in the fourth quarter of 2017 or $42 million higher than the same period in the prior year. The significantly higher financial results in the fourth quarter of 2017 primarily stemmed from:
higher propane margins due to higher sales volumes and seasonally strong winter demand and pricing for propane. Propane margins on an annual basis remain a fairly small contributor to Keyera’s overall Marketing operating margin;
$20 million in higher iso-octane sales margins in 2017 as the fourth quarter 2016 financial results included the effect of the scheduled turnaround at AEF that commenced in early September and concluded in early November; and
strong operating margin from Keyera’s crude oil midstream business due to higher blending volumes and crude oil prices compared to the same period in the prior year.
The section of this MD&A titled, “Segmented Results of Operations”, provides more information related to the performance of each of the operating segments. Corporate and Other Keyera reports operating margin (net of royalties and operating expenses) from the production associated with all of its reserves as other income. Other income was $2 million in the fourth quarter of 2017, $2 million lower than the same quarter in 2016. Production for the three months ended December 31, 2017 averaged 3,897 barrels of oil equivalent per day compared to 4,353 barrels of oil equivalent per day in the same period in 2016. Cash Flow Metrics
For the three months ended December 31, 2017, cash flow from operating activities was $213 million, $172 million higher than the same period in 2016. Distributable cash flow was $174 million for the fourth quarter of 2017, $70 million higher than the same period in the prior year. The significantly higher cash flow metrics in the fourth quarter of 2017 were a result of several factors including higher operating results from the Marketing and Liquids Infrastructure segments as described above. Cash flow metrics in the fourth quarter of 2016 were affected by the scheduled turnaround at AEF that resulted in a lower contribution from the sale of iso-octane. Cash flow from operating activities in 2016 were also lower due to an approximately $55 million cash payment for the acquisition of land in the Industrial Heartland that closed in early 2017. For the three months ended December 31, 2017, dividends declared were $82 million, or 47% of distributable cash flow, compared to dividends declared of $74 million, or 71% of distributable cash flow for the same period in 2016.

Keyera Corp. TSX: KEY 2017 Year End Report February 15, 2018
KEYERA CORP.
32
CRITICAL ACCOUNTING ESTIMATES In preparing Keyera’s audited consolidated financial statements in accordance with GAAP, management has made appropriate decisions with respect to the formulation of estimates and assumptions that affect the recorded amounts of certain assets, liabilities, revenues and expenses. Keyera has hired qualified individuals who have the skills required to make such estimates. These estimates and assumptions are reviewed and compared to actual results as well as to budgets in order to make more informed decisions on future estimates. The most significant estimates are those indicated below: Operating Revenues Gathering and Processing and Liquids Infrastructure: For each month, actual volumes processed and fees earned from the Gathering and Processing and Liquids Infrastructure assets are not known at the end of the month. Accordingly, the financial statements contain an estimate of one month's revenue based upon a review of historical trends. This estimate is adjusted for events that are known to have a significant effect on the month's operations such as non-routine maintenance projects. At December 31, 2017, operating revenues and accounts receivable for the Gathering and Processing and Liquids Infrastructure segments contained an estimate of approximately $68 million primarily for December 2017 operations. Marketing: The majority of the Marketing sales revenue is recorded based upon actual volumes and prices; however, in many cases actual product lifting volumes have not yet been confirmed and sales prices that are dependent on other variables are not yet known. Accordingly, the financial statements contain an estimate for these sales. Estimates are prepared based upon contract quantities and known events. The estimates are reviewed and compared to expected results to verify their accuracy. At December 31, 2017, the Marketing sales and accounts receivable contained an estimate for December 2017 revenues of approximately $152 million. Operating Expenses and Product Purchases Gathering and Processing and Liquids Infrastructure: The period in which invoices are rendered for the supply of goods and services necessary for the operation of the Gathering and Processing and Liquids Infrastructure assets is generally later than the period in which the goods or services were provided. Accordingly, the financial statements contain an estimate of one month's operating costs based upon a review of historical trends. This estimate is adjusted for events that are known to have a significant effect on the month's operations such as non-routine maintenance projects. At December 31, 2017, operating expenses and accounts payable contained an estimate of approximately $24 million primarily for December 2017 operations. Marketing: NGL mix feedstock and specification products such as propane, butane and condensate are purchased from facilities located throughout western Canada and in some locations in the U.S. The majority of NGL mix purchases are estimated each month as actual volume information is generally not available until the next month. Specification product volumes and prices are based upon contract volumes and prices. Accordingly, the financial statements contain an estimate for one month of these purchases. Marketing cost of goods sold, inventory and accounts payable contained an estimate of NGL product purchases of approximately $177 million at December 31, 2017. Equalization Adjustments Much of the revenue from the Gathering and Processing assets includes a recovery of operating costs. Under this method, the operating component of the fee is a pro rata share of the operating costs for the facility, calculated based upon total throughput. Users of each facility are charged a fee per unit based upon estimated costs and throughput, with an adjustment to actual throughput completed after the end of the year. Each

Keyera Corp. TSX: KEY 2017 Year End Report February 15, 2018
KEYERA CORP.
33
quarter, throughput volumes and operating costs are reviewed to determine whether the estimated unit fee charged during the quarter properly reflects the actual volumes and costs, and the allocation of revenues and operating costs to other plant owners is also reviewed. Appropriate adjustments to revenue and operating expenses are recognized in the quarter and allocations to other owners are recorded. For the Gathering and Processing segment, an equalization adjustment of $7 million was included in revenue and accounts receivable at December 31, 2017. Operating expenses and accounts payable contained an equalization adjustment of $13 million. Depreciation of property, plant and equipment For purposes of determining depreciation, depletion and amortization expense, estimates and judgments are required to establish depreciation methods, useful lives, and residual values for Keyera’s assets. Determining depreciation methods requires management to make judgments that most appropriately reflect the pattern of an asset’s future economic benefit expected to be consumed by Keyera. For assets other than production assets, useful life estimates include management’s assumptions regarding the period over which the asset is expected to be available for use by the company. This includes assessing the assets’ physical and economic lives and, if applicable, may include an estimation of the associated reserve lives and production activity related to the assets’ respective capture areas. Production assets are depleted using the unit-of-production method based on estimated proved reserves, which are determined by Keyera’s independent qualified reserves evaluator. The estimation of reserves involves the exercise of professional judgment and is inherently subject to uncertainty. Changes in forward price estimates, production costs or recovery rates may change the economic status of reserves. Allowance for Doubtful Accounts The allowance for doubtful accounts is reviewed on a monthly basis. An assessment is made whether an account is deemed impaired based on the number of days outstanding and the likelihood of collection from the counter-party. The allowance for doubtful accounts was $3 million as at December 31, 2017, approximately $1 million lower than the prior year-end. Derivative Financial Instruments Keyera utilizes derivative financial instruments to manage its exposure to market risks relating to commodity prices and foreign currency exchange rates. Fair values of derivative contracts fluctuate depending on the underlying estimates of future commodity prices or foreign currency exchange rates. The estimated fair value of all derivative financial instruments are based on observable market data, including commodity price curves, foreign currency curves and credit spreads. Refer to note 21, Financial Instruments and Risk Management, of the accompanying financial statements for a summary of the fair value of derivative financial instruments existing at December 31, 2017. Fair value estimates of property, plant and equipment Determination of the fair value of identifiable assets acquired in a business combination requires Keyera’s management to make assumptions and estimates about future events. The fair value of identifiable assets such as gathering and processing, storage and fractionation facilities, pipelines, terminals and other equipment is estimated with reference to the expected discounted future cash flows expected to be derived from the acquired assets. These assumptions and estimates generally require judgment and include estimates of future revenues, costs and discount rates. Changes in any of the assumptions or estimates used in determining the fair value of acquired assets and liabilities could impact the amounts assigned to the net assets acquired in a business combination. Impairment of property, plant and equipment and goodwill In determining the recoverable amount of assets, in the absence of quoted market prices, estimates are made regarding the present value of future cash flows. The useful lives of property, plant and equipment is determined by the present value of future cash flows. Future cash flow estimates are based on future production profiles and reserves for surrounding wells, commodity prices and costs. Estimates are also made in determining the discount rate used to calculate the present value of future cash flows.
Keyera Corp. TSX: KEY 2017 Year End Report February 15, 2018
KEYERA CORP.
34
Determining whether goodwill is impaired requires an estimation of the value in use of the CGUs to which goodwill has been allocated. The value in use calculation requires management to estimate the future cash flows expected to arise from the CGU and the discount rate in order to calculate present value. The determination of CGUs is subject to management’s judgment. Refer to note 10, Property, Plant and Equipment and note 11, Goodwill, of the accompanying financial statements for further details of the impairment expense recorded for the year ended December 31, 2017. Long-term incentive plan liability The LTIP is accounted for using the liability method and is measured at fair value. Determining the fair value requires management to estimate Keyera’s financial performance over a three-year period to determine the appropriate payout multiplier associated with the Performance Awards. The payout multiplier is based 70% on the average annual pre-tax distributable cash flow per share over the three-year period and 30% on the relative total shareholder return over the same period. The payout multiplier determines the number of shares expected to be settled following the third anniversary of the grant date of the Performance Awards. Refer to note 20, Share-based Compensation and Pension Plans, of the accompanying financial statements for further details. Decommissioning liability Keyera will be responsible for compliance with all applicable laws and regulations regarding the decommissioning, abandonment and reclamation of its gathering and processing, fractionation, iso-octane and storage facilities, pipelines and terminals at the end of their economic life. The decommissioning obligations are generally expected to be incurred over the next 25 to 45 years. While the provision is based on the best estimate of future costs and the economic lives of these assets, there is uncertainty regarding the amount and timing of these costs. No assets have been legally restricted for settlement of the liability. The process, overseen by Keyera’s Health, Safety and Environment Committee, is undertaken by professionals involved in activities that deal with the design, construction, operation and decommissioning of assets. Specialists with knowledge and assessment processes specific to environmental and decommissioning activities and costs are also utilized in the process. Ultimately, all medium and large facilities will be independently assessed in accordance with regulatory requirements. Keyera has estimated the net present value of its total decommissioning liability to be approximately $466 million at December 31, 2017, compared to $476 million at December 31, 2016. The fair value of the decommissioning liability is calculated by using a risk-free discount rate of 2.26% (December 31, 2016 – 2.31%). For an investor to compare Keyera’s decommissioning liability with that of midstream peers who use a credit adjusted discount rate, the net present value of Keyera’s decommissioning liability would have been $269 million as of December 31, 2017 based on an estimated credit adjusted discount rate of 4.60% (December 31, 2016 – $273 million assuming an estimated credit adjusted discount rate of 4.60%). Refer to note 14, Decommissioning Liability, of the accompanying financial statements for a reconciliation of the beginning and ending carrying amount of the decommissioning liability. Additional information related to decommissioning, abandonment and reclamation is also provided in Keyera’s Annual Information Form, which is available on SEDAR at www.sedar.com.

Keyera Corp. TSX: KEY 2017 Year End Report February 15, 2018
KEYERA CORP.
35
Deferred tax assets and liabilities Deferred tax assets and liabilities require management’s judgment in determining the amounts to be recognized. In particular, judgment is used when assessing the extent to which deferred tax assets should be recognized with consideration given to the timing and level of future taxable income. To the extent estimates differ from the final tax return, earnings would be affected in a subsequent period. Refer to note 16, Income Taxes, of the accompanying financial statements for a reconciliation of income taxes to the income tax provision recognized for the year ended December 31, 2017. LIQUIDITY AND CAPITAL RESOURCES The following is a comparison of cash inflows (outflows) from operating, investing and financing activities for the years ended December 31, 2017 and 2016:
Cash inflows (outflows) (Thousands of Canadian dollars)
Increase
2017 2016 (decrease) Explanation
Operating
513,697 412,926 100,771 Increase in cash from operating activities in 2017 was primarily due to: i) $39 million in higher operating margin from the Liquids Infrastructure segment in 2017; and ii) a $55 million cash payment in the fourth quarter of 2016 for the acquisition of land that closed in early 2017.
Investing
(646,935) (760,974) 114,039 Capital spending in 2017 and 2016 primarily related to growth capital projects as described in the “Segmented Results of Operations” section of this MD&A. In early 2017, Keyera closed the acquisition of land in the Industrial Heartland for $55 million; however, the cash outlay to fund the purchase occurred in the fourth quarter of 2016. As a result, this acquisition did not have an effect on cash flow from investing activities in 2017.
Financing
445,846 350,516 95,330 In 2017, Keyera issued common shares for net proceeds of $474 million and placed $400 million of long-term notes. Proceeds from these financing activities will be used to support Keyera’s capital program and for general corporate purposes. A portion of the net proceeds were initially used to repay $235 million of short-term debt under its credit facility. Approximately $60 million of long-term private notes were also repaid in 2017. In 2016, Keyera issued common shares for net proceeds of $331 million and placed $360 million of long-term notes. The net proceeds were initially used to reduce short-term debt by $135 million and to repay $98 million of long-term private notes.

Keyera Corp. TSX: KEY 2017 Year End Report February 15, 2018
KEYERA CORP.
36
Working capital requirements are strongly influenced by the amounts of inventory held in storage and their related commodity prices. Product inventories are required to meet seasonal demand patterns and will vary depending on the time of year. Typically, Keyera’s inventory levels for propane are at their lowest after the winter season and reach their peak in the third quarter to meet the demand for propane in the winter season. Butane inventory is maintained for the production of iso-octane. When market conditions enable Keyera to source additional butane at favourable prices, butane may be held in storage for use in future periods. Inventory levels for iso-octane may fluctuate depending on market conditions. Demand for iso-octane is typically stronger in the second and third quarters, associated with the higher gasoline demand in the summer months. A working capital surplus (current assets less current liabilities) of $337 million existed at December 31, 2017. This is compared to a surplus of $46 million at December 31, 2016. In addition to the significant working capital surplus, Keyera has access to a credit facility in the amount of $1.5 billion of which no amounts were drawn as at December 31, 2017. Refer to the section below of this MD&A, “Long-term Debt”, for more information related to Keyera’s Credit Facility. Equity Financing In the fourth quarter of 2017, Keyera issued 12,200,000 common shares, as well as an additional 1,830,000 common shares pursuant to an over-allotment option exercised by underwriters in connection with the equity offering. The common shares were issued at a price of $35.20 per common share for gross total proceeds of approximately $494 million. Financing costs associated with the issuance of shares were approximately $20 million. Net proceeds from the equity financing will be used to support Keyera’s ongoing growth capital program and for general corporate purposes. In the second quarter of 2016, Keyera issued 9,487,500 common shares, including the over-allotment option that was exercised by underwriters. The common shares were issued at a price of $36.35 per common share for gross total proceeds of approximately $345 million. Financing costs associated with the issuance of shares were approximately $14 million. Dividend Reinvestment Plan Keyera’s dividend reinvestment plan (the “Plan”) consists of two components: a Premium Dividend
TM
(“Premium DRIP”) reinvestment component and a regular dividend reinvestment component (“DRIP”). The
DRIP component allows eligible shareholders of Keyera to direct their cash dividends to be reinvested in additional shares issued from treasury at a 3% discount to the Average Market Price (as defined in the Plan) on the applicable dividend date. The Premium DRIP
component permits eligible shareholders to elect to have the additional shares issued at
the 3% discount delivered to the designated Plan Broker in exchange for a premium cash payment equal to 101% of the regular, declared cash dividend that was reinvested on their behalf under the Plan. A copy of the Plan is available on Keyera’s website at www.keyera.com and on SEDAR at www.sedar.com. The DRIP and Premium
DRIP generated cash of $181 million for the year ended December 31, 2017. In
2016, the plan generated cash of $170 million. Corporate Credit Ratings In the fourth quarter of 2017, DBRS Limited (“DBRS”) assigned Keyera an Issuer Rating of “BBB” with a “Stable” trend and S&P Global (“S&P”) assigned Keyera a Long-term Corporate Credit Rating of “BBB/Stable”. These ratings further enhance Keyera’s ability to efficiently and cost-effectively access various forms of capital, including public debt and preferred shares, as it continues to grow its business and execute its capital growth program.

Keyera Corp. TSX: KEY 2017 Year End Report February 15, 2018
KEYERA CORP.
37
Long-term Debt (including Credit Facilities) Below is a summary of Keyera’s long-term debt obligations as at December 31, 2017:
As at December 31, 2017 (Thousands of Canadian dollars)
Total
2018
2019
2020
2021
2022
After 2022
Credit facilities
Bank credit facility — — — — — — —
Total credit facilities — — — — — — —
Canadian dollar denominated debt
5.01% due January 4, 2019 70,000 — 70,000 — — — —
4.35% due June 19, 2019 52,000 — 52,000 — — — —
5.68% due September 8, 2020 2,000 — — 2,000 — — —
6.14% due December 3, 2022 60,000 — — — — 60,000 —
3.50% due June 16, 2023 30,000 — — — — — 30,000
4.91% due June 19, 2024 17,000 — — — — — 17,000
4.92% due October 10, 2025 100,000 — — — — — 100,000
5.05% due November 20, 2025 20,000 — — — — — 20,000
4.15% due June 16, 2026 30,000 — — — — — 30,000
3.96% due October 13, 2026 200,000 — — — — — 200,000
3.68% due September 20, 2027 400,000 — — — — — 400,000
5.09% due October 10, 2028 100,000 — — — — — 100,000
4.11% due October 13, 2028 100,000 — — — — — 100,000
5.34% due April 8, 2029 75,000 — — — — — 75,000
1,256,000 — 122,000 2,000 — 60,000 1,072,000
U.S. dollar denominated debt
3.42% due June 19, 2019 (US$3,000)
3,756
—
3,756 —
—
—
—
5.14% due September 8, 2020 (US$103,000)
128,935
—
—
128,935
— —
—
4.19% due June 19, 2024 (US$128,000)
160,230
—
—
—
— —
160,230
4.75% due November 20, 2025 (US$140,000)
175,252
—
—
—
— —
175,252
4.95% due November 20, 2028 (US$65,000)
81,367
—
—
—
— —
81,367
549,540 — 3,756 128,935 — — 416,849
Total long-term debt 1,805,540 — 125,756 130,935 — 60,000 1,488,849
Credit Facilities Keyera’s Credit Facility is with a syndicate of nine lenders under which it can borrow up to $1.5 billion, with the potential to increase that limit to $1.85 billion subject to certain conditions. As at December 31, 2017, no amounts were drawn under this facility (December 31, 2016 – $235 million). In the first quarter of 2017, Keyera amended its senior note agreements (discussed below) and the Credit Facility to provide more flexibility with respect to the funding of growth capital projects by introducing two changes in the covenant calculations. The first change allows Keyera to increase its Net Debt to EBITDA ratio from 4.0 to 4.5 for periods of up to four consecutive fiscal quarters. The second change allows Keyera
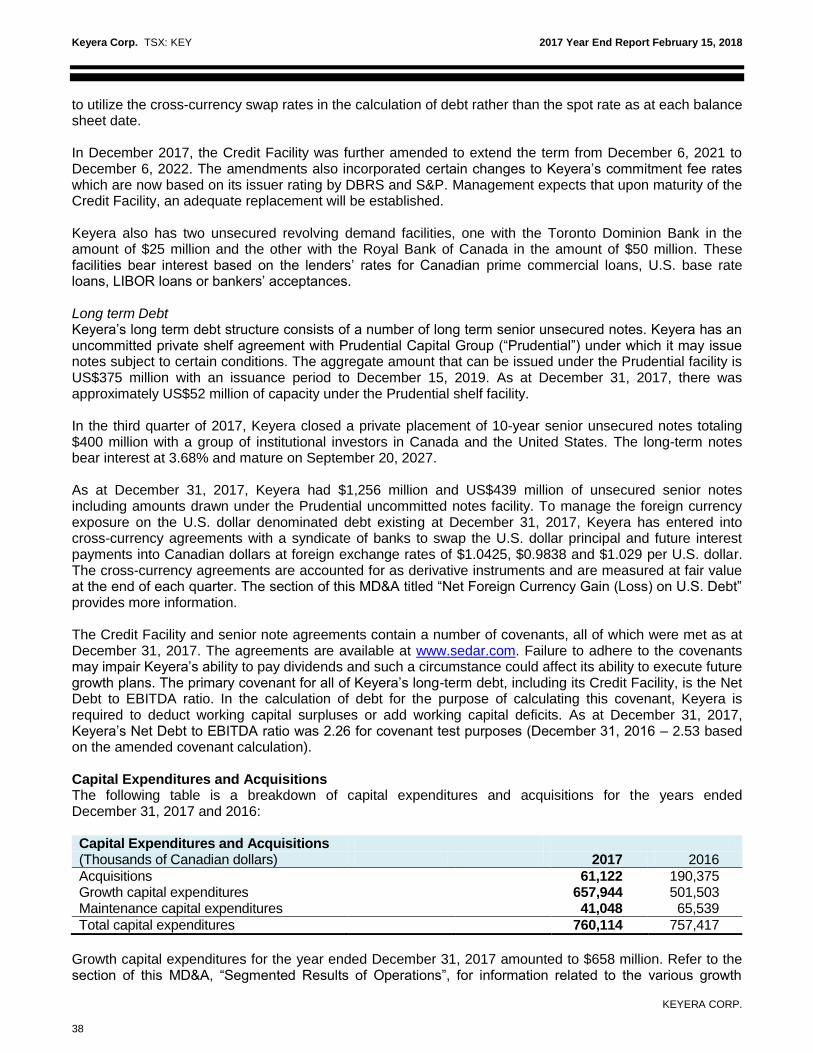
Keyera Corp. TSX: KEY 2017 Year End Report February 15, 2018
KEYERA CORP.
38
to utilize the cross-currency swap rates in the calculation of debt rather than the spot rate as at each balance sheet date. In December 2017, the Credit Facility was further amended to extend the term from December 6, 2021 to December 6, 2022. The amendments also incorporated certain changes to Keyera’s commitment fee rates which are now based on its issuer rating by DBRS and S&P. Management expects that upon maturity of the Credit Facility, an adequate replacement will be established. Keyera also has two unsecured revolving demand facilities, one with the Toronto Dominion Bank in the amount of $25 million and the other with the Royal Bank of Canada in the amount of $50 million. These facilities bear interest based on the lenders’ rates for Canadian prime commercial loans, U.S. base rate loans, LIBOR loans or bankers’ acceptances. Long term Debt Keyera’s long term debt structure consists of a number of long term senior unsecured notes. Keyera has an uncommitted private shelf agreement with Prudential Capital Group (“Prudential”) under which it may issue notes subject to certain conditions. The aggregate amount that can be issued under the Prudential facility is US$375 million with an issuance period to December 15, 2019. As at December 31, 2017, there was approximately US$52 million of capacity under the Prudential shelf facility. In the third quarter of 2017, Keyera closed a private placement of 10-year senior unsecured notes totaling $400 million with a group of institutional investors in Canada and the United States. The long-term notes bear interest at 3.68% and mature on September 20, 2027. As at December 31, 2017, Keyera had $1,256 million and US$439 million of unsecured senior notes including amounts drawn under the Prudential uncommitted notes facility. To manage the foreign currency exposure on the U.S. dollar denominated debt existing at December 31, 2017, Keyera has entered into cross-currency agreements with a syndicate of banks to swap the U.S. dollar principal and future interest payments into Canadian dollars at foreign exchange rates of $1.0425, $0.9838 and $1.029 per U.S. dollar. The cross-currency agreements are accounted for as derivative instruments and are measured at fair value at the end of each quarter. The section of this MD&A titled “Net Foreign Currency Gain (Loss) on U.S. Debt” provides more information. The Credit Facility and senior note agreements contain a number of covenants, all of which were met as at December 31, 2017. The agreements are available at www.sedar.com. Failure to adhere to the covenants may impair Keyera’s ability to pay dividends and such a circumstance could affect its ability to execute future growth plans. The primary covenant for all of Keyera’s long-term debt, including its Credit Facility, is the Net Debt to EBITDA ratio. In the calculation of debt for the purpose of calculating this covenant, Keyera is required to deduct working capital surpluses or add working capital deficits. As at December 31, 2017, Keyera’s Net Debt to EBITDA ratio was 2.26 for covenant test purposes (December 31, 2016 – 2.53 based on the amended covenant calculation). Capital Expenditures and Acquisitions The following table is a breakdown of capital expenditures and acquisitions for the years ended December 31, 2017 and 2016: Capital Expenditures and Acquisitions (Thousands of Canadian dollars) 2017 2016
Acquisitions 61,122 190,375 Growth capital expenditures 657,944 501,503 Maintenance capital expenditures 41,048 65,539
Total capital expenditures 760,114 757,417
Growth capital expenditures for the year ended December 31, 2017 amounted to $658 million. Refer to the section of this MD&A, “Segmented Results of Operations”, for information related to the various growth

Keyera Corp. TSX: KEY 2017 Year End Report February 15, 2018
KEYERA CORP.
39
capital projects in the Gathering and Processing and Liquids Infrastructure segments, including estimated costs to complete, costs incurred in 2017 and since inception of the project, and estimated completion timeframes.
Acquisitions in 2017 largely related to the purchase of 1,290 acres of undeveloped land in the Industrial Heartland area near Fort Saskatchewan for approximately $55 million. Acquisitions in 2016 included:
the purchase of an acid gas injection well for $19 million as part of the Wapiti gas plant project;
purchase of the Hull Terminal Pipeline System for approximately $32 million;
purchase of the North Condensate Connector for $18 million; and
acquisition of an additional 35% ownership interest in the Alder Flats gas plant and associated gathering pipeline, including a pre-payment for costs associated with Phase 2 for proceeds of $113 million.
Keyera has comprehensive inspection, monitoring and maintenance programs in place. The objectives of these programs are to keep Keyera’s facilities in good working order and to maintain their ability to operate reliably for many years. In addition to the maintenance capital expenditures, Keyera incurred maintenance and repair expenses of $51 million for the year ended December 31, 2017, compared to $37 million in 2016. The majority of these expenditures, including maintenance capital, will be recovered over varying periods of time, depending upon the fee structure at each facility. Keyera’s ongoing operations are not heavily dependent on capital expenditures to maintain current levels of cash flow. However, to grow future cash flow, Keyera is investing growth capital to expand its current asset base and capture new opportunities. Based on current plans, Keyera anticipates that its growth capital investment in 2018 will be between $800 million and $900 million, including the acquisition of a 50% interest in the South Grand Rapids diluent pipeline. Maintenance capital for 2018 is expected to be between $40 million and $50 million, including the scheduled turnarounds at the Strachan, Nevis and Brazeau North gas plants. The capital program is expected to be funded by cash flow from operating activities, the DRIP and Premium DRIP
TM program, cash, and the existing Credit Facility, augmented if necessary by incremental
debt and equity financing. Access to debt and equity financing is dependent on Keyera’s ongoing financial performance and general market conditions. Readers are referred to the section of the MD&A titled, “Forward-Looking Information” for a further discussion of the assumptions and risks that could affect future performance and plans. Dividends Distributable Cash Flow Distributable cash flow is not a standard measure under GAAP, and therefore may not be comparable to similar measures reported by other entities. Distributable cash flow is used to assess the level of cash flow generated from ongoing operations and to evaluate the adequacy of internally generated cash flow to fund dividends. The following is a reconciliation of distributable cash flow to its most closely related GAAP measure, cash flow from operating activities: Distributable Cash Flow (Thousands of Canadian dollars) 2017 2016
Cash flow from operating activities 513,697 412,926 Add (deduct): Changes in non-cash working capital 53,942 129,224 Long-term incentive plan expense (13,907) (16,840) Maintenance capital (41,048) (65,539) Other (2,250) (188)
Distributable cash flow 510,434 459,583 Dividends declared to shareholders
312,643
277,578
Keyera Corp. TSX: KEY 2017 Year End Report February 15, 2018
KEYERA CORP.
40
For the year ended December 31, 2017, dividends declared were $313 million, or 61% of distributable cash flow, compared to dividends declared of $278 million, or 60% of distributable cash flow in 2016. Distributable cash flow for 2017 was $510 million, $51 million higher than the prior year primarily due to: i) $24 million in lower maintenance capital expenditures in 2017 as the prior year results included $40 million of costs associated with the scheduled turnaround at AEF, including the replacement of catalyst; and ii) record operating margin posted by the Liquids Infrastructure segment. Distributable cash flow in 2017 was strong despite a nine-week outage at AEF in the first half of 2017 that resulted in a lower contribution from the Marketing segment. These financial results stemmed from: i) incremental cash flow generated from the Norlite pipeline that became operational in mid-2017; ii) strong demand for Keyera’s diluent handling services including storage and transportation services; and iii) higher fractionation revenue at Keyera’s Fort Saskatchewan facility. Refer to the section of this MD&A, “Segmented Results of Operations”, for more information on the financial results of Keyera’s operating segments for the year ended December 31, 2017. Changes in non-cash working capital are excluded from the determination of distributable cash flow because they are primarily the result of seasonal fluctuations in product inventories or other temporary changes and are generally funded with short-term debt. Also deducted from distributable cash flow are maintenance capital expenditures and the long-term incentive plan expense, which are funded from current operating cash flow. Dividend Policy Keyera increased its dividend by approximately 6% from $0.1325 per share per month to $0.14 per share per month, or $1.68 per share annually, beginning with its dividend payable on June 15, 2017. In determining the level of cash dividends to shareholders, Keyera’s board of directors considers current and expected future levels of distributable cash flow, capital expenditures, borrowings and debt repayments, changes in working capital requirements and other factors. Keyera expects to pay dividends from distributable cash flow; however, credit facilities may be used to stabilize dividends from time to time. Growth capital expenditures will be funded from cash, retained operating cash flow, and additional debt or equity, as required. Although Keyera intends to continue to make regular, monthly cash dividends to its shareholders, these dividends are not guaranteed. For a more detailed discussion of the risks that could affect the level of cash dividends, refer to Keyera’s Annual Information Form available at www.sedar.com. EBITDA EBITDA and Adjusted EBITDA are not standard measures under GAAP and, therefore, may not be comparable to similar measures reported by other entities. EBITDA is a measure showing earnings before finance costs, taxes, depreciation, and amortization. Adjusted EBITDA is calculated as EBITDA before costs associated with non-cash items, including unrealized gains/losses on commodity contracts, impairment expenses and any other non-cash items such as gains/losses on the disposal of property, plant and equipment. Management believes that these supplemental measures facilitate the understanding of Keyera’s results from operations.

Keyera Corp. TSX: KEY 2017 Year End Report February 15, 2018
KEYERA CORP.
41
The following is a reconciliation of EBITDA and Adjusted EBITDA to their most closely related GAAP measure, net earnings: EBITDA (Thousands of Canadian dollars) 2017 2016
Net earnings 289,920 216,851 Add (deduct): Finance costs 72,393 72,830 Depreciation, depletion and amortization expenses 165,978 171,615 Income tax expense 104,798 90,478
EBITDA 633,089 551,774
Unrealized (gain) loss on commodity contracts (5,326) 37,751 Net foreign currency (gain) loss on U.S. debt (11,131) 2,442 (Gain) loss on disposal of property, plant and equipment (20,447) 890 Impairment expense 20,830 12,270
Adjusted EBITDA 617,015 605,127
CONTRACTUAL OBLIGATIONS Keyera has assumed various contractual obligations in the normal course of its operations. At December 31, 2017, the obligations that represent known future cash payments that are required under existing contractual arrangements were as follows:
Payments Due by Period
Contractual obligations (Thousands of Canadian dollars)
Total
$
2018
$
2019
$
2020
$
2021
$
2022
$
After 2022
$
Derivative financial instruments 35,618 35,398 220 — — — —
Dividends payable 28,637 28,637 — — — — —
Credit facility — — — — — — —
Long-term debt1 1,805,540 — 125,756 130,935 — 60,000 1,488,849
Other liabilities2 98,817 9,696 8,747 8,120 5,250 5,250 61,754
Decommissioning liabilities3 466,039 9,584 — — — — 456,455
Operating leases4 252,761 56,434 45,898 37,630 30,184 22,969 59,646
Purchase obligations5,6 530,632 508,297 22,335 — — — —
Total contractual obligations 3,218,044 648,046 202,956 176,685 35,434 88,219 2,066,704
Notes: 1 Long-term debt obligations are principal only and exclude interest payments. For the U.S. denominated senior unsecured notes, the principal
obligations are converted at the December 31, 2017 spot foreign exchange rate of 1.2518. 2
Other liabilities include the future minimum lease payments related to finance lease liabilities as well as the current and long-term portions of the LTIP.
3 The majority of these obligations are expected to be settled between 2018 and 2063. No assets have been legally restricted for settlement of
the liability. 4 Keyera has lease commitments relating to railway tank cars, vehicles, computer hardware, office space, terminal lease space and natural gas
transportation. 5 Purchase obligations include third party contractual commitments related to assets under construction.
6 Keyera through its operating entities has assumed commitments in various contractual purchase agreements in the normal course of its operations. The agreements involve the purchase of NGL production from producers in the areas specified in the agreements. The purchase prices are based on current market prices. The future volumes and prices for these contracts cannot be reasonably determined and therefore no amount has been included in purchase obligations to reflect these contractual agreements.
RELATED PARTY TRANSACTIONS Keyera has provided compensation to key management personnel who are comprised of its directors and executive officers. There have been no other material related party transactions or significant changes to the annual compensation amounts disclosed in note 27, Related Party Transactions, of the accompanying December 31, 2017 financial statements. RISK FACTORS Historically, the majority of Keyera’s cash flow is derived from the Gathering and Processing and Liquids Infrastructure business segments. The contribution generated from Gathering and Processing facilities is not

Keyera Corp. TSX: KEY 2017 Year End Report February 15, 2018
KEYERA CORP.
42
significantly exposed to changes in operating costs, due to the nature of most fee structures, which provide a mechanism for the recovery of operating costs. The most significant exposure faced by the Gathering and Processing and Liquids Infrastructure segments over the long term is related to declines in throughput volumes. Without reserve additions, third party production will decline over time, as reserves are depleted. Declining production volumes may translate into lower throughput and revenues at Keyera’s plants and facilities; however, the effect of any reduction in throughput would likely be gradual. Keyera’s facilities are located in significant natural gas supply areas of the Western Canada Sedimentary Basin and capital costs present barriers to entry for new competitors. The most significant exposure faced by the Marketing business is the fluctuation in the prices of the commodities that Keyera buys and sells. Refer to the section below titled, “Marketing Risk”, for more information related to these risks. For a further discussion of the risks identified in this MD&A, other risks and trends that could affect Keyera’s performance and the steps that Keyera takes to mitigate these risks, readers are referred to the descriptions in this MD&A and Keyera’s Annual Information Form, which is available on SEDAR at www.sedar.com. Regulatory Risk Keyera is subject to a range of laws and regulations imposed by various levels of government and regulatory bodies in the jurisdictions in which it operates. In particular, income tax laws, environmental laws and regulatory requirements can have a significant financial and operational impact on Keyera’s business. While these laws and regulations affect all dimensions of Keyera’s activities, Keyera does not believe that they affect its operations in a manner materially different from other comparable businesses operating in the same jurisdictions. A more complete discussion of regulatory risks can be found in the Annual Information Form available on SEDAR at www.sedar.com and in the section of this MD&A titled, “Environmental Regulation and Climate Change”. Credit Risk Keyera assumes credit risk with respect to its fee-for-service business, the purchase and sale of commodities in its Marketing business, the hedging of commodity price changes and the other financial contracts into which it enters. In particular, Keyera is exposed to credit-related losses in the event that counterparties to contracts become insolvent or otherwise fail to fulfill their present or future financial obligations to Keyera. The majority of Keyera’s accounts receivable are due from entities in the oil and gas business and are subject to normal industry credit risks. Concentration of credit risk is mitigated to some degree by having a broad based domestic and international customer base. With respect to counterparties for financial instruments used for economic hedging purposes, Keyera limits its credit risk by dealing with recognized futures exchanges, or investment grade financial institutions, or by adherence to credit policies that significantly reduce overall counterparty credit risk. Keyera regularly monitors accounts receivable for collection purposes and reviews exposure to customers and counterparties. It has also implemented other credit risk management strategies including but not limited to the following: i) obtaining netting agreements in order to reduce the net exposure to a particular customer or producer; ii) obtaining letters of credit that may be used as collateral; or iii) requiring pre-payment prior to the sale of product or rendering of services where deemed appropriate. Management believes these measures reduce Keyera’s overall credit risk; however, there can be no assurance that these processes will protect against all losses from non-performance. As at December 31, 2017, the allowance for doubtful accounts was $3 million (December 31, 2016 – $4 million) to provide for specific accounts receivable amounts that may be uncollectible. Despite Keyera’s efforts in the monitoring and collection of accounts receivable, actual losses from defaults may be greater than that provided for. For a discussion of the risks that could affect Keyera’s liquidity and working capital and the steps Keyera takes to mitigate these risks, readers are referred to note 21, Financial Instruments and Risk Management,
Keyera Corp. TSX: KEY 2017 Year End Report February 15, 2018
KEYERA CORP.
43
of the accompanying financial statements and to Keyera’s Annual Information Form, which are available on SEDAR at www.sedar.com. Credit Ratings With the recent assignment of two long-term corporate credit ratings, rating agencies will regularly evaluate Keyera, including its financial strength. In addition, factors not entirely within Keyera’s control may also be considered, including conditions affecting the industry in which it operates. There can be no assurance that one or more of Keyera’s credit ratings will not be downgraded. A credit rating downgrade could impair Keyera’s ability to enter into arrangements with suppliers or counterparties and could limit its access to private and public credit markets and increase the costs of borrowing. Marketing Risk Keyera enters into contracts to purchase and sell natural gas, NGLs, crude oil and iso-octane. Most of these contracts are priced at floating market prices. These activities expose Keyera to market risks resulting from movements in commodity prices between the time volumes are purchased and the time they are sold, from fluctuations in the margins between purchase prices and sales prices and, in some cases, may also expose Keyera to foreign currency risk. The prices of the products that are marketed by Keyera are subject to fluctuations as a result of such factors as seasonal demand changes, changes in crude oil, gasoline and natural gas markets and other factors. In many circumstances, particularly in NGL marketing, purchase and sale contracts are not perfectly matched as they are entered into at different times, locations and values. Further, Keyera normally has a long position in propane that it markets and in butane that it uses as a feedstock for the production of iso-octane, and it may store these products in order to meet seasonal demand and take advantage of seasonal pricing differentials, resulting in inventory price risk. In Keyera’s NGL, iso-octane and crude oil marketing businesses, margins can vary significantly from period to period and volatility in the markets for these products may cause distortions in financial results from period to period that are not replicable. To some extent, Keyera can lessen certain elements of risk exposure through the integration of its marketing business with its facilities businesses. In spite of this integration, Keyera remains exposed to market and commodity price risk. Keyera manages this commodity risk in a number of ways, including the use of financial and physical hedging contracts and by offsetting some physical and financial contracts in terms of volumes, timing of performance and delivery obligations. There is no guarantee that hedging and other efforts to manage the marketing and inventory risks will generate profits or mitigate all the market and inventory risk associated with these activities. While hedging and other efforts to manage market and inventory risk are intended to mitigate Keyera’s risk exposure, because of the inherent nature and risk of such transactions, those activities can result in losses. If Keyera hedges its commodity price exposure, it may forego the benefits that may otherwise be experienced if commodity prices were to change and it is subject to credit risks associated with the counterparties with whom it contracts. Refer to the section of this MD&A titled, “Marketing: Risk Management”, for more information of Keyera’s risk management strategies. Operational Risk Keyera’s cash flows may be adversely affected by the occurrence of common hazards and environmental risks related to the natural gas gathering, processing and pipeline transportation business, such as the failure of equipment, systems or processes, operator error, labour disputes, disputes with owners of interconnected facilities, catastrophic events or acts of terrorism. To mitigate these operational and environmental risks, Keyera provides training to its employees, maintains written standard operating practices, formally assesses and documents employee competency, and maintains formal inspection, maintenance, safety and environmental programs. In addition, Keyera carries casualty and business interruption insurance, although there can be no assurance that the proceeds of such insurance will compensate Keyera fully for any losses, nor can it be assured that such insurance will be available in the future. For a further discussion of operational risks and the steps that Keyera takes to mitigate these risks, readers are referred to Keyera’s Annual Information Form which is available on SEDAR at www.sedar.com.
Keyera Corp. TSX: KEY 2017 Year End Report February 15, 2018
KEYERA CORP.
44
Foreign Currency Risk Foreign currency risk arises on financial instruments that are denominated in a foreign currency. Keyera’s functional currency is the Canadian dollar. The Gathering and Processing and Liquids Infrastructure segments are not subject to foreign currency risk as all sales and virtually all purchases are denominated in Canadian dollars. In the Marketing business, approximately US$1,057 million of sales and US$399 million of purchases were priced in U.S. dollars in 2017 compared to US$635 million of sales and US$374 million of purchases denominated in U.S. dollars in 2016. Foreign currency risk is actively managed by using forward currency contracts and cross currency swaps. Management monitors the exposure to foreign currency risk and regularly reviews its risk management strategies and all outstanding positions. Keyera is also exposed to foreign currency risk related to its U.S. dollar denominated long-term debt. To manage this currency exposure, Keyera has entered into cross currency swap contracts related to the principal portion and future interest payments for substantially all of the U.S. dollar denominated debt. These cross currency swap contracts are discussed further in the “Liquidity and Capital Resources” section of this MD&A. Cyber Security There is a risk that failure of one or more technology system could lead to failure of other systems. In addition, the risk of cyber-attacks in general are increasing. A breach in Keyera’s security or information technology could result in operational outages, financial loss, loss of material data, reputational harm and other adverse outcomes. These risks are somewhat mitigated through Keyera’s technology strategy that focuses on employing a multilayer security framework and incident management system to protect and detect issues within its information technology infrastructure. ENVIRONMENTAL REGULATION AND CLIMATE CHANGE Keyera is subject to a range of laws, regulations and requirements imposed by various levels of government and regulatory bodies in the jurisdictions in which it operates. While these legal controls and regulations affect numerous aspects of Keyera’s activities, including but not limited to, the operation of wells, pipelines and facilities, construction activities, transportation of dangerous goods, emergency response, operational safety and environmental matters, Keyera does not believe that they impact its operations in a manner materially different from other comparable businesses operating in the same jurisdictions. The midstream industry is subject to provincial and federal environmental legislation and regulations. Among other things, the environmental regulatory regime provides for restrictions and prohibitions on releases or emissions of various substances produced in association with certain oil and natural gas industry operations. Environmental regulation affects the operation of facilities and limits the extent to which facility expansion is permitted. In addition, legislation requires that facility sites and pipelines be abandoned and reclaimed to the satisfaction of provincial authorities and local landowners. A breach of such legislation may result in the imposition of fines, the issuance of clean-up orders or the shutting down of facilities and pipelines. Greenhouse gases, mainly carbon dioxide and methane, are components of the raw natural gas processed and handled at Keyera’s facilities. Operations at Keyera’s facilities, including the combustion of fossil fuels in engines, turbines, heaters and boilers, release carbon dioxide, methane and other minor greenhouse gases. As such, Keyera is subject to various greenhouse gas reporting and reduction programs. Keyera uses engineering consulting firms and internal resources to compile inventories of greenhouse gas emissions and reports these inventories in accordance with federal and provincial programs. Third party audits or verifications of inventories are conducted for facilities that are required to meet regulatory targets. Keyera is closely monitoring the ongoing development and implementation of the regulatory framework through which the federal and provincial governments are implementing their climate change and emissions reduction policies. In the near term, the majority of Keyera’s facilities initially fall within the exemptions to the Alberta carbon levy that came into force in 2017. For example, there are exemptions for heating fuels on sites subject to the Specified Gas Emitters Regulations (“SGER”) and Carbon Competitiveness Incentive Regulation (“CCIR”) for Large Final Emitters (“LFE”). There is also an exemption for natural gas produced and consumed on site for conventional oil and gas activities until 2023 as the regulators focus on methane reduction initiatives in these areas.
Keyera Corp. TSX: KEY 2017 Year End Report February 15, 2018
KEYERA CORP.
45
The Alberta government recently announced that the CCIR will replace the 10-year-old SGER on January 1, 2018. Like the SGER, the CCIR will apply to facilities that emit 100,000 tonnes or more of greenhouse gasses (“GHGs”) in 2003 or in any subsequent year. Keyera’s Strachan, Rimbey, Brazeau River and Nevis gas plants, the Keyera Fort Saskatchewan complex and AEF all come under the CCIR regulations. The CCIR is currently developing a benchmark for natural gas processing facilities that is expected to be complete in 2018. For the interim, natural gas processing facilities have been issued a specific benchmark based on the production weighted emissions intensity from 2013-2015. As AEF is the only facility in Alberta to produce iso-octane, a facility specific benchmark was created based on the production weighted emissions intensity.
Details with respect to the Alberta Government’s methane reduction program for conventional oil and gas activities continue to evolve. Keyera is engaged in the ongoing consultation initiatives underway with the Government of Alberta as well as with other midstream players in the industry, but does not expect to be materially impacted by the methane reduction efforts in light of the nature of its operations. Keyera anticipates that its compliance costs will increase as a result of the changing regulatory requirements with respect to emissions and climate change. Based on currently available information, Keyera does not expect the incremental direct cost of compliance between now and 2023 to be material based on various scenarios that Keyera has considered. This includes taking into account the facility benchmarking data that is currently available, the expected form of the CCIR benchmark, forecast increases in carbon pricing based on the federal framework, forecast throughput at Keyera’s LFEs and expected emissions performance of Keyera facilities. However, in addition to the expected direct costs, there may be indirect costs or consequences with implications for Keyera. For example, to the extent that electricity costs increase as a result of these changes, the operating costs of some of Keyera’s facilities may increase. In addition to the incremental costs associated with the regulatory changes, Keyera is also conscious of the potential implications and costs that may be associated with continued growth in negative public sentiment toward emissions from the energy industry. To mitigate the impact of these regulatory changes and risks, Keyera continues to evaluate new emission reduction opportunities at its facilities through its Emissions Reduction Task Force, and is also continuing to integrate emissions considerations into overall lifecycle planning for its facilities through its Climate Change and Emissions Strategy Committee. For a detailed discussion of environmental regulations that affect Keyera, political and legislative developments as they relate to climate change and the risks associated therewith, see Keyera’s Annual Information Form which is available at www.sedar.com.

Keyera Corp. TSX: KEY 2017 Year End Report February 15, 2018
KEYERA CORP.
46
SELECTED FINANCIAL INFORMATION The following table presents selected annual financial information for Keyera:
(Thousands of Canadian dollars, except per share information)
2017
2016
2015
Revenue before intersegment eliminations
1
- Gathering and Processing2 466,473 462,550 466,733
- Liquids Infrastructure 418,822 369,393 347,191 - Marketing - Other
2,803,950 26,667
1,924,614 22,625
1,967,726 40,188
Operating margin - Gathering and Processing 275,284 290,225 259,094 - Liquids Infrastructure 285,271 246,104 219,858 - Marketing - Other
128,370 14,616
101,109 8,735
243,781 19,605
Net earnings 289,920 216,851 201,920 Earnings per share ($/share):
3
- Basic 1.53 1.21 1.19 - Diluted
1.53 1.21 1.19
Dividends to shareholders 312,643 277,578 240,685 Dividends per share (basic)
3 1.65 1.54 1.42
Shares outstanding (thousands)3
- Weighted average (basic) 189,002 179,688 169,936
- Weighted average (diluted) 189,002 179,688 169,936
Total assets 5,874,128 4,956,961 4,296,569
Total long-term liabilities 2,793,360 2,582,728 2,334,513 Notes: 1
Keyera’s Gathering and Processing and Liquids Infrastructure segments charge Keyera’s Marketing segment for the use of facilities at market rates. Revenue before inter-segment eliminations includes these transactions. Inter-segment transactions are eliminated on consolidation in order to arrive at Operating Revenues in accordance with GAAP.
2 Certain information provided for prior years has been reclassified to conform to the presentation adopted in 2017.
3 On April 1, 2015, Keyera’s outstanding common shares were split on a two-for-one basis. All per share information has been presented on
a post-share split basis.
The Liquids Infrastructure operating segment set a new record for financial results in 2017 that largely stemmed from incremental demand for Keyera’s diluent handling services combined with incremental cash flow from several new assets that were put into service in the year, including the Norlite pipeline and the Fort Saskatchewan condensate system pipeline expansion and manifold. Overall fractionation revenue was also higher in 2017 due to higher contracted volumes, albeit at lower average fractionation fees effective April 1, 2017. The Gathering and Processing segment recorded solid financial results in 2017. Overall gross average throughput was 12% higher in the fourth quarter of 2017 compared to the same period in 2016 as drilling activity continued to increase in the liquids-rich Montney and Duvernay geological zones. The majority of the increase in volumes was attributable to the Simonette gas plant which achieved record average throughput in 2017 despite completing its scheduled maintenance turnaround in August. Operating margin was lower in 2017 compared to 2016 largely due to lower operating margin from the Rimbey, Strachan and Nevis gas plants as described throughout this MD&A.

Keyera Corp. TSX: KEY 2017 Year End Report February 15, 2018
KEYERA CORP.
47
In the Marketing segment, iso-octane margins were weaker in 2017 and 2016 due to lower sales volumes resulting from the unplanned outage at AEF in the first half of 2017 and the major turnaround at AEF in the second half of 2016. Iso-octane margins were exceptionally robust in 2015 as a result of strong premiums for gasoline and iso-octane during the peak driving season. SUMMARY OF QUARTERLY RESULTS The following table presents selected financial information for Keyera: Dec 31,
2017 Sep 30,
2017 June 30,
2017 Mar 31,
2017 Dec 31,
2016 Sep 30,
2016 June 30,
2016 Mar 31,
2016
Revenue before inter-segment eliminations1
Gathering and Processing
2
120,422
116,635
116,689
112,727
127,103
117,542
104,182
113,723
Liquids Infrastructure 114,525 103,872 99,398 101,027 94,712 90,178 90,402 94,101 Marketing 864,730 612,526 627,651 699,043 535,708 472,442 457,447 459,017 Other 5,303 5,065 7,918 8,381 7,512 5,643 3,044 6,426
Operating margin Gathering and Processing
72,744
69,381
66,822
66,337
79,881
71,689
70,457
68,198
Liquids Infrastructure 81,905 71,718 67,073 64,575 62,781 62,781 59,018 61,524 Marketing 54,032 (15,130) 21,033 68,435 8,581 23,825 24,582 44,121 Other 2,408 2,265 4,868 5,075 4,196 2,663 (67) 1,943
Net earnings 88,052 38,464 67,062 96,342 34,621 52,420 59,679 70,131
Earnings per share ($/share)
Basic 0.45 0.20 0.36 0.52 0.19 0.28 0.34 0.41 Diluted 0.45 0.20 0.36 0.52 0.19 0.28 0.34 0.41
Weighted average common shares (basic) 193,552 188,650 187,445 186,286 185,116 183,962 177,309 172,258 Weighted average common shares (diluted) 193,552 188,650 187,445 186,286 185,116 183,962 177,309 172,258
Dividends declared to shareholders
81,801
79,317
77,400
74,125
73,657
71,819
67,440
64,662
Notes:
1 Keyera’s Gathering and Processing and Liquids Infrastructure segments charge Keyera’s Marketing segment for the use of facilities at market rates. Revenue before inter-segment eliminations reflects these transactions. Inter-segment transactions are eliminated on consolidation in order to arrive at Operating Revenues in accordance with GAAP.
2 Certain information provided for prior years has been reclassified to conform to the presentation adopted in 2017.
In the Gathering and Processing segment, Keyera has continued to focus on delivering cost-effective and value-added services intended to enhance its customers’ economics, while at the same time maximizing throughput and efficiencies at its facilities. Operating margin in the Gathering and Processing segment is largely influenced by volumes processed through its facilities and the associated fees charged for these services. These fees are intended to be competitive in nature and are generally influenced by the prevailing commodity price and economic environment that its producer customers are facing. In 2017, an increase in drilling activity in the Montney and Duvernay geological zones resulted in throughput growth at Keyera’s Simonette gas plant, while throughput at certain other facilities including the Rimbey gas plant remained relatively stable. Operating margin in the fourth quarter of 2016 was unusually high due to the inclusion of a non-recurring upward adjustment to revenue of approximately $9 million, $6 million of which was associated with prior quarters in 2016. This adjustment related to the recovery of future turnaround costs at the Strachan, Gilby and Nevis gas plants. In the Liquids Infrastructure segment, incremental cash flow from recent investments, including the newly constructed Norlite pipeline have contributed to the growth in operating margin. In addition, Keyera has long-term agreements in place to provide diluent transportation, storage and rail offload services in the Edmonton/Fort Saskatchewan area for several oil sands producers and the demand for these services steadily increased throughout 2016 and 2017.
Keyera Corp. TSX: KEY 2017 Year End Report February 15, 2018
KEYERA CORP.
48
Operating margin from the Marketing segment is affected by seasonal factors. The demand for iso-octane is typically highest in the second and third quarters as the demand for gasoline tends to be higher in the summer months. In contrast, propane sales are typically higher in the first and fourth quarters when propane demand is higher. In 2017, Keyera saw more pronounced seasonal variability in its propane results due to the pricing strategy it used in order to contract volumes. See the section of this MD&A, “Segmented Results of Operations: Marketing” for more information related to Keyera’s propane strategy. Unrealized non-cash gains and losses resulting from the change in fair value of risk management contracts and the timing of settling these contracts can also have a material effect on quarterly operating margin for this segment. Keyera continues to maintain its disciplined approach to risk management for its NGL and iso-octane products. See the section of this MD&A, “Segmented Results of Operations”, for more information on the financial results of Keyera’s operating segments for the year ended December 31, 2017. ADOPTION OF NEW AND AMENDED STANDARDS Keyera has applied the following IFRS amendment in 2017: Disclosure Initiative – Amendments to IAS 7, Statement of Cash Flows Effective January 1, 2017, Keyera adopted the disclosure requirements in IAS 7 related to changes in liabilities arising from financing activities. See note 28, Supplemental Cash Flow Information, for a reconciliation that provides additional disclosures on the cash and non-cash changes in liabilities arising from financing activities. As allowed by IAS 7, comparative information has not been presented. FUTURE ACCOUNTING PRONOUNCEMENTS
IFRS 9, Financial Instruments IFRS 9 is now the standard which sets out the recognition and measurement requirements for financial instruments and some contracts to buy or sell non-financial items. IFRS 9 provides a single model of classifying and measuring financial assets and liabilities, and provides for only two classification categories: amortized cost and fair value. Hedge accounting requirements have also been updated in the new standard and are now more aligned with the risk management activities of an entity. IFRS 9 is effective for annual periods beginning on or after January 1, 2018. Early adoption is permitted; however, if an entity elects to apply this standard early, it must disclose that fact and apply all of the requirements in this standard at the same time.
Expected Impact Keyera has reviewed the standard to determine whether there would be any changes to how Keyera currently recognizes and measures financial instruments. Based on Keyera’s assessment, there would not be any differences to its consolidated financial statements upon the adoption of IFRS 9 on January 1, 2018 with respect to the recognition and measurement of financial instruments. Keyera currently does not follow hedge accounting to reflect its risk management activities. IFRS 15, Revenue from Contracts with Customers In May 2014, the IASB issued IFRS 15, Revenue from Contracts with Customers, the new standard which sets out the recognition and measurement requirements for reporting the nature, amount, timing and uncertainty of revenue and cash flows arising from an entity’s contracts with customers. IFRS 15 supersedes:
a) IAS 11 Construction Contracts; b) IAS 18 Revenue; c) IFRIC 13 Customer Loyalty Programmes; d) IFRIC 15 Agreements for the Construction of Real Estate; e) IFRIC 18 Transfers of Assets from Customers; and f) SIC-31 Revenue – Barter Transactions Involving Advertising Services.

Keyera Corp. TSX: KEY 2017 Year End Report February 15, 2018
KEYERA CORP.
49
IFRS 15 also provides guidance for the recognition and measurement of gains and losses on the sale of certain non-financial assets, such as property, plant and equipment. The standard is required to be adopted either retrospectively or using a modified retrospective transition approach for fiscal years beginning on or after January 1, 2018, with earlier adoption permitted. Expected Impact Keyera has developed an implementation plan, identifying the contracts and arrangements which will fall within the scope of IFRS 15. Major contract types and revenue streams have been determined, and the review of relevant revenue contracts which are within the scope of IFRS 15 has been completed. The majority of the company’s long-term revenue contracts reside in the Liquids Infrastructure reportable segment. Performance obligations have been identified for these contracts based on services or series of distinct services performed under the agreements.
Keyera is in the process of concluding its detailed assessment of the adoption of IFRS 15. This includes finalizing the evaluation of (i) recognition and measurement of revenue on Keyera’s consolidated financial statements; (ii) company policies and business practices; (iii) internal controls; and (iv) significant judgments and estimations required. Keyera is also currently compiling the disclosures required for transition to IFRS 15. Based on the review and analysis of its revenue contracts, Keyera anticipates that implementation will not materially affect the amount and timing of its revenue recognition. Furthermore, Keyera does not anticipate any changes to its information technology systems, key operating metrics or financial covenants as a result of the adoption of IFRS 15. Keyera has decided that it will implement the standard using the full retrospective approach, including the election of allowable practical expedients upon adoption on January 1, 2018. IFRS 16, Leases In January 2016, the IASB issued IFRS 16, Leases, which provides a single lease accounting model for lessees, which require the recognition of most leases as finance leases on the statement of financial position. This will result in the recognition of a lease liability and a corresponding recognition of a leased asset called right-of-use asset. On the consolidated statement of net earnings and comprehensive income, lease expense will be recognized and will consist of two components, depreciation expense of the right-of-use asset and interest expense related to the lease liability. Finance lease exemptions exist for short-term leases where the term is 12 months or less and for leases of low value items. For lessors, the accounting treatment remains the same which provides a lessor the choice of classifying a lease as either a finance or operating lease. IFRS 16 comes into effect on January 1, 2019. Expected impact Keyera is currently in the process of developing a detailed implementation plan and has commenced its assessment of existing contracts to identify arrangements that would qualify as a lease under the new standard. Once all contracts within the scope of IFRS 16 have been identified, Keyera will assess the effect of adoption on its consolidated financial statements, and will address any necessary changes to its policies, processes, internal controls, information technology systems, key operating metrics, financial covenants, and significant judgments and estimation. Amendments to IFRS 2, Share-based Payment In June 2016, the IASB issued amendments to IFRS 2, Share-based Payment which is to be applied to annual reporting periods beginning on or after January 1, 2018 with early adoption permitted. The amendments clarify how to classify and measure certain types of share-based payment transactions.

Keyera Corp. TSX: KEY 2017 Year End Report February 15, 2018
KEYERA CORP.
50
Expected impact The application of the amendment will not have an effect on Keyera’s consolidated financial statements upon adoption on January 1, 2018. IFRIC 22, Foreign Currency Transactions and Advance Consideration In December 2016, the IFRS Interpretations Committee (IFRIC) issued IFRIC 22, Foreign Currency Transactions and Advance Consideration, an interpretation that clarifies the requirements in IAS 21, The Effects of Changes in Foreign Exchange Rates. Specifically, IFRIC 22 addresses transactions that include the receipt or payment of advance consideration in a foreign currency. Previously, when non-monetary assets or non-monetary liabilities arising from the payment or receipt of advance consideration were recognized before recognition of the asset, expense or income it related to, there was diversity in practice regarding the exchange rate used to translate the related item. IFRIC 22 clarifies that for the purpose of determining this exchange rate, the date of transaction is the date of initial recognition of the non-monetary asset or non-monetary liability arising from the advance consideration. If a transaction involves multiple payments or receipts of advance consideration, an entity shall determine a separate date of transaction for each payment or receipt. IFRIC 22 is applicable for annual periods beginning on or after January 1, 2018 with early adoption permitted. This interpretation can be adopted either retrospectively or prospectively to all assets, expenses and income in the scope of the interpretation initially recognized on or after: (i) the beginning of the reporting period in which the entity first applies the interpretation; or (ii) the beginning of a prior reporting period presented as comparative information. Expected impact Upon prospective adoption of IFRIC 22 on January 1, 2018, the application of this interpretation did not have an effect on Keyera’s consolidated financial statements.
CONTROL ENVIRONMENT Disclosure Controls and Procedures The Chief Executive Officer and the Chief Financial Officer are satisfied that, as of December 31, 2017, Keyera’s disclosure controls and procedures are designed to provide reasonable assurance that material information relating to Keyera and its consolidated subsidiaries has been brought to their attention and that information required to be disclosed pursuant to applicable securities legislation has been recorded, processed, summarized and reported in an appropriate and timely manner. Internal Controls Over Financial Reporting The Chief Executive Officer and the Chief Financial Officer are satisfied that Keyera’s internal controls over financial reporting are designed to provide reasonable assurance regarding the reliability of financial reporting and the preparation of financial statements for external purposes in accordance with GAAP. No changes were made for the period beginning January 1, 2017 and ending December 31, 2017 that have materially affected, or are reasonably likely to materially affect Keyera’s internal controls over financial reporting. COMMON SHARES There were 4,833,715 common shares issued under the DRIP and the Premium DRIP for consideration of $181 million, and 14,030,000 of common shares were issued in connection with the equity offering for consideration of $494 million, bringing the total common shares outstanding at December 31, 2017 to 204,547,142. Subsequent to December 31, 2017, 930,715 common shares were issued to shareholders enrolled in the DRIP and Premium DRIP for consideration of $31 million, bringing the total common shares outstanding at February 15, 2018 to 205,477,857. NON-GAAP FINANCIAL MEASURES This discussion and analysis refers to certain financial measures that are not determined in accordance with GAAP. Measures such as distributable cash flow (cash flow from operating activities adjusted for changes in non-cash working capital, long-term incentive plan costs, inventory write-down, maintenance capital
Keyera Corp. TSX: KEY 2017 Year End Report February 15, 2018
KEYERA CORP.
51
expenditures and finance lease liabilities); distributable cash flow per share (distributable cash flow divided by weighted average number of shares – basic); EBITDA (earnings before finance costs, taxes, depreciation, and amortization); and Adjusted EBITDA (calculated as EBITDA before costs associated with non-cash items, including unrealized gains/losses on commodity contracts, impairment expenses and any other non-cash items such as gains/losses on the disposal of property, plant and equipment); and realized margin (used in the Marketing segment) are not standard measures under GAAP and, therefore, may not be comparable to similar measures reported by other entities. Management believes that these supplemental measures facilitate the understanding of Keyera’s results of operations, leverage, liquidity and financial position. Distributable cash flow is used to assess the level of cash flow generated from ongoing operations and to evaluate the adequacy of internally generated cash flow to fund dividends. EBITDA and Adjusted EBITDA are measures used as an indication of earnings generated from operations after consideration of administrative and overhead costs. Realized margin reflects the exclusion of unrealized gains and losses from risk management contracts in the Marketing segment. This measure is used to assess the financial performance of the Marketing segment in the period. Investors are cautioned, however, that these measures should not be construed as an alternative to net earnings determined in accordance with GAAP as an indication of Keyera’s performance. FORWARD-LOOKING STATEMENTS Certain statements contained in this MD&A and accompanying documents contain forward-looking statements. These statements relate to future events or Keyera’s future performance. Such statements are predictions only and actual events or results may differ materially. The use of words such as “anticipate”, “continue”, “estimate”, “expect”, “may”, “will”, “project”, “should”, “plan”, “intend”, “believe”, and similar expressions, including the negatives thereof, is intended to identify forward-looking statements. All statements other than statements of historical fact contained in this document are forward-looking statements. The forward-looking statements reflect management’s current beliefs and assumptions with respect to such things as the outlook for general economic trends, industry trends, commodity prices, capital markets, and the governmental, regulatory and legal environment. In some instances, this MD&A and accompanying documents may also contain forward-looking statements attributed to third party sources. Management believes that its assumptions and analysis in this MD&A are reasonable and that the expectations reflected in the forward-looking statements contained herein are also reasonable. However, Keyera cannot assure readers that these expectations will prove to be correct. All forward-looking statements involve known and unknown risks, uncertainties and other factors that may cause actual results, events, levels of activity and achievements to differ materially from those anticipated in the forward-looking statements. Such factors include but are not limited to: general economic, market and business conditions; access to capital and debt markets; operational matters, including potential hazards inherent in our operations; risks arising from co-ownership of facilities; activities of other facility owners; access to third party facilities, competitive action by other companies; activities of producers and other customers and overall industry activity levels; changes in gas composition; fluctuations in commodity prices and supply/demand trends; processing and marketing margins; effects of weather conditions; availability of construction crews and materials; fluctuations in interest rates, ability to maintain current credit ratings and foreign currency exchange rates; changes in operating and capital costs, including fluctuations in input costs; actions by governmental authorities; compliance with regulatory requirements; decisions or approvals of administrative tribunals; changes in environmental and other regulations; reliance on key personnel; competition for, among other things, capital, acquisition opportunities and skilled personnel; changes in tax laws, including the effects that such changes may have on shareholders, and in particular any differential effects relating to shareholder’s country of residence; and other factors, many of which are beyond the control of Keyera, some of which are discussed in this MD&A and in Keyera’s Annual Information Form dated February 15, 2018, filed on SEDAR at www.sedar.com and available on the Keyera website at www.keyera.com. Proposed construction and completion schedules and budgets for capital projects are subject to many variables, including weather; availability and prices of materials; labour; customer project schedules and expected in service dates; contractor productivity; contractor disputes; quality of cost estimating; decision processes and approvals by joint venture partners; changes in project scope at the time of project

Keyera Corp. TSX: KEY 2017 Year End Report February 15, 2018
KEYERA CORP.
52
sanctioning; regulatory approvals, conditions or delays (including possible intervention by third parties); and macro socio-economic trends. Pipeline projects are also subject to Keyera’s ability to secure the necessary rights of way; and underground cavern development is dependent on sufficient water supply. As a result, expected timing, costs and benefits associated with these projects may differ materially from the descriptions in this MD&A. Further, some of the projects discussed in this MD&A are subject to securing sufficient producer/customer interest and may not proceed if sufficient commitments are not obtained. Typically, the earlier in the engineering process that projects are sanctioned, the greater the likelihood that the schedule and budget may change. Expected closing of acquisitions and financings are subject to satisfaction of closing conditions which may vary depending on the nature of the transactions. Acquisitions may be subject to rights of first refusal and other third party consents. Readers are cautioned that they should not unduly rely on the forward-looking statements in this MD&A and accompanying documents. Further, readers are cautioned that the forward-looking statements in this document speak only as of the date of this MD&A. Any statements relating to “reserves” are deemed to be forward-looking statements as they involve the implied assessment, based on certain estimates and assumptions that the reserves described can be profitably produced in the future. All forward-looking statements contained in this MD&A and accompanying documents are expressly qualified by this cautionary statement. Such statements speak only as of the date hereof. Further information about the factors affecting forward-looking statements and management’s assumptions and analysis thereof, is available in filings made by Keyera with Canadian provincial securities commissions, which can be viewed on SEDAR at www.sedar.com.

Keyera Corp. TSX: KEY 2017 Year End Report February 15, 2018
KEYERA CORP.
53
Investor Information DIVIDENDS TO SHAREHOLDERS Dividends declared to shareholders of Keyera were $0.42 per share in the fourth quarter and a total of $1.65 per share in 2017. Effective with the May 2017 dividend and payable to shareholders on June 15, 2017, Keyera’s dividend increased by 6% to $0.14 per share per month or $1.68 per share annually. Keyera is focused on providing stable long-term dividends per share that grow over time.
TAXABILITY OF DIVIDENDS Keyera’s dividends are considered to be eligible dividends for the purpose of the Income Tax Act (Canada). For non-resident shareholders, Keyera’s dividends are subject to Canadian withholding tax.
SUPPLEMENTARY INFORMATION A breakdown of Keyera’s operational and financial results, including volumetric and operating margin information by major business unit, is available on our website at www.keyera.com/ir/reports. YEAR END 2017 RESULTS CONFERENCE CALL AND WEBCAST Keyera will be conducting a conference call and webcast for investors, analysts, brokers and media representatives to discuss the 2017 financial results at 8:00 am Mountain Standard Time (10:00 am Eastern Standard Time) on February 16, 2018. Callers may participate by dialing either 888-231-8191 or 647-427-7450. An audio recording of the call will be available for replay until 11:59 pm Mountain Standard Time on March 2, 2018 by dialing 855-859-2056 or 416-849-0833 and entering passcode 5468535. Internet users can listen to the call live on Keyera’s website at www.keyera.com/news/events. Shortly after the call, an audio archive will be posted on the website for 90 days. QUESTIONS We welcome questions from interested parties. Calls should be directed to Keyera’s Investor Relations department at 403-205-7670, toll free at 1-888-699-4853 or via email at [email protected]. Information about Keyera can also be found on our website at www.keyera.com.

Keyera Corp. TSX: KEY 2017 Year End Report February 15, 2018
KEYERA CORP.
54
Keyera Corp. Consolidated Statements of Financial Position (Thousands of Canadian dollars)
December 31, December 31,
Note 2017 2016
As at $ $
ASSETS
Cash 326,381 16,477
Trade and other receivables 7 435,620 364,081
Derivative financial instruments 21 11,561 9,021
Inventory 8 147,831 107,876
Other assets 9 16,604 81,592
Total current assets 937,997 579,047
Long-term portion of other assets 9 — 4,200
Derivative financial instruments 21 90,109 119,606
Property, plant and equipment 10 4,792,398 4,200,484
Goodwill 11 53,624 53,624
Total assets 5,874,128 4,956,961
LIABILITIES AND EQUITY
Trade and other payables 12 527,869 400,076
Derivative financial instruments 21 35,398 36,086
Dividends payable 19 28,637 24,603
Current portion of long-term debt 13 — 60,000
Current portion of decommissioning liability 14 9,584 11,960
Total current liabilities 601,488 532,725
Derivative financial instruments 21 220 500
Credit facilities 13 — 235,000
Long-term debt 13 1,795,530 1,437,413
Decommissioning liability 14 456,455 464,239
Other long-term liabilities 15 58,922 57,463
Deferred tax liabilities 16 482,233 388,113
Total liabilities 3,394,848 3,115,453
Equity
Share capital 17 2,647,836 1,987,341
Accumulated deficit (168,556) (145,833)
Total equity 2,479,280 1,841,508
Total liabilities and equity 5,874,128 4,956,961 See accompanying notes to the consolidated financial statements. Commitments and contingencies (note 30) These consolidated financial statements were approved by the board of directors of Keyera Corp. on February 15, 2018.
(Signed) Michael Norris (Signed) David G. Smith
Director Director
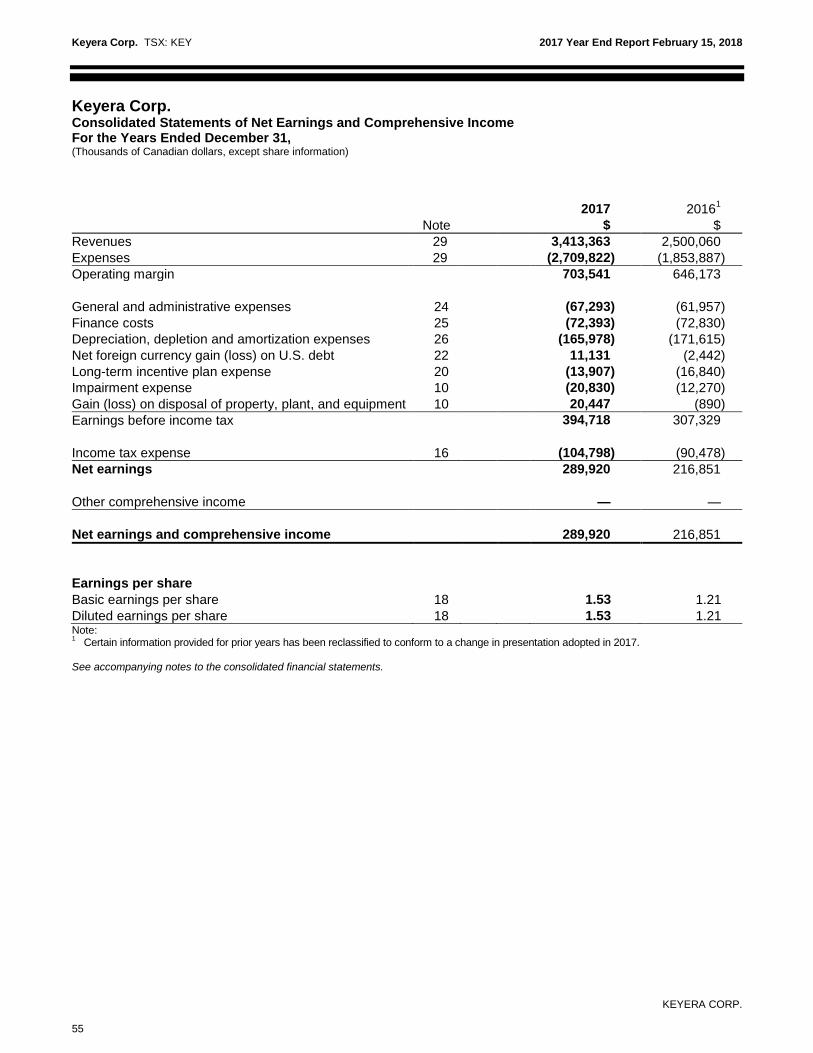
Keyera Corp. TSX: KEY 2017 Year End Report February 15, 2018
KEYERA CORP.
55
Keyera Corp. Consolidated Statements of Net Earnings and Comprehensive Income For the Years Ended December 31, (Thousands of Canadian dollars, except share information)
2017 20161
Note $ $
Revenues 29 3,413,363 2,500,060
Expenses 29 (2,709,822) (1,853,887)
Operating margin 703,541 646,173
General and administrative expenses 24 (67,293) (61,957)
Finance costs 25 (72,393) (72,830)
Depreciation, depletion and amortization expenses 26 (165,978) (171,615)
Net foreign currency gain (loss) on U.S. debt 22 11,131 (2,442)
Long-term incentive plan expense 20 (13,907) (16,840)
Impairment expense 10 (20,830) (12,270)
Gain (loss) on disposal of property, plant, and equipment 10 20,447 (890)
Earnings before income tax 394,718
307,329
Income tax expense 16 (104,798) (90,478)
Net earnings 289,920 216,851
Other comprehensive income — —
Net earnings and comprehensive income 289,920 216,851
Earnings per share
Basic earnings per share 18 1.53 1.21
Diluted earnings per share 18 1.53 1.21 Note: 1
Certain information provided for prior years has been reclassified to conform to a change in presentation adopted in 2017. See accompanying notes to the consolidated financial statements.

Keyera Corp. TSX: KEY 2017 Year End Report February 15, 2018
KEYERA CORP.
56
Keyera Corp. Consolidated Statements of Cash Flows For the Years Ended December 31, (Thousands of Canadian dollars)
2017
2016
Note $ $
Cash provided by (used in):
OPERATING ACTIVITIES
Net earnings: 289,920 216,851
Adjustments for items not affecting cash:
Finance costs 25 14,039 12,220
Depreciation, depletion and amortization expenses 26 165,978 171,615
Long-term incentive plan expense 20 13,907 16,840
Unrealized loss on derivative financial instruments 21 25,990 68,930
Unrealized gain on foreign exchange (31,171) (28,323)
Deferred income tax expense 16 99,383 75,106 Impairment expense
10 20,830 12,270
(Gain) loss on disposal of property, plant and equipment 10 (20,447) 890
Decommissioning liability expenditures 14 (10,790) (4,249)
Changes in non-cash working capital 28 (53,942) (129,224)
Net cash provided by operating activities 513,697 412,926
INVESTING ACTIVITIES
Acquisitions 10 (61,122) (190,375)
Capital expenditures 10 (698,992) (567,042)
Proceeds on disposal of property, plant, and equipment 10 6,015 85
Changes in non-cash working capital 28 107,164 (3,642)
Net cash used in investing activities (646,935) (760,974)
FINANCING ACTIVITIES
Borrowings under credit facilities 13 3,268,802 1,397,406
Repayments under credit facilities 13 (3,503,802) (1,532,406)
Proceeds from issuance of long-term debt 13 400,000 360,000
Financing costs related to credit facilities/long-term debt 13 (3,527) (2,238)
Repayment of long-term debt 13 (60,000) (97,740)
Proceeds from equity offering 17 493,856 344,871
Issuance costs related to equity offering 17 (19,742) (14,528)
Proceeds from issuance of shares related to DRIP 17 181,118 169,777
Repayment of finance lease liabilities 15 (2,250) (188)
Dividends paid to shareholders 19 (308,609) (274,438)
Net cash provided in financing activities 445,846 350,516 Effect of exchange rate fluctuations on foreign cash held
(2,704)
562
Net increase in cash 309,904 3,030
Cash at the beginning of the year 16,477 13,447
Cash at the end of the year 326,381 16,477
Income taxes paid in cash 3,351 73,348
Interest paid in cash 82,996 84,134 See accompanying notes to the consolidated financial statements.
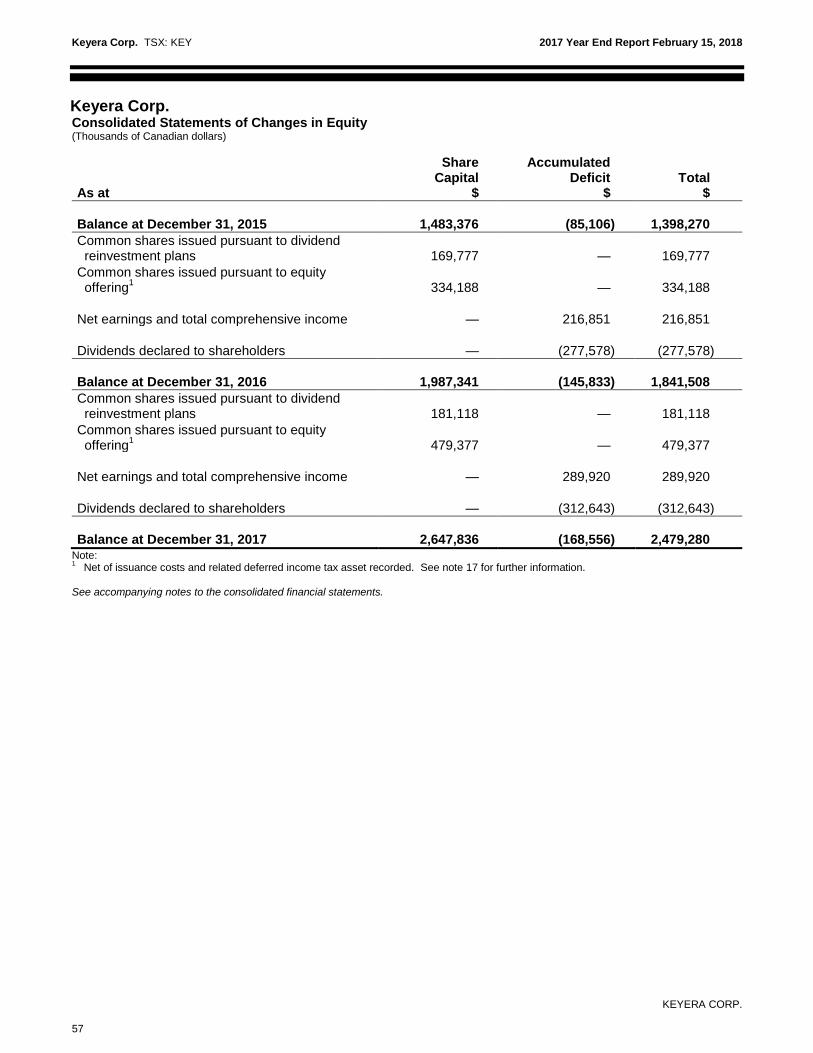
Keyera Corp. TSX: KEY 2017 Year End Report February 15, 2018
KEYERA CORP.
57
Keyera Corp. Consolidated Statements of Changes in Equity (Thousands of Canadian dollars)
Share
Capital Accumulated
Deficit Total As at $ $ $
Balance at December 31, 2015 1,483,376 (85,106) 1,398,270
Common shares issued pursuant to dividend reinvestment plans 169,777 — 169,777
Common shares issued pursuant to equity offering
1 334,188 — 334,188
Net earnings and total comprehensive income — 216,851 216,851
Dividends declared to shareholders — (277,578) (277,578)
Balance at December 31, 2016 1,987,341 (145,833) 1,841,508
Common shares issued pursuant to dividend reinvestment plans 181,118 — 181,118
Common shares issued pursuant to equity offering
1 479,377 — 479,377
Net earnings and total comprehensive income — 289,920 289,920
Dividends declared to shareholders — (312,643) (312,643)
Balance at December 31, 2017 2,647,836 (168,556) 2,479,280
Note: 1 Net of issuance costs and related deferred income tax asset recorded. See note 17 for further information.
See accompanying notes to the consolidated financial statements.
Keyera Corp. TSX: KEY 2017 Year End Report February 15, 2018
KEYERA CORP. Notes to annual consolidated financial statements
58
Keyera Corp. Notes to Consolidated Financial Statements As at and for the years ended December 31, 2017 and 2016 (All amounts expressed in thousands of Canadian dollars, except as otherwise noted)
1. GENERAL BUSINESS DESCRIPTION
The operating subsidiaries of Keyera Corp. include Keyera Partnership (the “Partnership”), Keyera Energy Ltd. (“KEL”), Keyera Energy Inc. (“KEI”), Keyera Rimbey Ltd. (“KRL”), Keyera RP Ltd. (“KRPL”), Rimbey Pipeline Limited Partnership (“RPLP”), Alberta Diluent Terminal Ltd. (“ADT”) and Alberta EnviroFuels Inc. (“AEF”). Keyera Corp. and its subsidiaries are involved in the business of natural gas gathering and processing; transportation, storage and marketing of natural gas liquids (“NGLs”) and iso-octane in Canada and the United States (“U.S.”); the production of iso-octane; and crude oil midstream activities in Canada. Keyera Corp. and its subsidiaries are collectively referred to herein as “Keyera”. The address of Keyera’s registered office and principal place of business is Suite 200, Sun Life Plaza West Tower, 144 – 4th Avenue S.W., Calgary, AB, Canada. Pursuant to its Articles of Amalgamation, Keyera Corp. is authorized to issue an unlimited number of common shares (the “Shares”). The Shares trade on the Toronto Stock Exchange under the symbol “KEY”. Keyera is approved to issue two classes of preferred shares (one class referred to as the “First Preferred Shares”, a second class referred to as the “Second Preferred Shares”), and collectively both classes being referred to as the “Preferred Shares”. Each are issuable in one or more series without par value and each with such rights, restrictions, designations and provisions as the board of directors may at any time and from time to time determine, subject to an aggregate maximum number of authorized Preferred Shares. No preferred shares had been issued as at December 31, 2017. Interests in Subsidiaries
Keyera Corp. directly or indirectly owns 100% of the voting interests in all of its operating subsidiaries and is the managing partner of the Partnership, Keyera’s primary Canadian operating subsidiary. On January 1, 2017, Keyera Energy Ltd. and Keyera Midstream Ltd., both subsidiaries of Keyera Corp., amalgamated under the Keyera Energy Ltd. name. As a result of the amalgamation, Keyera Energy Ltd. owns the 2.5391% general partnership interest in Keyera Partnership formerly owned by Keyera Midstream Ltd.

Keyera Corp. TSX: KEY 2017 Year End Report February 15, 2018
KEYERA CORP. Notes to annual consolidated financial statements
59
The following diagram sets out the name and jurisdiction of formation of the operating subsidiaries of Keyera Corp as of December 31, 2017.
Rimbey Pipeline Limited
Partnership (Manitoba)
Keyera Rimbey Ltd.
(Alberta)
Alberta Diluent Terminal Ltd.
(Alberta)
Keyera Corp.(Alberta)
Keyera RP Ltd.
(Alberta)
Keyera Partnership
(Alberta)
Keyera Energy Inc.
(Delaware)
Keyera Energy Ltd.
(Alberta)
AlbertaEnvirofuels Inc.
(Alberta)
The Partnership owns and operates the majority of Keyera’s Canadian assets and businesses. In accordance with the Partnership Agreement, the Partnership is authorized to carry on a number of business activities including: (i) directly or indirectly, alone or in conjunction with other persons, gathering, processing, transporting, delivering, fractionating, extracting, storing, blending, buying, selling, marketing, investing in, developing, producing, and disposing of natural gas, NGLs, iso-octane, crude oil, bitumen and other petroleum products (including any by-products associated with the foregoing), petroleum based solvents, and electricity; (ii) constructing, owning, operating, managing, acquiring and investing in facilities and infrastructure related to the foregoing; (iii) other business activities as the board of directors may determine; and (iv) all activities ancillary or incidental to any of the foregoing.
Keyera’s only Canadian assets that are not owned and operated by the Partnership are the Rimbey Pipeline, which is owned and operated by RPLP, and the Alberta Diluent Terminal, which is owned and operated by ADT. The Edmonton Terminal which was previously owned and operated by RPLP was transferred to the Partnership on January 1, 2016.
Keyera Energy Inc. is Keyera’s U.S. operating subsidiary. It carries out Keyera’s NGL and iso-octane marketing activities in the United States.

Keyera Corp. TSX: KEY 2017 Year End Report February 15, 2018
KEYERA CORP. Notes to annual consolidated financial statements
60
Interests in Material Jointly Controlled Operations For all of the material jointly controlled operations below, Keyera recognizes its proportionate share of revenues and expenses and property, plant and equipment.
Name of Joint Arrangement Place of Business % Ownership Nature of Relationship
Alberta Crude Terminal Alberta 50% Rail Loading, Offloading and Storage
Alder Flats Gas Plant Alberta 70% Gathering and Processing Facilities
Brazeau River Gas Plant Alberta 94% Gathering and Processing Facilities
Cynthia Gas Plant Alberta 93% Gathering and Processing Facilities
Keyera Fort Saskatchewan Facilities
Alberta 77% NGL Processing, Storage and Pipelines
Minnehik Buck Lake Gas Plant Alberta 80% Gathering and Processing Facilities
Norlite Pipeline Alberta 30% NGL Pipelines
Ricinus Gas Plant Alberta 71% Gathering and Processing Facilities
Rimbey Gas Plant Alberta 99% Gathering and Processing Facilities
South Cheecham Rail and Truck Terminal
Alberta 50% Rail Loading, Offloading and Storage
West Pembina Gas Plant Alberta 83% Gathering and Processing Facilities
Zeta Creek Gas Plant Alberta 60% Gathering and Processing Facilities

Keyera Corp. TSX: KEY 2017 Year End Report February 15, 2018
KEYERA CORP. Notes to annual consolidated financial statements
61
2. BASIS OF PREPARATION International Financial Reporting Standards (“IFRS”) are the generally accepted accounting principles in Canada (“GAAP”). As such, the accompanying consolidated financial statements were prepared in accordance with the respective IFRS. The consolidated financial statements have been prepared on the historical cost basis except for the following:
derivative financial instruments are measured at fair value; and
liabilities for Keyera’s long-term incentive plan are measured at fair value.
The consolidated financial statements were authorized for issuance on February 15, 2018 by the board of directors. New and amended IFRS standards adopted by Keyera Keyera has applied the following IFRS amendment in 2017: Disclosure Initiative – Amendments to IAS 7, Statement of Cash Flows Effective January 1, 2017, Keyera adopted the disclosure requirements in IAS 7 related to changes in liabilities arising from financing activities. See note 28, Supplemental Cash Flow Information, for a reconciliation that provides additional disclosures on the cash and non-cash changes in liabilities arising from financing activities. As allowed by IAS 7, comparative information has not been presented.
3. SIGNIFICANT ACCOUNTING POLICIES Principles of consolidation The consolidated financial statements include the accounts of Keyera and all of its subsidiaries. Subsidiaries are entities over which Keyera has control. Generally, control is achieved where Keyera has the power to govern the financial and operating policies of an entity so as to obtain benefits from its activities. The financial statements of subsidiaries are prepared for the same reporting period as Keyera, using consistent accounting policies. All intercompany accounts and transactions have been eliminated upon consolidation. Jointly controlled operations Jointly controlled operations are assets over which Keyera has joint ownership with one or more unaffiliated entities. Keyera undertakes a number of Gathering and Processing and Liquids Infrastructure activities through jointly controlled operations.
Jointly controlled operations are accounted for using the proportionate consolidation method as follows:
the consolidated statement of financial position includes Keyera’s share of the assets that it controls jointly and the liabilities for which it is jointly responsible; and
the consolidated statement of net earnings and comprehensive income includes Keyera’s share of the income and expenses generated by the jointly controlled operation.
Business combinations Business combinations are accounted for using the acquisition method. Assets and liabilities acquired in a business combination and any contingent consideration are measured at their fair values as of the date
Keyera Corp. TSX: KEY 2017 Year End Report February 15, 2018
KEYERA CORP. Notes to annual consolidated financial statements
62
of acquisition and subsequently remeasured at fair value with changes recorded through the consolidated statement of net earnings and comprehensive income each period until settled. In addition, acquisition related and restructuring costs are recognized separately from the business combination and are expensed to the consolidated statement of net earnings and comprehensive income. Business combinations also applies to the acquisition of an interest in a joint operation in which the activity of the joint operation constitutes a business.
Currency The functional currency and presentation currency of Keyera and its subsidiaries is Canadian dollars. Keyera’s only foreign subsidiary, KEI, has a functional currency of Canadian dollars as its operations are carried out as an extension of the Canadian Marketing business and is integrated with the Canadian reporting entity. Transactions in foreign currencies are initially recorded in the functional currency by applying the rate of exchange at the date of the transaction. Monetary assets and liabilities denominated in foreign currencies are retranslated into the functional currency at the rate of exchange on the statement of financial position date. Any resulting exchange differences are included in the consolidated statement of net earnings and comprehensive income. Non-monetary assets and liabilities denominated in a foreign currency are measured at historical cost and are translated into the functional currency using the rates of exchange as at the dates of the initial transactions.
Revenue recognition Revenue is measured at the fair value of the consideration received or receivable, after eliminating intercompany sales.
Revenue from the rendering of services is recognized when the following criteria are met:
the amount of revenue can be measured reliably;
the stage of completion can be measured reliably;
the receipt of economic benefits is probable; and
costs incurred can be measured reliably. Revenue from the sale of products is recognized when the following criteria are met:
the risks and rewards of ownership have transferred to the customer;
the amount of revenue can be measured reliably;
the receipt of economic benefits is probable; and
costs incurred can be measured reliably. In addition to the above general principles, Keyera applies the following specific revenue recognition policies: Marketing revenue Revenue from marketing NGLs, iso-octane and natural gas as well as from crude oil midstream activities is recognized based on volumes delivered to customers at contracted rates and delivery points. Gathering and Processing revenue Gathering and Processing revenue is generated through fixed fee arrangements or flow-through arrangements that are designed to recover operating costs and provide a return on capital. Under fixed fee arrangements, the fee is a fixed charge per unit transported or processed. Under the flow-through method, the operating costs for the facility are recovered from each customer based upon that customer’s pro rata share of total throughput. Users of each facility are charged a fee per unit based upon estimated
Keyera Corp. TSX: KEY 2017 Year End Report February 15, 2018
KEYERA CORP. Notes to annual consolidated financial statements
63
operating costs and throughput, with an adjustment to actual costs and throughput completed after the end of the year. Each quarter, throughput volumes and operating costs are reviewed to determine whether the estimated unit fee charged during the quarter properly reflects the actual volumes and costs, and the allocation of revenues and operating costs to other plant owners is also reviewed. Amounts collected in excess of the recoverable amounts under flow-through arrangements are recorded as a current liability. Recoverable amounts in excess of the amounts collected under flow-through arrangements are recorded as a current receivable. Revenue from take or pay arrangements is recognized as service is provided or in accordance with the terms of the agreement.
Liquids Infrastructure revenue Revenue from transportation, processing and storage of NGLs is generated through fee-for-service arrangements. The fee is generally comprised of a fixed charge per unit transported, processed or stored. Revenue is recognized when services have been performed and collection is reasonably assured.
Share-based compensation Keyera has a Long-Term Incentive Plan (“LTIP”), which is described in note 20. The LTIP is accounted for using the liability method and is measured at fair value at each statement of financial position date until the award is settled. The liability is measured by using a fair value pricing model. The compensation expense is recognized over the vesting period, with a corresponding liability recognized on the statement of financial position.
Cash Cash is comprised of cash on hand at year end.
Trade and other receivables Trade receivables are amounts due from customers from the rendering of services or sale of goods in the ordinary course of business. Trade receivables are classified as current assets if payment is due within one year or less. Trade receivables are recognized initially at fair value and subsequently measured at amortized cost, less allowance for doubtful accounts. Keyera maintains an allowance for doubtful accounts to provide for impairment of trade receivables. The expense or recovery relating to doubtful accounts is included within general and administrative expenses in the consolidated statement of net earnings and comprehensive income.
Inventory Inventory is comprised primarily of NGL and iso-octane products for sale through the Marketing operations. Inventory is measured at the lower of weighted average cost and net realizable value. Net realizable value represents the estimated selling price for inventories less selling expenses at the statement of financial position date. The reversal of previous net realizable value write-downs is recorded when there is a subsequent increase in the value of inventories.
Property, plant and equipment Items of property, plant and equipment, which include plant and processing equipment and production assets, are measured at cost less accumulated depreciation, depletion and accumulated impairment losses net of recoveries. The initial cost of an asset comprises its purchase price or construction cost, any costs directly attributable to bringing the asset into operation, the initial estimate of any decommissioning liability, and for qualifying assets, borrowing costs. The purchase price or construction cost is the aggregate amount paid and the fair value of any other consideration given to acquire the asset. Major
Keyera Corp. TSX: KEY 2017 Year End Report February 15, 2018
KEYERA CORP. Notes to annual consolidated financial statements
64
maintenance programs (turnaround costs) are capitalized and amortized over the period to the next scheduled maintenance. The costs of day-to-day servicing of property, plant and equipment are recognized in the consolidated statement of net earnings and comprehensive income as incurred. The cost of replacing part of an item of property, plant and equipment is capitalized if it is probable that future economic benefits will flow to Keyera and its cost can be measured reliably. An item of property, plant and equipment is derecognized upon disposal, replacement or when no future economic benefits are expected to arise from the continued use of the asset. Any gains or losses arising on the disposal or retirement of an item of property, plant and equipment are determined by comparing the proceeds from disposal with the carrying amount of the item, and are recognized in the consolidated statement of net earnings and comprehensive income. Depreciation is recognized so as to expense the cost of significant components of assets less their residual values over their useful lives, using the straight-line method. Production assets are depleted using the unit-of-production method based on estimated proved reserves. Land and linefill are not depreciated. Capitalized leased assets under finance lease arrangements are depreciated over the shorter of the estimated useful life of the asset or the lease term if the lease arrangement does not transfer ownership of the underlying asset to the lessee at the end of the lease term or if the cost of the capitalized leased asset does not reflect that the lessee will exercise a purchase option. Otherwise, the capitalized leased asset is depreciated from the commencement date to the end of the useful life of the underlying asset. Depreciation methods, useful lives and residual values are reviewed on an annual basis and, if necessary, any changes would be accounted for prospectively. The estimated useful lives of Keyera’s property, plant and equipment are as follows: General plant and processing equipment 4 - 45 years Other properties and equipment 5 - 10 years Turnarounds 4 - 10 years Borrowing costs Borrowing costs that Keyera incurs in connection with the borrowing of funds that are attributable to the acquisition, construction or production of a qualifying asset are capitalized when the assets take a significant period of time to get ready for use or sale. Other borrowing costs are expensed as incurred. Impairment of property, plant and equipment Keyera assesses assets for impairment whenever events or changes in circumstances indicate that the carrying value of an asset may not be recoverable. For the purposes of assessing impairment, assets are grouped at the lowest levels for which there are separately identifiable cash inflows (cash generating units or CGUs). Any impairment loss is recognized for the amount by which the asset’s carrying amount exceeds its recoverable amount. If the recoverable amount of an asset is estimated to be less than its carrying amount, the carrying amount of the asset is reduced to its recoverable amount. An impairment loss is recognized immediately in the consolidated statement of net earnings and comprehensive income. The recoverable amount is the greater of: i) an asset’s fair value less costs of disposal; and ii) its value in use. Fair value is the price that would be expected to be received in a sale transaction less costs of disposal.
Keyera Corp. TSX: KEY 2017 Year End Report February 15, 2018
KEYERA CORP. Notes to annual consolidated financial statements
65
In assessing value in use, the estimated future cash flows are discounted to their present value using a pre-tax discount rate that reflects current market assessments of the time value of money and the risks specific to the asset for which the estimates of future cash flows have not been adjusted. Keyera evaluates impairment losses for potential reversals, other than goodwill impairment, when events or changes in circumstances warrant such consideration. Reversals of impairment losses are evaluated and if deemed necessary are recognized immediately in the consolidated statement of net earnings and comprehensive income. Goodwill Goodwill arising in a business combination is recognized as an asset and initially measured at cost, being the excess of the consideration transferred in the business combination over Keyera’s interest in the net fair value of the identifiable assets, liabilities and contingent liabilities recognized. If Keyera’s interest in the net fair value of the acquiree’s identifiable assets, liabilities and contingent liabilities exceeds the cost of the business combination, the excess is recognized immediately in the consolidated statement of net earnings and comprehensive income. Following initial recognition, goodwill is measured at cost less any accumulated impairment losses. Goodwill is not amortized but is reviewed for impairment at least annually. Impairment of goodwill Impairment is assessed annually and is determined by assessing the recoverable amount of the CGU or group of CGUs to which the goodwill relates. Where the recoverable amount of the CGU or group of CGUs is less than the carrying amount, an impairment loss is recognized in the consolidated statement of net earnings and comprehensive income. The impairment loss is allocated first to reduce the carrying amount of any goodwill and then on a pro-rata basis to the other assets within the CGU. An impairment loss recognized for goodwill is not reversed in a subsequent period.
Financial assets Financial assets include cash, trade and other receivables and derivative financial instruments. Keyera determines the classification of its financial assets at initial recognition. Financial assets are recognized initially at fair value net of transaction costs. The subsequent measurement of financial assets depends on their classification, as follows: a) Loans and receivables Loans and receivables are non-derivative financial assets with fixed or determinable payments that are not quoted in an active market. These assets are initially recognized at fair value plus transaction costs and subsequently carried at amortized cost using the effective interest method. Gains and losses are recognized in the consolidated statement of net earnings and comprehensive income when the loans and receivables are derecognized or impaired. Assets in this category include trade and other receivables that are classified as current assets on the consolidated statement of financial position. b) Financial assets at fair value through the consolidated statement of net earnings and comprehensive income A financial asset is classified in this category if acquired principally for the purpose of selling in the short-term or if so designated by management. Derivatives, other than those designated as effective hedging instruments, are classified as fair value through the consolidated statement of net earnings and comprehensive income and are included in this category. Keyera has not designated any derivative instruments as hedges. These assets are carried on the consolidated statement of financial position at fair value with gains or losses recognized in the consolidated statement of net earnings and comprehensive income in the period in which they arise. The estimated fair value of assets and liabilities classified as fair value through the

Keyera Corp. TSX: KEY 2017 Year End Report February 15, 2018
KEYERA CORP. Notes to annual consolidated financial statements
66
consolidated statement of net earnings and comprehensive income is determined by reference to observable market data, including commodity price curves, foreign currency curves and credit spreads. Transaction costs are charged to the consolidated statement of net earnings and comprehensive income as incurred. c) Available for sale Financial assets available for sale are non-derivatives that are either designated in this category or not classified in any of the other categories. These assets are measured at fair value, with changes in those fair values recognized in other comprehensive income. Transaction costs are initially recognized as part of the carrying amount of the financial asset. The costs are then amortized through the consolidated statement of net earnings and comprehensive income over the term of the instrument using the effective interest method. Currently, Keyera does not have any financial assets classified as available for sale. Impairment of financial assets Keyera assesses at each statement of financial position date whether there is objective evidence that a financial asset is impaired. Impairments are measured as the excess of the carrying amount over the fair value and are recognized in the consolidated statement of net earnings and comprehensive income. Financial liabilities Financial liabilities consist of current and long-term debt, credit facilities, trade and other payables, derivative financial instruments, dividends payable and finance lease liabilities. Financial liabilities are classified in the following categories at the time of initial recognition:
a) Financial liabilities at fair value through the consolidated statement of net earnings and comprehensive income Derivatives are classified as fair value through the consolidated statement of net earnings and comprehensive income and are included in this category. These liabilities are carried on the consolidated statement of financial position at fair value with gains or losses recognized in the consolidated statement of net earnings and comprehensive income in the period in which they arise. Keyera has not designated any derivative instruments as hedges. Transaction costs are charged to the consolidated statement of net earnings and comprehensive income as incurred. b) Financial liabilities measured at amortized cost All other financial liabilities are initially recognized at fair value. For interest bearing debt, this is the fair value of the proceeds received net of transaction costs associated with the borrowing. After initial recognition, financial liabilities are subsequently measured at amortized cost using the effective interest method. Amortized cost is calculated by taking into account any transaction costs, and any discount or premium on settlement. Keyera has classified current and long-term debt, credit facilities, trade and other payables, dividends payable and finance lease liabilities in this category. Derivatives and embedded derivatives Derivative instruments include financial contracts that derive their value from underlying changes in interest rates, foreign exchange rates, credit spreads, commodity prices, equities or other financial measures. Keyera uses derivative instruments such as commodity price swaps (NGLs, crude oil, natural gas, motor gasoline), electricity price swaps, foreign exchange forward contracts, and cross-currency swaps to manage its risks.
Natural gas, NGL and crude oil contracts that require physical delivery at fixed prices and do not meet Keyera’s expected purchase, sale or usage requirements are accounted for as derivative instruments.
Derivatives may include those derivatives that are embedded in financial or non-financial contracts that are not closely related to the host contracts. Embedded derivatives are accounted for as derivative instruments.
Keyera Corp. TSX: KEY 2017 Year End Report February 15, 2018
KEYERA CORP. Notes to annual consolidated financial statements
67
Changes in the fair value of derivatives are recognized in the consolidated statement of net earnings and comprehensive income and are included in Marketing revenue, Liquids Infrastructure operating expenses, Gathering and Processing operating expenses, Corporate and Other revenue and expenses and net foreign currency gain (loss) on U.S. debt. The grouping of these gains and losses in the consolidated statement of net earnings and comprehensive income is consistent with the underlying nature and purpose of the derivative instruments (see note 21).
Provisions Provisions are recognized when Keyera has a present obligation (legal or constructive) as a result of a past event, it is probable that Keyera will be required to settle the obligation, and a reliable estimate can be made of the amount of the obligation. The amount recognized as a provision is the best estimate of the consideration required to settle the present obligation at the statement of financial position date, taking into account the risks and uncertainties surrounding the obligation. Where a provision is measured using the cash flows estimated to settle the present obligation, its carrying amount is the present value of those cash flows. When some or all of the economic benefits required to settle a provision are expected to be recovered from a third party, a receivable is recognized as an asset if it is virtually certain that reimbursement will be received and the amount of the receivable can be measured reliably. Decommissioning Liability Liabilities for decommissioning costs are recognized for the reclamation of Keyera’s facilities at the end of their economic life. Any change in the present value, as a result of a change in discount rate or expected future costs, of the estimated obligation is reflected as an adjustment to the provision and the corresponding item of property, plant and equipment. Keyera’s discount rate is a risk free rate based on the Government of Canada’s benchmark long-term bond yield. The liability for decommissioning costs is increased each period through the unwinding of the discount, which is included in finance costs in the consolidated statement of net earnings and comprehensive income. Actual expenditures incurred are charged against the decommissioning liability.
Taxation Income tax expense represents the sum of current and deferred tax. Tax is recognized in the consolidated statement of net earnings and comprehensive income except to the extent it relates to items recognized in other comprehensive income or directly in equity. a) Current tax
The tax currently payable is based on taxable profit for the year. Current tax expense is based on the results for the period as adjusted for items that are not taxable or not deductible. Current tax is calculated using tax rates and laws that were enacted or substantively enacted at the end of the reporting period. b) Deferred tax Deferred tax is recognized using the liability method on temporary differences arising between the tax basis of assets and liabilities and their carrying amounts on the statement of financial position. Deferred tax is calculated using tax rates and laws that have been enacted or substantively enacted at the end of the reporting period, and which are expected to apply when the related deferred income tax asset is realized or the deferred income tax liability is settled.
Keyera Corp. TSX: KEY 2017 Year End Report February 15, 2018
KEYERA CORP. Notes to annual consolidated financial statements
68
Deferred tax liabilities:
are generally recognized for all taxable temporary differences;
are not recognized for taxable temporary differences arising on investments in subsidiaries, associates and joint ventures, except where the reversal of the temporary difference can be controlled and it is probable that the difference will not reverse in the foreseeable future; and
are not recognized on temporary differences that arise from goodwill which is not deductible for tax purposes.
Deferred tax assets:
are recognized to the extent it is probable that taxable income will be available against which the deductible temporary differences can be utilized; and
are reviewed at the end of the reporting period and reduced to the extent that it is no longer probable that sufficient taxable profits will be available to allow all or part of the asset to be recovered.
Deferred tax assets and liabilities are not recognized in respect of temporary differences that arise on initial recognition of assets and liabilities acquired other than in a business combination. Deferred tax assets and liabilities are offset when there is a legally enforceable right to set off current tax assets against current tax liabilities and when they relate to income taxes levied by the same taxation authority and Keyera intends to settle its current tax assets and liabilities on a net basis.
Leases Leases are classified as finance leases whenever the terms of the lease transfer substantially all the risks and rewards of ownership to Keyera. Finance leases are capitalized at the commencement of the lease term at the lower of the fair value of the lease property or the present value of minimum lease payments and are included in property, plant and equipment. All other leases are classified as operating leases and are expensed to the consolidated statement of net earnings and comprehensive income based on the terms of the lease.
Finance costs Finance costs include interest expense on debt, interest charges related to finance leases, non-cash expense related to the unwinding of the debt discount, and non-cash accretion expense related to decommissioning liabilities, net of interest capitalized for qualifying projects and interest income. All finance costs are recognized in the consolidated statement of net earnings and comprehensive income in the period in which they are incurred.
Earnings per share Basic earnings per share are calculated by dividing net earnings by the weighted average number of shares outstanding during the period. For the calculation of the weighted average number, shares are determined to be outstanding from the date they are issued. Diluted earnings per share are calculated by adding the weighted average number of shares outstanding during the period to the additional shares that would have been outstanding if potentially dilutive shares had been issued as a result of any convertible debentures outstanding, using the “if converted” method. Accumulated deficit Accumulated deficit includes opening deficit, total comprehensive income for the period to date, and dividends declared to shareholders.
Keyera Corp. TSX: KEY 2017 Year End Report February 15, 2018
KEYERA CORP. Notes to annual consolidated financial statements
69
4. CRITICAL ACCOUNTING ESTIMATES AND JUDGMENTS In the application of Keyera’s accounting policies, management is required to make estimates and assumptions about the carrying amounts of assets and liabilities that are not readily apparent from other sources. The estimates and associated assumptions are based on historical experience and other factors that are considered to be relevant. Actual results may differ from the estimates. The most significant estimates and judgments contained in the consolidated financial statements are described below:
Allowance for doubtful accounts Keyera provides services and sells NGLs and iso-octane to a number of counterparties on credit terms. The allowance for credit losses is reviewed on a monthly basis. An assessment is made whether an account is deemed impaired based on the number of days outstanding and the likelihood of collection from the counterparty.
Depreciation of property, plant and equipment For purposes of determining depreciation, depletion and amortization expense, estimates and judgments are required to establish depreciation methods, useful lives, and residual values for Keyera’s assets. Determining depreciation methods requires management to make judgments that most appropriately reflect the pattern of an asset’s future economic benefit expected to be consumed by Keyera. For assets other than production assets, useful life estimates include management’s assumptions regarding the period over which the asset is expected to be available for use by the company. This includes assessing the assets’ physical and economic lives and, if applicable, may include an estimation of the associated reserve lives and production activity related to the assets’ respective capture areas. Production assets are depleted using the unit-of-production method based on estimated proved reserves, which are determined by Keyera’s independent qualified reserves evaluator. The estimation of reserves involves the exercise of professional judgment and is inherently subject to uncertainty. Changes in forward price estimates, production costs or recovery rates may change the economic status of reserves. Depreciation methods, useful lives and residual values are reviewed on an annual basis and, if necessary, any changes are accounted for prospectively.
Fair value estimates of property, plant and equipment Determination of the fair value of identifiable assets acquired in a business combination requires Keyera’s management to make assumptions and estimates about future events. The fair value of identifiable assets such as gathering and processing, storage and fractionation facilities, pipelines, terminals and other equipment is estimated with reference to the expected discounted future cash flows expected to be derived from the acquired assets. These assumptions and estimates generally require judgment and include estimates of future revenues, costs and discount rates. Changes in any of the assumptions or estimates used in determining the fair value of acquired assets and liabilities could impact the amounts assigned to the net assets acquired in a business combination.
Impairment of property, plant and equipment In determining the recoverable amount of assets, in the absence of quoted market prices, estimates are made regarding the present value of future cash flows. The useful lives of property, plant and equipment is determined by the present value of future cash flows. Future cash flow estimates are based on future production profiles and reserves for surrounding wells, commodity prices and costs. Estimates are also made in determining the discount rate used to calculate the present value of future cash flows.
Keyera Corp. TSX: KEY 2017 Year End Report February 15, 2018
KEYERA CORP. Notes to annual consolidated financial statements
70
Impairment of goodwill Determining whether goodwill is impaired requires an estimation of the value in use of the CGUs to which goodwill has been allocated. The value in use calculation requires management to estimate the future cash flows expected to arise from the CGU and the discount rate in order to calculate present value. The determination of CGUs is subject to management’s judgment.
Derivative financial instruments Keyera utilizes derivative financial instruments to manage its exposure to market risks relating to commodity prices and foreign currency exchange rates. Fair values of derivative contracts fluctuate depending on the underlying estimates of future commodity prices or foreign currency exchange rates. The estimated fair value of all derivative financial instruments are based on observable market data, including commodity price curves, foreign currency curves and credit spreads.
Long-term incentive plan liability
The LTIP is accounted for using the liability method and is measured at fair value. Determining the fair value requires management to estimate Keyera’s financial performance over a three-year period to determine the appropriate payout multiplier associated with the Performance Awards. The payout multiplier is based 70% on the average annual pre-tax distributable cash flow per share over the three- year period. The payout multiplier determines the number of shares expected to be settled following the third anniversary of the grant date of the Performance Awards.
Decommissioning liabilities Keyera estimates future site restoration costs for its gathering and processing, fractionation, iso-octane and storage facilities, pipelines and terminals. The ultimate costs are uncertain and cost estimates can vary in response to many factors including changes to relevant legal requirements, the emergence of new restoration techniques or experience at other processing sites.
Deferred tax assets and liabilities Deferred tax assets and liabilities require management’s judgment in determining the amounts to be recognized. In particular, judgment is used when assessing the extent to which deferred tax assets should be recognized with consideration given to the timing and level of future taxable income. To the extent estimates differ from the final tax return, earnings would be affected in a subsequent period.
Operating revenues and operating expenses a) Gathering and Processing and Liquids Infrastructure: Each month, actual volumes processed and fees earned from the Gathering and Processing and Liquids Infrastructure assets are not known until the following month. In addition, the period in which invoices are rendered for the supply of goods and services necessary for the operation of the Gathering and Processing and Liquids Infrastructure assets is generally later than the period in which the goods or services were provided. Estimates of one month’s revenue and one month’s operating costs are recorded in the consolidated financial statements based upon a review of historical trends that is adjusted for events that are known to have a significant effect on the month’s operations.
b) Marketing: Marketing sales revenue is recorded based on actual volumes and prices. However, in many cases actual volumes have not yet been confirmed and sales prices that are dependent on other variables are not yet known. In addition, the majority of NGL supply purchases are estimated each month as actual volume information is not available until the following month. At the end of the period, estimates for sales and purchases are recorded in the consolidated financial statements. Estimates are prepared based on contracted volumes and known events.

Keyera Corp. TSX: KEY 2017 Year End Report February 15, 2018
KEYERA CORP. Notes to annual consolidated financial statements
71
Equalization Adjustments Much of the revenue from the Gathering and Processing segment includes a recovery of operating costs. Users of each facility are charged a fee per unit based upon estimated costs and throughput, with an adjustment to actual throughput completed after the end of the year. On a quarterly basis, throughput volumes and operating costs are reviewed and adjustments are made to revenue and operating expenses based on actual operating costs incurred to date.
5. FUTURE ACCOUNTING PRONOUNCEMENTS IFRS 9, Financial Instruments IFRS 9 is now the standard which sets out the recognition and measurement requirements for financial instruments and some contracts to buy or sell non-financial items. IFRS 9 provides a single model of classifying and measuring financial assets and liabilities, and provides for only two classification categories: amortized cost and fair value. Hedge accounting requirements have also been updated in the new standard and are now more aligned with the risk management activities of an entity. IFRS 9 is effective for annual periods beginning on or after January 1, 2018. Early adoption is permitted; however, if an entity elects to apply this standard early, it must disclose that fact and apply all of the requirements in this standard at the same time. Expected Impact Keyera has reviewed the standard to determine whether there would be any changes to how Keyera currently recognizes and measures financial instruments. Based on Keyera’s assessment, there would not be any differences to its consolidated financial statements upon the adoption of IFRS 9 on January 1, 2018 with respect to the recognition and measurement of financial instruments. Keyera currently does not follow hedge accounting to reflect its risk management activities. IFRS 15, Revenue from Contracts with Customers In May 2014, the IASB issued IFRS 15, Revenue from Contracts with Customers, the new standard which sets out the recognition and measurement requirements for reporting the nature, amount, timing and uncertainty of revenue and cash flows arising from an entity’s contracts with customers. IFRS 15 supersedes:
a) IAS 11 Construction Contracts; b) IAS 18 Revenue; c) IFRIC 13 Customer Loyalty Programmes; d) IFRIC 15 Agreements for the Construction of Real Estate; e) IFRIC 18 Transfers of Assets from Customers; and f) SIC-31 Revenue – Barter Transactions Involving Advertising Services.
IFRS 15 also provides guidance for the recognition and measurement of gains and losses on the sale of certain non-financial assets, such as property, plant and equipment. The standard is required to be adopted either retrospectively or using a modified retrospective transition approach for fiscal years beginning on or after January 1, 2018, with earlier adoption permitted. Expected Impact Keyera has developed an implementation plan, identifying the contracts and arrangements which will fall within the scope of IFRS 15. Major contract types and revenue streams have been determined, and the review of relevant revenue contracts which are within the scope of IFRS 15 has been completed. The majority of the company’s long-term revenue contracts reside in the Liquids Infrastructure reportable segment. Performance obligations have been identified for these contracts based on services or series of distinct services performed under the agreements. Keyera is in the process of concluding its detailed assessment of the adoption of IFRS 15. This includes finalizing the evaluation of (i) recognition and measurement of revenue on Keyera’s consolidated financial

Keyera Corp. TSX: KEY 2017 Year End Report February 15, 2018
KEYERA CORP. Notes to annual consolidated financial statements
72
statements; (ii) company policies and business practices; (iii) internal controls; and (iv) significant judgments and estimations required. Keyera is also currently compiling the disclosures required for transition to IFRS 15. Based on the review and analysis of its revenue contracts, Keyera anticipates that implementation will not materially affect the amount and timing of its revenue recognition. Furthermore, Keyera does not anticipate any changes to its information technology systems, key operating metrics or financial covenants as a result of the adoption of IFRS 15. Keyera has decided that it will implement the standard using the full retrospective approach, including the election of allowable practical expedients upon adoption on January 1, 2018.
IFRS 16, Leases In January 2016, the IASB issued IFRS 16, Leases, which provides a single lease accounting model for lessees, which require the recognition of most leases as finance leases on the statement of financial position. This will result in the recognition of a lease liability and a corresponding recognition of a leased asset called right-of-use asset. On the consolidated statement of net earnings and comprehensive income, lease expense will be recognized and will consist of two components, depreciation expense of the right-of-use asset and interest expense related to the lease liability. Finance lease exemptions exist for short-term leases where the term is 12 months or less and for leases of low value items. For lessors, the accounting treatment remains the same which provides a lessor the choice of classifying a lease as either a finance or operating lease. IFRS 16 comes into effect on January 1, 2019. Expected impact Keyera is currently in the process of developing a detailed implementation plan and has commenced its assessment of existing contracts to identify arrangements that would qualify as a lease under the new standard. Once all contracts within the scope of IFRS 16 have been identified, Keyera will assess the effect of adoption on its consolidated financial statements, and will address any necessary changes to its policies, processes, internal controls, information technology systems, key operating metrics, financial covenants, and significant judgments and estimation. Amendments to IFRS 2, Share-based Payment In June 2016, the IASB issued amendments to IFRS 2, Share-based Payment which is to be applied to annual reporting periods beginning on or after January 1, 2018 with early adoption permitted. The amendments clarify how to classify and measure certain types of share-based payment transactions. Expected impact The application of the amendment will not have an effect on Keyera’s consolidated financial statements upon adoption on January 1, 2018. IFRIC 22, Foreign Currency Transactions and Advance Consideration In December 2016, the IFRS Interpretations Committee (IFRIC) issued IFRIC 22, Foreign Currency Transactions and Advance Consideration, an interpretation that clarifies the requirements in IAS 21, The Effects of Changes in Foreign Exchange Rates. Specifically, IFRIC 22 addresses transactions that include the receipt or payment of advance consideration in a foreign currency. Previously, when non-monetary assets or non-monetary liabilities arising from the payment or receipt of advance consideration were recognized before recognition of the asset, expense or income it related to, there was diversity in practice regarding the exchange rate used to translate the related item. IFRIC 22 clarifies that for the purpose of determining this exchange rate, the date of transaction is the date of initial recognition of the non-monetary asset or non-monetary liability arising from the advance consideration. If a transaction

Keyera Corp. TSX: KEY 2017 Year End Report February 15, 2018
KEYERA CORP. Notes to annual consolidated financial statements
73
involves multiple payments or receipts of advance consideration, an entity shall determine a separate date of transaction for each payment or receipt. IFRIC 22 is applicable for annual periods beginning on or after January 1, 2018 with early adoption permitted. This interpretation can be adopted either retrospectively or prospectively to all assets, expenses and income in the scope of the interpretation initially recognized on or after: (i) the beginning of the reporting period in which the entity first applies the interpretation; or (ii) the beginning of a prior reporting period presented as comparative information. Expected impact Upon prospective adoption of IFRIC 22 on January 1, 2018, the application of this interpretation did not have an effect on Keyera’s consolidated financial statements.
6. BUSINESS COMBINATION In August 2016, Keyera completed its acquisition of an additional 35% ownership interest in the O’Chiese Nees-Ohpawganu’ck gas plant (“Alder Flats”) and associated gathering pipelines (collectively the “Facilities”) from Bellatrix Exploration Ltd. (“Bellatrix”). Before this transaction, Keyera’s existing ownership interest was 35% in the Facilities, bringing Keyera’s total ownership interest in the Facilities to 70%. The acquisition was recorded as a business combination under IFRS 3, Business Combinations, and there was not a change in control as a result of the transaction. As the Facilities are jointly controlled, they continued to be accounted for as a joint operation. Total consideration for the fair value acquisition was $112,500. Of the total consideration, $27,125 was a prepayment for future construction costs related to the phase two expansion of Alder Flats, while $86,080 related to a 35% working interest in the existing plant, processing equipment, gathering lines, and costs incurred to date on the phase two expansion. Decommissioning liabilities of $705 were assumed in the acquisition. No goodwill was recognized on this business combination. The prepayment of $27,125 was allocated to Other Assets while the remaining balance of $86,080 was allocated to Property, Plant and Equipment on the consolidated statement of financial position. Within Property, Plant and Equipment, the amount resides in the general plant and processing equipment component group. At December 31, 2017, the prepayment amount residing in Other Assets was $8,878 (2016 – $22,857) (see note 9) while the amount residing in Property, Plant and Equipment was $104,327 (2016 – $90,348). These amounts relate specifically to this business combination of the above Facilities.

Keyera Corp. TSX: KEY 2017 Year End Report February 15, 2018
KEYERA CORP. Notes to annual consolidated financial statements
74
7. TRADE AND OTHER RECEIVABLES
As at December 31, 2017
$ 2016
$
Trade and accrued receivables 438,846 368,114 Allowance for doubtful accounts: Balance at beginning of the period (4,033) (4,033) Impairment losses – trade receivables 807 —
Balance at the end of the period (3,226) (4,033)
Total trade and accrued receivables 435,620 364,081
In determining the recoverability of a trade receivable, Keyera considers any change in the credit quality of the trade receivable from the date credit was initially granted up to the reporting date in addition to normal credit risks associated with entities in the oil and gas industry. The allowance for doubtful accounts is reviewed on a monthly basis. An assessment is made whether an account is deemed impaired based on the number of days outstanding and the likelihood of collection from the counterparty. The concentration of credit risk is mitigated by having a broad domestic and international customer base.
Trade receivables are non-interest bearing and are generally on 5 to 30 day terms which are classified as neither past due or impaired in the aging analysis below.
Aging of receivables that are not impaired As at December 31,
2017 $
2016 $
Neither past due or impaired 434,154 361,919 Past due 31 to 60 days 1,466 2,162 Past due over 60 days — —
Total trade and accrued receivables 435,620 364,081
8. INVENTORY
The total carrying amount and classification of inventory was as follows: 2017 2016
As at December 31, $ $
NGLs and iso-octane 142,356 103,233 Other 5,475 4,643
Total inventory 147,831 107,876
For the year ended December 31, 2017, $147,831 (2016 – $107,876) of inventory was carried at cost and $nil (2016 – $nil) was carried at net realizable value. The cost of inventory expensed for the year ended December 31, 2017 was $2,273,478 (2016 – $1,457,686).

Keyera Corp. TSX: KEY 2017 Year End Report February 15, 2018
KEYERA CORP. Notes to annual consolidated financial statements
75
9. OTHER ASSETS
2017
2016 As at December 31, $ $
Prepaid deposits 608 615 Other 15,996 85,177
Other assets 16,604 85,792 Less: long-term portion of other assets — (4,200)
Total current other assets 16,604 81,592
Included in other assets are funds advanced to a joint venture partner for the construction of the expansion phase on an existing gas plant jointly owned by Keyera and the joint venture partner. As at December 31, 2017, $8,878 of the advanced funding remained in current other assets (2016 – $18,657) and $nil in the long-term portion of other assets (2016 – $4,200). At December 31, 2016, $55,054 was recorded in other assets which related to a prepayment made by Keyera for the acquisition of 1,290 acres of undeveloped land in the Fort Saskatchewan area.
10. PROPERTY, PLANT, AND EQUIPMENT Cost
General plant & processing
equipment $
Other
properties &
equipment $
Turnarounds $
Land & linefill
$
Total $
Balance at December 31, 2015 4,423,241 168,516
205,213 89,867 4,886,837
Additions 655,972 29,986 29,453 19,062 734,473 Other: Finance lease asset 54,234 —
— — 54,234
Decommissioning asset (15,350) — — — (15,350)
Balance at December 31, 2016 5,118,097 198,502
234,666 108,929 5,660,194
Additions 684,146 12,234 16,457 61,257 774,094
Disposals (49,271) — (2,152) — (51,423)
Decommissioning asset 5,965 — — — 5,965
Balance at December 31, 2017 5,758,937 210,736
248,971 170,186 6,388,830

Keyera Corp. TSX: KEY 2017 Year End Report February 15, 2018
KEYERA CORP. Notes to annual consolidated financial statements
76
Accumulated depreciation, depletion and impairment
General plant & processing
equipment $
Other
properties &
equipment $
Turnarounds $
Land & linefill
$
Total $
Balance at December 31, 2015 (1,011,456) (126,200) (136,463) (2,291) (1,276,410)
Net impairment expense (12,270) — — — (12,270) Depreciation and depletion expenses (106,342) (19,018) (29,596) — (154,956)
Decommissioning asset (16,074) — — — (16,074)
Balance at December 31, 2016 (1,146,142) (145,218) (166,059) (2,291) (1,459,710)
Impairment expense (14,521) (918) (5,391) — (20,830) Depreciation and depletion expenses (96,979) (18,810) (31,163) — (146,952)
Disposals 48,691 — 1,394 50,085
Decommissioning asset (19,025) — — — (19,025) Balance at December 31, 2017 (1,227,976) (164,946) (201,219) (2,291) (1,596,432)
Carrying value
General plant & processing
equipment $
Other
properties &
equipment $
Turnarounds $
Land & linefill
$
Total $
As at December 31, 2016 3,971,955 53,284 68,607 106,638 4,200,484
As at December 31, 2017 4,530,961 45,790 47,752 167,895 4,792,398
Property, plant and equipment under construction included in carrying value Cost
$
As at December 31, 2016
770,816
As at December 31, 2017
829,453
Assets under finance leases included in carrying value
As at December 31,
2017 $
As at December 31,
2016 $
General plant & processing equipment 45,233 45,233 Land 9,001 9,001
Total finance lease assets 54,234 54,234
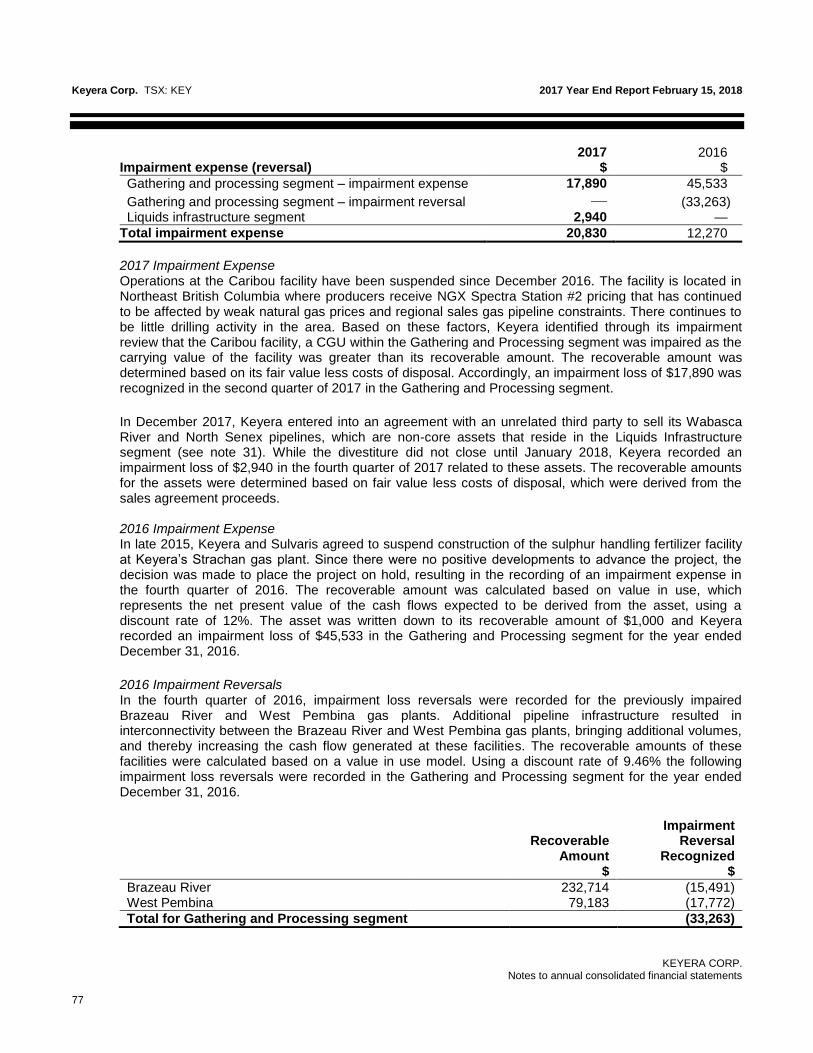
Keyera Corp. TSX: KEY 2017 Year End Report February 15, 2018
KEYERA CORP. Notes to annual consolidated financial statements
77
2017 2016 Impairment expense (reversal) $ $
Gathering and processing segment – impairment expense 17,890 45,533
Gathering and processing segment – impairment reversal — (33,263) Liquids infrastructure segment 2,940 —
Total impairment expense 20,830 12,270
2017 Impairment Expense Operations at the Caribou facility have been suspended since December 2016. The facility is located in Northeast British Columbia where producers receive NGX Spectra Station #2 pricing that has continued to be affected by weak natural gas prices and regional sales gas pipeline constraints. There continues to be little drilling activity in the area. Based on these factors, Keyera identified through its impairment review that the Caribou facility, a CGU within the Gathering and Processing segment was impaired as the carrying value of the facility was greater than its recoverable amount. The recoverable amount was determined based on its fair value less costs of disposal. Accordingly, an impairment loss of $17,890 was recognized in the second quarter of 2017 in the Gathering and Processing segment.
In December 2017, Keyera entered into an agreement with an unrelated third party to sell its Wabasca River and North Senex pipelines, which are non-core assets that reside in the Liquids Infrastructure segment (see note 31). While the divestiture did not close until January 2018, Keyera recorded an impairment loss of $2,940 in the fourth quarter of 2017 related to these assets. The recoverable amounts for the assets were determined based on fair value less costs of disposal, which were derived from the sales agreement proceeds. 2016 Impairment Expense In late 2015, Keyera and Sulvaris agreed to suspend construction of the sulphur handling fertilizer facility at Keyera’s Strachan gas plant. Since there were no positive developments to advance the project, the decision was made to place the project on hold, resulting in the recording of an impairment expense in the fourth quarter of 2016. The recoverable amount was calculated based on value in use, which represents the net present value of the cash flows expected to be derived from the asset, using a discount rate of 12%. The asset was written down to its recoverable amount of $1,000 and Keyera recorded an impairment loss of $45,533 in the Gathering and Processing segment for the year ended December 31, 2016.
2016 Impairment Reversals In the fourth quarter of 2016, impairment loss reversals were recorded for the previously impaired Brazeau River and West Pembina gas plants. Additional pipeline infrastructure resulted in interconnectivity between the Brazeau River and West Pembina gas plants, bringing additional volumes, and thereby increasing the cash flow generated at these facilities. The recoverable amounts of these facilities were calculated based on a value in use model. Using a discount rate of 9.46% the following impairment loss reversals were recorded in the Gathering and Processing segment for the year ended December 31, 2016.
Recoverable Amount
Impairment Reversal
Recognized $ $
Brazeau River 232,714 (15,491) West Pembina 79,183 (17,772)
Total for Gathering and Processing segment (33,263)

Keyera Corp. TSX: KEY 2017 Year End Report February 15, 2018
KEYERA CORP. Notes to annual consolidated financial statements
78
Disposal of property, plant and equipment In the second quarter of 2017, Keyera disposed of the Paddle River facility and the Judy Creek natural gas pipeline for total proceeds of $6,000, which resulted in a gain of $20,447 as the buyer assumed the related decommissioning liabilities associated with these pipelines. The Paddle River facility had been shut down since February 2015 and the Judy Creek natural gas pipeline was non-operational and a non-core asset within Keyera’s Gathering and Processing segment. Change in accounting estimate In the fourth quarter of 2016, Keyera conducted a review of the useful life of its assets. Based on this review, the useful life of several facilities was extended, including the Simonette and Rimbey gas plants as well as assets within Keyera’s Liquids Infrastructure segment. This change in estimate was effective October 1, 2016 and was accounted for on a prospective basis.
11. GOODWILL
2017 2016 Cost and Carrying Value as at December 31, $ $
Balance at end of the year 53,624 53,624
Impairment test of goodwill Keyera performed its annual test for goodwill impairment at December 31, 2017, in accordance with its policy described in note 3. Keyera assessed the recoverable amount of goodwill and determined that goodwill was not impaired.
Allocation of goodwill to cash-generating units For the purpose of impairment testing, goodwill is allocated to Keyera’s CGUs which represent the lowest level within Keyera at which the goodwill is monitored for internal management purposes. The carrying amount of goodwill was allocated to CGUs as follows: As at December 31,
2017 $
2016 $
Liquids infrastructure facilities 32,015 32,015 Rimbey gas plant 12,810 12,810 Simonette gas plant 8,799 8,799 Total goodwill 53,624 53,624
The recoverable amount for Keyera’s CGUs was determined based on a value in use calculation. Value in use was calculated by discounting future cash flow projections that are based on Keyera’s internal budget. Keyera projected cash flows for a period of five years, and then applied a perpetual long-term declining rate thereafter. In arriving at its forecasts, Keyera considered past experience, economic trends such as inflation as well as industry and market trends. The discount rate used in the calculation of value in use represented a weighted average cost of capital (“WACC”). The WACC is an estimate of the overall required rate of return on an investment for both debt and equity owners and serves as the basis for developing an appropriate discount rate. Determination of the WACC requires separate analysis of the cost of equity and debt, and considers a risk premium based on an assessment of risks related to the projected cash flows of each CGU. The discount rate used for

Keyera Corp. TSX: KEY 2017 Year End Report February 15, 2018
KEYERA CORP. Notes to annual consolidated financial statements
79
the Liquids Infrastructure CGU and the Rimbey and Simonette gas plant CGUs was 9.27% at December 31, 2017 (December 31, 2016 – 9.46% for the same CGUs).
12. TRADE AND OTHER PAYABLES The components of trade and other payables were as follows:
As at December 31,
2017
$
2016
$
Trade and accrued payables 505,814 363,287 Other payables 16,161 12,360 Current portion of long-term incentive plan 5,196 24,429 Current income taxes payable 698 — Total trade and other payables 527,869 400,076
13. LONG-TERM DEBT
Carrying value Amounts recorded in the consolidated financial statements are referred to as carrying value. The carrying value of debt is reflected in current debt and long-term debt on the statement of financial position. Fair value The fair value of long-term debt is based on third party estimates for similar issues or current rates offered to Keyera for debt of the same maturity. The fair value of Keyera’s senior unsecured notes at December 31, 2017, as noted below was determined by reference to valuation inputs under Level 2 of the fair value hierarchy as referenced in note 21.
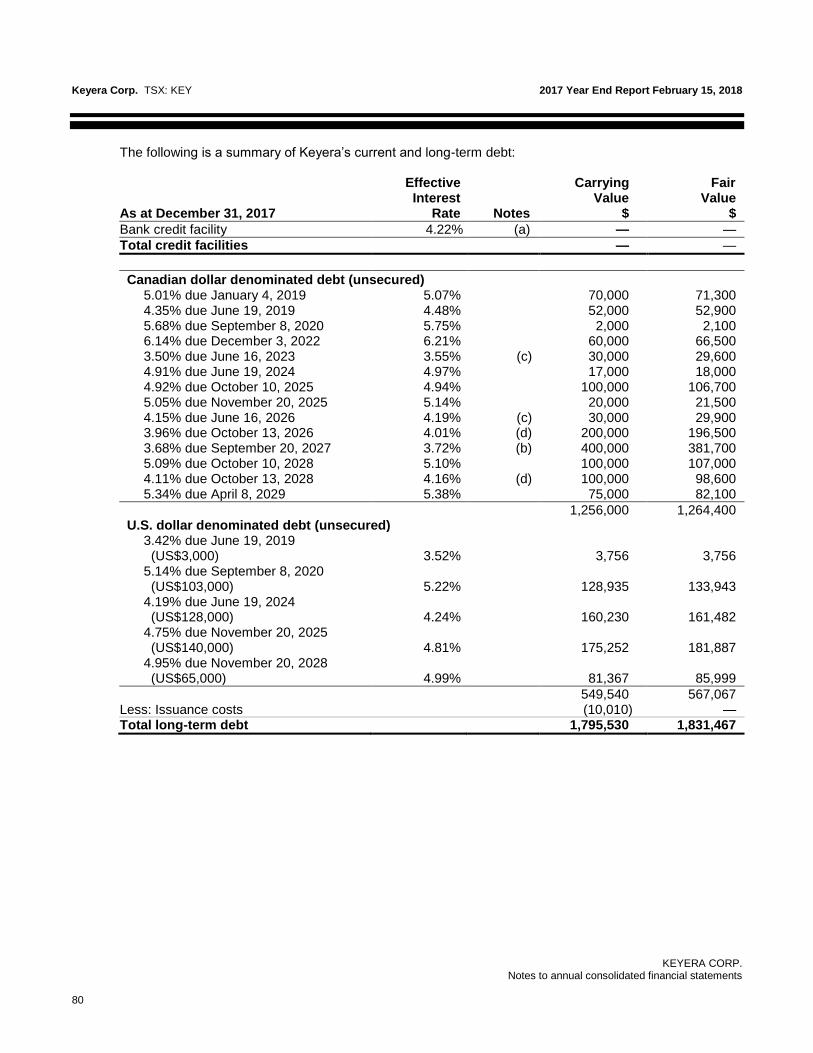
Keyera Corp. TSX: KEY 2017 Year End Report February 15, 2018
KEYERA CORP. Notes to annual consolidated financial statements
80
The following is a summary of Keyera’s current and long-term debt:
As at December 31, 2017
Effective Interest
Rate
Notes
Carrying Value
$
Fair Value
$
Bank credit facility 4.22% (a) — —
Total credit facilities — —
Canadian dollar denominated debt (unsecured) 5.01% due January 4, 2019 5.07% 70,000 71,300 4.35% due June 19, 2019 4.48% 52,000 52,900 5.68% due September 8, 2020 5.75% 2,000 2,100 6.14% due December 3, 2022 6.21% 60,000 66,500 3.50% due June 16, 2023 3.55% (c) 30,000 29,600 4.91% due June 19, 2024 4.97% 17,000 18,000 4.92% due October 10, 2025 4.94% 100,000 106,700 5.05% due November 20, 2025 5.14% 20,000 21,500 4.15% due June 16, 2026 4.19% (c) 30,000 29,900 3.96% due October 13, 2026 4.01% (d) 200,000 196,500 3.68% due September 20, 2027 3.72% (b) 400,000 381,700 5.09% due October 10, 2028 5.10% 100,000 107,000 4.11% due October 13, 2028 4.16% (d) 100,000 98,600 5.34% due April 8, 2029 5.38% 75,000 82,100
1,256,000 1,264,400 U.S. dollar denominated debt (unsecured)
3.42% due June 19, 2019 (US$3,000)
3.52%
3,756
3,756
5.14% due September 8, 2020 (US$103,000)
5.22%
128,935
133,943
4.19% due June 19, 2024 (US$128,000)
4.24%
160,230
161,482
4.75% due November 20, 2025 (US$140,000)
4.81%
175,252
181,887
4.95% due November 20, 2028 (US$65,000)
4.99%
81,367
85,999
549,540 567,067 Less: Issuance costs (10,010) — Total long-term debt 1,795,530 1,831,467
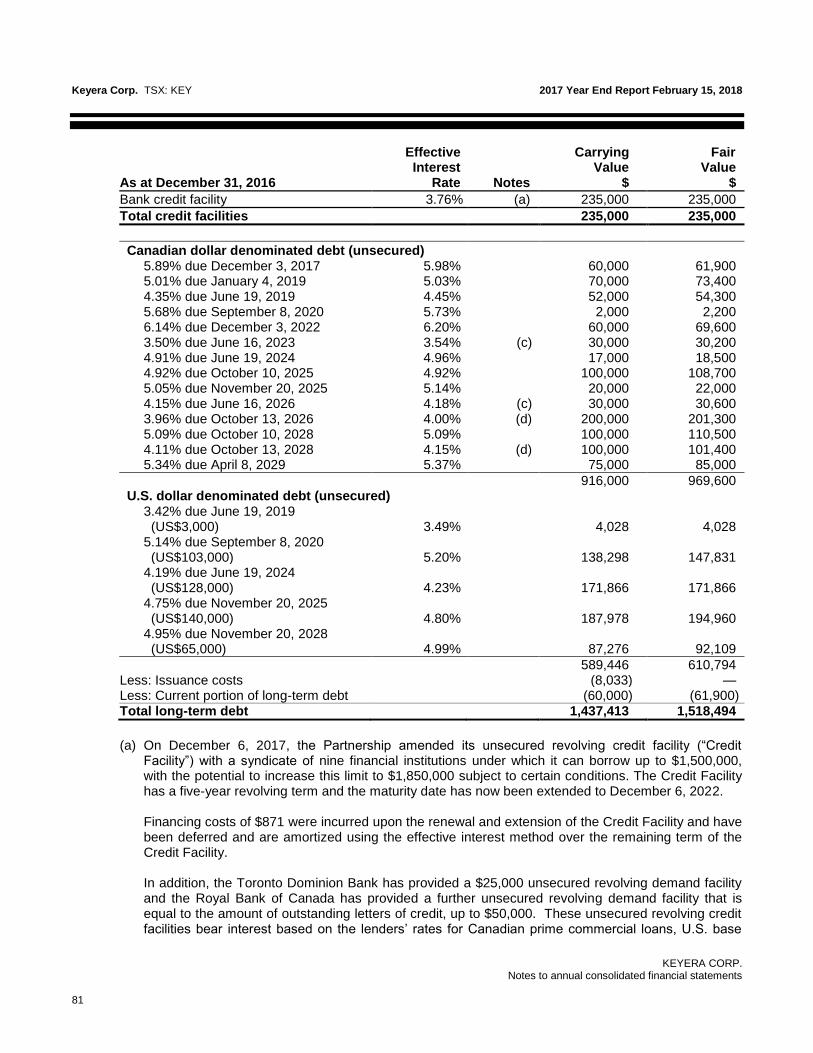
Keyera Corp. TSX: KEY 2017 Year End Report February 15, 2018
KEYERA CORP. Notes to annual consolidated financial statements
81
As at December 31, 2016
Effective Interest
Rate
Notes
Carrying Value
$
Fair Value
$
Bank credit facility 3.76% (a) 235,000 235,000
Total credit facilities 235,000 235,000
Canadian dollar denominated debt (unsecured) 5.89% due December 3, 2017 5.98% 60,000 61,900 5.01% due January 4, 2019 5.03% 70,000 73,400 4.35% due June 19, 2019 4.45% 52,000 54,300 5.68% due September 8, 2020 5.73% 2,000 2,200 6.14% due December 3, 2022 6.20% 60,000 69,600 3.50% due June 16, 2023 3.54% (c) 30,000 30,200 4.91% due June 19, 2024 4.96% 17,000 18,500 4.92% due October 10, 2025 4.92% 100,000 108,700 5.05% due November 20, 2025 5.14% 20,000 22,000 4.15% due June 16, 2026 4.18% (c) 30,000 30,600 3.96% due October 13, 2026 4.00% (d) 200,000 201,300 5.09% due October 10, 2028 5.09% 100,000 110,500 4.11% due October 13, 2028 4.15% (d) 100,000 101,400 5.34% due April 8, 2029 5.37% 75,000 85,000
916,000 969,600 U.S. dollar denominated debt (unsecured)
3.42% due June 19, 2019 (US$3,000)
3.49%
4,028
4,028
5.14% due September 8, 2020 (US$103,000)
5.20%
138,298
147,831
4.19% due June 19, 2024 (US$128,000)
4.23%
171,866
171,866
4.75% due November 20, 2025 (US$140,000)
4.80%
187,978
194,960
4.95% due November 20, 2028 (US$65,000)
4.99%
87,276
92,109
589,446 610,794 Less: Issuance costs (8,033) — Less: Current portion of long-term debt (60,000) (61,900) Total long-term debt 1,437,413 1,518,494
(a) On December 6, 2017, the Partnership amended its unsecured revolving credit facility (“Credit
Facility”) with a syndicate of nine financial institutions under which it can borrow up to $1,500,000, with the potential to increase this limit to $1,850,000 subject to certain conditions. The Credit Facility has a five-year revolving term and the maturity date has now been extended to December 6, 2022.
Financing costs of $871 were incurred upon the renewal and extension of the Credit Facility and have been deferred and are amortized using the effective interest method over the remaining term of the Credit Facility.
In addition, the Toronto Dominion Bank has provided a $25,000 unsecured revolving demand facility and the Royal Bank of Canada has provided a further unsecured revolving demand facility that is equal to the amount of outstanding letters of credit, up to $50,000. These unsecured revolving credit facilities bear interest based on the lenders’ rates for Canadian prime commercial loans, U.S. base

Keyera Corp. TSX: KEY 2017 Year End Report February 15, 2018
KEYERA CORP. Notes to annual consolidated financial statements
82
rate loans, LIBOR loans, or bankers’ acceptances. As at December 31, 2017, outstanding letters of
credit issued were $10,680 (December 31, 2016 – $11,359).
(b) On September 20, 2017, Keyera closed a private placement of 10-year senior unsecured notes with a
group of institutional investors in Canada and the U.S. The $400,000 senior unsecured notes bear interest at 3.68% and mature on September 20, 2027. Interest is paid semi-annually.
Financing costs of approximately $1,560 have been deferred and are amortized using the effective interest method over the remaining term of the debt.
(c) On June 3, 2016, Keyera issued $60,000 in long-term notes in two tranches pursuant to the
Prudential uncommitted shelf facility
$30,000 bearing interest at 3.50% maturing on June 16, 2023; and
$30,000 bearing interest at 4.15% maturing on June 16, 2026.
On December 15, 2016, Keyera renewed and revised its unsecured uncommitted shelf facility with the Prudential Capital Group (“Prudential”) providing Keyera the ability to borrow up to US$375,000 less any amount committed by Prudential on certain previous debt offerings issued by Keyera.
Financing costs of approximately $215 have been deferred and are amortized using the effective interest method over the remaining terms of the related debt. Previous draw downs on the amended Prudential shelf facility were as follows:
$70,000 bearing interest at 5.01% maturing on January 4, 2019;
$100,000 bearing interest at 4.92% maturing on October 10, 2025; and
$100,000 bearing interest at 5.09% maturing on October 10, 2028.
As at December 31, 2017, there was approximately US$52,000 of capacity remaining under the amended shelf facility that matures on December 15, 2019.
(d) On October 13, 2016, Keyera closed a private placement of 10-year and 12-year senior unsecured
notes totaling $300,000 with a group of institutional investors in Canada and the U.S. The senior notes were issued in two tranches with $200,000 bearing interest at 3.96% and maturing on October 13, 2026 and $100,000 bearing interest at 4.11% and maturing on October 13, 2028. Interest will be paid semi-annually.
Financing costs of approximately $1,515 have been deferred and are amortized using the effective interest method over the remaining terms of the related debt.
14. DECOMMISSIONING LIABILITY
Keyera estimates the future costs of decommissioning for its gathering and processing, fractionation, iso-octane and storage facilities, pipelines and terminals on a discounted basis upon acquisition or installation of these assets. The total undiscounted amount of cash flows required to settle the decommissioning liability is $846,391 (2016 – $895,330) which has been discounted using a risk-free rate of 2.26% (2016 – 2.31%). These costs are generally expected to be incurred over the next 25 to 45 years. While the provision is based on the best estimate of future costs and the economic lives of the facilities and pipelines, there is uncertainty regarding the amount and timing of these costs. No assets have been legally restricted for settlement of the liability.

Keyera Corp. TSX: KEY 2017 Year End Report February 15, 2018
KEYERA CORP. Notes to annual consolidated financial statements
83
The following is a reconciliation of the beginning and ending carrying amount of the obligation associated with the decommissioning of Keyera’s assets: 2017 2016 As at December 31, $ $
Decommissioning liability, beginning of the period 476,199 485,046 Liabilities acquired 581 1,110 Liabilities disposed (15,768) — Liabilities settled (10,790) (4,249) Revision in estimated cash flows (674) 54,832 Revision due to change in useful lives — (53,822) Revision due to change in discount rate 6,058 (17,470) Unwinding of discount included in finance costs 10,433 10,752
466,039 476,199
Less: Current portion of decommissioning liability (9,584) (11,960)
Long-term portion of decommissioning liability 456,455 464,239
15. OTHER LIABILITIES
2017 2016 As at December 31, $ $
Finance lease liabilities 54,029 54,218 Less: Current portion of finance lease liabilities (1,474) (189)
Long-term portion of finance lease liabilities 52,555 54,029 Long-term incentive plan 6,367 3,434
Total other liabilities 58,922 57,463
In 2015, Keyera entered into an arrangement for the use of a pipeline for transportation services in the Edmonton/Fort Saskatchewan area. The substance of the initial arrangement was determined to contain a lease and was classified as an operating lease. Subsequently, in September of 2016, Keyera finalized an agreement to purchase a segment of the pipeline. The remaining portion of pipeline continues to be leased. The terms of the initial arrangement were amended and reassessed under the requirements of IFRIC 4, Determining Whether an Arrangement Contains a Lease and IAS 17, Leases. Effective December 1, 2016, the arrangement was classified as a finance lease as this was the date Keyera was entitled to exercise its right to use the pipeline for its sole benefit and the risks and rewards incidental to ownership were transferred to Keyera.
Within 1 year
After 1 year but no later than 5
years
Later than 5 years
Total
2017 2016 2017 2016 2017 2016 2017 2016 $ $ $ $ $ $ $ $
Interest payments 3,026 2,061 12,184 12,379 18,015 20,842 33,225 35,282 Future minimum lease payments 4,500 2,250 21,000 20,250 61,754 67,000 87,254 89,500 Present value of minimum lease payments 1,474 189 8,816 7,871 43,739 46,158 54,029 54,218

Keyera Corp. TSX: KEY 2017 Year End Report February 15, 2018
KEYERA CORP. Notes to annual consolidated financial statements
84
16. INCOME TAXES
The components of the tax expense were as follows:
2017 $
2016 $
Current income taxes Current income tax charge 6,176 16,810 Adjustments with respect to current income tax of the previous year (761) (1,438)
Current income tax expense 5,415 15,372
Deferred income taxes Related to the origination and reversal of temporary differences 100,143 74,232 Adjustments to opening deferred tax balances (760) 874
Deferred income tax expense 99,383 75,106
Total income tax expense 104,798 90,478
The following is a reconciliation of income taxes, calculated at the combined federal and provincial income tax rate, to the income tax provision included in the consolidated statement of net earnings and comprehensive income.
Reconciliation of income tax expense 2017
$ 2016
$
Earnings before income tax 394,718 307,329
Income tax at statutory rate of 27% (2016 – 27%) 106,574 82,979 Increase in valuation allowance 5,800 7,822 Non-deductible items excluded from income for tax purposes (3,657) (1,563) Tax rate differences and adjustments (1,655) (540) Adjustments to tax pool balances (1,521) (564) Other (743) 2,344
Total income tax expense 104,798 90,478

Keyera Corp. TSX: KEY 2017 Year End Report February 15, 2018
KEYERA CORP. Notes to annual consolidated financial statements
85
Deferred income tax balances The deferred tax (liabilities) assets relate to losses and to the (taxable) deductible temporary differences in the carrying values and tax bases as follows:
Balance at December 31,
2017
Deferred income tax recognized
on the consolidated statement of net earnings
Deferred income tax
related to share
issuance costs
Balance at December 31,
2016 $ $ $ $
Deferred tax liabilities Property, plant and equipment (616,817) (63,116) — (553,701) Decommissioning liabilities 125,621 (3,078) — 128,699 Long-term incentive plan 3,571 (3,959) — 7,530 Non-capital losses 1,632 (2,637) — 4,269 Intangible assets 6,191 (7,055) 5,263 7,983 Partnership deferral (21,393) (21,393) — — Finance lease liabilities 14,624 (15) — 14,639 Other 4,338 1,870 — 2,468
Total deferred tax liabilities (482,233) (99,383) 5,263 (388,113)
Balance at December 31,
2016
Deferred income tax recognized
on the consolidated statement of net earnings
Deferred income tax
related to share
issuance costs
Balance at December 31,
2015 $ $ $ $
Deferred tax liabilities Property, plant and equipment (553,701) (108,870) — (444,831) Decommissioning liabilities 128,699 (2,337) — 131,036 Long-term incentive plan 7,530 (3,309) — 10,839 Non-capital losses 4,269 1,423 — 2,846 Intangible assets 7,983 1,727 3,845 2,411 Partnership deferral — 15,914 — (15,914) Finance lease liabilities 14,639 14,639 — — Other 2,468 5,707 — (3,239)
Total deferred tax liabilities (388,113) (75,106) 3,845 (316,852)
Deferred tax assets are recognized for tax loss carry-forwards to the extent that the realization of the related tax benefit through future taxable profits is probable. The ability to realize the tax benefits of these losses is dependent upon a number of factors, including the future profitability of operations in the jurisdictions in which the tax losses arose. As at December 31, 2017, Keyera and its subsidiaries have non-capital losses carried forward of $72,649 (2016 – $49,348) which are available to offset income of specific entities of the consolidated group in future periods. The amount of unrecognized non-capital losses at December 31, 2017 is $48,163 (2016 –
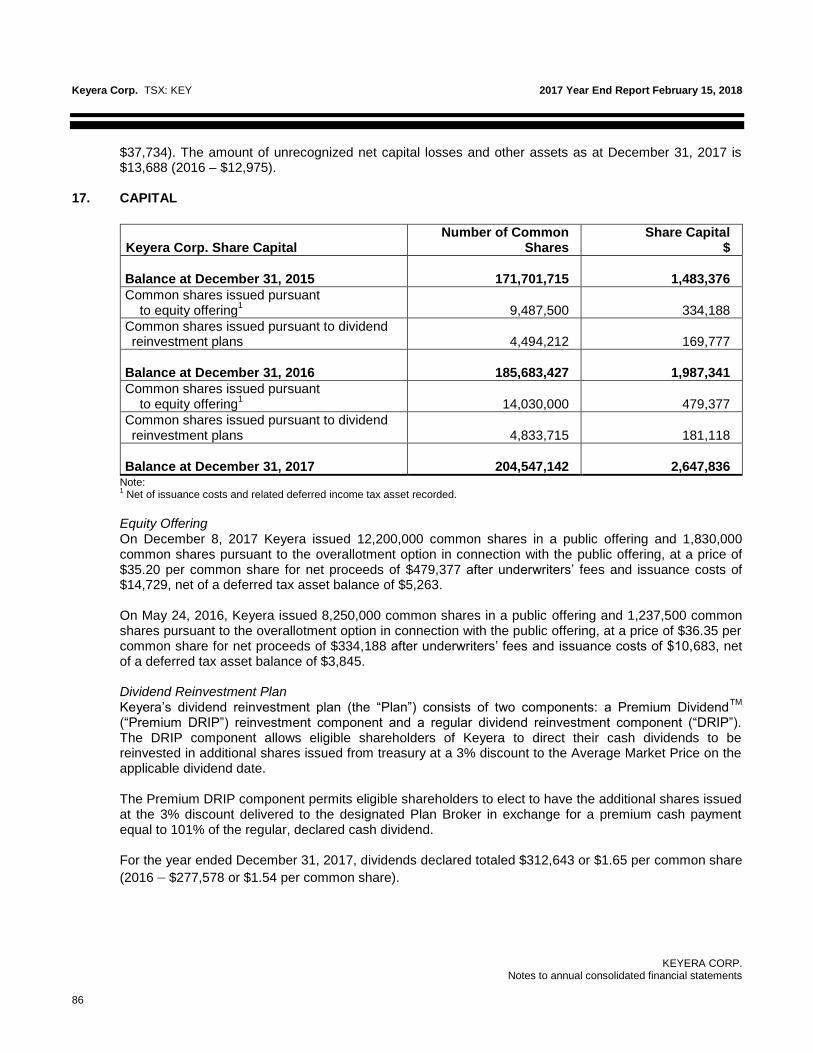
Keyera Corp. TSX: KEY 2017 Year End Report February 15, 2018
KEYERA CORP. Notes to annual consolidated financial statements
86
$37,734). The amount of unrecognized net capital losses and other assets as at December 31, 2017 is $13,688 (2016 – $12,975).
17. CAPITAL
Keyera Corp. Share Capital Number of Common
Shares Share Capital
$ Balance at December 31, 2015
171,701,715
1,483,376
Common shares issued pursuant to equity offering
1
9,487,500
334,188
Common shares issued pursuant to dividend reinvestment plans
4,494,212
169,777
Balance at December 31, 2016
185,683,427
1,987,341
Common shares issued pursuant to equity offering
1
14,030,000
479,377
Common shares issued pursuant to dividend reinvestment plans
4,833,715 181,118
Balance at December 31, 2017 204,547,142
2,647,836
Note: 1 Net of issuance costs and related deferred income tax asset recorded.
Equity Offering On December 8, 2017 Keyera issued 12,200,000 common shares in a public offering and 1,830,000 common shares pursuant to the overallotment option in connection with the public offering, at a price of $35.20 per common share for net proceeds of $479,377 after underwriters’ fees and issuance costs of $14,729, net of a deferred tax asset balance of $5,263. On May 24, 2016, Keyera issued 8,250,000 common shares in a public offering and 1,237,500 common shares pursuant to the overallotment option in connection with the public offering, at a price of $36.35 per common share for net proceeds of $334,188 after underwriters’ fees and issuance costs of $10,683, net of a deferred tax asset balance of $3,845. Dividend Reinvestment Plan Keyera’s dividend reinvestment plan (the “Plan”) consists of two components: a Premium Dividend
TM
(“Premium DRIP”) reinvestment component and a regular dividend reinvestment component (“DRIP”). The DRIP component allows eligible shareholders of Keyera to direct their cash dividends to be reinvested in additional shares issued from treasury at a 3% discount to the Average Market Price on the applicable dividend date. The Premium DRIP component permits eligible shareholders to elect to have the additional shares issued at the 3% discount delivered to the designated Plan Broker in exchange for a premium cash payment equal to 101% of the regular, declared cash dividend. For the year ended December 31, 2017, dividends declared totaled $312,643 or $1.65 per common share
(2016 – $277,578 or $1.54 per common share).

Keyera Corp. TSX: KEY 2017 Year End Report February 15, 2018
KEYERA CORP. Notes to annual consolidated financial statements
87
18. EARNINGS PER SHARE
Basic earnings per share was calculated by dividing net earnings by the weighted average number of shares outstanding for the related period.
2017
$ 2016
$
Basic and diluted earnings per share 1.53 1.21 Net earnings – basic and diluted 289,920 216,851
(in thousands)
2017
2016
Weighted average number of shares – basic and diluted 189,002 179,688
19. ACCUMULATED DIVIDENDS TO SHAREHOLDERS
The following table presents the reconciliation between the beginning and ending accumulated dividends to shareholders.
$
Balance at December 31, 2015 1,598,876 Dividends declared and paid 252,975 Dividends declared 24,603
Balance at December 31, 2016 1,876,454 Dividends declared and paid 284,006 Dividends declared 28,637 Balance at December 31, 2017 2,189,097
Keyera's general practice is to pay a monthly dividend on the closest business day to the 15th of each calendar month to shareholders of record as of the dividend record date, which is usually 20 to 26 days prior to the dividend payment date. Keyera's dividend policy is to provide shareholders with relatively stable and predictable monthly dividends, while retaining a portion of cash flow to fund ongoing growth projects. The amount of dividends to be paid on the common shares, if any, is subject to the discretion of the board of directors and may vary depending on a variety of factors. In determining the level of dividends to be declared each month, the board of directors takes into consideration such factors as current and expected future levels of distributable cash flow, capital expenditures, borrowings and debt repayments, changes in working capital requirements and other factors.
20. SHARE-BASED COMPENSATION AND PENSION PLANS Long-term incentive plan The Long-Term Incentive Plan (“LTIP”) compensates officers and key employees by delivering shares of Keyera or paying cash in lieu of shares. Participants in the LTIP are granted rights (“share awards”) to receive shares of Keyera on specified dates in the future. Grants of share awards are authorized by the board of directors. Shares delivered to employees are acquired in the marketplace and not issued from treasury. The acquired shares are placed in a trust account established for the benefit of the participants until the share awards vest.

Keyera Corp. TSX: KEY 2017 Year End Report February 15, 2018
KEYERA CORP. Notes to annual consolidated financial statements
88
The LTIP consists of two types of share awards, which are described below: (a) Performance Awards
All Performance Awards issued and outstanding are settled on or before September 1st following the third
anniversary of the grant date. The number of shares to be delivered will be determined by the financial performance of Keyera over the three-year period. The number of shares to be delivered will be calculated by multiplying the number of share awards by an adjustment ratio and a payout multiplier. The adjustment ratio adjusts the number of shares to be delivered to reflect the per share cash dividends paid by Keyera to its shareholders during the term that the share award is outstanding. The payout multiplier is based 70% on the average annual pre-tax distributable cash flow per share over the performance period of three years and 30% on the relative total shareholder return in a defined peer group over the performance period of three years.
(b) Time Vested Awards (“Restricted Awards”)
Restricted Awards are settled in three equal installments over a three-year period regardless of the performance of Keyera. The number of shares to be delivered will be multiplied by an adjustment ratio which reflects the per share cash dividends paid by Keyera to its shareholders during the term that the share award is outstanding. The LTIP is accounted for using the liability method and is measured at fair value at each statement of financial position date until the award is settled. The fair value of the liability is measured by applying a fair value pricing model whereby one of the valuation inputs was the December 31, 2017 share price of
Keyera, which was $35.42 per share (December 31, 2016 – $40.46 per share).
The compensation cost recorded for the LTIP was as follows:
2017
$ 2016
$
Performance Awards 13,700 14,260 Restricted Awards 207 2,580 Total long-term incentive plan expense 13,907 16,840
The table below shows the number of share awards granted:
Share awards granted as at December 31, December 31, Share Award Series 2017 2016
Issued July 1, 2014 – Performance Awards — 335,398 Issued July 1, 2015 – Performance Awards 327,798 333,392 Issued July 1, 2016 – Performance Awards 341,458 345,081 Issued July 1, 2017 – Performance Awards 343,978 — Issued July 1, 2014 – Restricted Awards — 19,634 Issued July 1, 2015 – Restricted Awards 19,524 40,859 Issued July 1, 2016 – Restricted Awards 45,515 69,645 Issued July 1, 2017 – Restricted Awards 71,929 —
Employee Stock Purchase Plan Keyera maintains an employee stock purchase plan (“ESPP”) whereby eligible employees can purchase common shares of Keyera. Keyera will contribute an amount equal to 5% of the employee’s contribution.

Keyera Corp. TSX: KEY 2017 Year End Report February 15, 2018
KEYERA CORP. Notes to annual consolidated financial statements
89
To participate in the ESPP, eligible employees select an amount to be deducted from their semi-monthly remuneration. Employees may elect to withhold up to 25% of their base compensation for the stock purchases. The shares of Keyera are acquired on the Toronto Stock Exchange on a semi-monthly basis consistent with the timing of the semi-monthly remuneration. The cost of the shares purchased to match the employee’s contribution is expensed as incurred and recorded in general and administrative expenses. Defined Contribution Pension Plan For the year ended December 31, 2017, Keyera made pension contributions of $9,076 (2016 – $8,869) on behalf of its employees. The contributions were recorded in general and administrative expenses.
Deferred Share Unit Plan Effective January 1, 2016, Keyera implemented a deferred share unit (“DSU”) plan, for non-employee directors. Each DSU vests on the date the grant is awarded but cannot be redeemed until a director ceases to be a member of the board of directors. The grant value is determined based on a 20 day weighted average trading share price. DSUs are settled in cash (on an after-tax basis) based on the 20 day weighted average Keyera share price up to the date of settlement. For the year ended December 31, 2017, Keyera recorded $844 (2016 – $784) in general and administrative expenses related to the DSU.
The following table reconciles the number of DSUs outstanding for the years ended December 31, 2017 and 2016:
Deferred Share Units 2017 2016
Balance at beginning of period 19,827 — Granted 26,344 20,353 Redeemed — (526)
Balance at end of period 46,171 19,827
21. FINANCIAL INSTRUMENTS AND RISK MANAGEMENT Financial instruments include cash, trade and other receivables, derivative financial instruments, trade and other payables, dividends payable, credit facilities, finance lease liabilities, and current and long-term debt. Derivative financial instruments include foreign exchange contracts, cross-currency swaps, NGLs, crude oil, motor gasoline and natural gas price contracts, electricity price contracts and physical fixed price commodity contracts. Derivative instruments are classified as fair value through the consolidated statement of net earnings and comprehensive income and are measured at fair value. All other financial instruments are measured at amortized cost.
Financial Instruments (a) Fair value Fair value represents Keyera’s estimate of the price at which a financial instrument could be exchanged between knowledgeable and willing parties in an orderly arm’s length transaction motivated by normal business considerations. Fair value measurement of assets and liabilities recognized on the consolidated statement of financial position are categorized into levels within a fair value hierarchy based on the nature of valuation inputs.

Keyera Corp. TSX: KEY 2017 Year End Report February 15, 2018
KEYERA CORP. Notes to annual consolidated financial statements
90
The fair value hierarchy has the following levels: Level 1: quoted prices in active markets for identical assets or liabilities; Level 2: inputs other than quoted prices included within Level 1 that are observable for the asset
or liability, either directly or indirectly; and Level 3: inputs for the asset or liability that are not based on observable market data.
All of Keyera’s derivative instruments are classified as Level 2 as their fair value is derived by using observable inputs, including commodity price curves, foreign currency curves and credit spreads. For fixed price forward contracts, fair value is derived from observable NGL market prices.
Financial instruments with fair value equal to carrying value The carrying values of cash, trade and other receivables, trade and other payables and dividends payable approximate their fair values because the instruments are either near maturity, have 5 to 30 days payment terms or have no fixed repayment terms. The carrying value of the credit facilities approximates fair value due to their floating rates of interest. Fair value of senior fixed rate debt Refer to note 13 for the fair value amounts of the senior fixed rate debt.

Keyera Corp. TSX: KEY 2017 Year End Report February 15, 2018
KEYERA CORP. Notes to annual consolidated financial statements
91
The fair values and carrying values of the derivative instruments are listed below and represent an estimate of the amount that Keyera would receive (pay) if these instruments were settled at the end of the period.
Weighted Fair Value
Notional Average Hierarchy Net Fair Carrying Value
Volume1 Price Level
2 Value Asset Liability
As at December 31, 2017 $ $ $ $
Marketing: NGLs and Iso-octane
Financial contracts: Seller of fixed price WTI swaps (maturing by March 31, 2019)
2,095,175 Bbls
69.81/Bbl
Level 2
(11,138)
—
(11,138)
Buyer of fixed price WTI swaps (maturing by March 31, 2018)
73,500 Bbls
71.63/Bbl
Level 2
293
293
—
Seller of fixed price NGL swaps (maturing by March 31, 2018)
1,337,154 Bbls
45.35/Bbl
Level 2
(7,719)
64
(7,783)
Buyer of fixed price NGL swaps (maturing by March 31, 2018)
404,000 Bbls
48.77/Bbl
Level 2
3,913
3,978
(65)
Seller of fixed price RBOB basis spreads (iso-octane) (maturing by December 31, 2019)
3,380,000 Bbls
19.69/Bbl
Level 2
(15,163)
479
(15,642)
Physical: Seller of fixed price NGL forward contracts (maturing by March 31, 2018)
26,188 Bbls
43.94/Bbl
Level 2
(138)
—
(138)
Currency: Seller of forward contracts (maturing by June 30, 2018)
US$103,500,000
1.27/USD
Level 2
2,214
2,287
(73)
Liquids Infrastructure
Electricity: Buyer of fixed price swaps (maturing by December 31, 2019)
157,680 MWhs
40.41/MWh
Level 2
2,134
2,194
(60)
Gathering and Processing
Electricity: Buyer of fixed price swaps (maturing by December 31, 2018)
35,040 MWhs
44.65/MWh
Level 2
335
377
(42)
Emission Performance Credits:
Seller of emission performance credits — — Level 2 1,010 1,010 —
Corporate and Other
Electricity: Buyer of fixed price swaps (maturing by December 31, 2019)
35,040 MWhs
41.95/MWh
Level 2
422
443
(21)
Crude Oil & NGLs: Seller of fixed price swaps (maturing December 31, 2018)
135,000 Bbls
66.55/Bbl
Level 2
(656)
—
(656)
Long-term Debt Buyer of cross-currency swaps
(maturing September 8, 2020 –November 20, 2028 )
US$575,335,900
0.98/USD
- 1.22/USD
Level 2
90,545
90,545
—
66,052
101,670
(35,618)
Notes: 1 All notional amounts represent actual volumes or actual prices and are not expressed in thousands.
2 A description of the fair value hierarchy is discussed in the fair value section.

Keyera Corp. TSX: KEY 2017 Year End Report February 15, 2018
KEYERA CORP. Notes to annual consolidated financial statements
92
Weighted Fair Value
Notional Average Hierarchy Net Fair Carrying Value
Volume1 Price Level
2 Value Asset Liability
As at December 31, 2016 $ $ $ $
Marketing: NGLs and Iso-octane
Financial contracts: Seller of fixed price WTI swaps (maturing by March 31, 2018)
1,650,066 Bbls
69.76/Bbl
Level 2
(6,292)
146
(6,438)
Seller of fixed price NGL swaps (maturing by March 31, 2017)
958,000 Bbls
29.41/Bbl
Level 2
(10,718)
—
(10,718)
Buyer of fixed price NGL swaps (maturing by March 31, 2018)
600,000 Bbls
39.09/Bbl
Level 2
4,723
4,723
—
Buyer of fixed price NGL basis spreads (maturing by March 31, 2017)
407,250 Bbls
9.38/Bbl
Level 2
1,197
1,197
—
Seller of fixed price RBOB basis spreads (iso-octane) (maturing by September 30, 2018)
2,990,000 Bbls
19.83/Bbl
Level 2
(15,530)
558
(16,088)
Currency: Seller of forward contracts (maturing by June 1, 2017)
US$87,500,000
1.33/USD
Level 2
(1,296)
90
(1,386)
Liquids Infrastructure
Electricity: Buyer of fixed price swaps (maturing by December 31, 2017)
61,440 MWhs
40.51/MWh
Level 2
(631)
21
(652)
Gathering and Processing
Electricity: Buyer of fixed price swaps (maturing by December 31, 2017)
17,520 MWhs
31.75/MWh
Level 2
(26)
21
(47)
Corporate and Other
Electricity: Buyer of fixed price swaps (maturing by December 31, 2017)
35,040 MWhs
39.25/MWh
Level 2
(316)
11
(327)
Crude Oil & NGLs: Seller of fixed price swaps (maturing December 31, 2017)
129,000 Bbls
60.45/Bbl
Level 2
(930)
—
(930)
Long-term Debt: Buyer of cross-currency swaps
(maturing September 8, 2020 –November 20, 2028 )
US$557,289,410
0.98/USD
- 1.22/USD
Level 2
121,860
121,860
—
92,041
128,627
(36,586)
Notes: 1 All notional amounts represent actual volumes or actual prices and are not expressed in thousands.
2 A description of the fair value hierarchy is discussed in the fair value section.

Keyera Corp. TSX: KEY 2017 Year End Report February 15, 2018
KEYERA CORP. Notes to annual consolidated financial statements
93
Derivative instruments are recorded on the consolidated statement of financial position at fair value. Changes in the fair value of these financial instruments are recognized in the consolidated statement of net earnings and comprehensive income in the period in which they arise. Unrealized gains (losses), representing the change in fair value of derivative contracts, are recorded in the following consolidated statement of net earnings and comprehensive income line items and the related reportable operating segments: Derivative Contracts Related To
Reportable Operating Segments
Consolidated Net Earnings and Comprehensive Income Line Item
Natural gas, crude oil and NGLs, and iso-octane
Marketing; Corporate and Other
Marketing revenue; Corporate and other revenue
Electricity Liquids Infrastructure;
Gathering and Processing; Corporate and Other
Liquids infrastructure expenses; Gathering and processing expenses; Corporate and other expenses
Cross-currency swaps Corporate and Other Net foreign currency gain/(loss) on U.S. debt
Emission performance credits Gathering and Processing Gathering and processing
expenses
Unrealized (loss) gain
2017 $
2016 $
Marketing revenue 178 (35,396)
Liquids infrastructure operating expense 2,765 (14)
Gathering and processing expense 1,371 (26)
Corporate and Other:
Production revenue (expense) 1,012 (2,315)
Foreign currency loss on U.S. debt (31,316) (31,179)
Total unrealized loss (25,990) (68,930)
Risk Management
Market risk is the risk that the fair value of future cash flows of a financial asset or a financial liability will fluctuate because of changes in market prices. Market risk is comprised of commodity price risk, interest rate risk, and foreign currency risk, as well as credit and liquidity risks. (b) Commodity price risk Subsidiaries of Keyera enter into contracts to purchase and sell primarily NGLs and iso-octane, as well as natural gas and crude oil. These contracts are exposed to commodity price risk between the times contracted volumes are purchased and sold and foreign currency risk for those sales denominated in U.S. dollars. These risks are actively managed by utilizing physical and financial contracts which include commodity related forward contracts, price swaps and forward currency contracts. A risk management committee meets regularly to review and assess the risks inherent in existing contracts and the effectiveness of the risk management strategies. This is achieved by modeling future sales and purchase contracts to monitor the sensitivity of changing prices and volumes.

Keyera Corp. TSX: KEY 2017 Year End Report February 15, 2018
KEYERA CORP. Notes to annual consolidated financial statements
94
Significant amounts of electricity and natural gas are consumed by certain facilities. In order to mitigate the exposure to fluctuations in the prices of electricity and natural gas, price swap agreements may be used. These agreements are accounted for as derivative instruments. Certain NGL contracts that require physical delivery at fixed prices are accounted for as derivative instruments. (c) Foreign currency risk Foreign currency risk arises on financial instruments that are denominated in a foreign currency. Keyera’s functional currency is the Canadian dollar. Keyera’s foreign currency risk largely arises from the Marketing segment where a significant portion of sales and purchases are denominated in U.S. dollars. Foreign currency risk is actively managed by using forward currency contracts and cross-currency swaps. Management monitors the exposure to foreign currency risk and regularly reviews its financial instrument activities and all outstanding positions. The Gathering and Processing and Liquids Infrastructure segments have very little foreign currency risk as sales and purchases are primarily denominated in Canadian dollars.
U.S. dollar sales and purchases in the Marketing segment were as follows: U.S. dollar sales and purchases
2017 $
2016 $
Sales priced in U.S. dollars 1,057,109 635,297
Purchases priced in U.S. dollars (398,523) (374,187)
Portions of Keyera’s trade and other receivables and trade and other payables are denominated in U.S. dollars and, as a result, are subject to foreign currency risk.
Keyera is also exposed to foreign currency risk related to its U.S. dollar denominated long-term debt and U.S. dollar denominated LIBOR loans drawn under Keyera’s bank credit facility. To manage this currency exposure, Keyera has entered into long-term cross-currency swap contracts relating to the principal portion and future interest payments of the U.S. dollar denominated debt as well as short-term cross-currency swaps relating to the LIBOR loans drawn under the credit facility. These cross-currency contracts are accounted for as derivative instruments. As at December 31, 2017, Keyera has $nil of U.S. dollar denominated LIBOR loans drawn under the bank credit facilities (December 31, 2016 – $nil). Refer to note 22 for a summary of the foreign currency gains (losses) associated with the U.S. dollar denominated long-term debt.
(d) Interest rate risk The majority of Keyera’s interest rate risk is attributed to its fixed and floating rate debt, which is used to finance capital investments and operations. Keyera’s remaining financial instruments are not significantly exposed to interest rate risk. The floating rate debt creates exposure to interest rate cash flow risk, whereas the fixed rate debt creates exposure to interest rate price risk. As at December 31, 2017, fixed rate borrowings comprised 100% of total debt outstanding (December 31, 2016 – 86%). The fair value of future cash flows for fixed rate debt fluctuates with changes in market interest rates. It is Keyera’s intention to not repay fixed rate debt until maturity and therefore future cash flows would not fluctuate. (e) Credit risk The majority of trade and other receivables are due from entities in the oil and gas industry and are subject to normal industry credit risks. Concentration of credit risk is mitigated by having a broad domestic and international customer base. Keyera evaluates and monitors the financial strength of its customers in accordance with its credit policy.

Keyera Corp. TSX: KEY 2017 Year End Report February 15, 2018
KEYERA CORP. Notes to annual consolidated financial statements
95
Keyera’s maximum exposure to credit risk, which is a worst case scenario and does not reflect results expected by Keyera, is $435,620 at December 31, 2017 (December 31, 2016 – $364,081). Keyera does not typically renegotiate the terms of trade receivables. There were no significant renegotiated balances outstanding at December 31, 2017. With respect to counterparties for derivative financial instruments, the credit risk is managed through dealing primarily with recognized futures exchanges or investment grade financial institutions and by maintaining credit policies which significantly reduce overall counterparty credit risk. In addition, Keyera incorporates the credit risk associated with counterparty default, as well as Keyera’s own credit risk, into the estimates of fair value. The allowance for credit losses is reviewed on a monthly basis. An assessment is made whether an account is deemed impaired based on the number of days outstanding and the likelihood of collection from the counterparty. (f) Liquidity risk Liquidity risk is the risk that suitable sources of funding for Keyera’s business activities may not be available. Keyera manages liquidity risk by maintaining bank credit facilities, continuously managing forecast and actual cash flows and monitoring the maturity profiles of financial assets and financial liabilities. Keyera has access to a wide range of funding at competitive rates through capital markets and banks to meet the immediate and ongoing requirements of the business. The following table shows the contractual maturities for financial liabilities of Keyera as at December 31, 2017:
Total $
2018
$
2019
$
2020
$
2021
$
2022
$
After 2022
$
Trade and other payables 522,673 522,673 — — — — —
Derivative financial instruments
1 35,618 35,398 220 — — — —
Dividends payable 28,637 28,637 — — — — —
Credit facility — — — — — — —
Long-term debt2 1,805,540 — 125,756 130,935 — 60,000 1,488,849
Other liabilities3 98,817 9,696 8,747 8,120 5,250 5,250 61,754
2,491,285 596,404 134,723 139,055 5,250 65,250 1,550,603
Notes: 1
Derivative instruments include cross-currency swaps related to U.S. long-term debt (note 22). 2
Amounts represent principal only and exclude accrued interest. 3
Other liabilities include the future minimum lease payments related to finance lease liabilities as well as the current and long-term portions of the LTIP.
Risk Management Sensitivities The following table summarizes the sensitivity of the fair value of Keyera’s risk management positions to fluctuations in commodity price, interest rate, and foreign currency rate. Fluctuations in commodity prices, foreign currency rate and interest rate changes could have resulted in unrealized gains (losses) affecting income before tax as follows:

Keyera Corp. TSX: KEY 2017 Year End Report February 15, 2018
KEYERA CORP. Notes to annual consolidated financial statements
96
Impact on income before tax
Impact on income before tax
December 31, 2017 December 31, 2016 Risk sensitivities
Increase $
(Decrease) $
Increase $
(Decrease) $
Commodity price changes
+ 10% in electricity price 1,230 — 345 —
- 10% in electricity price — (1,230) — (345) + 10% in NGL, crude oil and iso-octane prices — (28,921) — (21,306) - 10% in NGL, crude oil and iso-octane prices 28,921 — 21,306 —
Foreign currency rate changes + $0.01 in U.S./Canadian dollar exchange
rate
926
—
168
— - $0.01 in U.S./Canadian dollar exchange rate
—
(926)
—
(168)
Interest rate changes
+ 1% in interest rate — — — (3,140)
- 1% in interest rate — — 3,140 —
22. NET FOREIGN CURRENCY GAIN (LOSS) ON U.S. DEBT
The components of net foreign currency gain (loss) were as follows:
2017 $
2016 $
Foreign currency gain (loss) resulting from:
Translation of long-term debt and interest payable 39,921 25,159 Change in fair value of the cross-currency swaps – principal and interest portion
(31,316)
(31,179)
Gain from cross-currency swaps – interest portion1 2,526 3,578
Total foreign currency gain (loss) on U.S. debt 11,131 (2,442) Note: 1 Foreign currency gains (losses) resulted from the exchange of currencies related to the settlement of interest payments on the
long-term cross-currency swaps.
23. CAPITAL MANAGEMENT Keyera’s objectives when managing capital are:
to safeguard Keyera’s ability to continue as a going concern;
to maintain financial flexibility in order to fund investment opportunities and meet financial obligations; and
to distribute to shareholders a significant portion of the current cash flow of its subsidiaries, after I. satisfaction of debt service obligations (principal and interest) and income tax expenses, II. satisfaction of any reclamation funding requirements,
III. providing for maintenance capital expenditures, and IV. retaining reasonable reserves for administrative and other expense obligations and
reasonable reserves for working capital and capital expenditures as may be considered appropriate.

Keyera Corp. TSX: KEY 2017 Year End Report February 15, 2018
KEYERA CORP. Notes to annual consolidated financial statements
97
Keyera defines its capital as shareholders’ equity, long-term debt, credit facilities, and working capital (defined as current assets less current liabilities). Keyera manages its capital structure and makes adjustments to it in light of changes in economic conditions and the risk characteristics of the underlying assets. In order to maintain or adjust the capital structure, Keyera may adjust the amount of dividends paid to shareholders, issue new shares, issue new debt or replace existing debt with new debt having different characteristics. For the year ended December 31, 2017, Keyera’s capital management strategy was unchanged from the prior year. Keyera monitors its capital structure primarily based on its consolidated net debt to consolidated earnings before interest, taxes, depreciation, amortization, accretion, unrealized gains and losses, impairment expenses and any other non-cash items (“adjusted EBITDA”) ratio. The definition of adjusted EBITDA for capital management purposes is similar, but not identical to the adjusted EBITDA financial measure used in the calculation of Keyera’s financial covenants on its credit facilities and long-term debt agreements. This ratio is calculated as consolidated net debt divided by a twelve-month trailing adjusted EBITDA, which are non-GAAP measures. In the first quarter of 2017, Keyera amended its credit facilities and long-term debt agreements to provide more flexibility by introducing two changes to the covenant calculations. The first change allows Keyera to increase its Net Debt to EBITDA ratio from 4.0 to 4.5 for periods of up to four consecutive fiscal quarters. The second change allows Keyera to utilize the cross-currency swap rates in the calculation of debt rather than the spot rate as at each balance sheet date. Keyera is also subject to the following financial covenants: (i) adjusted EBITDA to consolidated interest charges, and (ii) priority debt to consolidated total assets. The calculation for each of these financial covenants is based on specific definitions and is not in accordance with GAAP, and cannot be directly derived from the financial statements. Keyera was in compliance with all financial covenants as at December 31, 2017.
24. GENERAL AND ADMINISTRATIVE EXPENSES The components of general and administrative expenses were as follows:
2017 2016
$ $
Salaries and benefits 76,206 68,751
Professional fees and consulting 16,397 12,621
Other 17,246 22,259
Overhead recoveries on operated facilities (42,556) (41,674)
Total general and administrative expenses 67,293 61,957
Other expenses include operating lease charges, insurance, advertising and promotional expenditures. In 2016, $6,097 were included in other general and administrative expenses which related to previously capitalized front-end engineering costs for various small projects which were no longer proceeding further. As operator of most of its facilities, Keyera is compensated for its administrative work by collecting an overhead recovery fee equal to a certain percentage of operating costs. The reimbursement of such costs is called overhead recoveries.

Keyera Corp. TSX: KEY 2017 Year End Report February 15, 2018
KEYERA CORP. Notes to annual consolidated financial statements
98
25. FINANCE COSTS The components of finance costs were as follows:
2017 $
2016 $
Interest on bank overdrafts and credit facilities 11,007 11,835 Interest on long-term debt 74,046 62,814 Interest capitalized (26,511) (14,161) Other interest expense 1,869 294
Total interest expense on current and long-term debt 60,411 60,782 Unwinding of discount on decommissioning liability 10,433 10,752 Unwinding of discount on long-term debt 1,549 1,296
Non-cash expenses in finance costs 11,982 12,048
Total finance costs 72,393 72,830
For the year ended December 31, 2017, $26,511 of borrowing (interest) costs were capitalized (2016 – $14,161) at a weighted average capitalization rate of 4.87% on funds borrowed (2016 – 4.34%).
26. DEPRECIATION, DEPLETION AND AMORTIZATION The components of depreciation, depletion and amortization expense were as follows:
2017
$ 2016
$
Depreciation and depletion on property, plant and equipment and other properties
165,978
171,030
Amortization of intangible assets — 585
Total depreciation, depletion and amortization expenses 165,978 171,615
Change in accounting estimate In the fourth quarter of 2016, Keyera conducted a review of the useful life of its assets. Based on this review, the useful life of several facilities was extended, including the Simonette and Rimbey gas plants as well as assets within Keyera’s Liquids Infrastructure segment. This change in estimate was effective October 1, 2016 and was accounted for on a prospective basis.
27. RELATED PARTY TRANSACTIONS
Key management personnel are comprised of Keyera’s board of directors and executive officers. Compensation of key management personnel was as follows:
2017
$ 2016
$
Salaries and other short-term benefits 9,489 8,354 Post-employment benefits 362 330 Share-based payments 16,750 15,705
Total related party transactions 26,601 24,389
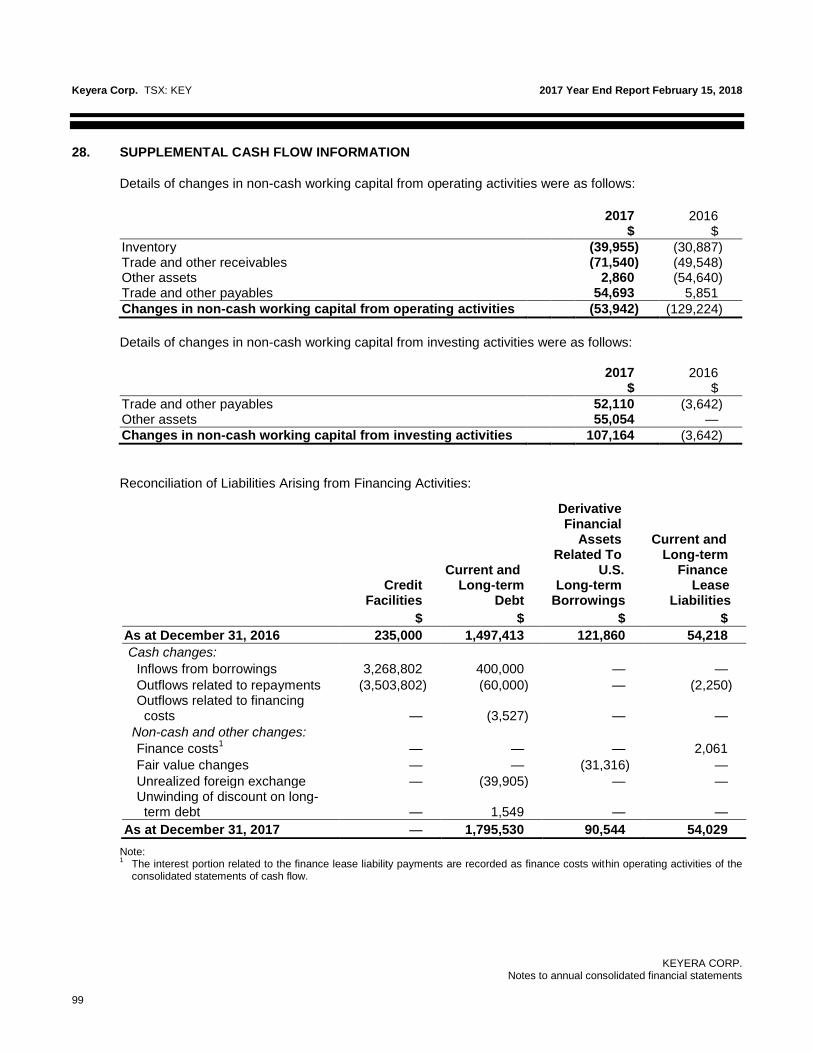
Keyera Corp. TSX: KEY 2017 Year End Report February 15, 2018
KEYERA CORP. Notes to annual consolidated financial statements
99
28. SUPPLEMENTAL CASH FLOW INFORMATION
Details of changes in non-cash working capital from operating activities were as follows:
2017
$ 2016
$
Inventory (39,955) (30,887) Trade and other receivables (71,540) (49,548) Other assets 2,860 (54,640) Trade and other payables 54,693 5,851
Changes in non-cash working capital from operating activities (53,942) (129,224)
Details of changes in non-cash working capital from investing activities were as follows:
2017 $
2016 $
Trade and other payables 52,110 (3,642) Other assets 55,054 —
Changes in non-cash working capital from investing activities 107,164 (3,642)
Reconciliation of Liabilities Arising from Financing Activities: Note: 1 The interest portion related to the finance lease liability payments are recorded as finance costs within operating activities of the
consolidated statements of cash flow.
Credit Facilities
Current and Long-term
Debt
Derivative Financial
Assets Related To
U.S. Long-term
Borrowings
Current and Long-term
Finance Lease Liabilities
$ $ $ $
As at December 31, 2016 235,000 1,497,413 121,860 54,218
Cash changes:
Inflows from borrowings 3,268,802 400,000 — —
Outflows related to repayments (3,503,802) (60,000) — (2,250) Outflows related to financing costs
— (3,527) — —
Non-cash and other changes:
Finance costs1 — — — 2,061
Fair value changes — — (31,316) —
Unrealized foreign exchange — (39,905) — — Unwinding of discount on long- term debt — 1,549 — —
As at December 31, 2017 — 1,795,530 90,544 54,029
Keyera Corp. TSX: KEY 2017 Year End Report February 15, 2018
KEYERA CORP. Notes to annual consolidated financial statements
100
29. SEGMENT INFORMATION
Keyera has the following four reportable operating segments based on the nature of its business activities: Marketing The Marketing segment is primarily involved in the marketing of NGLs, such as propane, butane, condensate, and iso-octane to customers in Canada and the United States, as well as various crude oil midstream activities. Gathering and Processing The Gathering and Processing segment includes raw gas gathering systems and processing plants located in the natural gas production areas primarily on the western side of the Western Canada Sedimentary Basin. The operations primarily involve providing natural gas gathering and processing, including liquids extraction, services to customers. Liquids Infrastructure The Liquids Infrastructure segment provides fractionation, storage, transportation and terminalling services for NGLs and crude oil. As well, it provides processing services to Keyera’s Marketing business related to iso-octane. These services are provided to customers through an extensive network of facilities that include underground NGL storage caverns, NGL fractionation facilities, NGL and crude oil pipelines as well as rail and truck terminals and the AEF facility. Corporate and Other The Corporate and Other segment includes corporate functions and the production of natural gas, natural gas liquids and crude oil. Inter-segment and intra-segment sales and expenses are recorded at current market prices at the date of the transaction. These transactions are eliminated on consolidation in order to arrive at net earnings in accordance with IFRS. Reclassification Certain information provided for prior years has been reclassified to conform to a change in presentation adopted in 2017.

Keyera Corp. TSX: KEY 2017 Year End Report February 15, 2018
KEYERA CORP. Notes to annual consolidated financial statements
101
The following table shows the operating margin from each of Keyera’s operating segments and includes inter-segment transactions. Operating margin is a key measure used by management to monitor profitability by segment.
Year ended December 31, 2017
Marketing $
Gathering & Processing
$
Liquids Infrastructure
$
Corporate and Other
$
Total
$
Revenue before inter-segment eliminations
2,803,950
466,473
418,822
26,667
3,715,912
Operating expenses before inter-segment eliminations
(2,675,580)
(191,189)
(133,551)
(12,051)
(3,012,371)
Operating margin 128,370 275,284 285,271 14,616 703,541
Inter-segment revenue eliminations (4,621) (23,836) (243,656) (30,436) (302,549)
Inter-segment expense eliminations 277,006 3,424 13,658 8,461 302,549
400,755 254,872 55,273 (7,359) 703,541
General and administrative expenses — — — (67,293) (67,293)
Finance costs — — — (72,393) (72,393) Depreciation, depletion and amortization expenses
—
—
—
(165,978)
(165,978)
Net foreign currency gain on U.S. debt — — — 11,131 11,131
Long-term incentive plan expense — — — (13,907) (13,907)
Impairment expense — (17,890) (2,940) — (20,830) Gain on disposal of property, plant, and equipment — 20,447 — — 20,447
Earnings (loss) before income tax 400,755 257,429 52,333 (315,799) 394,718
Income tax expense — — — (104,798) (104,798)
Net earnings (loss) 400,755 257,429 52,333 (420,597) 289,920
Revenue from external customers 2,799,329 442,637 175,166 (3,769) 3,413,363
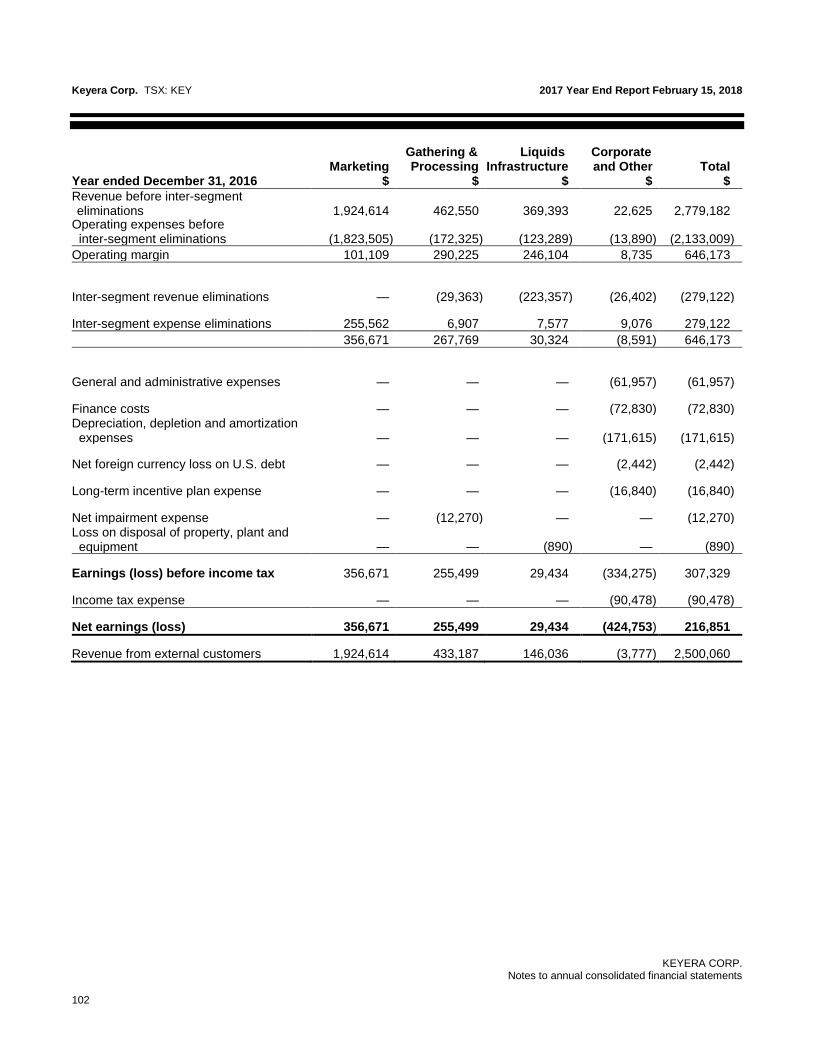
Keyera Corp. TSX: KEY 2017 Year End Report February 15, 2018
KEYERA CORP. Notes to annual consolidated financial statements
102
Year ended December 31, 2016
Marketing $
Gathering & Processing
$
Liquids Infrastructure
$
Corporate and Other
$
Total
$
Revenue before inter-segment eliminations
1,924,614
462,550
369,393
22,625
2,779,182
Operating expenses before inter-segment eliminations
(1,823,505)
(172,325)
(123,289)
(13,890)
(2,133,009)
Operating margin 101,109 290,225 246,104 8,735 646,173
Inter-segment revenue eliminations — (29,363) (223,357) (26,402) (279,122)
Inter-segment expense eliminations 255,562 6,907 7,577 9,076 279,122
356,671 267,769 30,324 (8,591) 646,173
General and administrative expenses — — — (61,957) (61,957)
Finance costs — — — (72,830) (72,830) Depreciation, depletion and amortization expenses
—
—
—
(171,615)
(171,615)
Net foreign currency loss on U.S. debt — — — (2,442) (2,442)
Long-term incentive plan expense — — — (16,840) (16,840)
Net impairment expense — (12,270) — — (12,270) Loss on disposal of property, plant and equipment — — (890) — (890)
Earnings (loss) before income tax 356,671 255,499 29,434 (334,275) 307,329
Income tax expense — — — (90,478) (90,478)
Net earnings (loss) 356,671 255,499 29,434 (424,753) 216,851
Revenue from external customers 1,924,614 433,187 146,036 (3,777) 2,500,060

Keyera Corp. TSX: KEY 2017 Year End Report February 15, 2018
KEYERA CORP. Notes to annual consolidated financial statements
103
Geographical information Keyera operates in two geographical areas, Canada and the U.S. Keyera’s revenue from external customers and information about its non-current assets by geographical location are detailed below based on the country of origin.
Revenue from external customers located in 2017
$
2016 $
Canada 2,873,125 2,132,104
U.S. 540,238 367,956
Total revenue 3,413,363 2,500,060
2017 2016 Non-current assets
1 as at December 31, $ $
Canada 4,752,164 4,172,058 U.S. 93,858 82,050 Total non-current assets 4,846,022 4,254,108
Note:
¹ Non-current assets are comprised of property, plant and equipment, and goodwill.
Information about major customers Keyera did not earn revenues from a single external customer that accounted for more than 10% of its total revenue for the years ended December 31, 2017 and 2016.
30. COMMITMENTS AND CONTINGENCIES Keyera through its operating entities has assumed commitments in various contractual purchase agreements in the normal course of its operations. The agreements involve the purchase of NGL production from producers in the areas specified in the agreements. The purchase prices are based on then current market prices. The future volumes and prices for these contracts cannot be reasonably determined and therefore no amount has been included in purchase obligations to reflect these contractual agreements. There are operating lease commitments relating to railway tank cars, vehicles, computer hardware, office space, terminal space, natural gas transportation and third party contractual obligations related to assets under construction. The estimated annual minimum payments due for these commitments are as follows: $
2018 564,731 2019 68,233 2020 37,630 2021 30,184 2022 22,969 Thereafter 59,646 Total commitments 783,393
Keyera has agreed to arbitration with a contractor involved in the construction of the Simonette Wapiti pipeline to resolve a dispute over the final amounts due under the construction contract. The arbitration will address Keyera’s counterclaim for damages caused by the contractor’s performance and associated delays. Keyera does not expect the financial impact of the dispute to have a material impact on its consolidated financial statements.
Keyera Corp. TSX: KEY 2017 Year End Report February 15, 2018
KEYERA CORP. Notes to annual consolidated financial statements
104
31. SUBSEQUENT EVENTS On January 11, 2018, Keyera declared a dividend of $0.14 per share, payable on February 15, 2018 to shareholders of record as of January 22, 2018. On January 15, 2018, Keyera completed the sale of the Wabasca River and North Senex pipelines to an unrelated third party for proceeds of $5,000 plus closing adjustments. As at December 31, 2017, an impairment loss of $2,940 was recorded.
On February 12, 2018, Keyera declared a dividend of $0.14 per share, payable on March 15, 2018 to shareholders of record as of February 23, 2018.

Keyera Corp. TSX: KEY 2017 Year End Report February 15, 2018
KEYERA CORP. 105
Additional Information
Fourth Quarter Results
(Unaudited) Three months ended
December 31, Statements of Net Earnings 2017 2016
1
(Thousands of Canadian dollars) $ $
Revenues 1,027,004 693,506 Expenses (815,915) (538,067)
Operating margin 211,089 155,439
General and administrative expenses (18,688) (13,878)
Finance costs (17,633) (19,916)
Depreciation, depletion and amortization expenses (43,917) (37,046)
Net foreign currency loss on U.S. debt (4,097) (12,202)
Long-term incentive plan recovery 31 273
Impairment expense (2,940) (12,270)
Adjustment to gain on disposal of property, plant and equipment (1,719) —
Earnings before income tax 122,126 60,400
Income tax expense (34,074) (25,779)
Net earnings 88,052 34,621
Weighted average number of shares (in thousands)
- basic 193,552 185,116 - diluted 193,552 185,116 Earnings per share $ $
- basic 0.45 0.19 - diluted 0.45 0.19
Note: 1
Certain information provided for prior years has been reclassified to conform to a change in presentation adopted in 2017.

Keyera Corp. TSX: KEY 2017 Year End Report February 15, 2018
KEYERA CORP. 106
Statements of Cash Flows (Thousands of Canadian dollars)
(Unaudited) Three months ended
December 31, 2017 2016
Net inflow (outflow) of cash: $ $
OPERATING ACTIVITIES
Net earnings 88,052 34,621
Adjustments for items not affecting cash:
Finance costs 3,306 3,437
Depreciation, depletion and amortization expenses 43,917 37,046
Long-term incentive plan recovery (31) (273)
Unrealized loss on derivative financial instruments 9,457 11,520
Unrealized loss on foreign exchange 2,284 12,651
Deferred income tax expense 33,535 24,197
Impairment expense 2,940 12,270
Adjustment to gain on disposal of property, plant and equipment 1,719 —
Decommissioning liability expenditures (3,638) (2,243)
Changes in non-cash working capital 31,068 (93,003)
Net cash provided by operating activities 212,609 40,223
INVESTING ACTIVITIES
Acquisitions — (8,033)
Capital expenditures (196,825) (148,323)
Changes in non-cash working capital (1,236) (34,224)
Net cash used in investing activities (198,061) (190,580)
FINANCING ACTIVITIES
Borrowings under credit facilities 105,000
185,000 Repayments under credit facilities (200,000) (315,000)
Proceeds from issuance of long term debt — 300,000
Financing costs related to credit facilities/long-term debt (968)
(2,098) Repayment of long-term debt (60,000) —
Proceeds from issuance of equity offering 493,856
—
Issuance costs related to equity offering (19,992)
(341) Proceeds from issuance of shares related to DRIP 45,176
45,017
Repayment of finance lease liabilities (563) (188)
Dividends paid to shareholders (79,661) (73,504)
Net cash provided by financing activities 282,848 138,886
Effect of exchange rate fluctuations on foreign cash held (932) 476
Net increase (decrease) in cash 296,464 (10,995)
Cash, start of period 29,917
27,472 Cash, end of period 326,381
16,477

Keyera Corp. TSX: KEY 2017 Year End Report February 15, 2018
KEYERA CORP. 107
SUPPLEMENTAL CASH FLOW INFORMATION
Details of changes in non-cash working capital from operating activities were as follows:
(Unaudited) Three months ended
December 31,
2017
$ 2016
$
Inventory 22,588 13,042 Trade and other receivables (51,487) (79,889) Other assets 7,556 (51,039) Trade and other payables 52,411 24,883
Changes in non-cash working capital from operating activities 31,068 (93,003)
Details of changes in non-cash working capital from investing activities were as follows:
(Unaudited) Three months ended
December 31,
2017
$ 2016
$
Trade and other payables (1,236) (34,224)
Changes in non-cash working capital from investing activities (1,236) (34,224)
The following amounts are included in Cash Flows from Operating Activities:
(Unaudited) Three months ended
December 31,
2017 $
2016 $
Income taxes paid in cash 766 4,855 Interest paid in cash 33,361 29,627
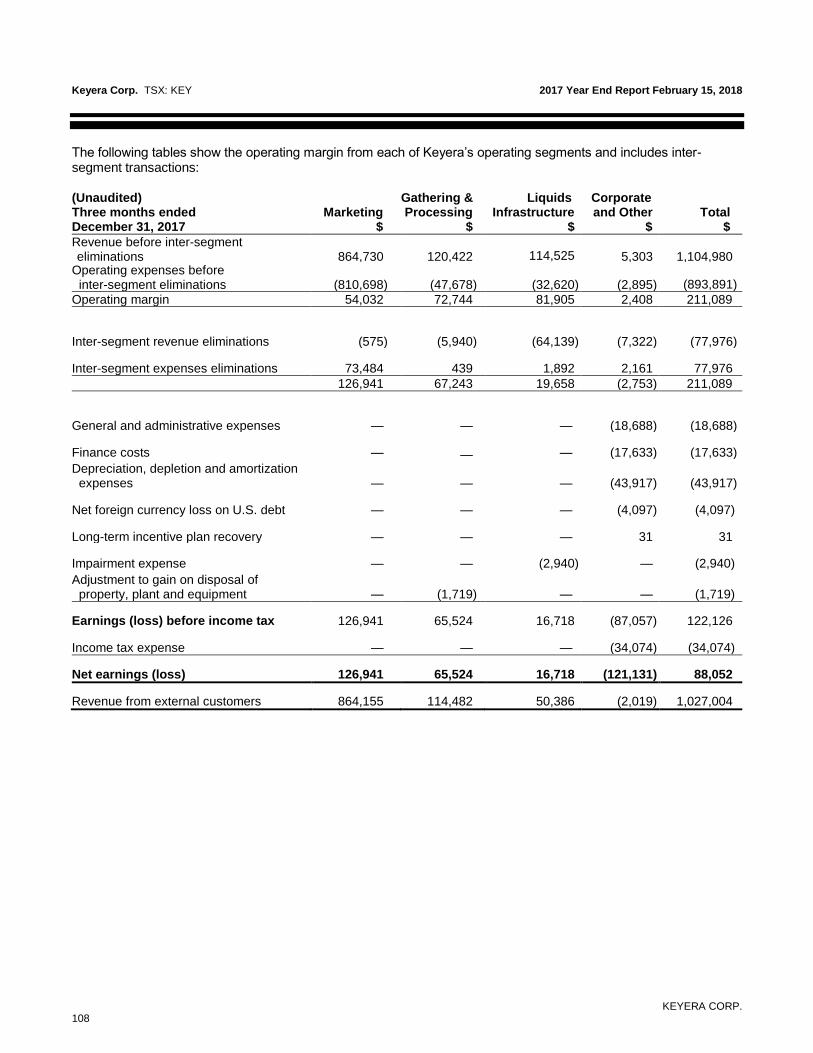
Keyera Corp. TSX: KEY 2017 Year End Report February 15, 2018
KEYERA CORP. 108
The following tables show the operating margin from each of Keyera’s operating segments and includes inter-segment transactions: (Unaudited) Three months ended December 31, 2017
Marketing $
Gathering & Processing
$
Liquids Infrastructure
$
Corporate and Other
$
Total
$
Revenue before inter-segment eliminations
864,730
120,422 114,525
5,303
1,104,980
Operating expenses before inter-segment eliminations
(810,698)
(47,678)
(32,620)
(2,895) (893,891)
Operating margin 54,032 72,744 81,905 2,408 211,089
Inter-segment revenue eliminations (575) (5,940) (64,139) (7,322) (77,976)
Inter-segment expenses eliminations 73,484 439 1,892 2,161 77,976
126,941 67,243 19,658 (2,753) 211,089
General and administrative expenses — — — (18,688) (18,688)
Finance costs —
— — (17,633) (17,633)
Depreciation, depletion and amortization expenses — — — (43,917) (43,917)
Net foreign currency loss on U.S. debt — — — (4,097) (4,097)
Long-term incentive plan recovery — — — 31 31
Impairment expense — — (2,940) — (2,940)
Adjustment to gain on disposal of property, plant and equipment — (1,719) — — (1,719)
Earnings (loss) before income tax 126,941 65,524 16,718 (87,057) 122,126
Income tax expense — — — (34,074) (34,074)
Net earnings (loss) 126,941 65,524 16,718 (121,131) 88,052
Revenue from external customers 864,155 114,482 50,386 (2,019) 1,027,004

Keyera Corp. TSX: KEY 2017 Year End Report February 15, 2018
KEYERA CORP. 109
(Unaudited) Three months ended December 31, 2016
1
Marketing $
Gathering & Processing
$
Liquids Infrastructure
$
Corporate and Other
$
Total
$
Revenue before inter-segment eliminations
535,708
127,103 94,712
7,512 765,035
Operating expenses before inter-segment eliminations
(527,127)
(47,222)
(31,931)
(3,316) (609,596)
Operating margin 8,581 79,881 62,781 4,196 155,439
Inter-segment revenue eliminations — (7,461) (55,048) (9,020) (71,529)
Inter-segment expenses eliminations 64,031 2,296 2,916 2,286 71,529
72,612 74,716 10,649 (2,538) 155,439
General and administrative expenses — — — (13,878) (13,878)
Finance costs — — — (19,916) (19,916) Depreciation, depletion and amortization expenses — — — (37,046) (37,046)
Net foreign currency loss on U.S. debt — — — (12,202) (12,202)
Long-term incentive plan recovery — — — 273 273
Net impairment expense — (12,270) — — (12,270)
Earnings (loss) before income tax 72,612 62,446 10,649 (85,307) 60,400
Income tax expense — — — (25,779) (25,779)
Net earnings (loss) 72,612 62,446 10,649 (111,086) 34,621
Revenue from external customers 535,708 119,642 39,664 (1,508) 693,506 Note: 1
Certain information provided for prior years has been reclassified to conform to a change in presentation adopted in 2017.

Keyera Corp. TSX: KEY 2017 Year End Report February 15, 2018
KEYERA CORP. 110
Corporate Information
Board of Directors Officers
Jim V. Bertram (1)
Corporate Director
Calgary, Alberta
Douglas Haughey (2)(4)
Corporate Director
Calgary, Alberta
Nancy M. Laird (3)
Corporate Director
Calgary, Alberta
Gianna Manes(5)
President and CEO
Enmax Corporation
Calgary, Alberta
Donald J. Nelson (4)(5)
President
Fairway Resources Inc.
Calgary, Alberta
Michael Norris (3)
Corporate Director
Toronto, Ontario
Thomas C. O’Connor(3)
Corporate Director
Evergreen, Colorado
Charlene Ripley(5)
EVP & General Counsel
Goldcorp Inc.
Vancouver, British Columbia David G. Smith President and Chief Executive Officer
Keyera Corp.
Calgary, Alberta
William R. Stedman (4)(5)
Chairman and CEO
ENTx Capital Corporation
Calgary, Alberta
Janet Woodruff (3)
Corporate Director
West Vancouver, British Columbia
(1)
Chair of the Board (2)
Independent Lead Director (3)
Member of the Audit Committee (4)
Member of the Compensation and Governance Committee (5)
Member of the Health, Safety and Environment Committee
Head Office Keyera Corp.
Suite 200, Sun Life Plaza West Tower
144 – 4th Avenue S.W.
Calgary, Alberta T2P 3N4
Main phone: 403-205-8300
Website: www.keyera.com
David G. Smith President and Chief Executive Officer Graham Balzun Vice President, Corporate Responsibility Jarrod Beztilny Vice President Operations, Liquids Business Unit Michael Freeman Vice President, Commercial Suzanne Hathaway Senior Vice President, General Counsel and Corporate Secretary Rick Koshman Vice President, Engineering Dion O. Kostiuk Vice President, Human Resources and Corporate Services Steven B. Kroeker Senior Vice President and Chief Financial Officer Bradley W. Lock Senior Vice President, Gathering and Processing Business Unit Eileen Marikar Vice President, Controller Brian Martin Vice President, Business Development, Liquids Business Unit C. Dean Setoguchi Senior Vice President, Liquids Business Unit Jamie Urquhart Vice President Operations, Gathering and Processing Business Unit
Stock Exchange Listing The Toronto Stock Exchange Trading Symbol KEY
Trading Summary for Q4 2017
TSX:KEY – Cdn $
High $39.22 Low $34.64 Close: December 29, 2017 $35.42 Volume 52,913,633 Average Daily Volume
853,446
Auditors Deloitte LLP Chartered Professional Accountants Calgary, Canada
Investor Relations Contact: Lavonne Zdunich or Nick Kuzyk Toll Free: 1-888-699-4853 Direct: 403-205-7670 Email: [email protected]