(year ended march 31, 2014) 2014
TRANSCRIPT

SHINSHOCORPORATION
ANDCONSOLIDATED
SUBSIDIARIESFINANCIAL
STATEMENTS
(Year ended March 31, 2014)
2014

1 See accompanying notes to consolidated financial statements.
SHINSHO CORPORATION AND CONSOLIDATED SUBSIDIARIESCONSOLIDATED BALANCE SHEETS March 31, March 31, 2014 2014 2013 Thousands of (Millions of Yen) (Millions of Yen) U.S. DollarsASSETSCurrent assets:
Cash and cash equivalents ……………………………………… 16,288 18,535 158,266Notes and accounts receivables ………………………………… 137,420 130,101 1,335,221Inventories ……………………………………………………… 22,907 22,430 222,580Advance payments ……………………………………………… 14,181 7,261 137,791Deferred tax assets (Note 6) ……………………………………… 679 666 6,599Other current assets ……………………………………………… 3,205 2,888 31,141Allowance for doubtful receivables ……………………………… (212) (225) (2,063)
Total current assets ………………………………………… 194,471 181,659 1,889,537
Property and equipment:Land ……………………………………………………………… 1,278 1,312 12,422Building and structures ………………………………………… 5,500 4,441 53,444Machinery and equipment ……………………………………… 5,389 3,371 52,363Other ……………………………………………………………… 1,308 1,606 12,713Accumulated depreciation ……………………………………… (6,599) (5,496) (64,121)
Total property and equipment ……………………………… 6,877 5,235 66,822
Investments and other assets:Goodwill ………………………………………………………… 359 490 3,491Investment securities …………………………………………… 27,478 23,561 266,991Long-term loans ………………………………………………… 50 106 487Deferred tax assets (Note 6) ……………………………………… 444 572 4,316Other ……………………………………………………………… 2,801 2,875 27,217Allowance for doubtful receivables ……………………………… (164) (294) (1,596)
Total investments and other assets ………………………… 30,969 27,312 300,908
Total Assets ………………………………………………… 232,318 214,206 2,257,268

2 See accompanying notes to consolidated financial statements.
March 31, March 31, 2014 2014 2013 Thousands of (Millions of Yen) (Millions of Yen) U.S. DollarsLIABILITIES AND EQUITYCurrent liabilities:
Notes and accounts payables …………………………………… 121,947 115,728 1,184,879Short-term loans and currentportion of long term debt (Note 3) ……………………………… 20,894 25,872 203,019Income taxes payable …………………………………………… 626 497 6,085Deferred tax liabilities (Note 6) ………………………………… 6 15 61Accured bonuses to employees ………………………………… 818 737 7,948Deposits received ………………………………………………… 11,635 5,361 113,051Other current liabilities ………………………………………… 9,020 9,220 87,646
Total current liabilities ……………………………………… 164,949 157,432 1,602,692
Long-term liabilities:Long-term debt, less current portion (Note 3) …………………… 27,436 23,402 266,576Guaranteed deposits received …………………………………… 1,026 923 9,971Deferred tax liabilities (Note 6) ………………………………… 650 123 6,315Employees' retirement benefit (Note 8) ………………………… − 602 −Directors' retirement benefit ……………………………………… 38 34 370Net defined benefit liability (Note 8) …………………………… 627 − 6,100Negative goodwill ……………………………………………… 34 68 333Other long-term liabilities ……………………………………… 18 140 182
Total long-term liabilities …………………………………… 29,831 25,294 289,850
Contingent liabilities (Note 5)
Equity:Owners' Equity
Common stock …………………………………………………… 5,650 5,650 54,899Capital surplus …………………………………………………… 2,703 2,703 26,269Retained earnings ………………………………………………… 25,463 22,844 247,414Treasury stock …………………………………………………… (17) (17) (167)
Total owners' equity ………………………………………… 33,800 31,181 328,415
Accumulated other comprehensive income (loss)Net unrealized gain (loss) on available-for-sale securities ……… 1,501 705 14,589Net unrealized gain (loss) on derivative instruments …………… 54 43 527Foreign currency translation adjustments ……………………… 22 (2,191) 221
Total accumulated other comprehensive income (loss) …… 1,578 (1,442) 15,337
Noncontrolling interest 2,158 1,740 20,972
Total Equity ………………………………………………… 37,537 31,479 364,725
Total liabilities and equity …………………………………… 232,318 214,206 2,257,268
3 See accompanying notes to consolidated financial statements.
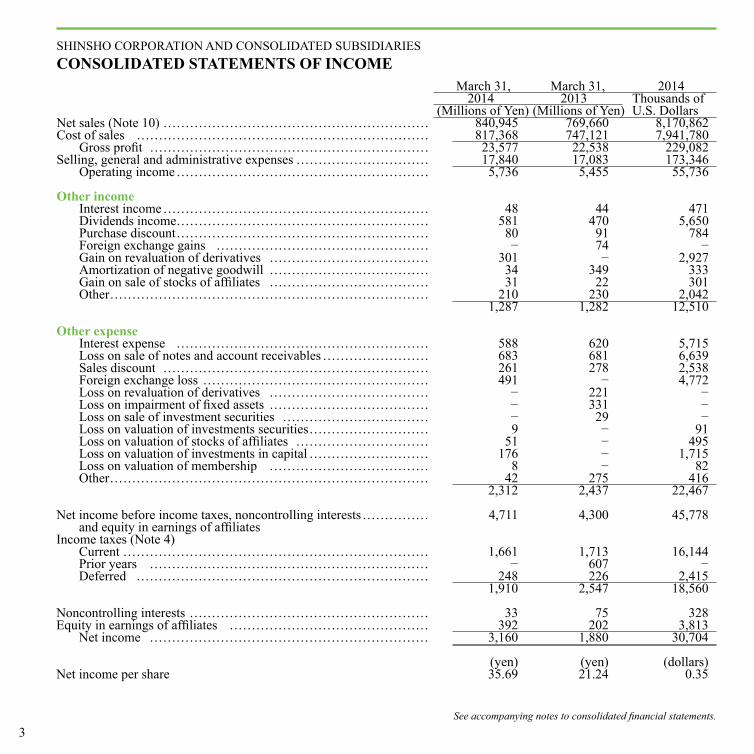
SHINSHO CORPORATION AND CONSOLIDATED SUBSIDIARIESCONSOLIDATED STATEMENTS OF INCOME March 31, March 31, 2014 2014 2013 Thousands of (Millions of Yen) (Millions of Yen) U.S. DollarsNet sales (Note 10) …………………………………………………… 840,945 769,660 8,170,862Cost of sales ………………………………………………………… 817,368 747,121 7,941,780
Gross profit ……………………………………………………… 23,577 22,538 229,082Selling, general and administrative expenses ………………………… 17,840 17,083 173,346
Operating income ………………………………………………… 5,736 5,455 55,736
Other incomeInterest income …………………………………………………… 48 44 471Dividends income………………………………………………… 581 470 5,650Purchase discount ………………………………………………… 80 91 784Foreign exchange gains ………………………………………… − 74 −Gain on revaluation of derivatives ……………………………… 301 − 2,927Amortization of negative goodwill ……………………………… 34 349 333Gain on sale of stocks of affiliates ……………………………… 31 22 301Other ……………………………………………………………… 210 230 2,042 1,287 1,282 12,510
Other expenseInterest expense ………………………………………………… 588 620 5,715Loss on sale of notes and account receivables …………………… 683 681 6,639Sales discount …………………………………………………… 261 278 2,538Foreign exchange loss …………………………………………… 491 − 4,772Loss on revaluation of derivatives ……………………………… − 221 −Loss on impairment of fixed assets ……………………………… − 331 −Loss on sale of investment securities …………………………… − 29 −Loss on valuation of investments securities ……………………… 9 − 91Loss on valuation of stocks of affiliates ………………………… 51 − 495Loss on valuation of investments in capital ……………………… 176 − 1,715Loss on valuation of membership ……………………………… 8 − 82Other ……………………………………………………………… 42 275 416 2,312 2,437 22,467
Net income before income taxes, noncontrolling interests …………… 4,711 4,300 45,778and equity in earnings of affiliates
Income taxes (Note 4)Current …………………………………………………………… 1,661 1,713 16,144Prior years ……………………………………………………… − 607 −Deferred ………………………………………………………… 248 226 2,415 1,910 2,547 18,560
Noncontrolling interests ……………………………………………… 33 75 328Equity in earnings of affiliates ……………………………………… 392 202 3,813
Net income ……………………………………………………… 3,160 1,880 30,704
(yen) (yen) (dollars)Net income per share 35.69 21.24 0.35

4 See accompanying notes to consolidated financial statements.
SHINSHO CORPORATION AND CONSOLIDATED SUBSIDIARIESCONSOLIDATED STATEMENTS OF SHAREHOLDERS' EQUITY March 31, March 31, 2014 2014 2013 Thousands of (Millions of Yen) (Millions of Yen) U.S. DollarsCommon stock:
Balance at beginning of year …………………………………… 5,650 5,650 54,899Balance at end of period ………………………………………… 5,650 5,650 54,899
Capital surplus:Balance at beginning of year …………………………………… 2,703 2,703 26,269Balance at end of year …………………………………………… 2,703 2,703 26,269
Retained earnings:Balance at beginning of year …………………………………… 22,844 21,415 221,965Adjustment on retained earnings of affiliated company ………… (9) − (91)Effect of changes in accounting policies applied to
foreign subsidiaries ………………………………………… − 79 −Cash dividends …………………………………………………… (531) (531) (5,163)Net income ……………………………………………………… 3,160 1,880 30,704Balance at end of period ………………………………………… 25,463 22,844 247,414
Net unrealized gain (loss) on available-for-sale securities:Balance at beginning of year …………………………………… 705 264 6,852Net change in unrealized gain (loss) on
available -for-sale securities ………………………………… 796 440 7,737Balance at end of period ………………………………………… 1,501 705 14,589
Net unrealized gain (loss) on derivative instruments:Balance at beginning of year …………………………………… 43 (11) 423Net change in unrealized gain (loss) on
derivative instruments ……………………………………… 10 55 103Balance at end of period ………………………………………… 54 43 527
Foreign currency transaction adjustment:Balance at beginning of year …………………………………… (2,191) (3,377) (21,292)Net change in foreign currency translation adjustments ………… 2,214 1,186 21,513Balance at end of period ………………………………………… 22 (2,191) 221
Treasury stock:Balance at beginning and end of year …………………………… (17) (17) (167)Net change in treasury stock …………………………………… (0) (0) (0)Balance at end of period ………………………………………… (17) (17) (167)
Noncontrolling interest:Balance at beginning and end of year …………………………… 1,740 1,904 16,909Net change in noncontrolling interest …………………………… 418 (163) 4,062Balance at end of period ………………………………………… 2,158 1,740 20,972
Total shareholders' equity 37,537 31,479 364,725
(thousands) (thousands)Number of shares of common stock authorized ……………………… 270,000 270,000Number of shares of common stock issued ………………………… 88,606 88,606

5 See accompanying notes to consolidated financial statements.
SHINSHO CORPORATION AND CONSOLIDATED SUBSIDIARIESCONSOLIDATED STATEMENTS OF CASH FLOWS March 31, March 31, 2014 2014 2013 Thousands of (Millions of Yen) (Millions of Yen) U.S. DollarsOperating activities:
Net income before income taxes, noncontrolling interests andequity in earnings of affiliates. …………………………………… 4,711 4,300 45,778Depreciation ……………………………………………………… 957 724 9,302Amortization of (negative) goodwill …………………………… 96 (207) 936Increase (Decrease) of reserve and provision …………………… (70) (19) (684)Net defined benefit liability ……………………………………… 54 − 532Interest and dividend income …………………………………… (630) (515) (6,122)Interest expense ………………………………………………… 588 620 5,715Loss on impairment of fixed assets ……………………………… − 331 −Loss on sale and dispose of property …………………………… 9 2 92Loss (Gain) on sale of stocks of affiliates ……………………… (31) (22) (301)Loss on sale of investment securities …………………………… − 29 −Loss on valuation of investment securities ……………………… 236 − 2,302Loss (Gain) on sale of membership ……………………………… − (5) −Loss on valuation of membership ……………………………… 8 23 82Decrease (Increase) in trade receivables ………………………… (4,893) 17,582 (47,543)Decrease (Increase) in inventories ……………………………… 916 2,804 8,906Increase (Decrease) in trade payables …………………………… 4,186 (14,086) 40,676Decrease (Increase) in other receivables ………………………… (87) (251) (846)Other, net ………………………………………………………… (940) (5,027) (9,141)
Sub-total …………………………………………………… 5,113 6,283 49,688Interest and dividend received …………………………………… 688 746 6,689Interest paid ……………………………………………………… (588) (624) (5,717)Income taxes paid ………………………………………………… (1,485) (2,813) (14,437)
Net cash provided by operating activities …………………… 3,728 3,592 36,222
Investing activities:Purchase of property and equipment …………………………… (1,464) (1,381) (14,232)Proceeds from sale of property and equipment ………………… 5 5 58Purchase of investment securities ……………………………… (1,713) (2,350) (16,652)Proceeds from sale of investment securities …………………… 0 40 1Purchase of stocks of affiliates …………………………………… (506) (616) (4,924)Proceeds from sale of stocks of affiliates ………………………… − 74 −Increase in short-term loans ……………………………………… (144) (1) (1,406)Collection of short-term loans …………………………………… 105 57 1,025Increase in long-term loans ……………………………………… (7) (6) (73)Collection of long-term loans …………………………………… 62 243 605Other, net ………………………………………………………… (354) (376) (3,443)
Net cash used in investing activities ………………………… (4,017) (4,311) (39,039)
Financing activities:Change in short-term debt, net …………………………………… (2,417) (2,783) (23,491)Proceeds from long-term debt …………………………………… 5,020 11,008 48,785Repayment of long-term debt …………………………………… (4,797) (6,709) (46,617)Repayment of finance lease debt ………………………………… (16) (21) (165)Dividends paid …………………………………………………… (531) (531) (5,163)Dividends paid to noncontrolling interest ……………………… (3) (3) (30)Proceeds from paid-in capital of noncontrolling interest ………… 37 376 366Other, net ………………………………………………………… (0) (0) (0)
Net cash used in financial activities ………………………… (2,708) 1,335 (26,317)
Effect of exchange on cash and cash equivalents …………………… 673 473 6,542Net increase (decrease) in cash and cash equivalents ………………… (2,325) 1,089 (22,592)Cash and cash equivalents at beginning of year ……………………… 18,513 17,460 179,886Effect of changes in consolidated subsidiaries ……………………… 93 (36) 907Cash and cash equivalents at end of year …………………………… 16,282 18,513 158,201

6
SHINSHO CORPORATION AND CONSOLIDATED SUBSIDIARIESNOTES TO THE CONSOLIDATED FINANCIAL STATEMENTS
1. Basis of presenting consolidated financial statements
The accompanying consolidated financial statements of Shinsho Corporation (the" Company") and its consolidated subsidiaries have been prepared in accordance with the provisions set forth in the Japanese Financial Instruments and Exchange Act and its related accounting regulations and in conformity with accounting principles generally accepted in Japan ("Japanese GAAP"), which are different in certain respects as to the application and disclosure requirements of International Financial Reporting Standards. Japanese yen figures less than a million yen are rounded down to the nearest million yen and U.S. dollar figures less than a thousand dollars are rounded down to the nearest thousand dollars, except for per share data. In preparing these consolidated financial statements, certain reclassifications and rearrangements have been made to the consolidated financial statements issued domestically in order to present them in a form which is more familiar to readers outside Japan. In addition, certain reclassifications have been made in the 2013 financial statements to conform to the classifications used in 2014. The accompanying consolidated financial statements are stated in Japanese yen, the currency of the country in which the Company is incorporated and principally operates. The translation of Japanese yen amounts into U.S. dollar amounts are included solely for the convenience of readers outside Japan and have been made at the rate of ¥102.92 to $1, the rate of exchange at March 31, 2014. Such translation should not be construed as representations that Japanese yen amounts could be converted into U.S. dollars at that or any other rate.
2. Summary of significant accounting policies
(1) Scope of consolidationThe Company had 28 subsidiaries (majority-owned companies) at March 31, 2014.The accompanying consolidated financial statements include the accounts of the Company and 28 of its subsidiaries for the year ended March 31, 2014, which are listed below:
Shinsho American CorporationShinsho Steel Products CorporationShinsho Non-ferrous CorporationShinko Shoji Singapore Pte.Ltd.Thai Escorp Ltd.Shinsho (Malaysia) Sdn.Bhd.
Asia Chemical Engineering Co.,Ltd.Kobelco Trading Shanghai Co., Ltd.Suzhou Shinko-shoji Material Co.,Ltd.Matsubo CorporationKobelco Plate Processing India Private Limited17 other consolidated subsidiaries
(2) Elimination and combinationFor the purposes of preparing the consolidated financial statements of the Company and its consolidated subsidiaries, all significant inter-company transactions, account balances and unrealized profits among the Company and its consolidated subsidiaries have been entirely eliminated to "Noncontrolling Interests". In the elimination, any differences between the cost of investments in subsidiaries and the amount of underlying equity in net assets of the subsidiaries is treated as an asset "Goodwill" or a liability "Negative goodwill", and amortized over the period of five years on a straight-line basis.(3) Equity method of accounting for investments in affiliatesThe Company had 24 affiliates (companies owned from 20% to 50% actually) at March 31, 2014. The equity method is applied to these 17 investments.(4) Cash and cash equivalentsCash and cash equivalents include all highly liquid investments. Cash equivalents are generally at the maturity of three months or less and readily convertible to cash. Cash equivalents near maturity indicate insignificant risk of changes in value because of changes in interest rates.(5) Investment securitiesSecurities are classified into the categories based on the purpose of holding, which can result in the different measurement and can account for the changes in the fair value. Debt securities that are intended to be held to maturity ("held-to-maturity debt securities") are measured at amortized cost in the balance sheet. Securities other than held-to-maturity debt securities and the equity investment in subsidiaries and affiliates ("other securities") are measured at the fair value. The difference between the fair value and the historical cost is recorded in the category of shareholder's equity. The historical cost is determined by the moving average cost. Securities that have no market price are stated at their historical cost.(6) InventoriesInventories are mainly stated at cost determined by the moving average method. (unless market value of inventories declines significantly and is not expected to recover to cost, in such cases

7
costs are reduced to net realizable values).(7) Property and equipmentProperty and equipment are stated at cost. Depreciation of property and equipment is computed principally by the declining balance method. However, depreciation of buildings booked from April 1, 1998 is computed using the straight-line method.(8) Long-lived assetsThe Company reviews its long-lived assets for the impairment whenever events or changes in circumstance indicate the carrying amount of an asset or asset group may not be recoverable. An impairment loss would be recognized if the carrying amount of an asset or asset group exceeds the sum of the undiscounted future cash flows expected as a result of the continuous use and eventual disposition of the asset or asset group. The impairment loss would be measured when the carrying amount of the asset exceeds its recoverable amount, which is higher of the discounted cash flows from the continuous use and eventual disposition of the asset or the net selling price at disposition.(9) Allowance for retirement and severance benefitsAccrued employees' retirement benefits in subsidiaries are provided mainly at the amount calculated based on the retirement benefit obligation and the fair value of the pension plan assetsas of the balance sheet date.(10) Allowance for doubtful receivablesThe allowance for doubtful receivables is provided in amounts which are sufficient to cover possible losses on collection. It consists of individually estimated uncollectible amounts and amounts calculated using the actual rate of historical bad debt.(11) Finance leasesEffective April 1, 2008, "Accounting Standard for Lease Transactions"(ASBJ Statement No.13) and "Guidance on Accounting Standard for Lease Transactions"(ASBJ Guidance No.16) were applied. Lease assets related to finance lease transactions that do not involve the transfer of ownership are depreciated on a straight-line basis, with the lease period used their useful lived and no residual value. For finance lease transactions which took place before April 1, 2008, the accounting method remainds same, as for ordinary operating lease transactions.(12) Income taxesThe asset and liability approach is used to recognize deferred tax assets and liabilities for the expected future tax consequences of temporary differences between the carrying amounts of assets and liabilities for financial reporting purposes and the amounts
used for income tax purposes.(13) Translation of foreign currency accountsCurrent and non-current monetary assets and liabilities denominated by foreign currencies are translated into Japanese yen at the exchange rates at the end of fiscal year, and the resulting exchange gains and losses are recognized in the income statement. Balance sheets of consolidated overseas subsidiaries are translated into Japanese yen at the exchange rates at the end of fiscal year except for tockholders' equity accounts, which are translated at the historical rates. Income statements of consolidated overseas subsidiaries are translated at the average exchange rates. The resulting translation adjustments are reflected in the consolidated financial statements as "Foreign currency translation adjustments".(14) Derivative financial instrumentsThe Company and its subsidiaries use derivative financial instruments to manage its exposures to fluctuations in foreign exchange rates and comodity prices. Derivatives include foreign currency forward contracts and comodities futures, which are utilized by the Company to reduce foreign currency exchange rate risks and comodity price risks. The Company and its subsidiaries do not enter into derivatives for trading or speculative purposes. The Company and its subsidiaries have taken various steps, including the establishment of internal management rules, to ensure that transactions are implemented appropriately and that risk is managed. Gains and losses on hedge of existing assets or liabilities are included in carrying amounts of those assets or liabilities and ultimately recognized the income as a part of those carrying amounts. Gains and losses related to qualifying hedges of firm commitments and anticipated transactions are deferred and recognized the income, or adjustments of carrying amounts, when the hedged transaction occurs.(15) Net income per shareThe computation of net income per share is based on the weighted average number of issued shares of common stock outstanding during the relevant period.
3. Short-term debt and long-term debt
Short-term debt at March 31, 2014 and 2013 consisted of the following:
8
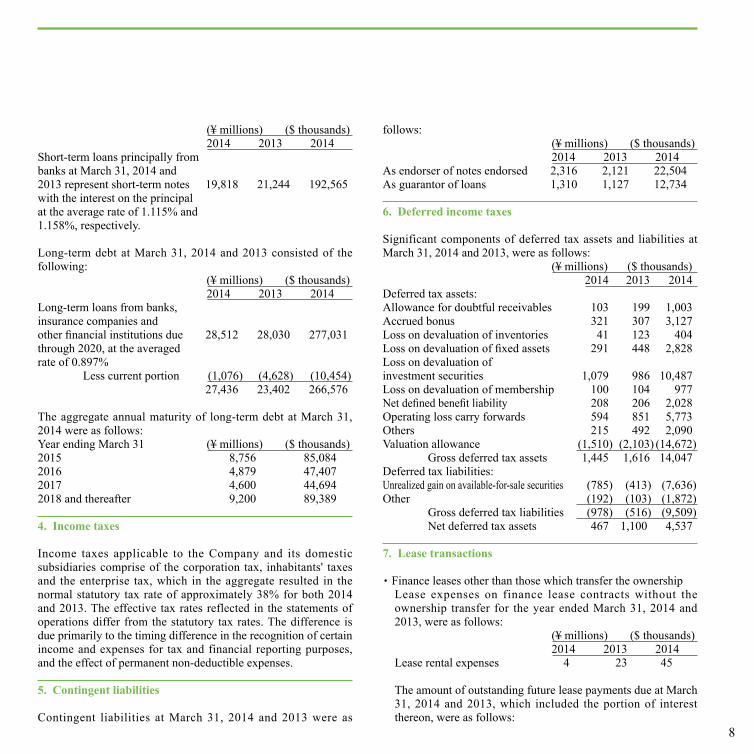
(¥ millions) ($ thousands) 2014 2013 2014Short-term loans principally from banks at March 31, 2014 and 2013 represent short-term notes 19,818 21,244 192,565with the interest on the principal at the average rate of 1.115% and 1.158%, respectively.
Long-term debt at March 31, 2014 and 2013 consisted of the following: (¥ millions) ($ thousands) 2014 2013 2014Long-term loans from banks, insurance companies and other financial institutions due 28,512 28,030 277,031through 2020, at the averaged rate of 0.897%
Less current portion (1,076) (4,628) (10,454) 27,436 23,402 266,576
The aggregate annual maturity of long-term debt at March 31, 2014 were as follows: Year ending March 31 (¥ millions) ($ thousands)2015 8,756 85,0842016 4,879 47,4072017 4,600 44,6942018 and thereafter 9,200 89,389
4. Income taxes
Income taxes applicable to the Company and its domestic subsidiaries comprise of the corporation tax, inhabitants' taxes and the enterprise tax, which in the aggregate resulted in the normal statutory tax rate of approximately 38% for both 2014 and 2013. The effective tax rates reflected in the statements of operations differ from the statutory tax rates. The difference is due primarily to the timing difference in the recognition of certain income and expenses for tax and financial reporting purposes, and the effect of permanent non-deductible expenses.
5. Contingent liabilities
Contingent liabilities at March 31, 2014 and 2013 were as
follows: (¥ millions) ($ thousands) 2014 2013 2014As endorser of notes endorsed 2,316 2,121 22,504As guarantor of loans 1,310 1,127 12,734
6. Deferred income taxes
Significant components of deferred tax assets and liabilities at March 31, 2014 and 2013, were as follows: (¥ millions) ($ thousands) 2014 2013 2014Deferred tax assets:Allowance for doubtful receivables 103 199 1,003Accrued bonus 321 307 3,127Loss on devaluation of inventories 41 123 404Loss on devaluation of fixed assets 291 448 2,828Loss on devaluation of investment securities 1,079 986 10,487Loss on devaluation of membership 100 104 977Net defined benefit liability 208 206 2,028Operating loss carry forwards 594 851 5,773Others 215 492 2,090Valuation allowance (1,510) (2,103) (14,672)
Gross deferred tax assets 1,445 1,616 14,047Deferred tax liabilities:Unrealized gain on available-for-sale securities (785) (413) (7,636)Other (192) (103) (1,872)
Gross deferred tax liabilities (978) (516) (9,509)Net deferred tax assets 467 1,100 4,537
7. Lease transactions
・Finance leases other than those which transfer the ownershipLease expenses on finance lease contracts without the ownership transfer for the year ended March 31, 2014 and 2013, were as follows:
(¥ millions) ($ thousands) 2014 2013 2014
Lease rental expenses 4 23 45
The amount of outstanding future lease payments due at March 31, 2014 and 2013, which included the portion of interest thereon, were as follows:
9
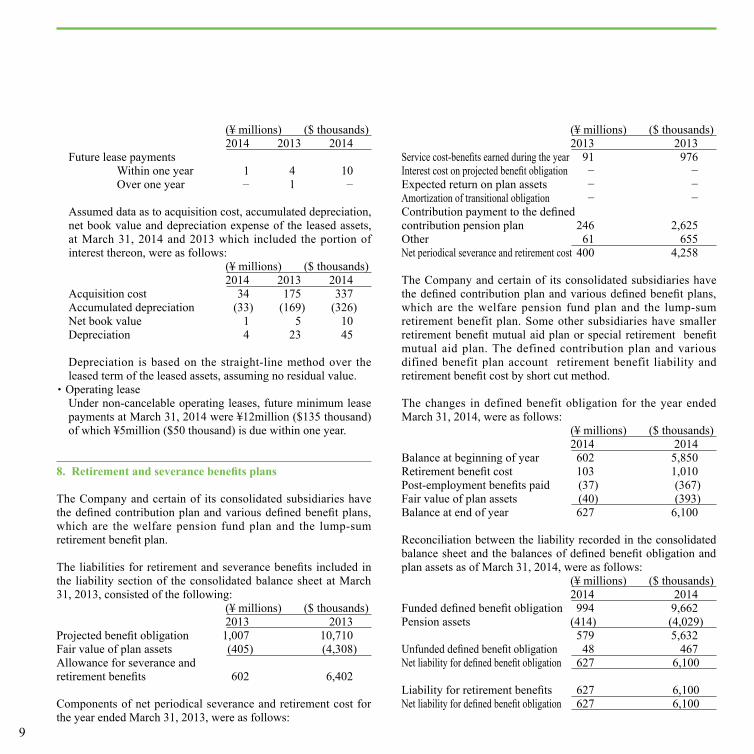
(¥ millions) ($ thousands) 2014 2013 2014Future lease payments
Within one year 1 4 10Over one year − 1 −
Assumed data as to acquisition cost, accumulated depreciation, net book value and depreciation expense of the leased assets, at March 31, 2014 and 2013 which included the portion of interest thereon, were as follows: (¥ millions) ($ thousands) 2014 2013 2014Acquisition cost 34 175 337Accumulated depreciation (33) (169) (326)Net book value 1 5 10Depreciation 4 23 45
Depreciation is based on the straight-line method over the leased term of the leased assets, assuming no residual value.
・Operating leaseUnder non-cancelable operating leases, future minimum lease payments at March 31, 2014 were ¥12million ($135 thousand) of which ¥5million ($50 thousand) is due within one year.
8. Retirement and severance benefits plans
The Company and certain of its consolidated subsidiaries have the defined contribution plan and various defined benefit plans, which are the welfare pension fund plan and the lump-sum retirement benefit plan.
The liabilities for retirement and severance benefits included in the liability section of the consolidated balance sheet at March 31, 2013, consisted of the following: (¥ millions) ($ thousands) 2013 2013Projected benefit obligation 1,007 10,710Fair value of plan assets (405) (4,308)Allowance for severance and retirement benefits 602 6,402
Components of net periodical severance and retirement cost for the year ended March 31, 2013, were as follows:
(¥ millions) ($ thousands) 2013 2013Service cost-benefits earned during the year 91 976Interest cost on projected benefit obligation − −Expected return on plan assets − −Amortization of transitional obligation − −Contribution payment to the defined contribution pension plan 246 2,625Other 61 655Net periodical severance and retirement cost 400 4,258
The Company and certain of its consolidated subsidiaries have the defined contribution plan and various defined benefit plans, which are the welfare pension fund plan and the lump-sum retirement benefit plan. Some other subsidiaries have smaller retirement benefit mutual aid plan or special retirement benefit mutual aid plan. The defined contribution plan and various difined benefit plan account retirement benefit liability and retirement benefit cost by short cut method.
The changes in defined benefit obligation for the year ended March 31, 2014, were as follows: (¥ millions) ($ thousands) 2014 2014Balance at beginning of year 602 5,850Retirement benefit cost 103 1,010Post-employment benefits paid (37) (367)Fair value of plan assets (40) (393)Balance at end of year 627 6,100
Reconciliation between the liability recorded in the consolidated balance sheet and the balances of defined benefit obligation and plan assets as of March 31, 2014, were as follows: (¥ millions) ($ thousands) 2014 2014Funded defined benefit obligation 994 9,662Pension assets (414) (4,029) 579 5,632Unfunded defined benefit obligation 48 467Net liability for defined benefit obligation 627 6,100
Liability for retirement benefits 627 6,100Net liability for defined benefit obligation 627 6,100
10
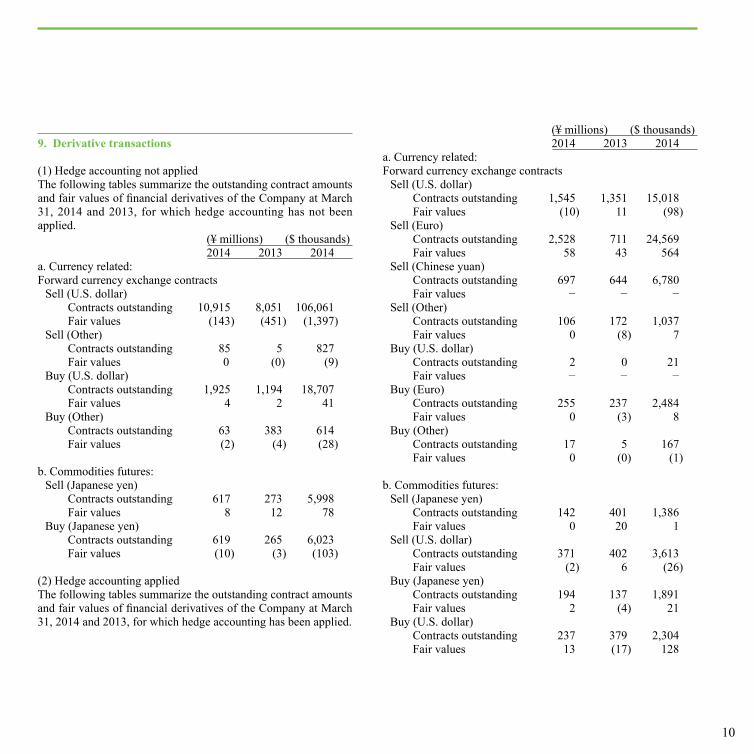
9. Derivative transactions
(1) Hedge accounting not appliedThe following tables summarize the outstanding contract amounts and fair values of financial derivatives of the Company at March 31, 2014 and 2013, for which hedge accounting has not been applied. (¥ millions) ($ thousands) 2014 2013 2014a. Currency related:Forward currency exchange contracts
Sell (U.S. dollar)Contracts outstanding 10,915 8,051 106,061Fair values (143) (451) (1,397)
Sell (Other)Contracts outstanding 85 5 827Fair values 0 (0) (9)
Buy (U.S. dollar)Contracts outstanding 1,925 1,194 18,707Fair values 4 2 41
Buy (Other)Contracts outstanding 63 383 614Fair values (2) (4) (28)
b. Commodities futures:Sell (Japanese yen)
Contracts outstanding 617 273 5,998Fair values 8 12 78
Buy (Japanese yen)Contracts outstanding 619 265 6,023Fair values (10) (3) (103)
(2) Hedge accounting appliedThe following tables summarize the outstanding contract amounts and fair values of financial derivatives of the Company at March 31, 2014 and 2013, for which hedge accounting has been applied.
(¥ millions) ($ thousands) 2014 2013 2014a. Currency related:Forward currency exchange contracts
Sell (U.S. dollar)Contracts outstanding 1,545 1,351 15,018Fair values (10) 11 (98)
Sell (Euro)Contracts outstanding 2,528 711 24,569Fair values 58 43 564
Sell (Chinese yuan)Contracts outstanding 697 644 6,780Fair values − − −
Sell (Other)Contracts outstanding 106 172 1,037Fair values 0 (8) 7
Buy (U.S. dollar)Contracts outstanding 2 0 21Fair values − − −
Buy (Euro)Contracts outstanding 255 237 2,484Fair values 0 (3) 8
Buy (Other)Contracts outstanding 17 5 167Fair values 0 (0) (1)
b. Commodities futures:Sell (Japanese yen)
Contracts outstanding 142 401 1,386Fair values 0 20 1
Sell (U.S. dollar)Contracts outstanding 371 402 3,613Fair values (2) 6 (26)
Buy (Japanese yen)Contracts outstanding 194 137 1,891Fair values 2 (4) 21
Buy (U.S. dollar)Contracts outstanding 237 379 2,304 Fair values 13 (17) 128

11
For the year ended March 31, 2013
For the year ended March 31, 2014
For the year ended March 31, 2014
10. Segment information
Notes: The segment is classified with the kind of inventories and the common sales route based on the sales department of the Company.
Iron & Steel Raw Materials Nonferrous MetalsNet sales Outside customers 254,855 298,868 158,226
Inter - segment − − 1Total 254,855 298,868 158,228
Segment profit or loss 2,580 993 467Segment assets 84,339 31,131 48,973 Other items Depreciation 212 87 199
Amortization of goodwill − − − Amortization of negative goodwill 10 − 133Interest received 22 4 14Interest expense 162 138 124Equity in earnings of affiliates 143 − 50Investments in equity method affiliates 2,890 − 309Increase from tangible fixed assets and intangible assets 825 190 481
Iron & Steel Raw Materials Nonferrous MetalsNet sales Outside customers 284,460 328,529 178,108
Inter - segment − − 1Total 284,460 328,529 178,109
Segment profit or loss 2,781 826 909Segment assets 96,533 36,211 54,168Other items Depreciation 347 123 237
Amortization of goodwill − − −Amortization of negative goodwill − − 19Interest received 37 6 17Interest expense 171 101 136Equity in earnings of affiliates 313 − 72Investments in equity method affiliates 3,943 − 394Increase from tangible fixed assets and intangible assets 1,477 57 177
Iron & Steel Raw Materials Nonferrous MetalsNet sales Outside customers 2,763,896 3,192,085 1,730,549
Inter - segment − − 14Total 2,763,896 3,192,085 1,730,564
Segment profit or loss 27,021 8,034 8,837Segment assets 937,943 351,840 526,314Other items Depreciation 3,372 1,195 2,312
Amortization of goodwill − − −Amortization of negative goodwill − − 190Interest received 365 65 167Interest expense 1,670 989 1,323Equity in earnings of affiliates 3,043 − 707Investments in equity method affiliates 38,320 − 3,834Increase from tangible fixed assets and intangible assets 14,358 563 1,724

12
( Millions of yen )
( Millions of yen )
( Thousands of US$ )
Machinery & Electronics Welding Total Other Corporate / Elimination Consolidated61,758 37,859 811,568 370 (42,277) 769,660
0 − 2 − (2) − 61,758 37,859 811,570 370 (42,279) 769,660
319 440 4,802 59 (0) 4,860 31,349 15,270 211,063 340 2,802 214,206
150 47 697 26 − 724 141 − 141 − − 141 57 147 349 − − 349
7 8 57 0 (12) 44 136 70 633 − (12) 620
− 10 204 − (1) 202 − 309 3,509 − − 3,509
264 76 1,838 − − 1,838
Machinery & Electronics Welding Total Other Corporate / Elimination Consolidated59,669 36,931 887,699 380 (47,134) 840,945
− − 1 − (1) −59,669 36,931 887,701 380 (47,136) 840,945
403 232 5,154 37 126 5,31829,779 17,058 233,750 520 (1,953) 232,318
162 59 930 26 − 957130 − 130 − − 130
− 14 34 − − 3412 12 86 0 (38) 48
136 80 626 − (38) 588− 5 391 − 1 392− 310 4,648 − − 4,648
78 34 1,825 − − 1,825
Machinery & Electronics Welding Total Other Corporate / Elimination Consolidated579,770 358,839 8,625,139 3,695 (457,973) 8,170,862
− − 14 − (14) −579,770 358,839 8,625,154 3,695 (457,988) 8,170,862
3,923 2,261 50,076 364 1,233 51,676289,342 165,749 2,271,188 5,056 (18,978) 2,257,268
1,582 579 9,040 260 − 9,3021,269 − 1,269 − − 1,269
− 142 332 − − 333125 120 842 2 (374) 471
1,324 782 6,088 − (374) 5,715− 51 3,801 − 11 3,813− 3,013 45,167 − − 45,168
764 331 17,740 − − 17,741

13
Investor Information (As of March 31, 2014)
Founded ……………………………………………………………………………………… November. 12 1946Number of Employees ……………………………………………………………………… 538 (Consolidated 1,277)Fiscal Year …………………………………………………………………………………… April 1 − March 31
Ordinary General Meeting of Shareholders ………………………………………………… June of each yearAuthorised Share Capital …………………………………………………………………… 270,000,000Number of Shares Issued …………………………………………………………………… 88,605,625Number of Shareholders ……………………………………………………………………… 4,774
Principal ShareholdersAt March 31, 2014, the ten largest Shareholders of the Company's Shareholders were as follows:
Thousands of shares Investment Ratio
Mizuho Trust & Banking Co., Ltd.(Kobe Steel,Ltd. Retirement Benefit Trust Account) 19,062 21.52%
Kobe Steel, Ltd. 11,791 13.31
Shinsho Client Shareholding Association 6,457 7.29
Mr. Masayoshi Yamauchi 2,197 2.48
Goldman Sachs International 1,599 1.81
SINFONIA TECHNOLOGY CO., LTD. 1,500 1.69
Shinsho Employees' Shareholding Association 1,263 1.43
The Master Trust Bank of Japan, Ltd. (Trust Account) 1,104 1.25
The Bank of Tokyo-Mitsubishi UFJ, Ltd. 1,092 1.23
Sumitomo Mitusi Banking Corporation 1,034 1.17
Note: The Investment ratio is computed excluding 34,274 shares of treasury stock held by Shinsho Corporation.

14
Head Office● OsakaYodoyabashi Square, 6-18, Kitahama 2-chome, Chuo-ku, Osaka, 541-8557 JapanTel:+81-6-6206-7010 Fax:+81-6-6206-7018
● TokyoEitaro Bldg.2-5, Nihonbashi 1-chome, Chuo-ku, Tokyo, 103-8261 JapanTel:+81-3-3276-2036 Fax: +81-3-3276-2311
Overseas Representative Offices● BeijingRoom 1602,Bldg B, Winterless Centre,No.1 West Dawang Road, Chaoyang District,Beijing 100026Tel:+86-10-8591-1531 Fax:+86-10-8591-1525
● DubaiDubai Airport Freezone Bldg. 2E, East Wing,1st Floor. No.2E 103 P.O.Box 293563.Dubai,United Arab EmiratesTel:+971-4-299-7003 Fax:+971-4-299-7004
Overseas Subsidiaries● SHINSHO AMERICAN CORPORATION26200 Town Center Drive, Suite 160, Novi, MI 48375, U.S.A.Tel:+1-248-675-5569 Fax: +1-248-675-5575
● GRAND BLANC PROCESSING, L.L.C.10151 Gainey Drive, Holly, MI 48442, U.S.A.Tel:+1-810-694-6000 Fax: +1-810-694-5164
● SHINSHO MEIHOKU WIRE, INC.3475 W. International Ct., Columbus, IN 47201Tel:+1-812-342-2409 Fax:+1-812-342-3257
● SHINSHO MEXICO S.A. DE C.V.Paseo de la Altiplanicie No.11. Int. 3-A Col. Villas de Irapuato, C.P. 36670, Irapuato, Guanajuato, MexicoTel:+52-462-104-5019
● SHINSHO EUROPE GMBHBerliner Allee 55, 40212 Düsseldorf, GermanyTel:+49-211-4181-960 Fax:+49-211-4181-9629
● THAI ESCORP LTD.1126/2 Vanit Bldg.,Ⅱ , Room 2102 2103,New Petchburi Road, Makkasan,Rajthevee, Bangkok 10400, ThailandTel:+66-2-254-7645 Fax:+66-2-254-7644
● TES E & M SERVICE CO.,LTD.1126/2 Vanit Bldg,Ⅱ , Room 2102 2103,New Petchburi Road, Makkasan,Rajthevee, Bangkok 10400, ThailandTel:+66-2-254-7645 Fax:+66-2-254-7644
● SHINSHO (MALAYSIA) SDN. BHD.Suite 503, 5th Floor, Kenanga International Building, Jalan Sultan Ismail, 50250 Kuala Lumpur, MalaysiaTel:+60-3-2161-6588 Fax:+60-3-2161-8228
● SHINKO SHOJI SINGAPORE PTE. LTD.8 shenton way, #25 - 03A AXA Tower, Singapore 068811Tel:+65-6220-3329 Fax:+65-6224-4700
●SHINSHO (PHILIPPINES) CORPORATIONUnit 2107 Philippine Axa Life Centre Sen.Gil Puyat Avenue Makati City 1200, PhilippinesTel:+63-2-848-5171 Fax:+63-2-848-5149
● KOBELCO TRADING INDIA PRIVATE LIMITED308, 3rd Floor, Rectangle-1, D-4 Saket District Centre, New Delhi-110017, India.Tel:+91-11-4673-7192 Fax:+91-11-4673-7195
●KOBELCO PLATE PROCESSING INDIA PRIVATE LIMITED2nd Floor,Amble Side, No.8, Khader Nawaz Khan Road, Nungambakkam, Chennai-600 006, IndiaTel:+91-44-4904-0104 Fax:+91-44-4203-6467
● PT.KOBELCO TRADING INDONESIAWisma Keiai, 7th Floor, Suite 0703 Jl. Jend Sudirman Kav.3 Jakarta 10220, IndonesiaTel:+62-21-572-4325 Fax:+62-21-572-4327
● KOBELCO TRADING VIETNAM CO., LTD.Unit 1808, 18th Floor, SUN WAH TOWER, 115 Nguyen Hue Boulevard, District 1, Ho Chi Minh City, VietnamTel:+84-8-3911-0900 Fax:+84-8-3911-0902
● SHINSHO AUSTRALIA PTY.LTD.Level 12, 124 Walker Street, North Sydney N.S.W. 2060, AustraliaTel:+61-2-9959-5660 Fax:+61-2-9959-5740
● KOBELCO TRADING (SHANGHAI) CO., LTD.Room 3703, Hong Kong New World Tower, 300 Huaihai(M) Road, Huangpu District,Shanghai 200021, P.R.ChinaTel:+86-21-5396-6464 Fax:+86-21-5396-5975
● SHANGHAI SHINSHO TRADING CO., LTD.Room 3703, Hong Kong New World Tower, 300 Huaihai(M) Road, Huangpu District,Shanghai 200021, P.R. ChinaTel:+86-21-5396-6464 Fax:+86-21-5396-5975
● SUZHOU SHINKO-SHOJI MATERIAL CO., LTD.No.46 Pingsheng Road, Forth DistrictSuzhou Industrial Park Jiangsu Province. P.R. ChinaTel:+86-512-6287-1233 Fax:+86-512-6287-1231
● KOBELCO PRECISION PARTS (Suzhou) CO., LTD.No.12 Factory, No.666, Jianlin Road, Suzhou Hi-tech. District, Jiangsu, 215151, P.R. ChinaTel:+86-512-8187-8277 Fax:+86-512-8187-8272
● TAIWAN SHINSHO CORP7F-2, No.146 Sung Chiang Road.,Taipei 10458 TaiwanTel:+886-2-2560-1085 Fax:+886-2-2560-1086
● SHINSHO KOREA CO., LTD.9F Bundang Square, 263 Seohyun-Dong, Bundang-Gu, Sungnam-Si, Kyunggi-Do, Korea 463-824Tel:+82-31-707-7915 Fax:+82-31-707-8394
● SHINSHO OSAKA SEIKO (NANTONG) CORPORATIONNo.1 Qing Feng Road Sutong Science and Technology Industrial Park, Nantong, Jiangsu ProvinceTel:+86-513-8919-1055 Fax:+86-513-8919-1056
