(year ended march 31, 2020) 2020
TRANSCRIPT

SHINSHOCORPORATION
ANDCONSOLIDATED
SUBSIDIARIESFINANCIAL
STATEMENTS
(Year ended March 31, 2020)
2020

1 See accompanying notes to consolidated financial statements.
SHINSHO CORPORATION AND CONSOLIDATED SUBSIDIARIESCONSOLIDATED BALANCE SHEETS March 31, March 31, 2020 2020 2019 Thousands of (Millions of Yen) (Millions of Yen) U.S. DollarsASSETSCurrent assets:
Cash and deposits ………………………………………………… 16,603 5,553 152,565Notes and accounts receivable …………………………………… 155,324 182,963 1,427,224Electronically recorded monetary claims ………………………… 7,394 7,259 67,948Inventories ……………………………………………………… 47,062 48,519 432,439Advance payments ……………………………………………… 10,453 16,050 96,054Other ……………………………………………………………… 4,502 5,156 41,368Allowance for doubtful accounts ………………………………… (184) (129) (1,693)
Total current assets ………………………………………… 241,157 265,373 2,215,908
Non-current assetsProperty, plant and equipment:
Land ……………………………………………………………… 1,695 1,690 15,577Building and structures ………………………………………… 8,232 7,681 75,647Machinery and equipment ……………………………………… 8,591 8,312 78,940Construction in progress ………………………………………… 806 555 7,411Accumulated depreciation ……………………………………… (11,365) (10,936) (104,430)Other ……………………………………………………………… 1,467 1,455 13,486
Total property, plant and equipment ………………………… 9,428 8,758 86,632
Intangible assets, investments and other assets:Goodwill ………………………………………………………… 71 157 657Investment securities …………………………………………… 29,413 29,710 270,266Long-term loans receivable ……………………………………… 318 454 2,926Deferred tax assets (Note 6) ……………………………………… 1,492 697 13,709Other ……………………………………………………………… 4,685 3,323 43,051Allowance for doubtful accounts ………………………………… (2,088) (884) (19,187)
Total intangible assets, investments and other assets ……… 33,892 33,459 311,423
Total non-current assets …………………………………………… 43,320 42,217 398,055
Total Assets …………………………………………………………… 284,477 307,590 2,613,964
2 See accompanying notes to consolidated financial statements.
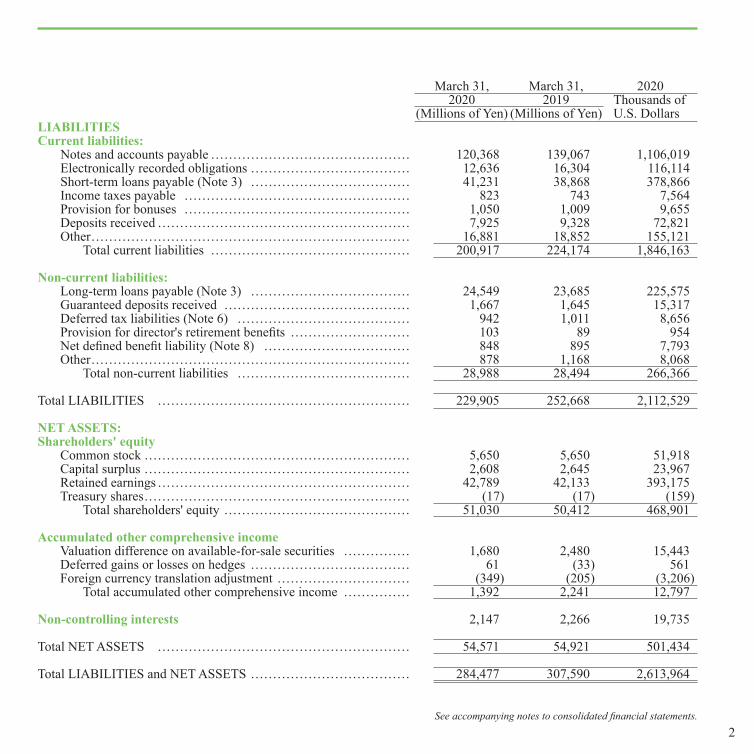
March 31, March 31, 2020 2020 2019 Thousands of (Millions of Yen) (Millions of Yen) U.S. DollarsLIABILITIESCurrent liabilities:
Notes and accounts payable ……………………………………… 120,368 139,067 1,106,019Electronically recorded obligations ……………………………… 12,636 16,304 116,114Short-term loans payable (Note 3) ……………………………… 41,231 38,868 378,866Income taxes payable …………………………………………… 823 743 7,564Provision for bonuses …………………………………………… 1,050 1,009 9,655Deposits received ………………………………………………… 7,925 9,328 72,821Other ……………………………………………………………… 16,881 18,852 155,121
Total current liabilities ……………………………………… 200,917 224,174 1,846,163
Non-current liabilities:Long-term loans payable (Note 3) ……………………………… 24,549 23,685 225,575Guaranteed deposits received …………………………………… 1,667 1,645 15,317Deferred tax liabilities (Note 6) ………………………………… 942 1,011 8,656Provision for director's retirement benefits ……………………… 103 89 954Net defined benefit liability (Note 8) …………………………… 848 895 7,793Other ……………………………………………………………… 878 1,168 8,068
Total non-current liabilities ………………………………… 28,988 28,494 266,366
Total LIABILITIES ………………………………………………… 229,905 252,668 2,112,529
NET ASSETS:Shareholders' equity
Common stock …………………………………………………… 5,650 5,650 51,918Capital surplus …………………………………………………… 2,608 2,645 23,967Retained earnings ………………………………………………… 42,789 42,133 393,175Treasury shares …………………………………………………… (17) (17) (159)
Total shareholders' equity …………………………………… 51,030 50,412 468,901
Accumulated other comprehensive incomeValuation difference on available-for-sale securities …………… 1,680 2,480 15,443Deferred gains or losses on hedges ……………………………… 61 (33) 561Foreign currency translation adjustment ………………………… (349) (205) (3,206)
Total accumulated other comprehensive income …………… 1,392 2,241 12,797
Non-controlling interests 2,147 2,266 19,735
Total NET ASSETS ………………………………………………… 54,571 54,921 501,434
Total LIABILITIES and NET ASSETS ……………………………… 284,477 307,590 2,613,964

3 See accompanying notes to consolidated financial statements.
SHINSHO CORPORATION AND CONSOLIDATED SUBSIDIARIESCONSOLIDATED STATEMENTS OF INCOME March 31, March 31, 2020 2020 2019 Thousands of (Millions of Yen) (Millions of Yen) U.S. Dollars
Net sales (Note 11) …………………………………………………… 936,031 952,507 8,600,863Cost of sales ………………………………………………………… 906,098 920,890 8,325,812
Gross profit ……………………………………………………… 29,933 31,616 275,051Selling, general and administrative expenses ………………………… 25,103 23,693 230,671
Non-operating incomeInterest income …………………………………………………… 137 119 1,266Dividend income ………………………………………………… 885 841 8,137Purchase discounts ……………………………………………… 57 62 527Gain on bargain purchase ………………………………………… − 152 −Gain on sale of investments in capital …………………………… 39 − 362Miscellaneous income …………………………………………… 382 380 3,518 1,503 1,766 13,812
Non-operating expensesInterest expenses ………………………………………………… 1,212 1,151 11,143Loss on sales of accounts receivable …………………………… 387 369 3,556Sales discounts …………………………………………………… 216 220 1,989Foreign exchange losses ………………………………………… 417 113 3,833Loss on valuation of derivatives ………………………………… 234 125 2,153Bad debts expense ……………………………………………… 277 − 2,554Impairment loss ………………………………………………… − 31 −Loss on valuation of investment securities ……………………… 894 1,498 8,222Loss on valuation of membership ……………………………… 24 3 221Miscellaneous loss ……………………………………………… 181 76 1,665 3,846 3,590 35,339
Profit before income taxes,non-controlling interests and equity method income …………… 2,486 6,098
Income taxes (Note 4)Current …………………………………………………………… 1,974 2,033 18,143Deferred ………………………………………………………… (645) (262) (5,935) 1,328 1,771 12,208
Profit (Loss) attributable to non-controlling interests ………………… 106 55 977Share of profit of entities accounted for using equity method ……… 577 747 5,306
Profit attributable to owners of parent …………………………… 1,629 5,019 14,973
(yen) (yen) (dollars)Profit per share 184.03 566.81 1.69

4 See accompanying notes to consolidated financial statements.
SHINSHO CORPORATION AND CONSOLIDATED SUBSIDIARIESCONSOLIDATED STATEMENTS OF CHANGES IN NET ASSETS March 31, March 31, 2020 2020 2019 Thousands of (Millions of Yen) (Millions of Yen) U.S. DollarsCommon stock:
Balance at beginning of period ………………………………… 5,650 5,650 51,918Balance at end of period ………………………………………… 5,650 5,650 51,918
Capital surplus:Balance at beginning of period ………………………………… 2,645 2,645 24,309Purchase of shares of consolidated subsidiaries ………………… (37) 0 (342)Balance at end of period ………………………………………… 2,608 2,645 23,967
Retained earnings:Balance at beginning of period ………………………………… 42,133 38,370 387,153Change of scope of equity method affiliates …………………… − (192) −Dividends of surplus …………………………………………… (974) (1,062) (8,951)Profit attributable to owners of parent …………………………… 1,629 5,019 14,973Balance at end of period ………………………………………… 42,789 42,133 393,175
Valuation difference on available-for-sale securities:Balance at beginning of period ………………………………… 2,480 3,338 22,794Net changes of items other than shareholders' equity …………… (800) (857) (7,351)Balance at end of period ………………………………………… 1,680 2,480 15,443
Deferred gains or losses on hedges:Balance at beginning of period ………………………………… (33) 117 (305)Net changes of items other than shareholders' equity …………… 94 (151) 867Balance at end of period ………………………………………… 61 (33) 561
Foreign currency translation adjustment:Balance at beginning of period ………………………………… (205) 734 (1,890)Net changes of items other than shareholders' equity …………… 31 (940) (1,316)Balance at end of period ………………………………………… (349) (205) (3,206)
Treasury shares:Balance at beginning of period ………………………………… (17) (17) (157)Change in treasury shares arising from change in
equity in entities accounted for using equity method ……… 0 − 0Purchase of treasury shares ……………………………………… (0) 0 (2)Balance at end of period ………………………………………… (17) (17) (159)
Non-controlling interests:Balance at beginning period ……………………………………… 2,266 2,886 20,830Net changes of items other than shareholders' equity …………… (119) (619) (1,095)Balance at end of period ………………………………………… 2,147 2,266 19,735
Total net assets ……………………………………………………… 54,571 54,921 501,434
(thousands) (thousands)Number of authorized shares ………………………………………… 27,000 27,000Number of issued shares (including treasury shares) ………………… 8,860 8,860

5 See accompanying notes to consolidated financial statements.
SHINSHO CORPORATION AND CONSOLIDATED SUBSIDIARIESCONSOLIDATED STATEMENTS OF CASH FLOWS March 31, March 31, 2020 2020 2019 Thousands of (Millions of Yen) (Millions of Yen) U.S. DollarsOperating activities:
Profit before income taxes,non-controlling interests and equity method income ……… 2,486 6,098 22,851
Depreciation ……………………………………………………… 1,384 1,562 12,717Amortization of goodwill ………………………………………… 86 93 790Increase (Declease) of reserve and provison …………………… 1,318 403 12,118Interest and dividend income …………………………………… (1,023) (960) (9,403)Interest expenses ………………………………………………… 1,212 1,151 11,143Gain on bargain purchase ………………………………………… − (152) −Impairment loss ………………………………………………… − 31 −Loss (Gain) on valuation of investment securities ……………… 894 1,498 8,222Decrease (Increase) in notes and accounts receivable …………… 26,990 (17,363) 248,009Decrease (Increase) in inventories ……………………………… 1,207 (15,049) 11,091Increase (Decrease) in notes and accounts payable ……………… (22,005) 12,287 (202,199)Decrease (Increase) in accounts receivable ……………………… (697) (24) (6,405)Other, net ………………………………………………………… 2,570 25 23,617
Subtotal ……………………………………………………… 14,425 (10,398) 132,553Interest and dividend income received …………………………… 1,188 1,028 10,918Interest expenses paid …………………………………………… (1,200) (1,109) (11,033)Income taxes paid ………………………………………………… (1,665) (2,789) (15,304)
Net cash provided by operating activities …………………… 12,747 (13,268) 117,134
Investing activities:Purchase of property, plant and equipment ……………………… (2,004) (1,098) (18,415)Proceeds from sales of property, plant and equipment ………… 12 94 112Purchase of investment securities ……………………………… (426) (68) (3,920)Proceeds from sales of investment securities …………………… 29 318 268Payments of short-term loans receivable ………………………… (2) (0) (22)Collection of short-term loans receivable ……………………… 2 1 24Payments of long-term loans receivable ………………………… (494) (416) (4,544)Collection of long-term loans receivable ………………………… 18 6 173Other, net ………………………………………………………… (743) (826) (6,834)
Net cash used in investing activities ………………………… (3,608) (1,990) (33,156)
Financing activities:Net increase (decrease) in short-term loans payable …………… 4,217 4,032 38,756Proceeds from long-term loans payable ………………………… 1,950 6,719 17,917Repayments of long-term loans payable ………………………… (2,711) (6,879) (24,917)Repayments of finance lease obligations ………………………… (191) (223) (1,760)Cash dividends paid ……………………………………………… (974) (1,062) (8,951)Dividends paid to non-controlling interests ……………………… (74) (68) (685)Payment from changes in ownership interests in subsidiaries
that do not result in change in scope of consolidation ……… (238) (412) (2,186)Other, net ………………………………………………………… (0) (0) (2)
Net cash used in financial activities ………………………… 1,977 2,104 18,171
Effect of exchange rate change on cash and cash equivalents ……… (66) (315) (608)Net increase (decrease) in cash and cash equivalents ………………… 11,050 (13,470) 101,540Cash and cash equivalents at beginning of period …………………… 5,552 19,022 51,016Cash and cash equivalents at end of period ………………………… 16,602 5,552 152,557

6
SHINSHO CORPORATION AND CONSOLIDATED SUBSIDIARIESNOTES TO THE CONSOLIDATED FINANCIAL STATEMENTS
1. Basis of presenting consolidated financial statements
The accompanying consolidated financial statements of Shinsho Corporation (the "Company") and its consolidated subsidiaries have been prepared in accordance with the provisions set forth in the Japanese Financial Instruments and Exchange Act and its related accounting regulations and in conformity with accounting principles generally accepted in Japan ("Japanese GAAP"), which are different in certain respects as to the application and disclosure requirements of International Financial Reporting Standards. Japanese yen figures less than a million yen are rounded down to the nearest million yen and U.S. dollar figures less than a thousand dollars are rounded down to the nearest thousand dollars, except for per share data. In preparing these consolidated financial statements, certain reclassifications and rearrangements have been made to the consolidated financial statements issued domestically in order to present them in a form which is more familiar to readers outside Japan. In addition, certain reclassifications have been made in the 2019 financial statements to conform to the classifications used in 2020. The accompanying consolidated financial statements are stated in Japanese yen, the currency of the country in which the Company is incorporated and principally operates. The translation of Japanese yen amounts into U.S. dollar amounts are included solely for the convenience of readers outside Japan and have been made at the rate of ¥108.83 to $1, the rate of exchange at March 31, 2020. Such transaction should not be construed as representations that Japanese yen amounts could be converted into U.S. dollars at that or any other rate.
2. Summary of significant accounting policies
(1) Scope of consolidationThe Company had 38 subsidiaries (majority-owned companies) at March 31, 2020. The accompanying consolidated financial statements include the accounts of the Company and 38 of its subsidiaries for the year ended March 31, 2020, which are listed below:
Shinsho American CorporationShinsho Steel Products CorporationShinsho Non-ferrous CorporationShinko Shoji Singapore Pte. Ltd.Thai Escorp Ltd.
Shinsho (Malaysia) Sdn. Bhd.Asia Chemical Engineering Co., Ltd.Kobelco Trading Shanghai Co., Ltd.Suzhou Shinko-shoji Material Co., Ltd.Matsubo CorporationKobelco Plate Processing India Private LimitedKobelco CH Wire Mexicana, S.A.de C.V.26 other consolidated subsidiaries
(2) Elimination and combinationFor the purposes of preparing the consolidated financial statements of the Company and its consolidated subsidiaries, all significant inter-company transactions, account balances and unrealized profits among the Company and its consolidated subsidiaries have been entirely eliminated to "Noncontrolling Interests". In the elimination, any differences between the cost of investments in subsidiaries and the amount of underlying equity in net assets of the subsidiaries is treated as an asset "Goodwill" or non-operating income "Gain on bargain purchase" Goodwill recorded promptly on balance sheet amortized within twenty years by cause.(3) Equity method of accounting for investments in affiliatesThe Company had 20 affiliates (companies owned from 20% to 50% actually) at March 31, 2020. The equity method is applied to these 15 investments.(4) Cash and cash equivalentsCash and cash equivalents include all highly liquid investments. Cash equivalents are generally at the maturity of three months or less and readily convertible to cash. Cash equivalents near maturity indicate insignificant risk of changes in value because of changes in interest rates.(5) Investment securitiesSecurities are classified into the categories based on the purpose of holding, which can result in the different measurement and can account for the changes in the fair value. Debt securities that are intended to be held to maturity ("held-to-maturity debt securities") are measured at amortized cost in the balance sheet. Securities other than held-to-maturity debt securities and the equity investment in subsidiaries and affiliates ("other securities") are measured at the fair value. The difference between the fair value and the historical cost is recorded in the category of shareholder's equity. The historical cost is determined by the moving average cost. Securities that have no market price are stated at their historical cost.

7
(6) InventoriesInventories are mainly stated at cost determined by the moving average method. (unless market value of inventories declines significantly and is not expected to recover to cost, in such cases costs are reduced to net realizable values).(7) Property, plant and equipmentProperty, plant and equipment are stated at cost. Depreciation of property, plant and equipment are computed principally by the declining balance method. However, depreciation of buildings booked from April 1, 1998 is computed using the straight-line method.(8) Long-lived assetsThe Company reviews its long-lived assets for the impairment whenever events or changes in circumstance indicate the carrying amount of an asset or asset group may not be recoverable. An impairment loss would be recognized if the carrying amount of an asset or asset group exceeds the sum of the undiscounted future cash flows expected as a result of the continuous use and eventual disposition of the asset or asset group. The impairment loss would be measured when the carrying amount of the asset exceeds its recoverable amount, which is higher of the discounted cash flows from the continuous use and eventual disposition of the asset or the net selling price at disposition.(9) Provision for retirement and benefitsAccrued employees' retirement benefits in subsidiaries are provided mainly at the amount calculated based on the retirement benefit obligation and the fair value of the pension plan assets as of the balance sheet date.(10) Allowance for doubtful accountsThe allowance for doubtful accounts is provided in amounts which are sufficient to cover possible losses on collection. It consists of individually estimated uncollectible amounts and amounts calculated using the actual rate of historical bad debt.(11) Finance leasesLease assets related to finance lease transactions that do not involve the transfer of ownership are depreciated on a straight-line basis, with the lease period used their useful lived and no residual value.(12) Income taxesThe asset and liability approach is used to recognize deferred tax assets and liabilities for the expected future tax consequences of temporary differences between the carrying amounts of assets and liabilities for financial reporting purposes and the amounts used for income tax purposes.(13) Translation of foreign currency accountsCurrent and non-current monetary assets and liabilities denominated by foreign currencies are translated into Japanese
yen at the exchange rates at the end of fiscal year, and the resulting exchange gains and losses are recognized in the income statement. Balance sheets of consolidated overseas subsidiaries are translated into Japanese yen at the exchange rates at the end of fiscal year except for stockholders' equity accounts, which are translated at the historical rates. Income statements of consolidated overseas subsidiaries are translated at the average exchange rates. The resulting translation adjustments are reflected in the consolidated financial statements as "Foreign currency translation adjustments".(14) Derivative financial instrumentsThe Company and its subsidiaries use derivative financial instruments to manage its exposures to fluctuations in foreign exchange rates and comodity prices. Derivatives include foreign currency forward contracts and comodities futures, which are utilized by the Company to reduce foreign currency exchange rate risks and comodity price risks. The Company and its subsidiaries do not enter into derivatives for trading or speculative purposes.The Company and its subsidiaries have taken various steps, including the establishment of internal management rules, to ensure that transactions are implemented appropriately and that risk is managed. Gains and losses on hedge of existing assets or liabilities are included in carrying amounts of those assets or liabilities and ultimately recognized the income as a part of those carrying amounts. Gains and losses related to qualifying hedges of firm commitments and anticipated transactions are deferred and recognized the income, or adjustments of carrying amounts, when the hedged transaction occurs.(15) Net income per shareThe computation of net income per share is based on the weighted average number of issued shares of common stock outstanding during the relevant period.
3. Short-term loans payable and long-term loans payable
Short-term loans payable at March 31, 2020 and 2019 consisted of the following: (¥ millions) ($ thousands)Short-term loans payable principally 2020 2019 2020from banks at March 31, 2020 and 2019 represent short-term noteswith the interest on the principal 40,172 36,152 369,126at the average rate of 1.487% and 1.868%, respectively.
8
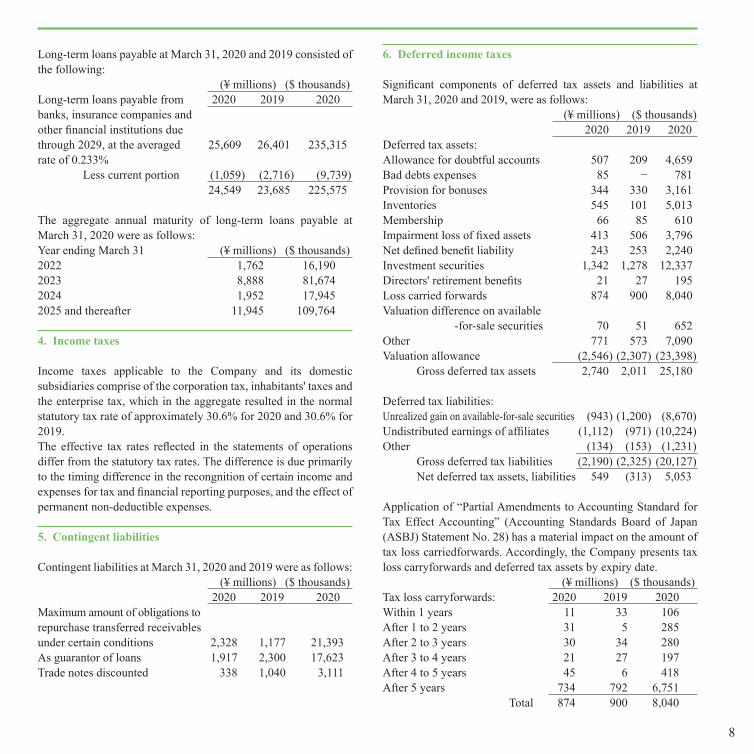
Long-term loans payable at March 31, 2020 and 2019 consisted of the following: (¥ millions) ($ thousands)Long-term loans payable from 2020 2019 2020banks, insurance companies and other financial institutions due through 2029, at the averaged 25,609 26,401 235,315rate of 0.233%
Less current portion (1,059) (2,716) (9,739) 24,549 23,685 225,575
The aggregate annual maturity of long-term loans payable at March 31, 2020 were as follows: Year ending March 31 (¥ millions) ($ thousands)2022 1,762 16,1902023 8,888 81,6742024 1,952 17,9452025 and thereafter 11,945 109,764
4. Income taxes
Income taxes applicable to the Company and its domestic subsidiaries comprise of the corporation tax, inhabitants' taxes and the enterprise tax, which in the aggregate resulted in the normal statutory tax rate of approximately 30.6% for 2020 and 30.6% for 2019. The effective tax rates reflected in the statements of operations differ from the statutory tax rates. The difference is due primarily to the timing difference in the recongnition of certain income and expenses for tax and financial reporting purposes, and the effect of permanent non-deductible expenses.
5. Contingent liabilities
Contingent liabilities at March 31, 2020 and 2019 were as follows: (¥ millions) ($ thousands) 2020 2019 2020Maximum amount of obligations to repurchase transferred receivables under certain conditions 2,328 1,177 21,393As guarantor of loans 1,917 2,300 17,623Trade notes discounted 338 1,040 3,111
6. Deferred income taxes
Significant components of deferred tax assets and liabilities at March 31, 2020 and 2019, were as follows: (¥ millions) ($ thousands)
2020 2019 2020Deferred tax assets:Allowance for doubtful accounts 507 209 4,659Bad debts expenses 85 − 781Provision for bonuses 344 330 3,161Inventories 545 101 5,013Membership 66 85 610Impairment loss of fixed assets 413 506 3,796Net defined benefit liability 243 253 2,240Investment securities 1,342 1,278 12,337Directors' retirement benefits 21 27 195Loss carried forwards 874 900 8,040Valuation difference on available -for-sale securities 70 51 652Other 771 573 7,090Valuation allowance (2,546) (2,307) (23,398)
Gross deferred tax assets 2,740 2,011 25,180
Deferred tax liabilities:Unrealized gain on available-for-sale securities (943) (1,200) (8,670)Undistributed earnings of affiliates (1,112) (971) (10,224)Other (134) (153) (1,231)
Gross deferred tax liabilities (2,190) (2,325) (20,127)Net deferred tax assets, liabilities 549 (313) 5,053
Application of “Partial Amendments to Accounting Standard for Tax Effect Accounting” (Accounting Standards Board of Japan (ASBJ) Statement No. 28) has a material impact on the amount of tax loss carriedforwards. Accordingly, the Company presents tax loss carryforwards and deferred tax assets by expiry date. (¥ millions) ($ thousands)Tax loss carryforwards: 2020 2019 2020Within 1 years 11 33 106After 1 to 2 years 31 5 285After 2 to 3 years 30 34 280After 3 to 4 years 21 27 197After 4 to 5 years 45 6 418After 5 years 734 792 6,751 Total 874 900 8,040

9
(¥ millions) ($ thousands)Valuation allowance: 2020 2019 2020Within 1 years (11) (33) (106)After 1 to 2 years (31) (5) (285)After 2 to 3 years (26) (34) (242)After 3 to 4 years (21) (27) (197)After 4 to 5 years (45) (6) (418)After 5 years (463) (498) (4,259) Total (599) (606) (5,509)
(¥ millions) ($ thousands)Deferred tax assets: 2020 2019 2020Within 1 years − − −After 1 to 2 years − − −After 2 to 3 years 4 − 38After 3 to 4 years − − −After 4 to 5 years − − −After 5 years 271 293 2,492 Total 275 293 2,530
7. Lease transactions
・Operating leaseUnder non-cancelable operating leases, future minimum lease payments at March 31, 2020 were ¥398 millions ($3,657 thousands) of which ¥131 millions ($1,209 thousands) is due within one year.
8. Retirement and severance benefits plans
The Company has defined contribution plan. Certain consolidated subsidiaries, differently, have defined contribution plan and defined benefit plan.Part of Certain consolidated subsidiaries have the smaller enterprise retirement allowance mutual aid or special retirement allowance mutual aid. When application of difined benefit plan, certain consolidated subsidiaries would calculate retirement benefit liability and cost by simplified method. (¥ millions) ($ thousands) 2020 2019 2020Balance at beginning of year 895 887 8,225Retirement benefit expenses 124 86 1,139Post-employment benefits paid (117) (43) (1,082)Employer contributions (53) (35) (489)Increase due to change in scope of consolidation − − −Balance at end of year 848 895 7,793
Reconciliation between the liability recorded in the consolidated balance sheet and the balances of defined benefit obligation and plan assets as of March 31, 2020, were as follows: (¥ millions) ($ thousands) 2020 2019 2020Funded defined benefit obligation 1,257 1,273 11,557Pension assets (594) (559) (5,465) 662 714 6,091Unfunded defined benefit obligation 185 180 1,701Net liability for defined benefit obligation 848 895 7,793
Liability for retirement benefits 848 895 7,793Net liability for defined benefit obligation 848 895 7,793
9. Derivative transactions
(1) Hedge accounting not appliedThe following tables summarize the outstanding contract amounts and fair values of financial derivatives of the Company at March 31, 2020 and 2019, for which hedge accounting has not been applied. (¥ millions) ($ thousands) 2020 2019 2020a. Currency related:Forward currency exchange contracts
Sell (Japanese yen)Contracts outstanding 4 5 41Fair values (0) (0) 0
Sell (U.S. dollar)Contracts outstanding 11,866 12,969 109,033Fair values (193) (29) (1,779)
Sell (Chinese yuan) Contracts outstanding 250 − 2,297Fair values (0) − (8)
Sell (Other)Contracts outstanding − − −Fair values − − −
Buy (Japanese yen)Contracts outstanding 363 295 3,341Fair values (8) (0) (80)
Buy (U.S. dollar)Contracts outstanding 5,307 3,654 48,770Fair values (9) 28 (89)
Buy (Chinese yuan)Contracts outstanding − − −Fair values − − −

10
(¥ millions) ($ thousands) 2020 2019 2020
Buy (Euro)Contracts outstanding − 3 −Fair values − (0) −
Buy (Other)Contracts outstanding − − −Fair values − − −
b. Commodities futures:Sell (Japanese yen)
Contracts outstanding 324 546 2,979Fair values 14 (4) 128
Buy (Japanese yen)Contracts outstanding 337 536 3,103Fair values (27) 14 (252)
(2) Hedge accounting appliedThe following tables summarize the outstanding contract amounts and fair values of financial derivatives of the Company at March 31, 2019 and 2018, for which hedge accounting has been applied.
(¥ millions) ($ thousands) 2020 2019 2020a. Currency related:Forward currency exchange contracts
Sell (Japanese yen)Contracts outstanding 78 232 720Fair values − − −
Sell (U.S. dollar)Contracts outstanding 3,616 7,205 33,234Fair values 17 (7) 163
Sell (Euro)Contracts outstanding 761 3,028 7,000Fair values 6 (24) 60
Sell (Chinese yuan)Contracts outstanding 1,470 2,186 13,514Fair values 1 (13) 14
Sell (Other)Contracts outstanding 1,386 81 12,737Fair values 3 0 28
Buy (Japanese yen)Contracts outstanding 254 618 2,340Fair values − − −
(¥ millions) ($ thousands) 2020 2019 2020
Buy (U.S. dollar)Contracts outstanding 91 531 842Fair values 1 (0) 9
Buy (Euro)Contracts outstanding 3,303 369 30,350Fair values (33) (1) (312)
Buy (Chinese yuan)Contracts outstanding 81 148 752Fair values 0 3 1
Buy (Other)Contracts outstanding 222 177 2,040Fair values (8) 3 (80)
b. Commodities futures:Sell (Japanese yen)
Contracts outstanding 820 2,149 7,541Fair values 106 (46) 981
Sell (U.S. dollar)Contracts outstanding 602 1,699 5,537Fair values 89 (37) 820
Buy (Japanese yen)Contracts outstanding 424 3,566 3,896Fair values (9) 28 (88)
Buy (U.S. dollar)Contracts outstanding 806 1,154 7,406Fair values (105) 27 (972)
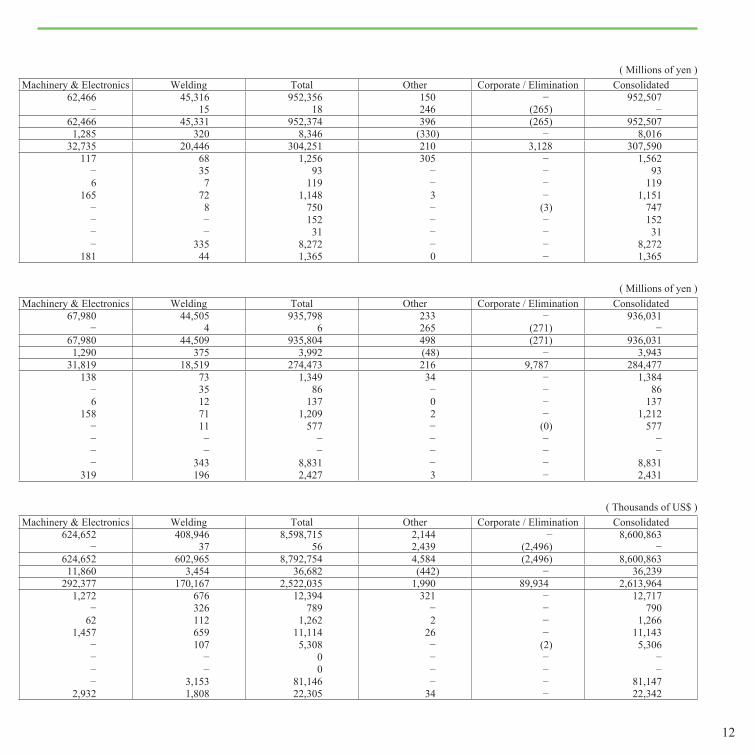
10. Segment information
In the fiscal year ended March 31, 2020, in order to assess and manage the performance of each reportable segment, the Company revised the method of adjusting transfers between reportable segments, and allocating the joint costs, etc. The Company also changed the calculation method of profit, loss, assets, and other items from reportable segment. The Company prensents segment information of the year ended March 31, 2019 which is made by the modified calculation method.

11
For the year ended March 31, 2019
For the year ended March 31, 2020
For the year ended March 31, 2020
Notes: The segment is classified with the kind of inventories and the common sales route based on the sales department of the Company.
Iron & Steel Raw Materials Nonferrous MetalsNet sales Outside customers 327,942 292,969 223,661
Inter - segment − − 2Total 327,942 292,969 223,663
Segment profit (loss) 3,819 1,220 1,700Segment assets 134,507 34,348 82,213Other items Depreciation 652 155 262
Amortization of goodwill − − 57 Interest income 18 32 54Interest expenses 514 122 272Equity in income (loss) of equity method companies 663 − 78Gain on bargain purchase 152 − −Impairment loss − − 31Investments in equity method companies 7,197 − 744Increase in property, plant and equipment and intangible assets 349 213 575
Iron & Steel Raw Materials Nonferrous MetalsNet sales Outside customers 320,672 297,787 204,851
Inter - segment − − 2Total 320,672 297,787 204,853
Segment profit (loss) 263 666 1,395Segment assets 124,081 28,219 71,833Other items Depreciation 655 184 296
Amortization of goodwill − − 50Interest income 28 32 57Interest expenses 654 106 218Equity in income (loss) of equity method companies 487 − 78Gain on bargain purchase − − −Impairment loss − − −Investments in equity method companies 7,580 − 907Increase in property, plant and equipment and intangible assets 1,150 320 441
Iron & Steel Raw Materials Nonferrous MetalsNet sales Outside customers 2,946,547 2,736,266 1,882,304
Inter - segment − − 19Total 2,946,547 2,736,266 1,882,324
Segment profit (loss) 2,418 6,126 12,824Segment assets 1,140,139 259,302 660,050Other items Depreciation 6,027 1,697 2,722
Amortization of goodwill − − 463Interest income 259 297 532Interest expenses 6,011 979 2,008Equity in income (loss) of equity method companies 4,480 − 721Gain on bargain purchase − − −Impairment loss − − −Investments in equity method companies 69,658 − 8,335Increase in property, plant and equipment and intangible assets 10,570 2,942 4,053
12
( Millions of yen )
( Millions of yen )
( Thousands of US$ )
Machinery & Electronics Welding Total Other Corporate / Elimination Consolidated62,466 45,316 952,356 150 − 952,507
− 15 18 246 (265) −62,466 45,331 952,374 396 (265) 952,507
1,285 320 8,346 (330) − 8,01632,735 20,446 304,251 210 3,128 307,590
117 68 1,256 305 − 1,562− 35 93 − − 936 7 119 − − 119
165 72 1,148 3 − 1,151− 8 750 − (3) 747− − 152 − − 152− − 31 − − 31− 335 8,272 − − 8,272
181 44 1,365 0 − 1,365
Machinery & Electronics Welding Total Other Corporate / Elimination Consolidated67,980 44,505 935,798 233 − 936,031
− 4 6 265 (271) −67,980 44,509 935,804 498 (271) 936,031
1,290 375 3,992 (48) − 3,94331,819 18,519 274,473 216 9,787 284,477
138 73 1,349 34 − 1,384− 35 86 − − 866 12 137 0 − 137
158 71 1,209 2 − 1,212− 11 577 − (0) 577− − − − − −− − − − − −− 343 8,831 − − 8,831
319 196 2,427 3 − 2,431
Machinery & Electronics Welding Total Other Corporate / Elimination Consolidated624,652 408,946 8,598,715 2,144 − 8,600,863
− 37 56 2,439 (2,496) −624,652 602,965 8,792,754 4,584 (2,496) 8,600,863
11,860 3,454 36,682 (442) − 36,239292,377 170,167 2,522,035 1,990 89,934 2,613,964
1,272 676 12,394 321 − 12,717− 326 789 − − 790
62 112 1,262 2 − 1,2661,457 659 11,114 26 − 11,143
− 107 5,308 − (2) 5,306− − 0 − − −− − 0 − − −− 3,153 81,146 − − 81,147
2,932 1,808 22,305 34 − 22,342

13
Investor Information (As of March 31, 2020)
Founded ……………………………………………………………………………………… November. 12 1946Number of Employees ……………………………………………………………………… 468 (Consolidated 1,660)Fiscal Year …………………………………………………………………………………… April 1 − March 31
Ordinary General Meeting of Shareholders ………………………………………………… June of each yearAuthorised Share Capital …………………………………………………………………… 27,000,000Number of Shares Issued …………………………………………………………………… 8,855,838Number of Shareholders ……………………………………………………………………… 3,551
Principal ShareholdersAt March 31, 2020, the ten largest Shareholders of the Company's Shareholders were as follows:
Name Shares Investment RatioMizuho Trust & Banking Co., Ltd. (Kobe Steel,Ltd. Retirement Benefit Trust Account) 1,906,200 21.51%Kobe Steel, Ltd. 1,179,118 13.30%Shinsho Client Shareholding Association 748,200 8.44%Japan Trustee Services Bank, Ltd. (trust account) 279,300 3.15%The Master Trust Bank of Japan, Ltd. (trust account) 235,500 2.65%Shinsho Employees' Shareholding Association 202,491 2.28%SINFONIA TECHNOLOGY CO., LTD. 150,000 1.69%DFA INTL SMALL CAP VALUE PORTFOLIO 118,899 1.34%MUFG Bank, LTD. 109,280 1.23%Sumitomo Mitsui Banking Corporation 103,429 1.16%
Note: The Investment ratio is computed excluding 4,724 shares of treasury stock held by Shinsho Corporation.
Head Office● OsakaYodoyabashi Square, 6-18, Kitahama 2-chome, Chuo-ku, Osaka 541-8557, JapanPhone:+81-6-6206-7010 Fax:+81-6-6206-7018
● TokyoMuseum Tower Kyobashi, 7-2, Kyobashi 1-chome, Chuo-ku, Tokyo 104-8389, JapanPhone:+81-3-5579-5203 Fax:+81-3-5524-5704
Overseas Representative Offices● DubaiDubai Airport Free Zone Bldg. 2E, East Wing,1st Floor, No.2E 103 P.O.Box 293563 Dubai,United Arab EmiratesPhone:+971-4-299-7003 Fax:+971-4-299-7004
● BrisbaneSuite 17, Level 54, 111 Eagle Street, Brisbane, QLD 4000 AustraliaPhone:+61-7-3012-6518 Fax:+61-7-3012-6699
● Yangon#1705 Sakura Tower, 339 Bogyoke Aung San Road, Kyauktada Township, Yangon, MyanmarPhone:+95-1-255-042 Fax:+95-1-255-031
● SydneySuite 1203, Level 12, 124 Walker Street, North Sydney, NSW 2060 AustraliaPhone:+61-2-9959-5660 Fax:+61-2-9959-5740

14
Overseas Subsidiaries● SHINSHO AMERICAN CORP.26200 Town Center Drive, Suite 220, Novi, MI 48375, U.S.APhone:+1-248-675-5569 Fax:+1-248-675-5575
● AIKEN WIRE PROCESSING, L.L.C.75 Windham Boulevard, Verenes Industrial Park, Aiken, SC 29805, U.S.A.Phone:+1-803-641-6091 Fax:+1-803-641-6092
● GRAND BLANC PROCESSING, L.L.C.10151Gainey Drive Holly MI 48442, U.S.A.Phone:+1-810-694-6000 Fax:+1-810-694-5164
● SHINSHO-MEIHOKU WIRE, INC.3475 W. International Court, Columbus, IN 47201, U.S.A.Phone:+1-812-342-2409 Fax:+1-812-342-3257
● SHINSHO MEXICO S.A. DE C.V.Paseo de la Altiplanicie No. 11. Int. 6BC Col. Villas de Irapuato, C.P. 36670, Irapuato, Guanajuato, MexicoPhone:+52-462-104-5019
● KOBELCO CH WIRE MEXICANA, S.A. DE C.V.Circuito Santa Fe No.179 Parque Industrial Santa Fe III, Guanajuato Puerto Interior Silao, Guanajuato C.P.36275 MexicoPhone:+52-472-135-2900
● SC TECH DE MEXICO, S.A. DE C.V.Numero 6 modulo “F” Conjunto Industrial Navetec Business Park Gamma Parcela no.48 Z-1 P-1/1 Ejido el Castillo, ZIP38184 Municipio de Apaseo el Grande, Guanajuato, MexicoPhone:+52-442-221-5560
● SHINSHO EUROPE GMBHBerliner Allee 55, 40212 Duesseldorf, GermanyPhone:+49-211-4181-960 Fax:+49-211-4181-9629
● KOBELCO TRADING AUSTRALIA PTY. LTD.Suite 1203 Level 12, 124 Walker Street, North Sydney NSW 2060, AustraliaPhone:+61-2-9959-5660 Fax:+61-2-9959-5740
● SHANGHAI SHINSHO TRADING CO., LTD.Suite 802,Gopher Center,No.757,Mengzi Road, Huangpu District, Shanghai 200023, ChinaPhone:+86-21-5396-6464 Fax:+86-21-5396-5975
● KOBELCO TRADING (SHANGHAI) CO., LTD.Suite 802,Gopher Center,No.757,Mengzi Road, Huangpu District, Shanghai 200023, ChinaPhone:+86-21-5396-6464 Fax:+86-21-5396-5975
● KOBELCO PRECISION PARTS (SUZHOU) CO., LTD.No.12 Factory, No. 666 Jianlin Road, Suzhou Hi-Tech District, Jiangsu 215151, ChinaPhone:+86-512-8187-8277 Fax:+86-512-8187-8272
● SHINSHO OSAKA SEIKO (NANTONG) CORPORATIONJ8 Qing Feng Establishment Park, No.1 Qing Feng Road Sutong Science and Technology Industrial Park, Nantong, Jiangsu Province, ChinaPhone:+86-513-8919-1055 Fax:+86-513-8919-1056
● NAKAYAMA CORPORATION (SHANGHAI) LIMITEDSuite 804,Gopher Center,No.757,Mengzi Road, Huangpu District, Shanghai 200023, ChinaPhone:+86-21-5187-0002 Fax:+86-21-5081-2428
● THAI ESCORP LTD.1126/2 Vanit Bldg. Ⅱ, Room 2102, 2103, New Petchburi Road., Makkasan, Rajthevee, Bangkok 10400, ThailandPhone:+66-2-254-7645 Fax:+66-2-254-7644
● TES E&M SERVICE CO., LTD.1126/2 Vanit Bldg. Ⅱ, Room 2102, 2103, New Petchburi Road., Makkasan, Rajthevee, Bangkok 10400, ThailandPhone:+66-2-254-7645 Fax:+66-2-254-7644
● SHINSHO METALS (THAILAND) LTD.1126/2 Vanit Bldg, Ⅱ, Room 2104B, New Petchburi Road, Makkasan, Rajthevee, Bangkok 10400, ThailandPhone:+66-2-255-8537 Fax:+66-2-255-8539
● SHINKO SHOJI SINGAPORE PTE. LTD.8 Shenton Way, #25-03A AXA Tower, Singapore 068811Phone:+65-6220-3329 Fax:+65-6224-4700
● SHINSHO KOREA CO., LTD.9F Bundang Square Bldg. 42, Hwangsaeul-ro 360 bungil, Bundang-gu, Seongnam-si, Gyeonggi-do, Korea 13591Phone:+82-31-707-7915 Fax:+82-31-707-8394
● PT. KOBELCO TRADING INDONESIAWisma Keiai, 7th Floor, Suite 0703 JI. Jend Sudirman Kav.3 Jakarta 10220, IndonesiaPhone:+62-21-572-4325 Fax:+62-21-572-4327
● PT. NAKAYAMAJl.Celebration Boulevard Blok AA 5/26 Grand Wisata, Lambang Jaya, Tambun Selatan, Bekasi 17514, Jawa Barat, IndonesiaPhone:+62-21-8261-5526 Fax:+62-21-8261-5528
● KOBELCO TRADING VIETNAM CO., LTD.Unit 1808, 18th Floor, SUN WAH TOWER 115 Nguyen Hue Boulevard, District 1, Ho Chi Minh City, VietnamPhone:+84-8-3911-0900 Fax:+84-8-3911-0902
● KOBELCO TRADING INDIA PRIVATE LIMITED202-203A, 2nd Floor, Salcon Rasvilas, D-1, District Centre, Saket, New Delhi-110017, IndiaPhone:+91-11-4383-3300 Fax:+91-11-4383-3317
● KOBELCO PLATE PROCESSING INDIA PRIVATE LIMITEDNew No.105, Sreela Terrace, Unit No.7, Second Floor, First Main Road,Gandhi Nagar, Adyar, Chennai-600020, Tamil Nabu, IndiaPhone:+91-44-4204-0700 Fax:+91-44-4204-0707● KTN Co., Ltd.182, Seotan 2-ro, Seotan-myeon, Pyeongtaek-si, Gyeonggi-do, Korea 17704Phone:+82-31-321-4179 Fax:+82-31-321-4189
● SHINSHO (PHILIPPINES) CORP.Unit 2107 Philippine AXA Life Centre, Sen. Gil Puyat Avenue Makati City 1200, PhilippinesPhone:+63-2-848-5171 Fax:+63-2-848-5149
● SHINSHO (MALAYSIA) SDN. BHD.Letter Box No.86 18th Floor, UBN Tower No.10, Jalan P. Ramlee, 50250 Kuala Lumpur, MalaysiaPhone:+60-3-2711-2708 Fax:+60-3-2711-2707
● TAIWAN SHINSHO CORPORATION7F-2, No.146, Sung Chiang Road., Taipei, 10458 TaiwanPhone:+886-2-2560-1085 Fax:+886-2-2560-1086
