year in sports media report - nielsen€¦ · tnt timeline of season highlights nba finals san...
TRANSCRIPT

12013 YEAR IN SPORTS Copyright © 2013 The Nielsen Company
Y E A R I N S P O R T S
M E D I A R E P O R T
2013

2 2013 YEAR IN SPORTS
WELCOMESTEPHEN MASTER SVP
SPORTS, NIELSEN
Welcome to Nielsen’s State of the Media: 2013 Year in Sports Media
Report, a compilation of media highlights, advertiser trends and
consumer insights across leading sports properties. This year, with the
addition of Nielsen Audio and Scarborough to the Nielsen portfolio our
“FANALYTICS” platform—what we refer to as the collective intelligence
and insights around sports consumers—continues to evolve, helping
our clients gain a deeper understanding of the sports fan.
Speaking of fans, their passion for sports, in the U.S. and around the
globe, continues to grow. And Nielsen was there every step of the way
in 2013 capturing fans’ engagement:
• Nearly 109 million viewers watched the “Harbowl,” the Beyonce
halftime show and the blackout.
• Viewers sent 27 million Tweets during the NBA Finals as the
Miami Heat repeated as champs.
• The series-clinching game six of the Stanley Cup final was
watched by 8.1 million viewers.
• Seventy one percent of UK homes’ TV sets were tuned to the
Wimbledon final as Andy Murray become the first male Brit to
win the title in 77 years.
• Over 21.6 million German viewers, accounting for 61 percent of
German households, watched the UEFA Champions League
Final match in May (Bayern Munchen vs. Borussia Dortmund).
I hope you enjoy these highlights from across Nielsen’s wealth of
consumer and media insights. This year continued to prove that
sports content, across all media platforms, is among the most popular
and engaging genres and well positioned to thrive in an increasingly
fragmented media marketplace and rapidly evolving multi-screen world.
Sincerely,
S T E P H E N M A S T E R

32013 YEAR IN SPORTS Copyright © 2013 The Nielsen Company
HOW WE’RE ENGAGING WITH SPORTS CONTENT ON TV
Viewers’ seemingly insatiable appetite for sports content has led to a
proliferation of television options over the past ten years. And although
more specialty sports channels have been added to the cable universe,
there has also been a trend of non-sports channels adding additional
hours of sports programming to their line-ups. Combined, these factors
have contributed to an explosive 232 percent increase in available hours of
national sports programming over the past ten years.
All of the additional sports content available has led to much greater
consumption of sports on television. In 2013, over 33 billion hours of
national sports programming was consumed by 255 million people in the
U.S., which is up 27 percent from the 26 billion hours consumed in 2003.
35.1K
26 BILLION 33 BILLION
116.4K
HOURS OF SPORTS PROGRAMMING
AVAILABLE
COLLECTIVE HOURS VIEWED
2003 2013 10-YEAR % CHANGE
+232%
+27%

4 2013 YEAR IN SPORTS
AND ACROSS OTHER SCREENS
AVG TIME SPENT AVG TIME SPENTUNIQUE AUDIENCE UNIQUE AUDIENCE
APRIL 2013 SEPTEMBER 2013
85 M
-7.2%
P2+
YOY CHANGE
APRIL34 M
+1.3%
P2+
YOY CHANGE
APRIL
52.2 M
+47.2%
P18+
YOY CHANGE
1:25
+42%
HH:MM
YOY CHANGE
87.3 M
-9.5%
P2+
YOY CHANGE
42.1 M
+7.4%
P2+
YOY CHANGE
61.7 M
+21.6%
P18+
YOY CHANGE
1:45
+25%YOY CHANGE
0:36
+20%YOY CHANGE
1:32
+15% YOY CHANGE
VISITING SPORTS SITES ON A COMPUTER
WATCHING VIDEO ON A SPORTS SITE ON A
COMPUTER
ACCESSING SPORTS CONTENT ON A
SMARTPHONE
Television is not the only medium where sports consumption is on the
rise. This year we looked at Americans’ consumption of sports content
across other devices during two major sports months, April and September.
During both months, Americans spent more time engaging with sports
content across each platform compared to the prior year. The average
amount of time spent visiting sports sites and accessing sports content
on mobile phones in April 2013 increased by double digits compared to
2012, and fans spent about a quarter more time visiting sports sites and
watching video on those sites during September.
Interestingly, the one figure that declined from 2012 to 2013 was the unique
number of people that actually used their computer to visit a sports site,
which can be attributed to the explosion of using mobile devices to access
sports content (up 47% in April and up 22% in September).
HH:MM
HH:MM
HH:MM
0:35
+9%YOY CHANGE
HH:MM
1:08
+15%YOY CHANGE
HH:MM

52013 YEAR IN SPORTS Copyright © 2013 The Nielsen Company
AVERAGE TIME SPENT (HH:MM)
A MULTICULTURAL LOOK AT SPORTS CONSUMPTION
APRIL 2013 SEPTEMBER 2013
VISITING SPORTS SITES ON A COMPUTER
WATCHING VIDEO ON A SPORTS SITE ON A
COMPUTER
ACCESSING SPORTS CONTENT ON A
SMARTPHONE
WHITETOTAL U.S P2+
TOTAL U.S P2+
TOTAL U.SP18+
BLACK HISPANIC ASIAN
1:191:25
0:35
1:08
1:471:45
0:36
1:32
2:12
1:45
1:02
1:17
1:47
1:56
WHITE BLACK HISPANIC ASIAN
0:33
0:33
0:46
0:47
0:36
0:30
0:43
1:05
WHITE BLACK HISPANIC ASIAN
1:10
1:35
0:44
1:15
1:31
1:45
1:00
1:42
SPORTS CONTINUES TO DOMINATE TWITTER TV DISCUSSION
In 2013, sports events
accounted for only
1.2 percent of all TV
programming, yet
conversation about sports
made up nearly half of all
Tweets about TV (49.7%),
an increase of 7 percent
from 2012. To put this in
perspective,TV Series had
the second greatest share
of Twitter TV activity at 34
percent, however made
up about 26.7% of all TV
programming

6 2013 YEAR IN SPORTS
AFC WILDCARDINDIANAPOLIS VS. BALTIMORE
CBS
N F LNATIONAL FOOTBALL LEAGUE
The packaged drama and plotlines of football continue to make the NFL
a ratings juggernaut as Americans just can’t seem to get enough football.
During 2013, each of the five broadcasters carrying NFL games (NBC, FOX,
CBS, ESPN, NFL NETWORK)saw an increase in viewership compared to last
season. Peyton Manning’s record-breaking season was a major story this
year with the Broncos becoming “America’s Team,” as four of the six highest-
rated NBC Sunday Night Football telecasts featured the Broncos.
Locally, the conference champions Broncos and Seahawks also posted strong
regular season ratings. In Denver, 40 percent of homes tuned into a Broncos
regular season game, up 23 percent over last season, and 34 percent of
homes in Seattle watched, an increase of 31 percent from the prior year.
TIMELINE OF SEASON HIGHLIGHTS
NFC WILDCARDSEATTLE VS. WASHINGTON
FOX
NFC CHAMPIONSHIPSAN FRANCISCO VS. ATLANTA
FOX
SUPER BOWLBALTIMORE VS. SAN FRANCISCO
CBS
AFC WILDCARD SAN DIEGO VS. CINCINNATI
CBS
AVERAGE # OF TV VIEWERS
3.8M1M
29.6M
47.7M 108.7M 31.7M
30.9M
47.1M38.1M
42M
26.1M 1.4M1.4M
.6M
.8M2.6M1.3M
6 20 3 5 28 5
FEB
SEP
NO
V
JAN
201
3
AFC CHAMPIONSHIPNEW ENGLAND VS. BALTIMORE
CBS
THURSDAY NIGHT KICKOFFBALTIMORE VS. DENVER
NBC
25.1M
JAN
201
4THANKSGIVING CLASSIC
OAKLAND VS. DALLASCBS
NFC WILDCARD SAN FRANCISCO VS. GREEN BAY
FOX
NFC
NFC
NFC
AFC
AFC
AFC
# OF TWEETS

72013 YEAR IN SPORTS Copyright © 2013 The Nielsen Company
FAN INSIGHTSFANTASY FOOTBALL APP USERS KEEP TRACK DAILYDuring September, more than 10 million Americans accessed fantasy
football apps on their smartphones, up 15 percent from a year ago.
Looking at the top fantasy football apps, Yahoo! and ESPN each had five
million unique users, respectively, during September. Overall, fantasy
football app users spent 2 hours 14 minutes per person, on average,
using these smartphone apps during September 2013, and they opened
them 27 times per person—that’s almost once a day! Compared to the average U.S. adult,
avid NFL fans are 16% more likely
to have gone to a pizza place and
41% more likely to have consumed
craft beer in the past month
16% 41%
GENDER
NFL REGULAR
SEASON
MALE FEMALE
2013 2012
2-17 18-34 35-54 55+
LESS THAN $20K $20K-$40K $40K-$75K $75-$100K $100K+
INCOME
65% 35%
17.4M 16.6M
AGE 9% 20% 34% 37%
9% 17% 32% 17% 25%
TOP 5 NFL ADVERTISERS• Bud Light
• Verizon Wireless
• AT&T Wireless
• Southwest Airlines
• Direct TV
1
2
3
4
5
TOP 5 LOCAL FAN BASES • Green Bay Packers 88%
• New Orleans Saints 81%
• Pittsburgh Steelers 78%
• Baltimore Ravens 70%
• Kansas City Chiefs 69%
1
2
3
4
5
Top Fantasy Football Apps - September 2013Ranked on Unique U.S. Audience
NameUnique
AudienceSessions Per
PersonTime Per Person
(hh:mm)
Total 10.3M 27.1 2:14
Yahoo! 5.1M 25.2 1:53
ESPN 4.9M 25.5 2:00
NFL.com 1.3M 30.1 1:53
CBS Sports 1.3M 12.2 0:41
SEASON-OVER-SEASON TV VIEWERSHIP:
Read as: During the 2013 NFL regular season, females made up 35 percent of the TV audience
*Numbers for Race/Ethnicity may not add up to 100 as viewers can identify as more than one group.
% of population that has watched, attended or listened to the team in the past 12 months
YOY% CHANGE IN VIEWERSHIP +4.8%
NFL DEMO PROFILE (2013 REGULAR SEASON):
BLACK WHITE HISPANIC
15% 77% 8%RACE/
ETHNICITY*

8 2013 YEAR IN SPORTS
FEB
N B ANATIONAL BASKETBALL ASSOCIATION
The fast-paced nature, high scoring games and iconic global superstars
of the NBA has younger fans continuing to tune in. When looking at
the NBA’s regular season viewing audience, NBA marketers have a lot
to be bullish about as the viewers are still skewing much younger than
other sports. The 34 and under viewers comprise 45 percent of the total
audience, for nationally televised regular season games.
In addition to skewing younger, NBA fans are also some of the most
social ones, too. Over 7.3 million Tweets were sent by 1.9 million Unique
Authors about the June 20th airing on ABC of the final game of the NBA
Finals between the Heat and Spurs.
NBA ALL-STARTNT
TIMELINE OF SEASON HIGHLIGHTS
NBA FINALS SAN ANTONIO VS. MIAMI
(7 TELECASTS) ABC
NBA CHRISTMAS DAY MIAMI VS. LA LAKERS
ABC
# OF TWEETS
26.7M10.8M
8M8.4M
17.7M
7.8M
2.9M 1.2M 1.8M
EASTERN CONFERENCE FINALS INDIANA VS. MIAMI (7 TELECASTS) TNT
NBA DRAFTESPN
3M
JUN
E
DEC
MAY
17 19 20 21 22 23 24 25 26 27 28 29 30 31 1 2 3 6 27 25
WESTERN CONFERENCE FINALS SAN ANTONIO VS. MEMPHIS
(4 TELECASTS) ESPN & ABC
4.9M
TOTAL SERIES
TOTAL SERIES
TOTAL SERIES
AVERAGE # OF TV VIEWERS

92013 YEAR IN SPORTS Copyright © 2013 The Nielsen Company
5 OF THE TOP 10 MOST-TWEETED ABOUT SPORTS EVENTS ARE NBA GAMES
Social media has fast become the new “water cooler” for fans to dish about
the latest sports topics, prompting teams, leagues, advertisers and brands
to take notice of the medium’s powerful connection with sports fans. And
in 2013, fans and non-fans alike took to Twitter to dish on NBA games,
positioning the league to have five of the ten most-Tweeted games in 2013.
Games six and seven of the NBA Finals on ABC between the Miami Heat
and San Antonio Spurs drew significant Twitter activity, with viewers sending
7.8 million and 7.4 million Tweets during the game, respectively. Only Super
Bowl XLVII drew more Twitter activity among TV viewers in 2013.
TOP 5 NBA SPORTS EVENTS BY # OF TWEETS: (JAN-NOV 2013)
NBA DEMO PROFILE (2012-2013 REGULAR SEASON):
2013 NBA FINALS (6/18)San Antonio Spurs at Miami Heat
7.8M ABC
2013 NBA FINALS (6/20)San Antonio Spurs at Miami HeatABC 7.4M
FAN INSIGHTS
Compared to the average U.S.
adult, avid NBA fans are 14% more
likely to have visited YouTube and
66% more likely to have used
Twitter in the past month
14% 66%
2013 NBA ALL-STAR GAME (2/17)TNT 2.9M
NBA BASKETBALL (6/3) Indiana Pacers at Miami HeatTNT 2.8M
2013 NBA FINALS (6/11)Miami Heat at San Antonio SpursABC 2.8M
GENDERMALE FEMALE
LESS THAN $20K $20K-$40K $40K-$75K $75-$100K $100K+
BLACK WHITE HISPANIC
AGE
INCOME
70% 30%
13% 32% 30% 25%
45% 40% 12%
13% 21% 32% 15% 18%
2-17 18-34 35-54 55+
TOP 5 NBA ADVERTISERS• Sprint Wireless
• State Farm Insurance
• Taco Bell
• Microsoft Windows
• KFC
1
2
3
4
5
TOP 5 LOCAL FAN BASES •
• San Antonio Spurs 60%
• Miami Heat 53%
• Dallas Mavericks 46%
• Chicago Bulls 45%
1
2
3
4
5
RACE/ETHNICITY*
NBA REGULAR
SEASON
NBA FINALS
2012-2013
2013
2011-2012
2012
1.4M
17.7M
1.6M
16.9M
SEASON-OVER-SEASON TV VIEWERSHIP:YOY% CHANGE IN VIEWERSHIP -11%YOY% CHANGE IN VIEWERSHIP +5%
Oklahoma City Thunder 64%
% of population that has watched, attended or listened to the team in the past 12 months

10 2013 YEAR IN SPORTS
APR
IL
M L BMAJOR LEAGUE BASEBALL
The Red Sox’s incredible run to the World Series Championship was the
story of the postseason, but the MLB regular season saw an incredible
resurgence in the heartland. Towns like Pittsburgh, Cleveland and Kansas
City who haven’t had recent success on the diamond each had strong
local viewership compared to last season, as the Pirates (+31%), Indians
(+45%) and Royals (+71%) all enjoyed a big jump in their local ratings.
Detroit and St. Louis have had more consistent success, and led their
leagues in local household ratings with the Tigers averaging 9.6 and the
Cards 8.7 in 2013.
Nationally, MLB regular season viewers are continuing to get older with
the 55+ audience comrising 50 percent of the viewers, versus 41 percent
ten seasons ago. As the audience skews older, it’s also gotten wealthier
with 21 percent of its viewing audience having household income of
$100K+ versus only 13 percent of its audience ten seasons ago.
1 16 1 2 11 12 13 14 15 16 17 18 19 23 24 25 26 27 28 29 30
OC
T
JULY
MLB OPENING DAY BOSTON VS. NY YANKEES
ESPN
WILDCARD GAMES PITTSBURGH VS. CINCINNATI, AND
TAMPA BAY VS. CLEVELAND(2 TELECASTS) TBS
NLCS PLAYOFFS ST LOUIS VS. LA DODGERS
(6 TELECASTS) TBS
ALCS PLAYOFFS BOSTON VS. DETROIT
(6 TELECASTS) FOX
WORLD SERIES BOSTON VS. ST LOUIS
(6 TELECASTS) FOXMLB ALL-STAR GAME
FOX
1.1M4.7M
5M 7.7M
14.9M11M
.3M .8M 4.3M1.8M1.7M
# OF TWEETS
TIMELINE OF SEASON HIGHLIGHTS
TOTAL SERIESTOTAL SERIESTOTAL SERIES
AVERAGE # OF TV VIEWERS
112013 YEAR IN SPORTS Copyright © 2013 The Nielsen Company
1 16 1 2 11 12 13 14 15 16 17 18 19 23 24 25 26 27 28 29 30
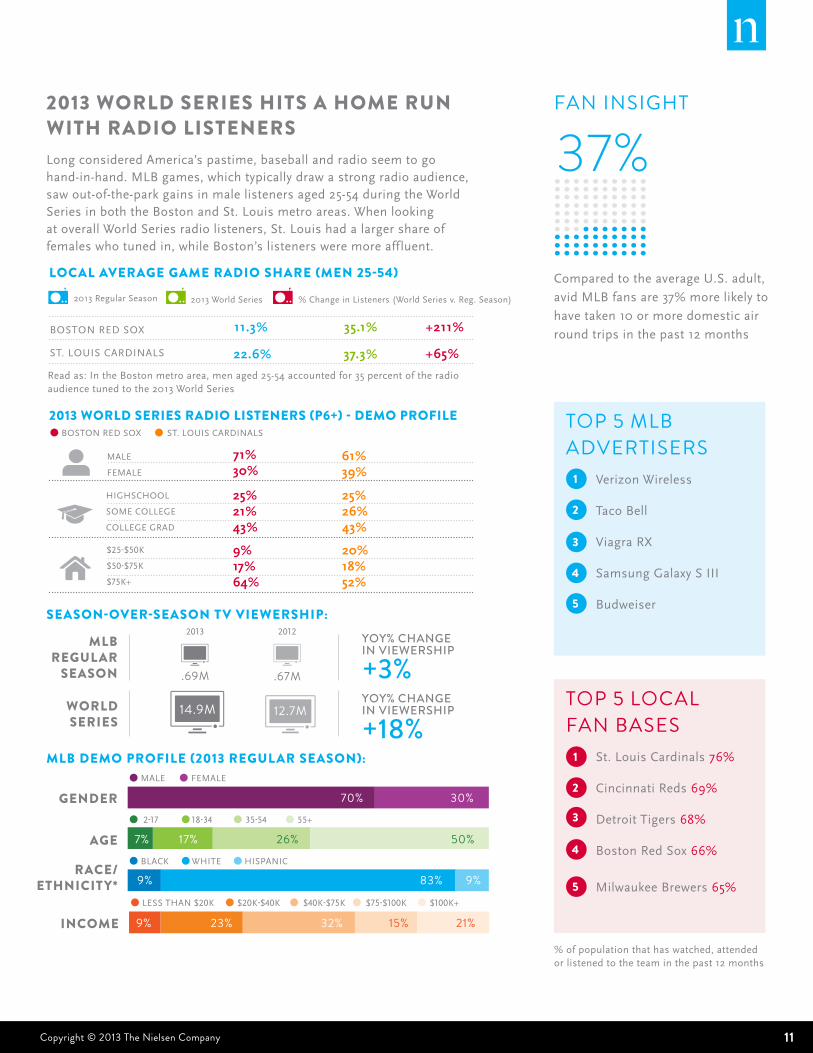
2013 WORLD SERIES HITS A HOME RUN WITH RADIO LISTENERS Long considered America’s pastime, baseball and radio seem to go hand-in-hand. MLB games, which typically draw a strong radio audience, saw out-of-the-park gains in male listeners aged 25-54 during the World Series in both the Boston and St. Louis metro areas. When looking at overall World Series radio listeners, St. Louis had a larger share of females who tuned in, while Boston’s listeners were more affluent.
SEASON-OVER-SEASON TV VIEWERSHIP:
LOCAL AVERAGE GAME RADIO SHARE (MEN 25-54)
2013 WORLD SERIES RADIO LISTENERS (P6+) - DEMO PROFILE
MLB DEMO PROFILE (2013 REGULAR SEASON):
Read as: In the Boston metro area, men aged 25-54 accounted for 35 percent of the radio audience tuned to the 2013 World Series
Compared to the average U.S. adult,
avid MLB fans are 37% more likely to
have taken 10 or more domestic air
round trips in the past 12 months
FAN INSIGHT
MALE FEMALE
70% 30%GENDER
7% 17% 26% 50%AGEBLACK WHITE HISPANIC
9% 83% 9%
LESS THAN $20K $20K-$40K $40K-$75K $75-$100K $100K+
9% 23% 32% 15% 21%INCOME
37%
TOP 5 MLB ADVERTISERS• Verizon Wireless
• Taco Bell
• Viagra RX
• Samsung Galaxy S III
• Budweiser
1
2
3
4
5
TOP 5 LOCAL FAN BASES • St. Louis Cardinals 76%
• Cincinnati Reds 69%
• Detroit Tigers 68%
• Boston Red Sox 66%
• Milwaukee Brewers 65%
1
2
3
4
5RACE/
ETHNICITY*
2013 Regular Season 2013 World Series % Change in Listeners (World Series v. Reg. Season)
BOSTON RED SOX 11.3% 35.1% +211%
+65%ST. LOUIS CARDINALS 22.6% 37.3%
MALE
FEMALE
71%30%
25%21%43%
9%17%64%
25%26%43%
20%18%52%
61%39%
HIGHSCHOOL
SOME COLLEGE
COLLEGE GRAD
$25-$50K
$50-$75K
$75K+
BOSTON RED SOX ST. LOUIS CARDINALS
MLB REGULAR
SEASON
WORLD SERIES
2013 2012
.69M
12.7M
.67M
14.9M
YOY% CHANGE IN VIEWERSHIP +3%YOY% CHANGE IN VIEWERSHIP +18%
% of population that has watched, attended or listened to the team in the past 12 months
2-17 18-34 35-54 55+

12 2013 YEAR IN SPORTS
N H LNATIONAL HOCKEY LEAGUE
Absence definitely made the heart grow fonder for NHL fans in 2013.
Despite a labor dispute that culminated in a lockout and a strike
shortened regular season of only 48 games, the NHL regular season
average viewership increased by almost 20 percent in 2013 versus the
prior season, albeit over a shorter period of time.
Over the past ten years, NHL regular season viewership continues to
skew more affluent. Over half (53%) of the NHL’s viewing audience for
nationally televised regular season games in 2013 came from households
earning over $75K, compared to only 27 percent of its audience ten
seasons ago.
JUN
E 20
13
JAN
201
4
1 2 3 4 5 6 7 8 12 13 14 15 16 17 18 19 20 21 22 23 24
GENDER
AGE
INCOME
WESTERN CONFERENCE FINALS CHICAGO VS. LA KINGS
(5 TELECASTS) NBC & NBCSN
EASTERN CONFERENCE FINALS BOSTON VS. PITTSBURGH
(4 TELECASTS) NBC & NBCSN
STANLEY CUP FINALS CHICAGO VS. BOSTON
(6 TELECASTS) NBC & NBCSN
WINTER CLASSIC DETROIT VS. TORONTO
NBC
2.4M
2.9M
5.8M
4.4M
TIMELINE OF SEASON HIGHLIGHTS
# OF TWEETS
2.8M.2M.9M .7M
1
TOTAL SERIES TOTAL SERIES TOTAL SERIES
AVERAGE # OF TV VIEWERS

132013 YEAR IN SPORTS Copyright © 2013 The Nielsen Company
RECORD-SETTING STANLEY CUP FINALS BY THE NUMBERS
NHL DEMO PROFILE (2012-2013 REGULAR SEASON):
The 2013 Stanley Cup Finals featured TWO of the original SIX NHL teams (Chicago Blackhawks, Boston Bruins), THREE overtime contests, including a TRIPLE-overtime in Game ONE
The Stanley Cup Finals averaged
5.8 million viewers (NBC and NBC Sports Network), becoming the most-watched Finals on record
Series-clinching Game SIX was
watched by 8.2 million viewers on NBC, up 66 percent from Game 6 in 2012, making it the second-most watched Game 6 since 1994
Overall, the 2013 Stanley Cup
Playoffs averaged 1.5 million viewers (across NBC, NBC
Sports Network and CNBC), making
it the most-watched post-season
since 1997
GENDERMALE FEMALE
LESS THAN $20K $20K-$40K $40K-$75K $75-$100K $100K+
BLACK WHITE HISPANIC
AGE
INCOME
68% 32%
9% 28% 35% 29%
3% 92% 2%
9% 12% 27% 20% 33%
2-17 18-34 35-54 55+
Compared to the average U.S. adult,
avid NHL fans are 20% more likely
to own a smartphone and 34% more
likely to own a tablet
FAN INSIGHTS
TOP 5 NHL ADVERTISERS• Discover Credit Card
• Geico Auto Insurance Coors Light
• MYCLEANPC.COM
• Subway
1
2
3
4
5
TOP 5 LOCAL FAN BASES • Pittsburgh Penguins 54%
• Buffalo Sabres 48%
• Detroit Red Wings 45%
• Boston Bruins 41%
• St. Louis Blues 33%
1
2
3
4
5
20% 34%
NHL REGULAR
SEASON
STANLEY CUP FINALS
2012-2013
2013
2011-2012
2012
.5M
5.8M
.4M
3M
SEASON-OVER-SEASON TV VIEWERSHIP:YOY% CHANGE IN VIEWERSHIP +19%YOY% CHANGE IN VIEWERSHIP +91%
RACE/ETHNICITY*
% of population that has watched, attended or listened to the team in the past 12 months

14 2013 YEAR IN SPORTS
M OTO R S P O R T S
NASCAR AND INDY RACING*
TIMELINE OF SEASON HIGHLIGHTS
FEB
MA
R
MAY
OC
T
24 3 10 5 26 12
One of the most well-known personalities in motorsports, Danica Patrick, has
seemingly had an impact on TV viewership since she shifted from the IndyCar series to
NASCAR two years ago. Case in point: In 2013, Indianapolis 500 viewership declined 17
percent versus the prior year. On the other hand, the 2013 Daytona 500, where Danica
became the first female driver to win a pole and ultimately finished eighth, saw a 22
percent increase in viewing compared to 2012.
Danica’s presence certainly generates buzz among race fans, and the Sprint Cup Series
has a long track record of attracting a strong female audience in particular. Over the
past ten years, NASCAR’s top series has consistently boasted the highest share of
female viewers among any major sports property regularly aired on TV (37%).
DAYTONA 500 FOX
SUBWAY FRESH FIT 500FOX KOBALT TOOLS 400
FOXINDIANAPOLIS 500*
ABCBANK OF
AMERICA 500ABC
AARON’S 500FOX
16.7M9.1M
7.5M5.7M 5.6M
7.3M
# OF TWEETS
.5M 89K
AVERAGE # OF TV VIEWERS

152013 YEAR IN SPORTS Copyright © 2013 The Nielsen Company
TOP NASCAR TV ADVERTISER CATEGORIES
Motor sports are an advertiser’s dream, offering prime advertising real
estate in the form of cars, helmets, and drivers’ uniforms—basically
anywhere you can find space. This unique advertising format draws an
eclectic mix of brands across a variety of categories, and the television
advertisers who promote their goods during NASCAR races are just as
diverse. Auto advertisers continue to spend the most ad dollars on NASCAR
events, while motion picture advertisers showed the largest year-over-year
increase in spending among the top advertiser categories.
Share of Total NASCAR Ad Spend YOY % Change in Ad Spend
SEASON-OVER-SEASON TV VIEWERSHIP:
TOP 10 TELEVISION AD SPEND CATEGORIES - NASCAR RACESQ4 2012 - Q3 2013, TOTAL TV SPEND ON BROADCAST & CABLE
Autos,trucks & misc. vehicles - factory
Communication & public utilities
17% +16%
12% -14%
Restaurants, hotel dining & night clubs 9% -1%
Medicines & proprietary remedies 9% +30%
Organizations 7% +5%
Retail stores 6% -6%
Proper casualty & ins 6% -28%
Soft drinks & bottled waters 4% +26%
Motion pictures 3% +60%
Beer & wine 3% +3%
Compared to the average U.S.
adult, avid NASCAR fans are 36%
more likely to plan to buy a new
full-size car and twice as likely to
plan to buy a new pickup truck, in
the next 12 months
FAN INSIGHTS
36%
TOP 5 NASCAR ADVERTISERS• Chevrolet Silverado
• AT&T Wireless
• KFC
• Budweiser
• Sprint Wireless
1
2
3
4
5
TOP 5 TWEETED DRIVERS @DAYTONA 500 • Danica Patrick 102K
• Jimmie Johnson 21K
• Brad Keselowski 9K
• Dale Earnhardt Jr. 7K
• Kyle Busch 6K
NASCAR DEMO PROFILE (2013 SPRINT CUP SERIES):
MALE FEMALE
63% 37%GENDER
5% 9% 37% 49%AGEBLACK WHITE HISPANIC
2% 94% 2%
LESS THAN $20K $20K-$40K $40K-$75K $75-$100K $100K+
11% 24% 37% 14% 14%INCOME
RACE/ETHNICITY*
1
2
3
4
5
NASCAR SPRINT
CUP SERIES
2013 2012
5.77M 5.76M
YOY% CHANGE IN VIEWERSHIP +0.2%
2-17 18-34 35-54 55+
Activity includes all Tweets containing the keyword phrase as shown.
16 2013 YEAR IN SPORTS
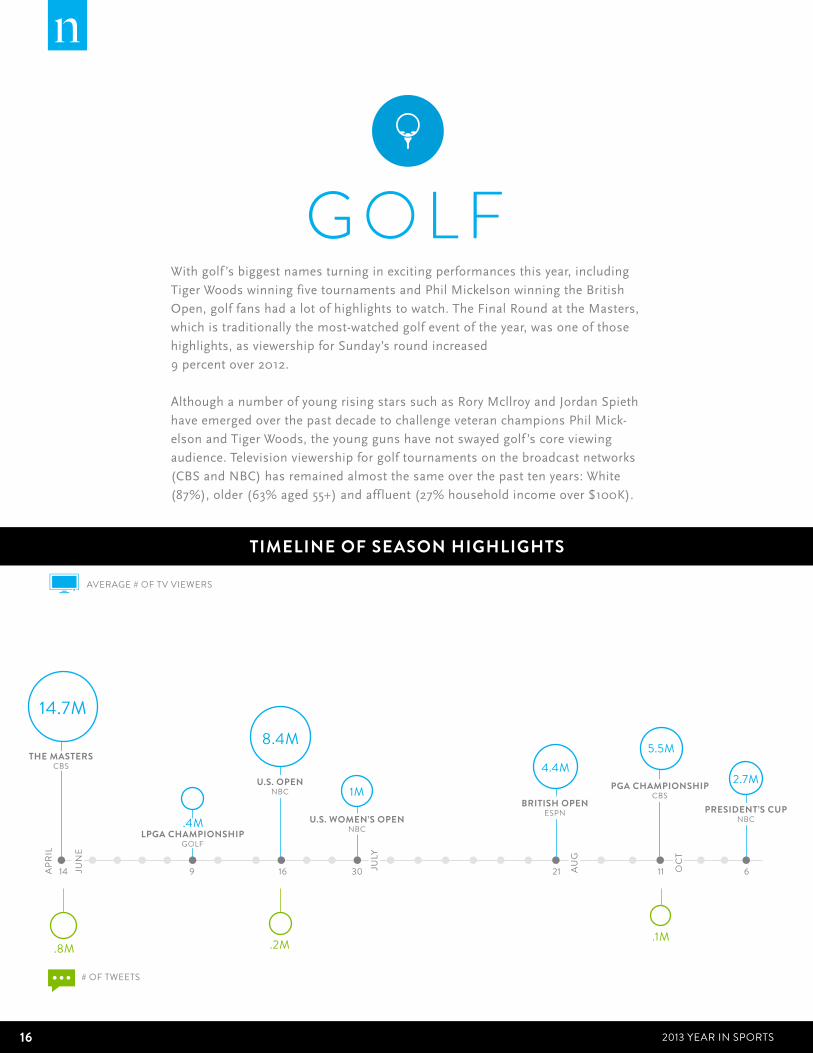
G O L FWith golf ’s biggest names turning in exciting performances this year, including
Tiger Woods winning five tournaments and Phil Mickelson win ning the British
Open, golf fans had a lot of highlights to watch. The Final Round at the Masters,
which is traditionally the most-watched golf event of the year, was one of those
highlights, as viewership for Sunday’s round increased
9 percent over 2012.
Although a number of young rising stars such as Rory Mcllroy and Jordan Spieth
have emerged over the past decade to challenge veteran champions Phil Mick-
elson and Tiger Woods, the young guns have not swayed golf ’s core viewing
audience. Television viewership for golf tournaments on the broadcast networks
(CBS and NBC) has remained almost the same over the past ten years: White
(87%), older (63% aged 55+) and affluent (27% household income over $100K).
TIMELINE OF SEASON HIGHLIGHTS
APR
IL
JUN
E
JULY
AU
G
OC
T
14 9 16 30 21 11 6
GENDER
AGE
INCOME
THE MASTERSCBS
LPGA CHAMPIONSHIPGOLF
U.S. OPENNBC
PRESIDENT’S CUPNBCU.S. WOMEN’S OPEN
NBC
14.7M8.4M
2.7M1M
# OF TWEETS
.8M .2M
.4M
.1M
4.4M
BRITISH OPENESPN
PGA CHAMPIONSHIPCBS
5.5M
AVERAGE # OF TV VIEWERS

172013 YEAR IN SPORTS Copyright © 2013 The Nielsen Company
AVID GOLF FANS SKEW OLDER, RICHER & TECH SAVVY
PGA DEMO PROFILE (2013 REGULAR SEASON):
GENDER
AGE
INCOME
65% 35%
4% 8% 24% 63%
7% 87% 3%
8% 17% 31% 16% 27%
Avid PGA fans are 43% more likely
to own second homes and 60%
more likely to own stocks/stock
options compared to the average
U.S. household
FAN INSIGHTS
43% 60%
TOP 5 PGA ADVERTISERS• Cialis RX
• FedEx
• Konica Minolta
• Titleist Pro V1
• IBM Business
1
2
3
4
5
The majority of avid golf fans are over the age of 55, but don’t let their
age fool you--they’re also highly tech-savy and access sports content on
a variety of devices. Perhaps it’s because the first two rounds of most
tournaments are typically played during the work day on Thursday and
Friday, avid PGA Fans are far more likely to consume sports content on
mobile apps (30%), tablets (33%) and while at work (20%) than fans of
other sports, and actually less likely to watch on TV.
% OF FANS WHO ACCESS SPORTS CONTENT BY DEVICE AND LOCATION AVID PGA FANS SPORTS FANS (NON-AVID PGA FANS)
TOP 5 TWEETEDGOLFERS @ AUGUSTA • Adam Scott 234K
• Tiger Woods 127K
• Angel Cabrera 63K
• Jason Day 30K
• Brandt Snedeker 27K
1
2
3
4
5
MALE FEMALE
2-17 18-34 35-54 55+
LESS THAN $20K $20K-$40K $40K-$75K $75-$100K $100K+
BLACK WHITE HISPANIC
RACE/ETHNICITY*
30%21%
MOBILE APP*
32%
32%
83% 33%
34%51% 47%
19% 89% 16%
TV TABLET SMARTPHONE
DESKTOP LAPTOP
13%3%
WORK COMMUTING
20%8%
Read as: 33% of avid PGA fans consumer sports content on a tablet
*Follow sports news
Activity includes all Tweets containing the keyword phrase as shown.

18 2013 YEAR IN SPORTS
S O C C E RWith the World Cup set to kick off in June 2014 in Brazil, there was a
lot of focus and excitement in the soccer world on a number of big
World Cup qualifying matches that took place in 2013. In the U.S.,
the most-watched soccer match of the year was the qualifying match
between U.S. and Mexico in March, which drew nearly 7 million
viewers across the Spanish and English broadcasts.
Despite the retirement of David Beckham, the MLS still had strong
viewership during its playoffs, which were up 9 percent compared
to 2012. When looking at the MLS regular season TV audience, the
viewership skewed young (40% under 34) and Hispanic (34%).
TIMELINE OF SEASON HIGHLIGHTS
MA
R
JUN
JUL
JAN
SEP
DEC
30 26 19 11 21 28 22 26 29
MEXICO VS. DENMARKESPN2 & UNIMAS
FIFA CONFED. CUP BRAZIL VS. MEXICO
ESPN & UNI
GOLD CUP UNITED STATES VS.
EL SALVADOR UNI & FOX
ENGLISH PREMIER LEAGUE (EPL)
MANCHESTER UNITED VS. MANCHESTER CITY
NBCSN & TEL
2.5M
3.3M
1.2M1.1M
.8M
WORLD CUP QUALIFIERS UNITED STATES VS. MEXICO
ESPN & UNIMAS
GOLD CUP MEXICO VS. CANADA
UNIMAS & FOX SOCCER
GOLD CUP UNITED STATES VS.
PANAMAUNI & FOX
7M
2.1M
4.5M
3.1M
EPL LIVERPOOL VS.
MANCHESTER CITYNBCSN & MUN2
EPL LIVERPOOL VS.
CHELSEA NBCSN & TEL
.23M .38M .14M(UNIMAS) (UNI) (UNI)
AVERAGE # OF TV VIEWERS
192013 YEAR IN SPORTS Copyright © 2013 The Nielsen Company
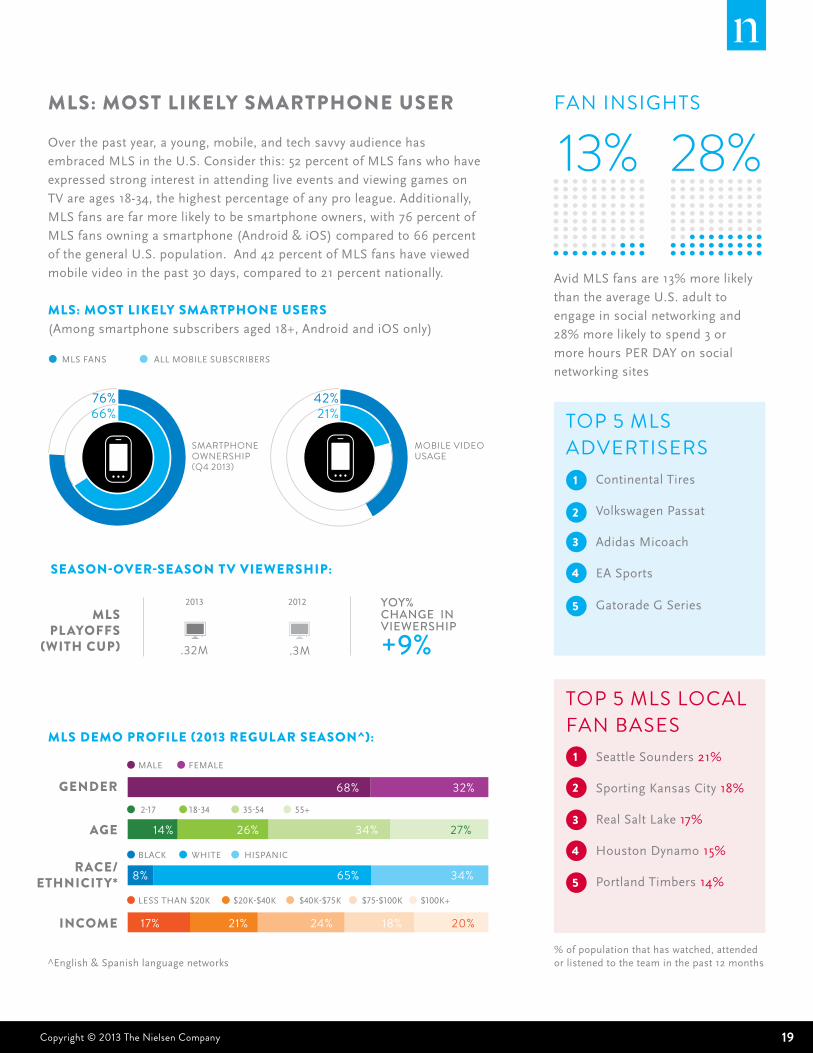
MLS: MOST LIKELY SMARTPHONE USER
Over the past year, a young, mobile, and tech savvy audience has
embraced MLS in the U.S. Consider this: 52 percent of MLS fans who have
expressed strong interest in attending live events and viewing games on
TV are ages 18-34, the highest percentage of any pro league. Additionally,
MLS fans are far more likely to be smartphone owners, with 76 percent of
MLS fans owning a smartphone (Android & iOS) compared to 66 percent
of the general U.S. population. And 42 percent of MLS fans have viewed
mobile video in the past 30 days, compared to 21 percent nationally.
MLS: MOST LIKELY SMARTPHONE USERS(Among smartphone subscribers aged 18+, Android and iOS only)
MLS DEMO PROFILE (2013 REGULAR SEASON^):
GENDERMALE FEMALE
2-17 18-34 35-54 55+
LESS THAN $20K $20K-$40K $40K-$75K $75-$100K $100K+
BLACK WHITE HISPANIC
AGE
INCOME
68% 32%
14% 26% 34% 27%
8% 65% 34%
17% 21% 24% 18% 20%
Avid MLS fans are 13% more likely
than the average U.S. adult to
engage in social networking and
28% more likely to spend 3 or
more hours PER DAY on social
networking sites
FAN INSIGHTS
13% 28%
TOP 5 MLS ADVERTISERS• Continental Tires
• Volkswagen Passat
• Adidas Micoach
• EA Sports
Gatorade G Series
1
2
3
4
5
TOP 5 MLS LOCAL FAN BASES • Seattle Sounders 21%
• Sporting Kansas City 18%
• Real Salt Lake 17%
• Houston Dynamo 15%
• Portland Timbers 14%
1
2
3
4
5
MLS PLAYOFFS
(WITH CUP)
2013
MLS FANS ALL MOBILE SUBSCRIBERS
2012
.32M .3M
SEASON-OVER-SEASON TV VIEWERSHIP:
YOY% CHANGE IN VIEWERSHIP +9%
RACE/ETHNICITY*
SMARTPHONE OWNERSHIP(Q4 2013)
MOBILE VIDEO USAGE
76% 42%66% 21%
^English & Spanish language networks% of population that has watched, attended or listened to the team in the past 12 months

20 2013 YEAR IN SPORTS
N C A ABASKETBALL
Maybe it’s all those brackets and office pools for March Madness, but the
viewing audience for the NCAA Tournament definitely shifts from the NCAA
Regular Season. During the regular season in 2012-13, the female audience
accounted for less than 29 percent of total viewers, but climbed to 35 percent
of the audience for the 2013 Tournament. Additionally, the audience gets more
affluent come tournament time, as those with a household income of $100K+
accounted for 23 percent of regular season viewers and 27 percent of the total
March Madness audience.
The 2013 tournament also generated a significant amount of Twitter activity
with the April 8 airing of Michigan vs. Louisville in the Championship Game
on CBS, ranking as the most tweeted about telecast in the month of April.
TIMELINE OF SEASON HIGHLIGHTS
MA
RC
H
21 22 23 24 28 29 30 31 6 8
APR
IL
# OF TWEETS
ROUND OF 64(32 TELECASTS)
CBS/TNT/TBS/TRUTV
SWEET 16(8 TELECASTS)
CBS/TBS
FINAL 4(2 TELECASTS)
CBSROUND OF 32(16 TELECASTS)
CBS/TNT/TBS/TRUTV
ELITE 8(4 TELECASTS)
CBS
CHAMPIONSHIP GAME
MICHIGAN VS. LOUISVILLE
CBS
2M
5.9M
15.7M
5M
11M
23.4M
3.3M
4.6M2.7M
TOTAL SERIES TOTAL SERIES
AVERAGE # OF TV VIEWERS

212013 YEAR IN SPORTS Copyright © 2013 The Nielsen Company
A CLOSER LOOK AT THE CONFERENCES
The ACC has long been thought of as the dominant and most popular
basketball conference in the country, with North Carolina and Duke
leading the way. However, throughout the 2012-13 regular season the Big
10’s Indiana, Michigan, Michigan State and Ohio State were consistently
near the top of the rankings and as a result led the pack in terms of TV
viewership. On average, three million viewers tuned in for the top 10
nationally televised regular season games involving a team from the Big
10 conference. Adults who visit NCAA.com are 59
percent more likely than the average
U.S. adult to have purchased
Sporting Goods within the last 6
months
FAN INSIGHTS
59%
TOP 5 NCAAB ADVERTISERS• AT&T Wireless
• Bud Light
• Capital One Credit Card
• Southwest Airlines
• Lowes
1
2
3
4
5
TOP 5 LOCAL FAN BASES • Kentucky Wildcats 67%
(Lexington) Louisville Cardinals 58% (Louisville) Syracuse Orange 49% (Syracuse) Ohio State Buckeyes 46% (Columbus) Memphis Tigers 41% (Memphis)
1
2
3
4
5
DEMO PROFILE (2013 NCAA TOURNAMENT):
MALE FEMALE
65% 35%GENDER
8% 21% 31% 40%AGE
BLACK WHITE HISPANIC
14% 80% 4%
LESS THAN $20K $20K-$40K $40K-$75K $75-$100K $100K+
8% 16% 31% 18% 27%INCOME
2-17 18-34 35-54 55+
TOP 10 GAMES BY AVERAGE VIEWERSHIP*
RACE/ETHNICITY*
NCAAB REGULAR
SEASON
NCAAB CHAMPION
-SHIP
2013-2012
2013
2012-2011
2012
.917M .919M
SEASON-OVER-SEASON TV VIEWERSHIP:
YOY% CHANGE IN VIEWERSHIP -0.2%YOY% CHANGE IN VIEWERSHIP +12.3%
23.4M 20.9M
SEC
2M
PAC12
.98M1.9M
BIG EAST
ACC
2.5M
BIG10
3M
*top ten games involving specified conference
1.9M
BIG 12
% of population that has watched, attended or listened to the team in the past 12 months
22 2013 YEAR IN SPORTS
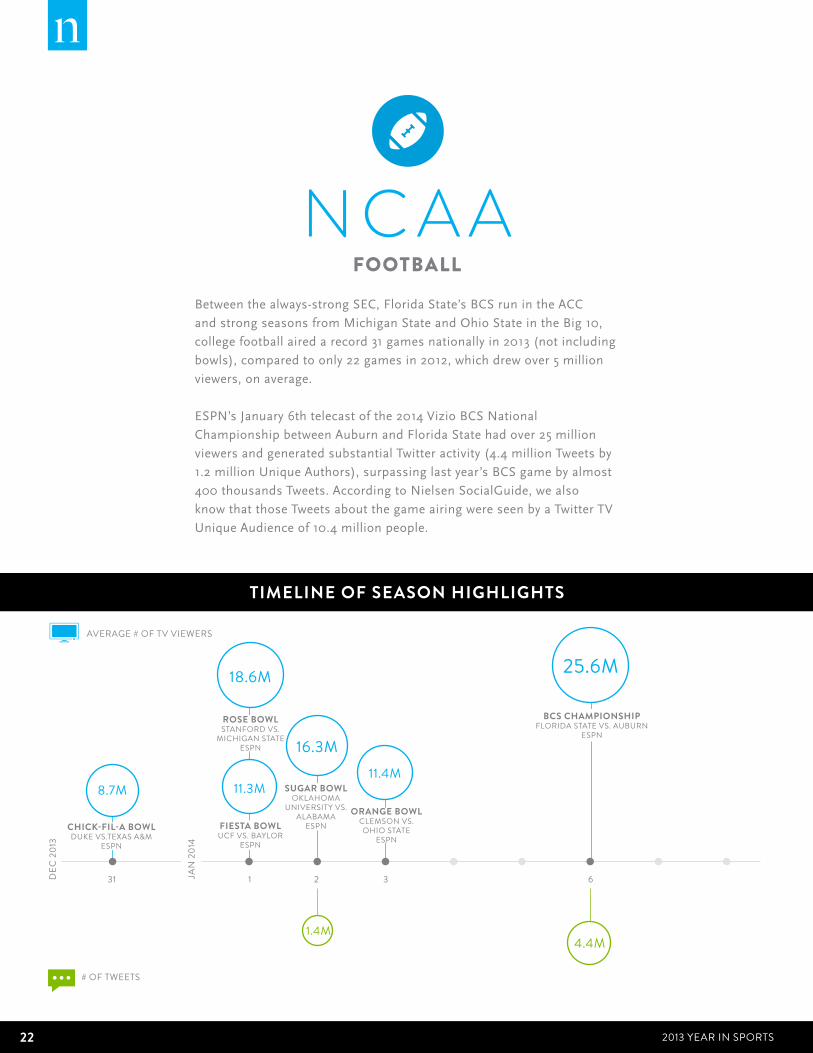
N C A AFOOTBALL
Between the always-strong SEC, Florida State’s BCS run in the ACC
and strong seasons from Michigan State and Ohio State in the Big 10,
college football aired a record 31 games nationally in 2013 (not including
bowls), compared to only 22 games in 2012, which drew over 5 million
viewers, on average.
ESPN’s January 6th telecast of the 2014 Vizio BCS National
Championship between Auburn and Florida State had over 25 million
viewers and generated substantial Twitter activity (4.4 million Tweets by
1.2 million Unique Authors), surpassing last year’s BCS game by almost
400 thousands Tweets. According to Nielsen SocialGuide, we also
know that those Tweets about the game airing were seen by a Twitter TV
Unique Audience of 10.4 million people.
TIMELINE OF SEASON HIGHLIGHTS
DEC
201
3
31 1 2 3 6
BCS CHAMPIONSHIPFLORIDA STATE VS. AUBURN
ESPN
SUGAR BOWLOKLAHOMA
UNIVERSITY VS. ALABAMA
ESPN
ORANGE BOWLCLEMSON VS. OHIO STATE
ESPN
25.6M
11.3M
18.6M
11.4M8.7M
FIESTA BOWLUCF VS. BAYLOR
ESPN
BCS CHAMPION
-SHIP
# OF TWEETS
1.4M4.4M
CHICK-FIL-A BOWLDUKE VS.TEXAS A&M
ESPN
ROSE BOWLSTANFORD VS.
MICHIGAN STATE ESPN
JAN
201
4
16.3M
AVERAGE # OF TV VIEWERS

232013 YEAR IN SPORTS Copyright © 2013 The Nielsen Company
A CLOSER LOOK AT THE CONFERENCES
Despite the fact that the SEC’s streak of seven BCS Championships in a
row was finally snapped this year in dramatic fashion by Florida State, the
conference enjoyed another banner year in terms of having the most viewed
college football games of the 2013 season. Between Alabama’s strong
season and holding the top spot in the polls until the final week of the
season, Auburn and Missouri’s resurgence and “Johnny Football” lighting
up the scoreboard for the Aggies, it is easy to see why the storylines in the
SEC captured the college football viewership crown again. An astounding
9.7 million viewers, on average, tuned in for the top 10 nationally televised
regular season games involving a team from the SEC.
Compared to the average U.S.
adult, avid college football fans
are 18% more likely to have life
insurance and 24% more likely to
belong to a health club
FAN INSIGHTS
18%
TOP 5 NCAAF ADVERTISERS• AT&T Wireless
• Taco Bell
• Aflac
• Verizon Wireless
• Home Depot
1
2
3
4
5
TOP 5 LOCAL FAN BASES • Ohio State Buckeyes 66%
(Columbus) Alabama Crimson Tide 65% (Birmingham) Arkansas Razorbacks 58% (Little Rock) Tennessee Volunteers 56% (Knoxville) Oklahoma Sooners 55% (Oklahoma City)
24%
TOP 10 GAMES BY AVERAGE VIEWERSHIP*
NCAA DEMO PROFILE (2013-2014 NCAA BOWL GAMES):
MALE FEMALE
66% 34%GENDER 2-17 18-34 35-54 55+
8% 18% 30% 44%AGE
BLACK WHITE HISPANIC
13% 82% 4%
LESS THAN $20K $20K-$40K $40K-$75K $75-$100K $100K+
9% 17% 32% 16% 25%INCOME
RACE/ETHNICITY*
NCAAF REGULAR
SEASON
BCS CHAMPION
-SHIP
YOY% CHANGE IN VIEWERSHIP +4.6%YOY% CHANGE IN VIEWERSHIP -3.1%
2.6M 2.5M
25.6M 26.4M
SEASON-OVER-SEASON TV VIEWERSHIP:2013
2014
2012
2013
SEC
9.7M
PAC12
3.9M
NOTRE DAME
4M
BIG 12
4.2M
ACC
5.3M
BIG10
7M
*top ten game involving specified conference/team
1
2
3
4
5
% of population that has watched, attended or listened to the team in the past 12 months
24 2013 YEAR IN SPORTS
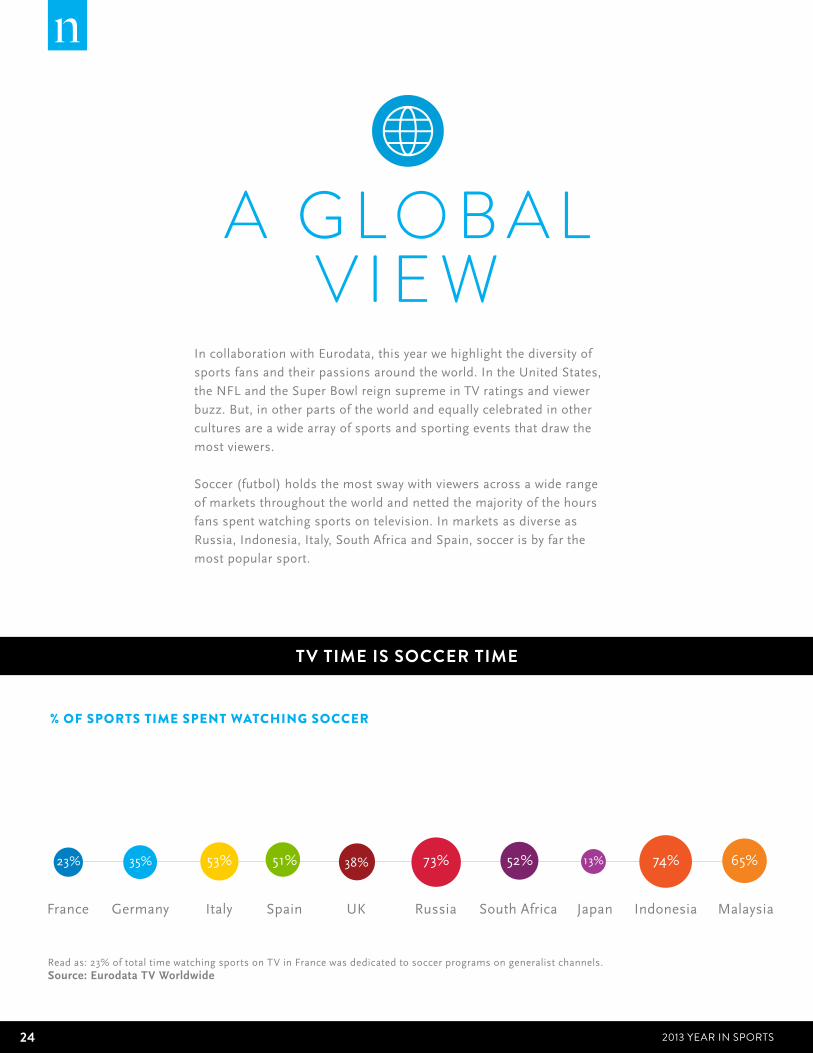
A G L O B A LV I E W
In collaboration with Eurodata, this year we highlight the diversity of
sports fans and their passions around the world. In the United States,
the NFL and the Super Bowl reign supreme in TV ratings and viewer
buzz. But, in other parts of the world and equally celebrated in other
cultures are a wide array of sports and sporting events that draw the
most viewers.
Soccer (futbol) holds the most sway with viewers across a wide range
of markets throughout the world and netted the majority of the hours
fans spent watching sports on television. In markets as diverse as
Russia, Indonesia, Italy, South Africa and Spain, soccer is by far the
most popular sport.
% OF SPORTS TIME SPENT WATCHING SOCCER
TV TIME IS SOCCER TIME
France
23%
Germany
35% 51%
Spain
53%
Italy
73%
Russia
38%
UK
52%
South Africa
74%
Indonesia
13%
Japan
65%
Malaysia
MAJOR TV SPORTS EVENT GLOBALLY
Read as: 23% of total time watching sports on TV in France was dedicated to soccer programs on generalist channels. Source: Eurodata TV Worldwide
252013 YEAR IN SPORTS Copyright © 2013 The Nielsen Company
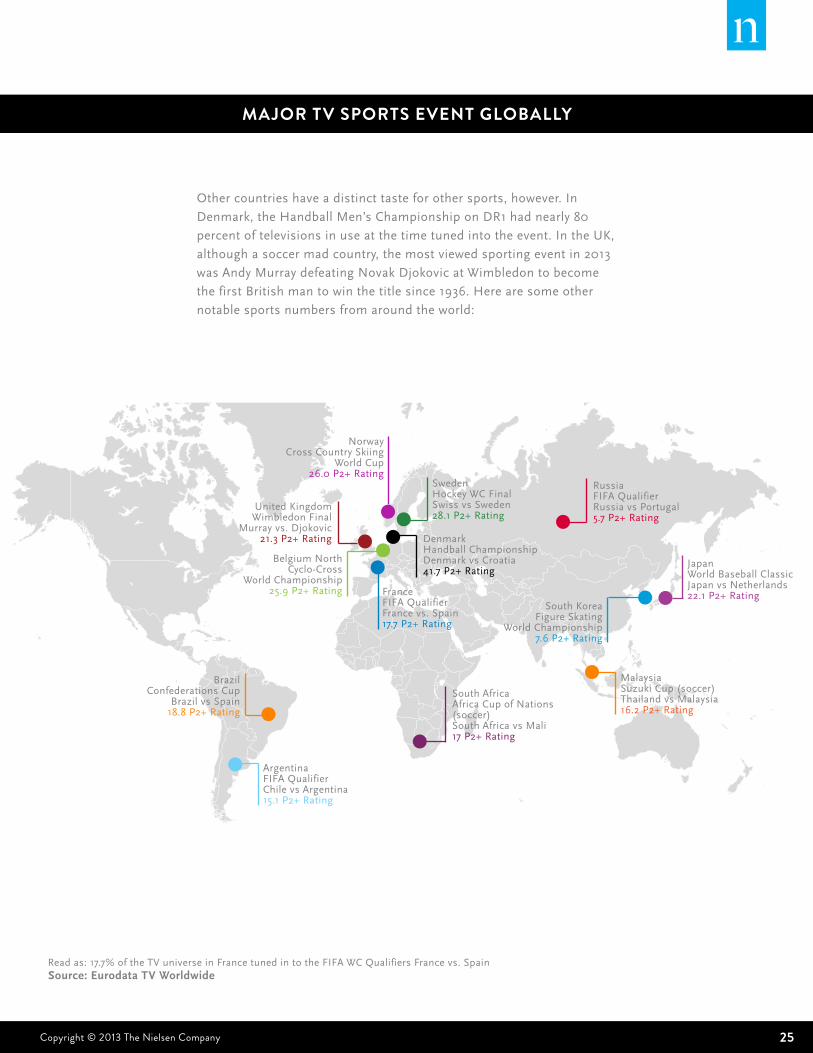
MAJOR TV SPORTS EVENT GLOBALLY
South AfricaAfrica Cup of Nations (soccer)South Africa vs Mali17 P2+ Rating
FranceFIFA QualifierFrance vs. Spain17.7 P2+ Rating
United KingdomWimbledon Final
Murray vs. Djokovic21.3 P2+ Rating
RussiaFIFA QualifierRussia vs Portugal5.7 P2+ Rating
JapanWorld Baseball ClassicJapan vs Netherlands22.1 P2+ Rating
MalaysiaSuzuki Cup (soccer)Thailand vs Malaysia16.2 P2+ Rating
NorwayCross Country Skiing
World Cup26.0 P2+ Rating
SwedenHockey WC FinalSwiss vs Sweden28.1 P2+ Rating
DenmarkHandball ChampionshipDenmark vs Croatia41.7 P2+ Rating
South KoreaFigure Skating
World Championship7.6 P2+ Rating
BrazilConfederations Cup
Brazil vs Spain18.8 P2+ Rating
ArgentinaFIFA QualifierChile vs Argentina15.1 P2+ Rating
Belgium NorthCyclo-Cross
World Championship25.9 P2+ Rating
Read as: 17.7% of the TV universe in France tuned in to the FIFA WC Qualifiers France vs. Spain Source: Eurodata TV Worldwide
Other countries have a distinct taste for other sports, however. In
Denmark, the Handball Men’s Championship on DR1 had nearly 80
percent of televisions in use at the time tuned into the event. In the UK,
although a soccer mad country, the most viewed sporting event in 2013
was Andy Murray defeating Novak Djokovic at Wimbledon to become
the first British man to win the title since 1936. Here are some other
notable sports numbers from around the world:

26 2013 YEAR IN SPORTS
OT H E R M A R Q U E E
S P O R T S P R O G R A M M I N G
TIMELINE OF YEARLY HIGHLIGHTS
JAN
APR
IL
MAY
JULY
SEPUFC ON FOX
JOHNSON VS. DODSONFOX
WIMBLEDON WOMEN’S FINAL
ESPN
KENTUCKY DERBY
NBC
U.S. OPEN WOMEN’S FINAL
CBS
U.S. OPEN MEN’S FINAL
CBS
MANTI T’EO INTERVIEW W/ KATIE COURIC
DAD
UFC ON FOXHENDERSON VS. MELENDEZ
FOX WIMBLEDON MEN’S FINALESPN
2.6M
4.2M
1.3M
16.2M6.2M
3.8M 3.7M
2.5M3.4M
2.4M
17 18 24 26 20 4 6 7 21 27 8 9
UFC ON FOXJOHNSON VS. MORAGA
FOX
# OF TWEETS
.3M
92K.1M .2M1M
LANCE ARMSTRONG INTERVIEW W/
OPRAH WINFREY 2 TELECASTS
OWN.2M
TOUR DE FRANCE (FINAL DAY)
(5 TELECASTS) NBCSN
AVERAGE # OF TV VIEWERS

272013 YEAR IN SPORTS Copyright © 2013 The Nielsen Company
SOURCE PAGE
17 18 24 26 20 4 6 7 21 27 8 9
Page 3:• Hours of programming and collective hours viewed:
Nielsen National TV Toolbox *Originator Type:
Network, Cable Syndication, Summary Type Codes:
Sports Event, Sports News, Sports Anthology, Sports
Commentary, P2+ and Live+SD, 1 min Qualifier.
The Total Hours was calculated by multiplying the
Reach Projection by Minutes viewed for each month
throughout the year.
Page 4 & 5:• Visiting Sports Sites: Nielsen Netview – Total
Methodology. Apr 1 – Apr 30, Sep 1 – Sep 30.
• Watching Video on a Sports Site: Nielsen
VideoCensus – Total Methodology. Apr 1 – Apr 30,
Sep 1 – Sep 30.
• Accessing Sports Content on a Mobile Device:
Nielsen Mobile Netview - Smartphones only. Apr 1 –
Apr 30, Sep 1 – Sep 30.
NFL• Timeline:
• TV Viewers: Nielsen Galaxy Explorer, Jan 2013 –
Jan 2014, P2+ and Live+SD
• Social: Nielsen SocialGuide, Jan 2013 – Jan
2014.
• Fantasy Football App: Nielsen, Mobile NetView,
September 2013
• Season-over-Season Viewership:
• Regular Season:Nielsen Galaxy Explorer, Sep-
Dec 2012, Sep-Dec 2013, P2+ and Live+SD.
*Networks included: NBC, CBS, FOX , NFLN,
ESPN.
• Demo Profile: Nielsen National TV Toolbox, Sep-Dec
2013, Live+SD *Networks included: CBS, FOX, NBC,
ESPN, NFLN
• Fan Insights: Scarborough USA+ Release 1, 2013,
P18+ (beer consumption measured among P21+)
• Top Advertisers: Nielsen Monitor Plus, Q4 2012 – Q3
2013, National TV.
• Top 5 Local Fan Bases: Scarborough local Release 1,
2013, P18+
NBA• Timeline:
• TV Viewers: Nielsen Galaxy Explorer, Feb –
December 2013, P2+ and Live+SD
• Social: Nielsen SocialGuide, Feb – June 2013.*
Tweets were added up across all events in the
Western Conference Finals, Eastern Conference
Finals and NBA Finals.
• 5 of Top 10 Most-Tweeted Sports Programs are NBA
Games: Nielsen SocialGuide, Jan – Nov 2013. Ranked
on number of Tweets
• Season-over-Season Viewership:
• Regular Season: Nielsen Galaxy Explorer, Dec
2011 –Apr 2012, Oct 2012 -Apr 2013, P2+ and
Live+SD *Networks included: ESPN, TNT,
ESPN2, NBA & ABC.
• NBA Finals: Nielsen Galaxy Explorer, June
2012, June 2013, P2+ and Live+SD *Networks
included: ABC.
• Demo Profile: Nielsen National TV Toolbox, Oct-
Apr 2013, Live+SD *Networks included: ABC, ESPN,
ESPN2, NBA-TV
• Fan Insights: Scarborough USA+ Release 1, 2013,
P18+
• Top Advertisers: Nielsen Monitor Plus, Q4 2012 – Q3
2013, National TV.
• Top 5 Local Fan Bases: Scarborough local Release 1,
2013, P18+
MLB• Timeline:
• TV Viewers: Nielsen Galaxy Explorer, Apr – Oct
2013, P2+ and Live+SD
• Tweets: Nielsen SocialGuide, Apr – Oct 2013. *
Tweets were added up across all events in the
NLCS Playoffs, ALCS Playoffs and World Series.
• 2013 World Series Hits a Home Run with Radio
Listeners: Nielsen Audio, PPM Custom Sports Study

28 2013 YEAR IN SPORTS
• Season-over-Season Viewership:
• MLB Regular Season: Nielsen Galaxy Explorer,
Apr – Oct 2012, Apr – Sep 2013, P2+ and
Live+SD *Networks included: FOX, ESPN
,ESPN2, TBS & MLBN
• World Series: Nielsen Galaxy Explorer, Oct
2012, Oct 2013, P2+ and Live+SD *Networks
included: FOX
• Demo Profile: Nielsen National TV Toolbox, Live+SD,
Apr – Sep 2013 *Networks included: FOX, ESPN,
ESPN2, MLBN & TBS
• Fan Insights: Scarborough USA+ Release 1, 2013,
P18+
• Top Advertisers: Nielsen Monitor Plus, Q4 2012 – Q3
2013, National TV.
• Top 5 Local Fan Bases: Scarborough local Release 1,
2013, P18+
NHL• Timeline:
• TV Viewers: Nielsen Galaxy Explorer, June 1-24
2013 & Jan 1 2014, P2+ and Live+SD
• Tweets: Nielsen SocialGuide, Jun 2013 – Jan
2014. * Tweets were added up across all events
in the Western Conference Finals, Eastern
Conference Finals and Stanley Cup Finals.
• Stanley Cup Finals By the Numbers: National
TV Toolbox, Live+SD, June 2012 and June 2013,
Household Demo, Networks included: NBC and NBC
Sports Network and CNBC
• Season-over-Season TV Viewership:
• NHL Regular Season: Nielsen Galaxy Explorer,
Oct – Apr 2012, Jan – Apr 2013 P2+ and
Live+SD. * Networks included: NBC & NBCSN
• Stanley Cup Finals: Nielsen Galaxy Explorer,
May - Jun 2012, June 2013 P2+ and Live+SD. *
Networks included: NBC & NBCSN
• Demo Profile: Nielsen National TV Toolbox, Live+SD,
Jan – April 2013 *Networks included: NBC and
NBCSN.
• Fan Insights: Scarborough USA+ Release 1, 2013,
P18+
• Top Advertisers: Nielsen Monitor Plus, Q4 2012 – Q3
2013, National TV
• Top 5 Local Fan Bases: Scarborough local Release 1,
2013, P18+
Motor Sports• Timeline:
• TV Viewers: Nielsen Galaxy Explorer, Feb – Oct
2013, P2+ and Live+SD
• Tweets: Nielsen SocialGuide, Feb – Mar 2013.
• Top Advertisers: Nielsen Monitor Plus, Q4 2012 –
Q3 2013, National TV *Excluding league association
spend
• Season-over-Season TV Viewership:
• NASCAR Sprint Cup Series: Nielsen Galaxy
Explorer, Feb – Nov 2013, Feb – Nov 2012, P2+
and Live+SD. *Networks included: ABC, FOX,
ESPN & TNT.
• Demo Profile: Nielsen National TV Toolbox, Live+SD,
Feb – Nov 2013. *Networks included: ABC, ESPN,
TNT, FOX, ESPN2.
• Fan Insights: Scarborough USA+ Release 1, 2013,
P18+
• Top 5 Most Tweeted Drivers @ Daytona 500: Nielsen
SocialGuide - Conversation, 2/24/2013, FOX.
Golf• Timeline:
• TV Viewers: Nielsen Galaxy Explorer, Apr-Oct
2013, P2+ and Live+SD
• Tweets: Nielsen SocialGuide, Apr – Oct 2013
• Avid PGA Fans Skew Older, Richer & Tech Savvy:
Nielsen FANTrender, P16+, Dec 2012 –Nov2013
• Demo Profile: Nielsen National TV Toolbox, Live+SD,
Jan-Sep 2013 *Networks included: CBS, NBC.
• Fan Insights: Scarborough USA+ Release 1, 2013,
P18+
• Top Advertisers: Nielsen Monitor Plus, Q4 2012 – Q3
2013, National TV. *Excluding league association
spend
• Top 5 Most Tweeted Golfers @ Augusta: Nielsen
SocialGuide – Conversation, 4/14/2013, CBS.

292013 YEAR IN SPORTS Copyright © 2013 The Nielsen Company
Soccer• Timeline:
• TV Viewers: Nielsen Galaxy Explorer, Jan –
Dec 2013, P2+ and Live+SD
• Tweets: Nielsen SocialGuide, Mar – Jul 2013
• MLS: Most Likely Smartphone User: Nielsen Mobile
Insights survey, Q3 2013, P18+
• Season-over-Season TV Viewership:
• MLS Playoffs (with cup): Nielsen Galaxy
Explorer, Oct -Dec 2012, Oct -Dec 2013,P2+
and Live+SD *Networks included: ESPN,
ESPN2 NBCSN, NBC & UMA
• Fan Insights: Scarborough USA+ Release 1, 2013,
P18+
• Top Advertisers: Nielsen Monitor Plus, Q4 2012 –
Q3 2013, National TV
• Demo Profile: National TV Toolbox, Mar-Oct 2013,
Live+SD *Networks included: ESPN, ESPN2, NBC,
NBCSN & UMA
• Top 5 Local Fan Bases: Scarborough local Release 1,
2013, P18+
NCAA Basketball:• Timeline:
• TV Viewers: Nielsen Galaxy Explorer, Mar –
Apr 2013, P2+ and Live+SD
• Tweets: Nielsen SocialGuide, March – April
2013. * Tweets were added up across all
events in the Elite8 and Final4
• A Closer Look at the Conferences: Nielsen Galaxy
Explorer, Nov 2012 – Mar 2013, P2+ and Live+SD.
*Nationally broadcast games only - Regional games
not included. *Networks included: ESPN2, ESPN &
CBS
• Season-over-Season TV Viewership:
• Regular Season: Nielsen Galaxy Explorer, Nov
2012 – Mar 2013, Nov 2011 – Mar 2012, P2+
and Live+SD. *Networks included: ESPN2,
ESPN & CBS
• NCAAB Championship: Nielsen Galaxy
Explorer, Apr 2013, Apr 2012, P2+ and
Live+SD. *Networks included: CBS
• Demo Profile: Nielsen National TV Toolbox, March
2013 – April 2013, Networks: CBS, TRU, TBS, TNT
• Fan Insights: Nielsen @Plan, Release Q3 2013, P18+
• Top Advertisers: Nielsen Monitor Plus, Q4 2012 – Q3
2013, National TV. *Excluding league association
spend
• Top 5 Local Fan Bases: Scarborough local Release 1,
2013, P18+
NCAA Football:
• Timeline:
• TV Ratings: Nielsen Galaxy Explorer, Dec 2013 -
Jan 2014, P2+ and Live+SD
• Tweets: Nielsen SocialGuide, Jan 2014
• Conference Breakdown: Nielsen Galaxy Explorer,
Aug– Dec 2013 , P2+ and Live+SD *Nationally
broadcast games only. Regional games not included.
*Networks included: ABC, CBS, ESPN, FOX, NBC,
ESPN2, ENN, NBCSN & ESPNU.
• Season-over-Season TV Viewership:
• Regular Season: Nielsen Galaxy Explorer, Aug
– Dec 2013, Sep – Dec 2012, P2+ and Live+SD.
*Networks included: ABC, CBS, ESPN, FOX,
NBC, ESPN2, ENN & NBCSN
• BCS Championship: Nielsen Galaxy Explorer,
Jan 2014, Jan 2013, P2+ and Live+SD.
*Networks included: ESPN
• Demo Profile: Nielsen National TV Toolbox,
December 2013 – January 2014, Networks: ABC, FOX,
CBS, ESPN, ESPN2, ESPNU
• Fan Insights: Scarborough USA+ Release 1, 2013,
P18+
• Top Advertisers: Nielsen Monitor Plus, Q4 2012 – Q3
2013, National TV
• Top 5 Local Fan Bases: Scarborough local Release 1,
2013, P18+

30 2013 YEAR IN SPORTS
International:
Source: Yearly Sports Key Facts 2013/2013 - Eurodata
TV Worldwide/Relevant Partners
Period: September 2012 - August 2013
Eurodata TV Worldwide / AGF - GfK
Fernsehforschung (Germany) /Auditel (Italy) /
BARB (UK) / CIM (Belgium) / Gallup
TV Meter (Denmark) / Ibope Media Information
(Argentina, Brazil) / Kantar Media (Spain) /
Mediamätning I Skandinavian AB (Sweden) /
Médiamétrie (France) / Nielsen Television Audience
Measurement (Indonesia, Korea, Malaysia) / TNS
Gallup (Norway, Russia) / SAARF (South Africa) /
Video Research Ltd (Japan)
For more information contact:Yassine-Guillaume BerhounSport ManagerMediaMetrie/Eurodata TV WorldwideEmail: [email protected]
Other Marquee Events:• Timeline:
• TV Ratings: Nielsen Galaxy Explorer, Jan – Sep
2013, P2+ and Live+SD
• Social: Nielsen SocialGuide, May – Sep 2013
Miscellaneous:Nielsen SocialGuide Activity metrics (Unique Authors
and Tweets) are a measure of relevant Twitter activity
from three hours before, during and three hours after
a TV event’s broadcast, local time. Reach metrics
(Unique Audience and Impressions) measure the
audience of relevant Tweets ascribed to an episode
from when the Tweets are sent until the end of the
broadcast day at 5am.
GET CLOSER TO THE FANS:
www.nielsenwire.com
FOR MORE INFORMATION CONTACT: Stephen MasterSenior Vice President – [email protected](646) 654-4577

312013 YEAR IN SPORTS Copyright © 2013 The Nielsen Company
ABOUT NIELSEN Nielsen Holdings N.V. (NYSE: NLSN) is a global information and
measurement company with leading market positions in marketing
and consumer information, television and other media measurement,
online intelligence, mobile measurement. Nielsen has a presence in
approximately 100 countries, with headquarters in New York, USA and
Diemen, the Netherlands.
For more information, visit www.nielsen.com.
Copyright © 2014 The Nielsen Company. All rights reserved. Nielsen and
the Nielsen logo are trademarks or registered trademarks of CZT/ACN
Trademarks, L.L.C. Other product and service names are trademarks or
registered trademarks of their respective companies. 14/7134

32 2013 YEAR IN SPORTS