yeast protocols volume 313 || chromatin immunoprecipitation to study protein–dna interactions in...
TRANSCRIPT
Chromatin Immunoprecipitation 225
225
From: Methods in Molecular Biology, vol. 313: Yeast Protocols: Second EditionEdited by: W. Xiao © Humana Press Inc., Totowa, NJ
20
Chromatin Immunoprecipitation to Study Protein DNAInteractions in Budding Yeast
Elena Ezhkova and William P. Tansey
SummaryThe accurate replication and expression of genetic information is ultimately gov-
erned by the interaction of regulatory proteins with specific sites on chromosomes. Inrecent years, our understanding of how these interactions occur in vivo has advancedconsiderably, in large part owing to the widespread application of chromatin immuno-precipitation (ChIP), a technique that allows quantification of protein–DNA interactionswithin the context of native chromatin. The ChIP assay involves three main steps: (1)chemical crosslinking of protein–DNA complexes in intact cells; (2) recovery of spe-cific proteins by immunoprecipitation; and (3) detection of co-precipitating DNAsequences, usually by the polymerase chain reaction (PCR). Here, we provide a detaileddescription of a ChIP procedure that is commonly used to detect protein–DNA interac-tions in the yeast Saccharomyces cerevisiae, and discuss various methods for quantify-ing co-precipitating DNAs. This protocol and discussion should be particularly useful tothose researchers interested in establishing ChIP assays in their laboratories.
Key Words: Chromatin; immunoprecipitation; ChIP; transcription factor;crosslinking; protein–DNA interaction; yeast.
1. IntroductionThe chromatin (ChIP) assay provides a unique opportunity to determine
whether a specific protein interacts with a particular piece of chromatin in vivo.Although the basic approach of using crosslinking agents to study protein–protein and protein–DNA interactions was reported as early as the 1960s (1,2),the present incarnation of the ChIP assay is a relatively recent advance, datingback to the early 1990s (3). Within the last 10 yr, there has been a tremendousincrease in the number of researchers using this technique. This is especiallytrue for those studying yeasts as a model organism, where powerful genetics,
226 Ezhkova and Tansey
combined with fully sequenced genomes, permit the analysis of virtually anyprotein–DNA interaction of interest. To date, an impression collection of pro-teins have been analyzed by ChIP, including RNA polymerases (4), histones(5,6), histone-modifying enzymes (5,7), transcription factors (8), silencing pro-teins (9), replication factors (10,11), and subunits of the proteasome (6,12).Collectively, these studies have played an instrumental role in unravelingmechanisms of transcription, chromatin modification, gene silencing, initia-tion of DNA replication, and cell-cycle control.
1.1. Chromatin Immunoprecipitation Overview
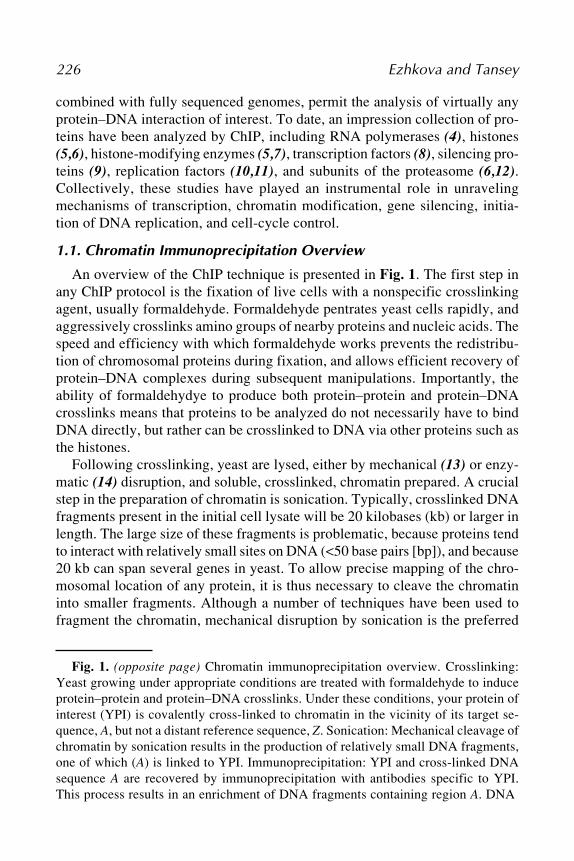
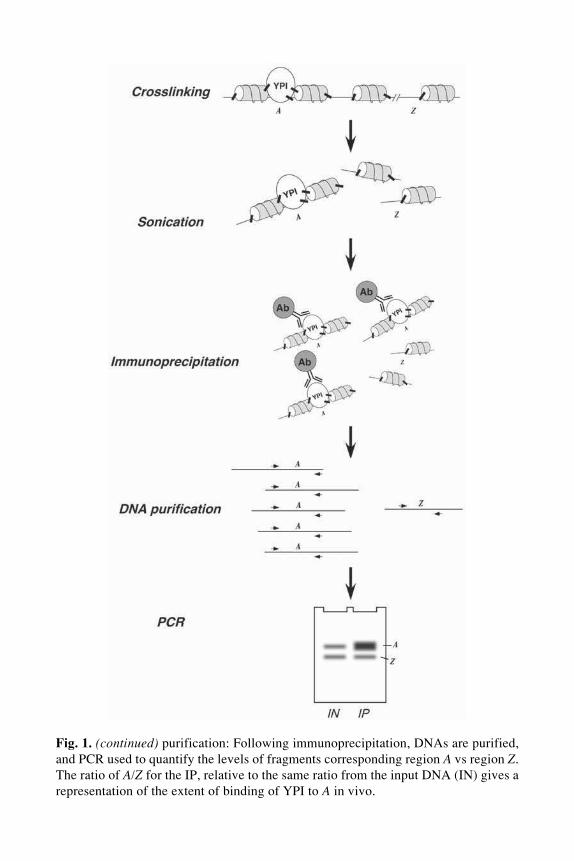
An overview of the ChIP technique is presented in Fig. 1. The first step inany ChIP protocol is the fixation of live cells with a nonspecific crosslinkingagent, usually formaldehyde. Formaldehyde pentrates yeast cells rapidly, andaggressively crosslinks amino groups of nearby proteins and nucleic acids. Thespeed and efficiency with which formaldehyde works prevents the redistribu-tion of chromosomal proteins during fixation, and allows efficient recovery ofprotein–DNA complexes during subsequent manipulations. Importantly, theability of formaldehydye to produce both protein–protein and protein–DNAcrosslinks means that proteins to be analyzed do not necessarily have to bindDNA directly, but rather can be crosslinked to DNA via other proteins such asthe histones.
Following crosslinking, yeast are lysed, either by mechanical (13) or enzy-matic (14) disruption, and soluble, crosslinked, chromatin prepared. A crucialstep in the preparation of chromatin is sonication. Typically, crosslinked DNAfragments present in the initial cell lysate will be 20 kilobases (kb) or larger inlength. The large size of these fragments is problematic, because proteins tendto interact with relatively small sites on DNA (<50 base pairs [bp]), and because20 kb can span several genes in yeast. To allow precise mapping of the chro-mosomal location of any protein, it is thus necessary to cleave the chromatininto smaller fragments. Although a number of techniques have been used tofragment the chromatin, mechanical disruption by sonication is the preferred
Fig. 1. (opposite page) Chromatin immunoprecipitation overview. Crosslinking:Yeast growing under appropriate conditions are treated with formaldehyde to induceprotein–protein and protein–DNA crosslinks. Under these conditions, your protein ofinterest (YPI) is covalently cross-linked to chromatin in the vicinity of its target se-quence, A, but not a distant reference sequence, Z. Sonication: Mechanical cleavage ofchromatin by sonication results in the production of relatively small DNA fragments,one of which (A) is linked to YPI. Immunoprecipitation: YPI and cross-linked DNAsequence A are recovered by immunoprecipitation with antibodies specific to YPI.This process results in an enrichment of DNA fragments containing region A. DNA
Chromatin Immunoprecipitation 227
Fig. 1. (continued) purification: Following immunoprecipitation, DNAs are purified,and PCR used to quantify the levels of fragments corresponding region A vs region Z.The ratio of A/Z for the IP, relative to the same ratio from the input DNA (IN) gives arepresentation of the extent of binding of YPI to A in vivo.
228 Ezhkova and Tansey
method, because it can efficiently shear large DNA molecules into randomfragments of approx 500 bp. Determining the efficiency of sonication is one ofthe most important parameters to establish before beginning a ChIP assay.
Finally, crosslinked protein–DNA complexes are recovered by immunopre-cipitation with an antibody directed against the protein of interest. One of theparticular advantages of studying yeast is that homologous recombination canbe used to epitope tag a particular protein expressed from its own chromo-somal locus. The development of rapid epitope-tagging techniques (15) hasbeen important to the widespread use of ChIP because: (1) it allows analysis ofproteins for which antibodies are not available; (2) it allows a diverse set ofproteins to be assayed easily, by tagging with a set of standardized epitopes;and (3) it allows the specificity of the ChIP reaction to be quantified, by com-parison of signal strength in immunoprecipitation reactions performed intagged vs untagged yeast strains.
1.2. Analysis of Co-Precipitating DNAs
After recovery of specific protein–DNA complexes, crosslinks are reversedby heat treatment, and co-precipitating DNAs recovered by phenol-chloroformextraction and ethanol precipitation. A variety of techniques have been used todetect specific DNA fragments in the precipitated material, including Southernhybridization and dot blotting. Typically, however, the amount of specific DNArecovered in a ChIP is small, and polymerase chain reaction (PCR)-based tech-niques in which precipitated DNAs are used as template for amplificationwith specific sets of primers are most commonly used to analyze ChIP DNA.
Here, we detail two PCR-based methods for quantifying precipitated DNAs:standard PCR and real-time, quantitative, PCR (Q-PCR). In both methods, it isessential that amplification reactions are quantitative; that is, that the amountof amplified material is directly proportional to the amount of input DNA. It isalso important that reference DNA sequences, not expected to bind the proteinof interest, are amplified as part of the analysis, to assess the level of nonspe-cific (“background”) binding to chromatin. Use of standard PCR has theadvantage of employing common lab equipment and reagents, such as a basicthermocycler and thermostable polymerase. With this approach, however, anextensive series of controls are needed to ensure that the PCR amplification isquantitative, and radioactivity is often required for precise quantification ofamplified products. Frequently, ChIP DNAs must be analyzed under severaldifferent amplification conditions to insure a quantitative PCR reaction. Real-time PCR, in contrast, requires a significant investment in equipment i.e.,purchase of a thermocycler capable of detecting incorporation of a fluorescentdye during the amplification reaction but offers the advantage of being ableto precisely quantify levels of DNA during the exponential phase of the
Chromatin Immunoprecipitation 229
amplification reaction. For many, the added expense of Q-PCR is justified bythe ability to consistently and accurately measure co-precipitating DNAs in asingle PCR reaction.
2. Materials2.1. Solutions
1. DOC Buffer: 10 mM Tris-HCl, pH 8.0, 0.25 M lithium chloride, 0.5% Nonidet-P40 (NP-40), 0.5% sodium deoxycholate (DOC), 1 mM ethylenediamine-tetraacetic acid (EDTA, pH 8.0). Sterilize through 0.45-μm filter. Store at roomtemperature.
2. 2.5 M Glycine. Adjust to pH 8.0 with 10 N sodium hydroxide to dissolve. Steril-ize through 0.45-μm filter. Store at room temperature.
3. Lysis Buffer: 50 mM HEPES, pH 7.5, 500 mM sodium chloride, 1 mM EDTA,pH 8.0, 1% Triton X-100, 0.1% DOC, 0.1% sodium dodecyl sulfate (SDS). Ster-ilize through 0.45-μm filter. Store at 4°C. Immediately before use, add proteinaseinhibitors: 0.4 mg/mL Pefablock (Roche), 10 μg/mL Leupeptin, 10 μg/mLPepstatin, 5 μg/mL Aprotinin.
4. Phosphate-buffered saline (PBS): 137 mM sodium chloride, 2.7 mM potassiumchloride, 10 mM disodium hydrogen phosphate, 2 mM potassium dihydrogenphosphate. Adjust to pH 7.4 with 10 M hydrochloric acid. Sterilize through 0.45-μm filter. Store at 4°C.
5. Proteinase K: 10 mg/mL proteinase K, dissolved in sterile water. Store in aliquotsat –20°C.
6. 3.0 M Sodium acetate. pH 4.8. Autoclave. Store at room temperature.7. TE: 10 mM Tris-HCl, pH 8.0, 1 mM EDTA, pH 8.0. Autoclave. Store at room
temperature.8. TES: 50 mM Tris-HCl, pH 8.0, 10 mM EDTA, pH 8.0, 1% SDS. Sterilize through
0.45-μm filter. Store at room temperature.
2.2. Reagents
1. Complete Proteinase Inhibitor Cocktail, 20 tablets (Roche, Indianapolis, IN; cat.no. 1 697 498).
2. 37% Formaldehyde Solution (Fisher Scientific, Pittsburgh, PA; cat. no. BP531-500).3. Protein A agarose (Roche; cat. no. 1 134 515).4. Protein G agarose (Roche; cat. no. 1 243 233).5. SYBR Green PCR Master Mix (Applied Biosystems, Foster City, CA; cat. no.
4309155).6. Anti-HA, mouse (12CA5) (Roche; cat. no. 1583816).7. Anti-Myc (9E10), mouse (Upstate Biotechnology, Charlottesville, VA; cat. no.
05-419).8. IgG agarose, rabbit (Sigma, St. Louis, MO; cat. no. A2909).9. Anti-Flag (M2), mouse (Sigma; cat. no. F3165).

230 Ezhkova and Tansey
2.3. Supplies
1. Acid-washed glass beads, 425-600 μ (Sigma; cat. no. G-8772). Store inrefrigerator.
2. Mini Bead Beater (BioSpec Products, Bartlesville, OK; cat. no. 693).3. 96-well optical plate (Applied Biosystems; cat. no. N801-0560).4. Optical caps (Applied Biosystems; cat. no. 4323032).5. Safe-lock tubes, 1.5 mL (Eppendorf, Westbury, NY; cat. no. 22 36 320-4).6. Siliconized, flat-cap tubes, 1.5 mL (Fisherbrand; cat. no. 02-681-320, Fisher
Scientific).7. Siliconized 2-mL screw-cap tubes, O-ring seal (Fisherbrand; cat. no. 05 669 9).8. 0.5-mL Theromo-tube for PCR (distributed by Marsh, Rochester, NY; cat. no.
AB-0489).9. Ultrasonic processor (Sonics and Materials, Inc., Newtown, CT; cat. no. VC 130
PB) equipped with stepped microtip (Sonics; cat. no. 630-0422).10. DNA Engine Opticon Continuous Fluorescent Detection System (MJ Research,
Waltham, MA; cat. no. CFD-3200).
3. MethodsMany excellent ChIP protocols have been published, both in the literature
and on the internet. Despite the wealth of protocols available, however, estab-lishing a successful ChIP assay can be a daunting task. We have therefore writ-ten this chapter specifically for those interested in performing ChIP for the firsttime. ChIP is a relatively protracted procedure; there are several stages at whichproblems can be encountered, and there are a few operations that need to beoptimized to ensure a successful outcome. Here we begin with a discussion ofparameters that need to be optimized before proceeding with the ChIP assay;these important parameters include sonication conditions, choice of antibodiesand epitope tags, and selection of appropriate controls. We then present a ChIPprotocol that is routinely used in our laboratory to study interaction of tran-scriptional regulators with chromatin (e.g., ref. 8). This protocol should be agood starting point for most ChIP assays. Finally, we describe two alternateprocedures for analyzing co-precipitated DNAs: by standard PCR or Q-PCR.Together, these descriptions should provide first-time ChIP users with enoughinformation to get started.
3.1. How to Start
Owing to the complexity and protracted nature of the ChIP protocol, it isdesirable that certain parameters, crucial to the success of the procedure, beoptimized prior to using a ChIP assay in any experiment. Here we discuss thefour most critical parameters: immunoprecipitation, sonication, control design,and PCR analysis.
Chromatin Immunoprecipitation 231
3.1.1. Immunoprecipitation
The success of any ChIP assay ultimately depends on the specificity andreactivity of antibodies used to capture the protein of interest. Two generaltypes of approaches can be used: (1) tagging of endogenous genes with epitopetags, and (2) use of antibodies against native proteins. The advent of rapidgene-tagging techniques for yeast (15) has greatly accelerated the use of ChIPanalyses, because, theoretically, any protein can be studied without the time orexpense required to raise antibodies against native proteins. Moreover, a stan-dard set of tags and matching antibodies can be developed, such that, onceoptimized, numerous proteins can be assayed quickly by tagging with a reli-able and robust epitope tag. Typical tags include 3×HA, which is recognizedby antibody 12CA5 (Roche; cat. no. 1583816); 3×Myc, which is recognized byantibody 9E10 (Upstate Biotechnology; cat. no. 05-419); TAP, which bindsdirectly to IgG agarose beads (Sigma; cat. no. A2909); and Flag, which is rec-ognized by antibody M2 (Sigma; cat. no. F3165). We, however, do not use theFlag epitope tag in our experiments, because of considerable cross-reactivitywith some (as yet unknown) chromatin-associated protein (unpublished obser-vations). It is also important to determine the amount of antibody to use forimmunoprecipitation. We recommend trying different amounts of antibody ina pilot ChIP experiment. The major downside of using epitope tags is that tag-ging a protein, even one expressed from its endogenous locus, can alter itsfunction. The histone methyltransferase Set1, for example, is inactivated bycarboxyl-terminal tagging (16), which is the most common position for tag-ging genes in yeast. Thus, when employing tagging methods, it is important tomake sure that the presence of the epitope tag does not substantially interferewith the functional characteristics of the protein.
Antibodies raised against specific protein antigens can offer selectivity andhigh signal strength, but usually require affinity purification prior to use (mostanimal hosts have endogenous antibodies against yeast proteins that will yieldhigh background signals). The best strategy, if possible, is to use polyclonalantibodies (PAbs) that have been raised against recombinant proteins. Althoughmonoclonal and anti-peptide polyclonal antibodies can work well, relying on asingle epitope to precipitate a protein in this kind of assay can be troublesome,because accessibility of the epitope within a crosslinked chromatin complexcan be limited. As a general rule, PAbs (or mixtures of monoclonals) offer thebest probability of finding an epitope on the target protein.
3.1.2. Sonication
One of the great advantages of ChIP is the ability to relate a chromatin-associated protein to a specific site on the DNA in vivo. Because PCR-baseddetection methods only ask if a specific piece of DNA is present in the IP
232 Ezhkova and Tansey
they do not give information about the size of the fragment that contained thatpiece of DNA the resolution of ChIP is ultimately determined by the size ofthe DNA fragments being co-precipitated. If the fragments are too large, thenthe signal generated by amplification of a specific DNA segment could actu-ally come from binding of the protein to a site several kb away! It is thus essen-tial that sonication the process used to mechanically shear the DNA beoptimized to generate fragments of the appropriate size: 0.5–1.0 kb for stan-dard PCR, 0.1–0.5 kb for Q-PCR.
Exact sonication conditions will depend on the instrument and the tip beingused. We recommend that a series of different sonication conditions be tested,beginning by simply altering the number of rounds of sonication the samplesreceive. Note that it is important that sonication conditions be optimized forcrosslinked samples under ChIP conditions, and that crosslinks be reversedprior to analysis of DNA size. Optimization steps are:
1. Follow steps in Subheadings 3.2.–3.4. of the ChIP protocol for one 50-mL culture.2. Prior to sonication, transfer 50 μL of lysate to a microfuge tube labeled “0,” and
place aside. This is the “unsonicated” control.3. Subject the remaining sample to a single 10-s pulse of sonication as described in
Subheading 3.5. Transfer 50 μL of lysate to a microfuge tube labeled “1,” andplace aside.
4. Subject the remaining sample to a single 10-s pulse of sonication as described.Transfer 50 μL of lysate to a microfuge tube labeled “2,” and place aside.
5. Continue this process until <50 μL of lysate remains.6. Add 150 μL of TES to each sample. Reverse crosslinks, purify, and precipitate
DNA as described in Subheading 3.8., steps 4–13.7. Analyze 50 μL of each DNA sample by agarose gel electrophoresis and ethidium
bromide (EtBr) staining. The DNA will run as a smear, the average size of whichwill decrease with increased sonication conditions.
3.1.3. Control Design
Before beginning any ChIP experiment, one should think carefully aboutappropriate controls. When starting ChIP for the first time, a positive control isa useful way to determine whether the ChIP procedure is working. We recom-mend using a commercially available antibody against RNA polymerase II(8WG16: Covance Research Products) that consistently performs well in ChIP,and should yield a strong signal with any transcriptionally active mRNA-en-coding gene. Given the real problems that can be encountered with antibodycross-reactivity (both specific and nonspecific), it is also important to includean appropriate series of negative controls. If antibodies were generated “in-house,” it is usually possible to obtain pre-immune serum. If this option is notavailable, negative controls can include using either no antibody in the immu-

Chromatin Immunoprecipitation 233
noprecipitation, or using an antibody from an unrelated protein that is notexpected to bind to chromatin. Of course, if epitope-tags are being used, thebest, and essential, negative control is to perform ChIP assays, under identicalconditions, with a congenic strain that lacks the epitope tag. In this way, issuesof antibody cross-reactivity are normalized between samples, and ChIP signalcan be directly attributed to the epitope-tagged protein. Finally, it is crucial toinclude appropriate controls for analysis of co-precipitated DNAs. Even ifantibodies are highly specific, inappropriate DNA molecules may be broughtdown in the ChIP assay owing to nonspecific binding to antibodies, beads, orthe plastic of the tubes. To control for nonspecific DNA recovery, we includein our PCR analyses a set of primers designed to amplify a control (or refer-ence) DNA fragment at which the protein of interest is not expected to bind. Inanalysis of transcriptional activation, for example, researchers often use anontranscribed (or even silenced) region of the genome as a reference point towhich all experimental ChIP signals are normalized.
3.1.4. PCR Analysis
For analysis of ChIP DNA by standard PCR, it is important to select primersthat amplify their target sequences efficiently, and to test amplification ongenomic DNA (usually INPUT DNA) prior to performing an experiment. Ifthe specific binding site of a protein on DNA is known, the target sequence foramplification can be centered on this site. If the binding site is not known, thenit is useful to amplify a series of target sequences, spaced 500–1000 bp apart,to empirically determine the DNA fragment that gives the most robust ChIPsignal. Optimal fragment size for amplification is around 200 bp.
A common approach, and one that economizes use of precious ChIP DNA,is to perform multiplex PCR, in which gene-specific and reference primers areamplified in the same tube. When performing multiplex PCR, the gene-spe-cific and reference primers should have similar melting temperatures, andshould amplify fragments of a slightly different size (<40 bp difference), sothat the two fragments can be distinguished by gel electrophoresis. Pilotexperiments should be performed, using INPUT DNA samples, to determinePCR conditions that will amplify both the gene-specific and reference DNAfragments with approx equal efficiency.
Finally, note that it is absolutely essential that PCR conditions be quantita-tive; in other words, that a twofold increase in the level of a target sequence inthe PCR reaction will result in a twofold increase in PCR product yield. Inpractice, it can be difficult to balance signal intensity (which increases withPCR cycle number) vs linearity (which will decrease with PCR cycle number).For each primer set, we recommend performing a fairly detailed preliminary
234 Ezhkova and Tansey
analysis on INPUT DNA, varying PCR cycle number, to establish a cycle num-ber that will give good signal strength, while at the same time accuratelyreflecting the relative amount of target sequence.
3.1.5. Quantitative PCR
Many of the considerations that apply to standard PCR choice of refer-ence vs gene-specific target “amplicons,” direct determination of the quanti-tative nature of the reaction also apply to Q-PCR. The main concern withQ-PCR is the nature of the primers themselves. Primers must be selected tominimize nonspecific products or primer-dimers. For our Q-PCR analyses,we amplify small fragments; 70–150 bp in length. The primers should notend in a G residue, three out of the last five nucleotides should be an A or a T,and the primers should not contain runs of identical nucleotide residuesgreater than 5 bp in length. Even if these recommendations are followed, it isstill important to determine the specificity of amplification prior to perform-ing an actual experiment. This can be done by performing “no DNA” PCRcontrol reactions, and by directly analyzing the products of Q-PCR reactionby agarose gel electrophoresis, to determine that a signal band of the correctsize is amplified.
Below we provide a standard ChIP protocol that is routinely used in ourlaboratory.
3.2. Cell Growth
1. Inoculate fresh 5-mL starter cultures of each yeast in appropriate media. Growovernight at the appropriate temperature (usually 30°C) (see Note 1).
2. Next day, inoculate 50 mL of appropriate selective media (in 250-mL flask) withapprox 1/200 dilution of the original starter culture. Grow at the appropriate tem-perature overnight until the optical density (OD) of the culture (at 600 nm) isapprox 0.8–1.0. (see Note 2).
3.3. Crosslinking
Prepare: Ice-cold PBS; benchtop centrifuge at 4°C; and labeled 50-mL Fal-con tubes, one for each culture.
1. Transfer flasks to rotating platform at room temperature. Rotate slowly.2. With culture slowly rotating, add 1.4 mL of 37% formaldehyde dropwise to each
culture (final concentration 1%). Continue to rotate for 15 min (see Note 3).3. Add 3 mL of 2.5 M glycine to each culture. Continue to rotate for 5 min at room
temperature.4. Transfer cell suspension to a labeled 50-mL conical tube. Spin at 800g for 5 min
at 4°C. Pour off supernatant. Wash cell pellet twice in 50 mL ice-cold PBS. Pro-ceed immediately with lysis or snap-freeze pellets in liquid nitrogen and store at–70°C.
Chromatin Immunoprecipitation 235
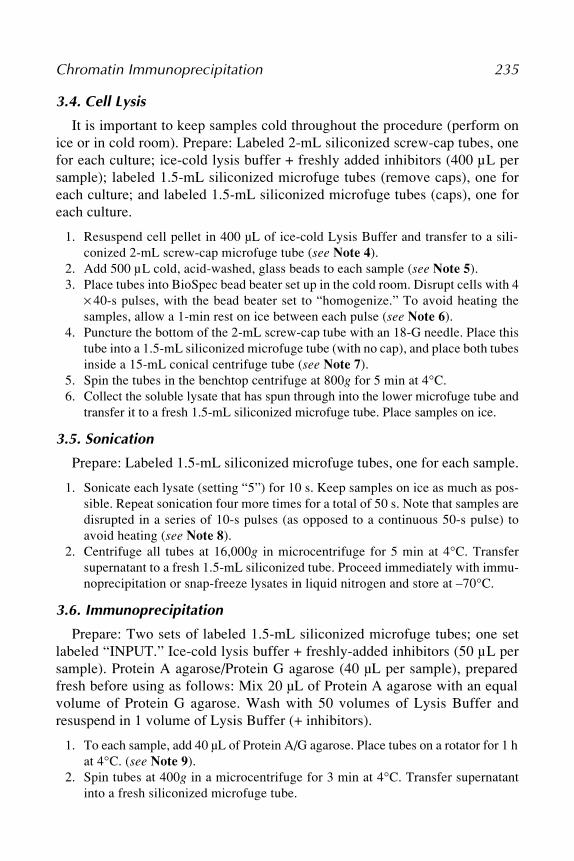
3.4. Cell Lysis
It is important to keep samples cold throughout the procedure (perform onice or in cold room). Prepare: Labeled 2-mL siliconized screw-cap tubes, onefor each culture; ice-cold lysis buffer + freshly added inhibitors (400 μL persample); labeled 1.5-mL siliconized microfuge tubes (remove caps), one foreach culture; and labeled 1.5-mL siliconized microfuge tubes (caps), one foreach culture.
1. Resuspend cell pellet in 400 μL of ice-cold Lysis Buffer and transfer to a sili-conized 2-mL screw-cap microfuge tube (see Note 4).
2. Add 500 μL cold, acid-washed, glass beads to each sample (see Note 5).3. Place tubes into BioSpec bead beater set up in the cold room. Disrupt cells with 4
× 40-s pulses, with the bead beater set to “homogenize.” To avoid heating thesamples, allow a 1-min rest on ice between each pulse (see Note 6).
4. Puncture the bottom of the 2-mL screw-cap tube with an 18-G needle. Place thistube into a 1.5-mL siliconized microfuge tube (with no cap), and place both tubesinside a 15-mL conical centrifuge tube (see Note 7).
5. Spin the tubes in the benchtop centrifuge at 800g for 5 min at 4°C.6. Collect the soluble lysate that has spun through into the lower microfuge tube and
transfer it to a fresh 1.5-mL siliconized microfuge tube. Place samples on ice.
3.5. Sonication
Prepare: Labeled 1.5-mL siliconized microfuge tubes, one for each sample.
1. Sonicate each lysate (setting “5”) for 10 s. Keep samples on ice as much as pos-sible. Repeat sonication four more times for a total of 50 s. Note that samples aredisrupted in a series of 10-s pulses (as opposed to a continuous 50-s pulse) toavoid heating (see Note 8).
2. Centrifuge all tubes at 16,000g in microcentrifuge for 5 min at 4°C. Transfersupernatant to a fresh 1.5-mL siliconized tube. Proceed immediately with immu-noprecipitation or snap-freeze lysates in liquid nitrogen and store at –70°C.
3.6. Immunoprecipitation
Prepare: Two sets of labeled 1.5-mL siliconized microfuge tubes; one setlabeled “INPUT.” Ice-cold lysis buffer + freshly-added inhibitors (50 μL persample). Protein A agarose/Protein G agarose (40 μL per sample), preparedfresh before using as follows: Mix 20 μL of Protein A agarose with an equalvolume of Protein G agarose. Wash with 50 volumes of Lysis Buffer andresuspend in 1 volume of Lysis Buffer (+ inhibitors).
1. To each sample, add 40 μL of Protein A/G agarose. Place tubes on a rotator for 1 hat 4°C. (see Note 9).
2. Spin tubes at 400g in a microcentrifuge for 3 min at 4°C. Transfer supernatantinto a fresh siliconized microfuge tube.
236 Ezhkova and Tansey
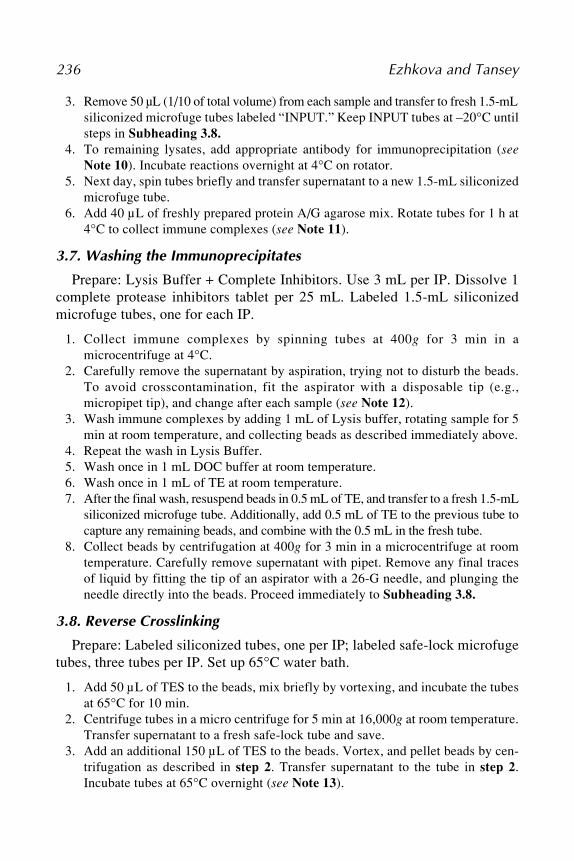
3. Remove 50 μL (1/10 of total volume) from each sample and transfer to fresh 1.5-mLsiliconized microfuge tubes labeled “INPUT.” Keep INPUT tubes at –20°C untilsteps in Subheading 3.8.
4. To remaining lysates, add appropriate antibody for immunoprecipitation (seeNote 10). Incubate reactions overnight at 4°C on rotator.
5. Next day, spin tubes briefly and transfer supernatant to a new 1.5-mL siliconizedmicrofuge tube.
6. Add 40 μL of freshly prepared protein A/G agarose mix. Rotate tubes for 1 h at4°C to collect immune complexes (see Note 11).
3.7. Washing the Immunoprecipitates
Prepare: Lysis Buffer + Complete Inhibitors. Use 3 mL per IP. Dissolve 1complete protease inhibitors tablet per 25 mL. Labeled 1.5-mL siliconizedmicrofuge tubes, one for each IP.
1. Collect immune complexes by spinning tubes at 400g for 3 min in amicrocentrifuge at 4°C.
2. Carefully remove the supernatant by aspiration, trying not to disturb the beads.To avoid crosscontamination, fit the aspirator with a disposable tip (e.g.,micropipet tip), and change after each sample (see Note 12).
3. Wash immune complexes by adding 1 mL of Lysis buffer, rotating sample for 5min at room temperature, and collecting beads as described immediately above.
4. Repeat the wash in Lysis Buffer.5. Wash once in 1 mL DOC buffer at room temperature.6. Wash once in 1 mL of TE at room temperature.7. After the final wash, resuspend beads in 0.5 mL of TE, and transfer to a fresh 1.5-mL
siliconized microfuge tube. Additionally, add 0.5 mL of TE to the previous tube tocapture any remaining beads, and combine with the 0.5 mL in the fresh tube.
8. Collect beads by centrifugation at 400g for 3 min in a microcentrifuge at roomtemperature. Carefully remove supernatant with pipet. Remove any final tracesof liquid by fitting the tip of an aspirator with a 26-G needle, and plunging theneedle directly into the beads. Proceed immediately to Subheading 3.8.
3.8. Reverse Crosslinking
Prepare: Labeled siliconized tubes, one per IP; labeled safe-lock microfugetubes, three tubes per IP. Set up 65°C water bath.
1. Add 50 μL of TES to the beads, mix briefly by vortexing, and incubate the tubesat 65°C for 10 min.
2. Centrifuge tubes in a micro centrifuge for 5 min at 16,000g at room temperature.Transfer supernatant to a fresh safe-lock tube and save.
3. Add an additional 150 μL of TES to the beads. Vortex, and pellet beads by cen-trifugation as described in step 2. Transfer supernatant to the tube in step 2.Incubate tubes at 65°C overnight (see Note 13).
Chromatin Immunoprecipitation 237
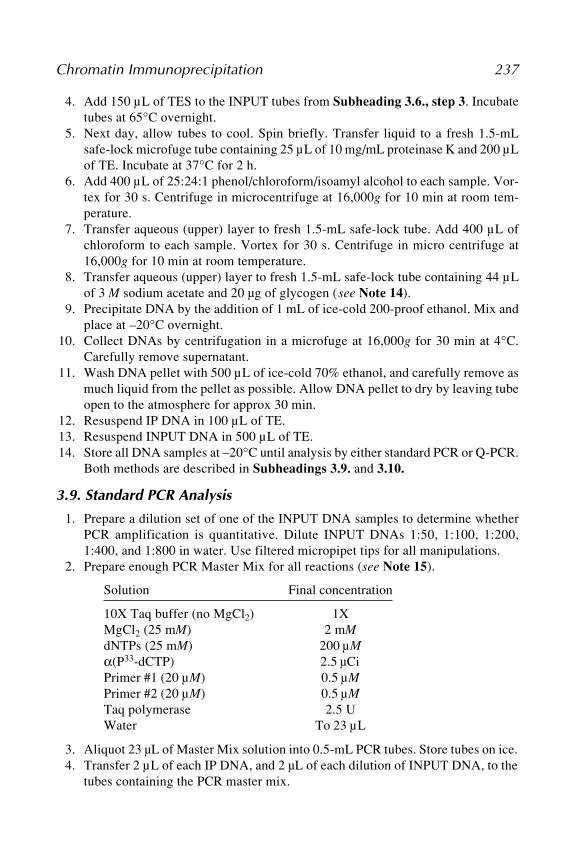
4. Add 150 μL of TES to the INPUT tubes from Subheading 3.6., step 3. Incubatetubes at 65°C overnight.
5. Next day, allow tubes to cool. Spin briefly. Transfer liquid to a fresh 1.5-mLsafe-lock microfuge tube containing 25 μL of 10 mg/mL proteinase K and 200 μLof TE. Incubate at 37°C for 2 h.
6. Add 400 μL of 25:24:1 phenol/chloroform/isoamyl alcohol to each sample. Vor-tex for 30 s. Centrifuge in microcentrifuge at 16,000g for 10 min at room tem-perature.
7. Transfer aqueous (upper) layer to fresh 1.5-mL safe-lock tube. Add 400 μL ofchloroform to each sample. Vortex for 30 s. Centrifuge in micro centrifuge at16,000g for 10 min at room temperature.
8. Transfer aqueous (upper) layer to fresh 1.5-mL safe-lock tube containing 44 μLof 3 M sodium acetate and 20 μg of glycogen (see Note 14).
9. Precipitate DNA by the addition of 1 mL of ice-cold 200-proof ethanol. Mix andplace at –20°C overnight.
10. Collect DNAs by centrifugation in a microfuge at 16,000g for 30 min at 4°C.Carefully remove supernatant.
11. Wash DNA pellet with 500 μL of ice-cold 70% ethanol, and carefully remove asmuch liquid from the pellet as possible. Allow DNA pellet to dry by leaving tubeopen to the atmosphere for approx 30 min.
12. Resuspend IP DNA in 100 μL of TE.13. Resuspend INPUT DNA in 500 μL of TE.14. Store all DNA samples at –20°C until analysis by either standard PCR or Q-PCR.
Both methods are described in Subheadings 3.9. and 3.10.
3.9. Standard PCR Analysis
1. Prepare a dilution set of one of the INPUT DNA samples to determine whetherPCR amplification is quantitative. Dilute INPUT DNAs 1:50, 1:100, 1:200,1:400, and 1:800 in water. Use filtered micropipet tips for all manipulations.
2. Prepare enough PCR Master Mix for all reactions (see Note 15).
Solution Final concentration
10X Taq buffer (no MgCl2) 1XMgCl2 (25 mM) 2 mMdNTPs (25 mM) 200 μMα(P33-dCTP) 2.5 μCiPrimer #1 (20 μM) 0.5 μMPrimer #2 (20 μM) 0.5 μMTaq polymerase 2.5 UWater To 23 μL
3. Aliquot 23 μL of Master Mix solution into 0.5-mL PCR tubes. Store tubes on ice.4. Transfer 2 μL of each IP DNA, and 2 μL of each dilution of INPUT DNA, to the
tubes containing the PCR master mix.
238 Ezhkova and Tansey
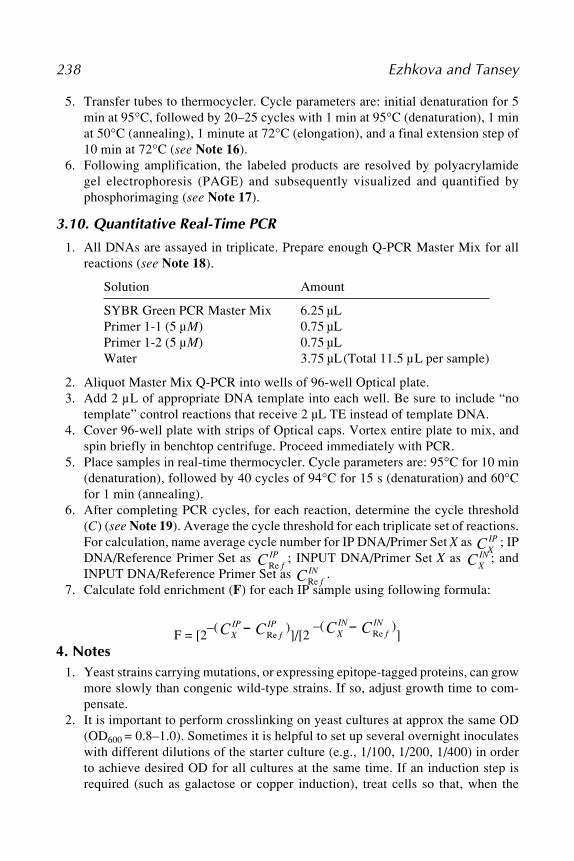
5. Transfer tubes to thermocycler. Cycle parameters are: initial denaturation for 5min at 95°C, followed by 20–25 cycles with 1 min at 95°C (denaturation), 1 minat 50°C (annealing), 1 minute at 72°C (elongation), and a final extension step of10 min at 72°C (see Note 16).
6. Following amplification, the labeled products are resolved by polyacrylamidegel electrophoresis (PAGE) and subsequently visualized and quantified byphosphorimaging (see Note 17).
3.10. Quantitative Real-Time PCR
1. All DNAs are assayed in triplicate. Prepare enough Q-PCR Master Mix for allreactions (see Note 18).
Solution Amount
SYBR Green PCR Master Mix 6.25 μLPrimer 1-1 (5 μM) 0.75 μLPrimer 1-2 (5 μM) 0.75 μLWater 3.75 μL(Total 11.5 μL per sample)
2. Aliquot Master Mix Q-PCR into wells of 96-well Optical plate.3. Add 2 μL of appropriate DNA template into each well. Be sure to include “no
template” control reactions that receive 2 μL TE instead of template DNA.4. Cover 96-well plate with strips of Optical caps. Vortex entire plate to mix, and
spin briefly in benchtop centrifuge. Proceed immediately with PCR.5. Place samples in real-time thermocycler. Cycle parameters are: 95°C for 10 min
(denaturation), followed by 40 cycles of 94°C for 15 s (denaturation) and 60°Cfor 1 min (annealing).
6. After completing PCR cycles, for each reaction, determine the cycle threshold(C) (see Note 19). Average the cycle threshold for each triplicate set of reactions.For calculation, name average cycle number for IP DNA/Primer Set X as CX
IP ; IPDNA/Reference Primer Set as C f
IPRe
; INPUT DNA/Primer Set X as CXIN ; and
INPUT DNA/Reference Primer Set as C fINRe
.7. Calculate fold enrichment (F) for each IP sample using following formula:
F = [2–( CX
IP – C fIPRe
)]/[2
–( CXIN – C f
INRe
)]
4. Notes1. Yeast strains carrying mutations, or expressing epitope-tagged proteins, can grow
more slowly than congenic wild-type strains. If so, adjust growth time to com-pensate.
2. It is important to perform crosslinking on yeast cultures at approx the same OD(OD600 = 0.8–1.0). Sometimes it is helpful to set up several overnight inoculateswith different dilutions of the starter culture (e.g., 1/100, 1/200, 1/400) in orderto achieve desired OD for all cultures at the same time. If an induction step isrequired (such as galactose or copper induction), treat cells so that, when the
Chromatin Immunoprecipitation 239
induction is complete, the yeast are at the correct density. Note that many DNA–protein interactions are transient, and that the exact point after induction at whichcrosslinking is performed may be important. If this is a concern, perform a time-course experiment to empirically determine the optimal time for crosslinking.Because yeast are dead almost immediately following exposure to formaldehyde,it is possible to perform a fairly detailed time-course using this technique.
3. Keep a separate bottle of formaldehyde for ChIP experiments. Note that formal-dehyde is toxic; use appropriate handling techniques. The time and temperatureof fixation can be altered to optimize signal strength. Less robust interactionsmay be revealed by performing the crosslinking at lower temperatures, or byincreasing the amount of time yeast are exposed to formaldehyde. We recom-mend starting with 15 min at room temperature. If this does not work, increasecrosslinking time to 60 min. If this fails, try 16°C for the fixation temperature.Note that sonication conditions are specifically linked to crosslinking conditions,and will need to be re-optimized if crosslinking conditions change.
4. The use of siliconized tubes is essential to minimize nonspecific binding of DNAand proteins to the plastic, which in turn will give high background signals.Microfuge tubes can be siliconized in the laboratory, but for consistency andconvenience we recommend purchasing them pre-treated.
5. To measure glass beads accurately, prepare a scoop by cutting a microfuge tubeat the 500 μL mark and attaching it to an 18-G needle as a handle.
6. An alternate method for preparing cell lysates involves the production of sphero-plasts (14). This technique involves more time than the one presented here, but itdoes work well.
7. This procedure is designed to separate the cell lysate quickly from the glass beadsand from the insoluble yeast material. Other methods can be used, but the par-ticular advantage of this technique is that it completely separates the lysate fromthe beads without the need to wash the beads (which would increase the volumeof the lysate).
8. As mentioned in Subheading 3.1., sonication conditions have to be optimized inadvance, and are specific for each instrument and configuration. The numberspresented here are a good starting point, but they are specific for the sonicator weuse in the laboratory (Sonics, VC 130 PB).
9. This is a pre-clearing step designed to reduce nonspecific capture of proteins bythe Protein A/G resin. Although it is not included in most ChIP protocols, wefind it valuable in reducing background signal in ChIP reactions. Note that weuse a mixture of Protein A and G resins because, individually, each has subtlespecificities for different antibody types; the combination of the two leads torobust antibody capture, regardless of antibody subtype.
10. It is important to optimize the exact amount of antibody used in each IP reactionto insure that the antigen is being quantitatively recovered. We suggest perform-ing IP reactions (under ChIP conditions) with increasing amounts of antibody,and using Western blotting to determine the amount of antibody that results innear-complete depletion of antigen from the lysate (measured at the end of Sub-

240 Ezhkova and Tansey
heading 3.6.). It is also important to optimize the time of immunoprecipitation.Overnight is convenient, but it can raise background signals. We recommendtrying different times of incubation in initial experiments to determine the bestconditions.
11. If TAP-tagged proteins are to be analyzed by ChIP, Subheading 3.6. in the ChIPprotocol will need to be modified, because TAP-tagged proteins carry the ProteinA tag, and must be recovered on rabbit IgG agarose (A-2909, Sigma). For thisreason, binding of antibody to antigen and collecting antibody/antigen complexessteps can be combined. The alternate procedure that replaces Subheading 3.6. ofthe protocol is:TAP-1: Remove 50 μL (1/10 of total volume) from each sample and transfer tofresh 1.5-mL siliconized microfuge tubes labeled “INPUT.” Keep INPUT tubesat –20°C until Subheading 3.8.TAP-2: To each sample, add 40 μL of rabbit IgG agarose, prepared by washingthree times in 400 μL of Lysis Buffer.TAP-3: Rotate tubes for 2 h at 4°C to collect immune complexes.TAP-4: Continue with standard protocol at Subheading 3.7.
12. ChIP is a technique that involves the selective elimination of most DNA se-quences from a complex mixture. Cross-contamination of samples is therefore areal concern with this assay, and can ruin many days worth of experimentation.Do not take any chances. Use fresh, plugged, microfuge tips for all additions;change tips for washing. Clean pipets and equipment frequently.
13. We recommend sealing lids of microfuge tubes with laboratory film before plac-ing them into the 65°C incubator to prevent loss of sample or contamination fromtubes inadvertently opening.
14. It is important to completely remove all proteins at this stage. If, during phenolextraction, the white interphase between the organic and aqueous phases is par-ticularly large (such that it might be difficult to remove the aqueous phase with-out transferring some of this material), simply perform a secondphenol-chloroform extraction before proceeding to the chloroform extraction.
15. The incorporation of radioactive dCTP during the PCR reaction offers superiorsensitivity to EtBr or other DNA-staining techniques. In our experience, it isdifficult to set up a quantitative PCR analysis of ChIP DNA using ethidium stain-ing, because the number of cycles needed to produce a product in sufficient quan-tity to be detected is usually too high for the amplification to be quantitative. Useof α(P33-dCTP) is convenient because it does not require extensive shielding, butbe sure to follow all institutional guideline for use of radioactive materials.
16. Remember that the listed cycling parameters are arbitrary, and will need to beoptimized for each experiment.
17. Following PCR, several calculations must be performed to determine the leveland specificity of binding of the protein of interest to a specific segment of DNA.To calculate the specific enrichment of the DNA fragment in the IP, calculate theratio of radioactivity in the target fragment relative to the reference fragment. Toadjust for inherent differences in the amplification of these two fragments, nor-
Chromatin Immunoprecipitation 241
malize this ratio to the same ratio calculated from the INPUT DNAs. The result-ing number is the fold enrichment of the target fragment. Finally, to determinewhether the signal is specific for the particular protein, normalize the fold enrich-ment of the specific IP with the same number from the control IP, performedeither using an irrelevant antibody or, when appropriate, the nonepitope-taggedyeast sample. An example of ChIP DNA analyzed by this method is presented inFig. 2.
18. We strongly recommend analyzing each sample in triplicate.19. During the exponential phase of amplification, the level of fluorescence corre-
sponds directly to the amount of target DNA sequence present in the reaction.Thus, the cycle number at which each PCR product reaches a particular exponen-tial phase (referred to as the “cycle threshold”) is a representation of the relativeabundance of each target DNA sequence. The relative amounts of target DNAscan be calculated using the following formula:
f = 2–(C1 – C2)
where f is the fold enrichment of PCR products amplified with primer set 1 com-pared to primer set 2, and C1 and C2 are the cycle thresholds for each primer set.Thus, using this formula, one can easily quantify how much more gene-specificDNA compared to reference DNA is present in ChIP immunoprecipitate:
f = 2–( CXIP – C f
IPRe
)
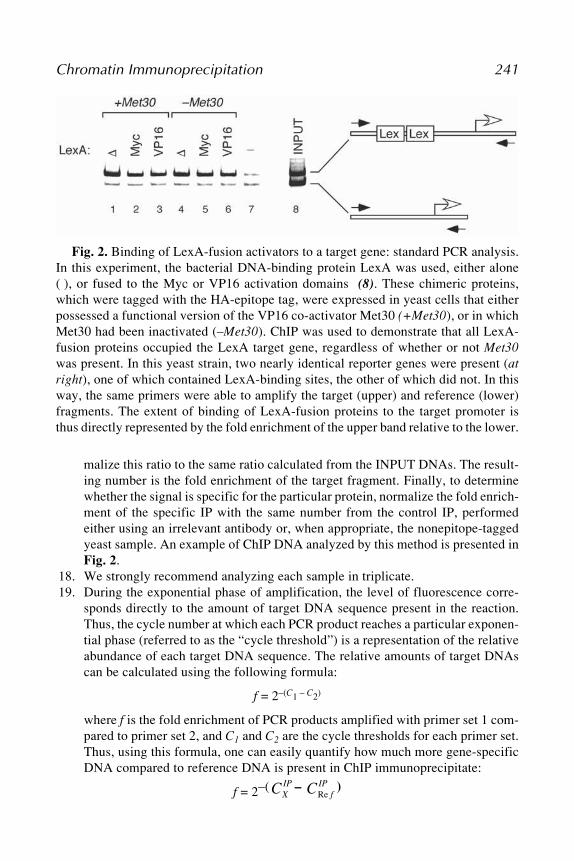
Fig. 2. Binding of LexA-fusion activators to a target gene: standard PCR analysis.In this experiment, the bacterial DNA-binding protein LexA was used, either alone( ), or fused to the Myc or VP16 activation domains (8). These chimeric proteins,which were tagged with the HA-epitope tag, were expressed in yeast cells that eitherpossessed a functional version of the VP16 co-activator Met30 (+Met30), or in whichMet30 had been inactivated (–Met30). ChIP was used to demonstrate that all LexA-fusion proteins occupied the LexA target gene, regardless of whether or not Met30was present. In this yeast strain, two nearly identical reporter genes were present (atright), one of which contained LexA-binding sites, the other of which did not. In thisway, the same primers were able to amplify the target (upper) and reference (lower)fragments. The extent of binding of LexA-fusion proteins to the target promoter isthus directly represented by the fold enrichment of the upper band relative to the lower.
242 Ezhkova and Tansey
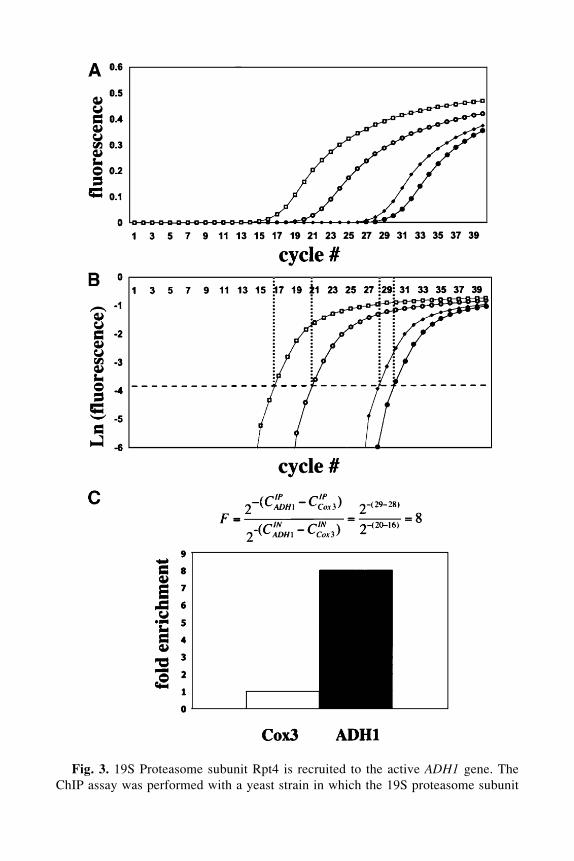
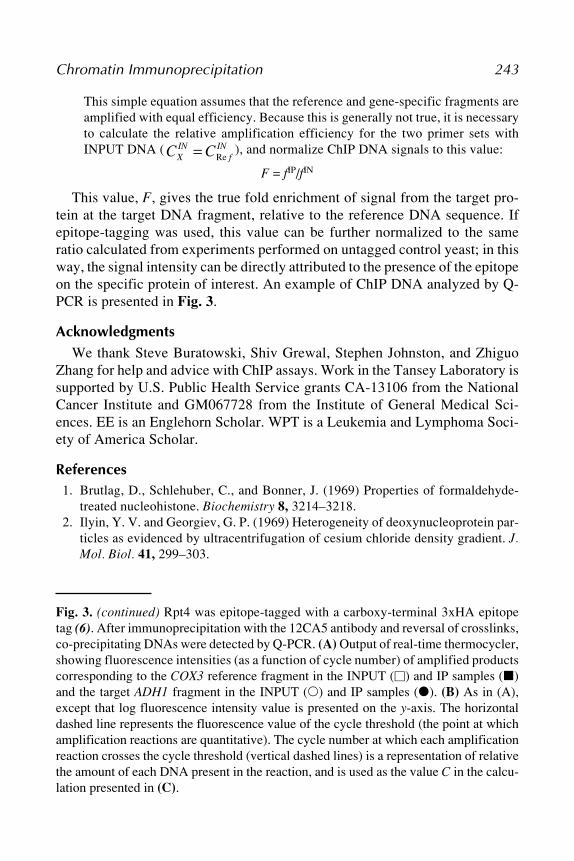
Fig. 3. 19S Proteasome subunit Rpt4 is recruited to the active ADH1 gene. TheChIP assay was performed with a yeast strain in which the 19S proteasome subunit
Chromatin Immunoprecipitation 243
This simple equation assumes that the reference and gene-specific fragments areamplified with equal efficiency. Because this is generally not true, it is necessaryto calculate the relative amplification efficiency for the two primer sets withINPUT DNA ( C CX
INf
IN= Re), and normalize ChIP DNA signals to this value:
F = fIP/fIN
This value, F, gives the true fold enrichment of signal from the target pro-tein at the target DNA fragment, relative to the reference DNA sequence. Ifepitope-tagging was used, this value can be further normalized to the sameratio calculated from experiments performed on untagged control yeast; in thisway, the signal intensity can be directly attributed to the presence of the epitopeon the specific protein of interest. An example of ChIP DNA analyzed by Q-PCR is presented in Fig. 3.
AcknowledgmentsWe thank Steve Buratowski, Shiv Grewal, Stephen Johnston, and Zhiguo
Zhang for help and advice with ChIP assays. Work in the Tansey Laboratory issupported by U.S. Public Health Service grants CA-13106 from the NationalCancer Institute and GM067728 from the Institute of General Medical Sci-ences. EE is an Englehorn Scholar. WPT is a Leukemia and Lymphoma Soci-ety of America Scholar.
References1. Brutlag, D., Schlehuber, C., and Bonner, J. (1969) Properties of formaldehyde-
treated nucleohistone. Biochemistry 8, 3214–3218.2. Ilyin, Y. V. and Georgiev, G. P. (1969) Heterogeneity of deoxynucleoprotein par-
ticles as evidenced by ultracentrifugation of cesium chloride density gradient. J.Mol. Biol. 41, 299–303.
Fig. 3. (continued) Rpt4 was epitope-tagged with a carboxy-terminal 3xHA epitopetag (6). After immunoprecipitation with the 12CA5 antibody and reversal of crosslinks,co-precipitating DNAs were detected by Q-PCR. (A) Output of real-time thermocycler,showing fluorescence intensities (as a function of cycle number) of amplified productscorresponding to the COX3 reference fragment in the INPUT (�) and IP samples (�)and the target ADH1 fragment in the INPUT (�) and IP samples (�). (B) As in (A),except that log fluorescence intensity value is presented on the y-axis. The horizontaldashed line represents the fluorescence value of the cycle threshold (the point at whichamplification reactions are quantitative). The cycle number at which each amplificationreaction crosses the cycle threshold (vertical dashed lines) is a representation of relativethe amount of each DNA present in the reaction, and is used as the value C in the calcu-lation presented in (C).
244 Ezhkova and Tansey
3. Dedon, P. C., Soults, J. A., Allis, C. D., and Gorovsky, M. A. (1991) A simplifiedformaldehyde fixation and immunoprecipitation technique for studying protein-DNA interactions. Anal. Biochem. 197, 83–90.
4. Komarnitsky, P., Cho, E. J., and Buratowski, S. (2000) Different phosphorylatedforms of RNA polymerase II and associated mRNA processing factors duringtranscription. Genes. Dev. 14, 2452–2460.
5. Ng, H. H., Robert, F., Young, R. A., and Struhl, K. (2003) Targeted recruitmentof Set1 histone methylase by elongating Pol II provides a localized mark andmemory of recent transcriptional activity. Mol. Cell 11, 709–719.
6. Ezhkova, E. and Tansey, W. P. (2004) Proteasomal ATPases link ubiquitylationof histone H2B to methylation of histone H3. Mol. Cell 13, 435–442.
7. Kurdistani, S. K., Robyr, D., Tavazoie, S., and Grunstein, M. (2002) Genome-widebinding map of the histone deacetylase Rpd3 in yeast. Nat. Genet. 31, 248–254.
8. Salghetti, S. E., Caudy, A. A., Chenoweth, J. G., and Tansey, W. P. (2001) Regu-lation of transcriptional activation domain function by ubiquitin. Science 293,1651–1653.
9. Luo, K., Vega-Palas, M. A., and Grunstein, M. (2002) Rap1-Sir4 binding inde-pendent of other Sir, yKu, or histone interactions initiates the assembly oftelomeric heterochromatin in yeast. Genes Dev. 16, 1528–1539.
10. Zhang, Z., Hayashi, M. K., Merkel, O., Stillman, B., and Xu, R. M. (2002) Struc-ture and function of the BAH-containing domain of Orc1p in epigenetic silencing.EMBO J. 21, 4600–4611.
11. Zou, L. and Stillman, B. (2000) Assembly of a complex containing Cdc45p, rep-lication protein A, and Mcm2p at replication origins controlled by S-phase cyclin-dependent kinases and Cdc7p-Dbf4p kinase. Mol. Cell. Biol. 20, 3086–3096.
12. Gonzalez, F., Delahodde, A., Kodadek, T., and Johnston, S. A. (2002) Recruit-ment of a 19S proteasome subcomplex to an activated promoter. Science 296,548–550.
13. Strahl-Bolsinger, S., Hecht, A., Luo, K., and Grunstein, M. (1997) SIR2 and SIR4interactions differ in core and extended telomeric heterochromatin in yeast. GenesDev. 11, 83–93.
14. Braunstein, M., Rose, A. B., Holmes, S. G., Allis, C. D., and Broach, J. R. (1993)Transcriptional silencing in yeast is associated with reduced nucleosome acetyla-tion. Genes Dev. 7, 592–604.
15. Knop, M., Siegers, K., Pereira, G., et al. (1999) Epitope tagging of yeast genesusing a PCR-based strategy: more tags and improved practical routines. Yeast 15,963–972.
16. Krogan, N. J., Dover, J., Khorrami, S., et al. (2002) COMPASS, a histone H3(Lysine 4) methyltransferase required for telomeric silencing of gene expression.J. Biol. Chem. 277, 10753–10755.