yield alberta 2011
DESCRIPTION
Crop insurance yields by variety and risk area, brought to you by Agriculture Financial Services Corporation and Alberta FarmerTRANSCRIPT

WW
WA
GR
ICG
OV
AB
CA
AP
P9
6L
OA
DR
PT
INP
UT
YIE
LD
AL
BE
RTA
2
01
1
A L B E R T AA L B E R T A
2011
Crop insurance yields by variety and risk area brought to you by Agriculture Financial Services Corporation and Alberta Farmer
JOB ID 2858-A
DATE FEBRUARY 24 2011
CLIENTSYNGENTA CANADA
PROJECTCRUISER MAXX ndash BENCHPRESS
PUBLICATIONYIELD MANITOBA
UCR 240
DESIGNERRAWBIE
( ) MECHANICAL ( ) PDFX
FINAL SIZE 8125 X 1075
CLIENT SERVICE
PROOFREADING
ART DIRECTION
PRODUCTION
Watch your crops grow stronger than ever before The unique Vigor Triggerreg effect of Cruiser Maxxreg Cereals goes beyond insect and disease control causing your plants to emerge faster resulting in stronger plants and a higher return on your investment Cruiser Maxx seed treatment also combines a powerful insecticide with two fungicides to protect your wheat and barley crops against early season disease and wireworm attack Itrsquos available as a pre-mix to apply on-farm
For further information please contact our Customer Resource Centre at 1-87-SYNGENTA (1-877-964-3682) or visit SyngentaFarmca
Always read and follow label directions Cruiser Maxxreg Cereals Vigor Triggerreg the Alliance Frame the Purpose Icon and the Syngenta logo are trademarks of a Syngenta Group Company copy 2011 Syngenta Crop Protection Canada Inc
3296A CruiserMaxx_BenchPress_YieldManitobaindd 1 11-01-28 413 PM
YIELD ALBERTA 2011 A PLANNING TOOL FOR ALBERTA FARMERS
2011 YIELD ALBERTA 3
Published byFarm Business Communications1666 Dublin AvenueWinnipeg MB R3H 0H1Phone 204-944-5765Fax 204-944-5562newsfbcpublishingcomwwwagcanadacom
National SalesJames ShawJSA CommunicationsPhone 416-231-1812Fax 416-233-4858jamesshawrogerscom
Cover photo by Laura RanceSupplement to the Alberta Farmer Express March 14 2011
Yield Alberta is a publication ofAgriculture Financial Services Corporation
Correspondence may be addressed toSusan CrumpSenior Project Manager Program Development and PolicyAgriculture Financial Services Corporation5718 56 Ave Lacombe AB T4L 1B1(403) 782-8279susancrumpafscca
Welcome to Yield Alberta 4
2010 ndash A year of extremes 6
Canola rotation performance in Alberta 8
Are BMPs actually beneficial 14
Risk Area Map 24
Variety Yield Tables
Alberta 25bull Risk Area 1 28bull Risk Area 2 28bull Risk Area 3 30bull Risk Area 4 31bull Risk Area 5 32
bull Risk Area 6 33bull Risk Area 7 33bull Risk Area 8 34bull Risk Area 9 35bull Risk Area 10 36bull Risk Area 11 36bull Risk Area 12 37bull Risk Area 13 38bull Risk Area 14 39bull Risk Area 15 39bull Risk Area 16 40bull Risk Area 17 40bull Risk Area 18 40bull Risk Area 19 41bull Risk Area 20 41bull Risk Area 21 42bull Risk Area 22 42
Agroclimatic Maps
Historical Grades Spring Wheat 17Historical Grades Barley 17Historical Grades Canola 17Growing Season Precipitation - April 17Growing Season Precipitation - April-May 18Growing Season Precipitation - April-June 18Growing Season Precipitation - April-July 18Growing Season Precipitation - April-August 18Growing Season Precipitation - April-Sept 19Spring Wheat Soil Moisture - April 19Spring Wheat Soil Moisture - October 19Average Daily Mean Temperature - April 19Average Daily Mean Temperature - May 20Average Daily Mean Temperature - June 20Average Daily Mean Temperature - July 20Average Daily Mean Temperature - August 20
14
68
4 YIELD ALBERTA 2011
When you fill in your harvested production report for the Canada-Alberta annual crop insurance program yoursquore doing more than simply meeting the terms of your contract Yoursquore contributing to a valuable database
that contains field-scale yields under actual crop condi-tions across the various regions of Alberta
This information has been available online for sev-eral years but now thanks to a joint project between Agriculture Financial Services Corporation (AFSC) and Alberta Farmer itrsquos now available in one easy-to-read publication called Yield Alberta
Interpreting the dataKeep in mind that the basis for the data is differ-
ent than for the Alberta Seed Guide where varieties are compared side by side in test plots Yield Alberta data is based on actual yields reported by farmers in each of AFSCrsquos 22 risk areas This means that yields from those fields are subjected to varying weather and management conditions The yields are adjusted for dockage and test weight but not quality Yields are as reported by farmers or from an inspection on a claim or random audit
The chal lenging growing condit ions last season illustrate how some risk areas can fare better than others and how conditions can change every year Yield Alberta allows you to look at how varieties performed on average
across the province as well as in each risk area and across a number of years
When comparing variety yields within each risk area pay attention to the number of acres seeded Varieties are listed if they are grown by five or more farmers for any risk area There are situations where there are only a few acres of some varieties Those fewer acres of a certain variety might be the ones that happened to be on better soil caught some extra rain from a thunderstorm or had higher levels of management So the more acres that are grown the more representative the yields will be
More available onlineIf yoursquod like to take your variety comparison a step fur-
ther you can log on to the Alberta Management Insights (AMI) data on Ropinrsquo the Web at wwwagricgovabcaapp96loadrptinput The site allows you to enter your legal land description and compare varieties by yield and by cropping practice for different regions You can com-pare varieties by twenty five township block risk area soil zone and risk areasoil zone combination It also includes a risk-area seeding summary and a report show-ing the top-yielding varieties for each risk area
We hope that Yield Alberta will be a valuable addition to your variety-selection toolbox If you would like more information on how to interpret the data contact Susan Crump Program Development and Policy at AFSC susancrumpafscca
Welcome to
Yield Alberta
by Dean Dyck Project Manager AFSC
Too everything ndash Alberta farmers had just about every kind of weather in 2010 and it never seemed to come in moderation
2010A
griculture is known for its unpredictability and 2010 was no exception Depending on where you farmed in Alberta to quote Charles Dickens ldquoIt was
the best of times it was the worst of timesrdquoMost 2010 crop yields in Alberta exceed-
ed the 10-year average mdash despite extremely dry conditions in the Peace too much rain in the south and crops that were seven to 10 days behind maturity for most of the growing year because of cool temperatures (Figure 1) The exceptions were forage seeds (alfalfa creeping red fescue and timothy) safflower potatoes and kabuli chickpeas
The majority of forage seeds are pro-duced in the Peace Region and yields suffered from lack of moisture and high temperatures
Safflower potatoes and kabuli chickpeas are grown in the southern region and delayed seeding a wet seedbed and a lack of heat all contributed to yield declines
YieldsHard red spring wheat averaged 46
bushels per acre on stubble 16 per cent higher than the 10-year average The high-est yields were in Risk Area 6 (west of Olds) at 66 bushels per acre but that was
only on 1400 acres Argentine canola yields averaged 37 bushels per acre on stubble compared to the 10-year average of 31 bushels per acre Yields were quite consistent throughout most of the prov-ince though the highest yields were in Risk Area 15 (St Paul Thorhild Smoky Lake Athabasca area) at 48 bushels per acre
Barley on stubble averaged 68 bushels per acre 10 bushels higher than the 10 year average The highest yields were Risk Area 7 (Lacombe Red Deer and Olds area) at 80 bushels per acre Oats on stubble aver-aged 87 bushels per acre almost 22 bush-els higher than the 10 year average The highest yields were in Risk Area 22 (Fort Vermilion area) at 122 bushels per acre
Field peas averaged 39 bushels per acre 15 per cent higher than the 10 year The highest yields were in Risk Area 10 and 15 at 50 bushels per acre
Lower qualityThe lack of maturity also led to lower
quality for the major crops (See page 17) Most of the province harvested 2 CW or lower for wheat and barley and 2 CAN or less for canola However the Peace region enjoyed high percentages of 1 CW wheat and barley and 1 CAN canola
Environment Canada reported that 2010 began with the warmest winter in history followed by the warmest spring the third-warmest summer and the sec-ond-warmest fall on record According to Environment Canada this makes 2010 Canadarsquos warmest year in 63 years
That was hard to believe through most of Alberta Spring seeding started off colder than normal For much of the province temperatures remained below normal through much of the growing season except for the Peace
The old adage ldquowhen it rains it poursrdquo held true to form Farmers throughout the province were quite concerned in April because soil moisture conditions were below normal (See page 19) Then the rain came mdash and never stopped until September Farmers in southern Alberta either delayed seeding reseeded or left acres unseeded because of the wet con-ditions In fact 124000 acres werent even seeded due to excess moisture in the spring according to AFSC On the posi-tive side soil moisture levels returned to normal to above normal The benefit was higher yields Wheat barley canola and field peas all yielded at least 10 per cent higher than normal
A year of extremesfor farming in Alberta
6 YIELD ALBERTA 2011
Southern Albertas irrigation equipment didnt get much of a workout during the summer of 2010 AFSC photo
2011 yield alberta 7
too wet mdash except the PeaceCentral Alberta started out dry then got
wet mdash and wetter mdash as the growing season progressed (See page 18) The wet con-ditions delayed seeding and delayed crop development at least 10 days from the nor-mal A warm October allowed harvest to be completed and wheat barley and canola yields were at least 10 per cent higher than normal Field pea yields were similar to the long-term average
Farmers in the Peace region were left wondering why they missed out Throughout the growing season pre-cipitation compared to the average was near normal in the northern and eastern corner of the region to low to very low in the central and southern portions Soil moisture levels already low com-ing into 2010 declined even further to the point where there is only a 10 per cent probability of spring soil moisture
returning to average throughout much of the region
Also temperatures were higher than aver-age for most of the growing season (See page 20) The central portion of the region (Risk areas 18 and 19) was affected most Yields for all major crops were down 17 to 32 per cent of normal In stark contrast producers in the northern part of the region (Risk area 22) harvested above average yields for all major crops Field pea yields were the hardest hit across the region down 20 to 43 per cent of normal Wheat yields were down five to 23 per cent of normal
all of the above Northern Alberta had it all The season
started out with soil moisture reserves rela-tive to the long-term normal at least near normal in the southeast to moderately low in the centre and north to very low and extremely low in the west When the pre-cipitation came accumulations varied from extremely high in the east and south por-tions to moderately low across the central and western portions of the region Late seeding and cool temperatures delayed crop maturity at least seven to 10 days While there was a lot of precipitation most of it was timely leading to above-average yields Wheat barley and canola yielded 20 per cent higher than average Field peas were near the long-term average
Crop insurance down hail up AFSC crop insurance claims for 2010
are estimated at $127 million down from $239 million in 2009 but still higher than the 2003 to 2008 average of $57 million The number of hail claims through AFSC was up 33 per cent from 2009 but close to the average The largest storm happened on July 12 affecting 296060 acres near Strathmore Standard Rockyford Hussar and Langdon
Optimism Nobody knows what 2011 will bring
but most of the agricultural land in Alberta is sufficient in soil moisture This years crop should have a good start except for the Peace region Low to very low soil moisture reserves will have farmers there looking for a lot of spring moisture Snow can help but depending on breakup only 20 to 35 per cent of that precipitation gets into the soil
Again farmers will have their fingers crossed for spring rains Looking for a ldquonormal yearrdquo Keep looking
Crop 2010 yield Buac
2009 yield Buac
change 10 year average change
HRS Wheat 35 34 19 39 16
Durum 45 32 30 32 29
Argentine Canola 37 29 24 31 16
Barley 68 56 17 57 15
Field Peas 39 29 26 33 15
Oats 88 55 37 65 26
Risk Area HRS Wheat Barley Canola Field Peas
1 NA 50 NA NA
2 43 54 37 46
3 41 57 39 38
4 35 47 31 33
5 47 72 38 49
6 68 74 27 NA
7 63 80 37 47
8 49 69 39 45
9 35 50 31 31
10 56 69 43 50
11 58 76 47 45
12 48 72 41 36
13 51 70 44 42
14 NA 69 43 NA
15 53 74 48 50
16 NA NA 42 NA
17 30 NA 24 NA
18 31 40 19 30
19 32 43 22 25
20 40 59 29 26
21 38 48 24 21
22 47 67 35 48
Risk Area HRS Wheat Barley Canola Field Peas
1 NA
2 46 73 49 41
3 66 73 46 42
4 67 67 46 42
5 73 45
Figure 1
Dryland Yields (bushels per acre)
Irrigated Yields (bushels per acre)
by Murray Hartman oilseed specialistAlberta Agriculture and Rural Development
Pushing it mdash are tight rotations leading to an ever-increasing amount of disease pressure on canola
Canola rotationperformance
in AlbertaPrairie farmers are seeding more canola
because of higher net returns than other crops but this is being achieved by shorten-ing rotations Agronomists indicate that very short rotations (canola every second year and canola on canola) are becoming prominent in the traditional canola-growing regions of Alberta
Recent research experiments on the per-formance of short canola rotations in Alberta are sparse and the limited data indicates that continuous canola is lower yielding than other rotation breaks However there is a wealth of information in the crop insurance records collected by Agriculture Financial Services Corporation (AFSC) This database was used to summarize recent information on the frequency and yield effects of various canola rotation breaks and canola after dif-ferent crops
Two different datasets were extracted from the AFSC database One dataset contained about 48000 records from 2001-09 for the yield of canola in relation to years from the last canola crop Another dataset held 20000 records from 2004-09 for the yield of canola following various crops (wheat barley peas canola and fallow) Each dataset was fil-tered to remove records from producers that
Continued on page 10
8 YIELD ALBERTA 2011
Good fit
Canola tailored to youExtensive investment and innovation has yielded three exciting
Viterra bred canola choices for 2011 ndash VT 500 VT Remarkable and VT Barrier We also have a wide selection of exclusive canola
like Provenreg 9553 These varieties offer excellent yield potential great standability and outstanding value With so many
options ndash wersquoll help you find the one that fits your farm
For more information on these outstanding varieties and our 2011 canola programming offers see your Viterra retail or visit seedviterraca
ADVICE OPPORTUNITIES ACCESS
Bad fit
VT 500 VT Remarkable VT Desirable VT Barrier Provenreg 9553SOLD OUT
2010 Viterra Canola Yield Data now available at seedviterraca
SOLD OUT SOLD OUT
Good fitBad fit
9553
VIT Yield MB 2011 adindd 1 02022011 92332 AM
reported the same yield on all their cano-la fields Data was summarized by major soil zones which represent the areas in Alberta with different soil climate and canola-cropping practices Average yield is not shown for situations with less than 10 data points for confidentiality and reduced reliability due to the limited numbers
Major soil zoneFor this article only graphs from the
BlackDark Gray (east) soil subzone will be shown due to space limitations However this soil zone reflects the same trends in the major canola regions in Alberta (Parkland and Peace River regions) All graphs for the main soil zones growing canola will be posted on AFSCs website later this winter
Figure 1 shows the trend of shorter canola rotations and canola every sec-ond year is the most popular break interval In contrast long rotation intervals such as the recommended three-year break are declining mdash in fact now there is more canola on cano-la than the long rotations This trend is consistent in other central and northern Alberta soil zones
The yield implication of short canola rotations is illustrated in Figure 2
Although the yield comparisons fluctu-ate from year to year canola on canola is consistently the lowest yielding Canola with one- or two-year breaks had similar yield and the recommended three-year break is best overall
On average over the six years in the Black DG east zone canola on canola
yielded 17 per cent less than canola with one or two-year breaks and canola with three-year breaks yielded eight per cent higher than one- or two-year breaks
The significant yield loss with canola on canola compared to one or two-year breaks was quite consistent among the major canola soil zones (16 per cent in BlackDark Gray west 17 per cent in the Peace region 12 per cent in Thin Black) Also other soil zones had a slight yield advantage of the three-year break over one- or two-year break ( four per cent in Black eight per cent in Dark Brown and nine per cent in Thin Black)
Although this data illustrates signifi-cant yield losses with short canola rota-tions larger differences in net returns between canola and other crops can financially justify such short rotations
Figure 3 illustrates the trend to plant more canola mainly following wheat and barley and a relatively slower increase in canola on canola Notice the unusual spikes in various crop stubbles in 2003 and 2004 mdash crop rotations are often altered for a couple of years after a drought The Peace River region had a similar trend to more canola on wheat but the rate of canola on canola increase was similar to that of wheat while canola on barley was rather stable
Continued from page 8
Figure 1 Number of records for canola break intervals
in the Black Dark gray soil subzone over 2004-09
Figure 2 Canola yield for rotation breaks in the
BlackDark gray east soil subzone over 2004-09
10 yield AlbertA 2011
Figure 4 (on following page) com-pares the yield of canola following vari-ous crops to that of canola on wheat in this soil zone Note how the relative yield of canola in the drought year 2002 jumped following these crops and fallow versus canola on wheat Although the percentage differences were huge that year the actual yield differences were much smaller mdash wheat averaged only about seven buac and thus a 50 per cent yield advantage would still be just 10 buac The reason for poor performance of canola on wheat that drought year may be due to less subsoil moisture remain-ing after wheat than after other crops in 2001
Trend increaseOther than the drought year of
2002 yield of canola on canola was
Continued on next pageFigure 3 Number of records for canola planted following various
crops in the Black Dark gray east soil subzone over 2001-09
Disease populations will shift due to high selection pressure in short rotations which is especially worrying for diseases like blackleg and clubroot
2011 yield alberTa 11
12 yield AlbertA 2011
much less than canola on wheat And there appears to be a trend of declin-ing yields following canola compared to canola after wheat Could this be the first signs of long-term adverse impacts of short-rotation canola Canola on wheat generally appears to be the best performer (except
for that drought year) with canola on barley or peas or summerfallow slightly poorer Canola yield on peas was quite variable perhaps due to problems with residual herbicides common diseases such as sclerotinia or inappropriate N fertilizer reduc-tions following peas
ConclusionsIn summary this data confirms that
the ancient practice of crop rotation still has benefit for canola production in Alberta Canola on canola measures about a 15 per cent yield drop com-pared to canola every two or three years Extending the canola rotation to the recommended once every four years will add about another eight per cent yield
Producers in the major canola-growing regions of Alberta have adopted short rotation canola over the past decade and canola every second year is the most popular rotation
Although there is a yield penalty for this short rotation the higher net returns with canola versus other crops justifies short rotations However adverse long-term effects of short rotation canola are possible and thus producers should also incorporate a risk premium when calculating the true costbenefit of short-rotation canola
One significant concern is that dis-ease populations will shift due to high selection pressure in short rotations leading to breakdown of canola variety resistance This is especially worrying for diseases like blackleg and clubroot So there definitely is a tradeoff mdash short-term financial gain for possible long term disease pain
Continued from previous page
Figure 4 Canola yield following various crops in the
Black Dark gray east soil subzone over 2001-09
Agriculture Financial Services Corporation (AFSC) is a provincial Crown corporation that works with Albertarsquos agriculture producers and commercial enterprises to ensure they have the tools they require to run a successful business With over 50 offices across Alberta AFSC delivers income stabilization programs provides insurance products and offers a range of lending products and services
Call AFSC today to find out how we can help you reach your goals
1-877-899-AFSC (2372) wwwAFSCca
2011 yield AlBeRTA 13
by Dawn Trautman Laslop and Scott Jeffrey Department of Rural Economy University of Alberta
BMPs Most help the farmer somewhat but theres one practice which is a clear winner
Producers have a pretty good idea of how crops per-form under conventional practices but what hap-pens under different ones Producers returns arent the only factor mdash the environment is also a con-sideration Well-managed land provides more than
food It improves water quality carbon sequestration wild-life habitat and recreation Beneficial management practices (BMPs) can provide these ecological goods and services and while society benefits BMPs may come at a cost for produc-ers This study funded by Alberta Pulse Growers and Alberta Crop Industry Development Fund looks at the impact of BMP adoption on farm performance
Benefitcost analysisAgriculture and Agri-Food Canada recognizes three gen-
eral categories of BMPs reducing inputs controlling erosion and runoff and barriers and buffers to intercept and contain contaminants Agricultural BMPs include fertilizernutrient management strip cropping shelterbelts buffer strips cover crops crop residue management and conversion of cropland to permanent forage among others
To determine the impact of BMPs for Alberta producers a set of ldquomodelrdquo or representative dryland crop farms were identified for major soil zones in Alberta including Brown Dark Brown Black and Dark Grey soil zones Statistics Canada data were used to determine an appropriate location and size for each model farm Crop rotations were determined using expert opinion Statistics Canada data and existing literature
The base rotations for each region are provided in Table 2 where B C DW SF and SW denote barley canola durum wheat summerfallow and spring wheat respectively
Cash flow simulation Cash flow was calculated with and without BMP adoption
The simulation modelling takes into account risk of uncertain prices and yields The model farms are assumed to participate in safety net programs including crop and hay insurance and AgriStabilityAgriInvest Yields were estimated based on past AFSC data
Performance is modelled over a 40-year period Annual cash flows are discounted and summed as net present values (NPVs) which represent a final present-day value of the operation Each model farm is simulated for a base scenario (ie refer-ence point) where there are no BMPs being adopted and then repeated for each BMP scenario
Are Beneficial Management Practices Actually Beneficial
Table 1 - Representative farm characteristics
Soil Zone Representative Country
Size (ha) Wetland
Brown Forty Mile 1295 4
Dark Brown Starland 1295 4
Black Camrose 1036 6
Dark Grey Smoky River 777 6
Table 2 - Base crop rotations
Soil Zone Crop Rotation
Brown SF - SW - C - DW - SF - B - C - SW
Dark Brown SW - C - B - SF
Black SW - C - B - SW - C
Dark Grey SW - C - B - SW - C
14 YIELD ALBERTA 2011
2011 yield alberta 15
BMPs included shelterbelts buffer strips around wetlands crop residue management and crop rotation adjustments Crop rotation BMPs include the addition of alfalfa hay field peas legume green manures andor oats However only results from expanding the rotations to include field peas will be discussed here
effects of each bMPbull Shelterbelts take up land previously used for crops In
the Brown Dark Brown Black and Dark Grey farms there are 954 763 458 and 229 hectares lost respectively There are also establishment costs of approximately $2000 per hectare lost On land directly adjacent there is a potential yield decrease and on the area sheltered by wind there is a potential increase The yield effect ranges from minus 49 per cent to plus 17 per cent of the normal yield specific to crop and region
bull Buffer strips reduce run-off into wetlands by replacing annual crop production with permanent vegetation However buffer strips also reduce land available for crop It is assumed that there is one small wetland per quarter section on each farm Land lost ranges from approximately nine to twelve hect-ares for the representative farms While there is land lost due to buffer strip adoption producers can seed the buffer region to hay and sell the hay at custom rates
bull Residue management Leaving residue on a field can reduce wind erosion and provide additional soil organic mat-ter There is a potential yield effect depending on the moisture content of the year which is indirectly measured using yields The residue removed is also sold
bull Rotations Properly managed rotations can improve soil quality and fertility and farm profitability In the short term cereals are rotated with broadleaf crops such as oilseeds or pulses to control weeds and reduce herbicide resistance Field
peas can fix nitrogen which reduces nitrogen input in the year the crop is grown and also in the subsequent year The BMP rotation where field peas (FP) are added in each region is pro-vided in Table 3
Continued on next page
Table 3 - Crop rotations when adding field peas
Soil Zone Crop Rotation
Brown SF - SW - C - DW - FP - B - C - SW
Dark Brown SW - C - B - FP - SW - SF
Black SW - C - B - FP - SW - C
Dark Grey SW - C - B - FP - SW - C
Shelterbelts take up cropland but help retain soil and moisture
In the Brown soil zone adding field peas to the rotation increased the annual value of the farm by 72 per cent
Adding field peas to the rotation provides a stochastic yield benefit for the subsequent crop ranging from 0 to 10 per cent in the Brown and Dark Brown soil zones and 20 to 30 per cent for the Black and Dark Grey soil zones Nitrogen effect following field peas is measured as fertilizer savings assuming fertilizer is applied at 33 per cent of normal Nitrogen savings vary from $1701ha to $2731ha depending on the region and subsequent crop
Convincing results Annualized results from the models are provided in Table 4
where the three non-rotational BMPs are adopted assuming the base rotation
bull Compared to the base rotation adding shelterbelts decreases the annual value of the farms in proportion to the amount of land lost due to shelterbelt adoption Losses in value of approximately 24 14 6 and 4 per cent occurred for the Brown Dark Brown Black and Dark Grey farms respectively
bull The adoption of buffer strips and seeding hay in the area came at a loss to the farms as compared to the base situation However this loss was minimal at one per cent or less for all farms
bull The adoption of residue management resulted in small gains in value for all modelled farms The farms in the Brown Dark Brown Black and Dark Grey soil zones saw gains in value of approximately 21 37 11 and 03 per cent from the adoption of
residue management bull Including field peas in the rotation generally results in strong
improvement to the value of the farms In the Brown soil zone add-ing field peas to the rotation increased the annual value of the farm by 72 per cent However field peas also came as a partial replacement for summerfallow in this soil zone so there is also more land under production per year
In the Dark Brown soil zone the value of the farm is increased by 36 per cent when field peas are in rotation In the Black soil zone there is actually a small decrease in the value of the farm when field peas are adopted in rotation This effect is likely due to less land being allocated overall to higher-valued crops such as canola
In the Dark Grey soil zone there is a two per cent increase in farm value when field peas are included in the rotation
Summary Due to increased yields and reduced input costs rotational
BMPs specifically field peas are typically beneficial for the pro-ducer However it is also apparent that BMPs such as shelterbelts are costly for producers due to high adoption costs and lost acreage BMPs such as buffer strips represent a smaller cost to the producer and could be feasible with minor incentives Residue management as a BMP is shown to have a positive effect on the farm and as such would likely not need external incentives
Continued from previous page
Buffer strips reduce run-off into wetlands by replacing annual crop production with permanent vegetation
Table 4 - Annualized mean NPV ($) of the representative regions under individual BMPs
Soil Zone Base Rotation Shelterbelts Hay in Buffer Residue Management BMP (field peas rotation)
Brown 7880486 59698392 7867032 8044147 13525247
Dark Brown 10449328 9026027 10420415 10831670 14242250
Black 27905786 26247451 27652625 28218095 27732774
Dark Grey 24378127 23421241 24132048 24458630 24868843
16 yield AlbertA 2011
2008
2009
2010
Historical Grades Spring Wheat
0
20
40
60
80
1 CW 2 CW 3 CW 4 CW Can Fd
0
20
40
60
80
1 CW 2 CW 3 CW 4 CW Can Fd
0
20
40
60
80
1 CW 2 CW 3 CW 4 CW Can Fd
0
20
40
60
80
1 CW 2 CW 3 CW 4 CW Can Fd
2008
2009
2010
Historical Grades Canola
0
20
40
60
80
100
1 Can 2 Can 3 Can Sample
0
20
40
60
80
100
1 Can 2 Can 3 Can Sample
0
20
40
60
80
100
1 Can 2 Can 3 Can Sample
0
20
40
60
80
100
1 Can 2 Can 3 Can Sample
2008
2009
2010
Historical Grades Barley
0
20
40
60
80
Malt 1 CW 2 CW Other
0
20
40
60
80
Malt 1 CW 2 CW Other
0
20
40
60
80
Malt 1 CW 2 CW Other
0
20
40
60
80
Malt 1 CW 2 CW Other
Historical Grades Spring Wheat
Historical Grades Canola
Historical Grades Barley
Growing SeasonPrecipitation to DateApril 1 2010 to April 28 2010
Precipitation (mm)
0-1010-2030-3030-4040-5050-6060-70
70-8080-9090-100100-120120-150gt150No Data
2011 yield alberta 17
Growing SeasonPrecipitation to DateApril 1 2010 to May 30 2010
Growing SeasonPrecipitation to DateApril 1 2010 to June 27 2010
Growing SeasonPrecipitation to DateApril 1 2010 to August 29 2010
Growing SeasonPrecipitation to DateApril 1 2010 to July 28 2010
18 yield alberta 2011
Precipitation (mm)
Precipitation (mm) Precipitation (mm)
Precipitation (mm)
0-2525-5050-7575-100100-125125-150150-175
0-4040-8080-120120-160160-200200-240240-280
0-5050-100100-150150-200200-250250-300300-350
0-2525-5050-7575-100100-125125-150150-175
175-200200-225225-250250-275275-300gt 300No Data
280-320320-360360-400400-440440-480gt 480No Data
350-400400-450450-500500-550550-600gt 600No Data
175-200200-225225-250250-275275-300gt 300No Data
Growing SeasonPrecipitation to DateApril 1 2010 to September 30 2010
April 2010Average Daily MeanTemperature Relativeto Long Term NormalApril 1 2010 to April 30 2010
Spring Wheat Soil Moisture Reserves Relative to Long Term Normal to a Depth of 120 cmEstimated as of April 18 2010
Spring Wheat Soil Moisture Reserves Relative to Long Term Normal to a Depth of 120 cmEstimated as of Oct 31 2010
2011 yield alberta 19
Precipitation (mm)Condition Frequency of Occurance
0-5050-100100-150150-200200-250350-300300-350
Extremely lowvery lowlowmoderately lownear normalmoderately highhighvery highextremely high
less than 1 in 25 yearsless than 1 in 12 yearsless than 1 in 6 yearsless than 1 in 3 yearsat least 1 in 3 yearsless than 1 in 3 yearsless than 1 in 6 yearsless than 1 in 12 yearsless than 1 in 25 years
350-400400-450450-500500-550550-600gt 600No Data
ConditionCondition
Frequency of OccuranceFrequency of OccuranceExtremely low
very lowlowmoderately lownear normalmoderately highhighvery highextremely high
Extremely lowvery lowlowmoderately lownear normalmoderately highhighvery highextremely high
less than 1 in 25 yearsless than 1 in 12 yearsless than 1 in 6 yearsless than 1 in 3 yearsat least 1 in 3 yearsless than 1 in 3 yearsless than 1 in 6 yearsless than 1 in 12 yearsless than 1 in 25 years
less than 1 in 25 yearsless than 1 in 12 yearsless than 1 in 6 yearsless than 1 in 3 yearsat least 1 in 3 yearsless than 1 in 3 yearsless than 1 in 6 yearsless than 1 in 12 yearsless than 1 in 25 years
May 2010Average Daily MeanTemperature Relativeto Long Term NormalMay 1 2010 to May 31 2010
June 2010Average Daily MeanTemperature Relativeto Long Term NormalJune 1 2010 to June 30 2010
August 2010Average Daily MeanTemperature Relativeto Long Term NormalAug 1 2010 to Aug 31 2010
July 2010Average Daily MeanTemperature Relativeto Long Term NormalJuly 1 2010 to July 31 2010
20 yield alberta 2011
ConditionCondition
ConditionCondition
Frequency of OccuranceFrequency of Occurance
Frequency of OccuranceFrequency of Occurance
Extremely lowvery lowlowmoderately lownear normalmoderately highhighvery highextremely high
Extremely lowvery lowlowmoderately lownear normalmoderately highhighvery highextremely high
Extremely lowvery lowlowmoderately lownear normalmoderately highhighvery highextremely high
Extremely lowvery lowlowmoderately lownear normalmoderately highhighvery highextremely high
less than 1 in 25 yearsless than 1 in 12 yearsless than 1 in 6 yearsless than 1 in 3 yearsat least 1 in 3 yearsless than 1 in 3 yearsless than 1 in 6 yearsless than 1 in 12 yearsless than 1 in 25 years
less than 1 in 25 yearsless than 1 in 12 yearsless than 1 in 6 yearsless than 1 in 3 yearsat least 1 in 3 yearsless than 1 in 3 yearsless than 1 in 6 yearsless than 1 in 12 yearsless than 1 in 25 years
less than 1 in 25 yearsless than 1 in 12 yearsless than 1 in 6 yearsless than 1 in 3 yearsat least 1 in 3 yearsless than 1 in 3 yearsless than 1 in 6 yearsless than 1 in 12 yearsless than 1 in 25 years
less than 1 in 25 yearsless than 1 in 12 yearsless than 1 in 6 yearsless than 1 in 3 yearsat least 1 in 3 yearsless than 1 in 3 yearsless than 1 in 6 yearsless than 1 in 12 yearsless than 1 in 25 years
More wheat solutionsthan Prairie towns
1 Developed by Agriculture amp Agri-Food Canada Winnipeg 2 Developed by Agriculture amp Agri-Food Canada Swift Current 3 Developed by Agriculture amp Agri-Food Canada Lethbridge
wwwsecancom
Genes that fit your farm No matter where you farm Call your SeCan seed retailer today 800-665-7333
CWB Variety Survey 2010 lsquoACrsquo is an official mark used under license from Agriculture amp Agri-Food Canada
Ad Number SEC_WHEAT_11_M
Prod
uced
by
SeC
an
Prod
uct
Cam
paig
n N
ame
SeC
an W
heat
Dat
e Pr
oduc
ed J
anua
ry 2
011
Ad N
umbe
r SE
C_W
HEAT
_11_
MPu
blic
atio
n Y
ield
Alb
erta
Type
Liv
e 7
25rdquo
x10
rdquoTrim
-81
25rdquo
x 10
75rdquo
Ble
ed 8
625
rdquo x
112
5rdquoSEC_WHEAT11_M_YAqxd 2111 323 PM Page 1
All purchases are subject to the terms of labelling and purchase documents reg TM SM Trademarks and service marks licensed to Pioneer Hi-Bred Limited copy 2011 PHL PR1610 Yield MN Grower_G_E
With industry-leading research and seed genetics Pioneer Hi-Bred is bringing a new level of performance to western Canadian growers We were the first company to bring new traits for sclerotinia and clubroot resistance to canola And wersquore also leading with the development and introduction of early maturity locally adapted corn hybrids
Wersquore also covering a lot of ground with the service and support we deliver to our customers You can count on your local Pioneer Hi-Bred sales rep to help you build a high yielding crop Plus theyrsquore backed by one of the strongest agronomic teams in the business
Pioneer Hi-Bred Wersquore gaining new ground where it matters most ndash in your fields
Seed genetics that aregaining new ground
Ask your local Pioneer Hi-Bred sales rep for a seed recommendation for your fields
Craig SchmidtBarrhead (780) 674-4828
FDH Holdings LtdBawlf (780) 608-8491
Danny NobbsBonanza (780) 864-1289
Jill Feniak-SplaneBoyle (780) 689-3386
Gordon FrankBrooks (403) 362-7299
You1st Enterprises LtdCalgary (403) 239-4215
Herb de HoogCamrose (780) 672-2339
Hal Creek Seed Company IncClyde (780) 348-2629
AJM Seeds LtdCoalhurst (403) 308-6685
Consort Agro Services LtdConsort (403) 577-3020
Colin PellerinDebolt (780) 957-2000
Lyndon PopovitchFairview (780) 835-4356
Ron WielerFort Vermilion (780) 927-4255
David SammonsGleichen (403) 934-0940
Lorne CampbellGrimshaw (780) 618-5220
Smoky Seed Company LtdGuy (780) 837-1334
Kelsey SolickHalkirk (403) 884-2358
EampA Land and Cattle Ltd Hayter (780) 753-6666
David Moroz Killam (780) 385-5353
All In Farm Services LtdKitscoty (780) 847-2022
Next Generation Seeds LtdManning (780) 836-7771
Sandrsquos Seed Farm LtdMcLaughlin (780) 745-2251
Gateway Agra Services LtdMedicine Hat (403) 526-9499
K amp S Sharpe Farms LtdMunson (403) 823-6761
Diadem Ag EnterprisesNanton (403) 646-5839
Ellis Agriculture LtdOlds (403) 556-1258
Accur-AgPonoka (403) 588-4689
Darcy KoesterRockyford (403) 901-3560
Jason TolsmaSpruce Grove Calmar (780) 446-1082
Myron ZabolotniukSt Albert (780) 915-6920
Gerald FodchukSt Brides (780) 645-3720
Ron WirstaSt Paul (780) 645-3939
Lee Van RingenStettler (403) 741-9067
Taber Home and Farm CentreTaber (403) 223-8948
Chris and Holly DraderTangent (780) 359-2727
Bauer Six LtdTorrington (403) 994-1149
Deryk SanfordVegreville Fort Saskatchewan (780) 632-9699
Dwayne AndrashewskiVegreville Two Hills (780) 336-4808
Webbrsquos Crop ServicesVermilion (780) 853-6565
Kittle Farms LtdViking (780) 336-2583
Markert Seeds LtdVulcan (403) 485-6708
Dalton Seed Farm IncWainwright (780) 842-2361
Hegland Seed FarmWembley (780) 766-2450
Sylvan RaaenRolla BC (250) 219-1778
PR1646 Alb Yield_G_E3indd 1 070211 445 PM
24 yield AlBeRTA 2011
3
4
5
2
6
7
8
9
1
7
3
4
8
5
6
9
11
11
51
95
71
42
50
79
27
83
48
75
59
67
52
63
15
91
99
72
39
68
60
49
28
76
23
55
96
84
64
87
80
88
16
24
40
36
92
65
53
56
61
69
77
25
47
73
18
29
70
12
57
19
41
37
94
89
13
85
97
54
81
93
66
20
17
35
78
21
62
10
14
26
82
38
58
74
30
33
90
98
32
22
31
86
43
34
44
45
46
83
67
71
91
39
64
59
36
65
19
31
37
59
75
15
27
63
87
51
55
48
38
60
66
76
99
79
92
22
43
47
24
60
83
16
20
52
23
68
28
78
56
52
84
51
88
33
73
40
75
53
84
32
6161
62
49
95
17
29
71
69
77
57
25
79
10
34
53
80
93
91
44
62
85
89
67
99
55
41
72
54
81
58
76
18
26
54
96
30
80
92
45
72
57
96
95
42
58
90
74
21
86
68
94
82
81
50
77
85
97
93
46
73
69
97
87
64
88
12
63
86
78
70
74
98
56
94
70
89
65
82
98
90
66
35
13
14
111111
111
119
115
116
112
117
113
118
114
110
126
119
115115
112
119
116116
112
117
113113
117
110
118
114
110
114
118
103
123
100
124
104
120
101
105
125
121
102
122
126
106
126
107
108
109
123
120
123
120
103
104
107
124
108
103
108
109
121
101
105
109
107
125124
100
121
104
122
106
122
101100
125
102102
105
106
9
23
2
47 56
48
86 9
7 69
9
5
2
3
7
8
58
2
4
9
36
2
9 8 678
35 4
2
6 5
3
2
4
4
5
4
53
7
2
9
74
8
69
59
8 57 4
2
3
6 35
37
8
2
2
3
4
9 458 67
684
7 6 5 4
9
39 8 2
35 4
345 278 6
3
2
7
9
6
4
9
3 2457
7
8
3
89
7
69
2
2
2
7
45
67
6
389
5
6
5
9 78
8
26 35 4
3
1111
11
11
11
11
11
1111
11
11
11
11
11
11
11
11
21
10
12
18 13 101216 1512
25
1021
19 1419
22 17
22
19
2324
15
13
14
18
20
10
23
12
1316
182310
1714
19
24
18
12
10
26
23
25
22 21
13 10
29
25
12
1423 21
24
2024
26
13
24 21
19
22 18
22 15
21
17
20
14 1616 1220
27
16
25
15 14
23
10
17
12
1521 17
28
26
10
1823
15
16 13
13
1719
10
1024
221012
12
12
21
14
22
23 13
18 25 20
25
15
10
1922
27
21 18 1620 1921 1722 2010
22
19
1314
28
18 12
26
23
17 2419
10
13
14
1516 22 211214
25
25
17
10
12 18
17
13
20
15
15
16
15
14 10
20
17
26
23 192024
27
16
16
22
12
18
18
1223 1520 14 1319 162124
25
17
24
27 26
23
20
1925
13
141521 16 1018 1723 13 12
22 20
24
24
1326
26
2727
4
9
14
2
20
3
5
1
15
8
13
21
11
22
7
10
6
19
16
12
17
18
Oyen
Olds
Taber
Hanna
Leduc
Vulcan
Ponoka
Lamont
Falher
Castor
Brooks
Provost
Manning
Lacombe
Camrose
Airdrie
Westlock
Thorhild
Stettler
St Paul
Grimshaw
Foremost
Fairview
Cardston
Barrhead
Red Deer
Vermilion
Sedgewick
Athabasca
Wainwright
Vegreville
Strathmore
Smoky Lake
High River
Claresholm
Lethbridge
Drumheller
Three Hills
Spirit River
High Prairie
Medicine Hat
Fort Vermilion
Grande Prairie
28
13
29
Valleyview
Stony Plain
Crop Risk Areas
Central Office
Regional Offices
AgriInsurance District Offices
RISK AREAS
2011 yield AlBeRTA 25
dagger Yields only for those varieties grown by 5 or more producers Dagger On system as of January 19 2011sect Weighted Average Yield and Total Acreage include acres not reported in the table
ALBERTA
WHEAT DRYLAND YIELDS BY VARIETY 2007ndash2010dagger ALBERTA 2007 2008 2009 2009 2010 2010Dagger Variety Yield Yield Yield Acres Yield Acres Harvest (HRS) 44 52 39 1212390 49 1182518 Lillian (HRS) 33 38 32 506206 41 529934 CDC Go (HRS) 53 59 41 318268 52 430052 Superb (HRS) 43 51 42 362570 44 318801 AC Eatonia (HRS) 25 29 33 229417 34 249139 AC Foremost (CPS) 66 75 53 190035 69 162010 Strongfield (D) 32 41 37 318183 44 146266 5700 PR (CPS) 57 65 51 188770 59 133822 CDC Imagine (HRS) 38 47 36 137003 47 119137 CDC Abound (HRS) mdash mdash 37 28183 49 116084 AC Intrepid (HRS) 47 48 39 121751 42 99061 Prodigy (HRS) 37 41 33 97765 42 82197 CDC Teal (HRS) 43 43 34 88686 33 67939 AC Barrie (HRS) 34 37 29 80738 40 65649 AC Splendor (HRS) 38 39 33 73774 37 60949 AC Crystal (CPS) 47 55 46 64640 57 53779 Radiant (HRW) 48 50 36 101078 53 50462 AC Avonlea (D) 28 38 35 114093 42 46209 Infinity (HRS) 46 47 39 62798 43 45198 CDC Alsask (HRS) mdash 43 37 12331 45 43703 McKenzie (HRS) 36 41 34 51256 40 42186 Alvena (HRS) mdash 54 44 10665 42 31123 5701 PR (CPS) 58 59 47 37935 57 28978 Snowbird (HRS) 44 48 44 25177 54 24866 Kane (HRS) mdash 64 38 9732 52 24299 Roblin (HRS) 38 42 34 36660 39 23230 AC Elsa (HRS) 37 41 31 35758 36 22389 AC Navigator (D) 40 43 40 52438 43 21323 5602 HR (HRS) 43 42 31 29192 44 17793 AC Cadillac (HRS) 30 31 18 19707 33 16560 5702 PR (CPS) mdash mdash 54 5329 62 15218 CDC Osprey (HRW) 43 50 28 12871 48 14500 Kyle (D) 24 34 30 41861 34 13614 Snowstar (HRS) mdash mdash 45 9574 45 13226 AC Abbey (HRS) 32 39 29 15909 39 12636 AC Andrew (SWS) 52 56 30 9102 50 12459 Journey (HRS) 40 47 36 18994 47 10867 WR 859 CL (HRS) mdash mdash mdash mdash 51 8733 CDC Bounty (HRS) 36 45 34 5220 42 8326 Columbus (HRS) 28 31 26 10739 34 8288 Katepwa (HRS) 28 34 28 9287 34 8136 Unity (HRS) mdash 48 48 447 53 8043 AC Bellatrix (HRW) 40 47 34 31063 51 7678 Laura (HRS) 28 33 29 8499 33 7299 Leader (HRS) 23 28 38 3880 37 6924 CDC Buteo (HRW) 36 48 38 3670 58 6121 Park (HRS) 37 38 30 6773 28 5844 Alikat (HRS) 46 53 58 6777 51 5684 Lovitt (HRS) 36 47 mdash mdash 48 5632 AC Taber (CPS) 41 44 45 9190 72 5441 Goodeve (HRS) mdash mdash mdash mdash 60 4798 AC Majestic (HRS) 44 43 32 6234 44 4548 AC Domain (HRS) 37 43 35 5023 46 4198 Oslo (CPS) 62 77 77 4523 82 4129 Stettler (HRS) mdash mdash 42 3191 48 3974 CDC Clair (HRW) 54 60 44 3502 59 3806 AC Morse (D) 26 28 36 13640 38 3756 CDC Makwa (HRS) 21 25 15 5010 21 3442 AC Michael (HRS) 22 31 27 2060 30 2535 Glenn (HRS) mdash mdash mdash mdash 39 2390 Biggar (CPS) 41 41 33 1481 27 1785 Peace (HRS) mdash 36 32 2020 32 1687 Waskada (HRS) mdash mdash mdash mdash 51 1676 Lancer (HRS) 30 39 24 877 50 1628 Neepawa (HRS) 29 26 30 1596 39 1283 Thatcher (HRS) 22 32 32 850 31 1154 CDC Falcon (HRW) 54 72 35 1331 71 1153 Sceptre (D) 29 42 33 1675 40 770 Bluesky (ES) mdash 36 mdash mdash 27 701 Sadash (SWS) mdash mdash mdash mdash 62 287 Weighted Average Dryland Wheat yield (Bu) amp total acressect 47 4506547
WHEAT IRRIGATED YIELDS BY VARIETY 2007ndash2010dagger ALBERTA 2007 2008 2009 2009 2010 2010Dagger Variety Yield Yield Yield Acres Yield Acres CDC Go (HRS) 72 70 77 47588 71 53415 Superb (HRS) 73 69 71 63671 66 53195
WHEAT IRRIGATED YIELDS BY VARIETY 2007ndash2010dagger ALBERTA 2007 2008 2009 2009 2010 2010Dagger Variety Yield Yield Yield Acres Yield Acres CDC Abound (HRS) mdash mdash 68 8098 59 22431 Strongfield (D) 80 76 77 44162 74 13915 Glenn (HRS) mdash mdash mdash mdash 49 9503 Radiant (HRW) 93 87 96 5831 87 8326 Lillian (HRS) 53 64 59 8750 53 5527 AC Andrew (SWS) 88 84 84 10480 77 5141 Sadash (SWS) mdash mdash mdash mdash 69 3715 AC Navigator (D) 77 81 70 15186 63 3608 CDC Imagine (HRS) 64 59 54 10294 47 3484 Snowstar (HRS) mdash mdash 74 2710 58 3135 Harvest (HRS) 70 75 52 3099 59 3030 WR 859 CL (HRS) mdash mdash mdash mdash 70 2235 AC Morse (D) 67 73 66 5903 61 2211 CDC Bounty (HRS) mdash mdash mdash mdash 64 1925 5700 PR (CPS) mdash mdash mdash mdash 82 1888 Stettler (HRS) mdash mdash 69 872 78 1687 Waskada (HRS) mdash mdash mdash mdash 50 1113 AC Meena (SWS) 85 91 87 942 82 770 AC Crystal (CPS) 68 97 75 3275 58 768 Kane (HRS) mdash mdash 65 3524 84 681 AC Eatonia (HRS) mdash 35 35 507 29 427 Weighted Average Irrigated Wheat yield (Bu) amp total acressect 67 208978
CANOLA DRYLAND YIELDS BY VARIETY 2007ndash2010dagger ALBERTA 2007 2008 2009 2009 2010 2010Dagger Variety Yield Yield Yield Acres Yield Acres 5440 mdash 45 33 457363 45 560836 5020 36 40 30 572062 36 532664 71-45RR 35 38 30 420133 33 335701 72-55 RR mdash 37 29 150694 35 264407 8440 mdash 45 33 230431 44 243925 9553 mdash 45 29 153012 40 194991 9590 36 44 32 151670 45 167694 45H28 mdash 40 30 107053 36 140868 72-65 RR mdash mdash 25 6419 39 107347 45H26 37 39 30 123848 34 99691 34-65 29 35 23 82700 33 80617 32-75 30 26 23 81061 22 66523 5770 mdash mdash mdash mdash 47 65361 1818 28 34 24 51086 34 61673 72-35 RR mdash mdash 27 24492 29 45416 45H29 mdash mdash 28 410 46 44431 9552 mdash mdash 20 18926 32 37095 45S51 mdash mdash 32 11841 37 36579 SP DesirableRR 28 35 24 38288 30 34085 46P50 31 41 26 47461 40 33978 5030 33 41 33 62268 44 31134 v1037 mdash mdash 28 14332 33 27262 D3151 mdash mdash 33 7153 35 26228 4414 RR 32 37 24 22073 35 25598 430 mdash mdash 24 7018 24 25415 9350 mdash mdash 27 4019 28 24933 1841 32 41 24 51341 34 24856 45H73 34 39 24 16844 36 23901 1950 mdash mdash mdash mdash 39 23527 45P70 33 35 27 16598 34 21930 Nex 845 CL 29 36 26 39590 33 21144 71-40 CL mdash 41 24 16263 27 19880 9550 26 33 28 14298 41 17739 43H57 mdash 29 27 22244 24 15737 45A71 27 30 16 13192 27 15089 1852 H 34 42 24 21325 30 14440 45H21 32 38 24 32860 35 14405 D3150 mdash mdash 27 11557 39 14298 43A56 30 22 21 25255 18 13267 46A76 25 30 23 12741 30 12732 Prairie 719RR 29 35 22 31744 30 12693 1145 mdash mdash mdash mdash 43 12558 997 RR 23 35 23 20101 28 12444 93H01RR mdash 44 26 7772 34 11563 NX4-104 RR mdash mdash 26 24711 32 11426 9555 mdash mdash mdash mdash 35 11328 9551 25 29 20 26119 34 10936 73-67 RR mdash mdash mdash mdash 46 10391 5525 CL mdash mdash mdash mdash 31 10333 45H24 33 32 25 14048 26 10086 4362 RR 32 33 22 10994 21 10051 6040 RR mdash mdash mdash mdash 37 9732
26 yield AlBeRTA 2011
dagger Yields only for those varieties grown by 5 or more producers Dagger On system as of January 19 2011sect Weighted Average Yield and Total Acreage include acres not reported in the table
CANOLA DRYLAND YIELDS BY VARIETY 2007ndash2010dagger ALBERTA 2007 2008 2009 2009 2010 2010Dagger Variety Yield Yield Yield Acres Yield Acres 1141 mdash 39 25 9694 38 9399 73-55 RR mdash mdash mdash mdash 41 8924 73-45 RR mdash mdash mdash mdash 35 8836 Rugby mdash 31 18 5091 27 7406 6130 RR mdash mdash mdash mdash 34 6974 9558C mdash mdash mdash mdash 40 6933 73-77 RR mdash mdash mdash mdash 46 6769 34-55 33 37 25 15608 39 6766 Reward 21 20 19 6054 17 6189 NX4-105 RR mdash mdash mdash mdash 38 6142 6020 RR mdash mdash mdash mdash 32 5966 8571 mdash mdash 17 1941 18 5796 5070 33 38 29 12902 40 5571 1768S mdash 38 30 2896 41 5030 Cafe 28 19 18 7223 13 4576 SP Banner 25 33 24 9964 37 4570 1956 mdash mdash mdash mdash 38 4326 Red River 1826 mdash 19 24 5413 21 4052 73-65 RR mdash mdash mdash mdash 41 3894 SW 6802 27 35 20 5616 24 3690 5505 CL mdash mdash 18 1363 28 3517 45H25 35 36 28 5605 33 3472 SP 621 RR 29 36 28 8819 31 3410 45A51 24 36 27 2348 43 2846 1651H mdash 29 20 3473 28 2762 1896 29 33 24 2823 22 2421 ACS-C7 mdash 15 16 1579 10 2250 73-35 RR mdash mdash mdash mdash 37 2228 SW Spirit River 17 10 mdash mdash 14 1832 45H72 27 32 17 3605 43 1725 46A65 28 38 14 1217 24 1687 D3152 mdash mdash mdash mdash 36 1660 4424 RR mdash mdash 26 2106 34 1657 Tobin 19 17 mdash mdash 14 1641 1855 H mdash 38 30 2803 37 1546 SW 3950 27 41 28 2240 33 1531 v1040 mdash mdash mdash mdash 28 1515 NX4-102 RR mdash mdash 22 10676 33 1474 83S01RR mdash 42 30 2640 39 1437 41P55 23 17 mdash mdash 15 1414 Canterra 1867 20 41 21 5155 39 1412 NX4-106 RR mdash mdash mdash mdash 31 1224 501 37 45 31 1741 38 1176 519RR mdash 52 44 916 42 1108 v2030 mdash mdash 30 4745 30 929 5108 32 29 12 3112 26 737 71-20CL 31 29 25 2558 45 509 9556 mdash mdash mdash mdash 50 463 Weighted Average Dryland Canola yield (Bu) amp total acressect 37 3926077
CANOLA IRRIGATED YIELDS BY VARIETY 2007ndash2010dagger ALBERTA 2007 2008 2009 2009 2010 2010Dagger Variety Yield Yield Yield Acres Yield Acres 5440 mdash 54 55 19054 50 27219 72-55 RR mdash mdash 47 3550 46 5457 71-45RR 45 46 51 8227 45 5289 45H28 mdash mdash 48 4265 45 3681 72-65 RR mdash mdash mdash mdash 45 3044 1841 46 49 44 5840 47 2950 5770 mdash mdash mdash mdash 52 2417 9553 mdash mdash 47 2667 43 2398 45S51 mdash mdash mdash mdash 43 2283 9590 42 54 42 1293 46 1624 46P50 45 46 46 1064 48 1542 8440 mdash 59 52 1485 52 1480 NX4-105 RR mdash mdash mdash mdash 40 1149 5020 48 53 50 1173 53 1138 NX4-104 RR mdash mdash 41 1878 48 897 v1037 mdash mdash mdash mdash 54 887 Nex 845 CL mdash 47 36 2763 36 768 45H26 49 56 52 1334 45 743 D3151 mdash mdash mdash mdash 32 642 1950 mdash mdash mdash mdash 44 554 Weighted Average Irrigated Canola yield (Bu) amp total acressect 47 75598
BARLEY DRYLAND YIELDS BY VARIETY 2007ndash2010dagger ALBERTA 2007 2008 2009 2009 2010 2010Dagger Variety Yield Yield Yield Acres Yield Acres Xena 55 73 62 643079 68 591246 AC Metcalfe 52 67 55 533515 64 476043
BARLEY DRYLAND YIELDS BY VARIETY 2007ndash2010dagger ALBERTA 2007 2008 2009 2009 2010 2010Dagger Variety Yield Yield Yield Acres Yield Acres CDC Copeland 59 73 55 208794 72 204463 CDC Cowboy 67 57 35 70124 61 115292 Ponoka 61 68 56 94737 67 89838 Conlon 53 65 46 95753 60 76818 Champion mdash mdash 65 11514 72 72433 Seebe 53 60 47 83084 61 72008 Sundre mdash 71 59 34761 67 50329 CDC Coalition 63 82 60 19066 74 47240 CDC Kendall 54 76 53 42968 72 27965 CDC Dolly 45 60 48 33083 54 23797 Newdale 56 74 56 20843 68 20738 Vivar 71 83 67 17142 78 19742 McLeod 62 70 52 20817 68 19044 CDC Bold 58 64 57 26021 66 18274 Formosa mdash 72 51 14086 78 18089 Stander 60 75 65 25118 75 16694 Bridge 39 56 49 17471 41 15409 CDCTrey 54 78 68 12288 82 13633 CDC Thompson 57 94 66 15451 89 12908 CDC Helgason 52 67 56 13890 64 11468 Trochu 60 83 59 12183 78 11306 Lacey 64 81 47 16630 73 10144 Harrington 40 51 42 19459 40 9147 Legacy (BT 950) 57 66 67 7997 66 7126 AC Lacombe 55 63 51 10459 45 6262 CDC Yorkton 55 69 66 5484 68 6177 CDC Meredith mdash mdash 85 690 81 5370 CDC PolarStar mdash mdash mdash mdash 74 5197 Niobe 60 84 42 4012 72 4890 AC Ranger 46 59 53 9447 73 4539 AC Harper 46 67 60 4853 41 4417 Bentley mdash mdash mdash mdash 82 4193 CDC Battleford 54 76 66 2324 65 3334 Robust 53 61 38 3871 50 3215 Falcon 54 54 62 1528 68 2462 Otal 45 31 33 2815 27 2059 CDC Select 53 66 68 1645 82 2012 Stockford 60 61 48 1734 66 1830 Abee 46 65 39 1110 59 1793 Winthrop 49 72 42 1914 50 1624 AC Rosser 63 48 11 2694 32 1336 AC Albright 60 26 36 1097 34 1196 Excel 57 79 57 2030 62 1174 CDC Stratus 52 77 67 733 71 896 Manley 49 64 56 3504 68 684 Stein 48 64 mdash mdash 62 683 Leduc 46 65 49 771 53 506 Dillon 32 36 19 1503 55 426 Palliser 53 mdash mdash mdash 79 425 Busby mdash mdash mdash mdash 91 357 Weighted Average Dryland Barley yield (Bu) amp total acressect 67 2133473
BARLEY IRRIGATED YIELDS BY VARIETY 2007ndash2010dagger ALBERTA 2007 2008 2009 2009 2010 2010Dagger Variety Yield Yield Yield Acres Yield Acres Xena 82 91 94 24497 72 21435 AC Harper 84 95 103 7482 72 9169 Vivar 93 92 98 8099 73 7485 CDC Yorkton 86 105 83 3828 67 6769 Sundre mdash 99 104 5053 71 6431 CDC Coalition mdash mdash 105 1823 81 5936 AC Metcalfe 71 89 72 3714 68 5454 Conlon 83 70 69 6044 71 2936 Champion mdash mdash mdash mdash 70 2815 CDC Earl 100 90 99 1870 65 2245 CDC Bold 86 99 88 2174 99 2204 CDC Cowboy mdash 75 86 2050 81 2083 Newdale 82 90 51 1293 88 1636 CDC Mindon mdash mdash mdash mdash 34 1527 Ponoka 87 92 100 838 91 1272 CDC Thompson 80 mdash 72 1003 61 1232 CDC Copeland mdash 78 70 885 60 629 Chigwell mdash mdash mdash mdash 91 523 Bridge 79 mdash mdash mdash 45 403 Weighted Average Irrigated Barley yield (Bu) amp total acressect 72 88799
2011 yield AlBeRTA 27
dagger Yields only for those varieties grown by 5 or more producers Dagger On system as of January 19 2011sect Weighted Average Yield and Total Acreage include acres not reported in the table
FIELD PEA DRYLAND YIELDS BY VARIETY 2007ndash2010dagger ALBERTA 2007 2008 2009 2009 2010 2010Dagger Variety Yield Yield Yield Acres Yield Acres CDC Meadow mdash 62 31 33797 46 107325 SW Midas 38 43 31 112571 37 92389 Delta 23 35 26 79067 37 67276 CDC Golden 32 36 23 66253 36 63828 Cooper 44 49 38 39731 39 47861 Eclipse 34 36 23 61802 30 37540 DS-Admiral 37 45 31 42330 40 32164 Cutlass FP 37 37 31 23831 30 31440 Thunderbird mdash mdash 41 8356 44 29097 Canstar 37 50 41 9913 44 15701 Polstead 52 48 37 9156 42 11648 Swing 31 42 30 11794 40 11232 Eiffel 33 39 30 10063 37 5890 SW Capri 40 47 35 9421 47 4857 CDC Mozart 35 18 19 3840 17 4727 CDC Striker mdash mdash mdash mdash 42 4707 Carneval 36 36 23 6523 30 4548 Miami 36 45 27 6721 35 3835 Garde mdash 10 mdash mdash 45 3564 Nitouche 34 36 37 4837 34 3493 Camry 37 34 30 5585 44 3453 CDC Patrick mdash mdash mdash mdash 40 3194 Espace 39 29 21 3696 42 2718 Profi 31 28 25 3214 36 2491 SW Parade 35 34 33 1497 29 2416 CDC Centennial mdash mdash 18 1011 38 2411 Sorento mdash mdash mdash mdash 53 2036 Toledo 38 39 31 2713 32 1802 Stratus 39 27 33 1910 27 1608 SW Circus 35 45 25 2605 39 1589 Agassiz mdash mdash 33 511 34 1571 CDC Sage mdash mdash 28 548 41 1495 Reward mdash mdash 30 797 42 1167 SW Bravo 39 41 34 1742 43 1147 CDC Bronco mdash mdash 26 3097 38 715 Weighted Average Dryland Field Pea yield (Bu) amp total acressect 39 626557
FIELD PEA IRRIGATED YIELDS BY VARIETY 2007ndash2010dagger ALBERTA 2007 2008 2009 2009 2010 2010Dagger Variety Yield Yield Yield Acres Yield Acres CDC Meadow mdash mdash 49 1682 39 1869 CDC Golden 37 39 55 1264 36 1418 Weighted Average Irrigated Field Pea yield (Bu) amp total acressect 42 5713
OATS DRYLAND YIELDS BY VARIETY 2007ndash2010dagger ALBERTA 2007 2008 2009 2009 2010 2010Dagger Variety Yield Yield Yield Acres Yield Acres AC Morgan 90 87 64 76308 100 94229 Derby 75 69 52 48418 79 55551 AC Mustang 64 69 50 24622 84 28941 Waldern 51 51 36 7721 67 9071 CDC Baler 55 64 39 9185 84 8798 Calibre 47 53 29 10143 72 8487 Cascade 61 58 42 5290 69 6681 Grizzly 51 59 35 3394 60 3394 7600M 75 74 56 1859 78 3081 Jordan mdash 73 74 475 97 1667 CDC Boyer 42 67 32 978 49 1654 AC Juniper 84 94 71 2110 75 1305 Foothill 31 43 15 1015 76 1084 Jasper 72 60 25 426 37 1019 CDC Orrin 87 25 80 937 62 984 Murphy 55 57 53 402 76 941 Athabasca 61 33 45 462 74 764 Lu mdash 112 37 549 121 577 Triple Crown 65 93 81 506 162 556 AC Medallion mdash 101 mdash mdash 88 338 CDC SO-I mdash mdash mdash mdash 116 331 Harmon 63 83 29 802 68 328 Weighted Average Dryland Oats yield (Bu) amp total acressect 87 237316
OATS IRRIGATED YIELDS BY VARIETY 2007ndash2010dagger ALBERTA 2007 2008 2009 2009 2010 2010Dagger Variety Yield Yield Yield Acres Yield Acres AC Morgan 82 74 117 766 85 478 Waldern mdash 100 50 487 105 454 AC Mustang mdash mdash mdash mdash 100 444 Weighted Average Irrigated Oats yield (Bu) amp total acressect 84 2018
MUSTARD DRYLAND YIELDS BY VARIETY 2007ndash2010dagger ALBERTA 2007 2008 2009 2009 2010 2010Dagger Variety Yield Yield Yield Acres Yield Acres Andante (Yellow) 14 17 18 40649 18 42064 AC Pennant (Yellow) 12 14 17 12995 19 12551 Ace (Yellow) 12 20 15 9159 20 7956 AC Base (Yellow) 14 14 16 3564 21 4258 Forge (Oriental) 16 19 17 5100 22 3959 Dutchess (Brown) 13 23 17 3293 19 3204 Centennial Brown (Brown) mdash 29 29 20844 23 2541 Weighted Average Dryland Mustard yield (Bu) amp total acressect 19 88191
LENTIL DRYLAND YIELDS BY VARIETY 2007ndash2010dagger ALBERTA 2007 2008 2009 2009 2010 2010Dagger Variety Yield Yield Yield Acres Yield Acres CDC Maxim mdash mdash mdash mdash 1710 18451 CDC Imperial mdash mdash 1297 5894 1459 15940 CDC Improve mdash mdash 1480 1892 1639 7019 CDC Richlea mdash 1564 1370 4829 1981 5559 CDC Impact mdash mdash 1380 2651 1893 4594 Laird 1055 1663 1373 1411 1639 2854 Weighted Average Dryland Lentil yield (Lbs) amp total acressect 1645 67252
BEAN IRRIGATED YIELDS BY VARIETY 2007ndash2010dagger ALBERTA 2007 2008 2009 2009 2010 2010Dagger Variety Yield Yield Yield Acres Yield Acres Island (Pinto) mdash mdash 1884 4120 1265 15903 Resolute (Great Northern) mdash mdash 2273 6701 1297 7570 AC Polaris (Great Northern) 2259 1979 1923 7759 1238 6303 Winchester Pinto (Pinto) 2192 1868 1870 8264 1382 5011 AC Black Diamond (Black) 2359 2150 1945 2253 1371 3813 AC Redbond (Small Red) 2136 1887 1877 3652 1208 2254 Othello (Pinto) 2311 1670 1769 3580 1344 1615 Myasi yellow (Black) mdash mdash 2742 523 1273 1346 NW - 63 (Small Red) mdash 1437 mdash mdash 1323 549 Weighted Average Irrigated Bean yield (Lbs) amp total acressect 1282 46854
POTATO DRYLAND YIELDS BY VARIETY 2007ndash2010dagger ALBERTA 2007 2008 2009 2009 2010 2010Dagger Variety Yield Yield Yield Acres Yield Acres Russet Burbank (Seed) 9 14 7 1088 10 1466 Weighted Average Dryland Potato yield (Tons) amp total acressect 11 4835
POTATO IRRIGATED YIELDS BY VARIETY 2007ndash2010dagger ALBERTA 2007 2008 2009 2009 2010 2010Dagger Variety Yield Yield Yield Acres Yield Acres Russet Burbank (Fry) 18 17 17 25205 15 24353 Shepody (Fry) 15 14 15 2473 11 3000 FL 1867 (Chip) mdash mdash 13 1015 9 1282 FL 1879 (Chip) mdash 15 16 1084 11 1174 Russet Burbank (Seed) 15 11 14 976 10 863 Atlantic (Chip) mdash 11 15 570 7 553 Weighted Average Irrigated Potato yield (Tons) amp total acressect 14 36991
SUGAR BEET IRRIGATED YIELDS BY VARIETY 2007ndash2010dagger ALBERTA 2007 2008 2009 2009 2010 2010Dagger Variety Yield Yield Yield Acres Yield Acres Beta 47RR65 mdash mdash mdash mdash 20 21081 Beta 47RR75 mdash mdash mdash mdash 21 5575 Beta 43RR90 mdash mdash 20 24635 20 1402 HM 9003RR mdash mdash mdash mdash 22 568 Weighted Average Irrigated Sugar Beet yield (Tons) amp total acressect 20 29352
FLAX DRYLAND YIELDS BY VARIETY 2007ndash2010dagger ALBERTA 2007 2008 2009 2009 2010 2010Dagger Variety Yield Yield Yield Acres Yield Acres CDC Sorrel mdash 22 24 4369 26 3869 CDC Bethune 26 29 21 8074 24 3428 Hanley mdash 22 22 1086 26 1935 Flanders 17 23 22 2403 27 1412 McGregor 18 25 22 2071 21 1130 Prairie Thunder mdash mdash 18 964 23 775 Weighted Average Dryland Flax yield (Bu) amp total acressect 24 14156
FLAX IRRIGATED YIELDS BY VARIETY 2007ndash2010dagger ALBERTA 2007 2008 2009 2009 2010 2010Dagger Variety Yield Yield Yield Acres Yield Acres CDC Sorrel mdash 33 41 3395 36 4394 CDC Bethune 32 42 40 2582 32 1425 Hanley mdash mdash 36 654 35 443 Weighted Average Irrigated Flax yield (Bu) amp total acressect 34 6989
28 yield AlBeRTA 2011
dagger Yields only for those varieties grown by 5 or more producers Dagger On system as of January 19 2011sect Weighted Average Yield and Total Acreage include acres not reported in the table
TRITICALE DRYLAND YIELDS BY VARIETY 2007ndash2010dagger ALBERTA 2007 2008 2009 2009 2010 2010Dagger Variety Yield Yield Yield Acres Yield Acres Pronghorn (Spring) 43 47 35 3221 53 3912 Bunker (Spring) mdash mdash 46 720 34 2432 Pika (Winter) 47 41 35 1192 43 1068 AC Ultima (Spring) 41 59 27 1952 26 800 AC Alta (Spring) mdash mdash mdash mdash 46 788 Bobcat (Winter) 47 53 33 1084 33 750 Weighted Average Dryland Triticale yield (Bu) amp total acressect 43 13135
TRITICALE IRRIGATED YIELDS BY VARIETY 2007ndash2010dagger ALBERTA 2007 2008 2009 2009 2010 2010Dagger Variety Yield Yield Yield Acres Yield Acres Bunker (Spring) mdash mdash 70 664 52 592 Weighted Average Irrigated Triticale yield (Bu) amp total acressect 85 2171
RYE DRYLAND YIELDS BY VARIETY 2007ndash2010dagger ALBERTA 2007 2008 2009 2009 2010 2010Dagger Variety Yield Yield Yield Acres Yield Acres Prima 46 47 27 3964 40 4410 AC Remington 33 47 36 1745 35 2907 Musketeer 33 40 26 2708 34 1702 AC Rifle 44 48 mdash mdash 44 1317 Dakota mdash 56 43 2449 51 1235 Kodiak 35 41 28 802 56 584 Weighted Average Dryland Rye yield (Bu) amp total acressect 41 13422
CANARY SEED DRYLAND YIELDS BY VARIETY 2007ndash2010dagger ALBERTA 2007 2008 2009 2009 2010 2010Dagger Variety Yield Yield Yield Acres Yield Acres Keet mdash mdash 617 893 1204 3531 CDC Togo mdash mdash mdash mdash 801 664 Weighted Average Dryland Canary Seed yield (Lbs) amp total acressect 1162 5474
FABA BEAN DRYLAND YIELDS BY VARIETY 2007ndash2010dagger ALBERTA 2007 2008 2009 2009 2010 2010Dagger Variety Yield Yield Yield Acres Yield Acres Snowbird 2424 2854 1683 4695 2444 2835 Weighted Average Dryland Faba Bean yield (Lbs) amp total acressect 2449 2858
FABA BEAN IRRIGATED YIELDS BY VARIETY 2007ndash2010dagger ALBERTA 2007 2008 2009 2009 2010 2010Dagger Variety Yield Yield Yield Acres Yield Acres Snowbird mdash mdash 2841 762 2411 904 Weighted Average Irrigated Faba Bean yield (Lbs) amp total acressect 2545 1039
CREEPING RED FESCUE DRYLAND YIELDS BY VARIETY 2007ndash2010 ALBERTA
2007 2008 2009 2009 2010 2010Dagger Variety Yield Yield Yield Acres Yield Acres Boreal 386 509 435 3793 293 1751 Weighted Average Dryland Creeping Red Fescue yield (Lbs) amp total acressect 290 2461
SAFFLOWER DRYLAND YIELDS BY VARIETY 2007ndash2010dagger ALBERTA 2007 2008 2009 2009 2010 2010Dagger Variety Yield Yield Yield Acres Yield Acres Saffire 1150 mdash 1448 1298 448 800 Weighted Average Dryland Safflower yield (Lbs) amp total acressect 448 800
RISK AREA 1
BARLEY DRYLAND YIELDS BY VARIETY 2007ndash2010dagger RISK AREA 1 2007 2008 2009 2009 2010 2010Dagger Variety Yield Yield Yield Acres Yield Acres Xena 46 69 76 19681 45 19943 CDC Cowboy mdash mdash mdash mdash 73 1689 Weighted Average Dryland Barley yield (Bu) amp total acressect 50 28273
RISK AREA 2
WHEAT DRYLAND YIELDS BY VARIETY 2007ndash2010dagger RISK AREA 2 2007 2008 2009 2009 2010 2010Dagger Variety Yield Yield Yield Acres Yield Acres Lillian (HRS) 37 41 39 161982 43 160551 Superb (HRS) 37 57 58 58244 40 58071 Harvest (HRS) 51 48 31 17582 51 23657 Strongfield (D) 38 47 41 57437 47 21106 CDC Go (HRS) 45 42 49 17446 47 18950 CDC Imagine (HRS) 32 40 37 18119 38 17171 AC Avonlea (D) 29 38 36 28917 40 15009 CDC Abound (HRS) mdash mdash 47 1232 49 9624 Radiant (HRW) 46 54 47 20811 53 9224 Snowstar (HRS) mdash mdash 47 7755 45 8938 AC Navigator (D) 40 44 40 12966 42 8043 AC Eatonia (HRS) 29 27 46 8041 33 6646 AC Intrepid (HRS) 48 47 26 5203 57 4303 CDC Teal (HRS) 38 46 42 6798 31 3628 AC Elsa (HRS) 48 43 27 3070 47 2245 WR 859 CL (HRS) mdash mdash mdash mdash 40 2194 Waskada (HRS) mdash mdash mdash mdash 54 1377 Kyle (D) 28 46 32 7848 43 1226 Snowbird (HRS) 46 37 39 1828 44 1226 Glenn (HRS) mdash mdash mdash mdash 32 820 Weighted Average Dryland Wheat yield (Bu) amp total acressect 44 399787
WHEAT IRRIGATED YIELDS BY VARIETY 2007ndash2010dagger RISK AREA 2 2007 2008 2009 2009 2010 2010Dagger Variety Yield Yield Yield Acres Yield Acres CDC Go (HRS) 63 75 74 12363 61 12073 Superb (HRS) 70 74 73 15493 64 8488 CDC Abound (HRS) mdash mdash 78 2322 53 7900 Glenn (HRS) mdash mdash mdash mdash 40 5818 Lillian (HRS) 56 67 59 6633 52 3480 AC Andrew (SWS) 88 97 94 1986 76 2203 Snowstar (HRS) mdash mdash 72 1980 58 1946 Strongfield (D) 72 84 76 8099 90 1919 AC Navigator (D) 66 75 71 3937 40 1245 Radiant (HRW) 89 83 84 1438 70 791 AC Meena (SWS) 90 95 87 942 81 664 CDC Imagine (HRS) 62 65 52 3120 40 648 Weighted Average Irrigated Wheat yield (Bu) amp total acressect 59 52638
CANOLA DRYLAND YIELDS BY VARIETY 2007ndash2010dagger RISK AREA 2 2007 2008 2009 2009 2010 2010Dagger Variety Yield Yield Yield Acres Yield Acres 5440 mdash 37 32 18513 43 30441 71-45RR 32 37 36 28943 33 27064 72-55 RR mdash mdash 36 6502 36 22570 1818 20 27 34 4905 26 13569 9590 27 37 29 8506 43 8152 8440 mdash 40 31 7929 43 5426 D3151 mdash mdash mdash mdash 31 5329 9553 mdash mdash 24 2311 40 5224 45H28 mdash mdash 37 4886 39 5159 v1037 mdash mdash mdash mdash 33 4744 72-65 RR mdash mdash mdash mdash 44 4647 Nex 845 CL 31 38 35 6595 37 4033 9552 mdash mdash mdash mdash 35 3884 5770 mdash mdash mdash mdash 46 3871 5020 32 32 32 8996 42 3469 34-65 23 35 28 3971 34 3027 NX4-105 RR mdash mdash mdash mdash 39 2968 1841 30 37 25 6970 38 2557 NX4-104 RR mdash mdash 38 4922 29 2321 45H26 mdash 39 31 3897 49 1845 1950 mdash mdash mdash mdash 33 1426 46P50 26 33 mdash mdash 29 842 Weighted Average Dryland Canola yield (Bu) amp total acressect 37 185048
CANOLA IRRIGATED YIELDS BY VARIETY 2007ndash2010dagger RISK AREA 2 2007 2008 2009 2009 2010 2010Dagger Variety Yield Yield Yield Acres Yield Acres 5440 mdash 57 55 8743 53 10066 45H28 mdash mdash 51 2609 49 2172 71-45RR 49 49 50 3480 48 1954 72-65 RR mdash mdash mdash mdash 45 1877
2011 yield AlBeRTA 29
CANOLA IRRIGATED YIELDS BY VARIETY 2007ndash2010dagger RISK AREA 2 2007 2008 2009 2009 2010 2010Dagger Variety Yield Yield Yield Acres Yield Acres 72-55 RR mdash mdash 45 1472 46 1302 NX4-105 RR mdash mdash mdash mdash 40 1149 1841 49 56 43 2672 41 1129 5770 mdash mdash mdash mdash 62 943 45S51 mdash mdash mdash mdash 53 905 D3151 mdash mdash mdash mdash 33 547 Weighted Average Irrigated Canola yield (Bu) amp total acressect 49 28325
BARLEY DRYLAND YIELDS BY VARIETY 2007ndash2010dagger RISK AREA 2 2007 2008 2009 2009 2010 2010Dagger Variety Yield Yield Yield Acres Yield Acres Xena 48 75 77 168172 49 128647 AC Metcalfe 46 63 50 54650 54 50860 Champion mdash mdash mdash mdash 62 17807 Ponoka 55 61 50 19250 59 16145 CDC Coalition mdash mdash 72 5217 67 13784 CDC Copeland 58 60 49 12829 62 10611 Conlon 44 50 48 8336 49 7290 McLeod 71 80 63 3212 75 5696 Bridge 36 66 58 8775 27 5501 Newdale 76 66 56 5909 78 4258 Harrington 49 55 44 6108 38 3886 AC Harper 46 80 75 2904 36 3148 CDC Cowboy mdash mdash mdash mdash 51 2978 CDC Meredith mdash mdash mdash mdash 76 2463 CDC Yorkton 49 75 76 2781 57 2274 Sundre mdash mdash 96 2449 71 2152 AC Lacombe 65 73 63 2742 29 1613 Vivar 66 mdash mdash mdash 78 359 Weighted Average Dryland Barley yield (Bu) amp total acressect 54 287591
BARLEY IRRIGATED YIELDS BY VARIETY 2007ndash2010dagger RISK AREA 2 2007 2008 2009 2009 2010 2010Dagger Variety Yield Yield Yield Acres Yield Acres Xena 80 95 104 14742 69 13332 AC Harper 89 95 105 5901 76 7239 CDC Yorkton 85 108 85 3583 69 5623 Vivar 100 101 108 4565 76 4362 Sundre mdash 98 110 3190 76 4342 CDC Coalition mdash mdash 102 808 81 3359 AC Metcalfe 69 88 79 2232 61 2574 Ponoka 82 mdash mdash mdash 108 927 Champion mdash mdash mdash mdash 91 589 Weighted Average Irrigated Barley yield (Bu) amp total acressect 73 47451
FIELD PEA DRYLAND YIELDS BY VARIETY 2007ndash2010dagger RISK AREA 2 2007 2008 2009 2009 2010 2010Dagger Variety Yield Yield Yield Acres Yield Acres CDC Meadow mdash mdash 34 10525 50 24215 SW Midas 38 40 26 26861 44 17413 CDC Golden mdash 43 26 10188 41 7557 Eclipse 38 33 23 13697 44 4315 Delta 32 45 30 2346 47 2588 CDC Bronco mdash mdash 43 1722 31 370 Weighted Average Dryland Field Pea yield (Bu) amp total acressect 46 62544
FIELD PEA IRRIGATED YIELDS BY VARIETY 2007ndash2010dagger RISK AREA 2 2007 2008 2009 2009 2010 2010Dagger Variety Yield Yield Yield Acres Yield Acres CDC Meadow mdash mdash mdash mdash 42 800 Weighted Average Irrigated Field Pea yield (Bu) amp total acressect 41 1970
The best seeds deserve the best seed treatment Year after year over half of the canola
acres in Canada are protected with Prosperreg FX
Prosper FX provides unmatched control of flea beetles and seed- and soil-borne
diseases like rhizoctonia and fusarium Make sure your seed is treated with the
respect it deserves ndash yoursquove earned it
For more information visit BayerCropSciencecaProsperFX
Some SeedS get Preferential treatmentProSPer FX THe ProTeCTIoN THeY DeSerVe
BayerCropScienceca or 1 888-283-6847 or contact your Bayer CropScience representativeAlways read and follow label directions Prosperreg is a registered trademark of Bayer Bayer CropScience is a member of CropLife Canada 0111-14567-05D
14567-05D Prosper_SeedAD_SeedABindd 1 12711 205 PM
dagger Yields only for those varieties grown by 5 or more producers Dagger On system as of January 19 2011sect Weighted Average Yield and Total Acreage include acres not reported in the table
30 yield AlBeRTA 2011
dagger Yields only for those varieties grown by 5 or more producers Dagger On system as of January 19 2011sect Weighted Average Yield and Total Acreage include acres not reported in the table
OATS DRYLAND YIELDS BY VARIETY 2007ndash2010dagger RISK AREA 2 2007 2008 2009 2009 2010 2010Dagger Variety Yield Yield Yield Acres Yield Acres AC Morgan 58 mdash 97 870 98 855 AC Mustang 32 72 mdash mdash 74 774 CDC Baler mdash 79 mdash mdash 54 342 Derby 51 mdash 35 610 72 325 Weighted Average Dryland Oats yield (Bu) amp total acressect 74 3208
MUSTARD DRYLAND YIELDS BY VARIETY 2007ndash2010dagger RISK AREA 2 2007 2008 2009 2009 2010 2010Dagger Variety Yield Yield Yield Acres Yield Acres Andante (Yellow) 12 17 19 16479 16 15013 Ace (Yellow) 12 22 18 1260 14 1550 Weighted Average Dryland Mustard yield (Bu) amp total acressect 17 18337
LENTIL DRYLAND YIELDS BY VARIETY 2007ndash2010dagger RISK AREA 2 2007 2008 2009 2009 2010 2010Dagger Variety Yield Yield Yield Acres Yield Acres CDC Maxim mdash mdash mdash mdash 1081 1202 CDC Imperial mdash mdash mdash mdash 1040 1164 Weighted Average Dryland Lentil yield (Lbs) amp total acressect 1153 6421
BEAN IRRIGATED YIELDS BY VARIETY 2007ndash2010dagger RISK AREA 2 2007 2008 2009 2009 2010 2010Dagger Variety Yield Yield Yield Acres Yield Acres Island (Pinto) mdash mdash 2117 532 656 1056 Resolute (Great Northern) mdash mdash 2369 549 880 993 Weighted Average Irrigated Bean yield (Lbs) amp total acressect 749 2582
POTATO IRRIGATED YIELDS BY VARIETY 2007ndash2010dagger RISK AREA 2 2007 2008 2009 2009 2010 2010Dagger Variety Yield Yield Yield Acres Yield Acres Russet Burbank (Fry) 19 20 19 2012 17 2022 Weighted Average Irrigated Potato yield (Tons) amp total acressect 17 2142
SUGAR BEET IRRIGATED YIELDS BY VARIETY 2007ndash2010dagger RISK AREA 2 2007 2008 2009 2009 2010 2010Dagger Variety Yield Yield Yield Acres Yield Acres Beta 47RR65 mdash mdash mdash mdash 20 3768 Beta 47RR75 mdash mdash mdash mdash 19 1202 Weighted Average Irrigated Sugar Beet yield (Tons) amp total acressect 19 5275
FLAX DRYLAND YIELDS BY VARIETY 2007ndash2010dagger RISK AREA 2 2007 2008 2009 2009 2010 2010Dagger Variety Yield Yield Yield Acres Yield Acres McGregor 18 28 23 1616 21 1130 Flanders 18 24 30 798 31 926 CDC Sorrel mdash mdash 36 1146 28 693 Weighted Average Dryland Flax yield (Bu) amp total acressect 25 3934
FLAX IRRIGATED YIELDS BY VARIETY 2007ndash2010dagger RISK AREA 2 2007 2008 2009 2009 2010 2010Dagger Variety Yield Yield Yield Acres Yield Acres CDC Sorrel mdash mdash mdash mdash 26 493 Weighted Average Irrigated Flax yield (Bu) amp total acressect 27 713
RISK AREA 3
WHEAT DRYLAND YIELDS BY VARIETY 2007ndash2010dagger RISK AREA 3 2007 2008 2009 2009 2010 2010Dagger Variety Yield Yield Yield Acres Yield Acres Lillian (HRS) 28 34 33 101966 42 143705 AC Eatonia (HRS) 24 32 34 76942 38 85403 Strongfield (D) 29 40 37 169178 46 79795 AC Avonlea (D) 27 37 34 60573 47 23526 Superb (HRS) 29 31 30 14547 40 18147 Radiant (HRW) 42 41 33 29755 55 15816 AC Navigator (D) 39 43 41 37428 45 12470 CDC Go (HRS) mdash 34 33 2986 46 11173 Harvest (HRS) mdash 42 33 4382 48 8544 Kyle (D) 21 32 30 20167 36 7802 CDC Abound (HRS) mdash mdash 41 702 45 6564 McKenzie (HRS) 23 24 30 1981 43 6234 CDC Imagine (HRS) 28 26 19 2869 39 6110 AC Morse (D) 23 32 35 6296 37 2749 Snowstar (HRS) mdash mdash 29 932 45 2545
WHEAT DRYLAND YIELDS BY VARIETY 2007ndash2010dagger RISK AREA 3 2007 2008 2009 2009 2010 2010Dagger Variety Yield Yield Yield Acres Yield Acres Leader (HRS) 25 26 47 1832 40 2498 AC Bellatrix (HRW) 36 43 35 10614 46 1613 Glenn (HRS) mdash mdash mdash mdash 44 1255 Sceptre (D) mdash 40 37 916 48 475 Sadash (SWS) mdash mdash mdash mdash 69 235 AC Andrew (SWS) 30 38 40 510 45 225 Stettler (HRS) mdash mdash 22 342 35 173 Weighted Average Dryland Wheat yield (Bu) amp total acressect 43 454479
WHEAT IRRIGATED YIELDS BY VARIETY 2007ndash2010dagger RISK AREA 3 2007 2008 2009 2009 2010 2010Dagger Variety Yield Yield Yield Acres Yield Acres Superb (HRS) 77 65 72 33110 67 33035 CDC Go (HRS) 79 61 83 19337 79 25666 CDC Abound (HRS) mdash mdash 65 4129 66 11400 Strongfield (D) 83 77 76 28563 71 8260 Radiant (HRW) 100 91 102 2275 90 4032 Sadash (SWS) mdash mdash mdash mdash 72 3247 AC Andrew (SWS) 91 85 80 7701 78 2938 Glenn (HRS) mdash mdash mdash mdash 60 2806 CDC Imagine (HRS) 67 53 56 4835 48 2641 AC Navigator (D) 79 83 69 10535 75 2363 AC Morse (D) 73 79 63 2750 60 2023 Lillian (HRS) 45 59 56 603 54 1050 Stettler (HRS) mdash mdash 69 857 75 1044 WR 859 CL (HRS) mdash mdash mdash mdash 78 1008 CDC Bounty (HRS) mdash mdash mdash mdash 69 881 Weighted Average Irrigated Wheat yield (Bu) amp total acressect 70 107434
CANOLA DRYLAND YIELDS BY VARIETY 2007ndash2010dagger RISK AREA 3 2007 2008 2009 2009 2010 2010Dagger Variety Yield Yield Yield Acres Yield Acres 8440 mdash mdash 32 4135 42 12368 5440 mdash 45 39 5658 46 8433 D3151 mdash mdash mdash mdash 37 7833 Nex 845 CL mdash 26 42 2460 33 4065 71-45RR 21 31 28 2449 31 3806 5770 mdash mdash mdash mdash 46 1871 72-65 RR mdash mdash mdash mdash 43 1650 9590 mdash 39 33 1469 36 1630 72-55 RR mdash mdash mdash mdash 41 1050 46P50 29 42 mdash mdash 26 1047 5020 30 34 mdash mdash 42 840 8571 mdash mdash mdash mdash 26 754 9553 mdash mdash mdash mdash 38 510 Weighted Average Dryland Canola yield (Bu) amp total acressect 39 58509
CANOLA IRRIGATED YIELDS BY VARIETY 2007ndash2010dagger RISK AREA 3 2007 2008 2009 2009 2010 2010Dagger Variety Yield Yield Yield Acres Yield Acres 5440 mdash 57 61 3636 51 3991 72-55 RR mdash mdash 63 425 45 1665 9553 mdash mdash 46 1261 46 1313 46P50 46 45 mdash mdash 49 1295 71-45RR 43 40 57 971 39 1250 Weighted Average Irrigated Canola yield (Bu) amp total acressect 46 14909
BARLEY DRYLAND YIELDS BY VARIETY 2007ndash2010dagger RISK AREA 3 2007 2008 2009 2009 2010 2010Dagger Variety Yield Yield Yield Acres Yield Acres Conlon 36 48 51 16796 54 22677 Xena 43 50 43 11499 68 20478 AC Metcalfe 39 51 52 14616 54 17504 CDC Bold 46 60 59 4596 65 9891 Bridge 40 54 50 4838 55 6623 CDC Copeland 39 46 34 3947 55 3692 CDC Coalition mdash mdash 48 2208 53 3602 Champion mdash mdash mdash mdash 55 3298 CDC Cowboy mdash mdash mdash mdash 41 2716 Harrington 38 54 49 3978 49 1939 CDC Dolly 45 58 60 1257 58 1895 Ponoka 53 mdash mdash mdash 46 1437 Newdale mdash mdash mdash mdash 66 545 Vivar 46 46 36 305 33 471 CDC Yorkton mdash mdash mdash mdash 49 308 Weighted Average Dryland Barley yield (Bu) amp total acressect 57 99996
2011 yield AlBeRTA 31
dagger Yields only for those varieties grown by 5 or more producers Dagger On system as of January 19 2011sect Weighted Average Yield and Total Acreage include acres not reported in the table
BARLEY IRRIGATED YIELDS BY VARIETY 2007ndash2010dagger RISK AREA 3 2007 2008 2009 2009 2010 2010Dagger Variety Yield Yield Yield Acres Yield Acres Vivar 91 77 85 2989 71 2906 Xena 91 71 86 1732 83 2258 CDC Bold 86 86 73 627 103 2019 Champion mdash mdash mdash mdash 60 1916 AC Metcalfe 94 87 53 632 73 1351 AC Harper 79 98 99 1170 48 1325 Conlon 86 59 66 2066 61 1304 CDC Coalition mdash mdash 131 277 84 1303 CDC Yorkton mdash mdash mdash mdash 58 1146 CDC Thompson mdash mdash mdash mdash 75 640 CDC Cowboy mdash mdash mdash mdash 80 415 Weighted Average Irrigated Barley yield (Bu) amp total acressect 73 20969
FIELD PEA DRYLAND YIELDS BY VARIETY 2007ndash2010dagger RISK AREA 3 2007 2008 2009 2009 2010 2010Dagger Variety Yield Yield Yield Acres Yield Acres Delta 21 34 28 58240 37 51780 CDC Meadow mdash mdash 24 5558 48 13367 CDC Golden 25 27 25 10979 34 10734 Eclipse 27 35 19 8792 34 3761 SW Midas 26 31 18 7577 31 3147 Weighted Average Dryland Field Pea yield (Bu) amp total acressect 38 86591
FIELD PEA IRRIGATED YIELDS BY VARIETY 2007ndash2010dagger RISK AREA 3 2007 2008 2009 2009 2010 2010Dagger Variety Yield Yield Yield Acres Yield Acres CDC Meadow mdash mdash 42 648 33 936 Weighted Average Irrigated Field Pea yield (Bu) amp total acressect 42 2034
OATS DRYLAND YIELDS BY VARIETY 2007ndash2010dagger RISK AREA 3 2007 2008 2009 2009 2010 2010Dagger Variety Yield Yield Yield Acres Yield Acres Waldern 40 48 38 552 66 820 AC Mustang mdash mdash mdash mdash 46 613 Weighted Average Dryland Oats yield (Bu) amp total acressect 62 1893
MUSTARD DRYLAND YIELDS BY VARIETY 2007ndash2010dagger RISK AREA 3 2007 2008 2009 2009 2010 2010Dagger Variety Yield Yield Yield Acres Yield Acres Andante (Yellow) 17 16 18 15587 21 16518 AC Pennant (Yellow) 14 15 17 7003 21 7209 Ace (Yellow) 14 16 13 5392 23 5221 AC Base (Yellow) 15 16 15 2713 19 2106 Weighted Average Dryland Mustard yield (Bu) amp total acressect 21 31803
LENTIL DRYLAND YIELDS BY VARIETY 2007ndash2010dagger RISK AREA 3 2007 2008 2009 2009 2010 2010Dagger Variety Yield Yield Yield Acres Yield Acres CDC Maxim mdash mdash mdash mdash 1971 10066 CDC Imperial mdash mdash 1267 4109 1842 9905 CDC Improve mdash mdash 1546 1532 1817 5626 CDC Richlea mdash mdash 1315 4104 1907 4245 CDC Impact mdash mdash mdash mdash 1709 1807 Weighted Average Dryland Lentil yield (Lbs) amp total acressect 1874 36598
BEAN IRRIGATED YIELDS BY VARIETY 2007ndash2010dagger RISK AREA 3 2007 2008 2009 2009 2010 2010Dagger Variety Yield Yield Yield Acres Yield Acres Island (Pinto) mdash mdash 1828 2994 1264 11898 Resolute (Great Northern) mdash mdash 2270 5492 1367 5822 AC Polaris (Great Northern) 2266 1909 1850 6715 1272 5516 Winchester Pinto (Pinto) 2248 1765 1811 6965 1426 4548 AC Black Diamond (Black) 2419 1978 1924 1901 1419 3356 AC Redbond (Small Red) 2226 1817 1847 3367 1265 2039 Myasi yellow (Black) mdash mdash 2742 523 1276 1279 Othello (Pinto) 2281 1706 1612 1927 1199 1259 NW - 63 (Small Red) mdash 1437 mdash mdash 1323 549 Weighted Average Irrigated Bean yield (Lbs) amp total acressect 1303 37948
POTATO IRRIGATED YIELDS BY VARIETY 2007ndash2010dagger RISK AREA 3 2007 2008 2009 2009 2010 2010Dagger Variety Yield Yield Yield Acres Yield Acres Russet Burbank (Fry) 18 17 16 20642 15 20130 Shepody (Fry) 15 14 15 2343 11 2724 Russet Burbank (Seed) 14 11 mdash mdash 9 426 Atlantic (Chip) mdash mdash 15 520 8 365 Weighted Average Irrigated Potato yield (Tons) amp total acressect 13 27911
SUGAR BEET IRRIGATED YIELDS BY VARIETY 2007ndash2010dagger RISK AREA 3 2007 2008 2009 2009 2010 2010Dagger Variety Yield Yield Yield Acres Yield Acres Beta 47RR65 mdash mdash mdash mdash 20 16800 Beta 47RR75 mdash mdash mdash mdash 21 4373 Beta 43RR90 mdash mdash 20 19679 21 927 HM 9003RR mdash mdash mdash mdash 22 508 Weighted Average Irrigated Sugar Beet yield (Tons) amp total acressect 20 23334
FLAX DRYLAND YIELDS BY VARIETY 2007ndash2010dagger RISK AREA 3 2007 2008 2009 2009 2010 2010Dagger Variety Yield Yield Yield Acres Yield Acres CDC Sorrel mdash mdash 21 1039 28 1486 Weighted Average Dryland Flax yield (Bu) amp total acressect 26 1921
FLAX IRRIGATED YIELDS BY VARIETY 2007ndash2010dagger RISK AREA 3 2007 2008 2009 2009 2010 2010Dagger Variety Yield Yield Yield Acres Yield Acres CDC Sorrel mdash mdash 40 1888 35 1561 CDC Bethune 31 34 40 635 32 1255 Weighted Average Irrigated Flax yield (Bu) amp total acressect 34 3131
TRITICALE DRYLAND YIELDS BY VARIETY 2007ndash2010dagger RISK AREA 3 2007 2008 2009 2009 2010 2010Dagger Variety Yield Yield Yield Acres Yield Acres Pronghorn (Spring) mdash mdash mdash mdash 44 710 Weighted Average Dryland Triticale yield (Bu) amp total acressect 39 1316
RYE DRYLAND YIELDS BY VARIETY 2007ndash2010dagger RISK AREA 3 2007 2008 2009 2009 2010 2010Dagger Variety Yield Yield Yield Acres Yield Acres AC Remington mdash mdash mdash mdash 36 377 Weighted Average Dryland Rye yield (Bu) amp total acressect 36 482
RISK AREA 4
WHEAT DRYLAND YIELDS BY VARIETY 2007ndash2010dagger RISK AREA 4 2007 2008 2009 2009 2010 2010Dagger Variety Yield Yield Yield Acres Yield Acres Lillian (HRS) 27 31 27 82582 36 93440 AC Eatonia (HRS) 23 27 38 80878 33 90164 Strongfield (D) 26 35 38 52954 34 19708 McKenzie (HRS) 29 33 27 7906 37 6065 Radiant (HRW) 39 35 40 14420 50 5367 Harvest (HRS) 31 42 29 5251 43 4872 Superb (HRS) 42 46 41 4217 39 4528 CDC Go (HRS) mdash 44 9 535 48 3496 CDC Abound (HRS) mdash mdash 10 1408 39 3183 Kyle (D) 25 33 35 9145 29 2816 AC Barrie (HRS) 28 31 26 1712 29 2590 CDC Makwa (HRS) 15 15 11 2061 16 1903 AC Avonlea (D) 26 36 41 9553 27 1641 CDC Imagine (HRS) mdash 31 6 2232 23 1321 AC Bellatrix (HRW) 31 46 32 4707 35 844 Weighted Average Dryland Wheat yield (Bu) amp total acressect 35 266976
WHEAT IRRIGATED YIELDS BY VARIETY 2007ndash2010dagger RISK AREA 4 2007 2008 2009 2009 2010 2010Dagger Variety Yield Yield Yield Acres Yield Acres CDC Go (HRS) mdash 76 80 10787 70 11493 Superb (HRS) 66 74 69 14100 68 11402 Strongfield (D) 60 62 83 7500 73 3736 Radiant (HRW) 87 86 98 2118 88 3453 CDC Abound (HRS) mdash mdash 66 1302 49 3123 5700 PR (CPS) mdash mdash mdash mdash 78 1005 Glenn (HRS) mdash mdash mdash mdash 79 879 Weighted Average Irrigated Wheat yield (Bu) amp total acressect 69 40793
CANOLA DRYLAND YIELDS BY VARIETY 2007ndash2010dagger RISK AREA 4 2007 2008 2009 2009 2010 2010Dagger Variety Yield Yield Yield Acres Yield Acres 5440 mdash mdash 36 6783 35 9396 71-45RR 22 15 32 6235 28 8395 8440 mdash mdash 39 1036 45 2633 5020 mdash 20 mdash mdash 27 2128 Weighted Average Dryland Canola yield (Bu) amp total acressect 31 32736
32 yield AlBeRTA 2011
dagger Yields only for those varieties grown by 5 or more producers Dagger On system as of January 19 2011sect Weighted Average Yield and Total Acreage include acres not reported in the table
CANOLA IRRIGATED YIELDS BY VARIETY 2007ndash2010dagger RISK AREA 4 2007 2008 2009 2009 2010 2010Dagger Variety Yield Yield Yield Acres Yield Acres 5440 mdash 49 58 4864 48 9736 72-55 RR mdash mdash 50 1452 47 1208 8440 mdash 63 55 1016 50 1145 71-45RR 41 45 52 3048 48 1082 72-65 RR mdash mdash mdash mdash 40 761 Nex 845 CL mdash 56 mdash mdash 34 636 5020 46 mdash mdash mdash 55 603 Weighted Average Irrigated Canola yield (Bu) amp total acressect 46 20476
BARLEY DRYLAND YIELDS BY VARIETY 2007ndash2010dagger RISK AREA 4 2007 2008 2009 2009 2010 2010Dagger Variety Yield Yield Yield Acres Yield Acres Xena 46 39 41 16728 48 10839 AC Metcalfe 36 39 46 5558 47 10037 CDC Cowboy mdash 43 9 5188 51 7019 Conlon 21 52 55 4537 56 6686 CDC Copeland mdash mdash mdash mdash 55 1259 Seebe 22 22 7 787 16 785 Weighted Average Dryland Barley yield (Bu) amp total acressect 47 43203
BARLEY IRRIGATED YIELDS BY VARIETY 2007ndash2010dagger RISK AREA 4 2007 2008 2009 2009 2010 2010Dagger Variety Yield Yield Yield Acres Yield Acres Xena 80 91 97 1654 87 1645 CDC Mindon mdash mdash mdash mdash 34 1527 CDC Earl 100 mdash 88 805 57 1083 Conlon 79 83 66 2560 89 674 Weighted Average Irrigated Barley yield (Bu) amp total acressect 67 9551
FIELD PEA DRYLAND YIELDS BY VARIETY 2007ndash2010dagger RISK AREA 4 2007 2008 2009 2009 2010 2010Dagger Variety Yield Yield Yield Acres Yield Acres CDC Golden 23 24 25 10661 36 9613 Delta 20 34 22 9747 36 9477 CDC Meadow mdash mdash 40 2203 30 5051 Eclipse 21 11 22 2135 24 1820 SW Midas mdash 16 23 965 34 1053 DS-Admiral 39 48 40 1664 28 740 Weighted Average Dryland Field Pea yield (Bu) amp total acressect 33 30968
FIELD PEA IRRIGATED YIELDS BY VARIETY 2007ndash2010dagger RISK AREA 4 2007 2008 2009 2009 2010 2010Dagger Variety Yield Yield Yield Acres Yield Acres CDC Golden mdash mdash mdash mdash 34 613 Weighted Average Irrigated Field Pea yield (Bu) amp total acressect 42 1461
OATS DRYLAND YIELDS BY VARIETY 2007ndash2010dagger RISK AREA 4 2007 2008 2009 2009 2010 2010Dagger Variety Yield Yield Yield Acres Yield Acres AC Mustang 52 35 70 1290 85 1972 Calibre 23 30 13 1678 70 1512 Waldern 30 mdash 43 1124 57 1429 Derby 36 33 7 2600 45 1097 AC Morgan 24 29 mdash mdash 50 402 Weighted Average Dryland Oats yield (Bu) amp total acressect 69 7816
MUSTARD DRYLAND YIELDS BY VARIETY 2007ndash2010dagger RISK AREA 4 2007 2008 2009 2009 2010 2010Dagger Variety Yield Yield Yield Acres Yield Acres Andante (Yellow) mdash 9 16 2774 17 3763 Centennial Brown (Brown) mdash mdash 24 1935 21 2088 AC Pennant (Yellow) 9 13 14 2234 15 2027 Weighted Average Dryland Mustard yield (Bu) amp total acressect 19 13327
LENTIL DRYLAND YIELDS BY VARIETY 2007ndash2010dagger RISK AREA 4 2007 2008 2009 2009 2010 2010Dagger Variety Yield Yield Yield Acres Yield Acres CDC Maxim mdash mdash mdash mdash 1883 2209 Weighted Average Dryland Lentil yield (Lbs) amp total acressect 1592 7729
BEAN IRRIGATED YIELDS BY VARIETY 2007ndash2010dagger RISK AREA 4 2007 2008 2009 2009 2010 2010Dagger Variety Yield Yield Yield Acres Yield Acres Island (Pinto) mdash mdash mdash mdash 1488 2949 Resolute (Great Northern) mdash mdash 2212 660 1310 755 Weighted Average Irrigated Bean yield (Lbs) amp total acressect 1379 5167
POTATO IRRIGATED YIELDS BY VARIETY 2007ndash2010dagger RISK AREA 4 2007 2008 2009 2009 2010 2010Dagger Variety Yield Yield Yield Acres Yield Acres Russet Burbank (Fry) 17 12 19 2551 15 2201 Weighted Average Irrigated Potato yield (Tons) amp total acressect 15 2357
SUGAR BEET IRRIGATED YIELDS BY VARIETY 2007ndash2010dagger RISK AREA 4 2007 2008 2009 2009 2010 2010Dagger Variety Yield Yield Yield Acres Yield Acres Beta 47RR65 mdash mdash mdash mdash 21 513 Weighted Average Irrigated Sugar Beet yield (Tons) amp total acressect 21 743
FLAX IRRIGATED YIELDS BY VARIETY 2007ndash2010dagger RISK AREA 4 2007 2008 2009 2009 2010 2010Dagger Variety Yield Yield Yield Acres Yield Acres CDC Sorrel mdash mdash 45 1137 37 1970 Hanley mdash mdash 36 654 35 443 Weighted Average Irrigated Flax yield (Bu) amp total acressect 36 2775
TRITICALE DRYLAND YIELDS BY VARIETY 2007ndash2010dagger RISK AREA 4 2007 2008 2009 2009 2010 2010Dagger Variety Yield Yield Yield Acres Yield Acres Bunker (Spring) mdash mdash mdash mdash 36 1764 Pronghorn (Spring) mdash 32 13 954 37 1213 Weighted Average Dryland Triticale yield (Bu) amp total acressect 38 4952
TRITICALE IRRIGATED YIELDS BY VARIETY 2007ndash2010dagger RISK AREA 4 2007 2008 2009 2009 2010 2010Dagger Variety Yield Yield Yield Acres Yield Acres Bunker (Spring) mdash mdash 70 664 52 592 Weighted Average Irrigated Triticale yield (Bu) amp total acressect 50 1155
RYE DRYLAND YIELDS BY VARIETY 2007ndash2010dagger RISK AREA 4 2007 2008 2009 2009 2010 2010Dagger Variety Yield Yield Yield Acres Yield Acres Dakota mdash mdash 43 2379 52 1160 Prima mdash 26 8 705 41 968 Weighted Average Dryland Rye yield (Bu) amp total acressect 36 5435
RISK AREA 5
WHEAT DRYLAND YIELDS BY VARIETY 2007ndash2010dagger RISK AREA 5 2007 2008 2009 2009 2010 2010Dagger Variety Yield Yield Yield Acres Yield Acres CDC Go (HRS) 57 61 36 85097 48 129403 Harvest (HRS) 48 56 35 151334 50 122031 Lillian (HRS) 44 48 37 58718 41 36877 Superb (HRS) 46 53 37 20068 39 18446 AC Intrepid (HRS) 42 56 47 21568 55 16559 CDC Imagine (HRS) 46 50 31 18228 53 12842 CDC Abound (HRS) mdash mdash 28 1923 49 12092 AC Splendor (HRS) 33 50 36 9243 36 8738 5700 PR (CPS) 76 81 42 8316 56 7920 Prodigy (HRS) 44 49 26 3827 45 6546 AC Barrie (HRS) 33 38 23 6589 35 6024 CDC Alsask (HRS) mdash mdash 43 1032 52 4401 Radiant (HRW) mdash 61 33 2842 55 4386 AC Elsa (HRS) 32 52 37 7753 31 4177 AC Abbey (HRS) 42 45 24 3443 42 3727 Roblin (HRS) 45 48 36 4472 53 3180 5702 PR (CPS) mdash mdash mdash mdash 52 2976 Journey (HRS) 45 50 38 8273 54 2718 AC Foremost (CPS) mdash mdash 33 3012 50 2240 Unity (HRS) mdash mdash mdash mdash 46 1913 WR 859 CL (HRS) mdash mdash mdash mdash 59 1501 Strongfield (D) 51 55 38 4919 34 880 Weighted Average Dryland Wheat yield (Bu) amp total acressect 48 428921
WHEAT IRRIGATED YIELDS BY VARIETY 2007ndash2010dagger RISK AREA 5 2007 2008 2009 2009 2010 2010Dagger Variety Yield Yield Yield Acres Yield Acres CDC Go (HRS) mdash 82 55 5101 56 3933 Harvest (HRS) 73 79 49 1577 56 1334 Weighted Average Irrigated Wheat yield (Bu) amp total acressect 62 7373
2011 yield AlBeRTA 33
dagger Yields only for those varieties grown by 5 or more producers Dagger On system as of January 19 2011sect Weighted Average Yield and Total Acreage include acres not reported in the table
CANOLA DRYLAND YIELDS BY VARIETY 2007ndash2010dagger RISK AREA 5 2007 2008 2009 2009 2010 2010Dagger Variety Yield Yield Yield Acres Yield Acres 5440 mdash 47 32 43734 44 57699 71-45RR 36 43 28 54266 36 42907 9553 mdash mdash 30 12158 39 16798 72-55 RR mdash mdash 27 5695 34 15973 5020 38 47 25 18316 41 13189 8440 mdash 46 32 22266 45 12935 45H28 mdash mdash 30 4725 39 10060 1841 32 40 21 15626 29 8294 1852 H 33 40 18 11733 27 8138 1950 mdash mdash mdash mdash 39 8110 v1037 mdash mdash mdash mdash 29 7532 93H01RR mdash 36 25 4574 36 7507 9590 39 41 28 4671 43 6449 45H26 mdash 44 30 6546 38 5805 72-65 RR mdash mdash mdash mdash 39 5252 430 mdash mdash mdash mdash 32 4433 34-65 32 38 32 3461 37 4264 5770 mdash mdash mdash mdash 43 3125 1145 mdash mdash mdash mdash 39 3077 45S51 mdash mdash mdash mdash 39 2730 9350 mdash mdash mdash mdash 36 2562 45H29 mdash mdash mdash mdash 24 2182 SP DesirableRR 35 40 12 1816 39 1953 32-75 30 41 24 3105 36 1882 45H21 33 37 19 5825 38 1874 D3151 mdash mdash 32 956 37 1690 45P70 mdash mdash 21 1235 29 1402 1818 27 29 19 1181 24 1368 72-35 RR mdash mdash 29 852 29 1323 83S01RR mdash 41 33 1855 39 973 Weighted Average Dryland Canola yield (Bu) amp total acressect 38 292755
CANOLA IRRIGATED YIELDS BY VARIETY 2007ndash2010dagger RISK AREA 5 2007 2008 2009 2009 2010 2010Dagger Variety Yield Yield Yield Acres Yield Acres 5440 mdash mdash 36 1811 48 3426 45S51 mdash mdash mdash mdash 33 1089 71-45RR mdash 54 48 728 46 1003 45H28 mdash mdash mdash mdash 37 815 Weighted Average Irrigated Canola yield (Bu) amp total acressect 45 11287
BARLEY DRYLAND YIELDS BY VARIETY 2007ndash2010dagger RISK AREA 5 2007 2008 2009 2009 2010 2010Dagger Variety Yield Yield Yield Acres Yield Acres Xena 64 78 44 96376 78 87663 CDC Copeland 62 76 56 45995 73 45248 AC Metcalfe 56 77 49 50115 64 44008 Conlon 57 66 35 19540 71 15292 Champion mdash mdash 31 3187 78 12962 CDC Cowboy mdash mdash 47 2566 55 5853 CDC Coalition mdash mdash 41 3795 89 5436 Newdale 50 81 60 5889 61 5356 Sundre mdash mdash 48 3193 51 4898 Ponoka 70 78 51 5299 55 4872 Formosa mdash mdash 29 3765 78 4021 CDC Dolly 42 53 53 3637 42 2414 McLeod 70 72 49 3283 95 1881 Trochu 61 100 mdash mdash 89 1716 Weighted Average Dryland Barley yield (Bu) amp total acressect 72 249817
BARLEY IRRIGATED YIELDS BY VARIETY 2007ndash2010dagger RISK AREA 5 2007 2008 2009 2009 2010 2010Dagger Variety Yield Yield Yield Acres Yield Acres Xena 80 89 71 5836 70 3520 CDC Coalition mdash mdash mdash mdash 84 1001 AC Metcalfe 56 98 63 708 86 925 Weighted Average Irrigated Barley yield (Bu) amp total acressect 73 9541
FIELD PEA DRYLAND YIELDS BY VARIETY 2007ndash2010dagger RISK AREA 5 2007 2008 2009 2009 2010 2010Dagger Variety Yield Yield Yield Acres Yield Acres CDC Meadow mdash mdash 16 2285 55 6537 CDC Golden 40 50 26 6339 46 5786 SW Midas 43 54 32 9179 52 5709 Eclipse 48 39 21 1428 32 1852 DS-Admiral 37 45 23 1180 47 1726 Weighted Average Dryland Field Pea yield (Bu) amp total acressect 49 24771
OATS DRYLAND YIELDS BY VARIETY 2007ndash2010dagger RISK AREA 5 2007 2008 2009 2009 2010 2010Dagger Variety Yield Yield Yield Acres Yield Acres AC Mustang 60 86 35 1421 74 1902 Derby 53 mdash mdash mdash 74 511 CDC Baler 52 66 mdash mdash 70 275 Weighted Average Dryland Oats yield (Bu) amp total acressect 73 4821
MUSTARD DRYLAND YIELDS BY VARIETY 2007ndash2010dagger RISK AREA 5 2007 2008 2009 2009 2010 2010Dagger Variety Yield Yield Yield Acres Yield Acres Andante (Yellow) 16 25 19 2153 20 2335 Weighted Average Dryland Mustard yield (Bu) amp total acressect 22 2823
RISK AREA 6
WHEAT DRYLAND YIELDS BY VARIETY 2007ndash2010dagger RISK AREA 6 2007 2008 2009 2009 2010 2010Dagger Variety Yield Yield Yield Acres Yield Acres Harvest (HRS) mdash 71 mdash mdash 68 1428 AC Foremost (CPS) mdash mdash mdash mdash 65 664 Weighted Average Dryland Wheat yield (Bu) amp total acressect 65 3432
CANOLA DRYLAND YIELDS BY VARIETY 2007ndash2010dagger RISK AREA 6 2007 2008 2009 2009 2010 2010Dagger Variety Yield Yield Yield Acres Yield Acres 71-45RR mdash 43 28 838 30 1579 32-75 34 32 25 2247 29 1121 72-35 RR mdash mdash 15 655 20 845 Weighted Average Dryland Canola yield (Bu) amp total acressect 27 7069
BARLEY DRYLAND YIELDS BY VARIETY 2007ndash2010dagger RISK AREA 6 2007 2008 2009 2009 2010 2010Dagger Variety Yield Yield Yield Acres Yield Acres AC Metcalfe 25 64 43 4061 85 3430 Xena 42 74 70 2540 85 2960 CDC Dolly 46 75 55 1309 79 2210 Formosa mdash mdash 61 2324 70 2164 CDC Copeland 50 78 45 3336 74 2086 CDC Helgason 49 63 32 909 72 1399 Conlon 36 58 68 1178 67 1307 Sundre mdash 55 50 1723 67 1171 Stander 40 56 67 1031 78 689 CDC Thompson mdash mdash mdash mdash 75 661 Trochu 39 61 66 888 70 593 Weighted Average Dryland Barley yield (Bu) amp total acressect 74 22039
OATS DRYLAND YIELDS BY VARIETY 2007ndash2010dagger RISK AREA 6 2007 2008 2009 2009 2010 2010Dagger Variety Yield Yield Yield Acres Yield Acres AC Morgan 73 64 73 884 72 1142 AC Mustang 63 104 36 1798 66 806 AC Juniper 104 92 58 796 116 373 Weighted Average Dryland Oats yield (Bu) amp total acressect 73 4222
RISK AREA 7
WHEAT DRYLAND YIELDS BY VARIETY 2007ndash2010dagger RISK AREA 7 2007 2008 2009 2009 2010 2010Dagger Variety Yield Yield Yield Acres Yield Acres Harvest (HRS) 54 66 52 51038 65 45341 5700 PR (CPS) 58 70 61 46703 69 35392 CDC Go (HRS) 56 68 60 18830 64 28477 AC Foremost (CPS) 54 77 65 22376 75 25906 CDC Imagine (HRS) 59 64 44 10340 59 12324 CDC Abound (HRS) mdash mdash 52 2128 61 7263 Alvena (HRS) mdash mdash 55 2845 59 5369 Oslo (CPS) 64 77 77 4405 81 4019 AC Intrepid (HRS) 53 60 55 3390 56 2608 5702 PR (CPS) mdash mdash 65 935 66 1962 Superb (HRS) 52 63 58 2366 59 1839 AC Crystal (CPS) 47 72 57 2228 65 1006 CDC Buteo (HRW) mdash mdash mdash mdash 63 783 Weighted Average Dryland Wheat yield (Bu) amp total acressect 66 178239
34 yield AlBeRTA 2011
dagger Yields only for those varieties grown by 5 or more producers Dagger On system as of January 19 2011sect Weighted Average Yield and Total Acreage include acres not reported in the table
CANOLA DRYLAND YIELDS BY VARIETY 2007ndash2010dagger RISK AREA 7 2007 2008 2009 2009 2010 2010Dagger Variety Yield Yield Yield Acres Yield Acres 5440 mdash 52 42 26338 42 47451 71-45RR 36 47 31 49219 36 35166 8440 mdash 50 39 23862 42 21954 5020 34 46 38 23768 40 19145 72-55 RR mdash mdash 32 12891 35 15410 45H28 mdash mdash 37 5837 38 9438 9553 mdash mdash 34 8893 33 9159 32-75 33 38 27 8919 28 6103 72-35 RR mdash mdash 29 2551 33 5519 45H26 36 50 37 10091 33 5126 45S51 mdash mdash 36 1647 38 4862 SP DesirableRR 29 43 27 5300 32 4239 72-65 RR mdash mdash mdash mdash 39 3732 1950 mdash mdash mdash mdash 37 3498 1852 H 33 46 32 5195 33 3432 5770 mdash mdash mdash mdash 39 3063 1818 29 45 34 2138 31 2008 4362 RR 25 40 28 1741 32 1900 4414 RR 35 45 31 2114 29 1762 9590 39 53 46 2057 33 1553 D3151 mdash mdash mdash mdash 36 1372 SW 3950 mdash mdash 32 1359 32 1315 73-45 RR mdash mdash mdash mdash 36 1182 1841 34 47 30 1809 40 1114 73-55 RR mdash mdash mdash mdash 35 1071 9350 mdash mdash mdash mdash 28 1061 43H57 mdash 43 mdash mdash 24 1037 1956 mdash mdash mdash mdash 37 1009 430 mdash mdash mdash mdash 24 917 SW 6802 32 42 mdash mdash 20 893 45H29 mdash mdash mdash mdash 39 888 34-65 32 39 36 1907 24 712 1896 31 42 24 1476 17 466 Weighted Average Dryland Canola yield (Bu) amp total acressect 37 234748
BARLEY DRYLAND YIELDS BY VARIETY 2007ndash2010dagger RISK AREA 7 2007 2008 2009 2009 2010 2010Dagger Variety Yield Yield Yield Acres Yield Acres AC Metcalfe 49 75 65 78461 74 65812 Xena 55 87 72 43444 88 41939 CDC Copeland 54 84 68 29220 80 34130 Formosa mdash 79 57 7997 81 11214 Stander 59 74 69 12058 76 9764 Sundre mdash 75 58 6769 76 9073 Conlon 52 78 55 14459 65 7188 Vivar 68 91 72 4615 81 7101 Lacey 66 86 46 10569 81 6462 CDC Thompson 44 102 78 6627 95 5998 CDC Bold 54 73 70 4165 70 4259 CDCTrey 62 79 79 4253 96 4095 Legacy (BT 950) 55 79 70 4256 78 3862 Ponoka 47 77 73 3314 79 3839 CDC Helgason 51 72 63 6481 82 3041 Champion mdash mdash 46 850 82 2985 Newdale 54 84 73 1623 82 2636 CDC Kendall 48 86 80 4062 86 2386 CDC Coalition mdash mdash 88 1301 95 2285 Trochu 57 82 49 2974 80 2249 CDC Yorkton mdash mdash 72 1243 79 2027 CDC Battleford 58 75 70 1653 74 1868 CDC Cowboy mdash 90 41 1729 63 1782 Falcon 64 68 72 939 65 1642 CDC Dolly 44 76 69 3779 73 1220 Bentley mdash mdash mdash mdash 80 1121 Seebe 54 59 66 1778 78 520 Weighted Average Dryland Barley yield (Bu) amp total acressect 80 245515
FIELD PEA DRYLAND YIELDS BY VARIETY 2007ndash2010dagger RISK AREA 7 2007 2008 2009 2009 2010 2010Dagger Variety Yield Yield Yield Acres Yield Acres Thunderbird mdash mdash 47 896 38 5633 CDC Meadow mdash mdash 49 1071 55 4506 Garde mdash mdash mdash mdash 59 1677 Cooper 40 mdash mdash mdash 50 1496 Camry mdash mdash 57 609 61 1204 Canstar mdash mdash mdash mdash 48 824 Weighted Average Dryland Field Pea yield (Bu) amp total acressect 47 18609
OATS DRYLAND YIELDS BY VARIETY 2007ndash2010dagger RISK AREA 7 2007 2008 2009 2009 2010 2010Dagger Variety Yield Yield Yield Acres Yield Acres AC Morgan 112 116 74 3244 119 5096 AC Mustang 102 116 59 2487 95 2845 Derby 72 84 mdash mdash 91 751 CDC Baler mdash mdash mdash mdash 97 742 Waldern 63 47 mdash mdash 122 522 Weighted Average Dryland Oats yield (Bu) amp total acressect 105 11397
POTATO DRYLAND YIELDS BY VARIETY 2007ndash2010dagger RISK AREA 7 2007 2008 2009 2009 2010 2010Dagger Variety Yield Yield Yield Acres Yield Acres Russet Burbank (Seed) mdash 14 mdash mdash 8 1041 Weighted Average Dryland Potato yield (Tons) amp total acressect 8 2307
RISK AREA 8
WHEAT DRYLAND YIELDS BY VARIETY 2007ndash2010dagger RISK AREA 8 2007 2008 2009 2009 2010 2010Dagger Variety Yield Yield Yield Acres Yield Acres CDC Go (HRS) 51 61 40 153132 54 176815 Harvest (HRS) 45 54 39 128610 46 110314 CDC Imagine (HRS) 45 49 33 16043 44 13483 Superb (HRS) 47 53 38 20901 45 10670 CDC Abound (HRS) mdash mdash 38 1759 43 8720 5700 PR (CPS) 56 67 46 12326 55 6834 CDC Teal (HRS) 40 47 33 7334 36 5181 Kane (HRS) mdash mdash 32 1432 43 3667 AC Elsa (HRS) 44 47 35 6656 36 3440 AC Barrie (HRS) 35 38 27 4760 41 3417 Lillian (HRS) 43 44 35 9814 36 3416 Prodigy (HRS) 33 45 33 3975 40 3345 Alvena (HRS) mdash mdash 43 1501 43 2973 AC Crystal (CPS) 42 65 38 4101 54 2283 AC Foremost (CPS) 53 66 42 4655 56 1635 Roblin (HRS) 31 41 28 4282 32 1443 AC Bellatrix (HRW) 46 61 24 1113 71 1256 Stettler (HRS) mdash mdash mdash mdash 46 967 CDC Bounty (HRS) mdash 53 mdash mdash 46 913 Unity (HRS) mdash mdash mdash mdash 58 879 McKenzie (HRS) 33 44 38 2667 42 864 Weighted Average Dryland Wheat yield (Bu) amp total acressect 49 376785
CANOLA DRYLAND YIELDS BY VARIETY 2007ndash2010dagger RISK AREA 8 2007 2008 2009 2009 2010 2010Dagger Variety Yield Yield Yield Acres Yield Acres 5440 mdash 48 32 60684 44 85338 8440 mdash 49 33 35781 44 29402 71-45RR 32 44 30 37848 35 27826 72-55 RR mdash 39 29 18151 34 23126 9590 35 48 29 17511 43 18009 5020 35 45 27 18568 36 15815 45H28 mdash mdash 30 10507 37 14641 5770 mdash mdash mdash mdash 46 12779 9553 mdash mdash 26 11386 34 10929 45H26 29 40 27 6082 36 7056 72-65 RR mdash mdash mdash mdash 39 6875 1145 mdash mdash mdash mdash 41 6101 1841 28 38 26 11051 34 5170 1141 mdash mdash 27 1176 39 3307 4414 RR mdash 43 19 1719 31 3258 997 RR mdash 41 28 4145 28 3084 9552 mdash mdash 24 1916 24 2532 Nex 845 CL mdash 36 24 4967 35 2166 5030 29 40 30 7946 40 1788 9555 mdash mdash mdash mdash 32 1713 32-75 33 38 29 2771 25 1712 45H21 30 40 25 3341 31 1572 45P70 35 40 mdash mdash 34 1555 NX4-104 RR mdash mdash 26 3486 37 1467 46P50 33 46 26 989 36 1381 93H01RR mdash mdash 23 753 40 1377 9550 21 37 mdash mdash 39 1372 45H29 mdash mdash mdash mdash 36 1179 45S51 mdash mdash mdash mdash 38 1115 v2030 mdash mdash 22 1653 30 929 72-35 RR mdash mdash 26 899 34 916 1818 26 40 28 648 27 889 6040 RR mdash mdash mdash mdash 36 848 73-55 RR mdash mdash mdash mdash 34 671 v1040 mdash mdash mdash mdash 23 645 Weighted Average Dryland Canola yield (Bu) amp total acressect 39 319693
2011 yield AlBeRTA 35
dagger Yields only for those varieties grown by 5 or more producers Dagger On system as of January 19 2011sect Weighted Average Yield and Total Acreage include acres not reported in the table
BARLEY DRYLAND YIELDS BY VARIETY 2007ndash2010dagger RISK AREA 8 2007 2008 2009 2009 2010 2010Dagger Variety Yield Yield Yield Acres Yield Acres AC Metcalfe 54 81 51 94977 68 86933 Xena 61 83 51 45644 75 44358 CDC Copeland 53 84 49 31899 71 32830 CDC Cowboy mdash 60 42 11802 70 15289 CDC Kendall 53 82 50 8733 68 7328 Sundre mdash 80 48 2511 62 4408 Ponoka 62 78 52 5527 71 4337 CDC Coalition mdash mdash 61 941 71 3103 Newdale 66 81 57 2161 64 3040 Conlon 58 77 48 8788 59 2967 Trochu 50 70 53 1307 63 2113 CDC Helgason 52 72 44 1749 48 1985 CDC Dolly 54 73 35 3025 61 1835 Champion mdash mdash 55 847 77 1791 CDC Meredith mdash mdash mdash mdash 84 1536 Seebe 50 71 60 1879 54 1143 AC Lacombe 59 84 mdash mdash 63 848 Stander 63 74 47 1829 55 406 Weighted Average Dryland Barley yield (Bu) amp total acressect 69 224742
FIELD PEA DRYLAND YIELDS BY VARIETY 2007ndash2010dagger RISK AREA 8 2007 2008 2009 2009 2010 2010Dagger Variety Yield Yield Yield Acres Yield Acres CDC Meadow mdash mdash 27 5344 51 16376 SW Midas 42 48 26 11782 44 6204 Eclipse 46 48 24 7434 45 4902 Cooper mdash mdash 35 2636 42 2951 Canstar mdash 41 32 2792 36 2727 Thunderbird mdash mdash mdash mdash 49 2479 CDC Golden mdash 52 25 2333 36 2396 Polstead mdash 49 mdash mdash 37 2183 DS-Admiral 35 45 22 3210 43 1405 SW Circus 33 43 26 1766 39 1326 Weighted Average Dryland Field Pea yield (Bu) amp total acressect 45 46782
OATS DRYLAND YIELDS BY VARIETY 2007ndash2010dagger RISK AREA 8 2007 2008 2009 2009 2010 2010Dagger Variety Yield Yield Yield Acres Yield Acres AC Morgan 89 86 51 3041 94 3077 AC Mustang 61 72 56 1879 108 2540 CDC Baler 58 mdash 41 736 87 1498 Cascade 48 73 mdash mdash 88 527 Derby 68 70 43 371 106 416 Weighted Average Dryland Oats yield (Bu) amp total acressect 93 9646
FLAX DRYLAND YIELDS BY VARIETY 2007ndash2010dagger RISK AREA 8 2007 2008 2009 2009 2010 2010Dagger Variety Yield Yield Yield Acres Yield Acres CDC Bethune mdash 35 24 1374 33 1366 Weighted Average Dryland Flax yield (Bu) amp total acressect 31 1736
CANARY SEED DRYLAND YIELDS BY VARIETY 2007ndash2010dagger RISK AREA 8 2007 2008 2009 2009 2010 2010Dagger Variety Yield Yield Yield Acres Yield Acres Keet mdash mdash mdash mdash 1531 1041 Weighted Average Dryland Canary Seed yield (Lbs) amp total acressect 1531 1041
RISK AREA 9
WHEAT DRYLAND YIELDS BY VARIETY 2007ndash2010dagger RISK AREA 9 2007 2008 2009 2009 2010 2010Dagger Variety Yield Yield Yield Acres Yield Acres Lillian (HRS) 28 32 17 72887 38 76030 AC Eatonia (HRS) 27 28 23 62626 31 66786 Harvest (HRS) 34 38 23 59669 36 56671 Strongfield (D) 34 36 30 31240 42 23563 AC Barrie (HRS) 28 31 21 16701 32 14466 Superb (HRS) 30 36 22 13063 32 11856 AC Cadillac (HRS) 27 28 12 13442 30 10371 AC Andrew (SWS) 51 52 29 7107 51 8620 Prodigy (HRS) 28 36 17 9995 33 7758 CDC Go (HRS) mdash 48 28 5264 40 6603 AC Avonlea (D) 30 36 34 14402 33 6033 CDC Abound (HRS) mdash mdash 30 2482 43 6023 AC Elsa (HRS) 28 34 21 9654 34 5994 Infinity (HRS) 38 43 35 3348 46 4982
WHEAT DRYLAND YIELDS BY VARIETY 2007ndash2010dagger RISK AREA 9 2007 2008 2009 2009 2010 2010Dagger Variety Yield Yield Yield Acres Yield Acres McKenzie (HRS) 28 35 28 4284 37 4118 AC Crystal (CPS) 43 42 24 3510 46 3976 CDC Imagine (HRS) 35 38 27 4484 38 3791 Columbus (HRS) 26 27 12 3383 31 2947 Radiant (HRW) 30 44 22 8871 41 2208 Kyle (D) 24 27 23 4541 28 1770 Weighted Average Dryland Wheat yield (Bu) amp total acressect 36 342701
CANOLA DRYLAND YIELDS BY VARIETY 2007ndash2010dagger RISK AREA 9 2007 2008 2009 2009 2010 2010Dagger Variety Yield Yield Yield Acres Yield Acres 71-45RR 21 26 16 18947 29 26129 5440 mdash 32 21 11463 37 14862 45H26 mdash 33 21 4354 30 9444 45H28 mdash mdash 22 2799 30 6444 34-65 15 23 6 4789 24 6102 8440 mdash 29 20 4809 37 4479 9553 mdash mdash 24 6273 36 3735 5030 27 31 24 6687 31 3718 9590 31 35 31 4381 41 3453 5020 27 33 16 6312 36 2769 5770 mdash mdash mdash mdash 43 2714 Nex 845 CL mdash 29 20 1666 30 2627 1818 21 27 14 4444 21 2171 8571 mdash mdash mdash mdash 14 2049 9552 mdash mdash 24 760 26 1927 1651H mdash 21 mdash mdash 23 1842 46P50 21 29 18 1908 40 1719 9551 15 21 12 1893 34 1568 D3151 mdash mdash mdash mdash 33 1078 Rugby mdash mdash 12 905 34 910 72-65 RR mdash mdash mdash mdash 34 850 Weighted Average Dryland Canola yield (Bu) amp total acressect 31 131376
BARLEY DRYLAND YIELDS BY VARIETY 2007ndash2010dagger RISK AREA 9 2007 2008 2009 2009 2010 2010Dagger Variety Yield Yield Yield Acres Yield Acres Xena 44 56 36 24186 56 26647 AC Metcalfe 39 48 34 24992 48 20716 CDC Cowboy mdash 51 14 9496 47 16044 Conlon 33 58 32 5639 53 7681 McLeod mdash 59 32 4321 51 5924 Seebe 29 29 21 3552 42 4578 CDC Dolly 39 35 20 2761 47 2588 CDC Copeland 44 51 31 3785 40 2218 Ponoka 40 43 25 4342 66 2213 Bridge 28 34 22 2188 28 1993 Champion mdash mdash mdash mdash 68 1822 Weighted Average Dryland Barley yield (Bu) amp total acressect 50 99351
FIELD PEA DRYLAND YIELDS BY VARIETY 2007ndash2010dagger RISK AREA 9 2007 2008 2009 2009 2010 2010Dagger Variety Yield Yield Yield Acres Yield Acres CDC Golden 28 34 6 8404 34 9528 Eclipse 25 30 11 7625 16 4648 CDC Meadow mdash mdash 26 1062 35 3184 SW Midas mdash 32 15 4142 24 2356 Delta 29 31 6 4692 32 2081 DS-Admiral 31 44 22 4979 26 1702 Weighted Average Dryland Field Pea yield (Bu) amp total acressect 31 32039
OATS DRYLAND YIELDS BY VARIETY 2007ndash2010dagger RISK AREA 9 2007 2008 2009 2009 2010 2010Dagger Variety Yield Yield Yield Acres Yield Acres Derby 35 36 28 5499 70 4624 Calibre 39 45 23 5550 63 3585 AC Mustang 20 46 26 3163 73 2213 AC Morgan 43 48 25 2217 76 2186 Waldern 34 49 17 1681 78 1753 Weighted Average Dryland Oats yield (Bu) amp total acressect 69 18313
MUSTARD DRYLAND YIELDS BY VARIETY 2007ndash2010dagger RISK AREA 9 2007 2008 2009 2009 2010 2010Dagger Variety Yield Yield Yield Acres Yield Acres AC Pennant (Yellow) 10 12 mdash mdash 17 2345 Weighted Average Dryland Mustard yield (Bu) amp total acressect 17 9757
36 yield AlBeRTA 2011
dagger Yields only for those varieties grown by 5 or more producers Dagger On system as of January 19 2011sect Weighted Average Yield and Total Acreage include acres not reported in the table
LENTIL DRYLAND YIELDS BY VARIETY 2007ndash2010dagger RISK AREA 9 2007 2008 2009 2009 2010 2010Dagger Variety Yield Yield Yield Acres Yield Acres CDC Maxim mdash mdash mdash mdash 1704 1599 Weighted Average Dryland Lentil yield (Lbs) amp total acressect 1523 7581
RISK AREA 10
WHEAT DRYLAND YIELDS BY VARIETY 2007ndash2010dagger RISK AREA 10 2007 2008 2009 2009 2010 2010Dagger Variety Yield Yield Yield Acres Yield Acres AC Foremost (CPS) 81 83 57 24156 65 21770 Superb (HRS) 59 63 55 4107 64 3254 AC Crystal (CPS) 68 67 62 2031 57 2095 5700 PR (CPS) 58 82 61 1389 67 1211 5701 PR (CPS) mdash 68 48 1900 57 882 CDC Imagine (HRS) mdash 56 mdash mdash 27 870 Harvest (HRS) 39 mdash mdash mdash 58 718 Weighted Average Dryland Wheat yield (Bu) amp total acressect 62 35639
CANOLA DRYLAND YIELDS BY VARIETY 2007ndash2010dagger RISK AREA 10 2007 2008 2009 2009 2010 2010Dagger Variety Yield Yield Yield Acres Yield Acres 5440 mdash 56 46 16945 46 21964 9553 mdash mdash 42 5974 44 7820 5020 39 48 36 8721 44 7641 72-55 RR mdash mdash 45 3161 44 4384 71-45RR 38 48 34 2998 35 3724 9590 28 50 36 718 45 2480 45S51 mdash mdash mdash mdash 38 2426 8440 mdash mdash 39 1787 35 1949 45H28 mdash mdash 32 3425 52 1440 4414 RR mdash mdash mdash mdash 38 1399 1818 34 38 27 1009 33 1369 D3150 mdash mdash 49 973 51 962 45H26 mdash 46 39 2037 41 900 9350 mdash mdash mdash mdash 49 788 997 RR mdash mdash 25 542 30 743 72-35 RR mdash mdash mdash mdash 42 698 Weighted Average Dryland Canola yield (Bu) amp total acressect 43 76042
BARLEY DRYLAND YIELDS BY VARIETY 2007ndash2010dagger RISK AREA 10 2007 2008 2009 2009 2010 2010Dagger Variety Yield Yield Yield Acres Yield Acres Ponoka 71 77 67 8935 71 7941 Seebe 56 60 56 8316 61 6395 Xena 73 89 87 3888 85 5201 Sundre mdash 83 69 2746 63 4696 AC Metcalfe 65 76 75 1642 76 2854 Vivar mdash 66 65 607 74 821 Stander 50 66 mdash mdash 73 715 Weighted Average Dryland Barley yield (Bu) amp total acressect 69 35998
FIELD PEA DRYLAND YIELDS BY VARIETY 2007ndash2010dagger RISK AREA 10 2007 2008 2009 2009 2010 2010Dagger Variety Yield Yield Yield Acres Yield Acres CDC Meadow mdash mdash mdash mdash 53 1729 Cooper mdash mdash mdash mdash 59 1665 Canstar mdash mdash mdash mdash 40 1304 Polstead mdash mdash 58 1073 55 929 Weighted Average Dryland Field Pea yield (Bu) amp total acressect 50 7331
OATS DRYLAND YIELDS BY VARIETY 2007ndash2010dagger RISK AREA 10 2007 2008 2009 2009 2010 2010Dagger Variety Yield Yield Yield Acres Yield Acres AC Morgan 90 87 78 4180 100 5548 AC Mustang 56 81 99 1113 90 2854 Derby 71 72 64 1397 80 1279 Cascade 57 74 58 1071 70 625 Grizzly mdash mdash mdash mdash 74 436 Weighted Average Dryland Oats yield (Bu) amp total acressect 90 12473
RISK AREA 11
WHEAT DRYLAND YIELDS BY VARIETY 2007ndash2010dagger RISK AREA 11 2007 2008 2009 2009 2010 2010Dagger Variety Yield Yield Yield Acres Yield Acres Harvest (HRS) 57 64 48 77597 59 88829 AC Foremost (CPS) 67 75 46 63314 72 46510 Superb (HRS) 59 62 40 28660 61 27390
WHEAT DRYLAND YIELDS BY VARIETY 2007ndash2010dagger RISK AREA 11 2007 2008 2009 2009 2010 2010Dagger Variety Yield Yield Yield Acres Yield Acres CDC Go (HRS) mdash 69 45 9344 57 14844 5700 PR (CPS) 68 75 50 25748 66 14409 Snowbird (HRS) 59 62 48 6741 60 12548 CDC Imagine (HRS) 55 61 37 7900 56 8197 CDC Abound (HRS) mdash mdash 41 1802 58 7922 AC Intrepid (HRS) 56 65 45 7664 58 6853 AC Crystal (CPS) 55 65 46 8703 64 6718 Kane (HRS) mdash mdash 48 891 64 4558 5701 PR (CPS) 63 70 47 5390 75 3109 CDC Teal (HRS) 56 61 42 3766 47 2863 5702 PR (CPS) mdash mdash mdash mdash 78 2631 Prodigy (HRS) 50 62 43 3212 55 2445 Infinity (HRS) 53 57 39 3999 54 2088 AC Barrie (HRS) 48 52 29 2803 49 1836 WR 859 CL (HRS) mdash mdash mdash mdash 63 1725 Alvena (HRS) mdash mdash 44 1691 64 1656 AC Majestic (HRS) 55 51 34 2709 52 1322 Radiant (HRW) 63 61 45 3930 69 1290 5602 HR (HRS) 48 52 37 1938 48 1219 Roblin (HRS) 53 53 24 1524 49 1145 McKenzie (HRS) 43 52 26 1318 46 1104 Weighted Average Dryland Wheat yield (Bu) amp total acressect 62 268800
CANOLA DRYLAND YIELDS BY VARIETY 2007ndash2010dagger RISK AREA 11 2007 2008 2009 2009 2010 2010Dagger Variety Yield Yield Yield Acres Yield Acres 5440 mdash 51 36 50826 51 62157 5020 41 50 35 63630 50 53358 8440 mdash 52 35 33780 52 30364 72-55 RR mdash mdash 28 14745 43 23205 71-45RR 41 46 30 28440 40 20680 45H29 mdash mdash 21 265 51 18383 9553 mdash mdash 33 17605 49 17071 1818 34 45 24 12390 40 14890 45H28 mdash mdash 27 14701 43 11540 5770 mdash mdash mdash mdash 53 9921 73-67 RR mdash mdash mdash mdash 47 8099 72-65 RR mdash mdash mdash mdash 46 7665 9590 47 53 36 8778 53 7060 34-65 38 43 26 7465 43 5898 73-77 RR mdash mdash mdash mdash 47 5498 4414 RR 41 47 20 4543 40 5386 45S51 mdash mdash 33 2658 41 4449 45H26 43 49 28 13647 39 3708 9558C mdash mdash mdash mdash 50 3652 1950 mdash mdash mdash mdash 46 2519 v1037 mdash mdash 28 1824 39 1722 45H21 35 46 22 2789 40 1511 45H73 mdash mdash mdash mdash 43 1413 1852 H mdash 44 25 724 38 1377 32-75 35 38 16 1426 39 1361 73-55 RR mdash mdash mdash mdash 41 1313 45A51 mdash mdash mdash mdash 46 1228 1841 39 45 23 2191 39 1185 9552 mdash mdash mdash mdash 42 1139 997 RR mdash 39 23 3678 43 1124 34-55 36 42 26 4772 40 1114 Prairie 719RR 33 38 22 4647 33 1058 73-65 RR mdash mdash mdash mdash 47 1056 5030 45 52 35 5745 42 1010 1956 mdash mdash mdash mdash 34 1001 9551 37 38 30 1293 37 832 9555 mdash mdash mdash mdash 44 810 9550 33 42 31 842 39 732 93H01RR mdash 46 23 1047 40 553 Weighted Average Dryland Canola yield (Bu) amp total acressect 47 354621
BARLEY DRYLAND YIELDS BY VARIETY 2007ndash2010dagger RISK AREA 11 2007 2008 2009 2009 2010 2010Dagger Variety Yield Yield Yield Acres Yield Acres Xena 70 86 63 47157 82 44286 AC Metcalfe 62 79 63 30399 72 28941 Seebe 61 72 50 27132 69 27440 Ponoka 69 80 62 19177 72 15566 CDC Copeland 82 90 63 12398 85 12595 Sundre mdash 79 70 5561 73 9746 CDC Coalition mdash mdash 66 1673 78 7066 CDC Kendall 64 74 56 9361 86 6415 Vivar 75 88 61 4794 83 4998 CDC Cowboy mdash 67 27 3360 73 4615
2011 yield AlBeRTA 37
dagger Yields only for those varieties grown by 5 or more producers Dagger On system as of January 19 2011sect Weighted Average Yield and Total Acreage include acres not reported in the table
BARLEY DRYLAND YIELDS BY VARIETY 2007ndash2010dagger RISK AREA 11 2007 2008 2009 2009 2010 2010Dagger Variety Yield Yield Yield Acres Yield Acres Champion mdash mdash mdash mdash 80 3483 CDC PolarStar mdash mdash mdash mdash 84 3172 Stander 66 82 69 4976 76 2978 CDC Thompson 72 91 65 3212 85 2795 Newdale mdash mdash mdash mdash 42 2253 CDC Select 60 86 69 1581 82 2012 Conlon 67 78 41 7551 103 1746 Legacy (BT 950) mdash 91 77 977 47 1740 McLeod 64 89 69 1982 86 1646 CDC Dolly 62 66 57 1106 65 1582 CDC Bold 67 81 60 4748 69 1578 AC Lacombe 60 69 63 1231 65 697 Stockford mdash mdash mdash mdash 71 672 CDC Helgason 62 77 61 596 64 661 Excel 58 mdash 55 535 43 482 Weighted Average Dryland Barley yield (Bu) amp total acressect 76 196872
FIELD PEA DRYLAND YIELDS BY VARIETY 2007ndash2010dagger RISK AREA 11 2007 2008 2009 2009 2010 2010Dagger Variety Yield Yield Yield Acres Yield Acres Cooper 50 53 43 7180 42 8670 Thunderbird mdash mdash 48 1792 43 7192 SW Midas mdash 57 47 4189 55 3146 Polstead mdash 45 44 1106 50 2567 CDC Meadow mdash mdash 43 1314 43 2347 CDC Golden mdash mdash mdash mdash 34 2241 Canstar mdash mdash 45 906 51 2071 Nitouche 48 51 31 2134 49 1171 CDC Striker mdash mdash mdash mdash 68 753 CDC Patrick mdash mdash mdash mdash 36 580 Weighted Average Dryland Field Pea yield (Bu) amp total acressect 45 36572
OATS DRYLAND YIELDS BY VARIETY 2007ndash2010dagger RISK AREA 11 2007 2008 2009 2009 2010 2010Dagger Variety Yield Yield Yield Acres Yield Acres AC Morgan 109 100 60 10341 125 15324 Derby 97 93 52 6173 107 6730 AC Mustang 87 92 68 2391 109 2917 CDC Baler mdash mdash mdash mdash 68 478 Cascade 81 67 30 525 80 428 Murphy mdash mdash mdash mdash 60 391 Jordan mdash mdash mdash mdash 79 198 Weighted Average Dryland Oats yield (Bu) amp total acressect 114 28615
FABA BEAN DRYLAND YIELDS BY VARIETY 2007ndash2010dagger RISK AREA 11 2007 2008 2009 2009 2010 2010Dagger Variety Yield Yield Yield Acres Yield Acres Snowbird mdash 2987 2032 1936 2641 1575 Weighted Average Dryland Faba Bean yield (Lbs) amp total acressect 2651 1595
RISK AREA 12
WHEAT DRYLAND YIELDS BY VARIETY 2007ndash2010dagger RISK AREA 12 2007 2008 2009 2009 2010 2010Dagger Variety Yield Yield Yield Acres Yield Acres Harvest (HRS) 38 50 35 263481 49 267951 Superb (HRS) 39 50 36 72095 47 58686 CDC Abound (HRS) mdash mdash 37 8977 47 32406 AC Barrie (HRS) 34 39 31 29946 43 23464 CDC Imagine (HRS) 37 46 34 28766 46 18763 Prodigy (HRS) 33 39 32 15134 46 14451 CDC Go (HRS) mdash 65 36 10301 51 13487 AC Crystal (CPS) 43 50 42 11605 53 9793 Infinity (HRS) 44 49 37 17632 45 9342 AC Splendor (HRS) 32 42 27 9959 46 8634 Lillian (HRS) 37 44 35 12200 49 8465 5602 HR (HRS) 40 38 29 15149 45 7997 CDC Alsask (HRS) mdash mdash 40 1928 44 7508 Alvena (HRS) mdash mdash mdash mdash 45 6548 AC Foremost (CPS) 56 71 47 9070 60 5994 AC Intrepid (HRS) 40 55 36 9797 49 5155 AC Cadillac (HRS) 31 37 30 3926 36 4168 5701 PR (CPS) 49 52 32 4022 62 3692 Radiant (HRW) 62 56 23 5953 51 3666 Lovitt (HRS) 33 mdash mdash mdash 45 3499 McKenzie (HRS) 33 43 35 5910 48 3167
WHEAT DRYLAND YIELDS BY VARIETY 2007ndash2010dagger RISK AREA 12 2007 2008 2009 2009 2010 2010Dagger Variety Yield Yield Yield Acres Yield Acres Kane (HRS) mdash mdash 34 1468 48 2917 Unity (HRS) mdash mdash mdash mdash 55 2823 CDC Bounty (HRS) 31 41 30 3108 38 2594 5700 PR (CPS) 39 60 47 5701 61 2568 Snowbird (HRS) 37 52 37 1405 55 2250 Park (HRS) 38 37 mdash mdash 40 2103 CDC Teal (HRS) 33 41 29 3972 46 1858 CDC Osprey (HRW) mdash 56 17 2229 56 1771 AC Majestic (HRS) mdash mdash mdash mdash 43 1627 Roblin (HRS) 29 29 16 2514 36 1539 Weighted Average Dryland Wheat yield (Bu) amp total acressect 48 550692
CANOLA DRYLAND YIELDS BY VARIETY 2007ndash2010dagger RISK AREA 12 2007 2008 2009 2009 2010 2010Dagger Variety Yield Yield Yield Acres Yield Acres 5440 mdash 45 25 55116 47 79946 5020 31 41 24 81630 40 68701 8440 mdash 46 28 28396 47 33850 9553 mdash mdash 25 17477 41 26747 71-45RR 30 39 23 33356 39 25869 9590 33 40 23 21217 44 25869 72-65 RR mdash mdash 22 2470 42 19283 34-65 30 37 17 17822 35 14334 72-55 RR mdash mdash 21 18345 40 12521 46P50 31 40 24 17064 38 11455 45H26 mdash 40 23 11035 40 9537 5770 mdash mdash mdash mdash 51 8380 1818 29 38 19 5206 34 7706 46A76 24 28 21 3241 29 7063 D3150 mdash mdash 19 2054 31 6820 45S51 mdash mdash 32 623 41 6629 45H28 mdash mdash 22 6830 44 6259 71-40 CL mdash mdash 25 3691 38 4893 45A71 17 33 13 3446 37 4766 45P70 30 32 22 6878 35 4201 5030 30 37 28 7745 47 3546 9552 mdash mdash 20 1763 31 3245 1841 36 44 21 6149 37 3188 Prairie 719RR 26 33 14 6231 32 3064 v1037 mdash mdash 26 2170 35 2874 Nex 845 CL 29 34 19 8136 32 2738 45H29 mdash mdash mdash mdash 47 2592 4414 RR 30 39 18 3308 40 2464 6130 RR mdash mdash mdash mdash 35 2426 1950 mdash mdash mdash mdash 35 2335 6040 RR mdash mdash mdash mdash 35 2273 45H73 31 36 21 2554 36 2061 NX4-104 RR mdash mdash 24 2591 33 1937 9550 21 32 14 1753 41 1761 9555 mdash mdash mdash mdash 36 1698 34-55 32 38 19 3272 41 1419 32-75 25 34 25 1192 39 1307 5525 CL mdash mdash mdash mdash 40 1214 45H21 30 37 17 3737 34 989 5505 CL mdash mdash mdash mdash 35 856 9350 mdash mdash mdash mdash 35 703 73-45 RR mdash mdash mdash mdash 55 696 72-35 RR mdash mdash mdash mdash 47 398 Weighted Average Dryland Canola yield (Bu) amp total acressect 41 455233
BARLEY DRYLAND YIELDS BY VARIETY 2007ndash2010dagger RISK AREA 12 2007 2008 2009 2009 2010 2010Dagger Variety Yield Yield Yield Acres Yield Acres Xena 53 72 56 54771 75 54064 AC Metcalfe 49 65 52 42407 71 32827 CDC Copeland 51 70 44 25950 77 26256 CDC Cowboy mdash 53 31 13118 68 22516 Seebe 40 50 29 9744 47 8394 CDC Coalition mdash mdash 63 2635 83 5986 Champion mdash mdash mdash mdash 75 5673 CDC Kendall 47 67 44 8844 67 4339 Ponoka 56 55 34 3052 59 2649 Newdale 61 91 58 1876 80 1870 CDC Dolly 43 60 14 1714 57 1375 Conlon 61 71 46 4178 63 1026 Sundre mdash mdash mdash mdash 69 1004 Bentley mdash mdash mdash mdash 83 611 Weighted Average Dryland Barley yield (Bu) amp total acressect 72 176655
38 yield AlBeRTA 2011
dagger Yields only for those varieties grown by 5 or more producers Dagger On system as of January 19 2011sect Weighted Average Yield and Total Acreage include acres not reported in the table
FIELD PEA DRYLAND YIELDS BY VARIETY 2007ndash2010dagger RISK AREA 12 2007 2008 2009 2009 2010 2010Dagger Variety Yield Yield Yield Acres Yield Acres Cooper 42 51 34 17870 35 19289 CDC Meadow mdash mdash 21 1080 34 7552 SW Midas 30 46 26 7221 37 7136 CDC Golden 28 41 22 12107 40 7071 DS-Admiral 32 44 23 8751 31 5169 Eclipse 34 43 26 8194 35 4079 Polstead mdash mdash 31 2111 40 3509 Thunderbird mdash mdash 34 1532 40 3357 SW Capri 37 48 26 4455 45 2128 Sorento mdash mdash mdash mdash 52 1746 CDC Patrick mdash mdash mdash mdash 41 1716 Stratus 34 39 32 1002 25 1360 CDC Sage mdash mdash mdash mdash 40 881 Weighted Average Dryland Field Pea yield (Bu) amp total acressect 36 78464
OATS DRYLAND YIELDS BY VARIETY 2007ndash2010dagger RISK AREA 12 2007 2008 2009 2009 2010 2010Dagger Variety Yield Yield Yield Acres Yield Acres AC Morgan 62 63 44 2875 117 4376 Derby 40 64 31 5641 78 3916 AC Mustang 52 52 36 2804 64 2719 CDC Baler 42 55 39 2469 89 1929 7600M mdash 87 48 884 75 1743 Waldern 63 85 29 1483 68 1179 Calibre 45 60 44 843 99 686 Foothill mdash mdash mdash mdash 75 538 Cascade 33 59 19 589 61 431 Grizzly 37 43 32 634 59 348 Weighted Average Dryland Oats yield (Bu) amp total acressect 85 19985
LENTIL DRYLAND YIELDS BY VARIETY 2007ndash2010dagger RISK AREA 12 2007 2008 2009 2009 2010 2010Dagger Variety Yield Yield Yield Acres Yield Acres CDC Maxim mdash mdash mdash mdash 823 1214 Weighted Average Dryland Lentil yield (Lbs) amp total acressect 828 2392
RISK AREA 13
WHEAT DRYLAND YIELDS BY VARIETY 2007ndash2010dagger RISK AREA 13 2007 2008 2009 2009 2010 2010Dagger Variety Yield Yield Yield Acres Yield Acres Harvest (HRS) 41 50 44 274405 52 275980 Superb (HRS) 39 48 41 49446 49 38648 Prodigy (HRS) 34 42 35 35197 46 24624 5700 PR (CPS) 50 60 50 25598 57 23219 AC Splendor (HRS) 35 42 39 21916 46 18280 CDC Go (HRS) mdash 54 45 7138 56 14835 CDC Imagine (HRS) 33 47 42 14299 51 12928 AC Crystal (CPS) 45 55 48 17658 58 12557 CDC Abound (HRS) mdash mdash 42 3357 53 11924 AC Barrie (HRS) 34 40 35 13402 46 11498 CDC Alsask (HRS) mdash mdash 37 5454 56 11405 McKenzie (HRS) 38 48 42 13377 46 8894 Kane (HRS) mdash mdash 42 1912 50 8144 AC Intrepid (HRS) 41 50 42 7087 53 6702 5701 PR (CPS) 50 55 49 4756 57 6134 Infinity (HRS) 34 45 41 9238 56 5973 CDC Teal (HRS) 37 44 36 5970 51 5227 AC Foremost (CPS) 52 68 52 7883 67 4575 AC Taber (CPS) 52 56 61 3887 72 3494 Snowbird (HRS) 38 45 44 3557 51 3471 AC Domain (HRS) mdash mdash mdash mdash 49 3310 Laura (HRS) 31 36 35 3223 37 2640 Alvena (HRS) mdash mdash 48 863 50 2205 Journey (HRS) 41 40 46 2991 41 2047 5602 HR (HRS) 42 42 38 2360 48 1968 AC Elsa (HRS) 35 34 mdash mdash 51 1736 Roblin (HRS) 35 39 35 3273 36 1645 Katepwa (HRS) 31 34 31 3220 40 1526 Radiant (HRW) mdash 49 41 2770 53 1384 Unity (HRS) mdash mdash mdash mdash 51 1119 CDC Bounty (HRS) 38 mdash mdash mdash 50 1087 Weighted Average Dryland Wheat yield (Bu) amp total acressect 51 538528
CANOLA DRYLAND YIELDS BY VARIETY 2007ndash2010dagger RISK AREA 13 2007 2008 2009 2009 2010 2010Dagger Variety Yield Yield Yield Acres Yield Acres 5020 33 42 27 95077 43 74271 5440 mdash 44 31 78292 48 71780 9590 35 45 33 48788 48 63694
CANOLA DRYLAND YIELDS BY VARIETY 2007ndash2010dagger RISK AREA 13 2007 2008 2009 2009 2010 2010Dagger Variety Yield Yield Yield Acres Yield Acres 9553 mdash mdash 25 36455 45 50803 8440 mdash 43 31 28741 48 41520 72-55 RR mdash 48 28 24855 43 35154 72-65 RR mdash mdash 35 1335 45 31225 45H28 mdash 41 26 17752 42 21955 45H26 35 40 27 20108 43 18031 34-65 29 36 22 17897 38 17653 71-45RR 33 39 29 29373 42 15505 9552 mdash mdash 17 10029 37 14937 46P50 33 40 25 21083 43 14252 5030 34 41 32 11403 46 9121 1818 27 34 20 7506 37 8127 45H73 mdash 40 22 5734 45 7174 5770 mdash mdash mdash mdash 53 6856 45P70 34 42 32 5312 40 6682 SP DesirableRR 28 38 26 7279 37 5765 45H29 mdash mdash mdash mdash 65 5080 4414 RR 33 36 21 3412 39 4373 46A76 26 33 22 7005 34 4371 45H21 30 38 21 7276 38 4102 1768S mdash 36 29 1806 39 4027 v1037 mdash mdash 20 1875 38 3881 9550 28 33 29 3895 38 3520 9551 26 29 17 10595 33 3465 9555 mdash mdash mdash mdash 41 3269 D3150 mdash mdash 30 1694 44 2790 1950 mdash mdash mdash mdash 46 2564 73-55 RR mdash mdash mdash mdash 48 2555 9350 mdash mdash mdash mdash 38 2478 997 RR mdash 37 18 4185 30 2435 SP Banner 25 33 26 3671 40 2299 Prairie 719RR 27 30 20 5000 31 2165 Rugby mdash 36 9 1489 33 1899 5525 CL mdash mdash mdash mdash 39 1688 1141 mdash 39 23 3380 45 1442 1145 mdash mdash mdash mdash 49 1359 71-40 CL mdash mdash 23 1775 33 1273 45S51 mdash mdash 27 2928 42 1065 D3151 mdash mdash mdash mdash 42 995 6130 RR mdash mdash mdash mdash 33 901 6040 RR mdash mdash mdash mdash 33 786 72-35 RR mdash mdash mdash mdash 41 762 34-55 31 36 22 2454 40 545 Weighted Average Dryland Canola yield (Bu) amp total acressect 44 603036
BARLEY DRYLAND YIELDS BY VARIETY 2007ndash2010dagger RISK AREA 13 2007 2008 2009 2009 2010 2010Dagger Variety Yield Yield Yield Acres Yield Acres Xena 56 74 62 67051 75 61541 AC Metcalfe 52 67 59 61918 66 49976 CDC Cowboy mdash 59 42 14157 63 19724 CDC Copeland 55 72 63 22076 76 17888 Champion mdash mdash 75 939 83 11295 Seebe 48 58 44 8363 61 5663 CDC Dolly 44 56 44 6575 54 4402 CDCTrey 51 69 60 3086 78 4361 Sundre mdash mdash 44 1785 68 2826 CDC Kendall 50 67 54 5478 64 2728 Ponoka 51 54 42 3728 58 2444 Trochu 65 78 62 1749 81 2417 Conlon 53 65 50 2012 49 1420 CDC Bold 61 70 38 5617 56 1202 CDC Coalition mdash mdash mdash mdash 69 1104 CDC PolarStar mdash mdash mdash mdash 64 1074 AC Lacombe 38 52 43 372 36 475 Weighted Average Dryland Barley yield (Bu) amp total acressect 70 198073
FIELD PEA DRYLAND YIELDS BY VARIETY 2007ndash2010dagger RISK AREA 13 2007 2008 2009 2009 2010 2010Dagger Variety Yield Yield Yield Acres Yield Acres SW Midas 39 48 39 21107 39 22216 CDC Meadow mdash mdash 38 1773 48 10228 DS-Admiral 33 49 30 9032 40 8325 Thunderbird mdash mdash 35 2918 54 6869 Swing 34 47 35 8517 37 5340 CDC Golden mdash 48 45 2053 43 3735 Eclipse 35 43 33 4646 33 3690 Eiffel 36 44 35 3263 37 2956 Cooper 43 49 42 3234 43 2466 CDC Striker mdash mdash mdash mdash 45 2225
2011 YIELD ALBERTA 39
FIELD PEA DRYLAND YIELDS BY VARIETY 2007ndash2010dagger RISK AREA 13 2007 2008 2009 2009 2010 2010Dagger Variety Yield Yield Yield Acres Yield Acres Cutlass FP 28 42 36 1683 38 2130 Profi mdash mdash 45 1692 37 1820 Carneval 32 38 35 754 47 1613 Weighted Average Dryland Field Pea yield (Bu) amp total acressect 42 79070
OATS DRYLAND YIELDS BY VARIETY 2007ndash2010dagger RISK AREA 13 2007 2008 2009 2009 2010 2010Dagger Variety Yield Yield Yield Acres Yield Acres AC Morgan 80 95 59 11557 111 11587 Derby 63 79 51 6491 97 7281 AC Mustang 61 85 30 2164 114 1790 CDC Baler 43 84 50 1578 78 1417 Calibre 68 65 47 662 95 1266 Waldern 36 mdash 54 645 66 1006 7600M 53 mdash 48 689 73 951 Weighted Average Dryland Oats yield (Bu) amp total acressect 101 27617
RISK AREA 14
WHEAT DRYLAND YIELDS BY VARIETY 2007ndash2010dagger RISK AREA 14 2007 2008 2009 2009 2010 2010Dagger Variety Yield Yield Yield Acres Yield Acres AC Foremost (CPS) mdash 74 69 4493 76 5876 5700 PR (CPS) mdash mdash 64 1673 78 1854 Weighted Average Dryland Wheat yield (Bu) amp total acressect 70 11669
CANOLA DRYLAND YIELDS BY VARIETY 2007ndash2010dagger RISK AREA 14 2007 2008 2009 2009 2010 2010Dagger Variety Yield Yield Yield Acres Yield Acres 5440 mdash 49 47 5989 51 4806 5020 43 45 44 1032 44 3237 9553 mdash mdash 39 5459 41 2981 72-55 RR mdash mdash mdash mdash 47 1483 45H28 mdash mdash 42 761 36 879 Weighted Average Dryland Canola yield (Bu) amp total acressect 43 23002
BARLEY DRYLAND YIELDS BY VARIETY 2007ndash2010dagger RISK AREA 14 2007 2008 2009 2009 2010 2010Dagger Variety Yield Yield Yield Acres Yield Acres Ponoka 62 67 69 2301 73 3036 Sundre mdash mdash 86 1660 81 2237 Seebe 53 56 57 1656 49 1367 Xena mdash 74 89 1726 61 1231 AC Metcalfe 62 69 74 1804 81 997 Weighted Average Dryland Barley yield (Bu) amp total acressect 69 10227
OATS DRYLAND YIELDS BY VARIETY 2007ndash2010dagger RISK AREA 14 2007 2008 2009 2009 2010 2010Dagger Variety Yield Yield Yield Acres Yield Acres Derby 74 74 83 1678 86 1944 AC Morgan 105 102 68 2223 87 1933 AC Mustang 99 mdash mdash mdash 133 405 Weighted Average Dryland Oats yield (Bu) amp total acressect 89 5632
RISK AREA 15
WHEAT DRYLAND YIELDS BY VARIETY 2007ndash2010dagger RISK AREA 15 2007 2008 2009 2009 2010 2010Dagger Variety Yield Yield Yield Acres Yield Acres AC Foremost (CPS) 73 77 60 37406 74 36944 Harvest (HRS) 47 55 46 25025 51 26150 5700 PR (CPS) 61 70 52 21615 66 15044 Superb (HRS) 57 57 44 7445 56 12003 AC Crystal (CPS) 49 62 54 9651 67 11102 CDC Abound (HRS) mdash mdash 43 1061 58 6199 CDC Imagine (HRS) 41 53 52 3520 54 3203 5701 PR (CPS) 62 79 55 3069 66 2336 Infinity (HRS) mdash 63 50 659 52 2077 Roblin (HRS) 47 57 46 1624 52 1933 CDC Go (HRS) mdash mdash mdash mdash 57 1794 5702 PR (CPS) mdash mdash 48 2785 65 1787 AC Intrepid (HRS) 51 60 46 1234 50 1743
dagger Yields only for those varieties grown by 5 or more producers Dagger On system as of January 19 2011sect Weighted Average Yield and Total Acreage include acres not reported in the table
All the pArts bull All the serviceAll the time
wwwaglandcorpcom
All the pArts bull All the serviceAll the time
St paul hwy 29 amp hwy 881 south
(780) 645-4437
Vermilion4915 47th Avenue
(780) 853-5367
lloydminSterhwy 16 rr 14(780) 875-4471
complete SolutionS come Standard
Save now on utility tractors Balers amp mocoswith powerful performance exceptional reliability and advanced technology John Deere has been a trusted partner in the farming community for generations plus when your John Deere equipment comes from Agland it comes backed by superior service and support no matter the task at hand John Deere equipment and the experts at Agland will help you make the most of your land
40 yield AlBeRTA 2011
dagger Yields only for those varieties grown by 5 or more producers Dagger On system as of January 19 2011sect Weighted Average Yield and Total Acreage include acres not reported in the table
WHEAT DRYLAND YIELDS BY VARIETY 2007ndash2010dagger RISK AREA 15 2007 2008 2009 2009 2010 2010Dagger Variety Yield Yield Yield Acres Yield Acres AC Splendor (HRS) 34 mdash 38 1303 45 1620 CDC Alsask (HRS) mdash mdash mdash mdash 56 1474 Prodigy (HRS) 46 52 41 2727 54 1397 McKenzie (HRS) 42 mdash mdash mdash 59 867 Weighted Average Dryland Wheat yield (Bu) amp total acressect 62 135631
CANOLA DRYLAND YIELDS BY VARIETY 2007ndash2010dagger RISK AREA 15 2007 2008 2009 2009 2010 2010Dagger Variety Yield Yield Yield Acres Yield Acres 5020 37 47 39 41165 48 41083 5440 mdash 51 43 36604 52 34409 72-55 RR mdash mdash 37 13906 47 21522 9553 mdash 50 37 10680 46 20533 9590 39 51 40 16370 52 18874 8440 mdash 50 40 6100 54 10127 45H28 mdash mdash 35 9593 49 9597 71-45RR 37 42 32 14638 46 9413 34-65 35 41 29 9894 42 7432 1818 35 41 32 5476 44 6050 SP DesirableRR mdash 39 25 5842 41 5048 45H26 45 44 34 6964 46 4892 72-65 RR mdash mdash mdash mdash 48 4089 9550 28 35 48 1719 52 4030 72-35 RR mdash mdash mdash mdash 49 3633 5770 mdash mdash mdash mdash 49 3630 45H29 mdash mdash mdash mdash 53 3383 45S51 mdash mdash mdash mdash 49 3183 5030 37 45 36 5259 48 2877 4414 RR 33 41 20 1069 40 2337 D3151 mdash mdash mdash mdash 42 2013 D3150 mdash mdash mdash mdash 50 1829 Nex 845 CL mdash 42 28 1761 45 1585 9552 mdash mdash 25 1489 36 1576 34-55 33 38 33 1818 45 1569 9555 mdash mdash mdash mdash 40 1385 9551 29 34 11 1622 41 1154 Prairie 719RR 31 34 31 2518 42 1125 32-75 32 33 23 3213 39 1110 46P50 38 43 33 2443 50 1075 71-40 CL mdash mdash 35 780 33 994 73-55 RR mdash mdash mdash mdash 54 958 430 mdash mdash mdash mdash 37 865 997 RR mdash 39 33 1582 39 754 73-67 RR mdash mdash mdash mdash 50 709 45P70 mdash 43 34 1171 32 420 Weighted Average Dryland Canola yield (Bu) amp total acressect 48 248888
BARLEY DRYLAND YIELDS BY VARIETY 2007ndash2010dagger RISK AREA 15 2007 2008 2009 2009 2010 2010Dagger Variety Yield Yield Yield Acres Yield Acres Xena 62 75 69 23112 74 25410 AC Metcalfe 62 73 70 21029 76 20625 Seebe 57 61 53 16602 67 12677 Ponoka 60 73 64 8015 73 9322 CDC Cowboy mdash 65 54 4835 70 7732 CDC Copeland 64 74 66 5031 65 4730 CDC Coalition mdash 87 mdash mdash 85 2953 Champion mdash mdash mdash mdash 84 2488 Sundre mdash mdash 72 1101 79 2417 Vivar 74 84 60 2350 88 1985 CDC Thompson 80 91 73 1738 84 1508 Trochu mdash 95 79 2344 84 1283 Stander 67 76 60 1956 68 1058 AC Lacombe 52 69 65 1178 85 692 Weighted Average Dryland Barley yield (Bu) amp total acressect 74 100554
FIELD PEA DRYLAND YIELDS BY VARIETY 2007ndash2010dagger RISK AREA 15 2007 2008 2009 2009 2010 2010Dagger Variety Yield Yield Yield Acres Yield Acres Canstar mdash mdash 58 1967 52 3813 Cooper mdash mdash 52 1352 51 2751 CDC Meadow mdash mdash mdash mdash 62 1739 SW Midas 45 50 42 1764 41 1595 Weighted Average Dryland Field Pea yield (Bu) amp total acressect 50 17154
OATS DRYLAND YIELDS BY VARIETY 2007ndash2010dagger RISK AREA 15 2007 2008 2009 2009 2010 2010Dagger Variety Yield Yield Yield Acres Yield Acres AC Morgan 97 110 73 15310 106 18082 Derby 63 72 52 3047 76 2368 AC Mustang 64 68 52 1728 101 1470 Weighted Average Dryland Oats yield (Bu) amp total acressect 102 22811
RISK AREA 16
WHEAT DRYLAND YIELDS BY VARIETY 2007ndash2010dagger RISK AREA 16 2007 2008 2009 2009 2010 2010Dagger Variety Yield Yield Yield Acres Yield Acres AC Foremost (CPS) mdash mdash mdash mdash 89 659 Weighted Average Dryland Wheat yield (Bu) amp total acressect 69 3155
CANOLA DRYLAND YIELDS BY VARIETY 2007ndash2010dagger RISK AREA 16 2007 2008 2009 2009 2010 2010Dagger Variety Yield Yield Yield Acres Yield Acres 9553 mdash mdash mdash mdash 45 2849 5020 mdash mdash mdash mdash 41 1703 Weighted Average Dryland Canola yield (Bu) amp total acressect 42 11495
OATS DRYLAND YIELDS BY VARIETY 2007ndash2010dagger RISK AREA 16 2007 2008 2009 2009 2010 2010Dagger Variety Yield Yield Yield Acres Yield Acres Derby 68 102 mdash mdash 93 816 Weighted Average Dryland Oats yield (Bu) amp total acressect 97 1188
RISK AREA 17
WHEAT DRYLAND YIELDS BY VARIETY 2007ndash2010dagger RISK AREA 17 2007 2008 2009 2009 2010 2010Dagger Variety Yield Yield Yield Acres Yield Acres CDC Teal (HRS) 50 31 28 5458 20 7614 CDC Alsask (HRS) mdash mdash mdash mdash 32 1060 Weighted Average Dryland Wheat yield (Bu) amp total acressect 30 17904
CANOLA DRYLAND YIELDS BY VARIETY 2007ndash2010dagger RISK AREA 17 2007 2008 2009 2009 2010 2010Dagger Variety Yield Yield Yield Acres Yield Acres 5020 mdash mdash 36 5563 17 5245 45H28 mdash mdash mdash mdash 20 4970 71-45RR mdash 30 33 1535 39 3491 72-55 RR mdash mdash mdash mdash 35 1460 9553 mdash mdash 16 1356 15 1036 Weighted Average Dryland Canola yield (Bu) amp total acressect 24 27967
RISK AREA 18
WHEAT DRYLAND YIELDS BY VARIETY 2007ndash2010dagger RISK AREA 18 2007 2008 2009 2009 2010 2010Dagger Variety Yield Yield Yield Acres Yield Acres Harvest (HRS) 56 31 33 17745 37 12470 5700 PR (CPS) 62 35 44 9575 37 8004 AC Splendor (HRS) 49 19 26 5909 19 5785 AC Intrepid (HRS) 57 31 39 5735 31 5293 Superb (HRS) mdash 43 43 3277 38 4349 CDC Teal (HRS) mdash 26 31 3857 24 4315 CDC Alsask (HRS) mdash mdash mdash mdash 35 2465 Weighted Average Dryland Wheat yield (Bu) amp total acressect 33 50349
CANOLA DRYLAND YIELDS BY VARIETY 2007ndash2010dagger RISK AREA 18 2007 2008 2009 2009 2010 2010Dagger Variety Yield Yield Yield Acres Yield Acres 5020 42 24 29 17318 17 11210 71-45RR 43 25 29 10326 18 7336 72-55 RR mdash mdash mdash mdash 24 6651 45H26 mdash 28 38 6158 21 5899 430 mdash mdash 34 1421 15 5771 45H28 mdash mdash mdash mdash 20 4099 5440 mdash mdash mdash mdash 29 2927 32-75 28 23 21 1379 12 2394 43A56 36 19 25 2568 20 1679
2011 yield AlBeRTA 41
dagger Yields only for those varieties grown by 5 or more producers Dagger On system as of January 19 2011sect Weighted Average Yield and Total Acreage include acres not reported in the table
CANOLA DRYLAND YIELDS BY VARIETY 2007ndash2010dagger RISK AREA 18 2007 2008 2009 2009 2010 2010Dagger Variety Yield Yield Yield Acres Yield Acres 5525 CL mdash mdash mdash mdash 8 1412 SP DesirableRR mdash mdash 21 1265 14 1360 45S51 mdash mdash mdash mdash 18 429 Weighted Average Dryland Canola yield (Bu) amp total acressect 19 63778
BARLEY DRYLAND YIELDS BY VARIETY 2007ndash2010dagger RISK AREA 18 2007 2008 2009 2009 2010 2010Dagger Variety Yield Yield Yield Acres Yield Acres AC Metcalfe 62 36 47 6214 39 3257 Weighted Average Dryland Barley yield (Bu) amp total acressect 40 7170
FIELD PEA DRYLAND YIELDS BY VARIETY 2007ndash2010dagger RISK AREA 18 2007 2008 2009 2009 2010 2010Dagger Variety Yield Yield Yield Acres Yield Acres SW Midas mdash 26 36 2283 27 4488 CDC Meadow mdash mdash mdash mdash 40 2317 Weighted Average Dryland Field Pea yield (Bu) amp total acressect 30 8499
OATS DRYLAND YIELDS BY VARIETY 2007ndash2010dagger RISK AREA 18 2007 2008 2009 2009 2010 2010Dagger Variety Yield Yield Yield Acres Yield Acres Derby 93 39 47 939 64 4487 AC Morgan 107 37 55 4556 47 2978 AC Mustang mdash mdash 64 814 43 1110 Weighted Average Dryland Oats yield (Bu) amp total acressect 53 9202
RISK AREA 19
WHEAT DRYLAND YIELDS BY VARIETY 2007ndash2010dagger RISK AREA 19 2007 2008 2009 2009 2010 2010Dagger Variety Yield Yield Yield Acres Yield Acres Harvest (HRS) 54 46 39 93077 34 93732 Superb (HRS) 56 44 40 43243 36 38536 AC Intrepid (HRS) 54 36 34 34877 29 27871 CDC Teal (HRS) 49 39 31 29229 29 22429 Prodigy (HRS) 50 36 37 16037 35 14799 Infinity (HRS) 63 39 39 15137 27 11411 CDC Alsask (HRS) mdash mdash 32 3216 34 11072 AC Splendor (HRS) 47 35 37 11584 30 10728 Alvena (HRS) mdash mdash 32 1716 24 8305 CDC Osprey (HRW) 47 mdash 36 4008 44 7680 AC Foremost (CPS) 41 34 42 5469 32 4547 5700 PR (CPS) 62 50 36 13860 31 4272 5701 PR (CPS) mdash 50 46 6878 41 3512 AC Elsa (HRS) 50 27 32 4617 30 3292 McKenzie (HRS) 48 35 32 3215 23 3194 Radiant (HRW) mdash mdash 40 3391 45 2976 CDC Go (HRS) mdash mdash mdash mdash 31 2108 Roblin (HRS) 40 28 23 3027 24 2058 CDC Imagine (HRS) mdash 38 34 3697 36 1914 CDC Abound (HRS) mdash mdash mdash mdash 29 1728 Peace (HRS) mdash 36 32 2020 33 1607 Weighted Average Dryland Wheat yield (Bu) amp total acressect 33 283387
CANOLA DRYLAND YIELDS BY VARIETY 2007ndash2010dagger RISK AREA 19 2007 2008 2009 2009 2010 2010Dagger Variety Yield Yield Yield Acres Yield Acres 5020 38 27 31 106358 22 109870 72-55 RR mdash 24 31 16863 25 61966 71-45RR 38 26 32 67226 23 43200 45H28 mdash mdash 32 14612 26 29044 5440 mdash 32 32 31375 26 22555 8440 mdash 28 30 18317 29 19770 45H26 45 29 33 26290 25 19478 34-65 33 27 26 10671 22 17422 72-65 RR mdash mdash 29 466 22 16858 32-75 32 19 21 16489 13 16525 9553 mdash mdash 30 11992 21 15538 72-35 RR mdash mdash 30 5785 16 12238 9350 mdash mdash mdash mdash 22 10175 43H57 mdash 24 23 3838 18 8116 71-40 CL mdash mdash 24 6093 16 7983 9590 41 26 31 11659 18 7723 45S51 mdash mdash 25 976 18 6483
CANOLA DRYLAND YIELDS BY VARIETY 2007ndash2010dagger RISK AREA 19 2007 2008 2009 2009 2010 2010Dagger Variety Yield Yield Yield Acres Yield Acres 45H29 mdash mdash mdash mdash 30 5569 SP DesirableRR mdash 21 26 7686 18 5556 43A56 30 19 24 11076 14 5372 45A71 30 19 16 4171 10 5209 5770 mdash mdash mdash mdash 28 4972 9552 mdash mdash 25 1281 18 4071 45H24 37 20 25 5139 17 3855 430 mdash mdash 24 1953 18 3697 45P70 40 23 mdash mdash 23 3498 Cafe 33 10 19 4399 15 2610 45H73 mdash 30 24 2519 23 2235 73-45 RR mdash mdash mdash mdash 21 2014 4414 RR mdash 17 29 1425 15 1728 5525 CL mdash mdash mdash mdash 18 1457 45H21 34 19 27 2591 25 1445 Rugby mdash mdash 25 999 13 1345 46P50 38 32 mdash mdash 23 1181 4362 RR mdash 12 20 2819 16 1159 6040 RR mdash mdash mdash mdash 22 550 Weighted Average Dryland Canola yield (Bu) amp total acressect 22 505632
BARLEY DRYLAND YIELDS BY VARIETY 2007ndash2010dagger RISK AREA 19 2007 2008 2009 2009 2010 2010Dagger Variety Yield Yield Yield Acres Yield Acres AC Metcalfe 65 47 62 25329 42 23277 Xena 78 50 65 8593 47 9689 CDC Copeland 79 53 60 8712 44 7932 Ponoka 74 41 73 3055 57 3711 Champion mdash mdash mdash mdash 44 1984 CDC Cowboy mdash mdash 55 918 40 1937 Seebe 68 52 mdash mdash 42 1907 Sundre mdash 25 22 833 41 1602 CDC Helgason 60 mdash mdash mdash 31 942 Weighted Average Dryland Barley yield (Bu) amp total acressect 43 58931
FIELD PEA DRYLAND YIELDS BY VARIETY 2007ndash2010dagger RISK AREA 19 2007 2008 2009 2009 2010 2010Dagger Variety Yield Yield Yield Acres Yield Acres SW Midas mdash 30 36 11093 23 13330 Cutlass FP 45 33 33 9894 26 13082 Cooper mdash 17 39 3362 29 5298 CDC Meadow mdash mdash mdash mdash 30 3970 Eclipse 52 22 30 3481 20 2946 SW Parade 39 21 mdash mdash 24 1298 Garde mdash 16 mdash mdash 31 1240 Carneval 42 25 21 2517 17 1181 Weighted Average Dryland Field Pea yield (Bu) amp total acressect 25 50561
OATS DRYLAND YIELDS BY VARIETY 2007ndash2010dagger RISK AREA 19 2007 2008 2009 2009 2010 2010Dagger Variety Yield Yield Yield Acres Yield Acres Derby 102 70 77 8886 59 11483 AC Morgan 114 54 70 6502 55 8309 AC Mustang 94 mdash mdash mdash 38 566 Weighted Average Dryland Oats yield (Bu) amp total acressect 55 21581
CREEPING RED FESCUE DRYLAND YIELDS BY VARIETY 2007ndash2010dagger RISK AREA 19
2007 2008 2009 2009 2010 2010Dagger Variety Yield Yield Yield Acres Yield Acres Boreal 428 521 422 2294 244 884 Weighted Average Dryland Creeping Red Fescue yield (Lbs) amp total acressect 229 962
RISK AREA 20
WHEAT DRYLAND YIELDS BY VARIETY 2007ndash2010dagger RISK AREA 20 2007 2008 2009 2009 2010 2010Dagger Variety Yield Yield Yield Acres Yield Acres Harvest (HRS) 51 51 41 17033 37 18383 AC Intrepid (HRS) 51 54 41 9691 37 7875 CDC Teal (HRS) 48 52 42 8477 37 7731
42 yield AlBeRTA 2011
dagger Yields only for those varieties grown by 5 or more producers Dagger On system as of January 19 2011sect Weighted Average Yield and Total Acreage include acres not reported in the table
WHEAT DRYLAND YIELDS BY VARIETY 2007ndash2010dagger RISK AREA 20 2007 2008 2009 2009 2010 2010Dagger Variety Yield Yield Yield Acres Yield Acres Roblin (HRS) 51 48 40 5661 34 5345 McKenzie (HRS) mdash 44 mdash mdash 34 3849 CDC Alsask (HRS) mdash mdash mdash mdash 42 1908 Weighted Average Dryland Wheat yield (Bu) amp total acressect 40 55904
CANOLA DRYLAND YIELDS BY VARIETY 2007ndash2010dagger RISK AREA 20 2007 2008 2009 2009 2010 2010Dagger Variety Yield Yield Yield Acres Yield Acres 71-45RR 35 36 31 17186 26 18523 5020 39 36 30 15633 31 16425 8440 mdash mdash mdash mdash 37 7450 72-55 RR mdash mdash 30 5557 35 6595 32-75 29 28 21 10639 21 4937 4362 RR mdash mdash mdash mdash 15 3643 72-65 RR mdash mdash mdash mdash 23 3215 72-35 RR mdash mdash 29 4405 32 2271 34-65 mdash mdash mdash mdash 31 1106 71-40 CL mdash mdash mdash mdash 22 1056 Weighted Average Dryland Canola yield (Bu) amp total acressect 29 79284
BARLEY DRYLAND YIELDS BY VARIETY 2007ndash2010dagger RISK AREA 20 2007 2008 2009 2009 2010 2010Dagger Variety Yield Yield Yield Acres Yield Acres AC Metcalfe 60 63 69 1498 70 2807 Xena mdash mdash 55 1556 66 2113 Weighted Average Dryland Barley yield (Bu) amp total acressect 59 10207
FIELD PEA DRYLAND YIELDS BY VARIETY 2007ndash2010dagger RISK AREA 20 2007 2008 2009 2009 2010 2010Dagger Variety Yield Yield Yield Acres Yield Acres DS-Admiral 57 50 30 2298 25 3825 Cooper mdash mdash mdash mdash 49 840 Weighted Average Dryland Field Pea yield (Bu) amp total acressect 26 11605
OATS DRYLAND YIELDS BY VARIETY 2007ndash2010dagger RISK AREA 20 2007 2008 2009 2009 2010 2010Dagger Variety Yield Yield Yield Acres Yield Acres Derby 98 90 85 2280 92 3522 Weighted Average Dryland Oats yield (Bu) amp total acressect 86 4090
RISK AREA 21
WHEAT DRYLAND YIELDS BY VARIETY 2007ndash2010dagger RISK AREA 21 2007 2008 2009 2009 2010 2010Dagger Variety Yield Yield Yield Acres Yield Acres Harvest (HRS) 42 53 49 21282 39 21450 Superb (HRS) 57 64 50 14684 40 7390 CDC Go (HRS) mdash 53 54 7252 45 7263 5700 PR (CPS) 62 43 43 6403 35 6231 AC Intrepid (HRS) 54 32 37 4471 30 5069 AC Foremost (CPS) mdash 59 63 5087 39 3448 CDC Teal (HRS) 46 25 26 1802 22 1476 AC Splendor (HRS) 46 32 29 2784 22 1397 Alvena (HRS) mdash mdash mdash mdash 32 1040 Park (HRS) mdash mdash 25 684 25 505 Weighted Average Dryland Wheat yield (Bu) amp total acressect 37 63781
CANOLA DRYLAND YIELDS BY VARIETY 2007ndash2010dagger RISK AREA 21 2007 2008 2009 2009 2010 2010Dagger Variety Yield Yield Yield Acres Yield Acres 5020 43 37 30 26598 29 48390 32-75 26 13 20 16044 14 13709 72-55 RR mdash mdash 24 2213 29 8120 71-45RR 32 33 27 7870 26 5887 8440 mdash 47 40 3722 22 5716 SP DesirableRR mdash mdash 11 1560 16 5699 72-35 RR mdash mdash 13 3446 16 4953 430 mdash mdash 11 1390 22 4873 43A56 25 23 16 7659 19 3759 45H28 mdash mdash 30 5552 30 2985 45H73 mdash mdash mdash mdash 18 1906 9350 mdash mdash mdash mdash 17 1822 SW Spirit River 17 mdash mdash mdash 16 1447 Cafe mdash mdash 17 1055 4 1287 41P55 mdash mdash mdash mdash 7 752 Weighted Average Dryland Canola yield (Bu) amp total acressect 24 133560
BARLEY DRYLAND YIELDS BY VARIETY 2007ndash2010dagger RISK AREA 21 2007 2008 2009 2009 2010 2010Dagger Variety Yield Yield Yield Acres Yield Acres AC Metcalfe 59 43 50 10946 35 8540 Ponoka 78 76 50 4068 75 6520 Xena 65 45 56 5169 52 2599 Sundre mdash mdash 48 2387 38 1450 CDC Copeland 70 39 mdash mdash 36 1067 AC Albright 52 28 mdash mdash 33 896 Weighted Average Dryland Barley yield (Bu) amp total acressect 48 27696
FIELD PEA DRYLAND YIELDS BY VARIETY 2007ndash2010dagger RISK AREA 21 2007 2008 2009 2009 2010 2010Dagger Variety Yield Yield Yield Acres Yield Acres Cutlass FP mdash mdash 31 2264 27 6897 Eclipse 44 27 24 2953 15 4458 CDC Meadow mdash mdash mdash mdash 28 2069 SW Midas 39 mdash 31 1191 28 1280 Carneval mdash 20 mdash mdash 18 955 Nitouche mdash mdash mdash mdash 7 842 Weighted Average Dryland Field Pea yield (Bu) amp total acressect 21 21175
OATS DRYLAND YIELDS BY VARIETY 2007ndash2010dagger RISK AREA 21 2007 2008 2009 2009 2010 2010Dagger Variety Yield Yield Yield Acres Yield Acres AC Morgan 97 52 61 3809 77 6789 Derby 77 mdash 36 680 65 2271 AC Mustang 93 48 mdash mdash 33 600 Weighted Average Dryland Oats yield (Bu) amp total acressect 69 14618
RISK AREA 22
WHEAT DRYLAND YIELDS BY VARIETY 2007ndash2010dagger RISK AREA 22 2007 2008 2009 2009 2010 2010Dagger Variety Yield Yield Yield Acres Yield Acres Alikat (HRS) 45 54 60 6359 53 5355 AC Intrepid (HRS) mdash 46 48 4557 52 4232 CDC Teal (HRS) 33 41 38 4038 36 3429 Roblin (HRS) 41 45 46 5990 41 3132 CDC Imagine (HRS) mdash 45 41 1908 42 2513 Infinity (HRS) mdash mdash 53 2175 52 2388 Weighted Average Dryland Wheat yield (Bu) amp total acressect 47 27442
CANOLA DRYLAND YIELDS BY VARIETY 2007ndash2010dagger RISK AREA 22 2007 2008 2009 2009 2010 2010Dagger Variety Yield Yield Yield Acres Yield Acres 5020 34 39 32 29254 36 33686 32-75 30 29 28 13052 31 12283 71-45RR mdash 37 32 7156 31 7382 72-35 RR mdash mdash 33 3795 36 6567 5440 mdash mdash 35 1788 40 4218 43H57 mdash mdash 33 2646 31 2182 45H26 mdash mdash mdash mdash 33 1331 Weighted Average Dryland Canola yield (Bu) amp total acressect 35 76968
BARLEY DRYLAND YIELDS BY VARIETY 2007ndash2010dagger RISK AREA 22 2007 2008 2009 2009 2010 2010Dagger Variety Yield Yield Yield Acres Yield Acres AC Metcalfe 58 62 65 1358 68 1072 Weighted Average Dryland Barley yield (Bu) amp total acressect 67 3210
FIELD PEA DRYLAND YIELDS BY VARIETY 2007ndash2010dagger RISK AREA 22 2007 2008 2009 2009 2010 2010Dagger Variety Yield Yield Yield Acres Yield Acres DS-Admiral 45 53 46 7148 52 4824 Cutlass FP mdash mdash 41 1760 45 2455 SW Midas mdash mdash mdash mdash 32 839 Weighted Average Dryland Field Pea yield (Bu) amp total acressect 48 8535
OATS DRYLAND YIELDS BY VARIETY 2007ndash2010dagger RISK AREA 22 2007 2008 2009 2009 2010 2010Dagger Variety Yield Yield Yield Acres Yield Acres AC Morgan 129 135 116 2045 130 4377 Weighted Average Dryland Oats yield (Bu) amp total acressect 124 5393
Behold the undisputed cereal seed treatment champion With new micro-dispersion technology Raxilreg MD provides cereal growers with uniform seed coverage for superior plant protection and an increased return on your investment
Score an easy victory over true loose smut seed-and soil-bourne fusarium and knock out all the most serious early season cereal diseases ndash without the application struggle
For more information visit BayerCropSciencecaRaxil
Victory without the fight
BayerCropScienceca or 1 888-283-6847 or contact your Bayer CropScience representativeAlways read and follow label directions Raxilreg is a registered trademark of Bayer Bayer CropScience is a member of CropLife Canada
0111-15296A
15296A RaxilMD_Victory_FBCindd 1 12111 238 PM
Our high-yielding hybrids are here And theyrsquore backed by healthier agronomic performance even healthier demand from our customers plus a Healthier Profi t Guarantee More Nexera canola acres are needed now to meet the current demand for heart-healthy Omega-9 Oils So take advantage of this profi table canola opportunity Talk to your local Nexera canola crusher or retailer And contract today
Accomplish even more With Nexera canola hybrids Call our Solutions Center at 18006673852 Or visit healthierprofi tsca
NOW THE PROFIT IS REALLY FLOWING ndash WITH OUR NEW HYBRID CANOLA VARIETIES
TMTrademark of Dow AgroSciences LLC0211-15855-2
THE NEXERATM CANOLA
HYBRID EXPLOSIONHEALTHIER YIELDS
BY THE BUSHEL EVEN MORE PROFIT
BY THE BOTTLE
NEXERATM CANOLA
HYBRIDSPlanting
Now
15855-2 Yield Alberta 8125X1075indd 1 11-01-27 1034 AM
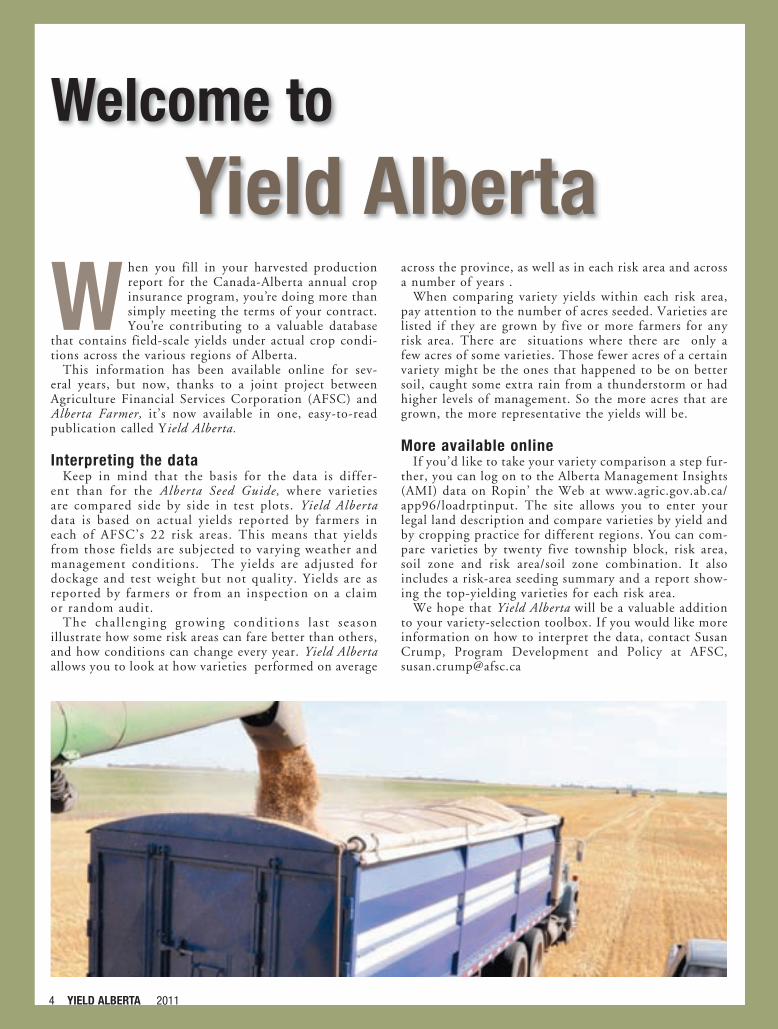

2008
2009
2010
Historical Grades Spring Wheat
0
20
40
60
80
1 CW 2 CW 3 CW 4 CW Can Fd
0
20
40
60
80
1 CW 2 CW 3 CW 4 CW Can Fd
0
20
40
60
80
1 CW 2 CW 3 CW 4 CW Can Fd
0
20
40
60
80
1 CW 2 CW 3 CW 4 CW Can Fd
2008
2009
2010
Historical Grades Canola
0
20
40
60
80
100
1 Can 2 Can 3 Can Sample
0
20
40
60
80
100
1 Can 2 Can 3 Can Sample
0
20
40
60
80
100
1 Can 2 Can 3 Can Sample
0
20
40
60
80
100
1 Can 2 Can 3 Can Sample
2008
2009
2010
Historical Grades Barley
0
20
40
60
80
Malt 1 CW 2 CW Other
0
20
40
60
80
Malt 1 CW 2 CW Other
0
20
40
60
80
Malt 1 CW 2 CW Other
0
20
40
60
80
Malt 1 CW 2 CW Other
Historical Grades Spring Wheat
Historical Grades Canola
Historical Grades Barley
Growing SeasonPrecipitation to DateApril 1 2010 to April 28 2010
Precipitation (mm)
0-1010-2030-3030-4040-5050-6060-70
70-8080-9090-100100-120120-150gt150No Data
2011 yield alberta 17
Growing SeasonPrecipitation to DateApril 1 2010 to May 30 2010
Growing SeasonPrecipitation to DateApril 1 2010 to June 27 2010
Growing SeasonPrecipitation to DateApril 1 2010 to August 29 2010
Growing SeasonPrecipitation to DateApril 1 2010 to July 28 2010
18 yield alberta 2011
Precipitation (mm)
Precipitation (mm) Precipitation (mm)
Precipitation (mm)
0-2525-5050-7575-100100-125125-150150-175
0-4040-8080-120120-160160-200200-240240-280
0-5050-100100-150150-200200-250250-300300-350
0-2525-5050-7575-100100-125125-150150-175
175-200200-225225-250250-275275-300gt 300No Data
280-320320-360360-400400-440440-480gt 480No Data
350-400400-450450-500500-550550-600gt 600No Data
175-200200-225225-250250-275275-300gt 300No Data
Growing SeasonPrecipitation to DateApril 1 2010 to September 30 2010
April 2010Average Daily MeanTemperature Relativeto Long Term NormalApril 1 2010 to April 30 2010
Spring Wheat Soil Moisture Reserves Relative to Long Term Normal to a Depth of 120 cmEstimated as of April 18 2010
Spring Wheat Soil Moisture Reserves Relative to Long Term Normal to a Depth of 120 cmEstimated as of Oct 31 2010
2011 yield alberta 19
Precipitation (mm)Condition Frequency of Occurance
0-5050-100100-150150-200200-250350-300300-350
Extremely lowvery lowlowmoderately lownear normalmoderately highhighvery highextremely high
less than 1 in 25 yearsless than 1 in 12 yearsless than 1 in 6 yearsless than 1 in 3 yearsat least 1 in 3 yearsless than 1 in 3 yearsless than 1 in 6 yearsless than 1 in 12 yearsless than 1 in 25 years
350-400400-450450-500500-550550-600gt 600No Data
ConditionCondition
Frequency of OccuranceFrequency of OccuranceExtremely low
very lowlowmoderately lownear normalmoderately highhighvery highextremely high
Extremely lowvery lowlowmoderately lownear normalmoderately highhighvery highextremely high
less than 1 in 25 yearsless than 1 in 12 yearsless than 1 in 6 yearsless than 1 in 3 yearsat least 1 in 3 yearsless than 1 in 3 yearsless than 1 in 6 yearsless than 1 in 12 yearsless than 1 in 25 years
less than 1 in 25 yearsless than 1 in 12 yearsless than 1 in 6 yearsless than 1 in 3 yearsat least 1 in 3 yearsless than 1 in 3 yearsless than 1 in 6 yearsless than 1 in 12 yearsless than 1 in 25 years
May 2010Average Daily MeanTemperature Relativeto Long Term NormalMay 1 2010 to May 31 2010
June 2010Average Daily MeanTemperature Relativeto Long Term NormalJune 1 2010 to June 30 2010
August 2010Average Daily MeanTemperature Relativeto Long Term NormalAug 1 2010 to Aug 31 2010
July 2010Average Daily MeanTemperature Relativeto Long Term NormalJuly 1 2010 to July 31 2010
20 yield alberta 2011
ConditionCondition
ConditionCondition
Frequency of OccuranceFrequency of Occurance
Frequency of OccuranceFrequency of Occurance
Extremely lowvery lowlowmoderately lownear normalmoderately highhighvery highextremely high
Extremely lowvery lowlowmoderately lownear normalmoderately highhighvery highextremely high
Extremely lowvery lowlowmoderately lownear normalmoderately highhighvery highextremely high
Extremely lowvery lowlowmoderately lownear normalmoderately highhighvery highextremely high
less than 1 in 25 yearsless than 1 in 12 yearsless than 1 in 6 yearsless than 1 in 3 yearsat least 1 in 3 yearsless than 1 in 3 yearsless than 1 in 6 yearsless than 1 in 12 yearsless than 1 in 25 years
less than 1 in 25 yearsless than 1 in 12 yearsless than 1 in 6 yearsless than 1 in 3 yearsat least 1 in 3 yearsless than 1 in 3 yearsless than 1 in 6 yearsless than 1 in 12 yearsless than 1 in 25 years
less than 1 in 25 yearsless than 1 in 12 yearsless than 1 in 6 yearsless than 1 in 3 yearsat least 1 in 3 yearsless than 1 in 3 yearsless than 1 in 6 yearsless than 1 in 12 yearsless than 1 in 25 years
less than 1 in 25 yearsless than 1 in 12 yearsless than 1 in 6 yearsless than 1 in 3 yearsat least 1 in 3 yearsless than 1 in 3 yearsless than 1 in 6 yearsless than 1 in 12 yearsless than 1 in 25 years
More wheat solutionsthan Prairie towns
1 Developed by Agriculture amp Agri-Food Canada Winnipeg 2 Developed by Agriculture amp Agri-Food Canada Swift Current 3 Developed by Agriculture amp Agri-Food Canada Lethbridge
wwwsecancom
Genes that fit your farm No matter where you farm Call your SeCan seed retailer today 800-665-7333
CWB Variety Survey 2010 lsquoACrsquo is an official mark used under license from Agriculture amp Agri-Food Canada
Ad Number SEC_WHEAT_11_M
Prod
uced
by
SeC
an
Prod
uct
Cam
paig
n N
ame
SeC
an W
heat
Dat
e Pr
oduc
ed J
anua
ry 2
011
Ad N
umbe
r SE
C_W
HEAT
_11_
MPu
blic
atio
n Y
ield
Alb
erta
Type
Liv
e 7
25rdquo
x10
rdquoTrim
-81
25rdquo
x 10
75rdquo
Ble
ed 8
625
rdquo x
112
5rdquoSEC_WHEAT11_M_YAqxd 2111 323 PM Page 1
All purchases are subject to the terms of labelling and purchase documents reg TM SM Trademarks and service marks licensed to Pioneer Hi-Bred Limited copy 2011 PHL PR1610 Yield MN Grower_G_E
With industry-leading research and seed genetics Pioneer Hi-Bred is bringing a new level of performance to western Canadian growers We were the first company to bring new traits for sclerotinia and clubroot resistance to canola And wersquore also leading with the development and introduction of early maturity locally adapted corn hybrids
Wersquore also covering a lot of ground with the service and support we deliver to our customers You can count on your local Pioneer Hi-Bred sales rep to help you build a high yielding crop Plus theyrsquore backed by one of the strongest agronomic teams in the business
Pioneer Hi-Bred Wersquore gaining new ground where it matters most ndash in your fields
Seed genetics that aregaining new ground
Ask your local Pioneer Hi-Bred sales rep for a seed recommendation for your fields
Craig SchmidtBarrhead (780) 674-4828
FDH Holdings LtdBawlf (780) 608-8491
Danny NobbsBonanza (780) 864-1289
Jill Feniak-SplaneBoyle (780) 689-3386
Gordon FrankBrooks (403) 362-7299
You1st Enterprises LtdCalgary (403) 239-4215
Herb de HoogCamrose (780) 672-2339
Hal Creek Seed Company IncClyde (780) 348-2629
AJM Seeds LtdCoalhurst (403) 308-6685
Consort Agro Services LtdConsort (403) 577-3020
Colin PellerinDebolt (780) 957-2000
Lyndon PopovitchFairview (780) 835-4356
Ron WielerFort Vermilion (780) 927-4255
David SammonsGleichen (403) 934-0940
Lorne CampbellGrimshaw (780) 618-5220
Smoky Seed Company LtdGuy (780) 837-1334
Kelsey SolickHalkirk (403) 884-2358
EampA Land and Cattle Ltd Hayter (780) 753-6666
David Moroz Killam (780) 385-5353
All In Farm Services LtdKitscoty (780) 847-2022
Next Generation Seeds LtdManning (780) 836-7771
Sandrsquos Seed Farm LtdMcLaughlin (780) 745-2251
Gateway Agra Services LtdMedicine Hat (403) 526-9499
K amp S Sharpe Farms LtdMunson (403) 823-6761
Diadem Ag EnterprisesNanton (403) 646-5839
Ellis Agriculture LtdOlds (403) 556-1258
Accur-AgPonoka (403) 588-4689
Darcy KoesterRockyford (403) 901-3560
Jason TolsmaSpruce Grove Calmar (780) 446-1082
Myron ZabolotniukSt Albert (780) 915-6920
Gerald FodchukSt Brides (780) 645-3720
Ron WirstaSt Paul (780) 645-3939
Lee Van RingenStettler (403) 741-9067
Taber Home and Farm CentreTaber (403) 223-8948
Chris and Holly DraderTangent (780) 359-2727
Bauer Six LtdTorrington (403) 994-1149
Deryk SanfordVegreville Fort Saskatchewan (780) 632-9699
Dwayne AndrashewskiVegreville Two Hills (780) 336-4808
Webbrsquos Crop ServicesVermilion (780) 853-6565
Kittle Farms LtdViking (780) 336-2583
Markert Seeds LtdVulcan (403) 485-6708
Dalton Seed Farm IncWainwright (780) 842-2361
Hegland Seed FarmWembley (780) 766-2450
Sylvan RaaenRolla BC (250) 219-1778
PR1646 Alb Yield_G_E3indd 1 070211 445 PM
All purchases are subject to the terms of labelling and purchase documents reg TM SM Trademarks and service marks licensed to Pioneer Hi-Bred Limited copy 2011 PHL PR1610 Yield MN Grower_G_E
With industry-leading research and seed genetics Pioneer Hi-Bred is bringing a new level of performance to western Canadian growers We were the first company to bring new traits for sclerotinia and clubroot resistance to canola And wersquore also leading with the development and introduction of early maturity locally adapted corn hybrids
Wersquore also covering a lot of ground with the service and support we deliver to our customers You can count on your local Pioneer Hi-Bred sales rep to help you build a high yielding crop Plus theyrsquore backed by one of the strongest agronomic teams in the business
Pioneer Hi-Bred Wersquore gaining new ground where it matters most ndash in your fields
Seed genetics that aregaining new ground
Ask your local Pioneer Hi-Bred sales rep for a seed recommendation for your fields
Craig SchmidtBarrhead (780) 674-4828
FDH Holdings LtdBawlf (780) 608-8491
Danny NobbsBonanza (780) 864-1289
Jill Feniak-SplaneBoyle (780) 689-3386
Gordon FrankBrooks (403) 362-7299
You1st Enterprises LtdCalgary (403) 239-4215
Herb de HoogCamrose (780) 672-2339
Hal Creek Seed Company IncClyde (780) 348-2629
AJM Seeds LtdCoalhurst (403) 308-6685
Consort Agro Services LtdConsort (403) 577-3020
Colin PellerinDebolt (780) 957-2000
Lyndon PopovitchFairview (780) 835-4356
Ron WielerFort Vermilion (780) 927-4255
David SammonsGleichen (403) 934-0940
Lorne CampbellGrimshaw (780) 618-5220
Smoky Seed Company LtdGuy (780) 837-1334
Kelsey SolickHalkirk (403) 884-2358
EampA Land and Cattle Ltd Hayter (780) 753-6666
David Moroz Killam (780) 385-5353
All In Farm Services LtdKitscoty (780) 847-2022
Next Generation Seeds LtdManning (780) 836-7771
Sandrsquos Seed Farm LtdMcLaughlin (780) 745-2251
Gateway Agra Services LtdMedicine Hat (403) 526-9499
K amp S Sharpe Farms LtdMunson (403) 823-6761
Diadem Ag EnterprisesNanton (403) 646-5839
Ellis Agriculture LtdOlds (403) 556-1258
Accur-AgPonoka (403) 588-4689
Darcy KoesterRockyford (403) 901-3560
Jason TolsmaSpruce Grove Calmar (780) 446-1082
Myron ZabolotniukSt Albert (780) 915-6920
Gerald FodchukSt Brides (780) 645-3720
Ron WirstaSt Paul (780) 645-3939
Lee Van RingenStettler (403) 741-9067
Taber Home and Farm CentreTaber (403) 223-8948
Chris and Holly DraderTangent (780) 359-2727
Bauer Six LtdTorrington (403) 994-1149
Deryk SanfordVegreville Fort Saskatchewan (780) 632-9699
Dwayne AndrashewskiVegreville Two Hills (780) 336-4808
Webbrsquos Crop ServicesVermilion (780) 853-6565
Kittle Farms LtdViking (780) 336-2583
Markert Seeds LtdVulcan (403) 485-6708
Dalton Seed Farm IncWainwright (780) 842-2361
Hegland Seed FarmWembley (780) 766-2450
Sylvan RaaenRolla BC (250) 219-1778
PR1646 Alb Yield_G_E3indd 1 070211 445 PM
24 yield AlBeRTA 2011
3
4
5
2
6
7
8
9
1
7
3
4
8
5
6
9
11
11
51
95
71
42
50
79
27
83
48
75
59
67
52
63
15
91
99
72
39
68
60
49
28
76
23
55
96
84
64
87
80
88
16
24
40
36
92
65
53
56
61
69
77
25
47
73
18
29
70
12
57
19
41
37
94
89
13
85
97
54
81
93
66
20
17
35
78
21
62
10
14
26
82
38
58
74
30
33
90
98
32
22
31
86
43
34
44
45
46
83
67
71
91
39
64
59
36
65
19
31
37
59
75
15
27
63
87
51
55
48
38
60
66
76
99
79
92
22
43
47
24
60
83
16
20
52
23
68
28
78
56
52
84
51
88
33
73
40
75
53
84
32
6161
62
49
95
17
29
71
69
77
57
25
79
10
34
53
80
93
91
44
62
85
89
67
99
55
41
72
54
81
58
76
18
26
54
96
30
80
92
45
72
57
96
95
42
58
90
74
21
86
68
94
82
81
50
77
85
97
93
46
73
69
97
87
64
88
12
63
86
78
70
74
98
56
94
70
89
65
82
98
90
66
35
13
14
111111
111
119
115
116
112
117
113
118
114
110
126
119
115115
112
119
116116
112
117
113113
117
110
118
114
110
114
118
103
123
100
124
104
120
101
105
125
121
102
122
126
106
126
107
108
109
123
120
123
120
103
104
107
124
108
103
108
109
121
101
105
109
107
125124
100
121
104
122
106
122
101100
125
102102
105
106
9
23
2
47 56
48
86 9
7 69
9
5
2
3
7
8
58
2
4
9
36
2
9 8 678
35 4
2
6 5
3
2
4
4
5
4
53
7
2
9
74
8
69
59
8 57 4
2
3
6 35
37
8
2
2
3
4
9 458 67
684
7 6 5 4
9
39 8 2
35 4
345 278 6
3
2
7
9
6
4
9
3 2457
7
8
3
89
7
69
2
2
2
7
45
67
6
389
5
6
5
9 78
8
26 35 4
3
1111
11
11
11
11
11
1111
11
11
11
11
11
11
11
11
21
10
12
18 13 101216 1512
25
1021
19 1419
22 17
22
19
2324
15
13
14
18
20
10
23
12
1316
182310
1714
19
24
18
12
10
26
23
25
22 21
13 10
29
25
12
1423 21
24
2024
26
13
24 21
19
22 18
22 15
21
17
20
14 1616 1220
27
16
25
15 14
23
10
17
12
1521 17
28
26
10
1823
15
16 13
13
1719
10
1024
221012
12
12
21
14
22
23 13
18 25 20
25
15
10
1922
27
21 18 1620 1921 1722 2010
22
19
1314
28
18 12
26
23
17 2419
10
13
14
1516 22 211214
25
25
17
10
12 18
17
13
20
15
15
16
15
14 10
20
17
26
23 192024
27
16
16
22
12
18
18
1223 1520 14 1319 162124
25
17
24
27 26
23
20
1925
13
141521 16 1018 1723 13 12
22 20
24
24
1326
26
2727
4
9
14
2
20
3
5
1
15
8
13
21
11
22
7
10
6
19
16
12
17
18
Oyen
Olds
Taber
Hanna
Leduc
Vulcan
Ponoka
Lamont
Falher
Castor
Brooks
Provost
Manning
Lacombe
Camrose
Airdrie
Westlock
Thorhild
Stettler
St Paul
Grimshaw
Foremost
Fairview
Cardston
Barrhead
Red Deer
Vermilion
Sedgewick
Athabasca
Wainwright
Vegreville
Strathmore
Smoky Lake
High River
Claresholm
Lethbridge
Drumheller
Three Hills
Spirit River
High Prairie
Medicine Hat
Fort Vermilion
Grande Prairie
28
13
29
Valleyview
Stony Plain
Crop Risk Areas
Central Office
Regional Offices
AgriInsurance District Offices
RISK AREAS
2011 yield AlBeRTA 25
dagger Yields only for those varieties grown by 5 or more producers Dagger On system as of January 19 2011sect Weighted Average Yield and Total Acreage include acres not reported in the table
ALBERTA
WHEAT DRYLAND YIELDS BY VARIETY 2007ndash2010dagger ALBERTA 2007 2008 2009 2009 2010 2010Dagger Variety Yield Yield Yield Acres Yield Acres Harvest (HRS) 44 52 39 1212390 49 1182518 Lillian (HRS) 33 38 32 506206 41 529934 CDC Go (HRS) 53 59 41 318268 52 430052 Superb (HRS) 43 51 42 362570 44 318801 AC Eatonia (HRS) 25 29 33 229417 34 249139 AC Foremost (CPS) 66 75 53 190035 69 162010 Strongfield (D) 32 41 37 318183 44 146266 5700 PR (CPS) 57 65 51 188770 59 133822 CDC Imagine (HRS) 38 47 36 137003 47 119137 CDC Abound (HRS) mdash mdash 37 28183 49 116084 AC Intrepid (HRS) 47 48 39 121751 42 99061 Prodigy (HRS) 37 41 33 97765 42 82197 CDC Teal (HRS) 43 43 34 88686 33 67939 AC Barrie (HRS) 34 37 29 80738 40 65649 AC Splendor (HRS) 38 39 33 73774 37 60949 AC Crystal (CPS) 47 55 46 64640 57 53779 Radiant (HRW) 48 50 36 101078 53 50462 AC Avonlea (D) 28 38 35 114093 42 46209 Infinity (HRS) 46 47 39 62798 43 45198 CDC Alsask (HRS) mdash 43 37 12331 45 43703 McKenzie (HRS) 36 41 34 51256 40 42186 Alvena (HRS) mdash 54 44 10665 42 31123 5701 PR (CPS) 58 59 47 37935 57 28978 Snowbird (HRS) 44 48 44 25177 54 24866 Kane (HRS) mdash 64 38 9732 52 24299 Roblin (HRS) 38 42 34 36660 39 23230 AC Elsa (HRS) 37 41 31 35758 36 22389 AC Navigator (D) 40 43 40 52438 43 21323 5602 HR (HRS) 43 42 31 29192 44 17793 AC Cadillac (HRS) 30 31 18 19707 33 16560 5702 PR (CPS) mdash mdash 54 5329 62 15218 CDC Osprey (HRW) 43 50 28 12871 48 14500 Kyle (D) 24 34 30 41861 34 13614 Snowstar (HRS) mdash mdash 45 9574 45 13226 AC Abbey (HRS) 32 39 29 15909 39 12636 AC Andrew (SWS) 52 56 30 9102 50 12459 Journey (HRS) 40 47 36 18994 47 10867 WR 859 CL (HRS) mdash mdash mdash mdash 51 8733 CDC Bounty (HRS) 36 45 34 5220 42 8326 Columbus (HRS) 28 31 26 10739 34 8288 Katepwa (HRS) 28 34 28 9287 34 8136 Unity (HRS) mdash 48 48 447 53 8043 AC Bellatrix (HRW) 40 47 34 31063 51 7678 Laura (HRS) 28 33 29 8499 33 7299 Leader (HRS) 23 28 38 3880 37 6924 CDC Buteo (HRW) 36 48 38 3670 58 6121 Park (HRS) 37 38 30 6773 28 5844 Alikat (HRS) 46 53 58 6777 51 5684 Lovitt (HRS) 36 47 mdash mdash 48 5632 AC Taber (CPS) 41 44 45 9190 72 5441 Goodeve (HRS) mdash mdash mdash mdash 60 4798 AC Majestic (HRS) 44 43 32 6234 44 4548 AC Domain (HRS) 37 43 35 5023 46 4198 Oslo (CPS) 62 77 77 4523 82 4129 Stettler (HRS) mdash mdash 42 3191 48 3974 CDC Clair (HRW) 54 60 44 3502 59 3806 AC Morse (D) 26 28 36 13640 38 3756 CDC Makwa (HRS) 21 25 15 5010 21 3442 AC Michael (HRS) 22 31 27 2060 30 2535 Glenn (HRS) mdash mdash mdash mdash 39 2390 Biggar (CPS) 41 41 33 1481 27 1785 Peace (HRS) mdash 36 32 2020 32 1687 Waskada (HRS) mdash mdash mdash mdash 51 1676 Lancer (HRS) 30 39 24 877 50 1628 Neepawa (HRS) 29 26 30 1596 39 1283 Thatcher (HRS) 22 32 32 850 31 1154 CDC Falcon (HRW) 54 72 35 1331 71 1153 Sceptre (D) 29 42 33 1675 40 770 Bluesky (ES) mdash 36 mdash mdash 27 701 Sadash (SWS) mdash mdash mdash mdash 62 287 Weighted Average Dryland Wheat yield (Bu) amp total acressect 47 4506547
WHEAT IRRIGATED YIELDS BY VARIETY 2007ndash2010dagger ALBERTA 2007 2008 2009 2009 2010 2010Dagger Variety Yield Yield Yield Acres Yield Acres CDC Go (HRS) 72 70 77 47588 71 53415 Superb (HRS) 73 69 71 63671 66 53195
WHEAT IRRIGATED YIELDS BY VARIETY 2007ndash2010dagger ALBERTA 2007 2008 2009 2009 2010 2010Dagger Variety Yield Yield Yield Acres Yield Acres CDC Abound (HRS) mdash mdash 68 8098 59 22431 Strongfield (D) 80 76 77 44162 74 13915 Glenn (HRS) mdash mdash mdash mdash 49 9503 Radiant (HRW) 93 87 96 5831 87 8326 Lillian (HRS) 53 64 59 8750 53 5527 AC Andrew (SWS) 88 84 84 10480 77 5141 Sadash (SWS) mdash mdash mdash mdash 69 3715 AC Navigator (D) 77 81 70 15186 63 3608 CDC Imagine (HRS) 64 59 54 10294 47 3484 Snowstar (HRS) mdash mdash 74 2710 58 3135 Harvest (HRS) 70 75 52 3099 59 3030 WR 859 CL (HRS) mdash mdash mdash mdash 70 2235 AC Morse (D) 67 73 66 5903 61 2211 CDC Bounty (HRS) mdash mdash mdash mdash 64 1925 5700 PR (CPS) mdash mdash mdash mdash 82 1888 Stettler (HRS) mdash mdash 69 872 78 1687 Waskada (HRS) mdash mdash mdash mdash 50 1113 AC Meena (SWS) 85 91 87 942 82 770 AC Crystal (CPS) 68 97 75 3275 58 768 Kane (HRS) mdash mdash 65 3524 84 681 AC Eatonia (HRS) mdash 35 35 507 29 427 Weighted Average Irrigated Wheat yield (Bu) amp total acressect 67 208978
CANOLA DRYLAND YIELDS BY VARIETY 2007ndash2010dagger ALBERTA 2007 2008 2009 2009 2010 2010Dagger Variety Yield Yield Yield Acres Yield Acres 5440 mdash 45 33 457363 45 560836 5020 36 40 30 572062 36 532664 71-45RR 35 38 30 420133 33 335701 72-55 RR mdash 37 29 150694 35 264407 8440 mdash 45 33 230431 44 243925 9553 mdash 45 29 153012 40 194991 9590 36 44 32 151670 45 167694 45H28 mdash 40 30 107053 36 140868 72-65 RR mdash mdash 25 6419 39 107347 45H26 37 39 30 123848 34 99691 34-65 29 35 23 82700 33 80617 32-75 30 26 23 81061 22 66523 5770 mdash mdash mdash mdash 47 65361 1818 28 34 24 51086 34 61673 72-35 RR mdash mdash 27 24492 29 45416 45H29 mdash mdash 28 410 46 44431 9552 mdash mdash 20 18926 32 37095 45S51 mdash mdash 32 11841 37 36579 SP DesirableRR 28 35 24 38288 30 34085 46P50 31 41 26 47461 40 33978 5030 33 41 33 62268 44 31134 v1037 mdash mdash 28 14332 33 27262 D3151 mdash mdash 33 7153 35 26228 4414 RR 32 37 24 22073 35 25598 430 mdash mdash 24 7018 24 25415 9350 mdash mdash 27 4019 28 24933 1841 32 41 24 51341 34 24856 45H73 34 39 24 16844 36 23901 1950 mdash mdash mdash mdash 39 23527 45P70 33 35 27 16598 34 21930 Nex 845 CL 29 36 26 39590 33 21144 71-40 CL mdash 41 24 16263 27 19880 9550 26 33 28 14298 41 17739 43H57 mdash 29 27 22244 24 15737 45A71 27 30 16 13192 27 15089 1852 H 34 42 24 21325 30 14440 45H21 32 38 24 32860 35 14405 D3150 mdash mdash 27 11557 39 14298 43A56 30 22 21 25255 18 13267 46A76 25 30 23 12741 30 12732 Prairie 719RR 29 35 22 31744 30 12693 1145 mdash mdash mdash mdash 43 12558 997 RR 23 35 23 20101 28 12444 93H01RR mdash 44 26 7772 34 11563 NX4-104 RR mdash mdash 26 24711 32 11426 9555 mdash mdash mdash mdash 35 11328 9551 25 29 20 26119 34 10936 73-67 RR mdash mdash mdash mdash 46 10391 5525 CL mdash mdash mdash mdash 31 10333 45H24 33 32 25 14048 26 10086 4362 RR 32 33 22 10994 21 10051 6040 RR mdash mdash mdash mdash 37 9732
26 yield AlBeRTA 2011
dagger Yields only for those varieties grown by 5 or more producers Dagger On system as of January 19 2011sect Weighted Average Yield and Total Acreage include acres not reported in the table
CANOLA DRYLAND YIELDS BY VARIETY 2007ndash2010dagger ALBERTA 2007 2008 2009 2009 2010 2010Dagger Variety Yield Yield Yield Acres Yield Acres 1141 mdash 39 25 9694 38 9399 73-55 RR mdash mdash mdash mdash 41 8924 73-45 RR mdash mdash mdash mdash 35 8836 Rugby mdash 31 18 5091 27 7406 6130 RR mdash mdash mdash mdash 34 6974 9558C mdash mdash mdash mdash 40 6933 73-77 RR mdash mdash mdash mdash 46 6769 34-55 33 37 25 15608 39 6766 Reward 21 20 19 6054 17 6189 NX4-105 RR mdash mdash mdash mdash 38 6142 6020 RR mdash mdash mdash mdash 32 5966 8571 mdash mdash 17 1941 18 5796 5070 33 38 29 12902 40 5571 1768S mdash 38 30 2896 41 5030 Cafe 28 19 18 7223 13 4576 SP Banner 25 33 24 9964 37 4570 1956 mdash mdash mdash mdash 38 4326 Red River 1826 mdash 19 24 5413 21 4052 73-65 RR mdash mdash mdash mdash 41 3894 SW 6802 27 35 20 5616 24 3690 5505 CL mdash mdash 18 1363 28 3517 45H25 35 36 28 5605 33 3472 SP 621 RR 29 36 28 8819 31 3410 45A51 24 36 27 2348 43 2846 1651H mdash 29 20 3473 28 2762 1896 29 33 24 2823 22 2421 ACS-C7 mdash 15 16 1579 10 2250 73-35 RR mdash mdash mdash mdash 37 2228 SW Spirit River 17 10 mdash mdash 14 1832 45H72 27 32 17 3605 43 1725 46A65 28 38 14 1217 24 1687 D3152 mdash mdash mdash mdash 36 1660 4424 RR mdash mdash 26 2106 34 1657 Tobin 19 17 mdash mdash 14 1641 1855 H mdash 38 30 2803 37 1546 SW 3950 27 41 28 2240 33 1531 v1040 mdash mdash mdash mdash 28 1515 NX4-102 RR mdash mdash 22 10676 33 1474 83S01RR mdash 42 30 2640 39 1437 41P55 23 17 mdash mdash 15 1414 Canterra 1867 20 41 21 5155 39 1412 NX4-106 RR mdash mdash mdash mdash 31 1224 501 37 45 31 1741 38 1176 519RR mdash 52 44 916 42 1108 v2030 mdash mdash 30 4745 30 929 5108 32 29 12 3112 26 737 71-20CL 31 29 25 2558 45 509 9556 mdash mdash mdash mdash 50 463 Weighted Average Dryland Canola yield (Bu) amp total acressect 37 3926077
CANOLA IRRIGATED YIELDS BY VARIETY 2007ndash2010dagger ALBERTA 2007 2008 2009 2009 2010 2010Dagger Variety Yield Yield Yield Acres Yield Acres 5440 mdash 54 55 19054 50 27219 72-55 RR mdash mdash 47 3550 46 5457 71-45RR 45 46 51 8227 45 5289 45H28 mdash mdash 48 4265 45 3681 72-65 RR mdash mdash mdash mdash 45 3044 1841 46 49 44 5840 47 2950 5770 mdash mdash mdash mdash 52 2417 9553 mdash mdash 47 2667 43 2398 45S51 mdash mdash mdash mdash 43 2283 9590 42 54 42 1293 46 1624 46P50 45 46 46 1064 48 1542 8440 mdash 59 52 1485 52 1480 NX4-105 RR mdash mdash mdash mdash 40 1149 5020 48 53 50 1173 53 1138 NX4-104 RR mdash mdash 41 1878 48 897 v1037 mdash mdash mdash mdash 54 887 Nex 845 CL mdash 47 36 2763 36 768 45H26 49 56 52 1334 45 743 D3151 mdash mdash mdash mdash 32 642 1950 mdash mdash mdash mdash 44 554 Weighted Average Irrigated Canola yield (Bu) amp total acressect 47 75598
BARLEY DRYLAND YIELDS BY VARIETY 2007ndash2010dagger ALBERTA 2007 2008 2009 2009 2010 2010Dagger Variety Yield Yield Yield Acres Yield Acres Xena 55 73 62 643079 68 591246 AC Metcalfe 52 67 55 533515 64 476043
BARLEY DRYLAND YIELDS BY VARIETY 2007ndash2010dagger ALBERTA 2007 2008 2009 2009 2010 2010Dagger Variety Yield Yield Yield Acres Yield Acres CDC Copeland 59 73 55 208794 72 204463 CDC Cowboy 67 57 35 70124 61 115292 Ponoka 61 68 56 94737 67 89838 Conlon 53 65 46 95753 60 76818 Champion mdash mdash 65 11514 72 72433 Seebe 53 60 47 83084 61 72008 Sundre mdash 71 59 34761 67 50329 CDC Coalition 63 82 60 19066 74 47240 CDC Kendall 54 76 53 42968 72 27965 CDC Dolly 45 60 48 33083 54 23797 Newdale 56 74 56 20843 68 20738 Vivar 71 83 67 17142 78 19742 McLeod 62 70 52 20817 68 19044 CDC Bold 58 64 57 26021 66 18274 Formosa mdash 72 51 14086 78 18089 Stander 60 75 65 25118 75 16694 Bridge 39 56 49 17471 41 15409 CDCTrey 54 78 68 12288 82 13633 CDC Thompson 57 94 66 15451 89 12908 CDC Helgason 52 67 56 13890 64 11468 Trochu 60 83 59 12183 78 11306 Lacey 64 81 47 16630 73 10144 Harrington 40 51 42 19459 40 9147 Legacy (BT 950) 57 66 67 7997 66 7126 AC Lacombe 55 63 51 10459 45 6262 CDC Yorkton 55 69 66 5484 68 6177 CDC Meredith mdash mdash 85 690 81 5370 CDC PolarStar mdash mdash mdash mdash 74 5197 Niobe 60 84 42 4012 72 4890 AC Ranger 46 59 53 9447 73 4539 AC Harper 46 67 60 4853 41 4417 Bentley mdash mdash mdash mdash 82 4193 CDC Battleford 54 76 66 2324 65 3334 Robust 53 61 38 3871 50 3215 Falcon 54 54 62 1528 68 2462 Otal 45 31 33 2815 27 2059 CDC Select 53 66 68 1645 82 2012 Stockford 60 61 48 1734 66 1830 Abee 46 65 39 1110 59 1793 Winthrop 49 72 42 1914 50 1624 AC Rosser 63 48 11 2694 32 1336 AC Albright 60 26 36 1097 34 1196 Excel 57 79 57 2030 62 1174 CDC Stratus 52 77 67 733 71 896 Manley 49 64 56 3504 68 684 Stein 48 64 mdash mdash 62 683 Leduc 46 65 49 771 53 506 Dillon 32 36 19 1503 55 426 Palliser 53 mdash mdash mdash 79 425 Busby mdash mdash mdash mdash 91 357 Weighted Average Dryland Barley yield (Bu) amp total acressect 67 2133473
BARLEY IRRIGATED YIELDS BY VARIETY 2007ndash2010dagger ALBERTA 2007 2008 2009 2009 2010 2010Dagger Variety Yield Yield Yield Acres Yield Acres Xena 82 91 94 24497 72 21435 AC Harper 84 95 103 7482 72 9169 Vivar 93 92 98 8099 73 7485 CDC Yorkton 86 105 83 3828 67 6769 Sundre mdash 99 104 5053 71 6431 CDC Coalition mdash mdash 105 1823 81 5936 AC Metcalfe 71 89 72 3714 68 5454 Conlon 83 70 69 6044 71 2936 Champion mdash mdash mdash mdash 70 2815 CDC Earl 100 90 99 1870 65 2245 CDC Bold 86 99 88 2174 99 2204 CDC Cowboy mdash 75 86 2050 81 2083 Newdale 82 90 51 1293 88 1636 CDC Mindon mdash mdash mdash mdash 34 1527 Ponoka 87 92 100 838 91 1272 CDC Thompson 80 mdash 72 1003 61 1232 CDC Copeland mdash 78 70 885 60 629 Chigwell mdash mdash mdash mdash 91 523 Bridge 79 mdash mdash mdash 45 403 Weighted Average Irrigated Barley yield (Bu) amp total acressect 72 88799
2011 yield AlBeRTA 27
dagger Yields only for those varieties grown by 5 or more producers Dagger On system as of January 19 2011sect Weighted Average Yield and Total Acreage include acres not reported in the table
FIELD PEA DRYLAND YIELDS BY VARIETY 2007ndash2010dagger ALBERTA 2007 2008 2009 2009 2010 2010Dagger Variety Yield Yield Yield Acres Yield Acres CDC Meadow mdash 62 31 33797 46 107325 SW Midas 38 43 31 112571 37 92389 Delta 23 35 26 79067 37 67276 CDC Golden 32 36 23 66253 36 63828 Cooper 44 49 38 39731 39 47861 Eclipse 34 36 23 61802 30 37540 DS-Admiral 37 45 31 42330 40 32164 Cutlass FP 37 37 31 23831 30 31440 Thunderbird mdash mdash 41 8356 44 29097 Canstar 37 50 41 9913 44 15701 Polstead 52 48 37 9156 42 11648 Swing 31 42 30 11794 40 11232 Eiffel 33 39 30 10063 37 5890 SW Capri 40 47 35 9421 47 4857 CDC Mozart 35 18 19 3840 17 4727 CDC Striker mdash mdash mdash mdash 42 4707 Carneval 36 36 23 6523 30 4548 Miami 36 45 27 6721 35 3835 Garde mdash 10 mdash mdash 45 3564 Nitouche 34 36 37 4837 34 3493 Camry 37 34 30 5585 44 3453 CDC Patrick mdash mdash mdash mdash 40 3194 Espace 39 29 21 3696 42 2718 Profi 31 28 25 3214 36 2491 SW Parade 35 34 33 1497 29 2416 CDC Centennial mdash mdash 18 1011 38 2411 Sorento mdash mdash mdash mdash 53 2036 Toledo 38 39 31 2713 32 1802 Stratus 39 27 33 1910 27 1608 SW Circus 35 45 25 2605 39 1589 Agassiz mdash mdash 33 511 34 1571 CDC Sage mdash mdash 28 548 41 1495 Reward mdash mdash 30 797 42 1167 SW Bravo 39 41 34 1742 43 1147 CDC Bronco mdash mdash 26 3097 38 715 Weighted Average Dryland Field Pea yield (Bu) amp total acressect 39 626557
FIELD PEA IRRIGATED YIELDS BY VARIETY 2007ndash2010dagger ALBERTA 2007 2008 2009 2009 2010 2010Dagger Variety Yield Yield Yield Acres Yield Acres CDC Meadow mdash mdash 49 1682 39 1869 CDC Golden 37 39 55 1264 36 1418 Weighted Average Irrigated Field Pea yield (Bu) amp total acressect 42 5713
OATS DRYLAND YIELDS BY VARIETY 2007ndash2010dagger ALBERTA 2007 2008 2009 2009 2010 2010Dagger Variety Yield Yield Yield Acres Yield Acres AC Morgan 90 87 64 76308 100 94229 Derby 75 69 52 48418 79 55551 AC Mustang 64 69 50 24622 84 28941 Waldern 51 51 36 7721 67 9071 CDC Baler 55 64 39 9185 84 8798 Calibre 47 53 29 10143 72 8487 Cascade 61 58 42 5290 69 6681 Grizzly 51 59 35 3394 60 3394 7600M 75 74 56 1859 78 3081 Jordan mdash 73 74 475 97 1667 CDC Boyer 42 67 32 978 49 1654 AC Juniper 84 94 71 2110 75 1305 Foothill 31 43 15 1015 76 1084 Jasper 72 60 25 426 37 1019 CDC Orrin 87 25 80 937 62 984 Murphy 55 57 53 402 76 941 Athabasca 61 33 45 462 74 764 Lu mdash 112 37 549 121 577 Triple Crown 65 93 81 506 162 556 AC Medallion mdash 101 mdash mdash 88 338 CDC SO-I mdash mdash mdash mdash 116 331 Harmon 63 83 29 802 68 328 Weighted Average Dryland Oats yield (Bu) amp total acressect 87 237316
OATS IRRIGATED YIELDS BY VARIETY 2007ndash2010dagger ALBERTA 2007 2008 2009 2009 2010 2010Dagger Variety Yield Yield Yield Acres Yield Acres AC Morgan 82 74 117 766 85 478 Waldern mdash 100 50 487 105 454 AC Mustang mdash mdash mdash mdash 100 444 Weighted Average Irrigated Oats yield (Bu) amp total acressect 84 2018
MUSTARD DRYLAND YIELDS BY VARIETY 2007ndash2010dagger ALBERTA 2007 2008 2009 2009 2010 2010Dagger Variety Yield Yield Yield Acres Yield Acres Andante (Yellow) 14 17 18 40649 18 42064 AC Pennant (Yellow) 12 14 17 12995 19 12551 Ace (Yellow) 12 20 15 9159 20 7956 AC Base (Yellow) 14 14 16 3564 21 4258 Forge (Oriental) 16 19 17 5100 22 3959 Dutchess (Brown) 13 23 17 3293 19 3204 Centennial Brown (Brown) mdash 29 29 20844 23 2541 Weighted Average Dryland Mustard yield (Bu) amp total acressect 19 88191
LENTIL DRYLAND YIELDS BY VARIETY 2007ndash2010dagger ALBERTA 2007 2008 2009 2009 2010 2010Dagger Variety Yield Yield Yield Acres Yield Acres CDC Maxim mdash mdash mdash mdash 1710 18451 CDC Imperial mdash mdash 1297 5894 1459 15940 CDC Improve mdash mdash 1480 1892 1639 7019 CDC Richlea mdash 1564 1370 4829 1981 5559 CDC Impact mdash mdash 1380 2651 1893 4594 Laird 1055 1663 1373 1411 1639 2854 Weighted Average Dryland Lentil yield (Lbs) amp total acressect 1645 67252
BEAN IRRIGATED YIELDS BY VARIETY 2007ndash2010dagger ALBERTA 2007 2008 2009 2009 2010 2010Dagger Variety Yield Yield Yield Acres Yield Acres Island (Pinto) mdash mdash 1884 4120 1265 15903 Resolute (Great Northern) mdash mdash 2273 6701 1297 7570 AC Polaris (Great Northern) 2259 1979 1923 7759 1238 6303 Winchester Pinto (Pinto) 2192 1868 1870 8264 1382 5011 AC Black Diamond (Black) 2359 2150 1945 2253 1371 3813 AC Redbond (Small Red) 2136 1887 1877 3652 1208 2254 Othello (Pinto) 2311 1670 1769 3580 1344 1615 Myasi yellow (Black) mdash mdash 2742 523 1273 1346 NW - 63 (Small Red) mdash 1437 mdash mdash 1323 549 Weighted Average Irrigated Bean yield (Lbs) amp total acressect 1282 46854
POTATO DRYLAND YIELDS BY VARIETY 2007ndash2010dagger ALBERTA 2007 2008 2009 2009 2010 2010Dagger Variety Yield Yield Yield Acres Yield Acres Russet Burbank (Seed) 9 14 7 1088 10 1466 Weighted Average Dryland Potato yield (Tons) amp total acressect 11 4835
POTATO IRRIGATED YIELDS BY VARIETY 2007ndash2010dagger ALBERTA 2007 2008 2009 2009 2010 2010Dagger Variety Yield Yield Yield Acres Yield Acres Russet Burbank (Fry) 18 17 17 25205 15 24353 Shepody (Fry) 15 14 15 2473 11 3000 FL 1867 (Chip) mdash mdash 13 1015 9 1282 FL 1879 (Chip) mdash 15 16 1084 11 1174 Russet Burbank (Seed) 15 11 14 976 10 863 Atlantic (Chip) mdash 11 15 570 7 553 Weighted Average Irrigated Potato yield (Tons) amp total acressect 14 36991
SUGAR BEET IRRIGATED YIELDS BY VARIETY 2007ndash2010dagger ALBERTA 2007 2008 2009 2009 2010 2010Dagger Variety Yield Yield Yield Acres Yield Acres Beta 47RR65 mdash mdash mdash mdash 20 21081 Beta 47RR75 mdash mdash mdash mdash 21 5575 Beta 43RR90 mdash mdash 20 24635 20 1402 HM 9003RR mdash mdash mdash mdash 22 568 Weighted Average Irrigated Sugar Beet yield (Tons) amp total acressect 20 29352
FLAX DRYLAND YIELDS BY VARIETY 2007ndash2010dagger ALBERTA 2007 2008 2009 2009 2010 2010Dagger Variety Yield Yield Yield Acres Yield Acres CDC Sorrel mdash 22 24 4369 26 3869 CDC Bethune 26 29 21 8074 24 3428 Hanley mdash 22 22 1086 26 1935 Flanders 17 23 22 2403 27 1412 McGregor 18 25 22 2071 21 1130 Prairie Thunder mdash mdash 18 964 23 775 Weighted Average Dryland Flax yield (Bu) amp total acressect 24 14156
FLAX IRRIGATED YIELDS BY VARIETY 2007ndash2010dagger ALBERTA 2007 2008 2009 2009 2010 2010Dagger Variety Yield Yield Yield Acres Yield Acres CDC Sorrel mdash 33 41 3395 36 4394 CDC Bethune 32 42 40 2582 32 1425 Hanley mdash mdash 36 654 35 443 Weighted Average Irrigated Flax yield (Bu) amp total acressect 34 6989
28 yield AlBeRTA 2011
dagger Yields only for those varieties grown by 5 or more producers Dagger On system as of January 19 2011sect Weighted Average Yield and Total Acreage include acres not reported in the table
TRITICALE DRYLAND YIELDS BY VARIETY 2007ndash2010dagger ALBERTA 2007 2008 2009 2009 2010 2010Dagger Variety Yield Yield Yield Acres Yield Acres Pronghorn (Spring) 43 47 35 3221 53 3912 Bunker (Spring) mdash mdash 46 720 34 2432 Pika (Winter) 47 41 35 1192 43 1068 AC Ultima (Spring) 41 59 27 1952 26 800 AC Alta (Spring) mdash mdash mdash mdash 46 788 Bobcat (Winter) 47 53 33 1084 33 750 Weighted Average Dryland Triticale yield (Bu) amp total acressect 43 13135
TRITICALE IRRIGATED YIELDS BY VARIETY 2007ndash2010dagger ALBERTA 2007 2008 2009 2009 2010 2010Dagger Variety Yield Yield Yield Acres Yield Acres Bunker (Spring) mdash mdash 70 664 52 592 Weighted Average Irrigated Triticale yield (Bu) amp total acressect 85 2171
RYE DRYLAND YIELDS BY VARIETY 2007ndash2010dagger ALBERTA 2007 2008 2009 2009 2010 2010Dagger Variety Yield Yield Yield Acres Yield Acres Prima 46 47 27 3964 40 4410 AC Remington 33 47 36 1745 35 2907 Musketeer 33 40 26 2708 34 1702 AC Rifle 44 48 mdash mdash 44 1317 Dakota mdash 56 43 2449 51 1235 Kodiak 35 41 28 802 56 584 Weighted Average Dryland Rye yield (Bu) amp total acressect 41 13422
CANARY SEED DRYLAND YIELDS BY VARIETY 2007ndash2010dagger ALBERTA 2007 2008 2009 2009 2010 2010Dagger Variety Yield Yield Yield Acres Yield Acres Keet mdash mdash 617 893 1204 3531 CDC Togo mdash mdash mdash mdash 801 664 Weighted Average Dryland Canary Seed yield (Lbs) amp total acressect 1162 5474
FABA BEAN DRYLAND YIELDS BY VARIETY 2007ndash2010dagger ALBERTA 2007 2008 2009 2009 2010 2010Dagger Variety Yield Yield Yield Acres Yield Acres Snowbird 2424 2854 1683 4695 2444 2835 Weighted Average Dryland Faba Bean yield (Lbs) amp total acressect 2449 2858
FABA BEAN IRRIGATED YIELDS BY VARIETY 2007ndash2010dagger ALBERTA 2007 2008 2009 2009 2010 2010Dagger Variety Yield Yield Yield Acres Yield Acres Snowbird mdash mdash 2841 762 2411 904 Weighted Average Irrigated Faba Bean yield (Lbs) amp total acressect 2545 1039
CREEPING RED FESCUE DRYLAND YIELDS BY VARIETY 2007ndash2010 ALBERTA
2007 2008 2009 2009 2010 2010Dagger Variety Yield Yield Yield Acres Yield Acres Boreal 386 509 435 3793 293 1751 Weighted Average Dryland Creeping Red Fescue yield (Lbs) amp total acressect 290 2461
SAFFLOWER DRYLAND YIELDS BY VARIETY 2007ndash2010dagger ALBERTA 2007 2008 2009 2009 2010 2010Dagger Variety Yield Yield Yield Acres Yield Acres Saffire 1150 mdash 1448 1298 448 800 Weighted Average Dryland Safflower yield (Lbs) amp total acressect 448 800
RISK AREA 1
BARLEY DRYLAND YIELDS BY VARIETY 2007ndash2010dagger RISK AREA 1 2007 2008 2009 2009 2010 2010Dagger Variety Yield Yield Yield Acres Yield Acres Xena 46 69 76 19681 45 19943 CDC Cowboy mdash mdash mdash mdash 73 1689 Weighted Average Dryland Barley yield (Bu) amp total acressect 50 28273
RISK AREA 2
WHEAT DRYLAND YIELDS BY VARIETY 2007ndash2010dagger RISK AREA 2 2007 2008 2009 2009 2010 2010Dagger Variety Yield Yield Yield Acres Yield Acres Lillian (HRS) 37 41 39 161982 43 160551 Superb (HRS) 37 57 58 58244 40 58071 Harvest (HRS) 51 48 31 17582 51 23657 Strongfield (D) 38 47 41 57437 47 21106 CDC Go (HRS) 45 42 49 17446 47 18950 CDC Imagine (HRS) 32 40 37 18119 38 17171 AC Avonlea (D) 29 38 36 28917 40 15009 CDC Abound (HRS) mdash mdash 47 1232 49 9624 Radiant (HRW) 46 54 47 20811 53 9224 Snowstar (HRS) mdash mdash 47 7755 45 8938 AC Navigator (D) 40 44 40 12966 42 8043 AC Eatonia (HRS) 29 27 46 8041 33 6646 AC Intrepid (HRS) 48 47 26 5203 57 4303 CDC Teal (HRS) 38 46 42 6798 31 3628 AC Elsa (HRS) 48 43 27 3070 47 2245 WR 859 CL (HRS) mdash mdash mdash mdash 40 2194 Waskada (HRS) mdash mdash mdash mdash 54 1377 Kyle (D) 28 46 32 7848 43 1226 Snowbird (HRS) 46 37 39 1828 44 1226 Glenn (HRS) mdash mdash mdash mdash 32 820 Weighted Average Dryland Wheat yield (Bu) amp total acressect 44 399787
WHEAT IRRIGATED YIELDS BY VARIETY 2007ndash2010dagger RISK AREA 2 2007 2008 2009 2009 2010 2010Dagger Variety Yield Yield Yield Acres Yield Acres CDC Go (HRS) 63 75 74 12363 61 12073 Superb (HRS) 70 74 73 15493 64 8488 CDC Abound (HRS) mdash mdash 78 2322 53 7900 Glenn (HRS) mdash mdash mdash mdash 40 5818 Lillian (HRS) 56 67 59 6633 52 3480 AC Andrew (SWS) 88 97 94 1986 76 2203 Snowstar (HRS) mdash mdash 72 1980 58 1946 Strongfield (D) 72 84 76 8099 90 1919 AC Navigator (D) 66 75 71 3937 40 1245 Radiant (HRW) 89 83 84 1438 70 791 AC Meena (SWS) 90 95 87 942 81 664 CDC Imagine (HRS) 62 65 52 3120 40 648 Weighted Average Irrigated Wheat yield (Bu) amp total acressect 59 52638
CANOLA DRYLAND YIELDS BY VARIETY 2007ndash2010dagger RISK AREA 2 2007 2008 2009 2009 2010 2010Dagger Variety Yield Yield Yield Acres Yield Acres 5440 mdash 37 32 18513 43 30441 71-45RR 32 37 36 28943 33 27064 72-55 RR mdash mdash 36 6502 36 22570 1818 20 27 34 4905 26 13569 9590 27 37 29 8506 43 8152 8440 mdash 40 31 7929 43 5426 D3151 mdash mdash mdash mdash 31 5329 9553 mdash mdash 24 2311 40 5224 45H28 mdash mdash 37 4886 39 5159 v1037 mdash mdash mdash mdash 33 4744 72-65 RR mdash mdash mdash mdash 44 4647 Nex 845 CL 31 38 35 6595 37 4033 9552 mdash mdash mdash mdash 35 3884 5770 mdash mdash mdash mdash 46 3871 5020 32 32 32 8996 42 3469 34-65 23 35 28 3971 34 3027 NX4-105 RR mdash mdash mdash mdash 39 2968 1841 30 37 25 6970 38 2557 NX4-104 RR mdash mdash 38 4922 29 2321 45H26 mdash 39 31 3897 49 1845 1950 mdash mdash mdash mdash 33 1426 46P50 26 33 mdash mdash 29 842 Weighted Average Dryland Canola yield (Bu) amp total acressect 37 185048
CANOLA IRRIGATED YIELDS BY VARIETY 2007ndash2010dagger RISK AREA 2 2007 2008 2009 2009 2010 2010Dagger Variety Yield Yield Yield Acres Yield Acres 5440 mdash 57 55 8743 53 10066 45H28 mdash mdash 51 2609 49 2172 71-45RR 49 49 50 3480 48 1954 72-65 RR mdash mdash mdash mdash 45 1877
2011 yield AlBeRTA 29
CANOLA IRRIGATED YIELDS BY VARIETY 2007ndash2010dagger RISK AREA 2 2007 2008 2009 2009 2010 2010Dagger Variety Yield Yield Yield Acres Yield Acres 72-55 RR mdash mdash 45 1472 46 1302 NX4-105 RR mdash mdash mdash mdash 40 1149 1841 49 56 43 2672 41 1129 5770 mdash mdash mdash mdash 62 943 45S51 mdash mdash mdash mdash 53 905 D3151 mdash mdash mdash mdash 33 547 Weighted Average Irrigated Canola yield (Bu) amp total acressect 49 28325
BARLEY DRYLAND YIELDS BY VARIETY 2007ndash2010dagger RISK AREA 2 2007 2008 2009 2009 2010 2010Dagger Variety Yield Yield Yield Acres Yield Acres Xena 48 75 77 168172 49 128647 AC Metcalfe 46 63 50 54650 54 50860 Champion mdash mdash mdash mdash 62 17807 Ponoka 55 61 50 19250 59 16145 CDC Coalition mdash mdash 72 5217 67 13784 CDC Copeland 58 60 49 12829 62 10611 Conlon 44 50 48 8336 49 7290 McLeod 71 80 63 3212 75 5696 Bridge 36 66 58 8775 27 5501 Newdale 76 66 56 5909 78 4258 Harrington 49 55 44 6108 38 3886 AC Harper 46 80 75 2904 36 3148 CDC Cowboy mdash mdash mdash mdash 51 2978 CDC Meredith mdash mdash mdash mdash 76 2463 CDC Yorkton 49 75 76 2781 57 2274 Sundre mdash mdash 96 2449 71 2152 AC Lacombe 65 73 63 2742 29 1613 Vivar 66 mdash mdash mdash 78 359 Weighted Average Dryland Barley yield (Bu) amp total acressect 54 287591
BARLEY IRRIGATED YIELDS BY VARIETY 2007ndash2010dagger RISK AREA 2 2007 2008 2009 2009 2010 2010Dagger Variety Yield Yield Yield Acres Yield Acres Xena 80 95 104 14742 69 13332 AC Harper 89 95 105 5901 76 7239 CDC Yorkton 85 108 85 3583 69 5623 Vivar 100 101 108 4565 76 4362 Sundre mdash 98 110 3190 76 4342 CDC Coalition mdash mdash 102 808 81 3359 AC Metcalfe 69 88 79 2232 61 2574 Ponoka 82 mdash mdash mdash 108 927 Champion mdash mdash mdash mdash 91 589 Weighted Average Irrigated Barley yield (Bu) amp total acressect 73 47451
FIELD PEA DRYLAND YIELDS BY VARIETY 2007ndash2010dagger RISK AREA 2 2007 2008 2009 2009 2010 2010Dagger Variety Yield Yield Yield Acres Yield Acres CDC Meadow mdash mdash 34 10525 50 24215 SW Midas 38 40 26 26861 44 17413 CDC Golden mdash 43 26 10188 41 7557 Eclipse 38 33 23 13697 44 4315 Delta 32 45 30 2346 47 2588 CDC Bronco mdash mdash 43 1722 31 370 Weighted Average Dryland Field Pea yield (Bu) amp total acressect 46 62544
FIELD PEA IRRIGATED YIELDS BY VARIETY 2007ndash2010dagger RISK AREA 2 2007 2008 2009 2009 2010 2010Dagger Variety Yield Yield Yield Acres Yield Acres CDC Meadow mdash mdash mdash mdash 42 800 Weighted Average Irrigated Field Pea yield (Bu) amp total acressect 41 1970
The best seeds deserve the best seed treatment Year after year over half of the canola
acres in Canada are protected with Prosperreg FX
Prosper FX provides unmatched control of flea beetles and seed- and soil-borne
diseases like rhizoctonia and fusarium Make sure your seed is treated with the
respect it deserves ndash yoursquove earned it
For more information visit BayerCropSciencecaProsperFX
Some SeedS get Preferential treatmentProSPer FX THe ProTeCTIoN THeY DeSerVe
BayerCropScienceca or 1 888-283-6847 or contact your Bayer CropScience representativeAlways read and follow label directions Prosperreg is a registered trademark of Bayer Bayer CropScience is a member of CropLife Canada 0111-14567-05D
14567-05D Prosper_SeedAD_SeedABindd 1 12711 205 PM
dagger Yields only for those varieties grown by 5 or more producers Dagger On system as of January 19 2011sect Weighted Average Yield and Total Acreage include acres not reported in the table
30 yield AlBeRTA 2011
dagger Yields only for those varieties grown by 5 or more producers Dagger On system as of January 19 2011sect Weighted Average Yield and Total Acreage include acres not reported in the table
OATS DRYLAND YIELDS BY VARIETY 2007ndash2010dagger RISK AREA 2 2007 2008 2009 2009 2010 2010Dagger Variety Yield Yield Yield Acres Yield Acres AC Morgan 58 mdash 97 870 98 855 AC Mustang 32 72 mdash mdash 74 774 CDC Baler mdash 79 mdash mdash 54 342 Derby 51 mdash 35 610 72 325 Weighted Average Dryland Oats yield (Bu) amp total acressect 74 3208
MUSTARD DRYLAND YIELDS BY VARIETY 2007ndash2010dagger RISK AREA 2 2007 2008 2009 2009 2010 2010Dagger Variety Yield Yield Yield Acres Yield Acres Andante (Yellow) 12 17 19 16479 16 15013 Ace (Yellow) 12 22 18 1260 14 1550 Weighted Average Dryland Mustard yield (Bu) amp total acressect 17 18337
LENTIL DRYLAND YIELDS BY VARIETY 2007ndash2010dagger RISK AREA 2 2007 2008 2009 2009 2010 2010Dagger Variety Yield Yield Yield Acres Yield Acres CDC Maxim mdash mdash mdash mdash 1081 1202 CDC Imperial mdash mdash mdash mdash 1040 1164 Weighted Average Dryland Lentil yield (Lbs) amp total acressect 1153 6421
BEAN IRRIGATED YIELDS BY VARIETY 2007ndash2010dagger RISK AREA 2 2007 2008 2009 2009 2010 2010Dagger Variety Yield Yield Yield Acres Yield Acres Island (Pinto) mdash mdash 2117 532 656 1056 Resolute (Great Northern) mdash mdash 2369 549 880 993 Weighted Average Irrigated Bean yield (Lbs) amp total acressect 749 2582
POTATO IRRIGATED YIELDS BY VARIETY 2007ndash2010dagger RISK AREA 2 2007 2008 2009 2009 2010 2010Dagger Variety Yield Yield Yield Acres Yield Acres Russet Burbank (Fry) 19 20 19 2012 17 2022 Weighted Average Irrigated Potato yield (Tons) amp total acressect 17 2142
SUGAR BEET IRRIGATED YIELDS BY VARIETY 2007ndash2010dagger RISK AREA 2 2007 2008 2009 2009 2010 2010Dagger Variety Yield Yield Yield Acres Yield Acres Beta 47RR65 mdash mdash mdash mdash 20 3768 Beta 47RR75 mdash mdash mdash mdash 19 1202 Weighted Average Irrigated Sugar Beet yield (Tons) amp total acressect 19 5275
FLAX DRYLAND YIELDS BY VARIETY 2007ndash2010dagger RISK AREA 2 2007 2008 2009 2009 2010 2010Dagger Variety Yield Yield Yield Acres Yield Acres McGregor 18 28 23 1616 21 1130 Flanders 18 24 30 798 31 926 CDC Sorrel mdash mdash 36 1146 28 693 Weighted Average Dryland Flax yield (Bu) amp total acressect 25 3934
FLAX IRRIGATED YIELDS BY VARIETY 2007ndash2010dagger RISK AREA 2 2007 2008 2009 2009 2010 2010Dagger Variety Yield Yield Yield Acres Yield Acres CDC Sorrel mdash mdash mdash mdash 26 493 Weighted Average Irrigated Flax yield (Bu) amp total acressect 27 713
RISK AREA 3
WHEAT DRYLAND YIELDS BY VARIETY 2007ndash2010dagger RISK AREA 3 2007 2008 2009 2009 2010 2010Dagger Variety Yield Yield Yield Acres Yield Acres Lillian (HRS) 28 34 33 101966 42 143705 AC Eatonia (HRS) 24 32 34 76942 38 85403 Strongfield (D) 29 40 37 169178 46 79795 AC Avonlea (D) 27 37 34 60573 47 23526 Superb (HRS) 29 31 30 14547 40 18147 Radiant (HRW) 42 41 33 29755 55 15816 AC Navigator (D) 39 43 41 37428 45 12470 CDC Go (HRS) mdash 34 33 2986 46 11173 Harvest (HRS) mdash 42 33 4382 48 8544 Kyle (D) 21 32 30 20167 36 7802 CDC Abound (HRS) mdash mdash 41 702 45 6564 McKenzie (HRS) 23 24 30 1981 43 6234 CDC Imagine (HRS) 28 26 19 2869 39 6110 AC Morse (D) 23 32 35 6296 37 2749 Snowstar (HRS) mdash mdash 29 932 45 2545
WHEAT DRYLAND YIELDS BY VARIETY 2007ndash2010dagger RISK AREA 3 2007 2008 2009 2009 2010 2010Dagger Variety Yield Yield Yield Acres Yield Acres Leader (HRS) 25 26 47 1832 40 2498 AC Bellatrix (HRW) 36 43 35 10614 46 1613 Glenn (HRS) mdash mdash mdash mdash 44 1255 Sceptre (D) mdash 40 37 916 48 475 Sadash (SWS) mdash mdash mdash mdash 69 235 AC Andrew (SWS) 30 38 40 510 45 225 Stettler (HRS) mdash mdash 22 342 35 173 Weighted Average Dryland Wheat yield (Bu) amp total acressect 43 454479
WHEAT IRRIGATED YIELDS BY VARIETY 2007ndash2010dagger RISK AREA 3 2007 2008 2009 2009 2010 2010Dagger Variety Yield Yield Yield Acres Yield Acres Superb (HRS) 77 65 72 33110 67 33035 CDC Go (HRS) 79 61 83 19337 79 25666 CDC Abound (HRS) mdash mdash 65 4129 66 11400 Strongfield (D) 83 77 76 28563 71 8260 Radiant (HRW) 100 91 102 2275 90 4032 Sadash (SWS) mdash mdash mdash mdash 72 3247 AC Andrew (SWS) 91 85 80 7701 78 2938 Glenn (HRS) mdash mdash mdash mdash 60 2806 CDC Imagine (HRS) 67 53 56 4835 48 2641 AC Navigator (D) 79 83 69 10535 75 2363 AC Morse (D) 73 79 63 2750 60 2023 Lillian (HRS) 45 59 56 603 54 1050 Stettler (HRS) mdash mdash 69 857 75 1044 WR 859 CL (HRS) mdash mdash mdash mdash 78 1008 CDC Bounty (HRS) mdash mdash mdash mdash 69 881 Weighted Average Irrigated Wheat yield (Bu) amp total acressect 70 107434
CANOLA DRYLAND YIELDS BY VARIETY 2007ndash2010dagger RISK AREA 3 2007 2008 2009 2009 2010 2010Dagger Variety Yield Yield Yield Acres Yield Acres 8440 mdash mdash 32 4135 42 12368 5440 mdash 45 39 5658 46 8433 D3151 mdash mdash mdash mdash 37 7833 Nex 845 CL mdash 26 42 2460 33 4065 71-45RR 21 31 28 2449 31 3806 5770 mdash mdash mdash mdash 46 1871 72-65 RR mdash mdash mdash mdash 43 1650 9590 mdash 39 33 1469 36 1630 72-55 RR mdash mdash mdash mdash 41 1050 46P50 29 42 mdash mdash 26 1047 5020 30 34 mdash mdash 42 840 8571 mdash mdash mdash mdash 26 754 9553 mdash mdash mdash mdash 38 510 Weighted Average Dryland Canola yield (Bu) amp total acressect 39 58509
CANOLA IRRIGATED YIELDS BY VARIETY 2007ndash2010dagger RISK AREA 3 2007 2008 2009 2009 2010 2010Dagger Variety Yield Yield Yield Acres Yield Acres 5440 mdash 57 61 3636 51 3991 72-55 RR mdash mdash 63 425 45 1665 9553 mdash mdash 46 1261 46 1313 46P50 46 45 mdash mdash 49 1295 71-45RR 43 40 57 971 39 1250 Weighted Average Irrigated Canola yield (Bu) amp total acressect 46 14909
BARLEY DRYLAND YIELDS BY VARIETY 2007ndash2010dagger RISK AREA 3 2007 2008 2009 2009 2010 2010Dagger Variety Yield Yield Yield Acres Yield Acres Conlon 36 48 51 16796 54 22677 Xena 43 50 43 11499 68 20478 AC Metcalfe 39 51 52 14616 54 17504 CDC Bold 46 60 59 4596 65 9891 Bridge 40 54 50 4838 55 6623 CDC Copeland 39 46 34 3947 55 3692 CDC Coalition mdash mdash 48 2208 53 3602 Champion mdash mdash mdash mdash 55 3298 CDC Cowboy mdash mdash mdash mdash 41 2716 Harrington 38 54 49 3978 49 1939 CDC Dolly 45 58 60 1257 58 1895 Ponoka 53 mdash mdash mdash 46 1437 Newdale mdash mdash mdash mdash 66 545 Vivar 46 46 36 305 33 471 CDC Yorkton mdash mdash mdash mdash 49 308 Weighted Average Dryland Barley yield (Bu) amp total acressect 57 99996
2011 yield AlBeRTA 31
dagger Yields only for those varieties grown by 5 or more producers Dagger On system as of January 19 2011sect Weighted Average Yield and Total Acreage include acres not reported in the table
BARLEY IRRIGATED YIELDS BY VARIETY 2007ndash2010dagger RISK AREA 3 2007 2008 2009 2009 2010 2010Dagger Variety Yield Yield Yield Acres Yield Acres Vivar 91 77 85 2989 71 2906 Xena 91 71 86 1732 83 2258 CDC Bold 86 86 73 627 103 2019 Champion mdash mdash mdash mdash 60 1916 AC Metcalfe 94 87 53 632 73 1351 AC Harper 79 98 99 1170 48 1325 Conlon 86 59 66 2066 61 1304 CDC Coalition mdash mdash 131 277 84 1303 CDC Yorkton mdash mdash mdash mdash 58 1146 CDC Thompson mdash mdash mdash mdash 75 640 CDC Cowboy mdash mdash mdash mdash 80 415 Weighted Average Irrigated Barley yield (Bu) amp total acressect 73 20969
FIELD PEA DRYLAND YIELDS BY VARIETY 2007ndash2010dagger RISK AREA 3 2007 2008 2009 2009 2010 2010Dagger Variety Yield Yield Yield Acres Yield Acres Delta 21 34 28 58240 37 51780 CDC Meadow mdash mdash 24 5558 48 13367 CDC Golden 25 27 25 10979 34 10734 Eclipse 27 35 19 8792 34 3761 SW Midas 26 31 18 7577 31 3147 Weighted Average Dryland Field Pea yield (Bu) amp total acressect 38 86591
FIELD PEA IRRIGATED YIELDS BY VARIETY 2007ndash2010dagger RISK AREA 3 2007 2008 2009 2009 2010 2010Dagger Variety Yield Yield Yield Acres Yield Acres CDC Meadow mdash mdash 42 648 33 936 Weighted Average Irrigated Field Pea yield (Bu) amp total acressect 42 2034
OATS DRYLAND YIELDS BY VARIETY 2007ndash2010dagger RISK AREA 3 2007 2008 2009 2009 2010 2010Dagger Variety Yield Yield Yield Acres Yield Acres Waldern 40 48 38 552 66 820 AC Mustang mdash mdash mdash mdash 46 613 Weighted Average Dryland Oats yield (Bu) amp total acressect 62 1893
MUSTARD DRYLAND YIELDS BY VARIETY 2007ndash2010dagger RISK AREA 3 2007 2008 2009 2009 2010 2010Dagger Variety Yield Yield Yield Acres Yield Acres Andante (Yellow) 17 16 18 15587 21 16518 AC Pennant (Yellow) 14 15 17 7003 21 7209 Ace (Yellow) 14 16 13 5392 23 5221 AC Base (Yellow) 15 16 15 2713 19 2106 Weighted Average Dryland Mustard yield (Bu) amp total acressect 21 31803
LENTIL DRYLAND YIELDS BY VARIETY 2007ndash2010dagger RISK AREA 3 2007 2008 2009 2009 2010 2010Dagger Variety Yield Yield Yield Acres Yield Acres CDC Maxim mdash mdash mdash mdash 1971 10066 CDC Imperial mdash mdash 1267 4109 1842 9905 CDC Improve mdash mdash 1546 1532 1817 5626 CDC Richlea mdash mdash 1315 4104 1907 4245 CDC Impact mdash mdash mdash mdash 1709 1807 Weighted Average Dryland Lentil yield (Lbs) amp total acressect 1874 36598
BEAN IRRIGATED YIELDS BY VARIETY 2007ndash2010dagger RISK AREA 3 2007 2008 2009 2009 2010 2010Dagger Variety Yield Yield Yield Acres Yield Acres Island (Pinto) mdash mdash 1828 2994 1264 11898 Resolute (Great Northern) mdash mdash 2270 5492 1367 5822 AC Polaris (Great Northern) 2266 1909 1850 6715 1272 5516 Winchester Pinto (Pinto) 2248 1765 1811 6965 1426 4548 AC Black Diamond (Black) 2419 1978 1924 1901 1419 3356 AC Redbond (Small Red) 2226 1817 1847 3367 1265 2039 Myasi yellow (Black) mdash mdash 2742 523 1276 1279 Othello (Pinto) 2281 1706 1612 1927 1199 1259 NW - 63 (Small Red) mdash 1437 mdash mdash 1323 549 Weighted Average Irrigated Bean yield (Lbs) amp total acressect 1303 37948
POTATO IRRIGATED YIELDS BY VARIETY 2007ndash2010dagger RISK AREA 3 2007 2008 2009 2009 2010 2010Dagger Variety Yield Yield Yield Acres Yield Acres Russet Burbank (Fry) 18 17 16 20642 15 20130 Shepody (Fry) 15 14 15 2343 11 2724 Russet Burbank (Seed) 14 11 mdash mdash 9 426 Atlantic (Chip) mdash mdash 15 520 8 365 Weighted Average Irrigated Potato yield (Tons) amp total acressect 13 27911
SUGAR BEET IRRIGATED YIELDS BY VARIETY 2007ndash2010dagger RISK AREA 3 2007 2008 2009 2009 2010 2010Dagger Variety Yield Yield Yield Acres Yield Acres Beta 47RR65 mdash mdash mdash mdash 20 16800 Beta 47RR75 mdash mdash mdash mdash 21 4373 Beta 43RR90 mdash mdash 20 19679 21 927 HM 9003RR mdash mdash mdash mdash 22 508 Weighted Average Irrigated Sugar Beet yield (Tons) amp total acressect 20 23334
FLAX DRYLAND YIELDS BY VARIETY 2007ndash2010dagger RISK AREA 3 2007 2008 2009 2009 2010 2010Dagger Variety Yield Yield Yield Acres Yield Acres CDC Sorrel mdash mdash 21 1039 28 1486 Weighted Average Dryland Flax yield (Bu) amp total acressect 26 1921
FLAX IRRIGATED YIELDS BY VARIETY 2007ndash2010dagger RISK AREA 3 2007 2008 2009 2009 2010 2010Dagger Variety Yield Yield Yield Acres Yield Acres CDC Sorrel mdash mdash 40 1888 35 1561 CDC Bethune 31 34 40 635 32 1255 Weighted Average Irrigated Flax yield (Bu) amp total acressect 34 3131
TRITICALE DRYLAND YIELDS BY VARIETY 2007ndash2010dagger RISK AREA 3 2007 2008 2009 2009 2010 2010Dagger Variety Yield Yield Yield Acres Yield Acres Pronghorn (Spring) mdash mdash mdash mdash 44 710 Weighted Average Dryland Triticale yield (Bu) amp total acressect 39 1316
RYE DRYLAND YIELDS BY VARIETY 2007ndash2010dagger RISK AREA 3 2007 2008 2009 2009 2010 2010Dagger Variety Yield Yield Yield Acres Yield Acres AC Remington mdash mdash mdash mdash 36 377 Weighted Average Dryland Rye yield (Bu) amp total acressect 36 482
RISK AREA 4
WHEAT DRYLAND YIELDS BY VARIETY 2007ndash2010dagger RISK AREA 4 2007 2008 2009 2009 2010 2010Dagger Variety Yield Yield Yield Acres Yield Acres Lillian (HRS) 27 31 27 82582 36 93440 AC Eatonia (HRS) 23 27 38 80878 33 90164 Strongfield (D) 26 35 38 52954 34 19708 McKenzie (HRS) 29 33 27 7906 37 6065 Radiant (HRW) 39 35 40 14420 50 5367 Harvest (HRS) 31 42 29 5251 43 4872 Superb (HRS) 42 46 41 4217 39 4528 CDC Go (HRS) mdash 44 9 535 48 3496 CDC Abound (HRS) mdash mdash 10 1408 39 3183 Kyle (D) 25 33 35 9145 29 2816 AC Barrie (HRS) 28 31 26 1712 29 2590 CDC Makwa (HRS) 15 15 11 2061 16 1903 AC Avonlea (D) 26 36 41 9553 27 1641 CDC Imagine (HRS) mdash 31 6 2232 23 1321 AC Bellatrix (HRW) 31 46 32 4707 35 844 Weighted Average Dryland Wheat yield (Bu) amp total acressect 35 266976
WHEAT IRRIGATED YIELDS BY VARIETY 2007ndash2010dagger RISK AREA 4 2007 2008 2009 2009 2010 2010Dagger Variety Yield Yield Yield Acres Yield Acres CDC Go (HRS) mdash 76 80 10787 70 11493 Superb (HRS) 66 74 69 14100 68 11402 Strongfield (D) 60 62 83 7500 73 3736 Radiant (HRW) 87 86 98 2118 88 3453 CDC Abound (HRS) mdash mdash 66 1302 49 3123 5700 PR (CPS) mdash mdash mdash mdash 78 1005 Glenn (HRS) mdash mdash mdash mdash 79 879 Weighted Average Irrigated Wheat yield (Bu) amp total acressect 69 40793
CANOLA DRYLAND YIELDS BY VARIETY 2007ndash2010dagger RISK AREA 4 2007 2008 2009 2009 2010 2010Dagger Variety Yield Yield Yield Acres Yield Acres 5440 mdash mdash 36 6783 35 9396 71-45RR 22 15 32 6235 28 8395 8440 mdash mdash 39 1036 45 2633 5020 mdash 20 mdash mdash 27 2128 Weighted Average Dryland Canola yield (Bu) amp total acressect 31 32736
32 yield AlBeRTA 2011
dagger Yields only for those varieties grown by 5 or more producers Dagger On system as of January 19 2011sect Weighted Average Yield and Total Acreage include acres not reported in the table
CANOLA IRRIGATED YIELDS BY VARIETY 2007ndash2010dagger RISK AREA 4 2007 2008 2009 2009 2010 2010Dagger Variety Yield Yield Yield Acres Yield Acres 5440 mdash 49 58 4864 48 9736 72-55 RR mdash mdash 50 1452 47 1208 8440 mdash 63 55 1016 50 1145 71-45RR 41 45 52 3048 48 1082 72-65 RR mdash mdash mdash mdash 40 761 Nex 845 CL mdash 56 mdash mdash 34 636 5020 46 mdash mdash mdash 55 603 Weighted Average Irrigated Canola yield (Bu) amp total acressect 46 20476
BARLEY DRYLAND YIELDS BY VARIETY 2007ndash2010dagger RISK AREA 4 2007 2008 2009 2009 2010 2010Dagger Variety Yield Yield Yield Acres Yield Acres Xena 46 39 41 16728 48 10839 AC Metcalfe 36 39 46 5558 47 10037 CDC Cowboy mdash 43 9 5188 51 7019 Conlon 21 52 55 4537 56 6686 CDC Copeland mdash mdash mdash mdash 55 1259 Seebe 22 22 7 787 16 785 Weighted Average Dryland Barley yield (Bu) amp total acressect 47 43203
BARLEY IRRIGATED YIELDS BY VARIETY 2007ndash2010dagger RISK AREA 4 2007 2008 2009 2009 2010 2010Dagger Variety Yield Yield Yield Acres Yield Acres Xena 80 91 97 1654 87 1645 CDC Mindon mdash mdash mdash mdash 34 1527 CDC Earl 100 mdash 88 805 57 1083 Conlon 79 83 66 2560 89 674 Weighted Average Irrigated Barley yield (Bu) amp total acressect 67 9551
FIELD PEA DRYLAND YIELDS BY VARIETY 2007ndash2010dagger RISK AREA 4 2007 2008 2009 2009 2010 2010Dagger Variety Yield Yield Yield Acres Yield Acres CDC Golden 23 24 25 10661 36 9613 Delta 20 34 22 9747 36 9477 CDC Meadow mdash mdash 40 2203 30 5051 Eclipse 21 11 22 2135 24 1820 SW Midas mdash 16 23 965 34 1053 DS-Admiral 39 48 40 1664 28 740 Weighted Average Dryland Field Pea yield (Bu) amp total acressect 33 30968
FIELD PEA IRRIGATED YIELDS BY VARIETY 2007ndash2010dagger RISK AREA 4 2007 2008 2009 2009 2010 2010Dagger Variety Yield Yield Yield Acres Yield Acres CDC Golden mdash mdash mdash mdash 34 613 Weighted Average Irrigated Field Pea yield (Bu) amp total acressect 42 1461
OATS DRYLAND YIELDS BY VARIETY 2007ndash2010dagger RISK AREA 4 2007 2008 2009 2009 2010 2010Dagger Variety Yield Yield Yield Acres Yield Acres AC Mustang 52 35 70 1290 85 1972 Calibre 23 30 13 1678 70 1512 Waldern 30 mdash 43 1124 57 1429 Derby 36 33 7 2600 45 1097 AC Morgan 24 29 mdash mdash 50 402 Weighted Average Dryland Oats yield (Bu) amp total acressect 69 7816
MUSTARD DRYLAND YIELDS BY VARIETY 2007ndash2010dagger RISK AREA 4 2007 2008 2009 2009 2010 2010Dagger Variety Yield Yield Yield Acres Yield Acres Andante (Yellow) mdash 9 16 2774 17 3763 Centennial Brown (Brown) mdash mdash 24 1935 21 2088 AC Pennant (Yellow) 9 13 14 2234 15 2027 Weighted Average Dryland Mustard yield (Bu) amp total acressect 19 13327
LENTIL DRYLAND YIELDS BY VARIETY 2007ndash2010dagger RISK AREA 4 2007 2008 2009 2009 2010 2010Dagger Variety Yield Yield Yield Acres Yield Acres CDC Maxim mdash mdash mdash mdash 1883 2209 Weighted Average Dryland Lentil yield (Lbs) amp total acressect 1592 7729
BEAN IRRIGATED YIELDS BY VARIETY 2007ndash2010dagger RISK AREA 4 2007 2008 2009 2009 2010 2010Dagger Variety Yield Yield Yield Acres Yield Acres Island (Pinto) mdash mdash mdash mdash 1488 2949 Resolute (Great Northern) mdash mdash 2212 660 1310 755 Weighted Average Irrigated Bean yield (Lbs) amp total acressect 1379 5167
POTATO IRRIGATED YIELDS BY VARIETY 2007ndash2010dagger RISK AREA 4 2007 2008 2009 2009 2010 2010Dagger Variety Yield Yield Yield Acres Yield Acres Russet Burbank (Fry) 17 12 19 2551 15 2201 Weighted Average Irrigated Potato yield (Tons) amp total acressect 15 2357
SUGAR BEET IRRIGATED YIELDS BY VARIETY 2007ndash2010dagger RISK AREA 4 2007 2008 2009 2009 2010 2010Dagger Variety Yield Yield Yield Acres Yield Acres Beta 47RR65 mdash mdash mdash mdash 21 513 Weighted Average Irrigated Sugar Beet yield (Tons) amp total acressect 21 743
FLAX IRRIGATED YIELDS BY VARIETY 2007ndash2010dagger RISK AREA 4 2007 2008 2009 2009 2010 2010Dagger Variety Yield Yield Yield Acres Yield Acres CDC Sorrel mdash mdash 45 1137 37 1970 Hanley mdash mdash 36 654 35 443 Weighted Average Irrigated Flax yield (Bu) amp total acressect 36 2775
TRITICALE DRYLAND YIELDS BY VARIETY 2007ndash2010dagger RISK AREA 4 2007 2008 2009 2009 2010 2010Dagger Variety Yield Yield Yield Acres Yield Acres Bunker (Spring) mdash mdash mdash mdash 36 1764 Pronghorn (Spring) mdash 32 13 954 37 1213 Weighted Average Dryland Triticale yield (Bu) amp total acressect 38 4952
TRITICALE IRRIGATED YIELDS BY VARIETY 2007ndash2010dagger RISK AREA 4 2007 2008 2009 2009 2010 2010Dagger Variety Yield Yield Yield Acres Yield Acres Bunker (Spring) mdash mdash 70 664 52 592 Weighted Average Irrigated Triticale yield (Bu) amp total acressect 50 1155
RYE DRYLAND YIELDS BY VARIETY 2007ndash2010dagger RISK AREA 4 2007 2008 2009 2009 2010 2010Dagger Variety Yield Yield Yield Acres Yield Acres Dakota mdash mdash 43 2379 52 1160 Prima mdash 26 8 705 41 968 Weighted Average Dryland Rye yield (Bu) amp total acressect 36 5435
RISK AREA 5
WHEAT DRYLAND YIELDS BY VARIETY 2007ndash2010dagger RISK AREA 5 2007 2008 2009 2009 2010 2010Dagger Variety Yield Yield Yield Acres Yield Acres CDC Go (HRS) 57 61 36 85097 48 129403 Harvest (HRS) 48 56 35 151334 50 122031 Lillian (HRS) 44 48 37 58718 41 36877 Superb (HRS) 46 53 37 20068 39 18446 AC Intrepid (HRS) 42 56 47 21568 55 16559 CDC Imagine (HRS) 46 50 31 18228 53 12842 CDC Abound (HRS) mdash mdash 28 1923 49 12092 AC Splendor (HRS) 33 50 36 9243 36 8738 5700 PR (CPS) 76 81 42 8316 56 7920 Prodigy (HRS) 44 49 26 3827 45 6546 AC Barrie (HRS) 33 38 23 6589 35 6024 CDC Alsask (HRS) mdash mdash 43 1032 52 4401 Radiant (HRW) mdash 61 33 2842 55 4386 AC Elsa (HRS) 32 52 37 7753 31 4177 AC Abbey (HRS) 42 45 24 3443 42 3727 Roblin (HRS) 45 48 36 4472 53 3180 5702 PR (CPS) mdash mdash mdash mdash 52 2976 Journey (HRS) 45 50 38 8273 54 2718 AC Foremost (CPS) mdash mdash 33 3012 50 2240 Unity (HRS) mdash mdash mdash mdash 46 1913 WR 859 CL (HRS) mdash mdash mdash mdash 59 1501 Strongfield (D) 51 55 38 4919 34 880 Weighted Average Dryland Wheat yield (Bu) amp total acressect 48 428921
WHEAT IRRIGATED YIELDS BY VARIETY 2007ndash2010dagger RISK AREA 5 2007 2008 2009 2009 2010 2010Dagger Variety Yield Yield Yield Acres Yield Acres CDC Go (HRS) mdash 82 55 5101 56 3933 Harvest (HRS) 73 79 49 1577 56 1334 Weighted Average Irrigated Wheat yield (Bu) amp total acressect 62 7373
2011 yield AlBeRTA 33
dagger Yields only for those varieties grown by 5 or more producers Dagger On system as of January 19 2011sect Weighted Average Yield and Total Acreage include acres not reported in the table
CANOLA DRYLAND YIELDS BY VARIETY 2007ndash2010dagger RISK AREA 5 2007 2008 2009 2009 2010 2010Dagger Variety Yield Yield Yield Acres Yield Acres 5440 mdash 47 32 43734 44 57699 71-45RR 36 43 28 54266 36 42907 9553 mdash mdash 30 12158 39 16798 72-55 RR mdash mdash 27 5695 34 15973 5020 38 47 25 18316 41 13189 8440 mdash 46 32 22266 45 12935 45H28 mdash mdash 30 4725 39 10060 1841 32 40 21 15626 29 8294 1852 H 33 40 18 11733 27 8138 1950 mdash mdash mdash mdash 39 8110 v1037 mdash mdash mdash mdash 29 7532 93H01RR mdash 36 25 4574 36 7507 9590 39 41 28 4671 43 6449 45H26 mdash 44 30 6546 38 5805 72-65 RR mdash mdash mdash mdash 39 5252 430 mdash mdash mdash mdash 32 4433 34-65 32 38 32 3461 37 4264 5770 mdash mdash mdash mdash 43 3125 1145 mdash mdash mdash mdash 39 3077 45S51 mdash mdash mdash mdash 39 2730 9350 mdash mdash mdash mdash 36 2562 45H29 mdash mdash mdash mdash 24 2182 SP DesirableRR 35 40 12 1816 39 1953 32-75 30 41 24 3105 36 1882 45H21 33 37 19 5825 38 1874 D3151 mdash mdash 32 956 37 1690 45P70 mdash mdash 21 1235 29 1402 1818 27 29 19 1181 24 1368 72-35 RR mdash mdash 29 852 29 1323 83S01RR mdash 41 33 1855 39 973 Weighted Average Dryland Canola yield (Bu) amp total acressect 38 292755
CANOLA IRRIGATED YIELDS BY VARIETY 2007ndash2010dagger RISK AREA 5 2007 2008 2009 2009 2010 2010Dagger Variety Yield Yield Yield Acres Yield Acres 5440 mdash mdash 36 1811 48 3426 45S51 mdash mdash mdash mdash 33 1089 71-45RR mdash 54 48 728 46 1003 45H28 mdash mdash mdash mdash 37 815 Weighted Average Irrigated Canola yield (Bu) amp total acressect 45 11287
BARLEY DRYLAND YIELDS BY VARIETY 2007ndash2010dagger RISK AREA 5 2007 2008 2009 2009 2010 2010Dagger Variety Yield Yield Yield Acres Yield Acres Xena 64 78 44 96376 78 87663 CDC Copeland 62 76 56 45995 73 45248 AC Metcalfe 56 77 49 50115 64 44008 Conlon 57 66 35 19540 71 15292 Champion mdash mdash 31 3187 78 12962 CDC Cowboy mdash mdash 47 2566 55 5853 CDC Coalition mdash mdash 41 3795 89 5436 Newdale 50 81 60 5889 61 5356 Sundre mdash mdash 48 3193 51 4898 Ponoka 70 78 51 5299 55 4872 Formosa mdash mdash 29 3765 78 4021 CDC Dolly 42 53 53 3637 42 2414 McLeod 70 72 49 3283 95 1881 Trochu 61 100 mdash mdash 89 1716 Weighted Average Dryland Barley yield (Bu) amp total acressect 72 249817
BARLEY IRRIGATED YIELDS BY VARIETY 2007ndash2010dagger RISK AREA 5 2007 2008 2009 2009 2010 2010Dagger Variety Yield Yield Yield Acres Yield Acres Xena 80 89 71 5836 70 3520 CDC Coalition mdash mdash mdash mdash 84 1001 AC Metcalfe 56 98 63 708 86 925 Weighted Average Irrigated Barley yield (Bu) amp total acressect 73 9541
FIELD PEA DRYLAND YIELDS BY VARIETY 2007ndash2010dagger RISK AREA 5 2007 2008 2009 2009 2010 2010Dagger Variety Yield Yield Yield Acres Yield Acres CDC Meadow mdash mdash 16 2285 55 6537 CDC Golden 40 50 26 6339 46 5786 SW Midas 43 54 32 9179 52 5709 Eclipse 48 39 21 1428 32 1852 DS-Admiral 37 45 23 1180 47 1726 Weighted Average Dryland Field Pea yield (Bu) amp total acressect 49 24771
OATS DRYLAND YIELDS BY VARIETY 2007ndash2010dagger RISK AREA 5 2007 2008 2009 2009 2010 2010Dagger Variety Yield Yield Yield Acres Yield Acres AC Mustang 60 86 35 1421 74 1902 Derby 53 mdash mdash mdash 74 511 CDC Baler 52 66 mdash mdash 70 275 Weighted Average Dryland Oats yield (Bu) amp total acressect 73 4821
MUSTARD DRYLAND YIELDS BY VARIETY 2007ndash2010dagger RISK AREA 5 2007 2008 2009 2009 2010 2010Dagger Variety Yield Yield Yield Acres Yield Acres Andante (Yellow) 16 25 19 2153 20 2335 Weighted Average Dryland Mustard yield (Bu) amp total acressect 22 2823
RISK AREA 6
WHEAT DRYLAND YIELDS BY VARIETY 2007ndash2010dagger RISK AREA 6 2007 2008 2009 2009 2010 2010Dagger Variety Yield Yield Yield Acres Yield Acres Harvest (HRS) mdash 71 mdash mdash 68 1428 AC Foremost (CPS) mdash mdash mdash mdash 65 664 Weighted Average Dryland Wheat yield (Bu) amp total acressect 65 3432
CANOLA DRYLAND YIELDS BY VARIETY 2007ndash2010dagger RISK AREA 6 2007 2008 2009 2009 2010 2010Dagger Variety Yield Yield Yield Acres Yield Acres 71-45RR mdash 43 28 838 30 1579 32-75 34 32 25 2247 29 1121 72-35 RR mdash mdash 15 655 20 845 Weighted Average Dryland Canola yield (Bu) amp total acressect 27 7069
BARLEY DRYLAND YIELDS BY VARIETY 2007ndash2010dagger RISK AREA 6 2007 2008 2009 2009 2010 2010Dagger Variety Yield Yield Yield Acres Yield Acres AC Metcalfe 25 64 43 4061 85 3430 Xena 42 74 70 2540 85 2960 CDC Dolly 46 75 55 1309 79 2210 Formosa mdash mdash 61 2324 70 2164 CDC Copeland 50 78 45 3336 74 2086 CDC Helgason 49 63 32 909 72 1399 Conlon 36 58 68 1178 67 1307 Sundre mdash 55 50 1723 67 1171 Stander 40 56 67 1031 78 689 CDC Thompson mdash mdash mdash mdash 75 661 Trochu 39 61 66 888 70 593 Weighted Average Dryland Barley yield (Bu) amp total acressect 74 22039
OATS DRYLAND YIELDS BY VARIETY 2007ndash2010dagger RISK AREA 6 2007 2008 2009 2009 2010 2010Dagger Variety Yield Yield Yield Acres Yield Acres AC Morgan 73 64 73 884 72 1142 AC Mustang 63 104 36 1798 66 806 AC Juniper 104 92 58 796 116 373 Weighted Average Dryland Oats yield (Bu) amp total acressect 73 4222
RISK AREA 7
WHEAT DRYLAND YIELDS BY VARIETY 2007ndash2010dagger RISK AREA 7 2007 2008 2009 2009 2010 2010Dagger Variety Yield Yield Yield Acres Yield Acres Harvest (HRS) 54 66 52 51038 65 45341 5700 PR (CPS) 58 70 61 46703 69 35392 CDC Go (HRS) 56 68 60 18830 64 28477 AC Foremost (CPS) 54 77 65 22376 75 25906 CDC Imagine (HRS) 59 64 44 10340 59 12324 CDC Abound (HRS) mdash mdash 52 2128 61 7263 Alvena (HRS) mdash mdash 55 2845 59 5369 Oslo (CPS) 64 77 77 4405 81 4019 AC Intrepid (HRS) 53 60 55 3390 56 2608 5702 PR (CPS) mdash mdash 65 935 66 1962 Superb (HRS) 52 63 58 2366 59 1839 AC Crystal (CPS) 47 72 57 2228 65 1006 CDC Buteo (HRW) mdash mdash mdash mdash 63 783 Weighted Average Dryland Wheat yield (Bu) amp total acressect 66 178239
34 yield AlBeRTA 2011
dagger Yields only for those varieties grown by 5 or more producers Dagger On system as of January 19 2011sect Weighted Average Yield and Total Acreage include acres not reported in the table
CANOLA DRYLAND YIELDS BY VARIETY 2007ndash2010dagger RISK AREA 7 2007 2008 2009 2009 2010 2010Dagger Variety Yield Yield Yield Acres Yield Acres 5440 mdash 52 42 26338 42 47451 71-45RR 36 47 31 49219 36 35166 8440 mdash 50 39 23862 42 21954 5020 34 46 38 23768 40 19145 72-55 RR mdash mdash 32 12891 35 15410 45H28 mdash mdash 37 5837 38 9438 9553 mdash mdash 34 8893 33 9159 32-75 33 38 27 8919 28 6103 72-35 RR mdash mdash 29 2551 33 5519 45H26 36 50 37 10091 33 5126 45S51 mdash mdash 36 1647 38 4862 SP DesirableRR 29 43 27 5300 32 4239 72-65 RR mdash mdash mdash mdash 39 3732 1950 mdash mdash mdash mdash 37 3498 1852 H 33 46 32 5195 33 3432 5770 mdash mdash mdash mdash 39 3063 1818 29 45 34 2138 31 2008 4362 RR 25 40 28 1741 32 1900 4414 RR 35 45 31 2114 29 1762 9590 39 53 46 2057 33 1553 D3151 mdash mdash mdash mdash 36 1372 SW 3950 mdash mdash 32 1359 32 1315 73-45 RR mdash mdash mdash mdash 36 1182 1841 34 47 30 1809 40 1114 73-55 RR mdash mdash mdash mdash 35 1071 9350 mdash mdash mdash mdash 28 1061 43H57 mdash 43 mdash mdash 24 1037 1956 mdash mdash mdash mdash 37 1009 430 mdash mdash mdash mdash 24 917 SW 6802 32 42 mdash mdash 20 893 45H29 mdash mdash mdash mdash 39 888 34-65 32 39 36 1907 24 712 1896 31 42 24 1476 17 466 Weighted Average Dryland Canola yield (Bu) amp total acressect 37 234748
BARLEY DRYLAND YIELDS BY VARIETY 2007ndash2010dagger RISK AREA 7 2007 2008 2009 2009 2010 2010Dagger Variety Yield Yield Yield Acres Yield Acres AC Metcalfe 49 75 65 78461 74 65812 Xena 55 87 72 43444 88 41939 CDC Copeland 54 84 68 29220 80 34130 Formosa mdash 79 57 7997 81 11214 Stander 59 74 69 12058 76 9764 Sundre mdash 75 58 6769 76 9073 Conlon 52 78 55 14459 65 7188 Vivar 68 91 72 4615 81 7101 Lacey 66 86 46 10569 81 6462 CDC Thompson 44 102 78 6627 95 5998 CDC Bold 54 73 70 4165 70 4259 CDCTrey 62 79 79 4253 96 4095 Legacy (BT 950) 55 79 70 4256 78 3862 Ponoka 47 77 73 3314 79 3839 CDC Helgason 51 72 63 6481 82 3041 Champion mdash mdash 46 850 82 2985 Newdale 54 84 73 1623 82 2636 CDC Kendall 48 86 80 4062 86 2386 CDC Coalition mdash mdash 88 1301 95 2285 Trochu 57 82 49 2974 80 2249 CDC Yorkton mdash mdash 72 1243 79 2027 CDC Battleford 58 75 70 1653 74 1868 CDC Cowboy mdash 90 41 1729 63 1782 Falcon 64 68 72 939 65 1642 CDC Dolly 44 76 69 3779 73 1220 Bentley mdash mdash mdash mdash 80 1121 Seebe 54 59 66 1778 78 520 Weighted Average Dryland Barley yield (Bu) amp total acressect 80 245515
FIELD PEA DRYLAND YIELDS BY VARIETY 2007ndash2010dagger RISK AREA 7 2007 2008 2009 2009 2010 2010Dagger Variety Yield Yield Yield Acres Yield Acres Thunderbird mdash mdash 47 896 38 5633 CDC Meadow mdash mdash 49 1071 55 4506 Garde mdash mdash mdash mdash 59 1677 Cooper 40 mdash mdash mdash 50 1496 Camry mdash mdash 57 609 61 1204 Canstar mdash mdash mdash mdash 48 824 Weighted Average Dryland Field Pea yield (Bu) amp total acressect 47 18609
OATS DRYLAND YIELDS BY VARIETY 2007ndash2010dagger RISK AREA 7 2007 2008 2009 2009 2010 2010Dagger Variety Yield Yield Yield Acres Yield Acres AC Morgan 112 116 74 3244 119 5096 AC Mustang 102 116 59 2487 95 2845 Derby 72 84 mdash mdash 91 751 CDC Baler mdash mdash mdash mdash 97 742 Waldern 63 47 mdash mdash 122 522 Weighted Average Dryland Oats yield (Bu) amp total acressect 105 11397
POTATO DRYLAND YIELDS BY VARIETY 2007ndash2010dagger RISK AREA 7 2007 2008 2009 2009 2010 2010Dagger Variety Yield Yield Yield Acres Yield Acres Russet Burbank (Seed) mdash 14 mdash mdash 8 1041 Weighted Average Dryland Potato yield (Tons) amp total acressect 8 2307
RISK AREA 8
WHEAT DRYLAND YIELDS BY VARIETY 2007ndash2010dagger RISK AREA 8 2007 2008 2009 2009 2010 2010Dagger Variety Yield Yield Yield Acres Yield Acres CDC Go (HRS) 51 61 40 153132 54 176815 Harvest (HRS) 45 54 39 128610 46 110314 CDC Imagine (HRS) 45 49 33 16043 44 13483 Superb (HRS) 47 53 38 20901 45 10670 CDC Abound (HRS) mdash mdash 38 1759 43 8720 5700 PR (CPS) 56 67 46 12326 55 6834 CDC Teal (HRS) 40 47 33 7334 36 5181 Kane (HRS) mdash mdash 32 1432 43 3667 AC Elsa (HRS) 44 47 35 6656 36 3440 AC Barrie (HRS) 35 38 27 4760 41 3417 Lillian (HRS) 43 44 35 9814 36 3416 Prodigy (HRS) 33 45 33 3975 40 3345 Alvena (HRS) mdash mdash 43 1501 43 2973 AC Crystal (CPS) 42 65 38 4101 54 2283 AC Foremost (CPS) 53 66 42 4655 56 1635 Roblin (HRS) 31 41 28 4282 32 1443 AC Bellatrix (HRW) 46 61 24 1113 71 1256 Stettler (HRS) mdash mdash mdash mdash 46 967 CDC Bounty (HRS) mdash 53 mdash mdash 46 913 Unity (HRS) mdash mdash mdash mdash 58 879 McKenzie (HRS) 33 44 38 2667 42 864 Weighted Average Dryland Wheat yield (Bu) amp total acressect 49 376785
CANOLA DRYLAND YIELDS BY VARIETY 2007ndash2010dagger RISK AREA 8 2007 2008 2009 2009 2010 2010Dagger Variety Yield Yield Yield Acres Yield Acres 5440 mdash 48 32 60684 44 85338 8440 mdash 49 33 35781 44 29402 71-45RR 32 44 30 37848 35 27826 72-55 RR mdash 39 29 18151 34 23126 9590 35 48 29 17511 43 18009 5020 35 45 27 18568 36 15815 45H28 mdash mdash 30 10507 37 14641 5770 mdash mdash mdash mdash 46 12779 9553 mdash mdash 26 11386 34 10929 45H26 29 40 27 6082 36 7056 72-65 RR mdash mdash mdash mdash 39 6875 1145 mdash mdash mdash mdash 41 6101 1841 28 38 26 11051 34 5170 1141 mdash mdash 27 1176 39 3307 4414 RR mdash 43 19 1719 31 3258 997 RR mdash 41 28 4145 28 3084 9552 mdash mdash 24 1916 24 2532 Nex 845 CL mdash 36 24 4967 35 2166 5030 29 40 30 7946 40 1788 9555 mdash mdash mdash mdash 32 1713 32-75 33 38 29 2771 25 1712 45H21 30 40 25 3341 31 1572 45P70 35 40 mdash mdash 34 1555 NX4-104 RR mdash mdash 26 3486 37 1467 46P50 33 46 26 989 36 1381 93H01RR mdash mdash 23 753 40 1377 9550 21 37 mdash mdash 39 1372 45H29 mdash mdash mdash mdash 36 1179 45S51 mdash mdash mdash mdash 38 1115 v2030 mdash mdash 22 1653 30 929 72-35 RR mdash mdash 26 899 34 916 1818 26 40 28 648 27 889 6040 RR mdash mdash mdash mdash 36 848 73-55 RR mdash mdash mdash mdash 34 671 v1040 mdash mdash mdash mdash 23 645 Weighted Average Dryland Canola yield (Bu) amp total acressect 39 319693
2011 yield AlBeRTA 35
dagger Yields only for those varieties grown by 5 or more producers Dagger On system as of January 19 2011sect Weighted Average Yield and Total Acreage include acres not reported in the table
BARLEY DRYLAND YIELDS BY VARIETY 2007ndash2010dagger RISK AREA 8 2007 2008 2009 2009 2010 2010Dagger Variety Yield Yield Yield Acres Yield Acres AC Metcalfe 54 81 51 94977 68 86933 Xena 61 83 51 45644 75 44358 CDC Copeland 53 84 49 31899 71 32830 CDC Cowboy mdash 60 42 11802 70 15289 CDC Kendall 53 82 50 8733 68 7328 Sundre mdash 80 48 2511 62 4408 Ponoka 62 78 52 5527 71 4337 CDC Coalition mdash mdash 61 941 71 3103 Newdale 66 81 57 2161 64 3040 Conlon 58 77 48 8788 59 2967 Trochu 50 70 53 1307 63 2113 CDC Helgason 52 72 44 1749 48 1985 CDC Dolly 54 73 35 3025 61 1835 Champion mdash mdash 55 847 77 1791 CDC Meredith mdash mdash mdash mdash 84 1536 Seebe 50 71 60 1879 54 1143 AC Lacombe 59 84 mdash mdash 63 848 Stander 63 74 47 1829 55 406 Weighted Average Dryland Barley yield (Bu) amp total acressect 69 224742
FIELD PEA DRYLAND YIELDS BY VARIETY 2007ndash2010dagger RISK AREA 8 2007 2008 2009 2009 2010 2010Dagger Variety Yield Yield Yield Acres Yield Acres CDC Meadow mdash mdash 27 5344 51 16376 SW Midas 42 48 26 11782 44 6204 Eclipse 46 48 24 7434 45 4902 Cooper mdash mdash 35 2636 42 2951 Canstar mdash 41 32 2792 36 2727 Thunderbird mdash mdash mdash mdash 49 2479 CDC Golden mdash 52 25 2333 36 2396 Polstead mdash 49 mdash mdash 37 2183 DS-Admiral 35 45 22 3210 43 1405 SW Circus 33 43 26 1766 39 1326 Weighted Average Dryland Field Pea yield (Bu) amp total acressect 45 46782
OATS DRYLAND YIELDS BY VARIETY 2007ndash2010dagger RISK AREA 8 2007 2008 2009 2009 2010 2010Dagger Variety Yield Yield Yield Acres Yield Acres AC Morgan 89 86 51 3041 94 3077 AC Mustang 61 72 56 1879 108 2540 CDC Baler 58 mdash 41 736 87 1498 Cascade 48 73 mdash mdash 88 527 Derby 68 70 43 371 106 416 Weighted Average Dryland Oats yield (Bu) amp total acressect 93 9646
FLAX DRYLAND YIELDS BY VARIETY 2007ndash2010dagger RISK AREA 8 2007 2008 2009 2009 2010 2010Dagger Variety Yield Yield Yield Acres Yield Acres CDC Bethune mdash 35 24 1374 33 1366 Weighted Average Dryland Flax yield (Bu) amp total acressect 31 1736
CANARY SEED DRYLAND YIELDS BY VARIETY 2007ndash2010dagger RISK AREA 8 2007 2008 2009 2009 2010 2010Dagger Variety Yield Yield Yield Acres Yield Acres Keet mdash mdash mdash mdash 1531 1041 Weighted Average Dryland Canary Seed yield (Lbs) amp total acressect 1531 1041
RISK AREA 9
WHEAT DRYLAND YIELDS BY VARIETY 2007ndash2010dagger RISK AREA 9 2007 2008 2009 2009 2010 2010Dagger Variety Yield Yield Yield Acres Yield Acres Lillian (HRS) 28 32 17 72887 38 76030 AC Eatonia (HRS) 27 28 23 62626 31 66786 Harvest (HRS) 34 38 23 59669 36 56671 Strongfield (D) 34 36 30 31240 42 23563 AC Barrie (HRS) 28 31 21 16701 32 14466 Superb (HRS) 30 36 22 13063 32 11856 AC Cadillac (HRS) 27 28 12 13442 30 10371 AC Andrew (SWS) 51 52 29 7107 51 8620 Prodigy (HRS) 28 36 17 9995 33 7758 CDC Go (HRS) mdash 48 28 5264 40 6603 AC Avonlea (D) 30 36 34 14402 33 6033 CDC Abound (HRS) mdash mdash 30 2482 43 6023 AC Elsa (HRS) 28 34 21 9654 34 5994 Infinity (HRS) 38 43 35 3348 46 4982
WHEAT DRYLAND YIELDS BY VARIETY 2007ndash2010dagger RISK AREA 9 2007 2008 2009 2009 2010 2010Dagger Variety Yield Yield Yield Acres Yield Acres McKenzie (HRS) 28 35 28 4284 37 4118 AC Crystal (CPS) 43 42 24 3510 46 3976 CDC Imagine (HRS) 35 38 27 4484 38 3791 Columbus (HRS) 26 27 12 3383 31 2947 Radiant (HRW) 30 44 22 8871 41 2208 Kyle (D) 24 27 23 4541 28 1770 Weighted Average Dryland Wheat yield (Bu) amp total acressect 36 342701
CANOLA DRYLAND YIELDS BY VARIETY 2007ndash2010dagger RISK AREA 9 2007 2008 2009 2009 2010 2010Dagger Variety Yield Yield Yield Acres Yield Acres 71-45RR 21 26 16 18947 29 26129 5440 mdash 32 21 11463 37 14862 45H26 mdash 33 21 4354 30 9444 45H28 mdash mdash 22 2799 30 6444 34-65 15 23 6 4789 24 6102 8440 mdash 29 20 4809 37 4479 9553 mdash mdash 24 6273 36 3735 5030 27 31 24 6687 31 3718 9590 31 35 31 4381 41 3453 5020 27 33 16 6312 36 2769 5770 mdash mdash mdash mdash 43 2714 Nex 845 CL mdash 29 20 1666 30 2627 1818 21 27 14 4444 21 2171 8571 mdash mdash mdash mdash 14 2049 9552 mdash mdash 24 760 26 1927 1651H mdash 21 mdash mdash 23 1842 46P50 21 29 18 1908 40 1719 9551 15 21 12 1893 34 1568 D3151 mdash mdash mdash mdash 33 1078 Rugby mdash mdash 12 905 34 910 72-65 RR mdash mdash mdash mdash 34 850 Weighted Average Dryland Canola yield (Bu) amp total acressect 31 131376
BARLEY DRYLAND YIELDS BY VARIETY 2007ndash2010dagger RISK AREA 9 2007 2008 2009 2009 2010 2010Dagger Variety Yield Yield Yield Acres Yield Acres Xena 44 56 36 24186 56 26647 AC Metcalfe 39 48 34 24992 48 20716 CDC Cowboy mdash 51 14 9496 47 16044 Conlon 33 58 32 5639 53 7681 McLeod mdash 59 32 4321 51 5924 Seebe 29 29 21 3552 42 4578 CDC Dolly 39 35 20 2761 47 2588 CDC Copeland 44 51 31 3785 40 2218 Ponoka 40 43 25 4342 66 2213 Bridge 28 34 22 2188 28 1993 Champion mdash mdash mdash mdash 68 1822 Weighted Average Dryland Barley yield (Bu) amp total acressect 50 99351
FIELD PEA DRYLAND YIELDS BY VARIETY 2007ndash2010dagger RISK AREA 9 2007 2008 2009 2009 2010 2010Dagger Variety Yield Yield Yield Acres Yield Acres CDC Golden 28 34 6 8404 34 9528 Eclipse 25 30 11 7625 16 4648 CDC Meadow mdash mdash 26 1062 35 3184 SW Midas mdash 32 15 4142 24 2356 Delta 29 31 6 4692 32 2081 DS-Admiral 31 44 22 4979 26 1702 Weighted Average Dryland Field Pea yield (Bu) amp total acressect 31 32039
OATS DRYLAND YIELDS BY VARIETY 2007ndash2010dagger RISK AREA 9 2007 2008 2009 2009 2010 2010Dagger Variety Yield Yield Yield Acres Yield Acres Derby 35 36 28 5499 70 4624 Calibre 39 45 23 5550 63 3585 AC Mustang 20 46 26 3163 73 2213 AC Morgan 43 48 25 2217 76 2186 Waldern 34 49 17 1681 78 1753 Weighted Average Dryland Oats yield (Bu) amp total acressect 69 18313
MUSTARD DRYLAND YIELDS BY VARIETY 2007ndash2010dagger RISK AREA 9 2007 2008 2009 2009 2010 2010Dagger Variety Yield Yield Yield Acres Yield Acres AC Pennant (Yellow) 10 12 mdash mdash 17 2345 Weighted Average Dryland Mustard yield (Bu) amp total acressect 17 9757
36 yield AlBeRTA 2011
dagger Yields only for those varieties grown by 5 or more producers Dagger On system as of January 19 2011sect Weighted Average Yield and Total Acreage include acres not reported in the table
LENTIL DRYLAND YIELDS BY VARIETY 2007ndash2010dagger RISK AREA 9 2007 2008 2009 2009 2010 2010Dagger Variety Yield Yield Yield Acres Yield Acres CDC Maxim mdash mdash mdash mdash 1704 1599 Weighted Average Dryland Lentil yield (Lbs) amp total acressect 1523 7581
RISK AREA 10
WHEAT DRYLAND YIELDS BY VARIETY 2007ndash2010dagger RISK AREA 10 2007 2008 2009 2009 2010 2010Dagger Variety Yield Yield Yield Acres Yield Acres AC Foremost (CPS) 81 83 57 24156 65 21770 Superb (HRS) 59 63 55 4107 64 3254 AC Crystal (CPS) 68 67 62 2031 57 2095 5700 PR (CPS) 58 82 61 1389 67 1211 5701 PR (CPS) mdash 68 48 1900 57 882 CDC Imagine (HRS) mdash 56 mdash mdash 27 870 Harvest (HRS) 39 mdash mdash mdash 58 718 Weighted Average Dryland Wheat yield (Bu) amp total acressect 62 35639
CANOLA DRYLAND YIELDS BY VARIETY 2007ndash2010dagger RISK AREA 10 2007 2008 2009 2009 2010 2010Dagger Variety Yield Yield Yield Acres Yield Acres 5440 mdash 56 46 16945 46 21964 9553 mdash mdash 42 5974 44 7820 5020 39 48 36 8721 44 7641 72-55 RR mdash mdash 45 3161 44 4384 71-45RR 38 48 34 2998 35 3724 9590 28 50 36 718 45 2480 45S51 mdash mdash mdash mdash 38 2426 8440 mdash mdash 39 1787 35 1949 45H28 mdash mdash 32 3425 52 1440 4414 RR mdash mdash mdash mdash 38 1399 1818 34 38 27 1009 33 1369 D3150 mdash mdash 49 973 51 962 45H26 mdash 46 39 2037 41 900 9350 mdash mdash mdash mdash 49 788 997 RR mdash mdash 25 542 30 743 72-35 RR mdash mdash mdash mdash 42 698 Weighted Average Dryland Canola yield (Bu) amp total acressect 43 76042
BARLEY DRYLAND YIELDS BY VARIETY 2007ndash2010dagger RISK AREA 10 2007 2008 2009 2009 2010 2010Dagger Variety Yield Yield Yield Acres Yield Acres Ponoka 71 77 67 8935 71 7941 Seebe 56 60 56 8316 61 6395 Xena 73 89 87 3888 85 5201 Sundre mdash 83 69 2746 63 4696 AC Metcalfe 65 76 75 1642 76 2854 Vivar mdash 66 65 607 74 821 Stander 50 66 mdash mdash 73 715 Weighted Average Dryland Barley yield (Bu) amp total acressect 69 35998
FIELD PEA DRYLAND YIELDS BY VARIETY 2007ndash2010dagger RISK AREA 10 2007 2008 2009 2009 2010 2010Dagger Variety Yield Yield Yield Acres Yield Acres CDC Meadow mdash mdash mdash mdash 53 1729 Cooper mdash mdash mdash mdash 59 1665 Canstar mdash mdash mdash mdash 40 1304 Polstead mdash mdash 58 1073 55 929 Weighted Average Dryland Field Pea yield (Bu) amp total acressect 50 7331
OATS DRYLAND YIELDS BY VARIETY 2007ndash2010dagger RISK AREA 10 2007 2008 2009 2009 2010 2010Dagger Variety Yield Yield Yield Acres Yield Acres AC Morgan 90 87 78 4180 100 5548 AC Mustang 56 81 99 1113 90 2854 Derby 71 72 64 1397 80 1279 Cascade 57 74 58 1071 70 625 Grizzly mdash mdash mdash mdash 74 436 Weighted Average Dryland Oats yield (Bu) amp total acressect 90 12473
RISK AREA 11
WHEAT DRYLAND YIELDS BY VARIETY 2007ndash2010dagger RISK AREA 11 2007 2008 2009 2009 2010 2010Dagger Variety Yield Yield Yield Acres Yield Acres Harvest (HRS) 57 64 48 77597 59 88829 AC Foremost (CPS) 67 75 46 63314 72 46510 Superb (HRS) 59 62 40 28660 61 27390
WHEAT DRYLAND YIELDS BY VARIETY 2007ndash2010dagger RISK AREA 11 2007 2008 2009 2009 2010 2010Dagger Variety Yield Yield Yield Acres Yield Acres CDC Go (HRS) mdash 69 45 9344 57 14844 5700 PR (CPS) 68 75 50 25748 66 14409 Snowbird (HRS) 59 62 48 6741 60 12548 CDC Imagine (HRS) 55 61 37 7900 56 8197 CDC Abound (HRS) mdash mdash 41 1802 58 7922 AC Intrepid (HRS) 56 65 45 7664 58 6853 AC Crystal (CPS) 55 65 46 8703 64 6718 Kane (HRS) mdash mdash 48 891 64 4558 5701 PR (CPS) 63 70 47 5390 75 3109 CDC Teal (HRS) 56 61 42 3766 47 2863 5702 PR (CPS) mdash mdash mdash mdash 78 2631 Prodigy (HRS) 50 62 43 3212 55 2445 Infinity (HRS) 53 57 39 3999 54 2088 AC Barrie (HRS) 48 52 29 2803 49 1836 WR 859 CL (HRS) mdash mdash mdash mdash 63 1725 Alvena (HRS) mdash mdash 44 1691 64 1656 AC Majestic (HRS) 55 51 34 2709 52 1322 Radiant (HRW) 63 61 45 3930 69 1290 5602 HR (HRS) 48 52 37 1938 48 1219 Roblin (HRS) 53 53 24 1524 49 1145 McKenzie (HRS) 43 52 26 1318 46 1104 Weighted Average Dryland Wheat yield (Bu) amp total acressect 62 268800
CANOLA DRYLAND YIELDS BY VARIETY 2007ndash2010dagger RISK AREA 11 2007 2008 2009 2009 2010 2010Dagger Variety Yield Yield Yield Acres Yield Acres 5440 mdash 51 36 50826 51 62157 5020 41 50 35 63630 50 53358 8440 mdash 52 35 33780 52 30364 72-55 RR mdash mdash 28 14745 43 23205 71-45RR 41 46 30 28440 40 20680 45H29 mdash mdash 21 265 51 18383 9553 mdash mdash 33 17605 49 17071 1818 34 45 24 12390 40 14890 45H28 mdash mdash 27 14701 43 11540 5770 mdash mdash mdash mdash 53 9921 73-67 RR mdash mdash mdash mdash 47 8099 72-65 RR mdash mdash mdash mdash 46 7665 9590 47 53 36 8778 53 7060 34-65 38 43 26 7465 43 5898 73-77 RR mdash mdash mdash mdash 47 5498 4414 RR 41 47 20 4543 40 5386 45S51 mdash mdash 33 2658 41 4449 45H26 43 49 28 13647 39 3708 9558C mdash mdash mdash mdash 50 3652 1950 mdash mdash mdash mdash 46 2519 v1037 mdash mdash 28 1824 39 1722 45H21 35 46 22 2789 40 1511 45H73 mdash mdash mdash mdash 43 1413 1852 H mdash 44 25 724 38 1377 32-75 35 38 16 1426 39 1361 73-55 RR mdash mdash mdash mdash 41 1313 45A51 mdash mdash mdash mdash 46 1228 1841 39 45 23 2191 39 1185 9552 mdash mdash mdash mdash 42 1139 997 RR mdash 39 23 3678 43 1124 34-55 36 42 26 4772 40 1114 Prairie 719RR 33 38 22 4647 33 1058 73-65 RR mdash mdash mdash mdash 47 1056 5030 45 52 35 5745 42 1010 1956 mdash mdash mdash mdash 34 1001 9551 37 38 30 1293 37 832 9555 mdash mdash mdash mdash 44 810 9550 33 42 31 842 39 732 93H01RR mdash 46 23 1047 40 553 Weighted Average Dryland Canola yield (Bu) amp total acressect 47 354621
BARLEY DRYLAND YIELDS BY VARIETY 2007ndash2010dagger RISK AREA 11 2007 2008 2009 2009 2010 2010Dagger Variety Yield Yield Yield Acres Yield Acres Xena 70 86 63 47157 82 44286 AC Metcalfe 62 79 63 30399 72 28941 Seebe 61 72 50 27132 69 27440 Ponoka 69 80 62 19177 72 15566 CDC Copeland 82 90 63 12398 85 12595 Sundre mdash 79 70 5561 73 9746 CDC Coalition mdash mdash 66 1673 78 7066 CDC Kendall 64 74 56 9361 86 6415 Vivar 75 88 61 4794 83 4998 CDC Cowboy mdash 67 27 3360 73 4615
2011 yield AlBeRTA 37
dagger Yields only for those varieties grown by 5 or more producers Dagger On system as of January 19 2011sect Weighted Average Yield and Total Acreage include acres not reported in the table
BARLEY DRYLAND YIELDS BY VARIETY 2007ndash2010dagger RISK AREA 11 2007 2008 2009 2009 2010 2010Dagger Variety Yield Yield Yield Acres Yield Acres Champion mdash mdash mdash mdash 80 3483 CDC PolarStar mdash mdash mdash mdash 84 3172 Stander 66 82 69 4976 76 2978 CDC Thompson 72 91 65 3212 85 2795 Newdale mdash mdash mdash mdash 42 2253 CDC Select 60 86 69 1581 82 2012 Conlon 67 78 41 7551 103 1746 Legacy (BT 950) mdash 91 77 977 47 1740 McLeod 64 89 69 1982 86 1646 CDC Dolly 62 66 57 1106 65 1582 CDC Bold 67 81 60 4748 69 1578 AC Lacombe 60 69 63 1231 65 697 Stockford mdash mdash mdash mdash 71 672 CDC Helgason 62 77 61 596 64 661 Excel 58 mdash 55 535 43 482 Weighted Average Dryland Barley yield (Bu) amp total acressect 76 196872
FIELD PEA DRYLAND YIELDS BY VARIETY 2007ndash2010dagger RISK AREA 11 2007 2008 2009 2009 2010 2010Dagger Variety Yield Yield Yield Acres Yield Acres Cooper 50 53 43 7180 42 8670 Thunderbird mdash mdash 48 1792 43 7192 SW Midas mdash 57 47 4189 55 3146 Polstead mdash 45 44 1106 50 2567 CDC Meadow mdash mdash 43 1314 43 2347 CDC Golden mdash mdash mdash mdash 34 2241 Canstar mdash mdash 45 906 51 2071 Nitouche 48 51 31 2134 49 1171 CDC Striker mdash mdash mdash mdash 68 753 CDC Patrick mdash mdash mdash mdash 36 580 Weighted Average Dryland Field Pea yield (Bu) amp total acressect 45 36572
OATS DRYLAND YIELDS BY VARIETY 2007ndash2010dagger RISK AREA 11 2007 2008 2009 2009 2010 2010Dagger Variety Yield Yield Yield Acres Yield Acres AC Morgan 109 100 60 10341 125 15324 Derby 97 93 52 6173 107 6730 AC Mustang 87 92 68 2391 109 2917 CDC Baler mdash mdash mdash mdash 68 478 Cascade 81 67 30 525 80 428 Murphy mdash mdash mdash mdash 60 391 Jordan mdash mdash mdash mdash 79 198 Weighted Average Dryland Oats yield (Bu) amp total acressect 114 28615
FABA BEAN DRYLAND YIELDS BY VARIETY 2007ndash2010dagger RISK AREA 11 2007 2008 2009 2009 2010 2010Dagger Variety Yield Yield Yield Acres Yield Acres Snowbird mdash 2987 2032 1936 2641 1575 Weighted Average Dryland Faba Bean yield (Lbs) amp total acressect 2651 1595
RISK AREA 12
WHEAT DRYLAND YIELDS BY VARIETY 2007ndash2010dagger RISK AREA 12 2007 2008 2009 2009 2010 2010Dagger Variety Yield Yield Yield Acres Yield Acres Harvest (HRS) 38 50 35 263481 49 267951 Superb (HRS) 39 50 36 72095 47 58686 CDC Abound (HRS) mdash mdash 37 8977 47 32406 AC Barrie (HRS) 34 39 31 29946 43 23464 CDC Imagine (HRS) 37 46 34 28766 46 18763 Prodigy (HRS) 33 39 32 15134 46 14451 CDC Go (HRS) mdash 65 36 10301 51 13487 AC Crystal (CPS) 43 50 42 11605 53 9793 Infinity (HRS) 44 49 37 17632 45 9342 AC Splendor (HRS) 32 42 27 9959 46 8634 Lillian (HRS) 37 44 35 12200 49 8465 5602 HR (HRS) 40 38 29 15149 45 7997 CDC Alsask (HRS) mdash mdash 40 1928 44 7508 Alvena (HRS) mdash mdash mdash mdash 45 6548 AC Foremost (CPS) 56 71 47 9070 60 5994 AC Intrepid (HRS) 40 55 36 9797 49 5155 AC Cadillac (HRS) 31 37 30 3926 36 4168 5701 PR (CPS) 49 52 32 4022 62 3692 Radiant (HRW) 62 56 23 5953 51 3666 Lovitt (HRS) 33 mdash mdash mdash 45 3499 McKenzie (HRS) 33 43 35 5910 48 3167
WHEAT DRYLAND YIELDS BY VARIETY 2007ndash2010dagger RISK AREA 12 2007 2008 2009 2009 2010 2010Dagger Variety Yield Yield Yield Acres Yield Acres Kane (HRS) mdash mdash 34 1468 48 2917 Unity (HRS) mdash mdash mdash mdash 55 2823 CDC Bounty (HRS) 31 41 30 3108 38 2594 5700 PR (CPS) 39 60 47 5701 61 2568 Snowbird (HRS) 37 52 37 1405 55 2250 Park (HRS) 38 37 mdash mdash 40 2103 CDC Teal (HRS) 33 41 29 3972 46 1858 CDC Osprey (HRW) mdash 56 17 2229 56 1771 AC Majestic (HRS) mdash mdash mdash mdash 43 1627 Roblin (HRS) 29 29 16 2514 36 1539 Weighted Average Dryland Wheat yield (Bu) amp total acressect 48 550692
CANOLA DRYLAND YIELDS BY VARIETY 2007ndash2010dagger RISK AREA 12 2007 2008 2009 2009 2010 2010Dagger Variety Yield Yield Yield Acres Yield Acres 5440 mdash 45 25 55116 47 79946 5020 31 41 24 81630 40 68701 8440 mdash 46 28 28396 47 33850 9553 mdash mdash 25 17477 41 26747 71-45RR 30 39 23 33356 39 25869 9590 33 40 23 21217 44 25869 72-65 RR mdash mdash 22 2470 42 19283 34-65 30 37 17 17822 35 14334 72-55 RR mdash mdash 21 18345 40 12521 46P50 31 40 24 17064 38 11455 45H26 mdash 40 23 11035 40 9537 5770 mdash mdash mdash mdash 51 8380 1818 29 38 19 5206 34 7706 46A76 24 28 21 3241 29 7063 D3150 mdash mdash 19 2054 31 6820 45S51 mdash mdash 32 623 41 6629 45H28 mdash mdash 22 6830 44 6259 71-40 CL mdash mdash 25 3691 38 4893 45A71 17 33 13 3446 37 4766 45P70 30 32 22 6878 35 4201 5030 30 37 28 7745 47 3546 9552 mdash mdash 20 1763 31 3245 1841 36 44 21 6149 37 3188 Prairie 719RR 26 33 14 6231 32 3064 v1037 mdash mdash 26 2170 35 2874 Nex 845 CL 29 34 19 8136 32 2738 45H29 mdash mdash mdash mdash 47 2592 4414 RR 30 39 18 3308 40 2464 6130 RR mdash mdash mdash mdash 35 2426 1950 mdash mdash mdash mdash 35 2335 6040 RR mdash mdash mdash mdash 35 2273 45H73 31 36 21 2554 36 2061 NX4-104 RR mdash mdash 24 2591 33 1937 9550 21 32 14 1753 41 1761 9555 mdash mdash mdash mdash 36 1698 34-55 32 38 19 3272 41 1419 32-75 25 34 25 1192 39 1307 5525 CL mdash mdash mdash mdash 40 1214 45H21 30 37 17 3737 34 989 5505 CL mdash mdash mdash mdash 35 856 9350 mdash mdash mdash mdash 35 703 73-45 RR mdash mdash mdash mdash 55 696 72-35 RR mdash mdash mdash mdash 47 398 Weighted Average Dryland Canola yield (Bu) amp total acressect 41 455233
BARLEY DRYLAND YIELDS BY VARIETY 2007ndash2010dagger RISK AREA 12 2007 2008 2009 2009 2010 2010Dagger Variety Yield Yield Yield Acres Yield Acres Xena 53 72 56 54771 75 54064 AC Metcalfe 49 65 52 42407 71 32827 CDC Copeland 51 70 44 25950 77 26256 CDC Cowboy mdash 53 31 13118 68 22516 Seebe 40 50 29 9744 47 8394 CDC Coalition mdash mdash 63 2635 83 5986 Champion mdash mdash mdash mdash 75 5673 CDC Kendall 47 67 44 8844 67 4339 Ponoka 56 55 34 3052 59 2649 Newdale 61 91 58 1876 80 1870 CDC Dolly 43 60 14 1714 57 1375 Conlon 61 71 46 4178 63 1026 Sundre mdash mdash mdash mdash 69 1004 Bentley mdash mdash mdash mdash 83 611 Weighted Average Dryland Barley yield (Bu) amp total acressect 72 176655
38 yield AlBeRTA 2011
dagger Yields only for those varieties grown by 5 or more producers Dagger On system as of January 19 2011sect Weighted Average Yield and Total Acreage include acres not reported in the table
FIELD PEA DRYLAND YIELDS BY VARIETY 2007ndash2010dagger RISK AREA 12 2007 2008 2009 2009 2010 2010Dagger Variety Yield Yield Yield Acres Yield Acres Cooper 42 51 34 17870 35 19289 CDC Meadow mdash mdash 21 1080 34 7552 SW Midas 30 46 26 7221 37 7136 CDC Golden 28 41 22 12107 40 7071 DS-Admiral 32 44 23 8751 31 5169 Eclipse 34 43 26 8194 35 4079 Polstead mdash mdash 31 2111 40 3509 Thunderbird mdash mdash 34 1532 40 3357 SW Capri 37 48 26 4455 45 2128 Sorento mdash mdash mdash mdash 52 1746 CDC Patrick mdash mdash mdash mdash 41 1716 Stratus 34 39 32 1002 25 1360 CDC Sage mdash mdash mdash mdash 40 881 Weighted Average Dryland Field Pea yield (Bu) amp total acressect 36 78464
OATS DRYLAND YIELDS BY VARIETY 2007ndash2010dagger RISK AREA 12 2007 2008 2009 2009 2010 2010Dagger Variety Yield Yield Yield Acres Yield Acres AC Morgan 62 63 44 2875 117 4376 Derby 40 64 31 5641 78 3916 AC Mustang 52 52 36 2804 64 2719 CDC Baler 42 55 39 2469 89 1929 7600M mdash 87 48 884 75 1743 Waldern 63 85 29 1483 68 1179 Calibre 45 60 44 843 99 686 Foothill mdash mdash mdash mdash 75 538 Cascade 33 59 19 589 61 431 Grizzly 37 43 32 634 59 348 Weighted Average Dryland Oats yield (Bu) amp total acressect 85 19985
LENTIL DRYLAND YIELDS BY VARIETY 2007ndash2010dagger RISK AREA 12 2007 2008 2009 2009 2010 2010Dagger Variety Yield Yield Yield Acres Yield Acres CDC Maxim mdash mdash mdash mdash 823 1214 Weighted Average Dryland Lentil yield (Lbs) amp total acressect 828 2392
RISK AREA 13
WHEAT DRYLAND YIELDS BY VARIETY 2007ndash2010dagger RISK AREA 13 2007 2008 2009 2009 2010 2010Dagger Variety Yield Yield Yield Acres Yield Acres Harvest (HRS) 41 50 44 274405 52 275980 Superb (HRS) 39 48 41 49446 49 38648 Prodigy (HRS) 34 42 35 35197 46 24624 5700 PR (CPS) 50 60 50 25598 57 23219 AC Splendor (HRS) 35 42 39 21916 46 18280 CDC Go (HRS) mdash 54 45 7138 56 14835 CDC Imagine (HRS) 33 47 42 14299 51 12928 AC Crystal (CPS) 45 55 48 17658 58 12557 CDC Abound (HRS) mdash mdash 42 3357 53 11924 AC Barrie (HRS) 34 40 35 13402 46 11498 CDC Alsask (HRS) mdash mdash 37 5454 56 11405 McKenzie (HRS) 38 48 42 13377 46 8894 Kane (HRS) mdash mdash 42 1912 50 8144 AC Intrepid (HRS) 41 50 42 7087 53 6702 5701 PR (CPS) 50 55 49 4756 57 6134 Infinity (HRS) 34 45 41 9238 56 5973 CDC Teal (HRS) 37 44 36 5970 51 5227 AC Foremost (CPS) 52 68 52 7883 67 4575 AC Taber (CPS) 52 56 61 3887 72 3494 Snowbird (HRS) 38 45 44 3557 51 3471 AC Domain (HRS) mdash mdash mdash mdash 49 3310 Laura (HRS) 31 36 35 3223 37 2640 Alvena (HRS) mdash mdash 48 863 50 2205 Journey (HRS) 41 40 46 2991 41 2047 5602 HR (HRS) 42 42 38 2360 48 1968 AC Elsa (HRS) 35 34 mdash mdash 51 1736 Roblin (HRS) 35 39 35 3273 36 1645 Katepwa (HRS) 31 34 31 3220 40 1526 Radiant (HRW) mdash 49 41 2770 53 1384 Unity (HRS) mdash mdash mdash mdash 51 1119 CDC Bounty (HRS) 38 mdash mdash mdash 50 1087 Weighted Average Dryland Wheat yield (Bu) amp total acressect 51 538528
CANOLA DRYLAND YIELDS BY VARIETY 2007ndash2010dagger RISK AREA 13 2007 2008 2009 2009 2010 2010Dagger Variety Yield Yield Yield Acres Yield Acres 5020 33 42 27 95077 43 74271 5440 mdash 44 31 78292 48 71780 9590 35 45 33 48788 48 63694
CANOLA DRYLAND YIELDS BY VARIETY 2007ndash2010dagger RISK AREA 13 2007 2008 2009 2009 2010 2010Dagger Variety Yield Yield Yield Acres Yield Acres 9553 mdash mdash 25 36455 45 50803 8440 mdash 43 31 28741 48 41520 72-55 RR mdash 48 28 24855 43 35154 72-65 RR mdash mdash 35 1335 45 31225 45H28 mdash 41 26 17752 42 21955 45H26 35 40 27 20108 43 18031 34-65 29 36 22 17897 38 17653 71-45RR 33 39 29 29373 42 15505 9552 mdash mdash 17 10029 37 14937 46P50 33 40 25 21083 43 14252 5030 34 41 32 11403 46 9121 1818 27 34 20 7506 37 8127 45H73 mdash 40 22 5734 45 7174 5770 mdash mdash mdash mdash 53 6856 45P70 34 42 32 5312 40 6682 SP DesirableRR 28 38 26 7279 37 5765 45H29 mdash mdash mdash mdash 65 5080 4414 RR 33 36 21 3412 39 4373 46A76 26 33 22 7005 34 4371 45H21 30 38 21 7276 38 4102 1768S mdash 36 29 1806 39 4027 v1037 mdash mdash 20 1875 38 3881 9550 28 33 29 3895 38 3520 9551 26 29 17 10595 33 3465 9555 mdash mdash mdash mdash 41 3269 D3150 mdash mdash 30 1694 44 2790 1950 mdash mdash mdash mdash 46 2564 73-55 RR mdash mdash mdash mdash 48 2555 9350 mdash mdash mdash mdash 38 2478 997 RR mdash 37 18 4185 30 2435 SP Banner 25 33 26 3671 40 2299 Prairie 719RR 27 30 20 5000 31 2165 Rugby mdash 36 9 1489 33 1899 5525 CL mdash mdash mdash mdash 39 1688 1141 mdash 39 23 3380 45 1442 1145 mdash mdash mdash mdash 49 1359 71-40 CL mdash mdash 23 1775 33 1273 45S51 mdash mdash 27 2928 42 1065 D3151 mdash mdash mdash mdash 42 995 6130 RR mdash mdash mdash mdash 33 901 6040 RR mdash mdash mdash mdash 33 786 72-35 RR mdash mdash mdash mdash 41 762 34-55 31 36 22 2454 40 545 Weighted Average Dryland Canola yield (Bu) amp total acressect 44 603036
BARLEY DRYLAND YIELDS BY VARIETY 2007ndash2010dagger RISK AREA 13 2007 2008 2009 2009 2010 2010Dagger Variety Yield Yield Yield Acres Yield Acres Xena 56 74 62 67051 75 61541 AC Metcalfe 52 67 59 61918 66 49976 CDC Cowboy mdash 59 42 14157 63 19724 CDC Copeland 55 72 63 22076 76 17888 Champion mdash mdash 75 939 83 11295 Seebe 48 58 44 8363 61 5663 CDC Dolly 44 56 44 6575 54 4402 CDCTrey 51 69 60 3086 78 4361 Sundre mdash mdash 44 1785 68 2826 CDC Kendall 50 67 54 5478 64 2728 Ponoka 51 54 42 3728 58 2444 Trochu 65 78 62 1749 81 2417 Conlon 53 65 50 2012 49 1420 CDC Bold 61 70 38 5617 56 1202 CDC Coalition mdash mdash mdash mdash 69 1104 CDC PolarStar mdash mdash mdash mdash 64 1074 AC Lacombe 38 52 43 372 36 475 Weighted Average Dryland Barley yield (Bu) amp total acressect 70 198073
FIELD PEA DRYLAND YIELDS BY VARIETY 2007ndash2010dagger RISK AREA 13 2007 2008 2009 2009 2010 2010Dagger Variety Yield Yield Yield Acres Yield Acres SW Midas 39 48 39 21107 39 22216 CDC Meadow mdash mdash 38 1773 48 10228 DS-Admiral 33 49 30 9032 40 8325 Thunderbird mdash mdash 35 2918 54 6869 Swing 34 47 35 8517 37 5340 CDC Golden mdash 48 45 2053 43 3735 Eclipse 35 43 33 4646 33 3690 Eiffel 36 44 35 3263 37 2956 Cooper 43 49 42 3234 43 2466 CDC Striker mdash mdash mdash mdash 45 2225
2011 YIELD ALBERTA 39
FIELD PEA DRYLAND YIELDS BY VARIETY 2007ndash2010dagger RISK AREA 13 2007 2008 2009 2009 2010 2010Dagger Variety Yield Yield Yield Acres Yield Acres Cutlass FP 28 42 36 1683 38 2130 Profi mdash mdash 45 1692 37 1820 Carneval 32 38 35 754 47 1613 Weighted Average Dryland Field Pea yield (Bu) amp total acressect 42 79070
OATS DRYLAND YIELDS BY VARIETY 2007ndash2010dagger RISK AREA 13 2007 2008 2009 2009 2010 2010Dagger Variety Yield Yield Yield Acres Yield Acres AC Morgan 80 95 59 11557 111 11587 Derby 63 79 51 6491 97 7281 AC Mustang 61 85 30 2164 114 1790 CDC Baler 43 84 50 1578 78 1417 Calibre 68 65 47 662 95 1266 Waldern 36 mdash 54 645 66 1006 7600M 53 mdash 48 689 73 951 Weighted Average Dryland Oats yield (Bu) amp total acressect 101 27617
RISK AREA 14
WHEAT DRYLAND YIELDS BY VARIETY 2007ndash2010dagger RISK AREA 14 2007 2008 2009 2009 2010 2010Dagger Variety Yield Yield Yield Acres Yield Acres AC Foremost (CPS) mdash 74 69 4493 76 5876 5700 PR (CPS) mdash mdash 64 1673 78 1854 Weighted Average Dryland Wheat yield (Bu) amp total acressect 70 11669
CANOLA DRYLAND YIELDS BY VARIETY 2007ndash2010dagger RISK AREA 14 2007 2008 2009 2009 2010 2010Dagger Variety Yield Yield Yield Acres Yield Acres 5440 mdash 49 47 5989 51 4806 5020 43 45 44 1032 44 3237 9553 mdash mdash 39 5459 41 2981 72-55 RR mdash mdash mdash mdash 47 1483 45H28 mdash mdash 42 761 36 879 Weighted Average Dryland Canola yield (Bu) amp total acressect 43 23002
BARLEY DRYLAND YIELDS BY VARIETY 2007ndash2010dagger RISK AREA 14 2007 2008 2009 2009 2010 2010Dagger Variety Yield Yield Yield Acres Yield Acres Ponoka 62 67 69 2301 73 3036 Sundre mdash mdash 86 1660 81 2237 Seebe 53 56 57 1656 49 1367 Xena mdash 74 89 1726 61 1231 AC Metcalfe 62 69 74 1804 81 997 Weighted Average Dryland Barley yield (Bu) amp total acressect 69 10227
OATS DRYLAND YIELDS BY VARIETY 2007ndash2010dagger RISK AREA 14 2007 2008 2009 2009 2010 2010Dagger Variety Yield Yield Yield Acres Yield Acres Derby 74 74 83 1678 86 1944 AC Morgan 105 102 68 2223 87 1933 AC Mustang 99 mdash mdash mdash 133 405 Weighted Average Dryland Oats yield (Bu) amp total acressect 89 5632
RISK AREA 15
WHEAT DRYLAND YIELDS BY VARIETY 2007ndash2010dagger RISK AREA 15 2007 2008 2009 2009 2010 2010Dagger Variety Yield Yield Yield Acres Yield Acres AC Foremost (CPS) 73 77 60 37406 74 36944 Harvest (HRS) 47 55 46 25025 51 26150 5700 PR (CPS) 61 70 52 21615 66 15044 Superb (HRS) 57 57 44 7445 56 12003 AC Crystal (CPS) 49 62 54 9651 67 11102 CDC Abound (HRS) mdash mdash 43 1061 58 6199 CDC Imagine (HRS) 41 53 52 3520 54 3203 5701 PR (CPS) 62 79 55 3069 66 2336 Infinity (HRS) mdash 63 50 659 52 2077 Roblin (HRS) 47 57 46 1624 52 1933 CDC Go (HRS) mdash mdash mdash mdash 57 1794 5702 PR (CPS) mdash mdash 48 2785 65 1787 AC Intrepid (HRS) 51 60 46 1234 50 1743
dagger Yields only for those varieties grown by 5 or more producers Dagger On system as of January 19 2011sect Weighted Average Yield and Total Acreage include acres not reported in the table
All the pArts bull All the serviceAll the time
wwwaglandcorpcom
All the pArts bull All the serviceAll the time
St paul hwy 29 amp hwy 881 south
(780) 645-4437
Vermilion4915 47th Avenue
(780) 853-5367
lloydminSterhwy 16 rr 14(780) 875-4471
complete SolutionS come Standard
Save now on utility tractors Balers amp mocoswith powerful performance exceptional reliability and advanced technology John Deere has been a trusted partner in the farming community for generations plus when your John Deere equipment comes from Agland it comes backed by superior service and support no matter the task at hand John Deere equipment and the experts at Agland will help you make the most of your land
40 yield AlBeRTA 2011
dagger Yields only for those varieties grown by 5 or more producers Dagger On system as of January 19 2011sect Weighted Average Yield and Total Acreage include acres not reported in the table
WHEAT DRYLAND YIELDS BY VARIETY 2007ndash2010dagger RISK AREA 15 2007 2008 2009 2009 2010 2010Dagger Variety Yield Yield Yield Acres Yield Acres AC Splendor (HRS) 34 mdash 38 1303 45 1620 CDC Alsask (HRS) mdash mdash mdash mdash 56 1474 Prodigy (HRS) 46 52 41 2727 54 1397 McKenzie (HRS) 42 mdash mdash mdash 59 867 Weighted Average Dryland Wheat yield (Bu) amp total acressect 62 135631
CANOLA DRYLAND YIELDS BY VARIETY 2007ndash2010dagger RISK AREA 15 2007 2008 2009 2009 2010 2010Dagger Variety Yield Yield Yield Acres Yield Acres 5020 37 47 39 41165 48 41083 5440 mdash 51 43 36604 52 34409 72-55 RR mdash mdash 37 13906 47 21522 9553 mdash 50 37 10680 46 20533 9590 39 51 40 16370 52 18874 8440 mdash 50 40 6100 54 10127 45H28 mdash mdash 35 9593 49 9597 71-45RR 37 42 32 14638 46 9413 34-65 35 41 29 9894 42 7432 1818 35 41 32 5476 44 6050 SP DesirableRR mdash 39 25 5842 41 5048 45H26 45 44 34 6964 46 4892 72-65 RR mdash mdash mdash mdash 48 4089 9550 28 35 48 1719 52 4030 72-35 RR mdash mdash mdash mdash 49 3633 5770 mdash mdash mdash mdash 49 3630 45H29 mdash mdash mdash mdash 53 3383 45S51 mdash mdash mdash mdash 49 3183 5030 37 45 36 5259 48 2877 4414 RR 33 41 20 1069 40 2337 D3151 mdash mdash mdash mdash 42 2013 D3150 mdash mdash mdash mdash 50 1829 Nex 845 CL mdash 42 28 1761 45 1585 9552 mdash mdash 25 1489 36 1576 34-55 33 38 33 1818 45 1569 9555 mdash mdash mdash mdash 40 1385 9551 29 34 11 1622 41 1154 Prairie 719RR 31 34 31 2518 42 1125 32-75 32 33 23 3213 39 1110 46P50 38 43 33 2443 50 1075 71-40 CL mdash mdash 35 780 33 994 73-55 RR mdash mdash mdash mdash 54 958 430 mdash mdash mdash mdash 37 865 997 RR mdash 39 33 1582 39 754 73-67 RR mdash mdash mdash mdash 50 709 45P70 mdash 43 34 1171 32 420 Weighted Average Dryland Canola yield (Bu) amp total acressect 48 248888
BARLEY DRYLAND YIELDS BY VARIETY 2007ndash2010dagger RISK AREA 15 2007 2008 2009 2009 2010 2010Dagger Variety Yield Yield Yield Acres Yield Acres Xena 62 75 69 23112 74 25410 AC Metcalfe 62 73 70 21029 76 20625 Seebe 57 61 53 16602 67 12677 Ponoka 60 73 64 8015 73 9322 CDC Cowboy mdash 65 54 4835 70 7732 CDC Copeland 64 74 66 5031 65 4730 CDC Coalition mdash 87 mdash mdash 85 2953 Champion mdash mdash mdash mdash 84 2488 Sundre mdash mdash 72 1101 79 2417 Vivar 74 84 60 2350 88 1985 CDC Thompson 80 91 73 1738 84 1508 Trochu mdash 95 79 2344 84 1283 Stander 67 76 60 1956 68 1058 AC Lacombe 52 69 65 1178 85 692 Weighted Average Dryland Barley yield (Bu) amp total acressect 74 100554
FIELD PEA DRYLAND YIELDS BY VARIETY 2007ndash2010dagger RISK AREA 15 2007 2008 2009 2009 2010 2010Dagger Variety Yield Yield Yield Acres Yield Acres Canstar mdash mdash 58 1967 52 3813 Cooper mdash mdash 52 1352 51 2751 CDC Meadow mdash mdash mdash mdash 62 1739 SW Midas 45 50 42 1764 41 1595 Weighted Average Dryland Field Pea yield (Bu) amp total acressect 50 17154
OATS DRYLAND YIELDS BY VARIETY 2007ndash2010dagger RISK AREA 15 2007 2008 2009 2009 2010 2010Dagger Variety Yield Yield Yield Acres Yield Acres AC Morgan 97 110 73 15310 106 18082 Derby 63 72 52 3047 76 2368 AC Mustang 64 68 52 1728 101 1470 Weighted Average Dryland Oats yield (Bu) amp total acressect 102 22811
RISK AREA 16
WHEAT DRYLAND YIELDS BY VARIETY 2007ndash2010dagger RISK AREA 16 2007 2008 2009 2009 2010 2010Dagger Variety Yield Yield Yield Acres Yield Acres AC Foremost (CPS) mdash mdash mdash mdash 89 659 Weighted Average Dryland Wheat yield (Bu) amp total acressect 69 3155
CANOLA DRYLAND YIELDS BY VARIETY 2007ndash2010dagger RISK AREA 16 2007 2008 2009 2009 2010 2010Dagger Variety Yield Yield Yield Acres Yield Acres 9553 mdash mdash mdash mdash 45 2849 5020 mdash mdash mdash mdash 41 1703 Weighted Average Dryland Canola yield (Bu) amp total acressect 42 11495
OATS DRYLAND YIELDS BY VARIETY 2007ndash2010dagger RISK AREA 16 2007 2008 2009 2009 2010 2010Dagger Variety Yield Yield Yield Acres Yield Acres Derby 68 102 mdash mdash 93 816 Weighted Average Dryland Oats yield (Bu) amp total acressect 97 1188
RISK AREA 17
WHEAT DRYLAND YIELDS BY VARIETY 2007ndash2010dagger RISK AREA 17 2007 2008 2009 2009 2010 2010Dagger Variety Yield Yield Yield Acres Yield Acres CDC Teal (HRS) 50 31 28 5458 20 7614 CDC Alsask (HRS) mdash mdash mdash mdash 32 1060 Weighted Average Dryland Wheat yield (Bu) amp total acressect 30 17904
CANOLA DRYLAND YIELDS BY VARIETY 2007ndash2010dagger RISK AREA 17 2007 2008 2009 2009 2010 2010Dagger Variety Yield Yield Yield Acres Yield Acres 5020 mdash mdash 36 5563 17 5245 45H28 mdash mdash mdash mdash 20 4970 71-45RR mdash 30 33 1535 39 3491 72-55 RR mdash mdash mdash mdash 35 1460 9553 mdash mdash 16 1356 15 1036 Weighted Average Dryland Canola yield (Bu) amp total acressect 24 27967
RISK AREA 18
WHEAT DRYLAND YIELDS BY VARIETY 2007ndash2010dagger RISK AREA 18 2007 2008 2009 2009 2010 2010Dagger Variety Yield Yield Yield Acres Yield Acres Harvest (HRS) 56 31 33 17745 37 12470 5700 PR (CPS) 62 35 44 9575 37 8004 AC Splendor (HRS) 49 19 26 5909 19 5785 AC Intrepid (HRS) 57 31 39 5735 31 5293 Superb (HRS) mdash 43 43 3277 38 4349 CDC Teal (HRS) mdash 26 31 3857 24 4315 CDC Alsask (HRS) mdash mdash mdash mdash 35 2465 Weighted Average Dryland Wheat yield (Bu) amp total acressect 33 50349
CANOLA DRYLAND YIELDS BY VARIETY 2007ndash2010dagger RISK AREA 18 2007 2008 2009 2009 2010 2010Dagger Variety Yield Yield Yield Acres Yield Acres 5020 42 24 29 17318 17 11210 71-45RR 43 25 29 10326 18 7336 72-55 RR mdash mdash mdash mdash 24 6651 45H26 mdash 28 38 6158 21 5899 430 mdash mdash 34 1421 15 5771 45H28 mdash mdash mdash mdash 20 4099 5440 mdash mdash mdash mdash 29 2927 32-75 28 23 21 1379 12 2394 43A56 36 19 25 2568 20 1679
2011 yield AlBeRTA 41
dagger Yields only for those varieties grown by 5 or more producers Dagger On system as of January 19 2011sect Weighted Average Yield and Total Acreage include acres not reported in the table
CANOLA DRYLAND YIELDS BY VARIETY 2007ndash2010dagger RISK AREA 18 2007 2008 2009 2009 2010 2010Dagger Variety Yield Yield Yield Acres Yield Acres 5525 CL mdash mdash mdash mdash 8 1412 SP DesirableRR mdash mdash 21 1265 14 1360 45S51 mdash mdash mdash mdash 18 429 Weighted Average Dryland Canola yield (Bu) amp total acressect 19 63778
BARLEY DRYLAND YIELDS BY VARIETY 2007ndash2010dagger RISK AREA 18 2007 2008 2009 2009 2010 2010Dagger Variety Yield Yield Yield Acres Yield Acres AC Metcalfe 62 36 47 6214 39 3257 Weighted Average Dryland Barley yield (Bu) amp total acressect 40 7170
FIELD PEA DRYLAND YIELDS BY VARIETY 2007ndash2010dagger RISK AREA 18 2007 2008 2009 2009 2010 2010Dagger Variety Yield Yield Yield Acres Yield Acres SW Midas mdash 26 36 2283 27 4488 CDC Meadow mdash mdash mdash mdash 40 2317 Weighted Average Dryland Field Pea yield (Bu) amp total acressect 30 8499
OATS DRYLAND YIELDS BY VARIETY 2007ndash2010dagger RISK AREA 18 2007 2008 2009 2009 2010 2010Dagger Variety Yield Yield Yield Acres Yield Acres Derby 93 39 47 939 64 4487 AC Morgan 107 37 55 4556 47 2978 AC Mustang mdash mdash 64 814 43 1110 Weighted Average Dryland Oats yield (Bu) amp total acressect 53 9202
RISK AREA 19
WHEAT DRYLAND YIELDS BY VARIETY 2007ndash2010dagger RISK AREA 19 2007 2008 2009 2009 2010 2010Dagger Variety Yield Yield Yield Acres Yield Acres Harvest (HRS) 54 46 39 93077 34 93732 Superb (HRS) 56 44 40 43243 36 38536 AC Intrepid (HRS) 54 36 34 34877 29 27871 CDC Teal (HRS) 49 39 31 29229 29 22429 Prodigy (HRS) 50 36 37 16037 35 14799 Infinity (HRS) 63 39 39 15137 27 11411 CDC Alsask (HRS) mdash mdash 32 3216 34 11072 AC Splendor (HRS) 47 35 37 11584 30 10728 Alvena (HRS) mdash mdash 32 1716 24 8305 CDC Osprey (HRW) 47 mdash 36 4008 44 7680 AC Foremost (CPS) 41 34 42 5469 32 4547 5700 PR (CPS) 62 50 36 13860 31 4272 5701 PR (CPS) mdash 50 46 6878 41 3512 AC Elsa (HRS) 50 27 32 4617 30 3292 McKenzie (HRS) 48 35 32 3215 23 3194 Radiant (HRW) mdash mdash 40 3391 45 2976 CDC Go (HRS) mdash mdash mdash mdash 31 2108 Roblin (HRS) 40 28 23 3027 24 2058 CDC Imagine (HRS) mdash 38 34 3697 36 1914 CDC Abound (HRS) mdash mdash mdash mdash 29 1728 Peace (HRS) mdash 36 32 2020 33 1607 Weighted Average Dryland Wheat yield (Bu) amp total acressect 33 283387
CANOLA DRYLAND YIELDS BY VARIETY 2007ndash2010dagger RISK AREA 19 2007 2008 2009 2009 2010 2010Dagger Variety Yield Yield Yield Acres Yield Acres 5020 38 27 31 106358 22 109870 72-55 RR mdash 24 31 16863 25 61966 71-45RR 38 26 32 67226 23 43200 45H28 mdash mdash 32 14612 26 29044 5440 mdash 32 32 31375 26 22555 8440 mdash 28 30 18317 29 19770 45H26 45 29 33 26290 25 19478 34-65 33 27 26 10671 22 17422 72-65 RR mdash mdash 29 466 22 16858 32-75 32 19 21 16489 13 16525 9553 mdash mdash 30 11992 21 15538 72-35 RR mdash mdash 30 5785 16 12238 9350 mdash mdash mdash mdash 22 10175 43H57 mdash 24 23 3838 18 8116 71-40 CL mdash mdash 24 6093 16 7983 9590 41 26 31 11659 18 7723 45S51 mdash mdash 25 976 18 6483
CANOLA DRYLAND YIELDS BY VARIETY 2007ndash2010dagger RISK AREA 19 2007 2008 2009 2009 2010 2010Dagger Variety Yield Yield Yield Acres Yield Acres 45H29 mdash mdash mdash mdash 30 5569 SP DesirableRR mdash 21 26 7686 18 5556 43A56 30 19 24 11076 14 5372 45A71 30 19 16 4171 10 5209 5770 mdash mdash mdash mdash 28 4972 9552 mdash mdash 25 1281 18 4071 45H24 37 20 25 5139 17 3855 430 mdash mdash 24 1953 18 3697 45P70 40 23 mdash mdash 23 3498 Cafe 33 10 19 4399 15 2610 45H73 mdash 30 24 2519 23 2235 73-45 RR mdash mdash mdash mdash 21 2014 4414 RR mdash 17 29 1425 15 1728 5525 CL mdash mdash mdash mdash 18 1457 45H21 34 19 27 2591 25 1445 Rugby mdash mdash 25 999 13 1345 46P50 38 32 mdash mdash 23 1181 4362 RR mdash 12 20 2819 16 1159 6040 RR mdash mdash mdash mdash 22 550 Weighted Average Dryland Canola yield (Bu) amp total acressect 22 505632
BARLEY DRYLAND YIELDS BY VARIETY 2007ndash2010dagger RISK AREA 19 2007 2008 2009 2009 2010 2010Dagger Variety Yield Yield Yield Acres Yield Acres AC Metcalfe 65 47 62 25329 42 23277 Xena 78 50 65 8593 47 9689 CDC Copeland 79 53 60 8712 44 7932 Ponoka 74 41 73 3055 57 3711 Champion mdash mdash mdash mdash 44 1984 CDC Cowboy mdash mdash 55 918 40 1937 Seebe 68 52 mdash mdash 42 1907 Sundre mdash 25 22 833 41 1602 CDC Helgason 60 mdash mdash mdash 31 942 Weighted Average Dryland Barley yield (Bu) amp total acressect 43 58931
FIELD PEA DRYLAND YIELDS BY VARIETY 2007ndash2010dagger RISK AREA 19 2007 2008 2009 2009 2010 2010Dagger Variety Yield Yield Yield Acres Yield Acres SW Midas mdash 30 36 11093 23 13330 Cutlass FP 45 33 33 9894 26 13082 Cooper mdash 17 39 3362 29 5298 CDC Meadow mdash mdash mdash mdash 30 3970 Eclipse 52 22 30 3481 20 2946 SW Parade 39 21 mdash mdash 24 1298 Garde mdash 16 mdash mdash 31 1240 Carneval 42 25 21 2517 17 1181 Weighted Average Dryland Field Pea yield (Bu) amp total acressect 25 50561
OATS DRYLAND YIELDS BY VARIETY 2007ndash2010dagger RISK AREA 19 2007 2008 2009 2009 2010 2010Dagger Variety Yield Yield Yield Acres Yield Acres Derby 102 70 77 8886 59 11483 AC Morgan 114 54 70 6502 55 8309 AC Mustang 94 mdash mdash mdash 38 566 Weighted Average Dryland Oats yield (Bu) amp total acressect 55 21581
CREEPING RED FESCUE DRYLAND YIELDS BY VARIETY 2007ndash2010dagger RISK AREA 19
2007 2008 2009 2009 2010 2010Dagger Variety Yield Yield Yield Acres Yield Acres Boreal 428 521 422 2294 244 884 Weighted Average Dryland Creeping Red Fescue yield (Lbs) amp total acressect 229 962
RISK AREA 20
WHEAT DRYLAND YIELDS BY VARIETY 2007ndash2010dagger RISK AREA 20 2007 2008 2009 2009 2010 2010Dagger Variety Yield Yield Yield Acres Yield Acres Harvest (HRS) 51 51 41 17033 37 18383 AC Intrepid (HRS) 51 54 41 9691 37 7875 CDC Teal (HRS) 48 52 42 8477 37 7731
42 yield AlBeRTA 2011
dagger Yields only for those varieties grown by 5 or more producers Dagger On system as of January 19 2011sect Weighted Average Yield and Total Acreage include acres not reported in the table
WHEAT DRYLAND YIELDS BY VARIETY 2007ndash2010dagger RISK AREA 20 2007 2008 2009 2009 2010 2010Dagger Variety Yield Yield Yield Acres Yield Acres Roblin (HRS) 51 48 40 5661 34 5345 McKenzie (HRS) mdash 44 mdash mdash 34 3849 CDC Alsask (HRS) mdash mdash mdash mdash 42 1908 Weighted Average Dryland Wheat yield (Bu) amp total acressect 40 55904
CANOLA DRYLAND YIELDS BY VARIETY 2007ndash2010dagger RISK AREA 20 2007 2008 2009 2009 2010 2010Dagger Variety Yield Yield Yield Acres Yield Acres 71-45RR 35 36 31 17186 26 18523 5020 39 36 30 15633 31 16425 8440 mdash mdash mdash mdash 37 7450 72-55 RR mdash mdash 30 5557 35 6595 32-75 29 28 21 10639 21 4937 4362 RR mdash mdash mdash mdash 15 3643 72-65 RR mdash mdash mdash mdash 23 3215 72-35 RR mdash mdash 29 4405 32 2271 34-65 mdash mdash mdash mdash 31 1106 71-40 CL mdash mdash mdash mdash 22 1056 Weighted Average Dryland Canola yield (Bu) amp total acressect 29 79284
BARLEY DRYLAND YIELDS BY VARIETY 2007ndash2010dagger RISK AREA 20 2007 2008 2009 2009 2010 2010Dagger Variety Yield Yield Yield Acres Yield Acres AC Metcalfe 60 63 69 1498 70 2807 Xena mdash mdash 55 1556 66 2113 Weighted Average Dryland Barley yield (Bu) amp total acressect 59 10207
FIELD PEA DRYLAND YIELDS BY VARIETY 2007ndash2010dagger RISK AREA 20 2007 2008 2009 2009 2010 2010Dagger Variety Yield Yield Yield Acres Yield Acres DS-Admiral 57 50 30 2298 25 3825 Cooper mdash mdash mdash mdash 49 840 Weighted Average Dryland Field Pea yield (Bu) amp total acressect 26 11605
OATS DRYLAND YIELDS BY VARIETY 2007ndash2010dagger RISK AREA 20 2007 2008 2009 2009 2010 2010Dagger Variety Yield Yield Yield Acres Yield Acres Derby 98 90 85 2280 92 3522 Weighted Average Dryland Oats yield (Bu) amp total acressect 86 4090
RISK AREA 21
WHEAT DRYLAND YIELDS BY VARIETY 2007ndash2010dagger RISK AREA 21 2007 2008 2009 2009 2010 2010Dagger Variety Yield Yield Yield Acres Yield Acres Harvest (HRS) 42 53 49 21282 39 21450 Superb (HRS) 57 64 50 14684 40 7390 CDC Go (HRS) mdash 53 54 7252 45 7263 5700 PR (CPS) 62 43 43 6403 35 6231 AC Intrepid (HRS) 54 32 37 4471 30 5069 AC Foremost (CPS) mdash 59 63 5087 39 3448 CDC Teal (HRS) 46 25 26 1802 22 1476 AC Splendor (HRS) 46 32 29 2784 22 1397 Alvena (HRS) mdash mdash mdash mdash 32 1040 Park (HRS) mdash mdash 25 684 25 505 Weighted Average Dryland Wheat yield (Bu) amp total acressect 37 63781
CANOLA DRYLAND YIELDS BY VARIETY 2007ndash2010dagger RISK AREA 21 2007 2008 2009 2009 2010 2010Dagger Variety Yield Yield Yield Acres Yield Acres 5020 43 37 30 26598 29 48390 32-75 26 13 20 16044 14 13709 72-55 RR mdash mdash 24 2213 29 8120 71-45RR 32 33 27 7870 26 5887 8440 mdash 47 40 3722 22 5716 SP DesirableRR mdash mdash 11 1560 16 5699 72-35 RR mdash mdash 13 3446 16 4953 430 mdash mdash 11 1390 22 4873 43A56 25 23 16 7659 19 3759 45H28 mdash mdash 30 5552 30 2985 45H73 mdash mdash mdash mdash 18 1906 9350 mdash mdash mdash mdash 17 1822 SW Spirit River 17 mdash mdash mdash 16 1447 Cafe mdash mdash 17 1055 4 1287 41P55 mdash mdash mdash mdash 7 752 Weighted Average Dryland Canola yield (Bu) amp total acressect 24 133560
BARLEY DRYLAND YIELDS BY VARIETY 2007ndash2010dagger RISK AREA 21 2007 2008 2009 2009 2010 2010Dagger Variety Yield Yield Yield Acres Yield Acres AC Metcalfe 59 43 50 10946 35 8540 Ponoka 78 76 50 4068 75 6520 Xena 65 45 56 5169 52 2599 Sundre mdash mdash 48 2387 38 1450 CDC Copeland 70 39 mdash mdash 36 1067 AC Albright 52 28 mdash mdash 33 896 Weighted Average Dryland Barley yield (Bu) amp total acressect 48 27696
FIELD PEA DRYLAND YIELDS BY VARIETY 2007ndash2010dagger RISK AREA 21 2007 2008 2009 2009 2010 2010Dagger Variety Yield Yield Yield Acres Yield Acres Cutlass FP mdash mdash 31 2264 27 6897 Eclipse 44 27 24 2953 15 4458 CDC Meadow mdash mdash mdash mdash 28 2069 SW Midas 39 mdash 31 1191 28 1280 Carneval mdash 20 mdash mdash 18 955 Nitouche mdash mdash mdash mdash 7 842 Weighted Average Dryland Field Pea yield (Bu) amp total acressect 21 21175
OATS DRYLAND YIELDS BY VARIETY 2007ndash2010dagger RISK AREA 21 2007 2008 2009 2009 2010 2010Dagger Variety Yield Yield Yield Acres Yield Acres AC Morgan 97 52 61 3809 77 6789 Derby 77 mdash 36 680 65 2271 AC Mustang 93 48 mdash mdash 33 600 Weighted Average Dryland Oats yield (Bu) amp total acressect 69 14618
RISK AREA 22
WHEAT DRYLAND YIELDS BY VARIETY 2007ndash2010dagger RISK AREA 22 2007 2008 2009 2009 2010 2010Dagger Variety Yield Yield Yield Acres Yield Acres Alikat (HRS) 45 54 60 6359 53 5355 AC Intrepid (HRS) mdash 46 48 4557 52 4232 CDC Teal (HRS) 33 41 38 4038 36 3429 Roblin (HRS) 41 45 46 5990 41 3132 CDC Imagine (HRS) mdash 45 41 1908 42 2513 Infinity (HRS) mdash mdash 53 2175 52 2388 Weighted Average Dryland Wheat yield (Bu) amp total acressect 47 27442
CANOLA DRYLAND YIELDS BY VARIETY 2007ndash2010dagger RISK AREA 22 2007 2008 2009 2009 2010 2010Dagger Variety Yield Yield Yield Acres Yield Acres 5020 34 39 32 29254 36 33686 32-75 30 29 28 13052 31 12283 71-45RR mdash 37 32 7156 31 7382 72-35 RR mdash mdash 33 3795 36 6567 5440 mdash mdash 35 1788 40 4218 43H57 mdash mdash 33 2646 31 2182 45H26 mdash mdash mdash mdash 33 1331 Weighted Average Dryland Canola yield (Bu) amp total acressect 35 76968
BARLEY DRYLAND YIELDS BY VARIETY 2007ndash2010dagger RISK AREA 22 2007 2008 2009 2009 2010 2010Dagger Variety Yield Yield Yield Acres Yield Acres AC Metcalfe 58 62 65 1358 68 1072 Weighted Average Dryland Barley yield (Bu) amp total acressect 67 3210
FIELD PEA DRYLAND YIELDS BY VARIETY 2007ndash2010dagger RISK AREA 22 2007 2008 2009 2009 2010 2010Dagger Variety Yield Yield Yield Acres Yield Acres DS-Admiral 45 53 46 7148 52 4824 Cutlass FP mdash mdash 41 1760 45 2455 SW Midas mdash mdash mdash mdash 32 839 Weighted Average Dryland Field Pea yield (Bu) amp total acressect 48 8535
OATS DRYLAND YIELDS BY VARIETY 2007ndash2010dagger RISK AREA 22 2007 2008 2009 2009 2010 2010Dagger Variety Yield Yield Yield Acres Yield Acres AC Morgan 129 135 116 2045 130 4377 Weighted Average Dryland Oats yield (Bu) amp total acressect 124 5393
Behold the undisputed cereal seed treatment champion With new micro-dispersion technology Raxilreg MD provides cereal growers with uniform seed coverage for superior plant protection and an increased return on your investment
Score an easy victory over true loose smut seed-and soil-bourne fusarium and knock out all the most serious early season cereal diseases ndash without the application struggle
For more information visit BayerCropSciencecaRaxil
Victory without the fight
BayerCropScienceca or 1 888-283-6847 or contact your Bayer CropScience representativeAlways read and follow label directions Raxilreg is a registered trademark of Bayer Bayer CropScience is a member of CropLife Canada
0111-15296A
15296A RaxilMD_Victory_FBCindd 1 12111 238 PM
Our high-yielding hybrids are here And theyrsquore backed by healthier agronomic performance even healthier demand from our customers plus a Healthier Profi t Guarantee More Nexera canola acres are needed now to meet the current demand for heart-healthy Omega-9 Oils So take advantage of this profi table canola opportunity Talk to your local Nexera canola crusher or retailer And contract today
Accomplish even more With Nexera canola hybrids Call our Solutions Center at 18006673852 Or visit healthierprofi tsca
NOW THE PROFIT IS REALLY FLOWING ndash WITH OUR NEW HYBRID CANOLA VARIETIES
TMTrademark of Dow AgroSciences LLC0211-15855-2
THE NEXERATM CANOLA
HYBRID EXPLOSIONHEALTHIER YIELDS
BY THE BUSHEL EVEN MORE PROFIT
BY THE BOTTLE
NEXERATM CANOLA
HYBRIDSPlanting
Now
15855-2 Yield Alberta 8125X1075indd 1 11-01-27 1034 AM
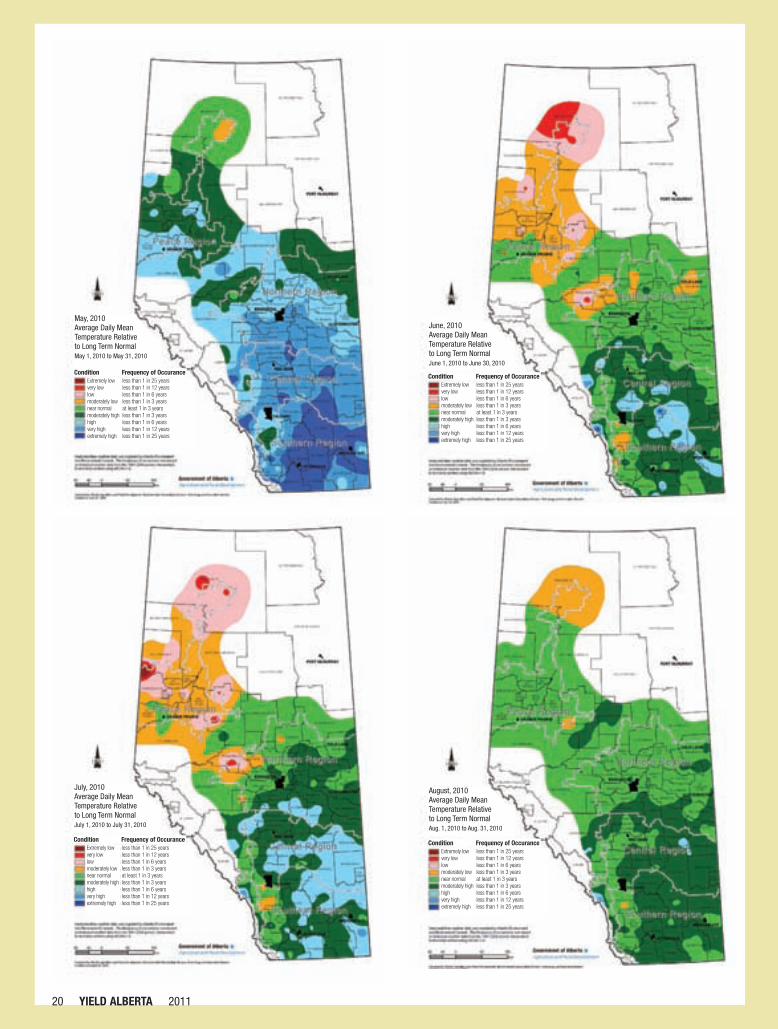

All purchases are subject to the terms of labelling and purchase documents reg TM SM Trademarks and service marks licensed to Pioneer Hi-Bred Limited copy 2011 PHL PR1610 Yield MN Grower_G_E
With industry-leading research and seed genetics Pioneer Hi-Bred is bringing a new level of performance to western Canadian growers We were the first company to bring new traits for sclerotinia and clubroot resistance to canola And wersquore also leading with the development and introduction of early maturity locally adapted corn hybrids
Wersquore also covering a lot of ground with the service and support we deliver to our customers You can count on your local Pioneer Hi-Bred sales rep to help you build a high yielding crop Plus theyrsquore backed by one of the strongest agronomic teams in the business
Pioneer Hi-Bred Wersquore gaining new ground where it matters most ndash in your fields
Seed genetics that aregaining new ground
Ask your local Pioneer Hi-Bred sales rep for a seed recommendation for your fields
Craig SchmidtBarrhead (780) 674-4828
FDH Holdings LtdBawlf (780) 608-8491
Danny NobbsBonanza (780) 864-1289
Jill Feniak-SplaneBoyle (780) 689-3386
Gordon FrankBrooks (403) 362-7299
You1st Enterprises LtdCalgary (403) 239-4215
Herb de HoogCamrose (780) 672-2339
Hal Creek Seed Company IncClyde (780) 348-2629
AJM Seeds LtdCoalhurst (403) 308-6685
Consort Agro Services LtdConsort (403) 577-3020
Colin PellerinDebolt (780) 957-2000
Lyndon PopovitchFairview (780) 835-4356
Ron WielerFort Vermilion (780) 927-4255
David SammonsGleichen (403) 934-0940
Lorne CampbellGrimshaw (780) 618-5220
Smoky Seed Company LtdGuy (780) 837-1334
Kelsey SolickHalkirk (403) 884-2358
EampA Land and Cattle Ltd Hayter (780) 753-6666
David Moroz Killam (780) 385-5353
All In Farm Services LtdKitscoty (780) 847-2022
Next Generation Seeds LtdManning (780) 836-7771
Sandrsquos Seed Farm LtdMcLaughlin (780) 745-2251
Gateway Agra Services LtdMedicine Hat (403) 526-9499
K amp S Sharpe Farms LtdMunson (403) 823-6761
Diadem Ag EnterprisesNanton (403) 646-5839
Ellis Agriculture LtdOlds (403) 556-1258
Accur-AgPonoka (403) 588-4689
Darcy KoesterRockyford (403) 901-3560
Jason TolsmaSpruce Grove Calmar (780) 446-1082
Myron ZabolotniukSt Albert (780) 915-6920
Gerald FodchukSt Brides (780) 645-3720
Ron WirstaSt Paul (780) 645-3939
Lee Van RingenStettler (403) 741-9067
Taber Home and Farm CentreTaber (403) 223-8948
Chris and Holly DraderTangent (780) 359-2727
Bauer Six LtdTorrington (403) 994-1149
Deryk SanfordVegreville Fort Saskatchewan (780) 632-9699
Dwayne AndrashewskiVegreville Two Hills (780) 336-4808
Webbrsquos Crop ServicesVermilion (780) 853-6565
Kittle Farms LtdViking (780) 336-2583
Markert Seeds LtdVulcan (403) 485-6708
Dalton Seed Farm IncWainwright (780) 842-2361
Hegland Seed FarmWembley (780) 766-2450
Sylvan RaaenRolla BC (250) 219-1778
PR1646 Alb Yield_G_E3indd 1 070211 445 PM
24 yield AlBeRTA 2011
3
4
5
2
6
7
8
9
1
7
3
4
8
5
6
9
11
11
51
95
71
42
50
79
27
83
48
75
59
67
52
63
15
91
99
72
39
68
60
49
28
76
23
55
96
84
64
87
80
88
16
24
40
36
92
65
53
56
61
69
77
25
47
73
18
29
70
12
57
19
41
37
94
89
13
85
97
54
81
93
66
20
17
35
78
21
62
10
14
26
82
38
58
74
30
33
90
98
32
22
31
86
43
34
44
45
46
83
67
71
91
39
64
59
36
65
19
31
37
59
75
15
27
63
87
51
55
48
38
60
66
76
99
79
92
22
43
47
24
60
83
16
20
52
23
68
28
78
56
52
84
51
88
33
73
40
75
53
84
32
6161
62
49
95
17
29
71
69
77
57
25
79
10
34
53
80
93
91
44
62
85
89
67
99
55
41
72
54
81
58
76
18
26
54
96
30
80
92
45
72
57
96
95
42
58
90
74
21
86
68
94
82
81
50
77
85
97
93
46
73
69
97
87
64
88
12
63
86
78
70
74
98
56
94
70
89
65
82
98
90
66
35
13
14
111111
111
119
115
116
112
117
113
118
114
110
126
119
115115
112
119
116116
112
117
113113
117
110
118
114
110
114
118
103
123
100
124
104
120
101
105
125
121
102
122
126
106
126
107
108
109
123
120
123
120
103
104
107
124
108
103
108
109
121
101
105
109
107
125124
100
121
104
122
106
122
101100
125
102102
105
106
9
23
2
47 56
48
86 9
7 69
9
5
2
3
7
8
58
2
4
9
36
2
9 8 678
35 4
2
6 5
3
2
4
4
5
4
53
7
2
9
74
8
69
59
8 57 4
2
3
6 35
37
8
2
2
3
4
9 458 67
684
7 6 5 4
9
39 8 2
35 4
345 278 6
3
2
7
9
6
4
9
3 2457
7
8
3
89
7
69
2
2
2
7
45
67
6
389
5
6
5
9 78
8
26 35 4
3
1111
11
11
11
11
11
1111
11
11
11
11
11
11
11
11
21
10
12
18 13 101216 1512
25
1021
19 1419
22 17
22
19
2324
15
13
14
18
20
10
23
12
1316
182310
1714
19
24
18
12
10
26
23
25
22 21
13 10
29
25
12
1423 21
24
2024
26
13
24 21
19
22 18
22 15
21
17
20
14 1616 1220
27
16
25
15 14
23
10
17
12
1521 17
28
26
10
1823
15
16 13
13
1719
10
1024
221012
12
12
21
14
22
23 13
18 25 20
25
15
10
1922
27
21 18 1620 1921 1722 2010
22
19
1314
28
18 12
26
23
17 2419
10
13
14
1516 22 211214
25
25
17
10
12 18
17
13
20
15
15
16
15
14 10
20
17
26
23 192024
27
16
16
22
12
18
18
1223 1520 14 1319 162124
25
17
24
27 26
23
20
1925
13
141521 16 1018 1723 13 12
22 20
24
24
1326
26
2727
4
9
14
2
20
3
5
1
15
8
13
21
11
22
7
10
6
19
16
12
17
18
Oyen
Olds
Taber
Hanna
Leduc
Vulcan
Ponoka
Lamont
Falher
Castor
Brooks
Provost
Manning
Lacombe
Camrose
Airdrie
Westlock
Thorhild
Stettler
St Paul
Grimshaw
Foremost
Fairview
Cardston
Barrhead
Red Deer
Vermilion
Sedgewick
Athabasca
Wainwright
Vegreville
Strathmore
Smoky Lake
High River
Claresholm
Lethbridge
Drumheller
Three Hills
Spirit River
High Prairie
Medicine Hat
Fort Vermilion
Grande Prairie
28
13
29
Valleyview
Stony Plain
Crop Risk Areas
Central Office
Regional Offices
AgriInsurance District Offices
RISK AREAS
2011 yield AlBeRTA 25
dagger Yields only for those varieties grown by 5 or more producers Dagger On system as of January 19 2011sect Weighted Average Yield and Total Acreage include acres not reported in the table
ALBERTA
WHEAT DRYLAND YIELDS BY VARIETY 2007ndash2010dagger ALBERTA 2007 2008 2009 2009 2010 2010Dagger Variety Yield Yield Yield Acres Yield Acres Harvest (HRS) 44 52 39 1212390 49 1182518 Lillian (HRS) 33 38 32 506206 41 529934 CDC Go (HRS) 53 59 41 318268 52 430052 Superb (HRS) 43 51 42 362570 44 318801 AC Eatonia (HRS) 25 29 33 229417 34 249139 AC Foremost (CPS) 66 75 53 190035 69 162010 Strongfield (D) 32 41 37 318183 44 146266 5700 PR (CPS) 57 65 51 188770 59 133822 CDC Imagine (HRS) 38 47 36 137003 47 119137 CDC Abound (HRS) mdash mdash 37 28183 49 116084 AC Intrepid (HRS) 47 48 39 121751 42 99061 Prodigy (HRS) 37 41 33 97765 42 82197 CDC Teal (HRS) 43 43 34 88686 33 67939 AC Barrie (HRS) 34 37 29 80738 40 65649 AC Splendor (HRS) 38 39 33 73774 37 60949 AC Crystal (CPS) 47 55 46 64640 57 53779 Radiant (HRW) 48 50 36 101078 53 50462 AC Avonlea (D) 28 38 35 114093 42 46209 Infinity (HRS) 46 47 39 62798 43 45198 CDC Alsask (HRS) mdash 43 37 12331 45 43703 McKenzie (HRS) 36 41 34 51256 40 42186 Alvena (HRS) mdash 54 44 10665 42 31123 5701 PR (CPS) 58 59 47 37935 57 28978 Snowbird (HRS) 44 48 44 25177 54 24866 Kane (HRS) mdash 64 38 9732 52 24299 Roblin (HRS) 38 42 34 36660 39 23230 AC Elsa (HRS) 37 41 31 35758 36 22389 AC Navigator (D) 40 43 40 52438 43 21323 5602 HR (HRS) 43 42 31 29192 44 17793 AC Cadillac (HRS) 30 31 18 19707 33 16560 5702 PR (CPS) mdash mdash 54 5329 62 15218 CDC Osprey (HRW) 43 50 28 12871 48 14500 Kyle (D) 24 34 30 41861 34 13614 Snowstar (HRS) mdash mdash 45 9574 45 13226 AC Abbey (HRS) 32 39 29 15909 39 12636 AC Andrew (SWS) 52 56 30 9102 50 12459 Journey (HRS) 40 47 36 18994 47 10867 WR 859 CL (HRS) mdash mdash mdash mdash 51 8733 CDC Bounty (HRS) 36 45 34 5220 42 8326 Columbus (HRS) 28 31 26 10739 34 8288 Katepwa (HRS) 28 34 28 9287 34 8136 Unity (HRS) mdash 48 48 447 53 8043 AC Bellatrix (HRW) 40 47 34 31063 51 7678 Laura (HRS) 28 33 29 8499 33 7299 Leader (HRS) 23 28 38 3880 37 6924 CDC Buteo (HRW) 36 48 38 3670 58 6121 Park (HRS) 37 38 30 6773 28 5844 Alikat (HRS) 46 53 58 6777 51 5684 Lovitt (HRS) 36 47 mdash mdash 48 5632 AC Taber (CPS) 41 44 45 9190 72 5441 Goodeve (HRS) mdash mdash mdash mdash 60 4798 AC Majestic (HRS) 44 43 32 6234 44 4548 AC Domain (HRS) 37 43 35 5023 46 4198 Oslo (CPS) 62 77 77 4523 82 4129 Stettler (HRS) mdash mdash 42 3191 48 3974 CDC Clair (HRW) 54 60 44 3502 59 3806 AC Morse (D) 26 28 36 13640 38 3756 CDC Makwa (HRS) 21 25 15 5010 21 3442 AC Michael (HRS) 22 31 27 2060 30 2535 Glenn (HRS) mdash mdash mdash mdash 39 2390 Biggar (CPS) 41 41 33 1481 27 1785 Peace (HRS) mdash 36 32 2020 32 1687 Waskada (HRS) mdash mdash mdash mdash 51 1676 Lancer (HRS) 30 39 24 877 50 1628 Neepawa (HRS) 29 26 30 1596 39 1283 Thatcher (HRS) 22 32 32 850 31 1154 CDC Falcon (HRW) 54 72 35 1331 71 1153 Sceptre (D) 29 42 33 1675 40 770 Bluesky (ES) mdash 36 mdash mdash 27 701 Sadash (SWS) mdash mdash mdash mdash 62 287 Weighted Average Dryland Wheat yield (Bu) amp total acressect 47 4506547
WHEAT IRRIGATED YIELDS BY VARIETY 2007ndash2010dagger ALBERTA 2007 2008 2009 2009 2010 2010Dagger Variety Yield Yield Yield Acres Yield Acres CDC Go (HRS) 72 70 77 47588 71 53415 Superb (HRS) 73 69 71 63671 66 53195
WHEAT IRRIGATED YIELDS BY VARIETY 2007ndash2010dagger ALBERTA 2007 2008 2009 2009 2010 2010Dagger Variety Yield Yield Yield Acres Yield Acres CDC Abound (HRS) mdash mdash 68 8098 59 22431 Strongfield (D) 80 76 77 44162 74 13915 Glenn (HRS) mdash mdash mdash mdash 49 9503 Radiant (HRW) 93 87 96 5831 87 8326 Lillian (HRS) 53 64 59 8750 53 5527 AC Andrew (SWS) 88 84 84 10480 77 5141 Sadash (SWS) mdash mdash mdash mdash 69 3715 AC Navigator (D) 77 81 70 15186 63 3608 CDC Imagine (HRS) 64 59 54 10294 47 3484 Snowstar (HRS) mdash mdash 74 2710 58 3135 Harvest (HRS) 70 75 52 3099 59 3030 WR 859 CL (HRS) mdash mdash mdash mdash 70 2235 AC Morse (D) 67 73 66 5903 61 2211 CDC Bounty (HRS) mdash mdash mdash mdash 64 1925 5700 PR (CPS) mdash mdash mdash mdash 82 1888 Stettler (HRS) mdash mdash 69 872 78 1687 Waskada (HRS) mdash mdash mdash mdash 50 1113 AC Meena (SWS) 85 91 87 942 82 770 AC Crystal (CPS) 68 97 75 3275 58 768 Kane (HRS) mdash mdash 65 3524 84 681 AC Eatonia (HRS) mdash 35 35 507 29 427 Weighted Average Irrigated Wheat yield (Bu) amp total acressect 67 208978
CANOLA DRYLAND YIELDS BY VARIETY 2007ndash2010dagger ALBERTA 2007 2008 2009 2009 2010 2010Dagger Variety Yield Yield Yield Acres Yield Acres 5440 mdash 45 33 457363 45 560836 5020 36 40 30 572062 36 532664 71-45RR 35 38 30 420133 33 335701 72-55 RR mdash 37 29 150694 35 264407 8440 mdash 45 33 230431 44 243925 9553 mdash 45 29 153012 40 194991 9590 36 44 32 151670 45 167694 45H28 mdash 40 30 107053 36 140868 72-65 RR mdash mdash 25 6419 39 107347 45H26 37 39 30 123848 34 99691 34-65 29 35 23 82700 33 80617 32-75 30 26 23 81061 22 66523 5770 mdash mdash mdash mdash 47 65361 1818 28 34 24 51086 34 61673 72-35 RR mdash mdash 27 24492 29 45416 45H29 mdash mdash 28 410 46 44431 9552 mdash mdash 20 18926 32 37095 45S51 mdash mdash 32 11841 37 36579 SP DesirableRR 28 35 24 38288 30 34085 46P50 31 41 26 47461 40 33978 5030 33 41 33 62268 44 31134 v1037 mdash mdash 28 14332 33 27262 D3151 mdash mdash 33 7153 35 26228 4414 RR 32 37 24 22073 35 25598 430 mdash mdash 24 7018 24 25415 9350 mdash mdash 27 4019 28 24933 1841 32 41 24 51341 34 24856 45H73 34 39 24 16844 36 23901 1950 mdash mdash mdash mdash 39 23527 45P70 33 35 27 16598 34 21930 Nex 845 CL 29 36 26 39590 33 21144 71-40 CL mdash 41 24 16263 27 19880 9550 26 33 28 14298 41 17739 43H57 mdash 29 27 22244 24 15737 45A71 27 30 16 13192 27 15089 1852 H 34 42 24 21325 30 14440 45H21 32 38 24 32860 35 14405 D3150 mdash mdash 27 11557 39 14298 43A56 30 22 21 25255 18 13267 46A76 25 30 23 12741 30 12732 Prairie 719RR 29 35 22 31744 30 12693 1145 mdash mdash mdash mdash 43 12558 997 RR 23 35 23 20101 28 12444 93H01RR mdash 44 26 7772 34 11563 NX4-104 RR mdash mdash 26 24711 32 11426 9555 mdash mdash mdash mdash 35 11328 9551 25 29 20 26119 34 10936 73-67 RR mdash mdash mdash mdash 46 10391 5525 CL mdash mdash mdash mdash 31 10333 45H24 33 32 25 14048 26 10086 4362 RR 32 33 22 10994 21 10051 6040 RR mdash mdash mdash mdash 37 9732
26 yield AlBeRTA 2011
dagger Yields only for those varieties grown by 5 or more producers Dagger On system as of January 19 2011sect Weighted Average Yield and Total Acreage include acres not reported in the table
CANOLA DRYLAND YIELDS BY VARIETY 2007ndash2010dagger ALBERTA 2007 2008 2009 2009 2010 2010Dagger Variety Yield Yield Yield Acres Yield Acres 1141 mdash 39 25 9694 38 9399 73-55 RR mdash mdash mdash mdash 41 8924 73-45 RR mdash mdash mdash mdash 35 8836 Rugby mdash 31 18 5091 27 7406 6130 RR mdash mdash mdash mdash 34 6974 9558C mdash mdash mdash mdash 40 6933 73-77 RR mdash mdash mdash mdash 46 6769 34-55 33 37 25 15608 39 6766 Reward 21 20 19 6054 17 6189 NX4-105 RR mdash mdash mdash mdash 38 6142 6020 RR mdash mdash mdash mdash 32 5966 8571 mdash mdash 17 1941 18 5796 5070 33 38 29 12902 40 5571 1768S mdash 38 30 2896 41 5030 Cafe 28 19 18 7223 13 4576 SP Banner 25 33 24 9964 37 4570 1956 mdash mdash mdash mdash 38 4326 Red River 1826 mdash 19 24 5413 21 4052 73-65 RR mdash mdash mdash mdash 41 3894 SW 6802 27 35 20 5616 24 3690 5505 CL mdash mdash 18 1363 28 3517 45H25 35 36 28 5605 33 3472 SP 621 RR 29 36 28 8819 31 3410 45A51 24 36 27 2348 43 2846 1651H mdash 29 20 3473 28 2762 1896 29 33 24 2823 22 2421 ACS-C7 mdash 15 16 1579 10 2250 73-35 RR mdash mdash mdash mdash 37 2228 SW Spirit River 17 10 mdash mdash 14 1832 45H72 27 32 17 3605 43 1725 46A65 28 38 14 1217 24 1687 D3152 mdash mdash mdash mdash 36 1660 4424 RR mdash mdash 26 2106 34 1657 Tobin 19 17 mdash mdash 14 1641 1855 H mdash 38 30 2803 37 1546 SW 3950 27 41 28 2240 33 1531 v1040 mdash mdash mdash mdash 28 1515 NX4-102 RR mdash mdash 22 10676 33 1474 83S01RR mdash 42 30 2640 39 1437 41P55 23 17 mdash mdash 15 1414 Canterra 1867 20 41 21 5155 39 1412 NX4-106 RR mdash mdash mdash mdash 31 1224 501 37 45 31 1741 38 1176 519RR mdash 52 44 916 42 1108 v2030 mdash mdash 30 4745 30 929 5108 32 29 12 3112 26 737 71-20CL 31 29 25 2558 45 509 9556 mdash mdash mdash mdash 50 463 Weighted Average Dryland Canola yield (Bu) amp total acressect 37 3926077
CANOLA IRRIGATED YIELDS BY VARIETY 2007ndash2010dagger ALBERTA 2007 2008 2009 2009 2010 2010Dagger Variety Yield Yield Yield Acres Yield Acres 5440 mdash 54 55 19054 50 27219 72-55 RR mdash mdash 47 3550 46 5457 71-45RR 45 46 51 8227 45 5289 45H28 mdash mdash 48 4265 45 3681 72-65 RR mdash mdash mdash mdash 45 3044 1841 46 49 44 5840 47 2950 5770 mdash mdash mdash mdash 52 2417 9553 mdash mdash 47 2667 43 2398 45S51 mdash mdash mdash mdash 43 2283 9590 42 54 42 1293 46 1624 46P50 45 46 46 1064 48 1542 8440 mdash 59 52 1485 52 1480 NX4-105 RR mdash mdash mdash mdash 40 1149 5020 48 53 50 1173 53 1138 NX4-104 RR mdash mdash 41 1878 48 897 v1037 mdash mdash mdash mdash 54 887 Nex 845 CL mdash 47 36 2763 36 768 45H26 49 56 52 1334 45 743 D3151 mdash mdash mdash mdash 32 642 1950 mdash mdash mdash mdash 44 554 Weighted Average Irrigated Canola yield (Bu) amp total acressect 47 75598
BARLEY DRYLAND YIELDS BY VARIETY 2007ndash2010dagger ALBERTA 2007 2008 2009 2009 2010 2010Dagger Variety Yield Yield Yield Acres Yield Acres Xena 55 73 62 643079 68 591246 AC Metcalfe 52 67 55 533515 64 476043
BARLEY DRYLAND YIELDS BY VARIETY 2007ndash2010dagger ALBERTA 2007 2008 2009 2009 2010 2010Dagger Variety Yield Yield Yield Acres Yield Acres CDC Copeland 59 73 55 208794 72 204463 CDC Cowboy 67 57 35 70124 61 115292 Ponoka 61 68 56 94737 67 89838 Conlon 53 65 46 95753 60 76818 Champion mdash mdash 65 11514 72 72433 Seebe 53 60 47 83084 61 72008 Sundre mdash 71 59 34761 67 50329 CDC Coalition 63 82 60 19066 74 47240 CDC Kendall 54 76 53 42968 72 27965 CDC Dolly 45 60 48 33083 54 23797 Newdale 56 74 56 20843 68 20738 Vivar 71 83 67 17142 78 19742 McLeod 62 70 52 20817 68 19044 CDC Bold 58 64 57 26021 66 18274 Formosa mdash 72 51 14086 78 18089 Stander 60 75 65 25118 75 16694 Bridge 39 56 49 17471 41 15409 CDCTrey 54 78 68 12288 82 13633 CDC Thompson 57 94 66 15451 89 12908 CDC Helgason 52 67 56 13890 64 11468 Trochu 60 83 59 12183 78 11306 Lacey 64 81 47 16630 73 10144 Harrington 40 51 42 19459 40 9147 Legacy (BT 950) 57 66 67 7997 66 7126 AC Lacombe 55 63 51 10459 45 6262 CDC Yorkton 55 69 66 5484 68 6177 CDC Meredith mdash mdash 85 690 81 5370 CDC PolarStar mdash mdash mdash mdash 74 5197 Niobe 60 84 42 4012 72 4890 AC Ranger 46 59 53 9447 73 4539 AC Harper 46 67 60 4853 41 4417 Bentley mdash mdash mdash mdash 82 4193 CDC Battleford 54 76 66 2324 65 3334 Robust 53 61 38 3871 50 3215 Falcon 54 54 62 1528 68 2462 Otal 45 31 33 2815 27 2059 CDC Select 53 66 68 1645 82 2012 Stockford 60 61 48 1734 66 1830 Abee 46 65 39 1110 59 1793 Winthrop 49 72 42 1914 50 1624 AC Rosser 63 48 11 2694 32 1336 AC Albright 60 26 36 1097 34 1196 Excel 57 79 57 2030 62 1174 CDC Stratus 52 77 67 733 71 896 Manley 49 64 56 3504 68 684 Stein 48 64 mdash mdash 62 683 Leduc 46 65 49 771 53 506 Dillon 32 36 19 1503 55 426 Palliser 53 mdash mdash mdash 79 425 Busby mdash mdash mdash mdash 91 357 Weighted Average Dryland Barley yield (Bu) amp total acressect 67 2133473
BARLEY IRRIGATED YIELDS BY VARIETY 2007ndash2010dagger ALBERTA 2007 2008 2009 2009 2010 2010Dagger Variety Yield Yield Yield Acres Yield Acres Xena 82 91 94 24497 72 21435 AC Harper 84 95 103 7482 72 9169 Vivar 93 92 98 8099 73 7485 CDC Yorkton 86 105 83 3828 67 6769 Sundre mdash 99 104 5053 71 6431 CDC Coalition mdash mdash 105 1823 81 5936 AC Metcalfe 71 89 72 3714 68 5454 Conlon 83 70 69 6044 71 2936 Champion mdash mdash mdash mdash 70 2815 CDC Earl 100 90 99 1870 65 2245 CDC Bold 86 99 88 2174 99 2204 CDC Cowboy mdash 75 86 2050 81 2083 Newdale 82 90 51 1293 88 1636 CDC Mindon mdash mdash mdash mdash 34 1527 Ponoka 87 92 100 838 91 1272 CDC Thompson 80 mdash 72 1003 61 1232 CDC Copeland mdash 78 70 885 60 629 Chigwell mdash mdash mdash mdash 91 523 Bridge 79 mdash mdash mdash 45 403 Weighted Average Irrigated Barley yield (Bu) amp total acressect 72 88799
2011 yield AlBeRTA 27
dagger Yields only for those varieties grown by 5 or more producers Dagger On system as of January 19 2011sect Weighted Average Yield and Total Acreage include acres not reported in the table
FIELD PEA DRYLAND YIELDS BY VARIETY 2007ndash2010dagger ALBERTA 2007 2008 2009 2009 2010 2010Dagger Variety Yield Yield Yield Acres Yield Acres CDC Meadow mdash 62 31 33797 46 107325 SW Midas 38 43 31 112571 37 92389 Delta 23 35 26 79067 37 67276 CDC Golden 32 36 23 66253 36 63828 Cooper 44 49 38 39731 39 47861 Eclipse 34 36 23 61802 30 37540 DS-Admiral 37 45 31 42330 40 32164 Cutlass FP 37 37 31 23831 30 31440 Thunderbird mdash mdash 41 8356 44 29097 Canstar 37 50 41 9913 44 15701 Polstead 52 48 37 9156 42 11648 Swing 31 42 30 11794 40 11232 Eiffel 33 39 30 10063 37 5890 SW Capri 40 47 35 9421 47 4857 CDC Mozart 35 18 19 3840 17 4727 CDC Striker mdash mdash mdash mdash 42 4707 Carneval 36 36 23 6523 30 4548 Miami 36 45 27 6721 35 3835 Garde mdash 10 mdash mdash 45 3564 Nitouche 34 36 37 4837 34 3493 Camry 37 34 30 5585 44 3453 CDC Patrick mdash mdash mdash mdash 40 3194 Espace 39 29 21 3696 42 2718 Profi 31 28 25 3214 36 2491 SW Parade 35 34 33 1497 29 2416 CDC Centennial mdash mdash 18 1011 38 2411 Sorento mdash mdash mdash mdash 53 2036 Toledo 38 39 31 2713 32 1802 Stratus 39 27 33 1910 27 1608 SW Circus 35 45 25 2605 39 1589 Agassiz mdash mdash 33 511 34 1571 CDC Sage mdash mdash 28 548 41 1495 Reward mdash mdash 30 797 42 1167 SW Bravo 39 41 34 1742 43 1147 CDC Bronco mdash mdash 26 3097 38 715 Weighted Average Dryland Field Pea yield (Bu) amp total acressect 39 626557
FIELD PEA IRRIGATED YIELDS BY VARIETY 2007ndash2010dagger ALBERTA 2007 2008 2009 2009 2010 2010Dagger Variety Yield Yield Yield Acres Yield Acres CDC Meadow mdash mdash 49 1682 39 1869 CDC Golden 37 39 55 1264 36 1418 Weighted Average Irrigated Field Pea yield (Bu) amp total acressect 42 5713
OATS DRYLAND YIELDS BY VARIETY 2007ndash2010dagger ALBERTA 2007 2008 2009 2009 2010 2010Dagger Variety Yield Yield Yield Acres Yield Acres AC Morgan 90 87 64 76308 100 94229 Derby 75 69 52 48418 79 55551 AC Mustang 64 69 50 24622 84 28941 Waldern 51 51 36 7721 67 9071 CDC Baler 55 64 39 9185 84 8798 Calibre 47 53 29 10143 72 8487 Cascade 61 58 42 5290 69 6681 Grizzly 51 59 35 3394 60 3394 7600M 75 74 56 1859 78 3081 Jordan mdash 73 74 475 97 1667 CDC Boyer 42 67 32 978 49 1654 AC Juniper 84 94 71 2110 75 1305 Foothill 31 43 15 1015 76 1084 Jasper 72 60 25 426 37 1019 CDC Orrin 87 25 80 937 62 984 Murphy 55 57 53 402 76 941 Athabasca 61 33 45 462 74 764 Lu mdash 112 37 549 121 577 Triple Crown 65 93 81 506 162 556 AC Medallion mdash 101 mdash mdash 88 338 CDC SO-I mdash mdash mdash mdash 116 331 Harmon 63 83 29 802 68 328 Weighted Average Dryland Oats yield (Bu) amp total acressect 87 237316
OATS IRRIGATED YIELDS BY VARIETY 2007ndash2010dagger ALBERTA 2007 2008 2009 2009 2010 2010Dagger Variety Yield Yield Yield Acres Yield Acres AC Morgan 82 74 117 766 85 478 Waldern mdash 100 50 487 105 454 AC Mustang mdash mdash mdash mdash 100 444 Weighted Average Irrigated Oats yield (Bu) amp total acressect 84 2018
MUSTARD DRYLAND YIELDS BY VARIETY 2007ndash2010dagger ALBERTA 2007 2008 2009 2009 2010 2010Dagger Variety Yield Yield Yield Acres Yield Acres Andante (Yellow) 14 17 18 40649 18 42064 AC Pennant (Yellow) 12 14 17 12995 19 12551 Ace (Yellow) 12 20 15 9159 20 7956 AC Base (Yellow) 14 14 16 3564 21 4258 Forge (Oriental) 16 19 17 5100 22 3959 Dutchess (Brown) 13 23 17 3293 19 3204 Centennial Brown (Brown) mdash 29 29 20844 23 2541 Weighted Average Dryland Mustard yield (Bu) amp total acressect 19 88191
LENTIL DRYLAND YIELDS BY VARIETY 2007ndash2010dagger ALBERTA 2007 2008 2009 2009 2010 2010Dagger Variety Yield Yield Yield Acres Yield Acres CDC Maxim mdash mdash mdash mdash 1710 18451 CDC Imperial mdash mdash 1297 5894 1459 15940 CDC Improve mdash mdash 1480 1892 1639 7019 CDC Richlea mdash 1564 1370 4829 1981 5559 CDC Impact mdash mdash 1380 2651 1893 4594 Laird 1055 1663 1373 1411 1639 2854 Weighted Average Dryland Lentil yield (Lbs) amp total acressect 1645 67252
BEAN IRRIGATED YIELDS BY VARIETY 2007ndash2010dagger ALBERTA 2007 2008 2009 2009 2010 2010Dagger Variety Yield Yield Yield Acres Yield Acres Island (Pinto) mdash mdash 1884 4120 1265 15903 Resolute (Great Northern) mdash mdash 2273 6701 1297 7570 AC Polaris (Great Northern) 2259 1979 1923 7759 1238 6303 Winchester Pinto (Pinto) 2192 1868 1870 8264 1382 5011 AC Black Diamond (Black) 2359 2150 1945 2253 1371 3813 AC Redbond (Small Red) 2136 1887 1877 3652 1208 2254 Othello (Pinto) 2311 1670 1769 3580 1344 1615 Myasi yellow (Black) mdash mdash 2742 523 1273 1346 NW - 63 (Small Red) mdash 1437 mdash mdash 1323 549 Weighted Average Irrigated Bean yield (Lbs) amp total acressect 1282 46854
POTATO DRYLAND YIELDS BY VARIETY 2007ndash2010dagger ALBERTA 2007 2008 2009 2009 2010 2010Dagger Variety Yield Yield Yield Acres Yield Acres Russet Burbank (Seed) 9 14 7 1088 10 1466 Weighted Average Dryland Potato yield (Tons) amp total acressect 11 4835
POTATO IRRIGATED YIELDS BY VARIETY 2007ndash2010dagger ALBERTA 2007 2008 2009 2009 2010 2010Dagger Variety Yield Yield Yield Acres Yield Acres Russet Burbank (Fry) 18 17 17 25205 15 24353 Shepody (Fry) 15 14 15 2473 11 3000 FL 1867 (Chip) mdash mdash 13 1015 9 1282 FL 1879 (Chip) mdash 15 16 1084 11 1174 Russet Burbank (Seed) 15 11 14 976 10 863 Atlantic (Chip) mdash 11 15 570 7 553 Weighted Average Irrigated Potato yield (Tons) amp total acressect 14 36991
SUGAR BEET IRRIGATED YIELDS BY VARIETY 2007ndash2010dagger ALBERTA 2007 2008 2009 2009 2010 2010Dagger Variety Yield Yield Yield Acres Yield Acres Beta 47RR65 mdash mdash mdash mdash 20 21081 Beta 47RR75 mdash mdash mdash mdash 21 5575 Beta 43RR90 mdash mdash 20 24635 20 1402 HM 9003RR mdash mdash mdash mdash 22 568 Weighted Average Irrigated Sugar Beet yield (Tons) amp total acressect 20 29352
FLAX DRYLAND YIELDS BY VARIETY 2007ndash2010dagger ALBERTA 2007 2008 2009 2009 2010 2010Dagger Variety Yield Yield Yield Acres Yield Acres CDC Sorrel mdash 22 24 4369 26 3869 CDC Bethune 26 29 21 8074 24 3428 Hanley mdash 22 22 1086 26 1935 Flanders 17 23 22 2403 27 1412 McGregor 18 25 22 2071 21 1130 Prairie Thunder mdash mdash 18 964 23 775 Weighted Average Dryland Flax yield (Bu) amp total acressect 24 14156
FLAX IRRIGATED YIELDS BY VARIETY 2007ndash2010dagger ALBERTA 2007 2008 2009 2009 2010 2010Dagger Variety Yield Yield Yield Acres Yield Acres CDC Sorrel mdash 33 41 3395 36 4394 CDC Bethune 32 42 40 2582 32 1425 Hanley mdash mdash 36 654 35 443 Weighted Average Irrigated Flax yield (Bu) amp total acressect 34 6989
28 yield AlBeRTA 2011
dagger Yields only for those varieties grown by 5 or more producers Dagger On system as of January 19 2011sect Weighted Average Yield and Total Acreage include acres not reported in the table
TRITICALE DRYLAND YIELDS BY VARIETY 2007ndash2010dagger ALBERTA 2007 2008 2009 2009 2010 2010Dagger Variety Yield Yield Yield Acres Yield Acres Pronghorn (Spring) 43 47 35 3221 53 3912 Bunker (Spring) mdash mdash 46 720 34 2432 Pika (Winter) 47 41 35 1192 43 1068 AC Ultima (Spring) 41 59 27 1952 26 800 AC Alta (Spring) mdash mdash mdash mdash 46 788 Bobcat (Winter) 47 53 33 1084 33 750 Weighted Average Dryland Triticale yield (Bu) amp total acressect 43 13135
TRITICALE IRRIGATED YIELDS BY VARIETY 2007ndash2010dagger ALBERTA 2007 2008 2009 2009 2010 2010Dagger Variety Yield Yield Yield Acres Yield Acres Bunker (Spring) mdash mdash 70 664 52 592 Weighted Average Irrigated Triticale yield (Bu) amp total acressect 85 2171
RYE DRYLAND YIELDS BY VARIETY 2007ndash2010dagger ALBERTA 2007 2008 2009 2009 2010 2010Dagger Variety Yield Yield Yield Acres Yield Acres Prima 46 47 27 3964 40 4410 AC Remington 33 47 36 1745 35 2907 Musketeer 33 40 26 2708 34 1702 AC Rifle 44 48 mdash mdash 44 1317 Dakota mdash 56 43 2449 51 1235 Kodiak 35 41 28 802 56 584 Weighted Average Dryland Rye yield (Bu) amp total acressect 41 13422
CANARY SEED DRYLAND YIELDS BY VARIETY 2007ndash2010dagger ALBERTA 2007 2008 2009 2009 2010 2010Dagger Variety Yield Yield Yield Acres Yield Acres Keet mdash mdash 617 893 1204 3531 CDC Togo mdash mdash mdash mdash 801 664 Weighted Average Dryland Canary Seed yield (Lbs) amp total acressect 1162 5474
FABA BEAN DRYLAND YIELDS BY VARIETY 2007ndash2010dagger ALBERTA 2007 2008 2009 2009 2010 2010Dagger Variety Yield Yield Yield Acres Yield Acres Snowbird 2424 2854 1683 4695 2444 2835 Weighted Average Dryland Faba Bean yield (Lbs) amp total acressect 2449 2858
FABA BEAN IRRIGATED YIELDS BY VARIETY 2007ndash2010dagger ALBERTA 2007 2008 2009 2009 2010 2010Dagger Variety Yield Yield Yield Acres Yield Acres Snowbird mdash mdash 2841 762 2411 904 Weighted Average Irrigated Faba Bean yield (Lbs) amp total acressect 2545 1039
CREEPING RED FESCUE DRYLAND YIELDS BY VARIETY 2007ndash2010 ALBERTA
2007 2008 2009 2009 2010 2010Dagger Variety Yield Yield Yield Acres Yield Acres Boreal 386 509 435 3793 293 1751 Weighted Average Dryland Creeping Red Fescue yield (Lbs) amp total acressect 290 2461
SAFFLOWER DRYLAND YIELDS BY VARIETY 2007ndash2010dagger ALBERTA 2007 2008 2009 2009 2010 2010Dagger Variety Yield Yield Yield Acres Yield Acres Saffire 1150 mdash 1448 1298 448 800 Weighted Average Dryland Safflower yield (Lbs) amp total acressect 448 800
RISK AREA 1
BARLEY DRYLAND YIELDS BY VARIETY 2007ndash2010dagger RISK AREA 1 2007 2008 2009 2009 2010 2010Dagger Variety Yield Yield Yield Acres Yield Acres Xena 46 69 76 19681 45 19943 CDC Cowboy mdash mdash mdash mdash 73 1689 Weighted Average Dryland Barley yield (Bu) amp total acressect 50 28273
RISK AREA 2
WHEAT DRYLAND YIELDS BY VARIETY 2007ndash2010dagger RISK AREA 2 2007 2008 2009 2009 2010 2010Dagger Variety Yield Yield Yield Acres Yield Acres Lillian (HRS) 37 41 39 161982 43 160551 Superb (HRS) 37 57 58 58244 40 58071 Harvest (HRS) 51 48 31 17582 51 23657 Strongfield (D) 38 47 41 57437 47 21106 CDC Go (HRS) 45 42 49 17446 47 18950 CDC Imagine (HRS) 32 40 37 18119 38 17171 AC Avonlea (D) 29 38 36 28917 40 15009 CDC Abound (HRS) mdash mdash 47 1232 49 9624 Radiant (HRW) 46 54 47 20811 53 9224 Snowstar (HRS) mdash mdash 47 7755 45 8938 AC Navigator (D) 40 44 40 12966 42 8043 AC Eatonia (HRS) 29 27 46 8041 33 6646 AC Intrepid (HRS) 48 47 26 5203 57 4303 CDC Teal (HRS) 38 46 42 6798 31 3628 AC Elsa (HRS) 48 43 27 3070 47 2245 WR 859 CL (HRS) mdash mdash mdash mdash 40 2194 Waskada (HRS) mdash mdash mdash mdash 54 1377 Kyle (D) 28 46 32 7848 43 1226 Snowbird (HRS) 46 37 39 1828 44 1226 Glenn (HRS) mdash mdash mdash mdash 32 820 Weighted Average Dryland Wheat yield (Bu) amp total acressect 44 399787
WHEAT IRRIGATED YIELDS BY VARIETY 2007ndash2010dagger RISK AREA 2 2007 2008 2009 2009 2010 2010Dagger Variety Yield Yield Yield Acres Yield Acres CDC Go (HRS) 63 75 74 12363 61 12073 Superb (HRS) 70 74 73 15493 64 8488 CDC Abound (HRS) mdash mdash 78 2322 53 7900 Glenn (HRS) mdash mdash mdash mdash 40 5818 Lillian (HRS) 56 67 59 6633 52 3480 AC Andrew (SWS) 88 97 94 1986 76 2203 Snowstar (HRS) mdash mdash 72 1980 58 1946 Strongfield (D) 72 84 76 8099 90 1919 AC Navigator (D) 66 75 71 3937 40 1245 Radiant (HRW) 89 83 84 1438 70 791 AC Meena (SWS) 90 95 87 942 81 664 CDC Imagine (HRS) 62 65 52 3120 40 648 Weighted Average Irrigated Wheat yield (Bu) amp total acressect 59 52638
CANOLA DRYLAND YIELDS BY VARIETY 2007ndash2010dagger RISK AREA 2 2007 2008 2009 2009 2010 2010Dagger Variety Yield Yield Yield Acres Yield Acres 5440 mdash 37 32 18513 43 30441 71-45RR 32 37 36 28943 33 27064 72-55 RR mdash mdash 36 6502 36 22570 1818 20 27 34 4905 26 13569 9590 27 37 29 8506 43 8152 8440 mdash 40 31 7929 43 5426 D3151 mdash mdash mdash mdash 31 5329 9553 mdash mdash 24 2311 40 5224 45H28 mdash mdash 37 4886 39 5159 v1037 mdash mdash mdash mdash 33 4744 72-65 RR mdash mdash mdash mdash 44 4647 Nex 845 CL 31 38 35 6595 37 4033 9552 mdash mdash mdash mdash 35 3884 5770 mdash mdash mdash mdash 46 3871 5020 32 32 32 8996 42 3469 34-65 23 35 28 3971 34 3027 NX4-105 RR mdash mdash mdash mdash 39 2968 1841 30 37 25 6970 38 2557 NX4-104 RR mdash mdash 38 4922 29 2321 45H26 mdash 39 31 3897 49 1845 1950 mdash mdash mdash mdash 33 1426 46P50 26 33 mdash mdash 29 842 Weighted Average Dryland Canola yield (Bu) amp total acressect 37 185048
CANOLA IRRIGATED YIELDS BY VARIETY 2007ndash2010dagger RISK AREA 2 2007 2008 2009 2009 2010 2010Dagger Variety Yield Yield Yield Acres Yield Acres 5440 mdash 57 55 8743 53 10066 45H28 mdash mdash 51 2609 49 2172 71-45RR 49 49 50 3480 48 1954 72-65 RR mdash mdash mdash mdash 45 1877
2011 yield AlBeRTA 29
CANOLA IRRIGATED YIELDS BY VARIETY 2007ndash2010dagger RISK AREA 2 2007 2008 2009 2009 2010 2010Dagger Variety Yield Yield Yield Acres Yield Acres 72-55 RR mdash mdash 45 1472 46 1302 NX4-105 RR mdash mdash mdash mdash 40 1149 1841 49 56 43 2672 41 1129 5770 mdash mdash mdash mdash 62 943 45S51 mdash mdash mdash mdash 53 905 D3151 mdash mdash mdash mdash 33 547 Weighted Average Irrigated Canola yield (Bu) amp total acressect 49 28325
BARLEY DRYLAND YIELDS BY VARIETY 2007ndash2010dagger RISK AREA 2 2007 2008 2009 2009 2010 2010Dagger Variety Yield Yield Yield Acres Yield Acres Xena 48 75 77 168172 49 128647 AC Metcalfe 46 63 50 54650 54 50860 Champion mdash mdash mdash mdash 62 17807 Ponoka 55 61 50 19250 59 16145 CDC Coalition mdash mdash 72 5217 67 13784 CDC Copeland 58 60 49 12829 62 10611 Conlon 44 50 48 8336 49 7290 McLeod 71 80 63 3212 75 5696 Bridge 36 66 58 8775 27 5501 Newdale 76 66 56 5909 78 4258 Harrington 49 55 44 6108 38 3886 AC Harper 46 80 75 2904 36 3148 CDC Cowboy mdash mdash mdash mdash 51 2978 CDC Meredith mdash mdash mdash mdash 76 2463 CDC Yorkton 49 75 76 2781 57 2274 Sundre mdash mdash 96 2449 71 2152 AC Lacombe 65 73 63 2742 29 1613 Vivar 66 mdash mdash mdash 78 359 Weighted Average Dryland Barley yield (Bu) amp total acressect 54 287591
BARLEY IRRIGATED YIELDS BY VARIETY 2007ndash2010dagger RISK AREA 2 2007 2008 2009 2009 2010 2010Dagger Variety Yield Yield Yield Acres Yield Acres Xena 80 95 104 14742 69 13332 AC Harper 89 95 105 5901 76 7239 CDC Yorkton 85 108 85 3583 69 5623 Vivar 100 101 108 4565 76 4362 Sundre mdash 98 110 3190 76 4342 CDC Coalition mdash mdash 102 808 81 3359 AC Metcalfe 69 88 79 2232 61 2574 Ponoka 82 mdash mdash mdash 108 927 Champion mdash mdash mdash mdash 91 589 Weighted Average Irrigated Barley yield (Bu) amp total acressect 73 47451
FIELD PEA DRYLAND YIELDS BY VARIETY 2007ndash2010dagger RISK AREA 2 2007 2008 2009 2009 2010 2010Dagger Variety Yield Yield Yield Acres Yield Acres CDC Meadow mdash mdash 34 10525 50 24215 SW Midas 38 40 26 26861 44 17413 CDC Golden mdash 43 26 10188 41 7557 Eclipse 38 33 23 13697 44 4315 Delta 32 45 30 2346 47 2588 CDC Bronco mdash mdash 43 1722 31 370 Weighted Average Dryland Field Pea yield (Bu) amp total acressect 46 62544
FIELD PEA IRRIGATED YIELDS BY VARIETY 2007ndash2010dagger RISK AREA 2 2007 2008 2009 2009 2010 2010Dagger Variety Yield Yield Yield Acres Yield Acres CDC Meadow mdash mdash mdash mdash 42 800 Weighted Average Irrigated Field Pea yield (Bu) amp total acressect 41 1970
The best seeds deserve the best seed treatment Year after year over half of the canola
acres in Canada are protected with Prosperreg FX
Prosper FX provides unmatched control of flea beetles and seed- and soil-borne
diseases like rhizoctonia and fusarium Make sure your seed is treated with the
respect it deserves ndash yoursquove earned it
For more information visit BayerCropSciencecaProsperFX
Some SeedS get Preferential treatmentProSPer FX THe ProTeCTIoN THeY DeSerVe
BayerCropScienceca or 1 888-283-6847 or contact your Bayer CropScience representativeAlways read and follow label directions Prosperreg is a registered trademark of Bayer Bayer CropScience is a member of CropLife Canada 0111-14567-05D
14567-05D Prosper_SeedAD_SeedABindd 1 12711 205 PM
dagger Yields only for those varieties grown by 5 or more producers Dagger On system as of January 19 2011sect Weighted Average Yield and Total Acreage include acres not reported in the table
30 yield AlBeRTA 2011
dagger Yields only for those varieties grown by 5 or more producers Dagger On system as of January 19 2011sect Weighted Average Yield and Total Acreage include acres not reported in the table
OATS DRYLAND YIELDS BY VARIETY 2007ndash2010dagger RISK AREA 2 2007 2008 2009 2009 2010 2010Dagger Variety Yield Yield Yield Acres Yield Acres AC Morgan 58 mdash 97 870 98 855 AC Mustang 32 72 mdash mdash 74 774 CDC Baler mdash 79 mdash mdash 54 342 Derby 51 mdash 35 610 72 325 Weighted Average Dryland Oats yield (Bu) amp total acressect 74 3208
MUSTARD DRYLAND YIELDS BY VARIETY 2007ndash2010dagger RISK AREA 2 2007 2008 2009 2009 2010 2010Dagger Variety Yield Yield Yield Acres Yield Acres Andante (Yellow) 12 17 19 16479 16 15013 Ace (Yellow) 12 22 18 1260 14 1550 Weighted Average Dryland Mustard yield (Bu) amp total acressect 17 18337
LENTIL DRYLAND YIELDS BY VARIETY 2007ndash2010dagger RISK AREA 2 2007 2008 2009 2009 2010 2010Dagger Variety Yield Yield Yield Acres Yield Acres CDC Maxim mdash mdash mdash mdash 1081 1202 CDC Imperial mdash mdash mdash mdash 1040 1164 Weighted Average Dryland Lentil yield (Lbs) amp total acressect 1153 6421
BEAN IRRIGATED YIELDS BY VARIETY 2007ndash2010dagger RISK AREA 2 2007 2008 2009 2009 2010 2010Dagger Variety Yield Yield Yield Acres Yield Acres Island (Pinto) mdash mdash 2117 532 656 1056 Resolute (Great Northern) mdash mdash 2369 549 880 993 Weighted Average Irrigated Bean yield (Lbs) amp total acressect 749 2582
POTATO IRRIGATED YIELDS BY VARIETY 2007ndash2010dagger RISK AREA 2 2007 2008 2009 2009 2010 2010Dagger Variety Yield Yield Yield Acres Yield Acres Russet Burbank (Fry) 19 20 19 2012 17 2022 Weighted Average Irrigated Potato yield (Tons) amp total acressect 17 2142
SUGAR BEET IRRIGATED YIELDS BY VARIETY 2007ndash2010dagger RISK AREA 2 2007 2008 2009 2009 2010 2010Dagger Variety Yield Yield Yield Acres Yield Acres Beta 47RR65 mdash mdash mdash mdash 20 3768 Beta 47RR75 mdash mdash mdash mdash 19 1202 Weighted Average Irrigated Sugar Beet yield (Tons) amp total acressect 19 5275
FLAX DRYLAND YIELDS BY VARIETY 2007ndash2010dagger RISK AREA 2 2007 2008 2009 2009 2010 2010Dagger Variety Yield Yield Yield Acres Yield Acres McGregor 18 28 23 1616 21 1130 Flanders 18 24 30 798 31 926 CDC Sorrel mdash mdash 36 1146 28 693 Weighted Average Dryland Flax yield (Bu) amp total acressect 25 3934
FLAX IRRIGATED YIELDS BY VARIETY 2007ndash2010dagger RISK AREA 2 2007 2008 2009 2009 2010 2010Dagger Variety Yield Yield Yield Acres Yield Acres CDC Sorrel mdash mdash mdash mdash 26 493 Weighted Average Irrigated Flax yield (Bu) amp total acressect 27 713
RISK AREA 3
WHEAT DRYLAND YIELDS BY VARIETY 2007ndash2010dagger RISK AREA 3 2007 2008 2009 2009 2010 2010Dagger Variety Yield Yield Yield Acres Yield Acres Lillian (HRS) 28 34 33 101966 42 143705 AC Eatonia (HRS) 24 32 34 76942 38 85403 Strongfield (D) 29 40 37 169178 46 79795 AC Avonlea (D) 27 37 34 60573 47 23526 Superb (HRS) 29 31 30 14547 40 18147 Radiant (HRW) 42 41 33 29755 55 15816 AC Navigator (D) 39 43 41 37428 45 12470 CDC Go (HRS) mdash 34 33 2986 46 11173 Harvest (HRS) mdash 42 33 4382 48 8544 Kyle (D) 21 32 30 20167 36 7802 CDC Abound (HRS) mdash mdash 41 702 45 6564 McKenzie (HRS) 23 24 30 1981 43 6234 CDC Imagine (HRS) 28 26 19 2869 39 6110 AC Morse (D) 23 32 35 6296 37 2749 Snowstar (HRS) mdash mdash 29 932 45 2545
WHEAT DRYLAND YIELDS BY VARIETY 2007ndash2010dagger RISK AREA 3 2007 2008 2009 2009 2010 2010Dagger Variety Yield Yield Yield Acres Yield Acres Leader (HRS) 25 26 47 1832 40 2498 AC Bellatrix (HRW) 36 43 35 10614 46 1613 Glenn (HRS) mdash mdash mdash mdash 44 1255 Sceptre (D) mdash 40 37 916 48 475 Sadash (SWS) mdash mdash mdash mdash 69 235 AC Andrew (SWS) 30 38 40 510 45 225 Stettler (HRS) mdash mdash 22 342 35 173 Weighted Average Dryland Wheat yield (Bu) amp total acressect 43 454479
WHEAT IRRIGATED YIELDS BY VARIETY 2007ndash2010dagger RISK AREA 3 2007 2008 2009 2009 2010 2010Dagger Variety Yield Yield Yield Acres Yield Acres Superb (HRS) 77 65 72 33110 67 33035 CDC Go (HRS) 79 61 83 19337 79 25666 CDC Abound (HRS) mdash mdash 65 4129 66 11400 Strongfield (D) 83 77 76 28563 71 8260 Radiant (HRW) 100 91 102 2275 90 4032 Sadash (SWS) mdash mdash mdash mdash 72 3247 AC Andrew (SWS) 91 85 80 7701 78 2938 Glenn (HRS) mdash mdash mdash mdash 60 2806 CDC Imagine (HRS) 67 53 56 4835 48 2641 AC Navigator (D) 79 83 69 10535 75 2363 AC Morse (D) 73 79 63 2750 60 2023 Lillian (HRS) 45 59 56 603 54 1050 Stettler (HRS) mdash mdash 69 857 75 1044 WR 859 CL (HRS) mdash mdash mdash mdash 78 1008 CDC Bounty (HRS) mdash mdash mdash mdash 69 881 Weighted Average Irrigated Wheat yield (Bu) amp total acressect 70 107434
CANOLA DRYLAND YIELDS BY VARIETY 2007ndash2010dagger RISK AREA 3 2007 2008 2009 2009 2010 2010Dagger Variety Yield Yield Yield Acres Yield Acres 8440 mdash mdash 32 4135 42 12368 5440 mdash 45 39 5658 46 8433 D3151 mdash mdash mdash mdash 37 7833 Nex 845 CL mdash 26 42 2460 33 4065 71-45RR 21 31 28 2449 31 3806 5770 mdash mdash mdash mdash 46 1871 72-65 RR mdash mdash mdash mdash 43 1650 9590 mdash 39 33 1469 36 1630 72-55 RR mdash mdash mdash mdash 41 1050 46P50 29 42 mdash mdash 26 1047 5020 30 34 mdash mdash 42 840 8571 mdash mdash mdash mdash 26 754 9553 mdash mdash mdash mdash 38 510 Weighted Average Dryland Canola yield (Bu) amp total acressect 39 58509
CANOLA IRRIGATED YIELDS BY VARIETY 2007ndash2010dagger RISK AREA 3 2007 2008 2009 2009 2010 2010Dagger Variety Yield Yield Yield Acres Yield Acres 5440 mdash 57 61 3636 51 3991 72-55 RR mdash mdash 63 425 45 1665 9553 mdash mdash 46 1261 46 1313 46P50 46 45 mdash mdash 49 1295 71-45RR 43 40 57 971 39 1250 Weighted Average Irrigated Canola yield (Bu) amp total acressect 46 14909
BARLEY DRYLAND YIELDS BY VARIETY 2007ndash2010dagger RISK AREA 3 2007 2008 2009 2009 2010 2010Dagger Variety Yield Yield Yield Acres Yield Acres Conlon 36 48 51 16796 54 22677 Xena 43 50 43 11499 68 20478 AC Metcalfe 39 51 52 14616 54 17504 CDC Bold 46 60 59 4596 65 9891 Bridge 40 54 50 4838 55 6623 CDC Copeland 39 46 34 3947 55 3692 CDC Coalition mdash mdash 48 2208 53 3602 Champion mdash mdash mdash mdash 55 3298 CDC Cowboy mdash mdash mdash mdash 41 2716 Harrington 38 54 49 3978 49 1939 CDC Dolly 45 58 60 1257 58 1895 Ponoka 53 mdash mdash mdash 46 1437 Newdale mdash mdash mdash mdash 66 545 Vivar 46 46 36 305 33 471 CDC Yorkton mdash mdash mdash mdash 49 308 Weighted Average Dryland Barley yield (Bu) amp total acressect 57 99996
2011 yield AlBeRTA 31
dagger Yields only for those varieties grown by 5 or more producers Dagger On system as of January 19 2011sect Weighted Average Yield and Total Acreage include acres not reported in the table
BARLEY IRRIGATED YIELDS BY VARIETY 2007ndash2010dagger RISK AREA 3 2007 2008 2009 2009 2010 2010Dagger Variety Yield Yield Yield Acres Yield Acres Vivar 91 77 85 2989 71 2906 Xena 91 71 86 1732 83 2258 CDC Bold 86 86 73 627 103 2019 Champion mdash mdash mdash mdash 60 1916 AC Metcalfe 94 87 53 632 73 1351 AC Harper 79 98 99 1170 48 1325 Conlon 86 59 66 2066 61 1304 CDC Coalition mdash mdash 131 277 84 1303 CDC Yorkton mdash mdash mdash mdash 58 1146 CDC Thompson mdash mdash mdash mdash 75 640 CDC Cowboy mdash mdash mdash mdash 80 415 Weighted Average Irrigated Barley yield (Bu) amp total acressect 73 20969
FIELD PEA DRYLAND YIELDS BY VARIETY 2007ndash2010dagger RISK AREA 3 2007 2008 2009 2009 2010 2010Dagger Variety Yield Yield Yield Acres Yield Acres Delta 21 34 28 58240 37 51780 CDC Meadow mdash mdash 24 5558 48 13367 CDC Golden 25 27 25 10979 34 10734 Eclipse 27 35 19 8792 34 3761 SW Midas 26 31 18 7577 31 3147 Weighted Average Dryland Field Pea yield (Bu) amp total acressect 38 86591
FIELD PEA IRRIGATED YIELDS BY VARIETY 2007ndash2010dagger RISK AREA 3 2007 2008 2009 2009 2010 2010Dagger Variety Yield Yield Yield Acres Yield Acres CDC Meadow mdash mdash 42 648 33 936 Weighted Average Irrigated Field Pea yield (Bu) amp total acressect 42 2034
OATS DRYLAND YIELDS BY VARIETY 2007ndash2010dagger RISK AREA 3 2007 2008 2009 2009 2010 2010Dagger Variety Yield Yield Yield Acres Yield Acres Waldern 40 48 38 552 66 820 AC Mustang mdash mdash mdash mdash 46 613 Weighted Average Dryland Oats yield (Bu) amp total acressect 62 1893
MUSTARD DRYLAND YIELDS BY VARIETY 2007ndash2010dagger RISK AREA 3 2007 2008 2009 2009 2010 2010Dagger Variety Yield Yield Yield Acres Yield Acres Andante (Yellow) 17 16 18 15587 21 16518 AC Pennant (Yellow) 14 15 17 7003 21 7209 Ace (Yellow) 14 16 13 5392 23 5221 AC Base (Yellow) 15 16 15 2713 19 2106 Weighted Average Dryland Mustard yield (Bu) amp total acressect 21 31803
LENTIL DRYLAND YIELDS BY VARIETY 2007ndash2010dagger RISK AREA 3 2007 2008 2009 2009 2010 2010Dagger Variety Yield Yield Yield Acres Yield Acres CDC Maxim mdash mdash mdash mdash 1971 10066 CDC Imperial mdash mdash 1267 4109 1842 9905 CDC Improve mdash mdash 1546 1532 1817 5626 CDC Richlea mdash mdash 1315 4104 1907 4245 CDC Impact mdash mdash mdash mdash 1709 1807 Weighted Average Dryland Lentil yield (Lbs) amp total acressect 1874 36598
BEAN IRRIGATED YIELDS BY VARIETY 2007ndash2010dagger RISK AREA 3 2007 2008 2009 2009 2010 2010Dagger Variety Yield Yield Yield Acres Yield Acres Island (Pinto) mdash mdash 1828 2994 1264 11898 Resolute (Great Northern) mdash mdash 2270 5492 1367 5822 AC Polaris (Great Northern) 2266 1909 1850 6715 1272 5516 Winchester Pinto (Pinto) 2248 1765 1811 6965 1426 4548 AC Black Diamond (Black) 2419 1978 1924 1901 1419 3356 AC Redbond (Small Red) 2226 1817 1847 3367 1265 2039 Myasi yellow (Black) mdash mdash 2742 523 1276 1279 Othello (Pinto) 2281 1706 1612 1927 1199 1259 NW - 63 (Small Red) mdash 1437 mdash mdash 1323 549 Weighted Average Irrigated Bean yield (Lbs) amp total acressect 1303 37948
POTATO IRRIGATED YIELDS BY VARIETY 2007ndash2010dagger RISK AREA 3 2007 2008 2009 2009 2010 2010Dagger Variety Yield Yield Yield Acres Yield Acres Russet Burbank (Fry) 18 17 16 20642 15 20130 Shepody (Fry) 15 14 15 2343 11 2724 Russet Burbank (Seed) 14 11 mdash mdash 9 426 Atlantic (Chip) mdash mdash 15 520 8 365 Weighted Average Irrigated Potato yield (Tons) amp total acressect 13 27911
SUGAR BEET IRRIGATED YIELDS BY VARIETY 2007ndash2010dagger RISK AREA 3 2007 2008 2009 2009 2010 2010Dagger Variety Yield Yield Yield Acres Yield Acres Beta 47RR65 mdash mdash mdash mdash 20 16800 Beta 47RR75 mdash mdash mdash mdash 21 4373 Beta 43RR90 mdash mdash 20 19679 21 927 HM 9003RR mdash mdash mdash mdash 22 508 Weighted Average Irrigated Sugar Beet yield (Tons) amp total acressect 20 23334
FLAX DRYLAND YIELDS BY VARIETY 2007ndash2010dagger RISK AREA 3 2007 2008 2009 2009 2010 2010Dagger Variety Yield Yield Yield Acres Yield Acres CDC Sorrel mdash mdash 21 1039 28 1486 Weighted Average Dryland Flax yield (Bu) amp total acressect 26 1921
FLAX IRRIGATED YIELDS BY VARIETY 2007ndash2010dagger RISK AREA 3 2007 2008 2009 2009 2010 2010Dagger Variety Yield Yield Yield Acres Yield Acres CDC Sorrel mdash mdash 40 1888 35 1561 CDC Bethune 31 34 40 635 32 1255 Weighted Average Irrigated Flax yield (Bu) amp total acressect 34 3131
TRITICALE DRYLAND YIELDS BY VARIETY 2007ndash2010dagger RISK AREA 3 2007 2008 2009 2009 2010 2010Dagger Variety Yield Yield Yield Acres Yield Acres Pronghorn (Spring) mdash mdash mdash mdash 44 710 Weighted Average Dryland Triticale yield (Bu) amp total acressect 39 1316
RYE DRYLAND YIELDS BY VARIETY 2007ndash2010dagger RISK AREA 3 2007 2008 2009 2009 2010 2010Dagger Variety Yield Yield Yield Acres Yield Acres AC Remington mdash mdash mdash mdash 36 377 Weighted Average Dryland Rye yield (Bu) amp total acressect 36 482
RISK AREA 4
WHEAT DRYLAND YIELDS BY VARIETY 2007ndash2010dagger RISK AREA 4 2007 2008 2009 2009 2010 2010Dagger Variety Yield Yield Yield Acres Yield Acres Lillian (HRS) 27 31 27 82582 36 93440 AC Eatonia (HRS) 23 27 38 80878 33 90164 Strongfield (D) 26 35 38 52954 34 19708 McKenzie (HRS) 29 33 27 7906 37 6065 Radiant (HRW) 39 35 40 14420 50 5367 Harvest (HRS) 31 42 29 5251 43 4872 Superb (HRS) 42 46 41 4217 39 4528 CDC Go (HRS) mdash 44 9 535 48 3496 CDC Abound (HRS) mdash mdash 10 1408 39 3183 Kyle (D) 25 33 35 9145 29 2816 AC Barrie (HRS) 28 31 26 1712 29 2590 CDC Makwa (HRS) 15 15 11 2061 16 1903 AC Avonlea (D) 26 36 41 9553 27 1641 CDC Imagine (HRS) mdash 31 6 2232 23 1321 AC Bellatrix (HRW) 31 46 32 4707 35 844 Weighted Average Dryland Wheat yield (Bu) amp total acressect 35 266976
WHEAT IRRIGATED YIELDS BY VARIETY 2007ndash2010dagger RISK AREA 4 2007 2008 2009 2009 2010 2010Dagger Variety Yield Yield Yield Acres Yield Acres CDC Go (HRS) mdash 76 80 10787 70 11493 Superb (HRS) 66 74 69 14100 68 11402 Strongfield (D) 60 62 83 7500 73 3736 Radiant (HRW) 87 86 98 2118 88 3453 CDC Abound (HRS) mdash mdash 66 1302 49 3123 5700 PR (CPS) mdash mdash mdash mdash 78 1005 Glenn (HRS) mdash mdash mdash mdash 79 879 Weighted Average Irrigated Wheat yield (Bu) amp total acressect 69 40793
CANOLA DRYLAND YIELDS BY VARIETY 2007ndash2010dagger RISK AREA 4 2007 2008 2009 2009 2010 2010Dagger Variety Yield Yield Yield Acres Yield Acres 5440 mdash mdash 36 6783 35 9396 71-45RR 22 15 32 6235 28 8395 8440 mdash mdash 39 1036 45 2633 5020 mdash 20 mdash mdash 27 2128 Weighted Average Dryland Canola yield (Bu) amp total acressect 31 32736
32 yield AlBeRTA 2011
dagger Yields only for those varieties grown by 5 or more producers Dagger On system as of January 19 2011sect Weighted Average Yield and Total Acreage include acres not reported in the table
CANOLA IRRIGATED YIELDS BY VARIETY 2007ndash2010dagger RISK AREA 4 2007 2008 2009 2009 2010 2010Dagger Variety Yield Yield Yield Acres Yield Acres 5440 mdash 49 58 4864 48 9736 72-55 RR mdash mdash 50 1452 47 1208 8440 mdash 63 55 1016 50 1145 71-45RR 41 45 52 3048 48 1082 72-65 RR mdash mdash mdash mdash 40 761 Nex 845 CL mdash 56 mdash mdash 34 636 5020 46 mdash mdash mdash 55 603 Weighted Average Irrigated Canola yield (Bu) amp total acressect 46 20476
BARLEY DRYLAND YIELDS BY VARIETY 2007ndash2010dagger RISK AREA 4 2007 2008 2009 2009 2010 2010Dagger Variety Yield Yield Yield Acres Yield Acres Xena 46 39 41 16728 48 10839 AC Metcalfe 36 39 46 5558 47 10037 CDC Cowboy mdash 43 9 5188 51 7019 Conlon 21 52 55 4537 56 6686 CDC Copeland mdash mdash mdash mdash 55 1259 Seebe 22 22 7 787 16 785 Weighted Average Dryland Barley yield (Bu) amp total acressect 47 43203
BARLEY IRRIGATED YIELDS BY VARIETY 2007ndash2010dagger RISK AREA 4 2007 2008 2009 2009 2010 2010Dagger Variety Yield Yield Yield Acres Yield Acres Xena 80 91 97 1654 87 1645 CDC Mindon mdash mdash mdash mdash 34 1527 CDC Earl 100 mdash 88 805 57 1083 Conlon 79 83 66 2560 89 674 Weighted Average Irrigated Barley yield (Bu) amp total acressect 67 9551
FIELD PEA DRYLAND YIELDS BY VARIETY 2007ndash2010dagger RISK AREA 4 2007 2008 2009 2009 2010 2010Dagger Variety Yield Yield Yield Acres Yield Acres CDC Golden 23 24 25 10661 36 9613 Delta 20 34 22 9747 36 9477 CDC Meadow mdash mdash 40 2203 30 5051 Eclipse 21 11 22 2135 24 1820 SW Midas mdash 16 23 965 34 1053 DS-Admiral 39 48 40 1664 28 740 Weighted Average Dryland Field Pea yield (Bu) amp total acressect 33 30968
FIELD PEA IRRIGATED YIELDS BY VARIETY 2007ndash2010dagger RISK AREA 4 2007 2008 2009 2009 2010 2010Dagger Variety Yield Yield Yield Acres Yield Acres CDC Golden mdash mdash mdash mdash 34 613 Weighted Average Irrigated Field Pea yield (Bu) amp total acressect 42 1461
OATS DRYLAND YIELDS BY VARIETY 2007ndash2010dagger RISK AREA 4 2007 2008 2009 2009 2010 2010Dagger Variety Yield Yield Yield Acres Yield Acres AC Mustang 52 35 70 1290 85 1972 Calibre 23 30 13 1678 70 1512 Waldern 30 mdash 43 1124 57 1429 Derby 36 33 7 2600 45 1097 AC Morgan 24 29 mdash mdash 50 402 Weighted Average Dryland Oats yield (Bu) amp total acressect 69 7816
MUSTARD DRYLAND YIELDS BY VARIETY 2007ndash2010dagger RISK AREA 4 2007 2008 2009 2009 2010 2010Dagger Variety Yield Yield Yield Acres Yield Acres Andante (Yellow) mdash 9 16 2774 17 3763 Centennial Brown (Brown) mdash mdash 24 1935 21 2088 AC Pennant (Yellow) 9 13 14 2234 15 2027 Weighted Average Dryland Mustard yield (Bu) amp total acressect 19 13327
LENTIL DRYLAND YIELDS BY VARIETY 2007ndash2010dagger RISK AREA 4 2007 2008 2009 2009 2010 2010Dagger Variety Yield Yield Yield Acres Yield Acres CDC Maxim mdash mdash mdash mdash 1883 2209 Weighted Average Dryland Lentil yield (Lbs) amp total acressect 1592 7729
BEAN IRRIGATED YIELDS BY VARIETY 2007ndash2010dagger RISK AREA 4 2007 2008 2009 2009 2010 2010Dagger Variety Yield Yield Yield Acres Yield Acres Island (Pinto) mdash mdash mdash mdash 1488 2949 Resolute (Great Northern) mdash mdash 2212 660 1310 755 Weighted Average Irrigated Bean yield (Lbs) amp total acressect 1379 5167
POTATO IRRIGATED YIELDS BY VARIETY 2007ndash2010dagger RISK AREA 4 2007 2008 2009 2009 2010 2010Dagger Variety Yield Yield Yield Acres Yield Acres Russet Burbank (Fry) 17 12 19 2551 15 2201 Weighted Average Irrigated Potato yield (Tons) amp total acressect 15 2357
SUGAR BEET IRRIGATED YIELDS BY VARIETY 2007ndash2010dagger RISK AREA 4 2007 2008 2009 2009 2010 2010Dagger Variety Yield Yield Yield Acres Yield Acres Beta 47RR65 mdash mdash mdash mdash 21 513 Weighted Average Irrigated Sugar Beet yield (Tons) amp total acressect 21 743
FLAX IRRIGATED YIELDS BY VARIETY 2007ndash2010dagger RISK AREA 4 2007 2008 2009 2009 2010 2010Dagger Variety Yield Yield Yield Acres Yield Acres CDC Sorrel mdash mdash 45 1137 37 1970 Hanley mdash mdash 36 654 35 443 Weighted Average Irrigated Flax yield (Bu) amp total acressect 36 2775
TRITICALE DRYLAND YIELDS BY VARIETY 2007ndash2010dagger RISK AREA 4 2007 2008 2009 2009 2010 2010Dagger Variety Yield Yield Yield Acres Yield Acres Bunker (Spring) mdash mdash mdash mdash 36 1764 Pronghorn (Spring) mdash 32 13 954 37 1213 Weighted Average Dryland Triticale yield (Bu) amp total acressect 38 4952
TRITICALE IRRIGATED YIELDS BY VARIETY 2007ndash2010dagger RISK AREA 4 2007 2008 2009 2009 2010 2010Dagger Variety Yield Yield Yield Acres Yield Acres Bunker (Spring) mdash mdash 70 664 52 592 Weighted Average Irrigated Triticale yield (Bu) amp total acressect 50 1155
RYE DRYLAND YIELDS BY VARIETY 2007ndash2010dagger RISK AREA 4 2007 2008 2009 2009 2010 2010Dagger Variety Yield Yield Yield Acres Yield Acres Dakota mdash mdash 43 2379 52 1160 Prima mdash 26 8 705 41 968 Weighted Average Dryland Rye yield (Bu) amp total acressect 36 5435
RISK AREA 5
WHEAT DRYLAND YIELDS BY VARIETY 2007ndash2010dagger RISK AREA 5 2007 2008 2009 2009 2010 2010Dagger Variety Yield Yield Yield Acres Yield Acres CDC Go (HRS) 57 61 36 85097 48 129403 Harvest (HRS) 48 56 35 151334 50 122031 Lillian (HRS) 44 48 37 58718 41 36877 Superb (HRS) 46 53 37 20068 39 18446 AC Intrepid (HRS) 42 56 47 21568 55 16559 CDC Imagine (HRS) 46 50 31 18228 53 12842 CDC Abound (HRS) mdash mdash 28 1923 49 12092 AC Splendor (HRS) 33 50 36 9243 36 8738 5700 PR (CPS) 76 81 42 8316 56 7920 Prodigy (HRS) 44 49 26 3827 45 6546 AC Barrie (HRS) 33 38 23 6589 35 6024 CDC Alsask (HRS) mdash mdash 43 1032 52 4401 Radiant (HRW) mdash 61 33 2842 55 4386 AC Elsa (HRS) 32 52 37 7753 31 4177 AC Abbey (HRS) 42 45 24 3443 42 3727 Roblin (HRS) 45 48 36 4472 53 3180 5702 PR (CPS) mdash mdash mdash mdash 52 2976 Journey (HRS) 45 50 38 8273 54 2718 AC Foremost (CPS) mdash mdash 33 3012 50 2240 Unity (HRS) mdash mdash mdash mdash 46 1913 WR 859 CL (HRS) mdash mdash mdash mdash 59 1501 Strongfield (D) 51 55 38 4919 34 880 Weighted Average Dryland Wheat yield (Bu) amp total acressect 48 428921
WHEAT IRRIGATED YIELDS BY VARIETY 2007ndash2010dagger RISK AREA 5 2007 2008 2009 2009 2010 2010Dagger Variety Yield Yield Yield Acres Yield Acres CDC Go (HRS) mdash 82 55 5101 56 3933 Harvest (HRS) 73 79 49 1577 56 1334 Weighted Average Irrigated Wheat yield (Bu) amp total acressect 62 7373
2011 yield AlBeRTA 33
dagger Yields only for those varieties grown by 5 or more producers Dagger On system as of January 19 2011sect Weighted Average Yield and Total Acreage include acres not reported in the table
CANOLA DRYLAND YIELDS BY VARIETY 2007ndash2010dagger RISK AREA 5 2007 2008 2009 2009 2010 2010Dagger Variety Yield Yield Yield Acres Yield Acres 5440 mdash 47 32 43734 44 57699 71-45RR 36 43 28 54266 36 42907 9553 mdash mdash 30 12158 39 16798 72-55 RR mdash mdash 27 5695 34 15973 5020 38 47 25 18316 41 13189 8440 mdash 46 32 22266 45 12935 45H28 mdash mdash 30 4725 39 10060 1841 32 40 21 15626 29 8294 1852 H 33 40 18 11733 27 8138 1950 mdash mdash mdash mdash 39 8110 v1037 mdash mdash mdash mdash 29 7532 93H01RR mdash 36 25 4574 36 7507 9590 39 41 28 4671 43 6449 45H26 mdash 44 30 6546 38 5805 72-65 RR mdash mdash mdash mdash 39 5252 430 mdash mdash mdash mdash 32 4433 34-65 32 38 32 3461 37 4264 5770 mdash mdash mdash mdash 43 3125 1145 mdash mdash mdash mdash 39 3077 45S51 mdash mdash mdash mdash 39 2730 9350 mdash mdash mdash mdash 36 2562 45H29 mdash mdash mdash mdash 24 2182 SP DesirableRR 35 40 12 1816 39 1953 32-75 30 41 24 3105 36 1882 45H21 33 37 19 5825 38 1874 D3151 mdash mdash 32 956 37 1690 45P70 mdash mdash 21 1235 29 1402 1818 27 29 19 1181 24 1368 72-35 RR mdash mdash 29 852 29 1323 83S01RR mdash 41 33 1855 39 973 Weighted Average Dryland Canola yield (Bu) amp total acressect 38 292755
CANOLA IRRIGATED YIELDS BY VARIETY 2007ndash2010dagger RISK AREA 5 2007 2008 2009 2009 2010 2010Dagger Variety Yield Yield Yield Acres Yield Acres 5440 mdash mdash 36 1811 48 3426 45S51 mdash mdash mdash mdash 33 1089 71-45RR mdash 54 48 728 46 1003 45H28 mdash mdash mdash mdash 37 815 Weighted Average Irrigated Canola yield (Bu) amp total acressect 45 11287
BARLEY DRYLAND YIELDS BY VARIETY 2007ndash2010dagger RISK AREA 5 2007 2008 2009 2009 2010 2010Dagger Variety Yield Yield Yield Acres Yield Acres Xena 64 78 44 96376 78 87663 CDC Copeland 62 76 56 45995 73 45248 AC Metcalfe 56 77 49 50115 64 44008 Conlon 57 66 35 19540 71 15292 Champion mdash mdash 31 3187 78 12962 CDC Cowboy mdash mdash 47 2566 55 5853 CDC Coalition mdash mdash 41 3795 89 5436 Newdale 50 81 60 5889 61 5356 Sundre mdash mdash 48 3193 51 4898 Ponoka 70 78 51 5299 55 4872 Formosa mdash mdash 29 3765 78 4021 CDC Dolly 42 53 53 3637 42 2414 McLeod 70 72 49 3283 95 1881 Trochu 61 100 mdash mdash 89 1716 Weighted Average Dryland Barley yield (Bu) amp total acressect 72 249817
BARLEY IRRIGATED YIELDS BY VARIETY 2007ndash2010dagger RISK AREA 5 2007 2008 2009 2009 2010 2010Dagger Variety Yield Yield Yield Acres Yield Acres Xena 80 89 71 5836 70 3520 CDC Coalition mdash mdash mdash mdash 84 1001 AC Metcalfe 56 98 63 708 86 925 Weighted Average Irrigated Barley yield (Bu) amp total acressect 73 9541
FIELD PEA DRYLAND YIELDS BY VARIETY 2007ndash2010dagger RISK AREA 5 2007 2008 2009 2009 2010 2010Dagger Variety Yield Yield Yield Acres Yield Acres CDC Meadow mdash mdash 16 2285 55 6537 CDC Golden 40 50 26 6339 46 5786 SW Midas 43 54 32 9179 52 5709 Eclipse 48 39 21 1428 32 1852 DS-Admiral 37 45 23 1180 47 1726 Weighted Average Dryland Field Pea yield (Bu) amp total acressect 49 24771
OATS DRYLAND YIELDS BY VARIETY 2007ndash2010dagger RISK AREA 5 2007 2008 2009 2009 2010 2010Dagger Variety Yield Yield Yield Acres Yield Acres AC Mustang 60 86 35 1421 74 1902 Derby 53 mdash mdash mdash 74 511 CDC Baler 52 66 mdash mdash 70 275 Weighted Average Dryland Oats yield (Bu) amp total acressect 73 4821
MUSTARD DRYLAND YIELDS BY VARIETY 2007ndash2010dagger RISK AREA 5 2007 2008 2009 2009 2010 2010Dagger Variety Yield Yield Yield Acres Yield Acres Andante (Yellow) 16 25 19 2153 20 2335 Weighted Average Dryland Mustard yield (Bu) amp total acressect 22 2823
RISK AREA 6
WHEAT DRYLAND YIELDS BY VARIETY 2007ndash2010dagger RISK AREA 6 2007 2008 2009 2009 2010 2010Dagger Variety Yield Yield Yield Acres Yield Acres Harvest (HRS) mdash 71 mdash mdash 68 1428 AC Foremost (CPS) mdash mdash mdash mdash 65 664 Weighted Average Dryland Wheat yield (Bu) amp total acressect 65 3432
CANOLA DRYLAND YIELDS BY VARIETY 2007ndash2010dagger RISK AREA 6 2007 2008 2009 2009 2010 2010Dagger Variety Yield Yield Yield Acres Yield Acres 71-45RR mdash 43 28 838 30 1579 32-75 34 32 25 2247 29 1121 72-35 RR mdash mdash 15 655 20 845 Weighted Average Dryland Canola yield (Bu) amp total acressect 27 7069
BARLEY DRYLAND YIELDS BY VARIETY 2007ndash2010dagger RISK AREA 6 2007 2008 2009 2009 2010 2010Dagger Variety Yield Yield Yield Acres Yield Acres AC Metcalfe 25 64 43 4061 85 3430 Xena 42 74 70 2540 85 2960 CDC Dolly 46 75 55 1309 79 2210 Formosa mdash mdash 61 2324 70 2164 CDC Copeland 50 78 45 3336 74 2086 CDC Helgason 49 63 32 909 72 1399 Conlon 36 58 68 1178 67 1307 Sundre mdash 55 50 1723 67 1171 Stander 40 56 67 1031 78 689 CDC Thompson mdash mdash mdash mdash 75 661 Trochu 39 61 66 888 70 593 Weighted Average Dryland Barley yield (Bu) amp total acressect 74 22039
OATS DRYLAND YIELDS BY VARIETY 2007ndash2010dagger RISK AREA 6 2007 2008 2009 2009 2010 2010Dagger Variety Yield Yield Yield Acres Yield Acres AC Morgan 73 64 73 884 72 1142 AC Mustang 63 104 36 1798 66 806 AC Juniper 104 92 58 796 116 373 Weighted Average Dryland Oats yield (Bu) amp total acressect 73 4222
RISK AREA 7
WHEAT DRYLAND YIELDS BY VARIETY 2007ndash2010dagger RISK AREA 7 2007 2008 2009 2009 2010 2010Dagger Variety Yield Yield Yield Acres Yield Acres Harvest (HRS) 54 66 52 51038 65 45341 5700 PR (CPS) 58 70 61 46703 69 35392 CDC Go (HRS) 56 68 60 18830 64 28477 AC Foremost (CPS) 54 77 65 22376 75 25906 CDC Imagine (HRS) 59 64 44 10340 59 12324 CDC Abound (HRS) mdash mdash 52 2128 61 7263 Alvena (HRS) mdash mdash 55 2845 59 5369 Oslo (CPS) 64 77 77 4405 81 4019 AC Intrepid (HRS) 53 60 55 3390 56 2608 5702 PR (CPS) mdash mdash 65 935 66 1962 Superb (HRS) 52 63 58 2366 59 1839 AC Crystal (CPS) 47 72 57 2228 65 1006 CDC Buteo (HRW) mdash mdash mdash mdash 63 783 Weighted Average Dryland Wheat yield (Bu) amp total acressect 66 178239
34 yield AlBeRTA 2011
dagger Yields only for those varieties grown by 5 or more producers Dagger On system as of January 19 2011sect Weighted Average Yield and Total Acreage include acres not reported in the table
CANOLA DRYLAND YIELDS BY VARIETY 2007ndash2010dagger RISK AREA 7 2007 2008 2009 2009 2010 2010Dagger Variety Yield Yield Yield Acres Yield Acres 5440 mdash 52 42 26338 42 47451 71-45RR 36 47 31 49219 36 35166 8440 mdash 50 39 23862 42 21954 5020 34 46 38 23768 40 19145 72-55 RR mdash mdash 32 12891 35 15410 45H28 mdash mdash 37 5837 38 9438 9553 mdash mdash 34 8893 33 9159 32-75 33 38 27 8919 28 6103 72-35 RR mdash mdash 29 2551 33 5519 45H26 36 50 37 10091 33 5126 45S51 mdash mdash 36 1647 38 4862 SP DesirableRR 29 43 27 5300 32 4239 72-65 RR mdash mdash mdash mdash 39 3732 1950 mdash mdash mdash mdash 37 3498 1852 H 33 46 32 5195 33 3432 5770 mdash mdash mdash mdash 39 3063 1818 29 45 34 2138 31 2008 4362 RR 25 40 28 1741 32 1900 4414 RR 35 45 31 2114 29 1762 9590 39 53 46 2057 33 1553 D3151 mdash mdash mdash mdash 36 1372 SW 3950 mdash mdash 32 1359 32 1315 73-45 RR mdash mdash mdash mdash 36 1182 1841 34 47 30 1809 40 1114 73-55 RR mdash mdash mdash mdash 35 1071 9350 mdash mdash mdash mdash 28 1061 43H57 mdash 43 mdash mdash 24 1037 1956 mdash mdash mdash mdash 37 1009 430 mdash mdash mdash mdash 24 917 SW 6802 32 42 mdash mdash 20 893 45H29 mdash mdash mdash mdash 39 888 34-65 32 39 36 1907 24 712 1896 31 42 24 1476 17 466 Weighted Average Dryland Canola yield (Bu) amp total acressect 37 234748
BARLEY DRYLAND YIELDS BY VARIETY 2007ndash2010dagger RISK AREA 7 2007 2008 2009 2009 2010 2010Dagger Variety Yield Yield Yield Acres Yield Acres AC Metcalfe 49 75 65 78461 74 65812 Xena 55 87 72 43444 88 41939 CDC Copeland 54 84 68 29220 80 34130 Formosa mdash 79 57 7997 81 11214 Stander 59 74 69 12058 76 9764 Sundre mdash 75 58 6769 76 9073 Conlon 52 78 55 14459 65 7188 Vivar 68 91 72 4615 81 7101 Lacey 66 86 46 10569 81 6462 CDC Thompson 44 102 78 6627 95 5998 CDC Bold 54 73 70 4165 70 4259 CDCTrey 62 79 79 4253 96 4095 Legacy (BT 950) 55 79 70 4256 78 3862 Ponoka 47 77 73 3314 79 3839 CDC Helgason 51 72 63 6481 82 3041 Champion mdash mdash 46 850 82 2985 Newdale 54 84 73 1623 82 2636 CDC Kendall 48 86 80 4062 86 2386 CDC Coalition mdash mdash 88 1301 95 2285 Trochu 57 82 49 2974 80 2249 CDC Yorkton mdash mdash 72 1243 79 2027 CDC Battleford 58 75 70 1653 74 1868 CDC Cowboy mdash 90 41 1729 63 1782 Falcon 64 68 72 939 65 1642 CDC Dolly 44 76 69 3779 73 1220 Bentley mdash mdash mdash mdash 80 1121 Seebe 54 59 66 1778 78 520 Weighted Average Dryland Barley yield (Bu) amp total acressect 80 245515
FIELD PEA DRYLAND YIELDS BY VARIETY 2007ndash2010dagger RISK AREA 7 2007 2008 2009 2009 2010 2010Dagger Variety Yield Yield Yield Acres Yield Acres Thunderbird mdash mdash 47 896 38 5633 CDC Meadow mdash mdash 49 1071 55 4506 Garde mdash mdash mdash mdash 59 1677 Cooper 40 mdash mdash mdash 50 1496 Camry mdash mdash 57 609 61 1204 Canstar mdash mdash mdash mdash 48 824 Weighted Average Dryland Field Pea yield (Bu) amp total acressect 47 18609
OATS DRYLAND YIELDS BY VARIETY 2007ndash2010dagger RISK AREA 7 2007 2008 2009 2009 2010 2010Dagger Variety Yield Yield Yield Acres Yield Acres AC Morgan 112 116 74 3244 119 5096 AC Mustang 102 116 59 2487 95 2845 Derby 72 84 mdash mdash 91 751 CDC Baler mdash mdash mdash mdash 97 742 Waldern 63 47 mdash mdash 122 522 Weighted Average Dryland Oats yield (Bu) amp total acressect 105 11397
POTATO DRYLAND YIELDS BY VARIETY 2007ndash2010dagger RISK AREA 7 2007 2008 2009 2009 2010 2010Dagger Variety Yield Yield Yield Acres Yield Acres Russet Burbank (Seed) mdash 14 mdash mdash 8 1041 Weighted Average Dryland Potato yield (Tons) amp total acressect 8 2307
RISK AREA 8
WHEAT DRYLAND YIELDS BY VARIETY 2007ndash2010dagger RISK AREA 8 2007 2008 2009 2009 2010 2010Dagger Variety Yield Yield Yield Acres Yield Acres CDC Go (HRS) 51 61 40 153132 54 176815 Harvest (HRS) 45 54 39 128610 46 110314 CDC Imagine (HRS) 45 49 33 16043 44 13483 Superb (HRS) 47 53 38 20901 45 10670 CDC Abound (HRS) mdash mdash 38 1759 43 8720 5700 PR (CPS) 56 67 46 12326 55 6834 CDC Teal (HRS) 40 47 33 7334 36 5181 Kane (HRS) mdash mdash 32 1432 43 3667 AC Elsa (HRS) 44 47 35 6656 36 3440 AC Barrie (HRS) 35 38 27 4760 41 3417 Lillian (HRS) 43 44 35 9814 36 3416 Prodigy (HRS) 33 45 33 3975 40 3345 Alvena (HRS) mdash mdash 43 1501 43 2973 AC Crystal (CPS) 42 65 38 4101 54 2283 AC Foremost (CPS) 53 66 42 4655 56 1635 Roblin (HRS) 31 41 28 4282 32 1443 AC Bellatrix (HRW) 46 61 24 1113 71 1256 Stettler (HRS) mdash mdash mdash mdash 46 967 CDC Bounty (HRS) mdash 53 mdash mdash 46 913 Unity (HRS) mdash mdash mdash mdash 58 879 McKenzie (HRS) 33 44 38 2667 42 864 Weighted Average Dryland Wheat yield (Bu) amp total acressect 49 376785
CANOLA DRYLAND YIELDS BY VARIETY 2007ndash2010dagger RISK AREA 8 2007 2008 2009 2009 2010 2010Dagger Variety Yield Yield Yield Acres Yield Acres 5440 mdash 48 32 60684 44 85338 8440 mdash 49 33 35781 44 29402 71-45RR 32 44 30 37848 35 27826 72-55 RR mdash 39 29 18151 34 23126 9590 35 48 29 17511 43 18009 5020 35 45 27 18568 36 15815 45H28 mdash mdash 30 10507 37 14641 5770 mdash mdash mdash mdash 46 12779 9553 mdash mdash 26 11386 34 10929 45H26 29 40 27 6082 36 7056 72-65 RR mdash mdash mdash mdash 39 6875 1145 mdash mdash mdash mdash 41 6101 1841 28 38 26 11051 34 5170 1141 mdash mdash 27 1176 39 3307 4414 RR mdash 43 19 1719 31 3258 997 RR mdash 41 28 4145 28 3084 9552 mdash mdash 24 1916 24 2532 Nex 845 CL mdash 36 24 4967 35 2166 5030 29 40 30 7946 40 1788 9555 mdash mdash mdash mdash 32 1713 32-75 33 38 29 2771 25 1712 45H21 30 40 25 3341 31 1572 45P70 35 40 mdash mdash 34 1555 NX4-104 RR mdash mdash 26 3486 37 1467 46P50 33 46 26 989 36 1381 93H01RR mdash mdash 23 753 40 1377 9550 21 37 mdash mdash 39 1372 45H29 mdash mdash mdash mdash 36 1179 45S51 mdash mdash mdash mdash 38 1115 v2030 mdash mdash 22 1653 30 929 72-35 RR mdash mdash 26 899 34 916 1818 26 40 28 648 27 889 6040 RR mdash mdash mdash mdash 36 848 73-55 RR mdash mdash mdash mdash 34 671 v1040 mdash mdash mdash mdash 23 645 Weighted Average Dryland Canola yield (Bu) amp total acressect 39 319693
2011 yield AlBeRTA 35
dagger Yields only for those varieties grown by 5 or more producers Dagger On system as of January 19 2011sect Weighted Average Yield and Total Acreage include acres not reported in the table
BARLEY DRYLAND YIELDS BY VARIETY 2007ndash2010dagger RISK AREA 8 2007 2008 2009 2009 2010 2010Dagger Variety Yield Yield Yield Acres Yield Acres AC Metcalfe 54 81 51 94977 68 86933 Xena 61 83 51 45644 75 44358 CDC Copeland 53 84 49 31899 71 32830 CDC Cowboy mdash 60 42 11802 70 15289 CDC Kendall 53 82 50 8733 68 7328 Sundre mdash 80 48 2511 62 4408 Ponoka 62 78 52 5527 71 4337 CDC Coalition mdash mdash 61 941 71 3103 Newdale 66 81 57 2161 64 3040 Conlon 58 77 48 8788 59 2967 Trochu 50 70 53 1307 63 2113 CDC Helgason 52 72 44 1749 48 1985 CDC Dolly 54 73 35 3025 61 1835 Champion mdash mdash 55 847 77 1791 CDC Meredith mdash mdash mdash mdash 84 1536 Seebe 50 71 60 1879 54 1143 AC Lacombe 59 84 mdash mdash 63 848 Stander 63 74 47 1829 55 406 Weighted Average Dryland Barley yield (Bu) amp total acressect 69 224742
FIELD PEA DRYLAND YIELDS BY VARIETY 2007ndash2010dagger RISK AREA 8 2007 2008 2009 2009 2010 2010Dagger Variety Yield Yield Yield Acres Yield Acres CDC Meadow mdash mdash 27 5344 51 16376 SW Midas 42 48 26 11782 44 6204 Eclipse 46 48 24 7434 45 4902 Cooper mdash mdash 35 2636 42 2951 Canstar mdash 41 32 2792 36 2727 Thunderbird mdash mdash mdash mdash 49 2479 CDC Golden mdash 52 25 2333 36 2396 Polstead mdash 49 mdash mdash 37 2183 DS-Admiral 35 45 22 3210 43 1405 SW Circus 33 43 26 1766 39 1326 Weighted Average Dryland Field Pea yield (Bu) amp total acressect 45 46782
OATS DRYLAND YIELDS BY VARIETY 2007ndash2010dagger RISK AREA 8 2007 2008 2009 2009 2010 2010Dagger Variety Yield Yield Yield Acres Yield Acres AC Morgan 89 86 51 3041 94 3077 AC Mustang 61 72 56 1879 108 2540 CDC Baler 58 mdash 41 736 87 1498 Cascade 48 73 mdash mdash 88 527 Derby 68 70 43 371 106 416 Weighted Average Dryland Oats yield (Bu) amp total acressect 93 9646
FLAX DRYLAND YIELDS BY VARIETY 2007ndash2010dagger RISK AREA 8 2007 2008 2009 2009 2010 2010Dagger Variety Yield Yield Yield Acres Yield Acres CDC Bethune mdash 35 24 1374 33 1366 Weighted Average Dryland Flax yield (Bu) amp total acressect 31 1736
CANARY SEED DRYLAND YIELDS BY VARIETY 2007ndash2010dagger RISK AREA 8 2007 2008 2009 2009 2010 2010Dagger Variety Yield Yield Yield Acres Yield Acres Keet mdash mdash mdash mdash 1531 1041 Weighted Average Dryland Canary Seed yield (Lbs) amp total acressect 1531 1041
RISK AREA 9
WHEAT DRYLAND YIELDS BY VARIETY 2007ndash2010dagger RISK AREA 9 2007 2008 2009 2009 2010 2010Dagger Variety Yield Yield Yield Acres Yield Acres Lillian (HRS) 28 32 17 72887 38 76030 AC Eatonia (HRS) 27 28 23 62626 31 66786 Harvest (HRS) 34 38 23 59669 36 56671 Strongfield (D) 34 36 30 31240 42 23563 AC Barrie (HRS) 28 31 21 16701 32 14466 Superb (HRS) 30 36 22 13063 32 11856 AC Cadillac (HRS) 27 28 12 13442 30 10371 AC Andrew (SWS) 51 52 29 7107 51 8620 Prodigy (HRS) 28 36 17 9995 33 7758 CDC Go (HRS) mdash 48 28 5264 40 6603 AC Avonlea (D) 30 36 34 14402 33 6033 CDC Abound (HRS) mdash mdash 30 2482 43 6023 AC Elsa (HRS) 28 34 21 9654 34 5994 Infinity (HRS) 38 43 35 3348 46 4982
WHEAT DRYLAND YIELDS BY VARIETY 2007ndash2010dagger RISK AREA 9 2007 2008 2009 2009 2010 2010Dagger Variety Yield Yield Yield Acres Yield Acres McKenzie (HRS) 28 35 28 4284 37 4118 AC Crystal (CPS) 43 42 24 3510 46 3976 CDC Imagine (HRS) 35 38 27 4484 38 3791 Columbus (HRS) 26 27 12 3383 31 2947 Radiant (HRW) 30 44 22 8871 41 2208 Kyle (D) 24 27 23 4541 28 1770 Weighted Average Dryland Wheat yield (Bu) amp total acressect 36 342701
CANOLA DRYLAND YIELDS BY VARIETY 2007ndash2010dagger RISK AREA 9 2007 2008 2009 2009 2010 2010Dagger Variety Yield Yield Yield Acres Yield Acres 71-45RR 21 26 16 18947 29 26129 5440 mdash 32 21 11463 37 14862 45H26 mdash 33 21 4354 30 9444 45H28 mdash mdash 22 2799 30 6444 34-65 15 23 6 4789 24 6102 8440 mdash 29 20 4809 37 4479 9553 mdash mdash 24 6273 36 3735 5030 27 31 24 6687 31 3718 9590 31 35 31 4381 41 3453 5020 27 33 16 6312 36 2769 5770 mdash mdash mdash mdash 43 2714 Nex 845 CL mdash 29 20 1666 30 2627 1818 21 27 14 4444 21 2171 8571 mdash mdash mdash mdash 14 2049 9552 mdash mdash 24 760 26 1927 1651H mdash 21 mdash mdash 23 1842 46P50 21 29 18 1908 40 1719 9551 15 21 12 1893 34 1568 D3151 mdash mdash mdash mdash 33 1078 Rugby mdash mdash 12 905 34 910 72-65 RR mdash mdash mdash mdash 34 850 Weighted Average Dryland Canola yield (Bu) amp total acressect 31 131376
BARLEY DRYLAND YIELDS BY VARIETY 2007ndash2010dagger RISK AREA 9 2007 2008 2009 2009 2010 2010Dagger Variety Yield Yield Yield Acres Yield Acres Xena 44 56 36 24186 56 26647 AC Metcalfe 39 48 34 24992 48 20716 CDC Cowboy mdash 51 14 9496 47 16044 Conlon 33 58 32 5639 53 7681 McLeod mdash 59 32 4321 51 5924 Seebe 29 29 21 3552 42 4578 CDC Dolly 39 35 20 2761 47 2588 CDC Copeland 44 51 31 3785 40 2218 Ponoka 40 43 25 4342 66 2213 Bridge 28 34 22 2188 28 1993 Champion mdash mdash mdash mdash 68 1822 Weighted Average Dryland Barley yield (Bu) amp total acressect 50 99351
FIELD PEA DRYLAND YIELDS BY VARIETY 2007ndash2010dagger RISK AREA 9 2007 2008 2009 2009 2010 2010Dagger Variety Yield Yield Yield Acres Yield Acres CDC Golden 28 34 6 8404 34 9528 Eclipse 25 30 11 7625 16 4648 CDC Meadow mdash mdash 26 1062 35 3184 SW Midas mdash 32 15 4142 24 2356 Delta 29 31 6 4692 32 2081 DS-Admiral 31 44 22 4979 26 1702 Weighted Average Dryland Field Pea yield (Bu) amp total acressect 31 32039
OATS DRYLAND YIELDS BY VARIETY 2007ndash2010dagger RISK AREA 9 2007 2008 2009 2009 2010 2010Dagger Variety Yield Yield Yield Acres Yield Acres Derby 35 36 28 5499 70 4624 Calibre 39 45 23 5550 63 3585 AC Mustang 20 46 26 3163 73 2213 AC Morgan 43 48 25 2217 76 2186 Waldern 34 49 17 1681 78 1753 Weighted Average Dryland Oats yield (Bu) amp total acressect 69 18313
MUSTARD DRYLAND YIELDS BY VARIETY 2007ndash2010dagger RISK AREA 9 2007 2008 2009 2009 2010 2010Dagger Variety Yield Yield Yield Acres Yield Acres AC Pennant (Yellow) 10 12 mdash mdash 17 2345 Weighted Average Dryland Mustard yield (Bu) amp total acressect 17 9757
36 yield AlBeRTA 2011
dagger Yields only for those varieties grown by 5 or more producers Dagger On system as of January 19 2011sect Weighted Average Yield and Total Acreage include acres not reported in the table
LENTIL DRYLAND YIELDS BY VARIETY 2007ndash2010dagger RISK AREA 9 2007 2008 2009 2009 2010 2010Dagger Variety Yield Yield Yield Acres Yield Acres CDC Maxim mdash mdash mdash mdash 1704 1599 Weighted Average Dryland Lentil yield (Lbs) amp total acressect 1523 7581
RISK AREA 10
WHEAT DRYLAND YIELDS BY VARIETY 2007ndash2010dagger RISK AREA 10 2007 2008 2009 2009 2010 2010Dagger Variety Yield Yield Yield Acres Yield Acres AC Foremost (CPS) 81 83 57 24156 65 21770 Superb (HRS) 59 63 55 4107 64 3254 AC Crystal (CPS) 68 67 62 2031 57 2095 5700 PR (CPS) 58 82 61 1389 67 1211 5701 PR (CPS) mdash 68 48 1900 57 882 CDC Imagine (HRS) mdash 56 mdash mdash 27 870 Harvest (HRS) 39 mdash mdash mdash 58 718 Weighted Average Dryland Wheat yield (Bu) amp total acressect 62 35639
CANOLA DRYLAND YIELDS BY VARIETY 2007ndash2010dagger RISK AREA 10 2007 2008 2009 2009 2010 2010Dagger Variety Yield Yield Yield Acres Yield Acres 5440 mdash 56 46 16945 46 21964 9553 mdash mdash 42 5974 44 7820 5020 39 48 36 8721 44 7641 72-55 RR mdash mdash 45 3161 44 4384 71-45RR 38 48 34 2998 35 3724 9590 28 50 36 718 45 2480 45S51 mdash mdash mdash mdash 38 2426 8440 mdash mdash 39 1787 35 1949 45H28 mdash mdash 32 3425 52 1440 4414 RR mdash mdash mdash mdash 38 1399 1818 34 38 27 1009 33 1369 D3150 mdash mdash 49 973 51 962 45H26 mdash 46 39 2037 41 900 9350 mdash mdash mdash mdash 49 788 997 RR mdash mdash 25 542 30 743 72-35 RR mdash mdash mdash mdash 42 698 Weighted Average Dryland Canola yield (Bu) amp total acressect 43 76042
BARLEY DRYLAND YIELDS BY VARIETY 2007ndash2010dagger RISK AREA 10 2007 2008 2009 2009 2010 2010Dagger Variety Yield Yield Yield Acres Yield Acres Ponoka 71 77 67 8935 71 7941 Seebe 56 60 56 8316 61 6395 Xena 73 89 87 3888 85 5201 Sundre mdash 83 69 2746 63 4696 AC Metcalfe 65 76 75 1642 76 2854 Vivar mdash 66 65 607 74 821 Stander 50 66 mdash mdash 73 715 Weighted Average Dryland Barley yield (Bu) amp total acressect 69 35998
FIELD PEA DRYLAND YIELDS BY VARIETY 2007ndash2010dagger RISK AREA 10 2007 2008 2009 2009 2010 2010Dagger Variety Yield Yield Yield Acres Yield Acres CDC Meadow mdash mdash mdash mdash 53 1729 Cooper mdash mdash mdash mdash 59 1665 Canstar mdash mdash mdash mdash 40 1304 Polstead mdash mdash 58 1073 55 929 Weighted Average Dryland Field Pea yield (Bu) amp total acressect 50 7331
OATS DRYLAND YIELDS BY VARIETY 2007ndash2010dagger RISK AREA 10 2007 2008 2009 2009 2010 2010Dagger Variety Yield Yield Yield Acres Yield Acres AC Morgan 90 87 78 4180 100 5548 AC Mustang 56 81 99 1113 90 2854 Derby 71 72 64 1397 80 1279 Cascade 57 74 58 1071 70 625 Grizzly mdash mdash mdash mdash 74 436 Weighted Average Dryland Oats yield (Bu) amp total acressect 90 12473
RISK AREA 11
WHEAT DRYLAND YIELDS BY VARIETY 2007ndash2010dagger RISK AREA 11 2007 2008 2009 2009 2010 2010Dagger Variety Yield Yield Yield Acres Yield Acres Harvest (HRS) 57 64 48 77597 59 88829 AC Foremost (CPS) 67 75 46 63314 72 46510 Superb (HRS) 59 62 40 28660 61 27390
WHEAT DRYLAND YIELDS BY VARIETY 2007ndash2010dagger RISK AREA 11 2007 2008 2009 2009 2010 2010Dagger Variety Yield Yield Yield Acres Yield Acres CDC Go (HRS) mdash 69 45 9344 57 14844 5700 PR (CPS) 68 75 50 25748 66 14409 Snowbird (HRS) 59 62 48 6741 60 12548 CDC Imagine (HRS) 55 61 37 7900 56 8197 CDC Abound (HRS) mdash mdash 41 1802 58 7922 AC Intrepid (HRS) 56 65 45 7664 58 6853 AC Crystal (CPS) 55 65 46 8703 64 6718 Kane (HRS) mdash mdash 48 891 64 4558 5701 PR (CPS) 63 70 47 5390 75 3109 CDC Teal (HRS) 56 61 42 3766 47 2863 5702 PR (CPS) mdash mdash mdash mdash 78 2631 Prodigy (HRS) 50 62 43 3212 55 2445 Infinity (HRS) 53 57 39 3999 54 2088 AC Barrie (HRS) 48 52 29 2803 49 1836 WR 859 CL (HRS) mdash mdash mdash mdash 63 1725 Alvena (HRS) mdash mdash 44 1691 64 1656 AC Majestic (HRS) 55 51 34 2709 52 1322 Radiant (HRW) 63 61 45 3930 69 1290 5602 HR (HRS) 48 52 37 1938 48 1219 Roblin (HRS) 53 53 24 1524 49 1145 McKenzie (HRS) 43 52 26 1318 46 1104 Weighted Average Dryland Wheat yield (Bu) amp total acressect 62 268800
CANOLA DRYLAND YIELDS BY VARIETY 2007ndash2010dagger RISK AREA 11 2007 2008 2009 2009 2010 2010Dagger Variety Yield Yield Yield Acres Yield Acres 5440 mdash 51 36 50826 51 62157 5020 41 50 35 63630 50 53358 8440 mdash 52 35 33780 52 30364 72-55 RR mdash mdash 28 14745 43 23205 71-45RR 41 46 30 28440 40 20680 45H29 mdash mdash 21 265 51 18383 9553 mdash mdash 33 17605 49 17071 1818 34 45 24 12390 40 14890 45H28 mdash mdash 27 14701 43 11540 5770 mdash mdash mdash mdash 53 9921 73-67 RR mdash mdash mdash mdash 47 8099 72-65 RR mdash mdash mdash mdash 46 7665 9590 47 53 36 8778 53 7060 34-65 38 43 26 7465 43 5898 73-77 RR mdash mdash mdash mdash 47 5498 4414 RR 41 47 20 4543 40 5386 45S51 mdash mdash 33 2658 41 4449 45H26 43 49 28 13647 39 3708 9558C mdash mdash mdash mdash 50 3652 1950 mdash mdash mdash mdash 46 2519 v1037 mdash mdash 28 1824 39 1722 45H21 35 46 22 2789 40 1511 45H73 mdash mdash mdash mdash 43 1413 1852 H mdash 44 25 724 38 1377 32-75 35 38 16 1426 39 1361 73-55 RR mdash mdash mdash mdash 41 1313 45A51 mdash mdash mdash mdash 46 1228 1841 39 45 23 2191 39 1185 9552 mdash mdash mdash mdash 42 1139 997 RR mdash 39 23 3678 43 1124 34-55 36 42 26 4772 40 1114 Prairie 719RR 33 38 22 4647 33 1058 73-65 RR mdash mdash mdash mdash 47 1056 5030 45 52 35 5745 42 1010 1956 mdash mdash mdash mdash 34 1001 9551 37 38 30 1293 37 832 9555 mdash mdash mdash mdash 44 810 9550 33 42 31 842 39 732 93H01RR mdash 46 23 1047 40 553 Weighted Average Dryland Canola yield (Bu) amp total acressect 47 354621
BARLEY DRYLAND YIELDS BY VARIETY 2007ndash2010dagger RISK AREA 11 2007 2008 2009 2009 2010 2010Dagger Variety Yield Yield Yield Acres Yield Acres Xena 70 86 63 47157 82 44286 AC Metcalfe 62 79 63 30399 72 28941 Seebe 61 72 50 27132 69 27440 Ponoka 69 80 62 19177 72 15566 CDC Copeland 82 90 63 12398 85 12595 Sundre mdash 79 70 5561 73 9746 CDC Coalition mdash mdash 66 1673 78 7066 CDC Kendall 64 74 56 9361 86 6415 Vivar 75 88 61 4794 83 4998 CDC Cowboy mdash 67 27 3360 73 4615
2011 yield AlBeRTA 37
dagger Yields only for those varieties grown by 5 or more producers Dagger On system as of January 19 2011sect Weighted Average Yield and Total Acreage include acres not reported in the table
BARLEY DRYLAND YIELDS BY VARIETY 2007ndash2010dagger RISK AREA 11 2007 2008 2009 2009 2010 2010Dagger Variety Yield Yield Yield Acres Yield Acres Champion mdash mdash mdash mdash 80 3483 CDC PolarStar mdash mdash mdash mdash 84 3172 Stander 66 82 69 4976 76 2978 CDC Thompson 72 91 65 3212 85 2795 Newdale mdash mdash mdash mdash 42 2253 CDC Select 60 86 69 1581 82 2012 Conlon 67 78 41 7551 103 1746 Legacy (BT 950) mdash 91 77 977 47 1740 McLeod 64 89 69 1982 86 1646 CDC Dolly 62 66 57 1106 65 1582 CDC Bold 67 81 60 4748 69 1578 AC Lacombe 60 69 63 1231 65 697 Stockford mdash mdash mdash mdash 71 672 CDC Helgason 62 77 61 596 64 661 Excel 58 mdash 55 535 43 482 Weighted Average Dryland Barley yield (Bu) amp total acressect 76 196872
FIELD PEA DRYLAND YIELDS BY VARIETY 2007ndash2010dagger RISK AREA 11 2007 2008 2009 2009 2010 2010Dagger Variety Yield Yield Yield Acres Yield Acres Cooper 50 53 43 7180 42 8670 Thunderbird mdash mdash 48 1792 43 7192 SW Midas mdash 57 47 4189 55 3146 Polstead mdash 45 44 1106 50 2567 CDC Meadow mdash mdash 43 1314 43 2347 CDC Golden mdash mdash mdash mdash 34 2241 Canstar mdash mdash 45 906 51 2071 Nitouche 48 51 31 2134 49 1171 CDC Striker mdash mdash mdash mdash 68 753 CDC Patrick mdash mdash mdash mdash 36 580 Weighted Average Dryland Field Pea yield (Bu) amp total acressect 45 36572
OATS DRYLAND YIELDS BY VARIETY 2007ndash2010dagger RISK AREA 11 2007 2008 2009 2009 2010 2010Dagger Variety Yield Yield Yield Acres Yield Acres AC Morgan 109 100 60 10341 125 15324 Derby 97 93 52 6173 107 6730 AC Mustang 87 92 68 2391 109 2917 CDC Baler mdash mdash mdash mdash 68 478 Cascade 81 67 30 525 80 428 Murphy mdash mdash mdash mdash 60 391 Jordan mdash mdash mdash mdash 79 198 Weighted Average Dryland Oats yield (Bu) amp total acressect 114 28615
FABA BEAN DRYLAND YIELDS BY VARIETY 2007ndash2010dagger RISK AREA 11 2007 2008 2009 2009 2010 2010Dagger Variety Yield Yield Yield Acres Yield Acres Snowbird mdash 2987 2032 1936 2641 1575 Weighted Average Dryland Faba Bean yield (Lbs) amp total acressect 2651 1595
RISK AREA 12
WHEAT DRYLAND YIELDS BY VARIETY 2007ndash2010dagger RISK AREA 12 2007 2008 2009 2009 2010 2010Dagger Variety Yield Yield Yield Acres Yield Acres Harvest (HRS) 38 50 35 263481 49 267951 Superb (HRS) 39 50 36 72095 47 58686 CDC Abound (HRS) mdash mdash 37 8977 47 32406 AC Barrie (HRS) 34 39 31 29946 43 23464 CDC Imagine (HRS) 37 46 34 28766 46 18763 Prodigy (HRS) 33 39 32 15134 46 14451 CDC Go (HRS) mdash 65 36 10301 51 13487 AC Crystal (CPS) 43 50 42 11605 53 9793 Infinity (HRS) 44 49 37 17632 45 9342 AC Splendor (HRS) 32 42 27 9959 46 8634 Lillian (HRS) 37 44 35 12200 49 8465 5602 HR (HRS) 40 38 29 15149 45 7997 CDC Alsask (HRS) mdash mdash 40 1928 44 7508 Alvena (HRS) mdash mdash mdash mdash 45 6548 AC Foremost (CPS) 56 71 47 9070 60 5994 AC Intrepid (HRS) 40 55 36 9797 49 5155 AC Cadillac (HRS) 31 37 30 3926 36 4168 5701 PR (CPS) 49 52 32 4022 62 3692 Radiant (HRW) 62 56 23 5953 51 3666 Lovitt (HRS) 33 mdash mdash mdash 45 3499 McKenzie (HRS) 33 43 35 5910 48 3167
WHEAT DRYLAND YIELDS BY VARIETY 2007ndash2010dagger RISK AREA 12 2007 2008 2009 2009 2010 2010Dagger Variety Yield Yield Yield Acres Yield Acres Kane (HRS) mdash mdash 34 1468 48 2917 Unity (HRS) mdash mdash mdash mdash 55 2823 CDC Bounty (HRS) 31 41 30 3108 38 2594 5700 PR (CPS) 39 60 47 5701 61 2568 Snowbird (HRS) 37 52 37 1405 55 2250 Park (HRS) 38 37 mdash mdash 40 2103 CDC Teal (HRS) 33 41 29 3972 46 1858 CDC Osprey (HRW) mdash 56 17 2229 56 1771 AC Majestic (HRS) mdash mdash mdash mdash 43 1627 Roblin (HRS) 29 29 16 2514 36 1539 Weighted Average Dryland Wheat yield (Bu) amp total acressect 48 550692
CANOLA DRYLAND YIELDS BY VARIETY 2007ndash2010dagger RISK AREA 12 2007 2008 2009 2009 2010 2010Dagger Variety Yield Yield Yield Acres Yield Acres 5440 mdash 45 25 55116 47 79946 5020 31 41 24 81630 40 68701 8440 mdash 46 28 28396 47 33850 9553 mdash mdash 25 17477 41 26747 71-45RR 30 39 23 33356 39 25869 9590 33 40 23 21217 44 25869 72-65 RR mdash mdash 22 2470 42 19283 34-65 30 37 17 17822 35 14334 72-55 RR mdash mdash 21 18345 40 12521 46P50 31 40 24 17064 38 11455 45H26 mdash 40 23 11035 40 9537 5770 mdash mdash mdash mdash 51 8380 1818 29 38 19 5206 34 7706 46A76 24 28 21 3241 29 7063 D3150 mdash mdash 19 2054 31 6820 45S51 mdash mdash 32 623 41 6629 45H28 mdash mdash 22 6830 44 6259 71-40 CL mdash mdash 25 3691 38 4893 45A71 17 33 13 3446 37 4766 45P70 30 32 22 6878 35 4201 5030 30 37 28 7745 47 3546 9552 mdash mdash 20 1763 31 3245 1841 36 44 21 6149 37 3188 Prairie 719RR 26 33 14 6231 32 3064 v1037 mdash mdash 26 2170 35 2874 Nex 845 CL 29 34 19 8136 32 2738 45H29 mdash mdash mdash mdash 47 2592 4414 RR 30 39 18 3308 40 2464 6130 RR mdash mdash mdash mdash 35 2426 1950 mdash mdash mdash mdash 35 2335 6040 RR mdash mdash mdash mdash 35 2273 45H73 31 36 21 2554 36 2061 NX4-104 RR mdash mdash 24 2591 33 1937 9550 21 32 14 1753 41 1761 9555 mdash mdash mdash mdash 36 1698 34-55 32 38 19 3272 41 1419 32-75 25 34 25 1192 39 1307 5525 CL mdash mdash mdash mdash 40 1214 45H21 30 37 17 3737 34 989 5505 CL mdash mdash mdash mdash 35 856 9350 mdash mdash mdash mdash 35 703 73-45 RR mdash mdash mdash mdash 55 696 72-35 RR mdash mdash mdash mdash 47 398 Weighted Average Dryland Canola yield (Bu) amp total acressect 41 455233
BARLEY DRYLAND YIELDS BY VARIETY 2007ndash2010dagger RISK AREA 12 2007 2008 2009 2009 2010 2010Dagger Variety Yield Yield Yield Acres Yield Acres Xena 53 72 56 54771 75 54064 AC Metcalfe 49 65 52 42407 71 32827 CDC Copeland 51 70 44 25950 77 26256 CDC Cowboy mdash 53 31 13118 68 22516 Seebe 40 50 29 9744 47 8394 CDC Coalition mdash mdash 63 2635 83 5986 Champion mdash mdash mdash mdash 75 5673 CDC Kendall 47 67 44 8844 67 4339 Ponoka 56 55 34 3052 59 2649 Newdale 61 91 58 1876 80 1870 CDC Dolly 43 60 14 1714 57 1375 Conlon 61 71 46 4178 63 1026 Sundre mdash mdash mdash mdash 69 1004 Bentley mdash mdash mdash mdash 83 611 Weighted Average Dryland Barley yield (Bu) amp total acressect 72 176655
38 yield AlBeRTA 2011
dagger Yields only for those varieties grown by 5 or more producers Dagger On system as of January 19 2011sect Weighted Average Yield and Total Acreage include acres not reported in the table
FIELD PEA DRYLAND YIELDS BY VARIETY 2007ndash2010dagger RISK AREA 12 2007 2008 2009 2009 2010 2010Dagger Variety Yield Yield Yield Acres Yield Acres Cooper 42 51 34 17870 35 19289 CDC Meadow mdash mdash 21 1080 34 7552 SW Midas 30 46 26 7221 37 7136 CDC Golden 28 41 22 12107 40 7071 DS-Admiral 32 44 23 8751 31 5169 Eclipse 34 43 26 8194 35 4079 Polstead mdash mdash 31 2111 40 3509 Thunderbird mdash mdash 34 1532 40 3357 SW Capri 37 48 26 4455 45 2128 Sorento mdash mdash mdash mdash 52 1746 CDC Patrick mdash mdash mdash mdash 41 1716 Stratus 34 39 32 1002 25 1360 CDC Sage mdash mdash mdash mdash 40 881 Weighted Average Dryland Field Pea yield (Bu) amp total acressect 36 78464
OATS DRYLAND YIELDS BY VARIETY 2007ndash2010dagger RISK AREA 12 2007 2008 2009 2009 2010 2010Dagger Variety Yield Yield Yield Acres Yield Acres AC Morgan 62 63 44 2875 117 4376 Derby 40 64 31 5641 78 3916 AC Mustang 52 52 36 2804 64 2719 CDC Baler 42 55 39 2469 89 1929 7600M mdash 87 48 884 75 1743 Waldern 63 85 29 1483 68 1179 Calibre 45 60 44 843 99 686 Foothill mdash mdash mdash mdash 75 538 Cascade 33 59 19 589 61 431 Grizzly 37 43 32 634 59 348 Weighted Average Dryland Oats yield (Bu) amp total acressect 85 19985
LENTIL DRYLAND YIELDS BY VARIETY 2007ndash2010dagger RISK AREA 12 2007 2008 2009 2009 2010 2010Dagger Variety Yield Yield Yield Acres Yield Acres CDC Maxim mdash mdash mdash mdash 823 1214 Weighted Average Dryland Lentil yield (Lbs) amp total acressect 828 2392
RISK AREA 13
WHEAT DRYLAND YIELDS BY VARIETY 2007ndash2010dagger RISK AREA 13 2007 2008 2009 2009 2010 2010Dagger Variety Yield Yield Yield Acres Yield Acres Harvest (HRS) 41 50 44 274405 52 275980 Superb (HRS) 39 48 41 49446 49 38648 Prodigy (HRS) 34 42 35 35197 46 24624 5700 PR (CPS) 50 60 50 25598 57 23219 AC Splendor (HRS) 35 42 39 21916 46 18280 CDC Go (HRS) mdash 54 45 7138 56 14835 CDC Imagine (HRS) 33 47 42 14299 51 12928 AC Crystal (CPS) 45 55 48 17658 58 12557 CDC Abound (HRS) mdash mdash 42 3357 53 11924 AC Barrie (HRS) 34 40 35 13402 46 11498 CDC Alsask (HRS) mdash mdash 37 5454 56 11405 McKenzie (HRS) 38 48 42 13377 46 8894 Kane (HRS) mdash mdash 42 1912 50 8144 AC Intrepid (HRS) 41 50 42 7087 53 6702 5701 PR (CPS) 50 55 49 4756 57 6134 Infinity (HRS) 34 45 41 9238 56 5973 CDC Teal (HRS) 37 44 36 5970 51 5227 AC Foremost (CPS) 52 68 52 7883 67 4575 AC Taber (CPS) 52 56 61 3887 72 3494 Snowbird (HRS) 38 45 44 3557 51 3471 AC Domain (HRS) mdash mdash mdash mdash 49 3310 Laura (HRS) 31 36 35 3223 37 2640 Alvena (HRS) mdash mdash 48 863 50 2205 Journey (HRS) 41 40 46 2991 41 2047 5602 HR (HRS) 42 42 38 2360 48 1968 AC Elsa (HRS) 35 34 mdash mdash 51 1736 Roblin (HRS) 35 39 35 3273 36 1645 Katepwa (HRS) 31 34 31 3220 40 1526 Radiant (HRW) mdash 49 41 2770 53 1384 Unity (HRS) mdash mdash mdash mdash 51 1119 CDC Bounty (HRS) 38 mdash mdash mdash 50 1087 Weighted Average Dryland Wheat yield (Bu) amp total acressect 51 538528
CANOLA DRYLAND YIELDS BY VARIETY 2007ndash2010dagger RISK AREA 13 2007 2008 2009 2009 2010 2010Dagger Variety Yield Yield Yield Acres Yield Acres 5020 33 42 27 95077 43 74271 5440 mdash 44 31 78292 48 71780 9590 35 45 33 48788 48 63694
CANOLA DRYLAND YIELDS BY VARIETY 2007ndash2010dagger RISK AREA 13 2007 2008 2009 2009 2010 2010Dagger Variety Yield Yield Yield Acres Yield Acres 9553 mdash mdash 25 36455 45 50803 8440 mdash 43 31 28741 48 41520 72-55 RR mdash 48 28 24855 43 35154 72-65 RR mdash mdash 35 1335 45 31225 45H28 mdash 41 26 17752 42 21955 45H26 35 40 27 20108 43 18031 34-65 29 36 22 17897 38 17653 71-45RR 33 39 29 29373 42 15505 9552 mdash mdash 17 10029 37 14937 46P50 33 40 25 21083 43 14252 5030 34 41 32 11403 46 9121 1818 27 34 20 7506 37 8127 45H73 mdash 40 22 5734 45 7174 5770 mdash mdash mdash mdash 53 6856 45P70 34 42 32 5312 40 6682 SP DesirableRR 28 38 26 7279 37 5765 45H29 mdash mdash mdash mdash 65 5080 4414 RR 33 36 21 3412 39 4373 46A76 26 33 22 7005 34 4371 45H21 30 38 21 7276 38 4102 1768S mdash 36 29 1806 39 4027 v1037 mdash mdash 20 1875 38 3881 9550 28 33 29 3895 38 3520 9551 26 29 17 10595 33 3465 9555 mdash mdash mdash mdash 41 3269 D3150 mdash mdash 30 1694 44 2790 1950 mdash mdash mdash mdash 46 2564 73-55 RR mdash mdash mdash mdash 48 2555 9350 mdash mdash mdash mdash 38 2478 997 RR mdash 37 18 4185 30 2435 SP Banner 25 33 26 3671 40 2299 Prairie 719RR 27 30 20 5000 31 2165 Rugby mdash 36 9 1489 33 1899 5525 CL mdash mdash mdash mdash 39 1688 1141 mdash 39 23 3380 45 1442 1145 mdash mdash mdash mdash 49 1359 71-40 CL mdash mdash 23 1775 33 1273 45S51 mdash mdash 27 2928 42 1065 D3151 mdash mdash mdash mdash 42 995 6130 RR mdash mdash mdash mdash 33 901 6040 RR mdash mdash mdash mdash 33 786 72-35 RR mdash mdash mdash mdash 41 762 34-55 31 36 22 2454 40 545 Weighted Average Dryland Canola yield (Bu) amp total acressect 44 603036
BARLEY DRYLAND YIELDS BY VARIETY 2007ndash2010dagger RISK AREA 13 2007 2008 2009 2009 2010 2010Dagger Variety Yield Yield Yield Acres Yield Acres Xena 56 74 62 67051 75 61541 AC Metcalfe 52 67 59 61918 66 49976 CDC Cowboy mdash 59 42 14157 63 19724 CDC Copeland 55 72 63 22076 76 17888 Champion mdash mdash 75 939 83 11295 Seebe 48 58 44 8363 61 5663 CDC Dolly 44 56 44 6575 54 4402 CDCTrey 51 69 60 3086 78 4361 Sundre mdash mdash 44 1785 68 2826 CDC Kendall 50 67 54 5478 64 2728 Ponoka 51 54 42 3728 58 2444 Trochu 65 78 62 1749 81 2417 Conlon 53 65 50 2012 49 1420 CDC Bold 61 70 38 5617 56 1202 CDC Coalition mdash mdash mdash mdash 69 1104 CDC PolarStar mdash mdash mdash mdash 64 1074 AC Lacombe 38 52 43 372 36 475 Weighted Average Dryland Barley yield (Bu) amp total acressect 70 198073
FIELD PEA DRYLAND YIELDS BY VARIETY 2007ndash2010dagger RISK AREA 13 2007 2008 2009 2009 2010 2010Dagger Variety Yield Yield Yield Acres Yield Acres SW Midas 39 48 39 21107 39 22216 CDC Meadow mdash mdash 38 1773 48 10228 DS-Admiral 33 49 30 9032 40 8325 Thunderbird mdash mdash 35 2918 54 6869 Swing 34 47 35 8517 37 5340 CDC Golden mdash 48 45 2053 43 3735 Eclipse 35 43 33 4646 33 3690 Eiffel 36 44 35 3263 37 2956 Cooper 43 49 42 3234 43 2466 CDC Striker mdash mdash mdash mdash 45 2225
2011 YIELD ALBERTA 39
FIELD PEA DRYLAND YIELDS BY VARIETY 2007ndash2010dagger RISK AREA 13 2007 2008 2009 2009 2010 2010Dagger Variety Yield Yield Yield Acres Yield Acres Cutlass FP 28 42 36 1683 38 2130 Profi mdash mdash 45 1692 37 1820 Carneval 32 38 35 754 47 1613 Weighted Average Dryland Field Pea yield (Bu) amp total acressect 42 79070
OATS DRYLAND YIELDS BY VARIETY 2007ndash2010dagger RISK AREA 13 2007 2008 2009 2009 2010 2010Dagger Variety Yield Yield Yield Acres Yield Acres AC Morgan 80 95 59 11557 111 11587 Derby 63 79 51 6491 97 7281 AC Mustang 61 85 30 2164 114 1790 CDC Baler 43 84 50 1578 78 1417 Calibre 68 65 47 662 95 1266 Waldern 36 mdash 54 645 66 1006 7600M 53 mdash 48 689 73 951 Weighted Average Dryland Oats yield (Bu) amp total acressect 101 27617
RISK AREA 14
WHEAT DRYLAND YIELDS BY VARIETY 2007ndash2010dagger RISK AREA 14 2007 2008 2009 2009 2010 2010Dagger Variety Yield Yield Yield Acres Yield Acres AC Foremost (CPS) mdash 74 69 4493 76 5876 5700 PR (CPS) mdash mdash 64 1673 78 1854 Weighted Average Dryland Wheat yield (Bu) amp total acressect 70 11669
CANOLA DRYLAND YIELDS BY VARIETY 2007ndash2010dagger RISK AREA 14 2007 2008 2009 2009 2010 2010Dagger Variety Yield Yield Yield Acres Yield Acres 5440 mdash 49 47 5989 51 4806 5020 43 45 44 1032 44 3237 9553 mdash mdash 39 5459 41 2981 72-55 RR mdash mdash mdash mdash 47 1483 45H28 mdash mdash 42 761 36 879 Weighted Average Dryland Canola yield (Bu) amp total acressect 43 23002
BARLEY DRYLAND YIELDS BY VARIETY 2007ndash2010dagger RISK AREA 14 2007 2008 2009 2009 2010 2010Dagger Variety Yield Yield Yield Acres Yield Acres Ponoka 62 67 69 2301 73 3036 Sundre mdash mdash 86 1660 81 2237 Seebe 53 56 57 1656 49 1367 Xena mdash 74 89 1726 61 1231 AC Metcalfe 62 69 74 1804 81 997 Weighted Average Dryland Barley yield (Bu) amp total acressect 69 10227
OATS DRYLAND YIELDS BY VARIETY 2007ndash2010dagger RISK AREA 14 2007 2008 2009 2009 2010 2010Dagger Variety Yield Yield Yield Acres Yield Acres Derby 74 74 83 1678 86 1944 AC Morgan 105 102 68 2223 87 1933 AC Mustang 99 mdash mdash mdash 133 405 Weighted Average Dryland Oats yield (Bu) amp total acressect 89 5632
RISK AREA 15
WHEAT DRYLAND YIELDS BY VARIETY 2007ndash2010dagger RISK AREA 15 2007 2008 2009 2009 2010 2010Dagger Variety Yield Yield Yield Acres Yield Acres AC Foremost (CPS) 73 77 60 37406 74 36944 Harvest (HRS) 47 55 46 25025 51 26150 5700 PR (CPS) 61 70 52 21615 66 15044 Superb (HRS) 57 57 44 7445 56 12003 AC Crystal (CPS) 49 62 54 9651 67 11102 CDC Abound (HRS) mdash mdash 43 1061 58 6199 CDC Imagine (HRS) 41 53 52 3520 54 3203 5701 PR (CPS) 62 79 55 3069 66 2336 Infinity (HRS) mdash 63 50 659 52 2077 Roblin (HRS) 47 57 46 1624 52 1933 CDC Go (HRS) mdash mdash mdash mdash 57 1794 5702 PR (CPS) mdash mdash 48 2785 65 1787 AC Intrepid (HRS) 51 60 46 1234 50 1743
dagger Yields only for those varieties grown by 5 or more producers Dagger On system as of January 19 2011sect Weighted Average Yield and Total Acreage include acres not reported in the table
All the pArts bull All the serviceAll the time
wwwaglandcorpcom
All the pArts bull All the serviceAll the time
St paul hwy 29 amp hwy 881 south
(780) 645-4437
Vermilion4915 47th Avenue
(780) 853-5367
lloydminSterhwy 16 rr 14(780) 875-4471
complete SolutionS come Standard
Save now on utility tractors Balers amp mocoswith powerful performance exceptional reliability and advanced technology John Deere has been a trusted partner in the farming community for generations plus when your John Deere equipment comes from Agland it comes backed by superior service and support no matter the task at hand John Deere equipment and the experts at Agland will help you make the most of your land
40 yield AlBeRTA 2011
dagger Yields only for those varieties grown by 5 or more producers Dagger On system as of January 19 2011sect Weighted Average Yield and Total Acreage include acres not reported in the table
WHEAT DRYLAND YIELDS BY VARIETY 2007ndash2010dagger RISK AREA 15 2007 2008 2009 2009 2010 2010Dagger Variety Yield Yield Yield Acres Yield Acres AC Splendor (HRS) 34 mdash 38 1303 45 1620 CDC Alsask (HRS) mdash mdash mdash mdash 56 1474 Prodigy (HRS) 46 52 41 2727 54 1397 McKenzie (HRS) 42 mdash mdash mdash 59 867 Weighted Average Dryland Wheat yield (Bu) amp total acressect 62 135631
CANOLA DRYLAND YIELDS BY VARIETY 2007ndash2010dagger RISK AREA 15 2007 2008 2009 2009 2010 2010Dagger Variety Yield Yield Yield Acres Yield Acres 5020 37 47 39 41165 48 41083 5440 mdash 51 43 36604 52 34409 72-55 RR mdash mdash 37 13906 47 21522 9553 mdash 50 37 10680 46 20533 9590 39 51 40 16370 52 18874 8440 mdash 50 40 6100 54 10127 45H28 mdash mdash 35 9593 49 9597 71-45RR 37 42 32 14638 46 9413 34-65 35 41 29 9894 42 7432 1818 35 41 32 5476 44 6050 SP DesirableRR mdash 39 25 5842 41 5048 45H26 45 44 34 6964 46 4892 72-65 RR mdash mdash mdash mdash 48 4089 9550 28 35 48 1719 52 4030 72-35 RR mdash mdash mdash mdash 49 3633 5770 mdash mdash mdash mdash 49 3630 45H29 mdash mdash mdash mdash 53 3383 45S51 mdash mdash mdash mdash 49 3183 5030 37 45 36 5259 48 2877 4414 RR 33 41 20 1069 40 2337 D3151 mdash mdash mdash mdash 42 2013 D3150 mdash mdash mdash mdash 50 1829 Nex 845 CL mdash 42 28 1761 45 1585 9552 mdash mdash 25 1489 36 1576 34-55 33 38 33 1818 45 1569 9555 mdash mdash mdash mdash 40 1385 9551 29 34 11 1622 41 1154 Prairie 719RR 31 34 31 2518 42 1125 32-75 32 33 23 3213 39 1110 46P50 38 43 33 2443 50 1075 71-40 CL mdash mdash 35 780 33 994 73-55 RR mdash mdash mdash mdash 54 958 430 mdash mdash mdash mdash 37 865 997 RR mdash 39 33 1582 39 754 73-67 RR mdash mdash mdash mdash 50 709 45P70 mdash 43 34 1171 32 420 Weighted Average Dryland Canola yield (Bu) amp total acressect 48 248888
BARLEY DRYLAND YIELDS BY VARIETY 2007ndash2010dagger RISK AREA 15 2007 2008 2009 2009 2010 2010Dagger Variety Yield Yield Yield Acres Yield Acres Xena 62 75 69 23112 74 25410 AC Metcalfe 62 73 70 21029 76 20625 Seebe 57 61 53 16602 67 12677 Ponoka 60 73 64 8015 73 9322 CDC Cowboy mdash 65 54 4835 70 7732 CDC Copeland 64 74 66 5031 65 4730 CDC Coalition mdash 87 mdash mdash 85 2953 Champion mdash mdash mdash mdash 84 2488 Sundre mdash mdash 72 1101 79 2417 Vivar 74 84 60 2350 88 1985 CDC Thompson 80 91 73 1738 84 1508 Trochu mdash 95 79 2344 84 1283 Stander 67 76 60 1956 68 1058 AC Lacombe 52 69 65 1178 85 692 Weighted Average Dryland Barley yield (Bu) amp total acressect 74 100554
FIELD PEA DRYLAND YIELDS BY VARIETY 2007ndash2010dagger RISK AREA 15 2007 2008 2009 2009 2010 2010Dagger Variety Yield Yield Yield Acres Yield Acres Canstar mdash mdash 58 1967 52 3813 Cooper mdash mdash 52 1352 51 2751 CDC Meadow mdash mdash mdash mdash 62 1739 SW Midas 45 50 42 1764 41 1595 Weighted Average Dryland Field Pea yield (Bu) amp total acressect 50 17154
OATS DRYLAND YIELDS BY VARIETY 2007ndash2010dagger RISK AREA 15 2007 2008 2009 2009 2010 2010Dagger Variety Yield Yield Yield Acres Yield Acres AC Morgan 97 110 73 15310 106 18082 Derby 63 72 52 3047 76 2368 AC Mustang 64 68 52 1728 101 1470 Weighted Average Dryland Oats yield (Bu) amp total acressect 102 22811
RISK AREA 16
WHEAT DRYLAND YIELDS BY VARIETY 2007ndash2010dagger RISK AREA 16 2007 2008 2009 2009 2010 2010Dagger Variety Yield Yield Yield Acres Yield Acres AC Foremost (CPS) mdash mdash mdash mdash 89 659 Weighted Average Dryland Wheat yield (Bu) amp total acressect 69 3155
CANOLA DRYLAND YIELDS BY VARIETY 2007ndash2010dagger RISK AREA 16 2007 2008 2009 2009 2010 2010Dagger Variety Yield Yield Yield Acres Yield Acres 9553 mdash mdash mdash mdash 45 2849 5020 mdash mdash mdash mdash 41 1703 Weighted Average Dryland Canola yield (Bu) amp total acressect 42 11495
OATS DRYLAND YIELDS BY VARIETY 2007ndash2010dagger RISK AREA 16 2007 2008 2009 2009 2010 2010Dagger Variety Yield Yield Yield Acres Yield Acres Derby 68 102 mdash mdash 93 816 Weighted Average Dryland Oats yield (Bu) amp total acressect 97 1188
RISK AREA 17
WHEAT DRYLAND YIELDS BY VARIETY 2007ndash2010dagger RISK AREA 17 2007 2008 2009 2009 2010 2010Dagger Variety Yield Yield Yield Acres Yield Acres CDC Teal (HRS) 50 31 28 5458 20 7614 CDC Alsask (HRS) mdash mdash mdash mdash 32 1060 Weighted Average Dryland Wheat yield (Bu) amp total acressect 30 17904
CANOLA DRYLAND YIELDS BY VARIETY 2007ndash2010dagger RISK AREA 17 2007 2008 2009 2009 2010 2010Dagger Variety Yield Yield Yield Acres Yield Acres 5020 mdash mdash 36 5563 17 5245 45H28 mdash mdash mdash mdash 20 4970 71-45RR mdash 30 33 1535 39 3491 72-55 RR mdash mdash mdash mdash 35 1460 9553 mdash mdash 16 1356 15 1036 Weighted Average Dryland Canola yield (Bu) amp total acressect 24 27967
RISK AREA 18
WHEAT DRYLAND YIELDS BY VARIETY 2007ndash2010dagger RISK AREA 18 2007 2008 2009 2009 2010 2010Dagger Variety Yield Yield Yield Acres Yield Acres Harvest (HRS) 56 31 33 17745 37 12470 5700 PR (CPS) 62 35 44 9575 37 8004 AC Splendor (HRS) 49 19 26 5909 19 5785 AC Intrepid (HRS) 57 31 39 5735 31 5293 Superb (HRS) mdash 43 43 3277 38 4349 CDC Teal (HRS) mdash 26 31 3857 24 4315 CDC Alsask (HRS) mdash mdash mdash mdash 35 2465 Weighted Average Dryland Wheat yield (Bu) amp total acressect 33 50349
CANOLA DRYLAND YIELDS BY VARIETY 2007ndash2010dagger RISK AREA 18 2007 2008 2009 2009 2010 2010Dagger Variety Yield Yield Yield Acres Yield Acres 5020 42 24 29 17318 17 11210 71-45RR 43 25 29 10326 18 7336 72-55 RR mdash mdash mdash mdash 24 6651 45H26 mdash 28 38 6158 21 5899 430 mdash mdash 34 1421 15 5771 45H28 mdash mdash mdash mdash 20 4099 5440 mdash mdash mdash mdash 29 2927 32-75 28 23 21 1379 12 2394 43A56 36 19 25 2568 20 1679
2011 yield AlBeRTA 41
dagger Yields only for those varieties grown by 5 or more producers Dagger On system as of January 19 2011sect Weighted Average Yield and Total Acreage include acres not reported in the table
CANOLA DRYLAND YIELDS BY VARIETY 2007ndash2010dagger RISK AREA 18 2007 2008 2009 2009 2010 2010Dagger Variety Yield Yield Yield Acres Yield Acres 5525 CL mdash mdash mdash mdash 8 1412 SP DesirableRR mdash mdash 21 1265 14 1360 45S51 mdash mdash mdash mdash 18 429 Weighted Average Dryland Canola yield (Bu) amp total acressect 19 63778
BARLEY DRYLAND YIELDS BY VARIETY 2007ndash2010dagger RISK AREA 18 2007 2008 2009 2009 2010 2010Dagger Variety Yield Yield Yield Acres Yield Acres AC Metcalfe 62 36 47 6214 39 3257 Weighted Average Dryland Barley yield (Bu) amp total acressect 40 7170
FIELD PEA DRYLAND YIELDS BY VARIETY 2007ndash2010dagger RISK AREA 18 2007 2008 2009 2009 2010 2010Dagger Variety Yield Yield Yield Acres Yield Acres SW Midas mdash 26 36 2283 27 4488 CDC Meadow mdash mdash mdash mdash 40 2317 Weighted Average Dryland Field Pea yield (Bu) amp total acressect 30 8499
OATS DRYLAND YIELDS BY VARIETY 2007ndash2010dagger RISK AREA 18 2007 2008 2009 2009 2010 2010Dagger Variety Yield Yield Yield Acres Yield Acres Derby 93 39 47 939 64 4487 AC Morgan 107 37 55 4556 47 2978 AC Mustang mdash mdash 64 814 43 1110 Weighted Average Dryland Oats yield (Bu) amp total acressect 53 9202
RISK AREA 19
WHEAT DRYLAND YIELDS BY VARIETY 2007ndash2010dagger RISK AREA 19 2007 2008 2009 2009 2010 2010Dagger Variety Yield Yield Yield Acres Yield Acres Harvest (HRS) 54 46 39 93077 34 93732 Superb (HRS) 56 44 40 43243 36 38536 AC Intrepid (HRS) 54 36 34 34877 29 27871 CDC Teal (HRS) 49 39 31 29229 29 22429 Prodigy (HRS) 50 36 37 16037 35 14799 Infinity (HRS) 63 39 39 15137 27 11411 CDC Alsask (HRS) mdash mdash 32 3216 34 11072 AC Splendor (HRS) 47 35 37 11584 30 10728 Alvena (HRS) mdash mdash 32 1716 24 8305 CDC Osprey (HRW) 47 mdash 36 4008 44 7680 AC Foremost (CPS) 41 34 42 5469 32 4547 5700 PR (CPS) 62 50 36 13860 31 4272 5701 PR (CPS) mdash 50 46 6878 41 3512 AC Elsa (HRS) 50 27 32 4617 30 3292 McKenzie (HRS) 48 35 32 3215 23 3194 Radiant (HRW) mdash mdash 40 3391 45 2976 CDC Go (HRS) mdash mdash mdash mdash 31 2108 Roblin (HRS) 40 28 23 3027 24 2058 CDC Imagine (HRS) mdash 38 34 3697 36 1914 CDC Abound (HRS) mdash mdash mdash mdash 29 1728 Peace (HRS) mdash 36 32 2020 33 1607 Weighted Average Dryland Wheat yield (Bu) amp total acressect 33 283387
CANOLA DRYLAND YIELDS BY VARIETY 2007ndash2010dagger RISK AREA 19 2007 2008 2009 2009 2010 2010Dagger Variety Yield Yield Yield Acres Yield Acres 5020 38 27 31 106358 22 109870 72-55 RR mdash 24 31 16863 25 61966 71-45RR 38 26 32 67226 23 43200 45H28 mdash mdash 32 14612 26 29044 5440 mdash 32 32 31375 26 22555 8440 mdash 28 30 18317 29 19770 45H26 45 29 33 26290 25 19478 34-65 33 27 26 10671 22 17422 72-65 RR mdash mdash 29 466 22 16858 32-75 32 19 21 16489 13 16525 9553 mdash mdash 30 11992 21 15538 72-35 RR mdash mdash 30 5785 16 12238 9350 mdash mdash mdash mdash 22 10175 43H57 mdash 24 23 3838 18 8116 71-40 CL mdash mdash 24 6093 16 7983 9590 41 26 31 11659 18 7723 45S51 mdash mdash 25 976 18 6483
CANOLA DRYLAND YIELDS BY VARIETY 2007ndash2010dagger RISK AREA 19 2007 2008 2009 2009 2010 2010Dagger Variety Yield Yield Yield Acres Yield Acres 45H29 mdash mdash mdash mdash 30 5569 SP DesirableRR mdash 21 26 7686 18 5556 43A56 30 19 24 11076 14 5372 45A71 30 19 16 4171 10 5209 5770 mdash mdash mdash mdash 28 4972 9552 mdash mdash 25 1281 18 4071 45H24 37 20 25 5139 17 3855 430 mdash mdash 24 1953 18 3697 45P70 40 23 mdash mdash 23 3498 Cafe 33 10 19 4399 15 2610 45H73 mdash 30 24 2519 23 2235 73-45 RR mdash mdash mdash mdash 21 2014 4414 RR mdash 17 29 1425 15 1728 5525 CL mdash mdash mdash mdash 18 1457 45H21 34 19 27 2591 25 1445 Rugby mdash mdash 25 999 13 1345 46P50 38 32 mdash mdash 23 1181 4362 RR mdash 12 20 2819 16 1159 6040 RR mdash mdash mdash mdash 22 550 Weighted Average Dryland Canola yield (Bu) amp total acressect 22 505632
BARLEY DRYLAND YIELDS BY VARIETY 2007ndash2010dagger RISK AREA 19 2007 2008 2009 2009 2010 2010Dagger Variety Yield Yield Yield Acres Yield Acres AC Metcalfe 65 47 62 25329 42 23277 Xena 78 50 65 8593 47 9689 CDC Copeland 79 53 60 8712 44 7932 Ponoka 74 41 73 3055 57 3711 Champion mdash mdash mdash mdash 44 1984 CDC Cowboy mdash mdash 55 918 40 1937 Seebe 68 52 mdash mdash 42 1907 Sundre mdash 25 22 833 41 1602 CDC Helgason 60 mdash mdash mdash 31 942 Weighted Average Dryland Barley yield (Bu) amp total acressect 43 58931
FIELD PEA DRYLAND YIELDS BY VARIETY 2007ndash2010dagger RISK AREA 19 2007 2008 2009 2009 2010 2010Dagger Variety Yield Yield Yield Acres Yield Acres SW Midas mdash 30 36 11093 23 13330 Cutlass FP 45 33 33 9894 26 13082 Cooper mdash 17 39 3362 29 5298 CDC Meadow mdash mdash mdash mdash 30 3970 Eclipse 52 22 30 3481 20 2946 SW Parade 39 21 mdash mdash 24 1298 Garde mdash 16 mdash mdash 31 1240 Carneval 42 25 21 2517 17 1181 Weighted Average Dryland Field Pea yield (Bu) amp total acressect 25 50561
OATS DRYLAND YIELDS BY VARIETY 2007ndash2010dagger RISK AREA 19 2007 2008 2009 2009 2010 2010Dagger Variety Yield Yield Yield Acres Yield Acres Derby 102 70 77 8886 59 11483 AC Morgan 114 54 70 6502 55 8309 AC Mustang 94 mdash mdash mdash 38 566 Weighted Average Dryland Oats yield (Bu) amp total acressect 55 21581
CREEPING RED FESCUE DRYLAND YIELDS BY VARIETY 2007ndash2010dagger RISK AREA 19
2007 2008 2009 2009 2010 2010Dagger Variety Yield Yield Yield Acres Yield Acres Boreal 428 521 422 2294 244 884 Weighted Average Dryland Creeping Red Fescue yield (Lbs) amp total acressect 229 962
RISK AREA 20
WHEAT DRYLAND YIELDS BY VARIETY 2007ndash2010dagger RISK AREA 20 2007 2008 2009 2009 2010 2010Dagger Variety Yield Yield Yield Acres Yield Acres Harvest (HRS) 51 51 41 17033 37 18383 AC Intrepid (HRS) 51 54 41 9691 37 7875 CDC Teal (HRS) 48 52 42 8477 37 7731
42 yield AlBeRTA 2011
dagger Yields only for those varieties grown by 5 or more producers Dagger On system as of January 19 2011sect Weighted Average Yield and Total Acreage include acres not reported in the table
WHEAT DRYLAND YIELDS BY VARIETY 2007ndash2010dagger RISK AREA 20 2007 2008 2009 2009 2010 2010Dagger Variety Yield Yield Yield Acres Yield Acres Roblin (HRS) 51 48 40 5661 34 5345 McKenzie (HRS) mdash 44 mdash mdash 34 3849 CDC Alsask (HRS) mdash mdash mdash mdash 42 1908 Weighted Average Dryland Wheat yield (Bu) amp total acressect 40 55904
CANOLA DRYLAND YIELDS BY VARIETY 2007ndash2010dagger RISK AREA 20 2007 2008 2009 2009 2010 2010Dagger Variety Yield Yield Yield Acres Yield Acres 71-45RR 35 36 31 17186 26 18523 5020 39 36 30 15633 31 16425 8440 mdash mdash mdash mdash 37 7450 72-55 RR mdash mdash 30 5557 35 6595 32-75 29 28 21 10639 21 4937 4362 RR mdash mdash mdash mdash 15 3643 72-65 RR mdash mdash mdash mdash 23 3215 72-35 RR mdash mdash 29 4405 32 2271 34-65 mdash mdash mdash mdash 31 1106 71-40 CL mdash mdash mdash mdash 22 1056 Weighted Average Dryland Canola yield (Bu) amp total acressect 29 79284
BARLEY DRYLAND YIELDS BY VARIETY 2007ndash2010dagger RISK AREA 20 2007 2008 2009 2009 2010 2010Dagger Variety Yield Yield Yield Acres Yield Acres AC Metcalfe 60 63 69 1498 70 2807 Xena mdash mdash 55 1556 66 2113 Weighted Average Dryland Barley yield (Bu) amp total acressect 59 10207
FIELD PEA DRYLAND YIELDS BY VARIETY 2007ndash2010dagger RISK AREA 20 2007 2008 2009 2009 2010 2010Dagger Variety Yield Yield Yield Acres Yield Acres DS-Admiral 57 50 30 2298 25 3825 Cooper mdash mdash mdash mdash 49 840 Weighted Average Dryland Field Pea yield (Bu) amp total acressect 26 11605
OATS DRYLAND YIELDS BY VARIETY 2007ndash2010dagger RISK AREA 20 2007 2008 2009 2009 2010 2010Dagger Variety Yield Yield Yield Acres Yield Acres Derby 98 90 85 2280 92 3522 Weighted Average Dryland Oats yield (Bu) amp total acressect 86 4090
RISK AREA 21
WHEAT DRYLAND YIELDS BY VARIETY 2007ndash2010dagger RISK AREA 21 2007 2008 2009 2009 2010 2010Dagger Variety Yield Yield Yield Acres Yield Acres Harvest (HRS) 42 53 49 21282 39 21450 Superb (HRS) 57 64 50 14684 40 7390 CDC Go (HRS) mdash 53 54 7252 45 7263 5700 PR (CPS) 62 43 43 6403 35 6231 AC Intrepid (HRS) 54 32 37 4471 30 5069 AC Foremost (CPS) mdash 59 63 5087 39 3448 CDC Teal (HRS) 46 25 26 1802 22 1476 AC Splendor (HRS) 46 32 29 2784 22 1397 Alvena (HRS) mdash mdash mdash mdash 32 1040 Park (HRS) mdash mdash 25 684 25 505 Weighted Average Dryland Wheat yield (Bu) amp total acressect 37 63781
CANOLA DRYLAND YIELDS BY VARIETY 2007ndash2010dagger RISK AREA 21 2007 2008 2009 2009 2010 2010Dagger Variety Yield Yield Yield Acres Yield Acres 5020 43 37 30 26598 29 48390 32-75 26 13 20 16044 14 13709 72-55 RR mdash mdash 24 2213 29 8120 71-45RR 32 33 27 7870 26 5887 8440 mdash 47 40 3722 22 5716 SP DesirableRR mdash mdash 11 1560 16 5699 72-35 RR mdash mdash 13 3446 16 4953 430 mdash mdash 11 1390 22 4873 43A56 25 23 16 7659 19 3759 45H28 mdash mdash 30 5552 30 2985 45H73 mdash mdash mdash mdash 18 1906 9350 mdash mdash mdash mdash 17 1822 SW Spirit River 17 mdash mdash mdash 16 1447 Cafe mdash mdash 17 1055 4 1287 41P55 mdash mdash mdash mdash 7 752 Weighted Average Dryland Canola yield (Bu) amp total acressect 24 133560
BARLEY DRYLAND YIELDS BY VARIETY 2007ndash2010dagger RISK AREA 21 2007 2008 2009 2009 2010 2010Dagger Variety Yield Yield Yield Acres Yield Acres AC Metcalfe 59 43 50 10946 35 8540 Ponoka 78 76 50 4068 75 6520 Xena 65 45 56 5169 52 2599 Sundre mdash mdash 48 2387 38 1450 CDC Copeland 70 39 mdash mdash 36 1067 AC Albright 52 28 mdash mdash 33 896 Weighted Average Dryland Barley yield (Bu) amp total acressect 48 27696
FIELD PEA DRYLAND YIELDS BY VARIETY 2007ndash2010dagger RISK AREA 21 2007 2008 2009 2009 2010 2010Dagger Variety Yield Yield Yield Acres Yield Acres Cutlass FP mdash mdash 31 2264 27 6897 Eclipse 44 27 24 2953 15 4458 CDC Meadow mdash mdash mdash mdash 28 2069 SW Midas 39 mdash 31 1191 28 1280 Carneval mdash 20 mdash mdash 18 955 Nitouche mdash mdash mdash mdash 7 842 Weighted Average Dryland Field Pea yield (Bu) amp total acressect 21 21175
OATS DRYLAND YIELDS BY VARIETY 2007ndash2010dagger RISK AREA 21 2007 2008 2009 2009 2010 2010Dagger Variety Yield Yield Yield Acres Yield Acres AC Morgan 97 52 61 3809 77 6789 Derby 77 mdash 36 680 65 2271 AC Mustang 93 48 mdash mdash 33 600 Weighted Average Dryland Oats yield (Bu) amp total acressect 69 14618
RISK AREA 22
WHEAT DRYLAND YIELDS BY VARIETY 2007ndash2010dagger RISK AREA 22 2007 2008 2009 2009 2010 2010Dagger Variety Yield Yield Yield Acres Yield Acres Alikat (HRS) 45 54 60 6359 53 5355 AC Intrepid (HRS) mdash 46 48 4557 52 4232 CDC Teal (HRS) 33 41 38 4038 36 3429 Roblin (HRS) 41 45 46 5990 41 3132 CDC Imagine (HRS) mdash 45 41 1908 42 2513 Infinity (HRS) mdash mdash 53 2175 52 2388 Weighted Average Dryland Wheat yield (Bu) amp total acressect 47 27442
CANOLA DRYLAND YIELDS BY VARIETY 2007ndash2010dagger RISK AREA 22 2007 2008 2009 2009 2010 2010Dagger Variety Yield Yield Yield Acres Yield Acres 5020 34 39 32 29254 36 33686 32-75 30 29 28 13052 31 12283 71-45RR mdash 37 32 7156 31 7382 72-35 RR mdash mdash 33 3795 36 6567 5440 mdash mdash 35 1788 40 4218 43H57 mdash mdash 33 2646 31 2182 45H26 mdash mdash mdash mdash 33 1331 Weighted Average Dryland Canola yield (Bu) amp total acressect 35 76968
BARLEY DRYLAND YIELDS BY VARIETY 2007ndash2010dagger RISK AREA 22 2007 2008 2009 2009 2010 2010Dagger Variety Yield Yield Yield Acres Yield Acres AC Metcalfe 58 62 65 1358 68 1072 Weighted Average Dryland Barley yield (Bu) amp total acressect 67 3210
FIELD PEA DRYLAND YIELDS BY VARIETY 2007ndash2010dagger RISK AREA 22 2007 2008 2009 2009 2010 2010Dagger Variety Yield Yield Yield Acres Yield Acres DS-Admiral 45 53 46 7148 52 4824 Cutlass FP mdash mdash 41 1760 45 2455 SW Midas mdash mdash mdash mdash 32 839 Weighted Average Dryland Field Pea yield (Bu) amp total acressect 48 8535
OATS DRYLAND YIELDS BY VARIETY 2007ndash2010dagger RISK AREA 22 2007 2008 2009 2009 2010 2010Dagger Variety Yield Yield Yield Acres Yield Acres AC Morgan 129 135 116 2045 130 4377 Weighted Average Dryland Oats yield (Bu) amp total acressect 124 5393
Behold the undisputed cereal seed treatment champion With new micro-dispersion technology Raxilreg MD provides cereal growers with uniform seed coverage for superior plant protection and an increased return on your investment
Score an easy victory over true loose smut seed-and soil-bourne fusarium and knock out all the most serious early season cereal diseases ndash without the application struggle
For more information visit BayerCropSciencecaRaxil
Victory without the fight
BayerCropScienceca or 1 888-283-6847 or contact your Bayer CropScience representativeAlways read and follow label directions Raxilreg is a registered trademark of Bayer Bayer CropScience is a member of CropLife Canada
0111-15296A
15296A RaxilMD_Victory_FBCindd 1 12111 238 PM
Our high-yielding hybrids are here And theyrsquore backed by healthier agronomic performance even healthier demand from our customers plus a Healthier Profi t Guarantee More Nexera canola acres are needed now to meet the current demand for heart-healthy Omega-9 Oils So take advantage of this profi table canola opportunity Talk to your local Nexera canola crusher or retailer And contract today
Accomplish even more With Nexera canola hybrids Call our Solutions Center at 18006673852 Or visit healthierprofi tsca
NOW THE PROFIT IS REALLY FLOWING ndash WITH OUR NEW HYBRID CANOLA VARIETIES
TMTrademark of Dow AgroSciences LLC0211-15855-2
THE NEXERATM CANOLA
HYBRID EXPLOSIONHEALTHIER YIELDS
BY THE BUSHEL EVEN MORE PROFIT
BY THE BOTTLE
NEXERATM CANOLA
HYBRIDSPlanting
Now
15855-2 Yield Alberta 8125X1075indd 1 11-01-27 1034 AM
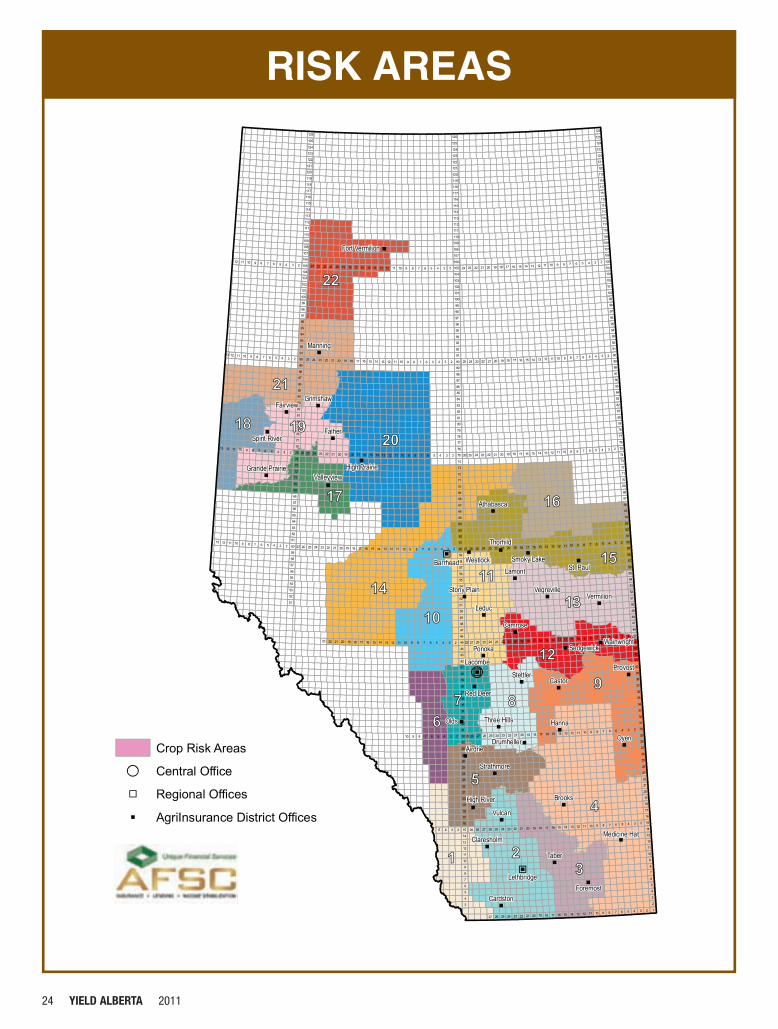
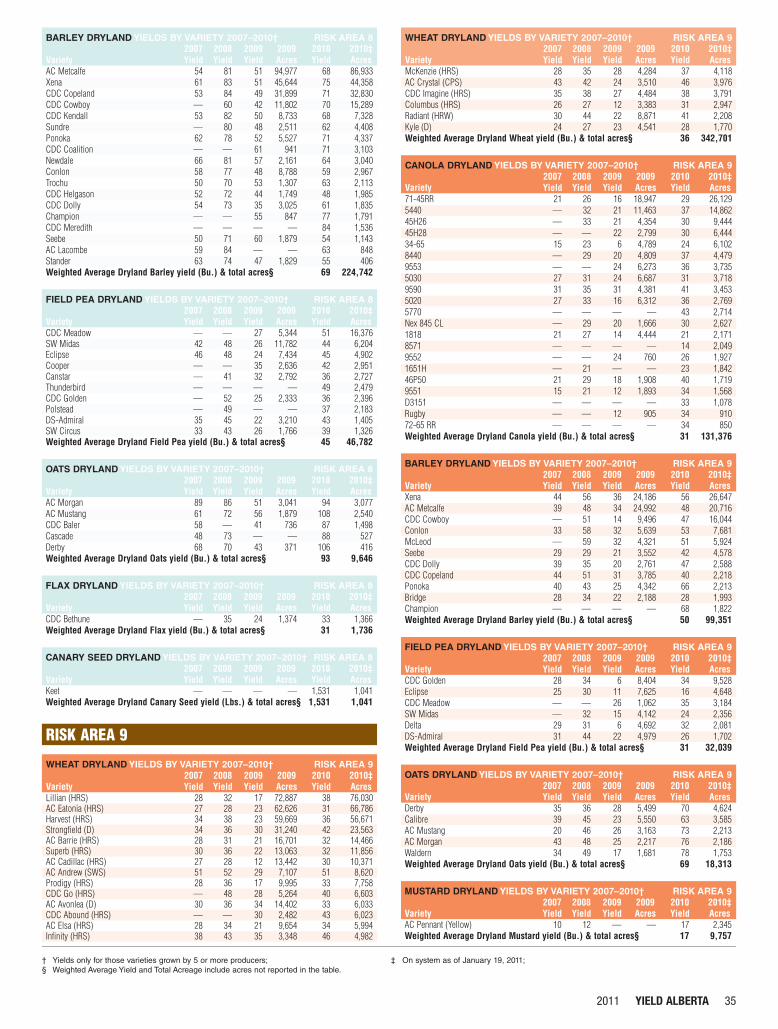
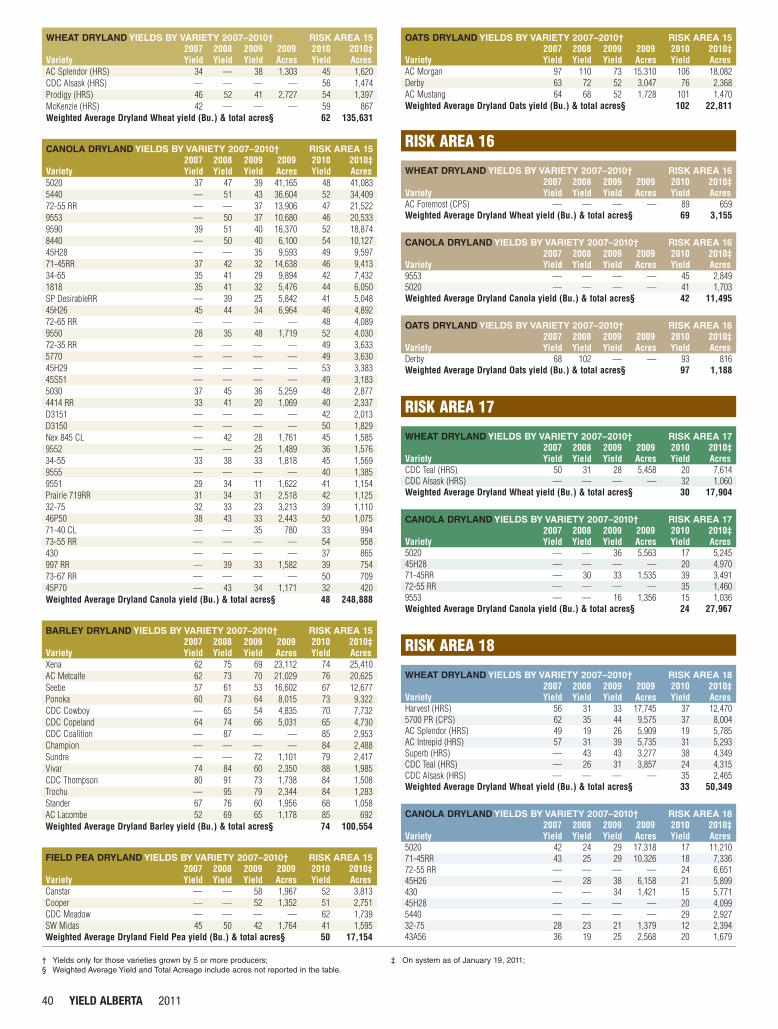
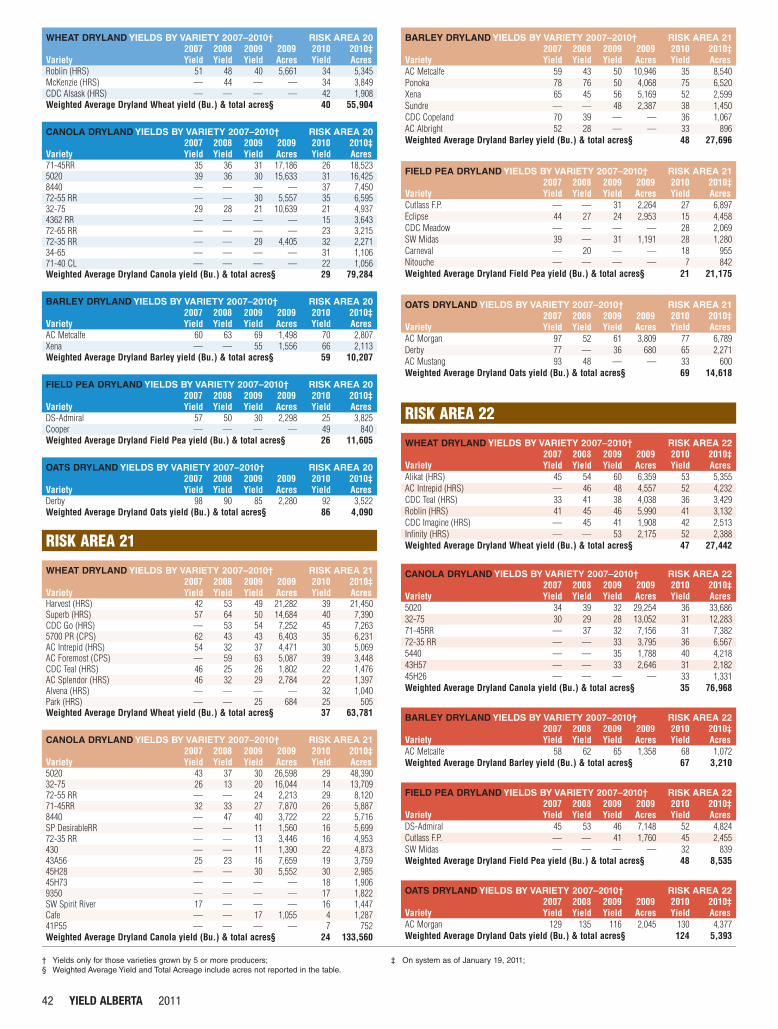