yield-increasing additives in kraft pulping: effect on carbohydrate … · 2017-01-22 ·...
TRANSCRIPT

Yield-increasing additives in kraft pulping: Effect on carbohydrate retention, composition and handsheet properties
Thesis for the degree doktor ingeniør
Trondheim, May 2008
Norwegian University of Science and TechnologyFaculty of Natural Sciences and TechnologyDepartment of Chemical Engineering
David André Grimsøen Vaaler
I n n o v a t i o n a n d C r e a t i v i t y
NTNUNorwegian University of Science and Technology
Thesis for the degree doktor ingeniør
Faculty of Natural Sciences and TechnologyDepartment of Chemical Engineering
© David André Grimsøen Vaaler
ISBN 978-82-471-8799-9 (printed version)ISBN 978-82-471-8804-0 (electronic version)ISSN 1503-8181
Doctoral theses at NTNU, 2008:137
Printed by NTNU-trykk

1
ABSTRACT
In this thesis, increased hemicellulose retention during kraft pulping has been studied. The work has been divided into three parts:
i) Development of an accessible and reliable method for determination of carbohydrate composition of kraft pulpsii) Investigation of the composition and molecular mass distributions of the carbohydrates in kraft pulps with increased hemicellulose contentiii) Investigation of the effect of increased hemicellulose content on the sheet properties of kraft pulps with increased hemicellulose content
A method for carbohydrate determination was developed. In this method, enzymes are used to hydrolyse the pulp into monosaccharides. A relatively mild acid hydrolysis is performed prior to detection on an HPLC with an RI-detector. The pulp is not derivatized and no pre-treatment (mechanical or chemical) is needed to determine the carbohydrate composition using the method developed here. Peak deconvolution software is used to improve the accuracy.
Polysulphide and H2S primarily increase the glucomannan yield, which can be boosted by up to 7 % on o.d. wood. However, the cellulose yield is more affected by the cooking time and the maximum yield increase of cellulose is approximately 2 % on o.d. wood compared to an ordinary kraft pulp. The cooking time is influenced by sulphide ion concentration, AQ addition and the final Kappa number. The xylan yield is remarkably stable, however the alkali profile during the cook may influence the xylan yield. Surface xylan content of the fibres depends on residual alkali concentration in the black liquor. The molecular mass distributions of cellulose and hemicellulose were determined for pulps with increased hemicellulose content using size exclusion chromatography. Deconvolution by peak separation software is used to gain information about the degree of polymerization for cellulose and hemicellulose. The average DP of glucomannan in the kraft fibre was found to be 350 ± 30 and the average DP of xylan in the kraft fibre was found to be 240 ± 20. There are indications that the glucomannan needs a minimum chain length higher than 100 to be retained, as opposed to xylan. There may be error factors in using the traditional intrinsic viscosity (limiting viscosity number) for the determination of the degree of polymerization for cellulose. However, using intrinsic viscosity and the fraction of hemicellulose and cellulose, a much more accurate estimate of the degree of polymerization of cellulose is found, correlating well with the molecular mass of cellulose found by SEC. Brownstock pulping yield can be estimated using three pulp properties; Kappa number, glucomannan and xylan content of pulp in addition to a contribution for the use of AQ. The main error in the yield determination originates from uncertainties in cellulose yield determination. The model seems to be robust and can be used on several softwood species.
Abstract2
The influence of hemicellulose content on handsheet properties is studied. Sheet density is used to evaluate the fibre flexibility. The fibre flexibility is closely related to the average fibre wall thickness, hemicellulose content and drying. The drying of pulps and more thick-walled fibres reduces the fibre flexibility while increased hemicellulose content is favourable for high fibre flexibility. Load-elongation properties like tensile index, tensile stiffness index and elongation at rupture have been evaluated. Pulps with a high hemicellulose content are more easily beaten and this results in higher tensile index for pulps with increased hemicellulose content. The reason is that increased swelling of fibres with higher hemicellulose content increases the straightness of fibres resulting in more easily activated fibre segments in the sheet network. However, the extensibility for sheets made of pulps with increased hemicellulose content is reduced. This indicates that the fibres with increased hemicellulose content have more rigid fibre walls that resist axial compressions better than fibres with lower hemicellulose content. The result is that pulps with high hemicellulose content form less microcompressions and less curled fibre segments compared to a reference kraft pulp. Tear index for sheet made from pulps using polysulphide and anthraquinone in the cook is reduced. However, using H2S pre-treament as yield-increasing additive, the tear index is unchanged compared to the reference kraft pulp.

3
PREFACE
The pulping yield influences the wood consumption to a great extent. Yield increase of 1 % on o.d. wood reduces the wood consumption by approximately 0.11 m3/ADT. This obviously decreases the variable costs due to lower wood consumption, but in many cases the pulp production can also be enhanced resulting in lower fixed costs. This is the case when the capacity of the recovery boiler limits the production or when the digester is the bottleneck. However, if dewatering equipment such as washing stages, paper or the dryer machines are the bottlenecks, the possibility for increased production is limited or even a decrease can occur.
However, the increase in pulping yield also influences the mechanical properties of paper products. The effect on pulping yield on the fibre and paper properties will be discussed in Chapter 7.
Commercial kraft pulp products are usually divided into softwood (NBSK, Northern Bleached Softwood Kraft) and hardwood (BHKP, Bleached Hardwood Kraft Pulp) kraft pulps. There is a price difference between the two main segments and the pricing of NBSK and BHKP are mainly dependent on the supply and demand of the market and less due to differences in fibre properties. This price system does not promote development of pulp products unless a pulp mill has access to remarkable raw materials resulting in end products with exceptional properties. Thus, the differences in paper qualities often are a result of paper machine design and furnish selection1.
The main problem for kraft pulps is the inhomogeneity of the fibre dimensions for the wood material. Different tree species have huge variations in wood and fibre properties [1]. Also, within most species we find large differences between and within territories and within each tree log. Different tree species and tree trunks with different growth conditions are often mixed to obtain a pulp with constant average fibre dimensions. However, these types of pulps result in wide distributions of fibre dimensions and less specialized paper properties. Niche products can be made by sorting the logs into grades with more narrow fibre dimensions distributions and emphasized fibre properties.
The chemistry of kraft cooking dissolves the main part of the hemicelluloses compared to the native wood. Thus, standard kraft pulping yields pulps with low levels of hemicellulose and quite similar chemical composition without regard to raw material or pulping process. Only small differences are seen for different pulping methods. However, yield-increasing methods change the carbohydrate composition resulting a new degree of freedom for specialization of kraft pulps. Supplementary interpretation of the used test methods are also essential.
1. Main furnish components: recycling paper grades, mechanical pulp, NBSK, BHKP, pigmets and fillers

Preface4
Better knowledge of these problems (fibre dimensions distribution, chemical composition modification and test methods) is highly desirable for further development of kraft pulp grades. A successful implementation of these important development issues may result in increased profit since pulps and paper with extraordinary fibre- and paper properties are demanded by the market. These niche products achieve better prices and steady shipments are usually obtained. In this thesis there ia an evaluation of the fibre properties of kraft pulp with different hemicellulose content using existing test methods.
This thesis is based on the idea that hemicellulose retention has an important influence on the pulping economy and pulp and fibre properties. The economy of pulping can be improved by increasing the pulping yield resulting in higher content of hemicellulose in fibres and lower wood demand. In addition, the pulp and fibre properties are affected by the chemical composition of the fibres.
Increasing the pulp yield is one way to reduce the costs. However, the pulp and paper industry has questioned the impact on the quality of the paper grade. It is necessary to document that paper made from high yield pulp is usable for paper products and for some paper products even better than standard kraft pulp. The objectives of the study is to gain better knowledge of: a) carbohydrate characterization and, b) handsheet properties of bleachable high yield pulp.
This thesis is submitted in partial fulfilment of the doktor ingeniør degree at the Norwegian University of Science and Technology. The work has been carried out at the Department of Chemical Engineering at the Norwegian University of Science and Technology from 2000 to 2004. From 2004 to 2008 the remaining work has been done part time at Södra Cell Tofte AS with Associate Professor Størker T. Moe and dr.ing.. Sverre Storebråten as supervisor and subsupervisor, respectively.
The work in the study was a part of the PFI-project “Chemical pulp - processes and properties”. The doctoral study was funded by Södra Cell, Peterson, the Norwegian University of Science and Technology and the Research Council of Norway.

5
ACKNOWLEDGEMENTS
This thesis is dedicated to my father Kristian Vaaler and my mother Marie Grimsøen Vaaler for being so supporting during my period of study. My father looked forward to see the fulfilment of this thesis but he died before the work was ready.
Associate professor Størker T. Moe and dr.ing. Sverre Storebråten have been responsible for the project. Their support during the whole period is greatly appreciated. Special thanks to dr.ing Sverre Storebråten for his unique ability to inspire and support me during the last few years. And thank you, Størker for letting me beat you in “Birken” every year.
Øyvind Eriksen and Sigrid Ljones, who completed their master’s thesis in topics given by the author are acknowledged for producing valuable results.
I would like to thank all my colleagues, graduate students and the staff at the pulp and paper group at the Norwegian University of Science and Technology for their good friendship and cooperation during these years. The good friendship and advice from Rune Holmstad and Marianne Haugan is sincerely appreciated.
I wish to thank Stewart Clark of Norwegian University of Science and Technology for editing the main part of this thesis.
Sissel Ravnsborg is recognized for organizing the PFI-project “Chemical pulp - processes and properties”.
I would also like to thank all the colleagues at PFI and especially Kristin Syverud and Kai Toven.
Björn Dillner and Espen Ribe at Södra Cell FoU and Berit Seem at Peterson are also thanked for their contribution.
Södra Cell, Peterson, the Research Concil of Norway and the Norwegian University of Science and Technology are acknowledged for their financial support that made this work possible. Södra Cell Tofte AS is greatly appreciated for the support during the last few years.
Last, but by no means least, I am indebted to my girlfriend Elin for her warm support and patience during the last few years.

Acknowledgements6

7
LIST OF PUBLICATIONS
During 2000 to 2005 some work has been published. The publications are attached at the end of the thesis. However, the thesis is written as a monograph to reflect the importance of hemicellulose on chemistry and handsheet properties. Thus, the content of the publications may diverge from the monograph.
Carbohydrate chemistry and yield determination:
I. Vaaler, D., Syverud, K., Seem, B. and Moe, S.T., “Estimating the pulping yield by carbohydrate analysis”, Tappi Journal 4(4):23-27 (2005)
II. Syverud, K., Leirset, I. and Vaaler, D., ”Characterization of carbohydrates in chemical pulps by pyrolysis-gas chromatography/mass spectometry”, Journal of Analytical and Applied Pyrolysis 67(2):381-391 (2003)
III. Vaaler, D., Syverud, K. and Moe, S.T., “Characterisation of pulp carbohydrates by enzymatic hydrolysis and determination of pulping yield with carbohydrate profiles”, The 3rd biennial Johan Gullichsen colloquium, p 87 - 93 (2001)
IV. Vaaler, D., Eriksen, Ø., Ribe, E. and Moe, S., “The relation between carbohydrate composition and softwood kraft pulp yield”, 7th European Workshop on Lignocellulosics and Pulp, p 265-268 (2002)
V. Vaaler, D., Berthold, F. and Moe, S.T., “Details on carbohydrate retention in kraft cooking by the use of additives”, 12th International Symposium on Wood and Pulping Chemistry, Madison, USA, Vol. I, p 109 - 112 (2003)
Fibre and handsheet properties:
VI. Vaaler, D., Ljones, S., Ribe, E., Toven, K. and Moe, S., “Effects of hemicellulose stabilisation and raw material on the beatability of softwood kraft pulps”, 7th European Workshop on Lignocellulosics and Pulp, p 147-150 (2002)
VII. Vaaler, D., Eriksen, Ø. and Moe, S.T., “The difference in pulp properties for once-dried kraft pulp with varying pulping yield”, 12th International Symposium on Wood and Pulping Chemistry, Madison, USA, Vol. II, p 67 - 70 (2003)
VIII. Vaaler, D., Eriksen, Ø. and Moe, S.T., “The difference in pulp properties for never-dried and once-dried kraft pulps with varying pulping yield”, 28th EUCEPA Conference, Lisbon, Portugal, p 353 - 355 (2003)

List of publications8
Other relevant publications:
Vaaler, D.A. and Moe, S. T., “Carbohydrate profiles of kraft pulps manufactured with white liquor additives”, 11th International Symposium on Wood and Pulping Chemistry Vol. 2, p 279 - 282 (2001)
Toven, K. and Vaaler, D., “On the beatability of Norway spruce and Scots pine kraft pulps”, 12th International Symposium on Wood and Pulping Chemistry, Madison, USA, Vol. I, p 73 - 76 (2003)
Dyer, T., Feng, Z., Ragauskas, A.J., Vaaler, D. and Moe, S.T., “Enhancing the Chemical Basis for Improved Kraft Pulping with PS, AQ, and PS/AQ”, 12th International Symposium on Wood and Pulping Chemistry, Madison, USA, Vol. I, p 49 - 52 (2003)

9
TABLE OF CONTENTS
ABSTRACT . . . . . . . . . . . . . . . . . . . . . . . . . . . . . . . . . . . . . . . . . . . . . . . . . . . . . . . .1
PREFACE . . . . . . . . . . . . . . . . . . . . . . . . . . . . . . . . . . . . . . . . . . . . . . . . . . . . . . . . .3
ACKNOWLEDGEMENTS . . . . . . . . . . . . . . . . . . . . . . . . . . . . . . . . . . . . . . . . . . . . .5
LIST OF PUBLICATIONS . . . . . . . . . . . . . . . . . . . . . . . . . . . . . . . . . . . . . . . . . . . . .7
CHAPTER 1INTRODUCTION . . . . . . . . . . . . . . . . . . . . . . . . . . . . . . . . . . . . . . . . . . . . . . . . . . . .13
1.1 Background . . . . . . . . . . . . . . . . . . . . . . . . . . . . . . . . . . . . . . . . . . . . . . . .131.2 Objectives of the study . . . . . . . . . . . . . . . . . . . . . . . . . . . . . . . . . . . . . . .141.3 Outline of the thesis . . . . . . . . . . . . . . . . . . . . . . . . . . . . . . . . . . . . . . . . . .14
CHAPTER 2FUNDAMENTAL OVERVIEW . . . . . . . . . . . . . . . . . . . . . . . . . . . . . . . . . . . . . . . . . .17
2.1 Fibre structure and fibre wall construction . . . . . . . . . . . . . . . . . . . . . . . .172.1.1 Fibre anatomy . . . . . . . . . . . . . . . . . . . . . . . . . . . . . . . . . . . . . . .182.1.2 Cellulose . . . . . . . . . . . . . . . . . . . . . . . . . . . . . . . . . . . . . . . . . . .192.1.3 Hemicellulose . . . . . . . . . . . . . . . . . . . . . . . . . . . . . . . . . . . . . . .202.1.4 Lignin . . . . . . . . . . . . . . . . . . . . . . . . . . . . . . . . . . . . . . . . . . . . .222.1.5 Lignin carbohydrate complexes . . . . . . . . . . . . . . . . . . . . . . . . .22
2.2 Changes in fibre structure during pulping . . . . . . . . . . . . . . . . . . . . . . . . .222.2.1 Kraft pulping - cooking . . . . . . . . . . . . . . . . . . . . . . . . . . . . . . . .222.2.2 Fibre wall changes using yield-increasing additives . . . . . . . . . .252.2.3 Bleaching . . . . . . . . . . . . . . . . . . . . . . . . . . . . . . . . . . . . . . . . . .25
2.3 Yield-increasing additives . . . . . . . . . . . . . . . . . . . . . . . . . . . . . . . . . . . . .252.3.1 Anthraquinone, AQ . . . . . . . . . . . . . . . . . . . . . . . . . . . . . . . . . . .262.3.2 Polysulphide, PS . . . . . . . . . . . . . . . . . . . . . . . . . . . . . . . . . . . . .272.3.3 Hydrogen sulphide gas pre-treatment . . . . . . . . . . . . . . . . . . . . .28
2.4 Comments . . . . . . . . . . . . . . . . . . . . . . . . . . . . . . . . . . . . . . . . . . . . . . . . .28
CHAPTER 3MATERIALS AND METHODS . . . . . . . . . . . . . . . . . . . . . . . . . . . . . . . . . . . . . . . . . .29
3.1 Carbohydrate characterization . . . . . . . . . . . . . . . . . . . . . . . . . . . . . . . . . .293.2 Pulps . . . . . . . . . . . . . . . . . . . . . . . . . . . . . . . . . . . . . . . . . . . . . . . . . . . . .29
3.2.1 Raw materials . . . . . . . . . . . . . . . . . . . . . . . . . . . . . . . . . . . . . . .303.2.2 Cooking, washing and screening . . . . . . . . . . . . . . . . . . . . . . . .313.2.3 Bleaching and drying . . . . . . . . . . . . . . . . . . . . . . . . . . . . . . . . .32

10
3.3 Wood and fibre characterization . . . . . . . . . . . . . . . . . . . . . . . . . . . . . . . .333.4 Handsheet properties . . . . . . . . . . . . . . . . . . . . . . . . . . . . . . . . . . . . . . . . .33
CHAPTER 4MEASUREMENT OF CARBOHYDRATE COMPOSITION . . . . . . . . . . . . . . . . . . . . . .35
4.1 Introduction . . . . . . . . . . . . . . . . . . . . . . . . . . . . . . . . . . . . . . . . . . . . . . . .354.2 Experimental . . . . . . . . . . . . . . . . . . . . . . . . . . . . . . . . . . . . . . . . . . . . . . .36
4.2.1 Enzymatic and acidic hydrolysis . . . . . . . . . . . . . . . . . . . . . . . . .364.2.2 HPLC analysis . . . . . . . . . . . . . . . . . . . . . . . . . . . . . . . . . . . . . . .374.2.3 Calculations . . . . . . . . . . . . . . . . . . . . . . . . . . . . . . . . . . . . . . . . .374.2.4 Surface carbohydrate composition . . . . . . . . . . . . . . . . . . . . . . .38
4.3 Results and discussion . . . . . . . . . . . . . . . . . . . . . . . . . . . . . . . . . . . . . . . .384.3.1 Enzymatic and acidic hydrolysis . . . . . . . . . . . . . . . . . . . . . . . . .394.3.2 Simplified carbohydrate analysis procedure . . . . . . . . . . . . . . . .404.3.3 Hydrolysis yield . . . . . . . . . . . . . . . . . . . . . . . . . . . . . . . . . . . . .424.3.4 Repeatability and comparison to the traditional procedure . . . .434.3.5 Hexenuronic acids . . . . . . . . . . . . . . . . . . . . . . . . . . . . . . . . . . . .454.3.6 Surface carbohydrate composition . . . . . . . . . . . . . . . . . . . . . . .45
4.4 Conclusions . . . . . . . . . . . . . . . . . . . . . . . . . . . . . . . . . . . . . . . . . . . . . . . .46
CHAPTER 5CARBOHYDRATE RETENTION AND MOLECULAR MASS DISTRIBUTION . . . . . . . .47
5.1 Introduction . . . . . . . . . . . . . . . . . . . . . . . . . . . . . . . . . . . . . . . . . . . . . . . .475.2 Experimental . . . . . . . . . . . . . . . . . . . . . . . . . . . . . . . . . . . . . . . . . . . . . . .485.3 Carbohydrate retention . . . . . . . . . . . . . . . . . . . . . . . . . . . . . . . . . . . . . . .495.4 Molecular mass distributions . . . . . . . . . . . . . . . . . . . . . . . . . . . . . . . . . . .54
5.4.1 Peak separation (deconvolution) . . . . . . . . . . . . . . . . . . . . . . . . .555.4.2 Molecular mass of hemicellulose(s) . . . . . . . . . . . . . . . . . . . . . .565.4.3 Molecular mass of cellulose . . . . . . . . . . . . . . . . . . . . . . . . . . . .57
5.5 Calculation of DP of cellulose using intrinsic viscosity . . . . . . . . . . . . . .575.6 Concluding remarks . . . . . . . . . . . . . . . . . . . . . . . . . . . . . . . . . . . . . . . . .59
CHAPTER 6INDIRECT YIELD DETERMINATION . . . . . . . . . . . . . . . . . . . . . . . . . . . . . . . . . . . .61
6.1 Introduction . . . . . . . . . . . . . . . . . . . . . . . . . . . . . . . . . . . . . . . . . . . . . . . .616.2 Experimental . . . . . . . . . . . . . . . . . . . . . . . . . . . . . . . . . . . . . . . . . . . . . . .626.3 Pulp yield determination . . . . . . . . . . . . . . . . . . . . . . . . . . . . . . . . . . . . . .63
6.3.1 Pitfalls in direct yield determination . . . . . . . . . . . . . . . . . . . . . .636.3.2 Indirect pulp yield determination . . . . . . . . . . . . . . . . . . . . . . . .636.3.3 Yield estimation for cellulose and hemicelluloses . . . . . . . . . . .646.3.4 Developed yield estimation: Σ∆Yn model . . . . . . . . . . . . . . . . .66
6.4 Concluding remarks . . . . . . . . . . . . . . . . . . . . . . . . . . . . . . . . . . . . . . . . .68

11
CHAPTER 7THE INFLUENCE OF HEMICELLULOSE CONTENT ON HANDSHEET PROPERTIES .71
7.1 Introduction . . . . . . . . . . . . . . . . . . . . . . . . . . . . . . . . . . . . . . . . . . . . . . . .717.1.1 Fibre flexibility . . . . . . . . . . . . . . . . . . . . . . . . . . . . . . . . . . . . . .717.1.2 Load-elongation properties . . . . . . . . . . . . . . . . . . . . . . . . . . . . .767.1.3 Other strength properties . . . . . . . . . . . . . . . . . . . . . . . . . . . . . . .78
7.2 Experimental . . . . . . . . . . . . . . . . . . . . . . . . . . . . . . . . . . . . . . . . . . . . . . .787.3 Wood properties and fibre wall thickness for the pulp series . . . . . . . . . .797.4 Fibre flexibility . . . . . . . . . . . . . . . . . . . . . . . . . . . . . . . . . . . . . . . . . . . . .83
7.4.1 Beating . . . . . . . . . . . . . . . . . . . . . . . . . . . . . . . . . . . . . . . . . . . .847.4.2 Fibre wall thickness . . . . . . . . . . . . . . . . . . . . . . . . . . . . . . . . . .847.4.3 Hemicellulose content . . . . . . . . . . . . . . . . . . . . . . . . . . . . . . . . .857.4.4 Drying (hornification) . . . . . . . . . . . . . . . . . . . . . . . . . . . . . . . . .87
7.5 Load-elongation properties . . . . . . . . . . . . . . . . . . . . . . . . . . . . . . . . . . . .897.5.1 Effect of fibre wall thickness and hemicellulose content on load-elongation properties . . . . . . . . . . . . . . . . . . . . . . . . . . . . . . . . . . .897.5.2 Increased hemicellulose content of fibres activate fibre segmentsand the fibre wall has increased resistance for axial compressions . . . .92
7.6 Other strength properties . . . . . . . . . . . . . . . . . . . . . . . . . . . . . . . . . . . . . .957.6.1 Tear strength . . . . . . . . . . . . . . . . . . . . . . . . . . . . . . . . . . . . . . . .957.6.2 Fibre strength . . . . . . . . . . . . . . . . . . . . . . . . . . . . . . . . . . . . . . .96
7.7 Concluding remarks . . . . . . . . . . . . . . . . . . . . . . . . . . . . . . . . . . . . . . . . .97
CHAPTER 8CONCLUDING REMARKS . . . . . . . . . . . . . . . . . . . . . . . . . . . . . . . . . . . . . . . . . . . . .99
8.1 Method development . . . . . . . . . . . . . . . . . . . . . . . . . . . . . . . . . . . . . . . . .998.2 Carbohydrate characterization . . . . . . . . . . . . . . . . . . . . . . . . . . . . . . . . . .998.3 Handsheet properties . . . . . . . . . . . . . . . . . . . . . . . . . . . . . . . . . . . . . . . . .1008.4 Practical implications . . . . . . . . . . . . . . . . . . . . . . . . . . . . . . . . . . . . . . . .1008.5 Suggestions for further work . . . . . . . . . . . . . . . . . . . . . . . . . . . . . . . . . . .100
REFERENCES . . . . . . . . . . . . . . . . . . . . . . . . . . . . . . . . . . . . . . . . . . . . . . . . . . . . . .103
APPENDIX A: DETERMINATION OF CARBOHYDRATE COMPOSITION . . . . . . . . .111Processing and integration of chromatograms . . . . . . . . . . . . . . . . . . . . . . . . .111Calibration . . . . . . . . . . . . . . . . . . . . . . . . . . . . . . . . . . . . . . . . . . . . . . . . . . . . .112
APPENDIX B:DELIGNIFICATION RATE AND END-GROUP STABILIZATION . . . . . .115Polysulphide degradation . . . . . . . . . . . . . . . . . . . . . . . . . . . . . . . . . . . . . . . . .115End-group stabilization or increased delignification rate? . . . . . . . . . . . . . . . .116
APPENDIX C: CARBOHYDRATE RETENTION . . . . . . . . . . . . . . . . . . . . . . . . . . . . .123Glucomannan yield . . . . . . . . . . . . . . . . . . . . . . . . . . . . . . . . . . . . . . . . . . . . . .123Xylan yield . . . . . . . . . . . . . . . . . . . . . . . . . . . . . . . . . . . . . . . . . . . . . . . . . . . .124Cellulose yield . . . . . . . . . . . . . . . . . . . . . . . . . . . . . . . . . . . . . . . . . . . . . . . . . .124

12
APPENDIX D: DECONVOLUTION OF MOLECULAR MASS DISTRIBUTION . . . . . . .127Processing and integration of chromatograms . . . . . . . . . . . . . . . . . . . . . . . . .127Raw data . . . . . . . . . . . . . . . . . . . . . . . . . . . . . . . . . . . . . . . . . . . . . . . . . . . . . .128
APPENDIX E: CALCULATION OF PULP YIELD . . . . . . . . . . . . . . . . . . . . . . . . . . . .131Calculation example . . . . . . . . . . . . . . . . . . . . . . . . . . . . . . . . . . . . . . . . . . . . .132Statistical comments. . . . . . . . . . . . . . . . . . . . . . . . . . . . . . . . . . . . . . . . . . . . . .133
APPENDIX F: FIBRE PROPERTIES . . . . . . . . . . . . . . . . . . . . . . . . . . . . . . . . . . . . .135Fibre flexibility . . . . . . . . . . . . . . . . . . . . . . . . . . . . . . . . . . . . . . . . . . . . . . . . .135Fibre wall thickness . . . . . . . . . . . . . . . . . . . . . . . . . . . . . . . . . . . . . . . . . . . . . .135Fibre dimensions . . . . . . . . . . . . . . . . . . . . . . . . . . . . . . . . . . . . . . . . . . . . . . . .136Coarseness and fibre length . . . . . . . . . . . . . . . . . . . . . . . . . . . . . . . . . . . . . . . .137Fibre form . . . . . . . . . . . . . . . . . . . . . . . . . . . . . . . . . . . . . . . . . . . . . . . . . . . . .140
COLLECTION OF PUBLICATIONS . . . . . . . . . . . . . . . . . . . . . . . . . . . . . . . . . . . . . .143
PAPER I . . . . . . . . . . . . . . . . . . . . . . . . . . . . . . . . . . . . . . . . . . . . . . . . . . . . . . . . . .144
PAPER II . . . . . . . . . . . . . . . . . . . . . . . . . . . . . . . . . . . . . . . . . . . . . . . . . . . . . . . . .150
PROCEEDINGS III . . . . . . . . . . . . . . . . . . . . . . . . . . . . . . . . . . . . . . . . . . . . . . . . . .162
PROCEEDINGS IV . . . . . . . . . . . . . . . . . . . . . . . . . . . . . . . . . . . . . . . . . . . . . . . . . .170
PROCEEDINGS V . . . . . . . . . . . . . . . . . . . . . . . . . . . . . . . . . . . . . . . . . . . . . . . . . . .175
PROCEEDINGS VI . . . . . . . . . . . . . . . . . . . . . . . . . . . . . . . . . . . . . . . . . . . . . . . . . .180
PROCEEDINGS VII . . . . . . . . . . . . . . . . . . . . . . . . . . . . . . . . . . . . . . . . . . . . . . . . .185
PROCEEDINGS VIII . . . . . . . . . . . . . . . . . . . . . . . . . . . . . . . . . . . . . . . . . . . . . . . .190

Introduction 13
C H A P T E R
1 INTRODUCTION
1.1 Background A paper furnish can contain one or more of these components: mechanical liberated fibres, chemical liberated fibres, recycled fibres and fillers/pigments and small amounts of helping aids. In 1995, about 555 pulp mills produced approximately 110 million tonnes of chemically liberated fibres [2] making chemical fibres the major fibre resource for the paper industry. The vast majority of fibres for paper industry comes from the kraft process. Some optimization has occurred and the mill equipment used for processing wood chips to bleach pulp has been made larger and better. In the 20th century, the capacity of an average pulp mill has increased dramatically and the kraft process has outdistanced the sulphite process. Today, a greenfield pulp mill fibre line usually manufactures >900 000 ADT/year compared to >250 000 ADT/year for 30 years ago. Although the equipment is larger nowadays, the major chemical principles for chemically liberating fibres from the wooden matrix is almost unchanged for a hundred years. Hydrogen sulphide ions and hydroxide ions are used as the reacting chemicals. During the last 30 years, the focus has been to produce an environmentally friendly pulp. Almost every pulp mill has replaced elementary chlorine with oxygen delignification and some mills have also introduced totally chlorine free (TCF) bleaching. These changes have improved the reputation of the industry but still there are some huge challenges. Thus, two questions are very relevant here [3]:
How to reduce the consumption of wood? Approximately half of the wooden material is dissolved in the cooking liquor during kraft pulping. Reducing the dissolution of carbohydrates increases the total pulp yield resulting in a decrease of wood consumption. The shortage of softwood lumber in the western Europe boosts wood prices. However, increasing pulp yield places higher demands on energy efficiency in the pulp mill due to increasing energy costs.
How to increase the quality of pulp? Pulp quality is ambiguous. An optimal fibre furnish used in linerboard is not necessarily suitable for tissue due to different strength and functionality specifications for the various paper grades. Fibres are heterogeneous with

1.2 Objectives of the study14
differing fibre dimensions. Fibres from different wood species obviously have properties that vary and each tree has an unique distribution of fibre dimensions due to variation in growth factors and genetics. Thus it is important to have a good control of the timber in the woodyard to produce stable and good pulp quality. In addition to fibre dimensions, the chemical composition of the fibres can be varied to improve the pulp quality. However, only a few pulp mills utilize the opportunities to customize pulp qualities using suitable raw material and chemical composition modifications. Another difficultly regarding pulp quality is how to test and evaluate relevant paper properties.
1.2 Objectives of the studyThe main objective of this study has been to characterize carbohydrate composition of bleachable high yield pulps and evaluate the effect the hemicelluloses have on the handsheet properties. The first step to characterize the carbohydrate composition of these pulps was to establish and improve an easy and available method for determination of carbohydrate composition. Pulps from softwood with a large difference in hemicellulose content have been manufactured and characterized for carbohydrate composition and molecular mass distributions. This is obtained by increasing the pulping yield using yield-increasing methods such as polysulphide, anthraquinone and hydrogen sulphide gas pre-treatment. Better understanding of carbohydrate retention using yield-increasing methods is investigated in the study. Some pulps were also bleached and tested for handsheet properties.
The understanding of carbohydrate retention resulted in interesting results. A method for the determination of pulping yield is developed using the carbohydrate composition of the fibres. The possibility to apply this method in a continuous digester is one useful area of application.
The influence of hemicellulose content on the pulp properties was investigated in detail to gain a deeper understanding of how the changes in chemical composition affect the mechanical properties of handsheets. Thus, the importance of fibre dimensions, like fibre wall thickness and fibre width, are not the main issue in this study. However, several pulp series were made of different wood materials. This is done to ensure that the trends that are found are significant and that the trends are valid for a wide range wood material found in Scandinavia.
1.3 Outline of the thesisThis thesis comprises results from two journal papers and six conference proceedings in addition to unpublished results. The journal papers are referred to as Papers I and II and the conference proceedings are called Proceedings III - VIII. Some findings in the publications and the outcome of this thesis may diverge since the results in this thesis are presented as a totality and seen in a larger context. The publications are attached as appendices.
This thesis is based the influence of hemicelluloses on carbohydrate determination, retention, characterization and yield determination in addition to handsheet properties.

Introduction 15
Chapter 2 is a review that is fundamental and valid for all chapters:
• Fibre structure and fibre wall construction• Changes in fibre structure during pulping• Yield-increasing additives
However, a more specific review is given in the respective Chapters 4 to 7.
Chapter 3 describes experimental methods applied in the thesis. However, a more detailed description of the material and methods may be found in their respective chapters.
Chapters 4 to 7 are structured after a norm used in most scientific papers (IMRAD1) with a specific background, experimental and results and discussion section. This is done to make the thesis easier to read.
Chapter 4 “Measurement of carbohydrate composition“ is about the developed carbohydrate composition method and the method involves enzymatic hydrolysis with a mild acidic hydrolysis before detection on an HPLC system with an RI-detector. The methods are also described in Papers I and II in addition to Proceedings III.
Chapter 5 “Carbohydrate retention and molecular mass distribution“ considerscarbohydrate retention of unbleached high yield pulps at bleachable grades and fully bleached pulps. Further, the molecular mass distributions of glucomannan, xylan and cellulose are determined. The findings are based on Proceedings IV and V.
In Chapter 6 “Indirect yield determination“, a method for estimation of pulping yields using carbohydrate composition and pulp properties. In addition, an unpublished model is delineated in this chapter. Paper I and Proceedings III and IV describe some of the results.
Chapter 7 establishes connection between hemicellulose content in the pulp and important fibre and handsheet parameters. The importance of raw material, fibre flexibility, load-elongation properties and other strength properties are discussed. Some of the results are presented in Proceedings VI - VIII and some of the findings are novel .
Chapter 8 presents the overall conclusions of the main findings in the work. Practical implication and suggestions for further work are recommended.
1. Introduction, Material/Methods, Results And Discussion

1.3 Outline of the thesis16

Fundamental overview 17
C H A P T E R
2 FUNDAMENTAL OVERVIEW
Upgrading fibre properties from a standard kraft fibre to a tailored fibre is a complex task. Knowledge of carbohydrate retention, fibre composition, structure and the influence of pulping processes are essential to implement the proper action to produce the best tailor-made pulp. To achieve this goal, expertise on both fundamental and more complex fibre properties is necessary.
This chapter is divided into three sections. In the first section the fibre structure, carbohydrate retention and fibre wall construction is described while Section 2.2 deals with changes in the fibre structure during pulping. Since a standard bleaching sequence is used in this work, the impact of bleaching chemistry is not evaluated. The last section describes the fundamental chemistry of the three yield-increasing additives: anthraquinone, polysulphide and hydrogen sulphide gas pre-treatment.
The sections are not résumés of all the work done in this research area but a brief overview of fundamental aspects. A more specific overview is found in each chapter, respectively.
2.1 Fibre structure and fibre wall constructionAfter pulping, either mechanical1 or chemical, fibres from Norway Spruce wood have favourable papermaking properties. The fibres are relatively thin-walled, long, strong and easily beaten to a certain strength.
The fibre structure is complicated and the arrangement of the lignin and the hemicellulose in relation to cellulose are not fully understood. The purpose of Section2.1 is to give a short summary of relevant information of the wooden material used in this thesis.
1. Not further discussed in the thesis.

2.1 Fibre structure and fibre wall construction18
2.1.1 Fibre anatomyOver 95 % of the volume in Norway Spruce wood is tracheids [4]. A softwood tracheid, from now on called fibre, is formed as a small tube. Typical dimensions for a Scandinavian fibre are that they are 0.5-6 mm long, have a width of 20-40 µm and the fibre wall thickness is normally 1.0-5 µm. This results in a large cavity (lumen, L) compared to the fibre wall thickness. The fibre wall is composed of several layers with different chemical composition, thickness and functions in the wood fibre (Figure 2.1). The amorphous middle lamella (ML) lies between the fibres in a connecting layer and holds the fibres together in a network. This layer is rich in lignin and to some extent pectins and the thickness of the layer is approximately 0.2-1.0 µm [5]. The primary (P) layer is oriented inside the ML and is composed of lignin, cellulose and hemicelluloses. The orientation of microfibrils in the primary layer is multidirectional and forms a irregular network. Three secondary layers are localized further inside the fibre wall. They are numbered S1, S2 and S3 where the S2-layer is the most important since the S2consists of 40-90 % of the fibre wall material [5]. S1 and S3 layers have a high fibril angle, while the dominant S2 layer has a lower fibril angle and it is suggested that the S2layer has the greatest impact on the chemical and physical properties of the fibres.
Wood fibre is a heterogeneous material. Within the tree, juvenile wood (first 20 years of the tree) has usually reduced fibre wall thickness and shorter fibres compared to mature wood. At a certain age, the water transportation in the core of the trunk is reduced and heartwood is formed. The water transportation is mainly concentrated in the outer part of the trunk and used to produce new cells (sapwood). In addition to some differences in fibre dimensions for juvenile and mature wood, the major difference between the two
Figure 2.1 Part i): Schematic representation of a wood fibre [4]. Part ii) and iii) indicate a more detailed composition of the interaction between cellulose, hemicelluloses and lignin. Figure ii) based on Kerr and Goring [6] and iii) Salmén and Olsson [7].

Fundamental overview 19
wood tissues are that the sapwood have approximately twice the moisture content compared to heartwood [8].
Trees do also form earlywood fibres in the springtime when the transport of nutrition to the tree is large. Thus, earlywood has large lumens and a relatively low fibre wall thickness. In the summertime, the trees need fibres with higher mechanical strength and they form latewood fibres with higher fibre wall thickness and longer fibre length. Between trees, the soil profile, altitude above sea level, regional climate, etc. influences the fibre ratio of summerwood and latewood in addition to fibre dimensions. Furthermore, stress resulting in compression wood and knot wood affects the wood structure.
Fibres in wood are built up of a matrix composed of hemicellulose and lignin, with cellulose as reinforcement. The amount of cellulose, glucomannan, xylan, lignin, other polysaccharides and extractives are 42 %, 16 %, 9 %, 27 %, 3 % and 2 % [5] on o.d. Norway Spruce wood, respectively, and the fraction of cellulose and hemicellulose increases with depth into the inner fibre layers, while the fraction of lignin decreases.
2.1.2 CelluloseCellulose (Figure 2.2) is a polydisperse linear homopolysaccharide consisting of D-glucose monosaccharides bound together by ß-(1, 4) glucosidic linkages. The regular structure, the high degree of polymerization (>10000) of the cellulose molecule and the large amount of OH-groups makes it easy for the molecules to form hydrogen bonds and thus form a crystalline structure. There are two types of hydrogen bonds, intramolecular and intermolecular. The interamolecular hydrogen bonds contribute to the stiffness and crystallinity of the cellulose chains while interchain cohesion is caused by intermolecular hydrogen bonds. A cluster of 25-100 cellulose molecules with a diameter of approximately 3.5 nm called elementary cellulose fibril [9]. However, the arrangement of elementary fibrils into larger fibrils is extensively debated. Three suggestions are shown in Figure 2.2. Fengel [10] suggested that a microfibril consists of several elementary cellulose fibrils surrounded with hemicellulose. Smaller versions of microfibrils with only one elementary cellulose fibril surrounded with hemicellulose and lignin can also be formed. Both these fibrils are highly crystalline. However, there are significant amounts of non-crystalline cellulose in the fibre wall. Depending on the type of fibre and the method to determine the crystallinity, the amount of non-crytalline cellulose is approximately 15 to 50 %. One example of model that allows amorphous cellulose is the fringe-micellar model [11]. Aggregates of both non-crystalline and crystalline cellulose is fibrils and have a size of approximately 10-30 nm [12,13] while smaller fibrils are approximately 4-5 nm [12]. Note that Figure 2.2 and Figure 2.1 are only theoretical models. The linkage between cellulose and the hemicellulose-lignin matrix is not confirmed. Thus, several models are proposed.

2.1 Fibre structure and fibre wall construction20
2.1.3 HemicelluloseHemicelluloses are polysaccharides consisting of hexoses (D-glucose, D-mannose and D-galactose), pentoses (D-xylose, L-arabinose and D-arabinose), uronic acids (4-O-methyl-D-glucoronic acid, D-galacturonic acid and D-glucoronic acid) and acetyl groups. In softwood the major hemicelluloses are acetyl-galactoglucomannan and arabino-4-O-methylglucoronoxylan. In this thesis these hemicelluloses are called glucomannan and xylan, respectively. A schematic outline of the two main hemicelluloses in softwood is shown in Figure 2.3. Xylan and glucomannan differ from the cellulose since they are amorphous and have much lower degree of polymerization (<200) compared to cellulose [5]. In Norway Spruce the amount of glucomannan and xylan are approximately 16 % and 9 % on o.d. wood, respectively.
Figure 2.2 Models of cellulose structure and cellulose fibrils. The figure is based on several works [5,10,11]
OO
HOH2C
HOOH
OOHOH2C
HOOH
O
OOO
HOH2C
HOOH HOH2C
HOOH
Elementary cellulose fibril
Molecule 0.57 nm
Microfibril
?Lignin
Hemi-cellulose
Cellulose
i) Large, cross section ii) Small,
cross sectioniii) Large and partly amorphous, transverse section
30 nm
30 nm5 nm amorphous
cellulose
crystalline cellulose

Fundamental overview 21
.
Hemicellulose may play an important role for the formation of cellulose fibrils. Several authors have studied the growth of bacterial cellulose in presence of hemicellulose. Atalla et al. [14] and Tokoh et al. [15] found that hemicellulose and especially glucomannan surround cellulose fibrils in a more complex manner than envisaged in classic models. Figure 2.4 shows that glucomannan influences the ability of cellulose microfibril aggregation. These model trials indicate that the ultrastructure in fibres ishighly dependent on the accessibility of hemicellulose and thus the content of hemicelluloses.
It is also assumed that a matrix of hemicellulose and lignin surrounds the cellulose fibrils [6,10] (Figure ii) 2.1). Salmén and Olsson [7] suggested a new fibre wall model where xylan is associated with the lignin and that glucomannan is associated with the cellulose fibrils (Figure iii) 2.1). This supports the findings of Atalla et al. [14] and Tokoh et al.[15].
Figure 2.3 Scheme of the structure of hemicelluloses in softwood, a) glucomannan (GlcMan) and b) xylan (Xyl).
Figure 2.4 Scheme of microfibril aggregation in presence of mannan. Experiment using bacterial cellulose growth with no mannan addition as a reference (left) and addition of mannan (right). The presence of mannan inhibits the aggregation of microfibrils [15].
4-O -M e-α -D -G lcpA
(→ 4) β -D -X ylp (1→ 4) β -D -X ylp2↑1
β -D -Xylp(1→ 4) (1→ 4) β -D -Xylp (1→ )
α -L-A ra f
3↑1
β -D -Xylp(1→ 4) 2 5
b)
(1→ ) β -D -M anp(1→ 4) (1→ 4) β -D -M anpβ -D -M anp(1→ 4) β -D -G lcp(→ 4) 2 ,3↑
Ac.
6↑1
α -D -G alp
a)
4 -O -M e -α -D -G l c pA :
β -D -X y lpα -L -A ra f
(1→ 4 )
β -D -M a n p
β -D -G lc p
A c .
α -D -G a lp
: D -g lu c o s e
: D -m a n n o s e
: D -x y lo s e
: D -g a la c to s e
: D -a ra b in o s e
4 -O -m e th y l-D -g lu c o ro n ic a c id
: a c e ty l
: b o n d b e tw e e n C 1 a n d C 4

2.2 Changes in fibre structure during pulping22
2.1.4 LigninSoftwood lignin is a crosslinked polymer formed by radical polymerization of coniferyl alcohol. The structure is three-dimensional, amorphous, heterogeneous, hydrophobic and the monomeric coniferyl alcohol is linked together with a number of different C-C and C-O bonds. The relative amount of lignin decreases from the middle lamella to the lumen but the main part of the lignin is located in the S2-layer due to its dominating part in the fibre wall. Lignin in the middle lamella is more cross-linked and has more etherified and less phenolic lignin compared to lignin found in the secondary wall [16,17].
In contrast to hemicelluloses, lignin does not directly take part in the formation of cellulose composite [18]. However, lignin is suggested to be necessary to form the cellulose-hemicellulose-lignin matrix in fibre wall.
2.1.5 Lignin carbohydrate complexesThere is some evidence that carbohydrates can form covalent bonds with lignin [19]. These complexes are often called lignin carbohydrate complexes (LCC) and they are most likely native [19], but can also be formed during pulping [20]. LCC is assumed to be of importance for delignification and bleaching efficiency since it has been shown that model compounds of LCC are relatively stable under alkaline conditions [21].
Salmén and Olsson [7] (see Figure 2.1) have suggested that xylan is closely bound to lignin. This indicates that the carbohydrate component in LCC is mainly from xylan. Lawoko et al. [22] found that 90 % of the residual lignin after cooking formed equal parts of lignin-xylan or lignin-xylan-glucomannan complexes and only a small amount of lignin-cellulose complex.
2.2 Changes in fibre structure during pulpingThe main objective during chemical pulping is to liberate the single fibres in the wood structure and to create a suitable fibre to make the desired paper quality. Different paper qualities require different fibre properties. Pulping consists of one or several different process steps: cooking, bleaching and drying. Prior to the paper machine, the fibres have to be beaten to obtain the desired strength and mechanical properties. This section gives a review of the most important changes in the fibre structure and changes in chemical composition during these major pulping and papermaking processes.
2.2.1 Kraft pulping - cookingThe middle lamella has to be broken down to liberate the single fibres. Since the ML mainly consists of lignin, the chemicals used in the process have to react with and dissolve lignin. The reactive chemicals in kraft pulping are hydroxide ions and hydrogen sulphide ions at elevated temperature and pressure. Unfortunately, these chemicals are not selective for lignin and a large amount of hemicelluloses are dissolved in the strong alkaline environment. The cooking process can be divided into three phases classified by the rate of lignin dissolution: initial, bulk and residual phase [23]. During the temperature elevation (often called initial phase) the loss of hemicellulose and especially glucomannan is high. Some lignin and xylan is also dissolved in the initial phase. The

Fundamental overview 23
bulk phase starts shortly before the maximum temperature in the cook is reached and the delignfication rate increases rapidly compared to the initial phase. On the other hand, the loss of cellulose and hemicellulose is relatively low in this phase. The residual phase starts when 75-85 % of the lignin is dissolved and this phase is characterized by low delignification rate [24]. Carbohydrate loss is almost equal the dissolution of lignin and the cook should on principle be ended before or early in the residual phase to avoid unnecessary yield and fibre quality loss.
Peeling and dissolution of low molecular mass carbohydrates in alkali are the main reasons for yield loss in kraft cooking. Peeling removes one monosaccharide from the reducing end of the carbohydrate and 50-100 monomers can be removed before the reducing end is stabilized by the “stopping reaction”
.
The yield loss of carbohydrates and lignin obviously affects the fibre wall structure. The fibre wall will probably have the original fibre wall volume, and the average pore size in the fibre wall increases when the lignin-hemicellulose matrix is removed. However, below 60 % pulping yield the built-in stress caused by material removal is to large and the fibre wall volume may decrease to its stress free state [25,26]. It has been reported that mainly larger pores called macropores are formed during pulping [25,27]. In addition, the fibre saturation point (FSP) or water retention value (WRV) for the pulp
Figure 2.5 Yield of wood component during kraft pulping at low EA charge (15.75 %). The data is taken from Aurell and Hartler [24].
Cooking time, min0 60 120 180 240
Yie
ld, %
0
20
40
60
80
100
LigninXylanGlucomannanCellulose
90
110
130
150
170 °C TEMPERATURE
Glucomannan
Xylan
Lignin
Cellulose
Initial phase Bulk phase Residual phase

2.2 Changes in fibre structure during pulping24
increases with decreasing pulping yield. After long cooking times and a total yield of approximately 48-55 % on o.d. wood, Stone and Scallan [28] showed that FSP seems to decrease without a decrease in average pore size estimated using solute exclusion technique. However, the amount of large pores and small pores may decrease [25]. Andreasson et al. [29] measured with NMR-technique that the pore size may decrease below 48 % pulping yield.
Another important phenomenon is the fibril aggregation of cellulose during pulping. Hult et al. [30] estimated the fibril size of acid hydrolysed pulp samples using CP/MAS 13C NMR. They found that the aggregation of cellulose fibrils increased significant in the transitional stage between initial and bulk phase while the size of elementary cellulose fibrils increased in the residual phase in the cook. Duchesne and Daniel [13] measured the surface fibril aggregation size in the initial, bulk and residual phase of the cook using field emission (FE)-SEM. This study found that the size of aggregated fibrils increased from the initial to the bulk phase. Micrographs of the surface of the initial, bulk and residual phase is shown in Figure 2.6. Fahlén and Salmén [31] used atomic force microscopy (AFM) to measure fibril size during cooking. The fibril size of the aggregated fibrils in pulp increased with 20-30 % compared to wood samples. These three techniques are not ideal for ultrastructure studies. FE-SEM and AFM may be inadequate to study the fibril size due to the limitation caused by resolution, 1.0 nm and 0.1 nm, respectively. Samples for CP/MAS 13C NMR analyses are usually hydrolysed with acid to remove the hemicelluloses and this procedure may change the ultrastructure. Thus, all these techniques have some limitiations.
After cooking, the residual lignin in the fibre is still unevenly distributed [32,33]. The surface has more lignin compared to the rest of the fibre. One reason can be that the middle lamella lignin is more difficult to delignify because it contains less phenolic lignin [17]. One of the most important delignification mechanisms is the cleavage of aryl ether bonds, whose reaction mechanism is highly dependent on phenolic lignin. Another reason for the high content of lignin on the fibre surface after cooking may be that lignin is condensed and precipitated on the surface on the fibre [33].
Figure 2.6 Surface FE-SEM micrographs of Spruce kraft fibres [13]. Left: Initial phase were microfibrils are embedded in lignin-hemicellulose matrix, fibril width: 19.5±3.5 nm. Middle: Bulk phase were the structure are porous, fibril width: 22.0±4.2 nm. Right: Residual phase were porous regions adjacent to compact regions, fibril width: 23.5±5.3 nm.

Fundamental overview 25
2.2.2 Fibre wall changes using yield-increasing additivesThe preservation of hemicellulose results in a change in the fibre ultrastructure. Duchesne et al. [12] (Figure 2.7) have shown that the surface porosity of fibres with high amount of hemicellulose is significant higher compared to fibres with low amount of hemicellulose. This may seem surprising since more of the matrix material is removed for low yield pulps and larger pores are expected to be formed. However, at lower pulping yields the fibre wall will probably collapse resulting in an aggregation of fibrils and larger macro fibrils [30], see Figure 2.7. Fibre wall with high content of glucomannan prevents agregation of cellulose fibrils. As observed by Tokoh et al. [15] in Figure 2.4, the aggregation of cellulose fibrils is blocked by the mannan. For low yield pulps, there are not sufficient amounts of hemicellulose protecting against the aggregation of cellulose fibrils. In addition, the increase in hemicellulose content of the pulps results in an increase of swelling and the porosity of the fibres increases. These two effects (less aggregation and increased swelling for high yield pulps) will significantly increase the porosity of the fibres when the hemicellulose content increases.
2.2.3 BleachingThe purpose of oxygen delignification and bleaching is to remove the residual lignin. Neither WRV nor FSP increases significant during bleaching [34], sometimes even a small decrease is observed. Most ionic groups in the fibre wall originate from lignin and hemicellulose and it is expected that delignification decreases the amounts of ionic groups resulting in a decrase in WRV or FSP. Thus, it is natural to assume that the fibre wall can collapse during bleaching due to an even lower amount of matrix material in bleached pulp compared to unbleached pulp. Bleaching chemicals are strongly oxidizing agents and the oxidation may introduce functional groups in the fibre wall matrix. This can influence the fibre surface and the mechanical properties of the paper.
2.3 Yield-increasing additivesThe hemicellulose matrix can be preserved to some extent by using yield-increasing additives such as anthraquinone (AQ), polysulphide (PS), hydrogen sulphide gas pre-treatment (H2S) and/or sodium borohydride (NaBH4). Using one or more of these yield-increasing agents, the reducing ends in carbohydrates (mostly hemicellulose) are
22 % hemicellulose 10 % hemicelluloseFigure 2.7 FE-SEM micrographs showing the ultrastructure of Norway Spruce kraft fibres with high (left) and low (right) hemicellulose contents [12].

2.3 Yield-increasing additives26
stabilized and thus less peeling occurs. This can been seen in Figure 2.8 where the content of glucomannan increases significant.
2.3.1 Anthraquinone, AQIt has been shown that AQ increases pulp yield and accelerates delignification [35,36,37], see Figure 2.9.
Accelerated delignification at normal cooking conditions (i.e. alkaline and temperature profiles) results in less secondary peeling and a minor yield increase [38]. In addition, both primary and secondary peeling is reduced due to oxidation of carbohydrates as a
Figure 2.8 Yield of glucomannan and cellulose during kraft pulping at low EA charge (15.75 %) and at high yield pulping conditions using 0.5 % NaBH4.The high yield pulp have a yield increase of 3 % on o.d. at the same lignin content. The data are taken from Aurell and Hartler [24]
Figure 2.9 AQ redox reactions with wood components [35,36,37]
Cooking time, min0 60 120 180 240
Yie
ld, %
0
20
40
60
80
100
Glucomannan - KraftGlucomannan - high yieldCellulose - KraftCellulose - high yield
90
110
130
150
170 °C TEMPERATURE
Glucomannan stabilization
Cellulosestabilization

Fundamental overview 27
consequence of AQ reduction. However. Vuorinen [39] claimed that formation of aldonic acid groups is marginal and oxidation reactions of carbohydrates in fibre wall by AQ causes little or no increase in carbohydrate yield.
2.3.2 Polysulphide, PSPolysulphide reacts with carbohydrate end-groups in the impregnation phase and early in the cooking process, see Equation 2.1
Polysulphide is generated according to Equation 2.2.
The addition of sulphur to white or green liquor disturbs the sodium-sulphur balance in a pulp mill resulting in long-term runnability problems due to SO2 emissions. In a pulp mill, sulphide is catalytically oxidized with oxygen and converted to sulphur which immediately reacts with sulphide producing polysulphide1. However, this reaction is not selective and approximately 50 % of the reacted sulphide is oxidized to the inactive thiosulphate or sulphate (Equation 2.3) instead of the desired polysulphide.
The thermal stability of PS is quite poor and it is degraded to sulphide and thiosulphate at elevated temperatures (Equation 2.4).
Polysulphide does not increase the delignification rate [40], however, the sulphide concentration changes due to stabilization reaction (Equation 2.1), PS generation (Equations 2.2 and 2.3) and thermal degradation (Equation 2.4). It is well known that the sulphide concentration affects the delignification rate, especially for sulphidities below 25 %.
( 2.1 )
( 2.2 )
1. MOXY or PAPRILOX
( 2.3 )
( 2.4 )
2 n 1 2 2RCHO Na S 3NaOH RCOONa 2Na S H O++ + → + +
2(s) n 2nS HS OH S S H O− − −+ + → +
2 22 2 3 2
2 22 4 2
2S 2O S O H O
S OH 2O SO H O
− −
− − −
+ → +
+ + → +
2 2n 2 2 3
n n nS S (n 1)OH (1 )H O (1 )HS S O4 2 2
− − − −+ − + − → + +

2.4 Comments28
2.3.3 Hydrogen sulphide gas pre-treatmentHydrogen sulphide gas pre-treatment in presence of sulphide ions reduces the end-groups in carbohydrates. The sulphide ion solution should not contain large amount of alkali since NaOH neutralizes the H2S. The delignification rate is not significantly changed, since the pre-treatment stage occurs before white liquor addition.
The end-group stabilizing of hydrogen gas pre-treatment are done by reductive thilation of end-groups as shown in Equation 2.5 [41]:
2.4 CommentsThe sections in this chapter are not résumés of all the work done in this research area. However, the fibre wall ultrastructure are described and the influence of increased hemicellulose content using yield-increasing additives on fibre wall ultrastructure and carbohydrate retention are pointed out. A more specific overview is found in each chapter, respectively.
( 2.5 )1 2K KK 22 (g) 2 (aq)
2 (aq ) 2
7 131 2
H S H S HS H S 2H
RCHO H S RCH SH
K Henry 's const., K 10 and K =10
− + − +
− −
+ +
+ →
= =

Materials and methods 29
C H A P T E R
3 MATERIALS AND METHODS
This chapter describes the raw material and experimental methods applied in the thesis. However, a more detailed description of the material and methods may be found in their respective chapters.
3.1 Carbohydrate characterizationA method for the determination of carbohydrate composition is implemented in Chapter4 using an existing HPLC system with a RI-detector. The method is described in Section4.2 and verified in Section 4.3. The method is used for carbohydrate composition for all pulps used in this work.
One important application of this method is to study carbohydrate retention of pulp using different yield-increasing additives (Section 5.3). The possibilities to use pulp carbohydrate composition to estimate pulping yield is also examined. These results are described in Section 6.3.
The molecular mass distributions of hemicelluloses using different yield-increasing methods were also evaluated using size exclusion chromatography (SEC). This was done in cooperation with Fredrik Berthold and the SEC analysis was done at STFI. The experimental procedure and results are shown in Section 5.4.
3.2 PulpsTables 3.1 and 3.2 display the pulp series used in this thesis.

3.2 Pulps30
3.2.1 Raw materialsSeveral sources of wood are used in the study. The basic wood density of the chips was determined according to SCAN CM 43:95.
Table 3.1: Unbleached pulp series used in Chapter 5 and 6.
Raw materialNo. of pulps
Additives Laboratory
Norway Spruce 17 Kraft, AQ, PS, PS/AQ and H2S
NTNU
Norway Spruce 14 Kraft, AQ, PS and PS/AQ
External 1
Scots Pine 4 Kraft and AQ External 1Scots Pine 8 Kraft, AQ, PS
and PS/AQNTNU
Mix of Scots Pine and Nor-way Spruce
8 Kraft, PS and PS/AQ. High Kappa.
NTNU
Norway Spruce 6 Kraft, AQ, PS and PS/AQ
NTNU
Table 3.2: Bleached pulp series used in Chapter 6 and 7.
Raw materiala
a. Code in Chapter 7: Raw material + Fibre wall thickness columns
No. of pulps
Fibre wall thicknessa Additives Laboratory
Norway Spruce
8 2.12 Kraft, AQ, PS and PS/AQ
External 1
Scots Pine 10 2.21 Kraft, AQ, PS and PS/AQ
External 1
Norway Spruce
3 2.43b
b. The two series are merged in Chapter 7
Kraft, AQ and PS/AQ
External 1
Norway Spruce
2 2.43b Kraft, AQ and PS/AQ
External 2
Norway Spruce
2 2.05 AQ and PS/AQ External 2
Norway Spruce
6 2.16 Kraft, AQ, PS, PS/AQ, H2S and H2S/AQ
NTNU

Materials and methods 31
NTNU pulp series: fresh Norway Spruce chips received from a Norwegian newsprint mill or pilot chipped Scots Pine were screened according to SCAN CM 47:92 and the fraction between 2 to 6 mm thickness was retained and air-dried to high dryness. An exact amount of chips free from bark and knots were selected. The measured amount is used in the determination of cooking yield.
External 1 and 2 pulp series: fresh Norway Spruce or Scots Pine logs were manually barked and chipped in a pilot chipper. Sawmill chips were taken from a pulp mill woodyard. The chips were screened using SCAN CM 40:01 and the chips with a thickness less than 8 mm and larger than 7 mm holes were accepted. An exact amount of wood was further processed. Yield boxes with an accurate amount of air-dried chips were used for determination of cooking yield.
3.2.2 Cooking, washing and screeningNTNU pulp series: An accurate amount of chips were steamed at approximately 2 bar at 30 minutes in a 2 L steel autoclave and the amount of water in the chips were determined. Effective alkali (EA, SCAN N 2:88) and water were added to reach a liquor-to-wood ratio of 3.5:1 and a residual alkali of 7-15 g/l (as NaOH, SCAN N 33:94). The chips were impregnated for 15 minutes at 6 bar N2 pressure. The pulp experiments were performed using an electrically heated rotating batch digester with 8 autoclaves and temperature was increased as a ramp function from 23ºC to the maximum temperature at 163ºC during 90 minutes. The cook was interrupted at desired H-factor by placing the autoclave in cold water. Orange liquor was made by dissolving elementary sulphur in white liquor with low Na2S levels keeping the sum of sulphur and sulphide constant.
The H2S cook was divided into two stages. After steaming 4 % active alkali (as g NaOH) of an industrial green liquor and water was added to reach liquor-to-wood ratio of 4:1. 4 bar H2S gas from a compressed H2S gas cylinder was added and impregnated with 6 bar N2 gas. The autoclaves was heated from 23ºC to 150ºC during 30 minutes and pre-treated at 150ºC for 50 minutes. Gas pressure was released to atmospheric pressure after cooling in cold water. Redundant liquor was drained and fresh white liquor (20 % as EA) was added and the liquor-to-wood ratio was adjusted to 3.75:1. The temperature of the autoclaves was then increased from 70ºC to 163ºC during 30 minutes. All pulps were washed in hot tap water, defibrated in a 10 L large disintegrator and the last residuals of black liquors were released by careful washing through a 200-mesh wire. No screening was requested due to very low reject amount (<0.1 %). The pulp was pressed in an old EVALETT press (previously used for pressing washed clothes) to solid content 25 % to 35 % o.d. and measured according to SCAN C 3:78. Kappa numbers (SCAN C 1:77) of each pulp were determined and viscosity was measured according to SCAN CM 15:99. The pulp yield after cooking was measured gravimetrically by using the weight of the whole content of the autoclave and the dryness content.
External 1 and 2 pulp series were cooked in a circulation digester with a liquor-to-wood ratio of 4.0 and a maximum temperature of 167ºC. The alkali charge was adjusted to achieve a residual alkali of 7-10 g/l (as NaOH). The Kappa number target was either 25 or 40. The AQ was dissolved in the cooking liquor before cooking, whereas PS was

3.2 Pulps32
charged using MOXY liquor from Peterson Linerboard, Moss as an alkali source. The concentration of polysulphide was adjusted to the desirable level by adding elementary sulphur. Extremely high concentrations of PS (>8 g S/L) were made dissolving elementary sulphur in the cooking liquor. The pulp was washed with tap water and screened with a 0.15 mm slots screen. The pulps from external lab 1 were pressed as for the NTNU series. However, the the external lab 2 was centrifuged. The Kappa number was determined according to SCAN C 1:00
3.2.3 Bleaching and dryingExternal:The pulps from the external 1 and 2 pulp series were oxygen delignified and bleached using a standard ECF sequence OD0(EO)D1ED2. The bleaching sequence was adjusted to achieve a Kappa number 13-15 after the O-stage (double O-stage (O+O) for some pulps) and a final brightness of 90 % ISO. The yield was determined gravimetrically after O-stage and for fully bleached pulps.
NTNU: The NTNU pulp series was only bleached using a D0ED1ED2 without O-stage to a brightness of 86 % ISO.
Table 3.3: Bleaching conditions for external pulps to 90 % ISO.
Stage TempºC
Timemin
Pbar
Conc.% End pH Addition
kg/ADT % ISO
O 100 60 5 12 9.3-12.5 10-17a
a. + 2 kg MgSO4/ADT
37-44
Do 70 60 1 10 2.9-3.3 15-33EOP 80 180 5 10 11.6-12.1 17-20a b
b. + 2 kg H2O2/ADT
73-80
D1 70 180 1 10 3.9 5-18 86-88ED2 80 5+180 1 10 4.6-4.7 1-8c
c. + 2 kg NaOH/ADT
89-90
Table 3.4: Bleaching conditions for NTNU pulps to 86 % ISO without O-stage.
Stage TempºC
Timemin
Conc.% End pH Addition
kg/o.d. ton % ISO
Do 60 60 10 3.1 63-88E 65 60 10 12.1 20 44-49
D1 70 120 10 3.5 39-53E 20 10 5 11.5 5-7.5 70-73
D2 75 180 10 3.9 39-42 86.3-86.5

Materials and methods 33
1000 g/m2 sheets of bleached pulps were pressed and dried prior to beating. Four of the NTNU pulps were tested as never-dried pulps.
3.3 Wood and fibre characterizationBasic wood density of the chips was determined before pulping.
Bleached pulp with different pulping and hemicellulose content was manufactured and tested for fibre and pulp properties. Fibre and pulp quality properties such kinks, curl, fibre dimensions, flexibility and swelling was evaluated.
An overview over the experimental procedures is presented in Table 3.5 while the results are presented and discussed in Chapter 7.
3.4 Handsheet propertiesBeating, sheet forming and sheet testing were carried out according to SCAN C 24:96, SCAN CM 26:99 and SCAN C 28:76. The pulps were also characterized for fibre length and coarseness by FQA according to the equipment manual.
Table 3.5: List of standards used for measuring fibre and pulp properties
Property abri. Procedure Unit
WRV SCAN C 62:00 g water/100 g o.d. pulpCoarseness C FQA µg/mBasic wood density BD SCAN CM 43:95 kg/m3
Fibre wall thickness FWT SEM: [42]Calculation: [43]
µm
Fibre width FW SEM: [42]Calculation: [43]
µm
Curl FQA %Kinks FQA 1/mmFibre length FQA mmKappa number SCAN C 1:77Solid content SCAN C 3:78 %Viscosity SCAN CM 15:99 ml/gISO-brightness SCAN-P 8:93 % ISO

3.4 Handsheet properties34
Table 3.6: List of standards used for measuring pulp and handsheet properties
Property Procedure Unit
Preparation of handsheets SCAN-CM 26:99PFI beating SCAN C 24:96 revs. PFIHand sheet testing SCAN CM 28:76Sheet density SCAN-P 7:96 kg/m3
Load-elongation properties SCAN-P 38:80 Nm/g, kNm/g, %Zero-span ISO/DIS 15361 Nm/gTear index SCAN-P 11:73 Nm2/kgAir resistance, Gurley SCAN-P 3:93 s/100 mlLight scattering coefficient SCAN-P 3:93 m2/kgScott bond Tappi 833 pm94 J/m2
ISO-brightness SCAN-P 8:93 % ISO

4.1 Introduction 35
C H A P T E R
4 MEASUREMENT OF
CARBOHYDRATE COMPOSITION
The objective is to develop a method for determination of carbohydrate composition using crude commercial enzymes and a mild acid to hydrolyse pulp carbohydrates. The separation of the hydrolysed monosaccharides is performed on a standard HPLC system with an RI-detector. RI-detectors are universal and detect most soluble compounds. However, the sensitivity of the RI-detector is low compared to many other detectors and high concentrations are necessary for detection. High concentrations of organic materials may lead to poor compound separation in the HPLC-column and the recorded chromatogram may have overlapped peaks. This problem can be solved by using a peak separation software for deconvolution. This process can compensate for the overlapped peaks in the chromatograms.
The methods that are developed are based on the work presented by Minja [44].
4.1 IntroductionMeasurement of carbohydrate composition is essential for this thesis. Determination of the carbohydrate composition of wood and pulp samples usually consists of hydrolysis of the sample to soluble monosaccharides followed by derivatization, detection and quantification by a suitable system.
Hydrolysis. The traditional carbohydrate analysis method uses 72 % sulphuric acid at room temperature to hydrolyse the pulp or wood sample (primary hydrolysis), followed by a secondary hydrolysis using hot dilute acid. All conditions during hydrolysis must be carefully supervised. Decomposition of monosaccharides occurs mainly in the secondary hydrolysis. Thus, the conditions during secondary hydrolysis standardize the decomposition of monosaccharides [45]. Acidic hydrolysis has a weakness due to the harsh condition in both the primary and secondary hydrolysis. The hash conditions may degrade monosaccharides to smaller fragments [46] and these fragments are harder to detect. Thus, several new methods for carbohydrate hydrolysis of chemical pulps have been published. These methods involve the use of enzymes for depolymerization of the

Measurement of carbohydrate composition36
pulp to mono- or oligosaccharides [47-51]. The mild conditions during enzymatic hydrolysis minimize the degradation of monosaccharides.
Detection of monosaccharides. After complete hydrolysis, the monosaccharides must be detected on a suitable system and the detection system must fit the separation system. Gas chromatography (GC) was utilized in the late 1960s and early 1970s [52, 53] and resulted in the widely used TAPPI Test method no. T249 cm-85. More recently, ion chromatography (IC) and capillary zone electrophoresis (CZE) have been used for separation and quantification [54]. For GC, it is necessary to introduce functional groups to make the monosaccharides more volatile and soluble in the non-polar solvent. Other chromatography systems often use detectors that need derivatization for sensitive detection. Thus, the chemical derivatization step requires operator skills and may introduce an additional loss of accuracy in the analysis.
Other methods. Pyrolysis gas chromatography/mass spectrometry (Py/GC/MS) is an analytical technique that is useful in the characterization of polymer compounds. A small sample is heated without oxygen present and each compound in the sample is depolymerized into a low molecular compounds separated by the GC and detected in the mass spectophotometer. A review of this technique can be found in Paper II. Infrared technologies such as NIR and FT-IR can also be used for carbohydrate analysis, however, calibration using advanced statistical methods is essential.
Surface carbohydrate composition. It is suggested that carbohydrates at the surface of chemical fibres have a glue-acting effect in the paper [55]. Process modifications may also influence the chemical composition [56]. Especially the surface xylan content is highly dependent on pulping parameters. However, only a few procedures are developed to detect the surface composition. The most common procedure involves isolation of secondary fines (without primary fines) prior to standard carbohydrate detection. However, Dahlman and Sjöberg [57] have developed a short enzymatic peeling prior to carbohydrate detection. The results from mechanical and enzymatic peeling show similar results.
4.2 Experimental
4.2.1 Enzymatic and acidic hydrolysisA pulp sample of 2.30 g, 12.5 ml acetic acid buffer (pH 5, 1 M solution) and 0.5000 g mannitol (internal standard) was diluted with water to a total weight of 125g. The fibrous suspension was stirred at 55°C and 1.0 ml of enzymes was added three times per day. The enzymatic hydrolysis time was set to 48 hours unless other time is stated. The enzyme mixture consisted of equal parts of ECOPULP TX-200 C (xylanase), ECOPULP C15 (cellulase) and Mannanase AMB, all enzymes supplied by Röhm Enzymes Finland Oy.
The TFA hydrolysis was performed in heat-resistant closed bottles in boiling water for one hour followed by neutralization with lead-(II)-oxide (PbO) and filtration through a 0.22 µm filter twice before HPLC injection. TFA is normally evaporated due to its low

4.2 Experimental 37
boiling point (72°C). However, evaporation was not performed because it was considered too time-consuming. All hydrolysates were stored at 4°C prior to HPLC analysis.
4.2.2 HPLC analysisChromatographic separation of the hydrolysate was performed on a Chrompack Carbohydrate Pb column with deionized (18.2 MΩ), filtered and deaerated water as the mobile phase. The column temperature was 80°C. A Shimadzu HPLC system consisting of a LC-6A pump, a manual injector, a CTO-10A column oven and a RID-6A refractive index detector was used. The chromatogram was acquired using Shimadzu CLASS-VP chromatography software.
The procedure for carbohydrate composition is summarized in Figure 4.1. Details concerning chromatogram processing and calibration are shown in Appendix A.
4.2.3 CalculationsThe pulp was characterized for Kappa number according to SCAN C 1:00 and amount of lignin was determined based on the Kappa number [58]. The lignin-free pulp was determined using Equation 4.1:
The mass fraction of cellulose (XCell), xylan (XXyl) and glucomannan (XGlcMan) were calculated using Equation 4.2 and the sum of cellulose, xylan and glucomannan are set to 100 % on o.d. lignin-free pulp:
XGlucan, XXyl and XMannan are the anhydrosaccharides to glucose, xylose and mannose, respectively. Recalculation from monosaccharides to anhydrosaccharides is necessary.
Figure 4.1 Scheme of the complete procedure for carbohydrate composition determination of pulp using HPLC detection. This procedure is also named Enz. + TFA.
mlignin-free pulp=mpulp·(1-0.00147·Kappa number) ( 4.1 )
XCell = XGlucan - 1/3·XMannanXXyl = XXyl (from xylose)XGlcMan = 4/3·XMannan
( 4.2 )
NaAc-buffer
EnzymesFibres
48 h
TFA
1 h
55°C100°C
HPLC
PbO Calculation:CelluloseXylanGlucomannan
Complete hydrolysis (Enz. + TFA):

Measurement of carbohydrate composition38
It should be noted that the sum of all reported carbohydrates should be 100 % and not the hydrolysis yield when pulps are compared. The hydrolysis yield may differ from sample to sample and this is often not of interest for the carbohydrate composition evaluation. However, a high hydrolysis yield assures successful completion the procedure.
4.2.4 Surface carbohydrate compositionThe surface layer analysis was done as described by a modified version of Dahlman and Sjöberg [57]. The modification was:
• 0.3 mL of unpurified enzymes (mixture of equal parts of the three enzymes used in Section 4.2.1), 0.05 g mannitol and 1.2 mL buffer (pH 5) was used for 0.3 g o.d. pulp and diluted to 25 mL.
• A blind sample without pulp and mannitol was subtracted from each chromatogram as described in Paper I.
4.3 Results and discussionAccurate determination of the carbohydrate composition of wood and pulp samples used traditional acid hydrolysis (TAPPI Test method no. T249 cm-85) can be a difficult and labour-intensive process due to the need for high precision in both the hydrolysis and derivatization stages.
The manufacturing of extremely selective enzymes [47] is a tedious process that requires specialized expertise. On the other hand, commercial enzymes used for pre-bleaching often have the required selectivity. However, these enzymes may not hydrolyse all
Figure 4.2 Schematic illustration of enzymatic peeling technique. Filtrates from 1, 3 , 10 minutes and 48 hours are determined.
FibreBuffer pH 5.0EnzymesMannitol (IS)
Filter50 µm
1 min 3 min 6 min 48 hours
24 h 24 h 24 h
HPLC analysis

4.3 Results and discussion 39
carbohydrates in the pulp to monosaccharides. The use of such enzymes will thus often require a chemical hydrolysis stage in order to degrade the oligosaccharides to monosaccharides. Hydrolysis of non-cellulosic polysaccharides with triflouroacetic acid (TFA) is considered to give less monosaccharide degradation compared to sulphuric acid hydrolysis [59]. Minja [44] has reported that triflouroacetic acid is suitable for complete hydrolysis of enzyme hydrolysates.
4.3.1 Enzymatic and acidic hydrolysisMost of the polysaccharides in the pulp is decomposed to monosaccharides after 48 hours and can be detected using a suitable system. Figure 4.3 shows the amount of detectable anhydrosugars of the main monosaccahrides in the pulp. The amounts of detectable xylose, arabinose and galactose (recalculated to their anhydrosugars) do not increase after 48 hours. It should be noted that mannose and to some extent glucose can benefit of further enzymatic hydrolysis. Enzymatic hydrolysis time above 48 hours can be used, however, 48 hours was chosen as the standard enzymatic hydrolysis time to reduce the analysis time necessary for further sample preparation and handling.
Since enzymatic hydrolysis with commercial enzymes normally gives a mixture of mono- and oligosaccharides, a secondary acidic hydrolysis using trifluoroacetic acid (TFA) was performed in order to get a complete degradation to monosaccharides. The strong organic acid TFA (pKa < 0.5) is a preferred acid for hydrolysis of polysaccharides with low non-specific degradation of monosaccharides. Each carbohydrate in the pulp enzymatic hydrolysate responds differently to the acidic hydrolysis. Figure 4.4 shows that the content of xylose and mannose (measured as xylan and mannan) increase at stronger acidic hydrolysis. In addition, the glucose content (glucan) benefits of a mild acidic hydrolysis. The optimum acidic hydrolysis of the enzymatic hydrolysate was set to 0.1 M and 2.5 M TFA in addition to the enzymatic hydrolysis without acidic hydrolysis. The hydrolysate with maximum value was chosen and used in the calculation.
Figure 4.3 Enzymatic hydrolysis of a unbleached laboratory cooked kraft pulp with a Kappa number of 31.7. Trend lines are exponential rise to a maximum.
0
0,2
0,4
0,6
0,8
1
0 10 20 30 40 50Enzymatic hydrolysis time, h
g de
tect
ed/g
o.d
. lig
nin
free-
pulp
Total
Glucan
0
0,02
0,04
0,06
0,08
0,1
0 10 20 30 40 50Enzymatic hydrolysis time, h
g de
tect
ed/g
o.d
. lig
nin
free-
pulp Xylan
GalactanArabinanMannan

Measurement of carbohydrate composition40
4.3.2 Simplified carbohydrate analysis procedureTo save man-hours, it is advisable to use only one HPLC run for each pulp analysis. In addition, avoiding the use of somewhat hazardous TFA and PbO is highly desirable. Thus, it is necessary to correlate the amount of carbohydrates detected in the enzymatic hydrolysis with the amount found at optimum TFA hydrolysis (defined as the maximum amount of carbohydrates detected), see Figures 4.3 and 4.4.
The two peaks with retention time from 26 to 30 minutes in the chromatogram varies with different acidic hydrolysis, see Figure 4.5. One peak decreases at increasing acidic hydrolysis while the other increases. The peak which is positively assign to mannose increases at increasing acid hydrolysis (26.5 to 28.5 minutes) while the peak in the area 28.5 to 30 minutes decreases, indicating that the peak is an unhydrolysed fragment from glucomannan (i.e. a glucomannan oligosaccharide) and that complete hydrolysis of
Figure 4.4 Acidic hydrolysis of a unbleached laboratory cooked kraft pulp with a Kappa number of 31.7. Trend lines are exponential rise to a maximum.
0,6
0,7
0,8
0,9
1,0
0,0 0,5 1,0 1,5 2,0 2,5 3,0TFA conc. [M]
g de
tect
ed/g
o.d
. lig
nin-
free
pulp
Total
Glucan
0,00
0,02
0,04
0,06
0,08
0,10
0,0 0,5 1,0 1,5 2,0 2,5 3,0TFA conc. [M]
g de
tect
ed/g
o.d
. lig
nin-
free
pul
p
XylanGalactanArabinanMannan

4.3 Results and discussion 41
glucomannan is obtained when this peak disappears. Assuming that the new unidentified peak is a glucomannan oligosaccharide, it is possible to simplify the procedure.
The sum of the relative areas of the mannose peak and the peak assigned to the glucomannan oligosaccharide at no acidic hydrolysis correlate well with the relative area for mannan obtained at optimum hydrolysis level. Similar procedures can also be performed for xylan and cellulose. Thus, it is possible to calculate the correlation factor for each carbohydrate.
The correlation factors are defined as:
where mtot is the amount of anhydrosaccharide at totally hydrolysis (defined as maximum level of monosaccharide at either no acidic hydrolysis (i.e. cellulose), 0.1 M TFA (i.e. xylan) or 2.5 M TFA (i.e. glucomannan) hydrolysis) and menz is the amount of hydrolysed anhydrosaccharide and corresponding oligosaccharide fragment after primary enzymatic hydrolysis.
The different monosaccarides responded differently to the TFA concentration and different correlation factors are needed to get an accurate measurement. The correlation factor for glucan (cellulose), xylan and mannan (glucomannan) was found to be 1.010 ±0.004, 1.11±0.04 and 1.07±0.03 at 95 % confidence interval (22 pulps analysed).
Figure 4.5 Chromatogram enlargement of a pulp with different acidic hydrolysis.
Correlation factor = mtot/menz ( 4.3 )
0
10000
20000
30000
40000
50000
26 28 30
Retention time, min
RI-u
nits
no acid
0.1 M TFA2.5 M TFA
GlcMan saccharideIncreased TFA hydrolysis
Mannose:Increased TFA hydrolysis

Measurement of carbohydrate composition42
The advantage of this simplified procedure is that fewer man-hours are needed to carry out an analysis. Also, the capacity of the HPLC is increased and the use of somewhat hazardous TFA and PbO is also avoided. The scheme of the totally hydrolysed and simplified procedure for softwood is given in Figure 4.6.
.
4.3.3 Hydrolysis yield
Enzymatic and acidic hydrolysis. The carbohydrate composition was determined after pure enzymatic hydrolysis. Table 4.1 shows that approximately 85-95 % of the carbohydrates in the pulp are detected as anhydrosaccahrides after enzymatic hydrolysis.
Optimal TFA hydrolysis increases the hydrolysis yield with 3-7 % units. This can be seen in Table 4.1. Most of the increase of hydrolysis yield is due to higher yield of glucomannan and to some extent xylan. The cellulose fraction of the hydrolysed pulp decreases to some extent because higher degradation of cellulose in acidic environment. Since the degradation of each pulp carbohydrate is different in acidic environment, it is
Figure 4.6 Scheme of the simplified procedure for carbohydrate composition determination of pulp using HPLC detection
Table 4.1: Amount of detected anhydrosaccharides after 48 hours of enzymatic hydrolysis and after both enzymatic and acidic hydrolysis (Enz. + TFA). 95 % confidence interval.SW = Softwood
Pulp Enzymatic hydrolysis yield, % on o.d. lignin-free pulp
Enzymatic and acidic hydrolysis, % on o.d. lignin-free pulp
Unbleached lab. SW PS/AQ 88.4 ± 2.4 95.2 ± 4.6
Unbleached lab. SW Kraft 85.5 ± 3.0 91.1 ± 3.3
Bleached commercial Eucalyptus 92.6 ± 2.5 95.8 ± 3.1
Bleached commercial SW 86.2 ± 4.7 91.0 ± 5.3
NaAc-buffer
48 h
55°C
HPLC
Correlation: Calculation:CelluloseXylanGlucomannan
EnzymesFibres
Simplified hydrolysis
Enz.
+TFA
Enz. (+ oligo-sacch. fragment)

4.3 Results and discussion 43
preferred to analyse the pulp sample after pure enzymatic hydrolysis (optimal for cellulose) and after a secondary hydrolysis at 0.1 M TFA (optimal for xylan) and 2.5M TFA (optimal for glucomannan).
4.3.4 Repeatability and comparison to the traditional procedureFour different pulps were analysed using:
• pure enzymatic hydrolysis • complete hydrolysis with TFA• the simplified method• standard acidic hydrolysis method (TAPPI-standard)
The hydrolysis yield is high (from >85 % using pure enzymatic hydrolysis to >90 % for complete hydrolysis with TFA), corresponding to the study performed by Dahlman et al.[51]. Figure 4.7 shows that both TAPPI-standard and enzymatic hydrolysis with TFA hydrolysis gave comparable results. It is worth noticing that the 95 % confidence interval in the developed procedure was small, 0.3 to 0.5 % on o.d. pulp.
Even though TFA is considered to be more suitable for secondary hydrolysis compared to strong mineral acids, it decomposes the monomers to a certain degree and xylose (i.e. xylan) and glucan (i.e. cellulose) are degraded more with increasing TFA concentration compared to mannan (i.e. glucomannan). Albersheim et al. [46] have found similar results. These conditions are probably more pronounced by the use of sulphuric acid, indicating that the TAPPI standard method may underestimate xylan in softwood. However, no significant underestimation of glucomannan was found. Figure 4.7 shows that the estimated values for xylan in softwood hydrolysed according to the TAPPI standard method are underestimated by 12 ± 7 % compared with the enzymatic hydrolysis. Recalculated data from Dahlman et al. [51] show that the underestimation of xylan in the TAPPI method was 12 ± 4 %. The four pulps shown in Figure 4.7 is not used to model the correlation factors in Section 4.3.2.

Measurement of carbohydrate composition44
Hardwood pulps may respond differently to acid hydrolysis. This is partly because the hemicelluloses in hardwood and softwood are different [5] and partly because the content of xylan is approximately twice the content of xylan in softwoods. Nevertheless, Figure 4.7 shows no significant difference between the traditional analysis and the methods presented in this paper (both the complete and the simplified procedure) when analysing hardwood pulps.
If only enzymatic hydrolysis is employed without any correction for incomplete hemicellulose hydrolysis, the cellulose content is overestimated and the glucomannan content underestimated. Thus, it is important to either perform a TFA hydrolysis or correct for the incomplete hemicellulose hydrolysis as described previously. Both the simplified method with correction for incomplete hydrolysis and the complete hydrolysis with TFA give an acceptable accuracy.
Another comparison is shown in Table 5 in Paper II. Py/GC/MS, TAPPI standard method and enzymatic + TFA method are compared for different pulps. In Py/GC/MS no hydrolysis is performed and the method differs fundamentally from the two wet-chemical analytical procedures presented. Even here the xylan from softwood shows a lower level compared to the enzymatic method. However, it should be noted that the
Figure 4.7 Comparison between carbohydrate analyses of pulps employing TAPPI-standard (TAPPI Test method no T249 cm-85), only enzymatic hydrolysis (only enz.), enzymatic hydrolysis with TFA (Enz. + TFA), simplified method without TFA hydrolysis and corrected for incomplete hydrolysis (Enz., no TFA, corrected). 95 % confidence interval
Commercial bleachedeucalyptus pulp
Rel
ativ
e co
nten
t, %
0
5
10
15
2075
80
85
0
5
10
15
2075
80
85
TAPPI Test method no. T249 cm-85Enz. + TFAEnz., no TFA, corrected (simplified)Only enz.
Cell Xyl GlcMan
Commercial bleachedSoftwood pulp
Cell Xyl GlcMan
Laboratory SWunbleached kraft
Cell Xyl GlcMan
Laboratory SWunbleached PS/AQ
Cell Xyl GlcMan

4.3 Results and discussion 45
amount of detected arabinan and galactan in the hydrolysis filtrate is neglected. This is due to impurities from the applied enzyme mixture. The Py/GC/MS method and acid hydrolysis/GC method do not have this problem. Thus, adding arabinan to the detected xylan content, the overall differences is reduced.
4.3.5 Hexenuronic acidsHexenuronic acids (HexA) have been widly discussed during the past decade. HexA are formed by elimination of methanol from 4-O-methylglucuronic acids during alkaline pulping [60]. Glucuronic acids are attached to the xylan backbone and the formation of HexA have undesirable influence on bleaching [60] and brightness reversion [61]. The content and yield of xylan are fairly constant in this study and the goal was not to examine bleaching chemistry, thus, HexA content is not investigated and no effort was done to identify and quantify the content of HexA groups in the recorded HPLC chromatogram. HexA groups are also hydrolysed in presence of TFA, however, HexA groups endure enzymatic hydrolysis. The use of an RI-detector is not ideal for HexA detection and other wet-chemistry methods are easily available for HexA detection [62].
4.3.6 Surface carbohydrate compositionThe composition of carbohydrates at the surface of chemical fibres is determined by enzymatic hydrolysis at varying hydrolysis time, see Figure 4.2.
Easily accessible fibre wall areas react with the applied enzymes. Material from the fibre surface, fibre dislocations, pores and cracks can react with the enzymes. Thus, the detected material does not entirely originate from the fibre surface. To make the comparison of surface carbohydrate composition more easy, the surface composition of each carbohydrate are calculated as the value obtained at the time corresponding to 10 % fibre wall total dissolution. This is shown in Figure 4.8.
The surface composition of six pulps with different composition was determined and is presented in Chapters 5 and 7.
Figure 4.8 Relationship between carbohydrate composition and fibre wall dissolution for a standard kraft pulp. Surface composition is calculated from 10 % fibre wall dissolution. The average carbohydrate through the fibre wall are calculated from 48 hours enzymatic hydrolysis i.e. 100 % fibre wall dissolution.
65 %
70 %
75 %
80 %
85 %
0 % 25 % 50 % 75 % 100 %Fibre wall disolution, mass %
Cel
lulo
se c
onte
nt, m
ass
%
0 %
5 %
10 %
15 %
20 %
0 % 25 % 50 % 75 % 100 %Fibre wall disolution, mass %
Xxyl
an c
onte
nt, m
ass
%
0 %
5 %
10 %
15 %
20 %
0 % 25 % 50 % 75 % 100 %
Fibre wall disolution, mass %
Glc
Man
con
tent
, mas
s %

Measurement of carbohydrate composition46
4.4 ConclusionsNo derivatization or pre-treatment (mechanical or chemical) steps are needed to determine the carbohydrate composition using the methods developed here. As for derivatization, any pre-treatment of a sample can introduce systematic or random errors of the analysis results. Consequently, it is desirable to minimize any mechanical or chemical (e.g. chlorite washing) pre-treatment steps.
The application of an inexpensive and universal detector is compensated for by using peak deconvolution software on the recorded chromatograms. In addition, the mild enzymatic hydrolysis of the pulp may also preserve xylan better from degradation compared to acidic hydrolysis of pulps.

Carbohydrate retention and molecular mass distribution 47
C H A P T E R
5 CARBOHYDRATE RETENTION AND MOLECULAR MASS DISTRIBUTION
The carbohydrate retention is changed using different yield-increasing additives and the differences are measured using the method that has been developed (Chapter 4). The yields of xylan, glucomannan and cellulose using yield-increasing additives are investigated and discussed.
In addition, the molecular mass distribution of the carbohydrates in some high yield pulps are investigated using size exclusion chromatography. The molecular mass distributions for softwood pulps have only recently been successfully analysed due to problems with analysing glucomannan. Thus, it would be very interesting to examine pulps with different glucomannan content and extract information of the carbohydrates obtained by increased yield methods.
Usually, viscosity measurements are performed on pulps to gain information about the degree of polymerization, however, this type of analysis only gives an average value and the disadvantages of this measurement on high yield pulps are discussed.
5.1 IntroductionThe total yield for pulps using yield-increasing additives is often reported, however, the carbohydrate composition is more seldom reported. Formerly, paper chromatography of acidic hydrolysates was the basis for these studies. Thus, this method may produce different values compared to more modern wet chemistry methods. Sanyer and Laundrie [63] reported in 1964 that the glucomannan yield was doubled, accounting for one-half of the yield increase of 10% (on o.d wood). Xylan and cellulose were responsible for the other half. Kleppe and Kringstad [64] increased the pulp yield of Norway Spruce by 7 % (on o.d wood) and only 1-2 % of the yield gain was caused by cellulose. Glucomannan was responsible for 6 %. Xylan yields were low compared to values measured with modern techniques. During the last few years, more moderate additions of polysulphide are reported with yield gain in the area 2 to 4 % (% on o.d. wood). The main yield gain is caused by higher glucomannan retention [65,66]. Li et al. [66] also investigated the interaction between PS and AQ and found a synergistic effect. Hydrogen sulphide pre-

5.2 Experimental48
treatments increases the yield by 6-7 % and most of the yield gain is caused by glucomannan [67,68].
Size exclusion chromatography (SEC) is highly suitable for characterization of molecular mass distributions. First, the pulp has to be dissolved in a suitable solvent. For hardwood pulps, a solution of lithium chloride and N,N-dimethylacetamide is suitable for SEC analysis. However, this solution does not dissolve the hemicellulose in softwood fibres but researchers at STFI [69] have developed a technique that can dissolve both hemicellulose and cellulose for molecular mass analysis. An additional derivatization of the pulp has to be performed to increase the solubility of all the hemicellulose. Using this procedure (described in Figure 5.1), the detected low molecular mass distribution increases from 4 % of the total distribution to 20%.
5.2 ExperimentalMost of the pulps investigated in Section 5.3 are unbleached pulps delignified to bleachable Kappa numbers. None of the pulps are extracted and the composition is measured as relative carbohydrate composition based on lignin-free o.d. pulp. More details of the pulps and pulping conditions are found in Chapter 3.
The approach was to utilize enzymes to split the glycosidic bonds which form the polysaccharides from their monomers. Enzymes split the glycosidic bonds gentler compared to strong mineral acids. The surface composition of carbohydrates can also be estimated using a modified version of a method developed by researchers at STFI. The methods are described in Chapter 4.
Molecular mass distribution were analysed for four pulps with increased hemicellulose content and one reference kraft pulp sample. The carbohydrate yields of the samples are given in Table 5.1. A selection of pulps with different pulping yield was characterized in co-operation with Fredrik Berthold at STFI for molecular mass distribution.
Water swollen fibres were solvent exchanged with dry dimethylacetamide (DMAc) before addition of LiCl and ethyl isocyanate (derivatization reagent). After 5 days of
Table 5.1: Cooking time and yield of carbohydrates (based on in the pulps
PulpCooking time at 163 °C, h
Kappanumber
SCAN visc. ml/g
Yield, % on o.d. woodYCell YXyl YGlcMan YLign
Kraft 2.62 31.7 1190 38.2 4.4 3.9 2.3AQ 2.23 31.3 1165 39.5 4.0 4.4 2.4PS 2.05 30.0 1170 39.1 3.7 7.4 2.4PS/AQ 1.85 29.2 1130 38.9 4.0 8.0 2.3
H2S 0.83a + 2.45
a. Pre-treatment stage at 150°C
30.6 1115 38.7 3.9 8.8 2.5

Carbohydrate retention and molecular mass distribution 49
stirring, the sample was diluted and excess of derivatization reagent was quenched with dry methanol. See Berthold et al. [69] for further details.
Four PLgel 20um MIXED-A Columns were connected in a series in a HPLC system with a differential refractometer (RI) detector. 0.5% (w/v) LiCl/DMAc was used as mobile phase. The temperature of the columns was 80°C and five narrow pullulan standards (0.7 to 1660 kD) were used to calibrate the system. The molecular mass of the pullulan standards was corrected to better reflect the true molecular mass of cellulose as determined using multi angle laser light scattering (MALLS) [70]. The method will increase the apparent Mw of the hemicellulose distribution.
Figure 5.1 gives a schematic overview of the procedure performed at STFI. To separate hemicelluloses from cellulose in the chromatograms, a peak separation software (PeakFit from SPSS) was used.
Fredrik Berthold at STFI performed the SEC analysis. The wet chemistry analysis and the deconvolution was performed at NTNU.
5.3 Carbohydrate retentionThe yield of cellulose and glucomannan for unbleached pulps is shown in Figure 5.2 and it is significant which type of yield-increasing method that is used. The figure indicates that there are three ways to increase the glucomannan yield: increased Kappa number, addition of AQ and usage of PS or H2S. Increased Kappa number does not increase the glucomannan yield to a great extent and this can be seen as the relative flat curve named “Increased Kappa no.” in the left-hand of Figure 5.2. On the other hand, it seems that the yield gain caused by cellulose yield is high for increased Kappa numbers (right hand Figure 5.2).
Figure 5.1 Scheme for molecular mass determination using size exclusion chromatography (SEC).
DMAc
LiClFibres
5 days
ethyl iso-cyanate HPLC
PLgel20µm
MeOH1RI vs. volume2Calibration3RI vs. MW
RIFiltered

5.3 Carbohydrate retention50
Table 5.2 quantifies the fraction of glucomannan and cellulose yield when the Kappanumber is increased by 10. The increase in total lignin-free yield is 0.8 % and this corresponds to a unbleached total yield of 1.6 %. This agrees well with the results presented by Kleppe [23] which indicate an yield gain between 1.4 and 1.8 % when enhancing the Kappa number by 10 units. The yield gain is mainly caused by higher cellulose retention and to some extent higher glucomannan retention.
Thus, the yield gain obtained by increased Kappa number is somewhat different compared to the yield gain using additives. The addition of AQ results in both higher glucomannan and cellulose yields and it seems that approximately half of the yield increase is caused by higher cellulose retention and the other half by increased glucomannan yield. For cooks using PS and H2S pre-treatment, the predominant fraction of the yield gain is caused by higher glucomannan retention.
Table 5.3 shows results from a selection of cooks that use different yield additives. All cooks are standardized to Kappa number 30. The results are obtained by regression curves for the relationship between respective property and Kappa number. The lignin-
Figure 5.2 The relationship between glucomannan yield increase (on the left) or cellulose yield increase (on the right) and unbleached lignin-free yield increase.
Table 5.2: Yield gain obtained by increased Kappa number (shorter cooking time)
Additive% on o.d. wood
Yield at Kappa no. 30, % on o.d. wood ∆Cook-ing time,
hYLign-free YCell YGlcMan YXyl
Reference, Kappa no 30 46.6 38.9 3.7 4.0 0
Reference, Kappa no. 30 to 40
+0.8 +0.6 +0.3 -0.1 -0.31
-2
0
2
4
6
8
-2 0 2 4 6 8Lignin free yield increase, % on o.d.
wood
Glc
Man
yie
ld in
crea
se, %
on
o.d.
w
ood
KraftAQPSPS/AQH2SH2S/AQ
IncreasedKappa no.
AQ
PS, PS/AQH2S
-2
0
2
4
-2 0 2 4 6 8Yield increase, % on o.d. wood
Cel
lulo
se y
ield
incr
ease
, % o
n o.
d.
woo
d
KraftAQPSPS/AQH2S
Kraft and AQ PS, H2S
and PS/AQ
Upper celluloseyield limit
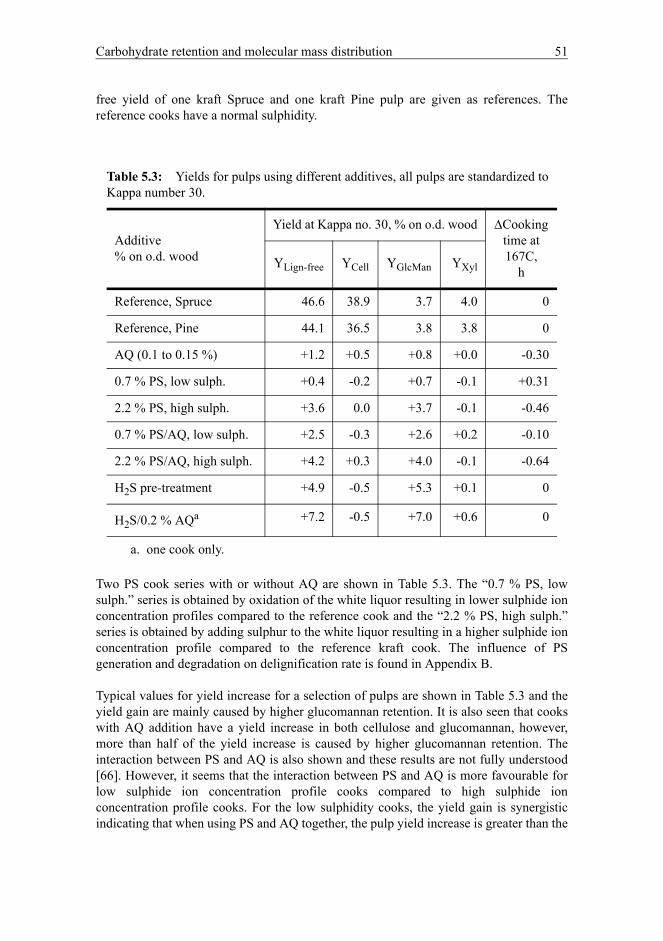
Carbohydrate retention and molecular mass distribution 51
free yield of one kraft Spruce and one kraft Pine pulp are given as references. The reference cooks have a normal sulphidity.
Two PS cook series with or without AQ are shown in Table 5.3. The “0.7 % PS, low sulph.” series is obtained by oxidation of the white liquor resulting in lower sulphide ion concentration profiles compared to the reference cook and the “2.2 % PS, high sulph.” series is obtained by adding sulphur to the white liquor resulting in a higher sulphide ion concentration profile compared to the reference kraft cook. The influence of PS generation and degradation on delignification rate is found in Appendix B.
Typical values for yield increase for a selection of pulps are shown in Table 5.3 and the yield gain are mainly caused by higher glucomannan retention. It is also seen that cooks with AQ addition have a yield increase in both cellulose and glucomannan, however, more than half of the yield increase is caused by higher glucomannan retention. The interaction between PS and AQ is also shown and these results are not fully understood [66]. However, it seems that the interaction between PS and AQ is more favourable for low sulphide ion concentration profile cooks compared to high sulphide ion concentration profile cooks. For the low sulphidity cooks, the yield gain is synergistic indicating that when using PS and AQ together, the pulp yield increase is greater than the
Table 5.3: Yields for pulps using different additives, all pulps are standardized to Kappa number 30.
Additive% on o.d. wood
Yield at Kappa no. 30, % on o.d. wood ∆Cooking time at 167C,
hYLign-free YCell YGlcMan YXyl
Reference, Spruce 46.6 38.9 3.7 4.0 0
Reference, Pine 44.1 36.5 3.8 3.8 0
AQ (0.1 to 0.15 %) +1.2 +0.5 +0.8 +0.0 -0.30
0.7 % PS, low sulph. +0.4 -0.2 +0.7 -0.1 +0.31
2.2 % PS, high sulph. +3.6 0.0 +3.7 -0.1 -0.46
0.7 % PS/AQ, low sulph. +2.5 -0.3 +2.6 +0.2 -0.10
2.2 % PS/AQ, high sulph. +4.2 +0.3 +4.0 -0.1 -0.64
H2S pre-treatment +4.9 -0.5 +5.3 +0.1 0
H2S/0.2 % AQa
a. one cook only.
+7.2 -0.5 +7.0 +0.6 0

5.3 Carbohydrate retention52
sum of the yield gain of AQ and PS used alone. This effect is also previous reported as a synergistic effect [58,66]. However, the size and reaction mechanism of the synergistic effect are not fully understood. These results indicate that the sulphide ion concentration profile may play an important role in the interaction between PS and AQ. AQ may be more effective in low sulphidity cooks compared to high sulphidity cooks. It seems that the sulphidity profiles of the PS cook series influence the cooking time.
Li et al. [66] have reported results from a study that investigated the synergistic effect of PS and AQ on yield improvement. Data are taken from the figures in the article [66] and the values are recalculated in Table 5.4. The orange liquor used in this study had an initial sulphidity of 15% prior to addition of sulphur/sulphide solution and the reference white liquor had a sulphidity of 30 %. The cooking times for the PS cook and reference cook are similar indicating that the PS cook performed by Li et al. [66] has sulphide ion profile that is between the two PS cooks shown in Table 5.3. Also for these cooks, the high retention of glucomannan is striking. However, for this case the synergistic effect seems to be caused by an unexpected higher cellulose retention for the PS/AQ cook and not by higher glucomannan retention as in Table 5.3. Thus, the reason for the synergistic effect is not similar for the two cases (Table 5.3 vs. Table 5.4).
Also H2S pre-treatment shows an impressive yield increase and all of this yield gain is caused by glucomannan retention. The interaction between H2S and AQ is additive or may also show synergistic effects. However, replication of this cook was not done due to HES considerations1 for using pressurized H2S in the rotating air-heated digester system.
Together with glucomannan yield increase, the cellulose yield increase is important when AQ or increased Kappa number is used compared to PS or H2S. This is probably due to the shorter cooking time as indicated in Table 5.3 and 5.4 and Figure 5.3. AQ increases the delignification rate resulting in shorter cooking time. Shorter cooking time is also the case when the cooks is interrupted earlier resulting in increased Kappa number. Addition
Table 5.4: Yields for Black Spruce cooks using different additives, all pulps are standardized to kappa number 28 and the results are recalculated from Li et al. [66].
Additive% on o.d. wood
Yield at Kappa no. 30, % on o.d. wood ∆Cooking time at 167C,,
hYLign-free YCell YGlcMan YXyl
Reference 46.3 38.7 3.6 4.0 0
0.1% AQ +1.1 +0.6 +0.7 -0.2 -0.38
1.6 % PS +1.6 -0.1 +2.0 -0.3 +0.01
1.6% PS/0.1% AQ +3.6 +1.3 +2.8 -0.5 -0.45
1. need permission from the university for the experiment

Carbohydrate retention and molecular mass distribution 53
of PS may influence the delignification rate. The reaction of PS with carbohydrates, generation and degradation of PS influences the sulphide ion concentration profile compared to a reference kraft pulp. Thus, the cooking time may increase (using catalytic oxidation of white liquor) or decrease (when adding sulphur to white liquor). The two PS cook series in Table 5.2 illustrates this effect.
The xylan yield is more or less constant during the last phase of the cooking and the H-factor and the Kappa number have a minor effect on the pulping yield.
It seems that the surface of the fibre has approximately twice the content of xylan compared to the bulk of the fibre, see Figure 4.8. Two effects can explain this effect: i) precipitation of xylan on the fibre surface and ii) high levels of lignin-xylan componds near the primary wall and middle lamella compared to the rest of the fibre wall. Precipitation may occur on the fibre surface towards the end of the cook since lower residual alkali promotes the xylan precipitation. The content of lignin is higher in the middle lamella and the primary wall in the fibre surface. Thus, the content of xylan may be higher in the surface area since xylan and lignin are closely connected. Both i) and ii) may contribute to a xylan content increase in the fibre surface.
The glucomannan is almost evenly distributed through the fibre wall and the glucomannan content in the surface is almost the same as for the rest of the fibre wall. Figure 4.8 illustrates a typical distribution
Figure 5.4 shows that the xylan yield is only varied with approximately 0.5 % when varying residual alkali with 10 g NaOH/L. The effect of the residual alkali in normal levels (8 to 14 g NaOH/L) should contribute to less than half of this effect, approximately 0.2 % on o.d. wood. This means that the residual alkali has only a minor effect on the total pulping yield, but it can affect important mechanical properties of mechanical paper properties, especially unbeaten paper properties. As seen in Figure 5.4, the surface xylan content correlates extraordinary well with the residual akali in the cook.
The constant xylan yield is probably valid for cooks with similar alkali profile during kraft pulping. However, the xylan yield can be dramatically lower when high
Figure 5.3 Cooking time affects the cellulose yield
37
38
39
40
1 1,5 2 2,5Cooking time at 167°C, h
Cel
lulo
se y
ield
, % o
n o.
d. w
ood
AQKraftPSPS/AQH2S

5.4 Molecular mass distributions54
concentration alkali profiles are used. Olm [71] varied the alkali concentration profiles dramatically and the level of residual alkali was varied (between 6 to 35 g NaOH/L) and the xylan yield decreased from 3.8 to 2.1 % on o.d. wood at the different alkali profiles. The right-hand Figure 5.4 shows that the decrease in xylan yield falls linearly with the alkali concentration. The slopes of all the curves in Figure 5.4 are approximately the same. The reason for the difference in xylan yield for the different pulp series may be due to different raw material, cooking equipment and alkali profiles.
Total yield increase can in addition to glucomannan and cellulose yield considerations, be described by the two mechanisms: i)end-group stabilization not caused by the stopping reaction and ii)reduced cooking time. It may be interesting to estimate the contribution of these two mechanisms. A method for this estimation is found in Appendix B and several pulp series from this work and other authors [66,72,73] are investigated. The most interesting result is that half of the yield gain of AQ is caused by lower cooking time and the other half by end-group stabilization (other than the standard stopping reaction). PS increases the yield gain mainly by the impregnation end-group stabilization, however, some changes in sulphidity profiles may cause a change in delignification rate and affects the cooking time and yield gain caused by cooking time. Appendix C describes details in glucomannan, xylan and cellulose retention.
5.4 Molecular mass distributionsIt is clear that the yield of glucomannan and cellulose is affected by the yield additives (Table 5.3). Other characteristics of the carbohydrates are necessary to increase the knowledge of yield-increasing additives. One characteristic may be the molecular mass distribution of the pulp. New information of the molecular size distributions of hemicelluloses and cellulose can be extracted from the recorded chromatograms using size exclusion chromatography (SEC). By combination of the results obtained by wet-chemistry methods (Chapter 4) and the recorded SEC chromatograms, it may be possible to identify the peaks of glucomannan, xylan and cellulose in the size exclusionchromatograms. Molecular mass distribution of these peaks is then determined.
Figure 5.4 Surface xylan content (left hand) and xylan yield (right hand) as a function of residual alkali.
10
12
14
16
18
6 8 10 12 14 16Residual alkali, g NaOH/L
Surf
ace
xyla
n co
nten
t, %
on
lig
nin
and
extr
activ
e fr
ee p
ulp AQ
KraftPS/AQH2SH2S/AQ
2
2,5
3
3,5
4
4,5
5
0 5 10 15 20 25 30 35 40Residual alkali, as g NaOH/L
Xyla
n yi
eld,
% o
n o.
d. w
ood External 1.
NTNUNTNUOlm thesis

Carbohydrate retention and molecular mass distribution 55
Previous techniques had problems to dissolve hemicelluloses found in softwoods and it was only possible to dissolve and analyse cellulose fibres with very low content of hemicellulose (dissolving pulps and cotton linters) or hardwood pulps. However, STFI has developed a technique for dissolution of softwood pulps but the method was not tested on softwood pulps with high varying content of glucomannan. Thus, the information obtained from the chromatograms are new.
5.4.1 Peak separation (deconvolution)A typical size exclusion chromatogram is seen in Figure 5.5. Two peaks are apparently visible. One high (HM) and one low molecular (LM) mass peak are seen in the molecular mass distribution. The two peaks are not fully separated and the tail of the high molecular mass peak and the head of the low molecular peak overlap. However, the form of the distribution may also hide several peaks. Berggren and co-workers [74] have shown that cellulose degraded with ozone is divided into two or three distributions. One high molecular, one medium molecular and one low molecular distribution. Thus, the high molecular mass area (HM) may conceal several peaks. It was chosen to separate the HM area into three distributions. The low molecular area is divided into two peaks indentified as xylan and glucomannan and the deconvolution is done using suitable peak separation software.
The recorded chromatogram for each pulp is normalized, meaning that the area under the curve is the same for all chromatograms. Thus, the area under the peak identified as glucomannan, xylan or cellulose should agree with the respective carbohydrate content found by wet chemistry methods.
The chromatograms (RI-signal vs. molecular mass) show at least two distributions, one low molecular (LM) and one high molecular (HM). There are at least two ways to separate the two fractions; a) making a sharp cut between the LM and HM zone at a certain molecular mass (e.g. 100 kg/mol or lowest value between the two distributions) or b) peak separation using deconvolution software. Peak separation using deconvolution software is best suited to separate the LM and HM distribution. The advantages and disadvantages for the different peak separation solutions are discussed in Appendix D.
For further discussions, the chromatograms are divided into five peaks assigned to xylan, glucomannan and three cellulose peaks, see Figure 5.5. Due to large differences in glucomannan in the pulps, it was possible to separate the xylan and glucomannan peaks in the molecular mass distribution. The characteristic for these distributions are given in Appendix D.

5.4 Molecular mass distributions56
5.4.2 Molecular mass of hemicellulose(s)The molecular mass of the low molecular (LM) deconvoluted peak is approximately 50 ± 10 kg/mol (DPn 320 ± 50 1). Traditionally, the DPn of hemicellulose has been estimated to 100 [5].
Figure 5.5 Typical molecular mass distribution recorded by SEC (left hand) and a 5 peak deconvolution of the chromatogram (right hand).
1. DPn: arithmetic average degree of polymerization. DPn = Molecular mass/MMonomer= MW/0.162
Figure 5.6 molecular mass distributions of glucomannan and xylan for the pulps (left-hand) and the relationship between DP and carbohydrate yield of glucomannan and xylan (right-hand).
0
0,1
0,2
0,3
0,4
0,5
1 10 100 1000 10000Molecular mass, kg/mol
RI u
nits
LMHM
M (kg/mol, relative pullulan)10 100 1000 10000
RI u
nits
0.0
0.1
0.2
0.3
0.4
Observed signal
M (kg/mol, relative pullulan)10 100 1000 10000
RI u
nits
0.0
0.1
0.2
0.3
0.4
Separated peaksObserved/sum of peaks
Xyl
GlcManCelllow
Cellmed
Cellhigh
asymmetrical peaksasymmetrical peaks
log M (kg/mol, relative pullulan)3.5 4.0 4.5 5.0 5.5
RI u
nits
0.00
0.05
0.10
0.15KraftAQPSPS/AQH2S
Xylan
GlcMan
20 60 210 660 2100
DP
0
100
200
300
400
500
0 2 4 6 8 10Yield, % on o.d. wood
DP n
Xylan
GlcMan

Carbohydrate retention and molecular mass distribution 57
It is observed that the low molecular peak is relatively higher at 40-50 kg/mol for high yield pulps compared to low yield pulps and the distribution is relative stable at 10-20 kg/mol. Since the glucomannan content in the pulps varies, glucomannan can be tentatively assigned to the high molecular area in the LM and xylan to the lowest molecular mass. The amount of glucomannan and xylan correlate well with the carbohydrate content found by enzymatic hydrolysis (see Appendix D), standard error of respectively 0.9 and 0.5 % on o.d. lignin-free pulp.
Glucomannan has an average DPn of approximately 350 ± 30 and xylan 240 ± 20. The DP of glucomannan increases to some extent for high yield pulps. However, the increase in DPn is only 13% when the yield of glucomannan is doubled from 4 to 8 %. This indicates that glucomannan needs a minimum chain length for retention. Figure 5.6shows that the average chain length of glucomannan needed for carbohydrate retention is approximately 290 (right-hand figure) and the minimum length is 100 (left-hand figure). However, the DP distribution of xylan starts at low molecular mass, only a DPn of 20 are needed for retention. The low DPn of xylan implies that xylan must be broken down into small oligomers before dissolution in kraft cooking whereas glucomannan is more easily dissolved. Only 5 pulps are analysed and further work has to be done to confirm the findings.
5.4.3 Molecular mass of celluloseCellulose has much higher molecular mass compared to hemicelluloses. The DPn of cellulose was found to be approximately 6000. However, there are differences for the different yield-increasing additives. Pulps with AQ have lower cellulose DPn compared to pulps without AQ. This seems surprising since AQ pulping gives higher cellulose yield. However, Chang [75] reported that AQ may introduce random chain cleavage due to homolytic oxidation. It is seen that the cellulose DP decreases by 100 to 200 using AQ compared with pulps cooked without AQ. However, AQ together with PS does not show the same decrease in DP. This may be due to the lower activity of AQ when sulphur is added to the white liquor due to higher sulphidity profiles (see Table 5.2).
5.5 Calculation of DP of cellulose using intrinsic viscosityViscosity measurements are usually determined to evaluate the degradation of cellulose in cooking and bleaching. However, this is only an average measurement and the recorded value can only be related to the compounds with longest chain length, cellulose. Information of hemicelluloses are lost since hemicelluloses have negligible intrinsic viscosity compared to cellulose.
DP of cellulose is often estimated using the Mark-Houvink equation [η]= K·Ma. Evan and Wallis [76] have estimated the constants using cellulose tricarbanilate for viscosity determination and light scattering for molecular mass determination. They proposed

5.5 Calculation of DP of cellulose using intrinsic viscosity58
Equation 5.1 as the best available relationship between the degree of polymerization and the intrinsic viscosity.
Equation 5.1 is probably valid for fibres with high content of cellulose such as dissolving pulp and cotton linters. The SCAN viscosity calculation is related to the total amount of pulp and not the fraction of cellulose in the pulp. For dissolving pulp and cotton linters this fraction is near 1. However, the fraction of cellulose is lower than 0.85 for pulp used in paper products. For high yield pulps, the fraction of cellulose can be as low than 0.75 and even lower for high Kappa number pulps. The contributions of pure residual lignin and hemicelluloses are minimal due to their low molecular masses and low intrinsic viscosities compared to cellulose. da Silva Perez and van Heiningen [77] illustrated this by mixing low molecular microcrystalline cellulose (MCC) in high molecular mass cotton linters. The MCC can be compared to hemicellulose with a degree of polymerization of approximately 360 and intrinsic viscosity of 121 ml/g and cotton linters with an intrinsic viscosity of 961 ml/g can be compared to cellulose in kraft pulps. The relationship between intrinsic viscosity and addition of MCC decreased almost linearly with intersection of 961 ml/g at xMCC = 0 and 121 ml/g at xMCC = 1, respectively. They deduced Equation 5.2 [77] for more correct DP determination which compensate for the cellulose fraction and low intrinsic viscosity of hemicellulose and lignin:
where both the cellulose and hemicellulose fraction of the pulp is included.
The DPs of cellulose calculated using Equation 5.2 and the DPs of cellulose determined in the SEC analysis are remarkably similar. However, using Equation. 5.1, without any hemicellulose correction, the ranking of the degree of polymerization is inverted resulting in an incorrect interpretation of the DPs. Thus, the intrinsic viscosity cannot be used as a single parameter to evaluate cellulose degradation. However, the degree of
DPv = 1.65·[η]1.111 ( 5.1 )
( 5.2 )1.111
Hemiv
Cell
(1.65[ ] 116xDPx
⎛ ⎞η −= ⎜ ⎟⎝ ⎠

Carbohydrate retention and molecular mass distribution 59
polymerization of cellulose may be estimated using intrinsic viscosity and fraction of cellulose and hemicellulose.
5.6 Concluding remarksThe reduced peeling in the early phase of the cook significantly influences the yield and content of glucomannan of the brownstock pulp at bleachable Kappa number. Polysulphide and H2S are very effective in this phase and the glucomannan yield can be boosted by up to 7 % on o.d. wood. However, the cellulose yield is more affected by the cooking time. Cooking time is influenced on sulphide ion concentration, AQ addition and the final Kappa number. Since cellulose is quite stable, the maximum yield increase of cellulose is appoximately 2 % on o.d. wood compared to a ordinary kraft pulp. The xylan yield is even more stable but the alkali profile in the cook may change the influence the xylan yield. The normal xylan yield is approximately 4 % on o.d. wood, but can be lowered to 2 % on o.d. wood at high residual alkali concentrations. The residual alkali may also change the surface xylan content.
The molecular mass distributions of cellulose and hemicellulose were determined for pulps with increased hemicellulose content using size exclusion chromatograms. One low molecular peak and one high molecular peak are found in the chromatograms and peak separation techniques are necessary for further analysis. Deconvolution by peak separation software is preferred compared to peak separation using a fixed point or separating the peaks at the lowest point between the peaks. The average DP of glucomannan is determined to 350 ± 30 and 240 ± 20 for xylan. However, it seems that glucomannan needs a minimum chain length higher than 100 for retention as opposed to xylan. The molecular mass of cellulose was found to be lower for AQ cooks compared to pulps without AQ.
Table 5.5: DP of cellulose estimated with scan viscosity without hemicellulose correction (Equation 5.1), with hemicellulose correction (Equation 5.2) and molecular mass by SEC.
SCAN DPv DPv DPn
visc. xCell xHemi Equation 5.1 Equation 5.2 SEC
Pulp ml/g · 103 · 103 · 103
Kraft 1190 0.778 0.174 4.6 6.0 5.9AQ 1165 0.775 0.178 4.5 5.8 5.7PS 1170 0.737 0.218 4.5 6.2 6.2PS/AQ 1130 0.733 0.223 4.3 6.0 6.1H2S 1115 0.708 0.246 4.2 6.1 6.3

5.6 Concluding remarks60
There may be some risks using the traditional intrinsic viscosity for determination of degree of polymerization for cellulose. However, using intrinsic viscosity and the fraction of hemicellulose and cellulose, a much more accurate estimate of the degree of polymerization of cellulose is found and it correlate well with the molecular mass of cellulose found by SEC. Thus, the correction of cellulose and hemicellulose fraction should be used when pulp degradation in pulping modification are evaluated. This may change some interpretation found in previous studies.

Indirect yield determination 61
C H A P T E R
6 INDIRECT YIELD DETERMINATION
The carbohydrate composition of the pulp is changed using different yield-increasing additives and the differences in chemical composition are measured using the method developed in Chapter 4. A new method for pulping yield estimation using the carbohydrate composition is proposed.
6.1 IntroductionThere are two ways to measure pulp yield: a direct and an indirect method. The direct pulp yield method is based on gravimetric determination on the incoming wood and the processed pulp. The indirect pulp yield methods correlate the pulp yield with black liquor or fibre properties to a pre-established calibration curve.
The industrial approach for direct determination of pulp yield is often based on the mass balance of the pulp mill digesters. Batch digesters can also use hanging baskets to determine pulp yield. Hanging baskets are placed inside the digesters and filled with a well-defined amount of wood. At the end of the delignification process, the baskets are removed from the digester and the amount of processed pulp is determined. This method requires well trained operators and auxiliary equipments.
Continuous digesters are more limited and no hanging baskets are available. Only mass balance considerations can be used and several weeks or months of wood consumption and production data have to be estimated. The long time-frame is required due to the complex and dynamic flows in a pulp or paper mill. Thus, the mass balance of the pulp mill is not suitable for short term evaluations.
It is desirable to estimate full-scale pulping yield without using mass balances. It is well known that the total pulping yield is related to the Kappa number for conventional kraft cooking at constant sulphidity and effective alkali charge [23]. For a Kappa number increase of 10, it is found that the cooking yield increases with 1.4 to 1.8 % on o.d. wood.
In the 1970s Kleppe [58] estimated the yield increase during mill trials at Peterson Linerboard, Moss using the content of mannan in pulps.

6.2 Experimental62
This relationship is useful when pulps are cooked to varying Kappa numbers at similar cooking conditions. However, the intercept is changed if major pulping variables are varied (such as wood species and usage of yield-increasing additives). Hatton [78] published an empirical method for determination of total pulping yield based on process parameters such as effective alkali (EA) and H-factor. Luthe et al. [79] reported that the predictability of this method is unsatisfactory when the yield increase is smaller than 4%. One explanation may be difficulties to estimate EA consumption when polysulphide is used (Equations 2.1, 2.2 and 2.4) to increase the yield. Consequently, a more useful model for determination of pulping yield is based on the composition of the pulp and disregard pulping conditions.
Several models for measuring pulping yield based on pulp properties have been published (58,80). Marcoccia et al. [80] found a semi-empirical method for estimating the yield in kraft pulping of Northern hardwoods on the basis on carbohydrate composition and pulp viscosity. Easty and Malcolm [81] published the "carbohydrate-lignin” or “YCell” method, which estimates the pulping yield based on the assumption of constant cellulose yield.
where Ytot and YCell are the total pulping yield and cellulose yield, respectively (based on o.d. wood), and XCell, XHemi and XLign are weight fractions of cellulose, hemicellulose and lignin, respectively.
Recently, van Heiningen et al. [82] deduced an improved "carbohydrate-lignin method" called the UoM-equation (University of Main). Some assumptions must be fulfilled in the UoM-equation: i) the secondary peeling (∆DP) has to be the same for all cooks and ii) the wood species have to be defined. Then, 1/YCell is plotted against 1/DP and a linear trend is found. The degree of polymerization (DP) varies with different delignification rates. Usage of AQ and large variation in cooking conditions such as sulphidity, alkalinity, temperature profiles and polysulphide addition are factors that influence the delignification rate resulting in failure or a large standard error of the method.
6.2 ExperimentalMost of the pulps investigated in Section 6.3 are unbleached pulps delignified to bleachable Kappa numbers. The model is also validated for bleached pulps. None of the pulps are extracted and the composition is measured as relative carbohydrate composition based on lignin-free o.d. pulp. More details of the pulps and pulping conditions are found in Chapter 3. The determination of carbohydrate composition is described in Chapter 4.
( 6.1 )
LignCell Hemitot Cell Cell
Cell Cell
X(X X )Y Y YX X+
= +

Indirect yield determination 63
6.3 Pulp yield determination
6.3.1 Pitfalls in direct yield determinationGravimetric analysis of chips and pulp is the most useful method for yield determination in batch digesters and in laboratory cooks. However, there are some pitfalls with this method. It is worth to noticing that the wood chips used in direct yield determination methods have to be dried to a defined dry matter content, preferably above 90 %. This is to assure that the amount of chips is well known. Variable dry matter content in the wood chips are found in fresh or only partly air-dried chips. The reason is that heartwood and sapwood have different dryness content and trees have different dry matter content due to growth conditions or storage time. Thus, the best way to determine the amount of wood chips is to dry the material. Determination of the manufactured pulp is also a challenge. The pulp can be oven dried but this will destroy the pulp before handsheet testing. Another way is to centrifuge or press the pulp to an even dryness above 25 %.
6.3.2 Indirect pulp yield determinationFor continuous digesters there are no suitable methods to determine pulp yield directly other than the mass balance of the pulp mill.
Indirect pulp yield determination is often used and the most used method is the relationship between yield and Kappa number. Figure 6.1 shows the linear correlation between the lignin-free yield and the Kappa number. Increasing the Kappa number by 10, the total yield increases approximately between 1.4 to 1.8 on o.d. wood. However, a large part of this cooking yield increase is lignin, and the lignin-free yield increase is only 0.7 to 0.9 % on o.d. wood. The disadvantage of using the yield vs. Kappa number relationship is that cooking conditions other than the cooking time have to be constant. For large differences in cooking conditions (e.g. addition of yield-increasing additives etc.), new yield vs. Kappa number relationships have to be developed. This can be seen as curves with different intercept in Figure 6.1.

6.3 Pulp yield determination64
Knowing the amount of additives, the yield increase can be modeled using the pulps described in section 3.2. Equation 6.2 quantify the effect of the yield-increasing additives.
where AQ and PS are in % on o.d. wood and H2S = 1 if used, otherwise H2S = 0. The assumption in this equation is that the liquor-to-wood ratio in the batch digester was 3.5.
6.3.3 Yield estimation for cellulose and hemicelluloses
Cellulose. Figure 5.2 indicates that the glucomannan yield and the yield increase is almost linear at higher yield increases. However, the correlation has limited application at yield increase less than 2 % on o.d. wood. At lower yield increase, the cellulose yield and to some extent xylan yield may contribute to a significant part of the total yield increase.
The cooking time may influence the cellulose degradation (see Figure 5.3) due to secondary peeling in the residual phase. Usually, the H-factor is used for delignification rate comparisons. Unfortunately, the relationship between Kappa number and H-factor varies for different digesters making it hard to compare pulps from different laboratories or digesters and this parameter may be unsuitable for general cellulose yield estimation. In addition, the H-factor is not measured directly for the pulp, but from the temperature and time profile obtained during cooking. Using the same digester with a wide range of cooking parameters, the standard error (RMSE) for cellulose yield estimation using only H-factor as the explanatory variable was 0.43 % on o.d. wood1.
Figure 6.1 Lignin-free pulp yield increases at increased Kappa number. Using yield-increasing additives, the relationship is displaced parallel to the standard kraft pulp curve.
YLign-free = 10·AQ + 1.6·PS + 5·H2S + 0.078·(Kappa - 30)RMSE = 0.6 % on o.d. wood
( 6.2 )
-2
0
2
4
6
8
20 30 40 50Kappa number
Lign
in-fr
ee y
ield
incr
ease
, % o
n o.
d. w
ood
KraftAQPSPS/AQH2SH2S/AQ

Indirect yield determination 65
As mentioned in Section 5.3, the Kappa number and the addition of AQ influence the cellulose yield. The cellulose yield can be estimated using these two significant parameters (p<0.05). The cellulose content of the pulp cannot be used as an explanatory variable for cellulose yield estimation. However, the cellulose yield varies for different wood species. As seen in Figure 5.2, the increase in cellulose yield is approximately 2-3 % and this emphasizes the fact that the Ycell-method has its limitations.
where ∆YCell is the change of cellulose yield (% on o.d. wood) and ∆Kappa number is the difference in Kappa number compared to a reference kraft pulp at Kappa number 30.
To justify the factor 3.5, it is necessary compare the relationship between AQ addition and total yield. As a rule of thumb, the total yield of AQ cooks is increased 10 times the amount of AQ added to the cook (see also Equation 6.2). As mentioned in Tables 5.3 and 5.4, approximately 35 to 50 % of the yield increase using AQ is due to increased cellulose yield. Thus it is expected that the factor is between 3.5 and 5.0.
The range of Kappa numbers studied in this work was above 20. Below 20, the cellulose yield loss is probably increasing. The relationship between yield and Kappa number diverge at low Kappa numbers and the slope of the curve increases rapidly indicating higher loss in carbohydrate yield. Thus the factor should be increased from 0.024 to at least 0.048 or even as high as 0.1 at very low Kappa numbers (below 15). This is not studied in this work, but empirical data [83] confirm that the loss of brownstock yield below Kappa number 20 is high.
The use of van Heiningen’s DP calculation (Equation 5.2, [77]) gave a slightly improved cellulose yield estimate1. However, the modified DP calculation was only determined for a small number of pulps making the estimation less universal due to the small selection of pulp tested. The UoM equation is not valid for these pulp series. Lower ∆DP (the rate of secondary peeling of cellulose) for AQ-cooks compared to reference kraft cook indicate that the cellulose yield is increased as stated in Section 5.3. The application of the UoM-equation was unsuccessfully implemented due to failure of the ∆DP assumption.
Glucomannan and xylan. At lower pulp yield increase, both the glucomannan yield, cellulose yield and in some cases xylan yield contribute significant to the yield gain. However, at higher yield increase, the glucomannan yield and in some cases xylan yield become the dominant factor. The yield of glucomannan can be described by only
1. ∆YCell = -0.0027·H-factor + 3.41; RMSE = 0.43 % on o.d. wood
∆YCell = 3.5·AQ (% on o.d. wood)+ 0.024·∆Kappa numberRMSE = 0.50 %
( 6.3 )
1. ∆YCell = 0.00101·DP - 5.52; RMSE = 0.44 % on o.d. wood
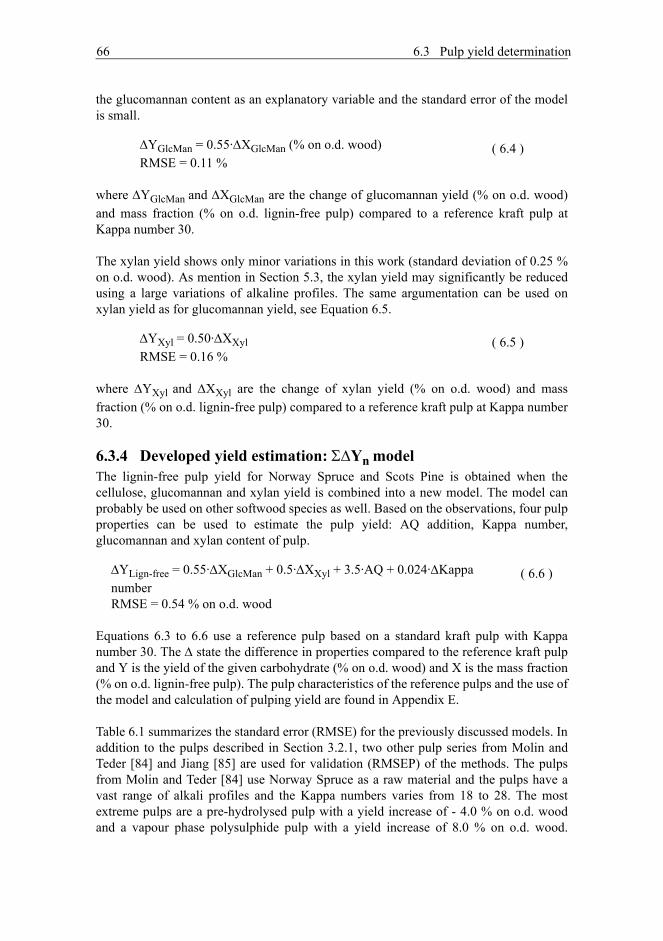
6.3 Pulp yield determination66
the glucomannan content as an explanatory variable and the standard error of the model is small.
where ∆YGlcMan and ∆XGlcMan are the change of glucomannan yield (% on o.d. wood) and mass fraction (% on o.d. lignin-free pulp) compared to a reference kraft pulp at Kappa number 30.
The xylan yield shows only minor variations in this work (standard deviation of 0.25 % on o.d. wood). As mention in Section 5.3, the xylan yield may significantly be reduced using a large variations of alkaline profiles. The same argumentation can be used on xylan yield as for glucomannan yield, see Equation 6.5.
where ∆YXyl and ∆XXyl are the change of xylan yield (% on o.d. wood) and mass fraction (% on o.d. lignin-free pulp) compared to a reference kraft pulp at Kappa number 30.
6.3.4 Developed yield estimation: Σ∆Yn modelThe lignin-free pulp yield for Norway Spruce and Scots Pine is obtained when the cellulose, glucomannan and xylan yield is combined into a new model. The model can probably be used on other softwood species as well. Based on the observations, four pulp properties can be used to estimate the pulp yield: AQ addition, Kappa number, glucomannan and xylan content of pulp.
Equations 6.3 to 6.6 use a reference pulp based on a standard kraft pulp with Kappanumber 30. The ∆ state the difference in properties compared to the reference kraft pulp and Y is the yield of the given carbohydrate (% on o.d. wood) and X is the mass fraction (% on o.d. lignin-free pulp). The pulp characteristics of the reference pulps and the use of the model and calculation of pulping yield are found in Appendix E.
Table 6.1 summarizes the standard error (RMSE) for the previously discussed models. In addition to the pulps described in Section 3.2.1, two other pulp series from Molin and Teder [84] and Jiang [85] are used for validation (RMSEP) of the methods. The pulps from Molin and Teder [84] use Norway Spruce as a raw material and the pulps have a vast range of alkali profiles and the Kappa numbers varies from 18 to 28. The most extreme pulps are a pre-hydrolysed pulp with a yield increase of - 4.0 % on o.d. wood and a vapour phase polysulphide pulp with a yield increase of 8.0 % on o.d. wood.
∆YGlcMan = 0.55·∆XGlcMan (% on o.d. wood)RMSE = 0.11 %
( 6.4 )
∆YXyl = 0.50·∆XXylRMSE = 0.16 %
( 6.5 )
∆YLign-free = 0.55·∆XGlcMan + 0.5·∆XXyl + 3.5·AQ + 0.024·∆Kappa numberRMSE = 0.54 % on o.d. wood
( 6.6 )

Indirect yield determination 67
Jiang’s pulps are made from Southern Pine with or without polysulphide. The range of Kappa numbers are from 12 (extended cooks) to a normal 28 and the yield increase is from -2.3 to 2.5 % on. o.d. wood. For pulps below 20, the Kappa number factor in Equation 6.6 is increased to 0.048 instead of 0.024. The UoM equation is not evaluated due to invalid assumption (different ∆DP). As seen in Table 6.1, the ∆YCell is hard to determine exactly and the ∆YCell will not exceed 2 % on o.d. wood. A better model for cellulose yield estimation is needed for more accurate yield estimation.
It is shown that the accuracy for the Σ∆Yn model is acceptable and is valid for most pulping conditions. The standard error of the model can be explained by the poor estimation of cellulose yield. Further work has to be done to bring down the standard error for cellulose yield. The usage of van Heiningen’s cellulose DP evaluation of pulp is probably one way to improve the cellulose yield estimation.
Table 6.1: RMSE and RMSEP for different yield models for brownstock pulps, % on. o.d. wood. Data for reference pulps are given on page 131
ModelRMSEThis worka
a. 59 pulps of Norway Spruce and Scots Pine.
RMSEP Molinb
b. 10 Norway Spruce pulps.
RMSEP Jiangc
c. 6 Southern Pine pulps.
∆YCell 0.50 0.63 0.41
∆YGlcMan 0.11 0.13 0.16
∆YXyl 0.19 0.28 0.11
YCell method 0.70 1.64 0.82
GlcMan method 0.67 1.13 1.45
Σ∆Yn model 0.54 0.55 0.52

6.4 Concluding remarks68
Some carbohydrates are lost in bleaching and the bleached yield is approximately 1 % lower on o.d. wood for the lignin-free pulp yield compared to the lignin-free yield for brownstock pulps, see Table 6.2. The carbohydrate composition of the reference pulp is not significantly changed in an ECF bleaching sequence. Thus, it is possible to use Equation 6.6 to calculate the pulping yield of bleached pulps in addition to brownstock pulps. Figure 6.2 visualizes the fit of the models based on the different pulp series. In Appendix E, the evaluation of the Σ∆Yn model on bleached pulp samples is shown and the fit is seenon the right of Figure 6.2.
6.4 Concluding remarksBrownstock pulping yield can be estimated using three pulp properties; Kappa number, glucomannan and xylan content of pulp in addition to a contribution for usage of AQ, see Equation 6.6. The main error in the yield determination originate from the uncertain cellulose yield determination. Further work has to be done to minimize the standard error
Figure 6.2 Use of the Σ∆Yn model for the pulps in Table 6.1.
Table 6.2: Pulping yield of brownstock and bleached softwood pulps
Brownstock Bleached
Species YLign-freea
a. YLign-free = Ytot·(1-0.00147·Kappa number)
Kappa no. YBl.
Norway Spruce 46.6 30 45.2
Scots Pine 44.1 30 43.1
Southern Pine 44.2 27 43.5
-6
-4
-2
0
2
4
6
8
10
-6 -4 -2 0 2 4 6 8 10
Estimated lignin-free pulp yield, % on o.d. wood
Mea
sure
d lig
nin-
free
pulp
yie
ld, %
on
o.d
. woo
d
JiangVaalerMolin
y = x
Brownstock pulps
-6
-4
-2
0
2
4
6
8
10
-6 -4 -2 0 2 4 6 8 10
Estimated bleached pulp yield, % on o.d. wood
Mea
sure
d bl
each
ed p
ulp
yiel
d, %
on
o.d
. woo
d
Jiang
Vaaler
y = x
Bleached pulps

Indirect yield determination 69
for cellulose yield estimation. The model seems to be robust and can be used on several softwood species.

6.4 Concluding remarks70

The influence of hemicellulose content on handsheet properties 71
C H A P T E R
7 THE INFLUENCE OF
HEMICELLULOSE CONTENT ON HANDSHEET PROPERTIES
7.1 IntroductionIn this chapter fibre flexibility, load-elongation properties and other strength properties are discussed for several bleached pulp series with different wood properties and hemicellulose content.
7.1.1 Fibre flexibilityFibre flexibility is an essential property for sheet formation and the sheet properties, i.e. formation of bonds, consolidation and fibre collapse during drying. Thus, the fibre flexibility defines the strength and optical sheet properties.
There are no standardized methods for direct determination of wet fibre flexibility. Two of the best methods to directly measure the wet fibre flexibility are the Steadman method [86] and the Tam Doo & Kerekes method [87], see Appendix F. for details regarding the methods.
Indirect measurement can be used for the determination of fibre flexibility. Swelling of fibres make the fibre wall less rigid and the fibre flexibility increases. The WRV value is a measuring method for swelling. The relationship between WRV and fibre flexibility is unambiguous, se Figure 7.1 (left). Another indirect measuring method for fibre flexibility is the apparent density [86]. Flexible fibres form a denser sheet compared to less flexible fibres and the development in sheet density can be related to the change in fibre flexibilty, see Figure 7.1 (right). The relative bonded area (RBA) do also correlates well with the wet fibre flexibility [88] but the analysis technique is more extensive compared to the sheet density. The sheet density is also affected by the collapsibility of the fibres. Fibres collapse easily during kraft pulping and papermaking. Both Page [89] and Paavilainen [90] found that over half of all fibres collapse during pulping and even

7.1 Introduction72
more after beating. Thus, most beaten fibres are collapsed and the variation in collapsibility has less effect on the conformability.
The sheet density of unbeaten or beaten fibres to given PFI revolutions is probably the easiest way to evaluate the fibre flexibility. However, some parameters influence the measurement. Large differences in fibre length, fines or kinks and curls alter the sheet density. When fibre flexibility is measured, the fines should be removed. However, fines are important for the load-elongation of paper and handsheets with fines are preferred for testing even though the fines affect the sheet density. Unbeaten measurement can also be difficult to evaluate due to variation of kinks and curls in pulp series. A large number of these kinks and curls are easily straightened and have no impact when the pulp is beaten in the laboratory (PFI mill). A large difference in kinks and curls may be observed for unbeaten pulps but the fibres are straightened during beating. Thus, the sheet density of a beaten pulp (e.g. 2000 revs PFI) correlates better with the fibre flexibility compared to the unbeaten sheet density.
Sheet strength is dependent on sufficient contact for adjacent fibres in order to form fibre-to-fibre bonds. The ability of fibres to form these fibre-to-fibre bonds is called fibre conformability and is mainly determined by the wet fibre flexibility and fibre collapsibility. Both the fibre flexibility and collapsibility are dependent on the fibre wall thickness, fibre width [90] and fibre wall elasticity. The four most important factors for fibre flexibility development are fibre wall thickness, hemicellulose content, drying, and beating.
Fibre wall thickness. Figure 7.2 illustrates that the coarse fibres consolidate poorer compared to more thin-walled fibres. Paavilainen [90] has shown that the wet fibre flexibility increases with decreasing fibre wall thickness (see Appendix F). The close correlation between flexibility and fibre wall thickness makes the fibre wall thickness
Figure 7.1 The relationship between wet fibre flexibility on WRV (left) and sheet density (right) [90].

The influence of hemicellulose content on handsheet properties 73
one of the most important properties for sheet strength. Flexible fibres are important in the formation of fibres into a network and thus the contact area for adjacent fibres that form fibre-to-fibre bonds.
In order to determine the fibre wall thickness it is measured using microscopic techniques. However, the resolution of light microscopes makes it impossible for accurate fibre wall thickness determination. Electron microscopes can be used but the technique is extensive and the coarseness is often determined as a substitute. Braaten and Molteberg [43] have deduced a formula for calculating the average wood cell wall thickness (Equation 7.1)
where C is coarseness (µg/m), D is the dry wood density (kg/m3), CD is the density of cell wall in wood (1500 kg/m3), Y is the pulp yield of chemical pulp and FWT is the fibre wall thickness (µm). The fibre wall thickness in softwood is always a distribution of realtively thin-walled earlywood and thick-walled latewood fibres. This also reflects the wood density since earlywood and latewood have large differences in basic wood density.
Fibre wall thickness influences the surface roughness of paper, seen in the right-hand picture in Figure 7.2. Coarse fibres in the surface area of the paper increase the roughness resulting in poor printing quality. Thus, a high portion of coarse fibres is destructive for printing papers.
Beating. Beating is very important for the development of fibre flexibility. Several effects on the fibre structure have been proposed in the literature and Page [92] has
Figure 7.2 Implication of fibre flexibility on sheet cross-section of more thick-walled Douglas Fir (left) and more thin-walled Western Red Cedar (middle). Notice the uncollapsed coarse fibres in both sheet cross-section and paper surface (right). Figures are taken by Weigel [91].
( 7.1 )
FWT 12--- 1000 C
Y D⋅------------ 1000 C CD D–( )⋅ ⋅
CD Y D⋅ ⋅------------------------------------------------–⎝ ⎠
⎛ ⎞=

7.1 Introduction74
written an excellent review of the beating of chemical pulps. Delamination, external fibrillation with fines production and hemicellulose redistribution and gel formation are important fibre structure changes obtained during beating.
Delamination, also called swelling or internal fibrillation, may be the most important and also the most extensively studied beating effect. Most studies have used water absorption ability to measure the delamination and swelling effect of the fibre. The increase of water absorption is caused by loosening the layers in the fibre wall. Thus, beating introduces large pores (10-100 nm) [27, 93] and cracks (>0,1 µm) [94, 95], see Figure 7.3. Both pores and cracks improve the flexibility of the fibre wall.
The degree of polymerization (DP) of the hemicellulose in pulp may influence the delamination. Hemicelluloses with low DP are believed to form a weaker matrix compared to pulp with high DP in the hemicellulose. This may explain some of the differences between sulphite pulps and kraft pulps. Fibre wall thickness is usually increased due to the swelling. Kibblewhite [26] has reported an increase of 5-30 % during beating.
High shear forces either from beater bars or other fibres can tear small fragments off from the fibre wall. For chemical pulps, the fines are produced principally from the P and S1 layers in the fibre wall, and it is only after extensive beating that fragments from the S2 layer are released. The amount of fines produced in beating is determined by the fibre type and beating action. For example, sulphite pulps produce fines that are more easily compared to kraft pulps [96]. In addition, industrial refining with high shear rate and specific edge load produces more fines compared to laboratory beating (i.e. PFI mill) [97]. Material from the fibre wall may also loosen without being completely removed. This external fibrillation is promoted at a low shear rate and external fibrilation is desirable due to higher retention and good strength properties compared to fines production [92].
Figure 7.3 Principle drawing of the development of pores and cracks in chemical pulp. Adapted and slightly modified from Page [92]. The development of the cracks is roughly estimated from micrographs from the literature [94, 95] and the pores are measured by Stone et al. [93].
Unbeaten
Beaten
Pores
Cracks
Freq
uenc
y di
strib
utio
n of
por
e si
zes
5 50 500
Pore size, nm

The influence of hemicellulose content on handsheet properties 75
Changes in the molecular structure of the surface may also occur during beating. Several theories are proposed and it is suggested that the result is a gelatinous layer of “molecular fuzz” on the surface providing improved fibre-to-fibre bonding [98].
The fibre wall elasticity is affected by the amount of water in a fibre wall. Increased hemicellulose content in the fibre wall [88] and beating may change the fibre wall elasticity and drying of fibres decreases the ability of fibres to obtain water. External fibrillation also occurs during beating and this changes the surface of the fibre wall resulting in better bonding ability. Formation of fines may also occur since some of the external fibrils are loosened.
Hemicellulose content and drying. Market pulp is usually dried before shipping to the customer. Drying has considerable impact on the fibre wall structure. When chemical fibres are dried, there is a loss of fibre swelling which is known as hornification [99]. The difference in WRV for never-dried and rewetted once-dried pulp increases with decreasing pulping yield [100].
Drying of pulp causes permanent closure of large pores in the fibre wall [27, 93]. Small micropores with a diameter less than 25 Å do not collapse permanently during drying. However, macropores larger than 25 Å and especially larger than 100 Å collapse irreversibly during drying. This may indicate that adjacent cellulose fibrils form bonds that are stable and are not broken by water. This can also be seen as an increase in macrofibril size for once-dried pulp compared to never-dried pulp [30], see Figure 7.4. The reorganization of fibrils to larger aggregates, may increase the crystallinity of the pulp [101]. However, the loss of amorphous material during rewetting and disintegration of once-dried pulp must be taken into consideration when the crystallinity is evaluated [102].
The content of hemicellulose can play an important role in hornification. Giertz [103] suggested that the main part of the hornification is due to formation of irreversible hydrogen bonds between fibre surface hemicellulose-molecules. However, later research [104, 105] has shown that hornification is promoted when hemicellulose is removed from the pulp. Oksanen et al. [104] selectively removed glucomannan and xylan, respectively. Pulps with less hemicellulose had a larger decrease in swelling during drying compared to pulps with a normal level of hemicellulose. The removal of both xylan and glucomannan yield the same result. This indicates that the carboxylic acids in xylan are of no importance in hornification. Cao et al. [105] extracted xylan from the pulp with alkaline treatment. They found that hornification of the pulp increases with decreasing content of xylan. Spiegelberg [106] found that the crystallinity increased during drying when he removed hemicellulose from the pulp. It was postulated that cellulose-hemicellulose bonds were replaced by cellulose-cellulose bonds during drying with decreasing hemicellulose content.

7.1 Introduction76
.
Fibre wall thickness decreases significantly during drying. Kibblewhite [26] reported that rewetted dried fibres have a fibre wall thickness that is 20-30 % lower compared to never-dried fibres. Here, the fibre width is unchanged but due to lumen collapse the fibre thickness1 decreases to approximately half of the value of the never-dried fibre.
Chen and Willliams [107] found that the fibre wall is less rigid for high-yield polysulphide pulps compared to the reference kraft pulp.
7.1.2 Load-elongation propertiesA typical load-elongation curve for a handsheet sample dried under restraint is seen in Figure 7.5. The tensile index and extensibility (elongation at rupture) define the end-points of the load-elongation curve. Seth [108] has stated that high tensile strength is achieved for straight, flexible and conformable fibres with few dislocations. It is also well known that tensile strength increases for bleached pulps using yield-increasing additives [64,84,85,107]. The influence of hemicellulose content on load-elongation properties is worth investigating.
The extensibility is dependent on the “stretch-potential” of the fibres and this potential is only realized when the fibres are well bonded in the sheet network [108]. For weak fibre bondings, the network fails before the potential is realized. Increasing the network fibre bonds and the stretch-potential of fibres is increasingly being realized. At the same time
Figure 7.4 Fibril aggregate dimensions of chlorite delignificated and acidic hydrolysed kraft pulp measured with CP/MAS 13C NMR. The content of hemicellulose is measured before chlorite delignification and acidic hydrolysis. Data from Hult et al. [30].
1.
Hemicellulose content, % on o.d. pulp8 12 16 20 24
Fibr
il ag
greg
atio
n di
men
sion
, nm
12
16
20
24
Once-dried pulpNever-dried pulp

The influence of hemicellulose content on handsheet properties 77
the tensile strength increases. Thus, factors that increase the fibre flexibility also increase the bonded area between fibres and increase the extensibility of the sheet.
Fibril angle and the fraction of axial compressed fibres influence the stretch-potential of the fibres. The fibril angle is fixed by nature and normally this factor cannot be varied. However, some misalignments may be pulled out when sheet is strained since the matrix starts to flow. More important is the formation of microcompressions when the fibres are axial compressed. This happens during chipping and pulping when the fibres are exposed to mechanical stresses. Microcompressions are particularly formed in medium and high consistency mechanical treatments. Not all fibres have the same ability to form microcompressions and swollen or more thick-walled fibres resist axial compressions to some extent.
The number of active fibre segments in the sheet is expressed by the modulus of elasticity (recalculated to tensile stiffness index). Active fibre segments can be defined as segments which endure a load when the sheet is stretched as opposed to passive fibre segments. The activation of fibre segments is promoted by the swelling of fibres. More swollen fibres have a higher potential for transversal shrinkage. Since fibres are fixed in the network before the water is evaporated, the shrikage during drying straightens the fibre segment between the fibre bonds and the fibre segments become active. The modulus of elasticity is determined by the swelling of the fibres, the number of fibre bonds, the fibre form and resistance axial compression of the fibre segments between the bonds, see Figure 7.2.
Figure 7.5 Load-elongation curve for restrained handsheet of a laboratory made kraft pulp.
0
10
20
30
40
50
60
70
80
90
0 1 2 3 4Elongation, %
Load
, Nm
/g
modulus of elasticity
Extensibility
Tensile index

7.2 Experimental78
7.1.3 Other strength propertiesThe tear index has had a central position in the development of pulp and paper grades and the theoretical foundation for the tear index is feeble. However, the tear index is usually explained by the balance of fibre strength and bonding strength. At low bond strength, the out-of-plane energy pulls fibres out of the sheet network. For flexible fibres with high bonding strength, more of out-of-plane energy has to be absorbed by the fibres resulting in fibre break. Thus, the highest tear strength is usually obtained for unbeaten or low beaten pulps where the balance between fibre strength and bonding strength is optimal. As a result, the fibre length of pulp influences the tear index. The relationship between tear index and tensile index is often used to compare pulp.
Some studies have been done to investigate the effect of polysulphide addition on handsheet properties. The addition of polysulphide increases the hemicellulose content and a decrease in the tear index for pulps with increased hemicellulose content is reported [64,84,85,107]. The decrease in tear strength for pulps with a high content of hemicellulose is probably the main reason why yield-increasing methods are not widely accepted. However, some studies have found that H2S pre-treated pulps have a tear strength that is comparable to a normal kraft pulp [41,110] while others show that the H2S pre-treated pulps have similar handsheet properties to polysulphide pulps [67,111]. At the same time, the beatability defined as the beating energy required to obtain a given tensile index is improved.
The main object was to vary the hemicellulose content of some softwood pulps with defined wood raw material. Thus, the effect of fibre wall thickness, beating, chemical composition and drying on handsheet properties can be investigated.
7.2 ExperimentalIn this work, 21 fully bleached pulps are studied and they are divided into three pulp series. The pulp series are made of two assortments of Norway Spruce round woood
Figure 7.6 Microcompression at fibre crossing (left) and mechanism for fomation of microcompression during drying (right). Figures are taken from Niskanen [109].

The influence of hemicellulose content on handsheet properties 79
lumber (8 and 6 pulps) and one assortment of Scots Pine round wood lumber (7 pulps) in addition to a Norway Spruce pulp series with 3 pulps. The various series from round wood lumber have relatively similar fibre wall thickness. It is attempted to keep the fibre dimension distributions as constant as possible for these assortments and in the determination of fibre dimensions it is only necessary to confirm that the wooden raw material in each pulp series is more or less equal.
Two of the series have an increase of yield of up to 4 % on o.d. wood while one has up to 8 % on o.d. wood. All pulps are once-dried and 4 to 6 levels of PFI beating are tested for each pulp. However, four pulps are also tested in the never-dried condition. In addition a never-dried unbeaten pulp series made of White Spruce reported by Chen and Willimans [107] is added for comparison when the same parameters are measured.
The cross sectional analysis of fibres is measured according to Reme et al. [42].
7.3 Wood properties and fibre wall thickness for the pulp seriesThe main purpose of the determination of wood properties and fibre dimensions for the pulp series is to confirm the homogeneity of the raw material. Only pulps that can be regarded as comparable are included in each pulp series for further testing. Several pulp series from different wood material are tested and evaluated. In addition, the effect of fibre wall thickness on handsheet properties is discussed.
Basic wood density may be one of the easiest and best ways to characterize wood properties. It is defined as the o.d. wood weight divided by the green volume of the wood and the value may say something abount the fraction of earlywood and latewood in the wooden raw material.
Table 7.1: Pulp series used in the Chapter 7
Raw materialNo. of pulps
Pulp yield, % on o.d. wood
Laboratory Remarks
Norway Spruce 8 44.8 to 49.4 External RoundwoodScots Pine 10 43.1 to 47.4 External RoundwoodNorway Spruce 5 45.1 to 49.0 External Saw mill chipNorway Spruce 2 46.8 to 49.7 External RoundwoodNorway Spruce 6 45.1 to 53.2 NTNU Roundwood

7.3 Wood properties and fibre wall thickness for the pulp series80
The basic wood density is shown in Table 7.2 and especially the Spruce pulp series processed at NTNU has unexpected high basic density compared to the other roundwood pulps. The wood used in this pulp series is from the middle of Scandinavia compared to the other series which is from the south of Norway. The differences in region and growth conditions for the pulp series may result in changes in the properties of earlywood and latewood.
Pulps do always consist of a distribution of fibres and typical fibre wall thickness distributions for Spruce pulp is seen in Figure 7.7. Other fibre dimensions have similar distributions. This is important to remember when average values of fibre distributions are evaluated since the shape of the distributions may deviate from sample to sample. Both shapes and amplitudes of the distribution may vary in and between wood species. Figure 7.7 presents two Spruce pulps using different raw materials (from rows 1 and 3 in Table 7.2) and the shape of the distribution is quite similar but the amplitudes vary. One of the peaks can be assign to earlywood and the other to latewood.
Table 7.2: Basic density of the wood used in Chapter 7.
Raw materialNo. of pulps
Basic density,kg/m3
Laboratory Remarks
Norway Spruce 8 394 External RoundwoodScots Pine 10 385 External RoundwoodNorway Spruce 5 403 External Saw mill chipsNorway Spruce 2 390 External RoundwoodNorway Spruce 6 406 NTNU RoundwoodScots Pine 2 419 External Saw mill chips
Figure 7.7 Fibre wall thickness distribution pulps from Spruce round wood and sawmill chips. The distributions are normalized.
0
0,1
0,2
0,3
0 1 2 3 4 5 6 7Fibre wall thickness, µm
Freq
.
Saw mill chipsRound wood
Latewood
Earlywood

The influence of hemicellulose content on handsheet properties 81
Fibre wall thickness (FWT) and fibre width (FW) determinations by micoscope techniques are time-consuming procedures. Thus, less complex methods for estimation of the FWT and FW are needed. Braaten and Molteberg [43] have deduced an equation for estimation of the weighted FWT average, see Equation 7.1. The inputs in this equation are dry density (or fibre saturation point and basic density) of the wood, pulping yield and fibre coarseness. Figure 7.8 shows that the derived FWT and FW correlates well with the estimated FWT and FW. Therefore, the estimated FWT and FW can be used further in the work.
Fibre wall thickness and fibre width are unchanged for fibres with increased hemicellulose content (Appendix F) and the fibre wall thickness of each pulp series is shown in Table 7.3. Also, the fibre width for a given raw material seems to be constant for unbeaten pulps with different hemicellulose content. Organic material is dissloved from the fibre wall during cooking. As a result, the coarseness increases at higher pulping yield. Usually the interpretation of increased coarseness gives coarser and stiffer fibres with higher fibre wall thickness compared to fibres with low coarseness. However, using the equation of Molteberg and Braaten [43], the fibre wall thickness of the pulps is unchanged even though the coarseness increases. When comparing pulps with varying pulp yields, the coarseness should be standarized to a given pulping yield or hemicellulose content, see Figure 7.9.
Figure 7.8 Left: Correlation between measured fibre wall thickness (FWT) by SEM and Braaten and Molteberg’s estimation [43]. Right: Correlation between fibre width (FW) by SEM and estimated FW. For SEM fibre width the perimeter of the cross is divided by 4.
1,75
2
2,25
2,5
2,75
3
1,75 2 2,25 2,5 2,75 3Estimated FWT (Equation 7.1), µm
Mea
sure
d FW
T(SE
M),
µm
Norway SpruceScots Pine
RMSE = 0.09 µm
22
24
26
28
30
32
22 24 26 28 30 32Estimated FW (C, BD, Yi), µm
Mea
sure
d FW
(SEM
), µm
Norway SpruceScots Pine
RMSE = 0.9 µm

7.3 Wood properties and fibre wall thickness for the pulp series82
Figure 7.9 The relationship between hemicellulose content and coarseness. The curves indicate the theoretical coarseness corrected for pulp yield increase.
Table 7.3: Bleached pulp series used in Chapter 7.
Raw materiala
a. code: Raw material + Fibre wall thickness
No. of pulps
Fibre wall thicknessa
µmAdditives
Pulp yield, % on o.d. wood
Laboratoryb
b. External 1 and NTNU pulp series are pressed in bleaching sequence for dewatering. External 2: dewatering through centrifugation.
Remarks
Norway Spruce
8 2.12 ± 0.07
Kraft, AQ, PS and PS/AQ
44.8 to 49.4
External 1 Round wood
Scots Pine
10 2.21 ± 0.03
Kraft, AQ, PS and PS/AQ
43.1 to 47.4
External 1 Round wood
Norway Spruce
3 2.43 ± 0.03
Kraft, AQ and PS/AQ
45.8 to 49.0
External 1 Saw mill chipSame raw material
Norway Spruce
2 2.43 ± 0.03
Kraft, AQ and PS/AQ
45.1 External 2
Norway Spruce
2 2.05 ± 0.02
AQ and PS/AQ 46.8 to 49.7
External 2 Round wood
Scots Pine
2 2.56 ± 0.02
Kraft 44.2 External 1 Saw mill chip
Norway Spruce
6 (4)
2.16 ± 0.03
Kraft, AQ, PS, PS/AQ, H2S and H2S/AQ
45.1 to 53.2
NTNU Round wood(+ never-dried)
120
140
160
180
200
220
240
10 15 20 25 30Hemicellulose, % on o.d. pulp
Coa
rsen
ess
(FQ
A),
µg/m
Spruce, FWT 2.12 µmSpruce, FWT 2.16 µmPine, FWT 2.21 µmSpruce, FWT 2.43 µmWhite spruce, Chen & Williams
lines:theoretical coarseness due to increased pulp yield

The influence of hemicellulose content on handsheet properties 83
In addition to fibre wall thickness, the light scattering coefficient can be used to evaluate fibre dimensions. Light is scattered in phase transitions between fibre the surface and air and this effect can be used to examine the fibre dimensions. The number of phase transitions are dependent on sheet density and fibre surface area of the fibres. Beating of fibres increases the fibre flexibility and sheet density whereas the scattering coefficient decreases due to reduced fibre phase transitions. Thus, knowledge of the fibre dimensions can be obtained when the light scattering coefficient is evaluated at a constant sheet density. For fibre distributions with a relatively high fibre wall thickness and wide fibres, the fibre surface area is relatively low and the number of phase transitions is lower compared to fibre distributions with low fibre wall thickness and narrow fibres. The result is that coarse fibres have a much lower light scattering coefficient at constant sheet density compared to slender fibres (see Figure 7.10).
However, some factors such as collapsibility and pore size distribution may reverse the effect of fibre dimensions on the light scattering. Ribbon-like, collapsed fibres do not have any lumen that scatter the light and this reduces the light scattering coefficient. Fibres with equal fibre wall thickness may collapse differently due to a different micro fibril angle or chemical composition of the fibre wall. The pore morphology may also affect the light scattering. The left-hand part of Figure 7.10 shows the relationship between light scattering and fibre wall thickness of the different pulp series. It is indicated that the Pine pulps have a higher light scattering coefficient compared to the Spruce pulps. Both the collapsibility and the pore size distribution of Pine pulps may explain the difference in the light scattering coefficient.
7.4 Fibre flexibilityFibre flexilility, defined as sheet density, is mainly influenced by fibre dimensions, fines, chemical composition, drying and mechanical treatment (beating, dislocations etc.).
Figure 7.10 The relationship between light scattering coefficient at sheet density 700 kg/m3 and fibre wall thickness.
14
16
18
20
22
24
26
1,8 2 2,2 2,4 2,6
Fibre wall thickness, µm
Ligh
t sca
tt.c
oeff
. at d
ensi
ty 7
00kg
/m3
Spruce, FWT 2.12 µmSpruce, FWT 2.16 µmSpruce, thick-walled Pine, FWT 2.21 µmPine, thick-walled
Spruce Pine

7.4 Fibre flexibility84
Apparent sheet density at a constant wet web pressure and beating degree can be related to the fibre flexibility.
7.4.1 BeatingBeating increases the fibre flexibility by internal delamination or swelling of the fibre wall. The increased swelling straightens the fibres and increases the fibre flexibility which makes the sheet denser. The formation of fines and external fibrils may also contribute to stronger interactions between fibres.
Figure 7.11 shows typical developments in sheet density during beating. However, some transformation of the beating energy is needed for interpolation. The easiest transformation is the logarithm of the beating energy. This is seen as the curves in the left hand of Figure 7.11. However, unbeaten data are then lost due to the invalid logarithm value. Adding a constant to the beating energy transforms the expression into a form that also includes the unbeaten data. In this work the constant is set to 300 and the relationship between paper property and log(PFI+300) is used for regression analysis.
As seen in Figure 7.11, beating is one factor that can increase the sheet density to almost every requested level. Thus, beating is also the most used method to increase the fibre flexibility.
7.4.2 Fibre wall thicknessFigure 7.10 (right) gives the correlation between sheet density and fibre wall thickness. Pulp with coarse fibres form sheets that are similar to Figure 7.2 (left) resulting in lower sheet density. Increasing the average fibre wall thickness by 0.2-0.3 µm may lower the
Figure 7.11 Beating curves (left hand: logarithmic, right hand: transformed logarithmic) for a reference kraft Spruce pulp. Interpolation of paper properties are best obtained by regression analysis using transformed logarithmic relationship.
500
550
600
650
700
750
800
0 2000 4000 6000 8000 10000revs. PFI
Shee
t den
sity
, kg/
m3
Kraft, FWT 2.12 µm
500
550
600
650
700
750
800
5 6 7 8 9 10ln(revs. PFI+300)
Shee
t den
sity
, kg/
m3
Kraft, FWT 2.12 µm

The influence of hemicellulose content on handsheet properties 85
sheet density by approximately 30-45 kg/m3. This must be seen as a large effect and may explain the difference in sheet density for pulps made from roundwood compared to pulps made of saw mill chips.
7.4.3 Hemicellulose contentChen and Williams [107] concluded that fully bleached never-dried White Spruce fibres with high level of hemicellulose have higher fibre flexibility, conformed better and were easier to collapse compared to fibres with a normal level of hemicellulose. It has been shown [85,107,110] that a pulping yield increase of 1 % on o.d. wood improves the unbeaten sheet density by 5 to 10 kg/m3
Another factor that affects the sheet density is the chemical composition of the pulp. Figure 7.13 presents the increase in sheet density with higher hemicellulose content. The sheet density of all pulp series is not included due to differences in the pulp washing procedures. This may influence the unbeaten result (see Appendix F) and only pressed pulps are included as the unbeaten pulp data. However, at higher beating degrees the variance of fibre form may diminish and all pulps may be included.
Figure 7.12 Beating curves for two Spruce pulps with different fibre wall thickness (left). The relationship between sheet density and fibre wall thickness (right).
500
550
600
650
700
750
800
0 2000 4000 6000 8000 10000revs. PFI
Shee
t den
sity
, kg/
m3
Spruce, FWT 2.12 µmSpruce, FWT 2.42 µm
Increased FWT
600
650
700
750
1,8 2 2,2 2,4 2,6
Fibre wall thickness, µm
Shee
t den
sity
at 2
000
revs
PFI
, kg
/m3 y = -140·FWT+const
RMSE=12 kg/m3

7.4 Fibre flexibility86
The increased fibre flexibility for bleachable “high yield pulps” may be explained by the increase in swelling. Hemicelluloses are amorphous and swell better compared to the more crystalline cellulose. Figure 7.14 shows that the water retention value rises slightly with increasing hemicellulose content. In addition to the swelling, the increased flexibility may also be explained by the plasticizing effect of hemicelluloses in the fibre wall [107,112].
Both the more thin-walled roundwood pulps and the more thick-walled saw mill chips pulps show the same increase in sheet density. Thus, the results from Section 7.4.2 can be added to the result in this section. Figure 7.15 combines the results in Figure 7.10 and 7.13. Both the fibre wall thickness and the hemicellulose content contribute significantly
Figure 7.13 Sheet density of once-dried bleached laboratory pulp (>86 % ISO) as a function of hemicellulose content.
Figure 7.14 Water retention value vs. hemicellulose content for beaten and unbeaten pulps
500
550
600
650
700
15 20 25 30Hemicellulose, % on o.d. pulp
Unb
eate
n sh
eet d
ensi
ty, k
g/m
3
Spruce, FWT 2.12 µmSpruce, FWT 2.16 µmPine, FWT 2.21 µm
650
700
750
800
850
15 20 25 30Hemicellulose, % on o.d. pulp
She
et d
ensi
ty a
t 200
0 re
vs P
FI,
kg/m
3
Spruce, FWT 2.12 µmSpruce, FWT 2.16 µmSpruce, FWT 2.43 µmPine, FWT 2.21 µm
100
120
140
160
180
15 20 25 30Hemicellulose, % on o.d. pulp
WR
V, g
H2O
2/100
g o
.d. p
ulp
2000 revs. PFI
unbeaten
100
120
140
160
180
15 20 25 30Hemicellulose, % on o.d. pulp
WR
V at
she
et d
ensi
ty 7
00 k
g/m
3 , g
H2O
2/100
g o
.d. p
ulp

The influence of hemicellulose content on handsheet properties 87
to the sheet density. An increase of hemicellulose content by 5 %1 boosts the sheet density by 30 - 40 kg/m3. For comparison, a similar effect can be obtained when the average fibre wall thickness is decreased by approximately 0.2 to 0.3 µm.
7.4.4 Drying (hornification)The drying of fibres changes the ultrastructure of the fibre wall and the uptake of water in the fibre wall is reduced. The relationship between water absorption (WRV) and sheet density for once-dried pulps compared to never-dried pulps is changed. Figure 7.16shows that the relationship for WRV and sheet density is not the same for once-dried and never-dried pulps. The reduction in WRV is often called hornification. In addition to the reduced WRV, the fibre flexibility is reduced. Figure 7.17 indicates that the reduction in sheet density is approximately 30-40 kg/m3 for once-dried pulp compared to never-dried pulps. The fibre flexibility is highly dependent on the amount of water in the fibre wall.
1. 5 % increase in hemicellulose content corresponds to a yield increase of 2.8 % or 0.8 % PS + 0.1 % AQ , (all number as o.d. wood) + Kappa number 33 compared to a standard kraft reference cook of Kappa number 25.
Figure 7.15 The development for sheet density as a function of fibre wall thickness and hemicellulose content.
650
700
750
800
1,8 2 2,2 2,4 2,6
Fibre wall thickness, µm
Shee
t den
sity
at 2
000
revs
PFI
, kg
/m3
XHemi=0.23
XHemi=0.17
XHemi=0.20
y = -140·FWT+700·XHemi+constRMSE = 12 kg/m3
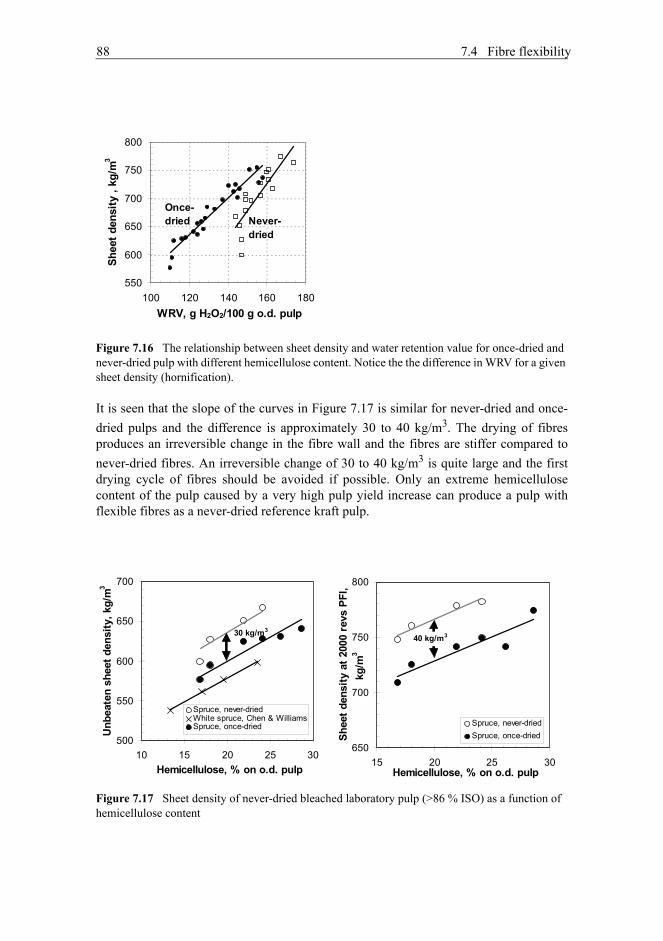
7.4 Fibre flexibility88
It is seen that the slope of the curves in Figure 7.17 is similar for never-dried and once-dried pulps and the difference is approximately 30 to 40 kg/m3. The drying of fibres produces an irreversible change in the fibre wall and the fibres are stiffer compared to never-dried fibres. An irreversible change of 30 to 40 kg/m3 is quite large and the first drying cycle of fibres should be avoided if possible. Only an extreme hemicellulose content of the pulp caused by a very high pulp yield increase can produce a pulp with flexible fibres as a never-dried reference kraft pulp.
Figure 7.16 The relationship between sheet density and water retention value for once-dried and never-dried pulp with different hemicellulose content. Notice the the difference in WRV for a given sheet density (hornification).
Figure 7.17 Sheet density of never-dried bleached laboratory pulp (>86 % ISO) as a function of hemicellulose content
550
600
650
700
750
800
100 120 140 160 180WRV, g H2O2/100 g o.d. pulp
Shee
t den
sity
, kg
/m3
Once-dried Never-
dried
500
550
600
650
700
10 15 20 25 30Hemicellulose, % on o.d. pulp
Unb
eate
n sh
eet d
ensi
ty, k
g/m
3
Spruce, never-driedWhite spruce, Chen & WilliamsSpruce, once-dried
30 kg/m3
650
700
750
800
15 20 25 30Hemicellulose, % on o.d. pulp
She
et d
ensi
ty a
t 200
0 re
vs P
FI,
kg/m
3
Spruce, never-driedSpruce, once-dried
40 kg/m3

The influence of hemicellulose content on handsheet properties 89
Results from Chen and Williams [107] are added to left-hand of Figure 7.17 and these results confirm the trend found for the never-dried and once-dried pulps used in this work. The level of sheet density is shifted due different fibre wall thickness for the White Spruce and wet pressing pressure1 used by Chen and Williams [107].
7.5 Load-elongation propertiesThe relationship between fibre flexibility and sheet strength are obvious. Fibres in a dense sheet form more fibre bonds to adjacent fibres than fibres in bulky sheets. However, the sheet strength is not only expressed by the fibre flexibility and density of the sheet. The mechanism during the formation of fibre bonds (in the bonding areas) is also critical and the load-elongation properties are related to some of these mechanisms.
Handsheets dried under restraint are usually manufactured and tested for various strength properties. Sheet strength parameters such as tensile index and tear index are also generally tested. The load-elongation curve contains a lot information and important data are lost when only the tensile index is evaluated. Paper testing methods such as the load-elongation curve, apparent density, optical properties and water absorption ability can be analysed in order to obtain information on the the behaviour of fibres in the sheet network.
The load-elongation properties are critical for strength characterization of all types of materials. Sheets consist of a network of fibres with a broad distribution of fibre dimensions making paper a special material to evaluate. Some sheets are also made of fibres from different wood species and pulping methods (mechanical and chemical processes) together with fillers and pigments. These kinds of paper grades are not evaluated in this thesis. The sheets evaluted in this thesis are exclusively laboratory made with a defined raw material as described in Table 7.3.
7.5.1 Effect of fibre wall thickness and hemicellulose content on load-elongation propertiesThe tensile strength is one of the end-points in the load-elongation curve and tensile strength is probably the most analysed strength parameter in the pulp and paper industry. Seth [108] has stated that high tensile strength is achieved for straight, flexible and conformable fibres with few dislocations. Storebråten [3] has shown that the relationship between sheet density and tensile strength is not unique and more thin-walled fibres attain high tensile strength with less beating energy compared to more thick-walled fibres. However, more thick-walled fibres have a higher tensile strength at a given sheet density compared to the more thin-walled fibres. In order to obtain a high unbeaten tensile strength the fibres have to be relatively thin-walled or have a high hemicellulose content. However, the slope in the tensile strength vs. sheet density is lower for more thin-walled and/or pulps with increased hemicellulose content compared to the slope obtained for beating of pulps. This can also be seen in left-hand part of Figure 7.18.
1. 345 kPa in the CPPA D.4 vs. 400 kPa for the SCAN P7:96
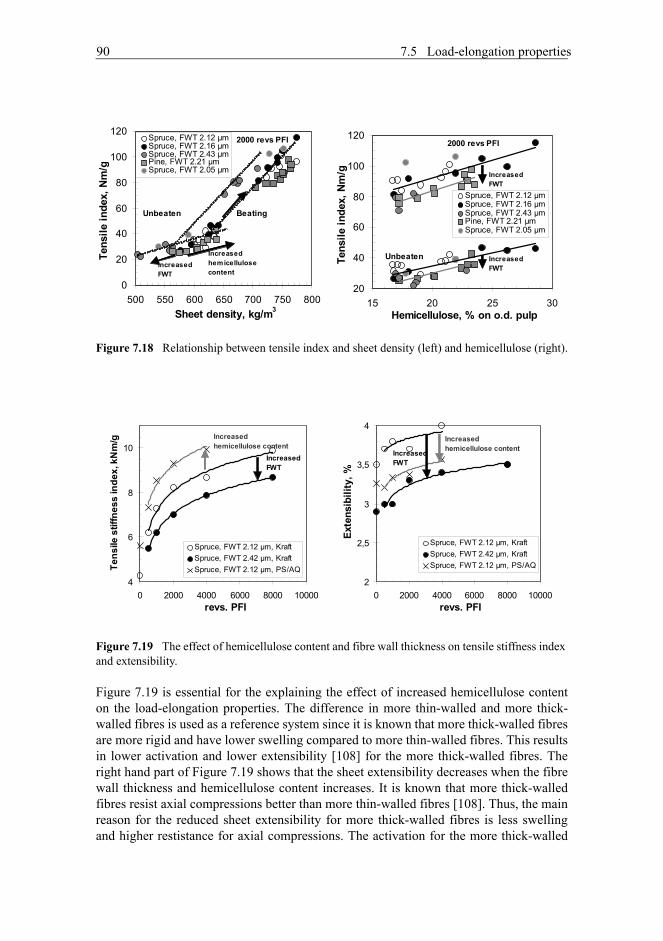
7.5 Load-elongation properties90
Figure 7.19 is essential for the explaining the effect of increased hemicellulose content on the load-elongation properties. The difference in more thin-walled and more thick-walled fibres is used as a reference system since it is known that more thick-walled fibres are more rigid and have lower swelling compared to more thin-walled fibres. This results in lower activation and lower extensibility [108] for the more thick-walled fibres. The right hand part of Figure 7.19 shows that the sheet extensibility decreases when the fibre wall thickness and hemicellulose content increases. It is known that more thick-walled fibres resist axial compressions better than more thin-walled fibres [108]. Thus, the main reason for the reduced sheet extensibility for more thick-walled fibres is less swelling and higher restistance for axial compressions. The activation for the more thick-walled
Figure 7.18 Relationship between tensile index and sheet density (left) and hemicellulose (right).
Figure 7.19 The effect of hemicellulose content and fibre wall thickness on tensile stiffness index and extensibility.
0
20
40
60
80
100
120
500 550 600 650 700 750 800Sheet density, kg/m3
Tens
ile in
dex,
Nm
/g
Spruce, FWT 2.12 µmSpruce, FWT 2.16 µmSpruce, FWT 2.43 µmPine, FWT 2.21 µmSpruce, FWT 2.05 µm
Unbeaten
2000 revs PFI
Increased hemicellulose content
Beating
Increased FWT
20
40
60
80
100
120
15 20 25 30Hemicellulose, % on o.d. pulp
Tens
ile in
dex,
Nm
/g
Spruce, FWT 2.12 µmSpruce, FWT 2.16 µmSpruce, FWT 2.43 µmPine, FWT 2.21 µmSpruce, FWT 2.05 µm
2000 revs PFI
Unbeaten
Increased FWT
Increased FWT
4
6
8
10
0 2000 4000 6000 8000 10000revs. PFI
Tens
ile s
tiffn
ess
inde
x, k
Nm
/g
Spruce, FWT 2.12 µm, KraftSpruce, FWT 2.42 µm, KraftSpruce, FWT 2.12 µm, PS/AQ
Increased FWT
Increased hemicellulose content
2
2,5
3
3,5
4
0 2000 4000 6000 8000 10000revs. PFI
Exte
nsib
ility
, %
Spruce, FWT 2.12 µm, KraftSpruce, FWT 2.42 µm, KraftSpruce, FWT 2.12 µm, PS/AQ
Increased FWT
Increased hemicellulose content

The influence of hemicellulose content on handsheet properties 91
fibres is lower than for the more thin-walled fibres. This is seen in Figure 7.19 as the black descending arrows.
The extensibility of the sheets made of pulps with increased hemicellulose content is lower compared to the less swollen reference kraft pulps. Normally, more swollen fibres should shrink more during drying compared to less swollen fibres. The increased transverse shrinkage would result in a increase in extensibility similar to more thin-walled fibres compared to more thick-walled ones. However, for handsheets1 made of fibres with increased hemicellulose content, the extensibility is reduced. The reason for the observed effects in Figure 7.19 has to be that fibres with increased hemicellulose content resist transversal shrinkage during drying. The fibres are more swollen and straighter resulting in higher resistance for axial compressions. Thus, the results in Figure 7.19 indicate that fibres with increased hemicellulose content are more activated and resist axial compressions in the bonding areas better than reference kraft fibres. The result is an increase in the tensile stiffness index and lower extensibility.
The fibre segments between fibre bonds can be straight or curly. However, the fibre segments must be straightened before they can endure load and become active segments. Since the network of fibres is fixed in the sheet before evaporation, the straightening of fibre segments is performed by transverse shrinkage of the fibres in the fibre bond areas. The number of fibre bonds, the fibre form and the axial resistance for straightening determine the modulus of elastisity (recalculated to tensile stiffness index).
It is also seen in Figure 7.20 that the extensibility of sheets made of pulps with increased hemicellulose content is lower at a given swelling degree compared to reference kraft pulps. The trend is also supported by never-dried fibres. Increased hemicellulose content decreases the sheet extensibility and increases the activation of the fibre segments.
1. dried under restraint
Figure 7.20 Extensibility and tensile stiffness index against water retention value. Extensibility is not only dependent on swelling but also resistance for axial compression.Activation is also influenced by the fibre form in addition to swelling.
2
2,5
3
3,5
4
4,5
100 120 140 160 180WRV, g H2O2/100 g o.d. pulp
Exte
nsib
ility
, %
AQKraftPS/AQH2SH2S/AQ
Once-dried
Higher axial resistance
4
5
6
7
8
9
10
100 120 140 160 180WRV, g H2O2/100 g o.d. pulp
Tens
ile s
tiffn
ess
inde
x,
kNm
/g
AQKraftPS/AQH2SH2S/AQ
Once-dried

7.5 Load-elongation properties92
Figure 7.21 shows that the fibre form is affected by the hemicellulose content. More curled fibres result in less activated fibre segments since the transversal shrinkage of the fibres cannot straighten a sufficient number of fibre segments and the fibre segments remain passive and do not endure load. Notice that the fibre curl reduces dramatically for PFI beaten pulps and the observed extensibility for beaten pulps is unlikely to be explained by the macroscopic measured curl. However, the macroscopic phenomena kinks and curls are introduced during mechanical treatment during pulping while formation of microcompressions are a microscopic phenomenon formed during the same mechanical treatment.
7.5.2 Increased hemicellulose content of fibres activate fibre seg-ments and the fibre wall has increased resistance for axial compres-sionsFurther relationships have to be studied to support the results in Figure 7.19. In this thesis, only sheet properties were studied and no microscope images are shown to confirm the hypothesis. In Figure 7.19 only a selection of the pulp is shown. However, the load-elongation curve of all pulps is investigated to support the findings.
The extensibility is caused by the “stretch-potensial” of the fibres and high extensibility is obtained in well bonded sheets. Seth [108] has stated that the bonding in the network needs to be high (i.e high tensile strength) before the stretch-potential of the fibres is realized. For this work, all pulps (except the pulps marked laboratory external 2) have the same mechanical treatment and the only difference in these pulps is the average fibre wall thickness and the hemicellulose content. Thus, the observed differences in the pulps are only affected by these two factors.
Figure 7.21 Straightening of the fibres for pulps with increased hemicellulose content.
0 %
5 %
10 %
15 %
20 %
10 15 20 25 30
Hemicellulose, % on o.d. pulp
FQA
cur
l
Spruce, FWT 2.12 µmSpruce, FWT 2.16 µmPine, FWT 2.21 µmWhite spruce, Chen & Williams
Centrifuged and unbeaten, never-dried
Pressed and unbeaten, rewetted once-dried
0 %
5 %
10 %
15 %
20 %
10 15 20 25 30Hemicellulose, % on o.d. pulp
FQ
A c
url a
t 200
0 re
vs P
FI
Spruce, once-dried
Spruce, never-dried
Once-dried,rewetted handsheet
Never-dried,rewetted handsheet

The influence of hemicellulose content on handsheet properties 93
Figure 7.22 supports the findings in Section 7.5.1 since the sheet extensibility decreases for fibres with increased hemicellulose content in a similar way observed for more thick-walled fibres. This may be surprising since fibres with increased hemicellulose content have similar swelling development compared to reference kraft fibres (see right hand part of Figure 7.14). However, fibres with high content of hemicellulose may resist axial compressions better than reference kraft pulps. Figure 7.22 also shows also that the tensile stiffness index increases for pulp with increased hemicellulose content at a given beating level. This is probably caused by higher swelling and relatively straight fibres. More thick-walled fibres have lower tensile stiffness index because they are stiffer and have more rigid fibre walls which results in passive and curly fibre segments.
Both beating and increased hemicellulose content have the same relationship between WRV and sheet density, see Figure 7.16. However, hemicellulose and beating may have different swelling mechanisms. It is known that beating decreases the fibre wall rigidity [108] but the effect of hemicellulose on the fibre wall rigidity is unknown. Beating improves the swelling by internal and external delamination and this treatment decreases the fibre wall rigidity and thus the fibre wall resistance regarding axial compressions is reduced. Fibres with increased hemicellulose have probably more of the original fibre wall rigidity even though the fibres have a higher degree of swelling than those with less hemicellulose content. Thus, the fibre wall rigidity may be higher at a given WRV for the less beaten pulps with increased hemicellulose content compared to the more beaten reference kraft pulps. The result is that fibres with high content of hemicellulose have a more rigiod fibre wall and resist axial compressions better compared to the more beaten reference kraft fibres.
Notice also in right of Figure 7.22 that H2S pre-treated pulps do not fit the linear relationship and the formation of microcompressions must be higher for these pulps compared to PS/AQ pulps with similar hemicellulose content. The reason for this
Figure 7.22 Influence of fibre wall thickness and hemicellulose content on the extensibility and tensile stiffness index.
3
3,5
4
4,5
15 20 25 30
Hemicellulose, % on o.d. pulp
Exte
nsib
ility
at t
ensi
le in
dex
80
Nm
/g, %
Spruce, FWT 2.12 µmSpruce, FWT 2.16 µmSpruce, FWT 2.43 µmPine, FWT 2.21 µmPine, FWT 2.56 µm
H2S H2S/AQ
Increased FWT
6
6,5
7
7,5
8
8,5
9
9,5
10
15 20 25 30Hemicellulose, % on o.d. pulp
Tens
ile s
tiffn
ess
inde
x at
200
0 re
vs P
FI, k
Nm
/g
Spruce, FWT 2.12 µmSpruce, FWT 2.16 µmSpruce, FWT 2.43 µmPine, FWT 2.21 µmPine, FWT 2.56 µm
H2S/AQ
H2S
Increased FWT

7.5 Load-elongation properties94
behaviour is not understood. However, during the H2S pre-treatment some microcompressions may be formed caused by the low pH in the pre-treatment step.
There is a close relationship between the modulus of elasticity and elongation at rupture for beaten pulps compared to sheet density 700 kg/m3. Pulps with high extensibility have a high fraction of axial compressed fibre wall (microcompressions) resulting in less straightened fibre segments. To straighten the fibre segments, the swelling of the fibres needs to be increased resulting in more transverse shrinkage in the bonding areas. Thus, the fibre activation is less at a given sheet density. Increasing the fibre wall thickness or hemicellulose content of the pulp increases the rigidity of the fibre wall and the fibre resists axial compressions better and the fibre is less curled. Thus, less transversal shrinkage is required in the fibre bonding areas for activation and the extensibility decreases.
The relationship between tensile index and tensile stiffness index is known to be good except for fibres exposed to extended oxidative decomposition of carbohydrates during pulping and bleaching [113]. Thus, the tensile index for fibres with increased hemicellulose is caused by the increased activation, see Figure 7.24.
Figure 7.23 The relationship between tensile stiffness index and extensibilty at sheet density 700 kg/m3).
5,5
6
6,5
7
7,5
8
8,5
9
9,5
3 3,5 4 4,5
Extensibility at sheet density 700 kg/m3, %
Tens
ile s
tiffn
ess
inde
x at
she
et
dens
ity 7
00kg
/m3 , k
Nm
/g
Spruce, FWT 2.12 µmSpruce, FWT 2.16 µmSpruce, FWT 2.43 µmPine, FWT 2.21 µmPine, FWT 2.56 µm
Increased hemicellulose content +
Increased FWT

The influence of hemicellulose content on handsheet properties 95
.
7.6 Other strength properties
7.6.1 Tear strengthMany pulp and paper tests are complex and the interpretion can be ambiguous. One of these tests is the tear index. Tear index is a sheet property that is frequently discussed in the litterature. However, this parameter is not fundamental and it may be dangerous to interpret matters so that high tear is equal to a good quality pulp [3]. To illustrate this Uesaka et al. [114] reported that the tear strength in cross direction of the paper web is not correlated to the runnability of paper in a printing press. Manufacturers of wood-containing printing papers have usually optimized the tear strength in good faith since a high tear index is believed to reduce the number of breaks in the pressroom.
The tear strength of the pulps with increased hemicellulose content decreases as observed by many authors [64,84,85,107]. However, pulps using H2S pre-treatment shows tear strength equal to the reference kraft pulp. This is surprising and the phenomenon has not yet been sufficiently explained. Increased tear strength was also found by Pekkala and Palenius [41] and Procter [110]. However, H2S pre-treated pulps are also found to decrease in tear strength in a similar way to polysulphide pulps [67,111]. Even though H2S pre-treated pulps have fewer fibres in the paper to distribute the load, the tear index is similar to reference kraft pulps. Thus, the number of fibres in the paper cannot explain the differences in the tear index.
As seen in Figure 7.22 and 7.22, the H2S pre-treated pulps diverge from the relationship found by PS/AQ pulps. The H2S pre-treated pulp and kraft pulp show similar
Figure 7.24 The relationship between tensile index and tensile stiffness index.
0
20
40
60
80
100
120
140
0 2 4 6 8 10 12
Tensile stiffness index, kNm/g
Tens
ile in
dex,
Nm
/g
Spruce, FWT 2.12 µmSpruce, FWT 2.16 µmSpruce, FWT 2.43 µmPine, FWT 2.21 µmPine, FWT 2.56 µm

7.6 Other strength properties96
extensibility at a given tear index. This implies that the tear index is dependent on adequate elongation to obtain high tear strength.
7.6.2 Fibre strengthIn addition to interfibre bond strength, the fibre strength influences the paper sheet strength [115]. Fibre strength is not easily measured and rewetted zero-span tensile strength is often used as an indicator of fibre strength. For carefully handled laboratory manufactured fibres the fibres are straight and the rewetted zero span tensile strength can be used to measure the fibre strength. For curled fibres, the zero span tensile strength increases with beating [116] and reach a plateau at approximately 3000 revolutions in a PFI mill. Further beating does not improve the straightness of the fibres.
According to Page et al. [117] the fibre strength is proportional to the cellulose content of the pulp and the zero-span strength reaches the maximum level at approximately 80 to 85 %. However, the pulps used in this study do not show this development as seen in Figure7.26. It seems that the fibre strength for fibres with increased hemicellulose content are equal to ordinary kraft pulps. The results from Mohlin and Teder [84] support the findings in this work. Thus, the fibre strength, measured as zero-span, is not significantly changed for fibres with increased hemicellulose content.
Figure 7.25 Tear index at sheet density 700 kg/m3 against hemicellulose content (left) and the relationship between tear index and extensibility (rigth).
5
10
15
20
15 20 25 30Hemicellulose, % on o.d. pulp
Tear
inde
x at
she
et d
ensi
ty 7
00
kg/m
3 , Nm
2 /kg
Spruce, FWT 2.12 µmSpruce, FWT 2.16 µmSpruce, FWT 2.43 µmPine, FWT 2.21 µm
H2S H2S/AQ
5
10
15
20
25
30
2 2,5 3 3,5 4Extensibility, %
Tear
inde
x, N
m2 /k
g
AQKraftPS/AQH2SH2S/AQ

The influence of hemicellulose content on handsheet properties 97
7.7 Concluding remarksSheet density has been used to evaluate the fibre flexibility as the fibre flexibility is closely related to the average fibre wall thickness. A decrease in fibre wall thickness of 0.2 µm increases the sheet density by approximately 30 kg/m3. Increased fibre flexibility is also obtained by increasing the hemicellulose content. An increase of hemicellulose content by 5 % (on o.d. pulp) increases the sheet density by approximately 30 kg/m3. The drying of fibres also influences the fibre flexibility and the loss of sheet density caused by drying is also approximately 30-40 kg/m3.
Tensile index, tensile stiffness index and elongation are also evaluated. Pulps with high hemicellulose content are more easily beaten and this results in higher tensile index for pulps with increased hemicellulose content. The reason is that increased swelling of pulps with increased hemicellulose content increases the straightness of fibres and the fibre segments in the sheet network is more easily activated. However, the extensibility for pulps with increased hemicellulose content is reduced. This indicates that the fibres with increased hemicellulose content have more rigid fibre walls that resist axial compressions better than fibres with lower hemicellulose content. The result is that pulps with high hemicellulose content form less microcompressions and less curled fibre segments compared to a reference kraft pulp.
The tear index for sheet made from pulps using polysulphide and anthraquinone in the cook is reduced. However, using H2S pre-treament as yield-increasing additive, the tear index is unchanged compared to the reference kraft pulp. The reason is unknown but the extensibilty for H2S pre-treated pulps and kraft pulps are higher than observed for PS/AQ fibres and this may imply that high elongation is favourable for the tear index. The zero-span tensile index is unaffected for pulps with different hemicellulose content.
Figure 7.26 Zero-span tensile index as a function of hemicellulose content.
100
120
140
160
180
200
15 20 25 30Hemicellulose, % on o.d. pulp
Zero
-spa
n te
nsile
inde
x at
sh
eet d
ensi
ty 7
00 k
g/m
3 , Nm
/g
Spruce, FWT 2.12 µmSpruce, FWT 2.16 µmSpruce, FWT 2.43 µmPine, FWT 2.21 µmPine, FWT 2.56 µm

7.7 Concluding remarks98

8.1 Method development 99
C H A P T E R
8 CONCLUDING REMARKS
8.1 Method developmentA method for carbohydrate determination was developed. In this method, enzymes are used to hydrolyse the pulp into monosaccharides. A relatively mild acid hydrolysis is performed prior to detection on an HPLC with an RI-detector. The pulp is not derivatized and no pre-treatment (mechanical or chemical) is needed to determine the carbohydrate composition using the method developed here. Peak deconvolution software is used to improve the accuracy.
8.2 Carbohydrate characterizationPolysulphide and H2S primarily increase the glucomannan yield, which can be boosted by up to 7 % on o.d. wood. However, the cellulose yield is more affected by the cooking time and the maximum yield increase of cellulose is appoximately 2 % on o.d. wood compared to an ordinary kraft pulp. The cooking time is influenced by sulphide ion concentration, AQ addition and the final Kappa number. The xylan yield is remarkably stable, however the alkali profile during the cook may influence the xylan yield. Surface xylan content of the fibres depends on residual alkali concentration in the black liquor. The molecular mass distributions of cellulose and hemicellulose were determined for pulps with increased hemicellulose content using size exclusion chromatography. Deconvolution by peak separation software is used to gain information about the degree of polymerization for cellulose and hemicellulose. The average DP of glucomannan in the kraft fibre was found to be 350 ± 30 and the average DP of xylan in the kraft fibre was found to be 240 ± 20. There are indications that the glucomannan needs a minimum chain length higher than 100 to be retained, as opposed to xylan. There may be error factors in using the traditional intrinsic viscosity (limiting viscosity number) for the determination of the degree of polymerization for cellulose. However, using intrinsic viscosity and the fraction of hemicellulose and cellulose, a much more accurate estimate of the degree of polymerization of cellulose is found, correlating well with the molecular mass of cellulose found by SEC.

Concluding remarks100
8.3 Handsheet propertiesThe influence of hemicellulose content on handsheet properties is studied. Sheet density is used to evaluate the fibre flexibility. The fibre flexibility is closely related to the average fibre wall thickness, hemicellulose content and drying. The drying of pulps and more thick-walled fibres reduces the fibre flexibility while increased hemicellulose content is favourable for high fibre flexibility. Sheet properties like tensile index, tensile stiffness index and elongation at rupture have been evaluated. Pulps with a high hemicellulose content are more easily beaten and this results in higher tensile index for pulps with increased hemicellulose content. The reason is that increased swelling of fibres with higher hemicellulose content increases the straightness of fibres resulting in more easily activated fibre segments in the sheet network. However, the extensibility for sheets made of pulps with increased hemicellulose content is reduced. This indicates that the fibres with increased hemicellulose content have more rigid fibre walls that resist axial compressions better than fibres with lower hemicellulose content. The result is that pulps with high hemicellulose content form less microcompressions and less curled fibre segments compared to a reference kraft pulp. Tear index for sheet made from pulps using polysulphide and anthraquinone in the cook is reduced. However, using H2S pre-treament as yield-increasing additive, the tear index is unchanged compared to the reference kraft pulp.
8.4 Practical implicationsBrownstock pulping yield can be estimated using three pulp properties; Kappa number, glucomannan and xylan content of pulp in addition to a contribution for the use of AQ. The main error in the yield determination originates from uncertainties in cellulose yield determination. The model seems to be robust and can be used on several softwood species.
Fibres with a high content of hemicellulose are more easily beaten and should preferably be used in paper qualities where only low level of refining is required. Another application for easily beaten pulps with high hemicellulose conent may be in paper mills with bottlenecks in the refining equipment.
8.5 Suggestions for further workThe interaction between anthraquinone and sulphidity should be further investigated. This may support the findings that the synergistic effects of PS and AQ is caused by changes in sulphide ion profiles that influences on the efficency of the anthraquinone on catalytical delignification and end-group stabilization.
The method used to analyse the molecular mass distribution of xylan, glucomannan and cellulose in softwood pulps should be further utilized to investigate pulps with increased hemicellulose content. Determination of molecular mass distribution of fibres with high and low xylan yield may support the findings in this thesis.

8.5 Suggestions for further work 101
Fibres with increased hemicellulose content have a lower extensibility in handsheets dried under restraint compared to reference kraft fibres. However, freely dried sheets may shrink more due to higher swelling and less axial resistance in the fibre wall during free drying, and the extensibility of the freely dried sheet using fibres with increased hemicellulose content may increase compared to reference kraft fibres. Another way to investigate the resistance to axial compressions for the fibres is to use high resolution images of the fibre wall in unbeaten and beaten sheets to study and quantify the formation of microcompressions, and determine the kinks and curls in the fibre segments between fibre bonds. The image analysis should be performed on both sheets dried under restrain and freely dried sheets.
The reason for the unexpected high tear strength for H2S pre-treated pulps should be further investigated. One way to approach this phenomenon is to investigate the influence of extensibility on the tear strength.

Concluding remarks102

103
REFERENCES
1. Molteberg, D.E., “Modelling of variations in wood and fibre properties in Norway spruce“, Doctoral Thesis, Norwegian University of Life Science, (2006)
2. Jaakko Pöyry Consulting Oy 3. Storebråten, S., “Karakterisering av massa og fibrer”, Svensk Papperstidning.,
102(6):125-130 (1999) 4. Fengel, D. and Wegener, G., “Wood - Chemistry, Ultrastructure, Reactions”, Walter de
Gruyter, Berlin, 613 p (1989) 5. Sjöström, E., “Wood chemistry. Fundamentals and applications”, Academic Press,
San Diego, California, USA (1993) 6. Kerr, A.J. and Goring, D.A.I., “The ultrastructural arrangement of the wood cell
wall”, Cellulose Chemistry and Technology, 9:563-573 (1975) 7. Salmén, L. and Olsson, A.-M., “Interaction Between Hemicelluloses, Lignin and
Cellulose: Structure - Property Relationships”, Journal of Pulp and Paper Science., 24(3):99-103 (1998)
8. Tyrväinen, J., “Wood and fibre properties of Norway spruce and its suitability for thermomechanical pulping”, Ph.D. thesis, Acta Forestalia 249., University of Helsinki, 154 p (1995)
9. Frey-Wyssling, A. and Mühlethaler, K., “The elementary fibrils of cellulose”, Makromolekulare Chemie, 62:25-30 (1963)
10. Fengel, D., “The ultrastructural behavior of cell wall polysaccharides“, Tappi Journal, 53(3):497-503 (1970)
11. Mark, H., “Intermicellar hole and tube system in fiber structure”, Journal of Physical Chemistry, 44:764-788 (1940)
12. Duchesne, I., Hult, E-L., Molin, U., Danial, G., Iversen, T. and Lennholm, H., “The influence of hemicellulose on fibril aggregation of kraft pulp fibres as revealed by FE-SEM and CP/MAS 13C-NMR”, Cellulose, 8:103-111 (2001)
13. Duchesne, I. and Daniel, G., “Changes in surface ultrastructure of Norway spruce fibres during kraft pulping - Visualisation by field-emission-SEM”, Nordic Pulp and Paper Research Journal, 15(1):54-61 (2000)
14. Atalla, R.H., Hackney, J.M., Uhlin, I. and Thompson, N.S., “Hemicellulose as structure regulators in the aggrregation of native cellulose”, International Journal of Biological Macromolecules, 15(2):109-112 (1993)
15. Tokoh, C., Takabe, K., Fujita, M. and Saiki, H., “Cellulose synthesized by Acetobacter xylinum in the presence of acetyl glucomannan”, Cellulose, 5(4):249-261 (1998)
16. Sorvari, J., Sjöström, E., Klemola, A. and Laine, J.E., “Chemical characterization of wood constituents, especially lignin, in fractions separated from middle lamella and secondary wall of Norway spruce”, Wood Science and Technology, 20:35-51 (1986)
17. Chen, H.T., Funaoka, M. and Lai, Y.-Z., “Attempts to understand the nature of phenolic and etherified components of wood lignin”, Wood Science and Technology, 31(6):433-440 (1997)
References104
18. Iwata, T., Indrarti, L. and Azuma, J.-I., “Affinity of hemicellulose for cellulose produced by Acetobacter xylinum”, Cellulose, 5(3):215-228 (1998)
19. Eriksson, Ö., Goring, D.A. and Lindgren, B.O., “Structural studies on the chemical bonds between lignins and carbohydrates in spruce wood”, Wood Science and Technology, 14:267-279 (1980)
20. Gierer, J. and Wännström, S., “Formation of alkali-stable carbon-carbon-bonds between lignin and carbohydrate fragments during kraft pulping”, Holzforschung, 40:19-22 (1986)
21. Taneda, H., Nakano, J., Hosoya, S. and Chang, H.-M., “Stability of α-ether type model compounds during chemical pulping processes”, Journal of Wood Chemistry and Technology, 7(4):485-498 (1987)
22. Lawoko, M., Henriksson, G. and Gellerstedt, G., “New method for quantitative preparation of lignin-carbohydrate complex from unbleached softwood kraft pulp: lignin-polysaccharide networks I.”, Holzforschung, 57(1):69-74 (2003)
23. Kleppe, P.J., “Kraft Pulping”, Tappi Journal, 53(1):35-47 (1970) 24. Aurell, R. and Hartler, N., “Kraft Pulping of Pine Part 1. The Changes in the
composition of the wood Residue During the Cooking Process”, Svensk Papperstidning., 68(3):59-68 (1965)
25. Stone, J.E. and Scallan, A.M., “The Effect of Components Removal Upon the Porus Structure of the Cell Wall of Wood. Part II. Swelling in Water and the Fibre Saturation Point”, Tappi, 50(10): 496-501 (1967)
26. Kibblewhite, R.P., “Effexts of Pulp Drying and Refining on Softwood Fibre Wall Structural Organisations”, Trans. of the Ninth Fundamental Research Symp. held at Cambridge, Fundamentals of Papermaking, Cambridge, England, vol 1, p. 121-152 (1989)
27. Maloney, T.C. and Paulapuro, H., “The Formation of Pores in the Cell Wall”, Journal of Pulp and Paper Science, 25(12):430-436 (1999)
28. Stone, J.E. and Scallan, A.M., “The Effect of Components Removal Upon the Porus Structure of the Cell Wall of Wood. Part III. A Comparison between the Sulphite and Kraft Processes”, Pulp and Paper Magazine of Canada, 69(12):69-74 (1968)
29. Andreasson, B., Forsström, J. and Wågberg, L., “The porous structure of pulp fibres with different yileds and its influence on paper strength”, Cellulose, 10(2):111-123 (2003)
30. Hult, E.-L., Larsson, P.T. and Iversen, T., “Cellulose fibril aggregation - an inherent property of kraft pulps”, Cellulose, 42(8):3309-3314 (2001)
31. Fahlén, J. and Salmén, L., “Cross-sectional structure of the secondary wall of wood fibres as affected by processing”, Journal of Material Science, 38(1):119-126 (2003)
32. Heijnesson, A., Simonson, R. and Westermark, U., “Removal of lignin-rich surface material from unbleached kraft fibers”, Holzforschung, 49(4):313-318 (1995)
33. Laine, J., Stenius, P., Carlson, G. and Ström, G., “Surface characterization of unbleached kraft pulps by means of ESCA”, Cellulose, 1(2):145-160 (1994)
34. Lindström, T. and Carlsson, G., “The effect of chemical environment on fibre swelling”, Svensk Papperstidning, 85(3): R14-R20 (1982)
35. Löwendahl, L. and Samuelson, O., “Carbohydrate stabilization during soda pulping with addition of anthraquinone“, Tappi, 61(2):19-21 (1978)
36. Fleming, B. I.; Kubes, G. J.; MacLeod, J. M. and Bolker, H. I., “Soda pulping with anthraquinone. A mechanism.“, Tappi, 61(6): 43-46 (1978).
105
37. Algar, W. H.; Farrington, A.; Jessup, B.; Nelson, P. F. and Vanderhoek, N., “The mechanism of soda-quinone pulping”, Appita, 33(1):33-37 (1979)
38. D.J.Dimmel, “Pulping with Anthraquinone: Fundamental Chemistry”, TAPPI 1996 Pulping Conference Proceedings, TAPPI PRESS, Atlanta, p 53 (1996)
39. Vuorinen, T.,"The Role of Carbohydrates in Alkali Anthraquinone Pulping", Journal of Wood Chemistry and Technology 13(1):97-125 (1993).
40. Ahlgren, P. and Teder, A., “Delignification Rate in Polysulfide Pulping”, Svensk Papperstidning, 70(4):135-143 (1967)
41. Pekkala, O. and Palenius, I., “Hydrogen Sulfide Pretreatment in Alkaline Pulping”, Paperi ja Puu, 55(9):659-668 (1973)
42. Reme, P.A., Johnsen, P.O. and Helle, T., “Assessment of Fibre Transvarse Dimensions using SEM and Image Analysis“, Journal of Pulp and Paper Science, 28(4):122-128 (2002)
43. Braaten, K.R. and Molteberg, D., “A mathematical method for determining fiber wall thickness and fiber width”, Tappi Journal, 3(2):9-12 (2004)
44. Minja, R. J.A., Doctoral thesis 1998:58, Norwegian University of Science and Technology (NTNU) (1998)
45. Saeman, J.F., Moore, W.E., Mitchell, R.L. and Millett, M.A.,”Techniques for the determination of pulp constituents by quantitative paper chromatography”, Tappi, 37(8):336-343 (1954)
46. Albersheim, P., Nevinsm D.J., English, P.D., “Analysis of sugars in plant cell-wall polysaccharides by gas-liquid chromatography”, Carbohydrate Research, 5(3):340-345 (1967)
47. Buchert, J., Siika-aho, M., Bailey, M., Puls, J., Valkeajärvi, A., Pere, J. and Viikari, L., “Quantitative determination of wood-derived soluble oligosaccharides by HPLC”, Biotechn. Techniques 7(11), 785 (1993)
48. Konno, M., Sakamoto, R. and Kamaya, Y., “Quantitative analysis of pulp-derived soluble oligosaccharides by an enzymic-HPLC method”, Journal of Fermentation Bioengineering, 82(6):607-609 (1996)
49. Tenkanen, M., Hausalo, T., Siika-aho, M., Buchert, J., Viikari, L.,”Use of enzymes in combination with anion exchange chromatography in the analysis of carbohydrate composition of kraft pulp”, Proc. 8th ISWPC, Helsinki, Vol. III, p 189-1994 (1995)
50. Syverud, K., Moe, S.T. and Minja, R.J.A.,”Carbohydrate analysis of pulps using enzymatic hydolysis and high pressure liquid chromatography”, Proc. 10th ISWPC, Yokohama, vol. 2, 232 (1999)
51. Dahlman, O., Jacobs, A., Liljenberg, A., Olsson, A.I., “Analysis of carbohydrates in wood and pulps employing enzymic hydrolysis and subsequent capillary zone electrophoresis”, Journal of Chromatography A, 891(1):154-174 (2000)
52. Crowell, E.P. and Burnett, B.B., “Determination of the carbohydrate composition of wood pulps by gas chromatography of the alditol acetates”, Analytical Chemistry., 39(1):121-124 (1967)
53. Borchardt, L.G. and Piper, C.V., “Gas-chromatographic method for carbohydrates as alditol-acetates”, Tappi, 53(2):257-260 (1970)
54. Ristolainen, M., “Characterization of totally chlorine-free effluents from kraft pulp bleaching. II. Analysis of carbohydrate-derived constituents after acid hydrolysis by capillary zone electrophoresis”, Journal of Chromatography A, 832(1+2):203-209 (1999)

References106
55. Rydholm, S.A., “Pulping Processes”, Interscience Publishers, (1965) 56. Sjöberg, J., Kleen, M., Dahlman, O., Agnemo, R. and Sunvall, H., “Fiber surface
composition and its relations to papermaking properties of soda anthraquinone and kraft pulps”, Nordic Pulp and Paper Research Journal, 19(3):392-396 (2004)
57. Dahlman, O. and Sjöberg, J., “Comparative Study of Different Approaches for Analyzing Carbohydrates at the Surface of Chemical Pulp Fibres“, 7th European Workshop on Lignocellulosics and Pulp, Åbo, 111 (2002)
58. Kleppe, P.J., “Polysulfide pulping in a dual-vessel Kamyr digester”, Tappi, 58(8):172-176 (1975)
59. De Ruiter, G.A., Scholes, H.A., Voragen, A.G.J. and Rombouts, F.M., “Carbohydrate analysis of water-soluble uronic acid-containing polysaccharides with high-performance anion-exchange chromatography using methanolysis combined with TFA hydrolysis is superior to four other methods” Analytical Biochemistry, 207(1):176-185 (1992)
60. Buchert, J., Teleman, A., Harjunpää, V., Tenkanen, M., Viikari, V. and Vourinen, T., “Effect of Cooking and Bleaching on Structure of Xylan in Conventional Pine Kraft Pulp“, Tappi Journal, 78(11):125-130 (1995).
61. Vuorinen, T. Fagerström, P., Buchert, J., Tenkanen, M. and Teleman, A., “Selective Hydrolysis of Hexenuronic Acid Groups and its Application in ECF and TCF Bleaching of Kraft Pulps“, Journal of Pulp and Paper Science, 25(5):155-162 (1999)
62. Chai, X.S., Zhu, J.Y. and Li., J., “A Simple and Rapid Method to Determine Hexenuronic Acid Groups in Chemical Pulps“, Journal of Pulp and Paper Science, 27(5):165-170 (2001)
63. Sanyer, N. and Laundrie, J.F., “Factors affecting Yield Increase and Fiber Quality in Polysulfide Pulping of Loblolly Pine, Other Softwoods, and Red Oak“, Tappi, 47(10):640-652 (1964).
64. Kleppe, P.J. and Kringstad, K., “Sulphate Pulping by Polysulphide Process“, Norsk Skogindustri, 17(11):428-440 (1963)
65. Hakanen, A. and Teder, A., “Modified kraft cooking with polysulfide: yield, viscosity, and physical properties”, Tappi Journal, 80(7):189-196 (1997)
66. Li, Z., Ma, H., Kubes, G.J. and Li, J., “Synergistic Effect of Kraft Pulping with Polysulphide and Anthraquinone an Pulp-Yield Improvement”, Journal of Pulp and Paper Science, 24(8):237-241 (1998)
67. Hartler, N. and Olsson, L.A., “Hydrogen sulfide cooking”, Svensk Papperstidning, 76(3):116-122 (1973)
68. Vinje, M.G. and Woster, H.E., “Hydrogen Sulfide-Alkaline Pulping- A New Method for Increasing Pulp Yield”, Tappi, 52(7):1341-1345 (1969)
69. Berthold, F., Gustafsson, K., Berggren, R., Sjöholm, E. and Lindström, M., “Dissolution of softwood kraft pulps by direct derivatization in lithium chloride/N,N-dimethylacetamide”, Journal of Applied Polymer Science, 94(2):424-431 (2004)
70. Bergren R., Berthold F., Sjöholm E., Lindström M., Improved methods to evaluate the molar mass distribution of cellulose in kraft pulp, Journal of Applied Polymer Science, 5(88):1170 (2003)
71. Olm, L. “Aspects on the effects of initial phase and sulfide pre-treatment in softwood kraft pulping “, Doctoral Thesis, KTH, (1999)

107
72. Prasad, D.Y., Jameel, H., Gratzl, J. and Tu, X., “Use of AQ/PS Pulping Additives for the Production of Linerboard Pulp, Tappi 1996 Pulping Conference, p 59-73 (1996)
73. Jameel, H., Gratzl, J., Prasad, D.Y. and Chivukula, S., “Extended Delignification with AQ/Polysulfide”, Tappi 1994 Pulping Conference, p 781- 799 (1994)
74. Berggren, R. Berthold, F., Sjöström, E. and Lindström, M., “Fiber strength in relation to molecular mass distribution of hardwood kraft pulp”, Nordic Pulp and Paper Research Journal, 16(4):333-338 (2001)
75. Chang, S-Y, “Using end-group analysis to derive mechanisms for anthraquinone-catalyzed reactions”, 56th Appita annual conference, Rotorua, New Zeland, p 491-496 (2002)
76. Evans, R. and Wallis, A.F.A., “Cellulose molecular weigths determination by viscometry“, Journal of Applied Polymer Science, 37(8):2331-2340 (1989)
77. da Silva Perez, D. and van Heiningen, A.R.P., “Determination of cellulose degree of polymerization in chemical pulps by viscosimetry”, 7th European Workshop on Lignocellulosics and Pulp, Åbo, 393 (2002)
78. Hatton, J.V., “Development of yield prediction equations in kraft pulping” Tappi Journal, 56(7):97-100 (1973)
79. Luthe, C., Berry, R., Radiotis, T. and Nadeau, L., “Measuring softwood yield gain at kraft pulp mills”, Journal of Pulp and Paper Science, 29(11):371-376 (2003)
80. Marcoccia, B.S., Stromberg, B. and Prough, J.R, “Achieving major increases in hardwood yield with Lo-Solids® cooking: A study in progress”, 1998 Breaking the pulp yield barrier symposium, TAPPI, Atlanta, p 79-89 (1998)
81. Easty, D.B. and Malcolm, E.W., “Estimation of pulping yield in continuous digesters from carbohydrate and lignin determinations”, Tappi Journal, 65(12):78-80 (1982)
82. Van Heiningen, A.R.P., Gao, Y. and Da Silva Perez, D., “Reduction of Alkaline Pulp Yield from the Mass Fraction and Degree of Polymerization of Cellulose”, 7th European Workshop on Lignocellulosics and Pulp, Åbo, p 63-68 (2002)
83. Kleppe, P., personal communication 84. Molin, U. and Teder, A., “Importance of cellulose/hemicellulose-ratio for pulp
strength“, Nordic Pulp and Paper Research Journal, 17(1):14-19 (2002) 85. Jiang, J.E., “Extended modified cooking of Southern Pine with polysulfide: effects
on pulp yield and physical properties”, Tappi J. 77(2):120-124 (1994) 86. Steadman, R. amd Luner, P., “The effect of wet fibre flexibility of sheet apparent
density”, Trans. of the Eighth Fundamental Research Symp., Oxford, England, Vol 1, p 331-337 (1985)
87. Tam Doo, P.A. and Kerekes, R.J., “A method to measure wet fiber flexibility”, Tappi, 64(3):113-116 (1981)
88. Paavilainen, L., “Effect of sulphate cooking parameters on the papermaking potential of pulp fibers”, Paperi ja Puu, 71(4):356-363 (1989)
89. Page, D.H., “The Collapse behaviour of Pulp Fibers”, Tappi, 50(9):449-455 (1967) 90. Paavilainen, L., “Conformability - flexibility and collapsibility - of sulphate pulp
fibres”, Paperi ja Puu, 75(9-10):689-702 (1993) 91. Weigel, G., “Fibre properties and allocation planning for the pulp and paper
industry“, Forac summer school, (2006) 92. Page, D.H., “The beating of chemical pulps - the action and the effects”, Trans. of
the 9th Fundamenatl Research Symposium, Cambridge, England, vol 1, p 1-38 (1989)

References108
93. Stone, J.E., Scallan, A.M. and Abrahamson, B., “Influence of beating on cell wall swelling and internal fibrillation”, Svensk Papperstidning, 71(19):687- 694 (1968)
94. McIntosh, D.C., “The effect of refining on the structure of the cell wall”, Tappi, 50(10):482-488 (1967)
95. Page, D.H. and De Grace, J.H., “Delamination of fibre walls by beating and refining”, Tappi, 50(10):489-495 (1967)
96. Giertz, H.W., “The effect on beating on individual fibres”, Trans. of Cambridge Symposium, British Paper and Board Makers Association, p 389-409 (1958)
97. Kibblewhite, R.P., “Effect of beating on fibre morphology and fibre surface structure”, Appita, 26(3):196-202 (1972)
98. Clark, J.d’A., “Pulp Technology and Treatment of Paper”, Miller Freemans Publications Inc., San Francisco, 1978
99. Jayme, G., “Mikro-Quellungsmessungen an Zellstoffen”, Der Papier-Fabrikant/Wochenblatt für Papierfabrikantion, 6:187-194 (1944)
100. Scallan, A.M. and Tigerström, A.C., “Elasticity of the Wet Fibre Wall: Effects of Pulping and Recycling”, CPPA, First Research Forum on Recycling, Preprints, Technical Section, Toronto, Canada, October 29-31, p149-154 (1991)
101. Marton, R., Brown, A., Granzow, S., Koeppicus, R. and Tomlinson, S., “Recycling and Fiber Structure”, Prog. Pap. Recycling, 2(2):58-70 (1993)
102. Bouchard, J. and Douek, M., “The Effects of Recycling on the Chemical Properties of Pulp”, Journal of Pulp and Paper Science, 20(5):J131-J136 (1994)
103. Giertz, H.W., “The Influence of Drying on Fibre Properties”, Proc. 6th EUCEPA Symp./8th European TAPPI Meeting, Stockholm, Sweden, September 20-25, p13:1-13:5 (1962)
104. Oksanen, T., Buchert, J. and Viikari, L., “The Role of Hemicelluloses in the Hornifcation of Bleached Kraft Pulps”, Holzforschung, 51(4):355-360 (1997)
105. Cao, B., Tschirner, U. and Ramaswamy, S., “Impact of pulp chemical compostion on recycling”, Tappi Journal, 81(12):119-127 (1998).
106. Spiegelberg, H., “The effect of hemicellulose on the mechanical properties of individual pulp fibers”, Tappi, 49(9):388-396 (1966)
107. Chen, J. and Williams, T., “Impact of high-yield polysulphide pulping on fibre properties: Fibre flexibility and conformability“, The 3rd Biennial Johan Gullichsen Colloquium, Espoo, p 31-40 (2001)
108. Seth, R.S., “Understanding sheet extensibility”, Pulp and Paper Canada, 106(2):33-40, (2005)
109. Niskanen, K., “Paper Physics“, Fapet Oy, Helsinki, Finland ISBN 952-5216-16-0 (1998)
110. Procter, A.R., “In situ hydrogen sulphide chip pretreatment increases kraft yield“, Pulp and Paper Canada, 77(12): 49-55 (1976)
111. Vinje, M.G. and Worster, H.E., “Hydrogen Sulphide-Alkaline Pulping Part II. A Quantitative Comparison with Polysulphide Pulping“, Pulp and Paper Magazine of Canada, 70(21):T431-T435 (1969)
112. Seth, R.J., Jang, H.F., Chan, B.K. and Wu, C.B., “Transverse Dimensions Wood Pulp Fibres and Their Implication for End Use”, 11th Fundamental Reserach Symp., Cambridge, UK, p 473-503 (1997)

109
113. Houen, P-J., “Studier over mekanismene ved tøyning og slitbrudd av papir”, Lic.tech. dissertation, Norwegian Institute of Technology (1966)
114. Uesaka, T., Ferahi, M., Hristopulos, D., Deng, N. and Moss, C., “Factors controlling pressroom runnability of paper”, 12th Fundamental Research Symposium, Oxford, England, p 1423-1440 (2001)
115. Page, D.H., “A Theory for Tensile Strength of Paper“, Tappi, 52(4):674-681 (1969) 116. Mohlin, U-B., Dahlbom, J. and Hornatowska, J., “Fiber deformation and sheet
strength“, Tappi Journal, 79(6):105-111 (1996). 117. Page, D.H., Seth, R.S. and El-Hosseiny, F., “Strength and chemical composition of
wood pulp fibres“, 8th Fundamental research symposium, Oxford, vol 1, p 77-91 (1985)
118. Van Allen, N.J., Hatton, J.V. and Gee, W.Y, “Effect pf sulfidity in alkaline pulping of white spruce with antraquinone“,Tappi J., 64(6):64 (1981)
119. Wigell, A., “Reaction kinetics of hemicellulose“, Lic.thesis, Chalmers University of Technology (2007)
120. Persson, K., “Micromechanical modelling of wood and fibre properties“, Doctoral Thesis, Lund Univeristy (2000)
121. Paavilainen, L., “Importance of cross-dimensional fibre properties and coarseness for the characterisation of softwood sulphate pulp“, Paperi ja Puu, 75(5):343-351 (1993)
122. Guay, D., Sutherland, N.R., Rantanen, W., Malandri, N., Stephens, A., Mattingly, K. and Scneider, M., “Comparison of fiber length analyzers“, 2005 TAPPI Practical Papermaking Conference, Milwaukee, Wisconsin, May 2005
123. Page, D.H. and Seth R.S., “The elastic modulus of paper”, Tappi, 63(6):113-116 (1980)
124. Page, D.H., “A Theory for the Tensile Strength of Paper”, Tappi, 52(4):674-681 (1969)
125. Arlow, A.P., “Load-elongation properties of paper sheets made from Bauer-McNett fractions of beaten sulphite pulp”, Norsk Skogindustri, 13(10):342-351 (1959)
126. Clark, J.d’A., Tappi 45(8): 628 (1962) 127. Page, D.H., Seth, R.S., Jordan, B.D. and Barbe, M.C., “Curl, Crimps, Kinks and
Microcompressions in Pulp Fibres - Their Origin, Measurement and Significance”, Trans. of the Eighth Fundamental Research Symp., Oxford, England, Vol 1, p 183-227 (1985)
128. Seth, R.S. and Page, D.H., “The Stress Strain Curve of Paper”, The Role of Fundamental Research in Papermaking. Brander, J.B. (ed.), Mech. Eng. Publications Ltd, London, UK, p 421–452 (1983)
129. Mohlin, U-.B. and Alfredsson, C., “Fibre deformation and its implications in pulp characterization”, Nordic Pulp and Paper Research Journal, 5(4):172-179 (1990)

References110

111
APPENDIX A: DETERMINATION OF CARBOHYDRATE COMPOSITION
A.1 Processing and integration of chromatogramsACSCII files containing the RI-data from each chromatogram were generated from the chromatography software, RI-data from a blind sample without pulp and mannitol was subtracted and a new chromatogram was achieved. This procedure adjusts for the monosaccharide contribution of the enzyme mixture. The file was then imported into a commercial PC software program (PeakFitΤΜ from SPSS Science) and the chromatogram was fitted to the required number of individual peaks. This is shown in Figure A.1. The areas under the deconvoluted peaks were used to calculate the carbohydrate composition.
Figure A.1 Chromatogram for a pulp after enzymatic hydrolysis. Glc: glucose, Xyl: xylose, Gal: galactose, Ara: arabinose, Man: mannose and GlcMan: glucomannan.
0
100000
200000
300000
400000
500000
600000
700000
800000
15 25 35 45 55
Retention time, min
RI-u
nits
0
10000
20000
30000
40000
50000
60000
70000
80000
90000
100000
18 20 22 24 26 28 30Retention time, min
RI-u
nits
GlcGlc
Xyl
Gal AraMan
Saccharide from GlcMan
Internal standard:Mannitol

112
A.2 CalibrationSolutions with a known amount of D-glucose, D-xylose, D-galactose, L-arabinose and D-mannose in different ratios were prepared. Mannitol was used as an internal standard. The area for each monosaccharide and the mannitol peak were measured as described above. The relative areas were obtained by dividing the peak areas for each monomers by the peak area of the internal standard. The relative areas for each monosaccharide were plotted as a function of the ratio of the monosaccharide and mannitol to obtain the calibration curves. Calibration curves for the three most important monosaccharides are given as examples in Figure A.3. The calibration procedure was performed after column rinsing; at least once every month.
Figure A.2 Peak deconvolution
0
10000
20000
30000
40000
50000
60000
18 20 22 24 26 28 30
Retention time, min
RI-u
nits
Observed data
Estimated peaksSum of estimated peaks
Glc Xyl
GalAra
Man
Saccharide GlcMan

113
Figure A.3 Standard calibration curves for glucose, xylose and mannose.
y = 0,9821xRMSE = 0.02
2,5
3
3,5
4
4,5
5
2,5 3 3,5 4 4,5 5
Glucose[g]/Mannitol[g]
Rel
.are
a (A
glc/A
man
nito
l)
y = 0,9821xRMSE = 0.009
0
0,15
0,3
0,45
0,6
0,75
0 0,15 0,3 0,45 0,6 0,75
Xylose[g]/Mannitol[g]R
el.a
rea
(Axy
l/Am
anni
tol)
y = 0,9821xRMSE = 0.0004
0
0,15
0,3
0,45
0,6
0,75
0 0,15 0,3 0,45 0,6 0,75
Mannan[g]/Mannitol[g]
Rel
.are
a (A
man
/Am
anni
tol)

114
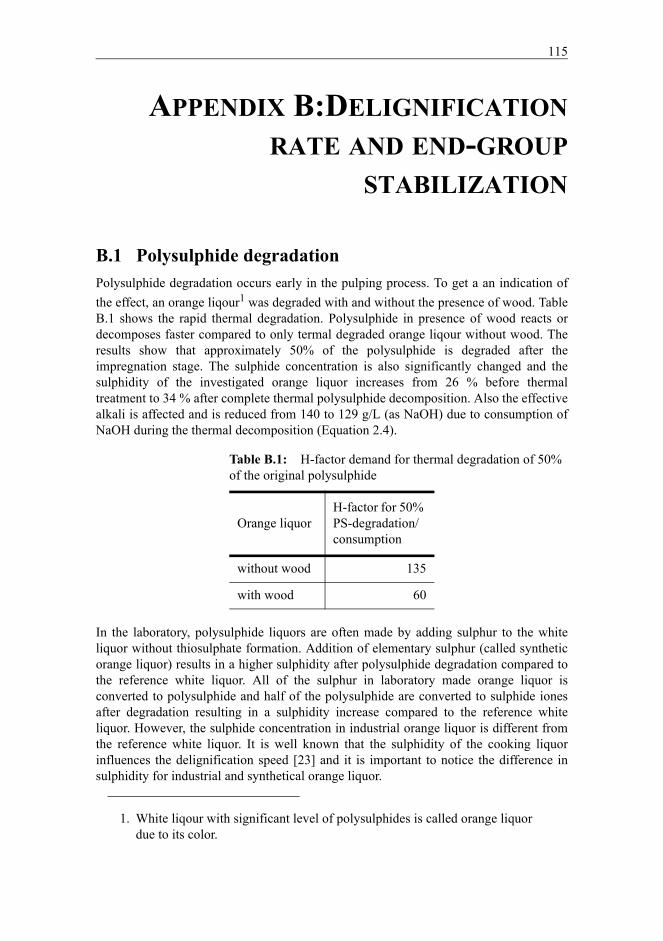
115
APPENDIX B:DELIGNIFICATION RATE AND END-GROUP
STABILIZATION
B.1 Polysulphide degradationPolysulphide degradation occurs early in the pulping process. To get a an indication of the effect, an orange liqour1 was degraded with and without the presence of wood. Table B.1 shows the rapid thermal degradation. Polysulphide in presence of wood reacts or decomposes faster compared to only termal degraded orange liqour without wood. The results show that approximately 50% of the polysulphide is degraded after the impregnation stage. The sulphide concentration is also significantly changed and the sulphidity of the investigated orange liquor increases from 26 % before thermal treatment to 34 % after complete thermal polysulphide decomposition. Also the effective alkali is affected and is reduced from 140 to 129 g/L (as NaOH) due to consumption of NaOH during the thermal decomposition (Equation 2.4).
In the laboratory, polysulphide liquors are often made by adding sulphur to the white liquor without thiosulphate formation. Addition of elementary sulphur (called synthetic orange liquor) results in a higher sulphidity after polysulphide degradation compared to the reference white liquor. All of the sulphur in laboratory made orange liquor isconverted to polysulphide and half of the polysulphide are converted to sulphide iones after degradation resulting in a sulphidity increase compared to the reference white liquor. However, the sulphide concentration in industrial orange liquor is different fromthe reference white liquor. It is well known that the sulphidity of the cooking liquor influences the delignification speed [23] and it is important to notice the difference in sulphidity for industrial and synthetical orange liquor.
1. White liqour with significant level of polysulphides is called orange liquor due to its color.
Table B.1: H-factor demand for thermal degradation of 50% of the original polysulphide
Orange liquorH-factor for 50% PS-degradation/consumption
without wood 135
with wood 60

116
The variation in sulphidity profiles was tested in two pulp series. The results was that the required H-factor to reach a given Kappa number increased by 20 % using strong oxidized pilot scale orange liquor (approx 10 g S/L) and decreased by 20 % when a strong syntetic orange liqour was used compared to the reference kraft process. The sulphidities of the thermally degraded liquors were not determined but it is assumed that the sulphidity of the syntetical orange liquor was 35-40 %, the reference white liquor was 30 % and the pilot scale liquor 20-25 %.
B.2 End-group stabilization or increased delignification rate?Pulp yield increase can be caused by two factors: i) end-group stabilization and ii) decreased peeling due to increased delignification rate or reduced cooking time. The two effects on yield gain are seldom quantified.
Yield increase is often seen as an effect of end-group stabilization. The redox cycle of AQ (Figure 2.9) indicates that the yield gain is caused by end-group stabilization and there is no doubt that PS stabilizes end-groups early in the cook. However, pulping with AQ, PS or combination of PS and AQ (PS/AQ) also affects the delignification rate. AQ increases the delignification rate due to cleavage of β-ether bonds and the sulphidity changes in PS cooks also affects the delignification rate of PS cooks. Can some of the yield increase be caused by increased delignification in addition to impregnation end-group stabilization?
Since both AQ and sulphide ion concentration affect the delignification rate, the efficiency of AQ may decrease at high sulphidities. Both sulphide ions and AQ react with the important β-ether bonds in lignin and cleavage of these bonds is critical for the delignification rate. At low sulphidities, AQ contributes to a relatively high delignification rate compared to the delignification rate without AQ [118]. For higher sulphidities, the contribution of AQ to the delignification rate may decrease since the high sulphide ion concentration effectively cleave the β-ether bonds. Thus, for higher sulphidities, the delignification rate is determined mainly by the sulphide concentration and less by AQ.
Vuorinen [39] substantiates that the yield effect of AQ is not caused by formation of aldonic end-groups. Thus, a hypothesis may be submitted “the yield increase in AQ pulping is caused by increased delignification rate”. AQ pulping does not alter the sulphide ion profile of the cooking liquor and the increase in delignification rate is solely caused by AQ. PS does not affect the delignification rate [40], however, the sulphide ion concentration changes due to preparation, degradation and stabilization reactions. Observation of delignification rates (H-factor) may give some information of the yield gain effect.
The high sulphidity PS cooks in Table B.2 show an increased delignification rate compared to both reference kraft and AQ cooks. Thus, some of the yield increase for the PS cook may originate from increased delignification rate in addition to end-group

117
stabilization. On the other hand, a combination of PS and AQ (PS/AQ) results in a delignification rate lower than the sum of the delignification rate of AQ + PS. Thus, AQ is not as effective as expected for high sulphide ion concentrations and the result is a yield increase lower than anticipated. On the other hand, industrial orange liquor reduces the sulphide ion concentration in the cook and the results are opposite compared to high sulphidity cooks. PS cooks show a lower delignification rate compared to both reference and AQ cooks. Adding AQ to the PS cook (PS/AQ) increases the delignification rate to approximately the same level as for cook with only AQ addition (without PS addition) although the sulphidity is lower for the PS/AQ cook compared to AQ cook. The result is a delignification rate higher than expected from the additive effect of AQ + PS.
The yield gain for the low sulphidity PS/AQ cook in Table B.3 is higher than the additive effect of PS and AQ (synergetic effect). For the high sulphidity cooks (Table B.2), the additive effect is opposite. The reason may be the relative changes in delignification rate for the cooks. However, this is only true when the delignification rate contribute to the yield increase.
Dividing the yield gain into one delignification rate component and one end-group stabilization component will help us evaluating the interaction between AQ and PS. Determination of two yield increase components can be done under certain assumptions. The first postulation is that carbohydrate yield loss during the residual phase of the cook is caused by peeling and should be linearly dependent on H-factor (valid for the pulps in this work). Another assumption is that yield increase at constant Kappa number can be obtained by end-group stabilization, by increased delignification rate or a combination of both. If a yield increase at a given Kappa number is caused by increased delignification rate, different cooks should give similar yield when compared at the same H-factor. Thus, increased carbohydrate yield at constant H-factor should be caused by end-group stabilization. e.g. since the PS cook requires an H-factor 1110 to reach Kappa number 30, the yield increase compared to a reference kraft cook H-factor 1110 should be caused by end-group stabilization (column (2) - column (1) in Table B.2 and B.3. The delignification rate yield component is found by comparing reference pulp yield at a given Kappa number (i.e. 30) to the reference pulp yield at the corresponding H-factor for a cook to obtain the given Kappa number (= column (1)).
The yields, Kappa numbers and H-factors are obtained by regression curves of the relationships yield/H-factor, Kappa number/H-factor and yield/Kappa number.
Two cases are illustrated below: i) adding surplus of sulphur to the white liquor (high sulphidities PS cooks compared to reference cook) and ii) oxidation of sulphide (low sulphidities PS cooks compared to reference cook).
Table B.2 illustrate the case where sulphur is added to a white liquor, resulting in an orange liquor with increased sulphide content compared to a reference white liquor. The delignification rate for all pulps is higher compared to the reference pulp and a significant part of the yield gain is caused by increased delignification rate in addition to end-group stabilization. The synergistic effect between PS and AQ is negative for the high sulphidity cooks. This may indicate that AQ is not effective to increase the

118
delignification rate and end-group stabilization for high sulphidity cooks. This may be explained by the reduced efficiency of AQ due to improved cleavage of β-ether bonds in lignin caused by higher sulphide concentration and the turnover in the redox cycle for AQ (Figure 2.9) is reduced.
Table B.2: Yield increase using additives and a syntetic orange liquor adding sulphur. PS cooks have higher sulphidity compared to reference kraft cook. Reference pulp: Kappa number 30 at H-factor 1440. NTNU digester.
Additive
H-factor
to Kappa no. 30
Lignin-free pulp yield for reference pulp at correspon-ding H-factor
(1)
Yield increase
at Kappa no. 30
(2)
Yield increase due to
End-group
=(2)-(1)
Deligni-fication
rate =(1)
Reference 1440 46.4 46.4 0.0 0.0
0.15 % AQ -220 +0.7 +1.4 +0.7 +0.7
2.2 % PS -330 +1.1 +3.7 +2.7 +1.1
2.2 % PS/0.15 % AQ -460 +1.6 +4.6 +3.0 +1.6
2.2% PSa
a. Similar sulphide profile as reference
-10 -0.1 +2.9 3.0 -0.1

119
The results in Table B.3 show the case where orange liquor is made by oxidation of white liquor resulting in cooks with overall lower sulphide ion concentration profile in the PS cooks compared to the reference cook. Thus, the PS cooks have a reduced delignification rate resulting in a yield loss caused by increased cooking time and secondary peeling. However, AQ seems to increase the delignification rate significantly for the low sulphidity PS cook (PS/AQ). The delignification rate is faster than expected from the single PS and AQ cooks. Thus, the synergistic yield gain may be caused by increased delignification since the low concentration of sulphide ions leads to a less effecicient of β-ether bonds in lignin. This may increase the effect of AQ and the turnover for AQ in the redox cycle boosts.
Li et al. [66] have also studied the synergistic effect of AQ in PS cooks. The orange liquors used in this study were synthetic but the initial sulphidity of the orange liquor was lowered to 15 % compared to the white liquor of 30 %. This resulted in similar delignification rate for PS and reference kraft cooks (Table B.4) and this may indicate that the sulphide ion concentration profiles of all cooks are relative similar. Also for this scenario, the overall delignification rate for PS/AQ cooks is higher than expected. However, the increase in delignification rate can not explain the large increase in yield gain for the PS/AQ cook. An unexpected increase of end-group stabilization is observed.
Table B.3: Yield increase using additives and an industrial orange liquor. PS cooks have low sulphidity compared to reference kraft cook. Reference pulp: Kappa number 30 at H-factor 1020. External digester.
Additive
H-factor
to Kappa no. 30
Lignin-free pulp yield for reference pulp at correspon-ding H-factor
(1)
Yield increase
at Kappa no 30
(2)
Yield increase due to
End-group
=(2)-(1)
Deligni-fication
rate =(1)
Reference 980 46.9 46.9 0.0 0.0
0.12 % AQ -110 +0.5 +0.9 +0.4 +0.5
0.7 % PS +220 -0.6 +1.0 +1.5 -0.6
1.5 % PS +220 -0.6 +2.4 +3.0 -0.6
0.7 % PS/0.12 % AQ -70 +0.3 +2.4 +2.0 +0.3

120
Table B.4: Yield increase using additives and a syntetic orange liquor adding sulphur. PS cooks have similar sulphidity as reference kraft cook. Orange liquor and white liquor have an initial sulphidity of 15% and 30%, respectively. The results are calculated from Li et al. [66].
Additive
H-factor
to Kappa no. 30
Lignin-free pulp yield for reference pulp at correspon-ding H-factor
(1)
Yield increase
at Kappa no. 30
(2)
Yield increase due to
End-group
=(2)-(1)
Deligni-fication
rate =(1)
Reference 1730 46.4 46.4 0.0 0.0
0.1 % AQ -350 +0.5 +1.2 +0.7 +0.5
1.6 % PS +10 +0.0 +1.7 +1.7 +0.0
1.6 % PS/0.1 % AQ -420 +0.6 +3.8 +3.1 +0.6
Table B.5: Yield increase using AQ and PS. Reference pulp: Kappa number 100. Orange liquor prepared by dissolving sulphur in white liquor. Data taken from Prasad et al. [72]
Additive
H-factor
to Kappa no. 100
Lignin-free pulp yield for reference pulp at correspon-ding H-factor
(1)
Yield increase
at Kappa no. 100
(2)
Yield increase due to
End-group
=(2)-(1)
Deligni-fication
rate =(1)
Reference 1160 47.1 47.1 0.0 0.0
0.04% AQ -360 +2.7 +2.8 +0.1 +2.7
0.8 % PS -230 +1.7 +2.4 +0.7 +1.7
1.0 % PS -310 +2.4 +2.3 -0.1 +2.4
1.3 % PS -280 +2.2 +4.3 +2.1 +2.2
0.04% AQ/0.8% PS -470 +3.6 +3.9 +0.3 +3.6
0.04% AQ/1.0% PS -530 +4.1 +5.0 +0.9 +4.1
0.04% AQ/1.3% PS -470 +3.5 +5.1 +1.6 +3.5

121
The calculations in Table B.5 support the results from Table B.2 as in both cases high sulphidity orange liquor has been used. In Table B.6 different sulphidity profiles have been used and the results depends on the delignification rate.
Table B.6: Yield increase using AQ and PS. Reference pulp: Kappa number 25. Data taken from Jameel et al. [73]
Additive
H-factor
to Kappa no. 25
Lignin-free pulp yield for reference pulp at correspon-ding H-factor
(1)
Yield increase
at Kappa no. 25
(2)
Yield increase due to
End-group
=(2)-(1)
Deligni-fication
rate =(1)
Reference, Sa=30%
a. S:sulphidity
2110 42.2 42.2 0.0 0.0
AQ, S=30% -150 +0.2 +0.9 +0.7 +0.2
1.0% PS, S=12% +200 -0.3 +0.5 +0.8 -0.3
1.3% PS, S=17% +90 -0.1 +1.3 +1.4 -0.1
1.6% PS, S=20% -70 +0.1 +2.4 +2.3 +0.1
1.0% PS/AQ, S=12% -330 +0.5 +2.2 +1.7 +0.5
1.3% PS/AQ, S=17% -360 +0.5 +2.4 +1.8 +0.5
1.6% PS/AQ, S=20% -370 +0.5 +3.2 +2.6 +0.5

122
The data in Table B.7 show that end-group stabilization of AQ is more effective for cooks with low sulphidities. However, the sulphidity do also affect the delignification rate.
Cooks with high sulphide ion concentration or addition of AQ increase the delignification rate. However, AQ also increases pulp yield caused by stabilization of end-groups in the same order of magnitude as the yield increase caused by delignification rate. Thus, the hypothesis stated: “the yield increase in AQ pulping is caused by increased delignification rate” is only partly valid
Table E.7: Yield increase using AQ and different sulphidities. Reference pulp: Kappa number 20. Data taken from Van Allen et al. [118].
Additive
H-factor
to Kappa no. 20
Lignin-free pulp yield for reference pulp at correspon-ding H-factor
(1)
Yield increase
at Kappa no. 20
(2)
Yield increase due to
End-group
=(2)-(1)
Deligni-fication
rate =(1)
Kraft, Sa=29%
a. S:sulphidity
1130 48.7 48.7 0.0 0.0
Kraft, S=15% +440 -1.5 -0.8 +0.8 -1.5
AQ, S=29% -320 +1.1 +1.0 -0.1 1.1
AQ, S=15% 0 0 +1.0 +1.0 0
AQ, S=0% +1060 -3.7 -0.6 +3.1 -3.7

123
APPENDIX C: CARBOHYDRATE RETENTION
C.1 Glucomannan yieldThe pulp yield is influenced on i)Kappa number, ii)addition of PS or H2S or iii) addition of AQ.
For i): Increasing the Kappa number above 40 is not feasible in a pulp mill producing fully bleached pulp due to limitation in oxygen delignification and the relatively high costs for bleaching agents. However, for unbleached paper grades, increased Kappanumbers are possible and widely used. An increase of Kappa number by 10 units may increase the glucomannan yield by only 0.2 to 0.3 % on o.d. wood (Figure C.1). The total lignin-free yield gain is approximately 0.7 to 0.9 % on o.d. wood and increasing the Kappa number shows similar trends for all types of cooks, with or without yield-increasing additives. Most of this yield increase is probably caused by the reduced cooking time. The increased glucomannan retention can only account for 1/4 of the total lignin-free yield increase, seen as the relatively flatten linear curve in Figure 5.2.
For ii): PS and H2S are effective in the impregnation phase of the cook as opposed to AQ
which is efficient during the whole delignification1. Using end-group stabilizing agents as PS or H2S, approximately all of the increase in carbohydrate yield is caused by the increase of glucomannan yield. Hemicelluloses have a large amount of end-groups compared to cellulose due to its low molecular mass. They are also amorphous which lead to even higher accessibility compared to cellulose. It seems that end-groups in glucomannan are more sensitive to alkaline peeling compared to end-groups in xylan [119]. Glucomannan yield gain is mainly obtained by end-group stabilization (using the same argumentation as in Table B.2). However, increased delignification rate also increases the glucomannan yield to some extent.
For iii): Approximately half of the increased carbohydrate retention can be explained by the increased glucomannan yield when AQ is used. Both the increase in delignification rate and end-group stabilization increase the glucomannan yield. Thus, the slope for AQ cooks in the left-hand Figure 5.2 lies between i) and ii). AQ cooks stabilize less glucomannan at a certain pulp yield compared to PS and H2S cooks but more than reference kraft cooks. However, it is clear that PS and H2S cooks stabilize glucomannan end-groups more effectively compared to AQ cooks. This is another observation that
1. AQ may be blocked or deactivated in the black liqour.

124
indicates that AQ pulp yield is caused by both end-group stabilization and increased delignification rate..
C.2 Xylan yieldThe xylan yield in kraft pulps made of Norway Spruce is approximately 4 %, calculated on o.d. wood. This accounts for approximately 50% of the xylan in native Norway Spruce. Lignin and xylan are bonded (Figure 2.1) and the dissolution of xylan and lignin behave in similar ways [24,119]. Thus, it seems natural that xylan and glucomannan behave differently even though both hemicelluloses are belived to have short chain length and are relatively amorphous. The yield increase of xylan using yield-increasing additives has previously been found to be relatively moderate or even insignificant [24,119].
However, the xylan content in the fibre surface has little effect on the total yield increase. According to Figure 4.8, approximately 50-60% of the xylan is found in the 5% outer layer of the fibre wall, 75-80% in the 10% outer layer of the fibre wall while major part of the fibre wall has a relatively stable xylan content. This calculation is based on xylan profiles obtained by the method described in Section 4.3.6 and the method has not been validated by other methods.
C.3 Cellulose yieldFigure 5.3 shows the development of cellulose yield as a function of pulping time given as H-factor. The relationship between cellulose yield and H-factor seems to decrease linearly regardless of the use of yield-increasing additives such as anthraquinone and polysulphide. Nevertheless, some additives may increase the delignification rate. For the case of anthraquinone and polysulphide made by sulphur addition, the delignification rate is higher, resulting in higher cellulose yield at a certain Kappa number level. It is also important to notice that different digesters have a different Kappa number vs. H-factor relationship due to flow rate and heat transfer fluctuations. Other factors which can
Figure C.1 Glukomannan yield increase as a function of Kappa number. Reference pulp is a kraft pulp at Kappa number 30.
-2
0
2
4
6
8
20 30 40 50 60 70Kappa number
Glc
Man
yie
ld in
crea
se, %
on
o.d.
w
ood
KraftAQPSPS/AQH2SH2S/AQ
Kraft
AQ
2.2 % PS
PS/AQH2S

125
interfere with this relationship are the impregnation phase and the alkali and sulphide profile in the cook.
The increase in cellulose yield for high Kappa and AQ pulps is limited to approximately 1.5% on o.d. wood compared to a kraft pulp with Kappa number of 30. Since different pulping conditions and different digesters are used in Figure 5.3, the relationship between cellulose yield and H-factor could have been better. However, it seems that increased Kappa number and AQ addition is favourable for cellulose yield. Using the same argumentation as in Table B.2, cellulose is not end-group stabilized but the yield increase of cellulose is mainly caused by increased delignification rate or lower cooking time.

126

127
APPENDIX D: DECONVOLUTION OF MOLECULAR MASS DISTRIBUTION
D.1 Processing and integration of chromatogramsACSCII files containing the RI-data from each chromatogram were generated from the chromatography software and RI-data. The file was then imported into a commercial PC software program (PeakFitTM from SPSS Science) and the chromatogram was fitted to the required number of individual peaks. One way to validate the method is to evaluate the area under the deconvoluted peaks and interpret the area as carbohydrate content. The carbohydrate composition can thus be calculated and compared with traditional wet chemistry methods. One requirement of the peak separation method is that the LM area is the same as the hemicellulose content. In Section 5.4 and Publication V three high molecular (cellulose) and two low molecular (xylan and glucomannan) peaks were presented and this assignment gave a high correlation. The more simple solution with one symetrical low molecular and one symetrical high molecular distribution gave a robust interpretation.
Traditionally, the two peaks are separeted by a given value, seen as the vertical line at 100 kg/mol in Figure D.1 (left hand) or at the lowest value between the two peaks. However, it would be more accurate to deconvolute the peaks as seen on the right hand in Figure D.1. It is natural to assume that the low molecular mass peak should originate from hemicellulose and the high molecular mass peak from cellulose.
Thus, the area under the curve of each peak should correlate with the content of hemicellulose and cellulose in the pulp found by other wet chemistry methods. Three
Figure D.1 Deconvolution of chromatogram into two fractions. Manual (left-handed) and peak separation software (right-handed)
0
0,1
0,2
0,3
0,4
0,5
1 10 100 1000 10000Molecular weight, kg/mol
RI u
nits
LMHM
0
0,1
0,2
0,3
0,4
0,5
1 10 100 1000 10000
Molecular weight, kg/mol
RI u
nits
ObservedLMHMHM + LM
LMHM

128
procedures are evaluated for separation of the two peaks. The simples way is cut the curve in two at a fixed value (100 kg/mol) and determine the realtive area under the curve. Another way is to separate the peaks at the lowest point between the peaks (a variable point around 100 kg/mol) and the third technique is to use a deconvolution software as seen in Figure D.1 (right hand). A comparison of the three separation techniques is evaluted in Table D.1. The relative area under the whole curve is set to 100% and the area under the low molecular peak is measured as AreaLow. There is a significant improvement using the deconvolution of the peaks compared to the two more simplified methods.
A.2 Raw dataFigure D.2 to D.4 give details in the characteristic of the SEC analysis.
Table D.1: Standard error for the model Xhemi= a·AreaLow
Separation technique RMSE, % on o.d. lignin-free pulp
Fixed value 3.6
Lowest point 3.0
Peak deconvolution 1.5

129
Figure D.2 Chromatograms for the five analysed pulps.
Figure D.3 Relationship for carbohydrate composition for wet chemistry methods (Enz: method from Chapter 4) and SEC.
M (kg/mol)10 100 1000 10000
RI u
nits
0.0
0.1
0.2
0.3
0.4KraftAQPSPS/AQH2S
Hemi-cellulose
Cellulose

130
Figure D.4 Characteristics for detected peaks for each pulp.
Kraft Mn Mw DPn Area % Area %Xyl 32.2 54.1 245 8.8GlcMan 53.7 65.6 330 8.9Celllow 192 256 1185 13.0 15.8CellMed 578 752 3570 28.9 35.1CellHigh 1475 1855 9105 40.4 49.1Cell 956 1570 5900 82.3 100.0
AQ Mn Mw DPn Area % Area % Xyl 34.1 56.9 260 8.2 GlcMan 54.4 67.2 335 10.0 Celllow 217 305 1340 14.5 17.7 CellMed 655 858 4045 30.8 37.7 CellHigh 1446 1793 8925 36.5 44.6 Cell 930 1483 5740 81.8 100.0
PS Mn Mw DPn Area % Area %Xyl 29.8 44.3 225 7.2GlcMan 59.7 78.4 370 14.9Celllow 223 289 1375 11.1 14.3CellMed 674 879 4160 29.3 37.7CellHigh 1492 1859 9210 37.4 48.1Cell 1003 1562 6190 77.8 100.0
PS/AQ Mn Mw DPn Area % Area % Xyl 29.5 39.6 225 7.5 GlcMan 59.7 75.8 370 15.2 Celllow 217 285 1340 13.0 16.8 CellMed 647 841 3995 27.1 35.1 CellHigh 1517 1902 9365 37.2 48.1 Cell 993 1600 6130 77.3 100.0
H2S Mn Mw DPn Area % Area %Xyl 25.5 36.5 195 7.4GlcMan 62.3 81.6 385 15.6Celllow 221 291 1365 10.8 14.0CellMed 734 982 4530 28.0 36.4CellHigh 1473 1810 9095 38.1 49.9Cell 1028 1549 6345 76.9 100.0

131
APPENDIX E: CALCULATION OF PULP YIELD
The models used in Chapter 5 are based on the changes of the carbohydrate composition compared to a reference pulp of normal bleachable brownstock Kappa number of 30. The characteristics of these reference pulps are given in Table E.1 and E.2
.
The yield of each carbohydrate has been calculated as the product of YLign-free and the mass fraction of the carbohydrate.
Table E.1: Characteristics for brownstock reference pulps
Species
YLign-freea
a. YLign-free = Ytot·(1-0.00147·Kappa number)
XGlcMan XXyl XCellKappa
no.
% on o.d. wood % on o.d . lignin-free pulp
Norway Spruce 46.6 8.1 8.7 83.2 30
Scots Pine 44.1 8.4 8.6 82.9 30
Southern Pine 44.2 8.7 7.7 83.6 27
Table E.2: Characteristics for bleached reference pulps
Species
YBl. XGlcMan XXyl XCell
Unbl. Kappa
no.
% on o.d. wood % on o.d . lignin-free pulp
Norway Spruce 45.2 7.8 9.3 82.9 30
Southern Pine 43.5 8.9 7.9 83.3 27

132
The pulp yield can is best calculated using a reference kraft pulp of the given wood species. The input factors are the subtraction for the pulp and the reference:
∆ before the symbol represents the difference between the pulp compared to the reference pulp.
E.1 Calculation examplePulp characteristics:
Wood species: XSpruce = 95 % and XScots Pine= 5 %AQ: 0.14 % on o.d. woodKappapulp = 28Carbohydrate composition: XGlcMan = 10.8 %, XXyl = 7.6 %, XCell = 81.6 % on o.d. lignin-free pulp
∆Y(Lign-free)Spruce = [0.55·(XGlcMan-Xref) + 0.50·(XXyl-Xref) + 2.16·AQ + 0.024·(Kappapulp-Kapparef)]·XSpruce
∆Y(Lign-free)Pine = [0.55·(XGlcMan-Xref) + 0.50·(XXyl-Xref) + 2.16·AQ + 0.024·(Kappapulp-Kapparef]·XPine
Y(Lign-free)Spruce = [0.55·(XGlcMan-Xref) + 0.50·(XXyl-Xref) + 2.16·AQ + 0.024·(Kappapulp-Kapparef) + Y(Lign-free)Spruce]·XSpruce
Y(Lign-free)Pine = [0.55·(XGlcMan-Xref) + 0.50·(XXyl-Xref) + 2.16·AQ + 0.024·(Kappapulp-Kapparef) + Y(Lign-free)Pine]·XPine
Y(Lign-free)pulp = Y(Lign-free)Spruce + Y(Lign-free)PineY(tot)pulp = Y(Lign-free)pulp/(1-0.00147·Kappapulp)
Inserting the given values:∆Y(Lign-free)pulp = 1.2 % on o.d. woodY(Lign-free)pulp = 47.7 % on o.d. woodY(tot)pulp = 49.7 % on o.d. wood
∆Ypulp = Ypulp - Yref∆Xpulp = Xpulp - Yref∆Kappapulp = Kappapulp - Kapparef
( 0.1 )

133
Table E.3 shows the RMSE for yield estimation of bleached pulps and can be compared to the corresponding brownstock RMSE given in Table 6.2. The Σ∆Yn model model is also valid for bleachable pulps. However, the reference pulps have to be bleached.
E.2 Statistical commentsThere are several statistical tools to evaluate regression curves. The most used parameter is the r2 and the dimensionless r2 parameter always has a value between 0 and 1. Multipied with 100 %, the r2 is often interpreted as the degree of explaination of the regression curve. However, this consideration may be questionable when a selection of samples is unevenly distributed along the x-axis. When adding one or a few extreme points to a sample collection, the extreme points are weighted more compared to the rest of the sample points.
Root mean square error, RMSE and RMSEP, are defined in Equations 0.1 and 0.2 and each specimens in the samples are equal weighted in these parameters in contrast to the r2 parameter. RMSE (and RMSEP) are more easily interpreted since they measure the degree of error in the predicted y-value for each x-value and RMSE (and RMSEP) have the same unit as the predicted value. This makes it more easy to evaluate the level of significance for the model or evaluation. The RMSE describes the error for the model and RMSEP describe the error for a selection used for evaluation of samples for a given model. The difference is the level of degree of freedoms used in the error estimation. Thus, RMSE are always higher compared to RMSEP for a given collection of samples.
Table E.3: RMSE for different yield models for bleached pulps, % on. o.d. wood. Data for reference pulps are given on page 131
Model This worka
a. 17 pulps of Norway Spruce pulps.
Jiangb
b. 6 Southern Pine pulps.
∆YCell 0.47 0.51
∆YGlcMan 0.16 0.13
∆YXyl 0.19 0.10
YCell method 0.93 0.71
GlcMan method 0.64 1.08
Σ∆Yn model 0.63 0.58

134
where n is the number of objects in the test set, yi the known value of the parameter of interest for sample i, and y^i the value of the parameter of interest predicted by the model for sample i. The RMSE and RMSEP values can be viewed as a measure of the standard deviation and should therefore be as small as possible.
( 0.1 )
( 0.2 )
n2
ii 1
1RMSE (y y)(n f) =
⎡ ⎤= −⎢ ⎥− ⎣ ⎦
∑
n2
ii 1
1RMSEP (y y)n =
⎡ ⎤= −⎢ ⎥
⎣ ⎦∑

135
APPENDIX F: FIBRE PROPERTIES
F.1 Fibre flexibilityIn the Steadman method, a thin fibre network is pressed against h parallell steel wires with a diameter of approximately 25 µm on a glass slide. The optical non-contact length between fibre network and the steel wire is measured using transmitted and incident light in a microscope. Tam Doo & Kerekes [87] used a different approach and measured the flexibility of a single fibre using the bending beam theory where a fibre is placed at a notch across the tip of a capillary tube. Due to the hydrodynamic forces caused by a water flow though the capillary, fibres deflect and bend. The maximum deflection at a given water flow was measured and used to determine the fibre stiffness.
One disadvantage of using unbeaten sheet density compared to beaten sheet density is that the fibre form, amount of fines and fibre line treatment may influence the sheet density to some extent. In this work, some of the pulps are centrifuged instead of pressed in the bleaching sequence. Rough fibre handling may increase the fibre flexibility, the fibre form and fines production. The press washing is considered more harsh compared to the centrifugation of washed pulp. The treatment may also produce somewhat different amounts of fines. Thus, unbeaten sheet density may be somewhat inaccurate. Another aspect is that unbeaten sheet density is directly measured without regression. The standard deviation of this measurement is approximately 10-15 kg/m3 and small differences in fibre wall thickness or composition is not easily seen.
However, when the pulps are moderately beaten, the sheet density of the two dewatering techniques is quite similar. Thus, beaten sheet density probably is less sensible for mechanical treatment in the fibre line. Another important factor is that the estimated values for the beaten sheet density is obtain by regression and the standard error for the sheet density is approximately half of the unbeaten sheet density.
F.2 Fibre wall thicknessBraaten and Molteberg [43] have deduced a formula for calculating the average wood cell wall thickness (see Equation 7.1). This method is accurate and cost-effective, however, coarseness has in principle the disadvantage that one stiff, thick-walled and narrow fibre with low bonding ability may have a the same coarseness as a flexible, thin-walled and wide fibre with large lumen and high bonding ability. This can be a problem when coarseness for different pulps is compared directly. At a given fibre wall thickness, fibres made from sawmill chips have a significant higher coarseness compared to fibres made of roundwood chips [90]. However, sawmill chips also have higher dry (or basic) wood density compared to roundwood chips. By using the Braaten-Molteberg formulas, it is possible to decompose the coarseness and dry (or basic) wood density of the sawmill chips to pure fibre cross section dimensions. By doing this, the method estimates a more accurate value for the cell wall thickness in wood. This method estimates the cell wall

136
thickness of wood and the fibre wall thickness of processed fibres may be different due to process parameters that influence the fibre wall collapse and fibre swelling.
F.3 Fibre dimensions
Figure F.1 Influence of fibre wall thickness on the fibre flexibility. [90].
Figure F.2 Wood cell structure (left) of an annual ring for Norway Spruce and wood density profile over a growth ring (right). Figures taken from Persson [120].

137
Figure F.4 confirms the results from Figure F.3 and different pulps series with constant fibre dimensions and varying hemicellulose content are manufactured. It is seen that Pine pulps are significantly wider compared to Spruce pulp with similar fibre wall thickness and the Pine roundwood pulps are almost as wide as sawmill chip Spruce pulps.
F.4 Coarseness and fibre lengthThe importance of fibre coarseness on paper properties is well documented [121]. Differences in wood raw material (such as wood species, growth speed of the wood, age,
Figure F.3 Right: Unchanged fibre wall thickness (equation) at different hemicellulose content
Figure F.4 Relationship between light scattering coefficient at sheet density 700 and hemicellulose contntet for different pulp series.
1,8
2
2,2
2,4
15 20 25 30Hemicellulose, % on o.d. pulp
Fib
re w
all t
hick
ness
, µm
Spruce, FWT 2.12 µmSpruce, FWT 2.16 µmPine, FWT 2.21 µmSpruce, FWT 2.43 µmSpruce, FWT 2.05 µm
22
24
26
28
30
32
15 20 25 30Hemicellulose, % on o.d. pulp
Fib
re w
idth
, µm
Spruce, FWT 2.12 µmSpruce, FWT 2.16 µmPine, FWT 2.21 µmSpruce, FWT 2.43 µmSpruce, FWT 2.05 µm
14
16
18
20
22
24
26
15 20 25 30Hemicellulose, % on o.d. pulp
Ligh
t sca
tt.c
oeff
. at d
ensi
ty 7
00kg
/m3
Spruce, FWT 2.12 µmSpruce, FWT 2.16 µmSpruce, FWT 2.43 µm Pine, FWT 2.21 µmPine, FWT 2.56 µm

138
etc) influence the fibre wall thickness distribution and to some extent the coarseness. Coareness is often measured instead of the more fundamental fibre wall thickness. However, the coarseness can be misleading compared to fibre wall thickness since a wide and thin springwood fibres may have the same coarseness as a narrow and thick sommerwood fibre. The distribution of both fibre width and fibre wall thickness influence the coarseness value. Thus, it is not correct to interpret the coarseness directly into fibre wall thickness. As seen in Figure F.3, Spruce and Pine have different fibre widths and the relationship between coarseness and fibre wall thickness may be different for the two wood species. However, the usage of the Braaten and Molteberg equation [43] adjusts for possible differences in cross section dimensions.
For kraft pulps cooked at standard conditions, the pulping yield and chemical composition are quite constant. It is usual to compare coarseness from softwood fibres at a standardized pulp yield.
However, as seen in Figure 7.13, the fibre flexibility is improved for high yield pulps compared to ordinary kraft pulps even though the relationship between coarseness and hemicellulose content show a positive trend (Figure 7.9).
It should be noted that fibre coarseness is not easily determined. An accurate and small amount of fibres is analysed in the camera and image processing system. The number of fibres can be from a few thousand up to a hundred thousand fibres. There are two types of techniques used for coarseness determination. One type of equipments recycle the fibre flow and only a fraction of the fibres is analysed. A correction factor is used for coarseness determination. Another principle for coarseness determination is to analyse all the fibres in the input vessel. This method is somewhat more demanding for the operator due to more complex sample preparation. Guay et. al. [122] reported that the coarseness determination can vary from 120 to 180 µg/m for a beaten unbleached softwood pulp using different fibre analysers. Thus, it is difficult to compare results from
Figure F.5 and fibre length (right-hand). The curves in left-handed figure indicate the theoretical coarseness corrected for increased pulp yield.
1
1,5
2
2,5
3
15 20 25 30Hemicellulose, % on o.d. pulp
Fib
re le
ngth
(FQ
A),
mm
Spruce, FWT 2.12 µmSpruce, FWT 2.16 µmSpruce, FWT 2.43 µmPine, FWT 2.21 µm
1,8
2
2,2
2,4
2,6
2,8
3
3,2
1,8 2 2,2 2,4 2,6
Fibre wall thickness, µm
Fibr
e le
ngth
(FQ
A),
mm
Spruce, FWT 2.12 µmSpruce, FWT 2.16 µmSpruce, thick-walled Pine, FWT 2.21 µmPine, thick-walled
SprucePine
0.55 mm

139
different fibre analysers. In this work, a FQA from OpTest Equipment Inc. is used and the fibre analyser measures all the fibres and does not recycle the fibre flow.
Even though fibre wall thickness may be one of the most important fibre dimension, the fibre width plays also a crucial part for paper properties. Broad fibres have the same impact on the paper properties as more thin-walled fibres.
Since fibres are finite in length, the load from each fibre must be transferred to fibre bonds near the fibre end. The load increases along the fibre length, being built up by the shear stresses in the adjacent fibres. The stress reaches a maximum at the center of the fibre and diminishes to zero at the ends [123]. A long fibre is utilized more effectively compared to a short fibre. Thus, higher fibre length increases the relative amount of bonds per fibre, and paper properties such as tensile index, elongation, fracture toughness and wet web tensile strength are usually improved at increasing fibre length. Page [124] used data from Arlow [125] and Clark [126] and found that the inverse tensile index correlated well with the inverse value of fibre length. An increase in average fibre length above 2.0 mm , however, does not increase the mechanical strength properties of paper. Fibres made from softwood will practically always have an average of fibre length above 2.0 mm. However, suspensions of fibres with long fibres flocculates at a higher consistency compared with shorter fibres resulting in non-uniform formation and thus lower mechnical paper strength than expected. Good formation is also an important quality issue for printing paper making.
Fibre length is often used as a measurement for fibre dimensions. The determination is easily performed and widly used. However, the fibre length does only to some extent correlate with other fibre dimensions as fibre wall thickness and fibre width. For a given wood species with similar growth conditions, the relationship between fibre wall thickness and fibre length is very good. However, at different growth conditions or wood species, the relationship between fibre length and fibre wall thickness is changed. Thus, it is hazardous to rank pulp due to only the fibre length and this is seen in Figure F.5(right). Spruce and Pine fibres with similar fibre wall thickness have different fibre length. The Pine pulps are approximately 0.55 mm shorter compared to the Spruce pulps at a given fibre wall thickness. Thus, fibre length for different raw material is not easily transferred to more fundamental fibre dimensions.
Also the measured fibre length varies between fibre analysers. Guay et. al. [122] found that the span of measured length weigthed mean fibre length for an unbleached beaten softwood pulp varied from 2.0 mm to 2.6 mm, whereas most of the analysers measured within a range of 0.15 mm. Thus, comparision of coarseness and fibre length between studies using different fibre analysersis hazardous.
As seen in Figure F.5 (left), the fibre length is not greatly influenced by the hemicellulose content. However, a small increase in fibre length is seen for unbeaten high yield pulps and this may be due to a straightening effect for the more swollen high yield pulps (see Section E.5) compared to the more stiff low yield pulps. The camera system in the FQA record the 2D projected image of the fibre. Since fibres are 3D objects, a straightening effect in the last dimension is recorded for the more swollen fibres compared to the less

140
swollen fibres. This may results in an increase of the apparent fibre length, however, the real fibre length is probably constant for each pulp series.
F.5 Fibre formBefore introduction of automatic image analysis equipment of diluted pulp suspensions, fibre deformations were not easily measured. Deformations such as kinks and curls may dominate the pulp suspension properties, wet web strength and dry sheet properties [127]. Fibre deformations were often neglected when fibre properties were evaluated due to the difficulties in the measurements. However, today kinks and curls can easily be estimated using the appropriate equipment.
Kinks and curls in fibres are introduced when shearing forces act upon pulp suspensions at high consistency. If the pulp consistency is higher than 10%, the shearing forces are transmitted directly from fibre to fibre resulting in creation of kinks and curl. Mechanical actions such as screw presses, high consistency pumps and mixers and during dewatering of pulps to high consistency form kinks and curl. Fibre deformations may also occur during chipping and transport of chips through plug screws [127]. Dry paper strength is decreased at elevated fibre deformation due to the reduced ability of the fibres to transmit load in the fibre network [127]. Page et al. [127] has shown that a increase of the curl index1 from 0.12 to 0.24 decreases the tensile index by 30 to 50%. For a straight fibre, the fibre segment length (load-bearing fibre segments) is practically the whole fibre length except at the fibre ends. On the other hand, an abrupt kink (which also increases the curl index) in a fibre behaves as a fibre end because no load can be transmitted across it [128]. This results in a reduction in the effective fibre length and thus a reduction in dry paper strength. Mohlin and Alfredsson [129] point out that the zero-span, used to measure fibre strength, is influenced by kinks and curl. Zero-span is a tensile strength measurement where the clamps are positioned as close to each other as possible. To measure fibre strength, all fibre in the breakage zone must be able to transmit loads. However, kinks and curl decreases the number of fibres that are available to transmit load in the breakage zone and the drop in zero-span is thus caused by fibre deformations. The difference between maximal and the measured value should be as low as possible.
Fibre are straightened during beating in a PFI mill and the curl index is reduced. However, this may not be the case in industrial beating. Especially at high specific edge loads, the fibre does not seems to be significantly straightened [129]. One explaination can be that industrial beating is less homogeneous than laboratory beating. The short time of treatment in a industrial refiner allows only a relative low amount of fibres to be treated. The homogeneity in beating improves at lower specific edge load or if the beating is performed in several stages due to longer retention time in the refiner zone
1. The curl index is defined as the difference between the real fibre length and the shortest fibre distance divided by the shortest fibre dimension.

141
[129]. Researchers often neglect fibre deformations as an important characterization factor since beating in the PFI mill is included in laboratory studies
All of the once-dried pulps used in this study have been pressed in the pulp washing stages. This pressing introduces some kinks and curl and the curl level for the rewetted dry lap samples is much higher compared to pulps with centrifugal washing. Comercial market pulps which have been processed in a fibre line under harsh washing and mixing conditions have approximately the same curl levels as the once-dried laboratory made pulps. Mechanical treatment in the fibre line may influence the form of the fibres. However, it seems that the kinks and curl introduced in a pulp mill fibre line (mixing and pressing) may be somewhat more irreversible compared to the kinks and curl introduced in the laboratory wash press.
Figure F.6 Distribution of curl index for pulps using differet yield-increasing additives
0,0
0,1
0,2
0,3
0 % 10 % 20 % 30 % 40 %
Curl
Frek
vens
KraftAQPSAQ10PSAQ20H2S
Kraft
AQPS/AQlow
PS/AQhigh
H2S

142

143
COLLECTION OF PUBLICATIONS

Paper I144
PAPER I
Vaaler, D., Syverud, K., Seem, B. and Moe, S.T., “Estimating the pulping yield by carbohydrate analysis”, Tappi Journal, 4(4):23-27 (2005)

145

Paper I146

147

Paper I148
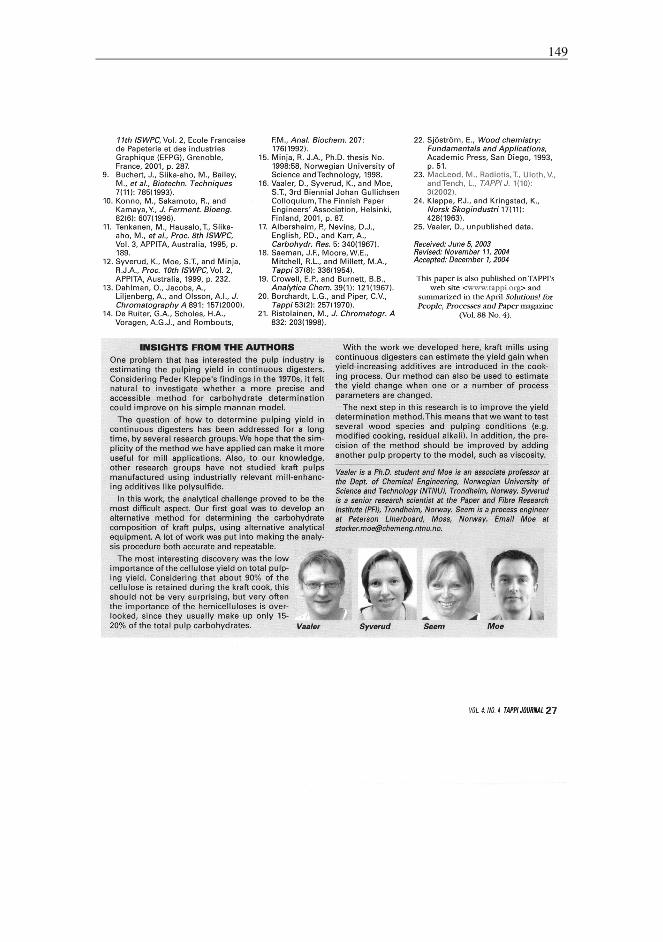
149

Paper II150
PAPER II
Syverud, K., Leirset, I. and Vaaler, D., “Characterization of carbohydrates in chemical pulps by pyrolysis-gas chromatography/mass spectometry”, Journal of Analytical and Applied Pyrolysis, 67(2):381 - 391 (2003)

151
Characterization of carbohydrates in chemical
pulps by pyrolysis gas chromatography/mass
spectrometry
Kristin Syverud a,*, Ingebjørg Leirset a, David Vaaler b
a Norwegian Pulp and Paper Research Institute (PFI), Høgskoleringen 6b, NO-7491 Trondheim, Norwayb Department of Chemical Engineering, Norwegian University of Science and Technology (NTNU), NO-
7491 Trondheim, Norway
Received 1 February 2002; accepted 26 June 2002
Abstract
A pyrolysis/gas chromatography/mass spectrometry method (Py/GC/MS) was developed to
determine the relative carbohydrate composition in chemical pulps. The composition was
determined directly from the pyrograms without calibration against any wet-chemical
analytical procedure. However, compensation was necessary due to differences in the response
factors of the anhydrosugars from glucan and mannan. The pyrolysis temperature range that
gave stable values for carbohydrate composition was found to be 500/700 8C. Various pre-
treatment steps were investigated. It was shown that the treatments affected the analytical
results and that milling should be avoided. The Py/GC/MS results agreed very well with results
from other analytical methods. However, low levels of mannan (approx. 0.5/1%) were not
detected. The main advantages of the method are its simplicity and shorter analysis time
compared to any wet-chemical analytical procedures.
# 2003 Elsevier Science B.V. All rights reserved.
Keywords: Carbohydrate characterization; Pyrolysis/gas chromatography/mass spectrometry; Hemi-
cellulose; Glucan; Mannan; Xylan; Arabinan
* Corresponding author. Tel.: /47-7355-0960; fax:/47-7355-0999
E-mail address: [email protected] (K. Syverud).
J. Anal. Appl. Pyrolysis 67 (2003) 381/391
www.elsevier.com/locate/jaap
0165-2370/02/$ - see front matter # 2003 Elsevier Science B.V. All rights reserved.
PII: S 0 1 6 5 - 2 3 7 0 ( 0 2 ) 0 0 0 7 6 - 1

Paper II152
1. Introduction
Pyrolysis gas chromatography/mass spectrometry (Py/GC/MS) is an analytical
technique that is useful in characterization of polymer compounds. The method is
widely used in qualitative analysis of residual lignin [1,2] and for various synthetic
polymer contaminants [3]. It can be used quantitatively as Bocchini et al. [4], among
others, have demonstrated for lignin pyrolysis products. This method has also been
used for the characterization of carbohydrates although there are not many recent
publications. Faix et al. [5,6] have identified 104 polysaccharide-derived products
and presented the complete mass spectra and structural formulai for them. Among
these, the anhydrosugars play an important role for carbohydrate identification. The
pyrolysis products 1,6-anhydroglucopyranose, 1,6-anhydromannopyranose and 1,6-
anhydrogalactopyranose are the specific products for cellulose, mannan and
galactan, respectively. These hexopyranoses have identical mass spectra, but are
separated as individual peaks in the pyrogram due to different retention time in the
GC. The typical pyrolysis product from arabinan is 1,5-anhydroarabinofuranose.
The hemicellulose xylan gives rise to two different peaks, 1,4-anhydroxylopyranose
and 1,5-anhydro-4-deoxypent-1-en-3-ulose [7].
Kleen and Gellerstedt [8] have shown some results for the quantification of
carbohydrates based on direct comparison of peak areas. The response factors of the
anhydrosugars were set to unity. The results indicated that pyrolysis can be used in
the quantification of carbohydrates although the precision at that stage seemed to be
to low for analytic purposes. Kleen et al. [9] have extended their method by the
introduction of multivariate data analysis. This method requires calibration against
reference data, that is, the results from traditional wet-chemical analysis. This
seemed to improve the precision considerably. However, the pyrolysis method was
reduced to an indirect approach that relied on wet-chemical analysis, a rigorous
statistical model and a huge calibration job.
In this paper we present a method for the quantification of carbohydrates directly
from the pyrogram. The significance of various pre-treatments is investigated.
2. Experimental
2.1. Pulps and reference compounds
Several different pulp samples were used in the study. These include an unbleached
laboratory polysulphide/anthraquinone pulp (PS/AQ), and industrial bleached
pulps. Properties of the pulps are given in Table 1. The PS/AQ pulp had a high
amount of glucomannan.
The reference compounds 1,6-anhydroglucopyranose and 1,6-anhydromannopyr-
anose were both obtained from Sigma.
K. Syverud et al. / J. Anal. Appl. Pyrolysis 67 (2003) 381/391382

153
2.2. Py/GC/MS
Pyrolysis was performed with a filament pulse pyrolyser (PYROLA-2000, Pyrol
AB, Lund, Sweden). The pulp samples were placed on the pyrolysis filament, and a
droplet of water was added to improve the contact between the sample and the
filament. The water was removed by warm air before the filament part was mounted
in the pyrolyser, and the sample was further dried in the pyrolysis chamber for 2 min
before pyrolysis. During pyrolysis, the pyrolysis chamber (maintained at 175 8C)
was purged with helium gas at a flow rate of 22 ml min1 in order to transport the
pyrolysis products quickly into the GC column. Pyrolysis time was set to 2 s, and
temperature rise time to 8 ms.
The pyrolyser was connected to HP 6890 GC system, and the gas flow was split to
allow 1/33 to enter the GC column. The injector temperature was 250 8C. The
separation was performed on a 30 m/0.25 mm i.d. fused silica capillary column
(film thickness 1 mm) denoted DB 1701 from J & W Scientific. Carrier gas velocity
was constant 0.8 ml min1. Temperature settings were: initial temperature 100 8C,
hold 2 min, increase 4 8C min1 to 265 8C, hold 5 min.
The MS was a HP 5973 Mass Selective Detector, operated in the electron impact
(EI) mode with ionisation energy of 70 eV. The ion source temperature was 230 8C.
The scan speed was 5.27 scan s1, and the mass range 35/300 amu. Between each
run the sample probe was removed and the column oven temperature was increased
to 280 8C for 20 min in order to remove the sample components completely from the
column.
2.3. Pyrolysis temperature
The pyrolysis temperature was varied from 400 to 700 8C in order to find a stable
range giving reproducible results.
Table 1
Pulps used in the study
Pulp Pulp type Addition (% on o.d. wooda) Raw materials Kappab
PS/AQ, softwood Laboratory 0.15% AQ and 2.0% PS Norway spruce 29.2
Kraft, soft-
wood
Industrial Unknown quantity of AQ 50% Norway spruce and 50%
Scots pine
/1 (ECFc)
Kraft, hardwood Industrial Unknown quantity of AQ Eucalyptus /1 (ECF)
Kraft, hardwood Industrial None Mainly birch TCFd
a Oven dried wood, 100% solid content.b The kappa number is an indirect method for lignin determination. It is determined according to the
SCANC 1:00 method.c Elemental chlorine free bleaching.d Total chlorine free bleaching.
K. Syverud et al. / J. Anal. Appl. Pyrolysis 67 (2003) 381/391 383

Paper II154
2.4. Pre-treatment
In order to investigate the significance of pre-treatment, a sample was subject to
various combinations of washing and milling. These are:
1) No pre-treatment
2) Milling
3) Washing
4) Milling followed by washing
5) Washing followed by milling
The washing was performed by disintegration of the pulps in 1 mM CaCl2 for 1 h
followed by washing with distilled water to remove excess of Ca2 and Cl ions.
The milled samples were ground to pass a 40 mesh screen.
2.5. Data analysis
In order to examine the validity of setting the response factors to unity the
degradation products of the hexoses, 1,6-anhydroglucopyranose (levoglucosan) and
1,6-anhydromannopyranose, were evaporated and quantitatively transferred from
the pyrolyser into the GC/MS. These compounds have equal mass spectra, and can
be compared directly. Response curves were obtained from these compounds. The
degradation products of xylose and arabinose are not commercially available.
Hardwood samples, which contain almost no mannan, were analysed to examine
whether the sum of the peak areas of the two degradation products of xylose can be
compared directly to the peak area of glucose. The results were compared to results
from wet-chemical analysis.
2.6. Comparison with other methods
To verify the Py/GC/MS method for analysis of carbohydrates various samples
were analysed with other methods for comparison. These were acid hydrolysis
followed by reduction, acetylation and GC quantification according to the TAPPI-
standard [10] with modifications of Cao et al. [11] and enzymatic and acid
(trifluoroacetic acid) hydrolysis and quantification by HPLC [12,13].
3. Results and discussion
3.1. Temperature dependence
Fig. 1 shows the relative amounts of glucan, mannan, xylan and arabinan as a
function of pyrolysis temperature. The carbohydrate values were calculated by direct
comparison of peak areas of the respective anhydrosugars. Xylan was calculated as
the sum of the two decomposition products, 1,4-anhydroxylopyranose and 1,5-
K. Syverud et al. / J. Anal. Appl. Pyrolysis 67 (2003) 381/391384
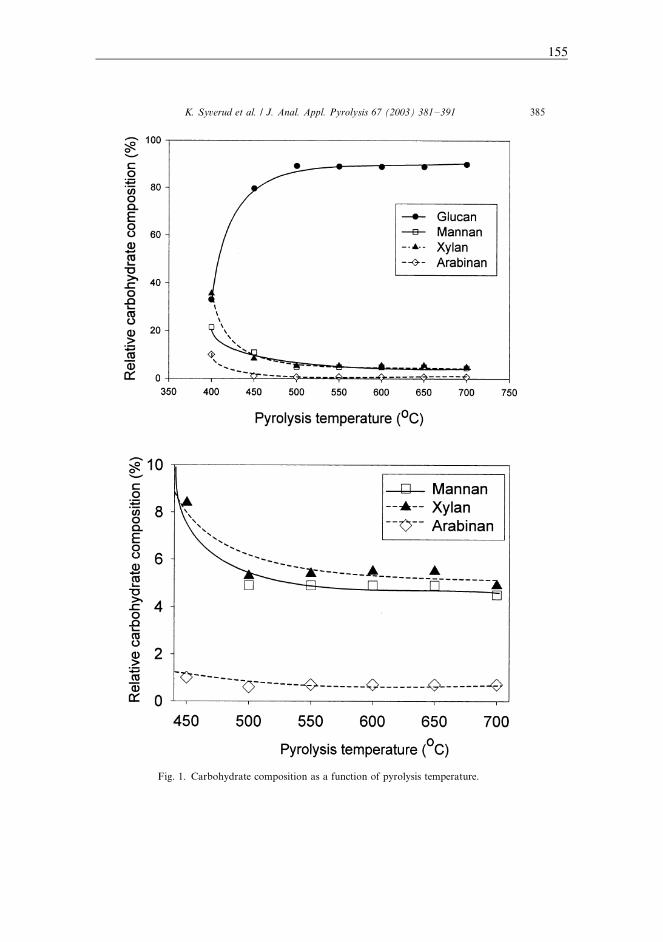
155
Fig. 1. Carbohydrate composition as a function of pyrolysis temperature.
K. Syverud et al. / J. Anal. Appl. Pyrolysis 67 (2003) 381/391 385

Paper II156
anhydro-4-deoxypent-1-en-3-ulose. The purpose of this investigation was to find the
temperature range giving stable amounts of degradation products from carbohy-
drate pyrolysis. Response factor values for the different anhydrosugars were not
taken into consideration at this stage. The composition varied with temperature up
to about 500 8C, while it was almost constant from 500 to 750 8C. The observed
variations were not larger than expected from random errors. A pyrolysis
temperature of 550/650 8C will therefore be a good choice for carbohydrates.
This is in agreement with Antal [14] who reports that depolymerization of cellulose
occurs in the range 300/500 8C with the formation of levoglucosan.
3.2. Pre-treatment
The carbohydrate composition of one pulp was determined after various pre-
treatments. The resulting values for glucose, mannose, xylose and arabinose were
compared by means of average and variance within each treatment. Analysis of
variance (ANOVA) and two sample t-tests were used to investigate whether the
treatments influenced the analysis results or not.
Table 2 shows the mean values and the variances for the four constituents. The
null hypothesis of the ANOVA is that there is no difference between the treatments.
The P -value is the probability of observing a difference between treatments that is at
least as large as observed in our data set, given that the null hypothesis is true. If the
P -value is 5/0.05 this means that the probability of rejecting a true null hypothesis is
less than 5%.
The P -values were very low, from 1/1011 to 1/105. This means that the
hypothesis was rejected for all the components, and that at least one treatment gave
a different result. A closer inspection of the averages and the variances gave the
following indications: It seems that the variances were smaller for samples both
washed and milled, regardless of order. Milled samples seemed to have more similar
averages than samples that were just washed, or not treated at all. This was examined
with ANOVA on samples where milling was a part of the pre-treatment (Table 3),
and two sample t-tests on pairs of treatments (Table 4). These tests gave the clear
result that milled samples gave the same results for xylan and arabinan regardless of
Table 2
Average and variance for a sample subjected to various pre-treatments
Treatment Count Glucan Mannan Xylan Arabinan
Av. Var Av. Var Av. Var Av. Var
No 7 83.2 0.54 9.65 0.26 6.35 0.16 0.8 0.0074
Washed 5 85.2 0.34 8.29 0.39 5.80 0.057 0.70 0.0028
Milled 11 86.7 0.52 7.74 0.27 5.08 0.25 0.49 0.0019
Milled-washed 5 86.4 0.17 7.58 0.14 5.50 0.13 0.47 0.0050
Washed-milled 4 87.6 0.26 6.63 0.11 5.26 0.057 0.48 3.3/105
K. Syverud et al. / J. Anal. Appl. Pyrolysis 67 (2003) 381/391386

157
washing. The results were more ambiguous for glucan and mannan, where one of the
milled samples was classified as being different.
The conclusions of this investigation are that both washing and milling affect the
analytical results, especially milling. Milling should therefore not be used as a pre-
treatment. Heating of the sample due to friction in the mill and thereby degradation
of carbohydrates can be a possible explanation of this phenomenon. As regards
washing, the conditions were somewhat different. All pulp producers do have some
kind of washing. It has been shown that Ca2 promotes the formation of
anhydrosugars, while Na, for example, has the opposite effect [15]. In order to
standardize the samples, and remove unwanted metal ions, the laboratory washing
procedure is justified.
3.3. Data analysis
Fig. 2 shows the pyrogram of a sample with the specific peaks originating from the
carbohydrates indicated.
Response curves for the degradation products 1,6-anhydroglucopyranose and 1,6-
anhydromannopyranose are shown in Fig. 3. Although they look quite similar, there
are differences in slope. The slope increases with a greater amount of anhydrosugar
for both of them. In addition, for all the samples in this study the 1,6-
anhydromannopyranose content falls in the lowest range of the curve, i.e. where
the slope is 58.2. Correspondingly, the 1,6-anhydroglucopyranose always falls in the
Table 3
P -values from the ANOVA comparing the pre-treatments where milling is involved
Component P -value
Glucan 0.029
Mannan 0.0025
Xylan 0.22
Arabinan 0.89
P -values5/0.05 indicate that the treatments give different results.
Table 4
P -values from t -tests comparing two pre-treatments
Comparing P (T5/t )1
Gluc Man Xyl Arab
No and washed 0.0004 0.004 0.014 0.049
Washed and milled-washed 0.006 0.064 0.16 0.0006
Milled-washed and milled 0.41 0.53 0.11 0.66
Washed-milled and milled 0.04 0.0017 0.52 0.74
Milled-washed and washed-milled 0.0060 0.0056 0.28 0.89
1 It is assumed that the variances are equal for two samples where milling is involved in the pre-
treatment. p/P (T5//t )/P (T]/t ). P -values/0.05 indicate that the treatments give different results.
K. Syverud et al. / J. Anal. Appl. Pyrolysis 67 (2003) 381/391 387

Paper II158
range where the slopes are 68.8 or 81.4. If the peak areas are compared directly, this
will lead to an underestimation of mannan. To avoid this, the peak area of 1,6-
anhydromannopyranose is multiplied with the slope ratio of the two anhydrosugars.
Fig. 2. Pyrogram of PS/AQ spruce pulp. The peak numbers are: 1, 1,5-anhydro-4-deoxypent-1-en-3-ulose;
2, 1,5-anhydroarabinofuranose; 3, 1,4-anhydroxylopyranose; 4, 1,6-anhydromannopyranose; 5, 1,6-
anhydroglucopyranose.
Fig. 3. Response curves for anhydrosugars. Slope figures are displayed beside the curves.
K. Syverud et al. / J. Anal. Appl. Pyrolysis 67 (2003) 381/391388

159
The most correct value for this is to use the average of the anhydroglucopyranose
slopes, 68.8 and 81.4, divided by the anhydromannopyranose slope, 58.2, that is
1.39. The new value for the 1,6-anhydromannopyranose peak area is summarized
with the other peak areas, and the part of each component is calculated as the
percentage of the sum.
A similar comparison cannot be made for the degradation products from xylose
and arabinose, because they decompose differently, and their mass spectra are
different. To check whether it is correct to compare peak areas without any
corrections, the results can be compared with those from another analytical
technique. This comparison has first been made to hardwood samples with no, or
low, detectable amounts of mannan, to simplify the approach. The results are shown
in Table 6, and there was very good agreement between glucan and xylan. This
proves that the peak areas can be compared directly. Mannan and arabinan are not
detected by the Py/GC/MS method in the amounts present in these hardwood
samples.
3.4. Comparison with other methods
The results of four different samples analysed by the Py/GC/MS technique are
compared with results from acid hydrolysis and GC (TAPPI-standard), and
enzymatic hydrolysis and HPLC in Table 5.
The Py/GC/MS results agreed very well with those from other methods, especially
the TAPPI-standard. The standard deviation of the Py/GC/MS results seemed to be
somewhat higher, from 0.1 to 0.9%. Low levels of mannan were not detected. Efforts
were made to improve the accuracy using different spectrometric interpretations;
total ion chromatogram (TIC) (standard), extracted ion chromatogram (EIC) and
single ion chromatogram (SIM). In the case of TIC, the MS is used in the scan-mode,
detecting every mass fragment origin from the sample. The pyrogram gives in this
case information about all the fragments. It is possible to extract information from
the obtained scan by choosing mass fragments of particular interest mathematically,
constructing an extracted ion chromatogram. This gives simplified chromatograms,
which were easy to integrate. In the case of SIM, the MS detects a selection of mass
fragments. As a result, the sensitivity of the selected masses improves. A
disadvantage is that the other mass fragments are not detected at all. Using EIC
or SIM, peak areas cannot be compared directly because only a part of the fragments
occurring from the constituent of interest are analysed. Calibration against known
values is needed to use these techniques. Experiments did not show considerable
improvement, and the methods were disregarded. Consequently, TIC was used in the
calculations.
The advantages of the Py/GC/MS method are its quickness, and the possibility to
analyse very small samples (about 100 mg). The whole analytical procedure is
performed within a couple of hours, including pre-treatment (washing), analysis and
calculations. The other methods for carbohydrate analysis include several steps that
take days rather than hours. Another advantage is the possibility to implement lignin
analysis into the method as well. The information is obtained in the same pyrogram.
K. Syverud et al. / J. Anal. Appl. Pyrolysis 67 (2003) 381/391 389

Paper II160
4. Conclusions
Pyrolysis/GC/MS has proved to be a fast and reliable method for carbohydrate
analysis of chemical pulps. The results were calculated directly from the pyrogram
without external carbohydrate analyses as reference. However, compensation was
necessary due to difference in response factors of the anhydrosugars from glucan and
mannan. The temperature range, which gave stable values of carbohydrate
composition, was found to be 500/700 8C. Various combinations of washing and
milling as pre-treatment of the samples were investigated. It was shown that the
treatments affected the analytical results, and that milling should be avoided. The
Py/GC/MS results were in agreement with results from other analytical methods.
The main advantage is the short analysis time.
Acknowledgements
The authors gratefully acknowledge financial support from Sodra Cell, Peterson
Linerboard, Borregaard ChemCell and the Research Council of Norway.
Table 5
Relative carbohydrate composition determined with three methods
Pulp Method Relative carbohydrate composition (%) with
standard deviation
Glucan Xylan Mannan Arabinan
Commercial bleached
Eucalyptus
Acid hydrolysis and GC3 81.29/0.3 18.39/0.3 0.439/0.02 0.179/0.03
Enz. hydrolysis and HPLC4 81.09/0.3 18.19/0.3 0.99/0.1 /
Py/GC/MS3 81.49/0.3 18.69/0.3 / /
Commercial bleached
hardwood
Enz. hydrolysis and HPLC2 75.4 23.6 0.5 0.6
Py/GC/MS3 76.09/0.7 24.09/0.7 / /
Commercial bleached
Spruce/Pine
Acid hydrolysis and GC2 83.9 8.0 7.4 0.7
Enz. hydrolysis and HPLC4 83.69/0.1 9.39/0.2 7.19/0.2 /
Py/GC/MS3 84.39/0.5 7.99/0.7 7.09/0.4 0.79/0.1
Laboratory unbleached
PS/AQ Spruce
Acid hydrolysis and GC2 80.1 6.4 13.0 0.5
Enz. hydrolysis and HPLC4 80.69/0.1 7.49/0.2 11.99/0.1 /
Py/GC/MS3 80.69/0.9 6.49/0.4 12.29/0.8 0.79/0.1
2 Average of two parallels;3 Three parallels;4 Four parallels.
K. Syverud et al. / J. Anal. Appl. Pyrolysis 67 (2003) 381/391390

161
Our colleague Ola Diserud is acknowledged for valuable discussion about the
statistics.
References
[1] J.C. del Rio, A. Gutierrez, J. Romero, M.J. Martinez, A.T. Martinez, J. Anal. Appl. Pyrol. 58/59
(2001) 425.
[2] T. Ikeda, H. Sunahara, H. Ohi, 10th International Symposium on Wood and Pulping Chemistry,
Yokohama, 2 (1999) 182.
[3] F. Bertaud, G. Mortha, J.C. Roux, Sixth European Workshop on Lignocellulosics and Pulp,
Bordeaux, (2000) 213.
[4] P. Bocchini, G.C. Galletti, S. Camarero, A.T. Martinez, J. Chromatogr. A 773 (1997) 227.
[5] O. Faix, I. Fortmann, J. Bremer, D. Meier, Holz als Roh- und Werkstoff 49 (1991) 213.
[6] O. Faix, I. Fortmann, J. Bremer, D. Meier, Holz als Roh- und Werkstoff 49 (1991) 299.
[7] G.R. Ponder, G.N. Richards, Carbohydrate Res. 218 (1991) 143.
[8] M. Kleen, G. Gellerstedt, J. Anal. Appl. Pyrol. 19 (1991) 139.
[9] M. Kleen, G. Lindblad, S. Backa, J. Anal. Appl. Pyrol. 25 (1993) 209.
[10] TAPPI Test method no. T249 cm-85.
[11] B. Cao, U. Tschirner, S. Ramaswamy, A. Webb, Tappi J. 80 (1997) 193.
[12] K. Syverud, S.T. Moe, R.J.A. Minja, 10th International Symposium on Wood and Pulping
Chemistry, Yokohama, 2 (1999) 232.
[13] D. Vaaler, K. Syverud, S.T. Moe, 3rd Biennal Johan Gullichsen Colloquium, Espoo (2001) 87.
[14] M.J. Antal, Jr, J. Adv. Solar Energy 2 (1983) 61.
[15] M. Kleen, Doctoral Thesis, Royal Institute of Technology, Department of Wood Chemistry,
Stockholm, 1993.
K. Syverud et al. / J. Anal. Appl. Pyrolysis 67 (2003) 381/391 391

Proceedings III162
PROCEEDINGS III
Vaaler, D., Syverud, K. and Moe, S.T., “Characterisation of pulp carbohydrates by enzymatic hydrolysis and determination of pulping yield with carbohydrate profiles”, The 3rd biennial Johan Gullichsen colloquium, p 87 - 93 (2001) Is not included due to copyright

Proceedings IV170
PROCEEDINGS IV
Vaaler, D., Eriksen, Ø., Ribe, E. and Moe, S., “The relation between carbohydrate composition and softwood kraft pulp yield”, 7th European Workshop on Lignocellulosics and Pulp, p 265-268 (2002) Is not included due to copyright

175
PROCEEDINGS V
Vaaler, D., Berthold, F. and Moe, S.T., “Details on carbohydrate retention in kraft cooking by the use of additives”, 12th International Symposium on Wood and Pulping Chemistry, Madison, USA, Vol. I, p 109 - 112 (2003) Is not included due to copyright

Proceedings VI180
PROCEEDINGS VI
Vaaler, D., Ljones, S., Ribe, E., Toven, K. and Moe, S., “Effects of hemicellulose stabilisation and raw material on the beatability of softwood kraft pulps”, 7th European Workshop on Lignocellulosics and Pulp, p 147-150 (2002) Is not included due to copyright

185
PROCEEDINGS VII
Vaaler, D., Eriksen, Ø. and Moe, S.T., “The difference in pulp properties for once-dried kraft pulp with varying pulping yield”, 12th International Symposium on Wood and Pulping Chemistry, Madison, USA, Vol. II, p 67 - 70 (2003) Is not included due to copyright
Proceedings VIII190
PROCEEDINGS VIII
Vaaler, D., Eriksen, Ø. and Moe, S.T., “The difference in pulp properties for never-dried and once-dried kraft pulps with varying pulping yield”, 28th EUCEPA Conference, Lisbon, Portugal, p 353 - 355 (2003) Is not included due to copyright