yield shear stress of cementitious … shear stress of cementitious mortar for self-compacting...
TRANSCRIPT
ICSBE2016-015
The 7th International Conference on Sustainable Built Environment, Earl’s Regency Hotel, Kandy, Sri Lanka from 16th to 18th December 2016
YIELD SHEAR STRESS OF CEMENTITIOUS MORTAR FOR SELF-COMPACTING CONCRETE
S.B.K.D. Dharmarathne*, S.M.C.J.B. Samarakoon, E.N.D. Edirisinghe1 and H. Abeyruwan
University of Peradeniya, Sri Lanka *E-mail: [email protected], TP: +94717353834
Abstract: Self-Compacting Concrete (SCC) is extensively used in modern constructions as it consolidates under its own weight without requiring any other compactive effort, whilst maintaining homogeneity. SCC is a thick suspension, and its rheology can be characterized by Bingham model, in terms of yield shear stress (τy) and plastic viscosity (μ).The main objective of this study is to explore variation of consistence of the mortar fraction, in terms of τy, when high-range water-reducing admixtures (HRWR), fly-ash and river sand are present in mortar. As SCC is a suspension of coarse aggregates in mortar, the research focuses on τy of grout and mortar.
In this study, τy of pastes that contain different quantities of HRWR, fly-ash and sand was measured. Combined effects of the constituents on τy were observed for two common w/c ratios using concentric rheometer and mini slump cone with the view to determine the optimum compositions. Results suggest to maintain HRWR and fly-ash contents around 1.0L/100 kg, and 25%-30% by mass of cement, respectively, and sand content below 40% by the total volume of the mix. Moreover, the study validates an analytical model derived to evaluate τy by using slump spread diameter and also develops and empirical formula linking τy to the slump spread diameter of cement paste. The findings pave way to use mini slump test as simple tool to judge the adequacy of the consistence of mortar and grout in proportioning of SCC, minimizing the repetitive trials.
Keywords: mini slump test, mortar fraction, rheology, self-compacting concrete, yield shear
stress
1. Introduction
Self-compacting concrete (SCC) is a flowing concrete mixture that is able to consolidate under its own weight. The highly fluid nature of SCC ensures that it fills the formwork completely, achieving full compaction without addition of external energy, even in the presence of a congested reinforcement arrangement.
SCC was first developed on Japan, primarily through the work by Okamura[1] in late 1980s when the construction industry experienced a decline in the availability of skilled labor. Over the next few decades SCC has been rapidly developed and utilized to overcome the inefficiencies in the traditional practices of concrete. Currently SCC is capable of offering a high strength, durable, homogeneous product with a minimum labor power requirements and environmental impacts due to so called ‘self-compacbility’.
To characterize a concrete as a self-compacting concrete, three key properties have been defined as follows. These are mainly associated with the workability of fresh concrete mix.
• flowing ability - o completely fill all areas and corners of formwork.
• passing ability -to pass through congested reinforcement without separation of the constituents or blocking.
• segregation resistance -to retain the coarse components of the mix in suspension in order to maintain a homogeneous material.
1.1 Rheology
Rheology is the science dealing with flow and deformability of a matter in a liquid state, but also as 'soft solids' or solids under conditions in which they respond with plastic flow in response to an internal or
ICSBE2016-015
The 7th International Conference on Sustainable Built Environment, Earl’s Regency Hotel, Kandy, Sri Lanka from 16th to 18th December 2016
external force. Since SCC behaves as a liquid (plastic), it should be studied in a rheological point of view. The following characteristics have been introduced in describing the rheology.
Yield shear stress-τy: Critical shear stress value to be applied on a thick suspension to initiates the flow
Plastic Viscosity-µ: Resistance to flow once the flow has initiated, which is the gradient of the line
To satisfy extended workability requirements, fresh SCC should incorporate a high capacity of deformation. When cementitous particles are dispersed well, yield shear stress gets sufficiently lowered and the material would deform more. As a result, without the need for any other force than gravity, SCC is able to spread out much further than the conventional concrete. The low yield shear stress also causes the self-compaction, by avoiding entrapped air bubbles. However, if the yield shear stress of the mix cannot withstand the stress induced by gravity on the aggregates, the coarse aggregates can sink in to the bottom of cement paste causing segregation. This would make the material non-homogeneous; hence strength and durability of the final product reduces. The segregation process of the aggregates can be slowed down ensuring a uniform suspension of aggregates and mortar by increasing the plastic viscosity, until it is completely stopped. Therefore, to be categorized as a self-compacting concrete, it is necessary for a concrete to have a low yield shear stress and a moderate plastic viscosity.
Currently a wide range of admixtures such as high range water reducing admixtures (HRWRA), viscosity modifiers, various additive material etc. have been introduced into the concrete industry to achieve yield shear stress and plastic viscosity requirements.
1.2 High range water reducing admixtures –HRWRA
HRWRA are primarily used, as their higher water reducing capacity to maintain a desired workability requirements of a concrete mix. In other words, it has a property of increasing the workability at a given w/c ratio in compare to a mix without HRWRA. Moreover, these indirectly add strength to hardened concrete by allowing reduction in w/c ratio or, reduce the required cement content for a given strength. As a result of low cement demands heat of hydration and material cost would be minimized. Therefore, in forming SCC the use of HRWRA has become a necessity, to incorporate an extended workability of fresh mix as well as high strength in hardened concrete.
1.3 Fly Ash as a supplementary cementitious material
Adding a viscosity modifying admixture or a large volume of finer material can eliminate the segregation risk by enhancing the cohesion and result in good dispersion between binder phase and aggregates in SCC. Moreover, to ensure high filling ability and flow without blockage, it should have a lesser coarse aggregate content and therefore a higher binder content. Replacing cement by a finer, cementitous material would be a better solution as it makes the mix more cohesive and reduces the higher cement demand and hence minimizes material cost as well as heat of hydration. Fly ash, silica fume, lime stone powder, glass filler and quartzite filler are currently used as finer material in the concrete industry, as some also possesses cementitous properties.
Fly ash is a residue of pulverized coal burning, available commonly and cheaply. Other than being a filler material, it is a pozzolanic material that reacts with calcium hydroxide to form a cement and hence increase the strength. Therefore, as an addition fly ash is often incorporated in place of cement about 10-30% replacement to the cement offering low construction costs while being environmental friendly
ICSBE2016-015
The 7th International Conference on Sustainable Built Environment, Earl’s Regency Hotel, Kandy, Sri Lanka from 16th to 18th December 2016
due to the minimal emission of greenhouse gases during the hydration process.
1.4 Cement grout and mortar
Freshly-mixed SCC is essentially a concentrated suspension of coarse aggregates in mortar. Similarly, mortar is a concentrated suspension of fine aggregates in cement grout which is a two phase material, composed of cementitious grains and water. Hence the rheology of mortar is dominated by that of cement grout and the properties of fine aggregates, whereas the rheology of SCC is dominated by that of mortar and the properties of coarse aggregates. Therefore, any change in cement paste rheology (grout and mortar) would cause changes in the flow properties of SCC. Hence, studying the rheological behavior of cement paste would assist in predicting the followability of SCC.
1.5 Scope and objectives
Despite different codes of practice and publications about mix design procedures of SCC in the literature, there are no universally accepted standards and technical drafts available to formulate concrete with desired self-compactible properties. Therefore, mixing procedure is mainly engaged with trial and error methods leading to large amounts of material, labor and time wastages. This can be minimized by having a direct method to link rheological properties of cement paste to that of concrete, since flow behavior of SCC is governed by paste rheology.
This study mainly focuses on investigating yield shear stress variation of cement paste. In the experimental evaluation of yield shear stress, coaxial type concentric rheometer and mini slump cone apparatus are used. Two common w/c ratios are employed and HRWRA and fly ash are occupied in the mixes to attain desired rheological characteristics.
Research objectives are summarized as follows;
1. Investigate the effect of HRWRA dosage on yield shear stress of cement grout.
2. Investigate the effect of fly ash as a supplementary cementitious material on yield shear stress of cement grout.
3. Investigate the effect of uniform size river sand as a fine aggregate on yield shear stress of mortar.
4. Validate the applicability of the analytical model for mini slump cone test.
5. Correlation between yield shear stress and mini slump spread diameter.
2. Literature Review
There have been extensive studies on mixture proportioning methods for and characterization of SCC using laboratory test methods, even though only a small amount of researches concentrated on rheological properties.
Workability, strength, and durability are three major characteristics of any type of concrete. Strength and durability are related to the hardened concrete while workability is related to the fresh concrete. Therefore, fresh concrete is much acceptable to be investigated in a rheological perspective to obtain data about its workability characteristics.
The characterization of concrete rheology is based on the concept that the fresh concrete can be considered as a fluid. A fluid deforms continuously under a constant shear stress and experiences no recovery of the deformation upon the removal of the load. Therefore, the relationship between shear stress and shearing rate was taken into the account in characterizing the fundamental flow properties of a material. This flow behavior has been idealized and to graphically represented with integral relationships between shear stress and shearing rate using flow curves.
Bingham model, Herschel Bulkley model and modified Bingham model are few regression models that have been developed to display the relationship between shear stress and shearing rate. The former is the simplest model, in which shear stress and
ICSBE2016-015
The 7th International Conference on Sustainable Built Environment, Earl’s Regency Hotel, Kandy, Sri Lanka from 16th to 18th December 2016
shearing rate linearly relate each other while other two offer nonlinear and complex combinations.
2.1 Bingham model
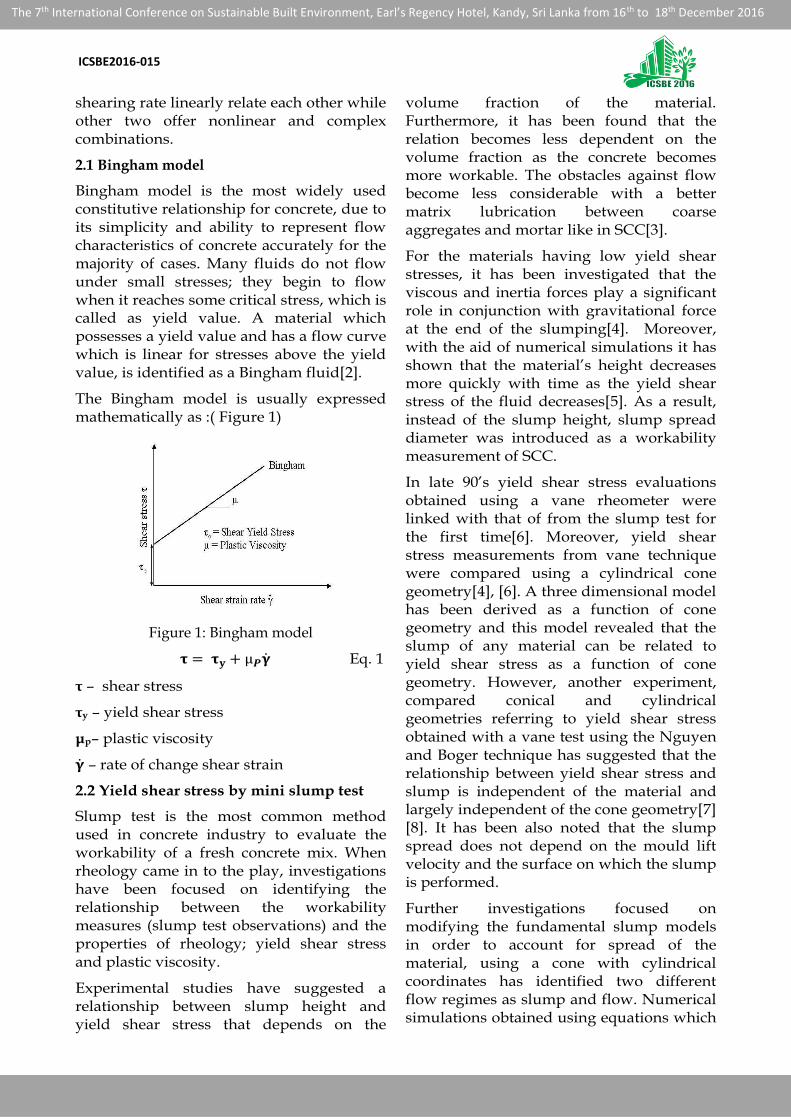
Bingham model is the most widely used constitutive relationship for concrete, due to its simplicity and ability to represent flow characteristics of concrete accurately for the majority of cases. Many fluids do not flow under small stresses; they begin to flow when it reaches some critical stress, which is called as yield value. A material which possesses a yield value and has a flow curve which is linear for stresses above the yield value, is identified as a Bingham fluid[2].
The Bingham model is usually expressed mathematically as :( Figure 1)
Figure 1: Bingham model
𝛕 = 𝛕𝐲 + µ𝑷 Eq. 1
τ – shear stress
τy – yield shear stress
μp– plastic viscosity
– rate of change shear strain
2.2 Yield shear stress by mini slump test
Slump test is the most common method used in concrete industry to evaluate the workability of a fresh concrete mix. When rheology came in to the play, investigations have been focused on identifying the relationship between the workability measures (slump test observations) and the properties of rheology; yield shear stress and plastic viscosity.
Experimental studies have suggested a relationship between slump height and yield shear stress that depends on the
volume fraction of the material. Furthermore, it has been found that the relation becomes less dependent on the volume fraction as the concrete becomes more workable. The obstacles against flow become less considerable with a better matrix lubrication between coarse aggregates and mortar like in SCC[3].
For the materials having low yield shear stresses, it has been investigated that the viscous and inertia forces play a significant role in conjunction with gravitational force at the end of the slumping[4]. Moreover, with the aid of numerical simulations it has shown that the material’s height decreases more quickly with time as the yield shear stress of the fluid decreases[5]. As a result, instead of the slump height, slump spread diameter was introduced as a workability measurement of SCC.
In late 90’s yield shear stress evaluations obtained using a vane rheometer were linked with that of from the slump test for the first time[6]. Moreover, yield shear stress measurements from vane technique were compared using a cylindrical cone geometry[4], [6]. A three dimensional model has been derived as a function of cone geometry and this model revealed that the slump of any material can be related to yield shear stress as a function of cone geometry. However, another experiment, compared conical and cylindrical geometries referring to yield shear stress obtained with a vane test using the Nguyen and Boger technique has suggested that the relationship between yield shear stress and slump is independent of the material and largely independent of the cone geometry[7] [8]. It has been also noted that the slump spread does not depend on the mould lift velocity and the surface on which the slump is performed.
Further investigations focused on modifying the fundamental slump models in order to account for spread of the material, using a cone with cylindrical coordinates has identified two different flow regimes as slump and flow. Numerical simulations obtained using equations which
ICSBE2016-015
The 7th International Conference on Sustainable Built Environment, Earl’s Regency Hotel, Kandy, Sri Lanka from 16th to 18th December 2016
connect the yield shear stress of the material to its slump flow showed very good correlation with the experimental results[9]. A recent research has presented experimental results showing that the slump flow spread is not a unique function of yield shear stress, rather a more complex function of both yield stress and plastic viscosity. Also, emphasized that the spread is more closely related to the yield shear stress than to the viscosity, especially at higher viscosities. [10]
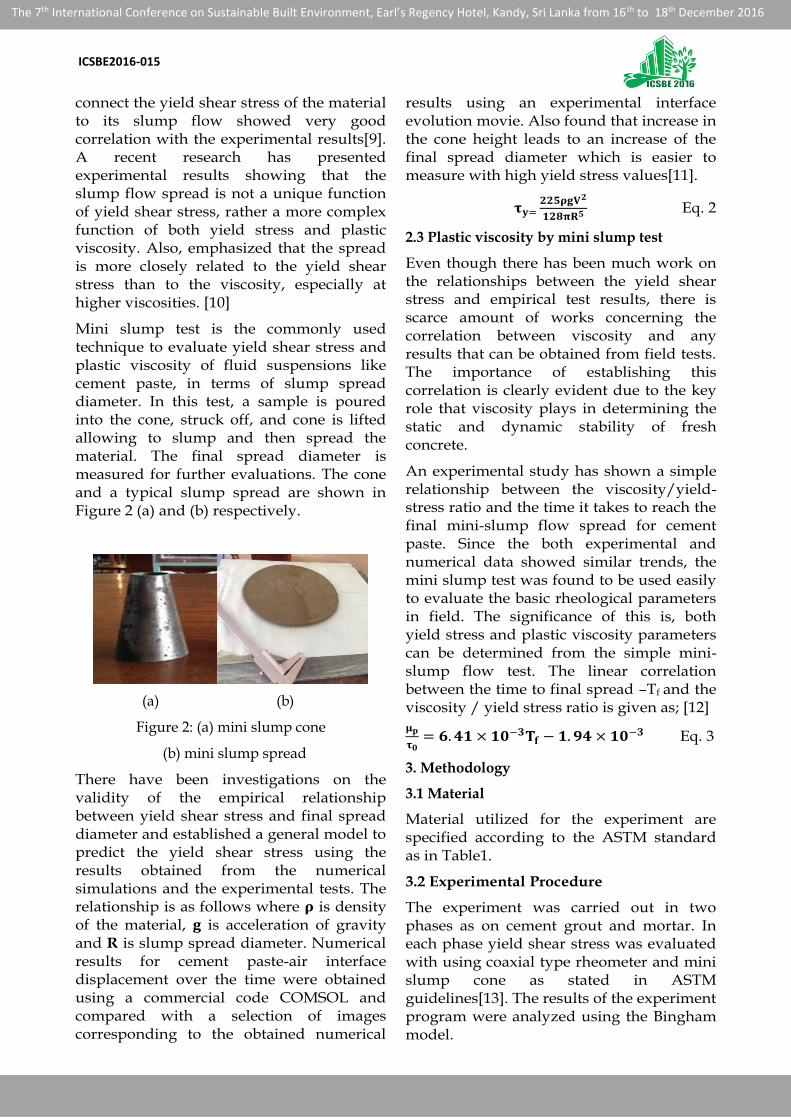
Mini slump test is the commonly used technique to evaluate yield shear stress and plastic viscosity of fluid suspensions like cement paste, in terms of slump spread diameter. In this test, a sample is poured into the cone, struck off, and cone is lifted allowing to slump and then spread the material. The final spread diameter is measured for further evaluations. The cone and a typical slump spread are shown in Figure 2 (a) and (b) respectively.
(a) (b)
Figure 2: (a) mini slump cone
(b) mini slump spread
There have been investigations on the validity of the empirical relationship between yield shear stress and final spread diameter and established a general model to predict the yield shear stress using the results obtained from the numerical simulations and the experimental tests. The relationship is as follows where 𝛒 is density of the material, 𝐠 is acceleration of gravity and R is slump spread diameter. Numerical results for cement paste-air interface displacement over the time were obtained using a commercial code COMSOL and compared with a selection of images corresponding to the obtained numerical
results using an experimental interface evolution movie. Also found that increase in the cone height leads to an increase of the final spread diameter which is easier to measure with high yield stress values[11].
𝛕𝐲=𝟐𝟐𝟓𝛒𝐠𝐕𝟐
𝟏𝟐𝟖𝛑𝐑𝟓 Eq. 2
2.3 Plastic viscosity by mini slump test
Even though there has been much work on the relationships between the yield shear stress and empirical test results, there is scarce amount of works concerning the correlation between viscosity and any results that can be obtained from field tests. The importance of establishing this correlation is clearly evident due to the key role that viscosity plays in determining the static and dynamic stability of fresh concrete.
An experimental study has shown a simple relationship between the viscosity/yield-stress ratio and the time it takes to reach the final mini-slump flow spread for cement paste. Since the both experimental and numerical data showed similar trends, the mini slump test was found to be used easily to evaluate the basic rheological parameters in field. The significance of this is, both yield stress and plastic viscosity parameters can be determined from the simple mini-slump flow test. The linear correlation between the time to final spread –Tf and the viscosity / yield stress ratio is given as; [12]
𝛍𝐩
𝛕𝟎= 𝟔. 𝟒𝟏 × 𝟏𝟎−𝟑𝐓𝐟 − 𝟏. 𝟗𝟒 × 𝟏𝟎−𝟑 Eq. 3
3. Methodology
3.1 Material
Material utilized for the experiment are specified according to the ASTM standard as in Table1.
3.2 Experimental Procedure
The experiment was carried out in two phases as on cement grout and mortar. In each phase yield shear stress was evaluated with using coaxial type rheometer and mini slump cone as stated in ASTM guidelines[13]. The results of the experiment program were analyzed using the Bingham model.
ICSBE2016-015
The 7th International Conference on Sustainable Built Environment, Earl’s Regency Hotel, Kandy, Sri Lanka from 16th to 18th December 2016
Table 1: Material properties
Material Description
Cement (Primary binder)
ASTM Type 1 OPC
Specific gravity - 3.05 g/cm3
Blaine fineness – 334 m2/kg
Fly ash
(Secondary binder)
ASTM Type F
Specific gravity–2.15 g/cm3
Blaine fineness – 438 m2/kg
HRWRA ASTM C618 Type B
Dispersing rate – 0.7-1.2 L/100kg
Fine aggregate
River sand
Passing 1180 μm and retaining 600 μm
As the first stage in phase I the effect of HRWRA on yield shear stress was observed, varying HRWRA dosage between 0.8-1.4 L/100kg of cement, with 0.2 L/100kg increments occupying two w/c ratios 0.42 and 0.45. As in the second stage, the effect of FA on yield shear stress was observed, varying the FA content from 20% by mass of cement with 5% increments, until yield shear stress become larger enough to prevent the slump spread of the mix. Same w/c ratios were occupied and HRWR dosage was kept constant at 1 L/100kg.
During phase II experiment was carried out on mortar, with the inclusion of sand in to grout mix, at the same w/c ratios as in phase I. Sand content was varied from 20% by total volume of the sample, with 5% increments until the mix remained plastic. HRWR dosage and FA were kept constant during this stage at 1 L/100kg and 30% by mass of cementitious material respectively. A summary of mix compositions is given in Table 2.
3.3 Experimental apparatus and mixing procedures
To evaluate yield shear stress of test specimens, two apparatus were used;
coaxial type concentric rheometer (Figure 3(a)) and mini slump cone (Figure 2(a)).
Table 2: Mix compositions
Ingredients Variable Range
Ph
ase
I Cement
Water HRWR
HRWR dosage
0.8-1.4 L/100 kg by mass of
cement
Ph
ase
I Cement
Water HRWR Fly ash
Fly ash content
20% - 40% by mass of cement
Ph
ase
II
Cement Water HRWR Fly ash Sand
Sand content
20% - 45% by total volume
(a). coaxial type concentric rheometer
Coaxial type concentric rheometer is the standard method for the evaluation of yield shear stress in the laboratory. The experiment was in accordance with the guidelines given in ASTM C1749; "Standard Guide for the measurement of rheological properties of a hydraulic cementitious paste using a rotational rheometer". Since the maximum particle size of the material used was less than 1.18 mm, the rheometer was modified to a narrow-gap concentric cylinder, to comply with the following condition where R1 and R2 is the radius (m) of the inner stationary cylinder and the outer rotating cylinder respectively.
𝑅1
R2 > = 0.92 Eq. 4
In the coaxial type cylindrical rheometer, the sample is poured into the gap between two cylinders and the outer cylinder is rotated, while the inner cylinder is remaining stationary. Thus, to reduce the slip of the liquid layer that develops at the wall of the rotating (outer) cylinder, the surface was roughened.
After filling the gap between two cylinders completely with the mix, the rotational speed was varied between 0-60 rpm. All the readings were first taken in the ascending

ICSBE2016-015
The 7th International Conference on Sustainable Built Environment, Earl’s Regency Hotel, Kandy, Sri Lanka from 16th to 18th December 2016
order and then, in the descending order. The torque and the rotational speed were recorded at each stage and converted to shear stress and shearing rate respectively. According to ASTM standard specification for a narrow gap concentric cylinder, following equations were used to determine shear stress and shearing rate from the torque and rotational speed.
Shearing Rate =Ω𝑖 .R2
R2−R1 Eq. 5
Shear Stress = T
2πR𝟏𝟐L
Eq. 6
i - rotational speed of the outer cylinder (r/s)
T - torque (Nm)
L - length of the cylinder (m)
The expected variation of torque with the rotational speed is indicated in the Figure 3(b). Yield shear stress is given by the gradient of the graph.
(a) (b)
Figure 3: (a) Concentric cylindrical rheometer
(b)Variation of torque with the rotational speed
(b). mini slump cone
Mini slump is an indirect method that admits the evaluation of yield shear stress of cement grouts and mortar. The cone that rested on a smooth horizontal glass plate, was completely filled with the paste and lifted vertically with a motion rapid enough for the cone to remain clear of the flowing paste, but slow enough to avoid imparting a significant upward momentum to the paste. The flow continued until the steady state reached where the local stress of the material reduced to the yield shear stress. Final average (Figure 2(b)) spread diameter
was measured in two perpendicular directions and yield shear stress of the paste was calculated using the empirical equation. (Equation (2))
During the mixing process of cement paste two different approaches, specified in ASTM standards were occupied for cement grout and mortar separately. Mixing of cement grout was done according to the ASTM C1738- “Standard Practice for High-Shear Mixing of Hydraulic Cement Pastes” as it provides a grout with rheological properties similar to those obtained in a concrete from which the aggregate has been removed[14]. A high speed mixture that imparts a significantly higher shearing was employed to occupy the shear loss due to the absence of sand. Thus the practice is known as high-shear mixing. Mixing of mortar was done using Hobart mixer according to ASTM C 305 which is the standard practice for ‘‘Mechanical Mixing of Hydraulic Cement Pastes and Mortars of Plastic Consistency”[15].
4. Results and Discussion
4.1 Influence of HRWR admixture dosage on yield shear stress of cement grout
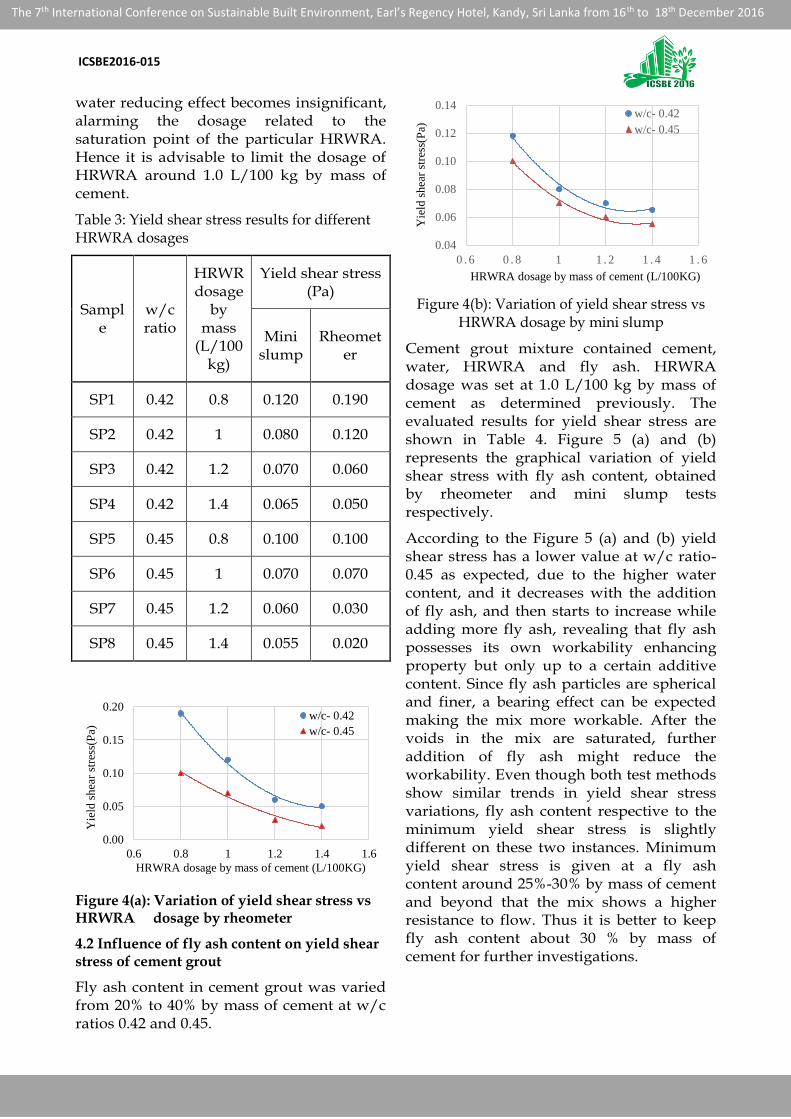
HRWR admixture content of cement grout was varied from 0.8 to 1.4 L/100 kg by mass of cement at w/c ratios 0.42 and 0.45. Cement grout comprised of cement, water and HRWR admixture only. The evaluated results for yield shear stress of cement grout are shown in Table 3. Figure 4 (a) and (b) depicts the graphical variation of yield shear stress with HRWR admixture dosage by mass of cement, obtained by rheometer and mini slump tests respectively.
According to the Figure 4 (a) and (b) yield shear stress of the mix, occupies a much lower value at w/c ratio-0.45 as intended due to higher water content and it decreases with the addition of HRWRA in higher doses irrespective of w/c ratio, making the mix is more workable.A polynomial function suits well with the variation. Furthermore, it shows that yield shear stress drastically decreases when HRWRA dosage is increased from 0.8 to 1.2 L/100 kg. Beyond HRWRA dosage- 1.2 L/100 kg,
To
rqu
e(kgf)
Rotatinal speed (rpm)
ICSBE2016-015
The 7th International Conference on Sustainable Built Environment, Earl’s Regency Hotel, Kandy, Sri Lanka from 16th to 18th December 2016
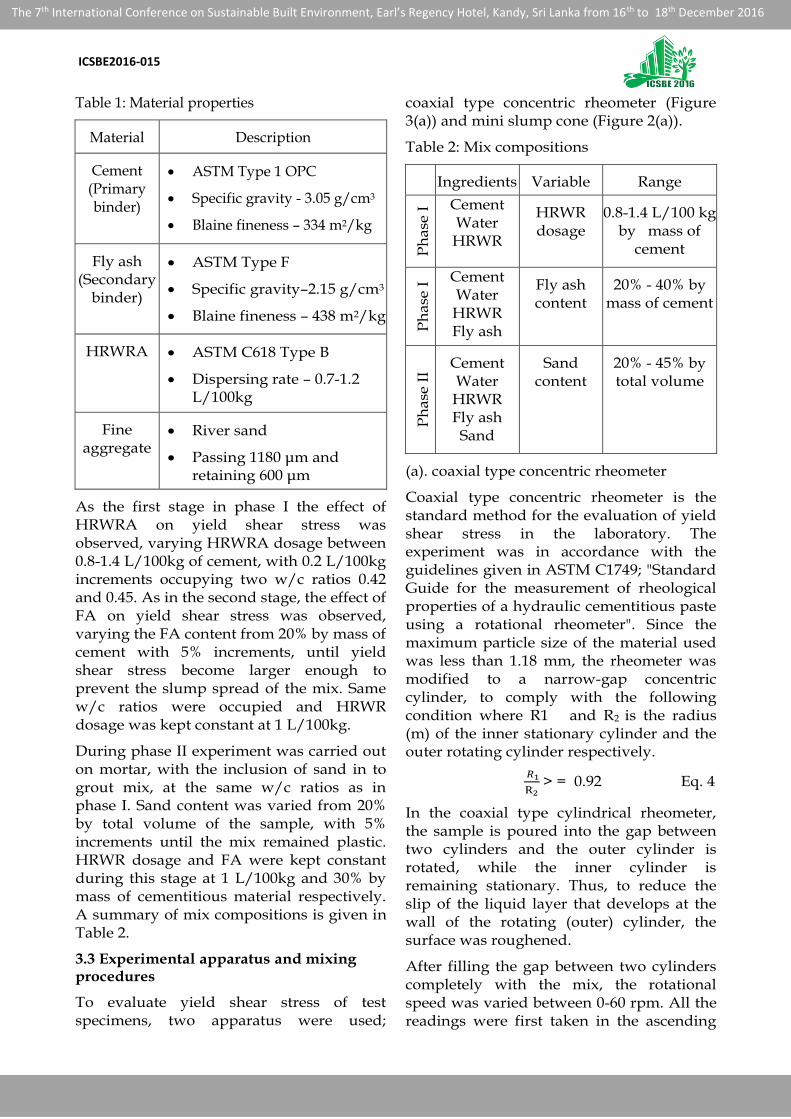
water reducing effect becomes insignificant, alarming the dosage related to the saturation point of the particular HRWRA. Hence it is advisable to limit the dosage of HRWRA around 1.0 L/100 kg by mass of cement.
Table 3: Yield shear stress results for different HRWRA dosages
Sample
w/c ratio
HRWR dosage
by mass
(L/100kg)
Yield shear stress (Pa)
Mini slump
Rheometer
SP1 0.42 0.8 0.120 0.190
SP2 0.42 1 0.080 0.120
SP3 0.42 1.2 0.070 0.060
SP4 0.42 1.4 0.065 0.050
SP5 0.45 0.8 0.100 0.100
SP6 0.45 1 0.070 0.070
SP7 0.45 1.2 0.060 0.030
SP8 0.45 1.4 0.055 0.020
Figure 4(a): Variation of yield shear stress vs HRWRA dosage by rheometer
4.2 Influence of fly ash content on yield shear stress of cement grout
Fly ash content in cement grout was varied from 20% to 40% by mass of cement at w/c ratios 0.42 and 0.45.
Figure 4(b): Variation of yield shear stress vs HRWRA dosage by mini slump
Cement grout mixture contained cement, water, HRWRA and fly ash. HRWRA dosage was set at 1.0 L/100 kg by mass of cement as determined previously. The evaluated results for yield shear stress are shown in Table 4. Figure 5 (a) and (b) represents the graphical variation of yield shear stress with fly ash content, obtained by rheometer and mini slump tests respectively.
According to the Figure 5 (a) and (b) yield shear stress has a lower value at w/c ratio-0.45 as expected, due to the higher water content, and it decreases with the addition of fly ash, and then starts to increase while adding more fly ash, revealing that fly ash possesses its own workability enhancing property but only up to a certain additive content. Since fly ash particles are spherical and finer, a bearing effect can be expected making the mix more workable. After the voids in the mix are saturated, further addition of fly ash might reduce the workability. Even though both test methods show similar trends in yield shear stress variations, fly ash content respective to the minimum yield shear stress is slightly different on these two instances. Minimum yield shear stress is given at a fly ash content around 25%-30% by mass of cement and beyond that the mix shows a higher resistance to flow. Thus it is better to keep fly ash content about 30 % by mass of cement for further investigations.
0.00
0.05
0.10
0.15
0.20
0.6 0.8 1 1.2 1.4 1.6
Yie
ld s
hea
r st
ress
(Pa)
HRWRA dosage by mass of cement (L/100KG)
w/c- 0.42
w/c- 0.45
0.04
0.06
0.08
0.10
0.12
0.14
0 . 6 0 . 8 1 1 . 2 1 . 4 1 . 6
Yie
ld s
hea
r st
ress
(Pa)
HRWRA dosage by mass of cement (L/100KG)
w/c- 0.42
w/c- 0.45
ICSBE2016-015
The 7th International Conference on Sustainable Built Environment, Earl’s Regency Hotel, Kandy, Sri Lanka from 16th to 18th December 2016
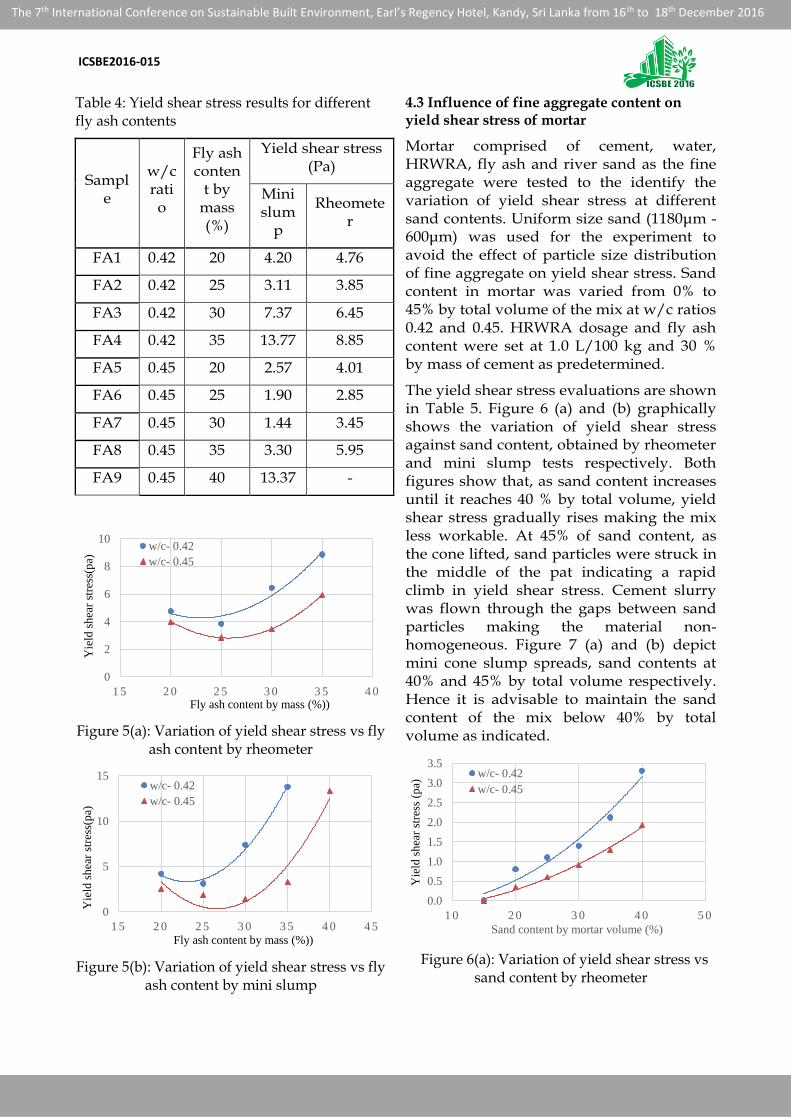
Table 4: Yield shear stress results for different fly ash contents
Sample
w/c ratio
Fly ash conten
t by mass (%)
Yield shear stress (Pa)
Mini slum
p
Rheometer
FA1 0.42 20 4.20 4.76
FA2 0.42 25 3.11 3.85
FA3 0.42 30 7.37 6.45
FA4 0.42 35 13.77 8.85
FA5 0.45 20 2.57 4.01
FA6 0.45 25 1.90 2.85
FA7 0.45 30 1.44 3.45
FA8 0.45 35 3.30 5.95
FA9 0.45 40 13.37 -
Figure 5(a): Variation of yield shear stress vs fly ash content by rheometer
Figure 5(b): Variation of yield shear stress vs fly ash content by mini slump
4.3 Influence of fine aggregate content on yield shear stress of mortar
Mortar comprised of cement, water, HRWRA, fly ash and river sand as the fine aggregate were tested to the identify the variation of yield shear stress at different sand contents. Uniform size sand (1180μm - 600μm) was used for the experiment to avoid the effect of particle size distribution of fine aggregate on yield shear stress. Sand content in mortar was varied from 0% to 45% by total volume of the mix at w/c ratios 0.42 and 0.45. HRWRA dosage and fly ash content were set at 1.0 L/100 kg and 30 % by mass of cement as predetermined.
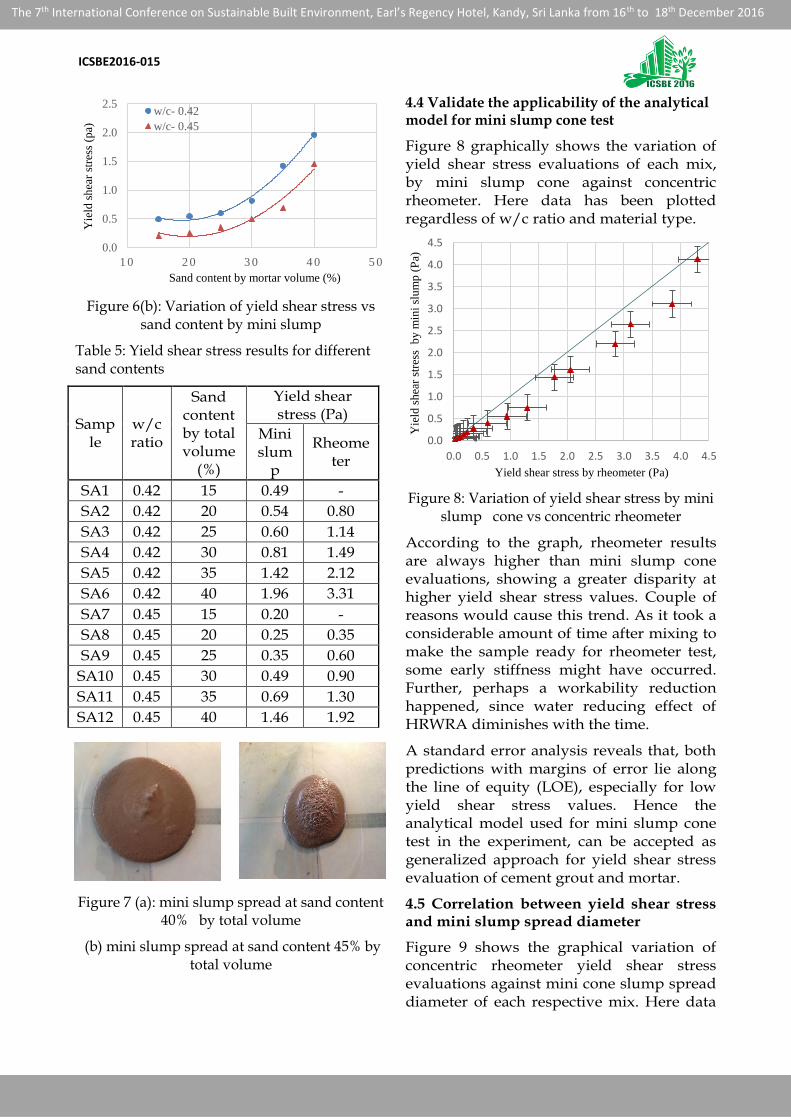
The yield shear stress evaluations are shown in Table 5. Figure 6 (a) and (b) graphically shows the variation of yield shear stress against sand content, obtained by rheometer and mini slump tests respectively. Both figures show that, as sand content increases until it reaches 40 % by total volume, yield shear stress gradually rises making the mix less workable. At 45% of sand content, as the cone lifted, sand particles were struck in the middle of the pat indicating a rapid climb in yield shear stress. Cement slurry was flown through the gaps between sand particles making the material non-homogeneous. Figure 7 (a) and (b) depict mini cone slump spreads, sand contents at 40% and 45% by total volume respectively. Hence it is advisable to maintain the sand content of the mix below 40% by total volume as indicated.
Figure 6(a): Variation of yield shear stress vs sand content by rheometer
0
2
4
6
8
10
1 5 2 0 2 5 3 0 3 5 4 0
Yie
ld s
hea
r st
ress
(pa)
Fly ash content by mass (%))
w/c- 0.42
w/c- 0.45
0
5
10
15
1 5 2 0 2 5 3 0 3 5 4 0 4 5
Yie
ld s
hea
r st
ress
(pa)
Fly ash content by mass (%))
w/c- 0.42
w/c- 0.45
0.0
0.5
1.0
1.5
2.0
2.5
3.0
3.5
1 0 2 0 3 0 4 0 5 0
Yie
ld s
hea
r st
ress
(p
a)
Sand content by mortar volume (%)
w/c- 0.42
w/c- 0.45
ICSBE2016-015
The 7th International Conference on Sustainable Built Environment, Earl’s Regency Hotel, Kandy, Sri Lanka from 16th to 18th December 2016
Figure 6(b): Variation of yield shear stress vs sand content by mini slump
Table 5: Yield shear stress results for different sand contents
Sample
w/c ratio
Sand content by total volume
(%)
Yield shear stress (Pa)
Mini slum
p
Rheometer
SA1 0.42 15 0.49 -
SA2 0.42 20 0.54 0.80
SA3 0.42 25 0.60 1.14
SA4 0.42 30 0.81 1.49
SA5 0.42 35 1.42 2.12
SA6 0.42 40 1.96 3.31
SA7 0.45 15 0.20 -
SA8 0.45 20 0.25 0.35
SA9 0.45 25 0.35 0.60
SA10 0.45 30 0.49 0.90
SA11 0.45 35 0.69 1.30
SA12 0.45 40 1.46 1.92
Figure 7 (a): mini slump spread at sand content 40% by total volume
(b) mini slump spread at sand content 45% by total volume
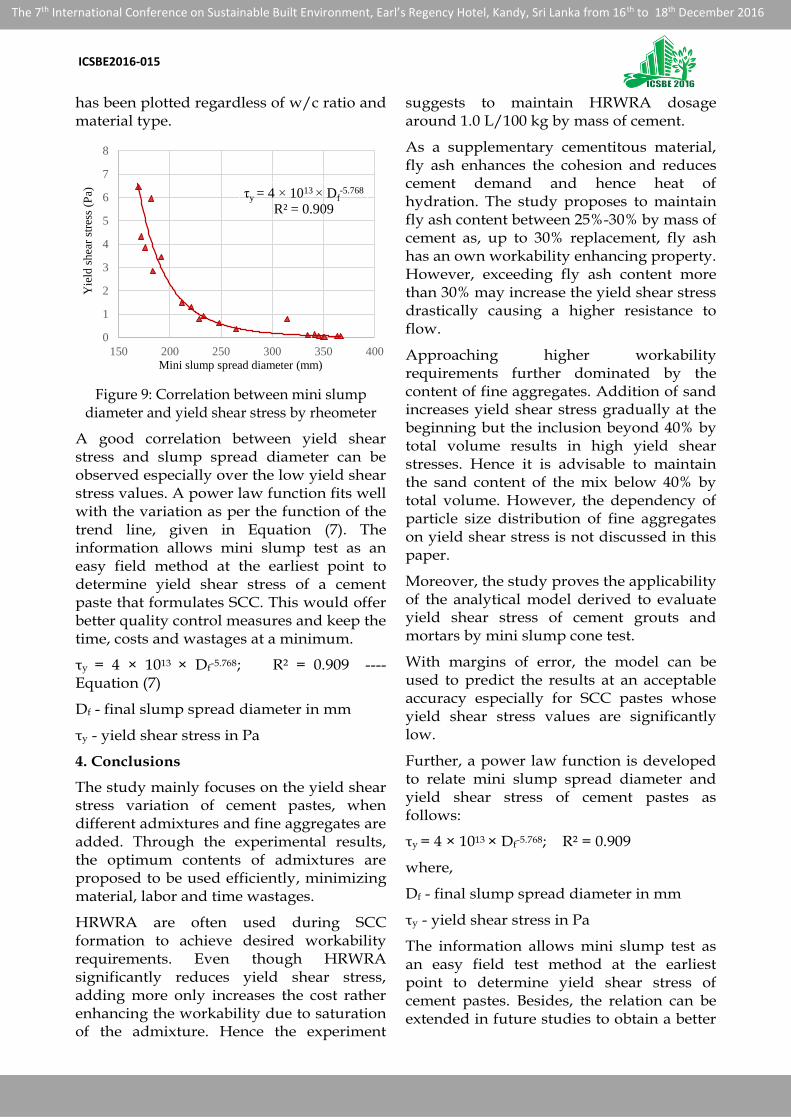
4.4 Validate the applicability of the analytical model for mini slump cone test
Figure 8 graphically shows the variation of yield shear stress evaluations of each mix, by mini slump cone against concentric rheometer. Here data has been plotted regardless of w/c ratio and material type.
Figure 8: Variation of yield shear stress by mini slump cone vs concentric rheometer
According to the graph, rheometer results are always higher than mini slump cone evaluations, showing a greater disparity at higher yield shear stress values. Couple of reasons would cause this trend. As it took a considerable amount of time after mixing to make the sample ready for rheometer test, some early stiffness might have occurred. Further, perhaps a workability reduction happened, since water reducing effect of HRWRA diminishes with the time.
A standard error analysis reveals that, both predictions with margins of error lie along the line of equity (LOE), especially for low yield shear stress values. Hence the analytical model used for mini slump cone test in the experiment, can be accepted as generalized approach for yield shear stress evaluation of cement grout and mortar.
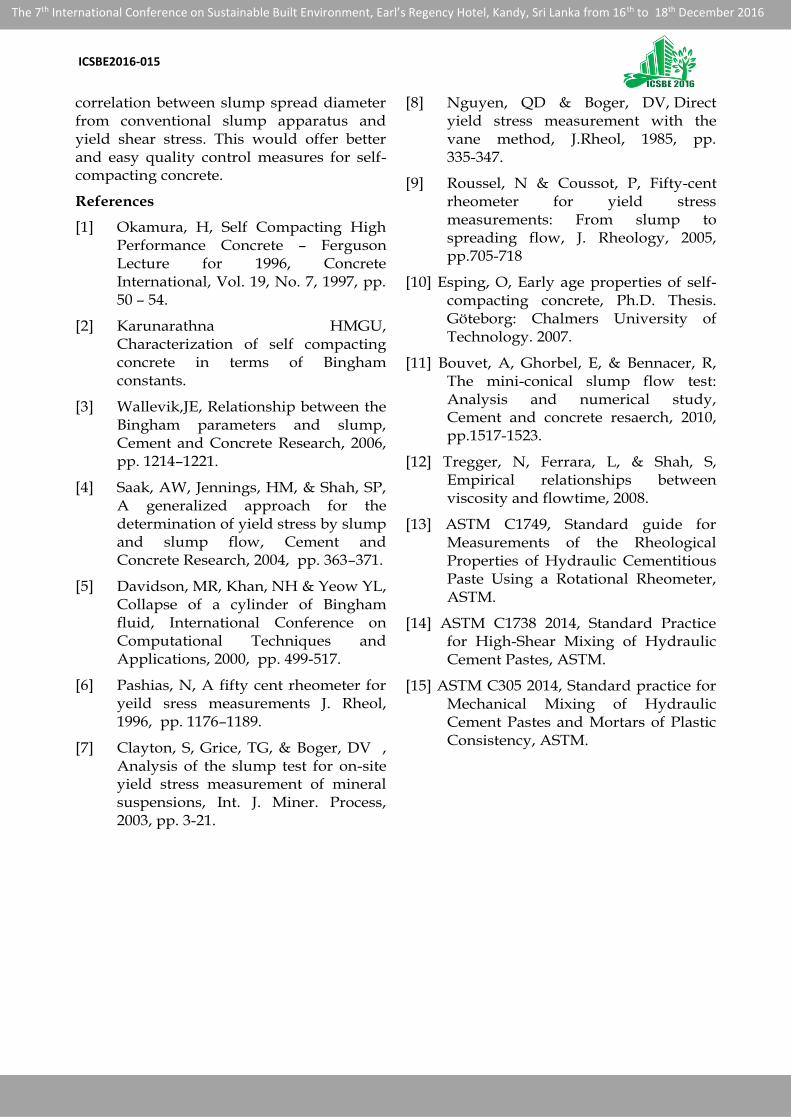
4.5 Correlation between yield shear stress and mini slump spread diameter
Figure 9 shows the graphical variation of concentric rheometer yield shear stress evaluations against mini cone slump spread diameter of each respective mix. Here data
0.0
0.5
1.0
1.5
2.0
2.5
1 0 2 0 3 0 4 0 5 0
Yie
ld s
hea
r st
ress
(p
a)
Sand content by mortar volume (%)
w/c- 0.42
w/c- 0.45
0.0
0.5
1.0
1.5
2.0
2.5
3.0
3.5
4.0
4.5
0.0 0.5 1.0 1.5 2.0 2.5 3.0 3.5 4.0 4.5
Yie
ld s
hea
r st
ress
b
y m
ini
slu
mp
(P
a)
Yield shear stress by rheometer (Pa)
ICSBE2016-015
The 7th International Conference on Sustainable Built Environment, Earl’s Regency Hotel, Kandy, Sri Lanka from 16th to 18th December 2016
has been plotted regardless of w/c ratio and material type.
Figure 9: Correlation between mini slump diameter and yield shear stress by rheometer
A good correlation between yield shear stress and slump spread diameter can be observed especially over the low yield shear stress values. A power law function fits well with the variation as per the function of the trend line, given in Equation (7). The information allows mini slump test as an easy field method at the earliest point to determine yield shear stress of a cement paste that formulates SCC. This would offer better quality control measures and keep the time, costs and wastages at a minimum.
τy = 4 × 10¹³ × Df-5.768; R² = 0.909 ----Equation (7)
Df - final slump spread diameter in mm
τy - yield shear stress in Pa
4. Conclusions
The study mainly focuses on the yield shear stress variation of cement pastes, when different admixtures and fine aggregates are added. Through the experimental results, the optimum contents of admixtures are proposed to be used efficiently, minimizing material, labor and time wastages.
HRWRA are often used during SCC formation to achieve desired workability requirements. Even though HRWRA significantly reduces yield shear stress, adding more only increases the cost rather enhancing the workability due to saturation of the admixture. Hence the experiment
suggests to maintain HRWRA dosage around 1.0 L/100 kg by mass of cement.
As a supplementary cementitous material, fly ash enhances the cohesion and reduces cement demand and hence heat of hydration. The study proposes to maintain fly ash content between 25%-30% by mass of cement as, up to 30% replacement, fly ash has an own workability enhancing property. However, exceeding fly ash content more than 30% may increase the yield shear stress drastically causing a higher resistance to flow.
Approaching higher workability requirements further dominated by the content of fine aggregates. Addition of sand increases yield shear stress gradually at the beginning but the inclusion beyond 40% by total volume results in high yield shear stresses. Hence it is advisable to maintain the sand content of the mix below 40% by total volume. However, the dependency of particle size distribution of fine aggregates on yield shear stress is not discussed in this paper.
Moreover, the study proves the applicability of the analytical model derived to evaluate yield shear stress of cement grouts and mortars by mini slump cone test.
With margins of error, the model can be used to predict the results at an acceptable accuracy especially for SCC pastes whose yield shear stress values are significantly low.
Further, a power law function is developed to relate mini slump spread diameter and yield shear stress of cement pastes as follows:
τy = 4 × 10¹³ × Df-5.768; R² = 0.909
where,
Df - final slump spread diameter in mm
τy - yield shear stress in Pa
The information allows mini slump test as an easy field test method at the earliest point to determine yield shear stress of cement pastes. Besides, the relation can be extended in future studies to obtain a better
τy = 4 × 10¹³ × Df-5.768
R² = 0.909
0
1
2
3
4
5
6
7
8
150 200 250 300 350 400
Yie
ld s
hea
r st
ress
(P
a)
Mini slump spread diameter (mm)
ICSBE2016-015
The 7th International Conference on Sustainable Built Environment, Earl’s Regency Hotel, Kandy, Sri Lanka from 16th to 18th December 2016
correlation between slump spread diameter from conventional slump apparatus and yield shear stress. This would offer better and easy quality control measures for self- compacting concrete.
References
[1] Okamura, H, Self Compacting High Performance Concrete – Ferguson Lecture for 1996, Concrete International, Vol. 19, No. 7, 1997, pp. 50 – 54.
[2] Karunarathna HMGU, Characterization of self compacting concrete in terms of Bingham constants.
[3] Wallevik,JE, Relationship between the Bingham parameters and slump, Cement and Concrete Research, 2006, pp. 1214–1221.
[4] Saak, AW, Jennings, HM, & Shah, SP, A generalized approach for the determination of yield stress by slump and slump flow, Cement and Concrete Research, 2004, pp. 363–371.
[5] Davidson, MR, Khan, NH & Yeow YL, Collapse of a cylinder of Bingham fluid, International Conference on Computational Techniques and Applications, 2000, pp. 499-517.
[6] Pashias, N, A fifty cent rheometer for yeild sress measurements J. Rheol, 1996, pp. 1176–1189.
[7] Clayton, S, Grice, TG, & Boger, DV , Analysis of the slump test for on-site yield stress measurement of mineral suspensions, Int. J. Miner. Process, 2003, pp. 3-21.
[8] Nguyen, QD & Boger, DV, Direct yield stress measurement with the vane method, J.Rheol, 1985, pp. 335-347.
[9] Roussel, N & Coussot, P, Fifty-cent rheometer for yield stress measurements: From slump to spreading flow, J. Rheology, 2005, pp.705-718
[10] Esping, O, Early age properties of self-compacting concrete, Ph.D. Thesis. Göteborg: Chalmers University of Technology. 2007.
[11] Bouvet, A, Ghorbel, E, & Bennacer, R, The mini-conical slump flow test: Analysis and numerical study, Cement and concrete resaerch, 2010, pp.1517-1523.
[12] Tregger, N, Ferrara, L, & Shah, S, Empirical relationships between viscosity and flowtime, 2008.
[13] ASTM C1749, Standard guide for Measurements of the Rheological Properties of Hydraulic Cementitious Paste Using a Rotational Rheometer, ASTM.
[14] ASTM C1738 2014, Standard Practice for High-Shear Mixing of Hydraulic Cement Pastes, ASTM.
[15] ASTM C305 2014, Standard practice for Mechanical Mixing of Hydraulic Cement Pastes and Mortars of Plastic Consistency, ASTM.