you are here - s3.amazonaws.com are here. 2 cognizant 2009 ... pepperweed advisors in the third...
TRANSCRIPT

ANNUAL REPORT 2009
Being Cognizant means leading clients through the reset economy
YOUARE
HERE

COGNIZANT (NASDAQ: CTSH) is a leading provider
of information technology, consulting, and business
process outsourcing services. Cognizant’s single-
minded passion is to dedicate our global technology
and innovation know-how, our industry expertise,
and worldwide resources to working together with
clients to make their businesses stronger. With
over 50 global development and delivery centers
and approximately 78,400 employees as of
December 31, 2009, we combine a unique global
delivery model infused with a distinct culture of
customer satisfaction. A member of the NASDAQ-100
Index and S&P 500 Index, Cognizant is a Forbes
Global 2000 company and a member of the Fortune
1000. We have been cited by Fortune as one of the
“World’s Most Admired Companies” and also rank
among the top information technology companies
in BusinessWeek’s Hot Growth and Top 50
Performers listings.
$1,4
24,2
67 $2
,135
,577
05
REVENUES (in thousands)
06 07 08 09
$2
,816
,30
4
$3,278
,663
$8
85
,83
0
$25
8,9
43 $3
81,5
22
05
OPERATING INCOME (in thousands)
06 07 08 09
$5
16,6
70 $618
,490
$17
7,6
16
38,8
53
55
,40
5
05
EMPLOYEES
06 07 08 09
61,6
97
78,422
24,3
42
$1,0
73,4
99
$1,4
68
,210
05
STOCKHOLDERS’ EQUITY (in thousands)
06 07 08 09
$1,9
65
,578 $
2,653,17
7
$7
14,14
5

To Our Stockholders:
In 2009, the challenges of the global economic recession placed an even greater premium on the value Cognizant brings to our client relationships. Being Cognizant meant partnering with clients — more than ever before — to navigate an uncertain and volatile business environment. However, the recession masked a significant secular shift in how business will be conducted in the future. Changes in technology, greater globalization, and the growing influence of Millennials as both clients and employees will compel companies to reconsider their existing business models. They will need to understand how to make their organizations not merely more efficient and effective, but also more innovative and virtualized. Thus, businesses now face a “reset economy” that poses twin challenges: preparing for an eventual cyclical upturn while transforming the way they approach their workplace, their marketplace, and their place in the competitive landscape.
COGNIZANT 2009 ANNUAL REPORT
EFFICIENCY
VIRTUALIZATION
EF
FE
CT
IVE
NE
SS IN
NO
VA
TIO
N
IN THE RESET ECONOMY, achieving efficiency is not enough. Organizations must cross new thresholds of effectiveness, to achieve operational excellence and productivity; innovation, through agility and revenue growth; and virtualization, by sharing knowledge across distributed teams. Cognizant helps clients locate the intersection of these forces to transform their businesses and drive optimum performance.
= New performance threshold
= Old performance threshold
YOUARE
HERE

2
COGNIZANT 2009 ANNUAL REPORT
LEADING CLIENTS THROUGH THE RESET ECONOMY
When we look back on this period, we will see it as an inflection point when the
implications of the reset economy became tangible for companies, markets, and
consequently, for our business. In this environment, Cognizant is uniquely positioned
to lead clients toward more efficient, effective, innovative, and virtualized business
models. We were born global and have grown up virtualized. Our people fully embrace
the collaborative and open work processes that will characterize the future of work.
We are drawing upon these inherent qualities to help clients succeed in this new work
environment, to ensure that both our clients and Cognizant win in the reset economy.
Being Cognizant means seeing beyond the current market cycle and leading clients to new, more productive business models.
During the past year, Cognizant focused on strengthening our value proposition
for clients. At a time when it might have been tempting to cut back on spending
for new initiatives, we made vital investments required to meet clients’ needs in a
shifting business landscape. At the same time, we managed our own business in
a focused and disciplined manner to achieve greater efficiency, productivity, and
employee utilization in a difficult cycle. As a result, we emerged from the downturn
stronger than when we went in — and well positioned to partner with clients, provide
exceptional value, and continue delivering industry-leading growth.
2009 FINANCIAL RESULTS
Cognizant’s 2009 results were distinguished by record revenue and earnings,
and growth rates that again surpassed our industry peers. Revenue rose 16% to
$3.3 billion. GAAP net income increased to $535.0 million, or $1.78 per diluted share,
from $430.8 million, or $1.44 per diluted share, for 2008. Diluted earnings per share
on a non-GAAP basis, excluding stock-based compensation expense and stock-based
Indian fringe benefit tax expense, grew in 2009 to $1.90, from $1.59 for 2008. GAAP
operating margin was 18.9%, while the non-GAAP operating margin was 20.3%.
We ended the year with cash, short-term and long-term investments of more than
$1.5 billion, an increase of over $625 million from a year ago.
Our performance reflected significant progress in the three key drivers of our business:
industry sectors, geographic footprint, and service areas. Within our industry sectors,
strong growth in Healthcare, Life Sciences, and Retail more than offset slower growth
in recession-challenged industries such as Financial Services. Geographically, we
continued to expand the scope of our business. Our prior investments to build our
presence in Europe led to an increase of 12.1% in revenues for the region, adjusted
for currency translation. We also established a beachhead in key markets in Asia
and the Middle East. We gained traction in newer service areas, such as Consulting,
IT Infrastructure Services, Business Process Outsourcing (BPO), Knowledge Process
Manufacturing/Retail/Logistics
17.2%
Healthcare 26.3%
Communications, Information,Media & Entertainment,
and High Technology 13.6%
Financial Services
42.9%
2009 TOTAL REVENUE BY INDUSTRY

3
CASE STUDY:
CLINICAL DATA MANAGEMENT
CHALLENGE:
AstraZeneca, one of the world’s top pharmaceutical companies, sought solutions for further increasing the efficiency of its drug development operations, as well as a range of services in other functional areas, including discovery, sales/marketing, and operations.
SOLUTION:
Forming a strategic partnership with Cognizant provided AstraZeneca with a centralized, end-to-end solution for its clinical data management processes. The engagement has helped AstraZeneca to significantly reduce operational costs and will support the overall business goals of speeding up the drug development process and getting medicines more quickly to patients. In 2009, Cognizant and AstraZeneca jointly won the Clinical Research Excellence “Data Management Team of the Year” award instituted by the Good Clinical Practice Journal, a leading industry publication, in recognition of the partnership approach and achievements of this engagement.
L NAGEMENT
Outsourcing (KPO), and Enterprise Analytics, which will be strategically important to our
clients going forward.
The key reason for Cognizant’s growth in a difficult economy, however, remains
our ability to forge strong partnerships with clients. In fact, the recession brought
us closer to our clients, who saw Cognizant as a vital resource in their efforts to
manage through the downturn and position their businesses for the longer term. We
know from experience, as well as independent surveys, that our clients view us as a
strategic partner. For this reason, clients typically grow with us: approximately 97%
of our revenue in 2009 came from clients that were with us at the start of the year.
The balance was generated by new client relationships that will provide platforms
for future growth.
INVESTING IN PARTNERSHIP AND PERFORMANCE
Being Cognizant means building the talent pool to help clients succeed while
sustaining our industry-leading growth. In 2009, as others in our industry retrenched,
we continued to invest in areas that increase our value as a partner to our clients. In
particular, we hired some 140 new client partners and account managers during the
past year. Our workforce rose by more than 16,700 for the year to total over 78,400.
We added 10,300 associates in the fourth quarter alone, to ensure that we have
talented people to serve our clients as the economy regains momentum.
Being Cognizant means investing in people and resources to help clients succeed in a changing work environment.
We continued to enhance our global delivery infrastructure, expanding our presence
in Hungary and adding delivery centers in Mexico and the Philippines. To better
serve both North American clients and multinationals with Canadian operations,
we expanded our Toronto delivery center in late 2009. We also expanded the range
of services offered through our delivery center in Phoenix, Arizona, to include our
BPO/KPO practice. Including our expansion in Phoenix, total employment in North
America is approximately 13,000.
Europe has been an area of particular focus. We have grown our business in the
region by recruiting experienced associates within each of the local markets we
serve, thereby combining Cognizant’s global resources with a strong appreciation of
local culture, language, and business practices. In the U.K., we now work with 24 of
the top 100 publicly-traded companies listed in the FTSE. Also during the year, we
added new clients in France, Germany, Belgium, The Netherlands, Switzerland, and
the Nordic region, in a broad range of sectors. A large number of these clients have
the potential to become significant strategic relationships.
In recent years, another key investment has been our Cognizant 2.0 platform,
which allows us to bring the best people, resources, and capabilities of our global

4
COGNIZANT 2009 ANNUAL REPORT
IN 2010, FOR A SECOND CONSECUTIVE year, Cognizant earned a place among Fortune’s “World’s Most Admired Companies,” ranking in the Top Five among information technology companies.
COGNIZANT WAS #51 ON THE BusinessWeek InfoTech 100 for 2009, in addition to ranking #31 on the BusinessWeek 50 top-performing U.S. companies for the third consecutive year. BusinessWeek attributed Cognizant’s success to its “strategy of assigning high-skilled technology and relationship managers” to partner with clients, and the Cognizant 2.0 platform.
INSTITUTIONAL INVESTOR MAGAZINE ranked Cognizant #1 in the Computer Services and IT Consulting sector on the 2010 All-America Executive Team.
delivery system to any client, anywhere. This pioneering Web 2.0-based platform
enables real-time knowledge management and the seamless sharing of work functions
across our entire delivery network. Cognizant 2.0 thus enhances collaboration
and increases the velocity of project delivery. Moreover, by facilitating knowledge
management — within Cognizant and with our business partners and clients — it results
in higher project quality and greater employee engagement. More than 6,000 client
projects are now managed via Cognizant 2.0.
A chief focus of our growth strategy has been to expand in practice areas that will
enhance our value to clients and offer exceptional growth potential, such as
Consulting, IT Infrastructure, and BPO/KPO. Consulting, in particular, has become a
fully integrated element of our offering to clients, complementing both our vertical
and horizontal practices. The strategic insights provided by our Consulting teams,
consisting of 1,800 people worldwide, are critical to our ability to drive value for
clients. Enterprise Analytics, in which we help clients analyze data collected by their
operations to yield deeper insights into their business, is another expanding area. We
established a base in this area with our 2007 acquisition of marketRx, an analytics
firm serving the Life Sciences industry, and have since added Analytics solutions
for Consumer Goods, Financial Services, Healthcare, Media, and Technology in an
integrated Enterprise Analytics Practice.
ACQUISITIONS AND ALLIANCES
The past year was particularly eventful on the M&A front, as we acquired operations
or businesses that added significantly to our scope of services. We acquired
Pepperweed Advisors in the third quarter, adding deep strategic consulting capability
in key areas of Infrastructure Services, including IT Service Management and
IT Asset Management. Pepperweed also brings seasoned consulting talent and
valuable intellectual property, including well-defined ITIL-based processes, tools, and
frameworks. Cognizant clients will benefit from a comprehensive IT infrastructure
process consulting offering that complements our Operations Maturity Model.
Earlier in the year we acquired Active Intelligence, a systems integration consultancy
specializing in Oracle’s retail solutions portfolio. This is an excellent complement to
our position as an Oracle “Certified Advantage Partner.” We also acquired the UBS
India Service Centre (UBS ISC), a captive service provider to UBS Group, the global
financial giant. Based in Hyderabad, India, the UBS ISC greatly enhanced our offerings
for the financial services industry, adding approximately 1,600 associates and deep
capabilities in wealth management, investment banking, asset management, research,
and remote IT infrastructure management. As part of the transaction, we signed a
multiyear agreement to provide a range of services to UBS units around the world.
New alliances included a global product R&D relationship with Invensys Operations
Management, a major provider of technology, software solutions, and consulting services
to the processing and manufacturing sectors. In addition to maintaining and enhancing
Invensys’ global R&D processes, this will greatly expand our presence in the rapidly
growing engineering services market. Another global R&D relationship involves Invensys
Rail, a leader in railway control and communications systems. We also became an SAP®

5
CASE STUDY:
INSURANCE INDUSTRY INNOVATION
CHALLENGE:
AXA Belgium, part of the AXA Group, a $91 billion global provider of insurance and asset management services, needed a partner to help the company address operational requirements more flexibly and manage IT costs and capacity more tightly.
SOLUTION:
Cognizant deployed a pioneering approach to manage back- and front-office applications across all lines of insurance business built on a managed services model with an outcomes-based pricing model. This is projected to significantly reduce AXA Belgium’s annual IT costs by streamlining IT operations while delivering considerable productivity improvements. We are also setting up specialized delivery centers in Microsoft Silverlight® and SharePoint® technologies and establishing development factories to create reusable software components for various development projects across AXA.
E
N
Global Services Partner, enabling us to work more closely with SAP to enhance the
value clients derive from their investments in SAP solutions. And we formed a strategic
partnership with Temenos, a global provider of integrated core banking systems, whereby
we will establish a Center of Excellence to support the T24 Model Bank software and
enable certain Cognizant associates to deliver T24 implementations.
BUILDING NEW CLIENT RELATIONSHIPS
New client relationships added in 2009 clearly demonstrate our diverse industry
expertise, our solid global delivery network, and the strength of our integrated portfolio
of service offerings. For example, Houghton Mifflin Harcourt, one of the world’s largest
publishers of educational materials, selected Cognizant to provide a range of IT services.
We also are jointly establishing the HMH Digital Transformation Lab to facilitate the
transition from print to digital products.
For Rodale Inc., a major publisher of health and wellness titles, we deployed a Remote
Infrastructure Management (RIM 2.0) platform that has increased operational efficiency,
reduced total cost of ownership, enhanced the customer experience, and better aligned
Rodale’s infrastructure with its business needs.
Marking a foothold in the Middle East, Cognizant was chosen by the United Arab
Emirates’ National Health Insurance Company, Daman, to develop the region’s first
online health insurance portal. In the U.K., we have been selected to help ELEXON
enhance its services for the balancing and settlement of electricity trading, thus
assisting in the efficient and cost-effective provision of energy across Great Britain.
CORPORATE CITIZENSHIP
As a responsible global citizen, Cognizant takes an active role in improving conditions
for the communities where we and our clients live and work.
Being Cognizant means embracing best practices in citizenship, accountability, sustainability, and corporate governance.
In 2009 we launched the “Go Green” initiative to coordinate efforts to conserve energy,
eliminate waste, and reduce our carbon footprint. In India, for example, we have used
Six Sigma techniques to reduce per-capita energy consumption at our facilities by
20%, and improved print management has lowered paper consumption by 40%. Our
campuses also have achieved 100% water recycling. Company-wide, new buildings will
be more energy efficient and LEED certified. We also are using high-definition video-
conferencing and telepresence capabilities globally to eliminate unnecessary business
travel and reduce our carbon footprint, while also fostering greater collaboration with
clients and associates.
The Cognizant Foundation embodies our passion for making a difference, providing
financial and technical support for programs to improve educational and healthcare

6
COGNIZANT 2009 ANNUAL REPORT
CASE STUDY:
BRINGING VITAL VACCINES TO MARKET
CHALLENGE:
Sanofi Pasteur, the largest company in the world devoted to human vaccines, produces 40% of the influenza vaccines used globally. To deliver vital H1N1 vaccines without compromising quality and safety, Sanofi Pasteur needed an innovative approach to clinical trial management.
SOLUTION:
The company turned to the Cognizant 2.0 platform to empower collaboration among research and clinical data management teams spread across the U.S., France, and India. This and other Cognizant processes helped Sanofi Pasteur meet aggressive deadlines on five H1N1 studies and deliver vaccines to market in an expedited manner. Today, Cognizant is helping Sanofi Pasteur execute more than 30 clinical studies, streamlining processes while accelerating time to value.
VITAL TTTO
opportunities. Outreach, Cognizant’s employee-driven corporate social responsibility
arm, has benefited communities in India and China by partnering with more than 90
schools and 14 orphanages. More than 5,000 volunteers have played a pivotal role
in organizing over 500 projects, impacting more than 100,000 lives in the two years
since the effort’s launch in November 2007. We also have channeled vital supplies
to communities devastated by natural disasters, such as the earthquake in Haiti and
tropical storms in India and Bangladesh.
Cognizant is committed to conducting business ethically, according to the highest
personal, professional, and corporate governance standards and in compliance with
all applicable regulations. Our senior leadership team has established and maintains
a strong ethical climate, overseen by an independent Board of Directors and
supported by an effective system of internal controls.
PROVIDING CLARITY
As we look forward to 2010 and beyond, we foresee a new wave of opportunity
brought about by the transition to the reset economy. While businesses have been
struggling with the impact of the global recession, they will soon need to face up to
important secular shifts that are occurring in almost every industry sector. These
shifts are being driven by significant changes in technology, regulation, globalization,
demographics, and customer demands. Financial institutions must deal with changes
in regulations, risk tolerance, and competition in the aftermath of the industry’s near
meltdown. Healthcare payers and providers must grapple with issues of cost control,
service delivery, and the new healthcare reform environment. Retailers must cope
with the possibility that consumers will maintain their newfound frugality. Technology
and pharmaceutical companies must improve their returns on R&D investment in
order to sustain growth. The media and entertainment sector must deal with the
growth of electronic media and its impact on the way content is delivered.
At the same time, all industries must face the implications of disruptive new
technologies such as social media and cloud computing on their businesses. The
trends toward virtualization and globalization mean that many knowledge activities
can be divided into small sub-functions, performed in the locations with the highest
expertise and/or lowest cost, and reintegrated seamlessly. And as Millennials grow in
proportion to the global population, they will place new demands on employers and
providers of products and services.
Being Cognizant means bringing the power of a global, virtualized, innovative organization to client solutions.
Given these vast shifts, businesses now must look beyond simply recovering from the
downturn, to reinventing for the future. The need for transformation will come with
particular urgency in industries where the management of knowledge assets is a
driving force for their businesses.

7
FRANCISCO D’SOUZA PRESIDENT AND CHIEF EXECUTIVE OFFICER
Our clients are looking for us to lead them through the transition to the reset
economy — and Cognizant is ready. We have created a strategic framework to provide
clarity to clients seeking to understand how best to transform their business. Our
framework helps clients identify the factors that will drive their businesses across
four key parameters: Efficiency, to continually optimize cost structures; Effectiveness,
to drive operational excellence and productivity; Innovation, based on agility and
managed revenue growth; and Virtualization, in which knowledge processes are
shared by highly distributed teams. This framework is the basis for a deep exploration
of the specific industry, market, and other issues that have an impact on our clients’
businesses. In turn, this allows us to work with clients to structure the right balance
of efficiency, effectiveness, innovation, and virtualization that will lead to a successful
transformation of their enterprise.
THE POWER OF “AND”
The challenges and opportunities that organizations face in the reset economy are
multidimensional, and the solutions must be as well. At Cognizant, we do not believe
that clients should be forced to compromise by choosing either a strategic partner or a
cost-effective outsourcing provider. We pride ourselves on offering clients the power of
“and” — both the deep strategic capabilities of a top multinational consultancy and the
cost advantages of a best-in-class outsourcing company. We are continually working
to further strengthen our value proposition by enriching our services, extending our
domain expertise, adding talented people, and maintaining an effective global
delivery system.
Cognizant will succeed in the reset economy because of our abiding passion
to serve as a trusted partner to our clients, to provide an attractive career
opportunity for our associates, to deliver meaningful value to our stock-
holders, and to contribute to the well-being of our communities. We look
forward to sharing our progress with you in the coming year and beyond.
Sincerely,
Francisco D’Souza
President and Chief Executive Officer
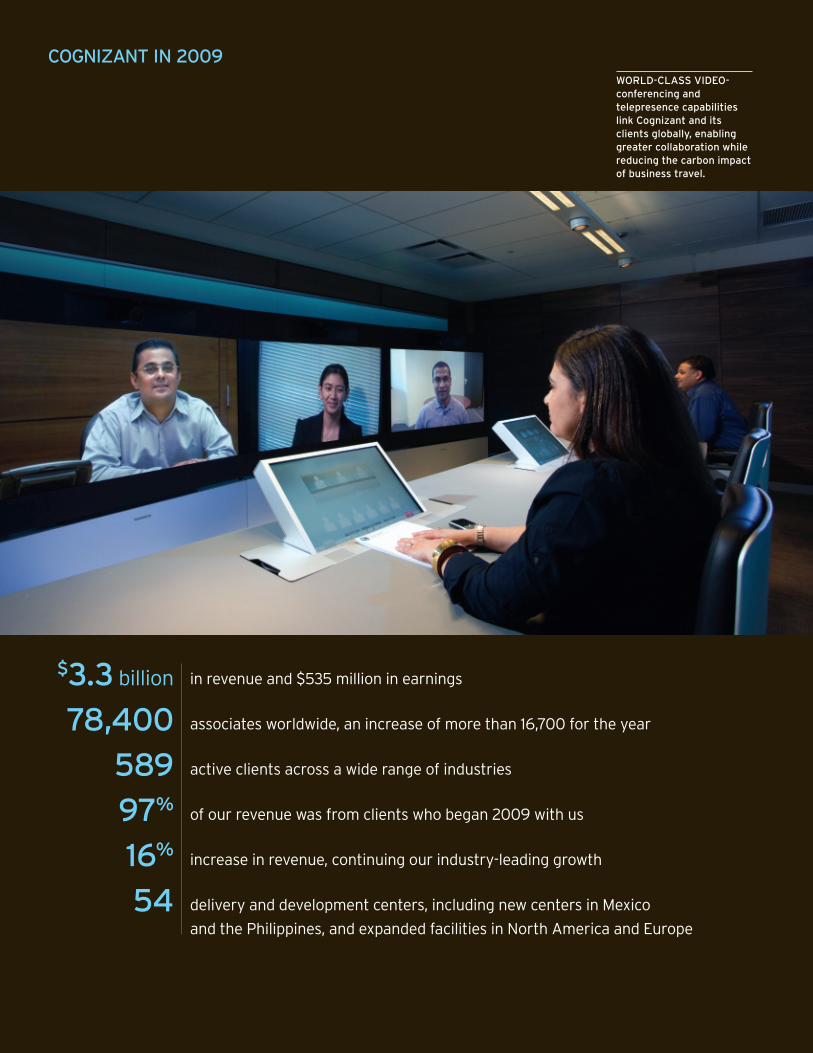
COGNIZANT IN 2009
in revenue and $535 million in earnings
associates worldwide, an increase of more than 16,700 for the year
active clients across a wide range of industries
of our revenue was from clients who began 2009 with us
increase in revenue, continuing our industry-leading growth
delivery and development centers, including new centers in Mexico
and the Philippines, and expanded facilities in North America and Europe
$3.3 billion
78,400
589
97%
16%
54
WORLD-CLASS VIDEO-conferencing and telepresence capabilities link Cognizant and its clients globally, enabling greater collaboration while reducing the carbon impact of business travel.

UNITED STATESSECURITIES AND EXCHANGE COMMISSION
Washington, DC 20549
FORM 10-KFOR ANNUAL AND TRANSITION REPORTS
PURSUANT TO SECTIONS 13 OR 15(d) OF THESECURITIES EXCHANGE ACT OF 1934
(Mark One)È ANNUAL REPORT PURSUANT TO SECTION 13 OR 15(d) OF THE SECURITIES EXCHANGE
ACT OF 1934For the fiscal year ended December 31, 2009
OR‘ TRANSITION REPORT PURSUANT TO SECTION 13 OR 15(d) OF THE SECURITIES EXCHANGE
ACT OF 1934For the transition period from to
Commission File Number 0-24429
COGNIZANT TECHNOLOGY SOLUTIONS CORPORATION(Exact Name of Registrant as Specified in Its Charter)
Delaware 13-3728359(State or Other Jurisdiction ofIncorporation or Organization)
(I.R.S. EmployerIdentification No.)
Glenpointe Centre West, 500 Frank W. Burr Blvd.,Teaneck, New Jersey 07666
(Address of Principal Offices) (Zip Code)Registrant’s telephone number, including area code: (201) 801-0233
Securities registered pursuant to Section 12(b) of the Act:Title of each class Name of each exchange on which registered
Class A Common Stock, $0.01 par value per share The NASDAQ Stock Market LLCSecurities registered pursuant to Section 12(g) of the Act:
Preferred Share Purchase Rights(Title of Class)
Indicate by check mark if the registrant is a well-known seasoned issuer, as defined in Rule 405 of the SecuritiesAct. È Yes ‘ No
Indicate by check mark if the registrant is not required to file reports pursuant to Section 13 or Section 15(d) of theAct. ‘ Yes È No
Indicate by check mark whether the registrant (1) has filed all reports required to be filed by Section 13 or 15(d) of the SecuritiesExchange Act of 1934 during the preceding 12 months (or for such shorter period that the registrant was required to file such reports), and(2) has been subject to such filing requirements for the past 90 days. È Yes ‘ No
Indicate by check mark whether the registrant has submitted electronically and posted on its corporate Website, if any, everyInteractive Data File required to be submitted and posted pursuant to Rule 405 of Regulation S-T during the preceding 12 months (or forsuch shorter period that the registrant was required to submit and post such files). È Yes ‘ No
Indicate by check mark if disclosure of delinquent filers pursuant to Item 405 of Regulation S-K (§229.405 of this chapter) is notcontained herein, and will not be contained, to the best of registrant’s knowledge, in definitive proxy or information statementsincorporated by reference in Part III of this Form 10-K or any amendment to this Form 10-K. ‘
Indicate by check mark whether the registrant is a large accelerated filer, an accelerated filer, a non-accelerated filer, or a smallerreporting company. See definitions of “large accelerated filer,” “accelerated filer” and “smaller reporting company” in Rule 12b-2 of theExchange Act. (Check one):
Large accelerated filer È Accelerated filer ‘Non-accelerated filer ‘ (Do not check if a smaller reporting company) Smaller reporting company ‘Indicate by check mark whether the registrant is a shell company (as defined in Rule 12b-2 of the Act). ‘ Yes È NoThe aggregate market value of the registrant’s voting shares of common stock held by non-affiliates of the registrant on June 30, 2009,
based on $26.70 per share, the last reported sale price on the NASDAQ Global Select Market of the NASDAQ Stock Market LLC on thatdate, was $7,796,158,232.
The number of shares of Class A common stock, $0.01 par value, of the registrant outstanding as of February 15, 2010 was 297,561,219 shares.
DOCUMENTS INCORPORATED BY REFERENCEThe following documents are incorporated by reference into the Annual Report on Form 10-K: Portions of the registrant’s definitive
Proxy Statement for its 2010 Annual Meeting of Stockholders are incorporated by reference into Part III of this Report.


TABLE OF CONTENTS
Item Page
PART I . . . . . . . . . . . . . . . . . . . . . . . . . . . . . . . . . . . . . . . . . . . . . . . . . . . . . . . . . . . . . . . . . . . . . . . . . . . . . . . 11. Business . . . . . . . . . . . . . . . . . . . . . . . . . . . . . . . . . . . . . . . . . . . . . . . . . . . . . . . . . . . . . . . 11A. Risk Factors . . . . . . . . . . . . . . . . . . . . . . . . . . . . . . . . . . . . . . . . . . . . . . . . . . . . . . . . . . . . 161B. Unresolved Staff Comments . . . . . . . . . . . . . . . . . . . . . . . . . . . . . . . . . . . . . . . . . . . . . . . 362. Properties . . . . . . . . . . . . . . . . . . . . . . . . . . . . . . . . . . . . . . . . . . . . . . . . . . . . . . . . . . . . . . 363. Legal Proceedings . . . . . . . . . . . . . . . . . . . . . . . . . . . . . . . . . . . . . . . . . . . . . . . . . . . . . . . 374. Submission of Matters to a Vote of Security Holders . . . . . . . . . . . . . . . . . . . . . . . . . . . . 37
PART II . . . . . . . . . . . . . . . . . . . . . . . . . . . . . . . . . . . . . . . . . . . . . . . . . . . . . . . . . . . . . . . . . . . . . . . . . . . . . . 385. Market for Our Common Equity, Related Stockholder Matters and Purchases of Equity
Securities . . . . . . . . . . . . . . . . . . . . . . . . . . . . . . . . . . . . . . . . . . . . . . . . . . . . . . . . . . . . 386. Selected Consolidated Financial Data . . . . . . . . . . . . . . . . . . . . . . . . . . . . . . . . . . . . . . . . 427. Management’s Discussion and Analysis of Financial Condition and Results of
Operations . . . . . . . . . . . . . . . . . . . . . . . . . . . . . . . . . . . . . . . . . . . . . . . . . . . . . . . . . . . 437A. Quantitative and Qualitative Disclosures About Market Risk . . . . . . . . . . . . . . . . . . . . . . 628. Financial Statements and Supplementary Data . . . . . . . . . . . . . . . . . . . . . . . . . . . . . . . . . 639. Changes in and Disagreements with Accountants on Accounting and Financial
Disclosure . . . . . . . . . . . . . . . . . . . . . . . . . . . . . . . . . . . . . . . . . . . . . . . . . . . . . . . . . . . . 639A. Controls and Procedures . . . . . . . . . . . . . . . . . . . . . . . . . . . . . . . . . . . . . . . . . . . . . . . . . . . 649B. Other Information . . . . . . . . . . . . . . . . . . . . . . . . . . . . . . . . . . . . . . . . . . . . . . . . . . . . . . . . 65
PART III . . . . . . . . . . . . . . . . . . . . . . . . . . . . . . . . . . . . . . . . . . . . . . . . . . . . . . . . . . . . . . . . . . . . . . . . . . . . . 6610. Directors and Executive Officers and Corporate Governance . . . . . . . . . . . . . . . . . . . . . . 6611. Executive Compensation . . . . . . . . . . . . . . . . . . . . . . . . . . . . . . . . . . . . . . . . . . . . . . . . . . 6612. Security Ownership of Certain Beneficial Owners and Management and Related
Stockholder Matters . . . . . . . . . . . . . . . . . . . . . . . . . . . . . . . . . . . . . . . . . . . . . . . . . . . . 6613. Certain Relationships and Related Transactions, and Director Independence . . . . . . . . . . 6614. Principal Accountant Fees and Services . . . . . . . . . . . . . . . . . . . . . . . . . . . . . . . . . . . . . . 66
PART IV . . . . . . . . . . . . . . . . . . . . . . . . . . . . . . . . . . . . . . . . . . . . . . . . . . . . . . . . . . . . . . . . . . . . . . . . . . . . . 6715. Exhibits, Financial Statements and Financial Statement Schedule . . . . . . . . . . . . . . . . . . 67
SIGNATURES . . . . . . . . . . . . . . . . . . . . . . . . . . . . . . . . . . . . . . . . . . . . . . . . . . . . . . . . . . . . . . . . . . . . . . . . . 68EXHIBIT INDEX . . . . . . . . . . . . . . . . . . . . . . . . . . . . . . . . . . . . . . . . . . . . . . . . . . . . . . . . . . . . . . . . . . . . . . . 69INDEX TO CONSOLIDATED FINANCIAL STATEMENTS . . . . . . . . . . . . . . . . . . . . . . . . . . . . . . . . . . . F-1
i

[THIS PAGE INTENTIONALLY LEFT BLANK]

PART I
Item 1. Business
Overview
We are a leading provider of custom Information Technology (IT) consulting and technology services andoutsourcing services. Our customers are primarily Global 2000 companies located in North America, Europe andAsia. Our core competencies include Technology Consulting, Complex Systems Development and Integration,Enterprise Software Package Implementation and Maintenance, Data Warehousing, Business Intelligence andAnalytics, Application Testing, Application Maintenance, Infrastructure Management, and Business andKnowledge Process Outsourcing (BPO and KPO). We tailor our services to specific industries, and utilize anintegrated global sourcing model. This seamless global sourcing model combines technical and accountmanagement teams located on-site at the customer location and at dedicated near-shore and offshoredevelopment and delivery centers located primarily in India, China, the United States, Argentina, Hungary andthe Philippines.
Industry Background
Many companies today face intense competitive pressure and rapidly changing market dynamics, driven bysuch factors as changes in the economy, government regulations, globalization, virtualization and othertechnology innovations. In response to these challenges, many companies are focused on improving efficiencies,enhancing effectiveness and driving innovation to favorably impact both the bottom-line and top-line. In order toachieve these goals, companies are focusing on a number of services, such as:
• Business and IT alignment;
• IT application and infrastructure optimization;
• Business and Knowledge Process effectiveness and efficiency;
• Advanced custom systems development;
• Data Warehousing, Business Intelligence (BI) and Analytics;
• Enterprise Resource Planning (ERP);
• Customer Relationship Management (CRM);
• Supply Chain Management;
• Enterprise 2.0 business models and technology solutions;
• Service-Oriented Architectures, Web 2.0 and Cloud Computing; and
• Engineering and Manufacturing solutions.
These solutions facilitate faster, more responsive and lower-cost business operations. However, theirdevelopment, integration and on-going maintenance present major challenges and require a large number ofhighly skilled professionals trained in many diverse technologies and specialized industries. In addition,companies also require additional technical resources to maintain, enhance and re-engineer their core legacy ITsystems and to address application maintenance projects. Increasingly, companies are relying on custom ITsolutions providers, such as us, to provide these services.
Additionally, in order to respond effectively to a changing and challenging business environment, ITdepartments of many companies have focused increasingly on improving returns on IT investments, loweringcosts and accelerating the delivery of new systems and solutions. To accomplish these objectives, many ITdepartments have shifted all or a portion of their IT development, integration and maintenance requirements tooutside service providers operating with global sourcing models.
1

Global demand for high quality, lower cost IT services from outside providers has created a significantopportunity for IT service providers that can successfully leverage the benefits of, and address the challenges inusing, a global talent pool. The effective use of personnel from across the globe can offer a variety of benefits,including lower costs, faster delivery of new IT solutions and innovations in vertical solutions, processes andtechnologies. Certain countries, particularly India and China, have large talent pools of highly qualified technicalprofessionals who can provide high quality IT and business and knowledge process outsourcing services at alower cost. India is a leader in IT services, and is regarded as having one of the largest and highest quality poolsof talent in the world. Historically, IT service providers have used offshore labor pools primarily to supplementthe internal staffing needs of customers. However, evolving customer demands have led to the increasingacceptance and use of offshore resources for higher value-added services. These services include applicationdesign, development, testing, integration and maintenance, as well as technology consulting and infrastructuremanagement. India’s services and software exports continue to see significant growth. Recent NASSCOM(India’s National Association of Software and Service Companies) reports state that India’s IT software andservices and business process outsourcing sectors are expected to reach an estimated $50 billion by the end ofNASSCOM’s fiscal year March 31, 2010. This is an expected growth rate of approximately 5.5% over the priorfiscal year. Additionally, the FY 2010-11 Outlook for these sectors expects revenue growth of approximately13% to 15%. According to the latest NASSCOM “Perspective 2020: Transform Business, Transform India”report, global changes and new megatrends within economic, demographic, business, social and environmentalareas are set to expand the outsourcing industry by creating new dynamics and opportunities; and are expected toresult in export revenues of approximately $175 billion by 2020.
Using a globally distributed workforce to provide value-added services presents a number of challenges toIT services and BPO/KPO providers. The offshore implementation of value-added IT services requires that ITservice providers continually and effectively attract, train and retain highly skilled software developmentprofessionals with advanced technical and industry skills necessary to keep pace with continuing changes ininformation technology, evolving industry standards and changing customer preferences. These skills arenecessary to design, develop and deploy high-quality technology solutions in a cost-effective and timely manner.In addition, IT service providers must have the methodologies, processes and communications capabilities toenable offshore workforces to be successfully integrated with on-site personnel. Service providers must also havestrong research and development capabilities, technology competency centers and relationship management skillsin order to compete effectively.
The Cognizant Approach
Our business is organized and managed primarily around our four vertically-oriented business segments:
• Financial Services;
• Healthcare;
• Manufacturing, Retail and Logistics; and
• Other, which includes Communications, Information, Media and Entertainment and High Technology.
This vertical focus has been central to our revenue growth and high customer satisfaction. As the IT servicesindustry continues to mature, clients are looking for service providers who understand their businesses, industryinitiatives, culture and have solutions tailored to meet their individual business needs. We have continued to hireexperts out of industry, establish a broad base of business analysts and consultants, invest in industry training forour staff, and build out industry-specific services and solutions. This approach is central to our high-levels ofon-time delivery and customer satisfaction, as we understand the full context of our clients’ challenges and havedeep experience in addressing them.
2
Our key service areas, IT Consulting and Technology Services, and Outsourcing Services are delivered toour clients across our four business segments in a standardized, high-quality manner through a Global DeliveryModel. These service areas include:
• IT Consulting and Technology Services
• Business and Knowledge Process Consulting;
• IT Strategy Consulting;
• Technology Consulting;
• Application Design, Development, Integration and Re-engineering, such as:
• Complex Custom Systems Development;
• Data Warehousing / Business Intelligence (BI);
• Customer Relationship Management (CRM) System implementation; and
• Enterprise Resource Planning (ERP) System implementation; and
• Software Testing Services.
• Outsourcing Services
• Application Maintenance, such as:
• Custom Application Maintenance; and
• CRM and ERP Maintenance;
• IT Infrastructure Outsourcing; and
• Business and Knowledge Process Outsourcing (BPO/KPO).
Business Segments
We are organized around our four vertically–oriented business segments, and we report the operations ofour business as follows:
Financial Services Healthcare Manufacturing/Retail/Logistics Other
BankingInsurance
HealthcareLife Sciences
Manufacturing and LogisticsRetail and Hospitality
CommunicationsInformation, Media andEntertainmentHigh Technology
Financial Services
In 2009, our Financial Services business segment represented approximately 42.9% of our total revenues.Revenues from our Financial Services business segment were $1,406.6 million, $1,284.0 million and $1,001.4million for the years ended December 31, 2009, December 31, 2008, and December 31, 2007, respectively. Thisbusiness segment provides services to our customers operating in the following industries:
• Banking. We focus on traditional retail and commercial banks, and diversified financial enterprises. Weassist these clients in such areas as: Consumer Lending, Cards & Payments, Wholesale Banking, RiskManagement, Investment Management, Corporate Services and Retail Banking. We also focus on theneeds of broker / dealers, asset management firms, depositories, clearing organizations and exchanges.Key areas where we help these clients in both driving efficiencies and establishing new capabilitiesinclude: Front Office, Middle Office, Back Office, Sales & Brokerage, Research, Exchange Operationsand Prime Brokerage solutions.
3

• Insurance. We assist with the needs of property and casualty insurers, life insurers, reinsurance firmsand insurance brokers. We focus on such areas as: Business Acquisition, Policy Administration, ClaimsProcessing, Management Reporting, Regulatory Compliance and Reinsurance.
Healthcare
In 2009, our Healthcare business segment represented approximately 26.3% of our total revenues. Revenuesfrom our Healthcare business segment were $860.4 million, $688.2 million and $504.5 million for the yearsended December 31, 2009, December 31, 2008, and December 31, 2007, respectively. This business segmentprovides services to our customers operating in the following industries:
• Healthcare. We work with many leading healthcare organizations, including many of the leadinghealthcare organizations in the United States. Our Healthcare service teams focus on the following keyindustry solutions: Broker Compensation, Sales & Underwriting Systems, Provider Management, PlanSponsor Administration, Electronic Enrollment, Membership, Billing, Claims Processing, MedicalManagement and Pharmacy Benefit Management. We are also partnering with our customers to enabletheir IT systems to deal with initiatives such as self service portals (member / provider / broker),consumer-driven healthcare, behavioral health, Medicare Modernization Act (MMA) and healthcaredata warehousing and analytics.
• Life Sciences. We partner with the leading organizations in the Life Sciences industry to assist themwith the opportunities and challenges of their rapidly evolving market. We work with most of theworld’s leading pharmaceutical companies and are assisting these companies in dealing with suchchallenges as: Consolidation, Data Integration, Time to Market, Safety, Globalization and Regulations.Some of our Life Sciences solutions include: Prescriber Behavior Analysis and Insight, LongitudinalPrescription Data Management Systems, Sales Force Compensation Systems, Sales Data and ClaimsData Management Systems, Clinical Trial Solutions, 21CFR11 Assessment and Computer SystemsValidation, Data Mining and Business Intelligence Solutions, e-Business and Data Portals, and ERPimplementation, upgrade, and maintenance services.
Manufacturing / Retail / Logistics
In 2009, our Manufacturing, Logistics & Retail business segment represented approximately 17.2% of ourtotal revenues. Revenues from our Manufacturing/Retail/Logistics business segment were $564.9 million, $443.2million and $320.1 million for the years ended December 31, 2009, December 31, 2008, and December 31, 2007,respectively. This business segment services customers in the following industry groups:
• Manufacturing and Logistics. We help organizations improve operational efficiencies, enhanceresponsiveness and collaborate with trading partners to better serve their end customers. We leverage acomprehensive understanding of the business and technology drivers of the industry. Some of ourManufacturing and Logistics solutions include: Supply Chain Management, Warehouse and YardManagement, Waste Management, Transportation Management, Optimization, Portals and ERPsolutions.
• Retail and Hospitality. We serve a wide spectrum of retailers and distributors, including supermarkets,specialty premium retailers and large mass-merchandise discounters. We deliver the best of bothworlds: in-depth experience with retailing applications and a strong enterprise architecture foundation.We also serve the entire travel and hospitality industry including airlines to hotels and restaurants, aswell as online and retail travel, global distribution systems and intermediaries and real-estatecompanies. Several of the services we provide for retail and hospitality customers are as follows:
• Upgrade supply chain systems, ranging from order management to category and spacemanagement, warehouse management, logistics management, pricing and promotions, andmerchandising management;
4

• Implement new point of sale solutions that embrace new international standards and provide newflexibility for supporting new merchandising initiatives;
• Implement point solutions developed by our Retail Center of Excellence. The Center ofExcellence has built solution accelerators and defined implementation methodologies for multi-channel integration, and for Point of Sale systems migration;
• Accelerate the implementation of enterprise and customer relationship management;
• Improve business intelligence effectiveness;
• We leverage our experience in a number of key functional areas such as loyalty programs,technical operations, and inventory distribution, channel management, brand portal development,outlet service desk and store accounting;
• Our technical and functional consultants provide in-depth knowledge of industry applications andstandards; and
• We also provide BPO and niche processes in restaurants, hotels and airlines.
Other
In 2009, our Other business segment represented approximately 13.6% of our total revenues. Revenues fromour Other business segment were $446.7 million, $400.8 million and $309.5 million for the years endedDecember 31, 2009, December 31, 2008, and December 31, 2007, respectively. The Other business segment is anaggregation of operating segments which, individually, are less than 10.0% of consolidated revenues and segmentoperating profit. The Other business segment includes Communications, Media and Information Services and HighTechnology operating segments. A description of operating segments included in Other is as follows:
• Communications. Our Communications industry practice serves some of the world’s leadingcommunications service providers, equipment vendors and software vendors. We have severalindustry-specific solutions, including: OSS / BSS Implementation, Network Management Services,Mobile Applications, Conformance Testing, Product Lifecycle Management, Product Implementation,Portals, Business Activity Monitoring, Mobile Systems Integration, Broadband Evolution Services andBilling Quality Assurance.
• Information, Media and Entertainment.We have an extensive track record working with some of theworld’s largest media and entertainment companies. With the emergence of digital technologiespromising to revolutionize the business, we offer consulting and outsourcing services to help media andentertainment companies concentrate on their end product. Some of our solutions include:
• Supply chain management solutions, from pre-press to material procurement, circulation,logistics, and vendor management;
• Business solutions covering advertising management, online media, and e-business;
• Workflow automation covering the product development process for broadcasters;
• Spot ad buying systems covering agency of record, traffic management, post-buy analysis, andfinancial management;
• Digital Asset Management (DAM) and Digital Rights Management (DRM); and
• Operational systems including ad sales, studio management, outsourcing billing and payments,along with content management and delivery.
• High Technology. We serve some of the world’s leading Independent Software Vendors (ISVs) andOnline Service Providers. We believe that the needs of technology companies are different—moretechnically complex, challenging and advanced than what is typically found in other industries.Catering to these needs, our High Technology practice assists with the unique needs of these clients inareas such as: Product Development, Product Sustenance, Compatibility Testing, Internationalization,Product Re-engineering, Multiple Channel Extension, Security Testing and Content Management.
5

Our Solution and Services
We believe that we have developed an effective integrated global delivery business model and this businessmodel is expected to be a critical element of our continued growth. To support this business model, atDecember 31, 2009, we employed approximately 78,400 professionals and support staff globally. We also haveestablished facilities and technology and communication infrastructures to support our business model.
Across each of our business segments, we provide a broad and expanding range of consulting, informationtechnology and outsourcing services, including:
Consulting and Technology Services
• IT Consulting. Our consulting division, Cognizant Business Consulting, focuses on helping clientsderive greater value at the intersection of their business initiatives and IT requirements. Our consultingofferings are based on rigorous and proven methodologies and scientifically driven frameworks. In theareas of business processes, technologies and offshoring, we analyze the existing environment, identifyopportunities for optimization and provide a robust roadmap for significant cost savings andproductivity improvement. The broad areas of coverage include: offshoring strategy, IT strategy,technology rationalization, business process rationalization, change management and IT solutionstrategy.
• Application Design, Development, Integration and Re-engineering. We define customer requirements,write specifications and design, develop, test and integrate software across multiple platforms includingInternet technologies. We modify and test applications to enable systems to function in new operatingenvironments. In addition, these services include Data Warehousing / Business Intelligence (BI), ERPand CRM implementation services. We follow either one of two alternative approaches to applicationdevelopment and integration:
• full life-cycle application development, in which we assume start-to-finish responsibility foranalysis, design, implementation, testing and integration of systems; or
• cooperative development, in which our employees work with a customer’s in-house IT personnelto jointly analyze, design, implement, test and integrate new systems.
In both of these approaches, our on-site team members work closely and collaboratively with ourclients. Detailed design, implementation and testing are generally performed offshore at our 47development and delivery centers located in India, China, Argentina, Mexico, the Philippines andHungary, as well as in Bentonville (AR), Boston (MA), Bridgewater (NJ), Chicago (IL), Phoenix (AZ),Amsterdam and Toronto. In addition, we maintain an on-site presence at each customer location inorder to address evolving customer needs and resulting changes to the project.
A key part of our application development and integration offering is a suite of services to helporganizations build and integrate business applications with the rest of their operations. In this suite ofservices, we leverage our skills in business application development and enterprise applicationintegration to build sophisticated business applications and to integrate these new applications andwebsites with client server and legacy systems. We build and deploy robust, scalable and extensiblearchitectures for use in a wide range of industries. We maintain competency centers specializing inMicrosoft, IBM, SAP, Oracle and JAVA applications, among others, in order to be able to provideapplication development and integration services to a broad spectrum of customers.
Our re-engineering service offerings assist customers migrating from systems based on legacy computingenvironments to newer standards-based distribution architectures, often in response to the more stringentdemands of business. Our re-engineering tools automate many of the processes required to implementadvanced technology platforms. We believe that this automation substantially reduces the time and cost toperform re-engineering services, savings that benefit both us and our customers. These tools also enableus to perform source code analysis and to re-design target databases and convert certain programminglanguages. If necessary, our programmers also help customers re-design and convert user interfaces.
6

• Software Testing. Our Software Testing service offering has experienced significant growth in the pastseveral years. Through this practice, we provide an independent verification and validation servicefocused exclusively on supporting the software testing needs of our clients. Our testing service has fourkey offerings: 1) Independent Functional Testing; 2) Test Automation; 3) Test Process Consulting; and4) Performance Testing. We utilize our own Managed Test Center process model to ensure our clientsreceive the highest quality code possible after it has been tested by us. We focus our Managed TestCenters on specific domains (e.g., specific industries and software solutions), ensuring we tailor ourtesting solutions to the particular needs of our clients.
Outsourcing Services
• Application Maintenance. Our Application Maintenance Service offering supports some or all of acustomer’s applications ensuring that systems remain operational and responsive to changing userrequirements and provide on-going enhancements as required by the customer.
We provide services to help ensure that a customer’s core operational systems are free of defects andresponsive to the customer’s changing needs. As part of this process, we are often able to introduceproduct and process enhancements and improve service levels to customers requesting modificationsand on-going support.
Our global delivery business model enables us to provide a range of rapid response and cost-effectivesupport services to our customers. Our on-site team members often provide help-desk services at thecustomer’s facility. These team members typically are available in the event of an emergency servicerequest and are able to quickly resolve customer problems from remote locations. In the case of morecomplex maintenance services, including modifications, enhancements and documentation, whichtypically have longer turnaround times, we take full advantage of our offshore resources to developsolutions more cost-effectively than would be possible relying on higher cost local professionals. Theservices provided by our offshore team members are delivered to customers using satellite and fiber-optic communications.
As part of our Application Maintenance services, we assist customers in renovating their core systemsto meet the requirements imposed by new regulations, new standards or other external events. Theseservices include, or have previously included, Year 2000 compliance, Eurocurrency compliance,decimalization within the securities industry and compliance with the Health Insurance Portability andAccountability Act for the healthcare industry.
We seek to anticipate the operational environment of our customers’ IT systems as we design anddevelop such systems. We also offer diagnostic services to customers to assist them in identifyingshortcomings in their IT systems and optimizing the performance of their systems.
• IT Infrastructure Services. We provide IT Infrastructure Management Outsourcing services. This is anewer service at Cognizant and we anticipate growing demand for it in the coming years. As a result ofour acquisition of AimNet Solutions, Inc. in September 2006, we provide service capability inredundant Network Operating Centers (NOCs) in North America and India through which we are ableto provide significant scale, quality and cost savings to our clients in IT Infrastructure Services. Wefocus on a number of key areas, including such key areas of infrastructure management as: Networks,Servers, Middleware, Security, Vendors, Storage, Messaging, Databases, and Desktops. We canprovide these through an IT Service Desk model, focusing on such areas as IT Operations and IT HelpDesk.
• Business and Knowledge Process Outsourcing (BPO/KPO).We provide BPO and KPO services to ourclients across industries of our specialization. At Cognizant, we are primarily focused on value-addedprocesses that are specific to clients in our key industry segments (particularly in Financial Services,Healthcare and Manufacturing / Retail / Logistics and Communications). Our BPO/KPO practicefocuses on core back office services covering: Transaction Processing, Accounting Operations, VoiceProcesses, Data Administration, Data Management and Data Analytics.
7

In addition to our industry-specific expertise and focus, our strengths, which we believe differentiate us fromother IT service providers, include the following:
Established and Scalable Proprietary Processes: We have a comprehensive process framework thataddresses the entire software engineering life cycle and support activities which are scalable for projects ofdifferent sizes and complexities. This proprietary framework, which we refer to as “Process Space” (part ofCognizant 2.0), is supported by in-house project management, metrics management and workflow tools and isavailable to all of our programmers globally. Process Space has evolved since its original release in 1996 inbreadth, depth and maturity, based on the implementation feedback from projects and findings of internal qualityaudits and external assessments. Process capabilities are monitored at the sub-process level and performancetargets are monitored at the process level, which are aligned with the overall business objectives. Statisticalprocess controls are used extensively to continuously monitor, predict and improve performance. Our QualityAssurance group facilitates process implementation from the project inception and audits the projectsperiodically to ensure that the implementation is effective and the risks are being managed.
Our process framework complies with the requirements of ISO 9001, TL 9000 for Telecom projects, andISO 20000 for Infrastructure projects. Our delivery processes, support processes and their implementation areformally certified by DNV (Det Norske Veritas) in the above mentioned standards. KPMG appraises ourenterprise-wide operations to be at CMMI Maturity Level 5, which is the highest possible maturity level rating,of the Capability Maturity Model Integration v1.2 (CMMI) of the Software Engineering Institute at CarnegieMellon University. Our BPO service offering is assessed at eSCM Maturity Level 4 which is the highest possiblerating for the first attempt of the e-Sourcing Capability Model of IT Services Qualification Center at CarnegieMellon University. Finally, all of our principal development centers have been certified by the STQC DirectorateMinistry of Communications and Information Technology, Government of India (the accreditation authority forcompanies in India) under the internationally recognized ISO 27001 (previously BS 7799-2) InformationSecurity Standards, a comprehensive set of controls comprising best practices in information security andbusiness continuity planning. We have implemented the above process framework enterprise-wide to ensure thatwe consistently deliver high quality of products and services to our clients from all global operations. We haveinvested considerably to develop a number of software automation tools designed to improve processinstitutionalization. For example, we have created and rolled out “Cognizant 2.0.” This is an Intelligent DeliveryEcosystem which orchestrates, across the organization, best practice methodologies and the collaboration andarchival of knowledge. Cognizant 2.0 has already been rolled out over a significant number of projects and isquickly becoming a one stop shop for all project management, metrics and knowledge management.Cognizant 2.0 gradually replaces the existing set of internally developed tools such as Prolite, eTracker andqSmart.
Our process framework has been extensively adapted to cater to different types of projects managed by theorganization, including Application Development, Application Maintenance, Testing, Mass Change, DataMigration, Reengineering, Business Process Outsourcing, IT infrastructure and Package Development projects.
Highly Skilled Workforce. Our managers and senior technical personnel provide in-depth projectmanagement expertise to customers. To maintain this level of expertise, we have placed significant emphasis onrecruiting and training our workforce of highly skilled professionals. We have approximately 8,300 projectmanagers and senior technical personnel around the world, many of whom have significant work experience inNorth America, Europe and Asia. We also maintain programs and personnel to hire and train the best availabletechnical professionals in both legacy systems and emerging technologies. We provide five months of combinedclassroom and on-the-job training to newly hired programmers, as well as additional annual training programsdesigned to enhance the business practices, tools, technology and consulting skills of our professional staff. Wewere assessed by KPMG at Level 5 (the highest possible rating) of the People Capability Maturity Model(P-CMM) of the Software Engineering Institute at Carnegie Mellon University. This widely recognized means ofimplementing current best practices in fields such as human resources, knowledge management andorganizational development help improve our processes for managing and developing our workforce andaddressing critical people issues.
8

Research and Development and Competency Centers. We have project experience and expertise acrossmultiple architectures and technologies, and have made significant investments in our competency centers and inresearch and development to keep abreast of the latest technology developments. Most of our programmers aretrained in multiple technologies and architectures. As a result, we are able to react to customers’ needs quicklyand efficiently redeploy programmers to different technologies. Also to develop and maintain this flexibility, wehave made a substantial investment in our competency centers so that the experience gained from particularprojects and research and development efforts is leveraged across our entire organization. In addition, throughour investment in research and development activities and the continuing education of our technical personnel,we enlarge our knowledge base and develop the necessary skills to keep pace with emerging technologies. Webelieve that our ability to work in new technologies allows us to foster long-term relationships by having thecapacity to continually address the needs of both existing and new customers.
Well-Developed Infrastructure. Our extensive facilities, technology and communications infrastructurefacilitate the seamless integration of our global workforces. This is accomplished by permitting team members indifferent locations to access common project information and to work directly on customer projects. Thisinfrastructure allows for:
• rapid completion of projects;
• highest level of quality;
• off-peak use of customers’ technological resources; and
• real-time access to project information by the on-site account manager or the customer.
International time differences enable our offshore teams to access a customer’s computing facilities locatedin North America, Europe, the Asia Pacific region and other countries in which we provide services duringoff-peak hours. This ability to perform services during off-peak hours enables us to complete projects morerapidly and does not require our customers to invest in duplicative hardware and software. In addition, for largeprojects with short time frames, our offshore facilities allow for parallel processing of various developmentphases to accelerate delivery time. In addition, we can deliver services more rapidly than some competitorswithout an offshore labor pool because our lower labor costs enable us to cost-effectively assign moreprofessionals to a project.
Business Strategies
Our objectives are to maximize stockholder value and enhance our position as a leading provider ofinformation technology, consulting and business outsourcing services. We implement the following corestrategies to achieve these objectives:
Further Develop Long-Term Customer Relationships. We have strong long-term strategic relationships withour customers and business partners. We seek to establish long-term relationships that present recurring revenueopportunities, frequently trying to establish relationships with our customers’ chief information officers, or otherIT decision makers, by offering a wide array of cost-effective high quality services. Approximately 97% of ourrevenues for the year ended December 31, 2009 were derived from customers who had been using our services atthe end of 2008. We also seek to leverage our experience with a customer’s IT systems into new businessopportunities. Knowledge of a customer’s processes and IT systems gained during the performance of applicationmaintenance services, for example, may provide us with a competitive advantage in securing additionalmaintenance, development and other projects from that customer.
Expand Service Offerings and Solutions.We have several teams dedicated to developing new, high valueservices. These teams collaborate with customers to develop these services. For example, we are currently developingnew offerings in Business and IT Consulting and vertically-oriented IT solutions atop innovative technologies suchas: Service Oriented Architectures (SOA) and Web 2.0. We invest in internal research and development and promote
9

knowledge building and sharing across the organization to promote the development of new services and solutions.Furthermore, we continue to enhance our capabilities and service offerings in the areas of:
• Customer Relationship Management (CRM);
• Enterprise Resource Planning (ERP);
• Data Warehousing / Business Intelligence (BI);
• Software Testing;
• Infrastructure Management; and
• Vertically-Oriented Business and Knowledge Process Outsourcing (BPO and KPO).
We believe that the continued expansion of our service offerings will reduce our reliance on any onetechnology initiative and may help foster long-term relationships with our customers by allowing us to betterserve their needs. Among service offerings, Infrastructure Management and Vertically-Oriented Business andKnowledge Process Outsourcing have been among the key drivers of growth.
Enhance Processes, Methodologies and Productivity Toolsets. With the globalization of business, we arecommitted to improving and enhancing our proprietary Process Space software engineering process and othermethodologies and toolsets. In light of the rapid evolution of technology, we believe that continued investment inresearch and development is critical to our continued success. We are constantly designing and developingadditional productivity software tools to automate testing processes and improve project estimation and riskassessment techniques. For example, we have created and rolled out “Cognizant 2.0” which uses groupwaretechnology based on Web 2.0 technologies, enabling Cognizant associates to share project experiences and bestpractice methodologies across the organization with the objective of improving productivity.
Expand Domestic and International Geographic Presence. As we expand our customer base, we plan toopen additional sales and marketing offices in North America, Europe, Latin America and Asia. This expansionis expected to facilitate sales and service to existing and new customers. We have established various sales andmarketing offices in several metropolitan areas including: Atlanta (GA), Boston (MA), Bridgewater (NJ),Chicago (IL), Dallas (TX), Minneapolis (MN), Phoenix (AZ), Los Angeles (CA), Norwalk (CT), San Francisco(CA) and Teaneck (NJ). In addition, we have been pursuing market opportunities internationally through ourinternational sales and marketing offices including: Amsterdam, Brussels, Buenos Aires, Chennai, Cyberjaya(Malaysia), Frankfurt, Geneva, London, Melbourne, Paris, Shanghai, Singapore, Stockholm, Tokyo, Toronto andZurich.
Continue to be an Employer of Choice in the Industry. As a rapidly growing professional services firm, akey attribute of our continued success is the ability to continually hire, assimilate, motivate and retain the besttalent possible in the industry. We have developed strong relationships with key universities around the world,particularly in India, to provide a continual funnel of talented staff from Tier One schools. In addition, wecontinue to expand our presence and brand in our key supply markets, further enhancing our ability to hireexperienced professionals from competing IT services firms and industry to support our client needs and growth.We invest heavily in training programs (centered around Cognizant Academy), motivational programs and careerdevelopment to ensure personal professional growth for each of our associates.
Pursue Selective Strategic Acquisitions, Joint Ventures and Strategic Alliances. We believe thatopportunities exist in the fragmented market in which we operate to expand our business through selectivestrategic acquisitions, joint ventures and strategic alliances. We believe that acquisition and joint venturecandidates may enable us to expand our geographic presence and our capabilities more rapidly, especially ingeographic markets and key industries. For example, in 2009, we completed four acquisitions, to strengthen ourOracle Retail solutions services practice, our IT Infrastructure services practice, our Engineering andManufacturing Solutions (EMS) practice, and our Financial Services KPO / BPO practice and enhance ourservice delivery capabilities in India. In addition, through our working relationships with independent softwarevendors we obtain projects using the detailed knowledge we gain in connection with a joint development process.Finally, we expect to continue to form strategic alliances with select IT service firms that offer complementaryservices to best meet the requirements of our customers.
10

Sales and Marketing
We market and sell our services directly through our professional staff, senior management and direct salespersonnel operating out of our Teaneck, New Jersey headquarters and our business development offices whichare strategically located in various metropolitan areas around the world including: Atlanta (GA), Boston (MA),Bridgewater (NJ), Chicago (IL), Dallas (TX), Los Angeles (CA), Minneapolis (MN), Norwalk (CT), Phoenix(AZ), San Francisco (CA), Teaneck (NJ), Amsterdam, Brussels, Buenos Aires, Chennai, Cyberjaya (Malaysia),Frankfurt, Geneva, London, Melbourne, Paris, Shanghai, Stockholm, Singapore, Tokyo, Toronto and Zurich. AtDecember 31, 2009, we had 86 direct sales persons and 860 account managers and client partners. The sales andmarketing group works with our technical team as the sales process moves closer to the customer’s selection of aservices provider. The duration of the sales process varies depending on the type of service, ranging fromapproximately two months to over one year. The account manager or sales executive works with the technicalteam to:
• define the scope, deliverables, assumptions and execution strategies for a proposed project;
• develop project estimates;
• prepare pricing and margin analyses; and
• finalize sales proposals.
Management reviews and approves proposals, which are then presented to the prospective customer. Oursales and account management personnel remain actively involved in the project through the execution phase.We focus our marketing efforts on businesses with intensive information processing needs. We maintain aprospect/customer database that is continuously updated and used throughout the sales cycle from prospectqualification to close. As a result of this marketing system, we pre-qualify sales opportunities, and direct salesrepresentatives are able to minimize the time spent on prospect qualification. In addition, substantial emphasis isplaced on customer retention and expansion of services provided to existing customers. In this regard, ouraccount managers play an important marketing role by leveraging their ongoing relationship with the customer toidentify opportunities to expand and diversify the type of services provided to that customer.
Customers
The number of customers served by us has increased significantly in recent years. As of December 31, 2009,we were providing services to approximately 589 customers, as compared to approximately 565 customers as ofDecember 31, 2008, and approximately 500 customers as of December 31, 2007. Accordingly, we provide asignificant volume of services to many customers in each of our business segments. Therefore, a loss of asignificant customer or a few significant customers in a particular segment could materially reduce revenues forsuch segment. However, no individual customer exceeded 10.0% of our consolidated revenues for the yearsended December 31, 2009, 2008 and 2007, respectively. In addition, the services we provide to our largercustomers are often critical to the operations of such customers and a termination of our services would requirean extended transition period with gradual declining revenues. For the years ended December 31, 2009, 2008 and2007, 79.1%, 79.1% and 82.8% of our revenue, respectively, was from North American customers.
For the year ended December 31, 2009, we derived our revenues from the following business segments:42.9% from Financial Services, 26.3% from Healthcare, 17.2% from Retail/Manufacturing/Logistics and 13.6%from Other.
We provide services either on a time-and-material basis or on a fixed price basis. The volume of workperformed for specific customers is likely to vary from year to year, and a significant customer in one year maynot use our services in a subsequent year.
11

Presented in the table below is additional information about our customers.
Year Ended December 31,
2009 2008 2007
Revenues from top five customers as a percentage of total revenues . . . . . . . . . . . . . . . . 17.4% 19.4% 23.9%Revenues from top ten customers as a percentage of total revenues . . . . . . . . . . . . . . . . . 29.4% 30.0% 34.3%Revenues under fixed-bid contracts as a percentage of total revenues . . . . . . . . . . . . . . . 30.3% 26.7% 24.7%
Competition
The intensely competitive IT services and outsourcing market includes a large number of participants and issubject to rapid change. This market includes participants from a variety of market segments, including:
• systems integration firms;
• contract programming companies;
• application software companies;
• traditional large consulting firms;
• the professional services groups of computer equipment companies; and
• facilities management and outsourcing companies.
Our direct competitors include, among others, Infosys Technologies, Tata Consultancy Services and Wipro,which utilize an integrated global delivery business model comparable to that used by us. We also compete withlarge IT service providers with greater resources than us, such as Accenture, Computer Sciences Corporation, HPEnterprise (formerly Electronic Data Systems), Perot Systems (acquired by Dell Inc.) and IBM Global Services.In addition, we compete with numerous smaller local companies in the various geographic markets in which weoperate.
Many of our competitors have significantly greater financial, technical and marketing resources and greatername recognition. The principal competitive factors affecting the markets for our services include:
• performance and reliability;
• quality of technical support, training and services;
• responsiveness to customer needs;
• reputation and experience;
• financial stability and strong corporate governance; and
• competitive pricing of services.
We rely on the following to compete effectively:
• a well developed recruiting, training and retention model;
• a successful service delivery model;
• a broad referral base;
• continual investment in process improvement and knowledge capture;
• investment in infrastructure and research and development;
• financial stability and strong corporate governance;
• continued focus on responsiveness to customer needs, quality of services, competitive prices; and
• project management capabilities and technical expertise.
12

Intellectual Property
Our intellectual property rights are important to our business. We presently hold no patents or registeredcopyrights. Instead, we rely on a combination of intellectual property laws, trade secrets, confidentialityprocedures and contractual provisions to protect our intellectual property. We require our employees,independent contractors, vendors and customers to enter into written confidentiality agreements upon thecommencement of their relationships with us. These agreements generally provide that any confidential orproprietary information disclosed or otherwise made available by us be kept confidential. In addition, when wedisclose any confidential or proprietary information to third parties, we routinely require those third parties toagree in writing to keep that information confidential.
A portion of our business involves the development for customers of highly complex informationtechnology software applications and other technology deliverables. This intellectual property includes writtenspecifications and documentation in connection with specific customer engagements. Our customers usually ownthe intellectual property rights in the software and other deliverables we develop for them.
On July 1,1998, Nielsen Media Research, Inc., the successor in interest to Cognizant Corporation, assignedall of its right, title and interest in and to the marks COGNIZANT and C & Design to Cognizant TechnologySolutions Corporation. On February 6, 2003, Cognizant Technology Solutions Corporation assigned certain of itsassets, including all of its intangible assets, to Cognizant Technology Solutions U.S. Corporation. As ofDecember 31, 2009, Cognizant Technology Solutions U.S. Corporation or its predecessors is the record ownerof: (a) two registrations for COGNIZANT, one registration for C & Design, one registration for MANAGEDTEST CENTER, one registration for TWO-IN-A-BOX and one registration for STRATEGIC VISION, as well assix pending applications for GOVERNANCE IN A BOX, MAKING TECHNOLOGY EFFECTIVE, MDMEXPRESS, MDM-IN-A-BOX, SV (STYLIZED) and THREE-IN-A-BOX in the United States; (b) tworegistrations for COGNIZANT, one registration for C & Design, one application for COGNIZANT, twoapplications for C & Design, one application for TWO-IN-A-BOX and one application for THREE-IN-A-BOXin India; (c) a registration for COGNIZANT in Spain; (d) one registration for each COGNIZANT and C &Design, one registration for MDM EXPRESS and one registration for MDM-IN-A-BOX and applications forTHREE-IN-A-BOX and TWO-IN-A-BOX in the European Union; and (e) six registrations and one applicationfor COGNIZANT and two registrations and two applications for C & Design in Malaysia. In addition, as ofDecember 31, 2009, Cognizant Technology Solutions U.S. Corporation, or its predecessors, is the record ownerof a total of 244 trademark registrations in 60 countries.
Employees
We finished the year of 2009 with headcount of approximately 78,400. We employed approximately62,400 persons in the Asia Pacific region, approximately 13,000 persons in various locations throughout NorthAmerica and South America and over 3,000 persons in various locations throughout Europe, principally in theUnited Kingdom. We are not party to any significant collective bargaining agreements. We consider our relationswith our employees to be good.
Our future success depends to a significant extent on our ability to attract, train and retain highly skilled ITdevelopment and other professionals. In particular, we need to attract, train and retain project managers,programmers and other senior technical personnel. We believe there is a shortage of, and significant competitionfor, IT development professionals in the United States, Europe and in India with the advanced technologicalskills necessary to perform the services we offer. We have an active recruitment program in India, and havedeveloped a recruiting system and database that facilitates the rapid identification of skilled candidates. Duringthe course of the year, we conduct extensive recruiting efforts at premier colleges and technical schools in India.We evaluate candidates based on academic performance, the results of a written aptitude test measuring problem-solving skills and a technical interview. In addition, we have an active lateral recruiting program in NorthAmerica, Europe and India. A substantial majority of the personnel on most on-site teams and virtually all thepersonnel staffed on offshore teams is comprised of Indian nationals.
13

Our senior project managers are hired from leading consulting firms in the United States, Europe and India.Our senior management and most of our project managers have experience working in the United States andEurope. This enhances our ability to attract and retain other professionals with experience in the United Statesand Europe. We have also adopted a career and education management program to define our employees’objectives and career plans. We have implemented an intensive orientation and training program to introducenew employees to the Process Space software engineering process, our other technologies and our services.
Our Executive Officers
The following table identifies our current executive officers:
Name Age Capacities in Which ServedIn Current
Position Since
Lakshmi Narayanan(1) . . . . . . . . . . . 56 Vice Chairman of the Board of Directors 2007Francisco D’Souza(2) . . . . . . . . . . . . 41 President and Chief Executive Officer 2007Gordon Coburn(3) . . . . . . . . . . . . . . . 46 Chief Financial and Operating Officer, and Treasurer 2007Ramakrishnan Chandrasekaran(4) . . . 52 President and Managing Director, Global Delivery 2006Rajeev Mehta(5) . . . . . . . . . . . . . . . . 43 Chief Operating Officer, Global Client Services 2006Steven Schwartz(6) . . . . . . . . . . . . . . 42 Senior Vice President, General Counsel and Secretary 2007
(1) Lakshmi Narayanan was appointed Vice Chairman of the Board of Directors, effective January 1, 2007.Mr. Narayanan served as our Chief Executive Officer from December 2003 through December 2006 and asour President from March 1998 through December 2006. Mr. Narayanan joined our Indian subsidiary asChief Technology Officer in 1994 and was elected President of such subsidiary on January 1, 1996. Prior tojoining us, from 1975 to 1994, Mr. Narayanan was the regional head of Tata Consultancy Services, a largeconsulting and software services company located in India. Mr. Narayanan serves on the board of directorsand as the Chairman of the Governance Committee of TVS Capital Funds Limited. Mr. Narayanan holds aBachelor of Science degree, a Master of Science degree and a Management degree from the Indian Instituteof Science.
(2) Francisco D’Souza was appointed President and Chief Executive Officer and became a member of theBoard of Directors, effective January 1, 2007. Mr. D’Souza served as our Chief Operating Officer fromDecember 2003 through December 2006. Prior to that, from November 1999 to December 2003, he servedas our Senior Vice President, North American Operations and Business Development. From March 1998 toNovember 1999, he served as our Vice President, North American Operations and Business Developmentand as our Director-North American Operations and Business Development from June 1997 to March 1998.From January 1996 to June 1997, Mr. D’Souza was engaged as our consultant. From February 1995 toDecember 1995, Mr. D’Souza was employed as Product Manager at Pilot Software. Between 1992 and1995, Mr. D’Souza held various marketing, business development and technology management positions asa Management Associate at The Dun & Bradstreet Corporation. While working at The Dun & BradstreetCorporation, Mr. D’Souza was part of the team that established the software development and maintenancebusiness conducted by us. Mr. D’Souza serves on the Board of Trustees of Carnegie Mellon University andthe Board of Trustees of The New York Hall of Science. Mr. D’Souza holds a Bachelor of BusinessAdministration degree from the University of East Asia and a Master of Business Administration degreefrom Carnegie Mellon University.
(3) Gordon Coburn was appointed Chief Operating Officer, effective January 1, 2007. Mr. Coburn continues toserve as our Chief Financial Officer and Treasurer, positions he has held since his election in March 1998.Mr. Coburn served as our Executive Vice President from December 2003 through December 2006. FromNovember 1999 to December 2003, he served as our Senior Vice President. He previously was our VicePresident from 1996 to November 1999. Mr. Coburn served as Senior Director—Group Finance &Operations for Cognizant Corporation from November 1996 to December 1997. From 1990 to October1996, Mr. Coburn held key financial positions with The Dun & Bradstreet Corporation. Mr. Coburn serveson the board of directors of Corporate Executive Board Company and he also served on the board ofdirectors of ICT Group, Inc. until its acquisition on February 2, 2010. Mr. Coburn holds a Bachelor of Artsdegree from Wesleyan University and a Master of Business Administration degree from the Amos TuckSchool at Dartmouth College.
14

(4) Ramakrishnan Chandrasekaran was appointed President and Managing Director, Global Delivery in August2006. Mr. Chandrasekaran served as our Executive Vice President and Managing Director from January2004 through July 2006. Prior to that, from November 1999 to January 2004, he served as our Senior VicePresident responsible for the ISV relationships, key alliances, capacity growth, process initiatives, businessdevelopment and offshore delivery. Mr. Chandrasekaran joined us as Assistant Vice President inDecember 1994, before getting promoted to Vice President in January 1997. Mr. Chandrasekaran has morethan 20 years of experience working in the IT services industry. Prior to joining us, Mr. Chandrasekaranworked with Tata Consultancy Services. Mr. Chandrasekaran holds a Mechanical Engineering degree andMaster of Business Administration degree from the Indian Institute of Management.
(5) Rajeev Mehta was appointed Chief Operating Officer, Global Client Services in August 2006 and isresponsible for our sales, business development and client relationship management organizations.Mr. Mehta, who joined Cognizant in 1997, most recently served as Senior Vice President and GeneralManager of our Financial Services Business Unit, a position he held from June 2005 to August2006. From November 2001 to June 2005, he served as our Vice President and General Manager of ourFinancial Services Business Unit. From January 1998 to November 2001, Mr. Mehta served as our Directorof the U.S. Central Region. Mr. Mehta served as our Senior Manager of Business Development fromJanuary 1997 to January 1998. Prior to joining Cognizant in 1997, Mr. Mehta was involved in implementingGE Information Services offshore outsourcing program and also held consulting positions at Deloitte &Touche and Andersen Consulting. Mr. Mehta holds a Bachelor of Science degree from the University ofMaryland and a Master of Business Administration degree from Carnegie-Mellon University.
(6) Steven Schwartz was named Senior Vice President, General Counsel and Secretary in July 2007, havingglobal responsibility for managing Cognizant’s legal function. Mr. Schwartz, who joined Cognizant in 2001,most recently served as Vice President and General Counsel, a position he held from March 2003 to July2007. From April 2002 to March 2003, he served as our Vice President and Chief Corporate Counsel. FromOctober 2001 to December 2002, he served as our Chief Corporate Counsel. Mr. Schwartz also serves as ourChief Legal Officer. Mr. Schwartz holds a Bachelor of Business Administration degree from the Universityof Miami, a Juris Doctor degree from Fordham University School of Law and an L.L.M. (in Taxation)degree from the New York University School of Law.
None of our executive officers are related to any other executive officer or to any of our Directors. Ourexecutive officers are elected annually by the Board of Directors and serve until their successors are duly electedand qualified.
Corporate History
We began our IT development and maintenance services business in early 1994, as an in-house technologydevelopment center for The Dun & Bradstreet Corporation and its operating units. In 1996, we, along withcertain other entities, were spun-off from The Dun & Bradstreet Corporation to form a new company, CognizantCorporation. On June 24, 1998, we completed an initial public offering of our Class A common stock. OnJune 30, 1998, a majority interest in us, and certain other entities were spun-off from Cognizant Corporation toform IMS Health. Subsequently, Cognizant Corporation was renamed Nielsen Media Research, Incorporated.
On January 30, 2003, we filed a tender offer in which IMS Health stockholders could exchange IMS Healthshares held by them for our Class B common stock held by IMS Health. On February 13, 2003, IMS Healthdistributed all of our Class B common stock that IMS Health owned in an exchange offer to its stockholders. OnFebruary 21, 2003, pursuant to the terms of our Restated Certificate of Incorporation, all of the shares of Class Bcommon stock automatically converted into shares of Class A common stock. Since February 21, 2003, therehave been no outstanding shares of Class B common stock. Effective May 26, 2004, pursuant to our Certificateof Incorporation, there are no authorized shares of Class B common stock.
On April 12, 2004, our Board of Directors declared a conditional two-for-one stock split to be effected by a100% stock dividend payable on June 17, 2004 to stockholders of record as of May 27, 2004. The stock split wassubject to stockholder approval, which was obtained on May 26, 2004 and, as a result, the stock dividend waspaid on June 17, 2004 to stockholders of record as of May 27, 2004.
15

On September 17, 2007, our Board of Directors declared a two-for-one stock split to be effected by a 100%stock dividend paid on October 16, 2007 to stockholders of record as of October 1, 2007.
These stock splits have been reflected in the accompanying consolidated financial statements, and allapplicable references as to the number of common shares and per share information were retroactively adjusted.Appropriate adjustments have been made in the exercise price and number of shares subject to stock options.Stockholder equity accounts were retroactively adjusted to reflect the reclassification of an amount equal to thepar value of the increase in issued common shares from the additional paid-in-capital account to the commonstock accounts.
Available Information
We make available the following public filings with the Securities and Exchange Commission, or the SEC,free of charge through our website at www.cognizant.com as soon as reasonably practicable after weelectronically file such material with, or furnish such material to, the SEC:
• our Annual Reports on Form 10-K and any amendments thereto;
• our Quarterly Reports on Form 10-Q and any amendments thereto; and
• our Current Reports on Form 8-K and any amendments thereto.
In addition, we make available our code of business conduct and ethics entitled “Cognizant’s Core Valuesand Standards of Business Conduct” free of charge through our website. We intend to disclose any amendmentsto, or waivers from, our code of business conduct and ethics that are required to be publicly disclosed pursuant torules of the SEC and the NASDAQ Global Select Market by filing such amendment or waiver with the SEC andposting it on our website.
No information on our Internet website is incorporated by reference into this Form 10-K or any other publicfiling made by us with the SEC.
Item 1A. Risk Factors
In addition to the risks and uncertainties detailed elsewhere in this Annual Report on Form 10-K, if anyof the following risks occur, our business, financial condition, results of operations or prospects could bematerially adversely affected. In such case, the trading price of our common stock could decline.
Our global operations are subject to complex risks, some of which might be beyond our control.
We have offices and operations in various countries around the world and provide services to clientsglobally. In 2009, approximately 79.1% of our revenues were attributable to the North American region, 18.5%were attributable to the European region, and 2.4% were attributable to the Asia Pacific region. If we are unableto manage the risks of our global operations, including regulatory, economic, political and other uncertainties inIndia, fluctuations in foreign exchange and inflation rates, international hostilities, terrorism, natural disasters,and multiple legal and regulatory systems, our results of operations could be adversely affected.
A substantial portion of our assets and operations are located in India and we are subject toregulatory, economic, political and other uncertainties in India.
We intend to continue to develop and expand our offshore facilities in India where a majority of ourtechnical professionals are located. While wage costs are lower in India than in the United States and otherdeveloped countries for comparably skilled professionals, wages in India have historically increased at a fasterrate than in the United States. If this were to continue in the future, it would result in increased costs for our
16

skilled professionals and thereby potentially reducing our operating margins. Also, there is no assurance that infuture periods competition for skilled professionals will not drive higher salaries in India thereby resulting inincreased costs for our technical professionals and reduced operating margins.
India has also recently experienced civil unrest and terrorism and has been involved in conflicts withneighboring countries. In recent years, there have been military confrontations between India and Pakistan thathave occurred in the region of Kashmir and along the India-Pakistan border. The potential for hostilities betweenthe two countries has been high in light of tensions related to recent terrorist incidents in India and the unsettlednature of the regional geopolitical environment, including events in and related to Afghanistan and Iraq. If Indiawere to become engaged in armed hostilities, particularly if these hostilities were protracted or involved thethreat of or use of weapons of mass destruction, our operations would be materially adversely affected. Inaddition, companies may decline to contract with us for services in light of international terrorist incidents orarmed hostilities even where India is not involved because of more generalized concerns about relying on aservice provider utilizing international resources.
In the past, the Indian economy has experienced many of the problems confronting the economies ofdeveloping countries, including high inflation, erratic gross domestic product growth and shortages of foreignexchange. The Indian government has exercised and continues to exercise significant influence over manyaspects of the Indian economy, and Indian government actions concerning the economy could have a materialadverse effect on private sector entities, including us. In the past, the Indian government has provided significanttax incentives and relaxed certain regulatory restrictions in order to encourage foreign investment in specifiedsectors of the economy, including the software development services industry. Programs that have benefited usinclude, among others, tax holidays, liberalized import and export duties and preferential rules on foreigninvestment and repatriation. Notwithstanding these benefits, India’s central and state governments remainsignificantly involved in the Indian economy as regulators. In recent years, the Indian government has introducednon-income related taxes, including the fringe benefit tax (which was repealed as of April 1, 2009) and newservice taxes, and income-related taxes, including the Minimum Alternative Tax. In addition, a change ingovernment leadership in India or change in policies of the existing government in India that results in theelimination of any of the benefits realized by us from our Indian operations or the imposition of new taxes couldhave a material adverse effect on our business, results of operations and financial condition.
In addition, the emergence of a widespread health emergency or pandemic could create economic orfinancial disruption that could negatively affect our revenue and operations or impair our ability to manage ourbusiness in certain parts of the world.
Our international sales and operations are subject to many uncertainties.
Revenues from customers outside North America represented approximately 20.9% of our revenues for theyear ended December 31, 2009. We anticipate that revenues from customers outside North America will continueto account for a material portion of our revenues in the foreseeable future and may increase as we expand ourinternational presence, particularly in Europe, the Asia Pacific and Latin America regions. In addition, themajority of our employees and our development and delivery centers are located in India. As a result, we may besubject to risks associated with international operations, including risks associated with foreign currencyexchange rate fluctuations, which may cause volatility in our reported income, and risks associated with theapplication and imposition of protective legislation and regulations relating to import or export or otherwiseresulting from foreign policy or the variability of foreign economic conditions. From time to time, we mayengage in hedging transactions to mitigate our risks relating to exchange rate fluctuations. The use of hedgingcontracts is intended to mitigate or reduce transactional level volatility in the results of our foreign operations,but does not completely eliminate volatility and risk. In addition, use of hedging contracts includes the risk ofnon-performance by the counterparty. Additional risks associated with international operations includedifficulties in enforcing intellectual property rights, the burdens of complying with a wide variety of foreignlaws, potentially adverse tax consequences, tariffs, quotas and other barriers and potential difficulties incollecting accounts receivable. In addition, we may face competition in other countries from companies that may
17

have more experience with operations in such countries or with international operations. We may also facedifficulties integrating new facilities in different countries into our existing operations, as well as integratingemployees that we hire in different countries into our existing corporate culture. Our international expansionplans may not be successful and we may not be able to compete effectively in other countries. There can be noassurance that these and other factors will not have a material adverse effect on our business, results ofoperations and financial condition.
Our operating results may be adversely affected by fluctuations in the Indian rupee and other foreigncurrency exchange rates.
Although we report our operating results in U.S. dollars, a portion of our revenues and expenses aredenominated in currencies other than the U.S. dollar. Fluctuations in foreign currency exchange rates can have anumber of adverse effects on us. Because our consolidated financial statements are presented in U.S. dollars, wemust translate revenues, expenses and income, as well as assets and liabilities, into U.S. dollars at exchange ratesin effect during or at the end of each reporting period. Therefore, changes in the value of the U.S. dollar againstother currencies will affect our revenues, income from operations, other income (expense), net and the value ofbalance sheet items originally denominated in other currencies. During the year ended December 31, 2009, thedepreciation of the Indian rupee versus the U.S. dollar favorably impacted our operating margins by 255 basispoints or 2.55 percentage points as compared to 2008. Additionally, during the year ended December 31, 2009,we recorded net foreign currency gains of $1.7 million, inclusive of losses of $20.8 million on undesignatedbalance sheet hedges. There is no guarantee that our financial results will not be adversely affected by currencyexchange rate fluctuations or that any efforts by us to engage in currency hedging activities will be effective. Inaddition, in some countries we could be subject to strict restrictions on the movement of cash and the exchangeof foreign currencies, which could limit our ability to use this cash across our global operations. Finally, as wecontinue to leverage our global delivery model, more of our expenses are incurred in currencies other than thosein which we bill for the related services. An increase in the value of certain currencies, such as the Indian rupee,against the U.S. dollar could increase costs for delivery of services at offshore sites by increasing labor and othercosts that are denominated in local currency.
Our operating results may be adversely affected by our use of derivative financial instruments.
We have entered into a series of foreign exchange forward contracts that are designated as cash flow hedgesof certain salary payments in India. These contracts are intended to partially offset the impact of the movement ofthe exchange rates on future operating costs. In addition, we also entered into foreign exchange forward contractsin order to mitigate foreign currency risk on Indian rupee denominated net monetary assets. The hedgingstrategies that we have implemented or may implement to mitigate foreign currency exchange rate risks may notreduce or completely offset our exposure to foreign exchange rate fluctuations and may expose our business tounexpected market, operational and counterparty credit risks. Accordingly, we may incur losses from our use ofderivative financial instruments that could have a material adverse affect on our business, results of operationsand financial condition.
Our global operations expose us to numerous and sometimes conflicting legal and regulatoryrequirements, and violations of these regulations could harm our business.
Because we provide services to clients throughout the world, we are subject to numerous, and sometimesconflicting, legal rules on matters as diverse as import/export controls, content requirements, trade restrictions,tariffs, taxation, sanctions, government affairs, internal and disclosure control obligations, data privacy and laborrelations. Violations of these laws or regulations in the conduct of our business could result in fines, criminalsanctions against us or our officers, prohibitions on doing business and damage to our reputation. Violations ofthese laws or regulations in connection with the performance of our obligations to our clients also could result inliability for monetary damages, fines and/or criminal prosecution, unfavorable publicity, restrictions on ourability to process information and allegations by our clients that we have not performed our contractual
18

obligations. Due to the varying degrees of development of the legal systems of the countries of which we operate,local laws might be insufficient to protect our rights. Our failure to comply with applicable legal and regulatoryrequirements could have a material adverse effect on our business, results of operations and financial condition.
In many parts of the world, including countries in which we operate, practices in the local businesscommunity might not conform to international business standards and could violate anticorruption laws orregulations, including the U.S. Foreign Corrupt Practices Act. Although we have policies and procedures in placethat are designed to promote legal and regulatory compliance, our employees, subcontractors and agents couldtake actions that violate these policies or procedures or applicable anticorruption laws or regulations. Violationsof these laws or regulations could subject us to criminal or civil enforcement actions, including fines andsuspension or disqualification from government contracting, any of which could have a material adverse effecton our business.
International hostilities, terrorist activities, other violence or war, natural disasters, pandemics andinfrastructure disruptions, could delay or reduce the number of new service orders we receive and impairour ability to service our customers, thereby adversely affecting our business, financial condition andresults of operations.
Hostilities involving the United States and other acts of terrorism, violence or war, such as the attacks ofSeptember 11, 2001 in the United States, the attacks of July 7, 2005 in the United Kingdom, the attacks ofNovember 26, 2008 in Mumbai, India, and the continuing conflict in Iraq and Afghanistan, natural disasters,global health risks or pandemics or the threat or perceived potential for these events could materially adverselyaffect our operations and our ability to service our customers. Such events could cause customers to delay theirdecisions on spending for information technology, consulting, and business and knowledge process outsourcingservices and give rise to sudden significant changes in regional and global economic conditions and cycles. Theseevents also pose significant risks to our people and to physical facilities and operations around the world,whether the facilities are ours or those of our clients, which could affect our financial results. By disruptingcommunications and travel, giving rise to travel restrictions, and increasing the difficulty of obtaining andretaining highly skilled and qualified personnel, these events could make it difficult or impossible for us todeliver services to our clients. The majority of our technical professionals are located in India, and the vastmajority of our technical professionals in the United States and Europe are Indian nationals who are able to workin the United States and Europe only because they hold current visas and work permits. Travel restrictions couldcause us to incur additional unexpected labor costs and expenses or could restrain our ability to retain the skilledprofessionals we need for our operations. In addition, any extended disruptions of electricity, other public utilitiesor network services at our facilities, as well as system failures at, or security breaches in, our facilities orsystems, could also adversely affect our ability to serve our clients.
Although we continue to believe that we have a strong competitive position in the United States, wecontinue to increase our efforts to geographically diversify our clients and revenue. Despite our efforts todiversify, hostilities involving the United States, the United Kingdom, India and other countries in which weprovide services to our clients, and other acts of terrorism, violence or war, natural disasters, global health risksor pandemics may reduce the demand for our services and negatively affect our revenues and profitability. Whilewe plan and prepare to defend against each of these occurrences, we might be unable to protect our people,facilities and systems against all such occurrences. If these disruptions prevent us from effectively serving ourclients, our operating results could be adversely affected.
Anti-outsourcing legislation, if adopted, could adversely affect our business, financial condition andresults of operations and impair our ability to service our customers.
The issue of companies outsourcing services to organizations operating in other countries is a topic ofpolitical discussion in many countries, including the United States, which is our largest market. For example,measures aimed at limiting or restricting outsourcing by United States companies are periodically considered in
19

Congress and in numerous state legislatures to address concerns over the perceived association between offshoreoutsourcing and the loss of jobs in the United States. Senators Richard Durbin (D-Illinois) and Charles Grassley(R-Iowa) have introduced a bill which would, if enacted, severely restrict the use of certain temporary businessvisas. Given the ongoing debate over this issue, the introduction and consideration of other restrictive legislationis possible. If enacted, such measures may: (1) broaden restrictions on outsourcing by federal and stategovernment agencies and on government contracts with firms that outsource services directly or indirectly,(2) impact private industry with measures such as tax disincentives or intellectual property transfer restrictions,and/or (3) restrict the use of certain business visas. In the event that any of these measures become law, ourbusiness, results of operations and financial condition could be adversely affected and our ability to service ourcustomers could be impaired.
In addition, from time to time, there has been publicity about negative experiences associated with offshoreoutsourcing, such as theft and misappropriation of sensitive client data, particularly involving service providersin India. Current or prospective clients may elect to perform certain services themselves or may be discouragedfrom transferring services from onshore to offshore providers to avoid negative perceptions that may beassociated with using an offshore provider. Any slowdown or reversal of existing industry trends toward offshoreoutsourcing would seriously harm our ability to compete effectively with competitors that provide services fromwithin the country in which our clients operate.
Legislation enacted in certain European jurisdictions and any future legislation in Europe, countries withinthe Asia Pacific region or any other country in which we have clients restricting the performance of businessprocess services from an offshore location could also have a material adverse effect on our business, results ofoperations and financial condition. For example, new legislation recently enacted in the United Kingdom, basedon the 1977 EC Acquired Rights Directive, has been adopted in some form by many European Union, or EU,countries, and provides that if a company outsources all or part of its business to a service provider or changes itscurrent service provider, the affected employees of the company or of the previous service provider are entitledto become employees of the new service provider, generally on the same terms and conditions as their originalemployment. In addition, dismissals of employees who were employed by the company or the previous serviceprovider immediately prior to that transfer are automatically considered unfair dismissals that entitle suchemployees to compensation. As a result, in order to avoid unfair dismissal claims we may have to offer, andbecome liable for, voluntary redundancy payments to the employees of our clients who outsource business to usin the United Kingdom and other EU countries who have adopted similar laws. This legislation may materiallyaffect our ability to obtain new business from companies in the United Kingdom and EU and to provideoutsourced services to companies in the United Kingdom and EU in a cost-effective manner.
Our growth may be hindered by immigration restrictions.
Our future success will depend on our ability to attract and retain employees with technical and projectmanagement skills from developing countries, especially India. The vast majority of our IT professionals in theUnited States and in Europe are Indian nationals. The ability of Indian nationals to work in the United States andEurope depends on their ability and our ability to obtain the necessary visas and work permits.
The H-1B visa classification enables United States employers to hire qualified foreign workers in positionsthat require an education at least equal to a four-year bachelor degree in the United States in specialtyoccupations such as IT systems engineering and systems analysis. The H-1B visa usually permits an individual towork and live in the United States for a period of up to six years. Under certain limited circumstances, H-1B visaextensions after the six-year period may be available. There is a limit on the number of new H-1B petitions thatthe United States Citizenship and Immigration Services, or CIS, one of the successor agencies to the Immigrationand Naturalization Service, may approve in any federal fiscal year, and in years in which this limit is reached, wemay be unable to obtain H-1B visas necessary to bring foreign employees to the United States. Currently, thelimit is 65,000 for holders of United States or United States-equivalent bachelor degrees (the general cap), and anadditional 20,000 for holders of advanced degrees from United States post-secondary educational institutions.Although CIS has reached its general cap and advanced degree cap for fiscal year 2010, we expect to be able to
20

file H-1B petitions with CIS against the fiscal year 2011 caps beginning April 1, 2010 for work in H-1B statusbeginning on October 1, 2011. As a part of our advanced planning process, we believe that we have sufficientemployees visa-ready to meet our anticipated business growth in the current year. In addition, there are strictlabor regulations associated with the H-1B visa classification. Larger users of the H-1B visa program are oftensubject to investigations by the Wage and Hour Division of the United States Department of Labor. A finding bythe United States Department of Labor of willful or substantial failure to comply with existing regulations on theH-1B classification may result in back-pay liability, substantial fines, and/or a ban on future use of the H-1Bprogram and other immigration benefits.
We also regularly transfer employees from India to the United States to work on projects, at client sites,using the L-1 visa classification. The L-1 visa allows companies abroad to transfer certain managers, executives,and employees with specialized company knowledge to related United States companies such as a parent,subsidiary, affiliate, joint venture, or branch office. We have an approved “Blanket L Program,” under which thecorporate relationships of our transferring and receiving entities have been pre-approved by CIS, thus enablingindividual L-1 visa applications to be presented directly to a visa-issuing United States consular post abroadrather than undergoing a pre-approval process through CIS in the United States. In recent years, both the UnitedStates consular posts that review initial L-1 applications and CIS, which adjudicates petitions for initial grantsand extensions of L-1 status, have become increasingly restrictive with respect to this category. As a result, therate of refusals of initial L-1 petitions and extensions has increased. In addition, even where L-1 visas areultimately granted and issued, security measures undertaken by United States consular posts around the worldhave delayed visa issuances. Our inability to bring qualified technical personnel into the United States to staffon-site customer locations would have a material adverse effect on our business, results of operations andfinancial condition.
On December 8, 2004, President Bush signed the L-1 Visa Reform Act, which was part of the fiscal year2005 Omnibus Appropriations Act (Public Law 108-447 at Division J, Title IV). This legislation containedseveral important changes to the laws governing L-1 visa holders. All of the changes took effect on June 8, 2005.Under one provision of this law, all L-1 applicants, including those brought to the United States under a BlanketL Program, must have worked abroad with the related company for one full year in the prior three years. Theprovision allowing Blanket L applicants who had worked abroad for the related company for six months duringthe qualifying three-year period was revoked. In addition, L-1B holders (intracompany transferees withspecialized company knowledge) may not be primarily stationed at the work site of another employer if the L-1Bvisa holder will be controlled and supervised by an employer other than the petitioning employer. Finally, L-1Bstatus may not be granted where placement of the L-1B visa holder at a third party site is part of an arrangementto provide labor for the third party, rather than placement at the site in connection with the provision of a productor service involving specialized knowledge specific to the petitioning employer.
We do not place L-1B workers at third party sites where they are under the primary supervision of adifferent employer, nor do we place L-1B workers at third party sites in an arrangement to provide labor for thethird party without providing a service involving our specialized knowledge. Since implementation of this law,we consistently have established this fact to CIS’s satisfaction. However, if CIS and/or the United StatesDepartment of State, through its visa-issuing consular posts abroad, decide to interpret these provisions in a veryrestrictive fashion, this could impair our ability to staff our projects in the United States with resources from ourentities abroad. In addition, CIS has not yet issued regulations governing these statutory provisions. If suchregulations are restrictive in nature, this could impair our ability to staff our projects in the United States withresources from our entities abroad.
We also process immigrant visas for lawful permanent residence in the United States for employees to fillpositions for which there are an insufficient number of able, willing, and qualified United States workersavailable to fill the positions. Compliance with existing United States immigration and labor laws, or changes inthose laws making it more difficult to hire foreign nationals or limiting our ability to successfully obtainpermanent residence for our foreign employees in the United States, could require us to incur additional
21

unexpected labor costs and expenses or could restrain our ability to retain the skilled professionals we need forour operations in the United States. Any of these restrictions or limitations on our hiring practices could have amaterial adverse effect on our business, results of operations and financial condition.
In addition to immigration restrictions in the United States, there are certain restrictions on transferringemployees to work in the United Kingdom, where we have experienced significant growth. The United Kingdomcurrently requires that all employees who are not nationals of European Union countries (plus nationals ofBulgaria and Romania) or EEA nationals, obtain work permission before obtaining a visa/entry clearance totravel to the United Kingdom. New European nations such as Hungary, Poland, Lithuania, Slovakia, and theCzech Republic do not have a work permit requirement but employees need to register to work within 30 days ofarrival. On November 27, 2008, the United Kingdom introduced a points-based system under which certaincertificates of sponsorship are issued by licensed employer sponsors, provided the employees they seek toemploy in the United Kingdom can accumulate a certain number of points based on certain attributes. Where theemployee has not worked for a Cognizant group company outside the United Kingdom for at least 6 months, wewill need to carry out a resident labor market test to confirm that the intended role cannot be filled by an EEAnational. We are currently an A-rated sponsor and were allocated certificates of sponsorship which we believe aresufficient to meet our demand for transfers to the United Kingdom.
Immigration and work permit laws and regulations in the United States, the United Kingdom, and othercountries are subject to legislative and administrative changes as well as changes in the application of standardsand enforcement. Immigration and work permit laws and regulations can be significantly affected by politicalforces and levels of economic activity. Our international expansion strategy and our business, results ofoperations, and financial condition may be materially adversely affected if changes in immigration and workpermit laws and regulations or the administration or enforcement of such laws or regulations impair our ability tostaff projects with IT professionals who are not citizens of the country where the work is to be performed.
Our revenues are highly dependent on clients primarily located in the United States and Europe, aswell as on clients concentrated in certain industries, including the financial services industry. Continuingor worsening economic conditions or factors that negatively affect the economic health of the UnitedStates, Europe or these industries may adversely affect our business.
Approximately 79.1% of our revenues during the year ended December 31, 2009 were derived fromcustomers located in North America. In the same period, approximately 18.5% of our revenues were derivedfrom customers located in Europe. If the United States or European economy continues to weaken or slow andconditions in the financial markets continue to deteriorate, pricing for our services may be depressed and ourcustomers may reduce or postpone their technology spending significantly, which may in turn lower the demandfor our services and negatively affect our revenues and profitability. Additionally, any prolonged recession in theUnited States and Europe could have an adverse impact on our revenues because a large portion of our revenuesare derived from the United States and Europe. In addition, during the year ended December 31, 2009, we earnedapproximately 42.9% of our revenues from the financial services industry, which includes insurance. Acontinuation of the current crisis in the financial services industry and significant consolidation in that industry,or a decrease in growth or consolidation in other industry segments on which we focus, may reduce the demandfor our services and negatively affect our revenues and profitability. In addition, if we are unable to successfullyanticipate changing economic and political conditions affecting the industries and markets in which we operate,we may be unable to effectively plan for or respond to those changes, and our business could be negativelyaffected.
22

We face intense competition from other service providers.
The intensely competitive information technology, consulting and business process outsourcing professionalservices markets includes a large number of participants and is subject to rapid change. These markets includesparticipants from a variety of market segments, including:
• systems integration firms;
• contract programming companies;
• application software companies;
• internet solutions providers;
• large or traditional consulting companies;
• professional services groups of computer equipment companies; and
• infrastructure management and outsourcing companies.
These markets also include numerous smaller local competitors in the various geographic markets in whichwe operate which may be able to provide services and solutions at lower costs or on terms more attractive toclients than we can. Our direct competitors who use the on-site/offshore business model include, among others,Infosys Technologies, Tata Consultancy Services and Wipro. In addition, many of our competitors havesignificantly greater financial, technical and marketing resources and greater name recognition and, therefore,may be better able to compete for new work and skilled professionals. Some of these larger competitors, such asAccenture, Electronic Data Systems (acquired by Hewlett-Packard Company) Perot Systems (acquired by DellInc.) and IBM Global Services, have offshore operations. There is a risk that increased competition could putdownward pressure on the prices we can charge for our services and on our operating margins. Similarly, if ourcompetitors develop and implement methodologies that yield greater efficiency and productivity, they may beable to offer services similar to ours at lower prices without adversely affecting their profit margins. Even if ourofferings address industry and client needs, our competitors may be more successful at selling their services. Ifwe are unable to provide our clients with superior services and solutions at competitive prices, our results ofoperations may suffer. Further, a client may choose to use its own internal resources rather than engage anoutside firm to perform the types of services we provide. We cannot assure you that we will be able to sustain ourcurrent levels of profitability or growth as competitive pressures, including competition for skilled technologyprofessionals and pricing pressure from competitors employing an on-site/offshore business model, increase.
In addition, we may face competition from companies that increase in size or scope as the result of strategicmergers or acquisitions. These transactions may include consolidation activity among hardware manufacturers,software companies and vendors, and service providers. The result of any such vertical integration may begreater integration of products and services that were once offered separately by independent vendors. Our accessto such products and services may be reduced as a result of this industry trend, which could adversely affect ourcompetitive position.
We may not be able to sustain our current level of profitability.
For the year ended December 31, 2009, we reported an operating margin of 18.9%. Our operating marginmay decline if we experience declines in demand and pricing for our services, imposition of new non-incomerelated taxes or due to adverse fluctuations in foreign currency exchange rates. In addition, historically, wages inIndia increased at a faster rate than in the United States. Additionally, the number and type of equity-basedcompensation awards and the assumptions used in valuing equity-based compensation awards may changeresulting in increased stock-based compensation expense and lower margins. Although we have historically beenable to partially offset wage increases and foreign currency fluctuations through further leveraging the scale ofour operating structure, obtaining price increases, and issuing a lower number of stock options and other equity-based compensation awards in proportion to our overall headcount, we cannot assure you that we will be able tocontinue to do so in the future.
23
Our profitability could suffer if we are not able to control our costs.
Our ability to control our costs and improve our efficiency affects our profitability. If we are unable tocontrol our costs or improve our efficiency, our profitability could be negatively affected.
Our business will suffer if we fail to develop new services and enhance our existing services in order tokeep pace with the rapidly evolving technological environment.
The information technology, consulting and outsourcing services market is characterized by rapidtechnological change, evolving industry standards, changing customer preferences and new product and serviceintroductions. Our future success will depend on our ability to develop solutions that keep pace with changes inthe markets in which we provide services. We cannot assure you that we will be successful in developing newservices addressing evolving technologies on a timely or cost-effective basis or, if these services are developed,that we will be successful in the marketplace. In addition, we cannot assure you that products, services ortechnologies developed by others will not render our services non-competitive or obsolete. Our failure to addressthese developments could have a material adverse effect on our business, results of operations and financialcondition.
Our ability to remain competitive will also depend on our ability to design and implement, in a timely andcost-effective manner, solutions for customers that both leverage their legacy systems and appropriately utilizenewer technologies such as Web 2.0 models, software-as-a-service, and service oriented architectures. Ourfailure to design and implement solutions in a timely and cost-effective manner could have a material adverseeffect on our business, results of operations and financial condition.
We may face difficulties in providing end-to-end business solutions for our clients that could causeclients to discontinue their work with us, which in turn could harm our business.
We have been expanding the nature and scope of our engagements and have added new service offerings,such as IT consulting, business and knowledge process outsourcing, systems integration and outsourcing of entireportions of IT infrastructure. The success of these service offerings is dependent, in part, upon continued demandfor such services by our existing and new clients and our ability to meet this demand in a cost-competitive andeffective manner. In addition, our ability to effectively offer a wider breadth of end-to-end business solutionsdepends on our ability to attract existing or new clients to these service offerings. To obtain engagements forsuch end-to-end solutions, we also are more likely to compete with large, well-established internationalconsulting firms, resulting in increased competition and marketing costs. Accordingly, we cannot be certain thatour new service offerings will effectively meet client needs or that we will be able to attract existing and newclients to these service offerings.
The increased breadth of our service offerings may result in larger and more complex projects with ourclients. This will require us to establish closer relationships with our clients and a thorough understanding of theiroperations. Our ability to establish such relationships will depend on a number of factors, including theproficiency of our professionals and our management personnel. Our failure to understand our clientrequirements or our failure to deliver services which meet the requirements specified by our clients could resultin termination of client contracts, and we could be liable to our clients for significant penalties or damages.
Larger projects may involve multiple engagements or stages, and there is a risk that a client may choose notto retain us for additional stages or may cancel or delay additional planned engagements. These terminations,cancellations or delays may result from the business or financial condition of our clients or the economygenerally, as opposed to factors related to the quality of our services. Such cancellations or delays make itdifficult to plan for project resource requirements, and inaccuracies in such resource planning may have anegative impact on our profitability.
24

If our clients are not satisfied with our services, our business could be adversely affected.
Our business model depends in large part on our ability to attract additional work from our base of existingclients. Our business model also depends on relationships our account teams develop with our clients so that wecan understand our clients’ needs and deliver solutions and services that are tailored to those needs. If a client isnot satisfied with the quality of work performed by us, or with the type of services or solutions delivered, then wecould incur additional costs to address the situation, the profitability of that work might be impaired, and theclient’s dissatisfaction with our services could damage our ability to obtain additional work from that client. Inparticular, clients that are not satisfied might seek to terminate existing contracts prior to their scheduledexpiration date and could direct future business to our competitors. In addition, negative publicity related to ourclient services or relationships, regardless of its accuracy, may further damage our business by affecting ourability to compete for new contracts with current and prospective clients.
We rely on a few customers for a large portion of our revenues.
Our top five customers generated approximately 17.4% of our revenues for the year ended December 31,2009. The volume of work performed for specific customers is likely to vary from year to year, and a majorcustomer in one year may not use our services in a subsequent year. The loss of one of our large customers couldhave a material adverse effect on our business, results of operations and financial condition.
We generally do not have long-term contracts with our customers and our results of operations couldbe adversely affected if our clients terminate their contracts with us on short notice.
Consistent with industry practice, we generally do not enter into long-term contracts with our customers. Amajority of our contracts can be terminated by our clients with short notice and without significant earlytermination cost. Terminations may result from factors that are beyond our control and unrelated to our workproduct or the progress of the project, including the business or financial conditions of the client, changes inownership or management at our clients, changes in client strategies or the economy or markets generally. Whencontracts are terminated, we lose the anticipated revenues and might not be able to eliminate our associated costsin a timely manner. Consequently, our profit margins in subsequent periods could be lower than expected. If weare unable to replace the lost revenue with other work on terms we find acceptable or effectively eliminate costs,we may not be able to maintain our level of profitability.
Our results of operations may be affected by the rate of growth in the use of technology in businessand the type and level of technology spending by our clients.
Our business depends in part upon continued growth in the use of technology in business by our clients andprospective clients and their customers and suppliers. In challenging economic environments, our clients mayreduce or defer their spending on new technologies in order to focus on other priorities. At the same time, manycompanies have already invested substantial resources in their current means of conducting commerce andexchanging information, and they may be reluctant or slow to adopt new approaches that could disrupt existingpersonnel, processes and infrastructures. If the growth of use of technology in business or our clients’ spendingon technology in business declines, or if we cannot convince our clients or potential clients to embrace newtechnology solutions, our results of operations could be adversely affected.
If we are unable to collect our receivables from or bill our unbilled services to our clients, our resultsof operations and cash flows could be adversely affected.
Our business depends on our ability to successfully obtain payment from our clients of the amounts theyowe us for work performed. We evaluate the financial condition of our clients and usually bill and collect onrelatively short cycles. We maintain allowances against receivables and unbilled services. Actual losses on clientbalances could differ from those that we currently anticipate and, as a result, we might need to adjust our
25

allowances. There is no guarantee that we will accurately assess the creditworthiness of our clients.Macroeconomic conditions, such as the continued credit crisis and related turmoil in the global financial system,could also result in financial difficulties, including limited access to the credit markets, insolvency or bankruptcy,for our clients, and, as a result, could cause clients to delay payments to us, request modifications to theirpayment arrangements that could increase our receivables balance, or default on their payment obligations to us.Timely collection of client balances also depends on our ability to complete our contractual commitments andbill and collect our contracted revenues. If we are unable to meet our contractual requirements, we mightexperience delays in collection of and/or be unable to collect our client balances, and if this occurs, our results ofoperations and cash flows could be adversely affected. In addition, if we experience an increase in the time to billand collect for our services, our cash flows could be adversely affected.
We are investing substantial cash assets in new facilities and physical infrastructure, and ourprofitability could be reduced if our business does not grow proportionately.
We have made and continue to make significant contractual commitments related to capital expenditures onconstruction or expansion of our development and delivery centers. We may encounter cost overruns or projectdelays in connection with new facilities. These expansions will likely increase our fixed costs and if we areunable to grow our business and revenues proportionately, our profitability may be reduced.
Competition for highly skilled technical personnel is intense and the success of our business dependson our ability to attract and retain highly skilled professionals.
Our future success will depend to a significant extent on our ability to attract, train and retain highly skilledprofessionals so as to keep our supply of skills and resources in balance with client demand. In particular, wemust attract, train and retain appropriate numbers of talented people, including project managers, IT engineersand other senior technical personnel, with diverse skills in order to serve client needs and grow our business. Weare particularly dependent on retaining our senior executives and other experienced managers with the skill setsrequired by our business, and if we are unable to do so, our ability to develop new business and effectively leadour current projects could be jeopardized. Similarly, the profitability of our business model depends on ourability to effectively utilize personnel with the right mix of skills and experience to support our projects. Theprocesses and costs associated with recruiting, training and retaining employees place significant demands on ourresources.
We believe there is a shortage of, and significant competition for, professionals in the United States, Europeand India with the advanced technological skills necessary to perform the services we offer. We havesubcontracted to a limited extent in the past, and may do so in the future, with other service providers in order tomeet our obligations to our customers. Our ability to maintain and renew existing engagements and obtain newbusiness will depend, in large part, on our ability to attract, train and retain technical personnel with the skills thatkeep pace with continuing changes in information technology, evolving industry standards and changingcustomer preferences. Further, we must train and manage our growing work force, requiring an increase in thelevel of responsibility for both existing and new management personnel. We cannot assure you that themanagement skills and systems currently in place will be adequate or that we will be able to train and assimilatenew employees successfully. Our profits and ability to compete for and manage client engagements could beadversely affected if we cannot manage employee hiring and attrition to achieve an efficient workforce structure.
Our ability to operate and compete effectively could be impaired if we lose key personnel or if wecannot attract additional qualified personnel.
Our future performance depends to a significant degree upon the continued service of the key members ofour management team, as well as marketing, sales and technical personnel, and our ability to attract and retainnew management and other personnel. We do not maintain key man life insurance on any of our executiveofficers or significant employees. Competition for personnel is intense, and there can be no assurance that we
26
will be able to retain our key employees or that we will be successful in attracting and retaining new personnel inthe future. The loss of any one or more of our key personnel or the failure to attract and retain key personnelcould have a material adverse effect on our business, results of operations and financial condition.
Restrictions in non-competition agreements with our executive officers may not be enforceable.
We have entered into non-competition agreements with our executive officers. We cannot assure you,however, that the restrictions in these agreements prohibiting such executive officers from engaging incompetitive activities are enforceable. Further, substantially all of our professional non-executive staff are notcovered by agreements that would prohibit them from working for our competitors. If any of our key professionalpersonnel leaves our employment and joins one of our competitors, our business could be adversely affected.
Our earnings may be adversely affected if we change our intent not to repatriate earnings in India orif such earnings become subject to U.S. tax on a current basis.
Effective January 1, 2002, and in accordance with authoritative literature, we no longer accrue incrementalU.S. taxes on all Indian earnings recognized in 2002 and subsequent periods as these earnings (as well as otherforeign earnings for all periods) are considered to be indefinitely reinvested outside of the United States. Whilewe have no plans to do so, events may occur in the future that could effectively force us to change our intent notto repatriate our foreign earnings. If we change our intent and repatriate such earnings, we will have to accrue theapplicable amount of taxes associated with such earnings and pay taxes at a substantially higher rate than oureffective income tax rate in 2009. These increased taxes could have a material adverse effect on our business,results of operations and financial condition.
In early 2009, President Obama’s Administration announced a number of tax-related legislative proposalsthat would, among other things, seek to effectively tax certain profits of U.S. companies earned abroad. Althoughthe President did not include several of these proposals in the budget he announced in early 2010, Congress couldconsider any of these measures at any time. If enacted into law, and depending on their precise terms, theseproposals could increase our tax rate and tax payments, and have a material adverse effect on our business,results of operations and financial condition.
Our operating results may be negatively impacted upon the loss of certain tax benefits provided byIndia to companies in our industry as well as from proposed tax legislation in India.
Our Indian subsidiaries are export-oriented companies which, under the Indian Income Tax Act of 1961, areentitled to claim tax holidays for a period of ten consecutive years for each Software Technology Park, or STP,with respect to export profits for each STP. Substantially all of the earnings of our Indian subsidiaries areattributable to export profits. The majority of our STPs in India are currently entitled to a 100% exemption fromIndian income tax. Under current Indian tax law, export profits after March 31, 2011 from our existing STPs willbe fully taxable at the Indian statutory rate (which is currently 33.99%) in effect at such time. If the tax holidaysrelating to our Indian STPs are not extended or new tax incentives are not introduced that would effectivelyextend the income tax holiday benefits beyond March 31, 2011, we expect that our effective income tax rate willincrease significantly beginning in calendar year 2011.
If our pricing structures do not accurately anticipate the cost and complexity of performing our work,then our contracts could be unprofitable.
We negotiate pricing terms with our clients utilizing a range of pricing structures and conditions. Wecontract to provide services either on a time-and-materials basis or on a fixed-price basis. Our pricing is highlydependent on our internal forecasts and predictions about our projects and the marketplace, which might be basedon limited data and could turn out to be inaccurate. If we do not accurately estimate the costs and timing forcompleting projects, our contracts could prove unprofitable for us or yield lower profit margins than anticipated.
27

We face a number of risks when pricing our contracts, as many of our projects entail the coordination ofoperations and workforces in multiple locations and utilizing workforces with different skill sets andcompetencies across geographically distributed service locations. Our pricing, cost and profit margin estimatesfor the work that we perform frequently include anticipated long-term cost savings from transformational andother initiatives that we expect to achieve and sustain over the life of the contract. There is a risk that we willunderprice our projects, fail to accurately estimate the costs of performing the work or fail to accurately assessthe risks associated with potential contracts. In particular, any increased or unexpected costs, delays or failures toachieve anticipated cost savings, or unexpected risks we encounter in connection with the performance of thiswork, including those caused by factors outside our control, could make these contracts less profitable orunprofitable, which could have an adverse effect on our profit margin.
In addition, a significant portion of our projects are on a fixed-price basis, subjecting us to the foregoingrisks to an even greater extent. Fixed-price contracts accounted for approximately 30.3% of our revenues for theyear ended December 31, 2009. We expect that an increasing number of our future projects will be contracted ona fixed-price basis. In addition to the other risks described in the paragraph above, we bear the risk of cost over-runs and operating cost inflation in connection with projects covered by fixed-price contracts. Our failure toestimate accurately the resources and time required for a fixed-price project, or our failure to complete ourcontractual obligations within the time frame committed, could have a material adverse effect on our business,results of operations and financial condition.
Our profitability could suffer if we are not able to maintain favorable pricing rates.
Our profit margin, and therefore our profitability, is dependent on the rates we are able to recover for ourservices. If we are not able to maintain favorable pricing for our services, our profit margin and our profitabilitycould suffer. The rates we are able to recover for our services are affected by a number of factors, including:
• our clients’ perceptions of our ability to add value through our services;
• competition;
• introduction of new services or products by us or our competitors;
• our competitors’ pricing policies;
• our ability to accurately estimate, attain and sustain contract revenues, margins and cash flows overincreasingly longer contract periods;
• bid practices of clients and their use of third-party advisors;
• the use by our competitors and our clients of offshore resources to provide lower-cost service deliverycapabilities;
• our ability to charge premium prices when justified by market demand or the type of service; and
• general economic and political conditions.
Our profitability could suffer if we are not able to maintain favorable utilization rates.
The cost of providing our services, including the utilization rate of our professionals, affects ourprofitability. If we are not able to maintain an appropriate utilization rate for our professionals, our profit marginand our profitability may suffer. Our utilization rates are affected by a number of factors, including:
• our ability to transition employees from completed projects to new assignments and to hire andassimilate new employees;
• our ability to forecast demand for our services and thereby maintain an appropriate headcount in eachof our geographies and workforces;
28

• our ability to manage attrition; and
• our need to devote time and resources to training, professional development and other non-chargeableactivities.
If we do not continue to improve our operational, financial and other internal controls and systems tomanage our rapid growth and size or if we are unable to enter, operate and compete effectively in newgeographic markets, our business may suffer and the value of our shareholders’ investment may beharmed.
Our anticipated growth will continue to place significant demands on our management and other resources.Our growth will require us to continue to develop and improve our operational, financial and other internalcontrols, both in the United States, India and elsewhere. In particular, our continued growth will increase thechallenges involved in:
• recruiting, training and retaining technical, finance, marketing and management personnel with theknowledge, skills and experience that our business model requires;
• maintaining high levels of client satisfaction;
• developing and improving our internal administrative infrastructure, particularly our financial,operational, communications and other internal systems;
• preserving our culture, values and entrepreneurial environment; and
• effectively managing our personnel and operations and effectively communicating to our personnelworldwide our core values, strategies and goals.
In addition, the size and scope of our operations increase the possibility that an employee will engage inunlawful or fraudulent activity, or otherwise expose us to unacceptable business risks, despite our efforts to trainour people and maintain internal controls to prevent such instances. If we do not continue to develop andimplement the right processes and tools to manage our enterprise, our ability to compete successfully and achieveour business objectives could be impaired.
As part of our growth strategy, we are expanding our operations in Europe, Asia, Middle East, and LatinAmerica. We may not be able to compete effectively in these markets and the cost of entering these markets maybe substantially greater than we expect. If we fail to compete effectively in the new markets we enter, or if thecost of entering those markets is substantially greater than we expect, our business, results of operations andfinancial condition could be adversely affected. In addition, if we cannot compete effectively, we may berequired to reconsider our strategy to invest in our international expansion plans and change our intent on therepatriation of our earnings.
Our operating results may experience significant quarterly fluctuations.
We historically have experienced significant quarterly fluctuations in our revenues and results of operationsand expect these fluctuations to continue. Among the factors causing these variations have been:
• the nature, number, timing, scope and contractual terms of the projects in which we are engaged;
• delays incurred in the performance of those projects;
• the accuracy of estimates of resources and time required to complete ongoing projects; and
• general economic conditions.
In addition, our future revenues, operating margins and profitability may fluctuate as a result of:
• changes in pricing in response to customer demand and competitive pressures;
29

• changes to the financial condition of our clients;
• the mix of on-site and offshore staffing;
• the ratio of fixed-price contracts versus time-and-materials contracts;
• employee wage levels and utilization rates;
• changes in foreign exchange rates, including the Indian rupee versus the U. S. dollar;
• the timing of collection of accounts receivable;
• enactment of new taxes;
• changes in domestic and international income tax rates and regulations; and
• changes to levels and types of stock-based compensation awards and assumptions used to determinethe fair value of such awards.
A high percentage of our operating expenses, particularly personnel and rent, are relatively fixed in advanceof any particular quarter. As a result, unanticipated variations in the number and timing of our projects or inemployee wage levels and utilization rates may cause significant variations in our operating results in anyparticular quarter, and could result in losses. Any significant shortfall of revenues in relation to our expectations,any material reduction in utilization rates for our professional staff or variance in the on-site, offshore staffingmix, an unanticipated termination of a major project, a customer’s decision not to pursue a new project orproceed to succeeding stages of a current project or the completion during a quarter of several major customerprojects could require us to pay underutilized employees and could therefore have a material adverse effect onour business, results of operations and financial condition.
As a result of these factors, it is possible that in some future periods, our revenues and operating results maybe significantly below the expectations of public market analysts and investors. In such an event, the price of ourcommon stock would likely be materially and adversely affected.
We could be held liable for damages or our reputation could be damaged by disclosure of confidentialinformation or personal data or system failures.
We are dependent on information technology networks and systems to process, transmit and store electronicinformation and to communicate among our locations around the world and with our clients. Security breaches ofthis infrastructure could lead to shutdowns or disruptions of our systems and potential unauthorized disclosure ofconfidential information. In addition, many of our engagements involve projects that are critical to the operationsof our customers’ businesses and provide benefits that are difficult to quantify. Any failure in a customer’scomputer system could result in a claim for substantial damages against us, regardless of our responsibility forthe failure. Although we attempt to limit by contract our liability for damages arising from negligent acts, errors,mistakes or omissions in rendering our services, we cannot assure you that any contractual limitations on liabilitywill be enforceable in all instances or will otherwise protect us from liability for damages.
In addition, we often have access to or are required to manage, utilize, collect and store sensitive orconfidential client or employee data, including nonpublic personal data. As a result, we are subject to numerousU.S. and foreign jurisdiction laws and regulations designed to protect this information, such as the EuropeanUnion Directive on Data Protection and various U.S. federal and state laws governing the protection of health orother individually identifiable information. If any person, including any of our employees, negligently disregardsor intentionally breaches our established controls with respect to such data or otherwise mismanages ormisappropriates that data, we could be subject to significant liability to our clients or our clients’ customers forbreaching contractual confidentiality provisions or privacy laws as well as liability and penalties in connectionwith any violation of applicable privacy laws and/or criminal prosecution. Unauthorized disclosure of sensitiveor confidential client or employee data, whether through breach of computer systems, systems failure, employee
30

negligence, fraud or misappropriation, or otherwise, could damage our reputation and cause us to lose clients.Similarly, unauthorized access to or through our information systems or those we develop or manage for ourclients, whether by our employees or third parties, could result in negative publicity, legal liability and damage toour reputation.
Although we have general liability insurance coverage, including coverage for errors or omissions, there canbe no assurance that coverage will continue to be available on reasonable terms or will be sufficient in amount tocover one or more large claims, or that the insurer will not disclaim coverage as to any future claim. Thesuccessful assertion of one or more large claims against us that exceed available insurance coverage or changesin our insurance policies, including premium increases or the imposition of large deductible or co-insurancerequirements, could have a material adverse effect on our business, results of operations and financial condition.
Our business could be negatively affected if we incur legal liability in connection with providing oursolutions and services.
If we fail to meet our contractual obligations or otherwise breach obligations to our clients, we could besubject to legal liability. We may enter into non-standard agreements because we perceive an importanteconomic opportunity or because our personnel did not adequately adhere to our guidelines. In addition, thecontracting practices of our competitors may cause contract terms and conditions that are unfavorable to us. Ourcontracts might not always protect us adequately through limitations on the scope and/or amount of our potentialliability. If we cannot or do not meet our contractual obligations to provide solutions and services, and if ourexposure is not adequately limited through the terms of our agreements, we might face significant legal liabilityand our business could be adversely affected.
We could incur liability or our reputation could be damaged if our provision of services and solutionsto our clients contributes to our clients’ internal control deficiencies.
Our clients may perform audits or require us to perform audits and provide audit reports with respect to thecontrols and procedures that we use in the performance of services for such clients, especially when we processdata belonging to them. Our ability to acquire new clients and retain existing clients may be adversely affectedand our reputation could be harmed if we receive a qualified opinion, or if we cannot obtain an unqualifiedopinion, with respect to our controls and procedures in connection with any such audit in a timely manner.Additionally, we could incur liability if our controls and procedures, or the controls and procedures we managefor a client, were to result in internal controls failures or impair our client’s ability to comply with its owninternal control requirements.
If we are unable to protect our intellectual property rights, our business may be adversely affected.
Our future success will depend in part on our ability to protect our proprietary methodologies and otherintellectual property. We presently hold no patents or registered copyrights, and rely upon a combination ofcopyright and trade secret laws, non-disclosure and other contractual arrangements and various security measuresto protect our intellectual property rights. Existing laws of some countries in which we provide services orsolutions, such as China, might offer only limited protection of our intellectual property rights. India is a memberof the Berne Convention, and has agreed to recognize protections on copyrights conferred under the laws offoreign countries, including the laws of the United States. We believe that laws, rules, regulations and treaties ineffect in the United States, India and other countries in which we operate are adequate to protect us frommisappropriation or unauthorized use of our copyrights and other intellectual property. However, there can be noassurance that these laws will not change and, in particular, that the laws of India or the United States will notchange in ways that may prevent or restrict the transfer of software components, libraries and toolsets from Indiato the United States or from the United States to India. There can be no assurance that the steps we have taken toprotect our intellectual property rights will be adequate to deter misappropriation of any of our intellectualproperty, or that we will be able to detect unauthorized use and take appropriate steps to enforce our rights.
31

Enforcing our rights might also require considerable time, money and oversight. Unauthorized use of ourintellectual property may result in development of technology, products or services that compete with ourproducts and services and unauthorized parties may infringe upon or misappropriate our products, services orproprietary information. If we are unable to protect our intellectual property, our business may be adverselyaffected.
Depending on the circumstances, we might need to grant a specific client greater rights in intellectualproperty developed or used in connection with a contract than we generally do. In certain situations, we mightforego all rights to the use of intellectual property we create and intend to reuse across multiple clientengagements, which would limit our ability to reuse that intellectual property for other clients. Any limitation onour ability to provide a service or solution could cause us to lose revenue-generating opportunities and require usto incur additional expenses to develop new or modified solutions for future projects.
Our services or solutions could infringe upon the intellectual property rights of others or we mightlose our ability to utilize the intellectual property of others.
We cannot be sure that our services and solutions, or the solutions of others that we offer to our clients, donot infringe on the intellectual property rights of third parties, and we could have infringement claims assertedagainst us or against our clients. These claims could harm our reputation, cost us money and prevent us fromoffering some services or solutions. In a number of our contracts, we have agreed to indemnify our clients forany expenses or liabilities resulting from claimed infringements of the intellectual property rights of third parties.In some instances, the amount of these indemnities could be greater than the revenues we receive from the client.Any claims or litigation in this area, whether we ultimately win or lose, could be time-consuming and costly,injure our reputation or require us to enter into royalty or licensing arrangements. We might not be able to enterinto these royalty or licensing arrangements on acceptable terms. If a claim of infringement were successfulagainst us or our clients, an injunction might be ordered against our client or our own services or operations,causing further damages. We expect that the risk of infringement claims against us will increase if ourcompetitors are able to obtain patents for software products and processes. Any infringement claim or litigationagainst us could have a material adverse effect on our business, results of operations and financial condition.
We could lose our ability or be unable to secure the right to utilize the intellectual property of others. Third-party suppliers of software, hardware or other intellectual assets could be unwilling to permit us to use theirintellectual property and this could impede or disrupt use of their products or services by us and our clients. Ifour ability to provide services and solutions to our clients is impaired, our operating results could be adverselyaffected.
We may be unable to integrate acquired companies or technologies successfully and we may besubject to certain liabilities assumed in connection with our acquisitions that could harm our operatingresults.
We expect to continue our program of pursuing strategic acquisitions and joint ventures designed to enhanceour capabilities, enable us to expand our geographic presence, especially in the European market, enter newtechnology areas or expand our capacity. We cannot assure you that we will successfully identify suitableacquisition candidates, consummate any acquisition or joint venture, integrate any acquired business or jointventure into our operations or achieve desired financial and operating results. Further, acquisitions and jointventures involve a number of special risks, including diversion of management’s attention and failure to retainkey personnel. We might need to dedicate additional management and other resources to complete thetransactions. Our organizational structure could make it difficult for us to efficiently integrate acquiredbusinesses or technologies into our ongoing operations and assimilate employees of those businesses into ourculture and operations. Accordingly, we might fail to realize the expected benefits or strategic objectives of anyacquisition we undertake. If we are unable to complete the number and kind of acquisitions for which we plan, orif we are inefficient or unsuccessful at integrating any acquired businesses into our operations, we may not be
32

able to achieve our planned rates of growth or improve our market share, profitability or competitive position inspecific markets or services. Also, we may finance any future acquisitions with cash, debt financing, the issuanceof equity securities or a combination of the foregoing. We cannot assure you that we will be able to arrangeadequate financing on acceptable terms. In addition, acquisitions financed with the issuance of our equitysecurities could be dilutive.
Although we conduct due diligence in connection with each of our acquisitions, there may be liabilities thatwe fail to discover or that we inadequately assess in our due diligence efforts. In particular, to the extent that anyacquired businesses or properties failed to comply with or otherwise violated applicable laws or regulations, orfailed to fulfill their contractual obligations to customers, we, as the successor owner, may be financiallyresponsible for these violations and failures and may suffer reputational harm or otherwise be adversely affected.While we generally require the selling party to indemnify us for any and all liabilities associated with suchliabilities, if for any reason the seller does not perform their indemnification obligation, we may be heldresponsible for such liabilities. In addition, as part of an acquisition, we may assume responsibilities andobligations of the acquired business pursuant to the terms and conditions of services agreements entered by theacquired entity that are not consistent with the terms and conditions that we typically accept and require.Although we attempt to structure acquisitions in such a manner as to minimize the liability that could arise fromsuch contractual commitments, we cannot assure you that any of our efforts to minimize the liability will beeffective in all instances or will otherwise protect us from liability for damages under such agreements. Thediscovery of any material liabilities associated with our acquisitions for which we are unable to receiveindemnification could harm our operating results.
System failure or disruptions in communications could disrupt our business and result in lostcustomers and curtailed operations which would reduce our revenue and profitability.
To deliver our services to our customers, we must maintain a high speed network of satellite, fiber optic andland lines and active voice and data communications 24 hours a day between our main offices in Chennai, ourother development and delivery centers and the offices of our customers worldwide. Although we maintainredundancy facilities and satellite communications links, any systems failure or a significant lapse in our abilityto transmit voice and data through satellite and telephone communications could result in lost customers andcurtailed operations which would reduce our revenue and profitability.
Consolidation in the industries that we serve could adversely affect our business.
Companies in the industries that we serve may seek to achieve economies of scale and other synergies bycombining with or acquiring other companies. If two or more of our current clients merge or consolidate andcombine their operations, it may decrease the amount of work that we perform for these clients. If one of ourcurrent clients merges or consolidates with a company that relies on another provider for its consulting, systemsintegration and technology, or outsourcing services, we may lose work from that client or lose the opportunity togain additional work. The increased market power of larger companies could also increase pricing andcompetitive pressures on us. Any of these possible results of industry consolidation could adversely affect ourbusiness.
Our ability to attract and retain business may depend on our reputation in the marketplace.
Our services are marketed to clients and prospective clients based on a number of factors. Since many of ourspecific client engagements involve unique services and solutions, our corporate reputation is a significant factorin our clients’ evaluation of whether to engage our services. We believe the Cognizant brand name and ourreputation are important corporate assets that help distinguish our services from those of our competitors and alsocontribute to our efforts to recruit and retain talented employees. However, our corporate reputation is potentiallysusceptible to damage by actions or statements made by current or former clients, competitors, vendors,adversaries in legal proceedings, government regulators, as well as members of the investment community and
33

the media. There is a risk that negative information about our company, even if based on rumor ormisunderstanding, could adversely affect our business. In particular, damage to our reputation could be difficultand time-consuming to repair, could make potential or existing clients reluctant to select us for newengagements, resulting in a loss of business, and could adversely affect our recruitment and retention efforts.Damage to our reputation could also reduce the value and effectiveness of the Cognizant brand name and couldreduce investor confidence in us, adversely affecting our share price.
Provisions in our charter, by-laws and stockholders’ rights plan and provisions under Delaware lawmay discourage unsolicited takeover proposals.
Provisions in our charter and by-laws, each as amended, our stockholders’ rights plan and Delaware GeneralCorporate Law, or DGCL, may have the effect of deterring unsolicited takeover proposals or delaying orpreventing changes in our control or management, including transactions in which stockholders might otherwisereceive a premium for their shares over then current market prices. In addition, these documents and provisionsmay limit the ability of stockholders to approve transactions that they may deem to be in their best interests. Ourboard of directors has the authority, without further action by the stockholders, to fix the rights and preferences,and issue shares of preferred stock. Our charter provides for a classified board of directors, which will prevent achange of control of our board of directors at a single meeting of stockholders. The prohibition of ourstockholders’ ability to act by written consent and to call a special meeting will delay stockholder actions untilannual meetings or until a special meeting is called by our chairman or chief executive officer or our board ofdirectors. The supermajority-voting requirement for specified amendments to our charter and by-laws allows aminority of our stockholders to block those amendments. The DGCL also contains provisions preventingstockholders from engaging in business combinations with us, subject to certain exceptions. These provisionscould also discourage bids for our common stock at a premium as well as create a depressive effect on the marketprice of the shares of our common stock.
Compliance with new and changing corporate governance and public disclosure requirements addsuncertainty to our compliance policies and increases our costs of compliance.
Changing laws, regulations and standards relating to accounting, corporate governance and publicdisclosure, including the Sarbanes-Oxley Act of 2002, other SEC regulations, and the NASDAQ Global SelectMarket rules, are creating uncertainty for companies like ours. These laws, regulations and standards may lackspecificity and are subject to varying interpretations. Their application in practice may evolve over time, as newguidance is provided by regulatory and governing bodies. This could result in continuing uncertainty regardingcompliance matters and higher costs of compliance as a result of ongoing revisions to such corporate governancestandards.
In particular, our efforts to comply with Section 404 of the Sarbanes-Oxley Act of 2002 and the relatedregulations regarding our required assessment of our internal controls over financial reporting and our externalauditors’ audit of that assessment requires the commitment of significant financial and managerial resources. Weconsistently assess the adequacy of our internal controls over financial reporting, remediate any controldeficiencies that may be identified, and validate through testing that our controls are functioning as documented.While we do not anticipate any material weaknesses, the inability of management and our independent auditor toprovide us with an unqualified report as to the adequacy and effectiveness, respectively, of our internal controlsover financial reporting for future year ends could result in adverse consequences to us, including, but not limitedto, a loss of investor confidence in the reliability of our financial statements, which could cause the market priceof our stock to decline.
We are committed to maintaining high standards of corporate governance and public disclosure, and ourefforts to comply with evolving laws, regulations and standards in this regard have resulted in, and are likely tocontinue to result in, increased general and administrative expenses and a diversion of management time andattention from revenue-generating activities to compliance activities. In addition, the laws, regulations and
34

standards regarding corporate governance may make it more difficult for us to obtain director and officer liabilityinsurance. Further, our board members, chief executive officer and chief financial officer could face an increasedrisk of personal liability in connection with their performance of duties. As a result, we may face difficultiesattracting and retaining qualified board members and executive officers, which could harm our business. If wefail to comply with new or changed laws, regulations or standards of corporate governance, our business andreputation may be harmed.
Our share price could be adversely affected if we are unable to maintain effective internal controls.
The accuracy of our financial reporting is dependent on the effectiveness of our internal controls. We arerequired to provide a report from management to our shareholders on our internal control over financial reportingthat includes an assessment of the effectiveness of these controls. Internal control over financial reporting hasinherent limitations, including human error, the possibility that controls could be circumvented or becomeinadequate because of changed conditions, and fraud. Because of these inherent limitations, internal control overfinancial reporting might not prevent or detect all misstatements or fraud. If we cannot maintain and executeadequate internal control over financial reporting or implement required new or improved controls that providereasonable assurance of the reliability of the financial reporting and preparation of our financial statements forexternal use, we could suffer harm to our reputation, fail to meet our public reporting requirements on a timelybasis, or be unable to properly report on our business and the results of our operations, and the market price ofour securities could be materially adversely affected.
We are exposed to credit risk and fluctuations in the market values of our investment portfolio.
Recent turmoil in the financial markets has adversely affected economic activity in the United States andother regions of the world in which we do business. We believe that based on our current cash, cash equivalentsand investment balances and expected operating cash flows, the current lack of liquidity in the credit markets willnot have a material impact on our liquidity, cash flow or financial flexibility. Continued deterioration of thecredit and capital markets could result in volatility of our investment earnings and impairments to our investmentportfolio, which could negatively impact our financial condition and reported income. The continued decline ineconomic activity could adversely affect the ability of counterparties to certain financial instruments such asmarketable securities and derivatives to meet their obligations to us.
Funds associated with auction-rate securities that we hold as investments may not be liquid and ourauction-rate securities may decline in value.
As of December 31, 2009, our short-term and long-term investments totaled $449.5 million and included$129.1 million in long-term AAA/A3-rated auction-rate municipal debt securities that are collateralized by debtobligations supported by student loans, substantially backed by the Federal Family Education Loan Program, orFFELP. In addition, the remainder of our long-term investments included an asset of $22.0 million related to theUBS Right. Since February 14, 2008, auctions failed for all the auction-rate securities still in our portfolio as ofDecember 31, 2009. We believe that the failed auctions experienced to date are not a result of the deterioration ofthe underlying credit quality of the securities and we continue to earn and receive interest on the auction-ratemunicipal debt securities at a pre-determined formula with spreads tied to particular interest rate indices. All ofthe auction-rate municipal debt securities held by us are callable by the issuer at par. In November 2008, weaccepted an offer from UBS AG, or UBS, to sell to UBS, at par value ($151.3 million at December 31, 2009), ourauction-rate municipal debt securities at any time during an exercise period from June 30, 2010 to July 2, 2012,which we refer to as the UBS Right. In accepting the UBS Right, we granted UBS the authority to purchase theseauction-rate municipal debt securities or sell them on our behalf at par value any time after the execution of theUBS Right through July 2, 2012. The offer is non-transferable. UBS’s inability to perform under the UBS Rightand the lack of liquidity for auction-rate municipal debt securities in the financial markets could have a materialadverse effect on our financial condition and results of operations.
35

Our stock price continues to be volatile.
Our stock has at times experienced substantial price volatility as a result of variations between our actualand anticipated financial results, announcements by us and our competitors, projections or speculation about ourbusiness or that of our competitors by the media or investment analysts or uncertainty about current globaleconomic conditions. The stock market as a whole also has experienced extreme price and volume fluctuationsthat have affected the market price of many technology companies in ways that may have been unrelated to thesecompanies’ operating performance. Furthermore, we believe our stock price should reflect future growth andprofitability expectations and, if we fail to meet these expectations, our stock price may significantly decline.
Item 1B. Unresolved Staff Comments.
None.
Item 2. Properties
To support our planned growth, we are continually expanding our development and delivery center capacitythrough the construction of new facilities, supplemented by additional leasing of non-owned facilities. Below is asummary of development and delivery facilities in India and China and our executive office in Teaneck, NewJersey.
LocationNumber ofLocations
Square FootageLeased
Square FootageOwned
Total SquareFootage
Development and Delivery Facilities:India:
Chennai . . . . . . . . . . . . . . . . . . . . . . . . . . . . . . . . . . 10 1,263,480 1,782,953 3,046,433Pune . . . . . . . . . . . . . . . . . . . . . . . . . . . . . . . . . . . . . 6 867,807 343,703 1,211,510Bangalore . . . . . . . . . . . . . . . . . . . . . . . . . . . . . . . . . 4 647,945 225,000 872,945Kolkata . . . . . . . . . . . . . . . . . . . . . . . . . . . . . . . . . . . 5 419,929 827,727 1,247,656Hyderabad . . . . . . . . . . . . . . . . . . . . . . . . . . . . . . . . 6 908,158 — 908,158Coimbatore . . . . . . . . . . . . . . . . . . . . . . . . . . . . . . . 3 173,641 725,611 899,252Mumbai . . . . . . . . . . . . . . . . . . . . . . . . . . . . . . . . . . 2 172,745 — 172,745Gurgaon . . . . . . . . . . . . . . . . . . . . . . . . . . . . . . . . . . 3 77,726 — 77,726Cochin . . . . . . . . . . . . . . . . . . . . . . . . . . . . . . . . . . . 1 73,800 — 73,800
Shanghai, China . . . . . . . . . . . . . . . . . . . . . . . . . . . . . . . 3 99,055 — 99,055
Total . . . . . . . . . . . . . . . . . . . . . . . . . . . . . . . . . 43 4,704,286 3,904,994 8,609,280
Executive Office:Teaneck . . . . . . . . . . . . . . . . . . . . . . . . . . . . . . . . . . 1 71,850 — 71,850
We operate out of our Teaneck, New Jersey headquarters and our regional and international offices. Wehave business development offices located in metropolitan areas including: Atlanta (GA), Boston (MA),Bridgewater (NJ), Chicago (IL), Dallas (TX), Los Angeles (CA), Minneapolis (MN), Norwalk (CT), Phoenix(AZ), San Francisco (CA), Teaneck (NJ), Amsterdam, Brussels, Buenos Aires, Chennai, Cyberjaya (Malaysia),Frankfurt, Geneva, London, Melbourne, Paris, Shanghai, Singapore, Stockholm, Tokyo, Toronto and Zurich. Inaddition, we operate development and delivery facilities in Bentonville (AR), Boston (MA), Bridgewater (NJ),Chicago (IL), Phoenix (AZ), Amsterdam, Budapest, Buenos Aires, Mexico, the Philippines and Toronto. We alsohave several training facilities strategically located near or within our main offices and development and deliverycenters. We believe that our current facilities are adequate to support our existing operations. We also believethat we will be able to obtain suitable additional facilities on commercially reasonable terms on an “as needed”basis.
36

Item 3. Legal Proceedings
We are involved in various claims and legal actions arising in the ordinary course of business. In the opinionof our management, the outcome of such claims and legal actions, if decided adversely, is not expected to have amaterial adverse effect on our quarterly or annual operating results, cash flows or consolidated financial position.
Item 4. Submission of Matter to a Vote of Security Holders
None.
37

PART II
Item 5. Market for Our Common Equity, Related Stockholder Matters and Purchases of EquitySecurities.
Our Class A common stock trades on the NASDAQ Global Select Market (NASDAQ) under the symbol“CTSH”.
The following table shows the per share range of high and low sale prices for shares of our Class A commonstock, as listed for quotation on the NASDAQ, and the quarterly cash dividends paid per share for the quarterlyperiods indicated.
Quarter Ended High LowCash Dividend
Per Share
March 31, 2008 . . . . . . . . . . . . . . . . . . . . . . . . . . . . . . . . . . . . . . . . . . . . . . . . . . . $34.00 $23.37 $0.00June 30, 2008 . . . . . . . . . . . . . . . . . . . . . . . . . . . . . . . . . . . . . . . . . . . . . . . . . . . . $37.10 $26.32 $0.00September 30, 2008 . . . . . . . . . . . . . . . . . . . . . . . . . . . . . . . . . . . . . . . . . . . . . . . . $32.53 $20.68 $0.00December 31, 2008 . . . . . . . . . . . . . . . . . . . . . . . . . . . . . . . . . . . . . . . . . . . . . . . . $22.69 $14.38 $0.00March 31, 2009 . . . . . . . . . . . . . . . . . . . . . . . . . . . . . . . . . . . . . . . . . . . . . . . . . . . $22.18 $17.26 $0.00June 30, 2009 . . . . . . . . . . . . . . . . . . . . . . . . . . . . . . . . . . . . . . . . . . . . . . . . . . . . $27.90 $20.35 $0.00September 30, 2009 . . . . . . . . . . . . . . . . . . . . . . . . . . . . . . . . . . . . . . . . . . . . . . . . $39.40 $25.01 $0.00December 31, 2009 . . . . . . . . . . . . . . . . . . . . . . . . . . . . . . . . . . . . . . . . . . . . . . . . $46.61 $36.69 $0.00
As of December 31, 2009, the approximate number of holders of record of our Class A common stock was211 and the approximate number of beneficial holders of our Class A common stock was 45,600.
Dividends
We have never declared or paid cash dividends on our Class A common stock. We currently intend to retainany future earnings to finance the growth of the business and, therefore, do not currently anticipate paying anycash dividends in the foreseeable future.
38

Equity Compensation Plan Information
The following table provides information as of December 31, 2009 with respect to the shares of our Class Acommon stock that may be issued under our existing equity compensation plans. We previously had four equitycompensation plans, each of which was approved by our stockholders: (1) Amended and Restated 1999 IncentiveCompensation Plan, which we refer to as the 1999 Incentive Plan; (2) Amended and Restated Non-EmployeeDirectors’ Stock Option Plan, which we refer to as the Director Plan; (3) the Amended and Restated KeyEmployees’ Stock Option Plan; and (4) the 2004 Employee Stock Purchase Plan. The 1999 Incentive Plan, theDirector Plan and the Key Employees’ Stock Option Plan were succeeded by the Cognizant TechnologySolutions Corporation 2009 Incentive Compensation Plan, which we refer to as the 2009 Incentive Plan, whichwas approved by our stockholders. Awards granted under the previous plans are still valid, however no additionalawards may be granted from the 1999 Incentive Plan, the Director Plan and the Key Employees Stock OptionPlan. For additional information on our equity compensation plans, please see Note 12 to the consolidatedfinancial statements.
Plan Category
Number of Securitiesto be Issued Upon Vesting
of Awards orExercise of
Outstanding Stock Options
Weighted AverageExercise Price of
Awards orOutstandingStock Options
Number of SecuritiesAvailable for FutureIssuance Under EquityCompensation Plans
Equity compensation plans that have beenapproved by security holders—stockoptions(1) . . . . . . . . . . . . . . . . . . . . . . . . . . . . . 19,080,201(2) $18.56 23,876,038(3)
Equity compensation plans that have beenapproved by security holders—performancestock units(4) . . . . . . . . . . . . . . . . . . . . . . . . . . 921,407 N/A —
Equity compensation plans that have beenapproved by security holders—restrictedstock units(5) . . . . . . . . . . . . . . . . . . . . . . . . . . 1,556,796 N/A —
Equity compensation plans not approved bysecurity holders . . . . . . . . . . . . . . . . . . . . . . . . — —
Total . . . . . . . . . . . . . . . . . . . . . . . . . . . . . . 21,558,404 23,876,038
(1) Consists of the 1999 Incentive Plan, the Director Plan, the Key Employees’ Stock Option Plan, the 2004Employee Stock Purchase Plan and the 2009 Incentive Compensation Plan.
(2) Excludes purchase rights outstanding under the 2004 Employee Stock Purchase Plan. Under such plan,employees may purchase whole shares of stock at price per share equal to 90% of the lower of the fairmarket value per share on the first day of the purchase period or the fair market value per share on the lastday of the purchase period.
(3) Includes 22,650,537 shares of Class A common stock available for future issuance under the 2009 IncentiveCompensation Plan and 1,225,501 shares of Class A common stock available for future issuance under the2004 Employee Stock Purchase Plan.
(4) Consists of 680,007 shares and 241,400 shares that are issuable to holders of performance stock unitsgranted pursuant to the 1999 Incentive Plan and the 2009 Incentive Compensation Plan, respectively, uponthe achievement of certain performance and vesting criteria.
(5) Consists of 566,492 shares and 990,304 shares that are issuable to holders of restricted stock units grantedpursuant to the 1999 Incentive Plan and the 2009 Incentive Plan, respectively.
39

Issuer Purchases of Equity Securities
In December 2008, our Board of Directors authorized up to $50.0 million in funds for repurchases ofCognizant’s outstanding shares of Class A common stock. The $50.0 million authorization excluded fees andexpenses and expired in December 2009. The program authorized management to repurchase sharesopportunistically in the open market or in private transactions from time to time, depending on marketconditions. No shares were repurchased under this program during the fourth quarter of 2009. No shares remainavailable for purchase under the authorization.
Month
Total Numberof SharesPurchased
AveragePrice Paidper Share
Total Number ofShares Purchasedas Part of Publicly
AnnouncedPlans orPrograms
ApproximateDollar Value of Shares
that May Yet BePurchased under thePlans or Programs(in thousands)
October 2009 . . . . . . . . . . . . . — $— — $37,581November 2009 . . . . . . . . . . . — $— — $37,581December 2009 . . . . . . . . . . . — $— — $ —
Total . . . . . . . . . . . . . . . — $— —
40

Performance Graph
The following graph compares the cumulative total stockholder return on our Class A common stock withthe cumulative total return on the NASDAQ-100 Index, S&P 500 Index and a Peer Group Index (capitalizationweighted) for the period beginning January 1, 2005 and ending on the last day of our last completed fiscal year.The stock performance shown on the graph below is not indicative of future price performance.
COMPARISON OF CUMULATIVE TOTAL RETURN(1)(2)
Among Cognizant, the NASDAQ-100 Index, the S&P 500 Index
And a Peer Group Index(3) (Capitalization Weighted)
$250
Comparison of Cumulative Five Year Total Return
$200
$150
$100
$50
$012/31/04
Cognizant Technology Solutions Corp
Nasdaq 100 Index Peer Group
S&P 500 Index
12/31/05 12/31/06 12/31/07 12/31/0912/31/08
Company / Index
BasePeriod12/31/04 12/31/05 12/31/06 12/31/07 12/31/08 12/31/09
COGNIZANT TECHNOLOGY SOLUTIONSCORP . . . . . . . . . . . . . . . . . . . . . . . . . . . . . . . . . . . . . 100 118.76 182.28 160.36 85.33 214.17
S&P 500 INDEX . . . . . . . . . . . . . . . . . . . . . . . . . . . . . . 100 104.91 121.48 128.16 80.74 102.11NASDAQ-100 . . . . . . . . . . . . . . . . . . . . . . . . . . . . . . . . 100 101.49 108.38 128.61 74.74 114.75PEER GROUP . . . . . . . . . . . . . . . . . . . . . . . . . . . . . . . . 100 106.86 139.00 129.95 82.46 153.22
(1) Graph assumes $100 invested on January 1, 2005 in our Class A common stock, the NASDAQ-100 Index,the S&P 500 Index, and the Peer Group Index (capitalization weighted).
(2) Cumulative total return assumes reinvestment of dividends.(3) We have constructed a Peer Group Index of other information technology consulting firms consisting of
Accenture Ltd., Computer Sciences Corporation, Computer Task Group, Inc., Diamond Management &Technology Consultants, Inc., Exlservice Holdings Inc, Genpact Ltd Inc., iGate Corp., Infosys TechnologiesLtd., Sapient Corp., Satyam Computer Services Ltd., Syntel, Inc., Wipro Ltd. and WNS Holdings LTD.
41

Item 6. Selected Consolidated Financial Data
The following table sets forth our selected consolidated historical financial data as of the dates and for theperiods indicated. Our selected consolidated financial data set forth below as of December 31, 2009 and 2008 andfor each of the three years in the period ended December 31, 2009 has been derived from the audited financialstatements included elsewhere herein. Our selected consolidated financial data set forth below as ofDecember 31, 2007, 2006 and 2005 and for each of the years ended December 31, 2006 and 2005 are derivedfrom our audited financial statements not included elsewhere herein. Our selected consolidated financialinformation for 2009, 2008 and 2007 should be read in conjunction with the Consolidated Financial Statementsand the Notes and “Item 7. Management’s Discussion and Analysis of Financial Condition and Results ofOperations” which are included elsewhere in this Annual Report on Form 10-K.
Year Ended December 31,
2009(1) 2008(1) 2007(1) 2006(1) 2005(2)
(in thousands, except per share data)Consolidated Statement of Operations Data:Revenues . . . . . . . . . . . . . . . . . . . . . . . . . . . . . . . . . . . . . . . $3,278,663 $2,816,304 $2,135,577 $1,424,267 $885,830Cost of revenues (exclusive of depreciation andamortization expense shown separately below) . . . . . . . 1,849,443 1,572,816 1,206,035 787,923 479,915
Selling, general and administrative expenses . . . . . . . . . . . 721,359 652,021 494,102 343,238 206,899Depreciation and amortization expense . . . . . . . . . . . . . . . 89,371 74,797 53,918 34,163 21,400
Income from operations . . . . . . . . . . . . . . . . . . . . . . . . . . . 618,490 516,670 381,522 258,943 177,616
Other income (expense), net:Interest income . . . . . . . . . . . . . . . . . . . . . . . . . . . . . . 15,895 22,188 29,560 17,615 8,982Other income (expense), net . . . . . . . . . . . . . . . . . . . . 2,566 (23,648) 3,274 1,253 (1,326)
Total other income (expense), net . . . . . . . . . . . . . . . . . . . . 18,461 (1,460) 32,834 18,868 7,656
Income before provision for income taxes . . . . . . . . . . . . . 636,951 515,210 414,356 277,811 185,272Provision for income taxes . . . . . . . . . . . . . . . . . . . . . . . . . 101,988 84,365 64,223 45,016 19,006
Net income . . . . . . . . . . . . . . . . . . . . . . . . . . . . . . . . . . . . . $ 534,963 $ 430,845 $ 350,133 $ 232,795 $166,266
Basic earnings per share . . . . . . . . . . . . . . . . . . . . . . . . . . . $ 1.82 $ 1.49 $ 1.22 $ 0.83 $ 0.61
Diluted earnings per share . . . . . . . . . . . . . . . . . . . . . . . . . . $ 1.78 $ 1.44 $ 1.15 $ 0.77 $ 0.57
Cash dividends declared per common share . . . . . . . . . . . . $ — $ — $ — $ — $ —
Weighted average number of common sharesoutstanding—Basic . . . . . . . . . . . . . . . . . . . . . . . . . . . . . 293,304 290,121 288,155 281,715 272,988
Weighted average number of common sharesoutstanding—Diluted . . . . . . . . . . . . . . . . . . . . . . . . . . . 301,115 298,940 303,593 301,124 293,790
Cash and cash equivalents and short-term investments . . . $1,399,332 $ 762,579 $ 670,425 $ 648,159 $424,001Long-term investments . . . . . . . . . . . . . . . . . . . . . . . . . . . . 151,131 161,693 — — —Long-term obligations:
Deferred income tax liabilities, net . . . . . . . . . . . . . . . — 7,294 15,145 — —Other noncurrent liabilities . . . . . . . . . . . . . . . . . . . . . 38,455 14,111 14,267 2,979 1,953
Working capital . . . . . . . . . . . . . . . . . . . . . . . . . . . . . . . . . . 1,660,960 1,080,542 901,495 790,888 509,628Total assets . . . . . . . . . . . . . . . . . . . . . . . . . . . . . . . . . . . . . 3,338,240 2,374,560 1,838,306 1,325,981 869,893Stockholders’ equity . . . . . . . . . . . . . . . . . . . . . . . . . . . . . . 2,653,177 1,965,578 1,468,210 1,073,499 714,145
(1) Includes the impact of our adoption of accounting for stock-based compensation effective January 1, 2006 and theimpact of the stock-based Indian fringe benefit tax for the period April 1, 2007 to March 31, 2009. For additionalinformation, refer to Note 12 (Stock-Based Compensation Plans) to our consolidated financial statements.
(2) For the year ended December 31, 2005, our consolidated statement of operations data includes the reduction ofincome tax expense (one-time income tax benefit) of $12,411, $0.05 per basic earnings per share and $0.04 perdiluted earnings per share related to the repatriation of $60,000 of Indian earnings pursuant to the American JobsCreation Act of 2004.
42

Item 7. Management’s Discussion and Analysis of Financial Condition and Results of Operations
Executive Summary
In 2009, our revenues increased to $3,278.7 million compared to $2,816.3 million in 2008. Net incomeincreased to $535.0 million or $1.78 per diluted share, including stock-based compensation expense and stock-based Indian fringe benefit tax expense net of tax of $0.12 per diluted share during 2009. This is compared to$430.8 million, or $1.44 per diluted share, including stock-based compensation expense and stock-based Indianfringe benefit tax expense net of tax of $0.15 per diluted share during 2008. The key drivers of our revenuegrowth in 2009 were as follows:
• strong performance within our Healthcare and Manufacturing/Retail/Logistics business segments, eachof which had revenue growth equal to or greater than 25.0%;
• strong performance in North America where we experienced revenue growth of 16.4% in 2009 ascompared to 2008;
• continued penetration of the European market where we experienced revenue growth of 12.1%, andsuccess with our recent entry in the Asian markets where we grew by 65.9%, in 2009 as compared to2008;
• expansion of our service offerings, which enabled us to cross-sell new services to our customers andmeet the rapidly growing demand for complex large-scale outsourcing solutions;
• increased penetration at existing customers, including strategic customers; and
• continued expansion of the market for global delivery of IT services and business process outsourcing.
We saw a continued increase in demand from our customers for a broad range of IT solutions, includingapplication maintenance, complex systems development engagements, testing, enterprise resource planning orERP, infrastructure management, business process outsourcing and business intelligence. We finished the yearwith approximately 589 active clients compared to approximately 565 as of December 31, 2008 and increased thenumber of strategic clients by 16 during the year bringing the total number of our strategic clients to 144. Wedefine a strategic client as one offering the potential to generate $5 million to $50 million or more in annualrevenues at maturity. Our top five and top ten customers accounted for 17.4% and 29.4%, respectively, of ourtotal revenues in 2009 as compared to 19.4% and 30.0%, respectively, for the year ended December 31, 2008. Aswe continue to add new customers and increase our penetration at existing customers, we expect the percentageof revenues from our top five and top ten customers to continue to decline over time.
Our revenue from European customers increased by 12.1% to approximately $606.8 million in 2009compared to approximately $541.1 million in 2008. Our operation in the United Kingdom, or UK reported a7.8% increase in revenue to approximately $353.5 million in 2009, as compared to approximately $328.0 millionin 2008. This increase is primarily attributed to growth from existing and new customers in our Healthcare andManufacturing /Retail/Logistics business segments and was offset by year-over-year unfavorable movement inforeign exchange rates which negatively impacted revenue in 2009 by approximately $50.1 million. Revenuefrom Europe, excluding the UK, increased by approximately 18.9% to approximately $253.3 million in 2009from approximately $213.1 million in 2008. We believe that Europe will continue to be an area of significantinvestment for us as we see this region and the Asia Pacific region, particularly Japan, India, Australia andSingapore, as growth opportunities for the long-term.
Our revenue growth is also attributed to increasing market acceptance of, and strong demand for, offshoreIT software and services and business process outsourcing. Recent NASSCOM (India’s National Association ofSoftware and Service Companies) reports state that India’s IT software and services and business processoutsourcing sectors are expected to reach almost $50 billion by the end of NASSCOM’s fiscal yearMarch 31, 2010. This is an expected growth rate of approximately 5.5% over the prior fiscal year. Additionally,the FY 2010-11 Outlook for these sectors expects revenue growth of 13% to 15%. According to the latestNASSCOM “Perspective 2020: Transform Business, Transform India” report, global changes and new
43

megatrends within economic, demographic, business, social and environmental areas are set to expand theoutsourcing industry by creating new dynamics and opportunities and are expected to result in export revenues of$175 billion by 2020.
In 2009, our operating margin increased to 18.9% compared to 18.3% in 2008. Excluding stock-basedcompensation costs of $44.8 million and stock-based Indian fringe benefit tax expense of $0.9 million, operatingmargin in 2009 was 20.3%. This was slightly above our historic targeted operating margin range, excludingstock-based compensation costs and stock-based Indian fringe benefit tax expense, of 19% to 20% of totalrevenues. The operating margin increase was primarily due to the favorable impact of the depreciation of theIndian rupee versus the U.S. dollar and achieving operating efficiencies as a result of our revenue growthoutpacing our headcount growth, partially offset by an increase in compensation costs, including incentive-basedcompensation costs, and investments to grow our business. Historically, we have invested our profitability abovethe 19% to 20% operating margin level, which excludes stock-based compensation and stock-based Indian fringebenefit tax expense, back into our business, which we believe is a significant contributing factor to our strongrevenue growth. This investment is primarily focused in the areas of: (i) hiring client partners and relationshippersonnel with specific industry experience or domain expertise; (ii) training our technical staff in a broaderrange of IT service offerings; (iii) strengthening our business analytic capabilities; (iv) strengthening andexpanding our portfolio of services; (v) continuing to expand our geographic presence for both sales anddelivery; and (vi) recognizing and rewarding exceptional performance by our employees. In addition, thisinvestment includes maintaining a level of resources, trained in a broad range of service offerings, to be wellpositioned to respond to our customer requests to take on additional projects. For the year ending December 31,2010, we expect to continue to invest amounts in excess of our historical targeted operating margin levels backinto the business.
We finished the year with total headcount of approximately 78,400, an increase of approximately 16,700over the prior year. The increases in the number of our technical personnel and the related infrastructure costs, tomeet the demand for our services, are the primary drivers of the increase in our operating expenses in 2009.Annualized turnover, including both voluntary and involuntary, was approximately 10.3% for 2009. The majorityof our turnover occurs in India. As a result, annualized attrition rates on-site at clients are below our globalattrition rate. In addition, attrition is weighted towards the more junior members of our staff. We haveexperienced wage inflation in India, which may continue in the future; however, this has not had a materialimpact on our results of operations as Indian wages represented less than 20% of our total operating expenses.
Our current India real estate development program includes planned construction of approximately4.5 million square feet of new space. The expanded program, which commenced during the quarter endedMarch 31, 2007, includes the expenditure of approximately $330.0 million through the end of the program onland acquisition, facilities construction and furnishings to build new state-of-the-art IT development and deliverycenters in regions primarily designated as Special Economic Zones located in India. During 2010, we expect tospend approximately $180 million globally for capital expenditures.
At December 31, 2009, we had cash and cash equivalents and short-term investments of $1,399.3 millionand working capital of approximately $1,661.0 million. Accordingly, we do not anticipate any near-term liquidityissues. During 2009, we repurchased $12.4 million of our Class A common stock under a stock repurchaseprogram that expired in December 2009. Stock repurchases under this program were funded from workingcapital.
While several measures have indicated that the economy may be improving, the economic environmentremains fragile. During 2010, we expect the following factors to affect our business and our operating results:
• Stabilization of global economic conditions and the financial services sector;
• Normalization of customer IT budgets, which may result in spending by customers on discretionaryprojects, specifically application development projects. In addition, we expect a continued focus by
44

customers on directing IT spending towards cost containment projects, such as applicationmaintenance, infrastructure management and BPO;
• Industry consolidation, which will drive demand for integration services;
• Secular changes driven by evolving technologies and regulatory changes; and
• Foreign currency volatility.
In response to this challenging macroeconomic environment, we plan to:
• Continue to invest in our talent base and new service offerings;
• Partner with our existing customers to see where we can provide innovative solutions resulting in ourgarnering an increased portion of our customers’ overall IT spend;
• Continue our focus on growing our business in Europe and the Asia Pacific region, where we believethere are opportunities to gain market share;
• Expand our BPO and infrastructure management practices, which are in high demand in thischallenging business environment;
• Continue to aggressively increase our customer base across all of our business segments;
• Opportunistically look for acquisitions that can improve our overall service delivery capabilities; and
• Continue operating focus and discipline to appropriately manage our cost structure.
Critical Accounting Estimates and Risks
Management’s discussion and analysis of our financial condition and results of operations is based on ourconsolidated financial statements that have been prepared in accordance with accounting principles generallyaccepted in the United States of America. The preparation of these financial statements requires management tomake estimates and assumptions that affect the amounts reported for assets and liabilities, including therecoverability of tangible and intangible assets, disclosure of contingent assets and liabilities as of the date of thefinancial statements, and the reported amounts of revenues and expenses during the reported period. On anon-going basis, we evaluate our estimates. The most significant estimates relate to the recognition of revenue andprofits based on the percentage of completion method of accounting for certain fixed-bid contracts, the allowancefor doubtful accounts, income taxes, valuation of investments, goodwill and other long-lived assets, assumptionsused in valuing stock-based compensation arrangements, contingencies and litigation. We base our estimates onhistorical experience and on various other assumptions that are believed to be reasonable under thecircumstances, the results of which form the basis for making judgments about the carrying values of assets andliabilities that are not readily apparent from other sources. The actual amounts may differ from the estimates usedin the preparation of the accompanying consolidated financial statements. Our significant accounting policies aredescribed in Note 1 to the consolidated financial statements.
We believe the following critical accounting policies require a higher level of management judgments andestimates than others in preparing the consolidated financial statements:
Revenue Recognition. Revenues related to our highly complex information technology applicationdevelopment contracts, which are predominantly fixed-price contracts, are recognized as the service is performedusing the percentage of completion method of accounting. Under this method, total contract revenue during theterm of an agreement is recognized on the basis of the percentage that each contract’s total labor cost to datebears to the total expected labor cost (cost to cost method). This method is followed where reasonablydependable estimates of revenues and costs can be made. Management reviews total expected labor costs on anongoing basis. Revisions to our estimates may result in increases or decreases to revenues and income and arereflected in the consolidated financial statements in the periods in which they are first identified. If our estimatesindicate that a contract loss will be incurred, a loss provision is recorded in the period in which the loss first
45
becomes probable and reasonably estimable. Contract losses are determined to be the amount by which theestimated costs of the contract exceed the estimated total revenues that will be generated by the contract and areincluded in cost of revenues in our consolidated statement of operations. Contract losses for all periods presentedwere immaterial.
Stock-Based Compensation. Utilizing the fair value recognition provisions prescribed by the authoritativeguidance, stock-based compensation cost is measured at the grant date based on the value of the award and isrecognized as expense over the vesting period. Determining the fair value of stock-based awards at the grant daterequires judgment, including estimating the expected term over which the stock awards will be outstandingbefore they are exercised, the expected volatility of our stock, the number of stock-based awards that areexpected to be forfeited and the expected exercise proceeds for stock-based awards subject to the Indian fringebenefit tax, if applicable. In addition, for performance stock units, we are required to estimate the most probableoutcome of the performance conditions in order to determine the amount of stock compensation costs to berecorded over the vesting period. If actual results differ significantly from our estimates, stock-basedcompensation expense and our results of operations could be materially impacted.
Income Taxes. Determining the consolidated provision for income tax expense, deferred income tax assetsand liabilities and related valuation allowance, if any, involves judgment. As a global company, we are requiredto calculate and provide for income taxes in each of the jurisdictions where we operate. Changes in thegeographic mix or estimated level of annual pre-tax income can also affect the overall effective income tax rate.
Our provision for income taxes also includes the impact of provisions established for uncertain income taxpositions, as well as the related net interest. Tax exposures can involve complex issues and may require anextended period to resolve. Although we believe we have adequately reserved for our uncertain tax positions, noassurance can be given that the final tax outcome of these matters will not be different. We adjust these reservesin light of changing facts and circumstances, such as the closing of a tax audit or the refinement of an estimate.To the extent that the final tax outcome of these matters differs from the amounts recorded, such differences willimpact the provision for income taxes in the period in which such determination is made.
On an on-going basis, we evaluate whether a valuation allowance is needed to reduce our deferred incometax assets to the amount that is more likely than not to be realized. While we have considered future taxableincome and on-going prudent and feasible tax planning strategies in assessing the need for the valuationallowance, in the event we determine that we will be able to realize deferred income tax assets in the future inexcess of the net recorded amount, an adjustment to the deferred income tax asset would increase income in theperiod such determination was made. Likewise, should we determine that we will not be able to realize all or partof the net deferred income tax asset in the future, an adjustment to the deferred income tax asset would becharged to income in the period such determination was made.
Our Indian subsidiaries, which are referred to collectively herein as Cognizant India, are export-orientedcompanies which, under the Indian Income Tax Act of 1961, are entitled to claim tax holidays for a period of tenconsecutive years for each Software Technology Park, or STPs, with respect to export profits for each STP.Substantially all of the earnings of Cognizant India are attributable to export profits. The majority of our STPs inIndia are currently entitled to a 100% exemption from Indian income tax. In August 2009, the tax holidays forSTPs were extended by one year and are currently scheduled to expire on March 31, 2011. Thereafter, exportprofits from our existing STPs will be fully taxable at the Indian statutory rate (33.99% as of December 31, 2009)in effect at such time. If the tax holidays relating to our Indian STPs are not extended or new tax incentives arenot introduced that would effectively extend the income tax holiday benefits beyond March 2011, we expect thatour effective income tax rate will increase significantly beginning in calendar year 2011. In addition, we expectto continue to locate a portion of our new development centers in areas designated as Special Economic Zones, orSEZs. Development centers operating in SEZs are entitled to certain income tax incentives for periods up to 15years.
46
Investments. Historically, our investments have been in municipal debt securities with interest rates thatreset through a Dutch auction process, corporate notes and bonds, debt issuances by U.S. government agencies,bank time deposits and commercial paper meeting certain criteria. We evaluate our available-for-sale investmentsperiodically for possible other-than-temporary impairment by reviewing factors such as the length of time andextent to which fair value has been below cost basis, the financial condition of the issuer and our ability andintent to hold the investment for a period of time, which may be sufficient for anticipated recovery of marketvalue. An impairment charge would be recorded to the extent that the carrying value of our available-for-salesecurities exceeds the fair market value of the securities and the decline in value is determined to be other-than-temporary.
Determining the fair value of our investment in auction-rate securities with unobservable inputs that aresupported by little or no market activity requires judgment, including determining the appropriate holding periodand discount rate to be used in valuing such securities. We value our investment in auction-rate securities using adiscounted cash flow analysis, which incorporates the following key inputs: (i) the underlying structure of eachsecurity; (ii) frequency and amounts of cash flows; (iii) expected holding period for the security; and(iv) discount rates that are believed to reflect current market conditions and the relevant risk associated with eachsecurity. In estimating the holding period, we considered the current developments in the auction-rate marketincluding: our ability to hold the securities for such period of time, recent calls of auction-rate securities byissuers and the possible reestablishment of an active market for the auction-rate securities that we hold. Basedupon these factors, we used a holding period of five years for securities with a stated maturity beyond five years,which represents the period of time we anticipate will elapse before a liquidity event could occur. An increase ordecrease in the holding period by two years would change the fair value of our investment in auction-ratesecurities by approximately $8.0 million. We derive the discount rate by considering observable interest rateyields for bonds supported by student loans and pricing of new bond issuances, and adding an illiquiditypremium to such rates. The illiquidity premium was estimated by management considering current marketconditions. As of December 31, 2009, we used a weighted-average illiquidity premium of 290 basis points. Thisweighted-average illiquidity premium has been impacted by overall issues within the credit and capital marketsand related increases in volatility including uncertainty of the credit and money markets. An increase or decreaseto the illiquidity premium of 100 basis points would change the estimated fair value of our investment in auction-rate securities by approximately $6.0 million. Our valuation is also impacted by changes in market interest ratesbecause the interest payments we receive on our auction-rate securities vary based on a pre-determined formulawith spreads tied to particular interest rate indices. An increase or decrease in market interest rates of 25 basispoints would change the estimated fair value of our investment in auction-rate securities by approximately $5.0million. We anticipate there will be ongoing developments in the credit markets and the market for the auction-rate securities that we hold. Accordingly, our estimates of the expected holding period and illiquidity premiumused in valuing such securities may change in the short-term.
Allowance for Doubtful Accounts. We maintain an allowance for doubtful accounts for estimated lossesresulting from the inability of our customers to make required payments. The allowance for doubtful accounts isdetermined by evaluating the relative credit-worthiness of each customer, historical collections experience andother information, including the aging of the receivables. If the financial condition of our customers were todeteriorate, resulting in an impairment of their ability to make payments, additional allowances may be required.
Goodwill. We evaluate goodwill for impairment at least annually, or as circumstances warrant. Whendetermining the fair value of our reporting units, we utilize various assumptions, including projections of futurecash flows. Any adverse changes in key assumptions about our businesses and their prospects or an adversechange in market conditions may cause a change in the estimation of fair value and could result in an impairmentcharge. As of December 31, 2009, our goodwill balance was $192.4 million.
Long-Lived Assets. We review long-lived assets and certain identifiable intangibles for impairmentwhenever events or changes in circumstances indicate that the carrying amount of an asset may not berecoverable. In general, we will recognize an impairment loss when the sum of undiscounted expected future
47
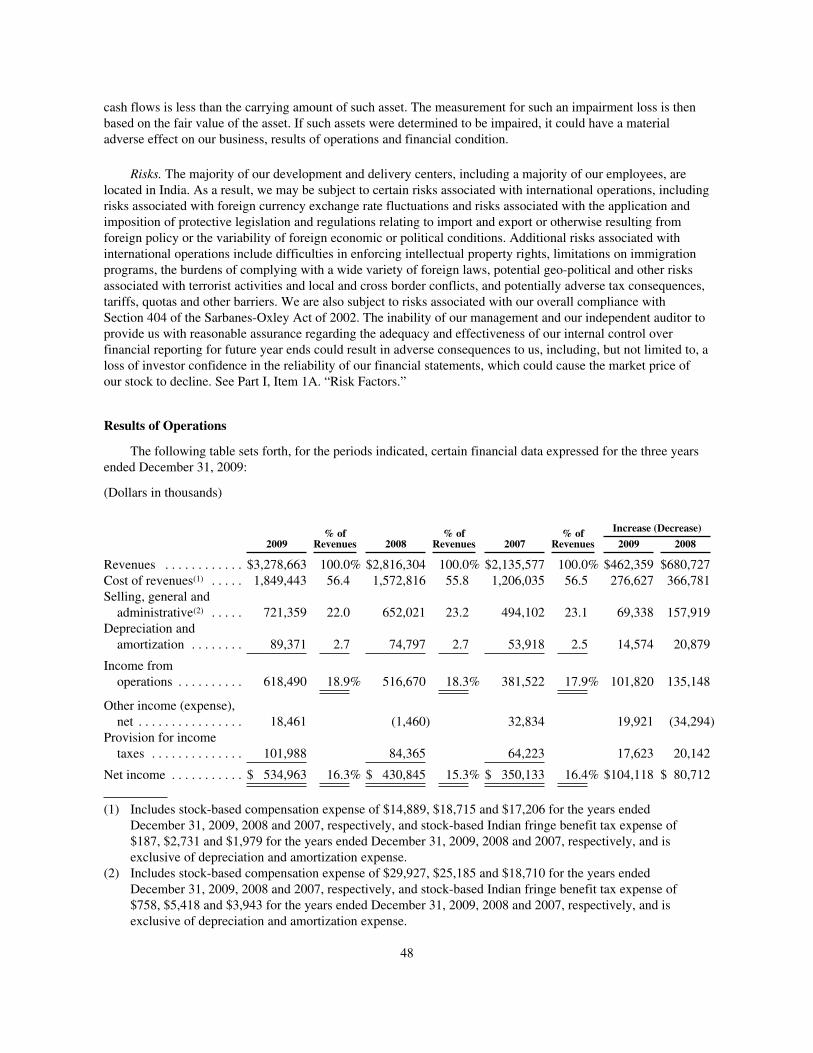
cash flows is less than the carrying amount of such asset. The measurement for such an impairment loss is thenbased on the fair value of the asset. If such assets were determined to be impaired, it could have a materialadverse effect on our business, results of operations and financial condition.
Risks. The majority of our development and delivery centers, including a majority of our employees, arelocated in India. As a result, we may be subject to certain risks associated with international operations, includingrisks associated with foreign currency exchange rate fluctuations and risks associated with the application andimposition of protective legislation and regulations relating to import and export or otherwise resulting fromforeign policy or the variability of foreign economic or political conditions. Additional risks associated withinternational operations include difficulties in enforcing intellectual property rights, limitations on immigrationprograms, the burdens of complying with a wide variety of foreign laws, potential geo-political and other risksassociated with terrorist activities and local and cross border conflicts, and potentially adverse tax consequences,tariffs, quotas and other barriers. We are also subject to risks associated with our overall compliance withSection 404 of the Sarbanes-Oxley Act of 2002. The inability of our management and our independent auditor toprovide us with reasonable assurance regarding the adequacy and effectiveness of our internal control overfinancial reporting for future year ends could result in adverse consequences to us, including, but not limited to, aloss of investor confidence in the reliability of our financial statements, which could cause the market price ofour stock to decline. See Part I, Item 1A. “Risk Factors.”
Results of Operations
The following table sets forth, for the periods indicated, certain financial data expressed for the three yearsended December 31, 2009:
(Dollars in thousands)
2009% of
Revenues 2008% of
Revenues 2007% of
Revenues
Increase (Decrease)
2009 2008
Revenues . . . . . . . . . . . . $3,278,663 100.0% $2,816,304 100.0% $2,135,577 100.0% $462,359 $680,727Cost of revenues(1) . . . . . 1,849,443 56.4 1,572,816 55.8 1,206,035 56.5 276,627 366,781Selling, general andadministrative(2) . . . . . 721,359 22.0 652,021 23.2 494,102 23.1 69,338 157,919
Depreciation andamortization . . . . . . . . 89,371 2.7 74,797 2.7 53,918 2.5 14,574 20,879
Income fromoperations . . . . . . . . . . 618,490 18.9% 516,670 18.3% 381,522 17.9% 101,820 135,148
Other income (expense),net . . . . . . . . . . . . . . . . 18,461 (1,460) 32,834 19,921 (34,294)
Provision for incometaxes . . . . . . . . . . . . . . 101,988 84,365 64,223 17,623 20,142
Net income . . . . . . . . . . . $ 534,963 16.3% $ 430,845 15.3% $ 350,133 16.4% $104,118 $ 80,712
(1) Includes stock-based compensation expense of $14,889, $18,715 and $17,206 for the years endedDecember 31, 2009, 2008 and 2007, respectively, and stock-based Indian fringe benefit tax expense of$187, $2,731 and $1,979 for the years ended December 31, 2009, 2008 and 2007, respectively, and isexclusive of depreciation and amortization expense.
(2) Includes stock-based compensation expense of $29,927, $25,185 and $18,710 for the years endedDecember 31, 2009, 2008 and 2007, respectively, and stock-based Indian fringe benefit tax expense of$758, $5,418 and $3,943 for the years ended December 31, 2009, 2008 and 2007, respectively, and isexclusive of depreciation and amortization expense.
48

The following table includes non-GAAP income from operations, excluding stock-based compensation andstock-based Indian fringe benefit tax expense, a measure defined by the Securities and Exchange Commission asa non-GAAP financial measure. This non-GAAP financial measure is not based on any comprehensive set ofaccounting rules or principles and should not be considered a substitute for, or superior to, financial measurescalculated in accordance with GAAP, and may be different from non-GAAP measures used by other companies.In addition, this non-GAAP measure, the financial statements prepared in accordance with GAAP andreconciliations of our GAAP financial statements to such non-GAAP measure should be carefully evaluated.
We seek to manage the company to a targeted operating margin, excluding stock-based compensation costsand stock-based Indian fringe benefit tax expense, of 19% to 20% of revenues. Accordingly, we believe thatnon-GAAP income from operations, excluding stock-based compensation costs and stock-based Indian fringebenefit tax expense, is a meaningful measure for investors to evaluate our financial performance. For our internalmanagement reporting and budgeting purposes, we use financial statements that do not include stock-basedcompensation expense and stock-based Indian fringe benefit tax expense for financial and operational decisionmaking, to evaluate period-to-period comparisons and for making comparisons of our operating results to that ofour competitors. Moreover, because of varying available valuation methodologies and the variety of award typesthat companies can use to account for stock-based compensation expense, we believe that providing a non-GAAPfinancial measure that excludes stock-based compensation expense and stock-based Indian fringe benefit taxexpense allows investors to make additional comparisons between our operating results and those of othercompanies. Accordingly, we believe that the presentation of non-GAAP income from operations when read inconjunction with our reported GAAP income from operations can provide useful supplemental information to ourmanagement and to investors regarding financial and business trends relating to our financial condition andresults of operations.
A limitation of using non-GAAP income from operations versus income from operations reported inaccordance with GAAP is that non-GAAP income from operations, excludes costs, namely, stock-basedcompensation that is recurring and stock-based Indian fringe benefit tax expense that was repealed during thethird quarter of 2009, retroactive to April 1, 2009. Stock-based compensation expense will continue to be for theforeseeable future a significant recurring expense in our business. In addition, other companies may calculatenon-GAAP financial measures differently than us, thereby limiting the usefulness of this non-GAAP financialmeasure as a comparative tool. We compensate for these limitations by providing specific information regardingthe GAAP amounts excluded from non-GAAP income from operations and evaluating such non-GAAP financialmeasures with financial measures calculated in accordance with GAAP.
A reconciliation of income from operations as reported and non-GAAP income from operations excludingstock-based compensation expense and stock-based Indian fringe benefit tax expense is as follows for the yearsended December 31:
(Dollars in thousands)
2009% of
Revenues 2008% of
Revenues 2007% of
Revenues
Income from operations, as reported . . . . . . $618,490 18.9% $516,670 18.3% $381,522 17.9%Add: stock-based compensation expense . . . 44,816 1.4 43,900 1.6 35,916 1.7Add: stock-based Indian fringe benefit taxexpense . . . . . . . . . . . . . . . . . . . . . . . . . . . 945 — 8,149 0.3 5,922 0.2
Non-GAAP income from operations,excluding stock-based compensationexpense and stock-based Indian fringebenefit tax expense . . . . . . . . . . . . . . . . . . $664,251 20.3% $568,719 20.2% $423,360 19.8%
The fringe benefit tax regulation in India obligated us to pay, upon exercise or distribution of shares under astock-based compensation award, a non-income related tax on the appreciation of the award from date of grant to
49

date of vest. There was no cash cost to us as we recovered the cost of the Indian fringe benefit tax from theemployee’s proceeds from the award. Under U.S. GAAP, the stock-based Indian fringe benefit tax expense isrequired to be recorded as an operating expense and the related recovery of such tax from our employee isrequired to be recorded to stockholders’ equity as proceeds from a stock-based compensation award. During thethird quarter of 2009, the Indian government repealed the fringe benefit tax retroactive to April 1, 2009.
Year Ended December 31, 2009 Compared to Year Ended December 31, 2008
Revenue. Revenue increased by 16.4%, or approximately $462.4 million, from approximately$2,816.3 million during 2008 to approximately $3,278.7 million in 2009. This increase is primarily attributed togreater acceptance of the global delivery model among an increasing number of industries, continued interest inusing the global delivery model as a means to reduce overall IT costs and greater penetration in the Europeanmarket. Revenue from customers existing as of December 31, 2008 increased by approximately $375.9 millionand revenue from new customers added since December 31, 2008 was approximately $86.5 million orapproximately 2.6% of total revenues for the year ended December 31, 2009. In addition, revenue from our NorthAmerican and European customers increased in 2009 by $365.9 million and $65.7 million, respectively, ascompared to 2008. We had approximately 589 active clients as of December 31, 2009 as compared toapproximately 565 active clients as of December 31, 2008. In addition, we experienced strong demand across allof our business segments for an increasingly broad range of services. Our Financial Services and Healthcarebusiness segments accounted for approximately $122.6 million and $172.2 million, respectively, of the$462.4 million increase in revenue. Additionally, our IT consulting and technology services and IT outsourcingrevenues increased by approximately 10.2% and 21.9%, respectively, compared to 2008 and representedapproximately 44.4% and 55.6%, respectively, of total revenues in 2009.
Cost of Revenues (Exclusive of Depreciation and Amortization Expense). Our cost of revenues consistsprimarily of salaries, incentive-based compensation, stock-based compensation expense and related stock-basedIndian fringe benefit tax expense, payroll taxes, benefits, immigration and project-related travel for technicalpersonnel, subcontracting and sales commissions related to revenues. Our cost of revenues increased byapproximately 17.6% or $276.6 million from $1,572.8 million during 2008 to $1,849.4 million in 2009. Theincrease was due primarily to higher compensation and benefits costs of approximately $267.1 million, inclusiveof the depreciation of the Indian rupee, resulting from the increase in the number of our technical personnel, andincentive-based compensation, offset by continued improvements in operating efficiencies.
Selling, General and Administrative Expenses. Selling, general and administrative expenses consistprimarily of salaries, incentive-based compensation, stock-based compensation expense and related stock-basedIndian fringe benefit tax expense, employee benefits, travel, promotion, communications, management, finance,administrative and occupancy costs. Selling, general and administrative expenses, including depreciation andamortization, increased by approximately 11.5% or $83.9 million, from $726.8 million during 2008, to$810.7 million during 2009, and decreased as a percentage of revenue from 25.8% in 2008 to 24.7% in 2009. Thedecrease as a percentage of revenue was due primarily to the favorable impact of the depreciation of the Indianrupee versus the U.S. dollar, economies of scale driven by increased revenues that resulted from our expandedsales and marketing activities in the current and prior years that allowed us to leverage our cost structure over alarger organization, reductions in discretionary spending, partially offset by an increase in compensation andbenefit costs, including incentive-based compensation, depreciation and amortization expense and expensesrelated to the expansion of our infrastructure to support our revenue growth.
Income from Operations. Income from operations increased approximately 19.7%, or $101.8 million, fromapproximately $516.7 million during 2008 to approximately $618.5 million during 2009, representing operatingmargins of approximately 18.9% of revenues in 2009 and 18.3% of revenues in 2008. The operating marginincrease was primarily due to the favorable impact of the depreciation of the Indian rupee versus the U.S. dollarand achieving operating efficiencies as a result of revenue growth outpacing our headcount growth, partially
50

offset by an increase in compensation and benefit costs, including incentive-based compensation costs, andinvestments to grow our business. Excluding the impact of applicable designated cash flow hedges, thedepreciation of the Indian rupee against the U.S. dollar favorably impacted our operating margin byapproximately 255 basis points or 2.55 percentage points. Each additional 1.0% change in the exchange ratebetween the Indian rupee and the U.S. dollar will have the effect of moving our operating margin byapproximately 24 basis points or 0.24 percentage points. Excluding stock-based compensation expense andstock-based Indian fringe benefit tax expense of $45.8 million in 2009 and $52.0 million in 2008, operatingmargins for the years ended December 31, 2009 and 2008 were 20.3% and 20.2%, respectively.
We entered into foreign exchange forward contracts to hedge certain salary payments in India. These hedgesare intended to mitigate the volatility of the changes in the exchange rate between the U.S. dollar and the Indianrupee. During 2009, these cash flow hedges favorably impacted our operating margin by approximately 27 basispoints or 0.27 percentage points.
Other Income (Expense), Net. Other income (expense), net consists primarily of foreign currency exchangegains and (losses) and interest income. The following table sets forth, for the periods indicated, Other income(expense), net:
(Dollars in thousands)
2009 2008Increase/(Decrease)
Foreign currency exchange gains (losses) . . . . . . . . . . . . . . . . . . . $ 22,493 $(22,818) $ 45,311Gains (losses) on foreign exchange forward contracts notdesignated as hedging instruments . . . . . . . . . . . . . . . . . . . . . . (20,821) — (20,821)
Net foreign currency exchange gains (losses) . . . . . . . . . . . . 1,672 (22,818) 24,490Interest income . . . . . . . . . . . . . . . . . . . . . . . . . . . . . . . . . . . . . . . 15,895 22,188 (6,293)Other income (expense), net . . . . . . . . . . . . . . . . . . . . . . . . . . . . . 894 (830) 1,724
Total other income (expense), net . . . . . . . . . . . . . . . . . . . . . . . . . $ 18,461 $ (1,460) $ 19,921
The foreign currency exchange gains of approximately $22.5 million were primarily attributed to (i) U.S.dollar denominated intercompany payables from our European subsidiaries to Cognizant India for servicesperformed by Cognizant India on behalf of our European customers and (ii) the remeasurement of the Indianrupee net monetary assets on Cognizant India’s books to the U.S. dollar functional currency. The $20.8 million oflosses on foreign exchange forward contracts were related to the change in fair value of foreign exchangeforward contracts entered into to offset foreign currency exposure to Indian rupee denominated net monetaryassets. At December 31, 2009, the notional value of these undesignated hedges was $400.0 million. The $6.3million decrease in interest income was due to lower average short-term interest rates during 2009 compared to2008. The increase in other income (expense), net of $1.7 million primarily relates to gains on redemptions ofcertain auction-rate securities offset by the net change in fair value of our auction-rate securities and the relatedUBS Right.
Provision for Income Taxes. The provision for income taxes increased from approximately $84.4 million in2008 to approximately $102.0 million in 2009. The effective income tax rate decreased from 16.4% in 2008 to16.0% in 2009. The decrease in our effective income tax rate was primarily attributed to the tax impact of foreignexchange forward contracts, as well as a shift in the geographic mix of our income which resulted in a greaterpercentage of our revenues falling under income tax holidays.
Net Income. Net income increased from approximately $430.8 million in 2008 to approximately$535.0 million in 2009, representing 15.3% and 16.3% of revenues, respectively. The increase in net income as apercentage of revenues in 2009 is primarily attributed to a higher operating margin and foreign currencyexchange gains partially offset by lower interest income.
51

Year Ended December 31, 2008 Compared to Year Ended December 31, 2007
Revenue. Revenue increased by 31.9%, or approximately $680.7 million, from approximately$2,135.6 million during 2007 to approximately $2,816.3 million in 2008. This increase is primarily attributed togreater acceptance of the global delivery model among an increasing number of industries, continued interest inusing the global delivery model as a means to reduce overall IT costs and greater penetration in the Europeanmarket. Revenue from customers existing as of December 31, 2007 increased by approximately $550.3 millionand revenue from new customers added during 2008 was approximately $130.4 million or approximately 4.6% oftotal revenues for the year ended December 31, 2008. In addition, revenue from European customers in 2008increased by $198.3 million as compared to 2007. We had approximately 565 active clients as of December 31,2008 as compared to approximately 500 active clients as of December 31, 2007. In addition, we experiencedstrong demand across all of our business segments for an increasingly broad range of services. Our FinancialServices and Healthcare business segments accounted for approximately $282.6 million and $183.7 million,respectively, of the $680.7 million increase in revenue. Additionally, our IT consulting and technology servicesand IT outsourcing revenues increased by approximately 28.0% and 35.5%, respectively, compared to 2007 andrepresented approximately 46.9% and 53.1%, respectively, of total revenues in 2008.
Cost of Revenues (Exclusive of Depreciation and Amortization Expense). Our cost of revenues consistsprimarily of salaries, stock-based compensation expense and related stock-based Indian fringe benefit taxexpense, payroll taxes, benefits, immigration and project-related travel for technical personnel, subcontractingand sales commissions related to revenues. Our cost of revenues increased by approximately 30.4%, or$366.8 million, from $1,206.0 million during 2007 to $1,572.8 million in 2008. The increase was due primarilyto higher compensation and benefits costs of approximately $326.0 million, which is primarily attributed to theincrease in the number of our technical personnel.
Selling, General and Administrative Expenses. Selling, general and administrative expenses consistprimarily of salaries, stock-based compensation expense and related stock-based Indian fringe benefit taxexpense, employee benefits, travel, promotion, communications, management, finance, administrative andoccupancy costs. Selling, general and administrative expenses, including depreciation and amortization,increased by approximately 32.6%, or $178.8 million, from $548.0 million during 2007 to $726.8 million during2008, and increased slightly as a percentage of revenue from 25.7% in 2007 to 25.8% in 2008. The increase as apercentage of revenue was due primarily to an increase in depreciation and amortization expense, and expensesrelated to the expansion of our infrastructure to support our revenue growth, partially offset by the favorableimpact of the depreciation of the Indian rupee versus the U.S. dollar.
Income from Operations. Income from operations increased approximately 35.4%, or $135.2 million, fromapproximately $381.5 million during 2007 to approximately $516.7 million during 2008, representing operatingmargins of approximately 18.3% of revenues in 2008 and 17.9% of revenues in 2007. The increase in operatingmargin was due primarily to increased revenues, achieving operating efficiencies including leverage on priorsales and marketing investments and the impact of the depreciation of the Indian rupee versus the U.S. dollar,partially offset by additional headcount to support our revenue growth. Excluding stock-based compensationexpense and stock-based Indian fringe benefit tax expense of $52.0 million in 2008 and $41.8 million in 2007,operating margins for the years ended December 31, 2008 and 2007 were 20.2% and 19.8%, respectively.
Other Income/(Expense), Net. Other income (expense), net decreased from $32.8 million of income in 2007to $1.5 million of expense in 2008, or by $34.3 million, and consists primarily of interest income and foreigncurrency exchange gains or losses. This $34.3 million decrease is attributed to a period-over-period decrease of$26.0 million in foreign currency exchange income attributed to the remeasurement of certain balance sheetaccounts for movements in foreign currency exchange rates, primarily the strengthening of the U.S. dollar againstthe British pound, Euro and Indian rupee, and a reduction of $7.4 million in interest income, from approximately$29.6 million in 2007 to $22.2 million in 2008. In 2008, foreign currency exchange losses were approximately$22.8 million, which are primarily attributed to U.S. dollar denominated intercompany payables from our
52

European subsidiaries to Cognizant India for services performed by Cognizant India on behalf of our Europeancustomers and the remeasurement of the Indian rupee net monetary assets on Cognizant India’s books to the U.S.dollar functional currency. The decrease in interest income is primarily due to lower average short-term interestrates in 2008 compared to 2007.
Provision for Income Taxes. The provision for income taxes increased from approximately $64.2 million in2007 to approximately $84.4 million in 2008. The effective income tax rate increased from 15.5% in 2007 to16.4% in 2008. The increase in our effective income tax rate was primarily attributed to tax benefits ofapproximately $3.6 million recognized in 2007 resulting from the settlement of and expiration of the statute oflimitations for certain tax provisions and, in 2008, a net return to provision adjustment of $2.4 million. Excludingdiscrete items, our effective tax rate was 15.9% for 2008 compared to 16.4% for 2007. This decrease wasprimarily due to our overall growth, which resulted in a greater percentage of Cognizant India’s revenues fallingunder the income tax holiday, growth in countries whose tax rates were lower than the United States and netreductions in statutory income tax rates, primarily in Europe.
Net Income. Net income increased from approximately $350.1 million in 2007 to approximately$430.8 million in 2008, representing 16.4% and 15.3% of revenues, respectively. The decrease in net income as apercentage of revenues in 2008 was primarily attributed to the decrease in interest income and the foreigncurrency losses in 2008, partially offset by a higher operating margin in 2008.
Results by Business Segment
Our reportable segments are: Financial Services, which includes customers providing banking / transactionprocessing, capital markets and insurance services; Healthcare, which includes healthcare providers and payersas well as life sciences customers; Manufacturing/Retail/Logistics, which includes manufacturers, retailers, traveland other hospitality customers, as well as customers providing logistics services; and Other, which is anaggregation of industry operating segments which, individually, are less than 10.0% of consolidated revenues andsegment operating profit. The Other segment includes entertainment, media and information services,communications, and high technology operating segments. Our sales managers, account executives, accountmanagers and project teams are aligned in accordance with the specific industries they serve.
Our chief operating decision maker evaluates Cognizant’s performance and allocates resources based onsegment revenues and operating profit. Segment operating profit is defined as income from operations beforeunallocated costs. Generally, operating expenses for each operating segment have similar characteristics and aresubject to the same factors, pressures and challenges. However, the economic environment and its effects onindustries served by our operating groups may affect revenue and operating expenses to differing degrees.Expenses included in segment operating profit consist principally of direct selling and delivery costs as well as aper seat charge for use of the development centers. Certain expenses, such as general and administrative, and aportion of depreciation and amortization, are not specifically allocated to specific segments as management doesnot believe it is practical to allocate such costs to individual segments because they are not directly attributable toany specific segment. Further, stock-based compensation expense and the related stock-based Indian fringebenefit tax are not allocated to individual segments in internal management reports used by the chief operatingdecision maker. Accordingly, these expenses are separately disclosed in Note 14 as “unallocated” and areadjusted only against the total income from operations.
As of December 31, 2009, we had approximately 589 active customers. Accordingly, we provide asignificant volume of services to many customers in each of our business segments. Therefore, a loss of asignificant customer or a few significant customers in a particular segment could materially reduce revenues forsuch segment. However, no individual customer exceeded 10.0% of our consolidated revenues for the yearsended December 31, 2009, 2008 and 2007, respectively. In addition, the services we provide to our largercustomers are often critical to the operations of such customers and a termination of our services would requirean extended transition period with gradual declining revenues.
53

Revenues from external customers and segment operating profit, before unallocated expenses, for theFinancial Services, Healthcare, Manufacturing/Retail/Logistics, and Other segments for the years endedDecember 31, 2009, 2008 and 2007 are as follows:
2009 2008
2009 2008 2007 Increase % Increase %
(Dollars in thousands)
Revenues:Financial Services . . . . . . . . $1,406,629 $1,284,013 $1,001,420 $122,616 9.5% $282,593 28.2%Healthcare . . . . . . . . . . . . . . 860,427 688,224 504,504 172,203 25.0 183,720 36.4Manufacturing/Retail/Logistics . . . . . . . . . . . . . 564,917 443,236 320,116 121,681 27.5 123,120 38.5
Other . . . . . . . . . . . . . . . . . . 446,690 400,831 309,537 45,859 11.4 91,294 29.5
Total revenues . . . . . . . $3,278,663 $2,816,304 $2,135,577 $462,359 16.4% $680,727 31.9%
Segment Operating Profit:Financial Services . . . . . . . . $ 503,689 $ 439,055 $ 355,696 $ 64,634 14.7% $ 83,359 23.4%Healthcare . . . . . . . . . . . . . . 331,007 270,790 199,791 60,217 22.2 70,999 35.5Manufacturing/Retail/Logistics . . . . . . . . . . . . . 184,636 136,609 108,480 48,027 35.2 28,129 25.9
Other . . . . . . . . . . . . . . . . . . 147,246 132,209 111,319 15,037 11.4 20,890 18.8
Total segmentoperating profit . . . . $1,166,578 $ 978,663 $ 775,286 $187,915 19.2% $203,377 26.2%
Year Ended December 31, 2009 Compared to Year Ended December 31, 2008
Financial Services Segment
Revenue. Revenue increased by 9.5%, or approximately $122.6 million, from approximately$1,284.0 million during 2008 to approximately $1,406.6 million in 2009. The increase in revenue was primarilydriven by continued expansion of existing customer relationships as well as revenue contributed by newcustomers. The increase in revenue from customers existing as of December 31, 2008 and customers added sincesuch date was approximately $108.7 million and approximately $13.9 million, respectively. Within the segment,revenue from our insurance customers increased approximately $76.3 million over the prior year. Overall, thefull year 2009 increase in the segment can also be attributed to leveraging sales and marketing investments in thisbusiness segment as well as greater acceptance of the global IT services delivery model. However, revenue fromour financial services segment grew slower than the rest of the company primarily due to the crisis in thefinancial services sector during 2009. We believe this trend, to a lesser extent, may continue during 2010.
Segment Operating Profit. Segment operating profit increased by 14.7%, or approximately $64.6 million,from approximately $439.1 million during 2008 to approximately $503.7 million during 2009. The increase insegment operating profit was attributable primarily to increased revenues, the impact of the depreciation of theIndian rupee versus the U.S. dollar and achieving operating efficiencies, including continued leverage of priorsales and marketing investments.
Healthcare Segment
Revenue. Revenue increased by 25.0%, or approximately $172.2 million, from approximately$688.2 million during 2008 to approximately $860.4 million in 2009. The increase in revenue was primarilydriven by continued expansion of existing customer relationships as well as revenue contributed by newcustomers. The increase in revenue from customers existing as of December 31, 2008 and customers added sincesuch date was approximately $157.9 million and approximately $14.3 million, respectively. Within the segment,growth was particularly strong among both our life sciences and healthcare customers, where revenue during
54

2009 increased by approximately $93.1 million $79.1 million, respectively. The increase can also be attributed toleveraging sales and marketing investments in this business segment as well as greater acceptance of the globalIT services delivery model.
Segment Operating Profit. Segment operating profit increased 22.2%, or approximately $60.2 million, fromapproximately $270.8 million during 2008 to approximately $331.0 million during 2009. The increase in segmentoperating profit was attributable primarily to increased revenues, achieving operating efficiencies and the impactof the depreciation of the Indian rupee versus the U.S. dollar, partially offset by additional headcount to supportour revenue growth, continued investment in sales and marketing and wage inflation, primarily in India.
Manufacturing/Retail/Logistics Segment
Revenue. Revenue increased by 27.5%, or approximately $121.7 million, from approximately$443.2 million during 2008 to approximately $564.9 million in 2009. The increase in revenue was primarilydriven by continued expansion of existing customer relationships as well as revenue contributed by newcustomers. The increase in revenue from customers existing as of December 31, 2008 and customers added sincesuch date was approximately $92.5 million and approximately $29.2 million, respectively. Within the segment,growth was particularly strong among our retail and hospitality customers, where revenue during 2009 increasedby approximately $92.3 million. The increase can also be attributed to leveraging sales and marketinginvestments in this business segment as well as greater acceptance of the global IT services delivery model.
Segment Operating Profit. Segment operating profit increased 35.2%, or approximately $48.0 million, fromapproximately $136.6 million during 2008 to approximately $184.6 million during 2009. The increase in segmentoperating profit was attributable primarily to increased revenues, the impact of the depreciation of the Indianrupee versus the U.S. dollar and achieving operating efficiencies, including continued leverage of prior sales andmarketing investments.
Other Segment
Revenue. Revenue increased by 11.4%, or approximately $45.9 million, from approximately $400.8 millionin 2008 to approximately $446.7 million in 2009. The increase in revenue was primarily driven by continuedexpansion of existing customer relationships as well as revenue contributed by new customers. The increase inrevenue from customers existing as of December 31, 2008 and customers added since such date wasapproximately $16.8 million and approximately $29.1 million, respectively. Within the Other segment, growthwas particularly strong among our entertainment, media and information services customers, where revenueduring 2009 increased approximately $41.2 million over the prior year. The increase can also be attributed toleveraging sales and marketing investments in this business segment as well as greater acceptance of the globalIT services delivery model.
Segment Operating Profit. Segment operating profit increased 11.4%, or approximately $15.0 million, fromapproximately $132.2 million in 2008 to approximately $147.2 million in 2009. The increase in segmentoperating profit was attributable primarily to increased revenues during the year.
Year Ended December 31, 2008 Compared to Year Ended December 31, 2007
Financial Services Segment
Revenue. Revenue increased by 28.2%, or approximately $282.6 million, from approximately$1,001.4 million during 2007 to approximately $1,284.0 million in 2008. The increase in revenue was primarilydriven by continued expansion of existing customer relationships as well as revenue contributed by newcustomers. The increase in revenue from customers existing as of December 31, 2007 and customers addedduring 2008 was approximately $263.1 million and approximately $19.5 million, respectively. Within the
55
segment, full year revenue from our banking customers increased approximately $202.1 million over the prioryear. However, our quarterly sequential revenue decreased in the latter portion of 2008 due to the continuingcrisis in the financial services sector. Overall, the full year 2008 increase in the segment can also be attributed toleveraging sales and marketing investments in this business segment as well as greater acceptance of the globalIT services delivery model.
Segment Operating Profit. Segment operating profit increased by 23.4%, or approximately $83.4 million,from approximately $355.7 million during 2007 to approximately $439.1 million during 2008. The increase insegment operating profit was attributable primarily to increased revenues and the impact of the depreciation ofthe Indian rupee versus the U.S. dollar, partially offset by additional headcount to support our revenue growth,continued investment in sales and marketing and wage inflation, primarily in India.
Healthcare Segment
Revenue. Revenue increased by 36.4%, or approximately $183.7 million, from approximately$504.5 million during 2007 to approximately $688.2 million in 2008. The increase in revenue was primarilydriven by continued expansion of existing customer relationships as well as revenue contributed by newcustomers. The increase in revenue from customers existing as of December 31, 2007 and customers addedduring 2008 was approximately $166.3 million and approximately $17.4 million, respectively. Within thesegment, growth was particularly strong among our life sciences customers, where revenue during 2008increased by approximately $121.3 million over the prior year. The increase can also be attributed to leveragingsales and marketing investments in this business segment as well as greater acceptance of the global IT servicesdelivery model.
Segment Operating Profit. Segment operating profit increased 35.5%, or approximately $71.0 million, fromapproximately $199.8 million during 2007 to approximately $270.8 million during 2008. The increase in segmentoperating profit was attributable primarily to increased revenues and the impact of the depreciation of the Indianrupee versus the U.S. dollar, partially offset by additional headcount to support our revenue growth, continuedinvestment in sales and marketing and wage inflation, primarily in India.
Manufacturing/Retail/Logistics Segment
Revenue. Revenue increased by 38.5%, or approximately $123.1 million, from approximately$320.1 million during 2007 to approximately $443.2 million in 2008. The increase in revenue was primarilydriven by continued expansion of existing customer relationships as well as revenue contributed by newcustomers. The increase in revenue from customers existing as of December 31, 2007 and customers addedduring 2008 was approximately $77.3 million and approximately $45.8 million, respectively. The increase canalso be attributed to leveraging sales and marketing investments in this business segment as well as greateracceptance of the global IT services delivery model.
Segment Operating Profit. Segment operating profit increased 25.9%, or approximately $28.1 million, fromapproximately $108.5 million during 2007 to approximately $136.6 million during 2008. The increase in segmentoperating profit was attributable primarily to increased revenues and the impact of the depreciation of the Indianrupee versus the U.S. dollar, partially offset by additional headcount to support our revenue growth, continuedinvestment in sales and marketing and wage inflation, primarily in India.
Other Segment
Revenue. Revenue increased by 29.5%, or approximately $91.3 million, from approximately $309.5 millionin 2007 to approximately $400.8 million in 2008. The increase in revenue was primarily driven by continuedexpansion of existing customer relationships as well as revenue contributed by new customers. The increase inrevenue from customers existing as of December 31, 2007 and customers added during 2008 was approximately$43.6 million and approximately $47.7 million, respectively. Within the segment, growth was particularly strong
56

among our high technology customers, where revenue during 2008 increased approximately $40.1 million overthe prior year. The increase can also be attributed to leveraging sales and marketing investments in this businesssegment as well as greater acceptance of the global IT services delivery model.
Segment Operating Profit. Segment operating profit increased 18.8%, or approximately $20.9 million, fromapproximately $111.3 million in 2007 to approximately $132.2 million in 2008. The increase in segmentoperating profit was attributable primarily to increased revenues and the impact of the depreciation of the Indianrupee versus the U.S. dollar, partially offset by additional headcount to support our revenue growth, continuedinvestment in sales and marketing and wage inflation, primarily in India.
Liquidity and Capital Resources
At December 31, 2009, we had cash and cash equivalents and short-term investments of $1,399.3 million.We have used, and plan to use, such cash for (i) expansion of existing operations, including our offshoredevelopment and delivery centers; (ii) continued development of new service lines; (iii) acquisitions ofbusinesses; (iv) formation of joint ventures; (v) stock repurchases; and (vi) general corporate purposes, includingworking capital. As of December 31, 2009, we had no third party debt and had working capital of approximately$1,661.0 million as compared to working capital of approximately $1,080.5 million as of December 31, 2008.Accordingly, we do not anticipate any near-term liquidity issues.
Net cash provided by operating activities was approximately $672.3 million for the year endedDecember 31, 2009, $429.7 million for the year ended December 31, 2008 and $344.3 million for the year endedDecember 31, 2007. The increase in 2009 as compared to the prior year is primarily attributed to the increase inour net income in 2009 and higher incentive based compensation accruals, which are paid subsequent to yearend. Trade accounts receivable increased from approximately $383.0 million at December 31, 2007 toapproximately $517.5 million at December 31, 2008 and to approximately $626.3 million at December 31, 2009.Unbilled accounts receivable increased from approximately $53.5 million at December 31, 2007 toapproximately $62.2 at December 31, 2008 and to approximately $83.0 million at December 31, 2009. Theincrease in trade accounts receivable and unbilled receivables during 2009 was due primarily to increasedrevenues and a higher number of days of sales outstanding. We monitor turnover, aging and the collection ofaccounts receivable through the use of management reports that are prepared on a customer basis and evaluatedby our finance staff. At December 31, 2009, our days sales outstanding, including unbilled receivables, wasapproximately 72 days as compared to 71 days as of December 31, 2008 and 67 days as of December 31, 2007.
Our investing activities used net cash of approximately $394.8 million for the year ended December 31,2009, $55.0 million for the year ended December 31, 2008 and $277.3 million for the year ended December 31,2007. The increase in net cash used in investing activities during 2009 primarily related to net purchases of short-term investments and increased payments for acquisitions offset by a decrease in capital expenditures to coincidewith the change in demand driven by the overall economic conditions. The decrease in net cash used in investingactivities during 2008 primarily related to decreased payments for acquisitions and the net effect of the sale of aportion of our auction-rate securities investments and subsequent reinvestment of the proceeds into cash and cashequivalents during the year.
Our financing activities provided net cash of approximately $76.9 million for the year ended December 31,2009, $44.0 million for the year ended December 31, 2008 and $4.0 million for the year ended December 31,2007. The increase in 2009 related to additional proceeds and excess tax benefits from issuances under our stock-based compensation plans and lower common stock repurchases under our stock repurchase program. Theincrease in 2008 related primarily to lower common stock repurchases under our stock repurchase program andlower proceeds and excess tax benefits from issuances under our stock-based compensation plans.
As of December 31, 2009, our short-term and long-term investments totaled $449.5 million and included$129.1 million in long-term of AAA/A3-rated auction-rate municipal debt securities that are collateralized bydebt obligations supported by student loans, substantially backed by the FFELP. In addition, the remainder of ourlong-term investments included $22.0 million of an auction-rate securities related UBS Right discussed below.
57
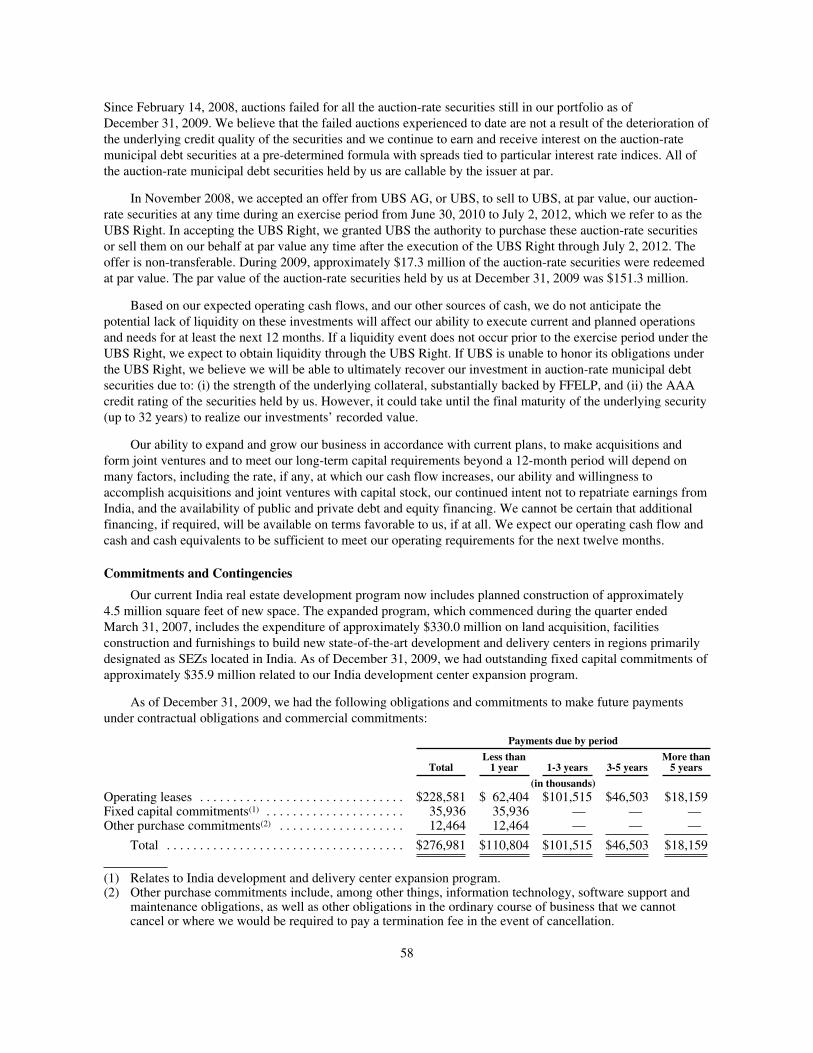
Since February 14, 2008, auctions failed for all the auction-rate securities still in our portfolio as ofDecember 31, 2009. We believe that the failed auctions experienced to date are not a result of the deterioration ofthe underlying credit quality of the securities and we continue to earn and receive interest on the auction-ratemunicipal debt securities at a pre-determined formula with spreads tied to particular interest rate indices. All ofthe auction-rate municipal debt securities held by us are callable by the issuer at par.
In November 2008, we accepted an offer from UBS AG, or UBS, to sell to UBS, at par value, our auction-rate securities at any time during an exercise period from June 30, 2010 to July 2, 2012, which we refer to as theUBS Right. In accepting the UBS Right, we granted UBS the authority to purchase these auction-rate securitiesor sell them on our behalf at par value any time after the execution of the UBS Right through July 2, 2012. Theoffer is non-transferable. During 2009, approximately $17.3 million of the auction-rate securities were redeemedat par value. The par value of the auction-rate securities held by us at December 31, 2009 was $151.3 million.
Based on our expected operating cash flows, and our other sources of cash, we do not anticipate thepotential lack of liquidity on these investments will affect our ability to execute current and planned operationsand needs for at least the next 12 months. If a liquidity event does not occur prior to the exercise period under theUBS Right, we expect to obtain liquidity through the UBS Right. If UBS is unable to honor its obligations underthe UBS Right, we believe we will be able to ultimately recover our investment in auction-rate municipal debtsecurities due to: (i) the strength of the underlying collateral, substantially backed by FFELP, and (ii) the AAAcredit rating of the securities held by us. However, it could take until the final maturity of the underlying security(up to 32 years) to realize our investments’ recorded value.
Our ability to expand and grow our business in accordance with current plans, to make acquisitions andform joint ventures and to meet our long-term capital requirements beyond a 12-month period will depend onmany factors, including the rate, if any, at which our cash flow increases, our ability and willingness toaccomplish acquisitions and joint ventures with capital stock, our continued intent not to repatriate earnings fromIndia, and the availability of public and private debt and equity financing. We cannot be certain that additionalfinancing, if required, will be available on terms favorable to us, if at all. We expect our operating cash flow andcash and cash equivalents to be sufficient to meet our operating requirements for the next twelve months.
Commitments and Contingencies
Our current India real estate development program now includes planned construction of approximately4.5 million square feet of new space. The expanded program, which commenced during the quarter endedMarch 31, 2007, includes the expenditure of approximately $330.0 million on land acquisition, facilitiesconstruction and furnishings to build new state-of-the-art development and delivery centers in regions primarilydesignated as SEZs located in India. As of December 31, 2009, we had outstanding fixed capital commitments ofapproximately $35.9 million related to our India development center expansion program.
As of December 31, 2009, we had the following obligations and commitments to make future paymentsunder contractual obligations and commercial commitments:
Payments due by period
TotalLess than1 year 1-3 years 3-5 years
More than5 years
(in thousands)Operating leases . . . . . . . . . . . . . . . . . . . . . . . . . . . . . . . $228,581 $ 62,404 $101,515 $46,503 $18,159Fixed capital commitments(1) . . . . . . . . . . . . . . . . . . . . . 35,936 35,936 — — —Other purchase commitments(2) . . . . . . . . . . . . . . . . . . . 12,464 12,464 — — —
Total . . . . . . . . . . . . . . . . . . . . . . . . . . . . . . . . . . . . $276,981 $110,804 $101,515 $46,503 $18,159
(1) Relates to India development and delivery center expansion program.(2) Other purchase commitments include, among other things, information technology, software support and
maintenance obligations, as well as other obligations in the ordinary course of business that we cannotcancel or where we would be required to pay a termination fee in the event of cancellation.
58

In connection with a 2008 acquisition, additional purchase price not to exceed $14.0 million, payable in2010, is contingent on the acquired company achieving certain financial and operating targets during an earn-outperiod. We expect to fund such payment, if any, from operating cash flow. The ultimate amount payable cannotbe predicted with reasonable certainty because the amount is dependent on future results of operations of theacquired business. In accordance with U.S. GAAP, we have not recorded a liability for this item on our balancesheet because the definitive amount is not determinable or distributable. The contingent consideration, if paid,will be recorded as an additional element of the cost of the acquired company.
As of December 31, 2009, we had $10.6 million of unrecognized tax benefits. This represents the taxbenefits associated with certain tax positions on our domestic and international tax returns that have not beenrecognized on our financial statements due to uncertainty regarding their resolution. The resolution or settlementof these tax positions with the relevant taxing authorities is at various stages and therefore we are unable to makea reliable estimate of the eventual cash flows by period that may be required to settle these matters.
We are involved in various claims and legal actions arising in the ordinary course of business. In the opinionof management, the outcome of such claims and legal actions, if decided adversely, is not expected to have amaterial adverse effect on our quarterly or annual operating results, cash flows, or consolidated financialposition. Additionally, many of our engagements involve projects that are critical to the operations of ourcustomers’ business and provide benefits that are difficult to quantify. Any failure in a customer’s systems or ourfailure to meet our contractual obligations to our clients, including any breach involving a customer’sconfidential information or sensitive data, or our obligations under applicable laws or regulations could result ina claim for substantial damages against us, regardless of our responsibility for such failure. Although we attemptto contractually limit our liability for damages arising from negligent acts, errors, mistakes, or omissions inrendering our services, there can be no assurance that the limitations of liability set forth in our contracts will beenforceable in all instances or will otherwise protect us from liability for damages. Although we have generalliability insurance coverage, including coverage for errors or omissions, there can be no assurance that suchcoverage will continue to be available on reasonable terms or will be available in sufficient amounts to cover oneor more large claims, or that the insurer will not disclaim coverage as to any future claim. The successfulassertion of one or more large claims against us that exceed available insurance coverage or changes in ourinsurance policies, including premium increases or the imposition of large deductible or co-insurancerequirements, could have a material adverse effect on our quarterly and annual operating results, financialposition and cash flows.
Foreign Currency Risk
Overall, we believe that we have limited revenue risk resulting from movement in foreign currencyexchange rates as approximately 79.1% of our revenues for the year ended December 31, 2009 were generatedfrom customers located in North America. However, a portion of our costs in India, representing approximately27.5% of our global operating costs for the year ended December 31, 2009, were denominated in the Indian rupeeand were subject to foreign exchange rate fluctuations. These foreign currency exchange rate fluctuations have animpact on our results of operations. In addition, a portion of our balance sheet is exposed to foreign currencyexchange rate fluctuations, which may result in non-operating foreign currency exchange gains or losses uponremeasurement. In 2009, we reported foreign currency exchange gains, exclusive of hedging gains or losses, ofapproximately $22.5 million, which were primarily attributed to the remeasurement of (i) U.S. dollardenominated intercompany payables from our European subsidiaries to Cognizant India for services performedby Cognizant India on behalf of our European customers and (ii) Indian rupee net monetary assets on CognizantIndia’s books to the U.S. dollar functional currency. On an ongoing basis, we manage a portion of this risk bylimiting our net monetary asset exposure to the Indian rupee in our Indian subsidiaries.
During December 2008 and throughout 2009, we entered into a series of foreign exchange forward contractsthat are designated as cash flow hedges of certain salary payments in India. Cognizant India converts U.S. dollarreceipts from intercompany billings to Indian rupees to fund local expenses, including salaries. These U.S. dollar /Indian rupee hedges to buy Indian rupees and sell U.S. dollars are intended to partially offset the impact of
59

movement of exchange rates on future operating costs. During 2009, we reported income of $8.9 million oncontracts that settled during the year. As of December 31, 2009, we have outstanding contracts with a notionalvalue of $450.0 million and weighted average forward rate of 49.44 rupees to the U.S. dollar scheduled to maturein 2010 and outstanding contracts with a notional value of $360.0 million and weighted average forward rate of48.49 rupees to the U.S. dollar scheduled to mature in 2011.
We also use foreign currency forward contracts to hedge balance sheet exposure to our Indian rupeedenominated net monetary assets. These contracts are not designated as hedges and are intended to offset theforeign currency exchange rate gains or losses upon the remeasurement of the underlying Indian rupeedenominated net monetary assets. During 2009, we entered into a series of foreign exchange forward contracts,scheduled to mature in 2010, to buy U.S. dollars and sell Indian rupees. At December 31, 2009, the notionalvalue of the outstanding contracts was $400.0 million and the related fair value was a liability of $20.8 million.During 2009, inclusive of the loss of $20.8 million on these undesignated balance sheet hedges, we reported netforeign currency exchange gains of approximately $1.7 million.
There were no off-balance sheet transactions, arrangements or other relationships with unconsolidatedentities or other persons in 2009, 2008 and 2007 that would have affected our liquidity or the availability of orrequirements for capital resources.
Effects of Inflation
Our most significant costs are the salaries and related benefits for our programming staff and otherprofessionals. Competition in India, the United States and Europe for professionals with advanced technical skillsnecessary to perform the services we offer has caused wages to increase at a rate greater than the general rate ofinflation. As with other service providers in our industry, we must adequately anticipate wage increases,particularly on our fixed-price contracts. There can be no assurance that we will be able to recover cost increasesthrough increases in the prices that we charge for our services in the United States and elsewhere. Historically,we have experienced wage inflation in India; however, this has not had a material impact on our results ofoperations as Indian wages represented less than 20.0% of our total operating expenses for the year endedDecember 31, 2009.
Recent Accounting Pronouncements
In 2006, the Financial Accounting Standards Board (FASB) issued authoritative guidance which defines fairvalue, establishes a market-based framework or hierarchy for measuring fair value and expands disclosures aboutfair value measurements. It is appropriate to apply fair value measurements whenever other sections of theauthoritative guidance requires or permits assets and liabilities to be measured at fair value. This authoritativeguidance does not expand or require any new fair value measures, however the application of this guidance maychange current practice. We adopted this authoritative guidance for financial assets and liabilities effectiveJanuary 1, 2008 and for non-financial assets and liabilities effective January 1, 2009. The adoption of thisauthoritative guidance, which primarily affected the valuation of our investments and derivative contracts, didnot have a material effect on our financial condition or results of operations.
In April 2009, the FASB issued several amendments to the accounting and disclosure requirementsregarding fair value measurements and impairments of securities. These amendments are intended to provideguidance to:
• Determine fair values when there is no active market or where the price inputs being used representdistressed sales. It reaffirms the need to use judgment to ascertain if a formerly active market hasbecome inactive and in determining fair values when markets have become inactive.
• Bring consistency to the timing of impairment recognition, and provide improved disclosures about thecredit and noncredit components of impaired debt securities that are not expected to be sold. The
60

measure of impairment in comprehensive income remains fair value. The amendment also requiresincreased and timelier disclosures regarding expected cash flows, credit losses, and an aging ofsecurities with unrealized losses.
• Disclose financial instruments that are not currently reflected on the balance sheet at fair value. Prior toissuing this amendment, fair values for these assets and liabilities were only disclosed once a year. Theamendment now requires these disclosures on a quarterly basis, providing qualitative and quantitativeinformation about fair value estimates for all those financial instruments not measured on the balancesheet at fair value.
We elected to early adopt these amendments effective March 31, 2009. The adoption of these amendmentsdid not have a material effect on our financial condition or results of operations.
In December 2007, the FASB revised the authoritative guidance for business combinations whichestablishes principles and requirements for how the acquiring entity in a business combination recognizes the fullfair value of assets acquired and liabilities assumed in the transaction (whether a full or partial acquisition);establishes the acquisition-date fair value as the measurement objective for all assets acquired and liabilitiesassumed; requires expensing of transaction and restructuring costs; and requires the acquirer to disclose theinformation needed to evaluate and understand the nature and financial effect of the business combination.Effective January 1, 2009, we adopted this revised guidance, which applies prospectively to businesscombinations for which the acquisition date is on or after January 1, 2009. The adoption of this revised guidancedid not have a significant impact on our results of operations or financial condition; however, the impact of thisrevised guidance on our future consolidated financial statements will depend upon the nature, terms and size ofthe acquisitions we consummate in the future.
In March 2008, the FASB issued authoritative guidance which applies to all derivative instruments andrelated hedged items accounted for as hedges. This guidance requires entities to provide greater transparencyabout how and why an entity uses derivative instruments, how derivative instruments and related hedged itemsare accounted for under this guidance and its related interpretations, and how derivative instruments and relatedhedged items affect an entity’s financial position, results of operations and cash flows. Effective January 1, 2009,we adopted this guidance and have presented the required information in Note 11.
In May 2009, the FASB issued authoritative guidance establishing principles and requirements forrecognition and disclosure of subsequent events in the financial statements. Our adoption of this guidance onJune 30, 2009 did not have a material effect on our financial condition or consolidated results of operations.
In June 2009, the FASB issued a new accounting standard which changes the consolidation rules as theyrelate to variable interest entities. Specifically, the new standard makes significant changes to the model fordetermining who should consolidate a variable interest entity, and also addresses how often this assessmentshould be performed. This guidance is effective for fiscal years beginning after November 15, 2009. Theadoption of this standard will not have a material effect on our financial condition or consolidated results ofoperations.
In June 2009, the FASB issued authoritative guidance, “The FASB Accounting Standards Codification andHierarchy of Generally Accepted Accounting Principles—a replacement of FASB Statement No. 162” (the“Codification”). The Codification does not alter current U.S. GAAP, but rather integrates existing accountingstandards with other authoritative guidance. Under the Codification, there is a single source of authoritative U.S.GAAP for nongovernmental entities and it supersedes all other previously issued non-SEC accounting andreporting guidance. The Codification is effective for financial statement periods ending after September 15,2009. Our adoption of the Codification on July 1, 2009 did not have a material effect on our financial conditionor consolidated results of operations.
In October 2009, the FASB issued a new accounting standard which provides guidance for arrangementswith multiple deliverables. Specifically, the new standard requires an entity to allocate consideration at the
61

inception of an arrangement to all of its deliverables based on their relative selling prices. In the absence of thevendor-specific objective evidence or third-party evidence of the selling prices, consideration must be allocatedto the deliverables based on management’s best estimate of the selling prices. In addition, the new standardeliminates the use of the residual method of allocation. In October 2009, the FASB also issued a new accountingstandard which changes revenue recognition for tangible products containing software and hardwareelements. Specifically, tangible products containing software and hardware that function together to deliver thetangible products’ essential functionality are scoped out of the existing software revenue recognition guidanceand will be accounted for under the multiple-element arrangements revenue recognition guidance discussedabove. Both standards will be effective for us in the first quarter of 2011. Early adoption is permitted. Theadoption of this standard will not have a material effect on our financial condition or consolidated results ofoperations.
Forward Looking Statements
The statements contained in this Annual Report on Form 10-K that are not historical facts are forward-looking statements (within the meaning of Section 21E of the Securities Exchange Act of 1934, as amended) thatinvolve risks and uncertainties. Such forward-looking statements may be identified by, among other things, theuse of forward-looking terminology such as “believes,” “expects,” “may,” “could,” “would,” “plan,” “intend,”“estimate,” “predict,” “potential,” “continue,” “should” or “anticipates” or the negative thereof or othervariations thereon or comparable terminology, or by discussions of strategy that involve risks and uncertainties.From time to time, we or our representatives have made or may make forward-looking statements, orally or inwriting.
Such forward-looking statements may be included in various filings made by us with the Securities andExchange Commission, or press releases or oral statements made by or with the approval of one of ourauthorized executive officers. These forward-looking statements, such as statements regarding anticipated futurerevenues or operating margins, contract percentage completions, earnings, capital expenditures and otherstatements regarding matters that are not historical facts, involve predictions. Our actual results, performance orachievements could differ materially from the results expressed in, or implied by, these forward-lookingstatements. We undertake no obligation to update or revise any forward-looking statements, whether as a resultof new information, future events or otherwise, except as may be required under applicable securities laws. Thereare a number of important factors that could cause our results to differ materially from those indicated by suchforward-looking statements. These factors include those set forth in Part I, in the section entitled Item 1A.“Risk Factors”.
Item 7A. Quantitative and Qualitative Disclosures About Market Risk
We are exposed to foreign currency exchange rate risk in the ordinary course of doing business as wetransact or hold a portion of our funds in foreign currencies, particularly the Indian rupee. Accordingly, weperiodically evaluate the need for hedging strategies, including the use of derivative financial instruments, tomitigate the effect of foreign currency exchange rate fluctuations and expect to continue to use such instrumentsin the future to reduce foreign currency exposure to appreciation or depreciation in the value of certain foreigncurrencies. All hedging transactions are authorized and executed pursuant to regularly reviewed policies andprocedures.
We have entered into a series of foreign exchange forward contracts that are designated as cash flow hedgesof certain salary payments in India. Cognizant India converts U.S. dollar receipts from intercompany billings toIndian rupees to fund local expenses, including salaries. These U.S. dollar / Indian rupee hedges are intended topartially offset the impact of movement of exchange rates on future operating costs. As of December 31, 2009and December 31, 2008, the notional value of these contracts was $810.0 million and $82.0 million, respectively.The outstanding contracts at December 31, 2009 are scheduled to mature each month during 2010 and 2011. AtDecember 31, 2009 and December 31, 2008, the net unrealized gain on our outstanding foreign exchangeforward contracts was $19.0 million and $0.6 million, respectively. Based upon a sensitivity analysis of ourforeign exchange forward contracts at December 31, 2009, which estimates the fair value of the contracts based
62

upon market exchange rate fluctuations, a 10.0% change in the foreign currency exchange rate against the U.S.dollar with all other variables held constant would have resulted in a change in the fair value of approximately$80.0 million.
We also use foreign exchange forward contracts to hedge balance sheet exposure to our Indian rupeedenominated net monetary assets. These contracts are not designated as hedges and are intended to offset theforeign currency exchange rate gains or losses upon the remeasurement of the underlying Indian rupeedenominated net monetary assets. During 2009, we entered into a series of foreign exchange forward contracts,scheduled to mature in 2010, to buy U.S. dollars and sell Indian rupees. At December 31, 2009, the notionalvalue of the outstanding contracts was $400.0 million and the related fair value was a liability of $20.8 million.Based upon a sensitivity analysis of our foreign exchange forward contracts at December 31, 2009, whichestimates the fair value of the contracts based upon market exchange rate fluctuations, a 10.0% change in theforeign currency exchange rate against the U.S. dollar with all other variables held constant would have resultedin a change in the fair value of approximately $42.0 million.
There were no off-balance sheet transactions, arrangements or other relationships with unconsolidatedentities or other persons in 2009, 2008 and 2007 that would have affected our liquidity or the availability of orrequirements for capital resources.
We do not believe we are exposed to material direct risks associated with changes in interest rates other thanwith our cash and cash equivalents and short-term investments. As of December 31, 2009, we had approximately$1,550.5 million of cash and cash equivalents and short-term and long-term investments most of which areimpacted almost immediately by changes in short-term interest rates. We limit our credit risk by investingprimarily in AAA/Aaa/A3 or A1/P1 rated securities as rated by Moody’s, Standard & Poor’s and Fitch ratingservices and restricting amounts that can be invested with any single issuer.
As of December 31, 2009, our short-term and long-term investments totaled $449.5 million and included$129.1 million in long-term of AAA/A3-rated auction-rate municipal debt securities that are collateralized bydebt obligations supported by student loans, substantially backed by the FFELP. In addition, the remainder of ourlong-term investments included $22.0 million of an auction-rate related UBS Right discussed below. SinceFebruary 14, 2008, auctions failed for all the auction-rate securities still in our portfolio as of December 31,2009. We believe that the failed auctions experienced to date are not a result of the deterioration of theunderlying credit quality of the securities and we continue to earn and receive interest on the auction-ratemunicipal debt securities at a pre-determined formula with spreads tied to particular interest rate indices. All ofthe auction-rate municipal debt securities held by us are callable by the issuer at par.
In November 2008, we accepted an offer from UBS to sell to UBS, at par value, our auction-rate securitiesat any time during an exercise period from June 30, 2010 to July 2, 2012, which we refer to as the UBS Right. Inaccepting the UBS Right, we granted UBS the authority to purchase these auction-rate securities or sell them onour behalf at par value any time after the execution of the UBS Right through July 2, 2012. The offer isnon-transferable. At December 31, 2009, we determined the fair value of the UBS Right to be $22.0 million.During 2009, approximately $17.3 million of auction rate securities were redeemed at par value.
Item 8. Financial Statements and Supplementary Data
The financial statements required to be filed pursuant to this Item 8 are appended to this Annual Report onForm 10-K. A list of the financial statements filed herewith is found in Part IV, “Item 15. Exhibits, FinancialStatements and Financial Statement Schedule”.
Item 9. Changes in and Disagreements with Accountants on Accounting and Financial Disclosure
Not applicable.
63

Item 9A. Controls and Procedures.
Evaluation of Disclosure Controls and Procedures
Our management under the supervision and with the participation of our chief executive officer and ourchief financial officer, evaluated the design and operating effectiveness of our disclosure controls and procedures(as defined in Rules 13a-15(e) and 15d-15(e) under the Securities Exchange Act of 1934, as amended, or theExchange Act) as of December 31, 2009. Based on this evaluation, our chief executive officer and our chieffinancial officer concluded that, as of December 31, 2009, our disclosure controls and procedures were effectiveto provide reasonable assurance that material information required to be disclosed by us in our reports that wefile or submit under the Exchange Act is (i) recorded, processed, summarized and reported within the timeperiods specified in the SEC’s rules and forms and (ii) accumulated and communicated to our chief executiveofficer and our chief financial officer as appropriate to allow timely decisions regarding required disclosure.
Changes in Internal Control over Financial Reporting
No changes in our internal control over financial reporting (as defined in Rules 13a-15(f) and 15d-15(f)under the Exchange Act) occurred during the fiscal quarter ended December 31, 2009 that have materiallyaffected, or are reasonably likely to materially affect, our internal control over financial reporting.
Management’s Responsibility for Financial Statements
Our management is responsible for the integrity and objectivity of all information presented in this annualreport. The consolidated financial statements were prepared in conformity with accounting principles generallyaccepted in the United States of America and include amounts based on management’s best estimates andjudgments. Management believes the consolidated financial statements fairly reflect the form and substance oftransactions and that the financial statements fairly represent the Company’s financial position and results ofoperations.
The Audit Committee of the Board of Directors, which is composed solely of independent directors, meetsregularly with the Company’s independent registered public accounting firm and representatives of managementto review accounting, financial reporting, internal control and audit matters, as well as the nature and extent ofthe audit effort. The Audit Committee is responsible for the engagement of the independent registered publicaccounting firm. The independent registered public accounting firm has free access to the Audit Committee.
Management’s Report on Internal Control Over Financial Reporting
Our management is responsible for establishing and maintaining adequate internal control over financialreporting. Internal control over financial reporting is defined in Rule 13a-15(f) or 15d-15(f) of the Exchange Actand is a process designed by, or under the supervision of, our chief executive and chief financial officers andeffected by our Board of Directors, management and other personnel, to provide reasonable assurance regardingthe reliability of financial reporting and the preparation of financial statements for external purposes inaccordance with generally accepted accounting principles and includes those policies and procedures that:
• Pertain to the maintenance of records that, in reasonable detail, accurately and fairly reflect thetransactions and dispositions of our assets;
• Provide reasonable assurance that transactions are recorded as necessary to permit preparation offinancial statements in accordance with generally accepted accounting principles, and that receipts andexpenditures of the Company are being made only in accordance with authorizations of ourmanagement and directors; and
• Provide reasonable assurance regarding prevention or timely detection of unauthorized acquisition, useor disposition of the Company’s assets that could have a material effect on the financial statements.
64

Our management assessed the effectiveness of the company’s internal control over financial reporting as ofDecember 31, 2009. In making this assessment, the Company’s management used the criteria set forth by theCommittee of Sponsoring Organizations of the Treadway Commission (COSO) in Internal Control-IntegratedFramework.
Based on its evaluation, our management has concluded that, as of December 31, 2009, our internal controlover financial reporting was effective. The effectiveness of our internal control over financial reporting as ofDecember 31, 2009 has been audited by PricewaterhouseCoopers LLP, an independent registered publicaccounting firm, as stated in their report which is included on page F-2.
Inherent Limitations of Internal Controls
Because of its inherent limitations, internal control over financial reporting may not prevent or detect allmisstatements. Projections of any evaluation of effectiveness to future periods are subject to the risk that controlsmay become inadequate because of changes in conditions, or that the degree of compliance with the policies orprocedures may deteriorate.
Item 9B. Other Information.
None.
65

PART III
Item 10. Directors, Executive Officers and Corporate Governance
The information relating to our directors and nominees for election as directors under the heading “Electionof Directors” in our definitive proxy statement for the 2010 Annual Meeting of Stockholders is incorporatedherein by reference to such proxy statement. The information relating to our executive officers in response to thisitem is contained in part under the caption “Our Executive Officers” in Part I of this Annual Report onForm 10-K and the remainder is incorporated herein by reference to our definitive proxy statement for the 2010Annual Meeting of Stockholders under the headings “Section 16(a) Beneficial Ownership ReportingCompliance,” “Corporate Governance-Code of Ethics” and “Committees of the Board-Audit Committee.”
We have adopted a written code of business conduct and ethics, entitled “Cognizant’s Core Values andStandards of Business Conduct,” that applies to all of our employees, including our principal executive officer,principal financial officer, principal accounting officer and controller, or persons performing similar functions.We make available our code of business conduct and ethics free of charge through our website which is locatedat www.cognizant.com. We intend to disclose any amendments to, or waivers from, our code of business conductand ethics that are required to be publicly disclosed pursuant to rules of the SEC and the NASDAQ Global SelectMarket by filing such amendment or waiver with the SEC and by posting it on our website.
Item 11. Executive Compensation
The discussion under the heading “Executive Compensation,” “Compensation Committee Report,”“Executive Compensation Tables” and “Compensation Committee Interlocks and Insider Participation” in ourdefinitive proxy statement for the 2010 Annual Meeting of Stockholders is incorporated herein by reference tosuch proxy statement.
Item 12. Security Ownership of Certain Beneficial Owners and Management and Related StockholderMatters
The discussion under the heading “Security Ownership of Certain Beneficial Owners and Management” inour definitive proxy statement for the 2010 Annual Meeting of Stockholders is incorporated herein by referenceto such proxy statement.
Item 13. Certain Relationships and Related Transactions, and Director Independence
The discussion under the heading “Certain Relationships and Related Transactions and DirectorIndependence” in our definitive proxy statement for the 2010 Annual Meeting of Stockholders is incorporatedherein by reference to such proxy statement.
Item 14. Principal Accountant Fees and Services
The discussion under the heading “Independent Registered Public Accounting Firm Fees and Other Matters”in our definitive proxy statement for the 2010 Annual Meeting of Stockholders is incorporated herein byreference to such proxy statement.
66

PART IV
Item 15. Exhibits, Financial Statement Schedules
(a) (1) Consolidated Financial Statements.Reference is made to the Index to Consolidated Financial Statements on Page F-1.
(2) Consolidated Financial Statement Schedule.Reference is made to the Index to Financial Statement Schedule on Page F-1.
(3) Exhibits.Reference is made to the Index to Exhibits on Page 69.
Schedules other than as listed above are omitted as not required or inapplicable or because the requiredinformation is provided in the consolidated financial statements, including the notes thereto.
67

SIGNATURES
Pursuant to the requirements of Section 13 or 15(d) of the Securities Exchange Act of 1934, the Registranthas duly caused this report to be signed on its behalf by the undersigned, thereunto duly authorized this 25th dayof February, 2010.
COGNIZANT TECHNOLOGY SOLUTIONSCORPORATION
By: /S/ FRANCISCO D’SOUZAFrancisco D’Souza, President and
Chief Executive Officer(Principal Executive Officer)
Pursuant to the requirements of the Securities Exchange Act of 1934, this report has been signed below bythe following persons on behalf of the Registrant and in the capacities and on the dates indicated.
Signature Title Date
/S/ FRANCISCO D’SOUZAFrancisco D’Souza
President, Chief Executive Officer and Director(Principal Executive Officer)
February 25, 2010
/S/ GORDON COBURN
Gordon Coburn
Chief Financial and Operating Officer, andTreasurer(Principal Financial and Accounting Officer)
February 25, 2010
/S/ JOHN E. KLEIN
John E. Klein
Chairman of the Board and Director February 25, 2010
/S/ LAKSHMI NARAYANAN
Lakshmi Narayanan
Vice Chairman of the Board and Director February 25, 2010
/S/ THOMAS M. WENDEL
Thomas M. Wendel
Director February 25, 2010
/S/ ROBERT W. HOWE
Robert W. Howe
Director February 25, 2010
/S/ ROBERT E. WEISSMAN
Robert E. Weissman
Director February 25, 2010
/S/ JOHN N. FOX, JR.John N. Fox, Jr.
Director February 25, 2010
/S/ MAUREEN BREAKIRON-EVANSMaureen Breakiron-Evans
Director February 25, 2010
68

EXHIBIT INDEX
Exhibit No. Description of Exhibit
3.1 Restated Certificate of Incorporation. (Incorporated by reference to Exhibit 3.1 to the Company’sCurrent Report on Form 8-K dated February 13, 2003.)
3.2 Amended and Restated By-laws of the Company, as amended on April 18, 2008. (Incorporated byreference to Exhibit 3.1 to the Company’s Current Report on Form 8-K dated April 18, 2008.)
3.3 Amendment to Restated Certificate of Incorporation. (Incorporated by reference to Exhibit 3.1 tothe Company’s Quarterly Report on Form 10-Q for the quarter ended June 30, 2004.)
3.4 Certificate of Amendment to Restated Certificate of Incorporation dated June 13, 2006.(Incorporated by reference to Exhibit 99.1 to the Company’s Current Report on Form 8-K datedJune 13, 2006.)
4.1 Rights Agreement, dated March 5, 2003, between the Company and American Stock Transfer &Trust Company, as Rights Agent, which includes the Certificate of Designations for the Series AJunior Participating Preferred Stock as Exhibit A, the Form of Right Certificate as Exhibit B andthe Summary of Rights to Purchase Preferred Shares as Exhibit C (Incorporated by reference toExhibit 4.1 to the Company’s Current Report on Form 8-K dated March 5, 2003.)
4.2 Specimen Certificate for shares of Class A common stock. (Incorporated by reference toExhibit 4.2 to the Company’s Amendment Number 4 to the Company’s Form S-4 dated January30, 2003.)
10.1* Form of Indemnification Agreement for Directors and Officers. (Incorporated by reference toExhibit 10.1 to the Company’s Registration Statement on Form S-1. (File Number 333-49783)which became effective on June 18, 1998.)
10.2* Amended and Restated Cognizant Technology Solutions Key Employees’ Stock Option Plan.(Incorporated by reference to Exhibit 10.2 to the Company’s Registration Statement on Form S-1(File Number 333-49783) which became effective on June 18, 1998.)
10.3* Amended and Restated Cognizant Technology Solutions Non-Employee Directors’ Stock OptionPlan. (Incorporated by reference to Exhibit 10.3 to the Company’s Registration Statement onForm S-1 (File Number 333-49783) which became effective on June 18, 1998.)
10.4* Form of Severance and Non-Competition Agreement between the Company and each of itsExecutive Officers. (Incorporated by reference to Exhibit 10.9 to the Company’s RegistrationStatement on Form S-1 (File Number 333-49783) which became effective on June 18, 1998.)
10.5* Amended and Restated 1999 Incentive Compensation Plan (As Amended and Restated ThroughApril 26, 2007). (Incorporated by reference to Exhibit 10.1 to the Company’s Current Report onForm 8-K dated June 7, 2007.)
10.6 2004 Employee Stock Purchase Plan. (Incorporated by reference to Exhibit 10.1 to the Company’sQuarterly Report on Form 10-Q for the quarter ended March 31, 2004.)
10.7 Form of Stock Option Certificate. (Incorporated by reference to Exhibit 10.1 to the Company’sQuarterly Report on Form 10-Q for the quarter ended September 30, 2004.)
10.8* The Cognizant Technology Solutions Executive Pension Plan. (Incorporated by reference toExhibit 10.2 to the Company’s Quarterly Report on Form 10-Q for the quarter ended June 30,2005.)
10.9 Distribution Agreement between IMS Health Incorporated and the Company dated January 7,2003. (Incorporated by reference to Exhibit 10.13 to the Company’s Amendment Number 4 to theCompany Form S-4 dated January 30, 2003.)
10.10* Form of Stock Option Agreement between the Company and Lakshmi Narayanan pursuant towhich stock options were granted on March 29, 2001. (Incorporated by reference to Exhibit 10.10to the Company’s Form 10-K dated March 12, 2004.)
69

Exhibit No. Description of Exhibit
10.11* Form of Stock Option Agreement between the Company and Lakshmi Narayanan pursuant towhich stock options were granted on February 5, 2003. (Incorporated by reference toExhibit 10.11 to the Company’s Form 10-K dated March 12, 2004.)
10.12* Form of Stock Option Agreement between the Company and Francisco D’Souza pursuant towhich stock options were granted on February 5, 2003. (Incorporated by reference toExhibit 10.13 to the Company’s Form 10-K dated March 12, 2004.)
10.13* Severance and Noncompetition Agreement between the Company and RamakrishnanChandrasekaran dated December 13, 2004. (Incorporated by reference to Exhibit 10.1 to theCompany’s Current Report on Form 8-K dated December 17, 2004.)
10.14* Amended and Restated 1999 Incentive Compensation Plan Amendment No. 1, which becameeffective on March 2, 2007. (Incorporated by reference to Exhibit 10.1 to the Company’sQuarterly Report on Form 10-Q for the quarter ended March 31, 2007.)
10.15 Amended and Restated Key Employees’ Stock Option Plan Amendment No. 1, which becameeffective on March 2, 2007. (Incorporated by reference to Exhibit 10.2 to the Company’sQuarterly Report on Form 10-Q for the quarter ended March 31, 2007.)
10.16* Amended and Restated Non-Employee Directors’ Stock Option Plan Amendment No. 1, whichbecame effective on March 2, 2007. (Incorporated by reference to Exhibit 10.3 to the Company’sQuarterly Report on Form 10-Q for the quarter ended March 31, 2007.)
10.17* Severance and Noncompetition Agreement with Rajeev Mehta dated July 23, 2007. (Incorporatedby reference to Exhibit 10.1 to the Company’s Current Report on Form 8-K dated July 18, 2007.)
10.18* Form of Performance Unit Award for grants to certain executive officers. (Incorporated byreference to Exhibit 10.1 to the Company’s Current Report on Form 8-K dated December 6,2007.)
10.19* Form of Stock Unit Award Agreement pursuant to the Cognizant Technology SolutionsCorporation Amended and Restated 1999 Incentive Compensation Plan. (Incorporated byreference to Exhibit 10.1 to the Company’s Form 8-K dated September 4, 2008.)
10.20* Form of Amendment to Severance and Noncompetition Agreements with the Named ExecutiveOfficers. (Incorporated by reference to Exhibit 10.1 to the Company’s Form 8-K datedDecember 3, 2008.)
10.21* The Cognizant Technology Solutions Executive Pension Plan, as amended and restated.(Incorporated by reference to Exhibit 10.2 to the Company’s Form 8-K dated December 3, 2008.)
10.22* Cognizant Technology Solutions Corporation 2009 Incentive Compensation Plan. (Incorporatedby reference to Exhibit 10.1 to the Company’s Quarterly Report on Form 10-Q for the quarterended June 3, 2009.)
10.23* Form of Cognizant Technology Solutions Corporation Stock Option Agreement. (Incorporated byreference to Exhibit 10.1 to the Company’s Current Report on Form 8-K filed July 6, 2009.
10.24* Form of Cognizant Technology Solutions Corporation Notice of Grant of Stock Option.(Incorporated by reference to Exhibit 10.2 to the Company’s Current Report on Form 8-K filedJuly 6, 2009.)
10.25* Form of Cognizant Technology Solutions Corporation Restricted Stock Unit Award AgreementTime-Based Vesting. (Incorporated by reference to Exhibit 10.3 to the Company’s Current Reporton Form 8-K filed July 6, 2009.)
10.26* Form of Cognizant Technology Solutions Corporation Notice of Award of Restricted Stock UnitsTime-Based Vesting. (Incorporated by reference to Exhibit 10.4 to the Company’s Current Reporton Form 8-K filed July 6, 2009.)
70

Exhibit No. Description of Exhibit
10.27* Form of Cognizant Technology Solutions Corporation Restricted Stock Unit Award AgreementPerformance-Based Vesting. (Incorporated by reference to Exhibit 10.5 to the Company’s CurrentReport on Form 8-K filed July 6, 2009.)
10.28* Form of Cognizant Technology Solutions Corporation Notice of Award of Restricted Stock UnitsPerformance-Based Vesting. (Incorporated by reference to Exhibit 10.6 to the Company’s CurrentReport on Form 8-K filed July 6, 2009.)
10.30* Form of Cognizant Technology Solutions Corporation Notice of Award of Restricted Stock UnitsNon-Employee Director Deferred Issuance. (Incorporated by reference to Exhibit 10.8 to theCompany’s Current Report on Form 8-K filed July 6, 2009.)
21.1 † List of subsidiaries of the Company.
23.1 † Consent of PricewaterhouseCoopers LLP.
31.1 † Certification Pursuant to Rule 13a-14(a) and 15d-14(a) of the Exchange Act, as Adopted Pursuantto Section 302 of the Sarbanes-Oxley Act of 2002 (Chief Executive Officer).
31.2 † Certification Pursuant to Rule 13a-14(a) and 15d-14(a) of the Exchange Act, as Adopted Pursuantto Section 302 of the Sarbanes-Oxley Act of 2002 (Chief Financial Officer).
32.1 †† Certification Pursuant to 18 U.S.C. Section 1350 (Chief Executive Officer).
32.2 †† Certification Pursuant to 18 U.S.C. Section 1350 (Chief Financial Officer).
101 The following materials from this Annual Report on Form 10-K for the year ended December 31,2009 and formatted in XBRL:
(i) Consolidated Statements of Financial Position as of December 31, 2009 and December 31,2008;
(ii) Consolidated Statements of Operations for the Years Ended December 31, 2009, 2008 and2007;
(iii) Consolidated Statements of Stockholders’ Equity for the Years Ended December 31, 2009,2008 and 2007;
(iv) Consolidated Statements of Cash Flows for the Years Ended December 31, 2009, 2008 and2007; and
(v) Notes to Consolidated Financial Statements, tagged as blocks of text.
* A management contract or compensatory plan or arrangement required to be filed as an exhibit pursuant toItem 15(a)(3) of Form 10-K.
† Filed herewith. All other exhibits previously filed.†† Furnished herewith.
71

[THIS PAGE INTENTIONALLY LEFT BLANK]

COGNIZANT TECHNOLOGY SOLUTIONS CORPORATION
INDEX TO CONSOLIDATED FINANCIAL STATEMENTSAND FINANCIAL STATEMENT SCHEDULE
Page
Consolidated Financial Statements:Report of Independent Registered Public Accounting Firm . . . . . . . . . . . . . . . . . . . . . . . . . . . . . . . . . . F-2Consolidated Statements of Financial Position as of December 31, 2009 and 2008 . . . . . . . . . . . . . . . F-3Consolidated Statements of Operations for the years ended December 31, 2009, 2008 and 2007 . . . . . F-4Consolidated Statements of Stockholders’ Equity for the years ended December 31, 2009, 2008 and2007 . . . . . . . . . . . . . . . . . . . . . . . . . . . . . . . . . . . . . . . . . . . . . . . . . . . . . . . . . . . . . . . . . . . . . . . . . . . F-5
Consolidated Statements of Cash Flows for the years ended December 31, 2009, 2008 and 2007 . . . . F-6Notes to Consolidated Financial Statements . . . . . . . . . . . . . . . . . . . . . . . . . . . . . . . . . . . . . . . . . . . . . . F-7
Financial Statement Schedule:Schedule of Valuation and Qualifying Accounts . . . . . . . . . . . . . . . . . . . . . . . . . . . . . . . . . . . . . . . . . . F-30
F-1

Report of Independent Registered Public Accounting Firm
To the Board of Directors and Stockholders of Cognizant Technology Solutions Corporation:
In our opinion, the consolidated financial statements listed in the accompanying index appearing underItem 15(a)(1) present fairly, in all material respects, the financial position of Cognizant Technology SolutionsCorporation (the “Company”) and its subsidiaries at December 31, 2009 and December 31, 2008, and the resultsof their operations and their cash flows for each of the three years in the period ended December 31, 2009 inconformity with accounting principles generally accepted in the United States of America. In addition, in ouropinion, the financial statement schedule listed in the accompanying index presents fairly, in all materialrespects, the information set forth therein when read in conjunction with the related consolidated financialstatements. Also in our opinion, the Company maintained, in all material respects, effective internal control overfinancial reporting as of December 31, 2009, based on criteria established in Internal Control—IntegratedFramework issued by the Committee of Sponsoring Organizations of the Treadway Commission (COSO). TheCompany’s management is responsible for these financial statements and financial statement schedule, formaintaining effective internal control over financial reporting and for its assessment of the effectiveness ofinternal control over financial reporting, included in Management’s Report on Internal Control Over FinancialReporting appearing under Item 9A. Our responsibility is to express opinions on these financial statements, onthe financial statement schedule, and on the Company’s internal control over financial reporting based on ourintegrated audits. We conducted our audits in accordance with the standards of the Public Company AccountingOversight Board (United States). Those standards require that we plan and perform the audits to obtainreasonable assurance about whether the financial statements are free of material misstatement and whethereffective internal control over financial reporting was maintained in all material respects. Our audits of thefinancial statements included examining, on a test basis, evidence supporting the amounts and disclosures in thefinancial statements, assessing the accounting principles used and significant estimates made by management,and evaluating the overall financial statement presentation. Our audit of internal control over financial reportingincluded obtaining an understanding of internal control over financial reporting, assessing the risk that a materialweakness exists, and testing and evaluating the design and operating effectiveness of internal control based onthe assessed risk. Our audits also included performing such other procedures as we considered necessary in thecircumstances. We believe that our audits provide a reasonable basis for our opinions.
As discussed in the Notes to the consolidated financial statements, the Company changed the manner inwhich it accounts for uncertainties in income taxes in 2007 and the manner in which it accounts for businesscombinations in 2009.
A company’s internal control over financial reporting is a process designed to provide reasonable assuranceregarding the reliability of financial reporting and the preparation of financial statements for external purposes inaccordance with generally accepted accounting principles. A company’s internal control over financial reportingincludes those policies and procedures that (i) pertain to the maintenance of records that, in reasonable detail,accurately and fairly reflect the transactions and dispositions of the assets of the company; (ii) provide reasonableassurance that transactions are recorded as necessary to permit preparation of financial statements in accordancewith generally accepted accounting principles, and that receipts and expenditures of the company are being madeonly in accordance with authorizations of management and directors of the company; and (iii) provide reasonableassurance regarding prevention or timely detection of unauthorized acquisition, use, or disposition of thecompany’s assets that could have a material effect on the financial statements.
Because of its inherent limitations, internal control over financial reporting may not prevent or detectmisstatements. Also, projections of any evaluation of effectiveness to future periods are subject to the risk thatcontrols may become inadequate because of changes in conditions, or that the degree of compliance with thepolicies or procedures may deteriorate.
PRICEWATERHOUSECOOPERS LLPNew York, New YorkFebruary 23, 2010
F-2

COGNIZANT TECHNOLOGY SOLUTIONS CORPORATION
CONSOLIDATED STATEMENTS OF FINANCIAL POSITION(in thousands, except par values)
At December 31,
2009 2008
AssetsCurrent assets:
Cash and cash equivalents . . . . . . . . . . . . . . . . . . . . . . . . . . . . . . . . . . . . . . . . . . . . $1,100,930 $ 735,066Short-term investments . . . . . . . . . . . . . . . . . . . . . . . . . . . . . . . . . . . . . . . . . . . . . . 298,402 27,513Trade accounts receivable, net of allowances of $16,465 and $13,441,respectively . . . . . . . . . . . . . . . . . . . . . . . . . . . . . . . . . . . . . . . . . . . . . . . . . . . . . 626,288 517,481
Unbilled accounts receivable . . . . . . . . . . . . . . . . . . . . . . . . . . . . . . . . . . . . . . . . . 82,952 62,158Deferred income tax assets, net . . . . . . . . . . . . . . . . . . . . . . . . . . . . . . . . . . . . . . . . 73,791 48,315Other current assets . . . . . . . . . . . . . . . . . . . . . . . . . . . . . . . . . . . . . . . . . . . . . . . . . 125,205 77,586
Total current assets . . . . . . . . . . . . . . . . . . . . . . . . . . . . . . . . . . . . . . . . . . . . . 2,307,568 1,468,119Property and equipment, net of accumulated depreciation of $274,570 and $199,188,respectively . . . . . . . . . . . . . . . . . . . . . . . . . . . . . . . . . . . . . . . . . . . . . . . . . . . . . . . . . 481,516 455,254
Long-term investments . . . . . . . . . . . . . . . . . . . . . . . . . . . . . . . . . . . . . . . . . . . . . . . . . . 151,131 161,693Goodwill . . . . . . . . . . . . . . . . . . . . . . . . . . . . . . . . . . . . . . . . . . . . . . . . . . . . . . . . . . . . . 192,372 154,035Intangible assets, net . . . . . . . . . . . . . . . . . . . . . . . . . . . . . . . . . . . . . . . . . . . . . . . . . . . . 75,757 47,790Deferred income tax assets, net . . . . . . . . . . . . . . . . . . . . . . . . . . . . . . . . . . . . . . . . . . . . 80,618 52,816Other assets . . . . . . . . . . . . . . . . . . . . . . . . . . . . . . . . . . . . . . . . . . . . . . . . . . . . . . . . . . . 49,278 34,853
Total assets . . . . . . . . . . . . . . . . . . . . . . . . . . . . . . . . . . . . . . . . . . . . . . . . . . . $3,338,240 $2,374,560
Liabilities and Stockholders’ EquityCurrent liabilities:
Accounts payable . . . . . . . . . . . . . . . . . . . . . . . . . . . . . . . . . . . . . . . . . . . . . . . . . . $ 54,640 $ 39,970Deferred revenue . . . . . . . . . . . . . . . . . . . . . . . . . . . . . . . . . . . . . . . . . . . . . . . . . . . 51,605 38,123Accrued expenses and other current liabilities . . . . . . . . . . . . . . . . . . . . . . . . . . . . 540,363 309,484
Total current liabilities . . . . . . . . . . . . . . . . . . . . . . . . . . . . . . . . . . . . . . . . . . 646,608 387,577Deferred income tax liabilities, net . . . . . . . . . . . . . . . . . . . . . . . . . . . . . . . . . . . . . . . . . — 7,294Other noncurrent liabilities . . . . . . . . . . . . . . . . . . . . . . . . . . . . . . . . . . . . . . . . . . . . . . . 38,455 14,111
Total liabilities . . . . . . . . . . . . . . . . . . . . . . . . . . . . . . . . . . . . . . . . . . . . . . . . 685,063 408,982
Commitments and contingencies (See Note 13)
Stockholders’ equity:Preferred stock, $.10 par value, 15,000 shares authorized, none issued . . . . . . . . . . . . . — —Class A common stock, $.01 par value, 500,000 shares authorized, 297,231 and291,670 shares issued and outstanding at December 31, 2009 and 2008,respectively . . . . . . . . . . . . . . . . . . . . . . . . . . . . . . . . . . . . . . . . . . . . . . . . . . . . . . . . . 2,972 2,917
Additional paid-in capital . . . . . . . . . . . . . . . . . . . . . . . . . . . . . . . . . . . . . . . . . . . . . . . . 664,560 541,735Retained earnings . . . . . . . . . . . . . . . . . . . . . . . . . . . . . . . . . . . . . . . . . . . . . . . . . . . . . . 1,965,368 1,430,405Accumulated other comprehensive income (loss) . . . . . . . . . . . . . . . . . . . . . . . . . . . . . 20,277 (9,479)
Total stockholders’ equity . . . . . . . . . . . . . . . . . . . . . . . . . . . . . . . . . . . . . . . . 2,653,177 1,965,578
Total liabilities and stockholders’ equity . . . . . . . . . . . . . . . . . . . . . . . . . . . . $3,338,240 $2,374,560
The accompanying notes are an integral part of the consolidated financial statements.
F-3

COGNIZANT TECHNOLOGY SOLUTIONS CORPORATION
CONSOLIDATED STATEMENTS OF OPERATIONS(in thousands, except per share data)
Year Ended December 31,
2009 2008 2007
Revenues . . . . . . . . . . . . . . . . . . . . . . . . . . . . . . . . . . . . . . . . . . . . . . . . . . $3,278,663 $2,816,304 $2,135,577Operating expenses:Cost of revenues (exclusive of depreciation and amortization expenseshown separately below) . . . . . . . . . . . . . . . . . . . . . . . . . . . . . . . . . . . . 1,849,443 1,572,816 1,206,035
Selling, general and administrative expenses . . . . . . . . . . . . . . . . . . . . . . 721,359 652,021 494,102Depreciation and amortization expense . . . . . . . . . . . . . . . . . . . . . . . . . . 89,371 74,797 53,918
Income from operations . . . . . . . . . . . . . . . . . . . . . . . . . . . . . . . . . . . . . . 618,490 516,670 381,522
Other income (expense), net:Interest income . . . . . . . . . . . . . . . . . . . . . . . . . . . . . . . . . . . . . . . . . 15,895 22,188 29,560Other income (expense), net . . . . . . . . . . . . . . . . . . . . . . . . . . . . . . . 2,566 (23,648) 3,274
Total other income (expense), net . . . . . . . . . . . . . . . . . . . . . . . . . . . . . . . 18,461 (1,460) 32,834
Income before provision for income taxes . . . . . . . . . . . . . . . . . . . . . . . . 636,951 515,210 414,356Provision for income taxes . . . . . . . . . . . . . . . . . . . . . . . . . . . . . . . . . . . . 101,988 84,365 64,223
Net income . . . . . . . . . . . . . . . . . . . . . . . . . . . . . . . . . . . . . . . . . . . . . . . . $ 534,963 $ 430,845 $ 350,133
Basic earnings per share . . . . . . . . . . . . . . . . . . . . . . . . . . . . . . . . . . . . . . $ 1.82 $ 1.49 $ 1.22
Diluted earnings per share . . . . . . . . . . . . . . . . . . . . . . . . . . . . . . . . . . . . . $ 1.78 $ 1.44 $ 1.15
Weighted average number of common shares outstanding—Basic . . . . . 293,304 290,121 288,155Dilutive effect of shares issuable under stock-based compensationplans . . . . . . . . . . . . . . . . . . . . . . . . . . . . . . . . . . . . . . . . . . . . . . . . . . . 7,811 8,819 15,438
Weighted average number of common shares outstanding—Diluted . . . . 301,115 298,940 303,593
The accompanying notes are an integral part of the consolidated financial statements.
F-4

COGNIZANT TECHNOLOGY SOLUTIONS CORPORATION
CONSOLIDATED STATEMENTS OF STOCKHOLDERS’ EQUITY(in thousands)
Class A Common Stock AdditionalPaid-inCapital
RetainedEarnings
Accumulated OtherComprehensiveIncome(Loss) TotalShares Amount
Balance, December 31, 2006 . . . . . . . . 285,026 $2,850 $ 408,594 $ 650,277 $ 11,778 $1,073,499Net income . . . . . . . . . . . . . . . . . . . . . — — — 350,133 — 350,133Foreign currency translationadjustments . . . . . . . . . . . . . . . . . . . — — — — 3,425 3,425
Comprehensive income . . . . . . . . . . . . $ 353,558
Adoption of FIN 48 (See Note 1) . . . . — — — (850) — (850)Common stock issued, stock-basedcompensation plans . . . . . . . . . . . . . 6,374 64 67,039 — — 67,103
Tax benefit, stock-based compensationplans . . . . . . . . . . . . . . . . . . . . . . . . . — — 44,344 — — 44,344
Stock-based compensation expense . . — — 35,916 — — 35,916Repurchases of common stock . . . . . . (3,388) (34) (105,326) — — (105,360)
Balance, December 31, 2007 . . . . . . . . 288,012 2,880 450,567 999,560 15,203 1,468,210Net income . . . . . . . . . . . . . . . . . . . . . — — — 430,845 — 430,845Foreign currency translationadjustments . . . . . . . . . . . . . . . . . . . — — — — (25,258) (25,258)
Change in unrealized gain on cashflow hedges, net of taxes of $22 . . . — — — — 576 576
Comprehensive income . . . . . . . . . . . . $ 406,163
Common stock issued, stock-basedcompensation plans . . . . . . . . . . . . . 4,575 46 54,830 — — 54,876
Tax benefit, stock-based compensationplans . . . . . . . . . . . . . . . . . . . . . . . . . — — 18,058 — — 18,058
Stock-based compensation expense . . — — 43,900 — — 43,900Repurchases of common stock andother . . . . . . . . . . . . . . . . . . . . . . . . . (979) (10) (27,825) — — (27,835)
Acquisition (See Note 2) . . . . . . . . . . . 62 1 2,205 — — 2,206
Balance, December 31, 2008 . . . . . . . . 291,670 2,917 541,735 1,430,405 (9,479) 1,965,578Net income . . . . . . . . . . . . . . . . . . . . . — — — 534,963 — 534,963Foreign currency translationadjustments . . . . . . . . . . . . . . . . . . . — — — — 11,922 11,922
Change in unrealized gain on cashflow hedges, net of taxes of $550 . . — — — — 17,834 17,834
Comprehensive income . . . . . . . . . . . . $ 564,719
Common stock issued, stock-basedcompensation plans . . . . . . . . . . . . . 6,326 63 61,588 — — 61,651
Tax benefit, stock-based compensationplans . . . . . . . . . . . . . . . . . . . . . . . . . — — 32,672 — — 32,672
Stock-based compensation expense . . — — 44,816 — — 44,816Repurchases of common stock . . . . . . (765) (8) (16,251) — — (16,259)
Balance, December 31, 2009 . . . . . . . . 297,231 $2,972 $ 664,560 $1,965,368 $ 20,277 $2,653,177
The accompanying notes are an integral part of the consolidated financial statements.
F-5

COGNIZANT TECHNOLOGY SOLUTIONS CORPORATION
CONSOLIDATED STATEMENTS OF CASH FLOWS(in thousands)
Year Ended December 31,
2009 2008 2007
Cash flows from operating activities:Net income . . . . . . . . . . . . . . . . . . . . . . . . . . . . . . . . . . . . . . . . . . . . . . . . . $ 534,963 $ 430,845 $ 350,133Adjustments to reconcile net income to net cash provided by operatingactivities:
Depreciation and amortization . . . . . . . . . . . . . . . . . . . . . . . . . . 89,371 74,797 53,918Provision for doubtful accounts . . . . . . . . . . . . . . . . . . . . . . . . . 3,347 8,473 3,560Deferred income taxes . . . . . . . . . . . . . . . . . . . . . . . . . . . . . . . . (26,589) (5,028) 25,061Stock-based compensation expense . . . . . . . . . . . . . . . . . . . . . . 44,816 43,900 35,916Excess tax benefit on stock-based compensation plans . . . . . . . (31,556) (16,993) (42,265)Other . . . . . . . . . . . . . . . . . . . . . . . . . . . . . . . . . . . . . . . . . . . . . . (6,101) 2,587 —
Changes in assets and liabilities:Trade accounts receivable . . . . . . . . . . . . . . . . . . . . . . . . . . . . . . (98,451) (168,395) (119,882)Other current assets . . . . . . . . . . . . . . . . . . . . . . . . . . . . . . . . . . . (42,778) (31,151) (34,232)Other assets . . . . . . . . . . . . . . . . . . . . . . . . . . . . . . . . . . . . . . . . . (9,255) (9,976) (15,780)Accounts payable . . . . . . . . . . . . . . . . . . . . . . . . . . . . . . . . . . . . 6,675 19,283 10,554Other current and noncurrent liabilities . . . . . . . . . . . . . . . . . . . 207,883 81,363 77,337
Net cash provided by operating activities . . . . . . . . . . . . . . . . . . . . . . 672,325 429,705 344,320
Cash flows used in investing activities:Purchases of property and equipment . . . . . . . . . . . . . . . . . . . . . . . . . . . . . (76,639) (169,410) (182,467)Purchases of investments . . . . . . . . . . . . . . . . . . . . . . . . . . . . . . . . . . . . . . (348,209) (135,200) (968,669)Proceeds from maturity or sale of investments . . . . . . . . . . . . . . . . . . . . . . 98,697 270,560 1,020,617Acquisitions, net of cash acquired . . . . . . . . . . . . . . . . . . . . . . . . . . . . . . . (68,613) (20,956) (146,820)
Net cash used in investing activities . . . . . . . . . . . . . . . . . . . . . . . . . . . . . . (394,764) (55,006) (277,339)
Cash flows from financing activities:Issuance of common stock under stock-based compensation plans . . . . . . 61,651 54,876 67,103Excess tax benefit on stock-based compensation plans . . . . . . . . . . . . . . . 31,556 16,993 42,265Repurchases of common stock . . . . . . . . . . . . . . . . . . . . . . . . . . . . . . . . . . (16,259) (27,835) (105,360)
Net cash provided by financing activities . . . . . . . . . . . . . . . . . . . . . . . . . . 76,948 44,034 4,008
Effect of currency translation on cash and cash equivalents . . . . . . . . . . . 11,355 (23,512) 2,919
Increase in cash and cash equivalents . . . . . . . . . . . . . . . . . . . . . . . . . . . . . 365,864 395,221 73,908Cash and cash equivalents, at beginning of year . . . . . . . . . . . . . . . . . . . . 735,066 339,845 265,937
Cash and cash equivalents, at end of year . . . . . . . . . . . . . . . . . . . . . . . . . $1,100,930 $ 735,066 $ 339,845
Supplemental information:Cash paid for income taxes during the year . . . . . . . . . . . . . . . . . . . . $ 120,544 $ 82,802 $ 43,256
The accompanying notes are an integral part of the consolidated financial statements.
F-6

Notes to Consolidated Financial Statements(Dollars in thousands, except share data)
1. Summary of Significant Accounting Policies
The terms “Cognizant,” “we,” “our,” “us” and the “Company” refer to Cognizant Technology SolutionsCorporation and its subsidiaries unless the context indicates otherwise.
Description of Business. Cognizant is a leading provider of custom Information Technology (“IT”)consulting and technology services and outsourcing services. Our customers are primarily Global 2000 Businesscompanies located in North America, Europe and Asia. Our core competencies include Technology StrategyConsulting, Complex Systems Development, Enterprise Software Package Implementation and Maintenance,Data Warehousing and Business Intelligence, Application Testing, Application Maintenance, InfrastructureManagement and Business and Knowledge Process Outsourcing. We tailor our services to specific industries,and utilize an integrated global delivery model. This seamless global delivery model combines technical andaccount management teams located on-site at the customer location and at dedicated near-shore and offshoredevelopment and delivery centers located primarily in India, China, the United States, Argentina, Hungary andthe Philippines.
Basis of Presentation and Principles of Consolidation. The consolidated financial statements are presentedin accordance with generally accepted accounting principles in the United States of America (“US GAAP”) andreflect the consolidated financial position, results of operations and cash flows and our consolidated subsidiariesfor all periods presented. All intercompany balances and transactions have been eliminated in consolidation.
Cash and Cash Equivalents. Cash and cash equivalents consist of all cash balances, including money marketfunds and liquid instruments with an original maturity of three months or less. Cash and cash equivalentsincluded time deposits of $11 at December 31, 2008.
Investments. All liquid investments with an original maturity greater than three months but less than oneyear are considered to be short-term investments. Investments with an original maturity greater than one year areconsidered to be long-term investments. Time deposits with financial institutions are valued at cost, whichapproximates fair value. Available-for-sale securities are reported at fair value with changes in unrealized gainsand losses recorded as a separate component of accumulated other comprehensive income (loss) until realized.Trading securities are reported at fair value with any unrealized gains or losses related to the changes in fairvalue recorded in income or loss. Interest and amortization of premiums and discounts for debt securities areincluded in interest income. We also evaluate our available-for-sale investments periodically for possible other-than-temporary impairment by reviewing factors such as the length of time and extent to which fair value hasbeen below cost basis, the financial condition of the issuer and our ability and intent to hold the investment for aperiod of time which may be sufficient for anticipated recovery of market value. An impairment charge would berecorded to the extent that the carrying value of the available-for-sale securities exceeds the fair market value ofthe securities and the decline in value is determined to be other-than-temporary.
Allowance for Doubtful Accounts. We maintain an allowance for doubtful accounts for estimated lossesresulting from the inability of our customers to make required payments. The allowance for doubtful accounts isdetermined by evaluating the relative credit-worthiness of each customer, historical collections experience andother information, including the aging of the receivables.
Unbilled Accounts Receivable. Unbilled accounts receivable represent revenues on contracts to be billed, insubsequent periods, as per the terms of the related contracts.
Short-term Financial Assets and Liabilities. Cash and cash equivalents, trade receivables, accounts payableand other accrued liabilities are short-term in nature and, accordingly, their carrying values approximate fairvalue.
F-7

Property and Equipment. Property and equipment are stated at cost, net of accumulated depreciation.Depreciation is calculated on the straight-line basis over the estimated useful lives of the assets. Leaseholdimprovements are amortized on a straight-line basis over the shorter of the term of the lease or the estimateduseful life of the improvement. Maintenance and repairs are expensed as incurred, while renewals andbetterments are capitalized. Deposits paid towards acquisition of long-lived assets and the cost of assets not putin use before the balance sheet date are disclosed under the caption “capital work-in-progress” in Note 4.
Internal Use Software. Costs for software developed or obtained for internal use are capitalized, includingthe salaries and benefits of employees that are directly involved in the installation of such software. Thecapitalized costs are amortized on a straight-line basis over the lesser of three years or the software’s useful life.Costs associated with preliminary project stage activities, training, maintenance and all other post-implementation stage activities are expensed as incurred.
Goodwill. We allocate the cost of an acquired entity to the assets acquired and liabilities assumed based ontheir estimated fair values including goodwill and identifiable intangible assets. We do not amortize goodwill,but instead test goodwill at the reporting unit level for impairment at least annually or as circumstances warrant.If an impairment is indicated, a write-down to fair value (normally measured by discounting estimated futurecash flows) is recorded. We do not have any indefinite-lived intangible assets.
Long-Lived Assets, including Finite-lived Intangible Assets. We review long-lived assets and finite-livedintangibles for impairment whenever events or changes in circumstances indicate that the carrying amount of anasset may not be recoverable. In general, we will recognize an impairment loss when the sum of undiscountedexpected future cash flows is less than the carrying amount of such assets. The impairment loss would equal theamount by which the carrying amount of the asset exceeds the fair value of the asset. Other intangibles representprimarily customer relationships and developed technology, which are being amortized on a straight-line basisover their estimated useful lives.
Stock Repurchase Program. Under a stock repurchase program which expired in December 2009, we wereauthorized to repurchase up to $50,000, excluding fees and expenses, of our Class A common stock. Wecompleted stock repurchases of 650,000 shares for $12,439, inclusive of fees and expenses under this program.Additional stock repurchases were made in connection with our stock-based compensation plans, wherebyCompany shares were tendered by employees for payment of exercise price or applicable statutory taxwithholdings. During 2009, such repurchases totaled 114,642 shares at an aggregate cost of $3,820. At the timeof repurchase, shares are returned to the status of authorized and unissued shares. We account for the repurchasesas constructively retired and record such repurchases as a reduction of Class A common stock and additionalpaid-in capital.
Revenue Recognition. Our contracts are entered into on either a time-and-materials or fixed-price basis.Revenues related to time-and-material contracts are recognized as the service is performed. Revenues related tofixed-price contracts that provide for highly complex information technology application development servicesare recognized as the service is performed using the percentage of completion method of accounting, underwhich the total value of revenue is recognized on the basis of the percentage that each contract’s total labor costto date bears to the total expected labor costs (cost to cost method). Revenues related to fixed-price contracts thatprovide solely for application maintenance services are recognized on a straight-line basis unless revenues areearned and obligations are fulfilled in a different pattern. Revenues related to fixed-price contracts that do notprovide for highly complex information technology development services are recognized as services areperformed on a proportional performance basis based upon the level of effort. Expenses are recorded as incurredover the contract period.
Revenues related to business process outsourcing, or BPO, contracts entered into on a time-and-materialbasis are recognized as the services are performed. Revenues from fixed-price BPO contracts are recognized on astraight-line basis, unless revenues are earned and obligations are fulfilled in a different pattern. Revenues from
F-8

transaction-priced contracts are recognized as transactions are processed. Amounts billable for transition orset-up activities are deferred and recognized as revenue evenly over the period services are provided. Costsrelated to delivering BPO services are expensed as incurred with the exception of certain transition costs relatedto the set-up of processes, personnel and systems, which are deferred during the transition period and expensedevenly over the period of service. The deferred costs are specific internal costs or external costs directly relatedto transition or set-up activities necessary to enable the BPO services. Generally, deferred amounts are protectedin the event of early termination of the contract and are monitored regularly for impairment. Impairment lossesare recorded when projected undiscounted operating cash flows of the related contract are not sufficient torecover the carrying amount of the deferred assets. Deferred transition revenues and costs as of December 31,2009 and 2008, respectively, were immaterial.
Contingent or incentive revenues are recognized when the contingency is satisfied and we conclude theamounts are earned. Volume discounts, if any, are recorded as a reduction of revenue over the contract period asservices are provided.
For contracts with multiple deliverables, we evaluate at the inception of each new contract all deliverablesin an arrangement to determine whether they represent separate units of accounting. For arrangements withmultiple units of accounting, primarily fixed-price contracts that provide both application maintenance andapplication development services and certain application maintenance contracts, arrangement consideration isallocated among the units of accounting, where separable, based on their relative fair values and revenue isrecognized for each unit of accounting based on our revenue recognition policy described above.
Fixed-price contracts are cancelable subject to a specified notice period. All services provided by us throughthe date of cancellation are due and payable under the contract terms. We issue invoices related to fixed-pricecontracts based upon achievement of milestones during a project or other contractual terms. Differences betweenthe timing of billings, based upon contract milestones or other contractual terms, and the recognition of revenueare recognized as either unbilled receivables or deferred revenue. Estimates of certain fixed-price contracts aresubject to adjustment as a project progresses to reflect changes in expected completion costs. The cumulativeimpact of any revision in estimates is reflected in the financial reporting period in which the change in estimatebecomes known and any anticipated losses on contracts are recognized immediately. Warranty provisionsgenerally exist under such contracts for a period of up to ninety days past contract completion and costs related tosuch provisions are accrued at the time the related revenues are recorded.
For all services, revenue is earned when, and if, evidence of an arrangement is obtained and the othercriteria to support revenue recognition are met, including the price is fixed or determinable, services have beenrendered and collectability is reasonably assured. Revenues related to services performed without a signedagreement or work order are not recognized until there is evidence of an arrangement, such as when agreementsor work orders are signed or payment is received; however, the cost related to the performance of such work isrecognized in the period the services are rendered.
We account for reimbursement of out-of-pocket expenses as revenues. Subcontractor costs are included incost of services as they are incurred.
Stock-Based Compensation. Stock-based compensation expense for awards of equity instruments toemployees and non-employee directors is determined based on the grant-date fair value of those awards. Werecognize these compensation costs net of an estimated forfeiture rate over the requisite service period of theaward. Forfeitures are estimated on the date of grant and revised if actual or expected forfeiture activity differsmaterially from original estimates.
Foreign Currency. The assets and liabilities of our foreign subsidiaries whose functional currency is not theU.S. dollar are translated into U.S. dollars from local currencies at current exchange rates and revenues andexpenses are translated from local currencies at average monthly exchange rates. The resulting translationadjustments are recorded in accumulated other comprehensive income (loss) on the accompanying consolidatedstatements of financial position. The U.S. dollar is the functional currency for certain foreign subsidiaries who
F-9

conduct business predominantly in U.S. dollars. For these foreign subsidiaries, non-monetary assets andliabilities are remeasured at historical exchange rates, while monetary assets and liabilities are remeasured atcurrent exchange rates. Foreign currency exchange gains or losses from remeasurement are included in income.Net foreign currency exchange gains (losses), which are included in our results of operations, totaled $1,672,$(22,818), and $3,216 for the years ended December 31, 2009, 2008 and 2007, respectively.
Derivative Financial Instruments. Derivative financial instruments are accounted for in accordance with theauthoritative guidance which requires that each derivative instrument be recorded on the balance sheet as eitheran asset or liability measured at its fair value as of the reporting date. Our derivative financial instruments consistof foreign exchange forward contracts. For derivative financial instruments to qualify for hedge accounting, thefollowing criteria must be met: (1) the hedging instrument must be designated as a hedge; (2) the hedgedexposure must be specifically identifiable and expose us to risk; and (3) it is expected that a change in fair valueof the derivative financial instrument and an opposite change in the fair value of the hedged exposure will have ahigh degree of correlation. The authoritative guidance also requires that changes in our derivatives’ fair values berecognized in income unless specific hedge accounting and documentation criteria are met (i.e., the instrumentsare accounted for as hedges). For items which hedge accounting is applied, we record the effective portion of ourderivative financial instruments that are designated as cash flow hedges in accumulated other comprehensiveincome (loss) in the accompanying consolidated statements of financial position. Any ineffectiveness or excludedportion of a designated cash flow hedge is recognized in income.
Use of Estimates. The preparation of financial statements requires management to make estimates andassumptions that affect the reported amounts of assets and liabilities, including the recoverability of tangible andintangible assets, disclosure of contingent assets and liabilities as of the date of the financial statements, and thereported amounts of revenues and expenses during the reported period. On an on-going basis, managementreevaluates these estimates. The most significant estimates relate to the recognition of revenue and profits basedon the percentage of completion method of accounting for certain fixed-bid contracts, the allowance for doubtfulaccounts, income taxes and related deferred income tax assets and liabilities, valuation of investments, goodwilland other long-lived assets, assumptions used in determining the fair value of stock-based compensation awards,the effectiveness of derivative financial instruments designated as a hedge, contingencies and litigation.Management bases its estimates on historical experience and on various other assumptions that are believed to bereasonable under the circumstances. The actual amounts may vary from the estimates used in the preparation ofthe accompanying consolidated financial statements.
Risks and Uncertainties. Principally, all of our development and delivery centers, including a majority ofour employees are located in India. As a result, we may be subject to certain risks associated with internationaloperations, including risks associated with foreign currency exchange rate fluctuations and risks associated withthe application and imposition of protective legislation and regulations relating to import and export or otherwiseresulting from foreign policy or the variability of foreign economic or political conditions. Additional risksassociated with international operations include difficulties in enforcing intellectual property rights, the burdensof complying with a wide variety of foreign laws, potential geo-political and other risks associated with terroristactivities and local or cross border conflicts and potentially adverse tax consequences, tariffs, quotas and otherbarriers.
Concentration of Credit Risk. Financial instruments that potentially subject us to significant concentrationsof credit risk consist primarily of cash and cash equivalents, time deposits, investments in securities, derivativefinancial instruments and trade accounts receivable. We maintain our cash and cash equivalents and investmentswith high credit quality financial institutions, invest in investment-grade debt securities and limit the amount ofcredit exposure to any one commercial issuer. Trade accounts receivable is dispersed across many customersoperating in different industries; therefore, concentration of credit risk is limited.
Income Taxes. We provide for income taxes utilizing the asset and liability method of accounting forincome taxes. Under this method, deferred income taxes are recorded to reflect the tax consequences in futureyears of differences between the tax basis of assets and liabilities and their financial reporting amounts at each
F-10

balance sheet date, based on enacted tax laws and statutory tax rates applicable to the periods in which thedifferences are expected to affect taxable income. If it is determined that it is more likely than not that future taxbenefits associated with a deferred income tax asset will not be realized, a valuation allowance is provided. Theeffect on deferred income tax assets and liabilities of a change in the tax rates is recognized in income in theperiod that includes the enactment date. Tax benefits earned on exercise of employee stock options in excess ofcompensation charged to income are credited to additional paid-in capital.
On January 1, 2007, we adopted the authoritative guidance which clarifies the accounting for uncertainty inincome taxes by prescribing a minimum recognition threshold for a tax position taken or expected to be taken ina tax return that is required to be met before being recognized in the financial statements. The authoritativeguidance also provides guidance on derecognition, measurement, classification, interest and penalties, accountingin interim periods, disclosure and transition. The cumulative effect of adopting the authoritative guidance of $850was recorded as a reduction of beginning retained earnings in 2007.
Earnings Per Share (“EPS”). Basic EPS excludes dilution and is computed by dividing earnings availableto common stockholders by the weighted-average number of common shares outstanding for the period. DilutedEPS includes all potential dilutive common stock in the weighted average shares outstanding. For purposes ofcomputing diluted earnings per share for the years ended December 31, 2009, 2008 and 2007, respectively,7,811,000, 8,819,000, and 15,438,000 shares were assumed to have been outstanding related to common shareequivalents. We exclude options with exercise prices that are greater than the average market price from thecalculation of diluted EPS because their effect would be anti-dilutive. We excluded 3,839,000 shares in 2009,5,397,000 shares in 2008 and 892,000 shares in 2007, from our diluted EPS calculation. Also, in accordance withthe authoritative guidance, we excluded from the calculation of diluted EPS options to purchase an additional228,000 shares in 2009, 248,000 shares in 2008 and 333,000 shares in 2007, whose combined exercise price,unamortized fair value and excess tax benefits were greater in each of those periods than the average marketprice of our common stock because their effect would be anti-dilutive. We include performance stock unitawards in the dilutive potential common shares when they become contingently issuable per the authoritativeguidance and exclude the awards when they are not contingently issuable.
Subsequent Events. We have evaluated subsequent events that have occurred after the balance sheet date butbefore the financial statements were available to be issued, which the Company considers to be the date of filingwith the Securities and Exchange Commission, and have concluded that no events or transactions have occurredthat would require adjustment to, or disclosure in, our financial statements.
Accounting Changes and New Accounting Standards.
In 2006, the Financial Accounting Standards Board (FASB) issued authoritative guidance which defines fairvalue, establishes a market-based framework or hierarchy for measuring fair value and expands disclosures aboutfair value measurements. It is appropriate to apply fair value measurements whenever other sections of theauthoritative guidance requires or permits assets and liabilities to be measured at fair value. This authoritativeguidance does not expand or require any new fair value measures, however the application of this guidance maychange current practice. We adopted this authoritative guidance for financial assets and liabilities effectiveJanuary 1, 2008 and for non-financial assets and liabilities effective January 1, 2009. The adoption of thisauthoritative guidance, which primarily affected the valuation of our investments and derivative contracts, didnot have a material effect on our financial condition or results of operations.
In April 2009, the FASB issued several amendments to the accounting and disclosure requirementsregarding fair value measurements and impairments of securities. These amendments are intended to provideguidance to:
• Determine fair values when there is no active market or where the price inputs being used representdistressed sales. It reaffirms the need to use judgment to ascertain if a formerly active market hasbecome inactive and in determining fair values when markets have become inactive.
F-11

• Bring consistency to the timing of impairment recognition, and provide improved disclosures about thecredit and noncredit components of impaired debt securities that are not expected to be sold. Themeasure of impairment in comprehensive income remains fair value. The amendment also requiresincreased and timelier disclosures regarding expected cash flows, credit losses, and an aging ofsecurities with unrealized losses.
• Disclose financial instruments that are not currently reflected on the balance sheet at fair value. Prior toissuing this amendment, fair values for these assets and liabilities were only disclosed once a year. Theamendment now requires these disclosures on a quarterly basis, providing qualitative and quantitativeinformation about fair value estimates for all those financial instruments not measured on the balancesheet at fair value.
We elected to early adopt these amendments effective March 31, 2009. The adoption of these amendmentsdid not have a material effect on our financial condition or results of operations.
In December 2007, the FASB revised the authoritative guidance for business combinations whichestablishes principles and requirements for how the acquiring entity in a business combination recognizes the fullfair value of assets acquired and liabilities assumed in the transaction (whether a full or partial acquisition);establishes the acquisition-date fair value as the measurement objective for all assets acquired and liabilitiesassumed; requires expensing of transaction and restructuring costs; and requires the acquirer to disclose theinformation needed to evaluate and understand the nature and financial effect of the business combination.Effective January 1, 2009, we adopted this revised guidance, which applies prospectively to businesscombinations for which the acquisition date is on or after January 1, 2009. The adoption of this revised guidancedid not have a significant impact on our results of operations or financial condition; however, the impact of thisrevised guidance on our future consolidated financial statements will depend upon the nature, terms and size ofthe acquisitions we consummate in the future.
In March 2008, the FASB issued authoritative guidance which applies to all derivative instruments andrelated hedged items accounted for as hedges. This guidance requires entities to provide greater transparencyabout how and why an entity uses derivative instruments, how derivative instruments and related hedged itemsare accounted for under this guidance and its related interpretations, and how derivative instruments and relatedhedged items affect an entity’s financial position, results of operations and cash flows. Effective January 1, 2009,we adopted this guidance and have presented the required information in Note 11.
In May 2009, the FASB issued authoritative guidance establishing principles and requirements forrecognition and disclosure of subsequent events in the financial statements. Our adoption of this guidance onJune 30, 2009 did not have a material effect on our financial condition or consolidated results of operations.
In June 2009, the FASB issued a new accounting standard which changes the consolidation rules as theyrelate to variable interest entities. Specifically, the new standard makes significant changes to the model fordetermining who should consolidate a variable interest entity, and also addresses how often this assessmentshould be performed. This guidance is effective for fiscal years beginning after November 15, 2009. Theadoption of this standard will not have a material effect on our financial condition or consolidated results ofoperations.
In June 2009, the FASB issued authoritative guidance, “The FASB Accounting Standards Codification andHierarchy of Generally Accepted Accounting Principles—a replacement of FASB Statement No. 162” (the“Codification”). The Codification does not alter current U.S. GAAP, but rather integrates existing accountingstandards with other authoritative guidance. Under the Codification, there is a single source of authoritative U.S.GAAP for nongovernmental entities and it supersedes all other previously issued non-SEC accounting andreporting guidance. The Codification is effective for financial statement periods ending after September 15,2009. Our adoption of the Codification on July 1, 2009 did not have a material effect on our financial conditionor consolidated results of operations.
F-12

In October 2009, the FASB issued a new accounting standard which provides guidance for arrangements withmultiple deliverables. Specifically, the new standard requires an entity to allocate consideration at the inception ofan arrangement to all of its deliverables based on their relative selling prices. In the absence of the vendor-specificobjective evidence or third-party evidence of the selling prices, consideration must be allocated to the deliverablesbased on management’s best estimate of the selling prices. In addition, the new standard eliminates the use of theresidual method of allocation. In October 2009, the FASB also issued a new accounting standard which changesrevenue recognition for tangible products containing software and hardware elements. Specifically, tangibleproducts containing software and hardware that function together to deliver the tangible products’ essentialfunctionality are scoped out of the existing software revenue recognition guidance and will be accounted for underthe multiple-element arrangements revenue recognition guidance discussed above. Both standards will be effectivefor us in the first quarter of 2011. Early adoption is permitted. The adoption of this standard will not have a materialeffect on our financial condition or consolidated results of operations.
2. Acquisitions
During 2009, we completed four acquisitions for an aggregate consideration of approximately $97,300 (netof cash acquired). We have allocated the purchase price for these acquisitions to tangible and intangible assetsand liabilities based upon their fair values, including approximately $2,200 to tax deductible goodwill, $36,600to non-deductible goodwill and $37,300 to intangible assets. The intangible assets are being amortized over aweighted average life of 6.3 years.
In December 2009, we acquired the stock of UBS India Service Centre Private Limited (“UBS ISC”) forcash consideration of approximately $62,800, net of acquired cash. As part of this transaction, we acquired multi-year service agreements, an assembled workforce, land, equipment and other assets. The acquisition expands ourbusiness and knowledge process outsourcing capabilities in the financial services industry. In the third quarter of2009, we entered into a transaction with Invensys pursuant to which we acquired a multi-year service agreement,an assembled workforce and certain other assets. Under the current authoritative business combinationguidelines, this transaction qualified as business combination. This transaction, with no initial cash consideration,expands our business process outsourcing expertise within engineering services. The remaining two acquisitionswere completed to strengthen our retail and infrastructure management capabilities.
During 2008, we completed two acquisitions, which were completed in March and June of 2008. Theacquisitions strengthen our IT consulting practice in the media and entertainment industry and service deliverycapabilities in India. The initial consideration paid in cash and stock was approximately $24,000 (net of cashacquired and including direct transaction costs). The stock consideration consisted of 62,340 shares of Class Acommon stock valued at $2,206. Additional purchase price, not to exceed $14,000, payable in cash, is contingentupon one of the acquired companies achieving certain financial and operating targets during an earn-out periodand will be recorded when the contingency is resolved. We made an allocation of the purchase price to thetangible and intangible assets and liabilities acquired, including approximately $7,400 to tax deductible goodwill,$1,500 to non-tax deductible goodwill and $7,260 to intangible assets. The intangible assets are being amortizedover a weighted average life of 10 years.
In November 2007, we acquired marketRx, Inc. (“marketRx”), a U.S.-based leading provider of dataanalytics and process outsourcing to global life sciences companies in the pharmaceutical, biotechnology andmedical devices segments for net cash consideration of approximately $136,000 (net of cash acquired andincluding direct transaction costs). In addition, the purchase price also included the estimated fair value ofunvested stock options assumed by us. We completed this acquisition to strengthen our life sciences industryexpertise as well as our data analytics capabilities in order to leverage such capabilities across multipleindustries. We made an allocation of the purchase price to the tangible and intangible assets and liabilitiesacquired based on their fair values, including approximately $103,000 to non-tax deductible goodwill and$35,500 of intangible assets, principally customer relationships and developed technology. The intangible assetsare being amortized over a weighted average life of 8.7 years.
F-13

The acquisitions in 2009, 2008 and 2007 were included in our consolidated financial statements as of the datewhich they were acquired and were not material to our operations, financial position or cash flows. For additionaldetails of our goodwill and intangible assets see Note 5.
3. Investments
Investments as of December 31, 2009 and 2008 were as follows:
2009 2008
Available-for-sale-securities:Agency discount notes . . . . . . . . . . . . . . . . . . . . . . . . . . . . . . . . . . . . . . . . . . $ 160 $ 7,008Other . . . . . . . . . . . . . . . . . . . . . . . . . . . . . . . . . . . . . . . . . . . . . . . . . . . . . . . . 2 1,149
Total available-for-sale-securities . . . . . . . . . . . . . . . . . . . . . . . . . . . . . . . . . . . . . 162 8,157Trading securities—auction-rate securities . . . . . . . . . . . . . . . . . . . . . . . . . . . . . . 129,103 139,398UBS Right . . . . . . . . . . . . . . . . . . . . . . . . . . . . . . . . . . . . . . . . . . . . . . . . . . . . . . . 22,028 28,158Time deposits . . . . . . . . . . . . . . . . . . . . . . . . . . . . . . . . . . . . . . . . . . . . . . . . . . . . . 298,240 13,493
Total investments . . . . . . . . . . . . . . . . . . . . . . . . . . . . . . . . . . . . . . . . . . . . . . . . . . $449,533 $189,206
The carrying value of the time deposits approximated fair value as of December 31, 2009 and 2008. Grossrealized gains or losses on the sale of available-for-sale securities were immaterial for the three years endedDecember 31, 2009. As of December 31, 2009 and 2008, available-for-sale securities in an unrealized loss or gainposition were immaterial. All available-for-sale-securities at December 31, 2009 contractually mature in 2010.
Our investment in auction-rate securities is recorded at fair value and consists of AAA/A3-rated municipalbonds with an auction reset feature whose underlying assets are generally student loans, which are substantiallybacked by the Federal Family Education Loan Program (“FFELP”). Since February 2008, auctions for thesesecurities have failed. The auction failures do not affect the value of the collateral underlying the auction-ratesecurities, and the Company continues to earn and receive interest on its auction-rate securities at a pre-determinedformula with spreads tied to particular interest rate indices. As of December 31, 2009, our investment in auction-ratesecurities was classified as a long-term investment. The classification of the auction-rate securities as long-terminvestments is due to continuing auction failures, the securities’ stated maturity of greater than one year and theCompany’s ability and intent to hold such securities beyond one year. The auction-rate securities mature as follows:$10,239 in 2012; and $118,864 after 2021.
In November 2008, we accepted an offer from UBS AG (“UBS”) to sell to UBS, at par value ($151,275 atDecember 31, 2009), our auction-rate securities at any time during an exercise period from June 30, 2010 to July 2,2012 (the “UBS Right”). In accepting the UBS Right, we granted UBS the authority to purchase these auction-ratesecurities or sell them on our behalf at par value anytime after the execution of the UBS Right through July 2, 2012.The offer is non-transferable. In 2008, we elected to measure the UBS Right under the fair value option as permittedunder the authoritative accounting pronouncement and recorded pre-tax income of $28,158, and a correspondinglong-term investment. At the same time, we transferred our investment in auction-rate securities fromavailable-for-sale securities to trading securities. As a result of this transfer, we recognized a pre-tax loss in ourconsolidated statement of operations of $29,127 reflecting the reversal of the unrealized loss previously recorded inaccumulated other comprehensive income (loss). In 2008, these transactions were recorded in the caption “otherincome (expense), net” in our accompanying consolidated statements of operations.
At December 31, 2009 and 2008, we estimated the fair value of the UBS Right at $22,028 and $28,158,respectively. During 2009 and 2008, redemptions of auction-rate securities, all at par value, totaled $17,250 and$7,800, respectively.
F-14

4. Property and Equipment, net
Property and equipment as of December 31, 2009 and 2008 were as follows:
Estimated Useful Life (Years) 2009 2008
Buildings . . . . . . . . . . . . . . . . . . . . . . . 30 $ 230,418 $ 159,069Computer equipment and purchasedsoftware . . . . . . . . . . . . . . . . . . . . . 3 195,646 167,234
Furniture and equipment . . . . . . . . . . . 5 – 9 131,368 91,587Land . . . . . . . . . . . . . . . . . . . . . . . . . . 16,042 12,866Leasehold land . . . . . . . . . . . . . . . . . . 16,930 16,930Capital work-in-progress . . . . . . . . . . 70,639 128,566Leasehold improvements . . . . . . . . . . Shorter of the lease term or the life of leased asset 95,043 78,190
Sub-total . . . . . . . . . . . . . . . . . . . 756,086 654,442Accumulated depreciation andamortization . . . . . . . . . . . . . . . . . . (274,570) (199,188)
Property and equipment, net . . . . . . . . $ 481,516 $ 455,254
Depreciation and amortization expense related to property and equipment was $79,126, $66,681and $50,337for the years ended December 31, 2009, 2008 and 2007, respectively.
In India, leasehold land is leased by us from the government of India with lease terms ranging from 90 to 99years. Lease payments are made at the inception of the lease agreement and amortized over the lease term.Amortization expense of leasehold land is immaterial for the periods presented and is included in depreciationand amortization expense in our accompanying consolidated statements of operations.
5. Goodwill and Intangible Assets, net
Changes in goodwill for the years ended December 31, 2009 and 2008 are as follows:
2009 2008
Balance, beginning of year . . . . . . . . . . . . . . . . . . . . . . . . . . . . . . . . . . . . . . . . $154,035 $148,789Acquisitions and adjustments . . . . . . . . . . . . . . . . . . . . . . . . . . . . . . . . . . . . . . 38,067 5,634Cumulative translation adjustments . . . . . . . . . . . . . . . . . . . . . . . . . . . . . . . . . 270 (388)
Balance, end of year . . . . . . . . . . . . . . . . . . . . . . . . . . . . . . . . . . . . . . . . . . . . . $192,372 $154,035
In 2009, the increase in goodwill was primarily related to the 2009 acquisitions. In 2008, the increase ingoodwill was related primarily to the acquisitions completed during the year net of adjustments of approximately$3,300 related to the final allocation of purchase price for the marketRx acquisition and the reduction of avaluation allowance initially established against deferred income tax assets recorded for acquired net operatinglosses related to an earlier acquisition. No impairment losses were recognized during the three years endedDecember 31, 2009.
Goodwill has been allocated to our reportable segments as follows:
2009 2008
Financial Services . . . . . . . . . . . . . . . . . . . . . . . . . . . . . . . . . . . . . . . . . . . . . . . $ 72,577 $ 43,165Healthcare . . . . . . . . . . . . . . . . . . . . . . . . . . . . . . . . . . . . . . . . . . . . . . . . . . . . . 65,097 64,736Manufacturing/Retail/Logistics . . . . . . . . . . . . . . . . . . . . . . . . . . . . . . . . . . . . . 21,048 12,670Other . . . . . . . . . . . . . . . . . . . . . . . . . . . . . . . . . . . . . . . . . . . . . . . . . . . . . . . . . 33,650 33,464
Total goodwill . . . . . . . . . . . . . . . . . . . . . . . . . . . . . . . . . . . . . . . . . . . . . . . . . . $192,372 $154,035
F-15

Components of intangible assets as of December 31, 2009 and 2008 were as follows:
2009 2008Weighted
Average Life
Customer relationships . . . . . . . . . . . . . . . . . . . . . . . . . . . . . . . $ 94,489 $ 58,470 8.6 yearsDeveloped technology . . . . . . . . . . . . . . . . . . . . . . . . . . . . . . . . 7,206 5,686 4.5 yearsOther . . . . . . . . . . . . . . . . . . . . . . . . . . . . . . . . . . . . . . . . . . . . . 3,797 3,045 3.9 years
105,492 67,201Accumulated amortization . . . . . . . . . . . . . . . . . . . . . . . . . . . . (29,735) (19,411)
Intangible assets, net . . . . . . . . . . . . . . . . . . . . . . . . . . . . . . . . . $ 75,757 $ 47,790
All of the intangible assets have finite lives and as such are subject to amortization. Amortization ofintangibles totaled $10,245 for 2009, $8,116 for 2008, and $3,581 for 2007. Estimated amortization expenserelated to our existing intangible assets for the next five years are as follows:
Year Amount
2010 . . . . . . . . . . . . . . . . . . . . . . . . . . . . . . . . . . . . . . . . . . . . . . . . . . . . . . . . . . . . . $14,6762011 . . . . . . . . . . . . . . . . . . . . . . . . . . . . . . . . . . . . . . . . . . . . . . . . . . . . . . . . . . . . . $12,1422012 . . . . . . . . . . . . . . . . . . . . . . . . . . . . . . . . . . . . . . . . . . . . . . . . . . . . . . . . . . . . . $11,5782013 . . . . . . . . . . . . . . . . . . . . . . . . . . . . . . . . . . . . . . . . . . . . . . . . . . . . . . . . . . . . . $10,4012014 . . . . . . . . . . . . . . . . . . . . . . . . . . . . . . . . . . . . . . . . . . . . . . . . . . . . . . . . . . . . . $10,301
6. Accrued Expenses and Other Current Liabilities
Accrued expenses and other current liabilities as of December 31, 2009 and 2008 were as follows:
2009 2008
Compensation and benefits . . . . . . . . . . . . . . . . . . . . . . . . . . . . . . . . . . . . . . . . $356,127 $187,063Taxes . . . . . . . . . . . . . . . . . . . . . . . . . . . . . . . . . . . . . . . . . . . . . . . . . . . . . . . . . 10,300 11,312Professional fees . . . . . . . . . . . . . . . . . . . . . . . . . . . . . . . . . . . . . . . . . . . . . . . . 26,508 16,066Travel and entertainment . . . . . . . . . . . . . . . . . . . . . . . . . . . . . . . . . . . . . . . . . . 15,871 22,000Customer volume incentives . . . . . . . . . . . . . . . . . . . . . . . . . . . . . . . . . . . . . . . 44,537 24,560Derivative financial instruments . . . . . . . . . . . . . . . . . . . . . . . . . . . . . . . . . . . . 20,968 —Other . . . . . . . . . . . . . . . . . . . . . . . . . . . . . . . . . . . . . . . . . . . . . . . . . . . . . . . . . 66,052 48,483
Total accrued expenses and other current liabilities . . . . . . . . . . . . . . . . . . . . . $540,363 $309,484
7. Accumulated Other Comprehensive Income (Loss)
The components of accumulated other comprehensive income (loss) as of December 31, 2009 and 2008were as follows:
2009 2008
Foreign currency translation adjustments . . . . . . . . . . . . . . . . . . . . . . . . . . . . . $ 1,867 $(10,055)Unrealized gain on cash flow hedges, net of taxes . . . . . . . . . . . . . . . . . . . . . . 18,410 576
Total accumulated other comprehensive income (loss) . . . . . . . . . . . . . . . . . . $20,277 $ (9,479)
8. Employee Benefits
In the United States, we maintain a 401(k) savings plan and supplemental retirement plan which are definedcontribution plans. Employer matching contributions for these plans were $5,562, $5,420, and $4,074 for theyears ended December 31, 2009, 2008 and 2007, respectively. Certain of our employees participate in definedcontribution plans in Europe, primarily the United Kingdom, sponsored by us. The costs related to these planswere not material to our results of operations or financial position for the years presented.
F-16
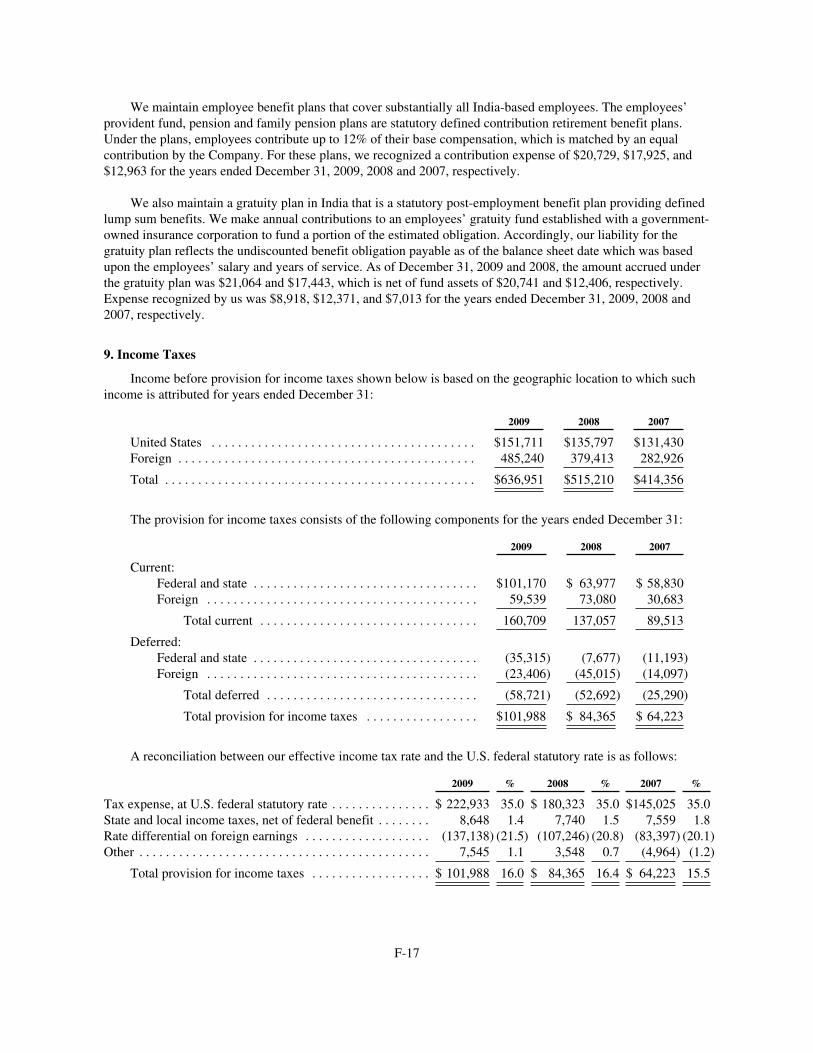
We maintain employee benefit plans that cover substantially all India-based employees. The employees’provident fund, pension and family pension plans are statutory defined contribution retirement benefit plans.Under the plans, employees contribute up to 12% of their base compensation, which is matched by an equalcontribution by the Company. For these plans, we recognized a contribution expense of $20,729, $17,925, and$12,963 for the years ended December 31, 2009, 2008 and 2007, respectively.
We also maintain a gratuity plan in India that is a statutory post-employment benefit plan providing definedlump sum benefits. We make annual contributions to an employees’ gratuity fund established with a government-owned insurance corporation to fund a portion of the estimated obligation. Accordingly, our liability for thegratuity plan reflects the undiscounted benefit obligation payable as of the balance sheet date which was basedupon the employees’ salary and years of service. As of December 31, 2009 and 2008, the amount accrued underthe gratuity plan was $21,064 and $17,443, which is net of fund assets of $20,741 and $12,406, respectively.Expense recognized by us was $8,918, $12,371, and $7,013 for the years ended December 31, 2009, 2008 and2007, respectively.
9. Income Taxes
Income before provision for income taxes shown below is based on the geographic location to which suchincome is attributed for years ended December 31:
2009 2008 2007
United States . . . . . . . . . . . . . . . . . . . . . . . . . . . . . . . . . . . . . . . . $151,711 $135,797 $131,430Foreign . . . . . . . . . . . . . . . . . . . . . . . . . . . . . . . . . . . . . . . . . . . . . 485,240 379,413 282,926
Total . . . . . . . . . . . . . . . . . . . . . . . . . . . . . . . . . . . . . . . . . . . . . . . $636,951 $515,210 $414,356
The provision for income taxes consists of the following components for the years ended December 31:
2009 2008 2007
Current:Federal and state . . . . . . . . . . . . . . . . . . . . . . . . . . . . . . . . . . $101,170 $ 63,977 $ 58,830Foreign . . . . . . . . . . . . . . . . . . . . . . . . . . . . . . . . . . . . . . . . . 59,539 73,080 30,683
Total current . . . . . . . . . . . . . . . . . . . . . . . . . . . . . . . . . 160,709 137,057 89,513
Deferred:Federal and state . . . . . . . . . . . . . . . . . . . . . . . . . . . . . . . . . . (35,315) (7,677) (11,193)Foreign . . . . . . . . . . . . . . . . . . . . . . . . . . . . . . . . . . . . . . . . . (23,406) (45,015) (14,097)
Total deferred . . . . . . . . . . . . . . . . . . . . . . . . . . . . . . . . (58,721) (52,692) (25,290)
Total provision for income taxes . . . . . . . . . . . . . . . . . $101,988 $ 84,365 $ 64,223
A reconciliation between our effective income tax rate and the U.S. federal statutory rate is as follows:
2009 % 2008 % 2007 %
Tax expense, at U.S. federal statutory rate . . . . . . . . . . . . . . . $ 222,933 35.0 $ 180,323 35.0 $145,025 35.0State and local income taxes, net of federal benefit . . . . . . . . 8,648 1.4 7,740 1.5 7,559 1.8Rate differential on foreign earnings . . . . . . . . . . . . . . . . . . . (137,138) (21.5) (107,246) (20.8) (83,397) (20.1)Other . . . . . . . . . . . . . . . . . . . . . . . . . . . . . . . . . . . . . . . . . . . . 7,545 1.1 3,548 0.7 (4,964) (1.2)
Total provision for income taxes . . . . . . . . . . . . . . . . . . $ 101,988 16.0 $ 84,365 16.4 $ 64,223 15.5
F-17

Deferred income tax assets and liabilities are comprised of the following at December 31:
2009 2008
Deferred income tax assets:Net operating losses . . . . . . . . . . . . . . . . . . . . . . . . . . . . . . . . . . . . . . . . . $ 9,304 $ 9,904Revenue recognition . . . . . . . . . . . . . . . . . . . . . . . . . . . . . . . . . . . . . . . . . 32,836 17,113Compensation and benefits . . . . . . . . . . . . . . . . . . . . . . . . . . . . . . . . . . . . 32,526 13,107Stock-based compensation . . . . . . . . . . . . . . . . . . . . . . . . . . . . . . . . . . . . 23,478 25,634Minimum alternative tax and other credits . . . . . . . . . . . . . . . . . . . . . . . . 81,201 55,836Depreciation and amortization . . . . . . . . . . . . . . . . . . . . . . . . . . . . . . . . . 260 —Other . . . . . . . . . . . . . . . . . . . . . . . . . . . . . . . . . . . . . . . . . . . . . . . . . . . . . 13,085 3,012
192,690 124,606Less valuation allowance . . . . . . . . . . . . . . . . . . . . . . . . . . . . . . . . . . . . . (10,230) (7,883)
Deferred income tax assets, net . . . . . . . . . . . . . . . . . . . . . . . . . . . . . . . . . 182,460 116,723
Deferred income tax liabilities:Undistributed Indian income . . . . . . . . . . . . . . . . . . . . . . . . . . . . . . . . . . . 6,134 6,141Depreciation and amortization . . . . . . . . . . . . . . . . . . . . . . . . . . . . . . . . . — 2,862Intangible assets . . . . . . . . . . . . . . . . . . . . . . . . . . . . . . . . . . . . . . . . . . . . 21,917 13,883
Deferred income tax liabilities . . . . . . . . . . . . . . . . . . . . . . . . . . . . . . . . . 28,051 22,886
Net deferred income tax assets . . . . . . . . . . . . . . . . . . . . . . . . . . . . . . . . . . . . . $154,409 $ 93,837
At December 31, 2009, we had foreign net operating loss carryforwards of approximately $36,900. We haverecorded a full valuation allowance on most of the foreign net operating loss carryforwards. During 2007, theIndian government passed tax legislation that, among other items, subjects Indian taxpayers to a MinimumAlternative Tax, or MAT. As of December 31, 2009 and 2008, deferred income taxes related to the MAT wereapproximately $78,800 and $53,300, respectively. The MAT calculation includes all Indian profits earned withinour Software Technology Parks, or STPs and the resulting tax may be credited against Indian income taxes due infuture years, subject to limitations.
Our Indian subsidiaries, collectively referred to as Cognizant India, are export-oriented companies which,under the Indian Income Tax Act of 1961 are entitled to claim tax holidays for a period of ten consecutive yearsfor each STP with respect to export profits for each STP. Substantially all of the earnings of Cognizant India areattributable to export profits. The majority of our STPs in India are currently entitled to a 100% exemption fromIndian income tax. In August 2009, the Indian government extended the tax holidays for STPs by one year fromMarch 31, 2010 to March 31, 2011. In addition, we have located several new development centers in areasdesignated as Special Economic Zones, or SEZs. Development centers operating in SEZs will be entitled tocertain income tax incentives for periods up to 15 years. For the years ended December 31, 2009, 2008 and 2007,the effect of the income tax holiday was to reduce the overall income tax provision and increase net income byapproximately $127,800¸ $102,500 and $81,700, respectively, and increase diluted EPS by $0.42, $0.34 and$0.27, respectively.
Prior to January 1, 2002, it was our intent to repatriate all accumulated earnings from India to the UnitedStates. Accordingly, we provided deferred income taxes on such pre-2002 undistributed earnings. During the firstquarter of 2002, we made a strategic decision to pursue an international strategy that includes expandedinfrastructure investments in India and geographic expansion in Europe and Asia. As a component of thisstrategy, we intend to use 2002 and subsequent Indian earnings and other foreign earnings for all periods toexpand operations outside of the United States instead of repatriating these earnings to the United States.Accordingly, effective January 1, 2002, we no longer accrue incremental U.S. taxes on all Indian earnings asthese earnings are considered to be indefinitely reinvested outside of the United States. With respect to all otherforeign earnings, it was our intent to indefinitely reinvest all such earnings outside of the United States. As of
F-18

December 31, 2009, the amount of unrepatriated Indian earnings and total foreign earnings (includingunrepatriated Indian earnings) upon which no incremental U.S. taxes have been recorded is approximately$1,506,100 and $1,624,500 respectively. If such earnings are repatriated in the future, or are no longer deemed tobe indefinitely reinvested, we will accrue the applicable amount of taxes associated with such earnings. Due tothe various methods by which such earnings could be repatriated in the future, it is not currently practicable todetermine the amount of applicable taxes that would result from such repatriation.
Due to the geographical scope of our operations, we are subject to tax examinations in various jurisdictions.Accordingly, we may record incremental tax expense, based upon the more-likely-than-not outcomes of anyuncertain tax positions. In addition, when applicable, we adjust the previously recorded tax expense to reflectexamination results when the position is effectively settled. Our ongoing assessments of the more-likely-than-notoutcomes of the examinations and related tax positions require judgment and can increase or decrease oureffective tax rate, as well as impact our operating results. The specific timing of when the resolution of each taxposition will be reached is uncertain.
Changes in unrecognized tax benefits for the years ended December 31, 2009 and 2008 are as follows:
2009 2008
Balance, beginning of year . . . . . . . . . . . . . . . . . . . . . . . . . . . . . . . . . . . . . . . . . . . $ 6,409 $7,932Additions based on tax positions related to the current year . . . . . . . . . . . . . 908 235Additions for tax positions of prior years . . . . . . . . . . . . . . . . . . . . . . . . . . . . 4,162 327Additions for tax positions of acquired subsidiaries . . . . . . . . . . . . . . . . . . . . — 113Reductions for tax positions of acquired subsidiaries . . . . . . . . . . . . . . . . . . . — (690)Reductions for tax positions due to lapse of statutes of limitations . . . . . . . . (1,034) (867)Settlements . . . . . . . . . . . . . . . . . . . . . . . . . . . . . . . . . . . . . . . . . . . . . . . . . . . — —Foreign currency exchange movement . . . . . . . . . . . . . . . . . . . . . . . . . . . . . . 108 (641)
Balance, end of year . . . . . . . . . . . . . . . . . . . . . . . . . . . . . . . . . . . . . . . . . . . . . . . . $10,553 $6,409
Approximately $10,030 and $5,886 of the total amount of unrecognized tax benefits at December 31, 2009and December 31, 2008, respectively, would affect the effective tax rate, if recognized. The remaining $523 as ofDecember 31, 2009 and 2008 would be adjusted against goodwill. It is reasonably possible that within the next12 months, certain U.S. state and foreign examinations will be resolved or reach the statute of limitations, whichcould result in a decrease in unrecognized tax benefits of $1,473. We recognize accrued interest and penaltiesassociated with uncertain tax positions as part of our provision for income taxes. The total amount of accruedinterest and penalties at December 31, 2009 and 2008 was approximately $3,800 and $700, respectively, andrelates to U.S. and foreign tax matters. The amount of interest and penalties expensed in 2009, 2008 and 2007were immaterial.
We file a U.S. federal consolidated income tax return. The U.S. federal statute of limitations remains openfor the year 2006 and onward. The statute of limitations for state audits varies by state. Years still underexamination by foreign tax authorities are years 2001 and forward.
10. Fair Value Measurements
We measure our cash equivalents, investments, including auction-rate securities, and foreign exchangeforward contracts at fair value. The authoritative guidance defines fair value as the exit price, or the amount thatwould be received to sell an asset or paid to transfer a liability in an orderly transaction between marketparticipants as of the measurement date. The authoritative guidance also establishes a fair value hierarchy that isintended to increase consistency and comparability in fair value measurements and related disclosures. The fairvalue hierarchy is based on inputs to valuation techniques that are used to measure fair value that are eitherobservable or unobservable. Observable inputs reflect assumptions market participants would use in pricing anasset or liability based on market data obtained from independent sources while unobservable inputs reflect areporting entity’s pricing based upon their own market assumptions.
F-19

The fair value hierarchy consists of the following three levels:
• Level 1—Inputs are quoted prices in active markets for identical assets or liabilities.
• Level 2—Inputs are quoted prices for similar assets or liabilities in an active market, quoted prices foridentical or similar assets or liabilities in markets that are not active, inputs other than quoted pricesthat are observable and market-corroborated inputs which are derived principally from or corroboratedby observable market data.
• Level 3—Inputs are derived from valuation techniques in which one or more significant inputs or valuedrivers are unobservable.
The following table summarizes our financial assets and (liabilities) measured at fair value on a recurringbasis as of December 31, 2009:
Level 1 Level 2 Level 3 Total
Cash equivalents:Money market funds . . . . . . . . . . . . . . . . . . . . . . . . . . . . . . . . . . . . $778,311 $ — $ — $778,311
Investments:Available-for-sale securities—current . . . . . . . . . . . . . . . . . . . . . . — 162 — 162Trading securities—noncurrent . . . . . . . . . . . . . . . . . . . . . . . . . . . — — 129,103 129,103UBS Right—noncurrent . . . . . . . . . . . . . . . . . . . . . . . . . . . . . . . . . — — 22,028 22,028
Other current assets:Derivative financial instruments—foreign exchange forwardcontracts . . . . . . . . . . . . . . . . . . . . . . . . . . . . . . . . . . . . . . . . . . . — 20,358 — 20,358
Other current liabilities:Derivative financial instruments—foreign exchange forwardcontracts . . . . . . . . . . . . . . . . . . . . . . . . . . . . . . . . . . . . . . . . . . . — (20,968) — (20,968)
Other assets:Derivative financial instruments—foreign exchange forwardcontracts . . . . . . . . . . . . . . . . . . . . . . . . . . . . . . . . . . . . . . . . . . . — 688 — 688
Other noncurrent liabilities:Derivative financial instruments—foreign exchange forwardcontracts . . . . . . . . . . . . . . . . . . . . . . . . . . . . . . . . . . . . . . . . . . . — (1,917) — (1,917)
Total assets and (liabilities) measured at fair value . . . . . . . . . . . . $778,311 $ (1,677) $151,131 $927,765
The following table summarizes our financial assets measured at fair value on a recurring basis as ofDecember 31, 2008:
Level 1 Level 2 Level 3 Total
Cash equivalents:Money market funds . . . . . . . . . . . . . . . . . . . . . . . . . . . . . . . . . . . . $291,432 $ — $ — $291,432Agency discount notes and commercial paper . . . . . . . . . . . . . . . . — 15,201 — 15,201
Investments:Available-for-sale securities—current . . . . . . . . . . . . . . . . . . . . . . — 8,157 — 8,157Trading securities—current . . . . . . . . . . . . . . . . . . . . . . . . . . . . . . — — 5,862 5,862Trading securities—noncurrent . . . . . . . . . . . . . . . . . . . . . . . . . . . — — 133,536 133,536UBS Right—noncurrent . . . . . . . . . . . . . . . . . . . . . . . . . . . . . . . . . — — 28,158 28,158
Other assets:Derivative financial instruments—foreign exchange forwardcontracts . . . . . . . . . . . . . . . . . . . . . . . . . . . . . . . . . . . . . . . . . . . — 598 — 598
Total assets measured at fair value . . . . . . . . . . . . . . . . . . . . . $291,432 $23,956 $167,556 $482,944
F-20

Level 3 assets consist of our investment in auction-rate securities and the related UBS Right. See Note 3 foradditional information. The following table provides a summary of changes in fair value of the Company’sLevel 3 financial assets for the years ended December 31, 2009 and 2008:
2009 2008
Balance, beginning of the year . . . . . . . . . . . . . . . . . . . . . . . . . . . . . . . . . . . . . . . . . $167,556 —Transfers in: auction-rate securities with failed auctions . . . . . . . . . . . . . . . . . . . . . — 176,325Transfers out: redemptions of called auction-rate securities . . . . . . . . . . . . . . . . . . (17,250) (7,800)Gain (loss) related to auction-rate securities included in other income(expense), net . . . . . . . . . . . . . . . . . . . . . . . . . . . . . . . . . . . . . . . . . . . . . . . . . . . . 6,955 (29,127)
(Loss) gain related to UBS Right included in other income (expense), net . . . . . . . (6,130) 28,158
Balance, end of the year . . . . . . . . . . . . . . . . . . . . . . . . . . . . . . . . . . . . . . . . . . . . . . $151,131 $167,556
We estimated the fair value of the auction-rate securities using a discounted cash flow model analysis whichconsidered the following key inputs: (i) the underlying structure of each security; (ii) the timing of expectedfuture principal and interest payments; and (iii) discount rates, inclusive of an illiquidity risk premium, that arebelieved to reflect current market conditions and the relevant risk associated with each security. We estimatedthat the fair market value of these securities at December 31, 2009 and 2008 was $129,103 and $139,398,respectively. We estimated the value of the UBS Right using a fair value model analysis, which considered thefollowing key inputs: discount rate, timing and amount of cash flow, and UBS counterparty risk. Theassumptions used in valuing both the auction-rate securities and the UBS Right are volatile and subject to changeas the underlying sources of these assumptions and market conditions change.
In addition to the debt securities discussed above, we had approximately $298,240 of time deposits includedin short-term investments as of December 31, 2009 and approximately $13,504 of time deposits included in cashand cash equivalents and short-term investments at December 31, 2008.
11. Derivative Financial Instruments
In the normal course of business, we use foreign exchange forward contracts to manage foreign currencyexchange rate risk. The estimated fair value of the foreign exchange forward contracts considers the followingitems: discount rate, timing and amount of cash flow and counterparty credit risk. The following table providesinformation on the location and fair values of derivative financial instruments included in our consolidatedstatements of financial position as of December 31, 2009:
Designation of Derivatives Location on Statement of Financial Position Assets Liabilities
Cash Flow Hedges—Designated as hedginginstrumentsForeign exchange forward contracts Other current assets . . . . . . . . . . . . . . . . . . . . . $20,211 $ —
Other assets . . . . . . . . . . . . . . . . . . . . . . . . . . . 688 —Accrued expenses and other currentliabilities . . . . . . . . . . . . . . . . . . . . . . . . . . . — —
Noncurrent liabilities . . . . . . . . . . . . . . . . . . . — 1,917
Total . . . . . . . . . . . . . . . . . . . . . . . . . . . . 20,899 1,917
Other Derivatives—Not designated as hedginginstrumentsForeign exchange forward contracts Other current assets . . . . . . . . . . . . . . . . . . . . . 147 —
Other assets . . . . . . . . . . . . . . . . . . . . . . . . . . . — —Accrued expenses and other currentliabilities . . . . . . . . . . . . . . . . . . . . . . . . . . . — 20,968
Noncurrent liabilities — —
Total . . . . . . . . . . . . . . . . . . . . . . . . . . . . 147 20,968
Total . . . . . . . . . . . . . . . . . . . . . . . . . . . . . . . . . . . . . . . . . . . . . . . . . . . . . . . . . . . . . . . . . . . . . . . $21,046 $22,885
F-21

The following table provides information on the location and fair values of derivative financial instrumentsincluded in our consolidated statements of financial position as of December 31, 2008:
Designation of Derivatives Location on Statement of Financial Position Assets Liabilities
Cash Flow Hedges—Designated as hedginginstrumentsForeign exchange forward contracts Other current assets $598 $—
Total . . . . . . . . . . . . . . . . . . . . . . . . . . . $598 $—
Cash Flow Hedges
We have entered into a series of foreign exchange forward contracts that are designated as cash flow hedgesof certain salary payments in India. These contracts are intended to partially offset the impact of movement ofexchange rates on future operating costs and are scheduled to mature each month during 2010 and 2011. Underthese contracts, we purchase Indian rupees and sell U.S. dollars and the changes in fair value of these contractsare initially reported in the caption “accumulated other comprehensive income (loss)” on our accompanyingconsolidated statements of financial position and is subsequently reclassified to earnings in the same period thehedge contract settles. As of December 31, 2009 and December 31, 2008, the notional value of our outstandingcontracts was $810,000 and $82,000, respectively, and the net unrealized gain included in accumulated othercomprehensive income (loss) for such contracts was $18,410 and $576, respectively,
Upon settlement or maturity of the cash flow hedge contracts, we record the related gain or loss, based onour designation at the commencement of the contract, to salary expense reported within cost of revenues andselling, general and administrative expenses. The tables below provide information on the location and amountsof gains or losses on our cash flow hedges included in our consolidated statement of operations for the yearsended December 31, 2009 and 2008.
Other Derivatives
We also use foreign exchange forward contracts, which have not been designated as hedges, to hedge ourbalance sheet exposure to Indian rupee denominated net monetary assets. During 2009, we entered into a seriesof foreign exchange forward contracts to purchase U.S. dollars and sell Indian rupees. At December 31, 2009, thenotional value of outstanding contracts was $400,000. Realized gains or losses and changes in the estimated fairvalue of these derivative financial instruments are recorded in other income (expense), net as a component offoreign currency exchange gains or losses in our consolidated statements of operations. For the year endedDecember 31, 2009, we reported a loss of $20,821 on these derivative contracts.
The following table provides information on the location and amounts of pre-tax gains (losses) on ourderivative financial instruments included in our consolidated statement of operations for the year endedDecember 31, 2009:
Increase inDerivative Gains
(Losses) Recognizedin Accumulated OtherComprehensive Income
(Loss)(effective portion)
Location of Net Derivative Gains(Losses) Reclassified
from Accumulated OtherComprehensive Income
(Loss) into Income(effective portion)
Net Gain (Loss) Reclassifiedfrom Accumulated OtherComprehensive Income
(Loss) into Income(effective portion)
Cash Flow Hedges—Designated as hedginginstruments
Foreign exchange forwardcontracts . . . . . . . . . . . . . . $27,330 Cost of revenues . . . . . . . . . . . . . . . $7,141
Selling, general andadministrative expenses . . . . . . . 1,805
Total . . . . . . . . . . . . . . . . . . . $27,330 $8,946
F-22

Location of Net Gains /(Losses)on Derivative Instruments
Amount of Net Gains (Losses)on Derivative Instruments
Other Derivatives—Not designated as hedginginstruments
Foreign exchange forward contracts Other income (expense), net . . . . . . $(20,821)
Total . . . . . . . . . . . . . . . . . . . . . . . . . . . . . . . . . . . . . . . . . . . . . . . . . . . . . . . . . . . . . . . . . . $(20,821)
The following table provides information on the location and amounts of pre-tax gains (losses) on ourderivative financial instruments included in our consolidated statement of operations for the year endedDecember 31, 2008:
Increase inDerivative Gains
(Losses) Recognizedin Accumulated OtherComprehensive Income
(Loss)(effective portion)
Location of Net Derivative Gains(Losses) Reclassified
from Accumulated OtherComprehensive Income
(Loss) into Income(effective portion)
Net Gain (Loss) Reclassifiedfrom Accumulated OtherComprehensive Income
(Loss) into Income(effective portion)
Cash Flow Hedges—Designated as hedginginstruments
Foreign exchange forwardcontracts . . . . . . . . . . . . . . $598 Cost of revenues . . . . . . . . . . . . . . . $—
Selling, general andadministrative expenses . . . . . . . —
Total . . . . . . . . . . . . . . . . . . . $598 $—
The related cash flow impacts of all of our derivative activities are reflected as cash flows from operatingactivities.
12. Stock-Based Compensation Plans
On June 5, 2009, our stockholders approved the adoption of the Cognizant Technology SolutionsCorporation 2009 Incentive Compensation Plan (the “2009 Incentive Plan”), under which 24,000,000 shares ofour Class A common stock were reserved for issuance. The 2009 Incentive Plan is the successor plan to ourAmended and Restated 1999 Incentive Compensation Plan which terminated on April 13, 2009 in accordancewith its terms (the “1999 Incentive Plan”), our Amended and Restated Non-Employee Directors’ Stock OptionPlan (the “Director Plan”) and our Amended and Restated Key Employees’ Stock Option Plan (the “KeyEmployee Plan”) which terminated in July 2009 (collectively, the “Predecessor Plans”). The 2009 Incentive Planwill not affect any options or stock issuances outstanding under the Predecessor Plans. No further awards will bemade under the Predecessor Plans. As of December 31, 2009, we have 22,650,537 shares available for grantunder the 2009 Incentive Plan.
Stock options granted to employees under our plans have a life ranging from seven to ten years, vestproportionally over four years, unless specified otherwise, and have an exercise price equal to the fair marketvalue of the common stock on the date of grant. Grants to non-employee directors vest proportionally over twoyears. Stock-based compensation expense relating to stock options is recognized on a straight-line basis over therequisite service period.
Restricted stock units vest proportionately in quarterly or annual installments over three years. Stock-basedcompensation expense relating to restricted stock units is recognized on a straight-line basis over the requisiteservice period.
F-23

We granted performance stock units that cliff vest after three years, principally to executive officers, andperformance stock units that vest over periods ranging from one to three years to employees including theexecutive officers. The vesting of performance stock units is contingent on both meeting revenue performancetargets and continued service. Stock-based compensation costs for performance stock units that cliff vest arerecognized on a straight-line basis and awards that vest proportionally are recognized on a graded-vesting basisover the vesting period based on the most probable outcome of the performance conditions. If the minimumperformance targets are not met, no compensation cost is recognized and any recognized compensation cost isreversed.
The Company’s 2004 Employee Stock Purchase Plan (the “Purchase Plan”) provides for the issuance of upto 6,000,000 shares of Class A common stock to eligible employees. The Purchase Plan provides for eligibleemployees to purchase whole shares of Class A common stock at a price of 90% of the lesser of: (a) the fairmarket value of a share of Class A common stock on the first date of the purchase period or (b) the fair marketvalue of a share of Class A common stock on the last date of the purchase period. Stock-based compensationexpense for the Purchase Plan is recognized over the vesting period of three months on a straight-line basis. As ofDecember 31, 2009, we had 1,225,501 shares available for future grants and issuances under the Purchase Plan.
In 2009, 2008 and 2007, stock-based compensation costs were $44,816, $43,900 and $35,916, respectively.The related tax benefit was $9,881, $8,788 and $6,816 in 2009, 2008 and 2007, respectively. The allocation ofstock-based compensation expense between cost of revenues and selling, general and administrative expenseswas as follows for the three years ended December 31:
2009 2008 2007
Cost of revenues . . . . . . . . . . . . . . . . . . . . . . . . . . . . . . . . . . . . . . . . . . . . . . . . . . . . $14,889 $18,715 $17,206Selling, general and administrative expenses . . . . . . . . . . . . . . . . . . . . . . . . . . . . . . 29,927 25,185 18,710
Total stock-based compensation expense . . . . . . . . . . . . . . . . . . . . . . . . . . . . . . . . $44,816 $43,900 $35,916
Effective April 1, 2007, the Indian government enacted a fringe benefit tax, or FBT, on the intrinsic value ofstock options and awards as of the vesting date that is payable by us at the time of exercise or distribution foremployees subject to FBT. We elected to recover this cost from the employee and withhold the FBT from theemployee’s stock option or award proceeds at the time of exercise or distribution before remitting the tax to theIndian government. Because we are the primary obligor of this tax obligation, we record the FBT as an operatingexpense and the recovery from the employee is recorded in additional paid-in capital as proceeds from stockissuance. During the third quarter of 2009, the Indian government repealed the FBT retroactive to April 1, 2009.For the years ended December 31, 2009, 2008 and 2007, we recorded stock-based FBT expense of $945, $8,149and $5,922, respectively.
In determining the fair value of stock options issued to employees who were subject to the FBT, we estimatedthe future stock issuance proceeds, including FBT, at time of grant. The Monte Carlo simulation model was used toestimate the future price of our stock on the respective vesting dates of stock option grants. Accordingly, effectiveApril 1, 2007, we began to segregate our employees into two groups for determining the fair value of stock optionsat date of grant: employees subject to the FBT and employees not subject to the FBT. Effective in 2007, the fairvalue of each stock option granted to employees subject to the FBT was estimated at the date of grant using theMonte Carlo simulation model and the fair value of each stock option granted to employees not subject to the FBTwas estimated at date of grant using the Black-Scholes option-pricing model. Effective April 1, 2009, we estimatedthe fair value of each stock option granted using the Black-Scholes option-pricing model. For the years endedDecember 31, 2009, 2008 and 2007, expected volatility was calculated using implied market volatilities. In addition,the expected term, which represents the period of time, measured from the grant date, that vested options areexpected to be outstanding, was derived by incorporating exercise and post-vest termination assumptions, based onhistorical data, in a Monte Carlo simulation model. The risk-free rate is derived from the U.S. Treasury yield curvein effect at the time of grant. We have not paid any dividends. Forfeiture assumptions used in amortizing stock-based compensation expense are based on an analysis of historical data.
F-24

The fair values of option grants, including the Purchase Plan, were estimated at the date of grant during theyears ended December 31, 2009, 2008 and 2007 based upon the following assumptions and were as follows:
2009 2008 2007
Dividend yield . . . . . . . . . . . . . . . . . . . . . . . . . . . . . . . . . . . . . . . . . . . . . . . . . . . . . . . . 0% 0% 0%Weighted average volatility factor:
Stock options . . . . . . . . . . . . . . . . . . . . . . . . . . . . . . . . . . . . . . . . . . . . . . . . . . . . . 45.98% 58.38% 33.37%Purchase Plan . . . . . . . . . . . . . . . . . . . . . . . . . . . . . . . . . . . . . . . . . . . . . . . . . . . . . 56.63% 46.89% 32.76%
Weighted average expected life (in years):Stock options . . . . . . . . . . . . . . . . . . . . . . . . . . . . . . . . . . . . . . . . . . . . . . . . . . . . . 4.18 5.95 5.26Purchase Plan . . . . . . . . . . . . . . . . . . . . . . . . . . . . . . . . . . . . . . . . . . . . . . . . . . . . . 0.25 0.25 0.25
Weighted average risk-free interest rate:Stock options . . . . . . . . . . . . . . . . . . . . . . . . . . . . . . . . . . . . . . . . . . . . . . . . . . . . . 2.48% 2.97% 4.43%Purchase Plan . . . . . . . . . . . . . . . . . . . . . . . . . . . . . . . . . . . . . . . . . . . . . . . . . . . . . 0.14% 1.88% 4.84%
Weighted average grant date fair value:Stock options . . . . . . . . . . . . . . . . . . . . . . . . . . . . . . . . . . . . . . . . . . . . . . . . . . . . . $10.49 $12.87 $13.32Purchase Plan . . . . . . . . . . . . . . . . . . . . . . . . . . . . . . . . . . . . . . . . . . . . . . . . . . . . . $ 5.04 $ 5.65 $ 6.69
During the year ended December 31, 2009, we issued 874,134 shares of Class A common stock under thePurchase Plan with a total vested fair value of approximately $4,407.
A summary of the activity for stock options granted under our stock-based compensation plans as ofDecember 31, 2009 and changes during the year then ended is presented below:
Number ofOptions
WeightedAverage Exercise
Price(in dollars)
WeightedAverage
RemainingLife
(in years)
AggregateIntrinsicValue
(in thousands)
Outstanding at January 1, 2009 . . . . . . . . . . . . . . . . . . . . . . 24,363,232 $16.48Granted . . . . . . . . . . . . . . . . . . . . . . . . . . . . . . . . . . . . . . . . 76,000 26.74Exercised . . . . . . . . . . . . . . . . . . . . . . . . . . . . . . . . . . . . . . . 5,120,026 8.10Cancelled . . . . . . . . . . . . . . . . . . . . . . . . . . . . . . . . . . . . . . . 151,415 33.33Expired . . . . . . . . . . . . . . . . . . . . . . . . . . . . . . . . . . . . . . . . 87,590 32.15
Outstanding at December 31, 2009 . . . . . . . . . . . . . . . . . . . 19,080,201 $18.56 4.84 $510,817
Vested and expected to vest at December 31, 2009 . . . . . . 18,727,873 $18.19 4.76 $508,206
Exercisable at December 31, 2009 . . . . . . . . . . . . . . . . . . . 15,368,349 $15.16 4.18 $463,623
As of December 31, 2009, $31,763 of total remaining unrecognized stock-based compensation cost relatedto stock options is expected to be recognized over the weighted-average remaining requisite service period of1.60 years. The total intrinsic value of options exercised was $142,676, $87,910 and $195,363 for the yearsended December 31, 2009, 2008 and 2007, respectively.
The fair value of performance stock units and restricted stock units is determined based on the number ofstock units granted and the quoted price of our stock at date of grant. For employees previously subject to theFBT, the grant date fair value is reduced by the amount of the FBT expected to be recovered by us from theemployee. Under the Monte Carlo simulation model, the value of the FBT is equal to the FBT tax rate multipliedby the quoted price of our stock at date of grant. Effective April 1, 2009, the Indian government repealed theFBT, and accordingly the fair value of performance stock units and restricted stock units is determined basedupon the number of stock units granted and the quoted price of our stock at the date of grant.
F-25

A summary of the activity for performance stock units granted under our stock-based compensation plans asof December 31, 2009 and changes during the year then ended is presented below:
Number ofUnits
Weighted AvgGrant DateFair Value(in dollars)
Unvested at January 1, 2009 . . . . . . . . . . . . . . . . . . . . . . . . . . . . . . . . . . . . 1,570,291 $21.89Granted . . . . . . . . . . . . . . . . . . . . . . . . . . . . . . . . . . . . . . . . . . . . . . . . . . . . . 241,400 45.14Vested . . . . . . . . . . . . . . . . . . . . . . . . . . . . . . . . . . . . . . . . . . . . . . . . . . . . . — —Forfeited . . . . . . . . . . . . . . . . . . . . . . . . . . . . . . . . . . . . . . . . . . . . . . . . . . . . 448,724 27.36Reduction in units due to performance condition . . . . . . . . . . . . . . . . . . . . 441,560 15.86
Unvested at December 31, 2009 . . . . . . . . . . . . . . . . . . . . . . . . . . . . . . . . . 921,407 $28.14
As of December 31, 2009, $12,760 of total remaining unrecognized stock-based compensation cost relatedto performance stock units is expected to be recognized over the weighted-average remaining requisite serviceperiod of 1.80 years.
A summary of the activity for restricted stock units granted under our stock-based compensation plans as ofDecember 31, 2009 and changes during the year then ended is presented below:
Number ofUnits
WeightedAvg Grant Date
Fair Value(in dollars)
Unvested at January 1, 2009 . . . . . . . . . . . . . . . . . . . . . . . . . . . . . . . . . . . 852,532 $17.21Granted . . . . . . . . . . . . . . . . . . . . . . . . . . . . . . . . . . . . . . . . . . . . . . . . . . . 1,043,355 35.35Vested . . . . . . . . . . . . . . . . . . . . . . . . . . . . . . . . . . . . . . . . . . . . . . . . . . . . 330,982 18.80Forfeited . . . . . . . . . . . . . . . . . . . . . . . . . . . . . . . . . . . . . . . . . . . . . . . . . . 8,109 19.69
Unvested at December 31, 2009 . . . . . . . . . . . . . . . . . . . . . . . . . . . . . . . . 1,556,796 $29.49
As of December 31, 2009, $36,943 of total remaining unrecognized stock-based compensation cost relatedto restricted stock units is expected to be recognized over the weighted-average remaining requisite serviceperiod of 2.39 years.
13. Commitments and Contingencies
We lease office space and equipment under operating leases, which expire at various dates through the year2021. Certain leases contain renewal provisions and generally require us to pay utilities, insurance, taxes, andother operating expenses. Future minimum rental payments under non-cancelable operating leases as ofDecember 31, 2009 are as follows:
2010 . . . . . . . . . . . . . . . . . . . . . . . . . . . . . . . . . . . . . . . . . . . . . . . . . . . . . . . . . . . . $ 62,4042011 . . . . . . . . . . . . . . . . . . . . . . . . . . . . . . . . . . . . . . . . . . . . . . . . . . . . . . . . . . . . 55,4572012 . . . . . . . . . . . . . . . . . . . . . . . . . . . . . . . . . . . . . . . . . . . . . . . . . . . . . . . . . . . . 46,0582013 . . . . . . . . . . . . . . . . . . . . . . . . . . . . . . . . . . . . . . . . . . . . . . . . . . . . . . . . . . . . 32,5102014 . . . . . . . . . . . . . . . . . . . . . . . . . . . . . . . . . . . . . . . . . . . . . . . . . . . . . . . . . . . . 13,993Thereafter . . . . . . . . . . . . . . . . . . . . . . . . . . . . . . . . . . . . . . . . . . . . . . . . . . . . . . . . 18,159
Total minimum lease payments . . . . . . . . . . . . . . . . . . . . . . . . . . . . . . . . . . . . . . . $228,581
Rental expense totaled $75,170, $85,281 and $54,475 for years ended December 31, 2009, 2008 and 2007,respectively.
F-26

Our current India real estate development program includes planned construction of approximately4.5 million square feet of new space. The expanded program, which commenced during the quarter endedMarch 31, 2007, includes the expenditure of approximately $330,000 on land acquisition, facilities constructionand furnishings to build new state-of-the-art development and delivery centers in regions primarily designated asSEZs located in India. As of December 31, 2009, we had outstanding fixed capital commitments of $35,936related to our India development center expansion program.
We are involved in various claims and legal actions arising in the ordinary course of business. In the opinionof management, the outcome of such claims and legal actions, if decided adversely, is not expected to have amaterial adverse effect on our business, financial condition and results of operations. Additionally, many of ourengagements involve projects that are critical to the operations of our customers’ business and provide benefitsthat are difficult to quantify. Any failure in a customer’s systems or our failure to meet our contractualobligations to our clients, including any breach involving a customer’s confidential information or sensitive data,or our obligations under applicable laws or regulations could result in a claim for substantial damages against us,regardless of our responsibility for such failure. Although we attempt to contractually limit our liability fordamages arising from negligent acts, errors, mistakes, or omissions in rendering our services, there can be noassurance that the limitations of liability set forth in our contracts will be enforceable in all instances or willotherwise protect us from liability for damages. Although we have general liability insurance coverage, includingcoverage for errors or omissions, there can be no assurance that such coverage will continue to be available onreasonable terms or will be available in sufficient amounts to cover one or more large claims, or that the insurerwill not disclaim coverage as to any future claim. The successful assertion of one or more large claims against usthat exceed available insurance coverage or changes in our insurance policies, including premium increases orthe imposition of large deductible or co-insurance requirements, would have a material adverse effect on ourbusiness, results of operations and financial condition.
14. Segment Information
Our reportable segments are: Financial Services, which includes customers providing banking / transactionprocessing, capital markets and insurance services; Healthcare, which includes healthcare providers and payersas well as life sciences customers; Manufacturing/Retail/Logistics, which includes manufacturers, retailers, traveland other hospitality customers, as well as customers providing logistics services; and Other, which is anaggregation of industry segments which, individually, are less than 10% of consolidated revenues and segmentoperating profit. The Other reportable segment includes entertainment, media and information services,communications, and high technology operating segments. Our sales managers, account executives, accountmanagers and project teams are aligned in accordance with the specific industries they serve.
Our chief operating decision maker evaluates the Company’s performance and allocates resources based onsegment revenues and operating profit. Segment operating profit is defined as income from operations beforeunallocated costs. Generally, operating expenses for each operating segment have similar characteristics and aresubject to the same factors, pressures and challenges. However, the economic environment and its effects onindustries served by our operating groups may affect revenue and operating expenses to differing degrees.Expenses included in segment operating profit consist principally of direct selling and delivery costs as well as aper seat charge for use of the development and delivery centers. Certain expenses, such as general andadministrative, and a portion of depreciation and amortization, are not specifically allocated to specific segmentsas management does not believe it is practical to allocate such costs to individual segments because they are notdirectly attributable to any specific segment. Further, stock-based compensation expense and the related stock-based Indian fringe benefit tax are not allocated to individual segments in internal management reports used bythe chief operating decision maker. Accordingly, these expenses are separately disclosed as “unallocated” andadjusted only against our total income from operations. Additionally, management has determined that it is notpractical to allocate identifiable assets, by segment, since such assets are used interchangeably among thesegments.
F-27

Revenues from external customers and segment operating profit, before unallocated expenses, for theFinancial Services, Healthcare, Manufacturing/Retail/Logistics, and Other reportable segments were as followsfor the years ended December 31:
2009 2008 2007
Revenues:Financial Services . . . . . . . . . . . . . . . . . . . . . . . . . . . . $1,406,629 $1,284,013 $1,001,420Healthcare . . . . . . . . . . . . . . . . . . . . . . . . . . . . . . . . . . 860,427 688,224 504,504Manufacturing/Retail/Logistics . . . . . . . . . . . . . . . . . . 564,917 443,236 320,116Other . . . . . . . . . . . . . . . . . . . . . . . . . . . . . . . . . . . . . . 446,690 400,831 309,537
Total revenue . . . . . . . . . . . . . . . . . . . . . . . . . . . . $3,278,663 $2,816,304 $2,135,577
2009 2008 2007
Segment Operating Profit:Financial Services . . . . . . . . . . . . . . . . . . . . . . . . . . . . $ 503,689 $ 439,055 $ 355,696Healthcare . . . . . . . . . . . . . . . . . . . . . . . . . . . . . . . . . . 331,007 270,790 199,791Manufacturing/Retail/Logistics . . . . . . . . . . . . . . . . . . 184,636 136,609 108,480Other . . . . . . . . . . . . . . . . . . . . . . . . . . . . . . . . . . . . . . 147,246 132,209 111,319
Total segment operating profit . . . . . . . . . . . . . . 1,166,578 978,663 775,286Less—unallocated costs(1) . . . . . . . . . . . . . . . . . . . . . . . . . . 548,088 461,993 393,764
Income from operations . . . . . . . . . . . . . . . . . . . . . . . $ 618,490 $ 516,670 $ 381,522
(1) Includes $44,816, $43,900 and $35,916 of stock-based compensation expense for the years endedDecember 31, 2009, 2008, and 2007, respectively and $945, $8,149 and $5,922 of stock-based Indian fringebenefit tax expense for the years ended December 31, 2009, 2008 and 2007.
Geographic Area Information
Revenue and long-lived assets, by geographic area, are as follows:
North America(2) Europe(3) Other(5)(6) Total
2009Revenues(1) . . . . . . . . . . . . . . . . . . . . . . . . . . . . . . . . . . . . . . $2,594,210 $606,804 $ 77,649 $3,278,663Long-lived assets(4) . . . . . . . . . . . . . . . . . . . . . . . . . . . . . . . . $ 9,042 $ 3,145 $469,329 $ 481,516
2008Revenues(1) . . . . . . . . . . . . . . . . . . . . . . . . . . . . . . . . . . . . . . $2,228,355 $541,142 $ 46,807 $2,816,304Long-lived assets(4) . . . . . . . . . . . . . . . . . . . . . . . . . . . . . . . . $ 7,494 $ 2,470 $445,290 $ 455,254
2007Revenues(1) . . . . . . . . . . . . . . . . . . . . . . . . . . . . . . . . . . . . . . $1,768,763 $342,866 $ 23,948 $2,135,577Long-lived assets(4) . . . . . . . . . . . . . . . . . . . . . . . . . . . . . . . $ 12,860 $ 1,873 $341,314 $ 356,047
(1) Revenues are attributed to regions based upon customer location.(2) Substantially all relates to operations in the United States.(3) Includes revenue from operations in the United Kingdom of $353,471, $327,995 and $221,029 in 2009,
2008 and 2007, respectively.(4) Long-lived assets include property and equipment net of accumulated depreciation and amortization.(5) Includes our operations in the Asia Pacific region, Middle East and South America.(6) Substantially all of these long-lived assets relate to operations in India.
F-28

15. Quarterly Financial Data (Unaudited)
Summarized quarterly results for the two years ended December 31, 2009 are as follows:
Three Months Ended
Full Year2009 March 31 June 30 September 30 December 31
Revenues . . . . . . . . . . . . . . . . . . . . . . . . . . . . . . . $745,862 $776,592 $853,488 $902,721 $3,278,663Cost of revenues (exclusive of depreciation andamortization expense shown separatelybelow) . . . . . . . . . . . . . . . . . . . . . . . . . . . . . . . 419,708 433,340 475,599 520,796 1,849,443
Selling, general and administrative expenses . . . 166,872 170,003 193,806 190,678 721,359Depreciation and amortization expense . . . . . . . 21,152 21,579 22,301 24,339 89,371Income from operations . . . . . . . . . . . . . . . . . . . 138,130 151,670 161,782 166,908 618,490Net Income . . . . . . . . . . . . . . . . . . . . . . . . . . . . . 113,132 141,255 136,572 144,004 534,963Basic EPS . . . . . . . . . . . . . . . . . . . . . . . . . . . . . . 0.39 0.48 0.47 0.49 1.82(1)
Diluted EPS . . . . . . . . . . . . . . . . . . . . . . . . . . . . 0.38 0.47 0.45 0.47 1.78(1)
Three Months Ended
Full Year2008 March 31 June 30 September 30 December 31
Revenues . . . . . . . . . . . . . . . . . . . . . . . . . . . . . . . $643,106 $685,427 $734,726 $753,045 $2,816,304Cost of revenues (exclusive of depreciation andamortization expense shown separatelybelow) . . . . . . . . . . . . . . . . . . . . . . . . . . . . . . . 366,265 380,867 405,936 419,748 1,572,816
Selling, general and administrative expenses . . . 148,853 167,105 166,685 169,378 652,021Depreciation and amortization expense . . . . . . . 16,293 17,777 19,474 21,253 74,797Income from operations . . . . . . . . . . . . . . . . . . . 111,695 119,678 142,631 142,666 516,670Net Income . . . . . . . . . . . . . . . . . . . . . . . . . . . . . 101,873 103,856 112,828 112,288 430,845Basic EPS . . . . . . . . . . . . . . . . . . . . . . . . . . . . . . 0.35 0.36 0.39 0.39 1.49(1)
Diluted EPS . . . . . . . . . . . . . . . . . . . . . . . . . . . . 0.34 0.35 0.38 0.38 1.44(1)
(1) The sum of the quarterly basic and diluted EPS for each of the four quarters may not equal the EPS for theyear due to rounding.
F-29

Cognizant Technology Solutions Corporation
Valuation and Qualifying AccountsFor the Years Ended December 31, 2009, 2008 and 2007
(Dollars in Thousands)
Description
Balance atBeginning of
Period
Charged toCosts andExpenses
Charged toOther
AccountsDeductions/
Other
Balance atEnd ofPeriod
Accounts receivable allowance for doubtfulaccounts:2009 . . . . . . . . . . . . . . . . . . . . . . . . . . . . . . . . . $13,441 $3,347 $ — $ 323 $16,4652008 . . . . . . . . . . . . . . . . . . . . . . . . . . . . . . . . . 6,339 8,473 — 1,371 13,4412007 . . . . . . . . . . . . . . . . . . . . . . . . . . . . . . . . . 3,719 3,560 216 1,156 6,339
Warranty accrual:2009 . . . . . . . . . . . . . . . . . . . . . . . . . . . . . . . . . $ 5,669 $7,588 $ — $6,682 $ 6,5752008 . . . . . . . . . . . . . . . . . . . . . . . . . . . . . . . . . 4,234 6,470 — 5,035 5,6692007 . . . . . . . . . . . . . . . . . . . . . . . . . . . . . . . . . 2,772 4,824 — 3,362 4,234
Valuation allowance—deferred income tax assets:2009 . . . . . . . . . . . . . . . . . . . . . . . . . . . . . . . . . $ 7,883 $2,362 $ — $ 15 $10,2302008 . . . . . . . . . . . . . . . . . . . . . . . . . . . . . . . . . 5,887 3,606 (1,225) 385 7,8832007 . . . . . . . . . . . . . . . . . . . . . . . . . . . . . . . . . 3,989 1,637 325 64 5,887
F-30

EXHIBIT 31.1
CERTIFICATION
I, Francisco D’Souza, certify that:
1. I have reviewed this Annual Report on Form 10-K of Cognizant Technology Solutions Corporation;
2. Based on my knowledge, this report does not contain any untrue statement of a material fact or omit tostate a material fact necessary to make the statements made, in light of the circumstances under whichsuch statements were made, not misleading with respect to the period covered by this report;
3. Based on my knowledge, the financial statements, and other financial information included in thisreport, fairly present in all material respects the financial condition, results of operations and cashflows of the registrant as of, and for, the periods presented in this report;
4. The registrant’s other certifying officer and I are responsible for establishing and maintainingdisclosure controls and procedures (as defined in Exchange Act Rules 13a-15(e) and 15d-15(e)) andinternal control over financial reporting (as defined in Exchange Act Rules 13a-15(f) and 15d-15(f)) forthe registrant and have:
a) Designed such disclosure controls and procedures, or caused such disclosure controls andprocedures to be designed under our supervision, to ensure that material information relating tothe registrant, including its consolidated subsidiaries, is made known to us by others within thoseentities, particularly during the period in which this report is being prepared;
b) Designed such internal control over financial reporting, or caused such internal control overfinancial reporting to be designed under our supervision, to provide reasonable assuranceregarding the reliability of financial reporting and the preparation of financial statements forexternal purposes in accordance with generally accepted accounting principles;
c) Evaluated the effectiveness of the registrant’s disclosure controls and procedures and presented inthis report our conclusions about the effectiveness of the disclosure controls and procedures, as ofthe end of the period covered by this report based on such evaluation; and
d) Disclosed in this report any change in the registrant’s internal control over financial reporting thatoccurred during the registrant’s most recent fiscal quarter (the registrant’s fourth fiscal quarter inthe case of an annual report) that has materially affected, or is reasonably likely to materiallyaffect, the registrant’s internal control over financial reporting; and
5. The registrant’s other certifying officer and I have disclosed, based on our most recent evaluation ofinternal control over financial reporting, to the registrant’s auditors and the audit committee of theregistrant’s board of directors (or persons performing the equivalent function):
a) All significant deficiencies and material weaknesses in the design or operation of internal controlover financial reporting which are reasonably likely to adversely affect the registrant’s ability torecord, process, summarize and report financial information; and
b) Any fraud, whether or not material, that involves management or other employees who have asignificant role in the registrant’s internal control over financial reporting.
Dated: February 25, 2010
/S/ FRANCISCO D’SOUZAFrancisco D’Souza
President and Chief Executive Officer(Principal Executive Officer)

EXHIBIT 31.2
CERTIFICATION
I, Gordon Coburn, certify that:
1. I have reviewed this Annual Report on Form 10-K of Cognizant Technology Solutions Corporation;
2. Based on my knowledge, this report does not contain any untrue statement of a material fact or omit tostate a material fact necessary to make the statements made, in light of the circumstances under whichsuch statements were made, not misleading with respect to the period covered by this report;
3. Based on my knowledge, the financial statements, and other financial information included in thisreport, fairly present in all material respects the financial condition, results of operations and cashflows of the registrant as of, and for, the periods presented in this report;
4. The registrant’s other certifying officer and I are responsible for establishing and maintainingdisclosure controls and procedures (as defined in Exchange Act Rules 13a-15(e) and 15d-15(e)) andinternal control over financial reporting (as defined in Exchange Act Rules 13a-15(f) and 15d-15(f)) forthe registrant and have:
a) Designed such disclosure controls and procedures, or caused such disclosure controls andprocedures to be designed under our supervision, to ensure that material information relating tothe registrant, including its consolidated subsidiaries, is made known to us by others within thoseentities, particularly during the period in which this report is being prepared;
b) Designed such internal control over financial reporting, or caused such internal control overfinancial reporting to be designed under our supervision, to provide reasonable assuranceregarding the reliability of financial reporting and the preparation of financial statements forexternal purposes in accordance with generally accepted accounting principles;
c) Evaluated the effectiveness of the registrant’s disclosure controls and procedures and presented inthis report our conclusions about the effectiveness of the disclosure controls and procedures, as ofthe end of the period covered by this report based on such evaluation; and
d) Disclosed in this report any change in the registrant’s internal control over financial reporting thatoccurred during the registrant’s most recent fiscal quarter (the registrant’s fourth fiscal quarter inthe case of an annual report) that has materially affected, or is reasonably likely to materiallyaffect, the registrant’s internal control over financial reporting; and
5. The registrant’s other certifying officer and I have disclosed, based on our most recent evaluation ofinternal control over financial reporting, to the registrant’s auditors and the audit committee of theregistrant’s board of directors (or persons performing the equivalent function):
a) All significant deficiencies and material weaknesses in the design or operation of internal controlover financial reporting which are reasonably likely to adversely affect the registrant’s ability torecord, process, summarize and report financial information; and
b) Any fraud, whether or not material, that involves management or other employees who have asignificant role in the registrant’s internal control over financial reporting.
Dated: February 25, 2010
/S/ GORDON COBURN
Gordon CoburnChief Financial and Operating
Officer and Treasurer(Principal Financial and Accounting Officer)

EXHIBIT 32.1
CERTIFICATION PURSUANT TO 18 U.S.C. SECTION 1350,
AS ADOPTED PURSUANT TO
SECTION 906 OF THE SARBANES-OXLEY ACT OF 2002
In connection with the Annual Report on Form 10-K of Cognizant Technology Solutions Corporation (the“Company”) for the period ended December 31, 2009 as filed with the Securities and Exchange Commission onthe date hereof (the “Report”), the undersigned, Francisco D’Souza, President and Chief Executive Officer of theCompany, hereby certifies, pursuant to 18 U.S.C. Section 1350, that:
(1) The Report fully complies with the requirements of Section 13(a) or 15(d) of the SecuritiesExchange Act of 1934; and
(2) The information contained in the Report fairly presents, in all material respects, the financialcondition and results of operations of the Company.
Dated: February 25, 2010
/S/ FRANCISCO D’SOUZA *Francisco D’Souza
President and Chief Executive Officer(Principal Executive Officer)
* A signed original of this written statement required by Section 906 has been provided to CognizantTechnology Solutions Corporation and will be retained by Cognizant Technology Solutions Corporationand furnished to the Securities and Exchange Commission or its staff upon request.
EXHIBIT 32.2
CERTIFICATION PURSUANT TO 18 U.S.C. SECTION 1350,
AS ADOPTED PURSUANT TO
SECTION 906 OF THE SARBANES-OXLEY ACT OF 2002
In connection with the Annual Report on Form 10-K of Cognizant Technology Solutions Corporation (the“Company”) for the period ended December 31, 2009 as filed with the Securities and Exchange Commission onthe date hereof (the “Report”), the undersigned, Gordon Coburn, Chief Financial and Operating Officer,Treasurer and Secretary of the Company, hereby certifies, pursuant to 18 U.S.C. Section 1350, that:
(1) The Report fully complies with the requirements of Section 13(a) or 15(d) of the SecuritiesExchange Act of 1934; and
(2) The information contained in the Report fairly presents, in all material respects, the financialcondition and results of operations of the Company.
Dated: February 25, 2010
/S/ GORDON COBURN *Gordon Coburn,
Chief Financial and Operating Officer and Treasurer(Principal Financial and Accounting Officer)
* A signed original of this written statement required by Section 906 has been provided to CognizantTechnology Solutions Corporation and will be retained by Cognizant Technology Solutions Corporationand furnished to the Securities and Exchange Commission or its staff upon request.

[THIS PAGE INTENTIONALLY LEFT BLANK]

[THIS PAGE INTENTIONALLY LEFT BLANK]

DIRECTORS
John E. Klein (1) (2) (3)
Chairman of the Board
Cognizant,
President and
Chief Executive Officer
Polarex, Inc.
Lakshmi Narayanan
Vice Chairman
Cognizant
John N. Fox, Jr. (1) (3)
Former Vice Chairman
Deloitte & Touche LLP
Robert W. Howe (2) (3)
Chairman
ADS Financial Services Solutions
Robert E. Weissman (1) (3)
Chairman
Shelburne Investments
Thomas M. Wendel (2) (3)
Former Chief Executive Officer
Bridge Information Systems
Maureen Breakiron-Evans (2)
Former Chief Financial Officer
Towers Perrin
Francisco D’Souza
President and
Chief Executive Officer
Cognizant
BOARD COMMITTEES
(1) Compensation Committee
(2) Audit Committee
(3) Nominating and Corporate Governance Committee
EXECUTIVE OFFICERS
Lakshmi Narayanan
Vice Chairman
Francisco D’Souza
President and
Chief Executive Officer
Gordon J. Coburn
Chief Financial and
Operating Officer,
and Treasurer
Ramakrishnan Chandrasekaran
President and Managing Director,
Global Delivery
Rajeev Mehta
Chief Operating Officer,
Global Client Services
Steven Schwartz
Senior Vice President,
General Counsel
and Secretary
EXECUTIVE OFFICES
Glenpointe Centre West
500 Frank W. Burr Blvd.
Teaneck, NJ 07666
Phone: 201.801.0233
Fax: 201.801.0243
FORM 10-K
A copy of the Company’s Form 10-K is
available without charge upon request
by contacting Investor Relations at the
address or phone number listed.
COMMON STOCK INFORMATION
The Company’s Class A common stock
(CTSH) is listed on the NASDAQ Global
Select Market.
ANNUAL MEETING
The Company’s annual meeting
of stockholders will be held at
9:30 AM on Tuesday, June 1, 2010
at the Company’s headquarters:
Glenpointe Centre West
500 Frank W. Burr Blvd.
Teaneck, NJ 07666
LEGAL COUNSEL
Morgan, Lewis and Bockius, LLP
502 Carnegie Center
Princeton, NJ 08540
INDEPENDENT REGISTERED
PUBLIC ACCOUNTING FIRM
PricewaterhouseCoopers LLP
300 Madison Avenue
New York, NY 10017
TRANSFER AGENT
American Stock Transfer & Trust Co.
59 Maiden Lane
New York, NY 10038
1.800.937.5449
INTERNET
Additional company information is
available at www.cognizant.com
INVESTOR RELATIONS
Requests for financial information
should be sent to:
David Nelson
Cognizant Technology Solutions
Glenpointe Centre West
500 Frank W. Burr Blvd.
Teaneck, NJ 07666
Phone: 201.801.0233
CORPORATE INFORMATION

WORLD HEADQUARTERSGlenpointe Centre West500 Frank W. Burr Blvd.Teaneck, NJ 07666
PHONE: 201.801.0233FAX: 201.801.0243TOLL FREE: 888.937.3277www.cognizant.com