you look for options in everything you do. why not …firstchoiceinvestments.in/fit.pdf · you look...
TRANSCRIPT

You look for options in everything you do.Why not when it comes to your tax-saving instruments?
Before you invest, #AskWhatELSS
February 2016

Few Questions That Bother Investors?
?ŸTax saving avenues: Traditional or New?
*Ÿ Is ELSS a prudent avenue?
ŸWhen, how and which ELSS to invest in?
ŸHow important is market timing while
investing?
ŸWhat additional benefits does ELSS offer?
1
* Equity linked tax saving schemes
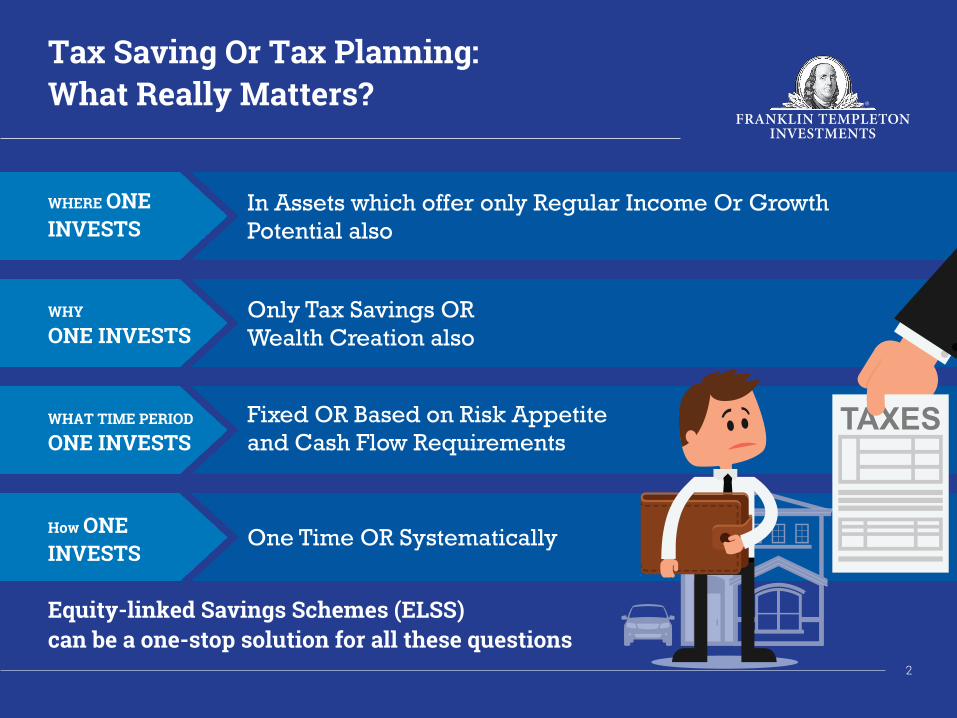
Tax Saving Or Tax Planning:
What Really Matters?
2
WHERE ONE
INVESTS
WHY
ONE INVESTS
WHAT TIME PERIOD
ONE INVESTS
How ONE
INVESTS
In Assets which offer only Regular Income Or Growth Potential also
Only Tax Savings OR Wealth Creation also
Fixed OR Based on Risk Appetite and Cash Flow Requirements
One Time OR Systematically
Equity-linked Savings Schemes (ELSS)
can be a one-stop solution for all these questions

Key Features:
ELSS vs Traditional Tax Saving Avenues
3
3 15^ 5 5
Capital gains & Dividends
Interest Interest Interest
Capital gains & Dividends are
Tax-free^^
Interest is Tax-free
Interest is Taxable
Interest is Taxable
Market Linked** Fixed Fixed Fixed
Avenues
Characteristics
Lock in period (in years)
Nature of gains
Tax treatment of gains^^
Type of returns
ELSS PPF NSC Bank FD
th^Partial withdrawals are allowed from 7 financial year and subject to conditions. However, full amount can only be withdrawn after 15 years.
Source: www.indiapost.gov.in for PPF and NSC and www.sbi.co.in for Bank FD.
^^ The information provided is for general information purpose only and the disclosures in respect of the tax implications are in accordance with prevailing tax laws and there can be no assurance or guarantee that the tax implications prevailing at the time of investment in the scheme will endure indefinitely. Further, statements with regard to tax implications mentioned herein are mere expressions of opinion and are not representations of the mutual fund to induce any investor to acquire units of the schemes of the mutual fund. In view of the individual nature of the implications, each investor is advised to consult with his or her own tax advisors/authorised dealers with respect to the specific tax and other implications arising out of his or her participation in the schemes.
**Returns are subject to market risks.

How Much Tax Can You Save?
Under section 80C, 80CCC and 80 CCD (1) of Income Tax Act 1961, an Individual / HUF
is entitled to an aggregate amount of deduction from Gross Total Income upto
Rs. 1.5 Lacs (from AY 2016-17) on specified qualifying investments / contributions /
deposits / payments.
Investments /
Contributions /
Deposits / Payments
of
Rs. 1,50,000
Tax savings
upto
Rs. 51,912*
*Assuming maximum marginal tax rate of 34.61% (including 30% income tax, 12% surcharge, 2% education cess and 1% secondary and higher education cess)
4

ELSS: Investment Rationale
BETTER INFLATION
ADJUSTED RETURNS
WEALTH
GENERATION OVER LONG TERM
PROFESSIONAL
MANAGEMENT
Equities may generate Real Positive Returns (adjusted for inflation)
Equities may help in Generating Wealth over long term
Active portfolio management with an objective to Reduce Volatility and Generate Alpha
5

Inflation and your returns
However, Equities may generate real positive returns (adjusted for inflation)
Average 3 year
rolling return** for
S&P BSE Sensex
11.8% 8.1%Average
Inflation^>*Assuming Inflation @ 6% for years 2020 and 2030. Past performance may or may not be sustained in future. **Returns: Compounded Annualized, 3 year rolling (with 1 month shift) from 30-Sep-2004 to 29-Feb-2016. ̂ Inflation taken for period between Sep-2004 & Feb-2016. Upto Dec 2011 CPI IW data is taken. From Jan 2012 CPI Combined data (new series) is taken.
6
Loaf of Bread
10
20
29*
48*
1 Litre Milk
25
45
60*
108*
1 Litre Petrol
28
69
92*
165*
HigherEducation
3 lakhs
17 lakhs
23 lakhs*
41 lakhs*
MILK
2000
2015
2020
2030
*Assuming Inflation @ 6% for years 2020 and 2030.

Equities (S&P BSE Sensex):
Long Term Potential
Equities may help in generating wealth over long term
Historical instances of +ve Performance
Historical instances of -ve Performance
62.2%
29.3%
21.1%
-18.5%
47.2%
3.7%
-1.5%
8.3%
14.9% 15.8% 16.% 16.0%
-30.0%
-20.0%
-10.0%
0.0%
10.0%
20.0%
30.0%
40.0%
50.0%
60.0%
70.0%
3 Year 5 Year 7 Year 10 Year
Maximum Returns Minimum Returns Average Returns
85.9%
14.1%
98.1%
1.9%
100%
0%
100%
0%
7
Past performance may or may not be sustained in future. Period – 10.04.1999 to 29.2.2016. Returns greater than 1 year period are compounded annualized. Note: The above graph shows the performance on a daily rolling return basis to compute returns for respective periods (3,5,7 and 10 years)

ELSS: Key Benefits
8
LOWER
LOCK-IN
PERIOD
TAX-FREE
GAINS
OPERATIONAL
EASE
POWER
OF TWO
ELSS currently has lowest lock-in period (3 years) among all tax saving investment avenues under section 80C of Income Tax Act,1961
Gains (either dividends or long term capital gains) are tax free as per current tax laws
Investment can be made either in lumpsum or systematically (SIPs)
Tax Saving + Potential for Long Term Wealth Creation

PRESENTING
FRANKLIN INDIA TAXSHIELD (FIT)An open end equity linked savings scheme
that is eligible for tax benefits on
investments up to Rs. 1.5 Lac under section
80C of the Income Tax Act, 1961
Investing in an ELSS gives you the double
advantage of saving tax and benefiting from
the growth potential of equities. What’s
more, it has a lock-in period of only 3 years.
9

About The Fund
FRANKLIN INDIA TAXSHIELD
Blend Of
Growth
And Value
Identifies
Opportunities Across
Market Cap
Resilient Across
Market Cycles
Long Term
Dividend
Track Record
10
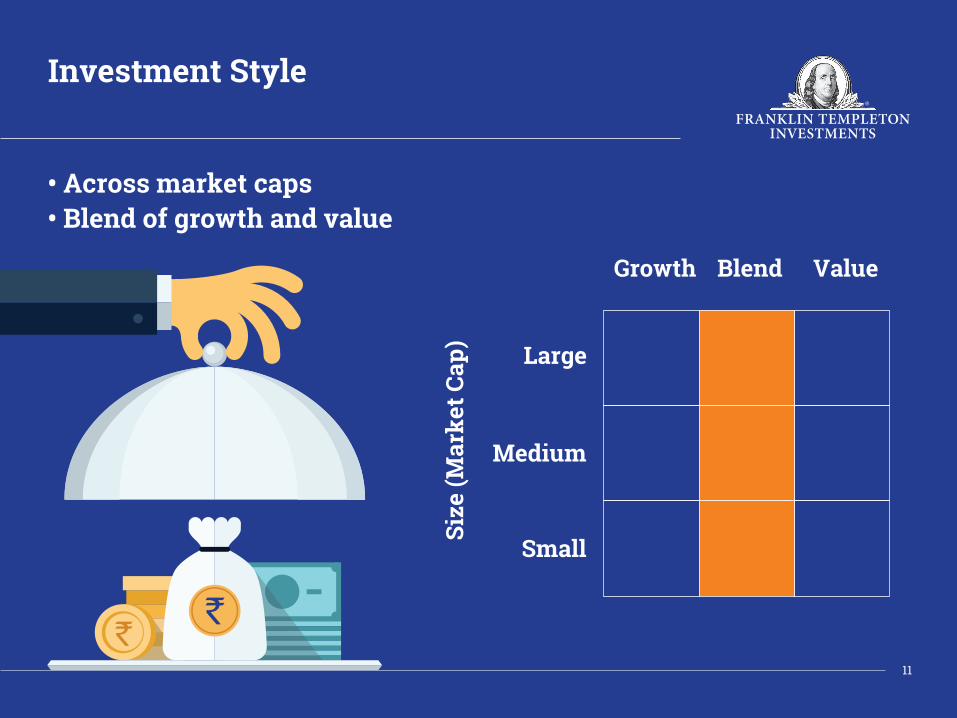
Investment Style
Growth Blend Value
Large
Medium
Small
• Across market caps
• Blend of growth and value
Siz
e (
Ma
rke
t C
ap
)
11

Investing across Market Cap
Franklin India Taxshield (FIT) (Allocation to Large Cap, Mid Cap & Small Cap)
Large Cap (%) Mid Cap (%) Small Cap (%)
Focused on identifying opportunities irrespective of market cap
Past performance may or may not be sustained in future. Information is historical and may not reflect current or future portfolio characteristics. Portfolio holdings are subject to change. Source: As per the internal classification. Data is as on Feb 29, 2016. Equity allocation in the fund is rebased to 100%.
12
0%
10%
20%
30%
40%
50%
60%
70%
80%
90%
100%
Feb-0
6
Aug-0
6
Feb-0
7
Aug-0
7
Feb-0
8
Aug-0
8
Feb-0
9
Aug-0
9
Feb-1
0
Aug-1
0
Feb-1
1
Aug-1
1
Feb-1
2
Aug-1
2
Feb-1
3
Aug-1
3
Feb-1
4
Aug-1
4
Feb-1
5
Aug-1
5
Feb-1
6

Fund Facts:
Long Term Dividend Track Record
Past performance may or may not be sustained in future.
Dividends on face value of Rs.10/-. Pursuant to payment of dividend, the NAVs of the schemes would fall to the extent of payout and statutory levies (as applicable). *Dividend yield is mentioned for Dividend option.
13
Year Record DateDividend Per
Unit (Rs.) (A)
Record Date NAV (Rs.)
Dividend Plan (B)
Record Date NAV
(Rs) Direct –
Dividend Plan
Dividend Yield*
(A/B)
2015
2016
January 30
January 22
3.00
3.50
47.2441
40.6886
47.9514
41.7001
6%
9%
2014 January 24 3.00 31.1896 31.3999 10%
2013 January 18 2.00 32.2527 32.2617 6%
2012 February 03 3.00 30.3111 NA 10%
2011 January 14 4.00 34.0334 NA 12%
2010 January 15 3.00 33.0523 NA 9%
2008 December 17 3.00 20.6681 NA 15%
November 14 8.00 46.8922 NA 17%
January 10 8.00 39.43 NA 20%
2006 February 15 3.50 38.01 NA 9%
2005 March 18 3.00 27.25 NA 11%
2004 February 24 4.00 24.01 NA 17%
2001 March 30 1.25 11.57 NA 11%
May 24 6.00 19.82 NA 30%
March 31 8.00 31.02 NA 26%
2007
2000

Fund Facts: Scheme Performance
As on Dec 31, 2015
Past performance may or may not be sustained in future. Fund Managers: FIBCF: Anand Radhakrishnan & Anand Vasudevan, FIT: Anand Radhakrishnan, FIPP: Anand Radhakrishnan & R. Janakiraman, FIF: Anand Radhakrishnan & Varun Sharma, FILSF: Equity-Anand Radhakrishnan; Debt-Sachin Padwal-Desai, Pallab Roy, FIMIP: Equity-Anand Radhakrishnan; Debt-Sachin Padwal-Desai & Umesh Sharma. B: Benchmark. AB: Additional Benchmark. N.A.: Not Applicable. *NAV (beginning of period). $Benchmark: The 50s Plus Plan - 20% S&P BSE Sensex+ 80% Crisil Composite Bond Fund Index; The 50s Plus Floating Rate Plan - 20% S&P BSE Sensex + 80% Crisil Liquid Fund Index. Discrete 12 months performance is absolute and since inception returns are compounded annualized. Load is not taken into consideration. Dividends assumed to be reinvested and Bonus is adjusted. The top three and bottom three funds managed by the fund manager(s) have been derived on the basis of the since inception returns. On account of difference in the type/category, asset allocation or investment strategy, inception dates, performances of these funds are not strictly comparable. Please refer to www.franklintempletonindia.com for details on performance of all schemes (including Direct Plans). # Index adjusted for the period September 16, 2005 to April 15, 2015 with the performance of S&P BSE IT Index.
14
Scheme
NAV as on Dec 31, 2015
Discrete Returns (%)
Since inception till Dec 31, 2015
Value of Investment of
Rs.10,000 since
inception
Inception DateDec 31, 2014 to Dec 31, 2015
Dec 31, 2013 to Dec 31, 2014
Dec 31, 2012 to Dec 31, 2013
NAV* Returns NAV* Returns NAV* Returns NAV* Returns
Franklin India Taxshield (FIT) -Growth 418.2161 401.9406 4.05% 256.1355 56.92% 241.3250 6.14% 10 24.99% 418,216 10.04.1999
B:Nifty 500 - - -0.72% - 37.82% - 3.61% - 14.53% 96,861
AB:Nifty 50 - - -4.06% - 31.39% - 6.76% - 13.23% 79,991
Performance of Top 3 and bottom 3 schemes managed by the fund managers of the scheme
Franklin India Bluechip Fund (FIBCF) - Growth 344.8196 338.0004 2.04% 246.3181 37.22% 236.6664 4.08% 10 22.12% 827,300 1.12.1993
B:S&P BSE SENSEX - - -5.03% - 29.89% - 8.98% - 9.83% 79,316
AB:Nifty 50 - - -4.06% - 31.39% - 6.76% - 9.80% 78,836
Franklin Infotech Fund (FIF) – Growth 113.8764 109.7588 3.75% 94.0101 16.75% 61.3091 53.34% 10 19.72% 227,784 22.8.1998
B: S&P BSE Information Technology # - - 4.51% - 16.54% - 59.78% - N.A. N.A.
AB:Nifty 50 - - -4.06% - 31.39% - 6.76% - 13.69% 92,891
Franklin India Prima Plus (FIPP) – Growth 435.8831 417.6007 4.38% 266.3419 56.79% 252.3438 5.55% 10 19.42% 435,883 29.9.1994
B:Nifty 500 - - -0.72% - 37.82% - 3.61% - 8.94% 61,796
AB:Nifty 50 - - -4.06% - 31.39% - 6.76% - 8.84% 60,593
Franklin India Monthly Income Plan (FIMIP) –Growth
44.3674 41.9480 5.77% 34.2746 22.39% 32.3434 5.97% 10 10.25% 44,367 28.9.2000
B: Crisil MIP Blended Fund Index - - 6.79% - 16.83% - 4.41% - N.A. N.A.
AB: Crisil 10 Year Gilt Index - - 7.39% - 14.14% - -0.68% - N.A. N.A.
Franklin India Life Stage Fund of Funds (FILSF) - The 50s Plus Floating Rate Plan – Growth
29.4135 27.5055 6.94% 23.9664 14.77% 22.2535 7.70% 10 9.85% 29,414 9.7.2004
Benchmark$ - - 5.57% - 13.21% - 9.15% - 9.22% 27,530
Additional Benchmark - - N.A - N.A - N.A - N.A N.A
FILSF - The 50s Plus Plan – Growth 27.9002 26.0729 7.01% 22.2305 17.28% 21.4038 3.86% 10 8.86% 27,900 1.12.2003
Benchmark$ - - 5.87% - 17.40% - 4.91% - 8.35% 26,380
Additional Benchmark - - N.A - N.A - N.A - N.A N.A

Fund Facts: Market Resilience
-100.00%
-50.00%
0.00%
50.00%
100.00%
150.00%
200.00%
250.00%
Te
ch
bu
bb
le p
ea
k
Te
ch
Cra
sh
& 9
/11
Re
co
ve
ry p
os
t 9
/11
Ind
ia R
e-r
ati
ng
20
08
Pe
ak
Glo
ba
l c
ris
is
Po
st-
Cri
sis
Pe
ak
Cu
rre
nt
Re
turn
s s
inc
e
inc
ep
tio
n
FIT-Growth B: Nifty 500 AB: Nifty 50
Tech Bubble Peak: th th10 Apr ‘99– 11 Feb ‘00.
Tech Crash and 9/11: th st
11 Feb ’00 – 21 Sep ‘01.
Recovery Post 9/11: st th21 Sep ‘01 – 14 Jan ’04.
India Re-rating: th th
14 Jan ‘04- 10 May ‘06.
2008 Peak: th th10 May ‘06- 8 Jan ‘08.
Global Crisis Lows: th th8 Jan’08- 9 Mar ‘09.
Post Crisis Peak: th th
9 Mar ‘09 – 9 Nov ‘10.
Current: th st9 Nov ‘10 – 31 Dec ‘15.
Past performance may or may not be sustained in future. Returns are calculated for growth plan and are compounded annualized for more than 1 year period. Inception Date: April 10 1999. Dividends are assumed to be reinvested and bonus is adjusted. Load is not taken into consideration. B: Benchmark, AB: Additional Benchmark.
15

Fund Facts: Portfolio Journey
Movement of Rs. 10,000 invested in FIT, Nifty 500 & Nifty 50
0
50000
100000
150000
200000
250000
300000
350000
400000
450000
500000
Ap
r-9
9
Ma
r-0
0
Fe
b-0
1
Ja
n-0
2
De
c-0
2
Oc
t-0
3
Se
p-0
4
Au
g-0
5
Ju
l-0
6
Ju
n-0
7
Ma
y-0
8
Ap
r-0
9
Ma
r-10
Fe
b-1
1
Ja
n-1
2
De
c-1
2
No
v-1
3
Oc
t-14
Se
p-1
5
FIT B: Nifty 500 AB: Nifty 50
Calendar year
FIT: Rs. 418,216
B: Nifty 500 - Rs. 96,861
AB: Nifty 50 - Rs. 79,991
Past performance may or may not be sustained in future. The graph shows the movement of Rs. 10,000 invested in FIT– Growth Plan , Nifty 500 and Nifty 50 since inception of the fund as on Dec 31, 2015. B: Benchmark and AB: Additional Benchmark. Inception Date: April 10, 1999. Please refer www.franklintempletonindia.com for details on performance of all schemes (including Direct Plans).
Ru
pe
es
16D
ec
-15

Fund Facts: Rolling Returns
Past performance may or may not be sustained in future. Period – 10.04.1999 to 31.12.2015. Load is not taken into consideration. Dividends are assumed to be reinvested. Returns greater than 1 year period are compounded annualized. Note: The above graph shows the performance on a daily rolling return basis to compute returns for respective periods (3,5,7 and 10 years).
74.3%
44.7%
31.4%
-12.9%
53.7%
15.4%
3.7%
8.9%
22.7%22.6%23.4%23.1%
-20.0%
-10.0%
0.0%
10.0%
20.0%
30.0%
40.0%
50.0%
60.0%
70.0%
80.0%
3 Year 5 Year 7 Year 10 Year
Maximum Returns Minimum Returns Average Returns
93.8%
6.2%
100%
0%
100%
0%
100%
0%
Historical instances of +ve Performance
Historical instances of -ve Performance
Franklin India Taxshield
17
Though past performance may or may not be sustained in future, historically,
there have been no instances of loss for investments held for over 5 years
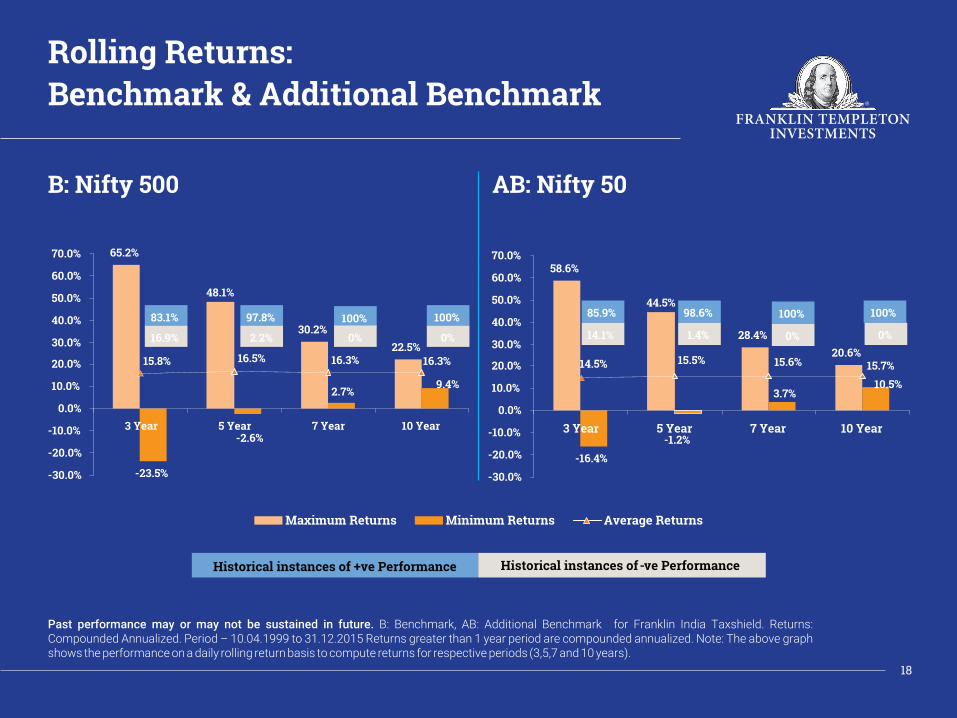
Rolling Returns:
Benchmark & Additional Benchmark
65.2%
30.2%
22.5%
-23.5%
48.1%
-2.6%
2.7%9.4%
15.8% 16.5% 16.3% 16.3%
-30.0%
-20.0%
-10.0%
0.0%
10.0%
20.0%
30.0%
40.0%
50.0%
60.0%
70.0%
3 Year 5 Year 7 Year 10 Year
83.1%
16.9%
97.8%
2.2%
100%
0%
100%
0%
58.6%
28.4%
20.6%
-16.4%
44.5%
10.5%
-1.2%
3.7%
15.7%15.6%15.5%14.5%
-30.0%
-20.0%
-10.0%
0.0%
10.0%
20.0%
30.0%
40.0%
50.0%
60.0%
70.0%
3 Year 5 Year 7 Year 10 Year
Maximum Returns Minimum Returns Average Returns
85.9%
14.1%
98.6%
1.4%
100%
0%
100%
0%
B: Nifty 500 AB: Nifty 50
Historical instances of +ve Performance Historical instances of -ve Performance
Past performance may or may not be sustained in future. B: Benchmark, AB: Additional Benchmark for Franklin India Taxshield. Returns: Compounded Annualized. Period – 10.04.1999 to 31.12.2015 Returns greater than 1 year period are compounded annualized. Note: The above graph shows the performance on a daily rolling return basis to compute returns for respective periods (3,5,7 and 10 years).
18
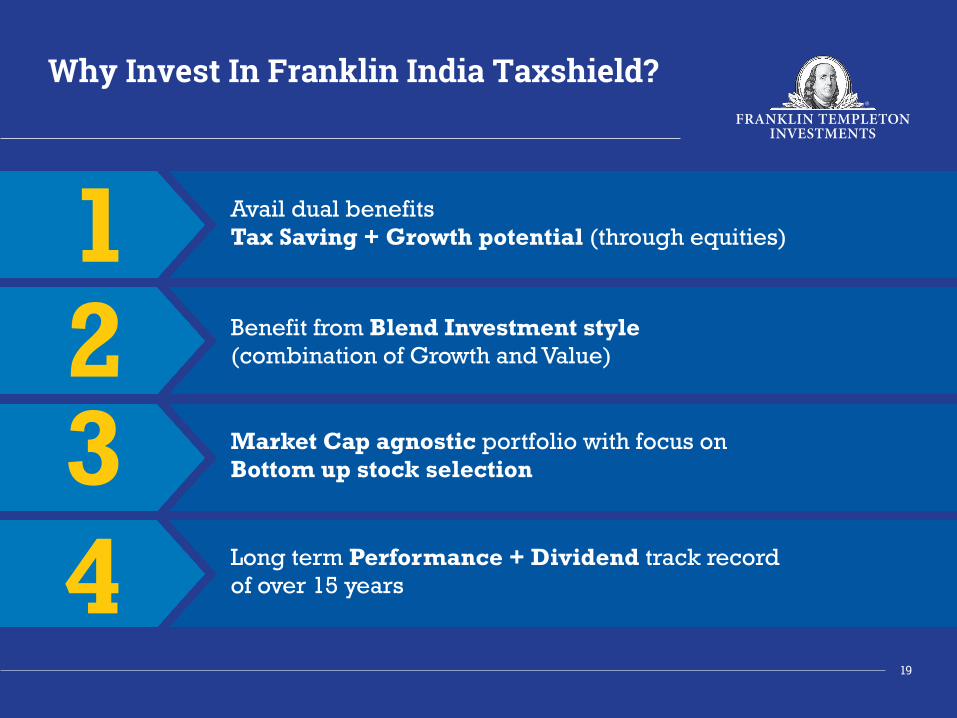
Why Invest In Franklin India Taxshield?
Avail dual benefitsTax Saving + Growth potential (through equities)
Benefit from Blend Investment style(combination of Growth and Value)
Market Cap agnostic portfolio with focus onBottom up stock selection
Long term Performance + Dividend track recordof over 15 years
1234
19

Risk Factors
This presentation is dated February 2016.
representation of every material fact regarding any industry, security or the fund and is neither an offer for units nor
an invitation to invest. This communication is meant for use by the recipient and not for circulation/reproduction
without prior approval. The views expressed by the portfolio managers are based on current market conditions and
information available to them and do not constitute investment advice. Regulatory/ taxation details mentioned in
the article are provided on a best effort basis and are as per the existing laws and subject to change from time to time.
The recipient is advised to consult its advisor/ tax consultant prior to arriving at any investment decision.
Scheme Classification and Objective: Franklin India Taxshield (FIT): An open-ended Equity Linked Savings Scheme
with an objective to provide medium to long term growth of capital along with income tax rebate. Load Structure:
FIT Entry Load: Nil: Exit Load: Nil. All subscriptions in FIT are subject to a lock in period of 3 years from the date of
allotment and the unit holder cannot redeem, transfer, assign or pledge the during the period. The Trustee, AMC,
their directors or their employees shall not be liable for any of the tax consequences that may arise, in the event that
the schemes are wound up before the completion of the lock-in period. Investors are requested to review the
prospectus carefully and obtain expert professional advice with regard to specific legal, tax and financial
implications of the investment/participation in the scheme.
The NAVs of the schemes may go up or down depending upon the factors and forces affecting the securities market.
The Mutual Fund is not guaranteeing or assuring any dividend under any of the schemes and the same is subject to
the availability and adequacy of distributable surplus. The past performance of the mutual funds managed by the
Franklin Templeton Group and its affiliates is not necessarily indicative of future performance of the schemes.
The information contained in this presentation is not a complete
Mutual Fund investments are subject to market risks, read all scheme related documents carefully.

Franklin Templeton Asset Management (India) Pvt. Ltd.
Indiabulls Finance Centre, Tower 2, 12th and 13th floor, Senapati Bapat Marg, Elphinstone (W), Mumbai 400013
Tel (91-22) 6751 9100 • Fax (91-22) 6639 1281 • www.franklintempletonindia.com