young people in the czech · pdf fileyoung people in the czech republic ... 3. 2. young...
TRANSCRIPT

1
YOUNG PEOPLE IN THE CZECH REPUBLIC
Ministry of Education, Youth and Sports Department for Youth Affairs
2003
2
CONTENTS INTRODUCTION
4
1. VALUE PREFERENCES
5
2. YOUNG PEOPLE�S POSITION IN RELIGIOUS AND SOCIO- POLITICAL MOVEMENTS
7
2. 1. The attitude of Czech youth toward religious movements 7 2. 2. Attitudes of Czech youth toward socio-political movements
9
3. THE CZECH AND EUROPEAN IDENTITY 11 3. 1. Important periods and great figures in Czech history 11 3. 2. Young people�s opinions on significant events in recent Czech history 16 3. 3. Patriotism, allegiance to Europe and European integration 17 3. 4. Young people�s language skills
22
4. ATTITUDES TOWARD MARGINAL GROUPS 25 4. 1. Attitudes toward national, ethnic and religious groups 25 4. 2. Factors influencing the creation of attitudes 29 4. 3. Attitudes toward marginal groups 30 5. LEISURE TIME
31
5. 1. Leisure-time activities 32 5. 2. Leisure-time preferences in general 38 5. 3. Developments in young people�s leisure-time activities 40 5. 4. Leisure-time facilities 41 6. TIME PICTURE
44
7. DRUGS, ALCOHOL, NICOTINE 52 7. 1. Drugs 52 7. 2. Alcohol 54 7. 3. Nicotine
54
8. PARTICIPATION IN MANAGEMENT 58 8. 1. Civic and political participation 58 8. 2. Economic participation
59
9. SOCIAL-ECONOMIC POSITION AND ITS PERCEPTION BY YOUNG PEOPLE 61 9. 1. Perception of one�s economic situation 61 9. 2. Perception of poverty 62 9. 3. Job satisfaction 65 9. 4. Professional prospects 67 9. 5. Unemployment 68 9. 6. Commuting 69 9. 7. Interest in working abroad 69 9. 8. Qualifications for being successful in the labor market 70 9. 9. Interest in running a business 71 9. 10. Housing problems
72

3
10. SOCIAL TIME-SPACE
73
10. 1. Major problems in life 73 10. 2. Life goals 76 10. 3. Career
77
11. PUBLIC ADMINISTRATION IN RELATION TO THE YOUTH IN THE CZECH REPUBLIC AND INSTITUTIONS THAT ARE INVOLVED IN YOUTH ISSUES
79
12. NON-GOVERNMENTAL, NON-PROFIT ORGANIZATIONS INVOLVED IN CHILDREN AND YOUTH WORK
81
CONCLUSIONS
84
4
INTRODUCTION The goal of this study is to inform the public about the results of research aimed at getting a comprehensive idea of Czech youth as the Czech Republic prepares to join the European Union. This research, which was made possible by a two-year grant provided by the Czech Ministry of Education, Youth and Sports, was based on findings from previous ministry-financed research: The Structure and Development of Young People’s Leisure-time Activities, Young People’s Relationship to Political Parties and Other Elements of the Political System, The Development of Young People�s Value Preferences, Spirituality and Youth, and The Media in Young People�s Lives. The research was also based on findings from Diagnosis, Prognosis and the Possibility of Re-socializing Groups, particularly Young People Endangered by Negative Trends in Society, which was financed from a grant awarded by the Czech Interior Ministry, as well as other research conducted by the author of this study and which is summarized in the study The Metamorphosis of Czech Youth. The ministry�s aim was to become thoroughly acquainted with today�s youth. The research primarily focused on how young people spend their leisure time, determining their values, attitudes toward marginal groups, integration into the European Union, patriotism and their notion of what it means to be European amid globalization and multi-cultural influences, their participation in administration, their socio-economic position and position on the labor market, language skills, life goals and problems. The research was conceived as interdisciplinary, being theoretically and methodologically focused on sociology and overlapping into pedagogy and psychology. The basic techniques �including standardized interviews and questionnaires and survey by questionnaire - were complemented by an analysis of the contents of the relevant documents and by observation. The empiric part consisted of two research projects undertaken in the form of a time picture. The data was collected in 2001. The unique nature of the project, and the value it has currently and for the future, stems from the fact that it proved possible to make connections between selective parts of the three research projects. The empirical research was prepared so as to be representative of the entire Czech population. A quota selection was used to form a selective group based on education and age. With a view to building up the interviewer network on a regional representative basis, the group is representative in terms of regions of the country as well. Both groups were set up to be representative as regards the same age subgroup. If we consider the group to be a unit, we can achieve proper representation by weighing. The population group older than 30 years included 692 respondents, and the population group between 15 and 30 years consisted of 1,186 respondents, of which 46% were men, 22% married and 20% have children. A total of 17% of the respondents were between the ages of 15 and 18, 35% between 19 and 23, and 48% between 24 and 30. As for education, 24% of the respondents had a basic education, 23% passed vocational training, 38% of the respondents were secondary-school graduates and 15% of the respondents were university graduates. The data was statistically analyzed in the SPSS (including a factor analysis) and Answer Tree programs.
5
The results presented are a selection of the most important findings. A detailed version of this study is available in the library of the Ministry of Education, Youth and Sports.
1. VALUE PREFERENCES Values play an important role in a person�s motivational structure. Value systems had been expected to change as a result of the social changes. An earlier project investigating value preferences had not revealed any metamorphosis in value preferences. Indeed, it is more of a development process -- some groups of values become more important while others lose importance. Basically, no profound changes have occurred. However, when evaluating the value system, it should be noted that the value system�s influence is changed by other personality elements and social conditions under which a specific value is implemented. The country�s preparations to join the European Union have created the conditions for a fairly similar value system to come about. Other phenomena should be taken into consideration as well. While the importance of ideologies and socio-political systems has diminished, pragmatism and the type of behavior referred to by Max Weber as �purposefully rational� are becoming more common. The individual does not primarily act on the basis of inner values but rather with a view to obtaining benefits. In such a case, even if an individual has a value system, it will not have much of an impact on his behavior In our research, we applied a value-examination methodology using a set of values whose importance was assessed by a respondent according to a five-grade scale, with 1 being the least important and 5 the most important. Indexes for each value were determined according to frequency as a weighted arithmetical mean; a table was created according to the magnitude of indexes. The order is arranged according to the indexes of the group aged 15 to 30. Health is considered the most important in all of the age groups surveyed. The Czech population realizes that health is of primary importance, as it allows all other activities to be pursued. Health is a prerequisite of all the other activities as well as a prerequisite for having a basic feeling of satisfaction with life.

6
Table: Value index by age group Age Groups
15 - 18 19 - 23 24 - 30 15 - 30 Health 4.82 4.84 4.87 4.85 Love 4.70 4.65 4.69 4.68 Spouse 4.50 4.67 4.65 4.63 Family and children 4.44 4.54 4.69 4.59 Friendship 4.62 4.60 4.55 4.58 Peace, life without war 4.53 4.55 4.58 4.56 Freedom 4.57 4.63 4.50 4.56 Healthy environment 4.46 4.38 4.55 4.48 Democracy 4.26 4.31 4.22 4.26 Truth, cognition 4.23 4.27 4.16 4.21 Interesting job 4.24 4.16 4.18 4.18 Developing one�s personality 4.24 4.17 4.10 4.15 Education 4.26 4.07 3.94 4.04 Being successful in work 4.15 4.01 3.95 4.01 Being useful for other people 3.91 3.94 3.92 3.92 Salary, other income 3.96 3.85 3.87 3.88 Satisfying one�s own interests 4.06 3.92 3.67 3.82 Fortune 3.54 3.44 3.28 3.38 Good reputation in society 3.00 2.76 2.59 2.72 Community service 2.76 2.67 2.51 2.61 Business activity 2.75 2.55 2.49 2.56 God 2.09 2.44 2.24 2.28 Involvement in politics 1.68 1.56 1.41 1.51
Youth between 15 and 30 years of age placed love in second place. Love helps people to get over their egotism, and teaches them how to live with and enrich other people. People often consider those things that they have not achieved, but have longed for them, as important. It is open to discussion whether the significance attributed to love proves that love is a part of young people�s lives or rather that the appreciation results from its absence. A spouse is ranked third -- which again is a value that belongs to a group of reproduction values and preferences. It is often heard that the family, as an institution, is in crisis. It is interesting in this context that Czech youth consider the family to be as important as love. The importance of the family is connected with a certain phase of life, and its importance increases in older age groups (4.44 - 4.54 - 4.69). Love, family and a spouse are values with similarly high indexes. The Czech population considers the traditional life connected with a family and children to be important despite the fact that marriage is more and more being postponed to an older age. In recent years, a bigger importance is being attached to values that had earlier been on the decline. While love, spouse, family and children rank high in terms of values, children are no longer being born and marriages not entered into. Perhaps, rising importance attached to these

7
values is a reaction of the �system� to demographic developments. Love, spouse, family and children are scarce, and as such their value is increasing on the basis of the market mechanism. Also ranking among the values are those related to an individual�s surroundings. While the above-mentioned values are closely connected with the individual, the following values reflect the wider social and physical environment in which the individual lives. Peace, life without war and a healthy environment are if people are to live full lives. The ranking of God at the next to last place is evidence of the atheism prevalent in Czech society. Involvement in politics ranks last, possibly due to the skepticism that arose after the upheaval in November 1989 as well as global trends and the manifestation of postmodernism. Postmodernism does not seek one universal ideology � there is no one right way. Perhaps, when a right way is not expected to be found, there is no desire to seek one and hence no need for political involvement.
2. YOUNG PEOPLE�S POSITION IN RELIGIOUS AND SOCIO-
POLITICAL MOVEMENTS To a large extent, the 19th and 20th centuries can be characterized as conflicts of ideas and ideologies. Real conflicts between groups and national interests were, at the same time, conflicts of ideas and ideologies. The end of the 20th century brought a dramatic change toward understanding history as a conflict of ideologies and how they enter into the life of a society. The end of the Cold War and the bi-polar world was considered to have been the end of history and ideologies. The international political situation and prevailing postmodern theories and approaches in the 1990s have formed a social-political climate in which contemporary youth matures socially and politically. How do Czech young people orient themselves in this situation, what ideas do they prefer and how do they develop? These were the issues that we wanted to investigate by questioning respondents: Does s/he consider her/himself to be a follower or a supporter of a religious, spiritual, ideological or societal movement? 2. 1. The attitude of Czech youth toward religious movements Indexes were calculated for specific religious and spiritual movements and for each age group as a weighted arithmetic mean. For young people between the ages of 15 and 18, the Roman Catholic Church is the most widely accepted, although the church�s position is the weakest in this group when compared with other age groups. This suggests that the position of the Roman Catholic Church in Czech society will continue to get weaker. For those between 23 and 45 years old, the position of the Roman Catholic Church is stable. The position of the Roman Catholic Church is more important in the age group close to retirement age. Yoga, new age and Buddhism rank behind the Roman Catholic Church for youth aged 15-18, although these three movements rank the highest in this age group, showing that they are becoming more important in Czech society population and that their position is improving.
8
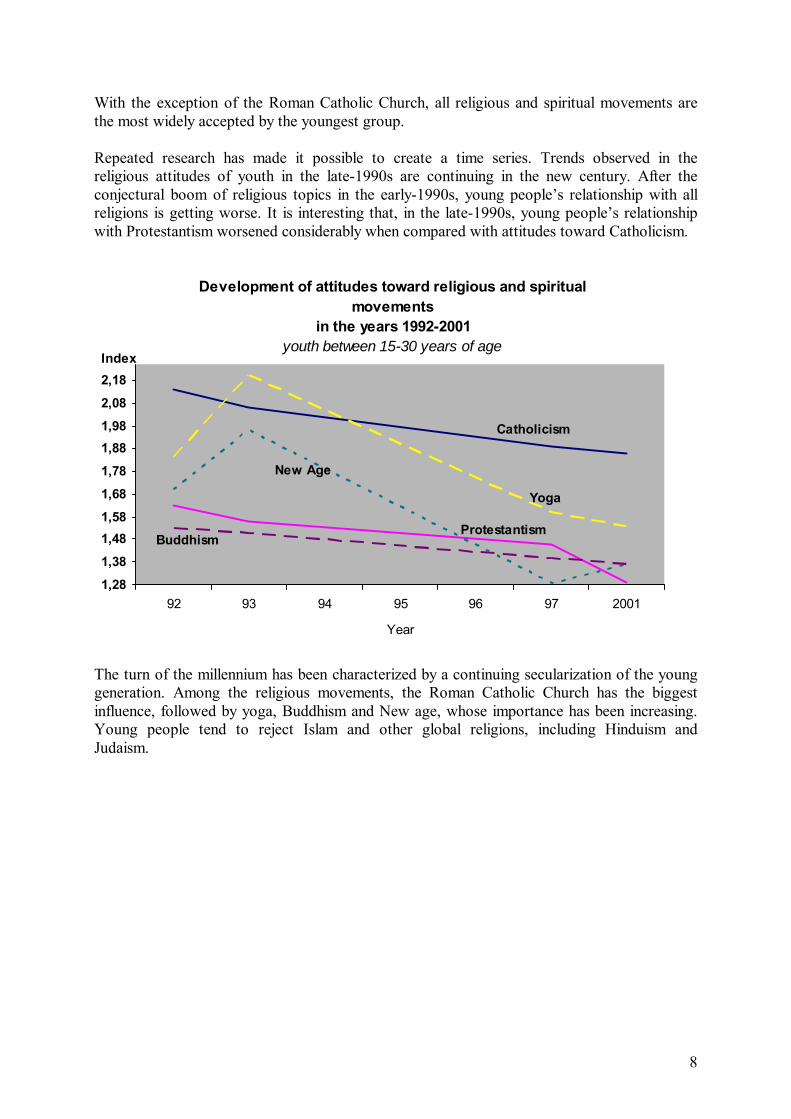
With the exception of the Roman Catholic Church, all religious and spiritual movements are the most widely accepted by the youngest group. Repeated research has made it possible to create a time series. Trends observed in the religious attitudes of youth in the late-1990s are continuing in the new century. After the conjectural boom of religious topics in the early-1990s, young people�s relationship with all religions is getting worse. It is interesting that, in the late-1990s, young people�s relationship with Protestantism worsened considerably when compared with attitudes toward Catholicism.
Development of attitudes toward religious and spiritual movements
in the years 1992-2001youth between 15-30 years of age
Catholicism
Protestantism
Yoga
New Age
Buddhism
1,281,381,481,581,681,781,881,982,082,18
92 93 94 95 96 97 2001
Year
Index
The turn of the millennium has been characterized by a continuing secularization of the young generation. Among the religious movements, the Roman Catholic Church has the biggest influence, followed by yoga, Buddhism and New age, whose importance has been increasing. Young people tend to reject Islam and other global religions, including Hinduism and Judaism.
9
Table: Attitudes toward religions
Age 15-18 19-23 24-30 31-45 46-60 61- total
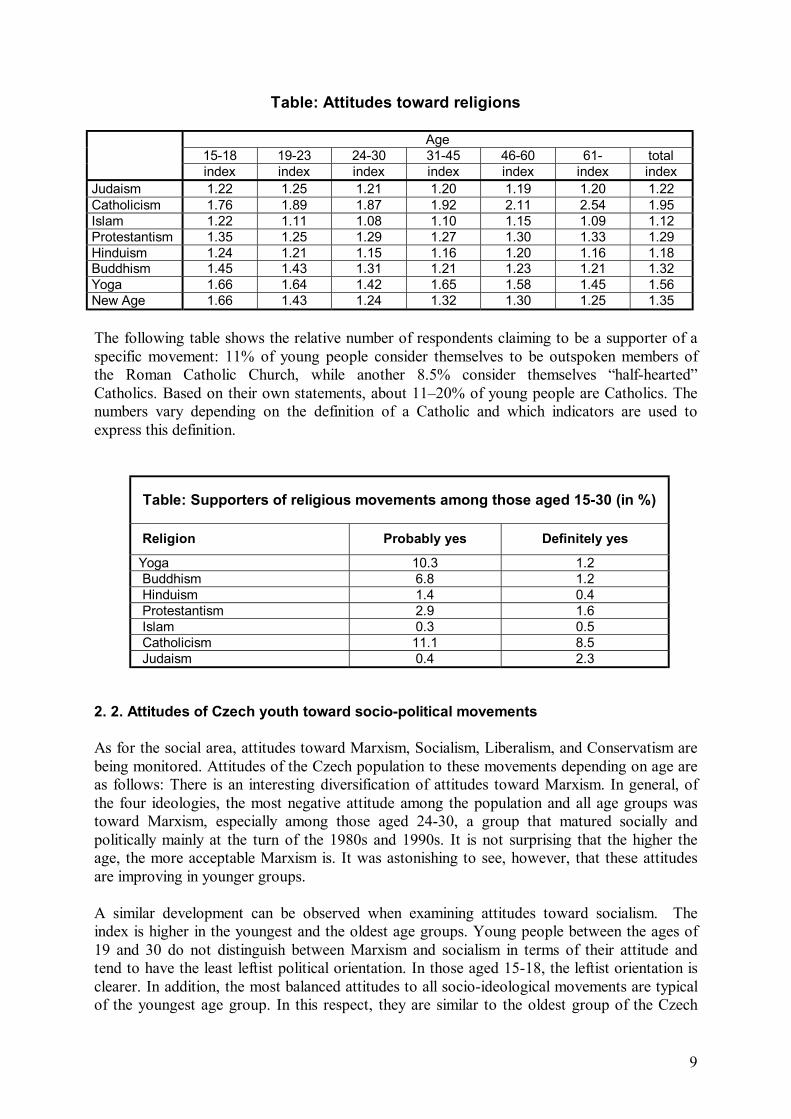
index index index index index index index Judaism 1.22 1.25 1.21 1.20 1.19 1.20 1.22 Catholicism 1.76 1.89 1.87 1.92 2.11 2.54 1.95 Islam 1.22 1.11 1.08 1.10 1.15 1.09 1.12 Protestantism 1.35 1.25 1.29 1.27 1.30 1.33 1.29 Hinduism 1.24 1.21 1.15 1.16 1.20 1.16 1.18 Buddhism 1.45 1.43 1.31 1.21 1.23 1.21 1.32 Yoga 1.66 1.64 1.42 1.65 1.58 1.45 1.56 New Age 1.66 1.43 1.24 1.32 1.30 1.25 1.35 The following table shows the relative number of respondents claiming to be a supporter of a specific movement: 11% of young people consider themselves to be outspoken members of the Roman Catholic Church, while another 8.5% consider themselves �half-hearted� Catholics. Based on their own statements, about 11�20% of young people are Catholics. The numbers vary depending on the definition of a Catholic and which indicators are used to express this definition.
Table: Supporters of religious movements among those aged 15-30 (in %)
Religion Probably yes Definitely yes
Yoga 10.3 1.2 Buddhism 6.8 1.2 Hinduism 1.4 0.4 Protestantism 2.9 1.6 Islam 0.3 0.5 Catholicism 11.1 8.5 Judaism 0.4 2.3
2. 2. Attitudes of Czech youth toward socio-political movements As for the social area, attitudes toward Marxism, Socialism, Liberalism, and Conservatism are being monitored. Attitudes of the Czech population to these movements depending on age are as follows: There is an interesting diversification of attitudes toward Marxism. In general, of the four ideologies, the most negative attitude among the population and all age groups was toward Marxism, especially among those aged 24-30, a group that matured socially and politically mainly at the turn of the 1980s and 1990s. It is not surprising that the higher the age, the more acceptable Marxism is. It was astonishing to see, however, that these attitudes are improving in younger groups. A similar development can be observed when examining attitudes toward socialism. The index is higher in the youngest and the oldest age groups. Young people between the ages of 19 and 30 do not distinguish between Marxism and socialism in terms of their attitude and tend to have the least leftist political orientation. In those aged 15-18, the leftist orientation is clearer. In addition, the most balanced attitudes to all socio-ideological movements are typical of the youngest age group. In this respect, they are similar to the oldest group of the Czech

10
population. Between 24 and 60, there is a big discrepancy between leftist and rightist attitudes. The group of population between 25 and 30 has clearly adopted rightist attitudes. Youth aged 15-18 prefer Liberalism and place socialism second. If these developments continue, a big ideological gap will open between the present groups of those around 25 years of age, which is right leaning, and the left-leaning youngest group. There is a risk that an abrupt socio-political development will take place again, bringing with it dramatic changes. The most homogenous attitudes are found among the youngest group and pensioners. The greatest differences in opinion are identified in the age group between 23 and 60. Leftist attitudes are largely disliked by those aged 24 to 30, who tend to prefer Liberalism. As this study used the same methodology as was used in research conducted in 1993 to examine the attitudes of Czech youth in relation to socio-ideological movements, developments over the last seven years can be examined. The results are shown in the following diagram:
1 1,2 1,4 1,6 1,8 2 2,2
Index
Marxism
Socialism
Liberalism
Conservatism
Attitudes of Czech youth toward socio-political movements
youth at the age of 15 - 30 years in the year 1993 and 2001
20011993
We can see that attitudes worsened toward all movements (mostly to liberalism). Young people consider themselves to be less and less supporters of any socio-ideological movement. A considerable decrease in this respect can be observed with all movements, in keeping with global trends that youth, and thus part of the global population, do not need an ideology.

11
Table: Attitudes toward socio-political movements
age 15-18 19-23 24-30 31-45 46-60 61- total
index index index index index index index Marxism 1.30 1.13 1.07 1.23 1.30 1.48 1.19 Socialism 1.44 1.14 1.13 1.39 1.53 1.81 1.31 Liberalism 1.63 1.66 1.69 1.78 1.86 1.84 1.73 Conservatism 1.39 1.44 1.61 1.79 1.84 1.71 1.62 Others 1.56 1.48 1.33 1.36 1.32 1.37 1.40
Table: Attitudes towards socio-ideological movements depending on a position on a right-left scale
Position on a scale Marxism Socialism Liberalism Conservatisms leftist orientation left-center center right-center rightist orientation I do not know Total
2.19 1.35 1.14 1.09 1.10 1.17 1.19
3.03 1.77 1.22 1.18 1.13 1.20 1.31
1.69 1.50 1.67 1.94 2.03 1.41 1.73
1.51 1.46 1.62 1.84 1.86 1.32 1.62
3. THE CZECH AND EUROPEAN IDENTITY The 1990s and the turn of the millennium were extremely important for the formation of the Czech state. In 1992, Czechoslovakia was dissolved and an independent, nationally homogenous Czech state was formed for the first time in modern history. In the 1990s, political as well as diplomatic activities were performed in relation to European integration. Issues including Czech identity, patriotism, nationalism, national identity, and European identity were on the agenda. Describing and understanding the dynamics of the Czech identity require Czech history to be comprehended and understood. The relationship between the Czech population and the European identity cannot be understood without looking into the Czech identity, and the transformation of the Czech identity cannot be understood without examining attitudes toward Czech history. As a result, a question concerning Czech history was incorporated into the research. 3. 1. Important periods and great figures in Czech history The topic of history was included into the research in the form of the question �Which period or event in Czech history do you consider to be the most important?� The answers were listed and categorized.

12
Table: Important periods in Czech history - Youth between 15 and 30 (in %)
November 1989 - Velvet Revolution 29.85 Formation of Czechoslovakia in 1918 20.24 Charles IV�s era 8.60 Hussite movement 3.88 The First Republic (1918-1938) 3.20 Formation of the Czech Republic in 1993 2.02 The National Revival 1.69 Prague spring in 1968 1.52 Arrival of Cyril and Methodius 1.18 Restoration of Czechoslovakia in 1945 1.01 The Great Moravian Empire 0.67 February 1948 (Communist coup) 0.51 Era of Přemysl rulers 0.34 Other 14.50 Nothing stated 10.62 Total 100.00
The event ranked first is not a typical historical event, as our contemporaries were actors in this event. About 30% of young people consider November 1989 being the most important event in Czech history. The formation of Czechoslovakia in 1918 was considered by 20% of the respondents as being the most important, ranking it second. The third most important historical event is the time of Charles IV, when the Czech lands were the center of world at the time (9%). The Hussite movement ranked fourth. Other events in Czech history are considered important only by a tiny fraction of current youth. The author of this study applied the same methodology to the Czech population�s opinions on Czech history and individual events at a crucial point in modern Czech history � the dissolution of Czechoslovakia and the formation of the Czech Republic. In late 1992, most young people considered the November 1989 upheaval to have been the most important event in the history of the Czech state and in Czech history and ranked the formation of Czechoslovakia in 1918 second. Charles IV�s era was third and the Hussite movement ranked fourth. Only 5% or less of young people considered other historical events to be important. In 1992, only 2.5% of young people considered the 1968 Prague Spring important. The following diagram shows a shift in the historical notions of young people. In the first years after the formation of the Czech Republic (in 1993), the number of young people who considered the November revolution to be the most important event in Czech history increased, as did the importance of the formation of Czechoslovakia. When considering all other events, the number of young people who regarded them important decreased. The Hussite movement saw the most significant drop in its assessment, mainly due to a new historical interpretation of the Hussite movement, especially the opinion of the Roman Catholic Church and intellectuals connected with it. Two historical events � the formation of Czechoslovakia in 1918 and the upheaval in November 1989 � are regarded as being of key importance by half of the young generation.

13
Important periods in Czech history - 1992 - 2001 Youth 15 - 30
0 5 10 15 20 25 30
November 1989 - Velvet Revolution
Formation of Czechoslovakia in 1918
Charles IV�s era
Hussite movement
The First Republic (1918-1938)
Formation of the Czech Republic in 1993
The National Revival
Prague spring in 1968
Arrival of Cyril and Methodius
Restoration of Czechoslovakia in 1945
The Great Moravian Empire
February 1948 (Communist coup)
Era of Přemysl rulers
%
Year 1992Year 2001
The historical awareness of youth can be examined not only on the basis of assessing historical events but also of significant historical personalities. As such, the research identified opinions on the importance of personalities in Czech history with the same methodology. It was evident that only a few personalities in Czech history enjoy general respect. It is interesting and rather depressing that personalities that had once been widely adored disappeared from the stage when they were deprived of their power and position in society. A good example of this is Alexandr Dubček, who was once one of the most famous figures of the 20th century -- not only in our country but also in a global context. At present, only 0.17% of young people � or two respondents - named him as an important figure in Czech history. The position once held by Dubček is now enjoyed by Václav Havel.

14
Table: Great Figures in Czech History
� Youth between 15-30 (in %) Charles IV 27.66 Masaryk 24.79 Havel 9.11 Hus 8.77 Komenský 7.42 Others 3.54 Scientists, artists 3.20 St. Wenceslas 2.02 Přemysl rulers 1.85 Rulers other than Přemysl rulers 1.69 �i�ka 1.18 Klaus 0.34 Post-1989 politicians in general 0.34 Jiří of Poděbrady 0.34 Dubček 0.17 Communist politicians between 1948 and 1989 0.17 None 7.42 Total 100.00
From young people�s perspective, two great figures of nearly the same importance can be found in Czech history � Charles IV and T.G. Masaryk, which are considered the most important by half of the young generation. They are followed by Vaclav Havel, Jan Hus and J. A. Komenský, all of whom are rated less than 10%.

15
0 5 10 15 20 25 30 %
Karel IV. Masaryk
Havel
Kom enský
Hus �i�ka
Přem ysl rulers
Rulers other than Přem ysl rulers
Klaus Jiřík z Poděbrad
Communist politicians betw een 1948 and1989
20011992
Great Figures in Czech H istory � 1992 to 2001
Young people�s assessment of the most significant personalities of Czech history - Charles IV and T.G. Masaryk � has improved over the last eight years. These two personalities seem to personify the ideals and values that are now appreciated by the Czech population, combining world repute with allegiance to the Czech nation. Neither of them is connected to nationalism; instead both of them considered allegiance to the Czech nation and traditions to be high values. They introduced positive global cultural values into the Czech context while putting forward the best that Czech culture had to offer into the European and/or global cultural context. These personalities prove that one can simultaneously be European and Czech. The importance of other historical figures has diminished � particularly that of Václav Havel and J.A. Komenský. For Václav Havel, this decrease can be explained by the fact that he is assessed more realistically. J. A. Komenský�s relationship to the evangelic church may explain his drop in rating vis-à-vis the Roman Catholic Church�s strengthening of its position. An examination of young people�s historical awareness and assessment of historical figures allows us to use this knowledge in educating youth.

16
3. 2. Young people�s opinions on significant events in recent Czech history Young people do not often get the opportunity to actively participate in a unique historical event such as the end of Czechoslovakia and the formation of a new state � the Czech Republic. The author of this study sociologically mapped the opinions of the Czech population around the time when Czechoslovakia was dissolved and the Czech Republic established (from mid December 1992 to early January 1993). The respondents were asked to what extent they agreed or disagreed with a set of statements covering a wide spectrum of phenomena connected with that event. After eight years, respondents were asked to make comments on the same set of statements. When we compare the opinions at the time of the formation of the Czech Republic and current opinions, we can see to what extent the expectations were fulfilled.
Table: Opinions on the consequences of Czechoslovakia�s dissolution - youth between 15 and 30 (in %)
Definitely not
Probably not
I do not
know Probably yes
Definitely yes
I do not know Total
Dynamic development of the Czech economy 12,73 33,28 26,66 20,54 3,06 3,74 100,00 First decline, than positive development 3,40 25,64 33,28 26,99 5,09 5,60 100,00 Continual deterioration of economic conditions 9,68 35,31 27,50 20,37 2,89 4,24 100,00 Increase in standard of living from the beginning 8,49 28,86 28,01 28,69 2,38 3,57 100,00 Deterioration of relationship between Czechs and Slovaks 6,10 32,54 17,97 33,05 8,81 1,53 100,00 Growth of nationalism in the Czech Republic 11,02 27,29 32,03 22,37 3,73 3,56 100,00 Czech Republic will be threatened by Germany 28,86 35,14 21,56 9,34 2,55 2,55 100,00 Deterioration of international position 18,98 36,44 23,05 13,56 4,58 3,39 100,00 Worse conditions of integration 17,12 35,25 28,14 12,54 3,22 3,73 100,00 Impoverishment of Czech cultural life 9,49 22,37 16,27 35,08 14,75 2,03 100,00
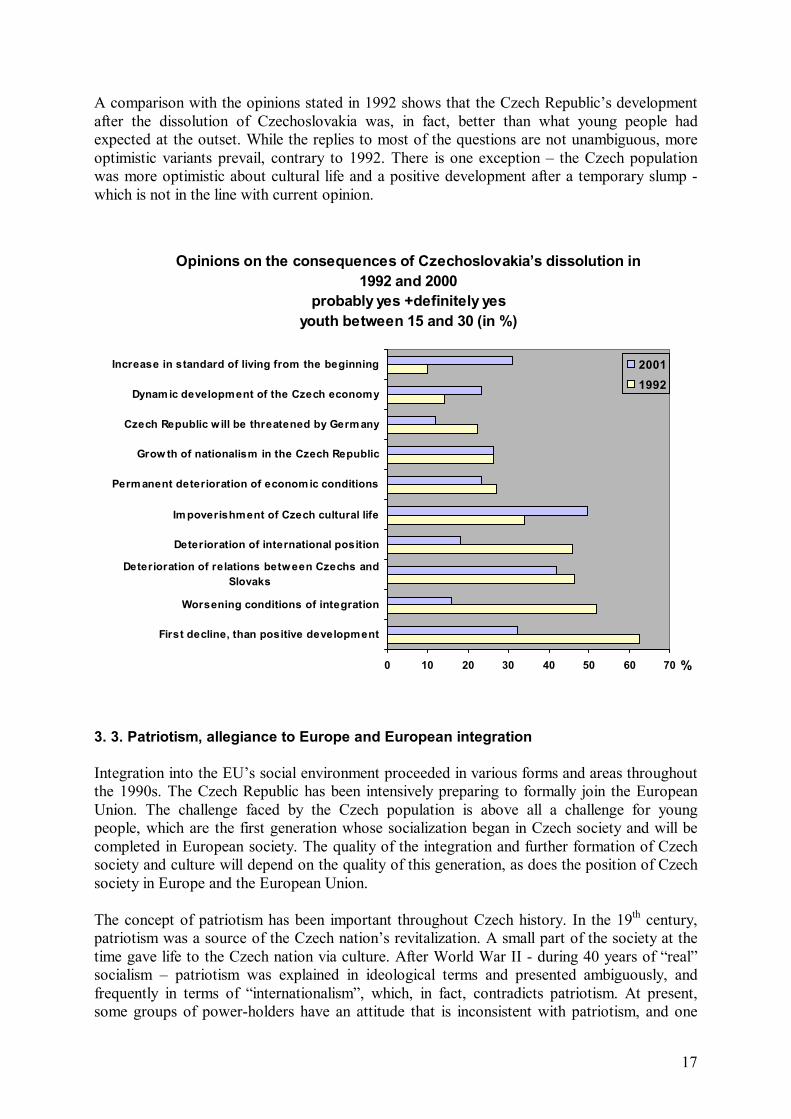
When examining the opinions found in individual age brackets, positive expectations were considered to have been fulfilled by the group aged 19 to 30 (about 12% - dynamic development, a promising development coming after a period of decline) and the group from 19 � 23 (8% on average) that appreciate the rising standard of living. Negative expectations were fulfilled according to the group aged 24 to 30 (especially that Czech cultural life would be impoverished, according to 54% of the respondents).
17
A comparison with the opinions stated in 1992 shows that the Czech Republic�s development after the dissolution of Czechoslovakia was, in fact, better than what young people had expected at the outset. While the replies to most of the questions are not unambiguous, more optimistic variants prevail, contrary to 1992. There is one exception � the Czech population was more optimistic about cultural life and a positive development after a temporary slump - which is not in the line with current opinion.
Opinions on the consequences of Czechoslovakia�s dissolution in 1992 and 2000
probably yes +definitely yesyouth between 15 and 30 (in %)
0 10 20 30 40 50 60 70
First decline, than positive development
Worsening conditions of integration
Deterioration of relations between Czechs andSlovaks
Deterioration of international position
Im poverishment of Czech cultural life
Perm anent deterioration of econom ic conditions
Grow th of nationalism in the Czech Republic
Czech Republic w ill be threatened by Germ any
Dynam ic development of the Czech economy
Increase in standard of living from the beginning
%
20011992
3. 3. Patriotism, allegiance to Europe and European integration Integration into the EU�s social environment proceeded in various forms and areas throughout the 1990s. The Czech Republic has been intensively preparing to formally join the European Union. The challenge faced by the Czech population is above all a challenge for young people, which are the first generation whose socialization began in Czech society and will be completed in European society. The quality of the integration and further formation of Czech society and culture will depend on the quality of this generation, as does the position of Czech society in Europe and the European Union. The concept of patriotism has been important throughout Czech history. In the 19th century, patriotism was a source of the Czech nation�s revitalization. A small part of the society at the time gave life to the Czech nation via culture. After World War II - during 40 years of �real� socialism � patriotism was explained in ideological terms and presented ambiguously, and frequently in terms of �internationalism�, which, in fact, contradicts patriotism. At present, some groups of power-holders have an attitude that is inconsistent with patriotism, and one

18
often connected with nationalism. Patriotism is sometimes considered to be in contradiction to European integrity, the formation of the European identity and implementing multi-culturalism in modern society. Our research investigated the importance of the Czech state by asking the question �What value does the Czech state or Czech statehood have for you?� The perceived importance was rated according to a scale of 1-5, with 1 corresponding to the least importance and 5 the highest importance. The table shows that the perceived importance of Czech statehood decreases with the age of the respondent.
Table: Importance of Czech statehood perceived by specific age brackets
Age 15 - 18 19 - 23 24 � 30 31 � 45 46 � 60 61 - Index 3.73 3.93 3.94 4.12 4.20 4.34
Czech people�s opinions on the importance of patriotism in general and in relation to Czech patriotism were investigated via a set of 12 statements that were rated by each respondent. This set of statements also covered the notion of patriotism. The diagram below compares young people�s opinions with those of middle-aged and elderly generations on the basis of an index (a weighted arithmetic mean). All of Czech society, including the young generation, rejects the notions that Czech patriotism is outdated and that the nation is losing its importance in an integrating Europe. This is the opinion of both the young generation and the elder generation, which more frequently emphasizes the importance of national culture and is less interested in pursuing a career abroad.
Opinions on the importance of a nation
2 2,5 3 3,5 4 4,5 5
Nation is losing itsimportance
Each nation has itsown unique value
Czech patriotism isoutdated
Looking for jobabroad
Importance ofnational culture
index
31 andmore15 - 30
The opinion most clearly stated by young people is that each nation, culture and history are unique values that should be protected and fostered. Czechs consider living amid the national culture and the Czech nation to be a very important value. Middle aged and elderly people
19
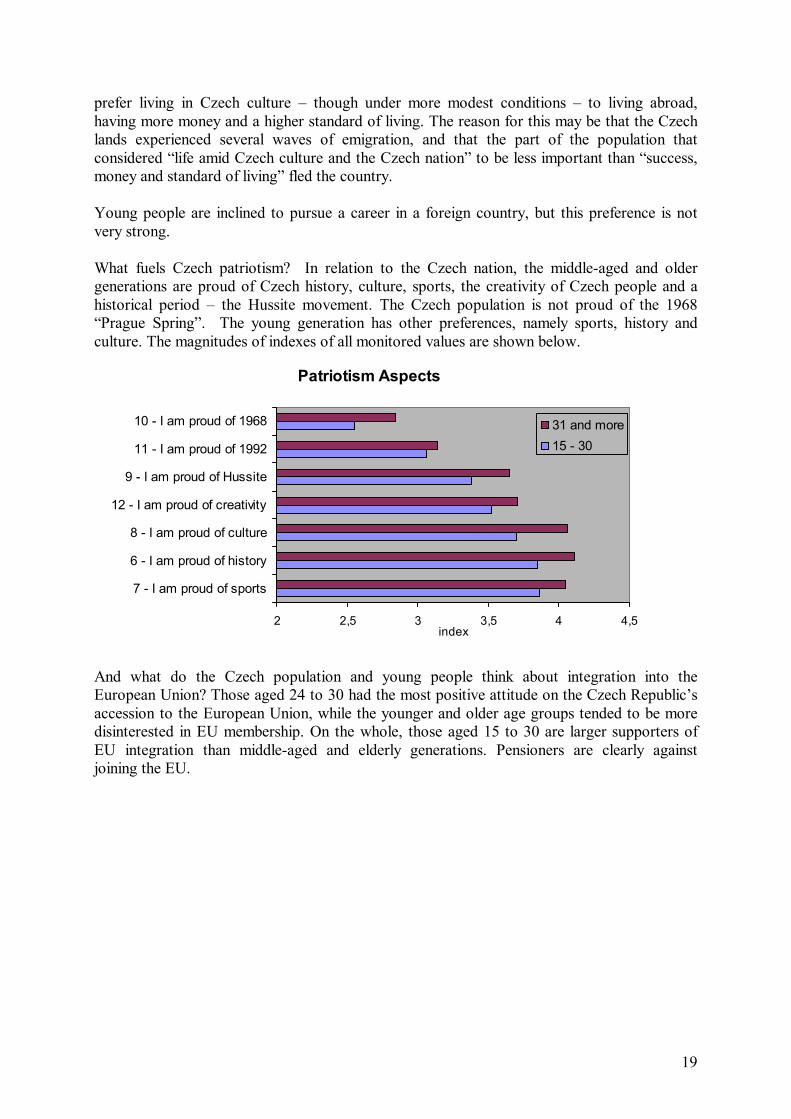
prefer living in Czech culture � though under more modest conditions � to living abroad, having more money and a higher standard of living. The reason for this may be that the Czech lands experienced several waves of emigration, and that the part of the population that considered �life amid Czech culture and the Czech nation� to be less important than �success, money and standard of living� fled the country. Young people are inclined to pursue a career in a foreign country, but this preference is not very strong. What fuels Czech patriotism? In relation to the Czech nation, the middle-aged and older generations are proud of Czech history, culture, sports, the creativity of Czech people and a historical period � the Hussite movement. The Czech population is not proud of the 1968 �Prague Spring�. The young generation has other preferences, namely sports, history and culture. The magnitudes of indexes of all monitored values are shown below.
Patriotism Aspects
2 2,5 3 3,5 4 4,5
7 - I am proud of sports
6 - I am proud of history
8 - I am proud of culture
12 - I am proud of creativity
9 - I am proud of Hussite
11 - I am proud of 1992
10 - I am proud of 1968
index
31 and more15 - 30
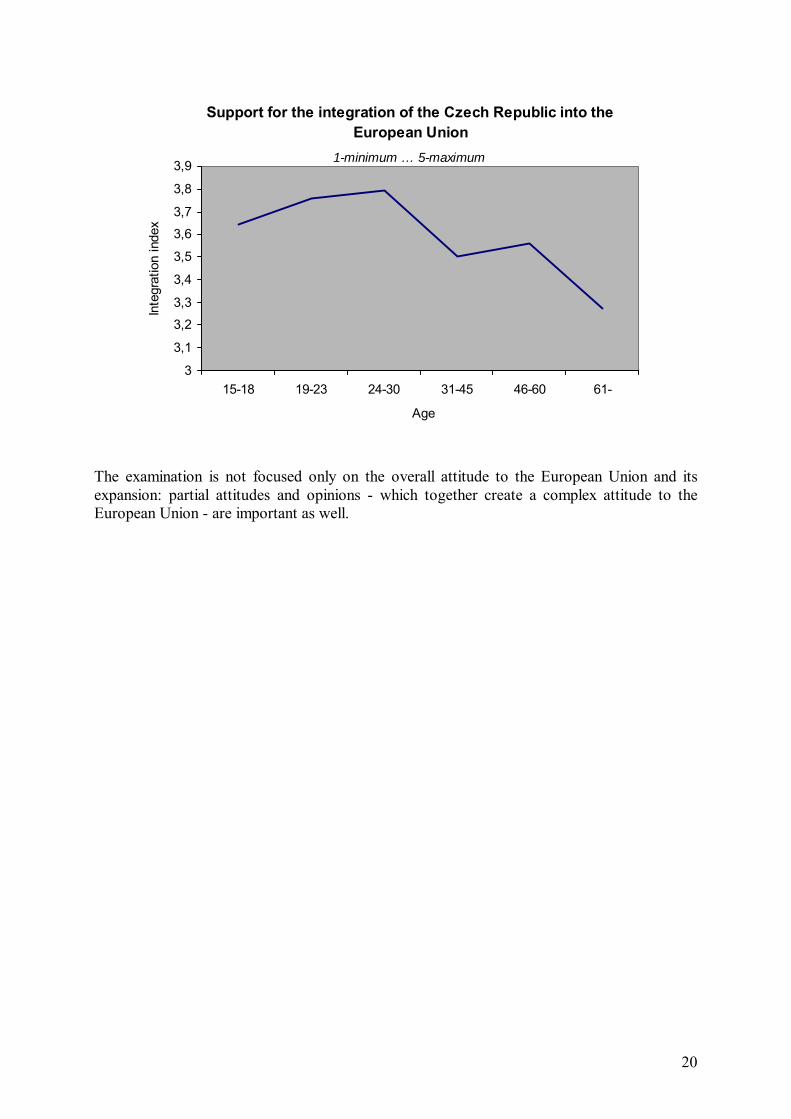
And what do the Czech population and young people think about integration into the European Union? Those aged 24 to 30 had the most positive attitude on the Czech Republic�s accession to the European Union, while the younger and older age groups tended to be more disinterested in EU membership. On the whole, those aged 15 to 30 are larger supporters of EU integration than middle-aged and elderly generations. Pensioners are clearly against joining the EU.
20
Support for the integration of the Czech Republic into the European Union
1-minimum … 5-maximum
3
3,1
3,23,3
3,4
3,5
3,63,7
3,8
3,9
15-18 19-23 24-30 31-45 46-60 61-
Age
Inte
grat
ion
inde
x
The examination is not focused only on the overall attitude to the European Union and its expansion: partial attitudes and opinions - which together create a complex attitude to the European Union - are important as well.

21
Consequences of the Czech integration into the EU
2 2,5 3 3,5 4 4,5 5
Traveling easily trhoughout Europe
Studying opportunities anyw here in Europe
Job opportunities in entire Europe
Benef its for science
More space for successful career
Enrichment by contact w ith other cultures
Option to live anyw here in Europe
More space for Czech economy
Fostering human rights
Grow th of standard of living
Endangering Czech agriculture
Feeling of European appurtenance
Endangering Czech economy
Higher devel. level of "Europeanism"
Restriction of severeignity
Implementation of Czech philosophers´ ideas
Elimination or supressing of negative phenomena
Subordination to large countries
Endangering national identity
index
31 and over15 - 30
There are no evident differences in understanding the consequences of Czech integration into the EU among the young, middle-aged and elderly. The young generation prefers �traveling�, �studying� and �working� in EU countries, while the middle-aged and elderly emphasize the potential risks of integration. In the Czech Republic, voices are heard that put into contradiction those supporting Czech integration into the EU and those representing the values of Czech society and culture, putting patriotism and Europeanism in opposition to each other. The research reveals that, in fact, this contradiction does not exist. Together with the increasing importance of the Czech state and statehood, positive attitudes toward EU accession are more apparent in youth. A similar link is obvious between the importance of Czech statehood and the understanding of the �formation of a European identity� as a high socio-historical process within the European socio-cultural environment. With the increasing value of Czech statehood, respondents have a more positive attitude to higher social entities such as Europe and mankind. The following table shows a similar link between the opinion that �allegiance to the European identity is a higher level of development� and an attitude to higher social entities. The most vocal

22
supporters of this opinion have the most positive attitude to the Czech nation and Czech state, to Europe and mankind.
Table: Dependency between Europeanism and attitudes toward higher social
entities Youth 15 – 30, index
High level of development �
�awareness of allegiance to Europeanism"
Czech nation Czech state Europe Mankind
1 2.67 2.54 2.04 2.83 2 2.72 2.63 2.30 2.78 3 2.77 2.74 2.53 2.80 4 2.89 2.88 2.74 3.19 5 3.33 3.56 3.30 3.59
The research revealed a consistency between Czech patriotism, the European identity and the understanding of the awareness of allegiance to the European identity as a qualitative new development phase within the European socio-cultural environment. The young generation has a more positive attitude to the European integration than the older generations. Young people prefer the specific pragmatic aspects of European integration such as traveling easily and job opportunities. The middle-aged and elderly generations prefer the cultural and social aspects of European integration. Patriotism and the value of Czech statehood on one side and the value of allegiance to the European identity increase with the education level of an individual. The higher an individual�s education level, the higher his/her reflection of importance of national culture and allegiance to the European identity. 3. 4. Young people�s language skills Czech society�s participation in globalization and its integration into European structures, both on a formal and informal basis, depend above all on the language skills of the Czech population. An examination of the conditions and prerequisites of our integration into the Europe must include a study of the Czech population�s language skills, especially those of the young generation. We are interested in both the current situation and trends in learning foreign languages. Young people�s language skills were examined in a standardized interview with a representative set of 1,900 respondents. Each respondent rated his/her knowledge of foreign languages according to a scale from 1 to 6. Three world languages are widespread in the Czech population: English, German and Russian. Knowledge of French, Spanish and other languages is marginal. Knowledge of English and Russian is more or less contradictory. The younger the population, the better knowledge of English and the poorer knowledge of Russian. The diagram shows clearly the influence of the occupation of Czechoslovakia by the Soviet Army. The Czech population�s knowledge of the Russian language culminated around 1968. After August 1968, the occupation was reflected in the attitudes of the entire generation, consequently influencing knowledge of the Russian language. In the 1980s, the influence of this attitude weakened and knowledge of Russian improved. The Czech population is roughly split in half by generations

23
in terms of foreign language knowledge. Up to the age of about 45, English is the dominant foreign language, while from the age of 45 Russian is. At present, knowledge of English culminates around the age of graduation from university and decreases with age. The diagram of the development of English knowledge reflects the boom of interest in English 11 years ago. Knowledge of English can be expected to gradually increase even after university graduation. Knowledge of German is better in the oldest generation, which experienced the Nazi Protectorate of Bohemia and Moravia. The generation that attended school and studied after World War II has the poorest knowledge of German. From the mid 1950s to the present, knowledge of German has increased and the youngest generation has a much better knowledge of German than of Russian. After English, German is the second foreign language of the Czech population. The preference of English and German by the Czech population is logical. English is the global language of the Internet and IT, and German is the language of our most important neighbor and with whom economic, political and cultural relations will be fostered. The following diagram illustrates specific levels of knowledge. The highest level of knowledge, rated by grades 4 and 5 (using a language actively, knowledge is as good as that of the mother tongue), is most frequent in the 24-30 age group. It is obvious that university study is insufficient for reaching the highest grades of knowledge skills. Such skills must be improved by other forms of education. Knowledge corresponding to grade 5 cannot be found in those above age 45. Knowledge on the level of grades 2 and 3 (poor and good knowledge), which is the most frequent in the population, decreases significantly with age. The middle grade is the most frequent in the middle-aged generation.
1-poor
2
34
5-best
0
5
10
15
20
25
30
35
15-18 19-23 24-30 31-45 46-60 61-Age
%
Knowledge of English by age
How do Czechs learn English, and how effective are these methods? The number of young people (aged 15-30) who use specific forms of language education can be seen in the
24
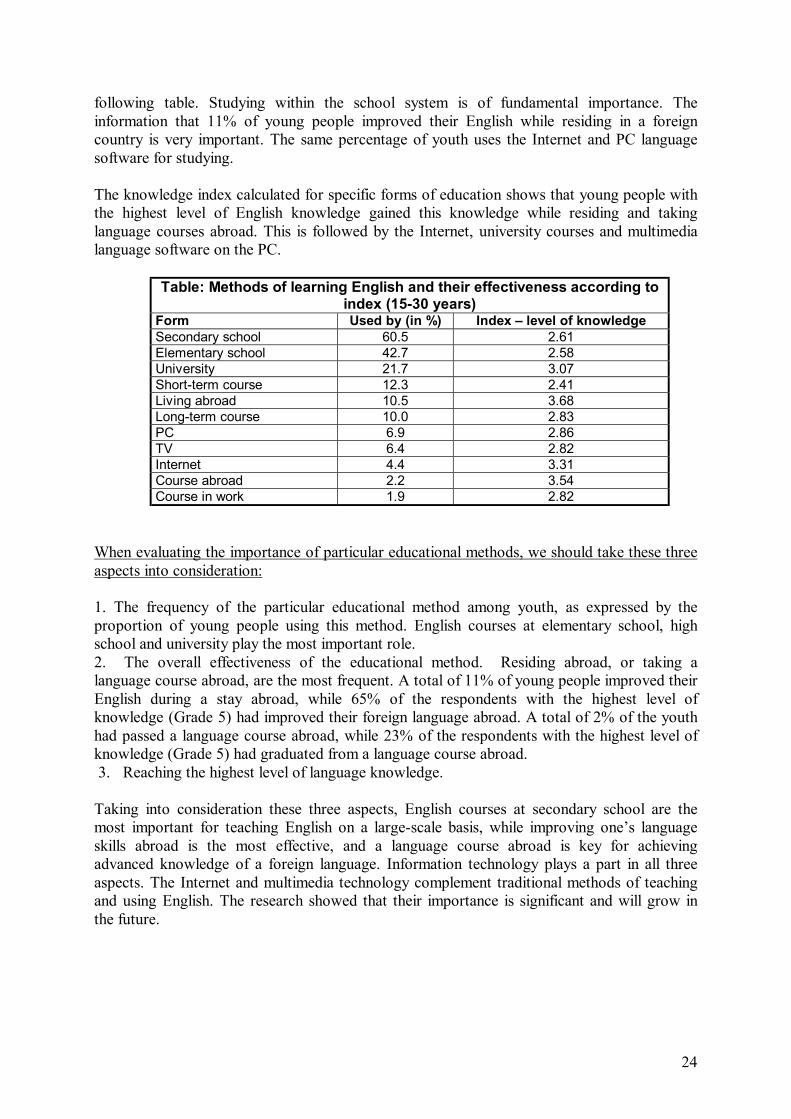
following table. Studying within the school system is of fundamental importance. The information that 11% of young people improved their English while residing in a foreign country is very important. The same percentage of youth uses the Internet and PC language software for studying. The knowledge index calculated for specific forms of education shows that young people with the highest level of English knowledge gained this knowledge while residing and taking language courses abroad. This is followed by the Internet, university courses and multimedia language software on the PC.
Table: Methods of learning English and their effectiveness according to index (15-30 years)
Form Used by (in %) Index � level of knowledge Secondary school 60.5 2.61 Elementary school 42.7 2.58 University 21.7 3.07 Short-term course 12.3 2.41 Living abroad 10.5 3.68 Long-term course 10.0 2.83 PC 6.9 2.86 TV 6.4 2.82 Internet 4.4 3.31 Course abroad 2.2 3.54 Course in work 1.9 2.82
When evaluating the importance of particular educational methods, we should take these three aspects into consideration: 1. The frequency of the particular educational method among youth, as expressed by the proportion of young people using this method. English courses at elementary school, high school and university play the most important role. 2. The overall effectiveness of the educational method. Residing abroad, or taking a language course abroad, are the most frequent. A total of 11% of young people improved their English during a stay abroad, while 65% of the respondents with the highest level of knowledge (Grade 5) had improved their foreign language abroad. A total of 2% of the youth had passed a language course abroad, while 23% of the respondents with the highest level of knowledge (Grade 5) had graduated from a language course abroad. 3. Reaching the highest level of language knowledge. Taking into consideration these three aspects, English courses at secondary school are the most important for teaching English on a large-scale basis, while improving one�s language skills abroad is the most effective, and a language course abroad is key for achieving advanced knowledge of a foreign language. Information technology plays a part in all three aspects. The Internet and multimedia technology complement traditional methods of teaching and using English. The research showed that their importance is significant and will grow in the future.

25
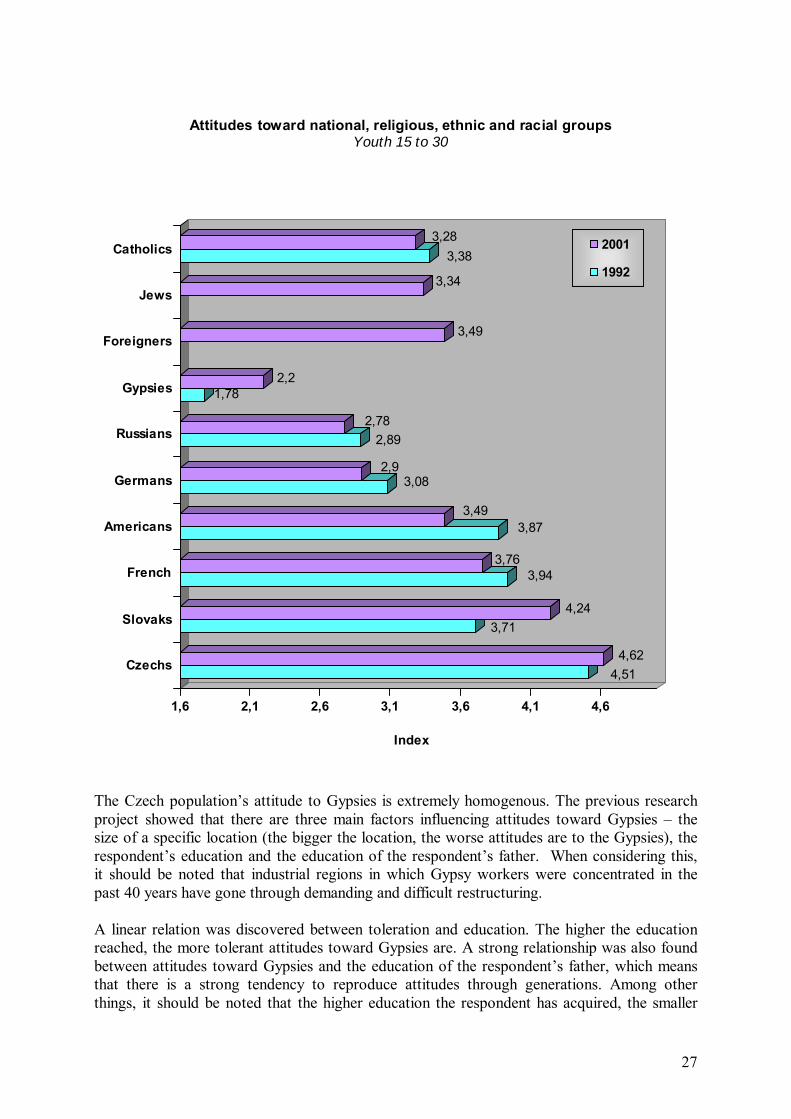
Conclusions The young generation considers the November 1989 political upheaval to be the most important historic event, and Charles IV and T.G. Masaryk to be the most significant figures, in Czech history, evidence that young people choose what corresponds to their current needs from history and that which helps them to find their position in life. Although they are centuries apart, Charles IV and T.G. Masaryk are perceived to be more alive than many contemporary figures. Identifying with a family is a prerequisite of future citizenship, while Czech patriotism is a basis for developing an awareness of Europeanism; such an awareness does not contradict patriotism. They express the individual�s general social maturity and social competition and provide information about the social time-space to which the individual is as a social being associated and in which s/he really and potentially proceeds and acts. For the Czech population, English has become the second language thanks to the young generation. The school system, which provides language knowledge at a basic level, serves as the broadest basis for language teaching. Young people acquire the most advanced knowledge while residing abroad. About 10% of young people acquire a foreign language during a stay abroad. New information and communication technologies, multimedia language programs and the Internet are becoming valuable teaching methods. 4. ATTITUDES TOWARD MARGINAL GROUPS 4. 1. Attitudes toward national, ethnic and religious groups Racial, ethnic, national and socio-cultural dynamics and dissolving are the dominant global characteristics of our time. Population movements create a platform for the movement of cultures, ideas, religions and other behavior patterns, standards and values. Whether or not it realizes it, the target country is changed by these movements, thereby becoming multicultural and more socially structured. Apart from being enriched by the new cultural elements, the target country also experiences tensions and conflicts. Our country must also cope with these trends. In addition to the phenomenon of �foreigners�, the Gypsy issue is now at the top of the agenda. The post-1989 development brought considerable problems to this group of the population, which had benefited more from the pre-1989 state paternalism. The need for unskilled laborers in the Czech economy decreased, leading the Gypsy population to undertake activities at the edge of or beyond the edge of legality. Attitudes to national, religious, ethnic, racial and marginal groups -- including attitudes to a specific group of foreigners -- were examined and graded on a five-grade scale. The question asked was: �Do you like the following national, religious, ethnic and political groups?� A diagram was prepared on the basis of the index (weighted arithmetical mean). An index higher than 3 expresses a positive attitude. The higher the number, the better the attitude is. Developments in the attitudes of youth and the entire population toward individual groups can be examined by comparing the results with empiric data compiled during research undertaken in 1992 using the same methodology.

26
The best attitude that young Czechs have is to their own nation. Although we often criticize our nation, Czechs rate themselves best when compared with the attitudes of other nationalities. Czechs� attitudes about themselves improved over the 1990s. The Slovaks ranked second in terms of attitudes. During the 1990s, after the dissolution of the Czechoslovakia, Czech attitudes toward Slovaks improved considerably, and there is no other nation to which Czech attitudes have changed so substantially. This result shows a kind of �tidal� behavior � nationalistic and anti-Slovak moods culminated at the outset, while respondents now express sympathy and nostalgia and realize what these two nations have in common. Czechs have traditionally had very good relations with the French. Attitudes to the French nation are so stable and positive � although they worsened slightly during the 1990s -- that they can be used as a certain standard for assessing attitudes to other nations. Attitudes to Americans can be described as generally positive, although these have deteriorated over the last nine years. The index value of 3.5 is only a little above the neutral mean value of 3. The Czech population�s attitude toward the Germans worsened considerably in the 1990s. Our research revealed that these attitudes fell under the mean index value of 3. This deterioration may have resulted from the political controversy related to the validity of the Bene� decrees. The results of this research cast doubt upon the idea put forward by media that attitudes to the Germans are only a generational matter. Negative attitudes are evident mostly in the oldest and youngest age groups. The deterioration in attitudes toward the Germans is quantitatively similar to that to the Russians. The Gypsies are a specific group in the Czech Republic. Although the respondents expressed a clearly negative attitude toward Gypsies, this cannot necessarily be considered racial; further analysis should be focused on whether or not this attitude is a racial one. It was interesting to find that attitudes toward the Gypsies improved at a time when attitudes toward the other nations under review (Germans, Americans and the Russians) worsened.
27
4,514,62
3,714,24
3,943,76
3,873,49
3,082,9
2,892,78
1,782,2
3,49
3,34
3,383,28
1,6 2,1 2,6 3,1 3,6 4,1 4,6
Index
Czechs
Slovaks
French
Americans
Germans
Russians
Gypsies
Foreigners
Jews
Catholics 2001
1992
Attitudes toward national, religious, ethnic and racial groups Youth 15 to 30
The Czech population�s attitude to Gypsies is extremely homogenous. The previous research project showed that there are three main factors influencing attitudes toward Gypsies � the size of a specific location (the bigger the location, the worse attitudes are to the Gypsies), the respondent�s education and the education of the respondent�s father. When considering this, it should be noted that industrial regions in which Gypsy workers were concentrated in the past 40 years have gone through demanding and difficult restructuring. A linear relation was discovered between toleration and education. The higher the education reached, the more tolerant attitudes toward Gypsies are. A strong relationship was also found between attitudes toward Gypsies and the education of the respondent�s father, which means that there is a strong tendency to reproduce attitudes through generations. Among other things, it should be noted that the higher education the respondent has acquired, the smaller

28
the likelihood that the respondents will be familiar with the Gypsy ethic (belief in God, preference of democracy and less importance attached to property). When examining attitudes to nationalities by age group, the youngest age group �youth aged 15- 18 � had the best attitude toward Gypsies, while those aged 31 to 45 had the worst attitude. The development in attitudes to Russians and Germans is similar with the exception of youth aged 15-18, which have the worst attitude to Russians. It was interesting to discover differences in the attitudes of the 15-18 and 19-23 age groups. The youngest group has the best attitudes to the Germans, while those aged 19-23 and pensioners have the worst attitudes. The same difference can be seen in these two groups of youth to Americans.
French
Czech - Moravians
Americans
Russians
Gypsies
Slovaks
Germans
2
2,5
3
3,5
4
4,5
5
15-18 19-23 24-30 31-45 46-60 61-
Age
Index
Attitudes toward national groups Age groups
4. 2. Factors influencing the creation of attitudes Our research examined the factors influencing the creation of attitudes to minority groups. We prepared and applied a seven-factor set to four minority groups that were defined according to different criteria: Gypsies � a ethnic minority, the Catholics � a minority religious group although it is the dominant religious group when compared with other religions in the Czech Republic, foreigners in general - who are different but have one attribute in common, namely that they differ from the Czech population - and Jewish people � a specific and hard-to-define group that became a target of racially and religiously motivated attacks in the past. This difference in the definition of the groups is intentional, as it makes it easier to determine not only the attributes to specific minority groups but also to generally analyze how attitudes to minority groups are formed.

29
Results of the research show that attitudes to Gypsies are primarily influenced by different lifestyles and value system. These two factors are closely interconnected, as lifestyle is a dynamic value system projected into a social time-space. Ethnic (quasi racial) difference is the least important of all the factors. Table: Factors influencing attitudes to specific groups �youth between 15 and 30 - index
Gypsies
Foreigners Jews Catholics
Ethnic difference 2.73 2.29 2.62 2.10 Economic situation 2.77 2.46 2.35 2.24 Social prestige 3.03 2.49 2.35 2.30 Different culture 3.12 2.51 2.40 2.39 Position in society 3.16 2.62 2.60 2.46 Different values 3.37 2.67 2.70 2.60 Style of life 3.65 2.82 2.72 2.75
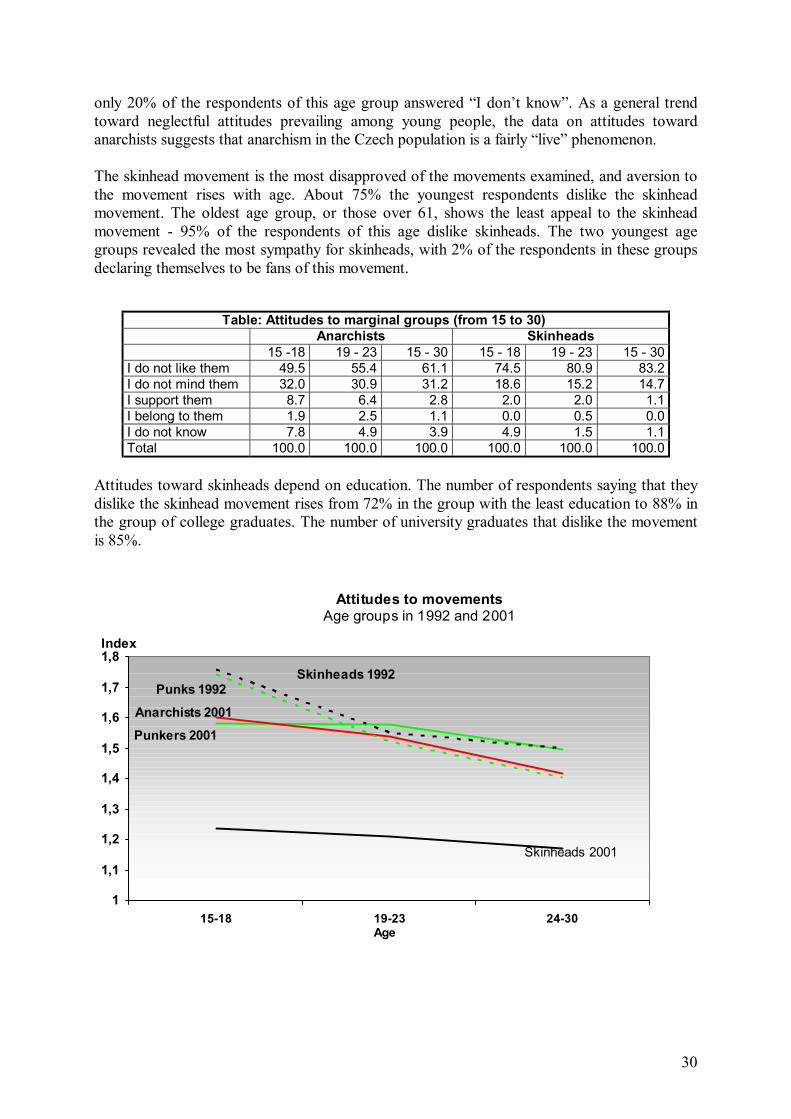
Note: The index value of 3 is a breaking point: A value higher than 3 means that a specific factor has a stronger impact on attitude formation. The impact is the biggest when the value is 5. Attitudes to foreigners are especially influenced by different values and ways of life. The respondents said that ethnic (racial) differences play a negligible role when attitudes are formed. These results confirm the frequent opinion that Czech attitudes are not racial. Attitudes toward Jewish people are also influenced by different values. The group�s social reputation ranks second followed by economic situation. Ethnic (racial) differences rank in last place. Verbal statements indicated that all of the factors are generally negligible, a result of the fact that the Czech population has stopped considering Jewish people as a minority group. Occasional media coverage of Czech anti-Semitism expresses more the opinions of extremists rather than reflect the real situation in society. The data gathered show that � generally speaking � the stronger the view on the minority is, the bigger impact the factors have and the more differentiated they are. Attitudes are mostly influenced by the values, lifestyles and social reputation of the minority group, while ethnic and racial differences have the least influence on attitudes to minorities. For the Gypsies, five factors -- differences in values and ways of life, position in society, differences in cultures and social reputation -- exceed the mean degree of 3. 4. 3. Attitudes toward marginal groups Attitudes toward anarchists are strongly dependent on the age of the respondent. The youngest age group has the most positive attitude toward anarchists. In this group, 32% of the respondents do not mind anarchists, 9% approve of anarchists and 2% declare themselves to be anarchists themselves. About 90% of the respondents in the oldest age group do not like anarchists, 6% do not mind anarchists and only 1% of the members of this age group support anarchists. Attitudes toward anarchists among the youngest age group have changed considerably since 1992, when 30% of the youngest respondents were not able to specify their attitude. In 2001,
30
only 20% of the respondents of this age group answered �I don�t know�. As a general trend toward neglectful attitudes prevailing among young people, the data on attitudes toward anarchists suggests that anarchism in the Czech population is a fairly �live� phenomenon. The skinhead movement is the most disapproved of the movements examined, and aversion to the movement rises with age. About 75% the youngest respondents dislike the skinhead movement. The oldest age group, or those over 61, shows the least appeal to the skinhead movement - 95% of the respondents of this age dislike skinheads. The two youngest age groups revealed the most sympathy for skinheads, with 2% of the respondents in these groups declaring themselves to be fans of this movement.
Table: Attitudes to marginal groups (from 15 to 30) Anarchists Skinheads 15 -18 19 - 23 15 - 30 15 - 18 19 - 23 15 - 30
I do not like them 49.5 55.4 61.1 74.5 80.9 83.2 I do not mind them 32.0 30.9 31.2 18.6 15.2 14.7 I support them 8.7 6.4 2.8 2.0 2.0 1.1 I belong to them 1.9 2.5 1.1 0.0 0.5 0.0 I do not know 7.8 4.9 3.9 4.9 1.5 1.1 Total 100.0 100.0 100.0 100.0 100.0 100.0
Attitudes toward skinheads depend on education. The number of respondents saying that they dislike the skinhead movement rises from 72% in the group with the least education to 88% in the group of college graduates. The number of university graduates that dislike the movement is 85%.
Punkers 2001
Skinheads 2001
Anarchists 2001Punks 1992
Skinheads 1992
1
1,1
1,2
1,3
1,4
1,5
1,6
1,7
1,8
15-18 19-23 24-30Age
Index
Attitudes to movements Age groups in 1992 and 2001
31
Dissidents
33,13,23,33,43,53,63,73,83,9
4
15-18 19-23 24-30 31-45 46-60 61-Age
Index
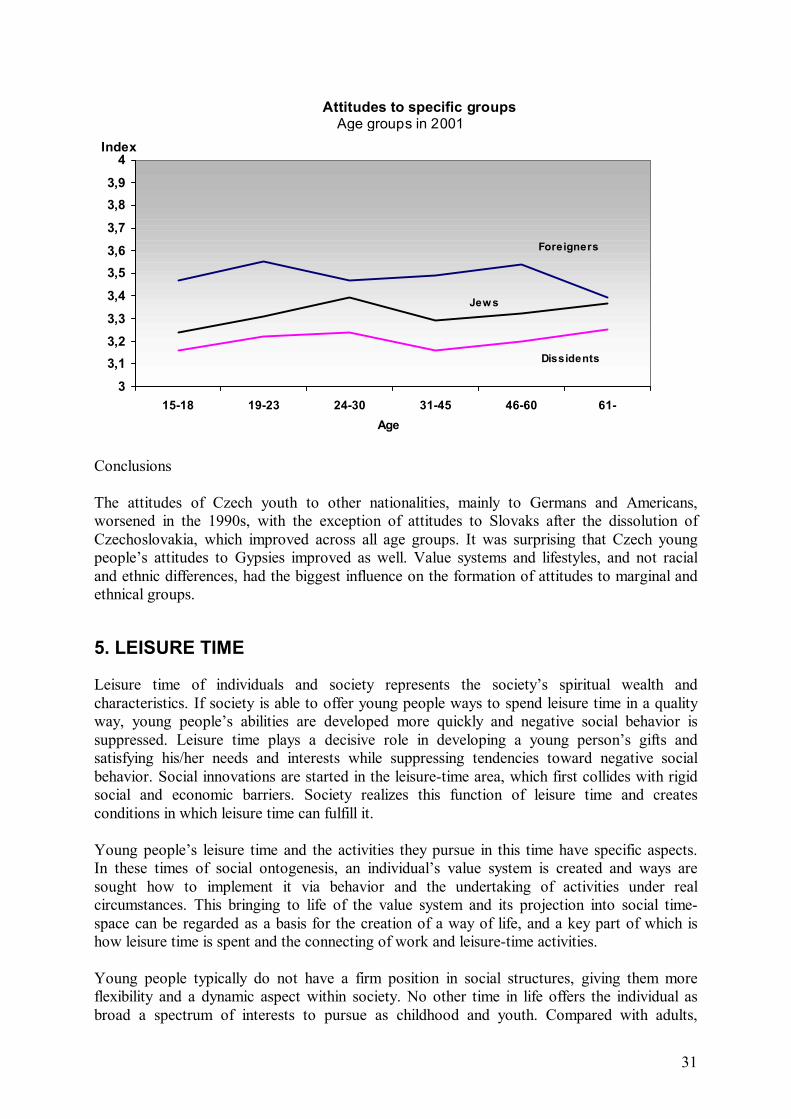
Attitudes to specific groups Age groups in 2001
Foreigners
Jews
Conclusions The attitudes of Czech youth to other nationalities, mainly to Germans and Americans, worsened in the 1990s, with the exception of attitudes to Slovaks after the dissolution of Czechoslovakia, which improved across all age groups. It was surprising that Czech young people�s attitudes to Gypsies improved as well. Value systems and lifestyles, and not racial and ethnic differences, had the biggest influence on the formation of attitudes to marginal and ethnical groups. 5. LEISURE TIME Leisure time of individuals and society represents the society�s spiritual wealth and characteristics. If society is able to offer young people ways to spend leisure time in a quality way, young people�s abilities are developed more quickly and negative social behavior is suppressed. Leisure time plays a decisive role in developing a young person�s gifts and satisfying his/her needs and interests while suppressing tendencies toward negative social behavior. Social innovations are started in the leisure-time area, which first collides with rigid social and economic barriers. Society realizes this function of leisure time and creates conditions in which leisure time can fulfill it. Young people�s leisure time and the activities they pursue in this time have specific aspects. In these times of social ontogenesis, an individual�s value system is created and ways are sought how to implement it via behavior and the undertaking of activities under real circumstances. This bringing to life of the value system and its projection into social time-space can be regarded as a basis for the creation of a way of life, and a key part of which is how leisure time is spent and the connecting of work and leisure-time activities. Young people typically do not have a firm position in social structures, giving them more flexibility and a dynamic aspect within society. No other time in life offers the individual as broad a spectrum of interests to pursue as childhood and youth. Compared with adults,
32
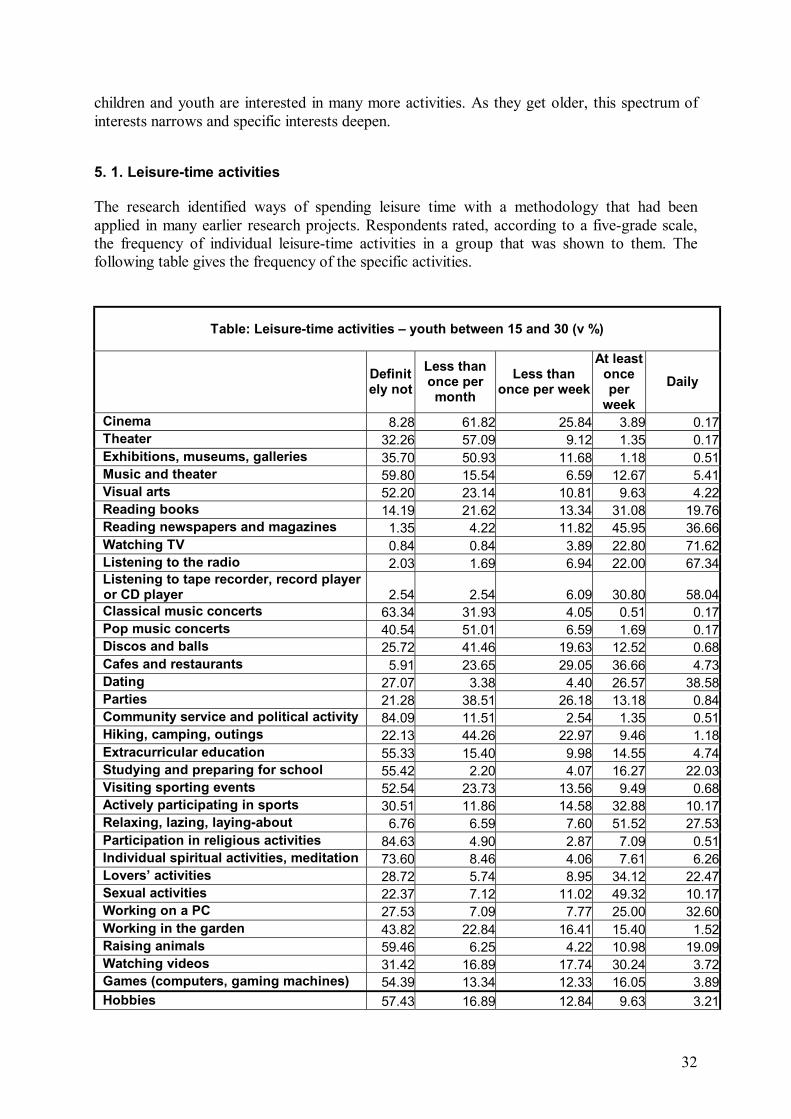
children and youth are interested in many more activities. As they get older, this spectrum of interests narrows and specific interests deepen. 5. 1. Leisure-time activities The research identified ways of spending leisure time with a methodology that had been applied in many earlier research projects. Respondents rated, according to a five-grade scale, the frequency of individual leisure-time activities in a group that was shown to them. The following table gives the frequency of the specific activities.
Table: Leisure-time activities � youth between 15 and 30 (v %)
Definitely not
Less than once per month
Less than once per week
At least once per
week Daily
Cinema 8.28 61.82 25.84 3.89 0.17 Theater 32.26 57.09 9.12 1.35 0.17 Exhibitions, museums, galleries 35.70 50.93 11.68 1.18 0.51 Music and theater 59.80 15.54 6.59 12.67 5.41 Visual arts 52.20 23.14 10.81 9.63 4.22 Reading books 14.19 21.62 13.34 31.08 19.76 Reading newspapers and magazines 1.35 4.22 11.82 45.95 36.66 Watching TV 0.84 0.84 3.89 22.80 71.62 Listening to the radio 2.03 1.69 6.94 22.00 67.34 Listening to tape recorder, record player
or CD player 2.54 2.54 6.09 30.80 58.04 Classical music concerts 63.34 31.93 4.05 0.51 0.17 Pop music concerts 40.54 51.01 6.59 1.69 0.17 Discos and balls 25.72 41.46 19.63 12.52 0.68 Cafes and restaurants 5.91 23.65 29.05 36.66 4.73 Dating 27.07 3.38 4.40 26.57 38.58 Parties 21.28 38.51 26.18 13.18 0.84 Community service and political activity 84.09 11.51 2.54 1.35 0.51 Hiking, camping, outings 22.13 44.26 22.97 9.46 1.18 Extracurricular education 55.33 15.40 9.98 14.55 4.74 Studying and preparing for school 55.42 2.20 4.07 16.27 22.03 Visiting sporting events 52.54 23.73 13.56 9.49 0.68 Actively participating in sports 30.51 11.86 14.58 32.88 10.17 Relaxing, lazing, laying-about 6.76 6.59 7.60 51.52 27.53 Participation in religious activities 84.63 4.90 2.87 7.09 0.51 Individual spiritual activities, meditation 73.60 8.46 4.06 7.61 6.26 Lovers� activities 28.72 5.74 8.95 34.12 22.47 Sexual activities 22.37 7.12 11.02 49.32 10.17 Working on a PC 27.53 7.09 7.77 25.00 32.60 Working in the garden 43.82 22.84 16.41 15.40 1.52 Raising animals 59.46 6.25 4.22 10.98 19.09 Watching videos 31.42 16.89 17.74 30.24 3.72 Games (computers, gaming machines) 54.39 13.34 12.33 16.05 3.89 Hobbies 57.43 16.89 12.84 9.63 3.21

33
Collecting 82.60 9.63 4.39 2.53 0.84 Secondary jobs 58.71 11.51 10.66 14.89 4.23 Construction and maintenance of house, apartment, weekend-house 52.87 16.05 12.50 14.19 4.39 Household chores 7.26 6.42 11.15 41.05 34.12 Repairing and maintaining bike,
motorcycle, car 56.95 19.83 11.69 10.17 1.36 Manual work 55.33 15.40 12.35 12.52 4.40 Talking to friends and acquaintances 0.51 2.20 6.60 41.62 49.07 Walking 12.71 16.27 24.07 37.29 9.66 Writing letters and diaries 58.14 17.97 10.85 9.83 3.22 Activities related to weekend house 84.33 9.37 4.26 1.87 0.17

34

35
Number of respondents performing a specific activitity at least once per week
youth 15 - 30
0 10 20 30 40 50 60
Relaxing, lazingSexual activities
Reading magazines and newspapersTalking to friends and acquintances
Household choresWalking, trips
Cafes, restaurantsLovers´ activities
Pursuit sports activelyReading books
Listening to tape recorder, record player, CDWatching videorecorder
DatingWorking on PC
Watching TVListening to radio
Studying and preparing for schoolGames (PC, gaming machines)
Working in gardenSecondary job
Extracurricular education
Construction and maintenance of houseapartment, weekend-house
PartiesMusic and theater
Discos and ballsHandwork
Raising animals
Repairing and maintenaining bike, motorcycle,car
Writing letters and diariesVisual arts
Do-it-yourself activitiesVisiting sport events
Hiking, camping, outings
Individual spiritual activities, mediationParticipation in religious activities
CinemaCollecting
Weekend-house activitiesPop-music concerts
Community service and political activityTheater
Exhibition, museum, galleryClassical music concert
%

36
Number of respondents performing a specific activitity less frequently than once per week
youth 15 - 30
0 5 10 15 20 25 30
Cafe, restaurantsParties
CinemaWalking, trips
Hiking, camping, outingsDiscos and balls
Watching video recorderWorking in garden
Pursuit sports activelyVisiting sport events
Reading booksDo-it-yourself activities
Construction and maintenance of house,apartment, weekend-house
HandworkGames (PC, gaming machines)
Reading newspapers and magazines
Repairs and maintenance of bike, motorcycle,car
Exhibition, museum, galleryHousehold chores
Sexual activitiesWriting letters and diaries
Visual artsSecondary job
Extracurricular educationTheater
Lovers´ activitiesWorking on PC
Relaxing, lazingListening to radio
Talking to friends and acquintancesMusic and theater
Pop-music concertsListening to record player, tape recorder, CD
DatingCollecting
Weekend-house activitiesRaising animals
Studying and preparing for schoolIndividual spiritual activities, mediation
Classical music concertsWatching TV
Participation in religisous lifeCommunity service and political activity
%

37
The following table contains indexes of leisure-time activities. Each index represents a weighted arithmetic mean and ranges from 1 to 5. These index tables provide basic information on what young people prefer to do with their leisure time. Only two activities are performed by young people on a daily basis -- watching TV and listening to the radio. The youngest age group prefers watching TV to listening to the radio, unlike the responses from elder age groups. This youngest age group prefers listening to recorded music to listening to the radio. Other activities related to mass media and mass culture -- reading newspapers and magazines, listening to a tape recorder, record-player and a CD player -- are typically engaged in once per week. Leisure-time activities that young people pursue once per day and once per week include above all the passive reception of aesthetic values and information from mass media, proving the immense influence that mass media and mass-culture makers have on the young generation.
Table: Leisure-time activities, age groups � index Youth between 15 and 30. - 1..5 +
Age Groups 15-18 19-23 24-30 15 - 30 Watching TV 4.75 4.63 4.60 4.64 Listening to the radio 4.22 4.53 4.60 4.51 Listening to tape recorder, record player, CD player 4.65 4.50 4.23 4.39 Talking to friends and acquaintances 4.60 4.49 4.20 4.37 Reading newspapers and magazines 3.91 4.09 4.22 4.12 Household chores 3.57 3.77 4.07 3.88 Relaxing, lazing, lazing-about 4.02 3.91 3.78 3.86 Dating 2.82 3.73 3.50 3.46 Working on a computer 3.56 3.48 3.04 3.28 Reading books 3.32 3.13 3.22 3.21 Sexual activities 2.03 3.27 3.52 3.18 Lovers� activities 2.23 3.39 3.33 3.16 Walking 3.01 3.10 3.23 3.15 Going to cafes, restaurants 2.83 3.41 2.99 3.11 Actively participating in sports 3.17 2.90 2.60 2.80 Watching videos 2.81 2.66 2.44 2.58 Studying and preparing for school 4.44 2.76 1.55 2.47 Parties 2.24 2.50 2.26 2.34 Cinema 2.29 2.31 2.21 2.26 Raising animals 2.56 2.32 2.07 2.24 Hiking, camping, outings, 2.21 2.20 2.26 2.23 Discos and balls 2.44 2.38 2.00 2.21 Work in the garden 1.99 1.90 2.24 2.08 Games (PC and gaming machines) 2.58 2.09 1.76 2.02 Construction and maintenance of house, apartment, weekend-house 1.56 1.78 2.34 2.01 Extracurricular education 2.06 2.06 1.89 1.98

38
Manual work 1.91 1.89 2.01 1.95 Secondary job 1.89 2.09 1.86 1.94 Visual arts 2.06 1.94 1.83 1.91 Music and theater 2.13 1.97 1.74 1.88 Hobbies 1.75 1.87 1.86 1.84 Writing letters and diaries 2.25 1.84 1.65 1.82 Visiting sporting events 2.00 1.84 1.74 1.82 Theater 1.91 1.80 1.76 1.80 Exhibitions, museums and galleries 1.84 1.87 1.73 1.80 Repairs and maintenance of bike, motorcycle, car 1.74 1.79 1.81 1.79 Visiting rock/pop concerts 1.84 1.75 1.61 1.70 Individual spiritual activities, meditations 1.46 1.68 1.68 1.64 Visiting classical music concerts 1.29 1.45 1.45 1.42 Participation in religious life 1.27 1.32 1.38 1.34 Collecting 1.49 1.22 1.28 1.29 Work at a weekend-house 1.20 1.23 1.27 1.24 Community service and political activity 1.12 1.24 1.26 1.23
5. 2. Leisure-time preferences in general A factor analysis was used to investigate leisure-time activities and made it possible to find a group of interrelated variables. This analysis showed that leisure-time activities form logically coherent clusters and represent general preferences of subjects, individuals and groups. The factor analysis revealed the existence of seven factors. Factor 1: Preference for culture This factor represents demanding and less frequented cultural activities that are both receptive and creative � going to exhibitions, museums and galleries, reading books, going to the theater, cinema, and classical music concert. This preference is typical of a group of active individuals who are interested in culture and lead a well-defined lifestyle. They are the cultural elite among youth (university graduates, single, divorced persons and women). Factor 2: Preference for extrovert � erotic activities This preference includes activities related to eroticism and sex � lovers ́ activities, dating, sexual activities as well as activities connected to these erotic activities � going to cafés, restaurants, parties (these respondents are mostly born in or before 1982, have one child, are childless, married, divorced or live with a partner). Factor 3: Preference for religion The preference for religion is definitely based on activities related to people�s spiritual dimension � individual spiritual activity (meditation) and participation in religious life. Respondents preferring this activity watch less TV and listen less to the radio (these respondents are university and college graduates, from cities with a population of less than 10,000, from cities with a population of more than 50,000, center--right and right-leaning political outlook). Factor 4: Preference for manual work Activities related to household and manual activity � manual work, work in the garden, construction and maintenance of a house, apartment, weekend-house, household chores.

39
These activities, which are typical of the preference for manual work, were preferred by respondents who go less frequently to cafés, restaurants, parties, discos and dancing parties (the respondents are frequently married and women with at least one child). Factor 5: Preference for sports This is a fairly well-defined leisure-time activity and one with deficient content. The activities include sports; the frequent occurrence of other activities such as games and attending sporting events is evidence of the respondents´ need for playing games � playfulness, while repairing a bicycle, bike and car, and do-it-yourself activities proving that they need to work manually. This preference does not include cultural and intellectual activities (this factor is more typical of men). Factor 6: Preference for relationships This factor includes talking to friends and acquaintances, writing letters and diaries. The respondents preferring such activities typically do not often undertake manual activities (the respondents are mostly women, single women born after 1982, single men born after 1979). Factor 7: Preference for studying Studying and preparation for school, extracurricular education and working on a PC are activities that are typical of this factor. The features of PC have become wider and thus the role of the PC in the educational process cannot be underestimated (the respondents are frequently born after 1982, from cities with a population of less than 10,000, college graduates and have a higher education, with left-center to right-leaning political outlook). The factors expressing leisure-time preferences were used to create synthetic attributes. For each of the five factors, the items with the biggest weighting were selected and the sum of their values divided by the number of items. The result was converted into five values (the higher the value, the more important the given factor is). The following table shows how the specific factors are distributed within a group of young people. The value of 1 expresses that a specific factor was not stated by the respondent, while the value of 5 indicates that a specific factor is the most preferred by the respondent. The respondents largely prefer the extrovert-erotic factor. This factor was given the highest value by 9% of the respondents, and a value of 4 was found in 46% of the respondents. The studying factor was ranked second by the respondents. The studying factor was given the highest rating by 9% of the respondents and a value of 4 in 26% of the respondents. For the cultural factor, the values of 2 (50%) and 3 (45%) were the most frequent. This fact is not surprising when considering that it is based on demanding cultural activities whose frequency cannot be expected to reach the level of less demanding activities. The religious factor revealed the largest number of respondents claiming disinterest (69%).

40
Table: Frequency of specific leisure-time activities - youth between 15 and 30 (in %)
Frequency of specific factors Leisure-time preference 1 2 3 4 5 Total
Culture 2.20 50.25 44.84 2.71 0.00 100.00 Extrovert-erotic 2.04 18.68 23.77 46.18 9.34 100.00 Religion 69.04 13.71 9.98 3.05 4.23 100.00 Manual work 4.07 33.90 39.83 19.32 2.88 100.00 Sports 9.71 49.74 30.66 9.37 0.51 100.00 Relationships 0.51 6.44 61.36 23.05 8.64 100.00 Studying 20.68 15.08 28.81 26.44 8.98 100.00
5. 3. Developments in young people�s leisure-time activities The existence of a research time series allows for following trends in how young people spend their leisure time. The two charts below show the development during the life of one generation from 1982 to 2001.
Development in the youth’s leisure-time activities I- at 15 to 18 from 1982 to 2001
CD, tape recorder
Talking to friends
Lazing
PC
Studying
Sports
Sports
2
2,4
2,8
3,2
3,6
4
4,4
1982 1984 1992 1996 1997 2001
Year
Index
Source: Research projects between 1984 and 1997. Sak. P. Proměny české mláde�e. Petrklíč. Praha 2000.
In the late 1990s, specific leisure-time activities were clearly preferred, and many activities were engaged in frequently. This situation reflected a certain change in society. Many differentiating processes took place in society that are typical of the conversion from a leveled
41
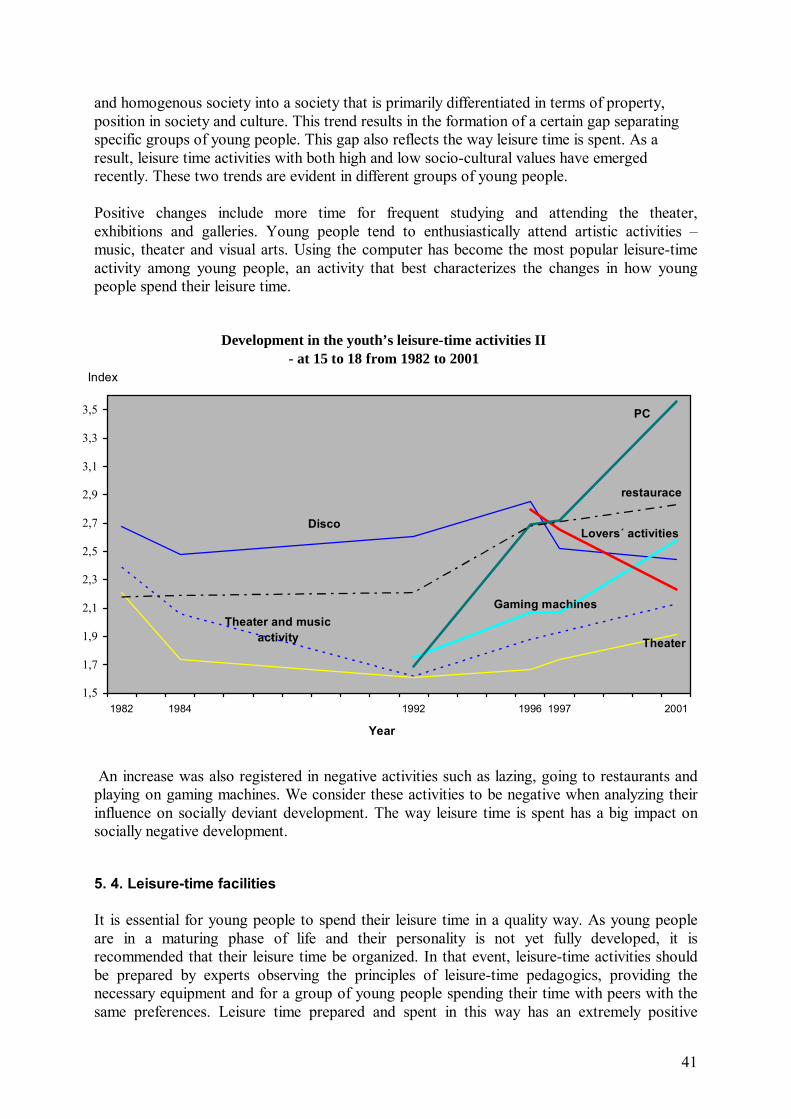
and homogenous society into a society that is primarily differentiated in terms of property, position in society and culture. This trend results in the formation of a certain gap separating specific groups of young people. This gap also reflects the way leisure time is spent. As a result, leisure time activities with both high and low socio-cultural values have emerged recently. These two trends are evident in different groups of young people.
Positive changes include more time for frequent studying and attending the theater, exhibitions and galleries. Young people tend to enthusiastically attend artistic activities � music, theater and visual arts. Using the computer has become the most popular leisure-time activity among young people, an activity that best characterizes the changes in how young people spend their leisure time.
Development in the youth’s leisure-time activities II- at 15 to 18 from 1982 to 2001
Disco
Gaming machines Theater and music
activity Theater
Lovers´ activities
PC
restaurace
1,5
1,7
1,9
2,1
2,3
2,5
2,7
2,9
3,1
3,3
3,5
1982 1984 1992 1996 1997 2001
Year
Index
An increase was also registered in negative activities such as lazing, going to restaurants and playing on gaming machines. We consider these activities to be negative when analyzing their influence on socially deviant development. The way leisure time is spent has a big impact on socially negative development.
5. 4. Leisure-time facilities It is essential for young people to spend their leisure time in a quality way. As young people are in a maturing phase of life and their personality is not yet fully developed, it is recommended that their leisure time be organized. In that event, leisure-time activities should be prepared by experts observing the principles of leisure-time pedagogics, providing the necessary equipment and for a group of young people spending their time with peers with the same preferences. Leisure time prepared and spent in this way has an extremely positive

42
influence. The development of a personality�s social aspect is the most effective prevention of social deviations and encourages the development of talent. It is in society�s interest to organize leisure time for as many young people as possible. Leisure time should be organized for both socially handicapped individuals and talented persons in all areas � arts, science, and the like.
Now let us examine how young people spend their leisure time. We have already described which activities young people take part in, and now we will examine where they spend their leisure time. The following table shows the frequency of activities pursued in specific leisure-time facilities.
Table: Places where leisure time is spent � age groups � youth between 15 and 30 (in %)
15-18 19-23 24-30 Sports clubs 37.25 26.47 23.16 At school, outside lessons 30.39 15.69 3.16
Youth centers 24.51 8.33 5.96 Commercial leisure-time facilities 14.71 31.37 25.61 Other institutions 10.68 14.22 12.28 Alone, with family, friends 85.29 86.76 90.53
Most of the respondents aged 15 to 18 spend their leisure time in sports clubs, schools
and youth centers.
Connection between leisure-time facilities and the nature of the leisure time spent In this part, we have focused on how young people aged 15 to 18 spend their leisure time, as organized leisure time is the most important for this age group. We have used the leisure-time preferences identified with the factor analysis. We have monitored what index (index of specific leisure-time preferences) is achieved by respondents spending leisure time in certain facilities and respondents who do not do so. The highest culture preference index was seen in respondents spending their leisure time in youth centers and who attend other leisure-time institutions and facilities. Contrary to this, the lowest culture factor index was identified in young people spending their leisure time in commercial leisure-time facilities. The extrovert-erotic preference was mostly referred to by respondents spending their leisure time in commercial leisure-time facilities. Almost the same index was achieved by young people not spending their leisure time in youth centers. Young people spending their leisure time in youth centers generated the lowest index. Respondents spending their leisure time in sports clubs generated the highest index of religious, manual and sports preferences. The relationship preference had the highest index in respondents not spending their free time alone or with their family and in respondents spending their free time in leisure-time facilities.

43
The study-preference index was the highest in respondents spending their leisure time in commercial leisure-time facilities and in extracurricular activities at school.
Table: Index of specific factors by facility type in which youth spend leisure time
Youth between 15 and 18 Preference
Culture Extrovert-erotic Sports Relation-
ship Studying
no 2.52 2.86 2.41 3.72 3.64 yes 2.50 2.68 2.89 3.63 3.74 Sports club total 2.51 2.79 2.59 3.69 3.68 no 2.51 2.84 2.47 3.70 3.58 yes 2.52 2.68 2.87 3.65 3.90 Extracurricular activities
at school total 2.51 2.79 2.59 3.69 3.68 no 2.47 2.94 2.61 3.68 3.61 yes 2.64 2.33 2.54 3.72 3.88 Youth centers total 2.51 2.79 2.59 3.69 3.68 no 2.54 2.76 2.56 3.69 3.63 yes 2.33 3.00 2.80 3.67 3.93 Commercial leisure-
time facilities total 2.51 2.79 2.59 3.69 3.68 no 2.51 2.81 2.60 3.67 3.65 yes 2.64 2.64 2.50 3.80 3.82 Other institutions,
facilities total 2.52 2.79 2.59 3.69 3.67 no 2.40 2.53 2.60 3.80 3.73 yes 2.53 2.84 2.59 3.67 3.67 Alone, with family,
friends total 2.51 2.79 2.59 3.69 3.68
Leisure time plays an important role in the life of individuals and society. A society�s technological advances reduce the need for unskilled and low-skilled workers. Instead, highly qualified personnel are needed and should be prepared for their career by a demanding education system. There is an increasing fraction of the population that is unable to acquire the necessary education and qualification for this or another reason. In addition, there are other groups that are able to find a good job and receive a good income but who are not able to participate in the life of the society. As a result, these groups are pushed to society�s margins because they are disqualified as to their profession, level of education and socio-cultural standard. This professional disqualification is accompanied by their social disqualification. These groups potentially endanger the entire society. These groups and related issues are typical not only of the Czech population � they concern modern society as a whole, in which part of the population is eliminated from purposeful processes in the society�s development. Our research identified such groups among young people with problems with education, an inability to find self-realization in their job and who consider their job and societal prospects to be far from promising. While these groups of the population have minimal economic potential, when taken as a whole they represent a substantial economic force that stimulates economic activities in society. In a modern mass-culture society, leisure-time products are created in order to entertain masses who are not able to undertake purposeful activities and in order to make them spend money. This business produces idols, sportsmen, �artificially made� artists whose task is to entertain people at a low socio-cultural level. This is the flip side of the leisure-time
44
society: it offers entertainment as a replacement of self-development -- killing time instead of encouraging self-realization.
In order to suppress this aspect of the leisure-time society, society should develop activities for young people�s leisure time. Leisure-time activities are considered to be the most important by individuals of around the age of 17. People above the age of 17 have less leisure time and their leisure-time activities are less varied.
6. TIME PICTURE
The time picture monitored a respondent�s activities 24 hours a day over an entire week. The respondent noted his/her activity in half-hour intervals each day in a time-picture form. A total of 72 categories were created for specific activities, and the respondents entered the category codes into the form. These activities were divided into major and minor activities. The major activities included ironing; minor activities included listening to the radio. The respondents further noted with whom they engaged in the specified activities. The created synthetic attributes allow us to learn that respondent X watched TV for 2.5 hours on Monday, slept eight hours and studied 12 hours a week, etc. The following table shows the average numbers of hours that individual age groups spent on various activities during the week. Data in the table shows the specific general trends. Within the 19 to 23, 24 to 30 and 31 to 45 age groups, the time spent doing various activities is mostly either on the increase or decrease. Contrary to this, the 15 to 18, 46 to 60 and over 61 age groups behave in a different way. Young people aged 15 to 18 are at a stage of life when dramatic changes in an individual�s life have taken place. Childhood evolves into puberty, schools are changed and the labor market entered into, and rapid changes take place in the individual�s social field. Between 46 and 60, the family�s way of life changes: children leave home and establish their own families. The original family is confronted with a change to its lifestyle. All of a sudden, they have more time that had been formerly devoted to the education and care of children, a change that makes them re-define their lifestyle. The group over 61 consists mostly of pensioners. The respondents in this group do not work and thus have more free time.
Sleep is a biological must, and it is the activity to which the most time is devoted across all age groups. The youngest bracket sleeps for the longest time. The number hours of sleep in elder age groups decreases on a step-by-step basis. The exception is the age group over 61, whose members spend an increasing time sleeping when compared to other groups. Those aged 15 to 18 sleep nine hours per day on average. The 46 to 60 age group (which spends the least amount of time sleeping) sleeps eight hours per day. The activity ranked second depends on whether a specific group is included in a pre-productive, productive or post-productive group of the population. The age groups in productive age spend most of their time sleeping and working. In the 15 to 18 age bracket, some respondents have finished elementary education, and most of those who completed elementary school continue studying. The members of this group rank studying at school

45
second. The oldest generation considers watching TV to be the second most important activity. Other age groups rank work second.
Table: Time spent on certain activities by specific age groups per week I. - average, main activity only, unweighted group
Age Groups Activity
15 � 18 19 � 23 24 � 30 31 � 45 46 � 60 61 + Sleep 61.51 57.71 56.92 55.61 55.07 60.43 School 23.17 10.22 1.12 0.39 0.73 0.00 TV 10.30 8.76 8.02 11.56 13.98 20.36 Eating 7.84 8.18 8.39 8.56 8.62 11.39 Studying at home 6.99 5.80 1.21 0.93 0.30 0.13 Going to/from school/work 6.70 5.96 5.02 4.05 4.69 1.07 Hygiene 5.65 6.05 6.58 6.78 6.57 6.62 Relaxing 3.52 3.00 3.79 2.78 3.22 5.87 Sports 2.67 1.84 1.54 0.86 0.75 0.18 Visiting friends 2.30 2.60 3.78 3.22 3.00 3.42 Tidying, household chores 2.17 2.90 5.04 5.77 6.62 8.59 Visiting restaurants 1.98 3.28 2.51 1.66 1.65 0.51 Dating 1.87 3.64 0.77 0.41 0.19 0.02 Reading books 1.75 1.22 1.76 1.45 2.20 2.99 Walking in the city 1.62 1.27 1.48 1.46 1.33 1.74 Other 1.54 2.66 1.94 1.59 1.51 1.93 Work 1.31 12.93 26.32 29.40 28.27 4.12 Parties 1.19 1.08 1.04 0.36 0.34 0.00 PC games 1.19 0.53 0.46 0.19 0.05 0.07 Disco 1.07 0.79 0.32 0.13 0.00 0.01 Working on the PC 1.04 1.66 0.63 0.72 0.28 0.35 Listening to a CD player, cassettes 0.99 0.43 0.84 0.25 0.18 0.13 Shopping 0.96 1.63 2.53 2.92 3.10 3.50 Playing a musical instrument, singing, playing theater 0.84 0.71 0.29 0.26 0.51 0.16
Internet 0.81 1.35 0.86 0.25 0.26 0.00 Watching videos 0.77 0.51 0.60 0.59 0.18 0.26 Secondary job, temporary job 0.67 1.03 1.36 1.38 0.58 1.07 Cooking 0.66 1.55 3.07 4.54 4.82 7.48 Going to the countryside 0.58 1.39 1.46 1.25 1.58 2.43 Cinema 0.58 0.66 0.38 0.14 0.12 0.05 Reading magazines 0.57 0.45 0.48 0.89 0.90 1.52 Extracurricular education 0.52 0.41 0.18 0.69 0.49 0.05 Driving 0.52 1.57 2.15 2.22 1.25 0.98 Visiting clubs 0.49 0.62 0.69 0.22 0.00 0.23 Ballet, dancing 0.47 0.05 0.00 0.02 0.00 0.10 Lovers´ activities 0.42 1.05 0.59 0.29 0.09 0.04 Conversation over the phone 0.38 0.44 0.49 0.30 0.31 0.32 Car maintenance 0.38 0.53 0.26 0.11 0.20 0.17 Sex 0.38 1.29 1.26 0.91 0.33 0.09 Raising animals 0.37 0.33 0.46 0.67 1.32 1.83

46
Listening to the radio 0.37 0.14 0.20 0.32 0.23 0.62 Seeing a doctor 0.36 0.24 0.42 0.46 0.65 1.26 Reading newspapers 0.35 0.28 0.58 0.90 1.36 2.05 Activities in youth organizations 0.33 0.05 0.03 0.04 0.01 0.01 Rock/pop concerts 0.31 0.13 0.00 0.11 0.06 0.04 Repairs in household, maintenance of house 0.28 0.34 0.76 0.59 1.03 1.19 Visiting sporting events 0.25 0.18 0.12 0.28 0.10 0.17 Construction and maintenance of house 0.24 0.12 0.64 0.43 0.53 0.47 Do-it-yourself activities 0.23 0.31 0.25 0.72 0.61 0.69 Engaging in visual arts 0.19 0.44 0.38 0.16 0.08 0.12 Theater-going 0.17 0.29 0.29 0.21 0.21 0.12 Hand work (knitting, embroidery) 0.13 0.32 0.78 1.23 0.51 2.98 Participation in religious ceremonies 0.13 0.21 0.14 0.10 0.26 0.26 Dealing with authorities 0.11 0.09 0.39 0.54 0.23 0.30 Roller skating 0.08 0.01 0.00 0.01 0.00 0.00 Individual spiritual activities 0.08 0.08 0.13 0.17 0.24 0.27 Heading a children�s organization 0.08 0.20 0.11 0.10 0.08 0.04 Work in the garden 0.07 0.18 0.60 0.26 1.07 1.33 Collecting 0.07 0.00 0.02 0.03 0.03 0.17 Looking for a job 0.05 0.03 0.16 0.06 0.01 0.04 Classical music concerts 0.04 0.06 0.10 0.11 0.20 0.13 Charity 0.03 0.00 0.03 0.02 0.00 0.15 Activities in unincorporated associations 0.02 0.00 0.02 0.22 0.05 0.18 Civic-political activities outside political party 0.02 0.01 0.00 0.04 0.05 0.03 Creating graffiti 0.01 0.00 0.02 0.00 0.00 0.00 Going to galleries 0.00 0.11 0.06 0.12 0.06 0.09 Gaming machines 0.00 0.00 0.01 0.01 0.00 0.05 Activities in a political party 0.00 0.00 0.00 0.00 0.00 0.07 Activity in local government 0.00 0.00 0.02 0.07 0.06 0.00 Ecological activities 0.00 0.00 0.02 0.00 0.01 0.02
Let us examine the category related to studying. Apart from sleeping, young people spend most of their time at school. Respondents attending school during the week represent 39% to 43%. This figure decreases on Friday, when only 36% of the respondents are at school. There was a small number of respondents (less than 1% on both weekend days) who reported attending school over the weekend, which was probably related to distant studying. The number of respondents studying outside school range from 1% to 4%. Most of the respondents pursuing extracurricular studies do so on Monday and the fewest on Friday. The studying takes place mainly on Friday and Wednesday afternoons, and from Friday to Sunday, primarily in the morning and in the afternoon (evening). The number of respondents reporting of studying at home or in a library on Monday and Tuesday is similar to the number of respondents attending school on the same days (up to 40%) and culminates between 5 and 7 p.m. The number of respondents studying decreases gradually from Wednesday to Saturday (to about 15%). The number of respondents reporting such grows steeply on Sunday. Young people relax and prefer activities other than studying on Friday and Saturday. They resume studying again on Sunday (mainly between 10 and 12 a.m., and 3 and 4 p.m.). Their number culminates between 5 and 6 p.m. Some respondents prefer studying between 9 and 10 p.m.

47
The number of respondents who work during the work week ranges from 40% to 42%. Contrary to school attendance (which drops on Friday), the number of respondents who work on Friday does not diminish. About 11% of the respondents work on Saturday and 8% on Sunday. About 3% to 6% of he respondents say that they have a temporary job on various days in the week � mainly on Tuesdays and Fridays. About 70 � 80% of the respondents go to school and work on weekdays (their number culminates between 7 and 8 a.m.). When going home, the number of persons is distributed the most evenly during the peak hours between 2 and 3 p.m. About 5% to 8% of the respondents play a musical instrument during the week (especially on Saturdays), 2% to 5% attend visual arts (mainly on Saturdays and Sundays). About 54% to 74% of the respondents watch TV during the week. The number of TV watchers is the highest on Sunday and the lowest on Friday. Sundays and Fridays reflect lifestyles - Sunday is predominantly reserved for watching TV and Friday is the least suitable day for TV because other activities are preferred. Young people prefer activities outside home on Friday evening, while middle-aged people go to a weekend-house and are tired at the end of the week. Most TV watching takes place between 7 and 10 p.m., with the peak being reached between 8.30 and 9 p.m.
Table: Number of hours spent watching TV per week by age groups ( weighted group, incl. non-watchers, in %)
Hours Age Groups Total
15 - 18 19 - 23 24 - 30 31 - 45 46 - 60 61 +
6.35 17.46 24.87 36.51 12.70 2.12 100.00 0 - 5.5 19.67 34.38 36.43 29.61 10.00 2.30 20.26 10.00 15.24 22.38 23.81 25.24 3.33 100.00 6 � 10 34.43 33.33 36.43 21.46 22.08 4.02 22.51 6.18 7.30 10.11 32.02 26.40 17.98 100.00 10.5 - 13.5 18.03 13.54 13.95 24.46 19.58 18.39 19.08 8.09 7.51 7.51 13.29 38.73 24.86 100.00 14 - 19.5 22.95 13.54 10.08 9.87 27.92 24.71 18.54 1.64 2.73 2.19 18.58 26.78 48.09 100.00 20 and more 4.92 5.21 3.10 14.59 20.42 50.57 19.61 6.54 10.29 13.83 24.97 25.72 18.65 100.00 Total 100.00 100.00 100.00 100.00 100.00 100.00 100.00
There is a strong statistical relationship between age group and the number of hours spent watching TV. Watching TV is the least preferred activity in the 19 to 23 and 24 to 30 age groups. The oldest generation spends the most time in front of the TV.
The number of hours spent watching TV increases depending on age. This dependence is also obvious in the youngest age group, which are under their parents� surveillance and their lifestyle is determined by their parent�s lifestyle. The other age groups study at universities,

48
upper secondary technical schools or start working and live mostly outside their original family. These have more room for decision-making, which allows them to actively select the way leisure time is spent. Their lifestyle is less dependent on that of their original family. The respondents of the 19 to 23 and 24 to 30 age groups are generally in the "extrovert� phase of life -- their social area is being extended and thus they may use new activities while not being limited by their family.
Table: Average number of hours spent watching TV per week by age group
- weighted group
Age Groups Average N Standard deviation 15 � 18 10.30 61 5.76
19 � 23 8.71 95 5.79
24 � 30 8.02 128 5.96
31 � 45 11.12 233 8.75
46 � 60 14.37 240 7.30
61 - 19.83 175 7.93
Total 12.87 932 8.41
It was found that the young generation watches TV less frequently than the middle-aged and elderly. The 15 to 18 age group watches TV the most frequently even though they watch TV less than the middle-age and elder generations. The middle-age and older generations have adopted typical viewing habits and stereotypes, which means that they continue watching TV even though they criticize the quality of TV programs. Young viewers are diverted from the TV screen by activities typical of young people and other media including the Internet and PC, with which TV programs of poor quality have a hard time competing. There are substantial differences between age groups in time spent watching TV. Young people watch TV about half the time spent by the elder generation and about a quarter less than the middle-aged bracket.
Table: Number of hours spent watching TV by age groups – unweighted group in %
Age Groups
Number of hours 15 - 18 19 - 23 24 - 30 31 - 45 46 - 60 61+ Total 0 - 5.5 19.67 34.38 36.43 29.61 10.00 2.30 20.26 6 � 10 34.43 33.33 36.43 21.46 22.08 4.02 22.51 10.5 - 13.5 18.03 13.54 13.95 24.46 19.58 18.39 19.08 14 - 19.5 22.95 13.54 10.08 9.87 27.92 24.71 18.54 20 and more 4.92 5.21 3.10 14.59 20.42 50.57 19.61 Total 100.00 100.00 100.00 100.00 100.00 100.00 100.00
The elderly generation is the most frequently represented in the category of 20 and more
49
hours spent watching TV (51%). The 46 to 60 age group is the most frequently represented (28%) in the category of 14 to 19.5 hours per week. The 31 to 45 age group is the most frequently represented in the 10.5 to 13.5 hours per week (25%) category. The 24 to 30 age group is the most frequently represented in the 6 to 10 hours per week category (36%) and the 19 to 23 age group is the most frequently represented in the 0 � 5.5 hour per week (34%) category. Those aged 15 to 18 are the most frequently represented in the 6 � 10 hours per week category (34%). Other media are less frequently followed � they are watched/listened to on weekdays by tenths of a percent to 12% of the respondents. The small number of respondents reporting that they listen to the radio is striking but not surprising given the poor quality of broadcasting. Commercial stations broadcast low-quality programs in terms of aesthetics, language and journalism quality. Public radio is producing programs of diminishing quality and is tending to adapt to the standards of commercial radio broadcasting. Radio, listening to CDs and watching videos converge in terms of preference. The advantages of CDs and videos are that one can listen to what s/he prefers. In the 1990s, cinema was affected by a dramatic change, namely a drop in attendance. The number of respondents listening to CDs on weekdays ranges from 8% to 12%. Listening to CDs during the week reflects the lifestyle projected in respondents� activities during the week. Friday is typically when young people pursue activities outside the home and in the company of their peers. As a result, listening to CDs decreases and culminates on Saturdays and Sundays. It should be noted how much time is spent listening to CDs. The entire population listens to CDs for half hour per week, with the 15 to 18 age group, which devotes the most time to listening to music, spending one hour per week listening to CDs. The 24 to 30 age bracket ranks second in this respect. This activity is strongly dependent on age. It is still fairly new technology, at least from a generational point of view. Young people between the ages of 15 and 30 spend more than twice the time than middle-aged and elderly generations listening to compact disks. About 3% to 6% respondents report listening to the radio during the week (listening to the radio was the main activity). Contrary to TV, radio is not a �weekend� medium. Radio has become a �background� medium, which means a medium that is listened to when engaging in another activity. It is open to discussion whether radio itself has not taken this position as a result of the nature and quality of broadcasting � or whether it is a complex issue connected with an overall change of the media, the lifestyle of the contemporary population and the development of society. Radio is preferred by pensioners and youth between 15 and 18 (about 25 minutes per week). About 4% to 8% of the respondents reported watching videos during the week. The viewing pattern is similar to that of listening to CDs. Videos are the least watched on Friday and the most watched on Sunday. The entire population spends about half an hour per week watching videos. This activity is preferred mostly by youth � above all by those aged 15 to 18 (about three quarters of an hour). Pensioners spend the least amount of time watching videos. Watching videos depends on the availability of the necessary equipment and the fact that this is not a technology of their generation. Technologies related to computers are clearly connected with the youngest generation. The
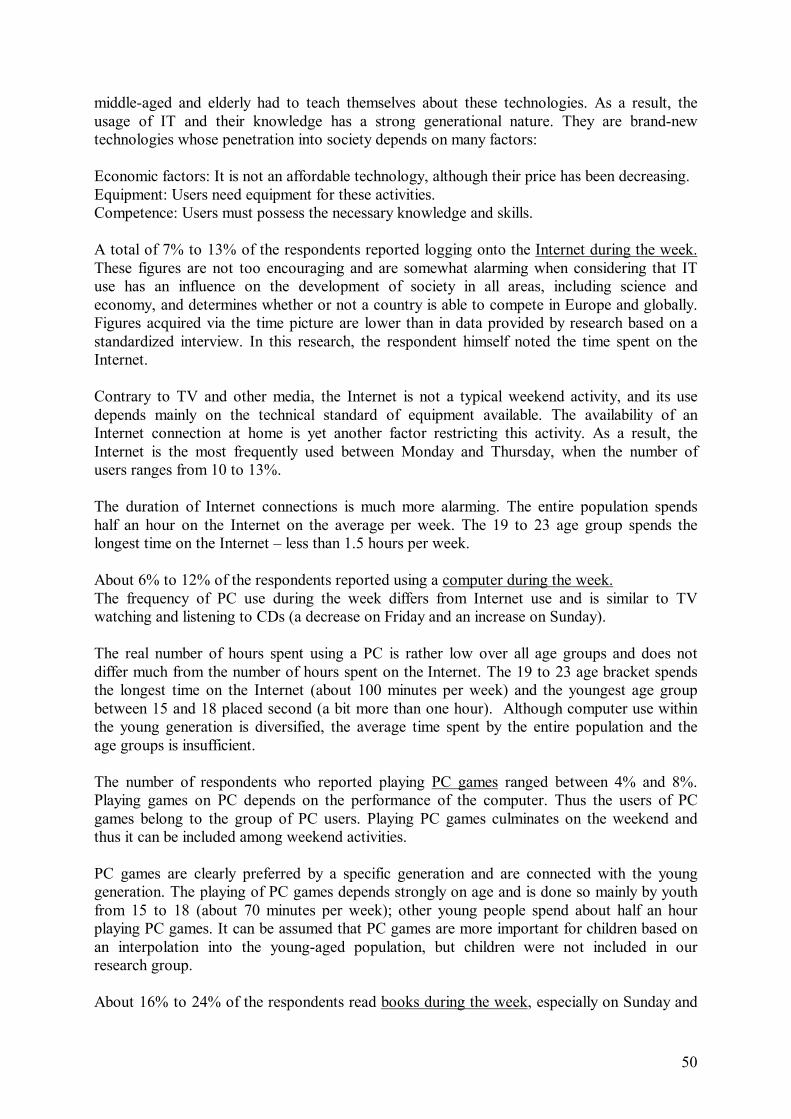
50
middle-aged and elderly had to teach themselves about these technologies. As a result, the usage of IT and their knowledge has a strong generational nature. They are brand-new technologies whose penetration into society depends on many factors: Economic factors: It is not an affordable technology, although their price has been decreasing. Equipment: Users need equipment for these activities. Competence: Users must possess the necessary knowledge and skills. A total of 7% to 13% of the respondents reported logging onto the Internet during the week. These figures are not too encouraging and are somewhat alarming when considering that IT use has an influence on the development of society in all areas, including science and economy, and determines whether or not a country is able to compete in Europe and globally. Figures acquired via the time picture are lower than in data provided by research based on a standardized interview. In this research, the respondent himself noted the time spent on the Internet. Contrary to TV and other media, the Internet is not a typical weekend activity, and its use depends mainly on the technical standard of equipment available. The availability of an Internet connection at home is yet another factor restricting this activity. As a result, the Internet is the most frequently used between Monday and Thursday, when the number of users ranges from 10 to 13%. The duration of Internet connections is much more alarming. The entire population spends half an hour on the Internet on the average per week. The 19 to 23 age group spends the longest time on the Internet � less than 1.5 hours per week. About 6% to 12% of the respondents reported using a computer during the week. The frequency of PC use during the week differs from Internet use and is similar to TV watching and listening to CDs (a decrease on Friday and an increase on Sunday). The real number of hours spent using a PC is rather low over all age groups and does not differ much from the number of hours spent on the Internet. The 19 to 23 age bracket spends the longest time on the Internet (about 100 minutes per week) and the youngest age group between 15 and 18 placed second (a bit more than one hour). Although computer use within the young generation is diversified, the average time spent by the entire population and the age groups is insufficient. The number of respondents who reported playing PC games ranged between 4% and 8%. Playing games on PC depends on the performance of the computer. Thus the users of PC games belong to the group of PC users. Playing PC games culminates on the weekend and thus it can be included among weekend activities. PC games are clearly preferred by a specific generation and are connected with the young generation. The playing of PC games depends strongly on age and is done so mainly by youth from 15 to 18 (about 70 minutes per week); other young people spend about half an hour playing PC games. It can be assumed that PC games are more important for children based on an interpolation into the young-aged population, but children were not included in our research group. About 16% to 24% of the respondents read books during the week, especially on Sunday and

51
the least often between Thursday and Saturday (mainly in late afternoon and evenings). All of the age groups sampled reported spending more time reading books than newspapers. On average, Czechs spend two hours per week reading books. Those over 60 spend three hours per week reading books. It was encouraging that the youngest age group (15-18 years) spend more than 1.5 hours per week reading books (similarly to young people between the ages of 20 and 30). The number of persons participating in religious ceremonies ranges from 1% to about 7% of the respondents (mainly on Sunday). About 1.5% to 2.5% of the respondents pursue individual spiritual activities over the entire week. About 10% of young people go partying � mainly on Saturday -- and more than one quarter of the respondents visit a restaurant over the weekend. The cinema is preferred on Friday (more than 5% of the respondents), discos on Saturday (up to 9%), while clubs are visited mainly on Friday (about 7%). Friends are visited primarily on the weekend (22 to 27%). During the week, the frequency is stable - about 15% on average. Relaxing and lazing is preferred by 38% to 45% of the respondents (around lunchtime, especially on Sunday). About 12-19% of the respondents engage in sexual activities during the week. The number of respondents reporting a preference for love-making has a slightly increasing tendency during the week.
Table: Number of respondents engaging in sexual activities during the week Weighted group
Age Groups %
15 �18 14.37
19 � 23 46.72 24 � 30 61.78
31 � 45 47.84 46 � 60 22.99
61 + 15.82
Dating takes place over the entire week and culminates on Friday (12 to 16%), mostly in the late afternoon and in evenings. Sports activities are engaged in evenly over the entire week and culminate on Thursday (about 15 to 18%). Trips to the countryside are preferred on weekends (up to 22% of the respondents).

52
7. DRUGS, ALCOHOL, NICOTINE The Czech population traditionally consumes much in the way of alcoholic drinks, cigarettes and � during the last decade due to young people - drugs. Drug consumption is one phenomenon that distinguishes present-day youth from those of earlier generations. Society and the government must deal with this problem. Drugs � directly and indirectly � deplete young people�s financial means and working capacity and destroy their lives. 7. 1. Drugs As information about drug consumption has been gathered from a set of known events over time, we can ascertain the number of young people having experience with drugs. A total of 42% of the 15 to 18 age group said they had such experience, 48% of the 19 to 23 age group and 37% of the 24 to 30 age group. Of those saying they had experience with drugs, the average age of the first such experience was 15.3 in the youngest age group, 16.4 in the 19 to 23 group and 18.2 in the oldest age group. We asked a question about experience with drugs that offered four options that are given in the following table along with their frequencies:
Table: Experience with drugs
Age Groups Never I have tried From time to time Regularly
15 � 18 58.42 35.64 5.94 0.00 19 � 23 52.48 34.16 12.87 0.50 24 � 30 62.90 31.80 5.30 0.00
The �regularly� option was selected by nobody, as drug addicts were unlikely to have been included in the research sample and drug consumption is illegal. About 37% to 47% of young people over all age groups reported having experience with drugs. We also investigated at which age young people were offered drugs for the first time. Each respondent specified the type of drug offered to him/her when s/he took drugs for the first time, as well as the age at which that happened. We selected the lowest age, at which drugs were first offered, and an attribute called �the lowest drug-offering age� was introduced that does not distinguish among types of drugs - it refers to drugs in general. The following diagram compares the 1996 and 2001 data gathered with this methodology.

53
Average �first-offering� agesIn the youth age groups
13,5
14
14,5
15
15,5
16
16,5
17
17,5
18
18,5
19
19,5
20
20,5
15-16 17-18 19-20 21-22 23-24 25-26 27-30
Age
Firs
t-offe
ring
age
1996
2001
In the 25 to 26 age group, the �first-offering� age was over 20 in 1996. In the 15 to 16 age group, it is a mere 13. The average �first-offering� ages shown in the diagram allow for getting an idea of how the drug problem develops. The percentage of drug users in specific age groups complements the data on average age. The comparison reveals that the 2001 curve shows a lower average �first-offering� age over the entire age spectrum. The exception is the youngest age group between 15 and 16, in which the �first-offering� age is a little higher in 2001. A comparison of the �first-offering� age and drug consumption suggests that one of the reasons why an individual becomes addicted is the extremely young age at which s/he was first offered drugs. The younger the individual is, the higher probability that drugs will become a problem for this individual. The following table provides data on the number of young people in the 15 to 30 age group having experience with drugs in 1992, 1996 and 2001.
Table: Relative frequency of drug experience � youth between 15 and 30 (in %)
Never tried I have
tried From
time to time
Regularly
1992 93.7 6.3 - - 1996 57.8 28.4 8.9 4.8 2001 58.5 33.3 8.0 0.2

54
It is evident that a minimal number of Czech young people took drugs in 1992. The main attack from drug pushers took place between 1992 and 1996. A diagram shows the frequencies of individual categories between 1996 and 2001 among youth aged 15 to 18. The answer �Never tried� has a higher frequency in 2001. The answers �From time to time� and �Regularly� are given more frequently than in 1996. This data - although it must be taken with some reserve � could suggest that the dissemination of drugs is � if not decreasing � at least stagnating or decelerating. 7. 2. Alcohol Like drugs, alcoholic beverage consumption and smoking were investigated and rated on a four-grade scale. The relative frequencies of the scale grades for all age groups in 2001 are presented in the table below. The data clearly show that alcohol has become an integral part of Czech society. It was not exceptional to find that some respondents in the youngest age group have drunken or drink alcohol. More than half of the respondents in the youngest age group drink alcoholic beverages. In other age groups, about 90% of the respondents reported drinking hard drinks.
Table: Experience with alcoholic drinks by age group (in %)
Age Groups Never I have tried From time to time Regularly
15 � 18 4.85 40.78 53.40 0.97 19 � 23 0.49 8.82 77.94 12.75 24 � 30 2.11 12.28 76.49 9.12
The following table shows the same data for youth aged 15 to 30 in 1992, 1996 and 2001.
Table: Relative frequency of experience with alcoholic drinks � youth between 15 and 30 (in %)
Never I have
tried From
time to time
Regularly
1992 5.9 14.7 76.4 3.0 1996 2.4 18.6 68.2 10.5 2001 2.0 16.1 73.0 8.96
The table shows that the development of young people�s alcohol consumption was negative in the 1990s. A negative breakpoint occurred between 1992 and 1996, with the highest consumption taking place in 2001. 7. 3. Nicotine In the 15 to 18 age group, a quarter of the respondents reported smoking cigarettes, while every third person in the 24 to 30 age bracket smokes.

55
Table: Experience with smoking by age group (in %)
Age Groups Never I have tried From time to time Regularly
15 � 18 15.53 59.22 12.62 12.62 19 � 23 20.10 37.75 15.20 26.96 24 � 30 16.90 50.70 10.56 21.83
When comparing the data gathered during the three years under review, it is obvious that smoking was the least popular in 1992 and culminated in 1996. At that time, 44% of young people between the ages of 15 and 30 reported smoking cigarettes regularly. In this context, it is open to discussion to what extent this had been influenced by cigarette advertising, which was uncontrolled and had peaked at around that time (those aged 15 to 18 � which can most easily be influenced by advertising - contributed to the high number of smokers among youth).
Table: Relative number of respondents with experience with smoking � youth from 15 to 30 (in %)
Never I have tried
From time to
time Regularly
1992 16.5 42.9 29.0 11.6 1996 10.9 28.8 15.7 44.3 2001 17.8 47.7 12.5 22.0
Respondents born in 1983 and later registered a drug addiction index (2.72) that was lower than that from persons born in or before 1982 (3.58). Persons who have already found their position in society - namely married persons � have a lower index of drug addiction. The high-salary brackets are endangered more (3.23). Men � contrary to women � have a higher drug addiction index, as have respondents that passed vocational training and basic education. The group with higher education has a lower drug addiction index. In cities with a population of less than 10,000, the drug addiction index is lower than in big cities. The group of respondents who had tried drugs for the first time at the age of 15 and younger had a drug addiction index of 4.35. Those who had tried a drug for the first time between 15 and 18 achieved a higher index (4.57). The group who reported using drugs for the first time when they were older than 18 had a lower drug addiction index. The age at which a disco or rock club is visited for the first time has a big influence in this respect. Those who went to such places for the first time when they were 14 and younger have a higher drug addiction index (3.21) than those who went to such places for the first time when they were older (or who have never gone to such places). This group�s drug addiction index is 2.84.
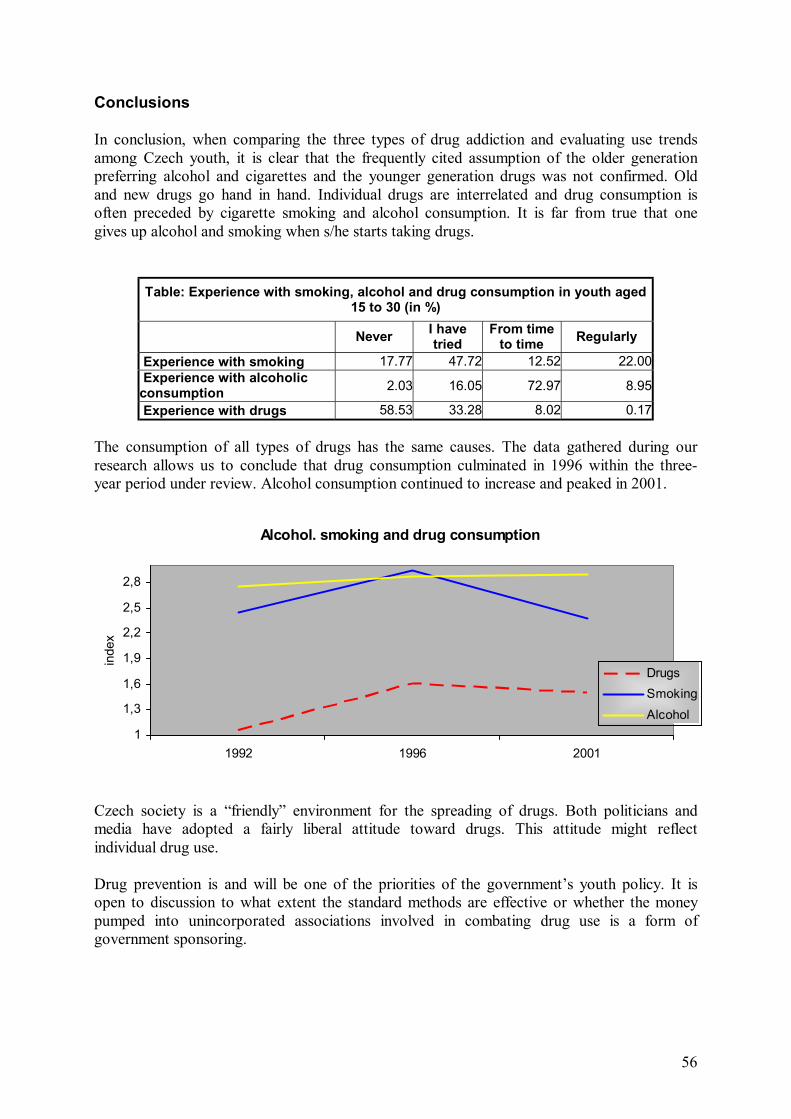
56
Conclusions In conclusion, when comparing the three types of drug addiction and evaluating use trends among Czech youth, it is clear that the frequently cited assumption of the older generation preferring alcohol and cigarettes and the younger generation drugs was not confirmed. Old and new drugs go hand in hand. Individual drugs are interrelated and drug consumption is often preceded by cigarette smoking and alcohol consumption. It is far from true that one gives up alcohol and smoking when s/he starts taking drugs.
Table: Experience with smoking, alcohol and drug consumption in youth aged 15 to 30 (in %)
Never I have tried
From time to time Regularly
Experience with smoking 17.77 47.72 12.52 22.00 Experience with alcoholic consumption 2.03 16.05 72.97 8.95
Experience with drugs 58.53 33.28 8.02 0.17 The consumption of all types of drugs has the same causes. The data gathered during our research allows us to conclude that drug consumption culminated in 1996 within the three-year period under review. Alcohol consumption continued to increase and peaked in 2001.
Alcohol. smoking and drug consumption
1
1,3
1,6
1,9
2,2
2,5
2,8
1992 1996 2001
inde
x
DrugsSmokingAlcohol
Czech society is a �friendly� environment for the spreading of drugs. Both politicians and media have adopted a fairly liberal attitude toward drugs. This attitude might reflect individual drug use. Drug prevention is and will be one of the priorities of the government�s youth policy. It is open to discussion to what extent the standard methods are effective or whether the money pumped into unincorporated associations involved in combating drug use is a form of government sponsoring.

57
8. PARTICIPATION IN MANAGEMENT Citizen participation is one of modern society�s basic principles. This is a trend that is intrinsic to modern society and - at the same time - it is a principle declared and enforced by the EU. The EU�s policy is based on the assumption that young people will create a new European identity and integrated multi-cultural society. As a result, mechanisms are sought how to integrate young people into the formation of European policy. 8. 1. Civic and political participation Before analyzing young people�s participation in the political and civic decision-making process, it should be pointed out that there are many myths about young people that are far from being true. We have a tendency to apply earlier generations� opinions on youth to the present young generation. Czech journalists and foreign youth sociologists support the thesis that Czech democracy � contrary to that of Western countries � is immature and thus youth participation will increase. It is evident that most political participation is engaged in by middle-aged and elder generations. Petitions and unincorporated associations are an exception and used by young people more often than the older generation.
Table: Forms of political participation that are used (in %)
Age Groups
15 - 18 19 - 23 24 - 30 15 - 30 31 and more
Participating in elections - 62.3 67.3 55.8 77.7 Member of local government - 0.0 0.7 0.3 2.3 Petitions 14.6 28.9 28.2 21.6 19.8 Political meetings 3.9 6.4 3.9 4.7 12.4 Political demonstrations 1.0 3.9 7.4 5.1 4.9 Strike readiness 0.0 2.5 10.2 5.8 15.1 Striking 2.9 4.9 16.2 10.0 15.8 Via unincorporated associations 4.9 1.0 3.2 2.7 1.7 Via trade unions 1.0 2.5 6.3 4.1 12.3 Via a political party - 0.0 0.7 0.5 2.9 Via publicizing articles in newspapers and magazines
4.9 4.9 2.5 3.7 3.0
Via lectures 2.9 1.0 1.4 1.5 1.3 The data gathered during empirical research indicate that young people do not often take part in any form of the civic and political decision-making process. Participation in civic life is not an integral part of young people�s lifestyles. Young people nowadays are rather individualistic and generally do not want to waste energy on activities that do not produce clear benefits for the individual. As a result, young people prefer education and economic activities while neglecting social activities and participation. Young people tend to be active in political life if they can benefit from it. This behavior is more obvious than in previous generations (the higher preference for political engagement is in line with individualistic value preferences). Young people enter a defined political area in which all forms of political participation have

58
already been established. While young people may endeavor to have certain forms of non-existing political and civic participation introduced, it is highly probable that this will not be among their priorities, especially concerning forms of direct democracy. When we conducted our research, 66.2% of young people under the age of 30 said that parliament should pass an act on referendums. This does not differ much from the adult population, of which 73.2% of the respondents above the age of 30 require an act on referendums. If we want citizens including young people to participate in the political and civic management of society, society is required to create natural conditions for such participation. Why devise sophisticated projects and mechanisms for youth participation when the political system is formed so as to exclude citizens from the decision-making process? There are politicians who do not trust citizens� decision-making ability and consider a citizen with the right to decide in a referendum a risky element. This attitude is incompatible with democracy. It is the citizen who vests his/her confidence in the politician and not vice versa, as the power of a politician is derived from the citizen�s will as expressed in elections. The increase in young people�s participation in the political decision-making process is the result of improvements in democratic mechanisms. Democracy is not based on the citizen being held hostage between elections held every four years. The system must be improved so as to allow the citizen to participate in the decision-making process. If there are areas in which s/he cannot make a decision, the decision-making processes adopted by politicians must be made more transparent and allow the public to gain control over them. The second condition for the development of young people�s participation is understanding their specific attributes and seeking a form of participation that would be acceptable for them. In this context, the beginning of the information society, medialization and digitalization of young people�s living space should be taken into consideration. The Internet is another option that young people can use to participate in political and social life. Young people discuss current topics in chat rooms, forms that can be used to start discussions with the young generation and get it involved in the life of society. 8. 2. Economic participation
Participation in leading society does not involve only political participation but also economic leadership in the form of managerial positions. Participation in democracy is not realized only in politics, as many people consider economic participation to be more important than engagement in politics. Data acquired in previous research projects allows for comparing not only current figures and data collected before the upheaval in November 1989 but also to follow trends over several decades. Young people�s representation in managerial positions did not change between 1952 and the late 1970s. In the 1980s, the number of managers grew, resulting in an increase in the number of young people in managerial positions, although this period was typical of gerontocracy and juventophobia. These trends became more obvious during the 1990s. Giant companies typical of the pre-1989 era disappeared. This trend, along with their restructuring and dissolution into small units, resulted in the formation of small working groups. In a private economy, small companies and small working groups prevail, resulting in a higher number of managerial
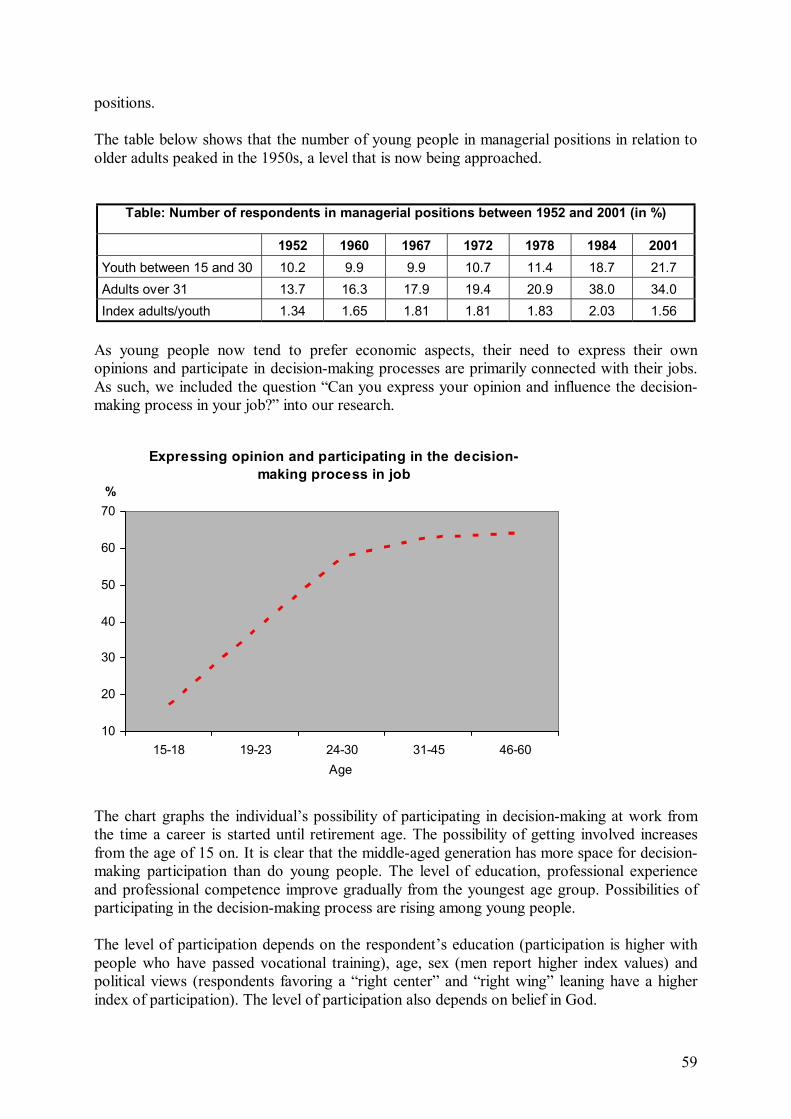
59
positions. The table below shows that the number of young people in managerial positions in relation to older adults peaked in the 1950s, a level that is now being approached.
Table: Number of respondents in managerial positions between 1952 and 2001 (in %)
1952 1960 1967 1972 1978 1984 2001 Youth between 15 and 30 10.2 9.9 9.9 10.7 11.4 18.7 21.7 Adults over 31 13.7 16.3 17.9 19.4 20.9 38.0 34.0 Index adults/youth 1.34 1.65 1.81 1.81 1.83 2.03 1.56
As young people now tend to prefer economic aspects, their need to express their own opinions and participate in decision-making processes are primarily connected with their jobs. As such, we included the question �Can you express your opinion and influence the decision-making process in your job?� into our research.
Expressing opinion and participating in the decision-making process in job
10
20
30
40
50
60
70
15-18 19-23 24-30 31-45 46-60Age
%
The chart graphs the individual�s possibility of participating in decision-making at work from the time a career is started until retirement age. The possibility of getting involved increases from the age of 15 on. It is clear that the middle-aged generation has more space for decision-making participation than do young people. The level of education, professional experience and professional competence improve gradually from the youngest age group. Possibilities of participating in the decision-making process are rising among young people. The level of participation depends on the respondent�s education (participation is higher with people who have passed vocational training), age, sex (men report higher index values) and political views (respondents favoring a �right center� and �right wing� leaning have a higher index of participation). The level of participation also depends on belief in God.

60
Conclusions Young people are largely individualistic and participate minimally in all of the forms sampled. Young people are interested above all in economic participation. Youth nowadays differ from previous generations, among other things, in their involvement in IT. Participation must take account of these specifics of young people. 9. SOCIAL-ECONOMIC POSITION AND ITS PERCEPTION BY YOUNG PEOPLE 9. 1. Perception of one�s economic situation We should map first the economic situation of young people. Are young people�s income and expenditures in balance? How do young people spend their income? What do their income and expenditures amount to? Basic economic situations were identified by asking a question allowing for determining each respondent�s positions in a scale ranging from running debts to saving. About one third of those between the ages of 15 and 30 have more income than expenditures, allowing them to save money. Less than one third of young people have more or less balanced income and expenditures � they can settle their debts but no money remains when they have paid the rent and made other mandatory payments. The remaining young people live under difficult economic conditions.
Table: Economic situation � Age Groups Youth between 15 and 30
15-18 19-23 24-30 15-30 My salary is insufficient and I am indebted 22.73 16.96 9.78 13.44 My salary is insufficient but I am not indebted 34.09 24.56 16.30 20.77 When I settle all payments there is nothingleft 15.91 26.32 31.88 28.51 My salary is sufficient - I can save money 27.27 32.16 42.03 37.27 Total 100.00 100.00 100.00 100.00 The economic situation of young people improves with age. Between 15 and 18, young people depend on support from their parents. Under these circumstances, young people can easily get into financial troubles when they spend more than they can get from their parents, whose income does not tend to be high. A quarter of young people between 15 and 18 are indebted (the amount of debts was not examined). This fact inspires more questions - for example, is there a relationship between their need for money and debts arising from drug consumption, and can these debts trigger criminal activities? It was encouraging to see that the economic situation of other age groups is improving. Half of the respondents in the 24 to 30 age group are able to save money and only 10% are indebted.

61
9. 2. Perception of poverty Czech society underwent a substantial transformation during the 1990s that had a big impact on specific groups. The Czech population had not experienced unemployment for about 50 years. Former regulations required people to work. Nowadays, up to 10% unemployment is a normal phenomenon. Pensioners and young families with children have a low standard of living. Some groups � namely gypsies and other groups with minimal professional qualifications � suffer from poverty. Homeless people have become a normal phenomenon. Indeed, Czech society must now cope with phenomena that it had not had to deal with for some time. What does poverty mean for a young man? What attributes does the stigma of poverty inflict upon an individual? The perception of poverty was examined by a set of statements on which each respondent made comments (�If a man does not consider himself/herself poor, s/he should have the opportunity: �.�).
Table: What should be available to a person so that s/he does not consider himself/herself poor
Youth between 15 and 30 in %
Definitely no
Probably not
I do not
know Probably yes
Definitely yes Total
To have a meal every day 0.85 0.85 0.85 15.91 81.39 100.00 To have decent clothing 0.51 6.45 3.74 40.75 48.56 100.00 To rent apartment 3.06 14.94 8.83 36.67 36.50 100.00 To buy necessary furniture 2.03 12.37 6.27 46.95 32.37 100.00 To have modern furnishing 4.76 18.54 7.65 44.05 25.00 100.00 To study, to give higher education to children 0.68 4.24 5.59 37.97 51.53 100.00 To buy motorbike, car 9.66 35.08 8.14 34.07 13.05 100.00 To buy a TV set, video recorder 8.66 29.03 7.98 36.84 17.49 100.00 To buy a PC 15.16 37.99 12.10 24.70 9.88 100.00 To go to restaurant, ball from time to time 4.42 18.20 7.48 47.62 22.28 100.00 To go to cinema, theater and concerts 3.24 21.29 7.33 44.63 23.51 100.00 To buy equipment for one�s hobbies 1.71 15.02 7.85 52.39 23.04 100.00 To spend vacations abroad 17.06 36.01 9.39 27.99 9.56 100.00 To buy apartment, house, weekend house 15.16 35.43 9.88 30.15 9.37 100.00 To invest in one�s own business 24.27 39.15 16.75 15.21 4.62 100.00 Young people must have a meal every day if they are to not consider themselves poor, which is not surprising. Education ranked second in this respect. This is followed by clothing, household furnishing, renting an apartment and entertainment. Not being able to buy a computer or spend one�s vacation abroad are not associated with poverty. How has the perception of poverty changed since 1992? The results were compared with the 1992 figures, when the same methodology was applied. The following chart shows that the limit was lowered for all items in the set under review. The exception is education and equipment necessary for one�s hobbies (a 1% increase) and the purchase of a computer. In 1992, education was already considered to be on a borderline between poverty and a normal position in society.

62
What should be available to a person so that s/he does not consider himself /herself poor
Probably yes + definitevely yesYouth between 15 and 30, 1992 and 2001
0 10 20 30 40 50 60 70 80 90 100
To have a meal everyday
To have decent clothing
To rent apartment
To buy necessary furniture
To have modern furnishing
To study, to give higher education to children
To buy motorbike, car
To buy TV set, video recorder
To buy PC
To go to restaurant, ball from time to time
To go to cinema, theater, concert
To buy equipment for one´s hobby
To spend vacation abroad
To buy apartment, house, weekend house
To invest in one´s own business
%
20011992
We also compared differences and changes in perceptions of poverty by specific age groups since 1992. The differences in assessing poverty and associating specific attributes with poverty are connected with a specific phase of life and preferred values. The youngest age bracket considers the clothing they wear to be a symbol of belonging to a specific group and one�s status. As a result, they consider clothing important in relation to poverty. The relationship between personal computers, poverty and age group is a key indicator of a society�s development. All age groups consider the availability of a computer to be important in respect to whether one is not poor. There is a significant indirect proportion in relation to age � the younger the group, the bigger part of the population that considers the computer to be indispensable. This opinion is expressed by 30% of those aged 24 to 30, 33% of young people between the ages of 19 and 23 and almost 50% of the youngest group. Every second respondent between the ages of 15 and 18 considers not having a PC to be an indicator of

63
poverty.
Table: What one should possess so as not to consider himself/herself poor -� index Index in age groups - 1..5 +
1992 2001 15-18 19-23 24-30 15-30 15-18 19-23 24-30 To have a meal every day 4.84 4.90 4.88 4.88 4.84 4.66 4.81 To have decent clothing 4.66 4.70 4.62 4.65 4.42 4.23 4.32 To study, to provide a higher education for children 4.33 4.30 4.40 4.36 4.28 4.26 4.45
To buy necessary furniture 4.11 4.09 4.24 4.18 4.06 3.70 3.95 To buy necessary furnishings 4.28 4.35 4.46 4.40 3.99 3.86 4.01 To buy equipment for one�s hobbies 3.85 3.81 3.74 3.78 3.93 3.77 3.78 To go to a restaurant, ball from time to time 3.93 3.89 3.80 3.85 3.76 3.55 3.68 To buy modern furnishing for one�s home 4.02 4.03 4.04 4.03 3.68 3.54 3.74 To go to the cinema, theater and concerts 4.01 4.00 3.89 3.94 3.68 3.53 3.70 To buy a TV set, video recorder 3.57 3.63 3.57 3.59 3.54 3.01 3.32 To buy a motorbike, car 3.54 3.50 3.32 3.41 3.35 2.88 3.08 To buy a PC 2.46 2.46 2.47 2.47 3.09 2.72 2.67 To vacation abroad 2.89 2.91 2.85 2.87 2.89 2.68 2.79 To buy an apartment, house, weekend house 2.86 2.91 2.90 2.90 2.83 2.72 2.91
To invest in one�s own business 2.64 2.49 2.68 2.62 2.41 2.22 2.46
Contrary to 1992, the same trend is obvious not only among younger people but across all age groups. When assessing an individual�s economic situation, information must be gathered about the amount of money that an individual can spend. Some money must be set aside for retirement and illness. We have applied a general equivalent for quantitatively assessing poverty. When using this methodology of quantifying poverty, we first ask about the amount of money that a respondent must set aside in order to not consider oneself to be poor. The following table shows the frequency of replies.
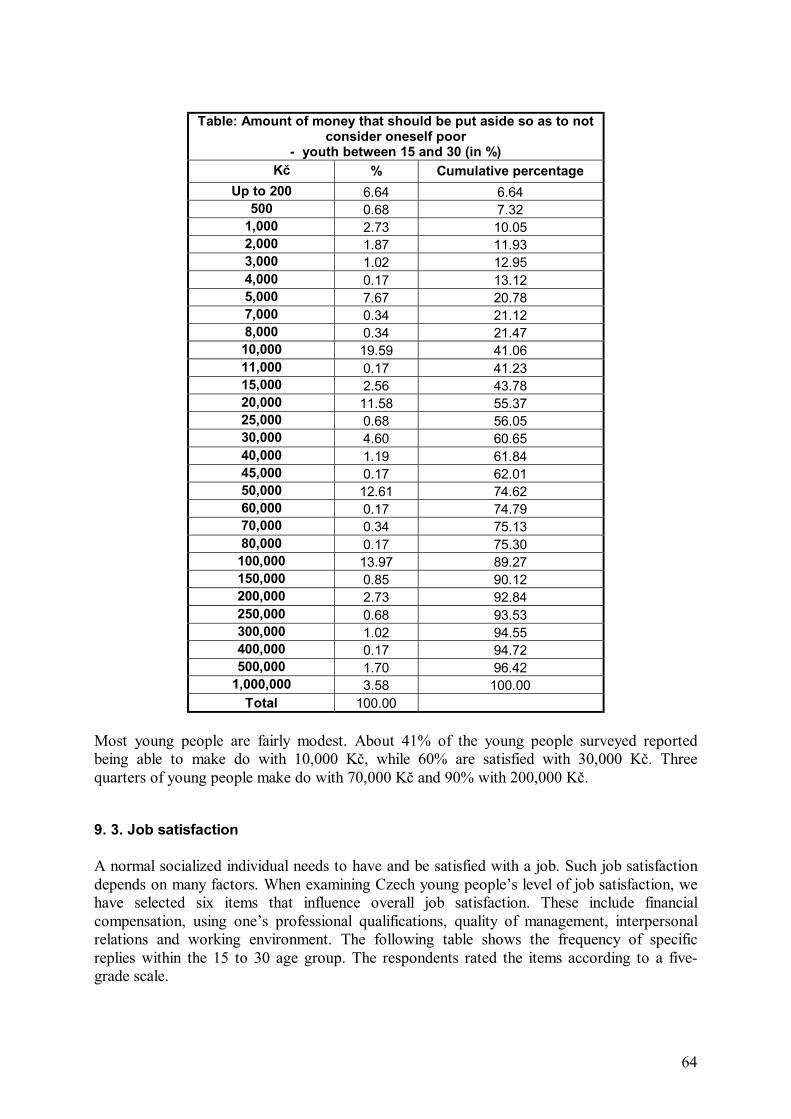
64
Table: Amount of money that should be put aside so as to not
consider oneself poor - youth between 15 and 30 (in %)
Kč % Cumulative percentage Up to 200 6.64 6.64
500 0.68 7.32 1,000 2.73 10.05 2,000 1.87 11.93 3,000 1.02 12.95 4,000 0.17 13.12 5,000 7.67 20.78 7,000 0.34 21.12 8,000 0.34 21.47 10,000 19.59 41.06 11,000 0.17 41.23 15,000 2.56 43.78 20,000 11.58 55.37 25,000 0.68 56.05 30,000 4.60 60.65 40,000 1.19 61.84 45,000 0.17 62.01 50,000 12.61 74.62 60,000 0.17 74.79 70,000 0.34 75.13 80,000 0.17 75.30
100,000 13.97 89.27 150,000 0.85 90.12 200,000 2.73 92.84 250,000 0.68 93.53 300,000 1.02 94.55 400,000 0.17 94.72 500,000 1.70 96.42
1,000,000 3.58 100.00 Total 100.00
Most young people are fairly modest. About 41% of the young people surveyed reported being able to make do with 10,000 Kč, while 60% are satisfied with 30,000 Kč. Three quarters of young people make do with 70,000 Kč and 90% with 200,000 Kč. 9. 3. Job satisfaction A normal socialized individual needs to have and be satisfied with a job. Such job satisfaction depends on many factors. When examining Czech young people�s level of job satisfaction, we have selected six items that influence overall job satisfaction. These include financial compensation, using one�s professional qualifications, quality of management, interpersonal relations and working environment. The following table shows the frequency of specific replies within the 15 to 30 age group. The respondents rated the items according to a five-grade scale.

65
Table: Satisfaction with present job � youth between 15 and 30 (in %)
Definitely not Mostly not I do not know Mostly yes Definitely yes I do not
know Financial compensation 13.74 28.44 12.32 34.83 3.55 7.11 Using professional qualifications 8.29 18.96 16.82 34.36 14.45 7.11
Quality of management 10.90 22.99 21.33 28.44 8.77 7.58 Interpersonal relations 6.86 14.42 16.55 41.37 13.48 7.33 Prospects 7.57 21.04 22.22 31.44 10.64 7.09 Working environment 5.46 17.10 14.96 42.28 13.30 6.89 Young people reported the most satisfaction with their working environment (55% of the youth are satisfied) and interpersonal relations (54%) but are the least satisfied with the quality of management. Only 9% of the young people surveyed are satisfied with the quality of management, and only half said they were satisfied with more than two items.
The following table compares indexes across specific age groups. An index higher than 3 is within the satisfaction range, while an index lower than 3 indicates dissatisfaction. Satisfaction increases with age. In the younger groups, the youth persons with low education and qualification are employed. The higher the age, the higher the qualification. Respondents across the entire age spectrum are dissatisfied with their salary. The youngest group is dissatisfied with all items. The 19 to 23 age group has an index of below 3 as to quality of management and financial compensation. The index of the 24 to 30 age group is higher than 3 in all categories.
The index of all items over all groups does not reach values of clear satisfaction. We can make a general conclusion that about a half of young people are more or less satisfied with their job and that half is dissatisfied. On the whole, this suggests the there is a relationship between the attitude and leisure-time activities in the 15 to 18 age group. The data on job dissatisfaction suggests where the roots of the skinhead movement and drug addiction lie. The fact that only 6% consider his/her job as having good prospects has a big impact on youth between the ages of 15 and 18.
Table: Satisfaction with present job � index
Youth between 15 and 30 -1 .. 5+ Age
15-18 19-23 24-30 Total Financial compensation 2.82 2.75 2.91 2.85 Using professional qualifications 2.86 3.04 3.48 3.30 Quality of management 2.59 2.93 3.10 3.01 Interpersonal relations 2.82 3.37 3.53 3.43 Job prospects 2.86 3.04 3.28 3.18 Working environment 3.00 3.31 3.56 3.44
Satisfaction rises in all categories with an increasing level of education (the most satisfaction is reported by secondary-school graduates, with the exception of ratings for the use of qualifications, and those who had passed vocational training, who are the most satisfied with interpersonal relations). The strongest link is between education and the use of qualifications. It is interesting that the lower the educational level, the stronger the dissatisfaction is with the
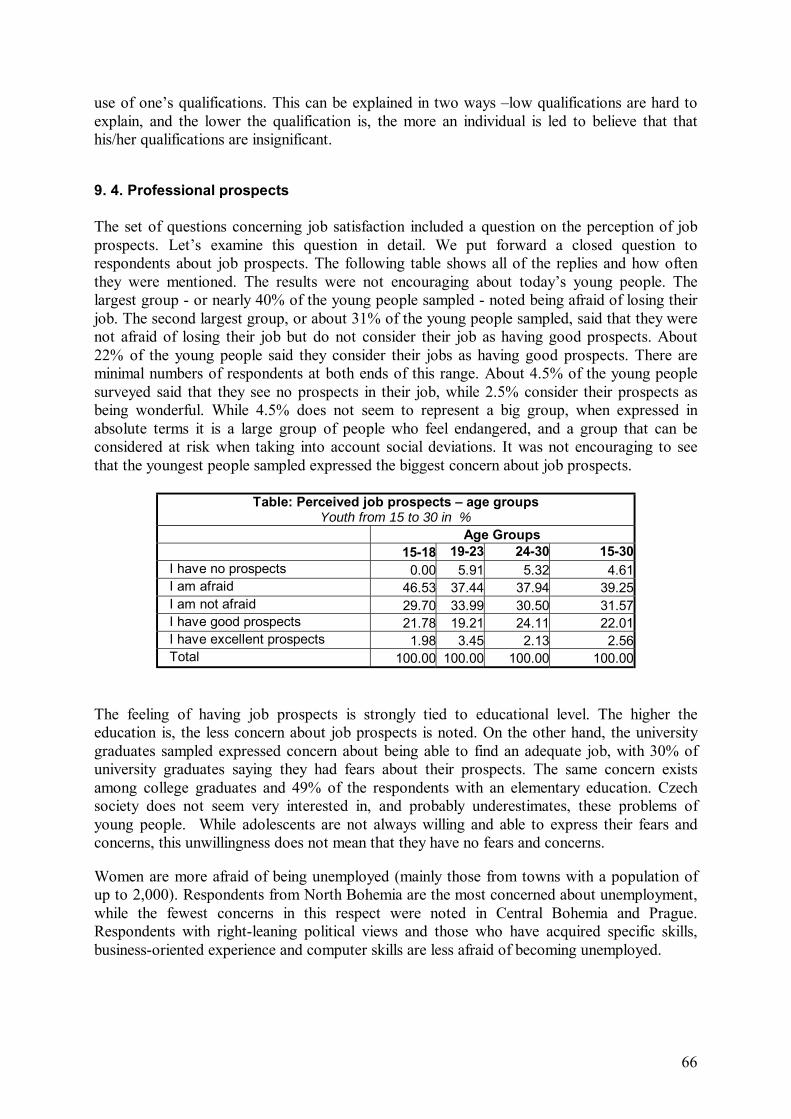
66
use of one�s qualifications. This can be explained in two ways �low qualifications are hard to explain, and the lower the qualification is, the more an individual is led to believe that that his/her qualifications are insignificant. 9. 4. Professional prospects The set of questions concerning job satisfaction included a question on the perception of job prospects. Let�s examine this question in detail. We put forward a closed question to respondents about job prospects. The following table shows all of the replies and how often they were mentioned. The results were not encouraging about today�s young people. The largest group - or nearly 40% of the young people sampled - noted being afraid of losing their job. The second largest group, or about 31% of the young people sampled, said that they were not afraid of losing their job but do not consider their job as having good prospects. About 22% of the young people said they consider their jobs as having good prospects. There are minimal numbers of respondents at both ends of this range. About 4.5% of the young people surveyed said that they see no prospects in their job, while 2.5% consider their prospects as being wonderful. While 4.5% does not seem to represent a big group, when expressed in absolute terms it is a large group of people who feel endangered, and a group that can be considered at risk when taking into account social deviations. It was not encouraging to see that the youngest people sampled expressed the biggest concern about job prospects.
Table: Perceived job prospects � age groups Youth from 15 to 30 in %
Age Groups 15-18 19-23 24-30 15-30
I have no prospects 0.00 5.91 5.32 4.61 I am afraid 46.53 37.44 37.94 39.25 I am not afraid 29.70 33.99 30.50 31.57 I have good prospects 21.78 19.21 24.11 22.01 I have excellent prospects 1.98 3.45 2.13 2.56 Total 100.00 100.00 100.00 100.00
The feeling of having job prospects is strongly tied to educational level. The higher the education is, the less concern about job prospects is noted. On the other hand, the university graduates sampled expressed concern about being able to find an adequate job, with 30% of university graduates saying they had fears about their prospects. The same concern exists among college graduates and 49% of the respondents with an elementary education. Czech society does not seem very interested in, and probably underestimates, these problems of young people. While adolescents are not always willing and able to express their fears and concerns, this unwillingness does not mean that they have no fears and concerns. Women are more afraid of being unemployed (mainly those from towns with a population of up to 2,000). Respondents from North Bohemia are the most concerned about unemployment, while the fewest concerns in this respect were noted in Central Bohemia and Prague. Respondents with right-leaning political views and those who have acquired specific skills, business-oriented experience and computer skills are less afraid of becoming unemployed.
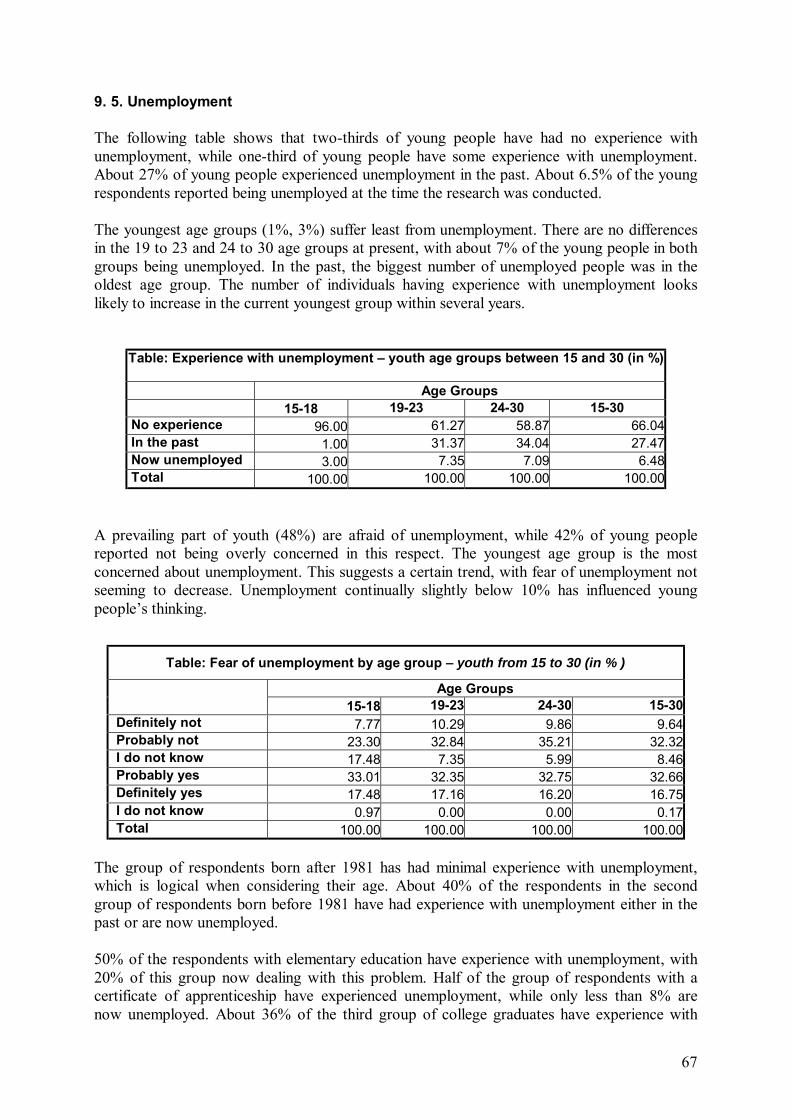
67
9. 5. Unemployment
The following table shows that two-thirds of young people have had no experience with unemployment, while one-third of young people have some experience with unemployment. About 27% of young people experienced unemployment in the past. About 6.5% of the young respondents reported being unemployed at the time the research was conducted.
The youngest age groups (1%, 3%) suffer least from unemployment. There are no differences in the 19 to 23 and 24 to 30 age groups at present, with about 7% of the young people in both groups being unemployed. In the past, the biggest number of unemployed people was in the oldest age group. The number of individuals having experience with unemployment looks likely to increase in the current youngest group within several years.
Table: Experience with unemployment � youth age groups between 15 and 30 (in %)
Age Groups 15-18 19-23 24-30 15-30 No experience 96.00 61.27 58.87 66.04 In the past 1.00 31.37 34.04 27.47 Now unemployed 3.00 7.35 7.09 6.48 Total 100.00 100.00 100.00 100.00
A prevailing part of youth (48%) are afraid of unemployment, while 42% of young people reported not being overly concerned in this respect. The youngest age group is the most concerned about unemployment. This suggests a certain trend, with fear of unemployment not seeming to decrease. Unemployment continually slightly below 10% has influenced young people�s thinking.
The group of respondents born after 1981 has had minimal experience with unemployment, which is logical when considering their age. About 40% of the respondents in the second group of respondents born before 1981 have had experience with unemployment either in the past or are now unemployed.
50% of the respondents with elementary education have experience with unemployment, with 20% of this group now dealing with this problem. Half of the group of respondents with a certificate of apprenticeship have experienced unemployment, while only less than 8% are now unemployed. About 36% of the third group of college graduates have experience with
Table: Fear of unemployment by age group � youth from 15 to 30 (in % )
Age Groups 15-18 19-23 24-30 15-30
Definitely not 7.77 10.29 9.86 9.64 Probably not 23.30 32.84 35.21 32.32 I do not know 17.48 7.35 5.99 8.46 Probably yes 33.01 32.35 32.75 32.66 Definitely yes 17.48 17.16 16.20 16.75 I do not know 0.97 0.00 0.00 0.17 Total 100.00 100.00 100.00 100.00

68
unemployment, with 6% of these now being affected by this problem. About 30% of the university graduate respondents reported being unemployed in their life, but only 1% of them are jobless at present.
About 36% of the single respondents have experienced unemployment, while those that are married, live with a partner or are divorced have had minimal experience with unemployment. Only 4% of these stated that they were jobless in the past. 9. 6. Commuting Czech society has long been characterized by a low willingness to move to a new job. In modern societies, it is normal for people to move to other places when they have found a job or to commute on a daily or weekly basis. The economic transformation, unemployment and a lack of job opportunities in the labor market have changed traditional behavioral patterns. Are Czech youth now willing to commute? Young people nowadays expect to commute. About 27% of young people have commuted or commute, and 43% of young people are ready to commute (older respondents). About 23% are prepared to commute if there is no other option, and only 7% rejected the idea of commuting.
Table: Willingness to commute by age group � youth between 15 and 30
Age groups 15-18 19-23 24-30 15-30
I commute 4.12 12.81 26.50 18.01 I have commuted 3.09 6.90 12.01 8.75 I am prepared to commute 67.01 49.26 29.68 42.71 If there is no other option 19.59 25.62 23.32 23.50 I am not prepared 6.19 5.42 8.48 7.03 Total 100.00 100.00 100.00 100.00
9. 7. Interest in working abroad
When talking about integration into the European Union, the option of working in EU countries is often mentioned. When the conditions of integration were being negotiated, a several-year ban on Czechs being allowed to work in the EU aroused displeasure. Are young people, who are the ones most likely to take up the option of working in the EU, really ready to work abroad? The young generation is divided in half over this question. About 47% of young people are not interested in working abroad and the same number is willing to work abroad. About 6% of young people have already worked abroad or are now working abroad.

69
Table: Interest in working abroad by age group � youth between 15 and 30 in %
Age Groups 15-18 19-23 24-30 15-30
I am working abroad 0.00 0.00 1.06 0.51 I have worked abroad 1.00 1.96 9.54 5.45 I am interested in working abroad 67.00 60.78 30.74 47.36 I am not interested in working abroad 32.00 37.25 58.66 46.68 Total 100.00 100.00 100.00 100.00
What opinions do specific age groups have on the issue of working abroad? The differences are substantial. The number of respondents who reported having worked abroad grows with increasing age. In the 24 to 30 age group, 10% have experience with working abroad. On the other hand, older respondents are less interested in working abroad, which may be associated with the experience this group has. Their more advanced age and different life phase are connected with the position they have acquired, the family they have established and interpersonal relations. It is probable that young people�s interest in working abroad is not well-defined and that many of them will become disinterested in this option without having taken advantage of it. About 59% of single respondents are interested in working abroad, while 5% of these have worked abroad in the past and 0.5% are now working abroad. Respondents that are married, live with a partner or are divorced seem to have cold feet with respect to the idea of working abroad. Only 19% of them are willing to work abroad, 6% have worked abroad in the past and 0.5% are now employed abroad. Women -- and especially women with children -- are less inclined to work abroad, as are men with several children. Interest in working abroad is mostly typical of college and university graduates. 9. 8. Qualifications for being successful in the labor market The labor market is, in fact, a set of specific job opportunities that, in its entirety, represents an aggregation of specific skills, knowledge and competences. The larger the set of necessary skills and competences acquired by an individual that is entering the labor market, the bigger his/her chances of being successful. Our research was focused on specific skills and knowledge that can help in being successful in the job search. The following table shows which competences and skills the young generation can offer. The data must be understood as representing a certain kind of self-assessment. Computer skills have been acquired by 62% of Czech youth, while 70% of young people have a driver�s license. An incredible 52% say that they have knowledge of English. However, knowledge levels in this group vary considerably. About 22% claim to be able to speak two world languages, 20% of young people have skills necessary for doing business and 10% have acquired experience in business. Knowledge of a world language and computer skills will undoubtedly eventually become mandatory for working in the EU.

70
Table: Qualifications necessary for being successful in the labor market by age
group Youth between 15 and 30. in %
Age Groups 15 -18 19 - 23 24 - 30 15 - 30
Computer skills 64.08 65.20 58.95 61.99 Knowledge of English 59.22 60.78 43.51 52.20 Knowledge of German 42.72 44.12 26.67 35.47 Knowledge of two world languages 22.55 27.94 17.54 22.00 Experience in doing business 0.97 11.33 13.33 10.49 Skills necessary for doing business 9.80 23.04 21.05 19.80 Driver�s license 27.45 76.96 79.65 69.71 Knowledge of bookkeeping 4.90 27.45 17.19 18.63 I have a trade license 0.98 13.73 19.30 14.16 Other 4.90 12.75 9.12 9.61
How are qualifications distributed among age groups? Some skills are the highest in the youngest age groups. We are living in dynamic times, and these dynamics are the most visible in young people, who are the most flexible group of society. Young people�s flexibility and the dynamism of society are evident in the phenomena identified within groups of youth only years apart. 9. 9. Interest in running a business The transformation to a market economy led the Czech population to adopt an attitude toward starting a business. A large part of the population has acquired experience in business and received a trade license. Contrary to the elder generation, young people need not face the necessity to start a business abruptly and dramatically - doing business is an integral part of their social maturity. To map the social-economic situation of young people, we must examine the phenomenon of running a business. The following table shows that half of young people are not interested in running a business, one third are interested and 9% are now running a business.
Table: Interest in running a business by age group � youth between 15 and 30 (in %)
Age Groups 15-18 19-23 24-30 15-30
I have run a business 1.01 2.94 5.26 3.74 I am interested in running a business 47.47 31.37 27.02 31.97 I am not interested in running a business 51.52 56.37 55.09 54.93 I am running a business 0.00 9.31 12.63 9.35 Total 100.00 100.00 100.00 100.00

71
Attitudes toward business activities and business itself are influenced by the age of the respondent. In the 24 to 30 age group, 1% run a business. Young people between the ages of 15 and 18 are most interested in running a business - 47% of them want to run their own business. 9. 10. Housing problems A lack of affordable apartments is a social problem that has a big effect on young people. A total of 24% of the young people sampled reported having housing problems while 76% reported having no problem of this kind. Housing problems are mostly associated with age. The youngest age group differs from other groups - only 9% mentioned having a housing problem. In the rest of the young generation, 27% of the respondents reported having housing problems, or more than one quarter of the respondents in these age groups.
10. SOCIAL TIME-SPACE 10. 1. Major problems in life This part deals with the �major problems in young people�s lives". Each respondent answered the question �What is the biggest problem in your life at present?" The answers were registered and generalized on a step-by-step basis and specific categories created.
Data about the major problems over all age groups are shown in the following table. The youngest age group considers school to be the biggest problem. This reply was stated by 37% of the youngest age group. Other problems are considered less important � they were mentioned by 6% of the respondents. This was an encouraging sign, not only because youth consider themselves as having no serious problems but also because they perceive studying to be an essential activity in this given phase of life. The 19 to 23 age group notes two major problems -- financial problems (20%) and studying (12%). Studying is a problem of one-third of the youth when comparing with the previous group. At this age, other problems appear � 6% have housing problems, while 6% have physical and psychical problems. A total of 4% reported health issues as being their biggest problem. A total of 25% of the respondents in the 24 to 30 age group reported having financial problems. This problem affects the largest number of young people in this age range. Problems related to work tend to become of primary importance, with these kinds of problems being stated by every tenth respondent. About 5% of the respondents expressed problems with his/her partner, interfamily relations, housing problems and health problems. The other age groups up to 45 years consider money to be their biggest problem. For those between the ages of 46 and 60, health issues are considered somewhat more problematic than financial problems. In the age group over 61, health issues are considered to be the biggest problem. Health is the biggest problem for 40% of the respondents.

72
Table: Biggest problem in life by age group (in %)
15 - 18 19 - 23 24 - 30 31 - 45 46 - 60 Over 61 No problems or no problems stated 24.27 28.78 20.70 26.62 23.78 24.22 Health 1.94 4.39 8.07 9.35 22.73 40.63 Financial 12.62 20.00 24.56 23.02 22.03 12.50 Studying 36.89 12.20 1.75 1.44 0.35 0.00 Work 1.94 5.85 10.18 11.15 7.34 0.78 Family relations 3.88 1.46 4.56 3.60 4.55 3.13 Social, existential 0.97 2.93 1.75 0.36 0.70 1.56 With a partner 1.94 3.41 4.91 3.96 3.15 5.47 Physical and psychical 5.83 6.34 5.26 3.96 4.20 5.47 No problems 2.91 2.44 1.75 2.16 2.10 0.78 Other 1.94 0.49 2.11 1.44 2.45 0.78 Lack of time 4.85 3.90 6.67 5.40 2.45 0.00 Housing 0.00 5.85 6.67 5.40 2.80 1.56 Interpersonal relations 0.00 0.49 1.05 0.72 0.70 2.34
Negative social phenomena 0.00 0.98 0.00 1.08 0.70 0.78 Transcendence 0.00 0.49 0.00 0.36 0.00 0.00 Total 100.00 100.00 100.00 100.00 100.00 100.00
Young people up to the age of 18 reported having the fewest financial problems, which were more prominent in other groups. Financial problems affect a lower number of respondents from the 24 to 30 age group on, although the decrease is very small. The decrease is especially apparent in those over the age of 61, where such a response was about ten percentage points less than those of other age groups. This part of the population has a furnished apartment and their children have moved away from home and no longer need substantial support. The respondents in this age group still have a job and appreciate the fact that their income exceeds their expenditures. Housing problems are the most common in the 24 to 30 age group (7%). The importance attached to this problem decreases in older age groups (6%, 3%, 2%). Health issues are the only category with a linear relation between the specified problem and age, with the frequency increasing in each subsequent age group. In the group of up to 18 years of age, 2% consider health issues to be their biggest problem. A dramatic increase is evident after the 45th year of life. Compared to the previous age group, the number of people considering health issues to be the biggest problem more than doubled. Problems with studying primarily concern the youngest respondents but are noted in other age groups as well. More than one-third of the respondents in the youngest age group consider studying to be their biggest problem. The occurrence of work-related problems increases from the 19 to 23 and 31 to 45 age groups but decreases between 46 and 60. Those aged 15 to18 and 19 to 23 reported having the fewest work-related problems, which results from the fact that most of the respondents in these age groups do not work but rather attend school.

73
The occurrence of family problems is largely connected with the coexistence of two generations. The fewest problems reported were in the 19 to 23 age group, an age when young people are becoming independent but tend to postpone the establishment of a family to a later time. Social problems � or the perception of problems at a macro-social level � were almost not mentioned, and some age groups did not mention this problem at all. This is mainly the result of the existing social-idea climate, in which the individual and individualism dominate and the problems of the individual overlap with social problems. The social-political euphoria was replaced by political skepticism and a tendency to believe that the individual�s problems should be solved individually regardless of how society develops. The same methodology had been used to examine major life problems in 1995. Comparing the 1995 data on young people�s problems with the 2001 data provides information on youth and the development of society.
Table: Comparing major life problems� 1996 vs. 2001 (in %)
Year 15 - 18 19 - 23 24 - 30 31- 45 1996 1.6 2.7 5.3 9.4 Health 2001 1.9 4.4 8.1 9.3 1996 10.4 10.7 6.8 9.4 No problems 2001 2.9 2.4 1.7 2.1 1996 11.2 17.1 25.2 21.2 Financial 2001 12.6 20.0 24.5 23.0 1996 0.8 14.3 13.5 2.0 Accommodation 2001 0.0 5.8 6.6 5.4 1996 34.4 13.4 4.3 1.2
Studying 2001 36.9 12.2 1.7 1.4 1996 7.2 14.5 12.6 15.5
Work 2001 1.94 5.8 10.1 11.1 1996 12.8 1.8 10.7 16.3 Interfamily relations 2001 3.9 1.5 4.6 3.6 1996 6.4 7.2 6.9 7.7 With partner 2001 1.9 3.4 4.9 3.9 1996 4 3.6 2.9 1.2 Interpersonal relations 2001 0 0.5 1.1 0.7 1996 0.8 0.0 0.0 0.4 Negative social phenomena 2001 0 0.9 0.0 1.1 1996 5.6 3.6 2.9 2.0 Physical and psychical 2001 5.8 6.3 5.2 3.9 1996 4.8 10.8 7.8 10.2 Others 2001 1.9 0.5 2.1 1.4 1996 0 0.5 0.9 3.3 Social, existential 2001 0.9 2.9 1.7 0.3
Interpersonal problems have become less frequent since 1996, and this development is the most evident in interfamily relations in the youngest and oldest age groups. In 1996, interfamily relations were the biggest problem in life for 13% of the respondents; in 2001 it was mentioned by only 4% of the respondents in the youngest age groups. In the 19 to 23 age
74
group, the number of respondents reporting dissatisfaction with interfamily relations remained more or less the same. Problems with partners decreased by almost half in all of the groups. At present, the 24 to 30 age group reported having the biggest problems with partners (5%). Compared with 1996, housing and work-related problems became less frequent while studying problems decreased slightly. The 19 to 23 age group considers financial issues to be the biggest problem. Health problems worsened a little since 1996, primarily in the oldest age group. Czech society can be said to have seen positive developments in recent years, as young people do not report massive problems. Young people consider studying to be the biggest problem. The overall situation of young people has improved over the last six years, as the urgency of their reported problems decreased. 10. 2. Life goals Life goals are intimately associated with an individual�s age and specific life phase. Each age group tends to have its own predominant goal. Each life phase is connected with particular goals that express the functions and needs of a given life phase. The reaching of one goal is a condition for defining and achieving the next goal. Education and qualification are the goals most often mentioned by respondents in the youngest age groups (61%). A total of 9% of the respondents in this age group associate their life goal with work (interesting work, self-realization�). Those between 19 and 23 consider education and qualification to be the most important in this respect, but this was mentioned by only 25% of the respondents. A job was ranked second by 15% of the respondents. Three times more respondents (12%) than in the previous age groups refer to a partner, marriage, family and children as their life goals. A partner, family and marriage were the goals most often mentioned (27%) in the 24 to 30 age group. This category � partner, family.� - is the most frequently cited by this age group. At the same time, financially securing their family was the most often mentioned in this age group as a life goal.
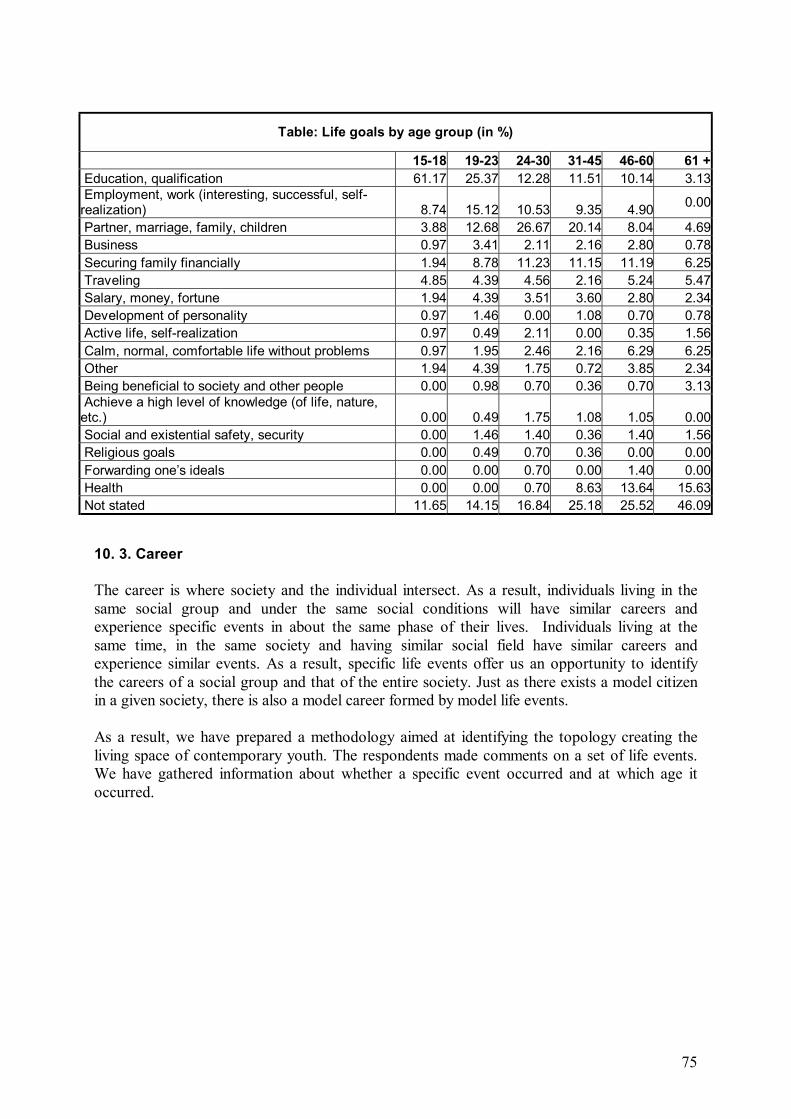
75
Table: Life goals by age group (in %)
15-18 19-23 24-30 31-45 46-60 61 + Education, qualification 61.17 25.37 12.28 11.51 10.14 3.13 Employment, work (interesting, successful, self-realization) 8.74 15.12 10.53 9.35 4.90 0.00
Partner, marriage, family, children 3.88 12.68 26.67 20.14 8.04 4.69 Business 0.97 3.41 2.11 2.16 2.80 0.78 Securing family financially 1.94 8.78 11.23 11.15 11.19 6.25 Traveling 4.85 4.39 4.56 2.16 5.24 5.47 Salary, money, fortune 1.94 4.39 3.51 3.60 2.80 2.34 Development of personality 0.97 1.46 0.00 1.08 0.70 0.78 Active life, self-realization 0.97 0.49 2.11 0.00 0.35 1.56 Calm, normal, comfortable life without problems 0.97 1.95 2.46 2.16 6.29 6.25 Other 1.94 4.39 1.75 0.72 3.85 2.34 Being beneficial to society and other people 0.00 0.98 0.70 0.36 0.70 3.13 Achieve a high level of knowledge (of life, nature, etc.) 0.00 0.49 1.75 1.08 1.05 0.00 Social and existential safety, security 0.00 1.46 1.40 0.36 1.40 1.56 Religious goals 0.00 0.49 0.70 0.36 0.00 0.00 Forwarding one�s ideals 0.00 0.00 0.70 0.00 1.40 0.00 Health 0.00 0.00 0.70 8.63 13.64 15.63 Not stated 11.65 14.15 16.84 25.18 25.52 46.09
10. 3. Career The career is where society and the individual intersect. As a result, individuals living in the same social group and under the same social conditions will have similar careers and experience specific events in about the same phase of their lives. Individuals living at the same time, in the same society and having similar social field have similar careers and experience similar events. As a result, specific life events offer us an opportunity to identify the careers of a social group and that of the entire society. Just as there exists a model citizen in a given society, there is also a model career formed by model life events. As a result, we have prepared a methodology aimed at identifying the topology creating the living space of contemporary youth. The respondents made comments on a set of life events. We have gathered information about whether a specific event occurred and at which age it occurred.

76
Table: First-ever experience with specific activities by age group (in %)
15 - 18 19 - 23 24 - 30 15 � 30
Be paid for work 86.41 99.02 100.00 97.30 Traveling abroad 95.15 95.10 96.84 95.95 Visit to disco, rock club 83.50 98.04 96.14 94.59 Vacationing without parents 74.76 96.08 94.74 91.72 Opening a bank account 22.33 75.00 90.88 73.48 Full-time job 4.85 54.90 92.63 64.36 Living independently 0 28.92 70.53 44.09 Drug use 45.10 48.04 38.25 42.81 Living with a partner 0 23.53 69.47 41.72 Getting own apartment 0 12.75 45.61 26.52 Marriage 0 6.86 48.07 25.72 Childbirth 1.94 4.41 37.68 19.97 Divorce 0.00 0.49 6.32 3.38
For example, traveling abroad is a part of life for more or less all age groups, with the younger the generation, the earlier young people have such experience. Contrary to young people in the third world, employment is not included in the Czech youth�s career priorities. When compared with young people in the United States, Czech youth start to live on their own at an older age. Compared with earlier generations, the respondents have their first child at a later age. Czech young people are more and more putting off the establishment of a family and having children to an older age. Young people tend to have their first child after the age of 23. The same applies to living independently.
Tab. Average age a given activity is experienced for the first time by age group (in %)
15 - 18 19 - 23 24 - 30 15 � 30 Divorce 0 19.0 23.4 23.2 Acquisition of apartment 0 19.8 23.0 22.5 First child born 18 20.4 22.6 22.6 Marriage 0 20.3 22.4 22.2 Living with partner 0 19.7 21.9 21.5 Living independently 0 19.3 21.5 21.0 Permanent job 18.0 18.6 19.7 19.4 Bank account opened 15.3 18.0 19.5 18.8 Drug use 15.3 16.4 18.2 17.0 Visit to disco, rock club 14.5 15.2 15.9 15.4 Paid work 14.9 15.3 15.6 15.4 Vacation without parents 14.5 14.8 14.8 14.7 Travel abroad 9.2 10.4 12.7 11.3
The milestones of an average career includes holidays abroad at the age of 9, holidays without parents and the first visit to a disco at the age of 14. At 15, experience with drugs is reported and the first job is usually experienced at the age of 18. First marriages tend to take place between the ages of 20 and 22, and the first divorce after the age of 23. The divorce age depends more on the age at which a person entered into his first marriage and less on whether or not s/he is able to live in a marriage. Important life events that are not covered by this
77
methodology should be mentioned � events related to education, such as the completion of a given educational level and the start of the subsequent level. Careers and the lifestyle that results from general leisure-time preferences are two synthetic indicators providing information about an individual and the state of society. Other similar indicators associated with consciousness are life goals and life problems. In their descriptions of careers, life goals and life problems, young people can provide us with further descriptions and analytic data on Czech youth.
11. PUBLIC ADMINISTRATION IN RELATION TO THE YOUTH IN THE CZECH REPUBLIC AND INSTITUTIONS THAT ARE INVOLVED IN YOUTH ISSUES
Public administration in relation to the youth is performed at the central level by specific ministries and at a lower level by regional and local authorities. The administration is executed as per Act No. 2/1969 Coll. on establishing ministries and other central offices of the state administration of the Czech Republic, Act No. 129/2000 Coll., on regions and Act No.128/2000 Coll., on communities. Public administration in relation to the care of children and the youth is executed at the central level primarily by the Ministry of Education, Youth and Sports. The Ministry focuses particularly on the following issues: • preparing regulations that cover this issue, • preparing and coordinating the concept of a governmental policy on the youth, • maintaining a grant policy in relation to non-governmental, non-profit organizations that
work with children and the youth, • interest and informal education, • youth participation, • work with gifted children and youths, including the organizing of competitions, • international cooperation and the exchange of young people, • work with information for children and the youth. Youth issues are of an interdisciplinary nature and require that other ministries be more involved. As a result, in addition to the Ministry of Education, Youth and Sports, other ministries cooperate in this area including, for example, the Ministry of Labor and Social Affairs, the Ministry of Health, the Ministry of Culture, the Ministry of the Environment, the Ministry of the Interior and the Ministry of Local Development. The ministries have established special institutes to deal with specific issues that fall within their competences. The Ministry of Education, Youth and Sports has established the following institutes: Institut dětí a mláde�e (The Institute for Children and Youth) � Its activities are focused particularly on carrying out interdisciplinary children and youth research projects; preparing conceptual, analytical and methodological documents; training � as an accredited institution � professionals and volunteers that are involved in interest education, extracurricular education and other leisure-time activities; and preparing and implementing official competitions and exhibitions. At the same time, the Institute for Children and Youth cooperates in preparing

78
acts and methodology instructions with the Ministry of Education, Youth and Sports which cover interest education, extracurricular education and other leisure-time activities concerning the care of gifted youth, EU educational programs, and the development of systematically providing children and the youth with information in compliance with the European Charter concerning Information for Youth. Institut zájmového vzdělávání (The Interest Education Institute) and Středisko vzdělávání, informací a slu�eb (The Center for Education, Information and Services) � Their activities are aimed at interest education, and children and youth�s leisure-time activities outside school. They test educational processes and content in practice at schools and school facilities; devise, prepare and check methodology instructions concerning interest education, extracurricular education and other leisure-time activities; propose and check school and school facilities´ forms of work with minorities and ethnic groups; and systematically train leaders of hobby groups and other similar entities. Should public administration in relation to the youth be executed correctly, the specific institutions should be more open to youth and/or non-government, non-profit organizations that associate with the children and the youth, and work with them. In order to create conditions of coordination, the Chamber of Youth was established in the early nineties and was later converted into an advisory body of the Ministry of Education, Youth and Sports in early 2002. The goal of the Chamber of Youth is to discuss issues related to the children and youth policy, the government�s children and youth policy, including current activities of specific ministries, implementation of the recommendations of the Council of Europe and UNESCO in the Czech Republic, adaptation of the EU´s regulations to the Czech context, and the like. The members of the Chamber of Youth are representatives of non-governmental, non-profit organizations of children and the youth and leisure-time centers, and are appointed by the umbrella non-governmental, non-profit organizations, the directors of organizations established by the Ministry of Education, Youth and Sports in order to solve children and youth issues (The Institut dětí a mláde�e (The Institute for Children and Youth), Institut zájmového vzdělávání (The Institute of Interest Education), Středisko vzdělávání, informací a slu�eb (The Center of Education, Information and Services), representatives of the Ministry of Labor and Social Affairs, the Ministry of Culture, the Ministry of Health and the Ministry of the Interior, the Ecumenical Council of Churches, the Youth Council of the Czech-Moravian Confederation of Trade Unions and regional authorities. Higher regional self-governing administrative units � regions � were formed in the territory of the Czech Republic by adopting the constitutional act No. 347/1997 Coll. on creating higher regional self-governing administrative units and alteration to the constitutional act of the Czech National Council No. 1/1993 Coll. the Constitution of the Czech Republic. Regional authorities and councils provide grants from their means to associations of citizens, humanitarian organizations and other legal and natural persons that are involved in the area of youth, sports and physical training in specific regions. The Committee of the regional authority for education, training and employment submits their opinion on allotting grants to youth and sports projects; discusses reports on the results of the educational activities of schools, school facilities and pre-school facilities, and fulfills other tasks concerning education according to the local authority�s instructions. In regions, these activities are pursuit above all by the youth and sports departments of the regional authorities that apply competences vested in them and/or transferred to them. These departments cooperate closely with the competent departments of the Ministries of Labor and

79
Social Affairs, the Ministry of Health, the Ministry of Culture and the Ministry of the Environment as well as other central institutions of the state administration. Their structure and job description vary in specific regions. Communities are essential for children and youth work. City authorities have specific departments that are involved in children and youth issues. Schools and school facilities play an important role among institutions involved in children and youth work. Leisure-time centers, school clubs and after-school centers offer leisure-time activities, interest education, work with gifted children and the youth, and provide other activities. The concept of their development falls within the competences of the regional and local authorities that are responsible for them.
12. NON-GOVERNMENTAL, NON-PROFIT ORGANIZATIONS INVOLVED IN CHILDREN AND YOUTH WORK
The non-governmental, non-profit organizations are an important element of the system of children and youth work. They are essential for informal education, offering leisure-time activities, work with risk children and youth groups, and work with unemployed young people. They influence the maturation of the children and the youth, their attitudes and their opinions. They complement the influence of the school and the family and other subjects. Churches and clerical clubs are also involved in this area. The activities of non-governmental, non-profit organizations can be considered a fundamental element of the building of a civic society. Though these organizations do have not many members, a lot of young people seem to be in touch with these organizations and participate only in specific actions as sociological research shows (this applies to young people). This suggests that these organizations have an influence on many people and not just on their members (about 25 % of children and young people). Persons that were members of these organizations often have an influence on other people in their surroundings � in public administration, non-profit and commercial spheres. The government has invested more and more money in support of non-government, non-profit organizations working with children and the youth over the past four years. The Ministry of Youth, Education and Sports´ 2002 budget set aside about 179 millions Kč for supporting these activities. Other ministries � including the Ministries of Labor and Social Affairs, the Ministry of Health, the Ministry of Culture, the Ministry of the Interior and the Ministry of the Environment also provide funds for activities of non-government, non-profit organizations involved in children and youth work. The number of members of non-governmental, non-profit organizations involved in children and youth work has decreased recently. 43 organizations under review that applied for grants from the Ministry of Educations, Youth and Sports´ programs have lost many members over the previous four years. This development also results from the population trends. Sociological research shows a similar picture in youth organizations in the former East Germany, Spain, France, Italy and Portugal. Further development in this area can be triggered by new trends in the activities of non-governmental, non-profit children and youth organizations, improved training of the leaders and other volunteers that work with children and the youth, activities aimed at children and the youth that are not members of any organization including children and youth clubs that will exchange information with organizations that have members.
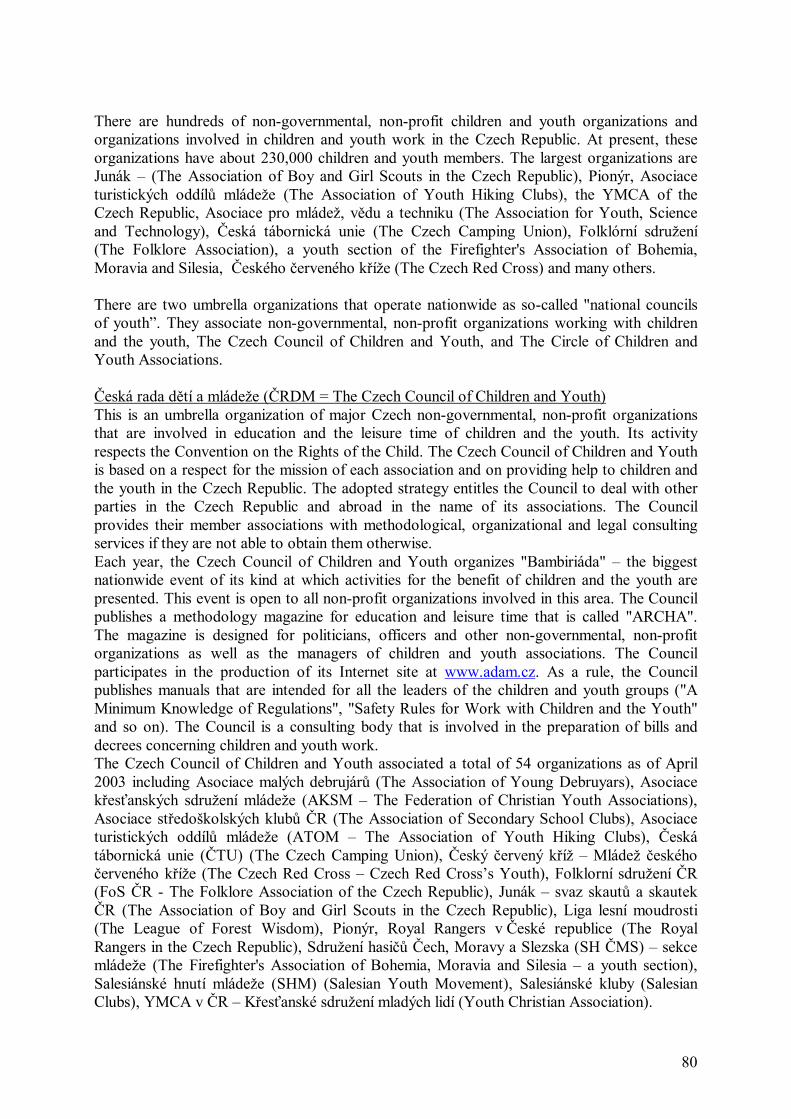
80
There are hundreds of non-governmental, non-profit children and youth organizations and organizations involved in children and youth work in the Czech Republic. At present, these organizations have about 230,000 children and youth members. The largest organizations are Junák � (The Association of Boy and Girl Scouts in the Czech Republic), Pionýr, Asociace turistických oddílů mláde�e (The Association of Youth Hiking Clubs), the YMCA of the Czech Republic, Asociace pro mláde�, vědu a techniku (The Association for Youth, Science and Technology), Česká tábornická unie (The Czech Camping Union), Folklórní sdru�ení (The Folklore Association), a youth section of the Firefighter's Association of Bohemia, Moravia and Silesia, Českého červeného kří�e (The Czech Red Cross) and many others. There are two umbrella organizations that operate nationwide as so-called "national councils of youth�. They associate non-governmental, non-profit organizations working with children and the youth, The Czech Council of Children and Youth, and The Circle of Children and Youth Associations. Česká rada dětí a mláde�e (ČRDM = The Czech Council of Children and Youth) This is an umbrella organization of major Czech non-governmental, non-profit organizations that are involved in education and the leisure time of children and the youth. Its activity respects the Convention on the Rights of the Child. The Czech Council of Children and Youth is based on a respect for the mission of each association and on providing help to children and the youth in the Czech Republic. The adopted strategy entitles the Council to deal with other parties in the Czech Republic and abroad in the name of its associations. The Council provides their member associations with methodological, organizational and legal consulting services if they are not able to obtain them otherwise. Each year, the Czech Council of Children and Youth organizes "Bambiriáda" � the biggest nationwide event of its kind at which activities for the benefit of children and the youth are presented. This event is open to all non-profit organizations involved in this area. The Council publishes a methodology magazine for education and leisure time that is called "ARCHA". The magazine is designed for politicians, officers and other non-governmental, non-profit organizations as well as the managers of children and youth associations. The Council participates in the production of its Internet site at www.adam.cz. As a rule, the Council publishes manuals that are intended for all the leaders of the children and youth groups ("A Minimum Knowledge of Regulations", "Safety Rules for Work with Children and the Youth" and so on). The Council is a consulting body that is involved in the preparation of bills and decrees concerning children and youth work. The Czech Council of Children and Youth associated a total of 54 organizations as of April 2003 including Asociace malých debrujárů (The Association of Young Debruyars), Asociace křesťanských sdru�ení mláde�e (AKSM � The Federation of Christian Youth Associations), Asociace středo�kolských klubů ČR (The Association of Secondary School Clubs), Asociace turistických oddílů mláde�e (ATOM � The Association of Youth Hiking Clubs), Česká tábornická unie (ČTU) (The Czech Camping Union), Český červený kří� � Mláde� českého červeného kří�e (The Czech Red Cross � Czech Red Cross�s Youth), Folklorní sdru�ení ČR (FoS ČR - The Folklore Association of the Czech Republic), Junák � svaz skautů a skautek ČR (The Association of Boy and Girl Scouts in the Czech Republic), Liga lesní moudrosti (The League of Forest Wisdom), Pionýr, Royal Rangers v České republice (The Royal Rangers in the Czech Republic), Sdru�ení hasičů Čech, Moravy a Slezska (SH ČMS) � sekce mláde�e (The Firefighter's Association of Bohemia, Moravia and Silesia � a youth section), Salesiánské hnutí mláde�e (SHM) (Salesian Youth Movement), Salesiánské kluby (Salesian Clubs), YMCA v ČR � Křesťanské sdru�ení mladých lidí (Youth Christian Association).

81
Kruh sdru�ení dětí a mláde�e (KSDM - The Circle of Children and Youth Associations) This associates children and youth organizations in the Czech Republic while maintaining their sovereignty and respecting their rights and interests. The Circle defends the interests of its members in relation to local and foreign bodies, organizations and institutions. The Circle�s goals include in particular: to enforce the conditions for children and youth work of civic associations, to foster a democratic and equal relationship among children and youth organizations, and their mutual cooperation, to actively participate in the international cooperation of children and youth associations, to articulate, defend and enforce the interests of the Circle member organizations. The main principles of activity are: to be open to all organizations that are involved in children and youth organizations, to define issues that can effectively be solved together, to define common working interests, to provide all participants with all the necessary information, to maintain the sovereignty of the member associations, to not obtain advantages to the detriment of another. The Circle of Children and Youth Associations of the Czech Republic (Kruh sdru�ení dětí a mláde�e ČR) had a total of 62 organizations as of April 2003 including Asociace pro mláde�, vědu a techniku AMAVET (The Association for Youth, Science and Technology), Československý zálesák (The Czechoslovak Tramp), DUHA � sdru�ení dětí a mláde�e (The Duha Association of Children and Youth), ELSA Česká republika (ELSA Czech Republic), Klub mladých Evropanů (The Club of Young Europeans), Klub Pathfinder (The Pathfinder Club), Kolpingovo dílo v ČR (Kolping´s Work in the Czech Republic), Kruh přátel Libertinu (The Circle of the Libertin Center�s Friends), Mladí sociální demokraté (The Young Social Democrats), Rada mladých SON ČR (The Youth Council SON Czech Republic), Sdru�ení přátel Jaroslava Foglara (The Association of Jaroslav Foglar´s Friends), Sdru�ení pro volný čas DEMARO (The DEMARO Leisure-Time Association), Sdru�ení rodičů a přátel Domu dětí a mláde�e (the Association of Parents and Friends of the Children and Youth Center), Společenství Romů na Moravě (The Association of Gypsies in Moravia), and Středisko Radost (The Radost Center).
82
CONCLUSIONS The late 1990s marked a clear turn in the development of young people. The negative trends witnessed in the 1990s changed. Both positive and negative trends became more deeply entrenched, which seems illogical. For example, the quality of leisure time spent changed, as both more and less demanding leisure-time activities were pursued. This results from the fact that society�s differentiating and structuring process divides youth into two parts -- with positive tendencies deepening and expanding in one half and negative tendencies developing in the same way for the other half. The basic differentiating factor is the socio-cultural standard of the young person�s family. Earlier, society used homogenization mechanisms in order to suppress excellent individuals and support individuals at the bottom of the social pyramid. If the family does not compensate for society�s negative impacts on children, the operating of society -- including advertising, media and mass culture -- have a conflicting or negative impact on young people. This development is evident in developments in drug consumption and the age of first sexual intercourse. Although the media continue to report that drug consumption is on the rise, our research revealed a different trend �drug penetration has come to a halt and consumption is stagnating. The 1995 research project �Social deviation and normality� showed for the first time the massive efforts of drug pushers in the Czech Republic and drug use at elementary schools. In the mid 1990s, drug pushers preferred younger children to teenagers as its target group. Our research showed that the situation seems to have improved somewhat (the lower figures may be the result of comparing with the previous research, which was conducted under different legislation and thus might have led respondents act differently. This assumption, however, does not fully explain the different results). This change can be attributed to the above-mentioned �generation gap�. While some young people do not consider drugs to be a novelty that must be tried, and drugs and drug consumption are considered to be in contradiction with all of the other goals, other young people have made drugs a part of their lifestyle. Drugs are being disseminated in this part of population, which is getting more and more addicted as a result. It is clear that the reality cannot be painted only in black and white - the line separating the two groups is not a sharp one. But the halt in negative trends is evident in, among other things, the fact that the age of first sexual intercourse is no longer dropping. Under a certain age, sexual intercourse clearly represents negative social information about individuals. Problems related with young people who can be described as being socially handicapped due to their socio-cultural family environment should be addressed in the government�s youth policy. The research showed that television watching declined for the first time since 1984. This results from a change in young people�s lifestyles and a switch to other media. The use of the Internet and computers has risen dramatically. The more time that is spent using new technologies, the less time is devoted to watching TV. One very important fact uncovered in the research is that many young people are afraid of the future. In general, they are not sure whether they will succeed in their future profession, and many young people are afraid of unemployment. Their basic feeling about life is determined by professional success. If this basic professional guarantee is not granted, the
83
future feels unsafe for them, which affects the individual�s time-space. While it is true that the number of persons expressing such concern decreases along with higher education, these anxieties also exist in young university graduates. The government�s policy should support an active employment policy for young people. Individual steps should be taken to create jobs for young people. At the same time, society should improve the social-psychic climate, which would ease young people�s tension and make them more confident about the future. Some politicians and economists consider fear of unemployment as being a positive phenomenon in relation to the market economy. Motivation based on fear is much worse than positive motivation resulting from creative work and the feeling that one is useful for society. A society based on this kind of motivation offers more satisfaction to its members than a society that makes use of the fear and concerns of its members, including that of young people.
Education became one of the clearest and most positive phenomena associated with young people in the late 1990s. Data on youth supplies information about society � and this information emphasizes education. The research into value preferences shows that these values have been appreciated more during recent years, especially by young age groups. The fact that education is highly valued by young people is proven not only by its ranking among value preferences but also other indicators such as time spent studying. Respondents in the 15 to 18 age group report studying seven hours per week on average. The number of hours that a respondent spends studying ranges from 0 to 15 hours (1.2%, 23 hours). Most of the respondents reported spending 5.5 hours per week studying. A total of 50% of the respondents study more than six hours per week. The importance of education is also evident in its relationship to poverty. Poverty is implicitly defined as a social condition not allowing an individual or his/her children to get an education. The importance and sensitivity of this topic for young people is evident in the perception of education; the 15 to 18 age group draws a relationship between life problems and education. It is clear that we consider that which is important for us to be problematic. If we perceive something as a big problem in life, then this phenomenon is vital for us. One-third of the 15 to 18 age group describes major life problems in this way. Government policy should use the existing favorable climate in society and among young people in relation to education and support education in the following areas:
1. existing school system 2. developing e-learning in connection with the �The Internet at Schools� project 3. developing leisure-time activities and centers, science-oriented activities of college students, etc. 4. life-long education.
Young people today are characterized by changes in life field and/or social field or the social time space. The basic change in the life field is its medialization and digitalization. Young people live and satisfy their needs via the Internet and computer technologies. Multimedia is widely used for education and language learning. The intensive use of new technologies in turn has an influence on the social and psychical aspects of a young individual.

84
The following diagram shows how much time young people aged 15 to 18 spend at the computer and TV.
Time spent at computer and TVYouth from 15 to 18
1
24,3
10,517,5
15,5
7,8
PC
18,4
8,86,9
TV
21,2
27,2
10,7
22,4
PC+TV
0
10
20
30
40
50
60
0 1-7 8-14 15-21 22-28 29-35 36-42
Hours per week
%
When compared with earlier generations, the current generation�s social field is expanding. More than 10% of young people have learnt a foreign language abroad, and some young people have worked or studied in a foreign country. The Internet offers young people on-line access to databases and other information from around the world. The Internet and e-mail and other technologies allow young people to communicate with the entire world, both spontaneously and in a goal-oriented manner. The young generation gets involved into globalization and European integration processes via its social field.