your instructor: dmitri nizovtsev office: 310n in henderson phone: 670-1599 e-mail:...
Post on 19-Dec-2015
216 views
TRANSCRIPT

Your instructor: Dmitri Nizovtsev
Office: 310N in HendersonPhone: 670-1599E-mail: [email protected] Hours: T 5pm – 7pm,
W 4pm – 5pm, R 12:15pm – 1:45pm + Open door policy
Course Web page:http://www.washburn.edu/sobu/dnizovtsev/Econ952.html
MANAGERIAL ECONOMICSEC 952

Textbook: Baye, Managerial Economics and Business Strategy, 7e.
Grading:Problem sets and writing assignments : 25% Two Midterms: 17.5 x 2 = 35% Group project: 15%Final: 25%

Cornerstones of (managerial) economics
1. Opportunity cost
The Opportunity cost (of a product, action etc.) is the value of the next best alternative that has to be forgone in order to obtain it.
The total economic cost consists of explicit (out of pocket, monetary) and implicit (measured in lost opportunities) costs. A good manager has to recognize both.

2. Cost/benefit comparison.
“Net benefit” is the difference between benefits and costs.Example: PROFIT
(1+2): The concept of economic profit (takes both explicit and implicit costs into account)

3. Marginal analysis Instead of looking at the overall costs and benefits, one can look at how costs and benefits change as a result of the action that is being evaluated. Benefits increased more than costs
your company is better off

Demand, Supply, and Market Equilibrium We often hear that “prices are governed by forces of supply and demand”. That is to a large extent true. (And not only prices, but quantities, too!) It is important for a manager to understand how those forces work, be able to predict their direction, and in some cases maybe even affect them. Ideally, it should work in the following way:• Step 1: Look at the “Big Picture” (S-D analysis)• Step 2: What does that mean for your company?• Step 3: Worry about details (create an action plan) First, let us see if we agree on what supply and demand are.

Demand is
relationship = a function, a graph, a formula, etc. What is the shape of a demand relationship? “Law of Demand”:
Why so?“Diminishing marginal utility”
a relationship between the price of a good and the quantity of the good consumers are expected to purchase (a. k. a. “quantity demanded”)
the higher the price of a good, the smaller the quantity demanded
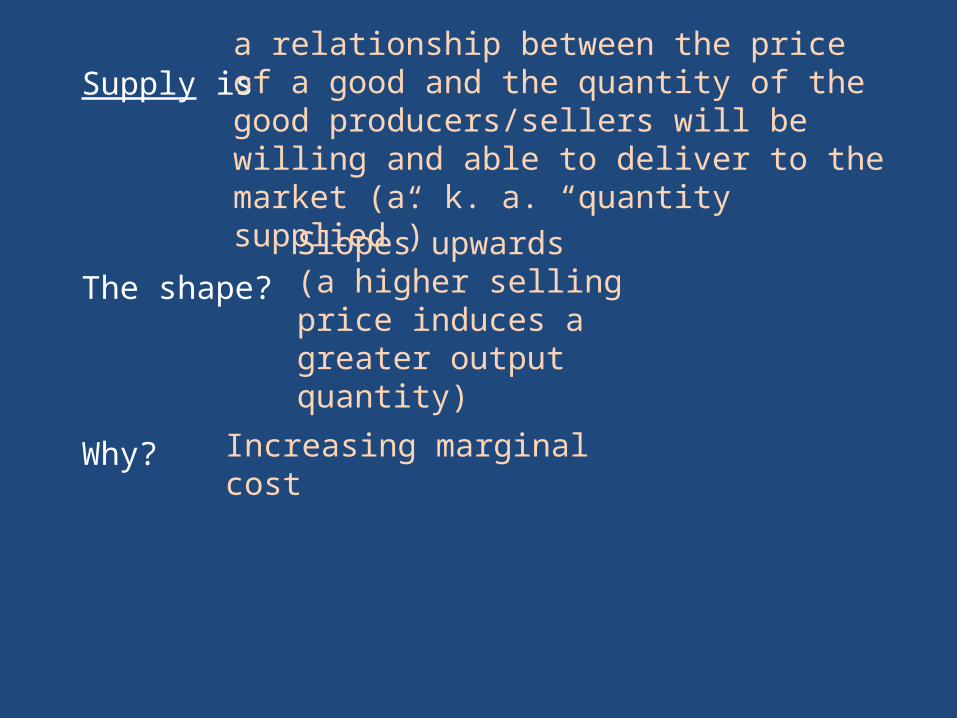
Supply is
The shape?
Why?
a relationship between the price of a good and the quantity of the good producers/sellers will be willing and able to deliver to the market (a. k. a. “quantity supplied”)
Slopes upwards (a higher selling price induces a greater output quantity)
Increasing marginal cost

Market equilibriumWhen put on the same graph, supply and demand curves usually intersect.
P
PE
Equilibrium price
QE
The point where the two curves intersect is called the market equilibrium. It is characterized by a price and a quantity.

In “perfect” markets• large number of buyers and sellers;• goods offered by different sellers are identical;• sellers can freely enter and exit the market;• everyone has perfect information about all the
transactions (prices, quantity, etc.),prices charged by different sellers are usually closely clustered around the equilibrium price. It can be shown by using common sense that it is in no one’s interest to try to ask or offer a price different from the equilibrium price.
In such markets, prices can change only as a result of changes (“shifts”) in supply and/or demand.

A. The price of pork decreasesB. It is getting harder to find workers willing to work in the chicken meat industry
P
Q
P
Q
All the graphs are for the chicken meat market!!!
PCH decreases, QCH decreases PCH increases, QCH decreases

C. A new feed formula helps birds gain weight 50% faster than before
D. Chicken meat is scientifically proven to have substantial health benefits
P
Q
P
Q
PCH decreases, QCH increases PCH increases, QCH increases

Factors that can shift demand (also called “determinants”, or “shifters”): P of a “substitute good” increases – Demand for our good P of a “complementary good” increases – Demand for our good
increases(shifts to the right)
decreases(shifts to the left)

Consumer income increases – Demand for our good….
if it is a “normal good”.
if it is an “inferior good”. Price of a good is expected to go up in the near future – Demand for the good today … There are many other, more trivial factors (# of consumers, information about the good, prior experience with the good, consumer demographics, time of the year, etc.)
INCREASES
DECREASES
INCREASES

Factors that can shift supply: Increase in costs (higher input prices, tax on producers, etc.)
Supply ____________ Decrease in costs (cheaper inputs, subsidy to producers, technol. progress, etc.)
Supply ____________
Increase in the number of firms in the market
DECREASES(shifts left)
INCREASES(shifts right)
Supply INCREASES

Prices of other goods (Y) that can be produced instead of the good of interest (X), “substitutes in production” Logic:Price of Y goes up Resources shift …… Or: Price of Y goes up The opp.cost of X….

Prices of other goods (Y) that can be produced instead of the good of interest (X), “substitutes in production” Logic:Price of Y goes up Resources shift from X into Y… Or: Price of Y goes up The opp.cost of X….

Prices of other goods (Y) that can be produced instead of the good of interest (X), “substitutes in production” Logic:Price of Y goes up Resources shift from X into Y…Less X is produced Or: Price of Y goes up The opp.cost of X….

Prices of other goods (Y) that can be produced instead of the good of interest (X), “substitutes in production” Logic:Price of Y goes up Resources shift from X into Y…Less X is produced – a decrease in supply of X Or: Price of Y goes up The opp.cost of X….

Prices of other goods (Y) that can be produced instead of the good of interest (X), “substitutes in production” Logic:Price of Y goes up Resources shift from X into Y…Less X is produced – a decrease in supply of X Or: Price of Y goes up The opp.cost of X increases
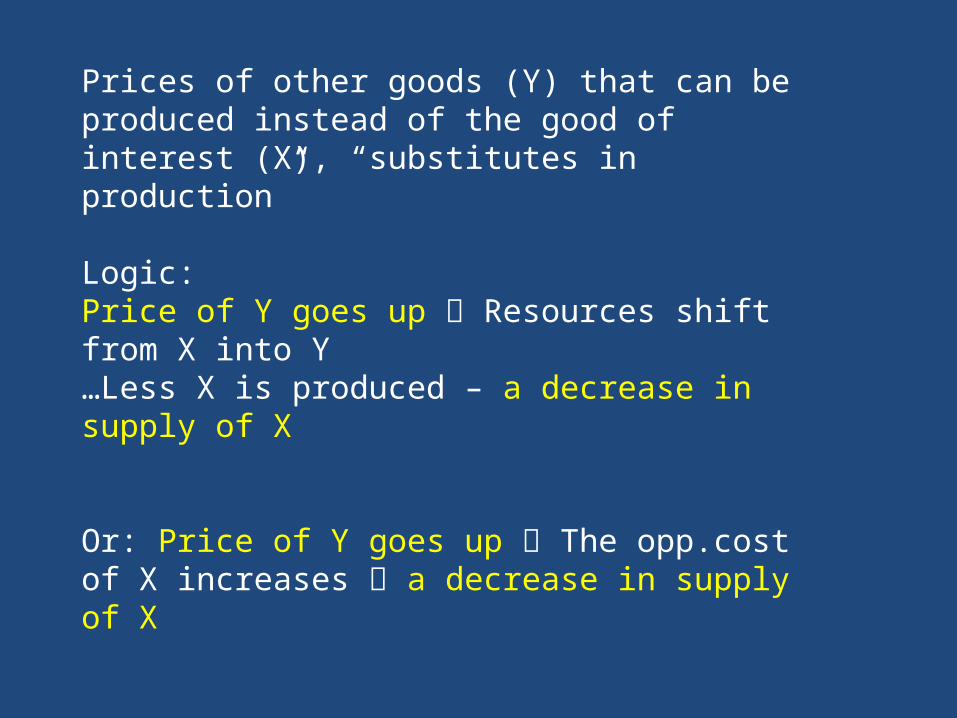
Prices of other goods (Y) that can be produced instead of the good of interest (X), “substitutes in production” Logic:Price of Y goes up Resources shift from X into Y…Less X is produced – a decrease in supply of X Or: Price of Y goes up The opp.cost of X increases a decrease in supply of X

Important things to keep in mind in S-and-D analysis: When both curves (supply AND demand) shift, and we are asked about the direction of change in price and quantity, we will be able to predict only one of the two. The other one will be indeterminate.
A common mistake is shifting too many curves too many times (in most cases, one event causes only one shift).
A shift in a curve should occur only if we are dealing with one of the “shifters” listed above.A change in the price of the good in question doesn’t cause a shift! Buyers and sellers do react to the price of the good but that reaction is illustrated by movement along a curve.

Why care about supply-and-demand analysis? Example:You manage a small firm that manufactures PCs.•Event: The WSJ reports that the prices of PC components are expected to fall by 5-8 percent over the next six months. • Step 1: Look at the “Big Picture” (S-D analysis)• Step 2: What does that mean for your company?• Step 3: Worry about details (create an action plan)

Often, quantitative analysis of market environment allows to present supply and demand relationships in the form of equations, such as QD,X = F(Px , Py , M, HD, …), where QD,X = quantity demanded of good X; Px = price of good X;Py = price of a related good Y(can be substitute or complement);M = consumers’ income;HD = any other variables affecting demand Similarly, QS,X = F(Px , Py , HS, …)
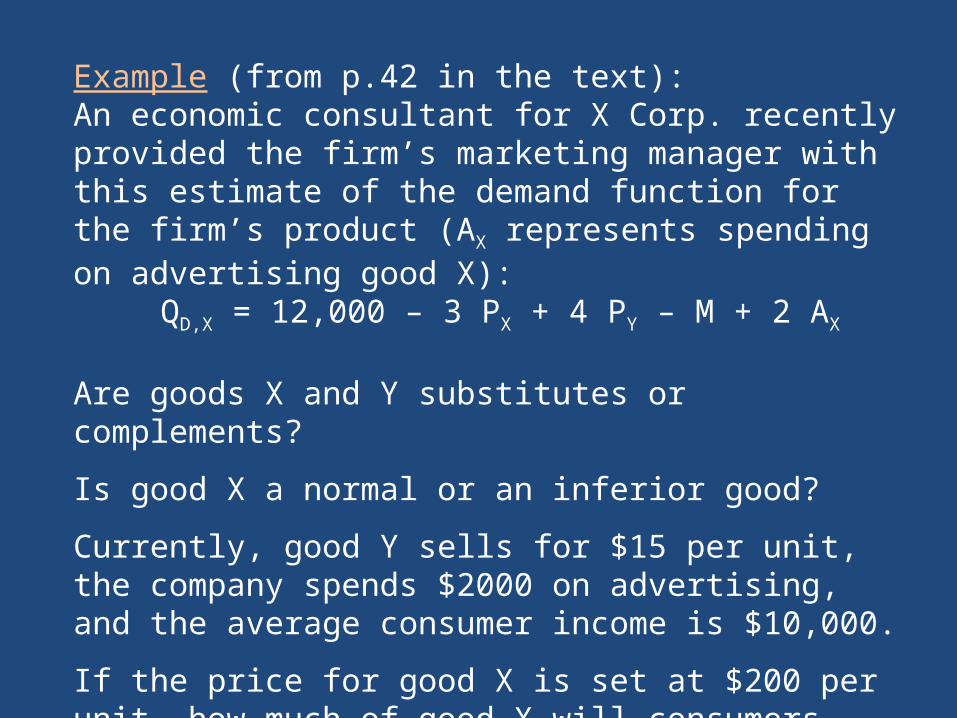
Example (from p.42 in the text):An economic consultant for X Corp. recently provided the firm’s marketing manager with this estimate of the demand function for the firm’s product (AX represents spending on advertising good X):
QD,X = 12,000 – 3 PX + 4 PY – M + 2 AX
Are goods X and Y substitutes or complements?
Is good X a normal or an inferior good?
Currently, good Y sells for $15 per unit, the company spends $2000 on advertising, and the average consumer income is $10,000.
If the price for good X is set at $200 per unit, how much of good X will consumers purchase?

When equations for supply and demand are available, we can make fairly accurate predictions regarding price and quantity. (Where those equations may come from will be discussed next week.) Example: Demand: QD = 3000 – 50 PSupply: QS = 200 P – 500 Can we tell what the equilibrium price and quantity are?
Normally, supply and demand equations are given in the form similar to the one above, where quantity is expressed as a function of price. On some occasions, we will need a different form, known as “inverse” supply/demand, when price is a function of quantity (price is on the left side of the equation). For example, the above equations can be rewritten as…
