your monthly neighborhood market report: march edition
DESCRIPTION
Here's your free digital monthly subscription of Chicago Neighborhood Market Report. Lots of exciting statistics. Hope you enjoy it! Call us anytime for questions 773-865-8575TRANSCRIPT

Stephany Oliveros Group

2-2014 2-2015 + / – 2-2014 2-2015 + / –
New Listings 12 18 + 50.0% 20 39 + 95.0%
Closed Sales 4 10 + 150.0% 9 16 + 77.8%
Median Sales Price* $266,000 $318,750 + 19.8% $270,000 $334,000 + 23.7%
Percent of Original List Price Received* 98.0% 93.5% - 4.6% 95.7% 94.4% - 1.4%
Market Time 38 102 + 171.5% 88 130 + 47.1%
Inventory of Homes for Sale 29 40 + 37.9% -- -- --
2-2014 2-2015 + / – 2-2014 2-2015 + / –
New Listings 11 27 + 145.5% 20 44 + 120.0%
Closed Sales 8 11 + 37.5% 17 22 + 29.4%
Median Sales Price* $100,000 $165,000 + 65.0% $110,000 $174,750 + 58.9%
Percent of Original List Price Received* 94.2% 88.5% - 6.1% 97.1% 90.3% - 7.0%
Market Time 196 90 - 54.2% 153 106 - 31.0%
Inventory of Homes for Sale 40 54 + 35.0% -- -- --* Does not account for sale concessions and/or down payment assistance. Note: Activity for one month can sometimes look extreme due to small sample size.
Change in Median Sales Price from Prior Year (6-Month Average)†
All All
Albany Park Albany Park
Detached Single-FamilyFebruary Year to Date
Attached Single-FamilyFebruary Year to Date
Local Market Update – February 2015
Albany Park+ 95.7% + 75.0% + 36.2%
Change inNew ListingsAll Properties
Change inClosed SalesAll Properties
Change in Inventory of Homes
All Properties
- 40%
- 30%
- 20%
- 10%
0%
+ 10%
+ 20%
+ 30%
+ 40%
+ 50%
+ 60%
+ 70%
1-2009 1-2010 1-2011 1-2012 1-2013 1-2014 1-2015
Detached Single-Familyb
a
- 80%
- 60%
- 40%
- 20%
0%
+ 20%
+ 40%
+ 60%
+ 80%
+ 100%
1-2009 1-2010 1-2011 1-2012 1-2013 1-2014 1-2015
Attached Single-Familyb
a
RESIDENTIAL ACTIVITY ONLY | Data current as of March 16, 2015
† Each dot represents the change in median sales price from the prior year using a 6-month weighted average. This means that each of the 6 months usedin a dot are proportioned according to their share of sales during that period. | Current as of March 2, 2015. All data from Midwest Real Estate Data.
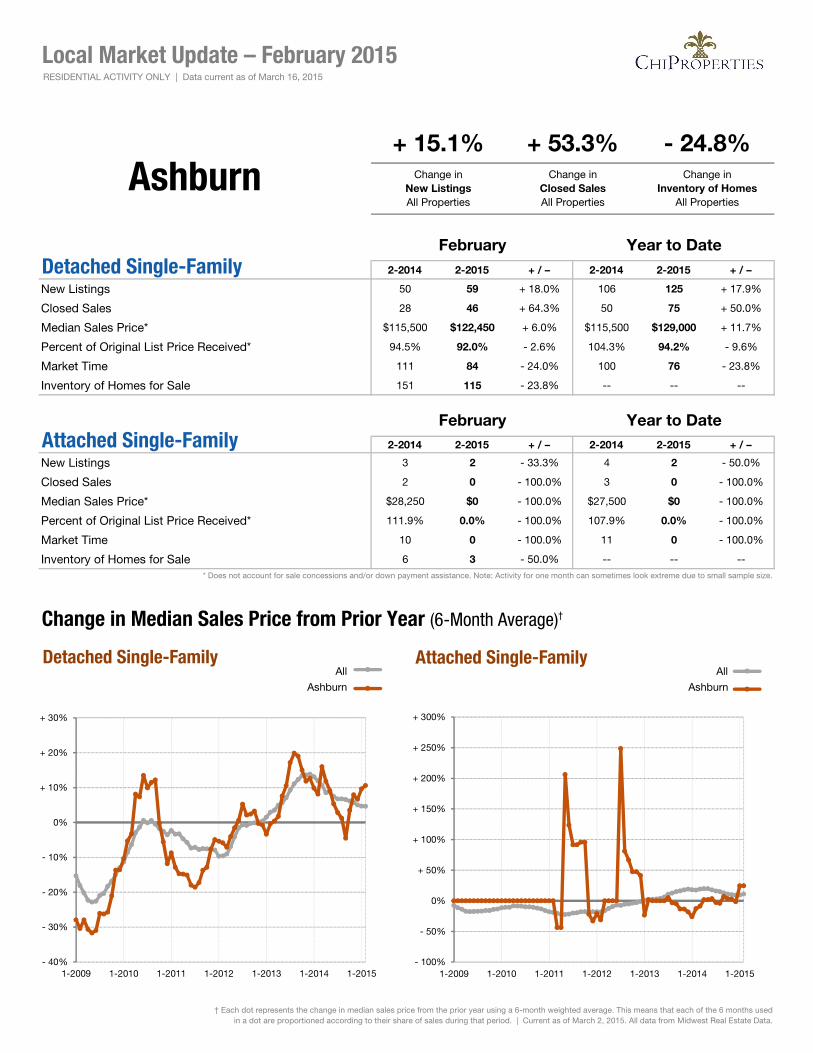
2-2014 2-2015 + / – 2-2014 2-2015 + / –
New Listings 50 59 + 18.0% 106 125 + 17.9%
Closed Sales 28 46 + 64.3% 50 75 + 50.0%
Median Sales Price* $115,500 $122,450 + 6.0% $115,500 $129,000 + 11.7%
Percent of Original List Price Received* 94.5% 92.0% - 2.6% 104.3% 94.2% - 9.6%
Market Time 111 84 - 24.0% 100 76 - 23.8%
Inventory of Homes for Sale 151 115 - 23.8% -- -- --
2-2014 2-2015 + / – 2-2014 2-2015 + / –
New Listings 3 2 - 33.3% 4 2 - 50.0%
Closed Sales 2 0 - 100.0% 3 0 - 100.0%
Median Sales Price* $28,250 $0 - 100.0% $27,500 $0 - 100.0%
Percent of Original List Price Received* 111.9% 0.0% - 100.0% 107.9% 0.0% - 100.0%
Market Time 10 0 - 100.0% 11 0 - 100.0%
Inventory of Homes for Sale 6 3 - 50.0% -- -- --* Does not account for sale concessions and/or down payment assistance. Note: Activity for one month can sometimes look extreme due to small sample size.
Change in Median Sales Price from Prior Year (6-Month Average)†
All All
Ashburn Ashburn
Detached Single-FamilyFebruary Year to Date
Attached Single-FamilyFebruary Year to Date
Local Market Update – February 2015
Ashburn+ 15.1% + 53.3% - 24.8%
Change inNew ListingsAll Properties
Change inClosed SalesAll Properties
Change in Inventory of Homes
All Properties
- 40%
- 30%
- 20%
- 10%
0%
+ 10%
+ 20%
+ 30%
1-2009 1-2010 1-2011 1-2012 1-2013 1-2014 1-2015
Detached Single-Familyb
a
- 100%
- 50%
0%
+ 50%
+ 100%
+ 150%
+ 200%
+ 250%
+ 300%
1-2009 1-2010 1-2011 1-2012 1-2013 1-2014 1-2015
Attached Single-Familyb
a
RESIDENTIAL ACTIVITY ONLY | Data current as of March 16, 2015
† Each dot represents the change in median sales price from the prior year using a 6-month weighted average. This means that each of the 6 months usedin a dot are proportioned according to their share of sales during that period. | Current as of March 2, 2015. All data from Midwest Real Estate Data.

2-2014 2-2015 + / – 2-2014 2-2015 + / –
New Listings 6 14 + 133.3% 17 27 + 58.8%
Closed Sales 4 5 + 25.0% 8 14 + 75.0%
Median Sales Price* $251,000 $240,000 - 4.4% $220,000 $447,000 + 103.2%
Percent of Original List Price Received* 96.2% 97.9% + 1.8% 106.9% 101.8% - 4.7%
Market Time 34 84 + 149.6% 20 52 + 165.7%
Inventory of Homes for Sale 20 26 + 30.0% -- -- --
2-2014 2-2015 + / – 2-2014 2-2015 + / –
New Listings 37 21 - 43.2% 49 35 - 28.6%
Closed Sales 3 14 + 366.7% 5 24 + 380.0%
Median Sales Price* $165,000 $279,000 + 69.1% $165,000 $318,450 + 93.0%
Percent of Original List Price Received* 100.4% 95.5% - 4.8% 99.9% 95.6% - 4.3%
Market Time 68 103 + 52.1% 91 87 - 4.3%
Inventory of Homes for Sale 39 30 - 23.1% -- -- --* Does not account for sale concessions and/or down payment assistance. Note: Activity for one month can sometimes look extreme due to small sample size.
Change in Median Sales Price from Prior Year (6-Month Average)†
All All
Avondale Avondale
Detached Single-FamilyFebruary Year to Date
Attached Single-FamilyFebruary Year to Date
Local Market Update – February 2015
Avondale- 18.6% + 171.4% - 5.1%
Change inNew ListingsAll Properties
Change inClosed SalesAll Properties
Change in Inventory of Homes
All Properties
- 60%
- 40%
- 20%
0%
+ 20%
+ 40%
+ 60%
+ 80%
+ 100%
+ 120%
+ 140%
1-2009 1-2010 1-2011 1-2012 1-2013 1-2014 1-2015
Detached Single-Familyb
a
- 60%
- 40%
- 20%
0%
+ 20%
+ 40%
+ 60%
+ 80%
+ 100%
1-2009 1-2010 1-2011 1-2012 1-2013 1-2014 1-2015
Attached Single-Familyb
a
RESIDENTIAL ACTIVITY ONLY | Data current as of March 16, 2015
† Each dot represents the change in median sales price from the prior year using a 6-month weighted average. This means that each of the 6 months usedin a dot are proportioned according to their share of sales during that period. | Current as of March 2, 2015. All data from Midwest Real Estate Data.

2-2014 2-2015 + / – 2-2014 2-2015 + / –
New Listings 37 44 + 18.9% 76 101 + 32.9%
Closed Sales 25 14 - 44.0% 43 31 - 27.9%
Median Sales Price* $140,700 $192,000 + 36.5% $150,700 $184,900 + 22.7%
Percent of Original List Price Received* 94.1% 95.6% + 1.6% 92.8% 97.3% + 4.8%
Market Time 110 106 - 3.5% 113 110 - 2.6%
Inventory of Homes for Sale 120 103 - 14.2% -- -- --
2-2014 2-2015 + / – 2-2014 2-2015 + / –
New Listings 5 3 - 40.0% 10 8 - 20.0%
Closed Sales 4 1 - 75.0% 5 2 - 60.0%
Median Sales Price* $137,500 $65,000 - 52.7% $135,000 $113,500 - 15.9%
Percent of Original List Price Received* 103.6% 73.0% - 29.5% 103.9% 82.3% - 20.8%
Market Time 83 86 + 3.6% 103 160 + 55.9%
Inventory of Homes for Sale 15 11 - 26.7% -- -- --* Does not account for sale concessions and/or down payment assistance. Note: Activity for one month can sometimes look extreme due to small sample size.
Change in Median Sales Price from Prior Year (6-Month Average)†
All All
Belmont Cragin Belmont Cragin
Detached Single-FamilyFebruary Year to Date
Attached Single-FamilyFebruary Year to Date
Local Market Update – February 2015
Belmont Cragin+ 11.9% - 48.3% - 15.6%
Change inNew ListingsAll Properties
Change inClosed SalesAll Properties
Change in Inventory of Homes
All Properties
- 50%
- 40%
- 30%
- 20%
- 10%
0%
+ 10%
+ 20%
+ 30%
+ 40%
1-2009 1-2010 1-2011 1-2012 1-2013 1-2014 1-2015
Detached Single-Familyb
a
- 100%
0%
+ 100%
+ 200%
+ 300%
+ 400%
+ 500%
1-2009 1-2010 1-2011 1-2012 1-2013 1-2014 1-2015
Attached Single-Familyb
a
RESIDENTIAL ACTIVITY ONLY | Data current as of March 16, 2015
† Each dot represents the change in median sales price from the prior year using a 6-month weighted average. This means that each of the 6 months usedin a dot are proportioned according to their share of sales during that period. | Current as of March 2, 2015. All data from Midwest Real Estate Data.
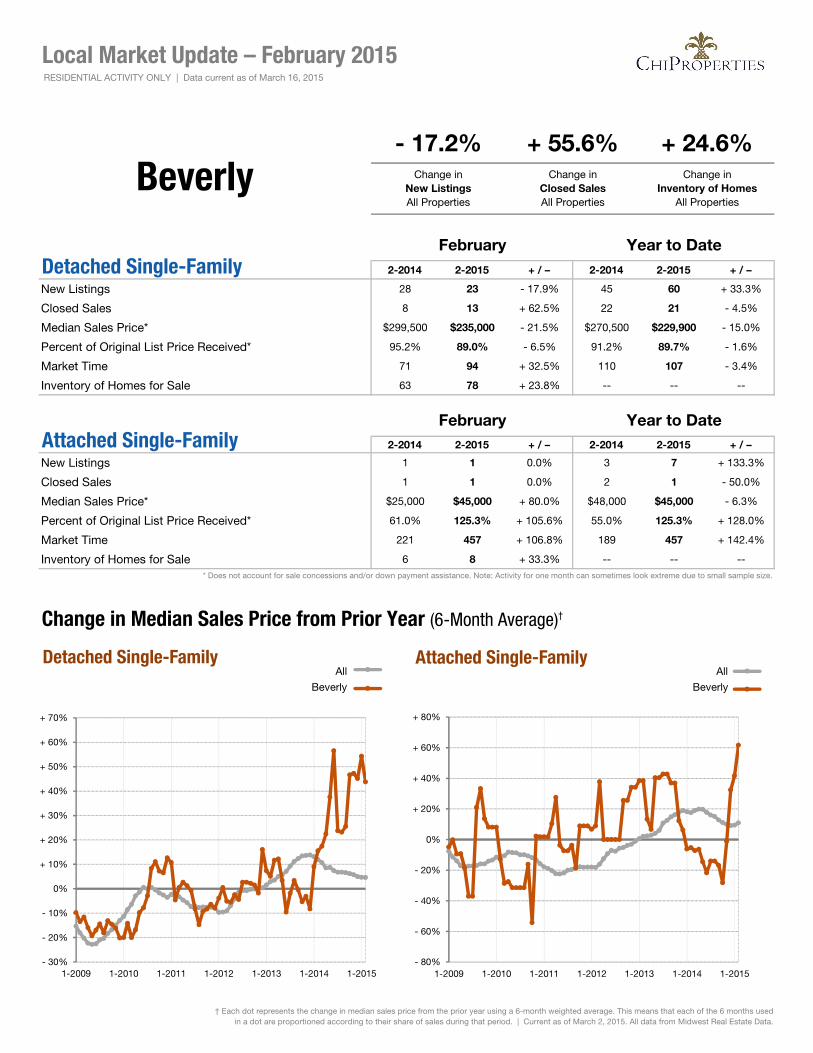
2-2014 2-2015 + / – 2-2014 2-2015 + / –
New Listings 28 23 - 17.9% 45 60 + 33.3%
Closed Sales 8 13 + 62.5% 22 21 - 4.5%
Median Sales Price* $299,500 $235,000 - 21.5% $270,500 $229,900 - 15.0%
Percent of Original List Price Received* 95.2% 89.0% - 6.5% 91.2% 89.7% - 1.6%
Market Time 71 94 + 32.5% 110 107 - 3.4%
Inventory of Homes for Sale 63 78 + 23.8% -- -- --
2-2014 2-2015 + / – 2-2014 2-2015 + / –
New Listings 1 1 0.0% 3 7 + 133.3%
Closed Sales 1 1 0.0% 2 1 - 50.0%
Median Sales Price* $25,000 $45,000 + 80.0% $48,000 $45,000 - 6.3%
Percent of Original List Price Received* 61.0% 125.3% + 105.6% 55.0% 125.3% + 128.0%
Market Time 221 457 + 106.8% 189 457 + 142.4%
Inventory of Homes for Sale 6 8 + 33.3% -- -- --* Does not account for sale concessions and/or down payment assistance. Note: Activity for one month can sometimes look extreme due to small sample size.
Change in Median Sales Price from Prior Year (6-Month Average)†
All All
Beverly Beverly
Detached Single-FamilyFebruary Year to Date
Attached Single-FamilyFebruary Year to Date
Local Market Update – February 2015
Beverly- 17.2% + 55.6% + 24.6%
Change inNew ListingsAll Properties
Change inClosed SalesAll Properties
Change in Inventory of Homes
All Properties
- 30%
- 20%
- 10%
0%
+ 10%
+ 20%
+ 30%
+ 40%
+ 50%
+ 60%
+ 70%
1-2009 1-2010 1-2011 1-2012 1-2013 1-2014 1-2015
Detached Single-Familyb
a
- 80%
- 60%
- 40%
- 20%
0%
+ 20%
+ 40%
+ 60%
+ 80%
1-2009 1-2010 1-2011 1-2012 1-2013 1-2014 1-2015
Attached Single-Familyb
a
RESIDENTIAL ACTIVITY ONLY | Data current as of March 16, 2015
† Each dot represents the change in median sales price from the prior year using a 6-month weighted average. This means that each of the 6 months usedin a dot are proportioned according to their share of sales during that period. | Current as of March 2, 2015. All data from Midwest Real Estate Data.

2-2014 2-2015 + / – 2-2014 2-2015 + / –
New Listings 10 10 0.0% 21 19 - 9.5%
Closed Sales 7 4 - 42.9% 11 8 - 27.3%
Median Sales Price* $356,000 $457,925 + 28.6% $293,000 $426,500 + 45.6%
Percent of Original List Price Received* 92.8% 106.4% + 14.7% 94.3% 101.2% + 7.3%
Market Time 99 31 - 68.6% 109 48 - 56.1%
Inventory of Homes for Sale 38 35 - 7.9% -- -- --
2-2014 2-2015 + / – 2-2014 2-2015 + / –
New Listings 4 2 - 50.0% 8 7 - 12.5%
Closed Sales 1 4 + 300.0% 2 5 + 150.0%
Median Sales Price* $150,000 $172,500 + 15.0% $125,000 $196,000 + 56.8%
Percent of Original List Price Received* 79.4% 93.4% + 17.7% 83.2% 94.4% + 13.4%
Market Time 494 44 - 91.1% 313 38 - 87.9%
Inventory of Homes for Sale 19 15 - 21.1% -- -- --* Does not account for sale concessions and/or down payment assistance. Note: Activity for one month can sometimes look extreme due to small sample size.
Change in Median Sales Price from Prior Year (6-Month Average)†
All All
Bridgeport Bridgeport
Detached Single-FamilyFebruary Year to Date
Attached Single-FamilyFebruary Year to Date
Local Market Update – February 2015
Bridgeport- 14.3% 0.0% - 12.3%
Change inNew ListingsAll Properties
Change inClosed SalesAll Properties
Change in Inventory of Homes
All Properties
- 40%
- 30%
- 20%
- 10%
0%
+ 10%
+ 20%
+ 30%
+ 40%
+ 50%
+ 60%
1-2009 1-2010 1-2011 1-2012 1-2013 1-2014 1-2015
Detached Single-Familyb
a
- 40%
- 30%
- 20%
- 10%
0%
+ 10%
+ 20%
+ 30%
+ 40%
+ 50%
+ 60%
1-2009 1-2010 1-2011 1-2012 1-2013 1-2014 1-2015
Attached Single-Familyb
a
RESIDENTIAL ACTIVITY ONLY | Data current as of March 16, 2015
† Each dot represents the change in median sales price from the prior year using a 6-month weighted average. This means that each of the 6 months usedin a dot are proportioned according to their share of sales during that period. | Current as of March 2, 2015. All data from Midwest Real Estate Data.

2-2014 2-2015 + / – 2-2014 2-2015 + / –
New Listings 8 13 + 62.5% 15 19 + 26.7%
Closed Sales 3 3 0.0% 13 9 - 30.8%
Median Sales Price* $165,000 $77,500 - 53.0% $94,900 $138,000 + 45.4%
Percent of Original List Price Received* 105.9% 74.6% - 29.6% 98.5% 89.0% - 9.6%
Market Time 43 444 + 925.4% 234 186 - 20.6%
Inventory of Homes for Sale 30 22 - 26.7% -- -- --
2-2014 2-2015 + / – 2-2014 2-2015 + / –
New Listings 4 0 - 100.0% 4 0 - 100.0%
Closed Sales 5 3 - 40.0% 6 3 - 50.0%
Median Sales Price* $206,900 $51,900 - 74.9% $206,900 $51,900 - 74.9%
Percent of Original List Price Received* 94.4% 89.9% - 4.7% 94.0% 89.9% - 4.4%
Market Time 2 186 + 9,216.7% 12 186 + 1,520.3%
Inventory of Homes for Sale 4 2 - 50.0% -- -- --* Does not account for sale concessions and/or down payment assistance. Note: Activity for one month can sometimes look extreme due to small sample size.
Change in Median Sales Price from Prior Year (6-Month Average)†
All All
Brighton Park Brighton Park
Detached Single-FamilyFebruary Year to Date
Attached Single-FamilyFebruary Year to Date
Local Market Update – February 2015
Brighton Park+ 8.3% - 25.0% - 29.4%
Change inNew ListingsAll Properties
Change inClosed SalesAll Properties
Change in Inventory of Homes
All Properties
- 60%
- 40%
- 20%
0%
+ 20%
+ 40%
+ 60%
+ 80%
+ 100%
1-2009 1-2010 1-2011 1-2012 1-2013 1-2014 1-2015
Detached Single-Familyb
a
- 500%
0%
+ 500%
+ 1000%
+ 1500%
+ 2000%
+ 2500%
1-2009 1-2010 1-2011 1-2012 1-2013 1-2014 1-2015
Attached Single-Familyb
a
RESIDENTIAL ACTIVITY ONLY | Data current as of March 16, 2015
† Each dot represents the change in median sales price from the prior year using a 6-month weighted average. This means that each of the 6 months usedin a dot are proportioned according to their share of sales during that period. | Current as of March 2, 2015. All data from Midwest Real Estate Data.
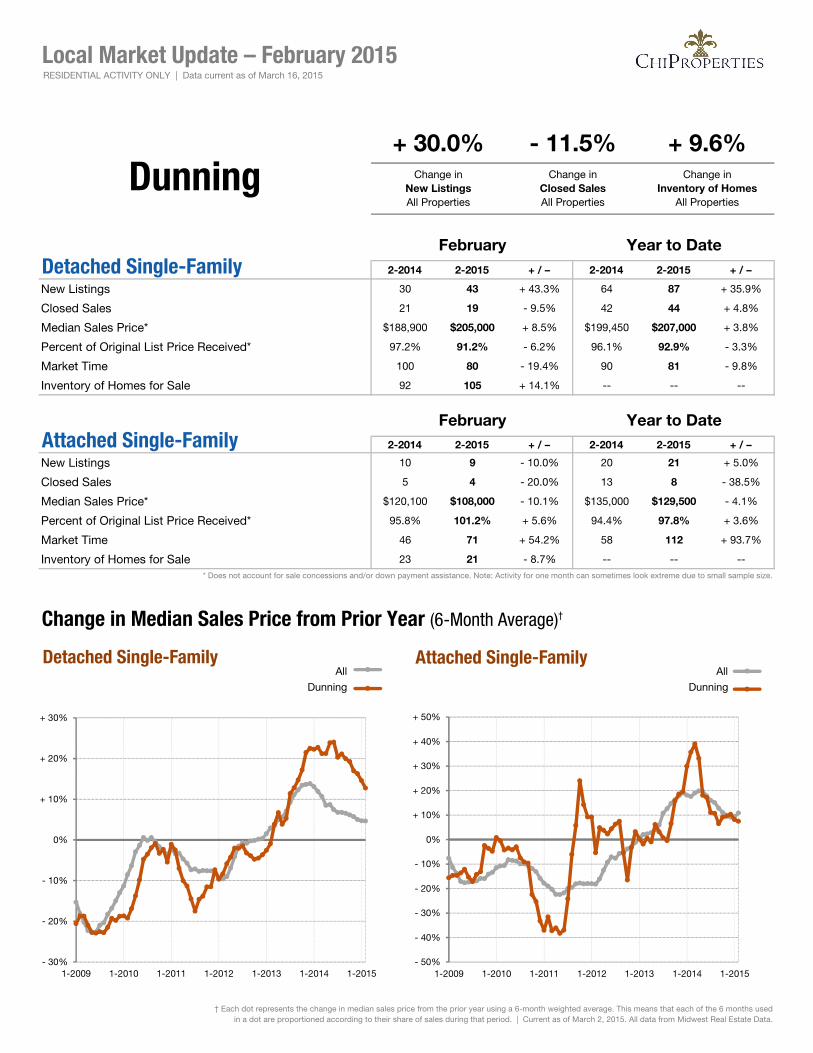
2-2014 2-2015 + / – 2-2014 2-2015 + / –
New Listings 30 43 + 43.3% 64 87 + 35.9%
Closed Sales 21 19 - 9.5% 42 44 + 4.8%
Median Sales Price* $188,900 $205,000 + 8.5% $199,450 $207,000 + 3.8%
Percent of Original List Price Received* 97.2% 91.2% - 6.2% 96.1% 92.9% - 3.3%
Market Time 100 80 - 19.4% 90 81 - 9.8%
Inventory of Homes for Sale 92 105 + 14.1% -- -- --
2-2014 2-2015 + / – 2-2014 2-2015 + / –
New Listings 10 9 - 10.0% 20 21 + 5.0%
Closed Sales 5 4 - 20.0% 13 8 - 38.5%
Median Sales Price* $120,100 $108,000 - 10.1% $135,000 $129,500 - 4.1%
Percent of Original List Price Received* 95.8% 101.2% + 5.6% 94.4% 97.8% + 3.6%
Market Time 46 71 + 54.2% 58 112 + 93.7%
Inventory of Homes for Sale 23 21 - 8.7% -- -- --* Does not account for sale concessions and/or down payment assistance. Note: Activity for one month can sometimes look extreme due to small sample size.
Change in Median Sales Price from Prior Year (6-Month Average)†
All All
Dunning Dunning
Detached Single-FamilyFebruary Year to Date
Attached Single-FamilyFebruary Year to Date
Local Market Update – February 2015
Dunning+ 30.0% - 11.5% + 9.6%
Change inNew ListingsAll Properties
Change inClosed SalesAll Properties
Change in Inventory of Homes
All Properties
- 30%
- 20%
- 10%
0%
+ 10%
+ 20%
+ 30%
1-2009 1-2010 1-2011 1-2012 1-2013 1-2014 1-2015
Detached Single-Familyb
a
- 50%
- 40%
- 30%
- 20%
- 10%
0%
+ 10%
+ 20%
+ 30%
+ 40%
+ 50%
1-2009 1-2010 1-2011 1-2012 1-2013 1-2014 1-2015
Attached Single-Familyb
a
RESIDENTIAL ACTIVITY ONLY | Data current as of March 16, 2015
† Each dot represents the change in median sales price from the prior year using a 6-month weighted average. This means that each of the 6 months usedin a dot are proportioned according to their share of sales during that period. | Current as of March 2, 2015. All data from Midwest Real Estate Data.

2-2014 2-2015 + / – 2-2014 2-2015 + / –
New Listings 9 6 - 33.3% 18 15 - 16.7%
Closed Sales 3 9 + 200.0% 10 16 + 60.0%
Median Sales Price* $64,000 $50,000 - 21.9% $54,000 $58,000 + 7.4%
Percent of Original List Price Received* 93.7% 82.6% - 11.9% 80.3% 83.1% + 3.5%
Market Time 282 66 - 76.5% 156 118 - 24.6%
Inventory of Homes for Sale 59 36 - 39.0% -- -- --
2-2014 2-2015 + / – 2-2014 2-2015 + / –
New Listings 0 0 -- 0 1 --
Closed Sales 0 0 -- 0 0 --
Median Sales Price* $0 $0 -- $0 $0 --
Percent of Original List Price Received* 0.0% 0.0% -- 0.0% 0.0% --
Market Time 0 0 -- 0 0 --
Inventory of Homes for Sale 0 2 -- -- -- --* Does not account for sale concessions and/or down payment assistance. Note: Activity for one month can sometimes look extreme due to small sample size.
Change in Median Sales Price from Prior Year (6-Month Average)†
All All
East Side East Side
Detached Single-FamilyFebruary Year to Date
Attached Single-FamilyFebruary Year to Date
Local Market Update – February 2015
East Side- 33.3% + 200.0% - 35.6%
Change inNew ListingsAll Properties
Change inClosed SalesAll Properties
Change in Inventory of Homes
All Properties
- 60%
- 40%
- 20%
0%
+ 20%
+ 40%
+ 60%
1-2009 1-2010 1-2011 1-2012 1-2013 1-2014 1-2015
Detached Single-Familyb
a
- 30%
- 20%
- 10%
0%
+ 10%
+ 20%
+ 30%
+ 40%
+ 50%
1-2009 1-2010 1-2011 1-2012 1-2013 1-2014 1-2015
Attached Single-Familyb
a
RESIDENTIAL ACTIVITY ONLY | Data current as of March 16, 2015
† Each dot represents the change in median sales price from the prior year using a 6-month weighted average. This means that each of the 6 months usedin a dot are proportioned according to their share of sales during that period. | Current as of March 2, 2015. All data from Midwest Real Estate Data.
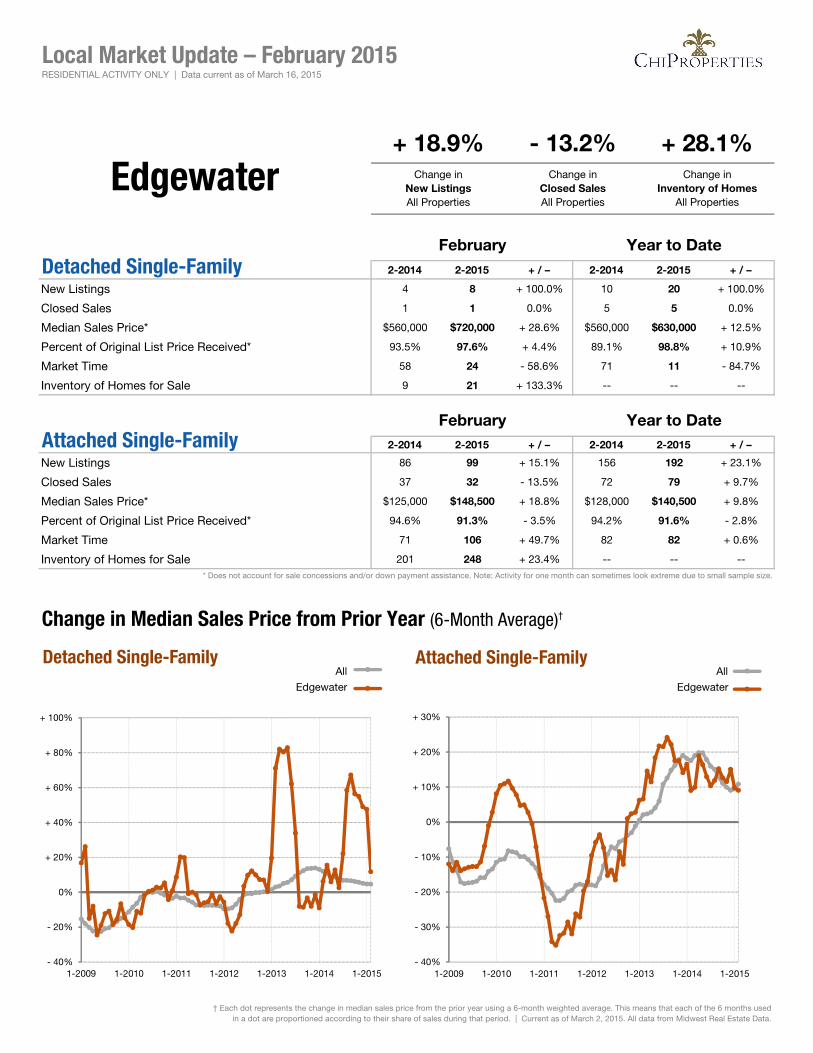
2-2014 2-2015 + / – 2-2014 2-2015 + / –
New Listings 4 8 + 100.0% 10 20 + 100.0%
Closed Sales 1 1 0.0% 5 5 0.0%
Median Sales Price* $560,000 $720,000 + 28.6% $560,000 $630,000 + 12.5%
Percent of Original List Price Received* 93.5% 97.6% + 4.4% 89.1% 98.8% + 10.9%
Market Time 58 24 - 58.6% 71 11 - 84.7%
Inventory of Homes for Sale 9 21 + 133.3% -- -- --
2-2014 2-2015 + / – 2-2014 2-2015 + / –
New Listings 86 99 + 15.1% 156 192 + 23.1%
Closed Sales 37 32 - 13.5% 72 79 + 9.7%
Median Sales Price* $125,000 $148,500 + 18.8% $128,000 $140,500 + 9.8%
Percent of Original List Price Received* 94.6% 91.3% - 3.5% 94.2% 91.6% - 2.8%
Market Time 71 106 + 49.7% 82 82 + 0.6%
Inventory of Homes for Sale 201 248 + 23.4% -- -- --* Does not account for sale concessions and/or down payment assistance. Note: Activity for one month can sometimes look extreme due to small sample size.
Change in Median Sales Price from Prior Year (6-Month Average)†
All All
Edgewater Edgewater
Detached Single-FamilyFebruary Year to Date
Attached Single-FamilyFebruary Year to Date
Local Market Update – February 2015
Edgewater+ 18.9% - 13.2% + 28.1%
Change inNew ListingsAll Properties
Change inClosed SalesAll Properties
Change in Inventory of Homes
All Properties
- 40%
- 20%
0%
+ 20%
+ 40%
+ 60%
+ 80%
+ 100%
1-2009 1-2010 1-2011 1-2012 1-2013 1-2014 1-2015
Detached Single-Familyb
a
- 40%
- 30%
- 20%
- 10%
0%
+ 10%
+ 20%
+ 30%
1-2009 1-2010 1-2011 1-2012 1-2013 1-2014 1-2015
Attached Single-Familyb
a
RESIDENTIAL ACTIVITY ONLY | Data current as of March 16, 2015
† Each dot represents the change in median sales price from the prior year using a 6-month weighted average. This means that each of the 6 months usedin a dot are proportioned according to their share of sales during that period. | Current as of March 2, 2015. All data from Midwest Real Estate Data.
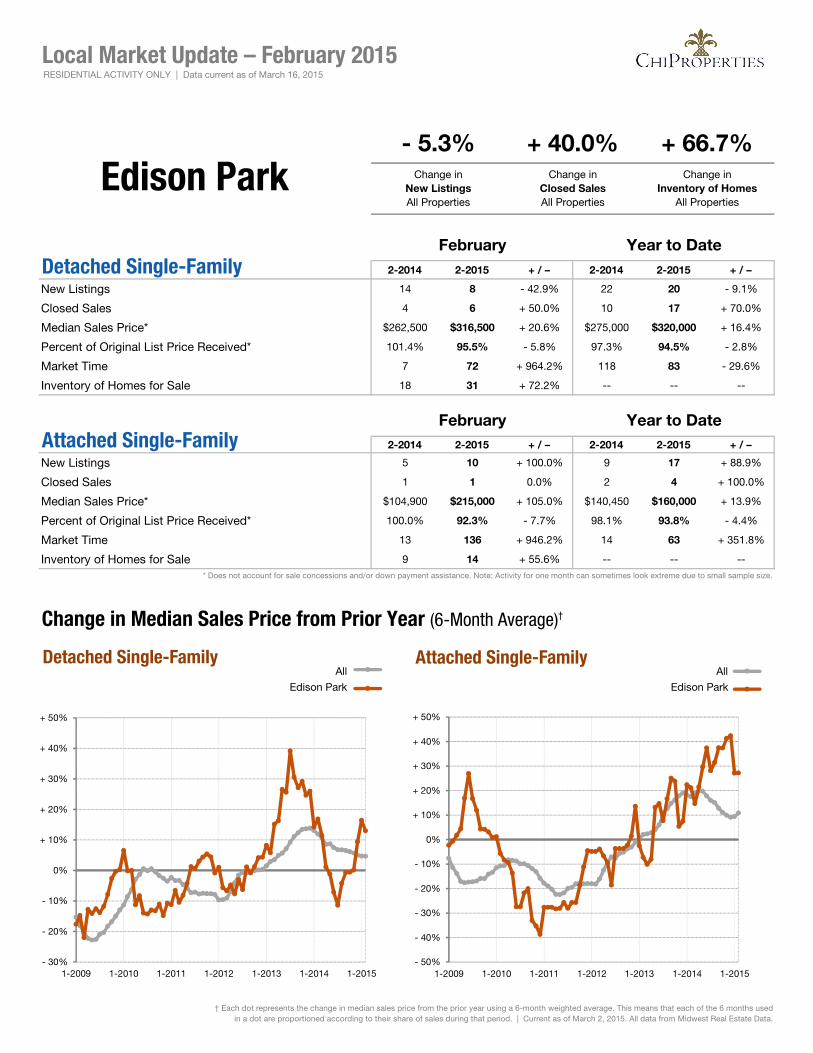
2-2014 2-2015 + / – 2-2014 2-2015 + / –
New Listings 14 8 - 42.9% 22 20 - 9.1%
Closed Sales 4 6 + 50.0% 10 17 + 70.0%
Median Sales Price* $262,500 $316,500 + 20.6% $275,000 $320,000 + 16.4%
Percent of Original List Price Received* 101.4% 95.5% - 5.8% 97.3% 94.5% - 2.8%
Market Time 7 72 + 964.2% 118 83 - 29.6%
Inventory of Homes for Sale 18 31 + 72.2% -- -- --
2-2014 2-2015 + / – 2-2014 2-2015 + / –
New Listings 5 10 + 100.0% 9 17 + 88.9%
Closed Sales 1 1 0.0% 2 4 + 100.0%
Median Sales Price* $104,900 $215,000 + 105.0% $140,450 $160,000 + 13.9%
Percent of Original List Price Received* 100.0% 92.3% - 7.7% 98.1% 93.8% - 4.4%
Market Time 13 136 + 946.2% 14 63 + 351.8%
Inventory of Homes for Sale 9 14 + 55.6% -- -- --* Does not account for sale concessions and/or down payment assistance. Note: Activity for one month can sometimes look extreme due to small sample size.
Change in Median Sales Price from Prior Year (6-Month Average)†
All All
Edison Park Edison Park
Detached Single-FamilyFebruary Year to Date
Attached Single-FamilyFebruary Year to Date
Local Market Update – February 2015
Edison Park- 5.3% + 40.0% + 66.7%
Change inNew ListingsAll Properties
Change inClosed SalesAll Properties
Change in Inventory of Homes
All Properties
- 30%
- 20%
- 10%
0%
+ 10%
+ 20%
+ 30%
+ 40%
+ 50%
1-2009 1-2010 1-2011 1-2012 1-2013 1-2014 1-2015
Detached Single-Familyb
a
- 50%
- 40%
- 30%
- 20%
- 10%
0%
+ 10%
+ 20%
+ 30%
+ 40%
+ 50%
1-2009 1-2010 1-2011 1-2012 1-2013 1-2014 1-2015
Attached Single-Familyb
a
RESIDENTIAL ACTIVITY ONLY | Data current as of March 16, 2015
† Each dot represents the change in median sales price from the prior year using a 6-month weighted average. This means that each of the 6 months usedin a dot are proportioned according to their share of sales during that period. | Current as of March 2, 2015. All data from Midwest Real Estate Data.

2-2014 2-2015 + / – 2-2014 2-2015 + / –
New Listings 28 29 + 3.6% 45 50 + 11.1%
Closed Sales 10 11 + 10.0% 20 23 + 15.0%
Median Sales Price* $396,250 $390,000 - 1.6% $388,750 $390,000 + 0.3%
Percent of Original List Price Received* 96.1% 93.9% - 2.3% 94.9% 94.5% - 0.5%
Market Time 110 132 + 19.8% 148 146 - 1.1%
Inventory of Homes for Sale 58 58 0.0% -- -- --
2-2014 2-2015 + / – 2-2014 2-2015 + / –
New Listings 1 2 + 100.0% 5 5 0.0%
Closed Sales 1 1 0.0% 2 1 - 50.0%
Median Sales Price* $150,299 $109,000 - 27.5% $198,400 $109,000 - 45.1%
Percent of Original List Price Received* 88.4% 101.0% + 14.3% 91.0% 101.0% + 11.0%
Market Time 53 24 - 54.7% 54 24 - 55.1%
Inventory of Homes for Sale 11 4 - 63.6% -- -- --* Does not account for sale concessions and/or down payment assistance. Note: Activity for one month can sometimes look extreme due to small sample size.
Change in Median Sales Price from Prior Year (6-Month Average)†
All All
Forest Glen Forest Glen
Detached Single-FamilyFebruary Year to Date
Attached Single-FamilyFebruary Year to Date
Local Market Update – February 2015
Forest Glen+ 6.9% + 9.1% - 10.1%
Change inNew ListingsAll Properties
Change inClosed SalesAll Properties
Change in Inventory of Homes
All Properties
- 25%
- 20%
- 15%
- 10%
- 5%
0%
+ 5%
+ 10%
+ 15%
+ 20%
+ 25%
1-2009 1-2010 1-2011 1-2012 1-2013 1-2014 1-2015
Detached Single-Familyb
a
- 40%
- 20%
0%
+ 20%
+ 40%
+ 60%
+ 80%
+ 100%
+ 120%
+ 140%
1-2009 1-2010 1-2011 1-2012 1-2013 1-2014 1-2015
Attached Single-Familyb
a
RESIDENTIAL ACTIVITY ONLY | Data current as of March 16, 2015
† Each dot represents the change in median sales price from the prior year using a 6-month weighted average. This means that each of the 6 months usedin a dot are proportioned according to their share of sales during that period. | Current as of March 2, 2015. All data from Midwest Real Estate Data.
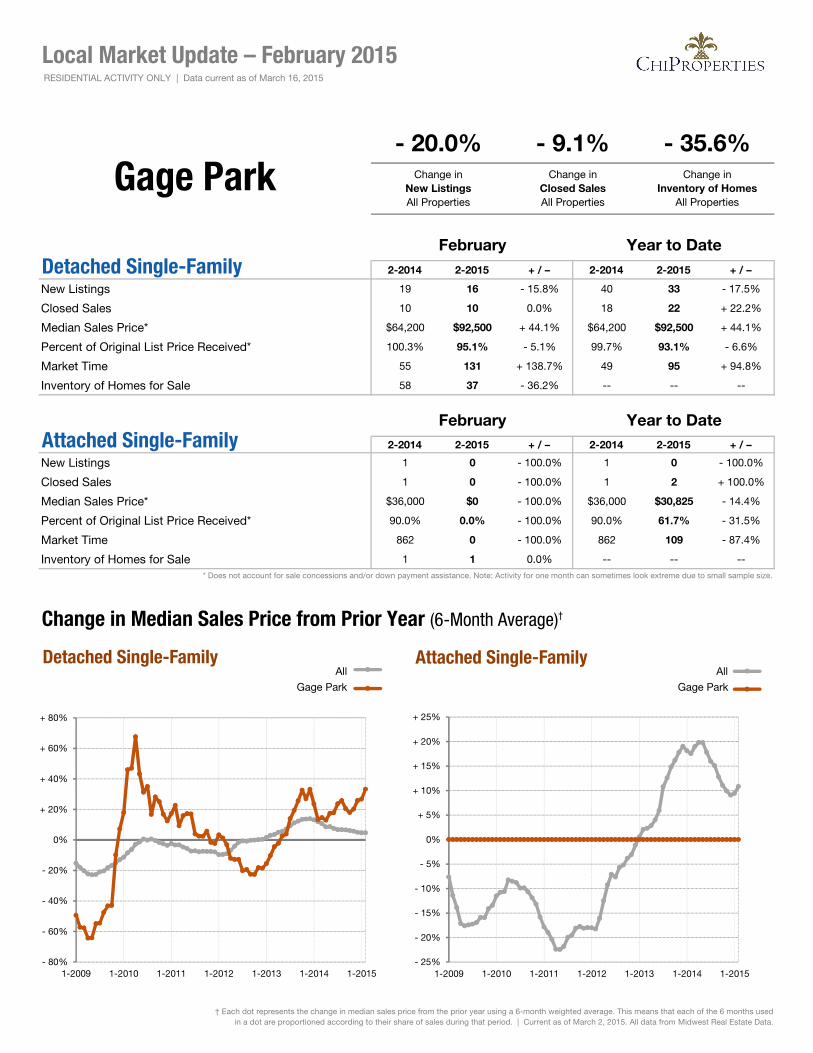
2-2014 2-2015 + / – 2-2014 2-2015 + / –
New Listings 19 16 - 15.8% 40 33 - 17.5%
Closed Sales 10 10 0.0% 18 22 + 22.2%
Median Sales Price* $64,200 $92,500 + 44.1% $64,200 $92,500 + 44.1%
Percent of Original List Price Received* 100.3% 95.1% - 5.1% 99.7% 93.1% - 6.6%
Market Time 55 131 + 138.7% 49 95 + 94.8%
Inventory of Homes for Sale 58 37 - 36.2% -- -- --
2-2014 2-2015 + / – 2-2014 2-2015 + / –
New Listings 1 0 - 100.0% 1 0 - 100.0%
Closed Sales 1 0 - 100.0% 1 2 + 100.0%
Median Sales Price* $36,000 $0 - 100.0% $36,000 $30,825 - 14.4%
Percent of Original List Price Received* 90.0% 0.0% - 100.0% 90.0% 61.7% - 31.5%
Market Time 862 0 - 100.0% 862 109 - 87.4%
Inventory of Homes for Sale 1 1 0.0% -- -- --* Does not account for sale concessions and/or down payment assistance. Note: Activity for one month can sometimes look extreme due to small sample size.
Change in Median Sales Price from Prior Year (6-Month Average)†
All All
Gage Park Gage Park
Detached Single-FamilyFebruary Year to Date
Attached Single-FamilyFebruary Year to Date
Local Market Update – February 2015
Gage Park- 20.0% - 9.1% - 35.6%
Change inNew ListingsAll Properties
Change inClosed SalesAll Properties
Change in Inventory of Homes
All Properties
- 80%
- 60%
- 40%
- 20%
0%
+ 20%
+ 40%
+ 60%
+ 80%
1-2009 1-2010 1-2011 1-2012 1-2013 1-2014 1-2015
Detached Single-Familyb
a
- 25%
- 20%
- 15%
- 10%
- 5%
0%
+ 5%
+ 10%
+ 15%
+ 20%
+ 25%
1-2009 1-2010 1-2011 1-2012 1-2013 1-2014 1-2015
Attached Single-Familyb
a
RESIDENTIAL ACTIVITY ONLY | Data current as of March 16, 2015
† Each dot represents the change in median sales price from the prior year using a 6-month weighted average. This means that each of the 6 months usedin a dot are proportioned according to their share of sales during that period. | Current as of March 2, 2015. All data from Midwest Real Estate Data.

2-2014 2-2015 + / – 2-2014 2-2015 + / –
New Listings 32 36 + 12.5% 56 78 + 39.3%
Closed Sales 18 27 + 50.0% 38 45 + 18.4%
Median Sales Price* $171,250 $167,000 - 2.5% $161,500 $166,000 + 2.8%
Percent of Original List Price Received* 90.6% 94.6% + 4.4% 91.9% 92.0% + 0.0%
Market Time 72 94 + 30.9% 140 95 - 32.3%
Inventory of Homes for Sale 86 93 + 8.1% -- -- --
2-2014 2-2015 + / – 2-2014 2-2015 + / –
New Listings 1 3 + 200.0% 2 3 + 50.0%
Closed Sales 1 3 + 200.0% 2 3 + 50.0%
Median Sales Price* $75,000 $53,000 - 29.3% $99,000 $53,000 - 46.5%
Percent of Original List Price Received* 102.1% 82.8% - 18.9% 96.6% 82.8% - 14.3%
Market Time 203 457 + 125.1% 214 457 + 113.6%
Inventory of Homes for Sale 6 2 - 66.7% -- -- --* Does not account for sale concessions and/or down payment assistance. Note: Activity for one month can sometimes look extreme due to small sample size.
Change in Median Sales Price from Prior Year (6-Month Average)†
All All
Garfield Ridge Garfield Ridge
Detached Single-FamilyFebruary Year to Date
Attached Single-FamilyFebruary Year to Date
Local Market Update – February 2015
Garfield Ridge+ 18.2% + 57.9% + 3.3%
Change inNew ListingsAll Properties
Change inClosed SalesAll Properties
Change in Inventory of Homes
All Properties
- 30%
- 25%
- 20%
- 15%
- 10%
- 5%
0%
+ 5%
+ 10%
+ 15%
+ 20%
+ 25%
1-2009 1-2010 1-2011 1-2012 1-2013 1-2014 1-2015
Detached Single-Familyb
a
- 60%
- 40%
- 20%
0%
+ 20%
+ 40%
+ 60%
+ 80%
+ 100%
+ 120%
1-2009 1-2010 1-2011 1-2012 1-2013 1-2014 1-2015
Attached Single-Familyb
a
RESIDENTIAL ACTIVITY ONLY | Data current as of March 16, 2015
† Each dot represents the change in median sales price from the prior year using a 6-month weighted average. This means that each of the 6 months usedin a dot are proportioned according to their share of sales during that period. | Current as of March 2, 2015. All data from Midwest Real Estate Data.
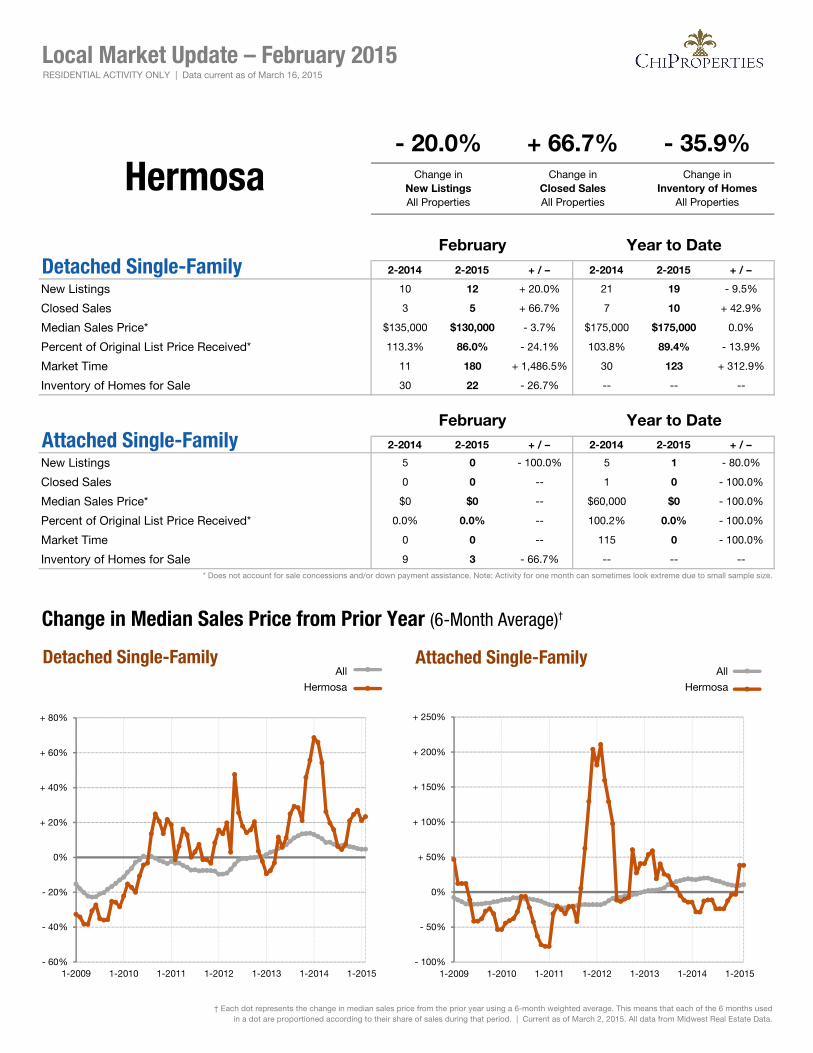
2-2014 2-2015 + / – 2-2014 2-2015 + / –
New Listings 10 12 + 20.0% 21 19 - 9.5%
Closed Sales 3 5 + 66.7% 7 10 + 42.9%
Median Sales Price* $135,000 $130,000 - 3.7% $175,000 $175,000 0.0%
Percent of Original List Price Received* 113.3% 86.0% - 24.1% 103.8% 89.4% - 13.9%
Market Time 11 180 + 1,486.5% 30 123 + 312.9%
Inventory of Homes for Sale 30 22 - 26.7% -- -- --
2-2014 2-2015 + / – 2-2014 2-2015 + / –
New Listings 5 0 - 100.0% 5 1 - 80.0%
Closed Sales 0 0 -- 1 0 - 100.0%
Median Sales Price* $0 $0 -- $60,000 $0 - 100.0%
Percent of Original List Price Received* 0.0% 0.0% -- 100.2% 0.0% - 100.0%
Market Time 0 0 -- 115 0 - 100.0%
Inventory of Homes for Sale 9 3 - 66.7% -- -- --* Does not account for sale concessions and/or down payment assistance. Note: Activity for one month can sometimes look extreme due to small sample size.
Change in Median Sales Price from Prior Year (6-Month Average)†
All All
Hermosa Hermosa
Detached Single-FamilyFebruary Year to Date
Attached Single-FamilyFebruary Year to Date
Local Market Update – February 2015
Hermosa- 20.0% + 66.7% - 35.9%
Change inNew ListingsAll Properties
Change inClosed SalesAll Properties
Change in Inventory of Homes
All Properties
- 60%
- 40%
- 20%
0%
+ 20%
+ 40%
+ 60%
+ 80%
1-2009 1-2010 1-2011 1-2012 1-2013 1-2014 1-2015
Detached Single-Familyb
a
- 100%
- 50%
0%
+ 50%
+ 100%
+ 150%
+ 200%
+ 250%
1-2009 1-2010 1-2011 1-2012 1-2013 1-2014 1-2015
Attached Single-Familyb
a
RESIDENTIAL ACTIVITY ONLY | Data current as of March 16, 2015
† Each dot represents the change in median sales price from the prior year using a 6-month weighted average. This means that each of the 6 months usedin a dot are proportioned according to their share of sales during that period. | Current as of March 2, 2015. All data from Midwest Real Estate Data.

2-2014 2-2015 + / – 2-2014 2-2015 + / –
New Listings 16 21 + 31.3% 35 48 + 37.1%
Closed Sales 8 6 - 25.0% 21 14 - 33.3%
Median Sales Price* $82,250 $39,500 - 52.0% $80,345 $73,000 - 9.1%
Percent of Original List Price Received* 104.8% 81.9% - 21.9% 100.4% 94.4% - 5.9%
Market Time 71 71 - 0.4% 104 74 - 28.3%
Inventory of Homes for Sale 59 49 - 16.9% -- -- --
2-2014 2-2015 + / – 2-2014 2-2015 + / –
New Listings 3 8 + 166.7% 9 14 + 55.6%
Closed Sales 3 3 0.0% 5 4 - 20.0%
Median Sales Price* $38,000 $161,000 + 323.7% $38,000 $170,450 + 348.6%
Percent of Original List Price Received* 96.1% 92.9% - 3.2% 101.4% 93.5% - 7.8%
Market Time 384 126 - 67.1% 238 119 - 50.2%
Inventory of Homes for Sale 14 17 + 21.4% -- -- --* Does not account for sale concessions and/or down payment assistance. Note: Activity for one month can sometimes look extreme due to small sample size.
Change in Median Sales Price from Prior Year (6-Month Average)†
All All
Humboldt Park Humboldt Park
Detached Single-FamilyFebruary Year to Date
Attached Single-FamilyFebruary Year to Date
Local Market Update – February 2015
Humboldt Park+ 52.6% - 18.2% - 9.6%
Change inNew ListingsAll Properties
Change inClosed SalesAll Properties
Change in Inventory of Homes
All Properties
- 80%
- 60%
- 40%
- 20%
0%
+ 20%
+ 40%
+ 60%
+ 80%
+ 100%
1-2009 1-2010 1-2011 1-2012 1-2013 1-2014 1-2015
Detached Single-Familyb
a
- 500%
0%
+ 500%
+ 1000%
+ 1500%
+ 2000%
+ 2500%
+ 3000%
+ 3500%
1-2009 1-2010 1-2011 1-2012 1-2013 1-2014 1-2015
Attached Single-Familyb
a
RESIDENTIAL ACTIVITY ONLY | Data current as of March 16, 2015
† Each dot represents the change in median sales price from the prior year using a 6-month weighted average. This means that each of the 6 months usedin a dot are proportioned according to their share of sales during that period. | Current as of March 2, 2015. All data from Midwest Real Estate Data.

2-2014 2-2015 + / – 2-2014 2-2015 + / –
New Listings 2 4 + 100.0% 5 7 + 40.0%
Closed Sales 1 3 + 200.0% 1 5 + 400.0%
Median Sales Price* $770,000 $875,000 + 13.6% $770,000 $800,000 + 3.9%
Percent of Original List Price Received* 93.9% 82.7% - 11.9% 93.9% 88.0% - 6.3%
Market Time 108 146 + 34.9% 108 128 + 18.7%
Inventory of Homes for Sale 13 15 + 15.4% -- -- --
2-2014 2-2015 + / – 2-2014 2-2015 + / –
New Listings 33 31 - 6.1% 60 60 0.0%
Closed Sales 7 11 + 57.1% 18 21 + 16.7%
Median Sales Price* $81,000 $225,000 + 177.8% $96,950 $150,000 + 54.7%
Percent of Original List Price Received* 82.4% 84.6% + 2.7% 87.0% 82.6% - 5.1%
Market Time 102 217 + 113.7% 151 203 + 33.9%
Inventory of Homes for Sale 142 154 + 8.5% -- -- --* Does not account for sale concessions and/or down payment assistance. Note: Activity for one month can sometimes look extreme due to small sample size.
Change in Median Sales Price from Prior Year (6-Month Average)†
All All
Hyde Park Hyde Park
Detached Single-FamilyFebruary Year to Date
Attached Single-FamilyFebruary Year to Date
Local Market Update – February 2015
Hyde Park0.0% + 75.0% + 9.0%Change in
New ListingsAll Properties
Change inClosed SalesAll Properties
Change in Inventory of Homes
All Properties
- 60%
- 40%
- 20%
0%
+ 20%
+ 40%
+ 60%
+ 80%
+ 100%
+ 120%
+ 140%
+ 160%
1-2009 1-2010 1-2011 1-2012 1-2013 1-2014 1-2015
Detached Single-Familyb
a
- 30%
- 20%
- 10%
0%
+ 10%
+ 20%
+ 30%
+ 40%
1-2009 1-2010 1-2011 1-2012 1-2013 1-2014 1-2015
Attached Single-Familyb
a
RESIDENTIAL ACTIVITY ONLY | Data current as of March 16, 2015
† Each dot represents the change in median sales price from the prior year using a 6-month weighted average. This means that each of the 6 months usedin a dot are proportioned according to their share of sales during that period. | Current as of March 2, 2015. All data from Midwest Real Estate Data.

2-2014 2-2015 + / – 2-2014 2-2015 + / –
New Listings 25 33 + 32.0% 48 69 + 43.8%
Closed Sales 13 9 - 30.8% 26 19 - 26.9%
Median Sales Price* $200,000 $498,750 + 149.4% $304,950 $382,502 + 25.4%
Percent of Original List Price Received* 89.2% 90.0% + 0.8% 93.5% 92.8% - 0.8%
Market Time 173 60 - 65.5% 98 85 - 13.1%
Inventory of Homes for Sale 52 68 + 30.8% -- -- --
2-2014 2-2015 + / – 2-2014 2-2015 + / –
New Listings 22 37 + 68.2% 38 72 + 89.5%
Closed Sales 14 9 - 35.7% 23 24 + 4.3%
Median Sales Price* $85,050 $155,000 + 82.2% $102,315 $162,500 + 58.8%
Percent of Original List Price Received* 93.9% 81.2% - 13.5% 100.5% 89.6% - 10.9%
Market Time 117 130 + 11.2% 97 86 - 10.7%
Inventory of Homes for Sale 64 76 + 18.8% -- -- --* Does not account for sale concessions and/or down payment assistance. Note: Activity for one month can sometimes look extreme due to small sample size.
Change in Median Sales Price from Prior Year (6-Month Average)†
All All
Irving Park Irving Park
Detached Single-FamilyFebruary Year to Date
Attached Single-FamilyFebruary Year to Date
Local Market Update – February 2015
Irving Park+ 48.9% - 33.3% + 24.1%
Change inNew ListingsAll Properties
Change inClosed SalesAll Properties
Change in Inventory of Homes
All Properties
- 40%
- 30%
- 20%
- 10%
0%
+ 10%
+ 20%
+ 30%
+ 40%
+ 50%
1-2009 1-2010 1-2011 1-2012 1-2013 1-2014 1-2015
Detached Single-Familyb
a
- 40%
- 30%
- 20%
- 10%
0%
+ 10%
+ 20%
+ 30%
+ 40%
+ 50%
+ 60%
1-2009 1-2010 1-2011 1-2012 1-2013 1-2014 1-2015
Attached Single-Familyb
a
RESIDENTIAL ACTIVITY ONLY | Data current as of March 16, 2015
† Each dot represents the change in median sales price from the prior year using a 6-month weighted average. This means that each of the 6 months usedin a dot are proportioned according to their share of sales during that period. | Current as of March 2, 2015. All data from Midwest Real Estate Data.
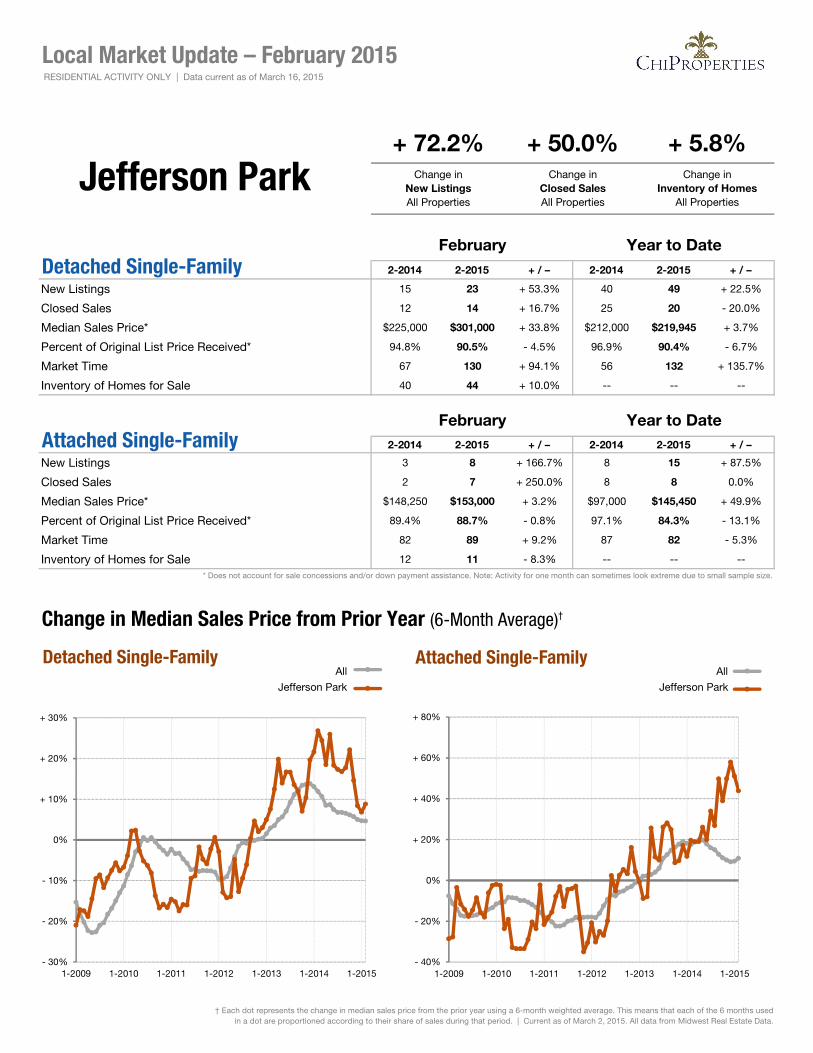
2-2014 2-2015 + / – 2-2014 2-2015 + / –
New Listings 15 23 + 53.3% 40 49 + 22.5%
Closed Sales 12 14 + 16.7% 25 20 - 20.0%
Median Sales Price* $225,000 $301,000 + 33.8% $212,000 $219,945 + 3.7%
Percent of Original List Price Received* 94.8% 90.5% - 4.5% 96.9% 90.4% - 6.7%
Market Time 67 130 + 94.1% 56 132 + 135.7%
Inventory of Homes for Sale 40 44 + 10.0% -- -- --
2-2014 2-2015 + / – 2-2014 2-2015 + / –
New Listings 3 8 + 166.7% 8 15 + 87.5%
Closed Sales 2 7 + 250.0% 8 8 0.0%
Median Sales Price* $148,250 $153,000 + 3.2% $97,000 $145,450 + 49.9%
Percent of Original List Price Received* 89.4% 88.7% - 0.8% 97.1% 84.3% - 13.1%
Market Time 82 89 + 9.2% 87 82 - 5.3%
Inventory of Homes for Sale 12 11 - 8.3% -- -- --* Does not account for sale concessions and/or down payment assistance. Note: Activity for one month can sometimes look extreme due to small sample size.
Change in Median Sales Price from Prior Year (6-Month Average)†
All All
Jefferson Park Jefferson Park
Detached Single-FamilyFebruary Year to Date
Attached Single-FamilyFebruary Year to Date
Local Market Update – February 2015
Jefferson Park+ 72.2% + 50.0% + 5.8%
Change inNew ListingsAll Properties
Change inClosed SalesAll Properties
Change in Inventory of Homes
All Properties
- 30%
- 20%
- 10%
0%
+ 10%
+ 20%
+ 30%
1-2009 1-2010 1-2011 1-2012 1-2013 1-2014 1-2015
Detached Single-Familyb
a
- 40%
- 20%
0%
+ 20%
+ 40%
+ 60%
+ 80%
1-2009 1-2010 1-2011 1-2012 1-2013 1-2014 1-2015
Attached Single-Familyb
a
RESIDENTIAL ACTIVITY ONLY | Data current as of March 16, 2015
† Each dot represents the change in median sales price from the prior year using a 6-month weighted average. This means that each of the 6 months usedin a dot are proportioned according to their share of sales during that period. | Current as of March 2, 2015. All data from Midwest Real Estate Data.
2-2014 2-2015 + / – 2-2014 2-2015 + / –
New Listings 3 2 - 33.3% 9 7 - 22.2%
Closed Sales 2 1 - 50.0% 3 3 0.0%
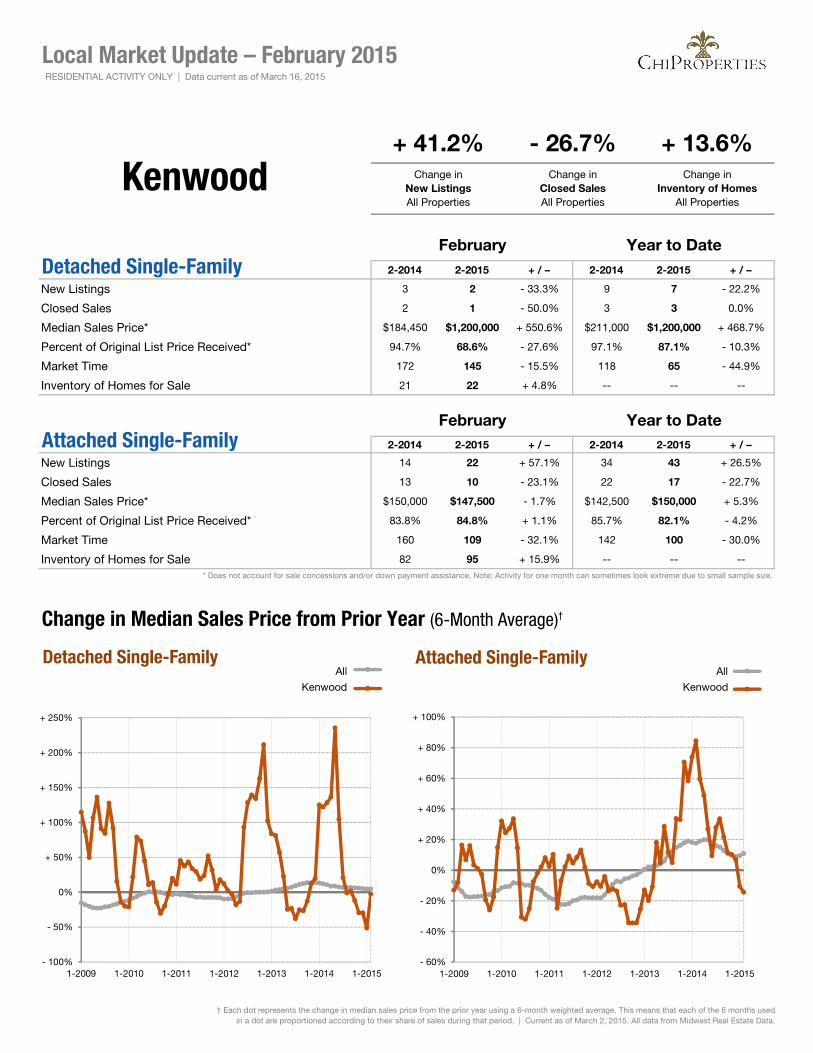
Median Sales Price* $184,450 $1,200,000 + 550.6% $211,000 $1,200,000 + 468.7%
Percent of Original List Price Received* 94.7% 68.6% - 27.6% 97.1% 87.1% - 10.3%
Market Time 172 145 - 15.5% 118 65 - 44.9%
Inventory of Homes for Sale 21 22 + 4.8% -- -- --
2-2014 2-2015 + / – 2-2014 2-2015 + / –
New Listings 14 22 + 57.1% 34 43 + 26.5%
Closed Sales 13 10 - 23.1% 22 17 - 22.7%
Median Sales Price* $150,000 $147,500 - 1.7% $142,500 $150,000 + 5.3%
Percent of Original List Price Received* 83.8% 84.8% + 1.1% 85.7% 82.1% - 4.2%
Market Time 160 109 - 32.1% 142 100 - 30.0%
Inventory of Homes for Sale 82 95 + 15.9% -- -- --* Does not account for sale concessions and/or down payment assistance. Note: Activity for one month can sometimes look extreme due to small sample size.
Change in Median Sales Price from Prior Year (6-Month Average)†
All All
Kenwood Kenwood
Detached Single-FamilyFebruary Year to Date
Attached Single-FamilyFebruary Year to Date
Local Market Update – February 2015
Kenwood+ 41.2% - 26.7% + 13.6%
Change inNew ListingsAll Properties
Change inClosed SalesAll Properties
Change in Inventory of Homes
All Properties
- 100%
- 50%
0%
+ 50%
+ 100%
+ 150%
+ 200%
+ 250%
1-2009 1-2010 1-2011 1-2012 1-2013 1-2014 1-2015
Detached Single-Familyb
a
- 60%
- 40%
- 20%
0%
+ 20%
+ 40%
+ 60%
+ 80%
+ 100%
1-2009 1-2010 1-2011 1-2012 1-2013 1-2014 1-2015
Attached Single-Familyb
a
RESIDENTIAL ACTIVITY ONLY | Data current as of March 16, 2015
† Each dot represents the change in median sales price from the prior year using a 6-month weighted average. This means that each of the 6 months usedin a dot are proportioned according to their share of sales during that period. | Current as of March 2, 2015. All data from Midwest Real Estate Data.
2-2014 2-2015 + / – 2-2014 2-2015 + / –
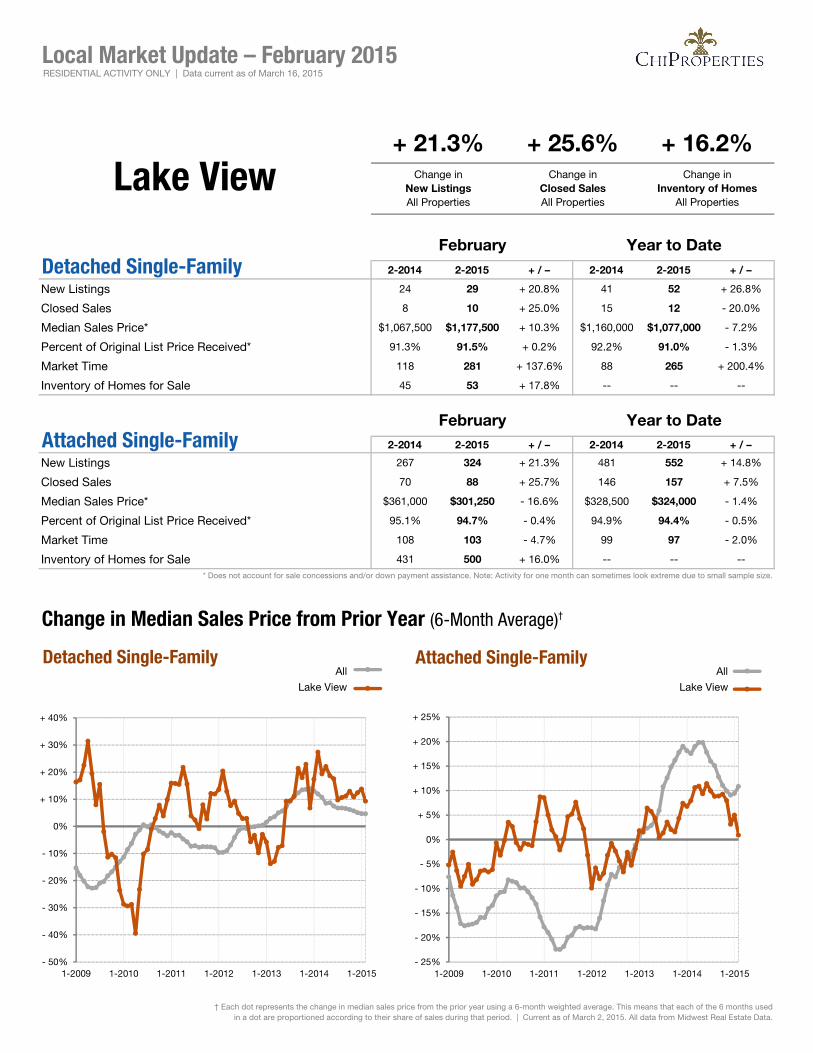
New Listings 24 29 + 20.8% 41 52 + 26.8%
Closed Sales 8 10 + 25.0% 15 12 - 20.0%
Median Sales Price* $1,067,500 $1,177,500 + 10.3% $1,160,000 $1,077,000 - 7.2%
Percent of Original List Price Received* 91.3% 91.5% + 0.2% 92.2% 91.0% - 1.3%
Market Time 118 281 + 137.6% 88 265 + 200.4%
Inventory of Homes for Sale 45 53 + 17.8% -- -- --
2-2014 2-2015 + / – 2-2014 2-2015 + / –
New Listings 267 324 + 21.3% 481 552 + 14.8%
Closed Sales 70 88 + 25.7% 146 157 + 7.5%
Median Sales Price* $361,000 $301,250 - 16.6% $328,500 $324,000 - 1.4%
Percent of Original List Price Received* 95.1% 94.7% - 0.4% 94.9% 94.4% - 0.5%
Market Time 108 103 - 4.7% 99 97 - 2.0%
Inventory of Homes for Sale 431 500 + 16.0% -- -- --* Does not account for sale concessions and/or down payment assistance. Note: Activity for one month can sometimes look extreme due to small sample size.
Change in Median Sales Price from Prior Year (6-Month Average)†
All All
Lake View Lake View
Detached Single-FamilyFebruary Year to Date
Attached Single-FamilyFebruary Year to Date
Local Market Update – February 2015
Lake View+ 21.3% + 25.6% + 16.2%
Change inNew ListingsAll Properties
Change inClosed SalesAll Properties
Change in Inventory of Homes
All Properties
- 50%
- 40%
- 30%
- 20%
- 10%
0%
+ 10%
+ 20%
+ 30%
+ 40%
1-2009 1-2010 1-2011 1-2012 1-2013 1-2014 1-2015
Detached Single-Familyb
a
- 25%
- 20%
- 15%
- 10%
- 5%
0%
+ 5%
+ 10%
+ 15%
+ 20%
+ 25%
1-2009 1-2010 1-2011 1-2012 1-2013 1-2014 1-2015
Attached Single-Familyb
a
RESIDENTIAL ACTIVITY ONLY | Data current as of March 16, 2015
† Each dot represents the change in median sales price from the prior year using a 6-month weighted average. This means that each of the 6 months usedin a dot are proportioned according to their share of sales during that period. | Current as of March 2, 2015. All data from Midwest Real Estate Data.
2-2014 2-2015 + / – 2-2014 2-2015 + / –
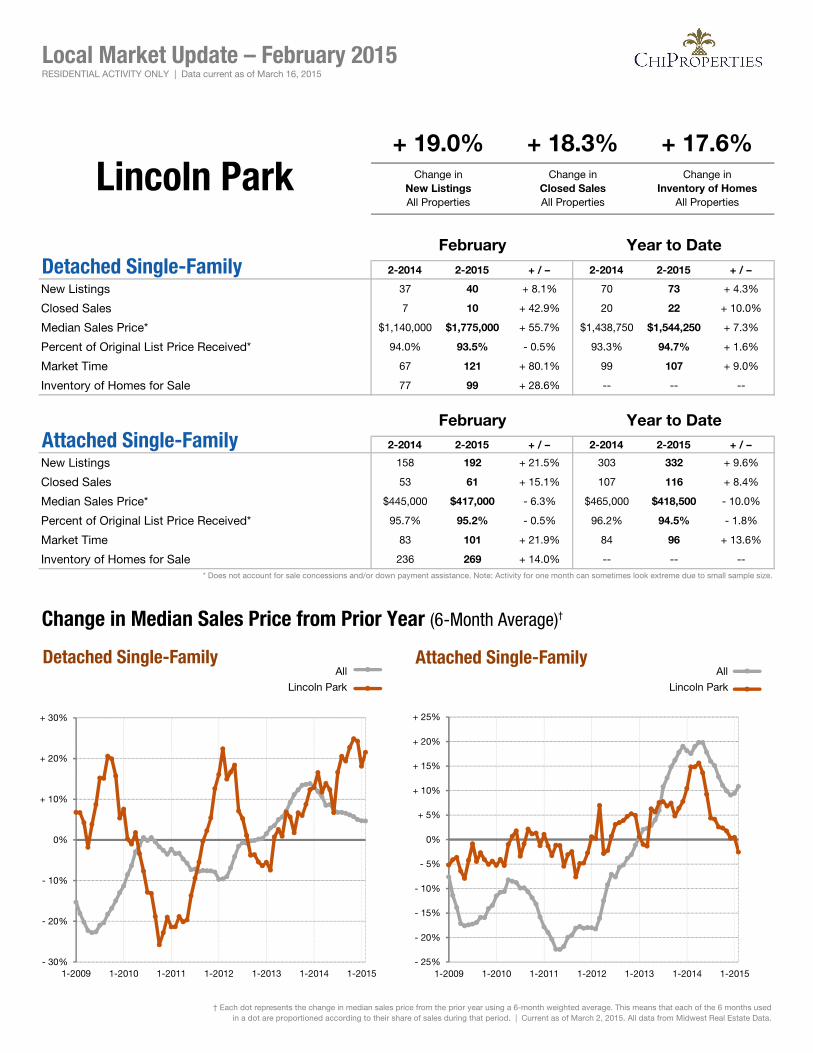
New Listings 37 40 + 8.1% 70 73 + 4.3%
Closed Sales 7 10 + 42.9% 20 22 + 10.0%
Median Sales Price* $1,140,000 $1,775,000 + 55.7% $1,438,750 $1,544,250 + 7.3%
Percent of Original List Price Received* 94.0% 93.5% - 0.5% 93.3% 94.7% + 1.6%
Market Time 67 121 + 80.1% 99 107 + 9.0%
Inventory of Homes for Sale 77 99 + 28.6% -- -- --
2-2014 2-2015 + / – 2-2014 2-2015 + / –
New Listings 158 192 + 21.5% 303 332 + 9.6%
Closed Sales 53 61 + 15.1% 107 116 + 8.4%
Median Sales Price* $445,000 $417,000 - 6.3% $465,000 $418,500 - 10.0%
Percent of Original List Price Received* 95.7% 95.2% - 0.5% 96.2% 94.5% - 1.8%
Market Time 83 101 + 21.9% 84 96 + 13.6%
Inventory of Homes for Sale 236 269 + 14.0% -- -- --* Does not account for sale concessions and/or down payment assistance. Note: Activity for one month can sometimes look extreme due to small sample size.
Change in Median Sales Price from Prior Year (6-Month Average)†
All All
Lincoln Park Lincoln Park
Detached Single-FamilyFebruary Year to Date
Attached Single-FamilyFebruary Year to Date
Local Market Update – February 2015
Lincoln Park+ 19.0% + 18.3% + 17.6%
Change inNew ListingsAll Properties
Change inClosed SalesAll Properties
Change in Inventory of Homes
All Properties
- 30%
- 20%
- 10%
0%
+ 10%
+ 20%
+ 30%
1-2009 1-2010 1-2011 1-2012 1-2013 1-2014 1-2015
Detached Single-Familyb
a
- 25%
- 20%
- 15%
- 10%
- 5%
0%
+ 5%
+ 10%
+ 15%
+ 20%
+ 25%
1-2009 1-2010 1-2011 1-2012 1-2013 1-2014 1-2015
Attached Single-Familyb
a
RESIDENTIAL ACTIVITY ONLY | Data current as of March 16, 2015
† Each dot represents the change in median sales price from the prior year using a 6-month weighted average. This means that each of the 6 months usedin a dot are proportioned according to their share of sales during that period. | Current as of March 2, 2015. All data from Midwest Real Estate Data.

2-2014 2-2015 + / – 2-2014 2-2015 + / –
New Listings 15 24 + 60.0% 24 37 + 54.2%
Closed Sales 4 7 + 75.0% 8 12 + 50.0%
Median Sales Price* $1,532,500 $929,500 - 39.3% $980,000 $827,500 - 15.6%
Percent of Original List Price Received* 96.5% 97.0% + 0.5% 95.4% 95.4% - 0.0%
Market Time 144 86 - 40.1% 106 101 - 4.3%
Inventory of Homes for Sale 17 30 + 76.5% -- -- --
2-2014 2-2015 + / – 2-2014 2-2015 + / –
New Listings 44 44 0.0% 73 78 + 6.8%
Closed Sales 10 21 + 110.0% 23 34 + 47.8%
Median Sales Price* $161,500 $225,000 + 39.3% $165,000 $230,000 + 39.4%
Percent of Original List Price Received* 91.9% 92.4% + 0.6% 92.5% 91.9% - 0.6%
Market Time 116 166 + 42.6% 88 128 + 45.9%
Inventory of Homes for Sale 74 72 - 2.7% -- -- --* Does not account for sale concessions and/or down payment assistance. Note: Activity for one month can sometimes look extreme due to small sample size.
Change in Median Sales Price from Prior Year (6-Month Average)†
All All
Lincoln Square Lincoln Square
Detached Single-FamilyFebruary Year to Date
Attached Single-FamilyFebruary Year to Date
Local Market Update – February 2015
Lincoln Square+ 15.3% + 100.0% + 12.1%
Change inNew ListingsAll Properties
Change inClosed SalesAll Properties
Change in Inventory of Homes
All Properties
- 30%
- 20%
- 10%
0%
+ 10%
+ 20%
+ 30%
+ 40%
+ 50%
+ 60%
1-2009 1-2010 1-2011 1-2012 1-2013 1-2014 1-2015
Detached Single-Familyb
a
- 60%
- 40%
- 20%
0%
+ 20%
+ 40%
+ 60%
+ 80%
+ 100%
+ 120%
1-2009 1-2010 1-2011 1-2012 1-2013 1-2014 1-2015
Attached Single-Familyb
a
RESIDENTIAL ACTIVITY ONLY | Data current as of March 16, 2015
† Each dot represents the change in median sales price from the prior year using a 6-month weighted average. This means that each of the 6 months usedin a dot are proportioned according to their share of sales during that period. | Current as of March 2, 2015. All data from Midwest Real Estate Data.
2-2014 2-2015 + / – 2-2014 2-2015 + / –
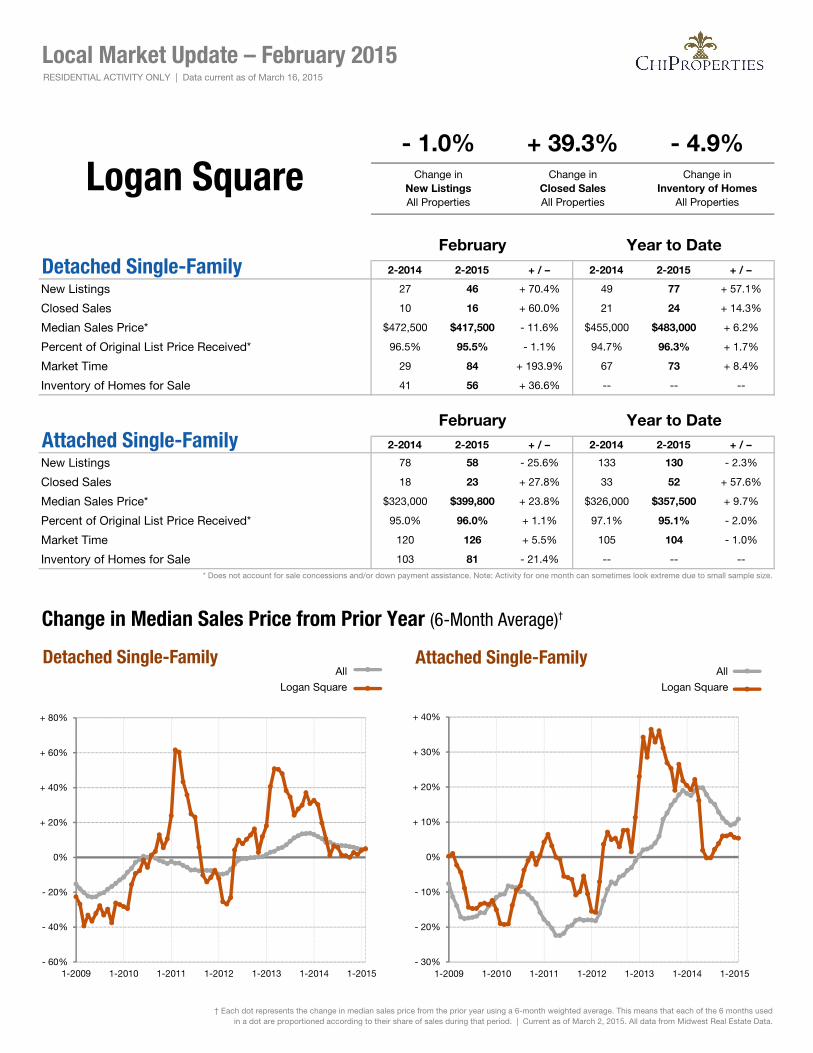
New Listings 27 46 + 70.4% 49 77 + 57.1%
Closed Sales 10 16 + 60.0% 21 24 + 14.3%
Median Sales Price* $472,500 $417,500 - 11.6% $455,000 $483,000 + 6.2%
Percent of Original List Price Received* 96.5% 95.5% - 1.1% 94.7% 96.3% + 1.7%
Market Time 29 84 + 193.9% 67 73 + 8.4%
Inventory of Homes for Sale 41 56 + 36.6% -- -- --
2-2014 2-2015 + / – 2-2014 2-2015 + / –
New Listings 78 58 - 25.6% 133 130 - 2.3%
Closed Sales 18 23 + 27.8% 33 52 + 57.6%
Median Sales Price* $323,000 $399,800 + 23.8% $326,000 $357,500 + 9.7%
Percent of Original List Price Received* 95.0% 96.0% + 1.1% 97.1% 95.1% - 2.0%
Market Time 120 126 + 5.5% 105 104 - 1.0%
Inventory of Homes for Sale 103 81 - 21.4% -- -- --* Does not account for sale concessions and/or down payment assistance. Note: Activity for one month can sometimes look extreme due to small sample size.
Change in Median Sales Price from Prior Year (6-Month Average)†
All All
Logan Square Logan Square
Detached Single-FamilyFebruary Year to Date
Attached Single-FamilyFebruary Year to Date
Local Market Update – February 2015
Logan Square- 1.0% + 39.3% - 4.9%
Change inNew ListingsAll Properties
Change inClosed SalesAll Properties
Change in Inventory of Homes
All Properties
- 60%
- 40%
- 20%
0%
+ 20%
+ 40%
+ 60%
+ 80%
1-2009 1-2010 1-2011 1-2012 1-2013 1-2014 1-2015
Detached Single-Familyb
a
- 30%
- 20%
- 10%
0%
+ 10%
+ 20%
+ 30%
+ 40%
1-2009 1-2010 1-2011 1-2012 1-2013 1-2014 1-2015
Attached Single-Familyb
a
RESIDENTIAL ACTIVITY ONLY | Data current as of March 16, 2015
† Each dot represents the change in median sales price from the prior year using a 6-month weighted average. This means that each of the 6 months usedin a dot are proportioned according to their share of sales during that period. | Current as of March 2, 2015. All data from Midwest Real Estate Data.
2-2014 2-2015 + / – 2-2014 2-2015 + / –
New Listings 0 0 -- 0 0 --
Closed Sales 0 0 -- 0 0 --
Median Sales Price* $0 $0 -- $0 $0 --
Percent of Original List Price Received* 0.0% 0.0% -- 0.0% 0.0% --
Market Time 0 0 -- 0 0 --
Inventory of Homes for Sale 0 0 -- -- -- --
2-2014 2-2015 + / – 2-2014 2-2015 + / –
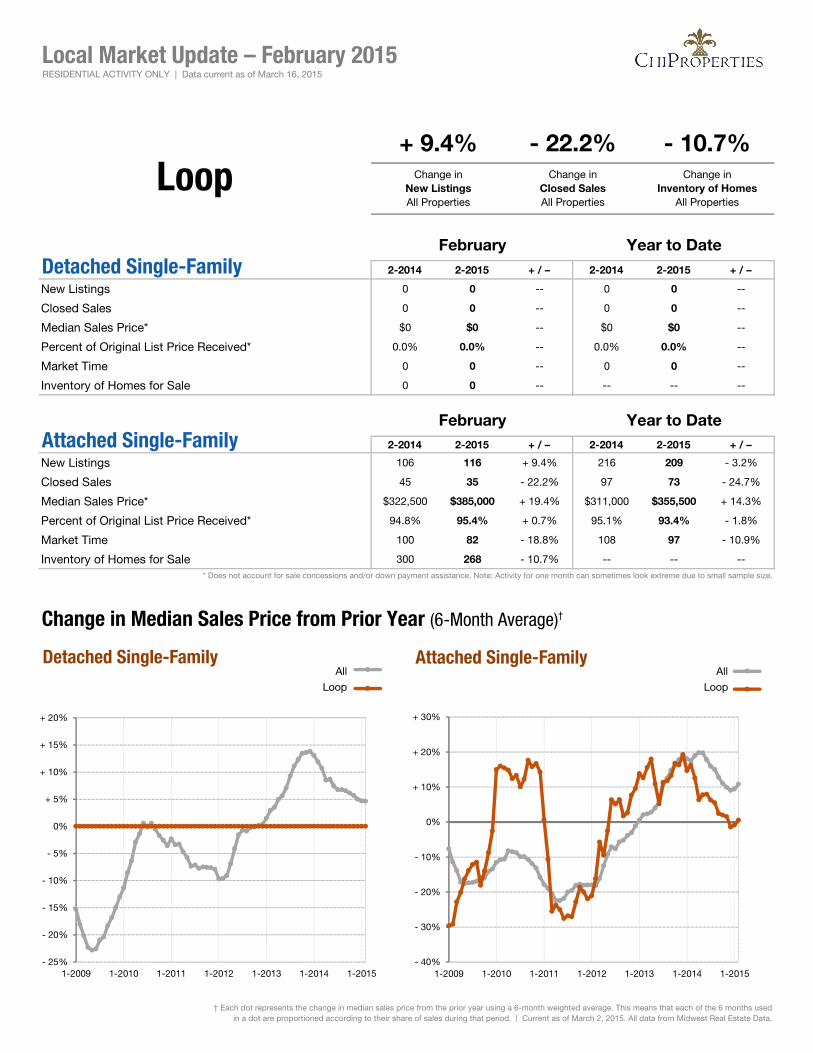
New Listings 106 116 + 9.4% 216 209 - 3.2%
Closed Sales 45 35 - 22.2% 97 73 - 24.7%
Median Sales Price* $322,500 $385,000 + 19.4% $311,000 $355,500 + 14.3%
Percent of Original List Price Received* 94.8% 95.4% + 0.7% 95.1% 93.4% - 1.8%
Market Time 100 82 - 18.8% 108 97 - 10.9%
Inventory of Homes for Sale 300 268 - 10.7% -- -- --* Does not account for sale concessions and/or down payment assistance. Note: Activity for one month can sometimes look extreme due to small sample size.
Change in Median Sales Price from Prior Year (6-Month Average)†
All All
Loop Loop
Detached Single-FamilyFebruary Year to Date
Attached Single-FamilyFebruary Year to Date
Local Market Update – February 2015
Loop+ 9.4% - 22.2% - 10.7%
Change inNew ListingsAll Properties
Change inClosed SalesAll Properties
Change in Inventory of Homes
All Properties
- 25%
- 20%
- 15%
- 10%
- 5%
0%
+ 5%
+ 10%
+ 15%
+ 20%
1-2009 1-2010 1-2011 1-2012 1-2013 1-2014 1-2015
Detached Single-Familyb
a
- 40%
- 30%
- 20%
- 10%
0%
+ 10%
+ 20%
+ 30%
1-2009 1-2010 1-2011 1-2012 1-2013 1-2014 1-2015
Attached Single-Familyb
a
RESIDENTIAL ACTIVITY ONLY | Data current as of March 16, 2015
† Each dot represents the change in median sales price from the prior year using a 6-month weighted average. This means that each of the 6 months usedin a dot are proportioned according to their share of sales during that period. | Current as of March 2, 2015. All data from Midwest Real Estate Data.
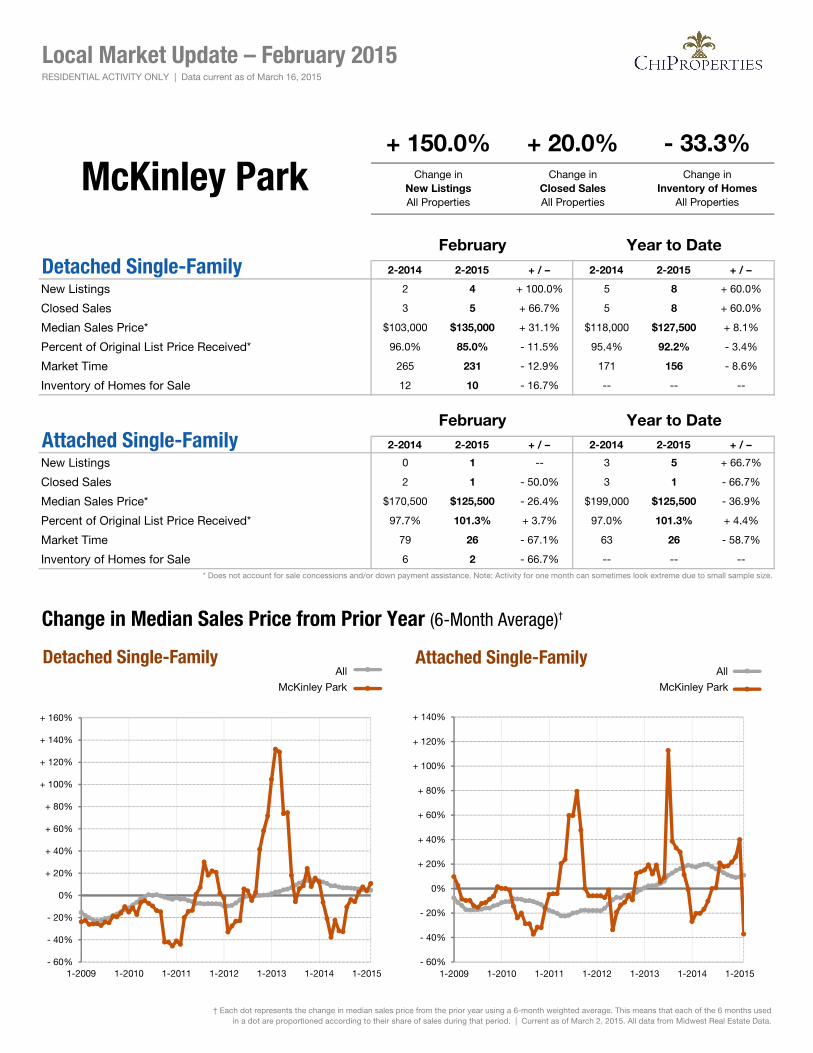
2-2014 2-2015 + / – 2-2014 2-2015 + / –
New Listings 2 4 + 100.0% 5 8 + 60.0%
Closed Sales 3 5 + 66.7% 5 8 + 60.0%
Median Sales Price* $103,000 $135,000 + 31.1% $118,000 $127,500 + 8.1%
Percent of Original List Price Received* 96.0% 85.0% - 11.5% 95.4% 92.2% - 3.4%
Market Time 265 231 - 12.9% 171 156 - 8.6%
Inventory of Homes for Sale 12 10 - 16.7% -- -- --
2-2014 2-2015 + / – 2-2014 2-2015 + / –
New Listings 0 1 -- 3 5 + 66.7%
Closed Sales 2 1 - 50.0% 3 1 - 66.7%
Median Sales Price* $170,500 $125,500 - 26.4% $199,000 $125,500 - 36.9%
Percent of Original List Price Received* 97.7% 101.3% + 3.7% 97.0% 101.3% + 4.4%
Market Time 79 26 - 67.1% 63 26 - 58.7%
Inventory of Homes for Sale 6 2 - 66.7% -- -- --* Does not account for sale concessions and/or down payment assistance. Note: Activity for one month can sometimes look extreme due to small sample size.
Change in Median Sales Price from Prior Year (6-Month Average)†
All All
McKinley Park McKinley Park
Detached Single-FamilyFebruary Year to Date
Attached Single-FamilyFebruary Year to Date
Local Market Update – February 2015
McKinley Park+ 150.0% + 20.0% - 33.3%
Change inNew ListingsAll Properties
Change inClosed SalesAll Properties
Change in Inventory of Homes
All Properties
- 60%
- 40%
- 20%
0%
+ 20%
+ 40%
+ 60%
+ 80%
+ 100%
+ 120%
+ 140%
+ 160%
1-2009 1-2010 1-2011 1-2012 1-2013 1-2014 1-2015
Detached Single-Familyb
a
- 60%
- 40%
- 20%
0%
+ 20%
+ 40%
+ 60%
+ 80%
+ 100%
+ 120%
+ 140%
1-2009 1-2010 1-2011 1-2012 1-2013 1-2014 1-2015
Attached Single-Familyb
a
RESIDENTIAL ACTIVITY ONLY | Data current as of March 16, 2015
† Each dot represents the change in median sales price from the prior year using a 6-month weighted average. This means that each of the 6 months usedin a dot are proportioned according to their share of sales during that period. | Current as of March 2, 2015. All data from Midwest Real Estate Data.

2-2014 2-2015 + / – 2-2014 2-2015 + / –
New Listings 9 10 + 11.1% 17 17 0.0%
Closed Sales 11 7 - 36.4% 18 13 - 27.8%
Median Sales Price* $175,500 $227,000 + 29.3% $180,250 $170,000 - 5.7%
Percent of Original List Price Received* 98.9% 96.2% - 2.7% 94.6% 91.0% - 3.9%
Market Time 127 92 - 27.9% 134 89 - 33.2%
Inventory of Homes for Sale 28 31 + 10.7% -- -- --
2-2014 2-2015 + / – 2-2014 2-2015 + / –
New Listings 0 3 -- 2 6 + 200.0%
Closed Sales 0 0 -- 1 3 + 200.0%
Median Sales Price* $0 $0 -- $118,475 $161,000 + 35.9%
Percent of Original List Price Received* 0.0% 0.0% -- 100.5% 90.7% - 9.7%
Market Time 0 0 -- 43 82 + 89.9%
Inventory of Homes for Sale 3 9 + 200.0% -- -- --* Does not account for sale concessions and/or down payment assistance. Note: Activity for one month can sometimes look extreme due to small sample size.
Change in Median Sales Price from Prior Year (6-Month Average)†
All All
Montclare Montclare
Detached Single-FamilyFebruary Year to Date
Attached Single-FamilyFebruary Year to Date
Local Market Update – February 2015
Montclare+ 44.4% - 36.4% + 29.0%
Change inNew ListingsAll Properties
Change inClosed SalesAll Properties
Change in Inventory of Homes
All Properties
- 40%
- 30%
- 20%
- 10%
0%
+ 10%
+ 20%
+ 30%
1-2009 1-2010 1-2011 1-2012 1-2013 1-2014 1-2015
Detached Single-Familyb
a
- 80%
- 60%
- 40%
- 20%
0%
+ 20%
+ 40%
+ 60%
+ 80%
+ 100%
+ 120%
1-2009 1-2010 1-2011 1-2012 1-2013 1-2014 1-2015
Attached Single-Familyb
a
RESIDENTIAL ACTIVITY ONLY | Data current as of March 16, 2015
† Each dot represents the change in median sales price from the prior year using a 6-month weighted average. This means that each of the 6 months usedin a dot are proportioned according to their share of sales during that period. | Current as of March 2, 2015. All data from Midwest Real Estate Data.

2-2014 2-2015 + / – 2-2014 2-2015 + / –
New Listings 12 19 + 58.3% 31 32 + 3.2%
Closed Sales 7 11 + 57.1% 16 22 + 37.5%
Median Sales Price* $163,000 $159,000 - 2.5% $162,750 $162,000 - 0.5%
Percent of Original List Price Received* 89.7% 93.4% + 4.1% 93.4% 92.8% - 0.6%
Market Time 130 106 - 18.8% 88 88 - 1.0%
Inventory of Homes for Sale 46 45 - 2.2% -- -- --
2-2014 2-2015 + / – 2-2014 2-2015 + / –
New Listings 1 0 - 100.0% 2 4 + 100.0%
Closed Sales 0 0 -- 0 1 --
Median Sales Price* $0 $0 -- $0 $105,000 --
Percent of Original List Price Received* 0.0% 0.0% -- 0.0% 80.8% --
Market Time 0 0 -- 0 104 --
Inventory of Homes for Sale 5 2 - 60.0% -- -- --* Does not account for sale concessions and/or down payment assistance. Note: Activity for one month can sometimes look extreme due to small sample size.
Change in Median Sales Price from Prior Year (6-Month Average)†
All All
Mount Greenwood Mount Greenwood
Detached Single-FamilyFebruary Year to Date
Attached Single-FamilyFebruary Year to Date
Local Market Update – February 2015
Mount Greenwood+ 46.2% + 57.1% - 7.8%
Change inNew ListingsAll Properties
Change inClosed SalesAll Properties
Change in Inventory of Homes
All Properties
- 30%
- 20%
- 10%
0%
+ 10%
+ 20%
+ 30%
+ 40%
1-2009 1-2010 1-2011 1-2012 1-2013 1-2014 1-2015
Detached Single-Familyb
a
- 60%
- 40%
- 20%
0%
+ 20%
+ 40%
+ 60%
1-2009 1-2010 1-2011 1-2012 1-2013 1-2014 1-2015
Attached Single-Familyb
a
RESIDENTIAL ACTIVITY ONLY | Data current as of March 16, 2015
† Each dot represents the change in median sales price from the prior year using a 6-month weighted average. This means that each of the 6 months usedin a dot are proportioned according to their share of sales during that period. | Current as of March 2, 2015. All data from Midwest Real Estate Data.

2-2014 2-2015 + / – 2-2014 2-2015 + / –
New Listings 11 4 - 63.6% 15 10 - 33.3%
Closed Sales 2 2 0.0% 7 4 - 42.9%
Median Sales Price* $3,032,500 $1,352,500 - 55.4% $2,965,000 $1,687,500 - 43.1%
Percent of Original List Price Received* 85.9% 95.0% + 10.5% 89.7% 95.7% + 6.7%
Market Time 386 11 - 97.3% 176 169 - 3.7%
Inventory of Homes for Sale 35 29 - 17.1% -- -- --
2-2014 2-2015 + / – 2-2014 2-2015 + / –
New Listings 370 439 + 18.6% 681 751 + 10.3%
Closed Sales 125 130 + 4.0% 252 267 + 6.0%
Median Sales Price* $385,000 $353,500 - 8.2% $397,500 $387,500 - 2.5%
Percent of Original List Price Received* 94.8% 95.2% + 0.5% 94.8% 95.1% + 0.4%
Market Time 94 110 + 17.3% 89 105 + 17.9%
Inventory of Homes for Sale 844 897 + 6.3% -- -- --* Does not account for sale concessions and/or down payment assistance. Note: Activity for one month can sometimes look extreme due to small sample size.
Change in Median Sales Price from Prior Year (6-Month Average)†
All All
Near North Side Near North Side
Detached Single-FamilyFebruary Year to Date
Attached Single-FamilyFebruary Year to Date
Local Market Update – February 2015
Near North Side+ 16.3% + 3.9% + 5.3%
Change inNew ListingsAll Properties
Change inClosed SalesAll Properties
Change in Inventory of Homes
All Properties
- 40%
- 20%
0%
+ 20%
+ 40%
+ 60%
+ 80%
+ 100%
+ 120%
+ 140%
+ 160%
+ 180%
1-2009 1-2010 1-2011 1-2012 1-2013 1-2014 1-2015
Detached Single-Familyb
a
- 30%
- 20%
- 10%
0%
+ 10%
+ 20%
+ 30%
1-2009 1-2010 1-2011 1-2012 1-2013 1-2014 1-2015
Attached Single-Familyb
a
RESIDENTIAL ACTIVITY ONLY | Data current as of March 16, 2015
† Each dot represents the change in median sales price from the prior year using a 6-month weighted average. This means that each of the 6 months usedin a dot are proportioned according to their share of sales during that period. | Current as of March 2, 2015. All data from Midwest Real Estate Data.
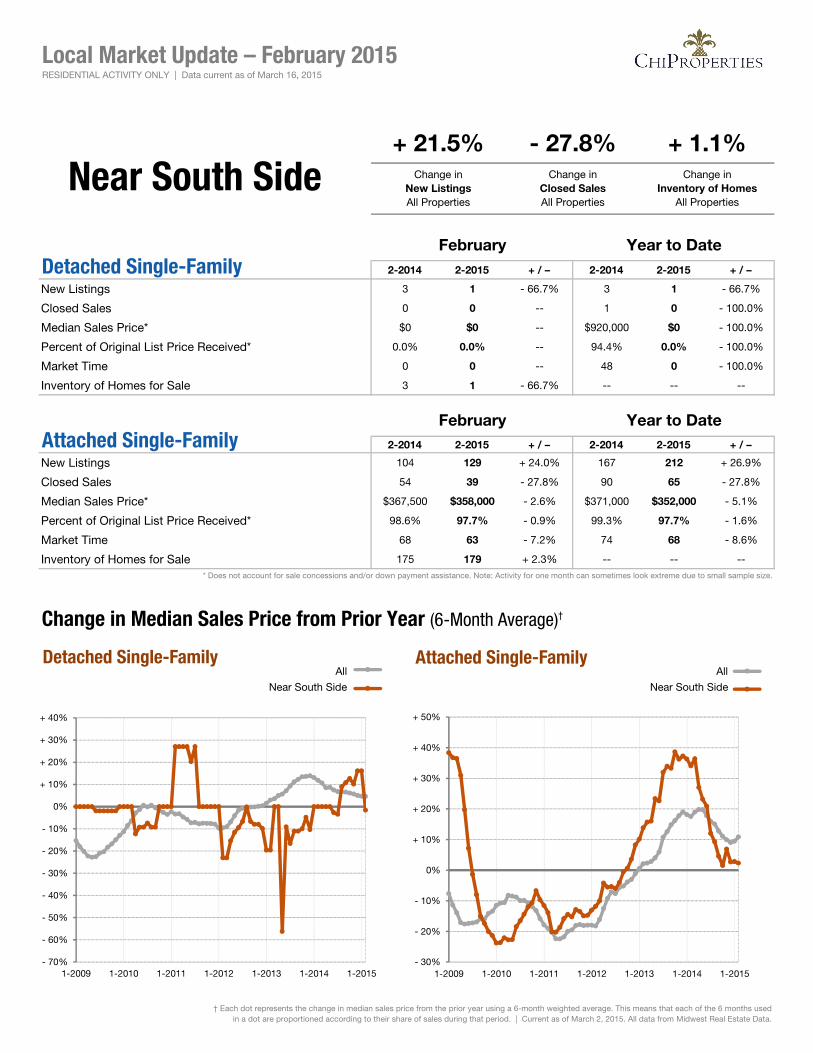
2-2014 2-2015 + / – 2-2014 2-2015 + / –
New Listings 3 1 - 66.7% 3 1 - 66.7%
Closed Sales 0 0 -- 1 0 - 100.0%
Median Sales Price* $0 $0 -- $920,000 $0 - 100.0%
Percent of Original List Price Received* 0.0% 0.0% -- 94.4% 0.0% - 100.0%
Market Time 0 0 -- 48 0 - 100.0%
Inventory of Homes for Sale 3 1 - 66.7% -- -- --
2-2014 2-2015 + / – 2-2014 2-2015 + / –
New Listings 104 129 + 24.0% 167 212 + 26.9%
Closed Sales 54 39 - 27.8% 90 65 - 27.8%
Median Sales Price* $367,500 $358,000 - 2.6% $371,000 $352,000 - 5.1%
Percent of Original List Price Received* 98.6% 97.7% - 0.9% 99.3% 97.7% - 1.6%
Market Time 68 63 - 7.2% 74 68 - 8.6%
Inventory of Homes for Sale 175 179 + 2.3% -- -- --* Does not account for sale concessions and/or down payment assistance. Note: Activity for one month can sometimes look extreme due to small sample size.
Change in Median Sales Price from Prior Year (6-Month Average)†
All All
Near South Side Near South Side
Detached Single-FamilyFebruary Year to Date
Attached Single-FamilyFebruary Year to Date
Local Market Update – February 2015
Near South Side+ 21.5% - 27.8% + 1.1%
Change inNew ListingsAll Properties
Change inClosed SalesAll Properties
Change in Inventory of Homes
All Properties
- 70%
- 60%
- 50%
- 40%
- 30%
- 20%
- 10%
0%
+ 10%
+ 20%
+ 30%
+ 40%
1-2009 1-2010 1-2011 1-2012 1-2013 1-2014 1-2015
Detached Single-Familyb
a
- 30%
- 20%
- 10%
0%
+ 10%
+ 20%
+ 30%
+ 40%
+ 50%
1-2009 1-2010 1-2011 1-2012 1-2013 1-2014 1-2015
Attached Single-Familyb
a
RESIDENTIAL ACTIVITY ONLY | Data current as of March 16, 2015
† Each dot represents the change in median sales price from the prior year using a 6-month weighted average. This means that each of the 6 months usedin a dot are proportioned according to their share of sales during that period. | Current as of March 2, 2015. All data from Midwest Real Estate Data.
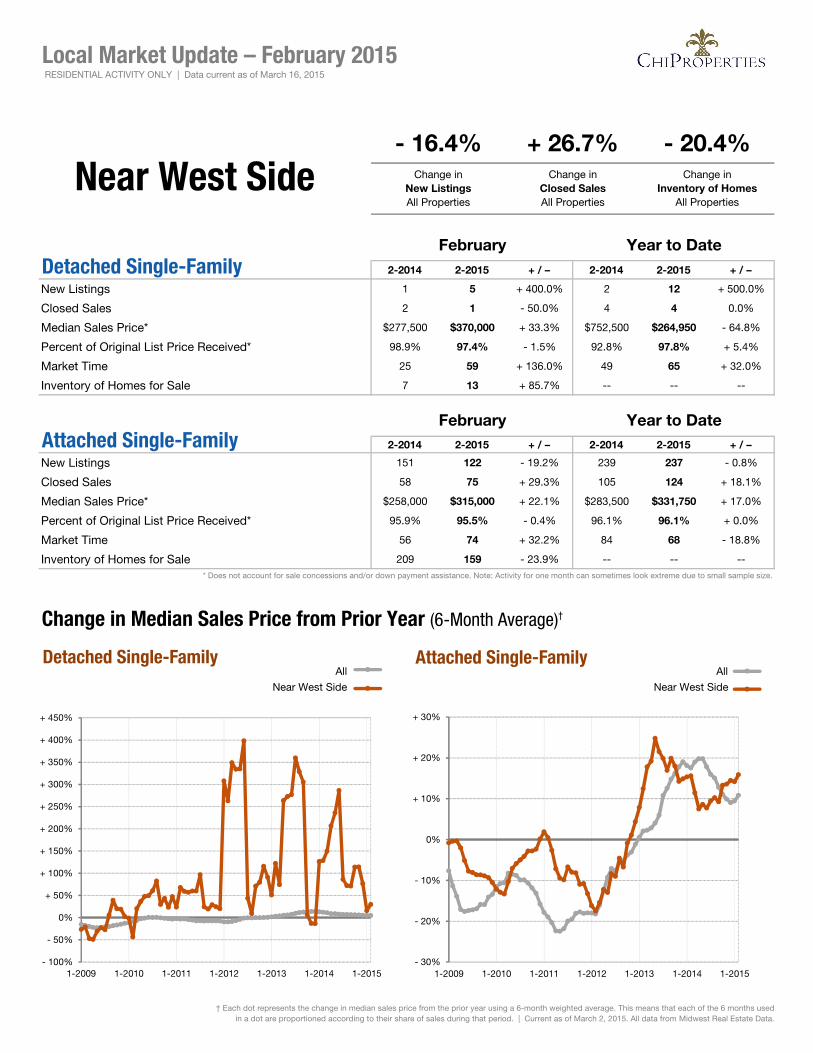
2-2014 2-2015 + / – 2-2014 2-2015 + / –
New Listings 1 5 + 400.0% 2 12 + 500.0%
Closed Sales 2 1 - 50.0% 4 4 0.0%
Median Sales Price* $277,500 $370,000 + 33.3% $752,500 $264,950 - 64.8%
Percent of Original List Price Received* 98.9% 97.4% - 1.5% 92.8% 97.8% + 5.4%
Market Time 25 59 + 136.0% 49 65 + 32.0%
Inventory of Homes for Sale 7 13 + 85.7% -- -- --
2-2014 2-2015 + / – 2-2014 2-2015 + / –
New Listings 151 122 - 19.2% 239 237 - 0.8%
Closed Sales 58 75 + 29.3% 105 124 + 18.1%
Median Sales Price* $258,000 $315,000 + 22.1% $283,500 $331,750 + 17.0%
Percent of Original List Price Received* 95.9% 95.5% - 0.4% 96.1% 96.1% + 0.0%
Market Time 56 74 + 32.2% 84 68 - 18.8%
Inventory of Homes for Sale 209 159 - 23.9% -- -- --* Does not account for sale concessions and/or down payment assistance. Note: Activity for one month can sometimes look extreme due to small sample size.
Change in Median Sales Price from Prior Year (6-Month Average)†
All All
Near West Side Near West Side
Detached Single-FamilyFebruary Year to Date
Attached Single-FamilyFebruary Year to Date
Local Market Update – February 2015
Near West Side- 16.4% + 26.7% - 20.4%
Change inNew ListingsAll Properties
Change inClosed SalesAll Properties
Change in Inventory of Homes
All Properties
- 100%
- 50%
0%
+ 50%
+ 100%
+ 150%
+ 200%
+ 250%
+ 300%
+ 350%
+ 400%
+ 450%
1-2009 1-2010 1-2011 1-2012 1-2013 1-2014 1-2015
Detached Single-Familyb
a
- 30%
- 20%
- 10%
0%
+ 10%
+ 20%
+ 30%
1-2009 1-2010 1-2011 1-2012 1-2013 1-2014 1-2015
Attached Single-Familyb
a
RESIDENTIAL ACTIVITY ONLY | Data current as of March 16, 2015
† Each dot represents the change in median sales price from the prior year using a 6-month weighted average. This means that each of the 6 months usedin a dot are proportioned according to their share of sales during that period. | Current as of March 2, 2015. All data from Midwest Real Estate Data.
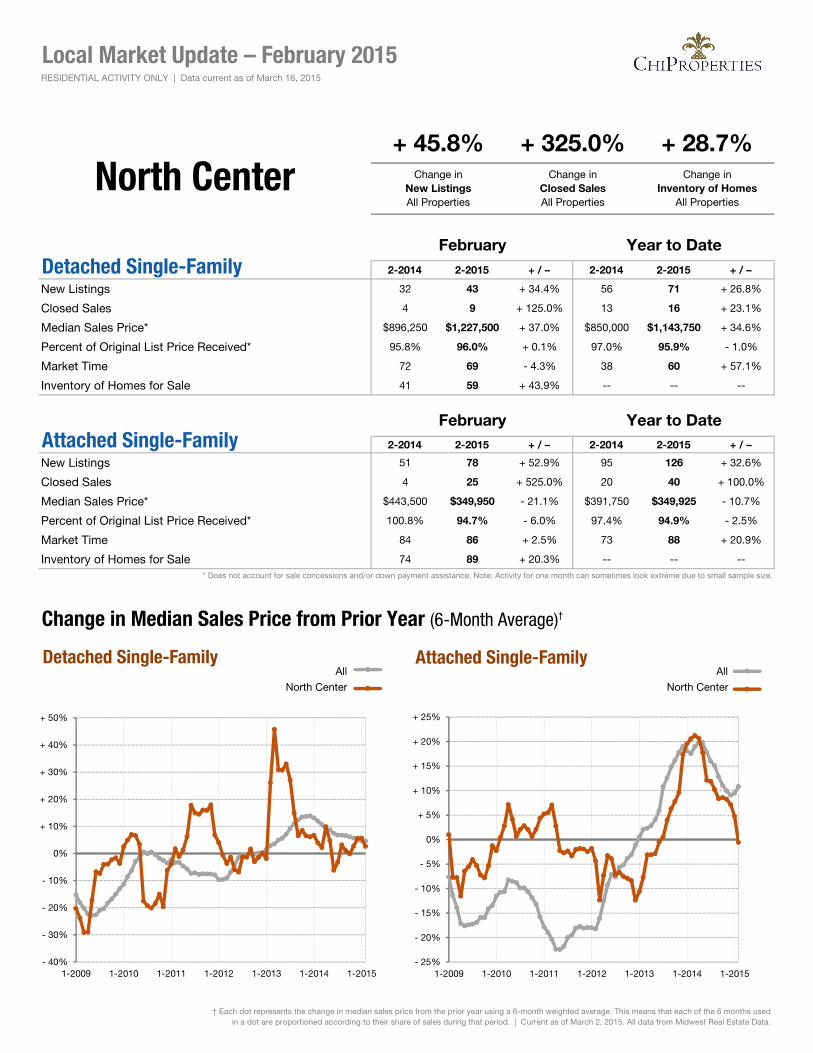
2-2014 2-2015 + / – 2-2014 2-2015 + / –
New Listings 32 43 + 34.4% 56 71 + 26.8%
Closed Sales 4 9 + 125.0% 13 16 + 23.1%
Median Sales Price* $896,250 $1,227,500 + 37.0% $850,000 $1,143,750 + 34.6%
Percent of Original List Price Received* 95.8% 96.0% + 0.1% 97.0% 95.9% - 1.0%
Market Time 72 69 - 4.3% 38 60 + 57.1%
Inventory of Homes for Sale 41 59 + 43.9% -- -- --
2-2014 2-2015 + / – 2-2014 2-2015 + / –
New Listings 51 78 + 52.9% 95 126 + 32.6%
Closed Sales 4 25 + 525.0% 20 40 + 100.0%
Median Sales Price* $443,500 $349,950 - 21.1% $391,750 $349,925 - 10.7%
Percent of Original List Price Received* 100.8% 94.7% - 6.0% 97.4% 94.9% - 2.5%
Market Time 84 86 + 2.5% 73 88 + 20.9%
Inventory of Homes for Sale 74 89 + 20.3% -- -- --* Does not account for sale concessions and/or down payment assistance. Note: Activity for one month can sometimes look extreme due to small sample size.
Change in Median Sales Price from Prior Year (6-Month Average)†
All All
North Center North Center
Detached Single-FamilyFebruary Year to Date
Attached Single-FamilyFebruary Year to Date
Local Market Update – February 2015
North Center+ 45.8% + 325.0% + 28.7%
Change inNew ListingsAll Properties
Change inClosed SalesAll Properties
Change in Inventory of Homes
All Properties
- 40%
- 30%
- 20%
- 10%
0%
+ 10%
+ 20%
+ 30%
+ 40%
+ 50%
1-2009 1-2010 1-2011 1-2012 1-2013 1-2014 1-2015
Detached Single-Familyb
a
- 25%
- 20%
- 15%
- 10%
- 5%
0%
+ 5%
+ 10%
+ 15%
+ 20%
+ 25%
1-2009 1-2010 1-2011 1-2012 1-2013 1-2014 1-2015
Attached Single-Familyb
a
RESIDENTIAL ACTIVITY ONLY | Data current as of March 16, 2015
† Each dot represents the change in median sales price from the prior year using a 6-month weighted average. This means that each of the 6 months usedin a dot are proportioned according to their share of sales during that period. | Current as of March 2, 2015. All data from Midwest Real Estate Data.

2-2014 2-2015 + / – 2-2014 2-2015 + / –
New Listings 43 50 + 16.3% 75 93 + 24.0%
Closed Sales 15 15 0.0% 28 34 + 21.4%
Median Sales Price* $285,000 $253,500 - 11.1% $285,000 $257,750 - 9.6%
Percent of Original List Price Received* 92.2% 90.8% - 1.5% 93.0% 90.8% - 2.4%
Market Time 153 146 - 4.7% 104 118 + 13.6%
Inventory of Homes for Sale 83 98 + 18.1% -- -- --
2-2014 2-2015 + / – 2-2014 2-2015 + / –
New Listings 14 9 - 35.7% 23 16 - 30.4%
Closed Sales 8 7 - 12.5% 13 12 - 7.7%
Median Sales Price* $91,750 $138,000 + 50.4% $98,000 $132,750 + 35.5%
Percent of Original List Price Received* 103.0% 119.3% + 15.8% 100.7% 108.1% + 7.4%
Market Time 115 106 - 8.3% 90 83 - 8.2%
Inventory of Homes for Sale 26 16 - 38.5% -- -- --* Does not account for sale concessions and/or down payment assistance. Note: Activity for one month can sometimes look extreme due to small sample size.
Change in Median Sales Price from Prior Year (6-Month Average)†
All All
Norwood Park Norwood Park
Detached Single-FamilyFebruary Year to Date
Attached Single-FamilyFebruary Year to Date
Local Market Update – February 2015
Norwood Park+ 3.5% - 4.3% + 4.6%
Change inNew ListingsAll Properties
Change inClosed SalesAll Properties
Change in Inventory of Homes
All Properties
- 30%
- 20%
- 10%
0%
+ 10%
+ 20%
+ 30%
+ 40%
1-2009 1-2010 1-2011 1-2012 1-2013 1-2014 1-2015
Detached Single-Familyb
a
- 50%
- 40%
- 30%
- 20%
- 10%
0%
+ 10%
+ 20%
+ 30%
+ 40%
+ 50%
+ 60%
1-2009 1-2010 1-2011 1-2012 1-2013 1-2014 1-2015
Attached Single-Familyb
a
RESIDENTIAL ACTIVITY ONLY | Data current as of March 16, 2015
† Each dot represents the change in median sales price from the prior year using a 6-month weighted average. This means that each of the 6 months usedin a dot are proportioned according to their share of sales during that period. | Current as of March 2, 2015. All data from Midwest Real Estate Data.

2-2014 2-2015 + / – 2-2014 2-2015 + / –
New Listings 35 56 + 60.0% 61 91 + 49.2%
Closed Sales 29 25 - 13.8% 48 52 + 8.3%
Median Sales Price* $210,000 $210,000 0.0% $227,500 $240,000 + 5.5%
Percent of Original List Price Received* 93.6% 91.7% - 2.1% 94.6% 92.7% - 2.0%
Market Time 91 141 + 55.1% 92 110 + 19.1%
Inventory of Homes for Sale 95 101 + 6.3% -- -- --
2-2014 2-2015 + / – 2-2014 2-2015 + / –
New Listings 14 9 - 35.7% 27 18 - 33.3%
Closed Sales 7 1 - 85.7% 15 1 - 93.3%
Median Sales Price* $78,000 $129,000 + 65.4% $90,000 $129,000 + 43.3%
Percent of Original List Price Received* 93.9% 95.6% + 1.9% 93.3% 95.6% + 2.5%
Market Time 451 60 - 86.7% 284 60 - 78.9%
Inventory of Homes for Sale 39 16 - 59.0% -- -- --* Does not account for sale concessions and/or down payment assistance. Note: Activity for one month can sometimes look extreme due to small sample size.
Change in Median Sales Price from Prior Year (6-Month Average)†
All All
Portage Park Portage Park
Detached Single-FamilyFebruary Year to Date
Attached Single-FamilyFebruary Year to Date
Local Market Update – February 2015
Portage Park+ 32.7% - 27.8% - 12.7%
Change inNew ListingsAll Properties
Change inClosed SalesAll Properties
Change in Inventory of Homes
All Properties
- 30%
- 20%
- 10%
0%
+ 10%
+ 20%
+ 30%
1-2009 1-2010 1-2011 1-2012 1-2013 1-2014 1-2015
Detached Single-Familyb
a
- 80%
- 60%
- 40%
- 20%
0%
+ 20%
+ 40%
+ 60%
+ 80%
+ 100%
+ 120%
1-2009 1-2010 1-2011 1-2012 1-2013 1-2014 1-2015
Attached Single-Familyb
a
RESIDENTIAL ACTIVITY ONLY | Data current as of March 16, 2015
† Each dot represents the change in median sales price from the prior year using a 6-month weighted average. This means that each of the 6 months usedin a dot are proportioned according to their share of sales during that period. | Current as of March 2, 2015. All data from Midwest Real Estate Data.
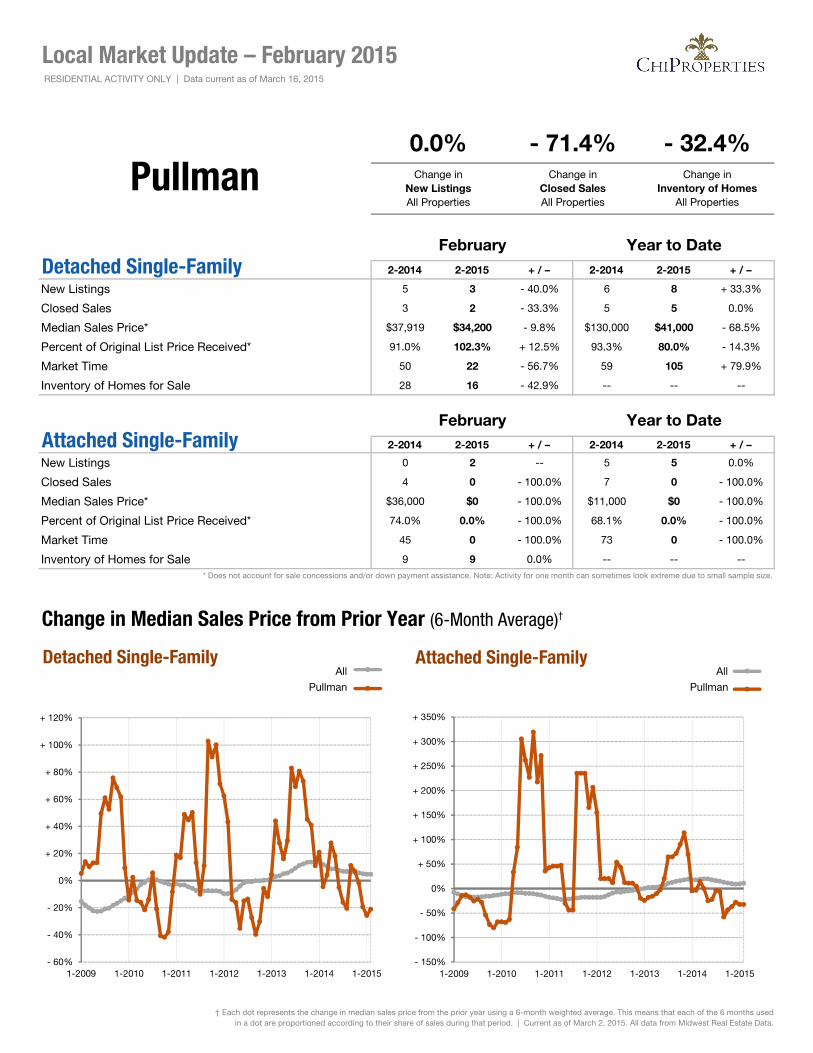
2-2014 2-2015 + / – 2-2014 2-2015 + / –
New Listings 5 3 - 40.0% 6 8 + 33.3%
Closed Sales 3 2 - 33.3% 5 5 0.0%
Median Sales Price* $37,919 $34,200 - 9.8% $130,000 $41,000 - 68.5%
Percent of Original List Price Received* 91.0% 102.3% + 12.5% 93.3% 80.0% - 14.3%
Market Time 50 22 - 56.7% 59 105 + 79.9%
Inventory of Homes for Sale 28 16 - 42.9% -- -- --
2-2014 2-2015 + / – 2-2014 2-2015 + / –
New Listings 0 2 -- 5 5 0.0%
Closed Sales 4 0 - 100.0% 7 0 - 100.0%
Median Sales Price* $36,000 $0 - 100.0% $11,000 $0 - 100.0%
Percent of Original List Price Received* 74.0% 0.0% - 100.0% 68.1% 0.0% - 100.0%
Market Time 45 0 - 100.0% 73 0 - 100.0%
Inventory of Homes for Sale 9 9 0.0% -- -- --* Does not account for sale concessions and/or down payment assistance. Note: Activity for one month can sometimes look extreme due to small sample size.
Change in Median Sales Price from Prior Year (6-Month Average)†
All All
Pullman Pullman
Detached Single-FamilyFebruary Year to Date
Attached Single-FamilyFebruary Year to Date
Local Market Update – February 2015
Pullman0.0% - 71.4% - 32.4%Change in
New ListingsAll Properties
Change inClosed SalesAll Properties
Change in Inventory of Homes
All Properties
- 60%
- 40%
- 20%
0%
+ 20%
+ 40%
+ 60%
+ 80%
+ 100%
+ 120%
1-2009 1-2010 1-2011 1-2012 1-2013 1-2014 1-2015
Detached Single-Familyb
a
- 150%
- 100%
- 50%
0%
+ 50%
+ 100%
+ 150%
+ 200%
+ 250%
+ 300%
+ 350%
1-2009 1-2010 1-2011 1-2012 1-2013 1-2014 1-2015
Attached Single-Familyb
a
RESIDENTIAL ACTIVITY ONLY | Data current as of March 16, 2015
† Each dot represents the change in median sales price from the prior year using a 6-month weighted average. This means that each of the 6 months usedin a dot are proportioned according to their share of sales during that period. | Current as of March 2, 2015. All data from Midwest Real Estate Data.

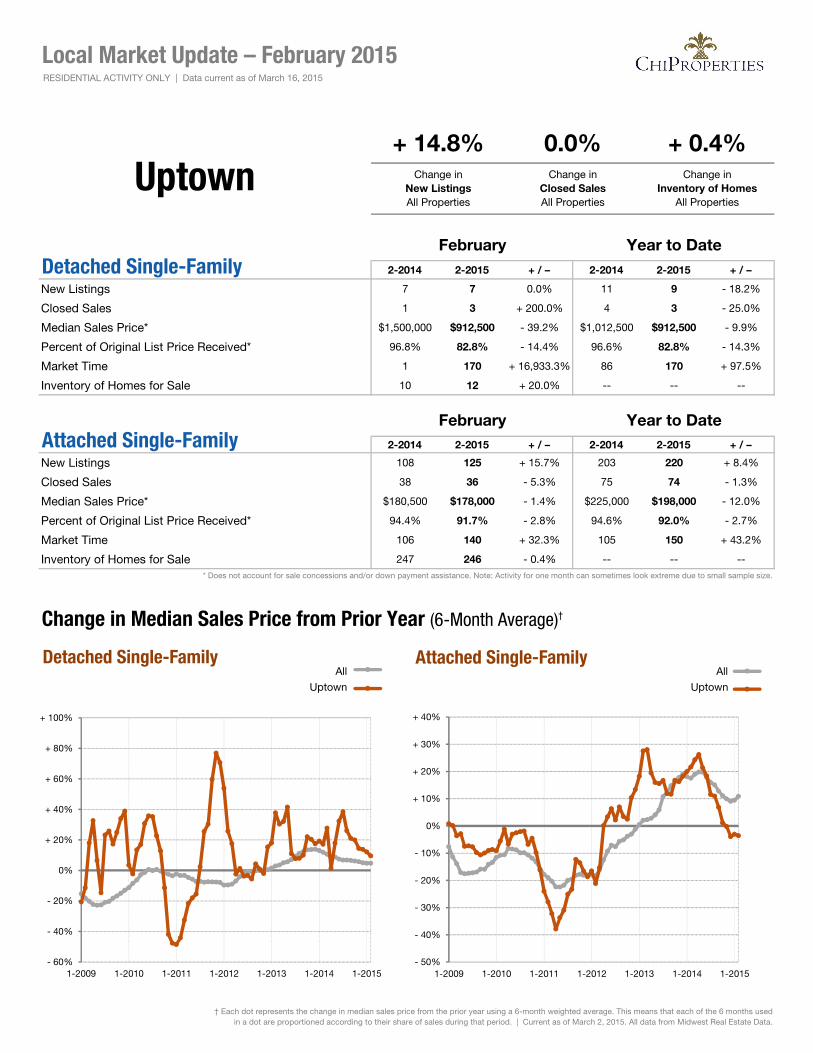
2-2014 2-2015 + / – 2-2014 2-2015 + / –
New Listings 7 7 0.0% 9 11 + 22.2%
Closed Sales 3 0 - 100.0% 7 2 - 71.4%
Median Sales Price* $145,500 $0 - 100.0% $413,000 $250,000 - 39.5%
Percent of Original List Price Received* 82.3% 0.0% - 100.0% 85.5% 77.2% - 9.8%
Market Time 94 0 - 100.0% 119 142 + 19.3%
Inventory of Homes for Sale 11 8 - 27.3% -- -- --
2-2014 2-2015 + / – 2-2014 2-2015 + / –
New Listings 60 52 - 13.3% 101 109 + 7.9%
Closed Sales 25 27 + 8.0% 56 42 - 25.0%
Median Sales Price* $85,500 $155,000 + 81.3% $85,000 $119,032 + 40.0%
Percent of Original List Price Received* 99.7% 94.1% - 5.7% 97.6% 92.0% - 5.7%
Market Time 110 99 - 9.8% 101 102 + 1.4%
Inventory of Homes for Sale 134 145 + 8.2% -- -- --* Does not account for sale concessions and/or down payment assistance. Note: Activity for one month can sometimes look extreme due to small sample size.
Change in Median Sales Price from Prior Year (6-Month Average)†
All All
Rogers Park Rogers Park
Detached Single-FamilyFebruary Year to Date
Attached Single-FamilyFebruary Year to Date
Local Market Update – February 2015
Rogers Park- 11.9% - 3.6% + 5.5%
Change inNew ListingsAll Properties
Change inClosed SalesAll Properties
Change in Inventory of Homes
All Properties
- 60%
- 40%
- 20%
0%
+ 20%
+ 40%
+ 60%
+ 80%
+ 100%
+ 120%
+ 140%
1-2009 1-2010 1-2011 1-2012 1-2013 1-2014 1-2015
Detached Single-Familyb
a
- 80%
- 60%
- 40%
- 20%
0%
+ 20%
+ 40%
+ 60%
+ 80%
1-2009 1-2010 1-2011 1-2012 1-2013 1-2014 1-2015
Attached Single-Familyb
a
RESIDENTIAL ACTIVITY ONLY | Data current as of March 16, 2015
† Each dot represents the change in median sales price from the prior year using a 6-month weighted average. This means that each of the 6 months usedin a dot are proportioned according to their share of sales during that period. | Current as of March 2, 2015. All data from Midwest Real Estate Data.
2-2014 2-2015 + / – 2-2014 2-2015 + / –
New Listings 7 7 0.0% 11 9 - 18.2%
Closed Sales 1 3 + 200.0% 4 3 - 25.0%
Median Sales Price* $1,500,000 $912,500 - 39.2% $1,012,500 $912,500 - 9.9%
Percent of Original List Price Received* 96.8% 82.8% - 14.4% 96.6% 82.8% - 14.3%
Market Time 1 170 + 16,933.3% 86 170 + 97.5%
Inventory of Homes for Sale 10 12 + 20.0% -- -- --
2-2014 2-2015 + / – 2-2014 2-2015 + / –
New Listings 108 125 + 15.7% 203 220 + 8.4%
Closed Sales 38 36 - 5.3% 75 74 - 1.3%
Median Sales Price* $180,500 $178,000 - 1.4% $225,000 $198,000 - 12.0%
Percent of Original List Price Received* 94.4% 91.7% - 2.8% 94.6% 92.0% - 2.7%
Market Time 106 140 + 32.3% 105 150 + 43.2%
Inventory of Homes for Sale 247 246 - 0.4% -- -- --* Does not account for sale concessions and/or down payment assistance. Note: Activity for one month can sometimes look extreme due to small sample size.
Change in Median Sales Price from Prior Year (6-Month Average)†
All All
Uptown Uptown
Detached Single-FamilyFebruary Year to Date
Attached Single-FamilyFebruary Year to Date
Local Market Update – February 2015
Uptown+ 14.8% 0.0% + 0.4%
Change inNew ListingsAll Properties
Change inClosed SalesAll Properties
Change in Inventory of Homes
All Properties
- 60%
- 40%
- 20%
0%
+ 20%
+ 40%
+ 60%
+ 80%
+ 100%
1-2009 1-2010 1-2011 1-2012 1-2013 1-2014 1-2015
Detached Single-Familyb
a
- 50%
- 40%
- 30%
- 20%
- 10%
0%
+ 10%
+ 20%
+ 30%
+ 40%
1-2009 1-2010 1-2011 1-2012 1-2013 1-2014 1-2015
Attached Single-Familyb
a
RESIDENTIAL ACTIVITY ONLY | Data current as of March 16, 2015
† Each dot represents the change in median sales price from the prior year using a 6-month weighted average. This means that each of the 6 months usedin a dot are proportioned according to their share of sales during that period. | Current as of March 2, 2015. All data from Midwest Real Estate Data.
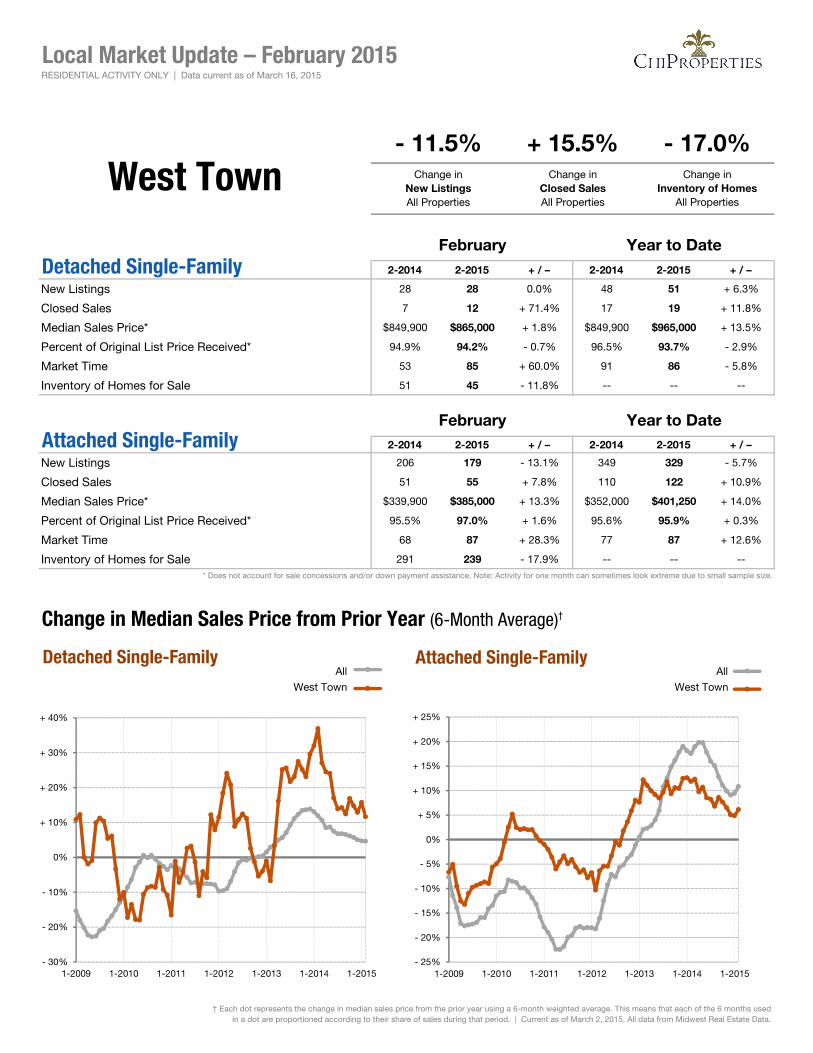
2-2014 2-2015 + / – 2-2014 2-2015 + / –
New Listings 28 28 0.0% 48 51 + 6.3%
Closed Sales 7 12 + 71.4% 17 19 + 11.8%
Median Sales Price* $849,900 $865,000 + 1.8% $849,900 $965,000 + 13.5%
Percent of Original List Price Received* 94.9% 94.2% - 0.7% 96.5% 93.7% - 2.9%
Market Time 53 85 + 60.0% 91 86 - 5.8%
Inventory of Homes for Sale 51 45 - 11.8% -- -- --
2-2014 2-2015 + / – 2-2014 2-2015 + / –
New Listings 206 179 - 13.1% 349 329 - 5.7%
Closed Sales 51 55 + 7.8% 110 122 + 10.9%
Median Sales Price* $339,900 $385,000 + 13.3% $352,000 $401,250 + 14.0%
Percent of Original List Price Received* 95.5% 97.0% + 1.6% 95.6% 95.9% + 0.3%
Market Time 68 87 + 28.3% 77 87 + 12.6%
Inventory of Homes for Sale 291 239 - 17.9% -- -- --* Does not account for sale concessions and/or down payment assistance. Note: Activity for one month can sometimes look extreme due to small sample size.
Change in Median Sales Price from Prior Year (6-Month Average)†
All All
West Town West Town
Detached Single-FamilyFebruary Year to Date
Attached Single-FamilyFebruary Year to Date
Local Market Update – February 2015
West Town- 11.5% + 15.5% - 17.0%
Change inNew ListingsAll Properties
Change inClosed SalesAll Properties
Change in Inventory of Homes
All Properties
- 30%
- 20%
- 10%
0%
+ 10%
+ 20%
+ 30%
+ 40%
1-2009 1-2010 1-2011 1-2012 1-2013 1-2014 1-2015
Detached Single-Familyb
a
- 25%
- 20%
- 15%
- 10%
- 5%
0%
+ 5%
+ 10%
+ 15%
+ 20%
+ 25%
1-2009 1-2010 1-2011 1-2012 1-2013 1-2014 1-2015
Attached Single-Familyb
a
RESIDENTIAL ACTIVITY ONLY | Data current as of March 16, 2015
† Each dot represents the change in median sales price from the prior year using a 6-month weighted average. This means that each of the 6 months usedin a dot are proportioned according to their share of sales during that period. | Current as of March 2, 2015. All data from Midwest Real Estate Data.
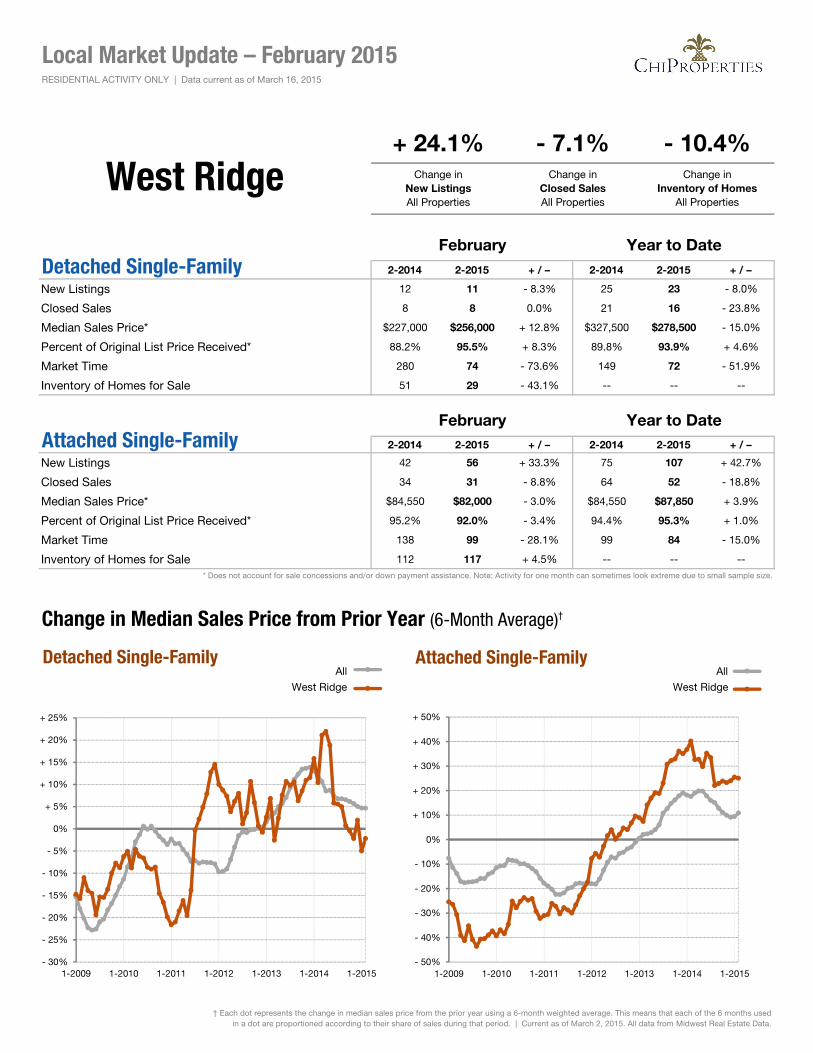
2-2014 2-2015 + / – 2-2014 2-2015 + / –
New Listings 12 11 - 8.3% 25 23 - 8.0%
Closed Sales 8 8 0.0% 21 16 - 23.8%
Median Sales Price* $227,000 $256,000 + 12.8% $327,500 $278,500 - 15.0%
Percent of Original List Price Received* 88.2% 95.5% + 8.3% 89.8% 93.9% + 4.6%
Market Time 280 74 - 73.6% 149 72 - 51.9%
Inventory of Homes for Sale 51 29 - 43.1% -- -- --
2-2014 2-2015 + / – 2-2014 2-2015 + / –
New Listings 42 56 + 33.3% 75 107 + 42.7%
Closed Sales 34 31 - 8.8% 64 52 - 18.8%
Median Sales Price* $84,550 $82,000 - 3.0% $84,550 $87,850 + 3.9%
Percent of Original List Price Received* 95.2% 92.0% - 3.4% 94.4% 95.3% + 1.0%
Market Time 138 99 - 28.1% 99 84 - 15.0%
Inventory of Homes for Sale 112 117 + 4.5% -- -- --* Does not account for sale concessions and/or down payment assistance. Note: Activity for one month can sometimes look extreme due to small sample size.
Change in Median Sales Price from Prior Year (6-Month Average)†
All All
West Ridge West Ridge
Detached Single-FamilyFebruary Year to Date
Attached Single-FamilyFebruary Year to Date
Local Market Update – February 2015
West Ridge+ 24.1% - 7.1% - 10.4%
Change inNew ListingsAll Properties
Change inClosed SalesAll Properties
Change in Inventory of Homes
All Properties
- 30%
- 25%
- 20%
- 15%
- 10%
- 5%
0%
+ 5%
+ 10%
+ 15%
+ 20%
+ 25%
1-2009 1-2010 1-2011 1-2012 1-2013 1-2014 1-2015
Detached Single-Familyb
a
- 50%
- 40%
- 30%
- 20%
- 10%
0%
+ 10%
+ 20%
+ 30%
+ 40%
+ 50%
1-2009 1-2010 1-2011 1-2012 1-2013 1-2014 1-2015
Attached Single-Familyb
a
RESIDENTIAL ACTIVITY ONLY | Data current as of March 16, 2015
† Each dot represents the change in median sales price from the prior year using a 6-month weighted average. This means that each of the 6 months usedin a dot are proportioned according to their share of sales during that period. | Current as of March 2, 2015. All data from Midwest Real Estate Data.