your use of this ontario geological survey document …€¦ · votre utilisation de ces sites web...
TRANSCRIPT
THESE TERMS GOVERN YOUR USE OF THIS DOCUMENT
Your use of this Ontario Geological Survey document (the “Content”) is governed by the terms set out on this page (“Terms of Use”). By downloading this Content, you (the
“User”) have accepted, and have agreed to be bound by, the Terms of Use.
Content: This Content is offered by the Province of Ontario’s Ministry of Northern Development and Mines (MNDM) as a public service, on an “as-is” basis. Recommendations and statements of opinion expressed in the Content are those of the author or authors and are not to be construed as statement of government policy. You are solely responsible for your use of the Content. You should not rely on the Content for legal advice nor as authoritative in your particular circumstances. Users should verify the accuracy and applicability of any Content before acting on it. MNDM does not guarantee, or make any warranty express or implied, that the Content is current, accurate, complete or reliable. MNDM is not responsible for any damage however caused, which results, directly or indirectly, from your use of the Content. MNDM assumes no legal liability or responsibility for the Content whatsoever. Links to Other Web Sites: This Content may contain links, to Web sites that are not operated by MNDM. Linked Web sites may not be available in French. MNDM neither endorses nor assumes any responsibility for the safety, accuracy or availability of linked Web sites or the information contained on them. The linked Web sites, their operation and content are the responsibility of the person or entity for which they were created or maintained (the “Owner”). Both your use of a linked Web site, and your right to use or reproduce information or materials from a linked Web site, are subject to the terms of use governing that particular Web site. Any comments or inquiries regarding a linked Web site must be directed to its Owner. Copyright: Canadian and international intellectual property laws protect the Content. Unless otherwise indicated, copyright is held by the Queen’s Printer for Ontario. It is recommended that reference to the Content be made in the following form: <Author’s last name>, <Initials> <year of publication>. <Content title>; Ontario Geological Survey, <Content publication series and number>, <total number of pages>p. Use and Reproduction of Content: The Content may be used and reproduced only in accordance with applicable intellectual property laws. Non-commercial use of unsubstantial excerpts of the Content is permitted provided that appropriate credit is given and Crown copyright is acknowledged. Any substantial reproduction of the Content or any commercial use of all or part of the Content is prohibited without the prior written permission of MNDM. Substantial reproduction includes the reproduction of any illustration or figure, such as, but not limited to graphs, charts and maps. Commercial use includes commercial distribution of the Content, the reproduction of multiple copies of the Content for any purpose whether or not commercial, use of the Content in commercial publications, and the creation of value-added products using the Content. Contact:
FOR FURTHER INFORMATION ON PLEASE CONTACT: BY TELEPHONE: BY E-MAIL:
The Reproduction of Content
MNDM Publication Services
Local: (705) 670-5691 Toll Free: 1-888-415-9845, ext.
5691 (inside Canada, United States)
The Purchase of MNDM Publications
MNDM Publication Sales
Local: (705) 670-5691 Toll Free: 1-888-415-9845, ext.
5691 (inside Canada, United States)
Crown Copyright Queen’s Printer Local: (416) 326-2678 Toll Free: 1-800-668-9938
(inside Canada, United States)
LES CONDITIONS CI-DESSOUS RÉGISSENT L'UTILISATION DU PRÉSENT DOCUMENT.
Votre utilisation de ce document de la Commission géologique de l'Ontario (le « contenu ») est régie par les conditions décrites sur cette page (« conditions d'utilisation »). En
téléchargeant ce contenu, vous (l'« utilisateur ») signifiez que vous avez accepté d'être lié par les présentes conditions d'utilisation.
Contenu : Ce contenu est offert en l'état comme service public par le ministère du Développement du Nord et des Mines (MDNM) de la province de l'Ontario. Les recommandations et les opinions exprimées dans le contenu sont celles de l'auteur ou des auteurs et ne doivent pas être interprétées comme des énoncés officiels de politique gouvernementale. Vous êtes entièrement responsable de l'utilisation que vous en faites. Le contenu ne constitue pas une source fiable de conseils juridiques et ne peut en aucun cas faire autorité dans votre situation particulière. Les utilisateurs sont tenus de vérifier l'exactitude et l'applicabilité de tout contenu avant de l'utiliser. Le MDNM n'offre aucune garantie expresse ou implicite relativement à la mise à jour, à l'exactitude, à l'intégralité ou à la fiabilité du contenu. Le MDNM ne peut être tenu responsable de tout dommage, quelle qu'en soit la cause, résultant directement ou indirectement de l'utilisation du contenu. Le MDNM n'assume aucune responsabilité légale de quelque nature que ce soit en ce qui a trait au contenu. Liens vers d'autres sites Web : Ce contenu peut comporter des liens vers des sites Web qui ne sont pas exploités par le MDNM. Certains de ces sites pourraient ne pas être offerts en français. Le MDNM se dégage de toute responsabilité quant à la sûreté, à l'exactitude ou à la disponibilité des sites Web ainsi reliés ou à l'information qu'ils contiennent. La responsabilité des sites Web ainsi reliés, de leur exploitation et de leur contenu incombe à la personne ou à l'entité pour lesquelles ils ont été créés ou sont entretenus (le « propriétaire »). Votre utilisation de ces sites Web ainsi que votre droit d'utiliser ou de reproduire leur contenu sont assujettis aux conditions d'utilisation propres à chacun de ces sites. Tout commentaire ou toute question concernant l'un de ces sites doivent être adressés au propriétaire du site. Droits d'auteur : Le contenu est protégé par les lois canadiennes et internationales sur la propriété intellectuelle. Sauf indication contraire, les droits d'auteurs appartiennent à l'Imprimeur de la Reine pour l'Ontario. Nous recommandons de faire paraître ainsi toute référence au contenu : nom de famille de l'auteur, initiales, année de publication, titre du document, Commission géologique de l'Ontario, série et numéro de publication, nombre de pages. Utilisation et reproduction du contenu : Le contenu ne peut être utilisé et reproduit qu'en conformité avec les lois sur la propriété intellectuelle applicables. L'utilisation de courts extraits du contenu à des fins non commerciales est autorisé, à condition de faire une mention de source appropriée reconnaissant les droits d'auteurs de la Couronne. Toute reproduction importante du contenu ou toute utilisation, en tout ou en partie, du contenu à des fins commerciales est interdite sans l'autorisation écrite préalable du MDNM. Une reproduction jugée importante comprend la reproduction de toute illustration ou figure comme les graphiques, les diagrammes, les cartes, etc. L'utilisation commerciale comprend la distribution du contenu à des fins commerciales, la reproduction de copies multiples du contenu à des fins commerciales ou non, l'utilisation du contenu dans des publications commerciales et la création de produits à valeur ajoutée à l'aide du contenu. Renseignements :
POUR PLUS DE RENSEIGNEMENTS SUR VEUILLEZ VOUS
ADRESSER À : PAR TÉLÉPHONE : PAR COURRIEL :
la reproduction du contenu
Services de publication du MDNM
Local : (705) 670-5691 Numéro sans frais : 1 888 415-9845,
poste 5691 (au Canada et aux États-Unis)
l'achat des publications du MDNM
Vente de publications du MDNM
Local : (705) 670-5691 Numéro sans frais : 1 888 415-9845,
poste 5691 (au Canada et aux États-Unis)
les droits d'auteurs de la Couronne
Imprimeur de la Reine
Local : 416 326-2678 Numéro sans frais : 1 800 668-9938
(au Canada et aux États-Unis)

ONTARIO DEPARTMENT OF MINES
HON. G. C. WARDROPE, Minister D. P. DOUGLASS, Deputy Minister
M. E. HURST, Director Geological Branch
SALT IN ONTARIO
By
D. F. HEWITT
Industrial Mineral Report No. 6
TORONTO
Printed and Published by Frank Fogg, Printer to the Queen's Most Excellent Majesty
1962
The Series
Industrial Mineral Circulars
has been re-named
Industrial Mineral Reports.
Therefore
Industrial Mineral Circular No. 5
is followed by
Industrial Mineral Report No. 6
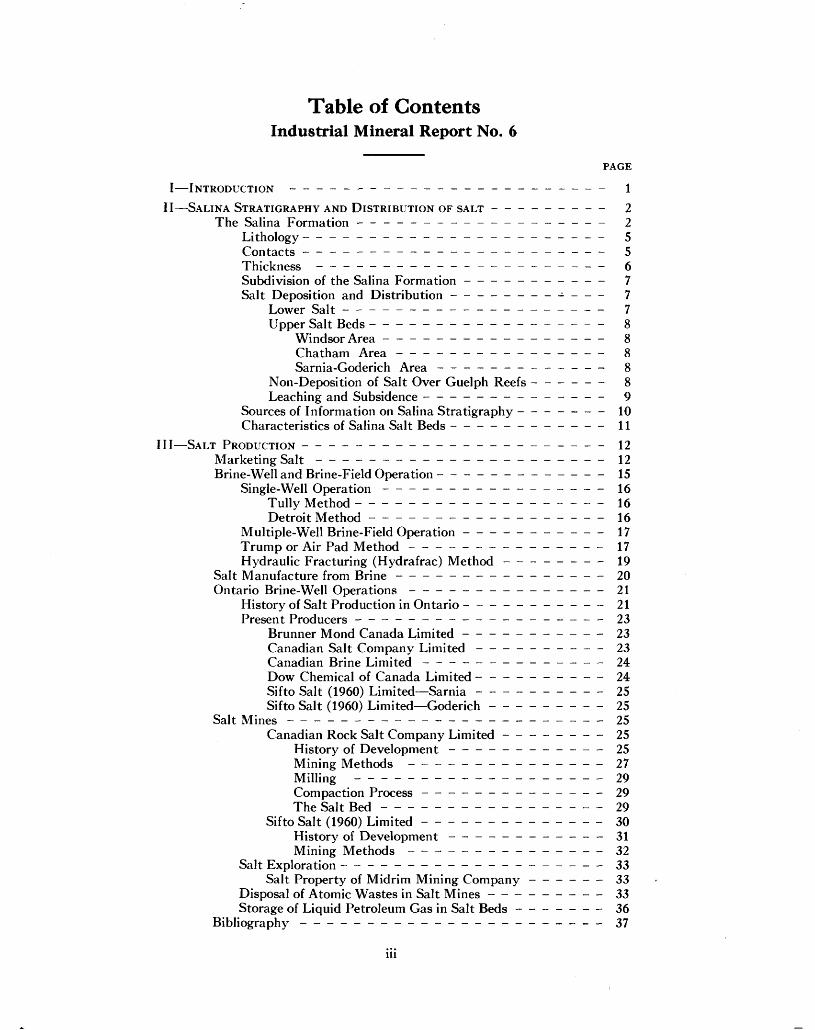
Table of ContentsIndustrial Mineral Report No. 6
PAGE
I INTRODUCTION ------------------------ i
II SALINA STRATIGRAPHY AND DISTRIBUTION OF SALT --------- 2The Salina Formation ------------------- 2
Lithology ----------------------- 5Contacts ----------------------- 5Thickness ---------------------- 5Subdivision of the Salina Formation ----------- 7Salt Deposition and Distribution ------------ 7
Lower Salt -------------------- 7Upper Salt Beds ------------------ g
Windsor Area ----------------- 8Chatham Area ---------------- 8Sarnia-Goderich Area ------------- 8
Non-Deposition of Salt Over Guelph Reefs - - - - - - 8Leaching and Subsidence -------------- 9
Sources of Information on Salina Stratigraphy ------- 10Characteristics of Salina Salt Beds ------------ 11
III SALT PRODUCTION ----------------------- 12Marketing Salt ---------------------- 12Brine- Well and Brine-Field Operation - ------------ 15
Single-Well Operation ----------------- 16Tully Method ------------------- 16Detroit Method ------------------ 16
Multiple-Well Brine-Field Operation ----------- 17Trump or Air Pad Method --------------- 17Hydraulic Fracturing (Hydrafrac) Method -------- 19
Salt Manufacture from Brine ---------------- 20Ontario Brine-Well Operations --------------- 21
History of Salt Production in Ontario - ---------- 21Present Producers ------------------- 23
Brunner Mond Canada Limited ----------- 23Canadian Salt Company Limited ---------- 23Canadian Brine Limited -------------- 24Dow Chemical of Canada Limited ---------- 24Sifto Salt (1960) Limited Sarnia ---------- 25Sifto Salt (I960) Limited Goderich --------- 25
Salt Mines ------------------------ 25Canadian Rock Salt Company Limited -------- 25
History of Development ------------ 25Mining Methods --------------- 27Milling --------^---------- 29Compaction Process -------------- 29The Salt Bed----------------- 29
Sifto Salt (1960) Limited -------------- 30History of Development ------------ 31Mining Methods --------------- 32
Salt Exploration -------------------- 33Salt Property of Midrim Mining Company - - - - - - 33
Disposal of Atomic Wastes in Salt Mines --------- 33Storage of Liquid Petroleum Gas in Salt Beds ------- 36
Bibliography ----------------------- 37
iii
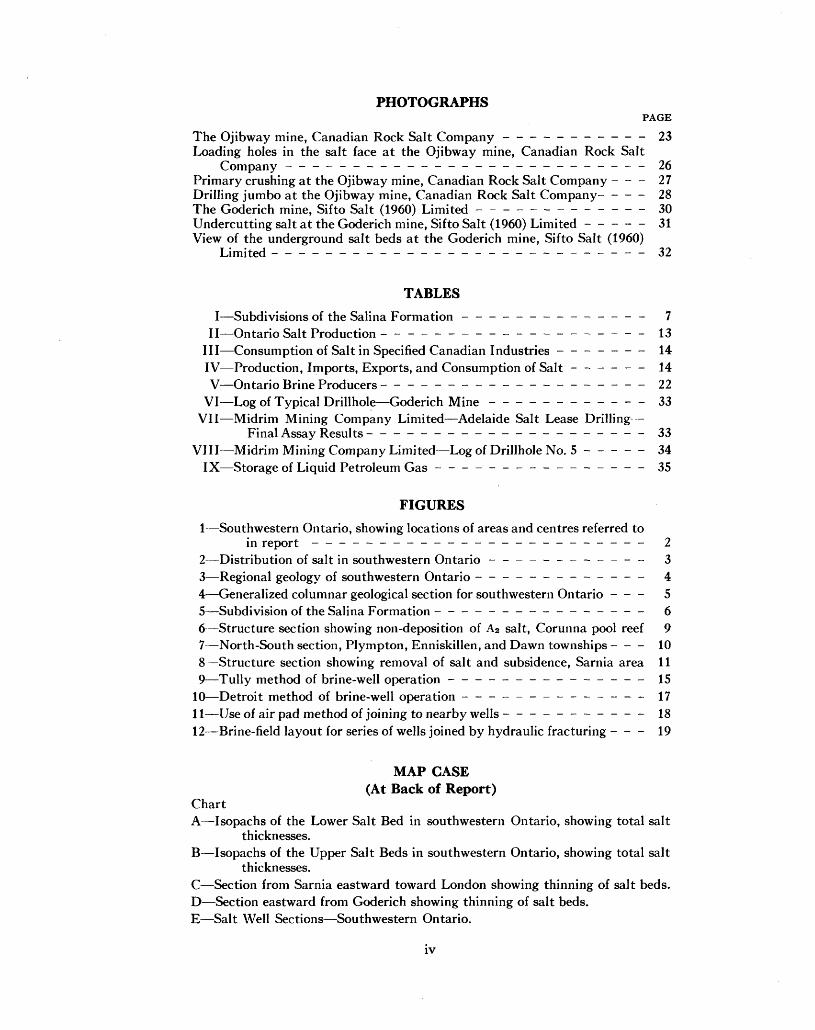
PHOTOGRAPHSPAGE
The Ojibway mine, Canadian Rock Salt Company ----------- 23Loading holes in the salt face at the Ojibway mine, Canadian Rock Salt
Company --------------------------- 26Primary crushing at the Ojibway mine, Canadian Rock Salt Company - - - 27 Drilling jumbo at the Ojibway mine, Canadian Rock Salt Company- - - - 28The Goderich mine, Sifto Salt (1960) Limited ------------- 30Undercutting salt at the Goderich mine, Sifto Salt (1960) Limited - - - - - 31View of the underground salt beds at the Goderich mine, Sifto Salt (1960)
Limited ---------------------------- 32
TABLESI—Subdivisions of the Salina Formation -------------- 7
II—Ontario Salt Production -------------------- 13III—Consumption of Salt in Specified Canadian Industries ------- 14IV—Production, Imports, Exports, and Consumption of Salt - - - - - - 14V—Ontario Brine Producers -------------------- 22
VI—Log of Typical Drillhole—Goderich Mine ------------ 33VII—Midrim Mining Company Limited—Adelaide Salt Lease Drilling - —
Final Assay Results --------------------- 33VIII—Midrim Mining Company Limited—Log of Drillhole No. 5 - - - - - 34
I——Storage of Liquid Petroleum Gas ---------------- 35
FIGURES
1—Southwestern Ontario, showing locations of areas and centres referred toin report ------------------------- 2
2—Distribution of salt in southwestern Ontario ------------ 33—Regional geology of southwestern Ontario ------------- 44—Generalized columnar geological section for southwestern Ontario - - - 55—Subdivision of the Salina Formation ---------------- 66—Structure section showing non-deposition of A2 salt, Corunna pool reef 97—North-South section, Plympton, Enniskillen, and Dawn townships - - - 108—Structure section showing removal of salt and subsidence, Sarnia area 119—Tully method of brine-well operation --------------- 15
10—Detroit method of brine-well operation -------------- 1711—Use of air pad method of joining to nearby wells - ---------- 1812—Brine-field layout for series of wells joined by hydraulic fracturing - - - 19
MAP CASE (At Back of Report)
ChartA—Isopachs of the Lower Salt Bed in southwestern Ontario, showing total salt
thicknesses. B—Isopachs of the Upper Salt Beds in southwestern Ontario, showing total salt
thicknesses.C—Section from Sarnia eastward toward London showing thinning of salt beds. D—Section eastward from Goderich showing thinning of salt beds. E—Salt Well Sections—Southwestern Ontario.
iv
SALT IN ONTARIOBY
D. F. Hewitt1
I—Introduction
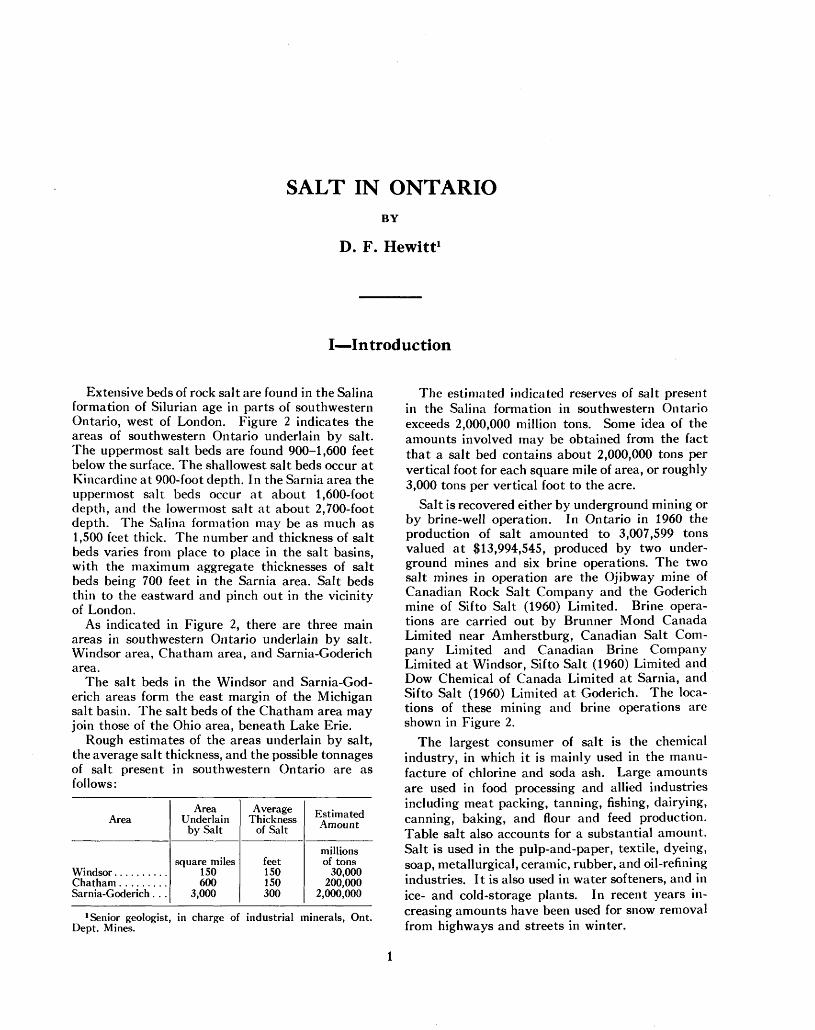
Extensive beds of rock salt are found in the Salina formation of Silurian age in parts of southwestern Ontario, west of London. Figure 2 indicates the areas of southwestern Ontario underlain by salt. The uppermost salt beds are found 900-1,600 feet below the surface. The shallowest salt beds occur at Kincardine at 900-foot depth. In the Sarnia area the uppermost salt beds occur at about 1,600-foot depth, and the lowermost salt at about 2,700-foot depth. The Salina formation may be as much as 1,500 feet thick. The number and thickness of salt beds varies from place to place in the salt basins, with the maximum aggregate thicknesses of salt beds being 700 feet in the Sarnia area. Salt beds thin to the eastward and pinch out in the vicinity of London.
As indicated in Figure 2, there are three main areas in southwestern Ontario underlain by salt. Windsor area, Chatham area, and Sarnia-Goderich area.
The salt beds in the Windsor and Sarnia-God erich areas form the east margin of the Michigan salt basin. The salt beds of the Chatham area may join those of the Ohio area, beneath Lake Erie.
Rough estimates of the areas underlain by salt, the average salt thickness, and the possible tonnages of salt present in southwestern Ontario are as follows:
Area
Sarnia-Goderich . . .
Area Underlain by Salt
square miles 150600
3,000
Average Thickness
of Salt
feet 150150300
Estimated Amount
millions of tons
30,000200,000
2,000,000
1 Senior geologist, in charge of industrial minerals, Ont. Dept. Mines.
The estimated indicated reserves of salt present in the Salina formation in southwestern Ontario exceeds 2,000,000 million tons. Some idea of the amounts involved may be obtained from the fact that a salt bed contains about 2,000,000 tons per vertical foot for each square mile of area, or roughly 3,000 tons per vertical foot to the acre.
Salt is recovered either by underground mining or by brine-well operation. In Ontario in 1960 the production of salt amounted to 3,007,599 tons valued at #13,994,545, produced by two under ground mines and six brine operations. The two salt mines in operation are the Ojibway mine of Canadian Rock Salt Company and the Goderich mine of Sifto Salt (1960) Limited. Brine opera tions are carried out by Brunner Mond Canada Limited near Amherstburg, Canadian Salt Com pany Limited and Canadian Brine Company Limited at Windsor, Sifto Salt (1960) Limited and Dow Chemical of Canada Limited at Sarnia, and Sifto Salt (1960) Limited at Goderich. The loca tions of these mining and brine operations are shown in Figure 2.
The largest consumer of salt is the chemical industry, in which it is mainly used in the manu facture of chlorine and soda ash. Large amounts are used in food processing and allied industries including meat packing, tanning, fishing, dairying, canning, baking, and flour and feed production. Table salt also accounts for a substantial amount. Salt is used in the pulp-and-paper, textile, dyeing, soap, metallurgical, ceramic, rubber, and oil-refining industries. It is also used in water softeners, and in ice- and cold-storage plants. In recent years in creasing amounts have been used for snow removal from highways and streets in winter.
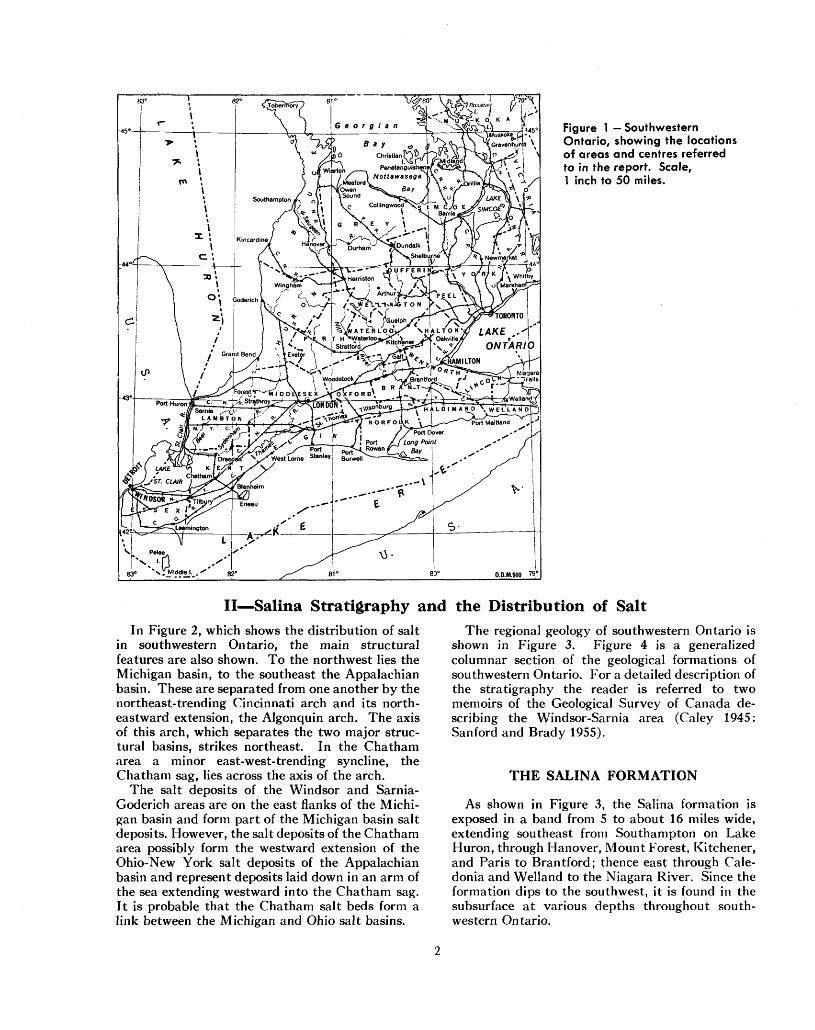
Figure l Southwestern Ontario, showing the locations of areas and centres referred to in the report. Scale, l inch to 50 miles.
—Salina Stratigraphy and the Distribution of SaltIn Figure 2, which shows the distribution of salt
in southwestern Ontario, the main structural features are also shown. To the northwest lies the Michigan basin, to the southeast the Appalachian basin. These are separated from one another by the northeast-trending Cincinnati arch and its north eastward extension, the Algonquin arch. The axis of this arch, which separates the two major struc tural basins, strikes northeast. In the Chatham area a minor east-west-trend ing syncline, the Chatham sag, lies across the axis of the arch.
The salt deposits of the Windsor and Sarnia- Goderich areas are on the east flanks of the Michi gan basin and form part of the Michigan basin salt deposits. However, the salt deposits of the Chatham area possibly form the westward extension of the Ohio-New York salt deposits of the Appalachian basin and represent deposits laid down in an arm of the sea extending westward into the Chatham sag. It is probable that the Chatham salt beds form a link between the Michigan and Ohio salt basins.
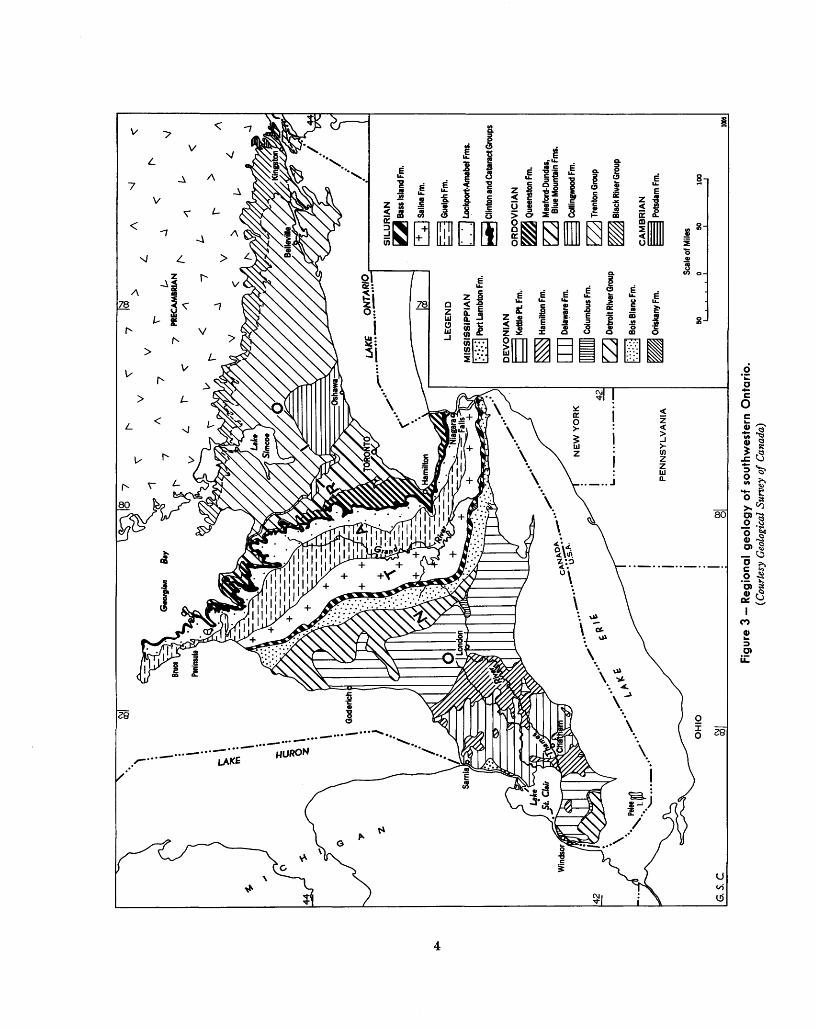
The regional geology of southwestern Ontario is shown in Figure 3. Figure 4 is a generalized columnar section of the geological formations of southwestern Ontario. For a detailed description of the stratigraphy the reader is referred to two memoirs of the Geological Survey of Canada de scribing the Windsor-Sarnia area (Caley 1945: Sanford and Brady 1955).
THE SALINA FORMATION
As shown in Figure 3, the Salina formation is exposed in a band from 5 to about 16 miles wide, extending southeast from Southampton on Lake Huron, through Hanover, Mount Forest, Kitchener, and Paris to Brantford; thence east through Cale donia and Welland to the Niagara River. Since the formation dips to the southwest, it is found in the subsurface at various depths throughout south western Ontario.
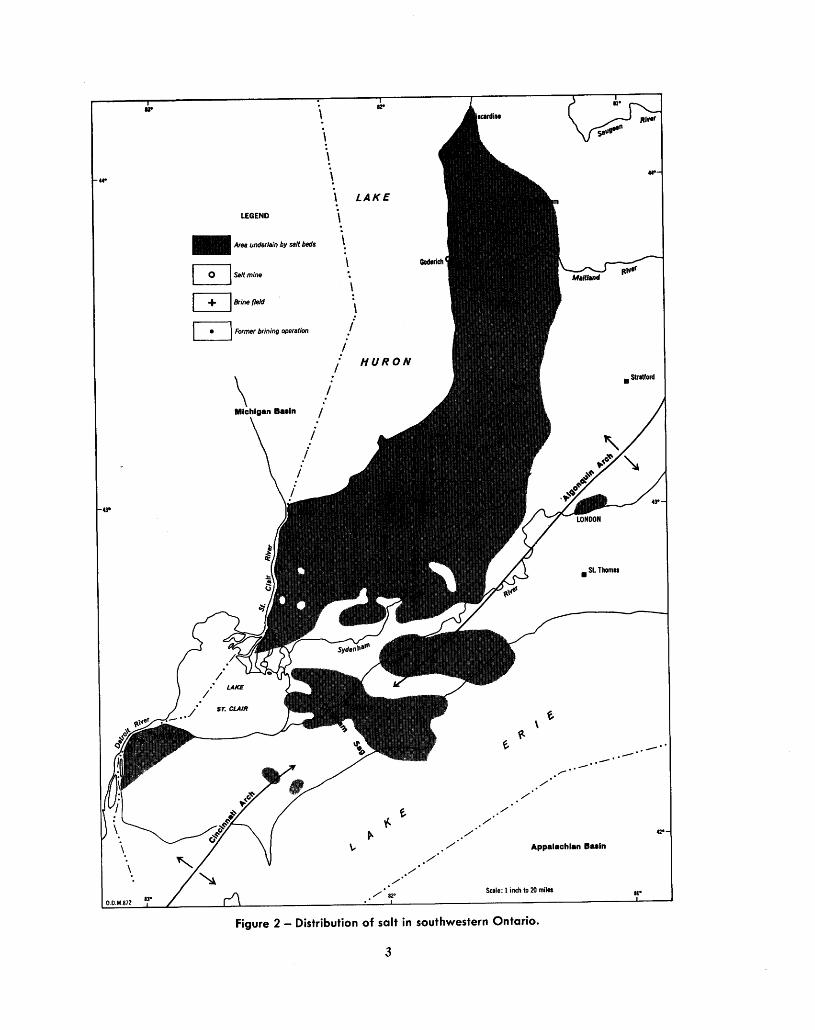
Figure 2 - Distribution of salt in southwestern Ontario.
3
500-
1 COO-
1500-
2000-
2500-
3500-
4000
225
'
hh
6
S! *
ft#
ft
*
V.
*
i-T"--^.-^l"
5-z-z
i*H*
j^|// — /~ y —
ST/T'±: ± : ±'
ffii^te3^5; 'r i
^^•— ; .-s-.- r^-:
:^f:
Iff•f -~±
~^—~—~
i — ii - i^y ̂l . \t i
———•.T.-J-.-I-:
KS/\ ^ vi
POST MMflTON
KETTLE POINT
HAMILTON
DUNDEE
DETROIT RIVER
BOIS BLANC
' ORISKANYBASS ISLAND
F
E
^r- SAUNA
B
A-2
A-i
GUELPH, LOCKPORT-AMABEL
CUNTON
CATARACT
QUEENSTON
MEAFORD-DUNDAS, BLUE MOUNTAIN
GLOUCESTER: 'COLLINGWOOD'
TRENTON-BLACK RIVER'
METAMORPHOSED ROCKS
AND MISSISSIPPIAN
Z <
0s0
z< tt.J55
<ooQ
0
PRECAMBRIAN
li 'J Limestone
•j- i -j"! Shaly limestone
- •''•'•'l Sandy limestone
\ f '\ DolomiteLt ——— iJ
[y^^l Shtly dolomite——
L'/- - 0-1 S*"^ dolomite
[•-- | S/wt/.
|rV'-r'.| Sane^ s/ia'e or shaly sandstone
|.;.'.V.| Sandstone
1 '-^; .'-TJ-.'l Sandstone, limestone,
HH8 EvaporAes
QU cw1^. ^ >i.| Metamorphosed rocks
G.S.C.
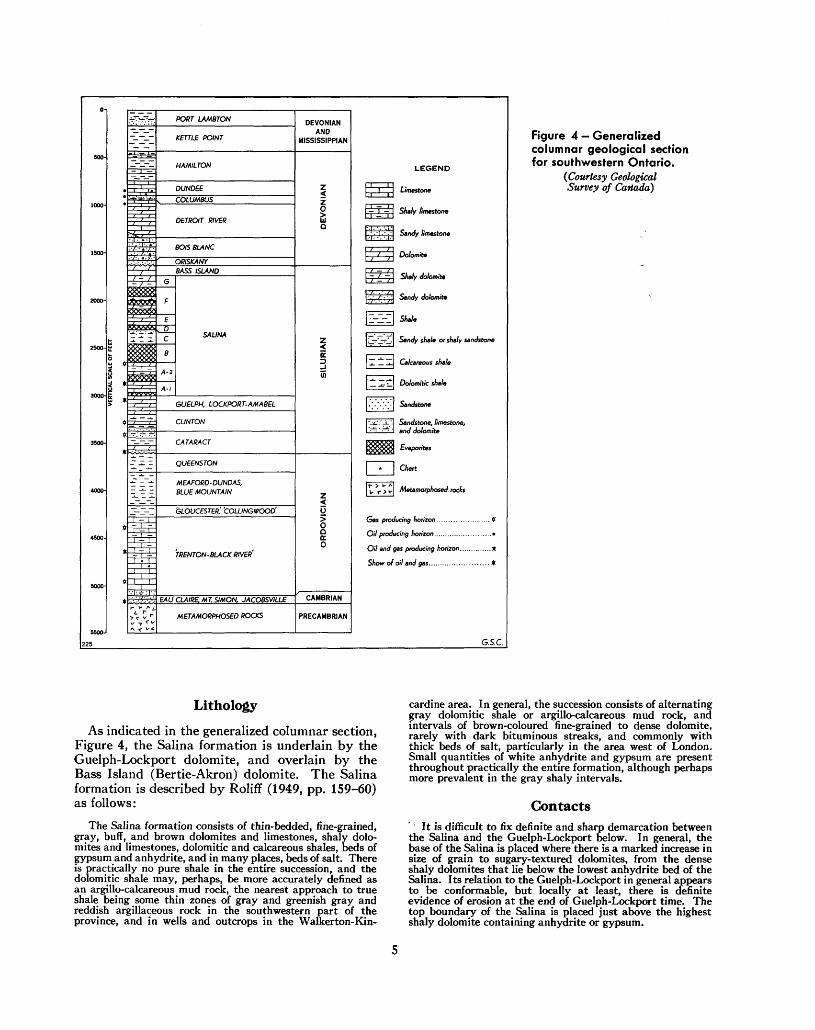
Figure 4 - Generalized columnar geological section for southwestern Ontario.
(Courtesy Geological Survey of Caiiada)
LithologyAs indicated in the generalized columnar section,
Figure 4, the Salina formation is underlain by the Guelph-Lockport dolomite, and overlain by the Bass Island (Bertie-Akron) dolomite. The Salina formation is described by Roliff (1949, pp. 159-60) as follows:
The Salina formation consists of thin-bedded, fine-grained, gray, buff, and brown dolomites and limestones, shaly dolo mites and limestones, dolomitic and calcareous shales, beds of gypsum and anhydrite, and in many places, beds of salt. There is practically no pure shale in the entire succession, and the dolomitic shale may, perhaps, be more accurately defined as an argillp-calcareous mud rock, the nearest approach to true shale being some thin zones of gray and greenish gray and reddish argillaceous rock in the southwestern part of the province, and in wells and outcrops in the Walkerton-Kin-
cardine area. In general, the succession consists of alternating gray dolomitic shale or argillo-calcareous mud rock, and intervals of brown-coloured fine-grained to dense dolomite, rarely with dark bituminous streaks, and commonly with thick beds of salt, particularly in the area west of London. Small quantities of white anhydrite and gypsum are present throughout practically the entire formation, although perhaps more prevalent in the gray shaly intervals.
ContactsIt is difficult to fix definite and sharp demarcation between
the Salina and the Guelph-Lockport below. In general, the base of the Salina is placed where there is a marked increase in size of grain to sugary-textured dolomites, from the dense shaly dolomites that lie below the lowest anhydrite bed of the Salina. Its relation to the Guelph-Lockport in general appears to ( be conformable, but locally at least, there is definite evidence of erosion at the end of Guelph-Lockport time. The top boundary of the Salina is placed just above the highest shaly dolomite containing anhydrite or gypsum.
Limestone
Shaly dolomite
Anhydrite
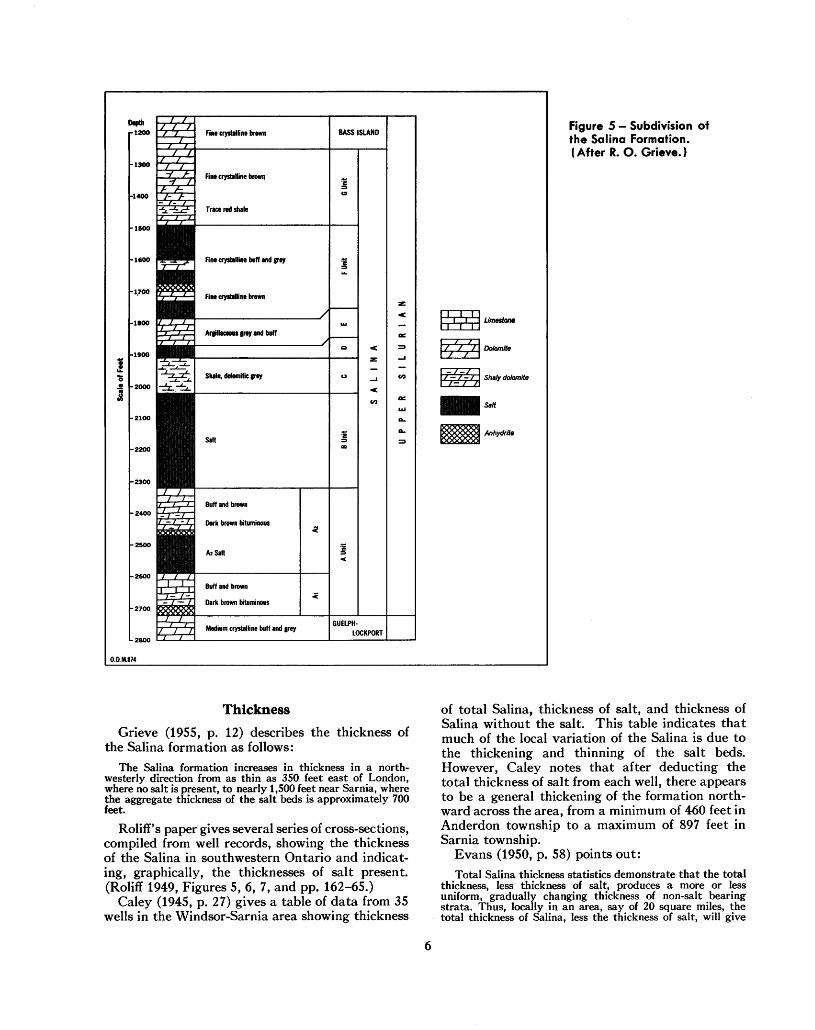
Figure 5 — Subdivision of the Salina Formation. (After R. O. Grieve.}
ThicknessGrieve (1955, p. 12) describes the thickness of
the Salina formation as follows:The Salina formation increases in thickness in a north
westerly direction from as thin as 350 feet east of London, where no salt is present, to nearly 1,500 feet near Sarnia, where the aggregate thickness of the salt beds is approximately 700 feet.
Roliff's paper gives several series of cross-sections, compiled from well records, showing the thickness of the Salina in southwestern Ontario and indicat ing, graphically, the thicknesses of salt present. (Roliff 1949, Figures 5, 6, 7, and pp. 162-65.)
Caley (1945, p. 27) gives a table of data from 35 wells in the Windsor-Sarnia area showing thickness
of total Salina, thickness of salt, and thickness of Salina without the salt. This table indicates that much of the local variation of the Salina is due to the thickening and thinning of the salt beds. However, Caley notes that after deducting the total thickness of salt from each well, there appears to be a general thickening of the formation north ward across the area, from a minimum of 460 feet in Anderdon township to a maximum of 897 feet in Sarnia township.
Evans (1950, p. 58) points out:Total Salina thickness statistics demonstrate that the total
thickness, less thickness of salt, produces a more or less uniform, gradually changing thickness of non-salt bearing strata. Thus, locally in an area, say of 20 square miles, the total thickness of Salina, less the thickness of salt, will give
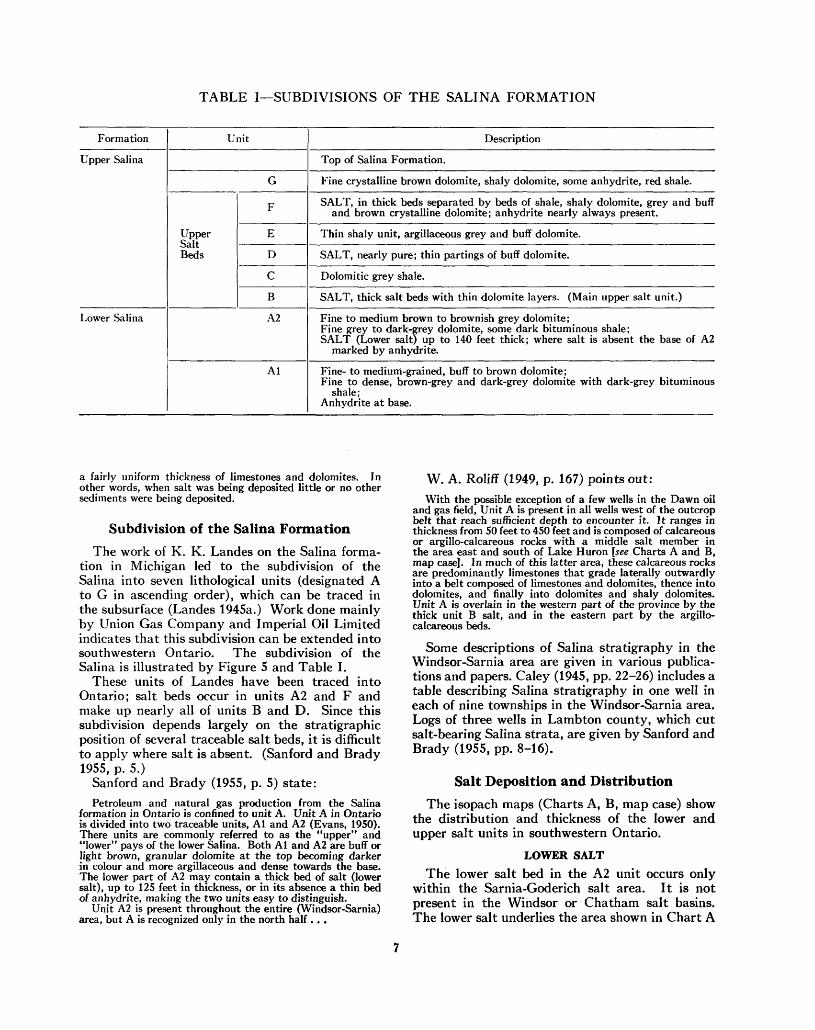
TABLE I—SUBDIVISIONS OF THE SALINA FORMATION
Formation
Upper Salina
Lower Salina
Unit
G
F
Upper E "^nil-Beds D
C
B
A2
Al
Description
Top of Salina Formation.
Fine crystalline brown dolomite, shaly dolomite, some anhydrite, red shale.
SALT, in thick beds separated by beds of shale, shaly dolomite, grey and and brown crystalline dolomite; anhydrite nearly always present.
buff
Thin shaly unit, argillaceous grey and buff dolomite.
SALT, nearly pure; thin partings of buff dolomite.
Dolomitic grey shale.
SALT, thick salt beds with thin dolomite layers. (Main upper salt unit.)
Fine to medium brown to brownish grey dolomite; Fine grey to dark-grey dolomite, some dark bituminous shale; SALT (Lower salt) up to 140 feet thick; where salt is absent the base of A2
marked by anhydrite.
Fine- to medium-grained, buff to brown dolomite; Fine to dense, brown-grey and dark-grey dolomite with dark-grey bituminous
shale; Anhydrite at base.
a fairly uniform thickness of limestones and dolomites. In other words, when salt was being deposited little or no other sediments were being deposited.
Subdivision of the Salina FormationThe work of K. K. Landes on the Salina forma
tion in Michigan led to the subdivision of the Salina into seven lithological units (designated A to G in ascending order), which can be traced in the subsurface (Landes 1945a.) Work done mainly by Union Gas Company and Imperial Oil Limited indicates that this subdivision can be extended into southwestern Ontario. The subdivision of the Salina is illustrated by Figure 5 and Table I.
These units of Landes have been traced into Ontario; salt beds occur in units A2 and F and make up nearly all of units B and D. Since this subdivision depends largely on the stratigraphic position of several traceable salt beds, it is difficult to apply where salt is absent. (Sanford and Brady 1955, p. 5.)
Sanford and Brady (1955, p. 5) state:Petroleum and natural gas production from the Salina
formation in Ontario is confined to unit A. Unit A in Ontario is divided into two traceable units, A l and A2 (Evans, 1950). There units are commonly referred to as the "upper" and "lower" pays of the lower Salina. Both Al and A2 are buff or light brown, granular dolomite at the top becoming darker in colour and more argillaceous and dense towards the base. The lower part of A2 may contain a thick bed of salt (lower salt), up to 125 feet in thickness, or in its absence a thin bed of anhydrite, making the two units easy to distinguish.
Unit A2 is present throughout the entire (Windsor-Sarnia) area, but A is recognized only in the north half . . .
W. A. Roliff (1949, p. 167) points out:With the possible exception of a few wells in the Dawn oil
and gas field, Unit A is present in all wells west of the outcrop belt that reach sufficient depth to encounter it. It ranges in thickness from 50 feet to 450 feet and is composed of calcareous or argillo-calcareous rocks with a middle salt member in the area east and south of Lake Huron [see Charts A and B, map case]. In much of this latter area, these calcareous rocks are predominantly limestones that grade laterally outwardly into a belt composed of limestones and dolomites, thence into dolomites, and finally into dolomites and shaly dolomites. Unit A is overlain in the western part of the province by the thick unit B salt, and in the eastern part by the argillo- calcareous beds.
Some descriptions of Salina stratigraphy in the Windsor-Sarnia area are given in various publica tions and papers. Caley (1945, pp. 22-26) includes a table describing Salina stratigraphy in one well in each of nine townships in the Windsor-Sarnia area. Logs of three wells in Lambton county, which cut salt-bearing Salina strata, are given by Sanford and Brady (1955, pp. 8-16).
Salt Deposition and DistributionThe isopach maps (Charts A, B, map case) show
the distribution and thickness of the lower and upper salt units in southwestern Ontario.
LOWER SALTThe lower salt bed in the A2 unit occurs only
within the Sarnia-Goderich salt area. It is not present in the Windsor or Chatham salt basins. The lower salt underlies the area shown in Chart A
(map case) within the Sarnia-Goderich area. The salt bed has a maximum thickness of 140 feet in the Sarnia area and extends as far south as Wallace burg where it pinches out. To the east of Sarnia it extends almost to Strathroy before pinching out. As indicated on the map, the lower salt thins or is absent over a number of "pinnacle" reefs in the Guelph formation southeast of Sarnia.
UPPER SALT BEDS
The upper salt beds include units B and D, and parts of unit F. Units B and D are almost entirely salt, and several salt beds may occur in unit F. Unit B is the thickest salt bed and in places exceeds 300 feet in thickness. Chart B (map case) is an isopach map showing the aggregate thickness of the upper salts in southwestern Ontario.
Windsor Area
As indicated on Chart B, salt beds underlie an area of about 105 square miles in the Windsor area. The upper salt beds have a maximum total thick ness of about 300 feet along the Detroit River south of Windsor; they thin to the southeast and pinch out about 12 miles to the south and east of Windsor. The B and D salt units are present, as are salt beds of the F unit. The Ojibway mine is in the F unit. Brine wells have been operated in B, D, and F salt beds in this area.
Chatham Area
Chart B indicates a salt-free area, extending eastward from Lake St. Clair through Dresden and Bothwell, which separates the salt of the Chatham basin from the extensive salt deposits of the Sarnia- Goderich area to the north. Evans (1950, p. 63) suggests that this salt-free band "apparently existed as a ridge over which no salt ever was deposited." This ridge might then have separated the Chatham salt of the Appalachian basin from the Sarnia-Goderich salt beds of the Michigan basin.
The salt beds of the Chatham area underlie a land area of over 300 square miles and extend for an undetermined distance under Lake Erie.
Grieve (1955, p. 12) states that only the B salt is present in the Chatham salt basin. In the vicinity of Chatham, as indicated on Chart B, the salt thickness in places exceeds 200 feet. A thick salt zone extends east-west through Chatham. A second thick salt zone extends east-west through Thamesville and Rodney, with a salt-free area between that divides the Chatham salt area into two minor basins.
Sarnia-Goderich AreaThe most extensive salt deposits in Ontario are
those of the Sarnia-Goderich area. As indicated on Chart B, salt beds underlie a land area of more than 3,000 square miles. Salt beds occur in the A2, B, D, and F units of the Salina formation in the Sarnia- Goderich area. As shown in the generalized struc ture section eastward from Sarnia (Chart C), the salt beds thin to the east of Sarnia, with the F, D, and A2 salt beds disappearing first. In the Sarnia area the upper salt beds have an aggregate thickness of over 550 feet, while the lower salt (A2) has a thickness of over 140 feet, giving a total salt thickness of about 700 feet.
Chart D is a section eastward from Goderich, showing the progressive thinning and pinching out of the salt beds to the east. The B salt horizon persists farthest.
In addition to the regional changes in thicknesses of salt beds due to their position in the salt basins, there are minor local variations, apparent on Chart B, which are due to local thinning or non-deposition or removal of salt beds. These local variations in salt deposition are apparently due either to thinning or non-deposition of salt over buried hills on the Guelph floor of the lower Salina sea or to later leaching and removal of salt by solution.
NON-DEPOSITION OF SALT OVER GUELPH REEFS
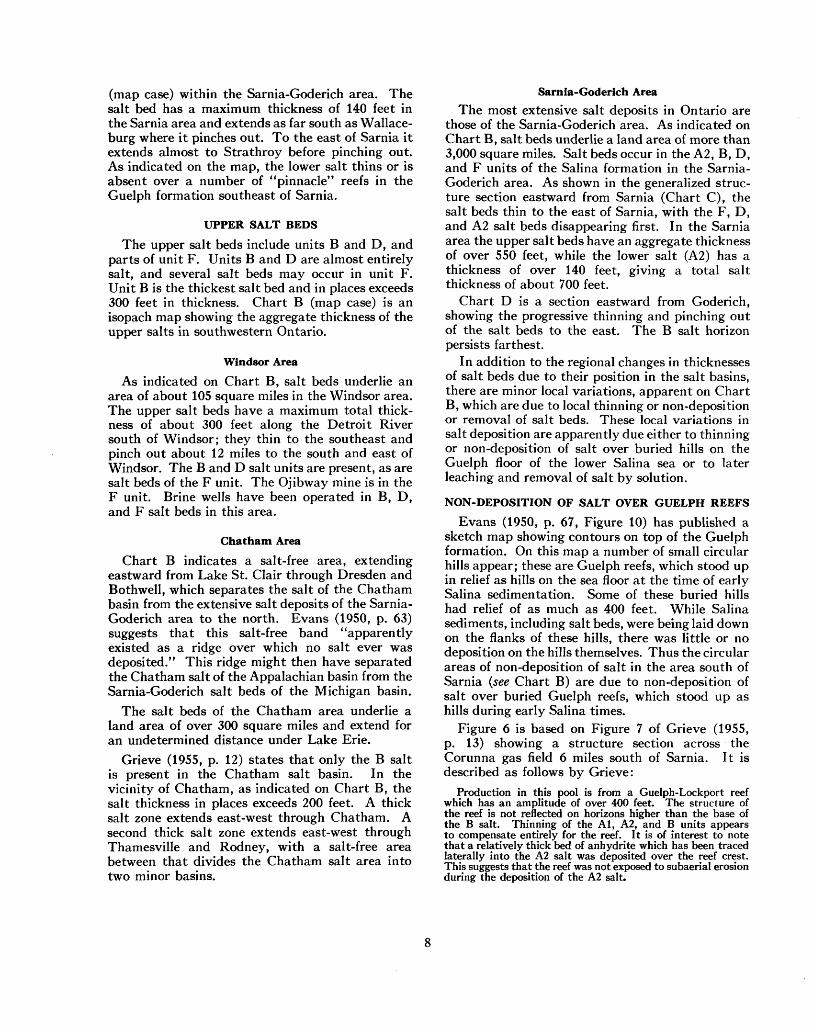
Evans (1950, p. 67, Figure 10) has published a sketch map showing contours on top of the Guelph formation. On this map a number of small circular hills appear; these are Guelph reefs, which stood up in relief as hills on the sea floor at the time of early Salina sedimentation. Some of these buried hills had relief of as much as 400 feet. While Salina sediments, including salt beds, were being laid down on the flanks of these hills, there was little or no deposition on the hills themselves. Thus the circular areas of non-deposition of salt in the area south of Sarnia (see Chart B) are due to non-deposition of salt over buried Guelph reefs, which stood up as hills during early Salina times.
Figure 6 is based on Figure 7 of Grieve (1955, p. 13) showing a structure section across the Corunna gas field 6 miles south of Sarnia. It is described as follows by Grieve:
Production in this pool is from a Guelph-Lockport reef which has an amplitude of over 400 feet. The structure of the reef is not reflected on horizons higher than the base of the B salt. Thinning of the Al, A2, and B units appears to compensate entirely for the reef. It is of interest to note that a relatively thick bed of anhydrite which has been traced laterally into the A2 salt was deposited over the reef crest. This suggests that the reef was not exposed to subaerial erosion during the deposition of the A2 salt.
Corunna No. 9O
Corunna No. 4
Corunna No. 11
Anhydrite
EastDRIFT
[KETTLE POINT HAMILTON
' DUNDEEDETROIT RIVER AND OLDER DEVONIAN
BASS ISLAND
B Unit
Ai Unit GUELPH-LOCKPORT
Scale of FeetO 500
Figure 6 — Structure section showing non- deposition of A2 salt, Corunna pool reef. (After R. O. Grieve.)
In discussing the Guelph reefs, Evans (1950, p. 76) states:
So far 13 "pinnacle" type reefs have been found . . . . . In all but three of these the relief above the surrounding Guelph ranged from 150 to 400 feet. Eleven of these reefs occur where the surrounding Guelph-Lockport is from 80 to 180 feet thick. The reef with the greatest relief (400 feet) shows thicknesses of 74 feet, 88 feet, and 95 feet of Guelph-Lockport around it. Two others with relief of 300 feet occur further south, where the Guelph-Lockport around them has a total thickness of 90 to 125 feet. Still further south two reefs with a relief of 150 feet have Guelph-Lockport thicknesses of about 150 feet around them. This suggests to the writer that these reefs, more resistant to erosion than the non-reef Guelph- Lockport dolomites, were etched out by pre-Salina erosion.
LEACHING AND SUBSIDENCEWithin the Sarnia salt basin (see Chart B) north
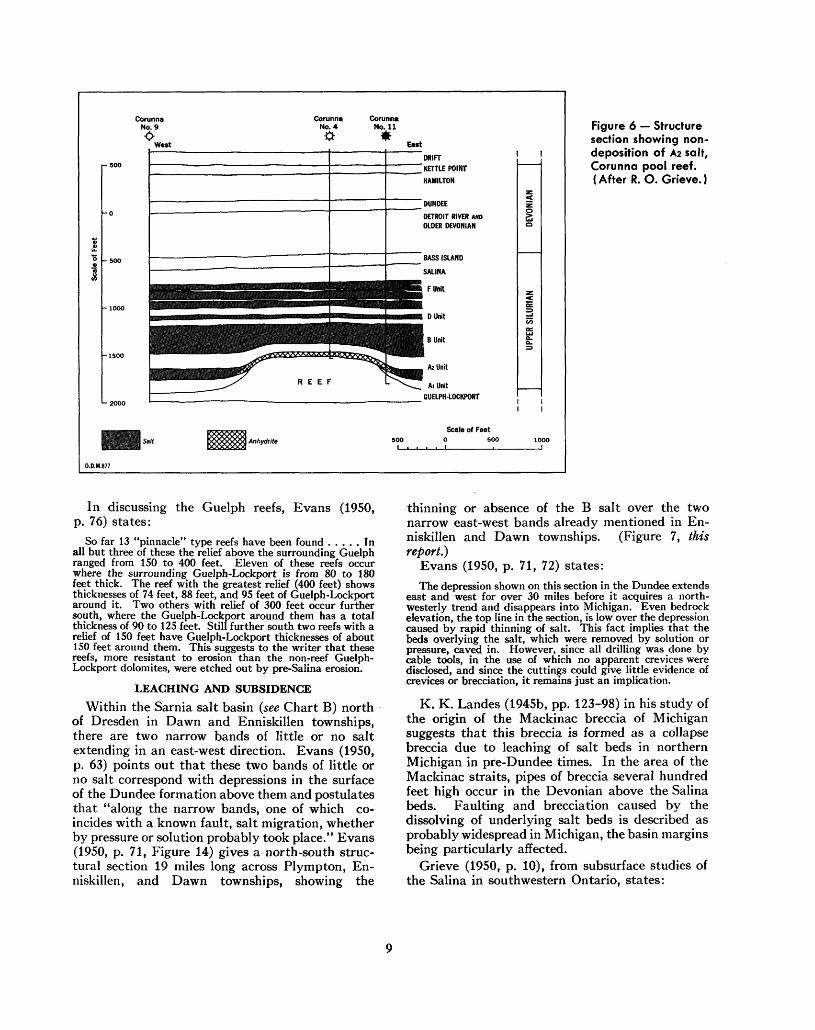
of Dresden in Dawn and Enniskillen townships, there are two narrow bands of little or no salt extending in an east-west direction. Evans (1950, p. 63) points out that these two bands of little or no salt correspond with depressions in the surface of the Dundee formation above them and postulates that "along the narrow bands, one of which co incides with a known fault, salt migration, whether by pressure or solution probably took place." Evans (1950, p. 71, Figure 14) gives a north-south struc tural section 19 miles long across Plympton, En niskillen, and Dawn townships, showing the
thinning or absence of the B salt over the two narrow east-west bands already mentioned in En niskillen and Dawn townships. (Figure 7, this report.)
Evans (1950, p. 71, 72) states:The depression shown on this section in the Dundee extends
east and west for over 30 miles before it acquires a north westerly trend and disappears into Michigan. Even bedrock elevation, the top line in the section, is low over the depression caused by rapid thinning of salt. This fact implies that the beds overlying the salt, which were removed by solution or pressure, caved in. However, since all drilling was done by cable tools, in the use of which no apparent crevices were disclosed, and since the cuttings could give little evidence of crevices or brecciation, it remains just an implication.
K. K. Landes (1945b, pp. 123-98) in his study of the origin of the Mackinac breccia of Michigan suggests that this breccia is formed as a collapse breccia due to leaching of salt beds in northern Michigan in pre-Dundee times. In the area of the Mackinac straits, pipes of breccia several hundred feet high occur in the Devonian above the Salina beds. Faulting and brecciation caused by the dissolving of underlying salt beds is described as probably widespread in Michigan, the basin margins being particularly affected.
Grieve (1950, p. 10), from subsurface studies of the Salina in southwestern Ontario, states:
SouthFigure 7 - North-south section, Plympton, Enniskillen, and Dawn townships. (After C. S. Evans.)
Within the salt basin(s) numerous areas, which range from a few hundred acres to many square miles, are noted for the complete absence of, or a marked thinning of, salt beds. Subsurface data from many of these areas indicate that salt was deposited and later removed. Subsidence of the overlying strata is attested by the structural features now present.
Locally, removal of salt appears to have been related to flexures or faults which, through fracturing, may have pro vided access to the salt-beds for solvent waters. Subsidence occurred as early as late Salina time and continued intermit tently until after Hamilton time.
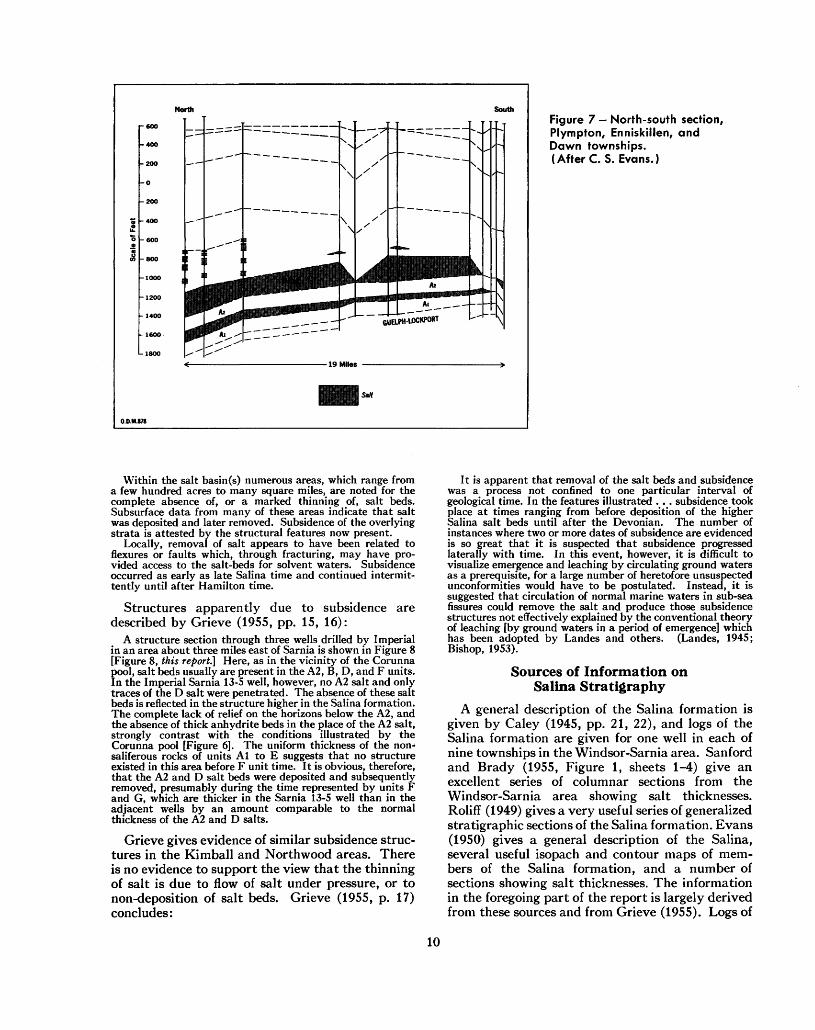
Structures apparently due to subsidence are described by Grieve (1955, pp. 15, 16):
A structure section through three wells drilled by Imperial in an area about three miles east of Sarnia is shown in Figure 8 [Figure 8, this report.] Here, as in the vicinity of the Corunna pool, salt beds usually are present in the A2, B, D, and F units. In the Imperial Sarnia 13-5 well, however, no A2 salt and only traces of the D salt were penetrated. The absence of these salt beds is reflected in the structure higher in the Salina formation. The complete lack of relief on the horizons below the A2, and the absence of thick anhydrite beds in the place of the A2 salt, strongly contrast with the conditions illustrated by the Corunna pool [Figure 6]. The uniform thickness of the non- saliferous rocks of units A l to E suggests that no structure existed in this area before F unit time. It is obvious, therefore, that the A2 and D salt beds were deposited and subsequently removed, presumably during the time represented by units F and G, which are thicker in the Sarnia 13-5 well than in the adjacent wells by an amount comparable to the normal thickness of the A2 and D salts.
Grieve gives evidence of similar subsidence struc tures in the Kimball and Northwood areas. There is no evidence to support the view that the thinning of salt is due to flow of salt under pressure, or to non-deposition of salt beds. Grieve (1955, p. 17) concludes:
It is apparent that removal of the salt beds and subsidence was a process not confined to one particular interval of geological time. In the features illustrated . . . subsidence took place at times ranging from before deposition of the higher Salina salt beds until after the Devonian. The number of instances where two or more dates of subsidence are evidenced is so great that it is suspected that subsidence progressed laterally with time. In this event, however, it is difficult to visualize emergence and leaching by circulating ground waters as a prerequisite, for a large number of heretofore unsuspected unconformities would have to be postulated. Instead, it is suggested that circulation of normal marine waters in sub-sea fissures could remove the salt and produce those subsidence structures not effectively explained by the conventional theory of leaching [by ground waters in a period of emergence] which has been adopted by Landes and others. (Landes, 1945; Bishop, 1953).
Sources of Information on Salina Stratigraphy
A general description of the Salina formation is given by Caley (1945, pp. 21, 22), and logs of the Salina formation are given for one well in each of nine townships in the Windsor-Sarnia area. Sanford and Brady (1955, Figure l, sheets 1-4) give an excellent series of columnar sections from the Windsor-Sarnia area showing salt thicknesses. Roliff (1949) gives a very useful series of generalized stratigraphic sections of the Salina formation. Evans (1950) gives a general description of the Salina, several useful isopach and contour maps of mem bers of the Salina formation, and a number of sections showing salt thicknesses. The information in the foregoing part of the report is largely derived from these sources and from Grieve (1955). Logs of
10
Imperial Sarnia No. 14-5
Imperial Sarnia No. 13-5
Imperial Sarnia No. 12-5
Scale of Feet500 O 500 100O 1500
Figure 8 — Structure section showing removal of salt and subsidence, Sarnia area.(After R. O. Grieve.)
oil and gas wells drilled in southwestern Ontario are on file at the offices of the Ontario Department of Energy Resources and are an important source of information on salt in the Salina formation.
Characteristics of Salina Salt BedsThe characteristics and origin of the Salina salt
beds of Michigan are described by Dellwig (1955, pp. 83-110): salt layers, 3-8 centimetres thick, alternate with tissue-thin laminae of anhydrite and dolomite; the anhydrite is generally darker in colour. Dellwig reports that some quartz, pyrite, celestite, polyhalite, and carbonaceous material may be present. Complex salts are rare, and pre cipitation apparently terminated before the de velopment of the polyhalite phase in the theoretical sequence of salt deposition.
It is pointed out that the thickening of the Salina salt toward the centre of the Michigan basin, to gether with the great salt thickness present, indicates subsidence during Salina deposition. These features also necessitate addition of brine during salt deposition. Contemporaneous salt and gypsum beds are found in eastern Ohio and New York states, and this presents the possibility that there was brine replenishment in the Michigan basin from the New York basin. Apparently a delicate balance was maintained between sinking, evapora tion, and supply so that at no time did evaporation approach completion.
Dellwig describes the banded salt as composed of three units: carbonate and sulphate laminae, clear salt, and cloudy salt. Cloudy zones contain abun dant liquid inclusions, while the clear salt is com paratively inclusion-free. Pyrite and carbonaceous material are localized along the anhydrite-dolomite laminae and indicate a reducing environment. At the Detroit mine, dolomite is mainly concentrated in crude, discontinuous layers. The low percentage of insolubles in the salt beds indicates evaporation and deposition from a concentrated brine.
Dellwig points out that for deposition of banded salt certain conditions must be established: the main mass of brine must be concentrated to a point at least near saturation, so that most of the dolomite and anhydrite deposited with the banded salt must come from the inflowing water intermittently added to the basin. Before the saturation point of NaCl is reached, all the CaCOa and about 90 percent of the CaSO4 are precipitated in that order. Under lying the salt, therefore, layers of dolomite and anhydrite might be expected.
Thick salt beds represent periods of influx of brine nearly depleted in CaCOs and CaSO4. The deposition of anhydrite-dolomite laminae is com pletely independent of the deposition of salt and may be considered due to an influx of brine into the basin of deposition. The presence of pyrite and carbonaceous material with these laminae is indica tive of this influx.
11
Conditions governing the deposition of CaSO4 were studied by Posnjak (1940, pp. 247-72). Anhydrite rather than gypsum will precipitate above 420C. regardless of the brine concentration of NaCl; if sea water has an NaCl concentration of 4.8 times normal at 300C., then anhydrite will deposit instead of gypsum, Dellwig points out that although dolomite-anhydrite laminae may be ac counted for by an influx of water into the basin, the alternation of dolomite and anhydrite is not readily explained. Increases in salinity or temperature will cause a decrease in carbonate solubility.
A study of inclusions in the salt indicates a range of temperature of deposition for the halite of 32 0-48.40C.
An earlier paper by Kaufmann and Slawson (1950, pp. 24, 25) describes features of the Salina salt beds in Michigan as follows:
A feature to be emphasized is the varvelike stratification of the salt beds . . . Each of the individual stratification bands is very persistent throughout the entire [Detroit] mine, showing only minor variations of spacing or intensity . . . The bands range from an almost imperceptible brown tint to dark brown or black . . . If the face of the salt is sprayed with water and slowly dissolved away, the core of the dark bands begin to protrude. This core consists of either a single layer or several layers of paper-thin lamellae of white or gray anhydrite, separated by narrow zones of salt of variable thickness. The lamellae are in some cases crowded so close together as to be almost indistinguishable. A group of four or five may occur in a centimeter of vertical distance . . . Clear bands of white salt also contain thin anhydrite lamellae. The presence of . . . laminae of anhydrite in the main mass of . . . salt as well as in the dark bands indicates [frequent environmental
changes] . . . There is no regularity in vertical spacings of the dark bands.
This same paper describes ripple marks in the salt of the Salina formation at the Detroit mine (Kaufmann and Slawson 1950, pp. 27, 28):
The ripples [apparently] formed in a layer of fine granular, poorly coherent massive salt crystals . . . Because of the continuity, uniformity, and well developed character of these ripples, and the nature of the salt in which they were formed, the authors are of the opinion that they represent the develop ment of ripples by wave action upon unconsolidated salt resting on a bed of consolidated salt. The uniformity of the entire rock salt formation suggests the action took place some distance from a shoreline.
A more recent paper (Briggs 1958, pp. 46-56) gives the results of facies analyses in the Michigan basin. These indicate that:
1) The Michigan and Ohio-New York basins were separate evaporite basins, connected across the Findlay (Algonquin) arch, through the Chatham sag.
2) The principal inlet to the salt basins was in the vicinity of Georgian Bay in Ontario which connected the Michigan basin with the Arctic seaway.
3) A subsidiary channel flowed northward into the Michi gan basin through an inlet in the vicinity of Clinton, Michigan, connecting the basin with the southern Appalachian seaway, principally during Middle Salina times.
4) A persistent river flowed eastward into the Michigan basin in the vicinity of Ludington, Michigan.
This paper also includes informative maps of the distribution of evaporite facies in the Michigan and Ohio-New York basins; it also indicates replen ishment of brine in the Ohio-New York basin from the Michigan basin via the Chatham sag.
Ill—Salt Production
In 1960, Ontario salt production amounted to 3,007,599 tons valued at ft 13,994,545 from two salt mines and six brine well operations. This was 95 percent of the total Canadian production. Other Ontario production figures for salt, back to 1895, are given in Table II.
MARKETING SALTThe largest consumers of salt are the chemical
industries, who use salt in the manufacture of soda ash and chlorine. In Ontario in 1959, Brunner Mond Canada Limited, Canadian Brine Limited, and Dow Chemical of Canada Limited who produce brine wholly for chemical purposes, accounted for 52 percent of the total Ontario output. In addition, some of the production of the other salt companies is used by the chemical industry.
The amount of salt used for de-icing streets and highways has increased greatly in recent years, and this use now accounts for a substantial quantity of
coarse-mined rock salt. In 1959, the Ontario Department of Highways used about 170,000 tons for this purpose; the municipality of Metropolitan Toronto used more than 20,000 tons; Hamilton municipality used 12,000 tons; and other munici palities used proportionate amounts.
Table III, from the Dominion Bureau of Sta tistics publication on the Salt Industry in 1958, gives figures of salt consumption for various specific industries. It will be noted that the food processing industries, including meat packing, fish processing, baking, dairy, canning, brewing, and confectionery are major users of salt. Salt is also used in the tanning, pulp and paper, soap-making, metal lurgical, rubber, and oil-refining industries.
A large quantity of salt is now used in water softeners.
Table IV, also from the Dominion Bureau of Statistics, gives statistics on imports and exports of salt.
12
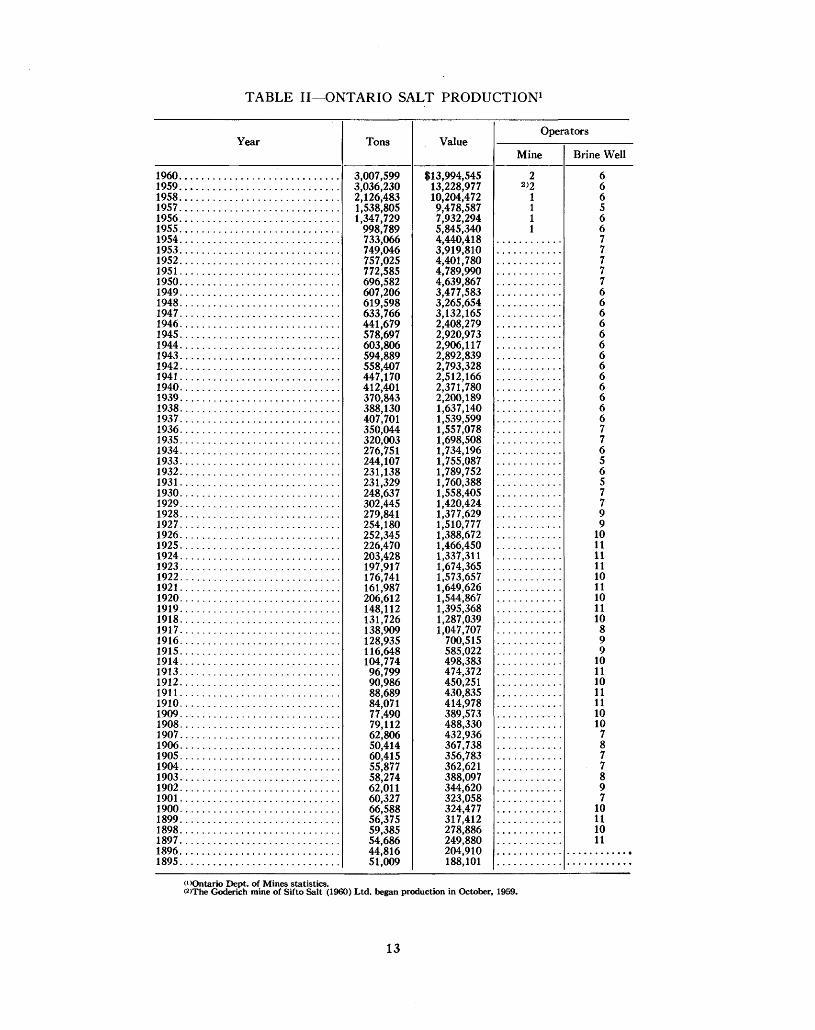
Year
1960.............................1959.............................1958.............................1957.............................1956.1955.............................1954.1953.............................1952.............................1951.... .... ............ ........ .1950.1949........................ .....1948.............................1947.... .........................1946..... ... . ............... .....1945.............................1944.............................1943.............................1942.............................1941.............................1940.1939.............................1938.............................1937.............................1936.............................1935.............................1934.1933.............................1932.......1931.............................1930.1929.............................1928.............................1927...1926.1925.............................1924.............................1923...1922. .... .... ... .... .... ....... ..1921.. . .... . ... .... ........... ...1920.1919.............................1918.............................1917.............................1916.............................1915....... . .... ........ ... ......1914... .... . ....... ....... .......1913. .... . ....... .... . .... ... ....1912.............................1911.. ... . .... ........ ...........1910.............................1909.............................1908.............................1907.............................1906.............................1905.............................1904.............................1903.............................1902.... ........... ........ ......19011900.......................... ...1899.1898.1897.............................1896.............................1895.............................
Tons
3,007,599 3,036,230 2,126,483 1,538,805 1,347,729
998,789 733,066 749,046 757,025 772,585 696,582 607,206 619,598 633,766 441,679 578,697 603,806 594,889 558,407 447,170 412,401 370,843 388,130 407,701 350,044 320,003 276,751 244,107 231,138 231,329 248,637 302,445 279,841 254,180 252,345 226,470 203,428 197,917 176,741 161,987 206,612 148,112 131,726 138,909 128,935 116,648 104,774 96,799 90,986 88,689 84,071 77,490 79,112 62,806 50,414 60,415 55,877 58,274 62,011 60,327 66,588 56,375 59,385 54,686 44,816 51,009
Value
11 3,994,545 13,228,977 10,204,472 9,478,587 7,932,294 5,845,340 4,440,418 3,919,810 4,401,780 4,789,990 4,639,867 3,477,583 3,265,654 3,132,165 2,408,279 2,920,973 2,906,117 2,892,839 2,793,328 2,512,166 2,371,780 2,200,189 1,637,140 1,539,599 1,557,078 1,698,508 1,734,196 1,755,087 1,789,752 1,760,388 1,558,405 1,420,424 1,377,629 1,510,777 1,388,672 1,466,450 1,337,311 1,674,365 1,573,657 1,649,626 1,544,867 1,395,368 1,287,039 1,047,707
700,515 585,022 498,383 474,372 450,251 430,835 414,978 389,573 488,330 432,936 367,738 356,783 362,621 388,097 344,620 323,058 324,477 317,412 278,886 249,880 204,910 188,101
Operators
Mine
22)2
1 1 1 1
Brine Well
6 6 6 5 6 6 7 7 7 7 7 6 6 6 6 6 6 6 6 6 6 6 6 6 7 7 6 5 6 5 7 7 9 9
10 11 11 11 10 11 10 11 10 8 9 9
10 11 10 11 11 10 10
7 8 7 7 8 9 7
10 11 10 11
(^Ontario Dept. of Mines statistics. (2)The Goderich mine of Sif to Salt (1960) Ltd. began production in October, 1959.
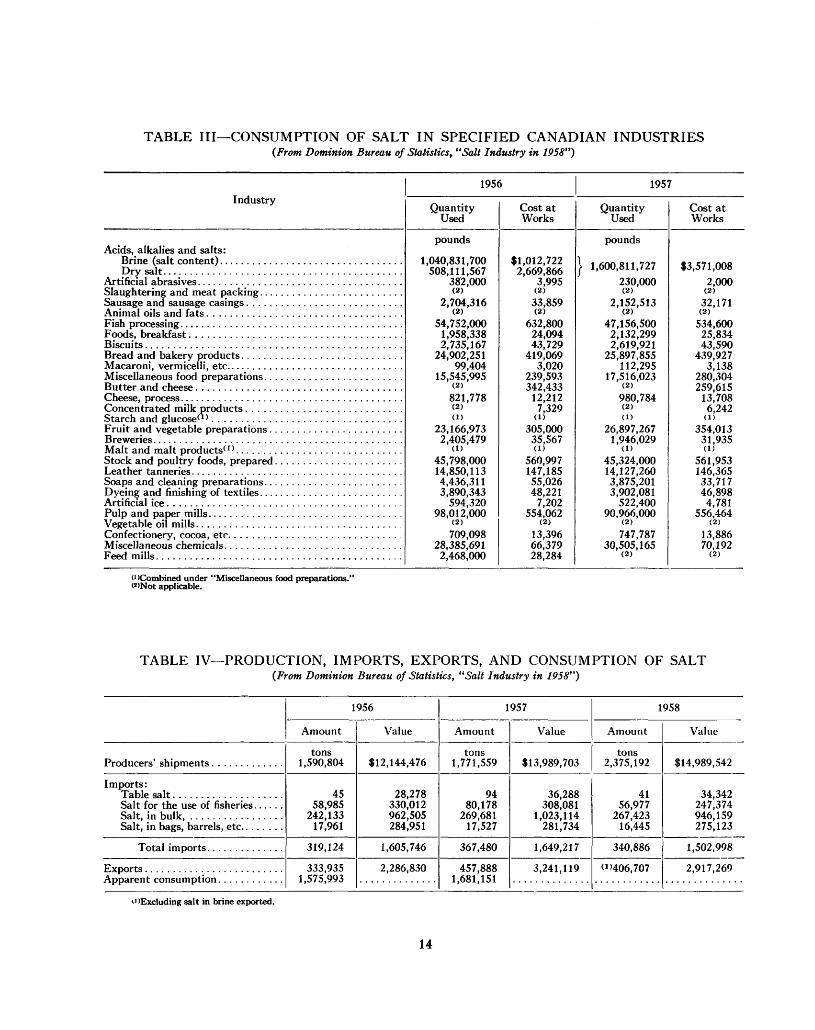
TABLE III—CONSUMPTION OF SALT IN SPECIFIED CANADIAN INDUSTRIES(From Dominion Bureau of Statistics, "Salt Industry in 1958")
Industry1956
Quantity Used
Cost atWorks
1957
Quantity Used
Cost at Works
pounds Acids, alkalies and salts:
Brine (salt content).................. .............. . 1,040,831,700Dry salt.... . . . . . . .. . . . . ... . . . .. . . . . .... . . . ... . . . . . 508,111,567
Artificial abrasives.... . . . . .. . . . ... . . .. . . . . .. . .. . .. . . . . . 382,000Slaughtering and meat packing...... .. . .... . . ...... .. ... (2)Sausage and sausage casings. .. . . . . .. . . . .... . . . ... . . . . .. 2,704,316Animal oils and fats. . .. . . .. . . . . . . . . . . .... .. . ..... . . . . . (2)Fish processing...... . . . . ... . . . . .. . . . . . . .. . . . . . . ... . . . . 54,752,000Foods, breakfast. . . .... . . ... . . . ... . . . . . . . . . . . . . .. . . . . . 1,958,338Biscuits..... . ..... . ...... ............ . ...... ...... . .. 2,735,167Bread and bakery products. .. . . . . .... . . ... . . . . . ... . . . . . 24,902,251Macaroni, vermicelli, etc....... .. .... . . . ..... . . . . .. . . . . . 99,404Miscellaneous food preparations.. ... . .. . ... . . . . ... . . . . . . 15,545,995Butter and cheese. ... . . . . . . .... ..... . . . .... .. .... . . . . . (2)Cheese, process....... . ........ . ..... . . ....... ....... .. 821,778Concentrated milk products. . . .. .. . . . . ... . . . . . . . ... . . . . (2)Starch and glucose(1) . . . . . . . . . . . . . . . . . . . . . . . . . . . . . . . . . . (1)Fruit and vegetable preparations.. . . . ... . . ... . . . . . .. ... . 23,166,973Breweries...... . . . . .. . . . . .. . . ... . . . .. . . .... . . . .... . . . . 2,405,479Malt and malt products(1) ... . . . . . . . . . . . . . . . . . . .. . . . . . . . (1)Stock and poultry foods, prepared... . . . . . . . . . . . . . . . . . . . . 45,798,000Leather tanneries...... .. . . . ... . . . . . . . . . . . . . . . . .. .. . . . . 14,850,113Soaps and cleaning preparations... . . . . . .. . . . . . . .. . . . . . . . 4,436,311Dyeing and finishing of textiles..... . . . . . ... . . . . .. . . . . . . . 3,890,343Artificial ice. . .. .. . . . ... . . . .... . . . . . . . . ... . . . . . .. . . . . . 594,320Pulp and paper mills..... . . . .. . . . . . . . . . ... . . . . . . ... . . . . 98,012,000Vegetable oil mills.. ..... . .... . . .... . . ...... . . ..... . . . . ' 2)Confectionery, cocoa, etc.. . . .. . ... . . . . . . . . . . . . . . .. . . . . 709,098Miscellaneous chemicals.... . . .. . . . . . . . . . . . . . . . . . . . . . . . . 28,385,691Feed mills. .. . . . ... . . .. . . . . ... . . . . .. . . . ........... . . . . 2,468,000
#1,012,7222,669,866
3,995(2)
33,859(2)
632,800 24,094 43,729
419,069 3,020
239,593342,433 12,212 7,329 d)
305,00035,567 d)
560,997147,18555,02648,2217,202
554,062(2)
13,39666,37928,284
pounds
1,600,811,727230,000(2)
2,152,513(2)
47,156,5002,132,2992,619,921
25,897,855112,295
17,516,023(2)
980,784(2)
(D
26,897,2671,946,029d)
45,324,00014,127,2603,875,2013,902,081522,400
90,966,000(2)
747,78730,505,165
(2)
13,571,008
2,000(2)
32,171(2)
534,60025,83443,590
439,9273,138
280,304259,61513,7086,242d)
354,01331,935d)
561,953146,36533,71746,8984,781
556,464(2)
13,88670,192
(2)
c'Combined under "Miscellaneous food preparations.' PONot applicable.
TABLE IV PRODUCTION, IMPORTS, EXPORTS, AND CONSUMPTION OF SALT(From Dominion Bureau of Statistics, "Salt Industry in 1958")
1956
Amount Value
1957
Amount Value
1958
Amount Value
Producers' shipments.tons
1,590,804 112,144,476tons
1,771,559 113,989,703tons
2,375,192 #14,989,542
Imports: Table saltSalt for the use of fisheries. Salt, in bulk, Salt, in bags, barrels, etc.. .
4558,985
242,13317,961
28,278330,012962,505284,951
9480,178
269,68117,527
36,288308,081
1,023,114281,734
4156,977
267,42316,445
34,342247,374946,159275,123
Total imports. 319,124 1,605,746 367,480 1,649,217 340,886 1,502,998
ExportsApparent consumption.
333,9351,575,993
2,286,830 457,8881,681,151
3,241,119 ^'406,707 2,917,269
"'Excluding salt in brine exported.
14
-Brine
Water
Ji
"Central tub*
-Casing
Caving of roof
iBitial stales of solution Development of "Morning Glory" shaped cavity Final stages showing caving of the roof
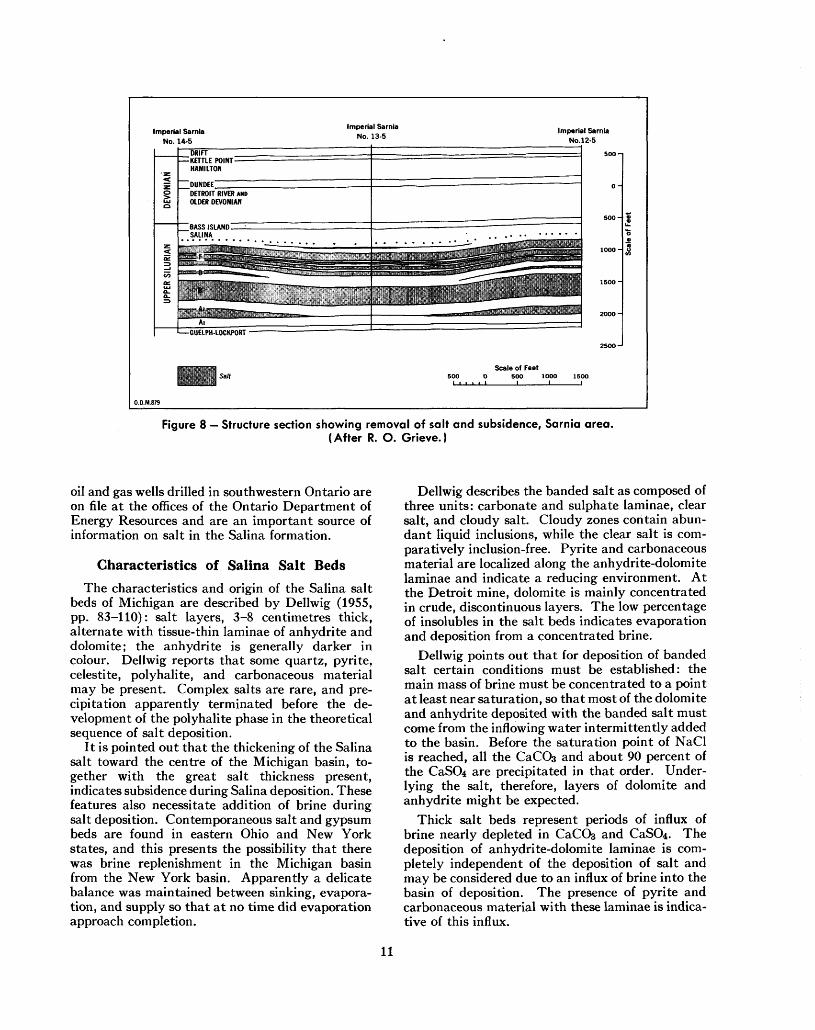
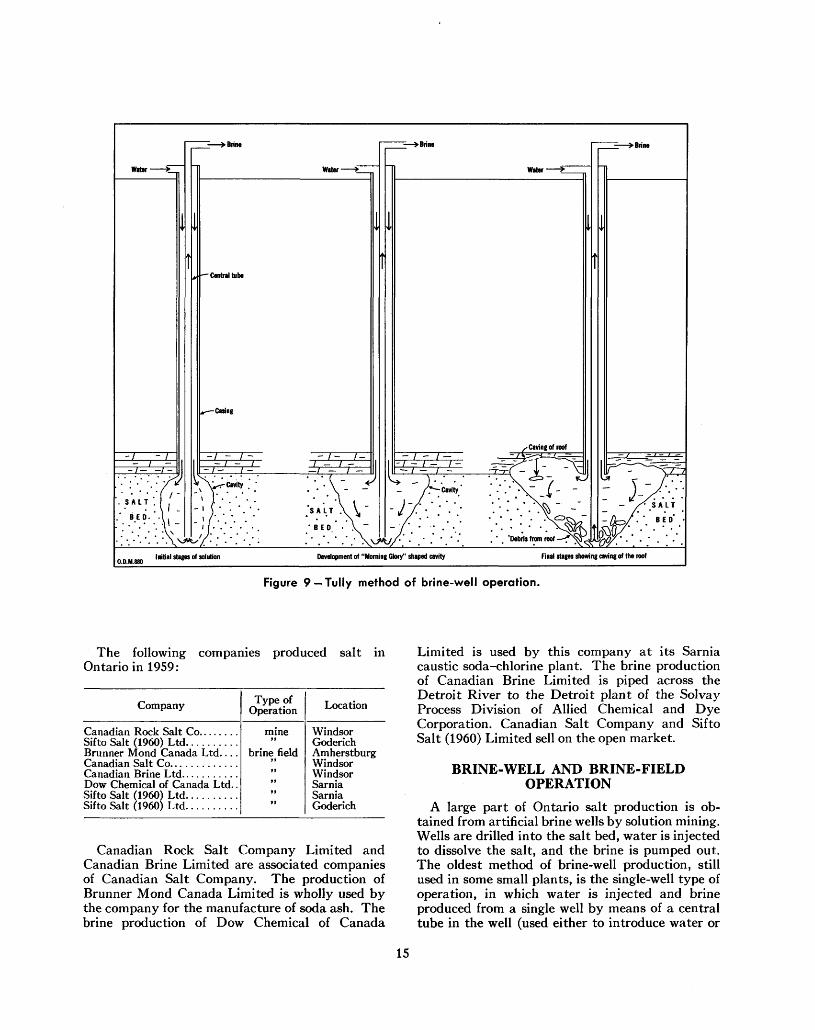
Figure 9 —Tully method of brine-well operation.
The following companies produced salt in Ontario in 1959:
Company
Sifto Salt (1960) Ltd.Brunner Mond Canada Ltd. . . .
Dow Chemical of Canada Ltd. . Sifto Salt (1960) Ltd.Sifto Salt (1960) Ltd.
Type of Operation
brine field
Location
Amherstburg
Sarnia
Canadian Rock Salt Company Limited and Canadian Brine Limited are associated companies of Canadian Salt Company. The production of Brunner Mond Canada Limited is wholly used by the company for the manufacture of soda ash. The brine production of Dow Chemical of Canada
Limited is used by this company at its Sarnia caustic soda-chlorine plant. The brine production of Canadian Brine Limited is piped across the Detroit River to the Detroit plant of the Solvay Process Division of Allied Chemical and Dye Corporation. Canadian Salt Company and Sifto Salt (1960) Limited sell on the open market.
BRINE-WELL AND BRINE-FIELD OPERATION
A large part of Ontario salt production is ob tained from artificial brine wells by solution mining. Wells are drilled into the salt bed, water is injected to dissolve the salt, and the brine is pumped out. The oldest method of brine-well production, still used in some small plants, is the single-well type of operation, in which water is injected and brine produced from a single well by means of a central tube in the well (used either to introduce water or
15
to provide exit for the brine). The single-well operation gives only a limited rate of production, depending on the thickness of the salt bed, the size of the salt cavity, the proportion of salt surface available for solution, and the rate of pumping.
Modern methods of brine production involve multiple-well brine-field operations in which two or more wells are joined in series. Water is injected into one well, and brine is recovered from one or more of the adjacent wells, which are joined to the injection well. Much larger rates of production can be achieved in this type of brine-field operation involving this use of multiple wells in series. It is also possible to exercise some control of the size and shape of cavities produced.
There are two main types of single-well operation, the Tully method and the Detroit method; and two main types of multiple-well brinefield opera tion, the Trump or Air Pad method (Trump 1944) and the hydraulic fracturing or "Hydrofrac" method.
In each case, wells are drilled by normal churn- drill or rotary-drill methods used in oil-well drilling. At the surface the wells generally have a diameter of 10-14 inches. The casing is generally 6-10 inches in outside diameter.
Single-Well OperationIn the Tully method of single-well operation,
water passes down the annular space between the casing or wall of the hole and the centre tube, and the brine rises in the centre tube. In the Detroit method, water passes down the centre tube, and brine rises in the annular space between the centre tube and the casing.
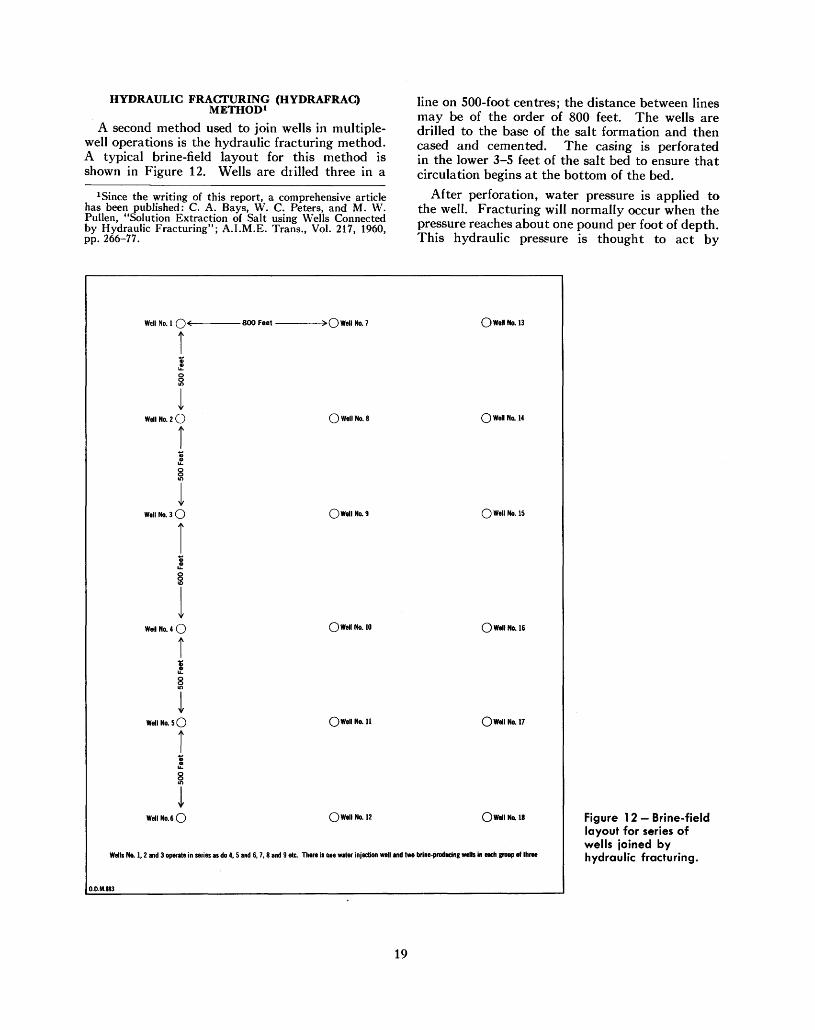
TULLY METHODIn the Tully method the well is drilled to the
base of the salt bed and may be cased and cemented to the top of the salt bed. A centre tube, 3-4 inches in diameter, is placed in the well extending to the bottom of the salt bed as shown in Figure 9. Water is forced down the well between the casing and the centre tube, and the brine is raised in the centre tube by hydraulic pressure. In some cases a small air-line is dropped down the centre tube to the brine level, and compressed air is injected. This addition of air decreases the specific gravity of the brine column, and the brine is raised in the centre tube by this "air-lift" method.
As shown in Figure 9, an inverted conical or "morning glory" type of cavity gradually develops, mushrooming outwards towards the roof of the salt bed. Anhydrite or shaly material interbedded with the salt falls to the bottom of the cavity and
blankets the salt surface, limiting the area available for solution to the upper exposed parts of the salt bed. When the cavity reaches and extends outward along the roof of the salt bed as shown in Figure 9, trouble begins owing to caving of the roof. Blocks of falling roof-rock may cut off the tubing; when this happens, production from the well is cut off until the tubing can be re-established. This may necessitate re-drilling in the caved section. Exces sive caving may force the abandonment of the well.
Taft (1946, p. 246), in describing salt wells at Hutchison, Kansas, states:
The life of a well may not be more than a year but some of those at Hutchison have a reported average life of 14 years. Cave-ins at the bottom of the well which may occur as frequently as twice a year, necessitate the difficult and expen sive operation of re-drilling the well through loose rock and pumping out the mud which blankets the bottom of the 'salt bed.'
Plastic tubing has been tried in place of iron tub ing since it is easier to re-drill in the debris pile in the well cavity. Total production from this type of well may be small, depending on the thickness of the salt bed.
In the Goderich-Kincardine area of Ontario, a variation of the Tully method was used and is still used in the older wells of Sif to Salt (1960) Limited at Goderich. These wells are drilled to the base of the salt bed, and the centre tube installed. The wells are cased to bedrock and are uncased below; underground water in an upper aquifer provides the solvent water. It flows down between the uncased walls of the hole and the centre tube. Brine is raised by air lift in the centre tube. New regulations requiring the casing of wells have made this type of well obsolete.
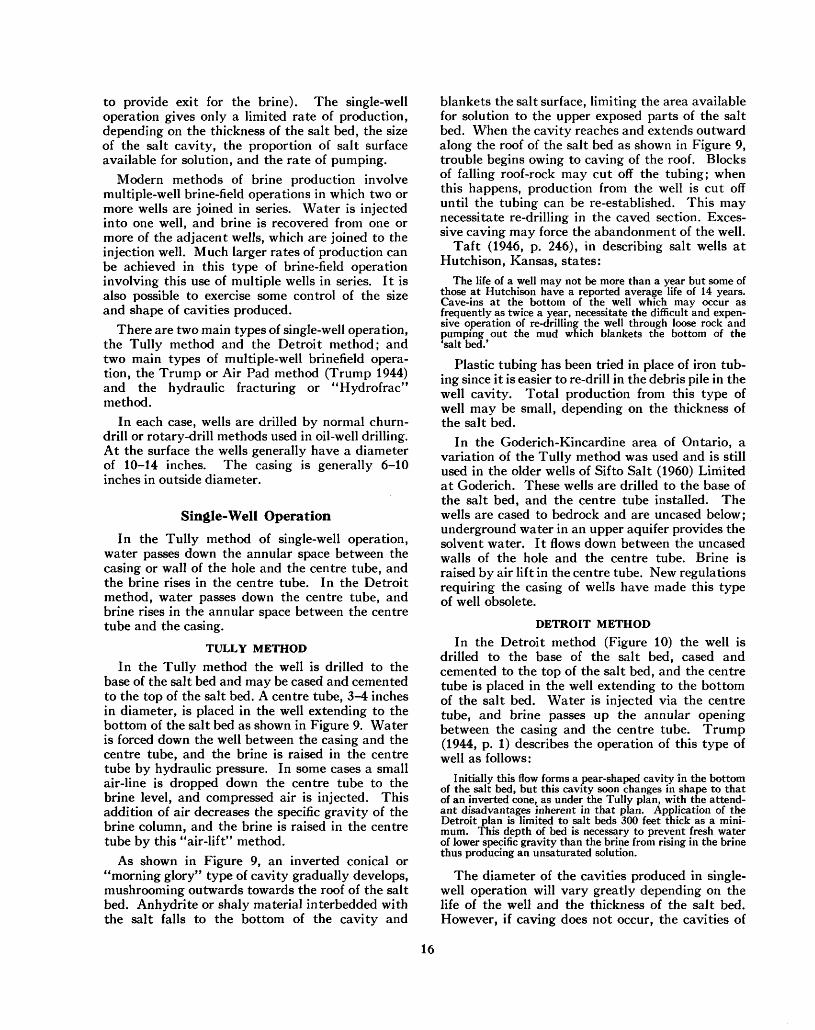
DETROIT METHODIn the Detroit method (Figure 10) the well is
drilled to the base of the salt bed, cased and cemented to the top of the salt bed, and the centre tube is placed in the well extending to the bottom of the salt bed. Water is injected via the centre tube, and brine passes up the annular opening between the casing and the centre tube. Trump (1944, p. 1) describes the operation of this type of well as follows:
Initially this flow forms a pear-shaped cavity in the bottom of the salt bed, but this cavity soon changes in shape to that of an inverted cone, as under the Tully plan, with the attend ant disadvantages inherent in that plan. Application of the Detroit plan is limited to salt beds 300 feet thick as a mini mum. This depth of bed is necessary to prevent fresh water of lower specific gravity than the brine from rising in the brine thus producing an unsaturated solution.
The diameter of the cavities produced in single- well operation will vary greatly depending on the life of the well and the thickness of the salt bed. However, if caving does not occur, the cavities of
16
•SALT
• BED
tt
Central tube
Casing
. Shale and dolomite roof
Figure 10 — Detroit method of brine-well operation.
two or more adjacent wells may join. In this event it is common practice to inject water at one well and to pump brine from the adjacent connected well or wells. In older fields many wells may become connected. This is desirable from a production standpoint as it enables higher production. When further production is required, a new offset well may be drilled a few hundred feet, possibly 300-500 feet, from the nearest adjacent well and may be operated as a single well until its cavity breaks through to join the system.
Multiple-Well Brine-Field OperationRecently brine-well producers have had success
in planning brine-field operations to give a higher percentage extraction from the whole salt bed, with control of the size and shape of cavity, and to get away from the old "morning-glory" type of salt-well development, with its attendant caving problems.
These newer methods of brine-field design depend on laying out the wells in series on 300- to 500-foot centres, joining the salt wells for production at the
base of the salt bed early in the production cycle, and then establishing a linear flow generally in a series of three wells in line, with one water-injection well and two brine-producing wells.
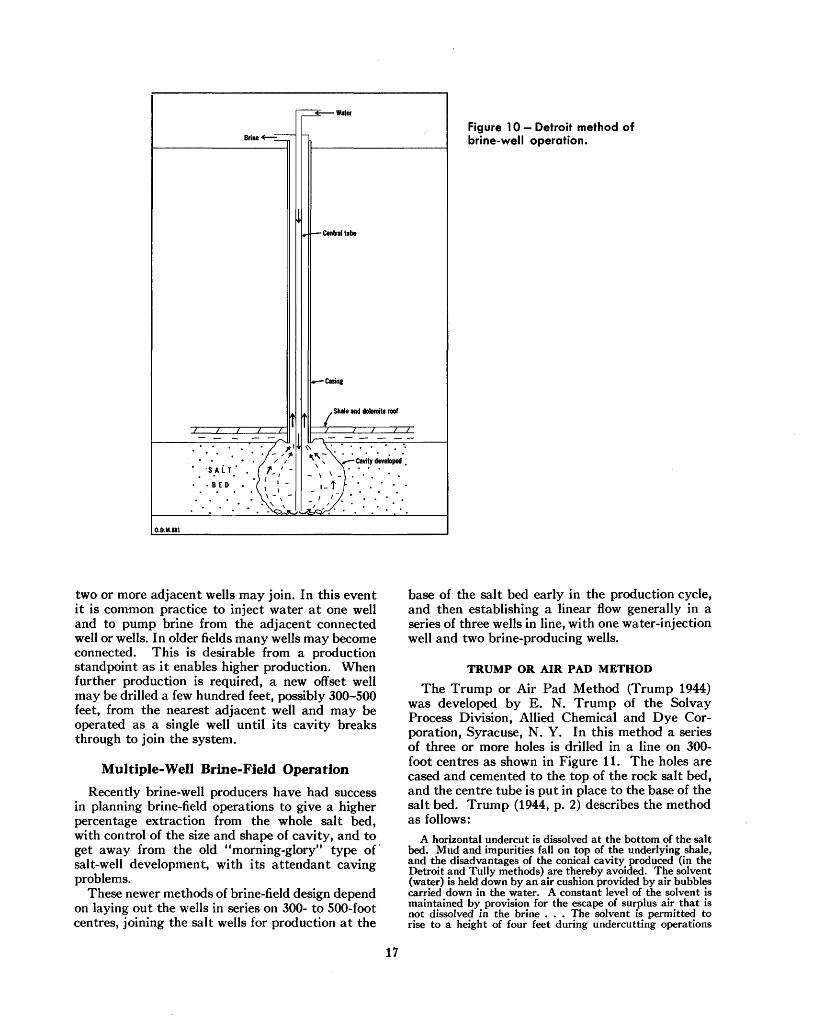
TRUMP OR AIR PAD METHOD
The Trump or Air Pad Method (Trump 1944) was developed by E. N. Trump of the Solvay Process Division, Allied Chemical and Dye Cor poration, Syracuse, N. Y. In this method a series of three or more holes is drilled in a line on 300- foot centres as shown in Figure 11. The holes are cased and cemented to the top of the rock salt bed, and the centre tube is put in place to the base of the salt bed. Trump (1944, p. 2) describes the method as follows:
A horizontal undercut is dissolved at the bottom of the salt bed. Mud and impurities fall on top of the underlying shale, and the disadvantages of the conical cavity produced (in the Detroit and Tully methods) are thereby avoided. The solvent (water) is held down by an air cushion provided by air bubbles carried down in the water. A constant level of the solvent is maintained by provision for the escape of surplus air that is not dissolved in the brine . . . The solvent is permitted to rise to a height of four feet during undercutting operations
17
Water4-air- Water+4JC.
300 Feet
". ' -' '. - .' " .'SALT B ED' . ' . - . - " . .
^ Cavities will join through use of Air Pad method
Figure 11 — Use of air pad method of joining two nearby wells.
by provision of an outlet for the surplus air ir drilled in the center tube at that height fro
Ius air in the form of holes from the base of the
saline bed . . . Air is added to the solvent water in the form of small bubbles, which decrease in size as pressure increases during the passage of water down the well. The heat of compression is absorbed by the water and the air dissolved, the weight of the water decreasing in weight by the volume displaced by the air. The water, moreover, will dissolve four times as much air as the saturated brine and sufficient air is added to the water to provide a surplus over that which is absorbed in the brine. This surplus air is then liberated to produce the air cushion, which in turn holds down the solvent.
As brine rises in the centre tube, the air dissolved therein is released in the form of bubbles, which increase in size as they move upward to the top of the tube. These bubbles decrease the weight of the brine by one eighth. To prevent dilution of the brine a bell may be placed above the surplus-air holes in the center tube. This arrangement permits the surplus air to be removed without taking water into the brine and prevents its entry with the brine into the center tube. To raise the brine in the center tube, the water, and air added to the water, at the top must be pumped into the annular space between the center tube and casing at a pressure equal to the difference in specific gravity between that of the brine and that of the water and air. Moreover, the loss of pressure resulting from friction in the pipes must be taken into con sideration.
The air pad allows the undercut to be extended in an expanding horizontal circle until the three wells are joined. The wells may then be operated by injecting water into an end well and pumping brine from the other two. It is assumed that the resulting cavity will have a linear form between the wells, resulting in an elongate room being dissolved out as solution progresses.
The air-pad method has the disadvantage that air introduced into the system speeds corrosion of brine lines and pipes. The pressures needed to operate the air pad at depth of 1,300-1,700 feet are difficult to handle. Oil pads have also been used with varying success.
Although the air pad is used to connect wells by undercutting on initiating brine production, it is not often used during later production. About 12-14 months is the normal period taken to join two wells 300 feet apart.
18
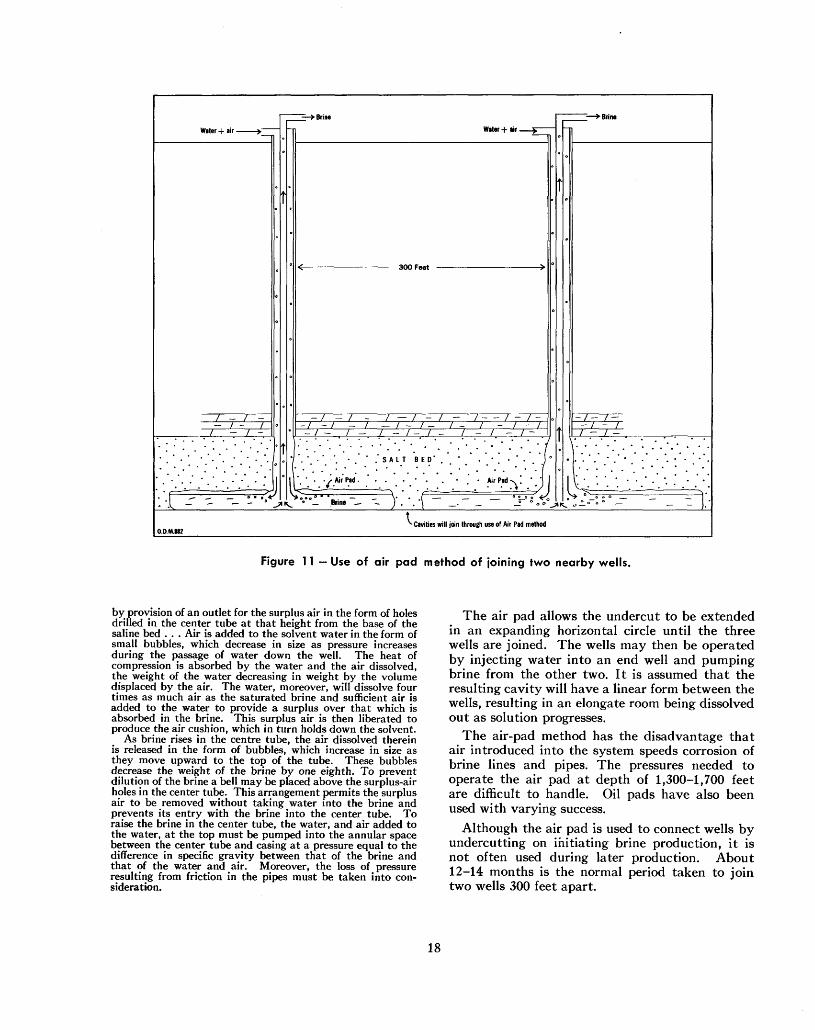
HYDRAULIC FRACTURING (HYDRAFRAC) METHOD 1
A second method used to join wells in multiple- well operations is the hydraulic fracturing method. A typical brine-field layout for this method is shown in Figure 12. Wells are drilled three in a
1 Since the writing of this report, a comprehensive article has been published: C. A. Bays, W. C. Peters, and M. W. Pullen, "Solution Extraction of Salt using Wells Connected by Hydraulic Fracturing"; A.I.M.E. Trans., Vol. 217, 1960, pp. 266-77.
line on 500-foot centres; the distance between lines may be of the order of 800 feet. The wells are drilled to the base of the salt formation and then cased and cemented. The casing is perforated in the lower 3-5 feet of the salt bed to ensure that circulation begins at the bottom of the bed.
After perforation, water pressure is applied to the well. Fracturing will normally occur when the pressure reaches about one pound per foot of depth. This hydraulic pressure is thought to act by
Well No. l *- -^ O Well No. 7 O Well No. 13
lWell No. 2 Q
l
O W*" No. * O W*'1 No. 14
Well No. 3 Q O W*H No. 9 Q W*" No. 15
Well No. 4 Q
t l
lWell No. 5 Qil
IWell No. 6 Q
O Well No. 10 O Well No. 16
Q Well No. 11 O**'1 No. 17
O Well No. 12
Wells No. l, 2 end 3 operate in series as do 4.5 and 6,7,8 and 9 etc. There is one water injection well and two brine-produtini wells in each group of three
Figure 12 — Brine-field layout for series of wells joined by hydraulic fracturing.
19
hydraulic jacking of the strata along horizontal fractures. Loss of pressure may indicate that an open fracture system has been reached. The fracturing between two wells 500 feet apart under ideal conditions may occur in 2-4 hours, and the join will be indicated by a dropping-off of the hydraulic pressure.
When three wells in a linear series are joined, water is introduced in one well (often the centre one) and brine pumped from the two adjacent wells. The join having been made at the base of the salt bed, the cavity is supposed to develop as a linear gallery between the three wells. Ideally it is hoped that a pillar of salt will be left between adjacent lines of wells.
If wells produce 100-percent saturated brine, this will have a specific gravity of 1.208 and will contain 2.6 pounds of salt per gallon or 1.3 tons per 1,000 gallons. All producing wells are metered, and the tonnage of salt produced frdm each group of three wells can be calculated. Knowing the thickness of the salt bed and assuming a cavity 300 feet wide, an approximation of the life of the series of three wells can be made.
No good method has been developed to determine the size and shape of the cavity. The volume of the cavity is known from the tonnage produced; the area of the cavity per foot of depth can only be ascertained by pumping it out. Before casing the well, radioactive tracers can be fired into the walls of the salt bed at various levels. As the cavity eats its way upwards these tracers will fall out one by one. A gamma-ray survey of the hole at any time will give an indication of the height of the cavity at the time of survey.
Some experimentation has been done on sonar surveys of well cavities, but so far the method has not had a wide application.
Rates of production vary, but the average is about 100 gallons per minute per well.
SALT MANUFACTURE FROM BRINEMethods of salt manufacture are described in the
following sources from which this section is largely derived (MacMillan 1960, pp. 727-28: Cole 1930, pp. 81-9: Hester and Diamond 1955, pp. 672-83: Badger and Standiford 1955, pp. 173-77, 180-83: Phalen 1949, pp. 834-37).
In Ontario, evaporated salt has been produced both by grainer and vacuum pan. The grainer, which produces coarse or flake salt most suitable for certain food-processing industries, consists of elongated shallow open pans or troughs heated by
steam pipes. Salt is produced by slow and quiet evaporation, and the hopper-shaped salt crystals form at the surface. The type of salt recovered is determined by the temperature and the brine com position. The salt that sinks to the bottom of the grainer is recovered by mechanical rakes. It may be centrifuged to reduce moisture content. The average production from a 120-foot grainer is 10 tons of salt per 24 hours. Fuel consumption is high, and production of grainer salt is limited. Grainer coils must be frequently cleaned of calcium sulphate scale, and maintenance time is said to amount to about one hour per ton of salt.
Nearly all evaporated salt is now made in vacuum pans, which produce fine cubic salt crystals. MacMillan (1960, pp. 727-28) describes the vacuum pan operation as follows:
Most evaporated salt is a product of the vacuum pan— a large cylindrical vessel, which may be 18 feet in diameter and 60 feet high, having a conical top and bottom. A steam- heated calandria encircles the vessel just below mid-section and a large impeller helps circulate the brine upward through the tubes of the heater and down through the central down- take. Crystallized salt collects in the conical bottom and is removed in a slurry. The pans are operated under partial vacuum to lower the boiling point of the brine.
Economy is increased substantially by operating several pans in series, using the vapor produced in one to heat the brine in the next; each succeeding pan operates on a slightly higher vacuum. This procedure is known as multiple effect evaporation and three or four effects are common in the salt industry.
Over the years many improvements in both design and operation of vacuum pans have been evolved. Calcium sulphate scale which formerly crusted the heat exchange tubes of the calandria and had to be drilled out each week is no longer a problem. It is now largely controlled by maintaining a considerable concentration of fine calcium sulphate crystals in the evaporator brines. The dissolved calcium sulphate which precipitates in the pans as the temperature increases is thus provided with small, circulating nuclei on which to grow, and the heating tubes are not encrusted. Excess calcium sulphate and fine salt crystals are washed from the salt slurry with saturated brine and a portion is returned to the evapora tors.
Calcium sulphate has an inverted solubility curve and precipitates at high temperatures.
Vacuum pans produce salt at the rate of about 2 tons per day per square foot of evaporator cross- section (Wilson 1947, p. 530). About 2,600 pounds of steam is required per ton of salt in triple-effect vacuum pans.
Salt is removed from the vacuum pans as a slurry and goes to a rotary vacuum filter. This step is followed by drying, screening, and packaging.
Treatment of brine is often necessary to remove impurities before evaporation. Phalen (1949, p. 834) states:
The brine coming from wells contains soluble impurities, chiefly hydrogen sulphide gas, iron compounds probably as
20
carbonate, and calcium and magnesium salts. For the purest grades of salt used in the food industries and for special purposes, these are largely removed by chemical means. The brine may be aerated, treated with lime or lime and soda ash, caustic soda and soda ash, and possibly alum, and allowed to settle a few days. Some manufacturers chlorinate the raw brine for the removal of sulphides and oxidation of the iron. The brine is then aerated to remove the excess of chlorine and the chemicals added. In the manufacture of vacuum pan or grainer salt for the most exacting trade, the brine may be purified by the lime-soda ash process, and for this trade, largely the dairy, some manufacturers consider the cubical grained or granulated salt as good as the flake grainer salt.
The addition of such chemicals as lime and soda ash should be under close chemical supervision, chemical dosage and control may be based on pH value, or, preferably, on actual chemical analysis or alkalinity of the purified product
In discussing salt manufacture, Badger and Standiford (1955, pp. 173-77, 180-83) state:
Salt is almost always made from brine saturated with calcium sulphate and containing appreciable amounts of calcium and magnesium chlorides. Few operators in this country find it possible to chemically purify the brine. The consumption of sodium carbonate to remove completely the calcium sulphate results in excessive costs. Consequently practically all salt evaporators today run on unpurified brine. However the calcium and magnesium chloride content of the mother liquor is watched and a sufficient bleed is taken off the evaporator to hold this concentration of soluble im purities at a desired level. This level is such that washing in the elutriation leg, washing in the settling tank, and washing in the top filter are enough to keep the calcium and magnesium chloride contents of the final salt in the desired limits. It is possible by such methods to make the salt considerably purer than 99.5 percent in day to day operations.
Other processes of salt manufacture such as the Alberger, Morton, International, and Richards processes are also used. The last two require solid salt as starting material. The Richards process is described in Chemical Engineering (Richards 1952, p. 140). This process is used in New York state.
An article by W. L. Hardy (1957, pp. 59, 60) is reviewed by the United States Bureau of Mines in the chapter on salt in their Minerals Yearbook for 1958, as follows:
The investment cost of a small plant capable of producing 35 tons per day of pure dry salt was estimated at 1426,000, divided about equally between equipment and buildings. Equipment and costs were itemized as follows:
1) Salt evaporator and accessories, #85,000;2) Rotary filter and accessories, #16,000;3) Salt drier, #50,000;4) Pumps, #4,000;5) Settling tanks, #8,000;6) Storage bins, #10,000;7) Piping and miscellaneous items, #25,000.The refining costs in a plant of this capacity were estimated
at #12 to #17 per ton of finished salt exclusive of brine costs.
A small salt unit manufactured by Manistee Iron Works for refinining 20 tons of salt per day is described in Chemical Engineering (Jan. 1952, p. 230).
ONTARIO BRINE-WELL OPERATIONS History of Salt Production in Ontario
An interesting account of the discovery of salt in Ontario is given by L. H. Cole (1915, pp. 30-32):
The discovery of salt in Ontario dates back to 1866. In that year, when the oil excitement was at its height in western Ontario, due to oil having been discovered to the south, a company was formed at Goderich, organized by a Samuel Platt, with the object of drilling for oil. This company, with a subscribed capital of #10,000, commenced drilling on the north bank of the Maitland river, to the east of the bridge. The drill passed through a series of layers of greyish limestone of varying hardness, to a depth of 686 feet, without encounter ing any indications of oil; so the stockholders decided to abandon the enterprise. Mr. Platt, however, decided to continue drilling at his own expense, especially since the County Council had offered a bonus of #1,000, and the city a bonus of #500 providing drilling was continued to a depth of 1,000 feet. His efforts were amply rewarded, for, at a depth of 964 feet from the collar of the hole, he encountered a solid bed of rock salt into which he bored for a distance of 60 feet, thus completing 1,000 feet, and securing the above-mentioned bonuses.
Upon encountering salt, the shareholders who previously had abandoned the work, expressed a desire to pay up their assessment and were allowed to do so by Mr. Plait. The capital of the company was increased to #14,000, and was incorporated as the Goderich Petroleum Company, and in September, 1866, pumping of brine commenced. The salt made from this brine was sold to George Rumball 8c Co., who marketed it.
As soon as the well was in shape for pumping the brine, the Goderich Salt Company [as it was then called] constructed two blocks of 52 kettles each: the kettles ranging in capacity from 120 to 140 gallons. Thus the total capacity of the plant was in the neighbourhood of 100 barrels per day.
The salt produced found a ready market, so that at the end of the first year's operation the profits were considerable, dividends totalling 51 per cent, having been distributed among the shareholders. The price then obtained for the salt was #1.25 per barrel at the works.
The kettle method was soon found to be expensive, hence it was discarded in favour of the pan method of evaporation.
The success attending this pioneer company gave great impetus to this infant industry, so that by the next summer the valley of the Maitland from the bridge to the town was the scene of extensive drilling operations. About the year 1872, the following blocks, with the enumerated capacity in barrels per day were in full operation: "The Goderich" 200 bbls. (this was the pioneer well); "Maitland" 100; "Prince," 100; "Victoria," 100; "Huron," 100; "Dominion," 200; "Ontario," 150; "Tecumseh," 150; "Hawley's," 200; "In- niskillen," 200; "International," 600; and "Platt's," 150 (Platt having severed his connexion with the original com pany and erected works of his own).
In the meantime, drilling operations had been carried on with good success at Clinton and Seaforth, and at both places salt was encountered, and plants erected. The fact that wood fuel was cheaper at these latter places enabled them to supply the Canadian market at lower prices than from the Goderich wells, and in consequence a number of the plants at the latter place were forced to close down.
In the year 1879, there were only four of the Goderich plants in operation: namely: "Platt's"—making 150 barrels per day; "Tecumseh"—owned by A. Hodge, 75 barrels; "Hawley's"—200 barrels; and the "International"—600 bar rels. This last mentioned Company was operated by the Seaforth Syndicate and was, up to that time, the largest salt works in Canada.
21
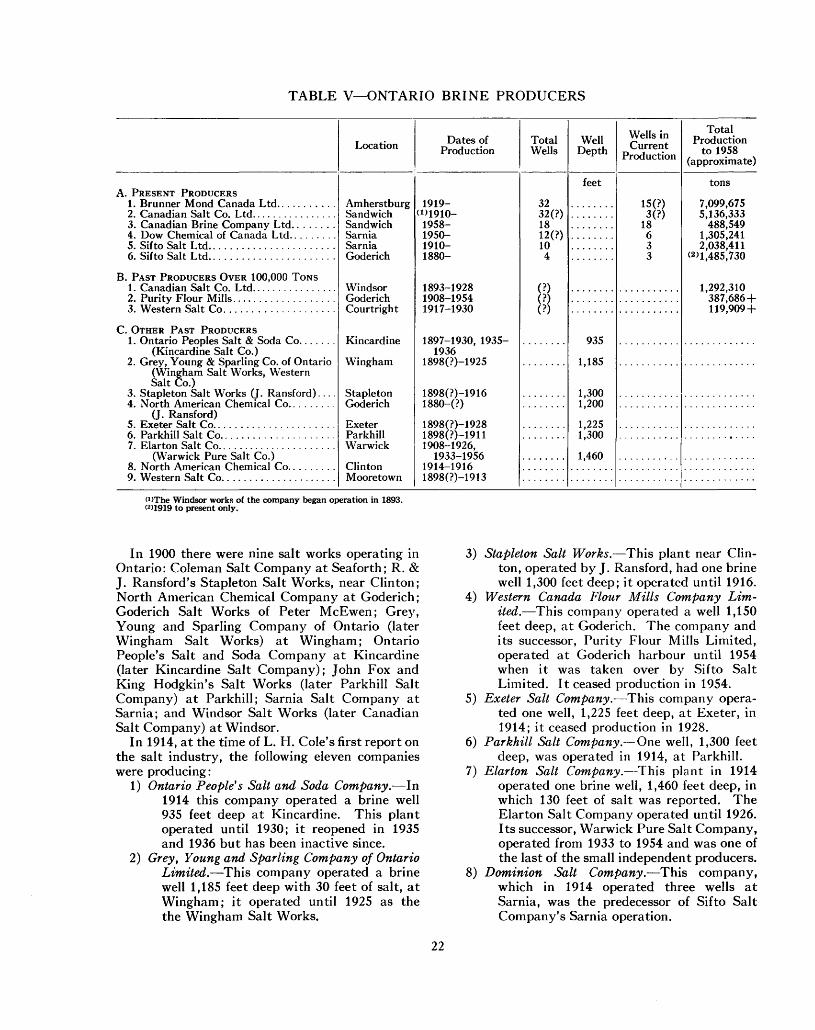
TABLE V—ONTARIO BRINE PRODUCERS
A. PRESENT PRODUCERS
5. Sifto Salt Ltd.6. Sifto Salt Ltd.
B. PAST PRODUCERS OVER 100,000 TONS
3. Western Salt Co. . . . . . . . . . . . . . . . . . . .
C. OTHER PAST PRODUCERS
(Kincardine Salt Co.)
(Wingham Salt Works, Western Salt Co.)
(J. Ransford)
6. Parkhill Salt Co.........7. Elarton Salt Co. . . . . . . . . . . . . . . . . . . . . .
9. Western Salt Co. . . . . . . . . . . . . . . . . . . . .
Location
SarniaGoderich
Courtright
Wingham
Stapleton
Parkhill
Moore town
Dates of Production
1919-(D1910-
1958-1950-1910-1880-
1893-19281908-19541917-1930
1897-1930, 1935-1936
1898(?)-1925
1898(?)-19161880-(?)
1898(?)-19281898(?)-19111908-1926,
IQ^l-IQ'lfi1914-19161898f?)-1913
Total Wells
3232(?)1812(?)104
(?)(?)(?)
Well Depth
feet
935
1,185
1,3001,2001,2251,300
1,460
Wells in Current
Production
15(?)•iff)18633
Total Production
to 1958(approximate)
tons
7,099,6755,136,333
488,5491,305,2412,038,411
(2)1,485,730
1,292,310387,686 +119,909 4-
OThe Windsor works of the company began operation in 1893. (2)1919 to present only.
In 1900 there were nine salt works operating in Ontario: Coleman Salt Company at Seaforth; R. 8t J. Ransford's Stapleton Salt Works, near Clinton; North American Chemical Company at Goderich; Goderich Salt Works of Peter McEwen; Grey, Young and Sparling Company of Ontario (later Wingham Salt Works) at Wingham; Ontario People's Salt and Soda Company at Kincardine (later Kincardine Salt Company); John Fox and King Hodgkin's Salt Works (later Parkhill Salt Company) at Parkhill; Sarnia Salt Company at Sarnia; and Windsor Salt Works (later Canadian Salt Company) at Windsor.
In 1914, at the time of L. H. Cole's first report on the salt industry, the following eleven companies were producing:
1) Ontario People's Salt and Soda Company.—In 1914 this company operated a brine well 935 feet deep at Kincardine. This plant operated until 1930; it reopened in 1935 and 1936 but has been inactive since.
2) Grey, Young and, Sparling Company of Ontario Limited.—This company operated a brine well 1,185 feet deep with 30 feet of salt, at Wingham; it operated until 1925 as the the Wingham Salt Works.
3) Stapleton Salt Works.—This plant near Clin ton, operated by J. Ransford, had one brine well 1,300 feet deep; it operated until 1916.
4) Western Canada Flour Mills Company Lim ited.—This company operated a well 1,150 feet deep, at Goderich. The company and its successor, Purity Flour Mills Limited, operated at Goderich harbour until 1954 when it was taken over by Sifto Salt Limited. It ceased production in 1954.
5) Exeter Salt Company.—This company opera ted one well, 1,225 feet deep, at Exeter, in 1914; it ceased production in 1928.
6) Parkhill Salt Company.— One well, 1,300 feet deep, was operated in 1914, at Parkhill.
7) Elarton Salt Company.—This plant in 1914 operated one brine well, 1,460 feet deep, in which 130 feet of salt was reported. The Elarton Salt Company operated until 1926. Its successor, Warwick Pure Salt Company, operated from 1933 to 1954 and was one of the last of the small independent producers.
8) Dominion Salt Company.—This company, which in 1914 operated three wells at Sarnia, was the predecessor of Sifto Salt Company's Sarnia operation.
22
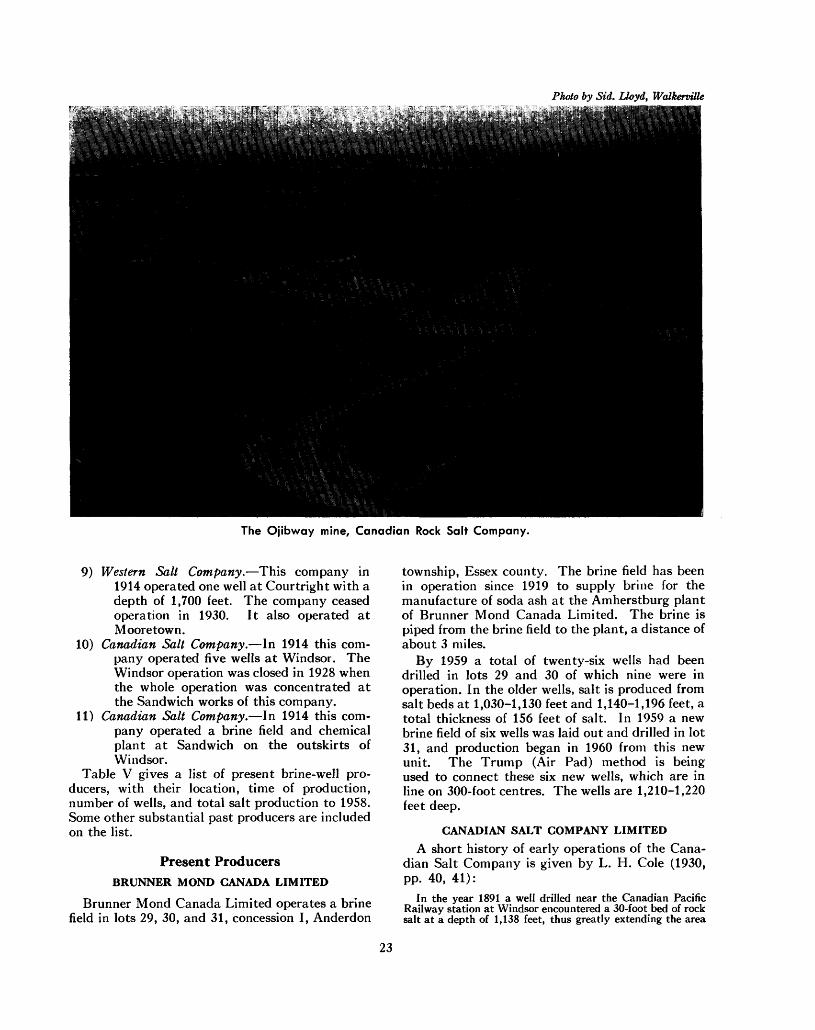
Photo by Sid. Lloyd, Walkervtile
The Ojibway mine, Canadian Rock Salt Company.
9) Western Salt Company.—This company in 1914 operated one well at Courtright with a depth of 1,700 feet. The company ceased operation in 1930. It also operated at Moore town.
10) Canadian Salt Company.—In 1914 this com pany operated five wells at Windsor. The Windsor operation was closed in 1928 when the whole operation was concentrated at the Sandwich works of this company.
11) Canadian Salt Company.—In 1914 this com pany operated a brine field and chemical plant at Sandwich on the outskirts of Windsor.
Table V gives a list of present brine-well pro ducers, with their location, time of production, number of wells, and total salt production to 1958. Some other substantial past producers are included on the list.
Present ProducersBRUNNER MOND CANADA LIMITED
Brunner Mond Canada Limited operates a brine field in lots 29, 30, and 31, concession I, Anderdon
township, Essex county. The brine field has been in operation since 1919 to supply brine for the manufacture of soda ash at the Amherstburg plant of Brunner Mond Canada Limited. The brine is piped from the brine field to the plant, a distance of about 3 miles.
By 1959 a total of twenty-six wells had been drilled in lots 29 and 30 of which nine were in operation. In the older wells, salt is produced from salt beds at 1,030-1,130 feet and 1,140-1,196 feet, a total thickness of 156 feet of salt. In 1959 a new brine field of six wells was laid out and drilled in lot 31, and production began in 1960 from this new unit. The Trump (Air Pad) method is being used to connect these six new wells, which are in line on 300-foot centres. The wells are 1,210-1,220 feet deep.
CANADIAN SALT COMPANY LIMITEDA short history of early operations of the Cana
dian Salt Company is given by L. H. Cole (1930, pp. 40, 41):
In the year 1891 a well drilled near the Canadian Pacific Railway station at Windsor encountered a 30-foot bed of rock salt at a depth of 1,138 feet, thus greatly extending the area
23
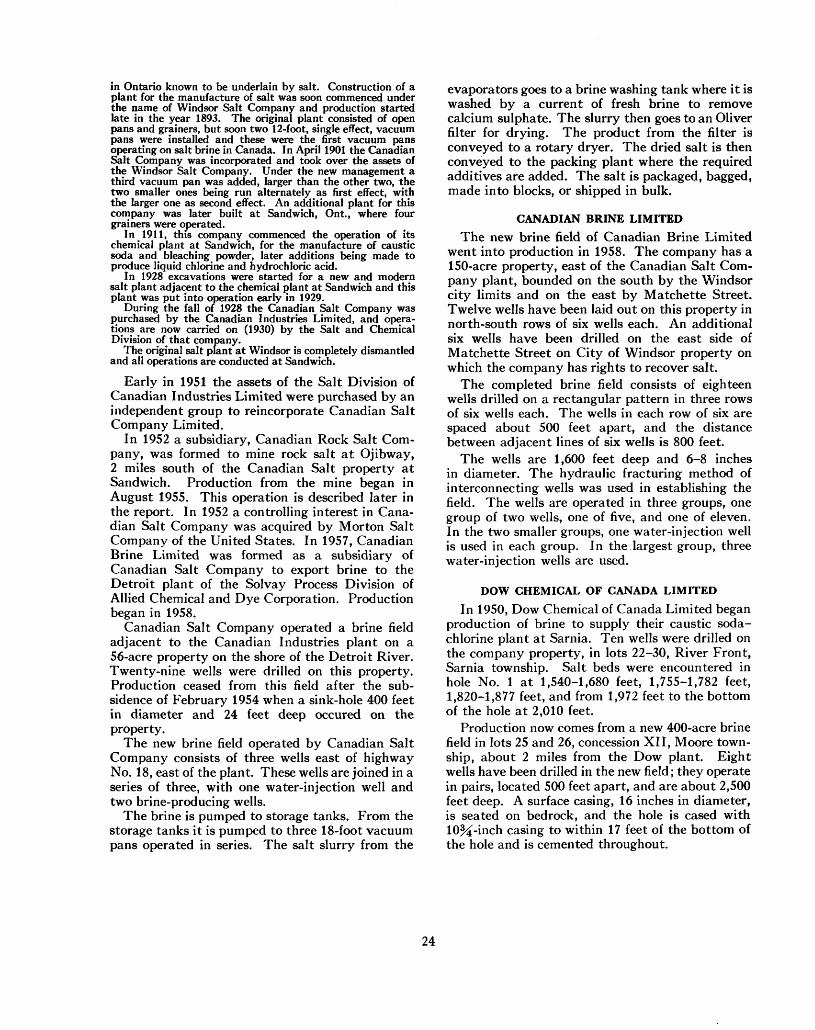
in Ontario known to be underlain by salt. Construction of a plant for the manufacture of salt was soon commenced under the name of Windsor Salt Company and production started late in the year 1893. The original plant consisted of open pans and grainers, but soon two 12-foot, single effect, vacuum pans were installed and these were the first vacuum pans operating on salt brine in Canada. In April 1901 the Canadian Salt Company was incorporated and took over the assets of the Windsor Salt Company. Under the new management a third vacuum pan was added, larger than the other two, the two smaller ones being run alternately as first effect, with the larger one as second effect. An additional plant for this company was later built at Sandwich, Ont., where four grainers were operated.
In 1911, this company commenced the operation of its chemical plant at Sandwich, for the manufacture of caustic soda and bleaching powder, later additions being made to produce liquid chlorine and hydrochloric acid.
In 1928 excavations were started for a new and modern salt plant adjacent to the chemical plant at Sandwich and this plant was put into operation early in 1929.
During the fall of 1928 the Canadian Salt Company was purchased by the Canadian Industries Limited, and opera tions ^are now carried on (1930) by the Salt and Chemical Division of that company.
The original salt plant at Windsor is completely dismantled and all operations are conducted at Sandwich.
Early in 1951 the assets of the Salt Division of Canadian Industries Limited were purchased by an independent group to reincorporate Canadian Salt Company Limited.
In 1952 a subsidiary, Canadian Rock Salt Com pany, was formed to mine rock salt at Ojibway, 2 miles south of the Canadian Salt property at Sandwich. Production from the mine began in August 1955. This operation is described later in the report. In 1952 a controlling interest in Cana dian Salt Company was acquired by Morton Salt Company of the United States. In 1957, Canadian Brine Limited was formed as a subsidiary of Canadian Salt Company to export brine to the Detroit plant of the Solvay Process Division of Allied Chemical and Dye Corporation. Production began in 1958.
Canadian Salt Company operated a brine field adjacent to the Canadian Industries plant on a 56-acre property on the shore of the Detroit River. Twenty-nine wells were drilled on this property. Production ceased from this field after the sub sidence of February 1954 when a sink-hole 400 feet in diameter and 24 feet deep occured on the property.
The new brine field operated by Canadian Salt Company consists of three wells east of highway No. 18, east of the plant. These wells are joined in a series of three, with one water-injection well and two brine-producing wells.
The brine is pumped to storage tanks. From the storage tanks it is pumped to three 18-foot vacuum pans operated in series. The salt slurry from the
evaporators goes to a brine washing tank where it is washed by a current of fresh brine to remove calcium sulphate. The slurry then goes to an Oliver filter for drying. The product from the filter is conveyed to a rotary dryer. The dried salt is then conveyed to the packing plant where the required additives are added. The salt is packaged, bagged, made into blocks, or shipped in bulk.
CANADIAN BRINE LIMITEDThe new brine field of Canadian Brine Limited
went into production in 1958. The company has a 150-acre property, east of the Canadian Salt Com pany plant, bounded on the south by the Windsor city limits and on the east by Matchette Street. Twelve wells have been laid out on this property in north-south rows of six wells each. An additional six wells have been drilled on the east side of Matchette Street on City of Windsor property on which the company has rights to recover salt.
The completed brine field consists of eighteen wells drilled on a rectangular pattern in three rows of six wells each. The wells in each row of six are spaced about 500 feet apart, and the distance between adjacent lines of six wells is 800 feet.
The wells are 1,600 feet deep and 6-8 inches in diameter. The hydraulic fracturing method of interconnecting wells was used in establishing the field. The wells are operated in three groups, one group of two wells, one of five, and one of eleven. In the two smaller groups, one water-injection well is used in each group. In the largest group, three water-injection wells are used.
DOW CHEMICAL OF CANADA LIMITEDIn 1950, Dow Chemical of Canada Limited began
production of brine to supply their caustic soda- chlorine plant at Sarnia. Ten wells were drilled on the company property, in lots 22-30, River Front, Sarnia township. Salt beds were encountered in hole No. l at 1,540-1,680 feet, 1,755-1,782 feet, 1,820-1,877 feet, and from 1,972 feet to the bottom of the hole at 2,010 feet.
Production now comes from a new 400-acre brine field in lots 25 and 26, concession XII, Moore town ship, about 2 miles from the Dow plant. Eight wells have been drilled in the new field; they operate in pairs, located 500 feet apart, and are about 2,500 feet deep. A surface casing, 16 inches in diameter, is seated on bedrock, and the hole is cased with 10%-inch casing to within 17 feet of the bottom of the hole and is cemented throughout.
24
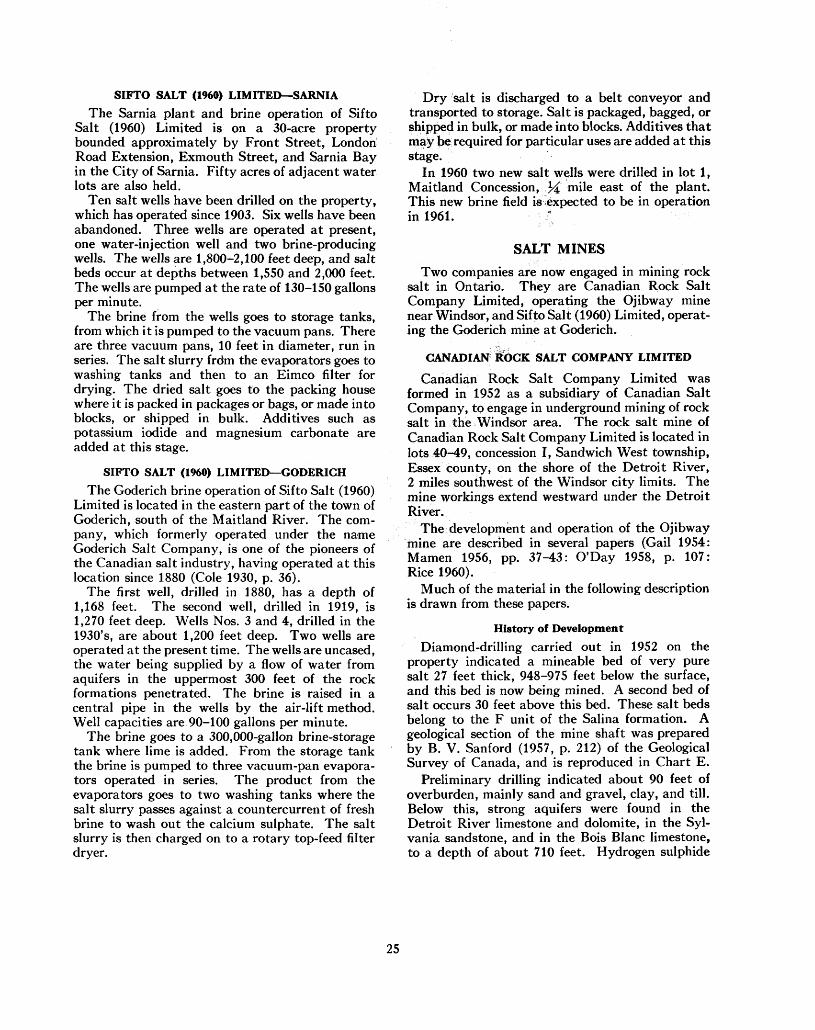
SIFTO SALT (1960) LIMITED—SARNIAThe Sarnia plant and brine operation of Sifto
Salt (1960) Limited is on a 30-acre property bounded approximately by Front Street, London Road Extension, Exmouth Street, and Sarnia Bay in the City of Sarnia. Fifty acres of adjacent water lots are also held.
Ten salt wells have been drilled on the property, which has operated since 1903. Six wells have been abandoned. Three wells are operated at present, one water-injection well and two brine-producing wells. The wells are 1,800-2,100 feet deep, and salt beds occur at depths between 1,550 and 2,000 feet. The wells are pumped at the rate of 130-150 gallons per minute.
The brine from the wells goes to storage tanks, from which it is pumped to the vacuum pans. There are three vacuum pans, 10 feet in diameter, run in series. The salt slurry frdm the evaporators goes to washing tanks and then to an Eimco filter for drying. The dried salt goes to the packing house where it is packed in packages or bags, or made into blocks, or shipped in bulk. Additives such as potassium iodide and magnesium carbonate are added at this stage.
SIFTO SALT (1960) LIMITED—GODERICHThe Goderich brine operation of Sifto Salt (1960)
Limited is located in the eastern part of the town of Goderich, south of the Maitland River. The com pany, which formerly operated under the name Goderich Salt Company, is one of the pioneers of the Canadian salt industry, having operated at this location since 1880 (Cole 1930, p. 36).
The first well, drilled in 1880, has a depth of 1,168 feet. The second well, drilled in 1919, is 1,270 feet deep. Wells Nos. 3 and 4, drilled in the 1930's, are about 1,200 feet deep. Two wells are operated at the present time. The wells are uncased, the water being supplied by a flow of water from aquifers in the uppermost 300 feet of the rock formations penetrated. The brine is raised in a central pipe in the wells by the air-lift method. Well capacities are 90-100 gallons per minute.
The brine goes to a 300,000-gallon brine-storage tank where lime is added. From the storage tank the brine is pumped to three vacuum-pan evapora tors operated in series. The product from the evaporators goes to two washing tanks where the salt slurry passes against a countercurrent of fresh brine to wash out the calcium sulphate. The salt slurry is then charged on to a rotary top-feed filter dryer.
Dry salt is discharged to a belt conveyor and transported to storage. Salt is packaged, bagged, or shipped in bulk, or made into blocks. Additives that may be required for particular uses are added at this stage.
In 1960 two new salt wells were drilled in lot l, Maitland Concession, J4 mile east of the plant. This new brine field is expected to be in operation in 1961. "
Two companies are now engaged in mining rock salt in Ontario. They are Canadian Rock Salt Company Limited, operating the Ojibway mine near Windsor, and Sifto Salt (1960) Limited, operat ing the Goderich mine at Goderich.
Canadian Rock Salt Company Limited was formed in 1952 as a subsidiary of Canadian Salt Company, to engage in underground mining of rock salt in the Windsor area. The rock salt mine of Canadian Rock Salt Company Limited is located in lots 40-49, concession I, Sandwich West township, Essex county, on the shore of the Detroit River, 2 miles southwest of the Windsor city limits. The mine workings extend westward under the Detroit River.
The development and operation of the Ojibway mine are described in several papers (Gail 1954: Mamen 1956, pp. 37-43: O'Day 1958, p. 107: Rice 1960).
Much of the material in the following description is drawn from these papers.
History of DevelopmentDiamond-drilling carried out in 1952 on the
property indicated a mineable bed of very pure salt 27 feet thick, 948-975 feet below the surface, and this bed is now being mined. A second bed of salt occurs 30 feet above this bed. These salt beds belong to the F unit of the Salina formation. A geological section of the mine shaft was prepared by B. V. Sanford (1957, p. 212) of the Geological Survey of Canada, and is reproduced in Chart E.
Preliminary drilling indicated about 90 feet of overburden, mainly sand and gravel, clay, and till. Below this, strong aquifers were found in the Detroit River limestone and dolomite, in the Syl- vania sandstone, and in the Bois Blanc limestone, to a depth of about 710 feet. Hydrogen sulphide
25
Photo by Sid. Lloyd, Walkenritte
Loading holes in the salt face at the Ojibway mine, Canadian Rock Salt Company. Note the well-beddedcharacter of the salt horizon.
was also encountered in some of the strata. Owing to the difficult water conditions and the presence of hydrogen sulphide gas, it was decided to sink the shaft by the Poetsch method of freezing the ground prior to sinking.
The production shaft, with an inside diameter of 16 feet, was sunk to a depth of 1,100 feet. The ground was frozen to a depth of 750 feet, below the lowermost aquifer, by means of a series of freeze holes drilled 3 feet apart on the circumference of a circle of 32-foot diameter. The concrete shaft- lining ranges from 16 to 30 inches in thickness depending on ground and water conditions. The lining was grouted after the shaft was completed. After the ground thawed, additional grouting was carried out, as required, to seal leaks.
Some interesting information on water conditions in the central pilot hole, drilled to examine the formations and water conditions and to provide a pressure-relief hole, are given by C. P. Gail (1954, p. 3):
In drilling the centre hole, the following water data was obtained: The sand and gravel strata at about 8 feet was found to carry a moderate flow of water. This was probably surface water. The clay and other stratas down to 87 feet were wet, but no pronounced water veins were indicated. As the hole was drilled below 87 feet in the rock, the static level of the water rose to the surface and overflowed the 10-inch casing.
The artesian water flows, as measured while drilling, were as follows: at 137 feet, 200 g.p.m.; 175 feet, 250 g.p.m.; 203 feet, 500 g.p.m.; 207 feet, 750 g.p.m.; and at 210 feet a flow of 1,150 g.p.m. overflowed the 11-inch casing. Therefore it was evident that a water vein of considerable capacity existed at the 210-foot depth.
26

Photo by Sid. Lloyd, Walkerville
Primary crushing at the Ojibway mine, Canadian Rock Salt Company.
As the hole was drilled below the 210-foot depth, the overflow decreased, so that at 625-foot depth the overflow was about 390 g.p.tn., which remained fairly constant down to 710 feet. At 710 feet another water vein was tapped which, when isolated from the upper flows, had a static level of approximately minus 27 feet. By an injection test and the ob servance of the draw-down while pumping, the capacity of this water vein was calculated to be about 625 g.p.m.
A survey of the vertical water flows was made after the center hole was drilled down to 785 feet, and the following deductions were made: inasmuch as the overflow water de creased after the hole was drilled below the 210-foot depth, a part of the water from that zone passed down into the other strata to 710 feet which are believed normally dry, but possibly porous. A vertical flow survey indicated that at 230 feet 195 g.p.m. was flowing downward from 210 feet, and at 365 feet 120 g.p.m. was flowing downward. After the 710-foot water vein was tapped the survey indicated about 30 g.p.m. flowing from above into the 710-foot vein.
This evidence on the flow of water from strong aquifers into normally dry, but porous, strata
penetrated during drilling, indicates the necessity of plugging drill holes after abandonment, in order to ensure that water, brine, oil, or gas are retained in their original formations.
Work on the production shaft began in the fall of 1952, and the property began operating in August 1955. An access shaft, 12 feet in diameter, also sunk by the freezing method, was completed in 1959 to a depth of 1,025 feet.
Mining MethodsThe salt bed being mined lies at an elevation of
975-948 feet below the shaft collar. The bed averages 27 feet in thickness and, being flat-lying, is mined by the room-and-pillar method. A thickness of 18-21 feet of salt is mined, leaving some 6 feet of salt in the roof for extra stability.
27
Photo by Sid. Lloyd, Walkervitte
Drilling jumbo at the Ojibway m ine, Canadian Rock Salt Company.
Rice (1960, p. 9) states that:Extraction to date has been in the range 57 per cent leaving
43 per cent as pillars. Panels 2,000 feet on all sides are worked by a 30-foot wide twin entry system with lateral rooms on either side. Each new panel is transverse to the preceding to distribute weight over a greater area.
The width of the rooms is 50 feet and the pillars between rooms are also 50 feet. 1 The rooms have narrow points of entry to provide extra protection to the roadways.
The mining operation consists of undercutting, drilling, blasting, and loading. Undercutting to a depth of 11 feet is carried out by electrically powered, hydraulically controlled undercutters, which travel across the 50-foot face at an average speed of 7 inches per minute. Drilling is done by a
x The pillar width has now been changed to 60 feet.
jumbo mounting four hydraulic auger drills. The 11-foot drill-round consists of 72 holes spaced horizontally at 4^ feet apart. The upper holes are horizontal, the lower holes are slanted downward to draw the break towards the undercut.
Rice (I960, p. 10) states that:The blasting, after undercutting and drilling are completed,
requires a combination of 40 and 50 per cent Stopeite with electric millisecond delay caps. The break of salt from one blasted face amounts to 650 tons or one ton for each half pound of explosive used. There is very little secondary blast ing required and the break size can be controlled very readily to suit production needs. Scaling is carried on from the muck pile before the loading operation. Any subsequent scaling is done from special trucks with hydraulically extensible plat forms.
The salt is loaded by Joy loaders on to 18-ton diesel Le Tourneau rear-dump haulage units for
28

haulage to the crusher stations. At the crusher station the salt is dumped on a 12-inch grizzly. The throughs go to the primary crusher, a 36 by 54-inch single-roll crusher. The product goes via 2,000-foot conveyors to the skip-loading pockets at the production shaft. These conveyors have a rated capacity of 700 tons per hour. Rice states that the hoisting facilities are designed to handle 500 tons per hour using 10-ton bottom-dump skips. Some fine salt is screened out underground for use in road maintenance in haulageways.
MillingRice (1960, pp. 11-13) describes the mill opera
tions as follows:The processing of the salt after it leaves the mine is rela
tively simple; it consists of crushing, screening and storing functions. The run-of-mine product as it enters the mill is —2^-inch, and after being elevated, flows by gravity through the various screens and crushers for disposition to storage areas and to subsequent bag or bulk movement. The primary screening is carried out on a series of Dillon vibrating screens, the secondary screens of the finer fractions by Rotex screens.
The screened products are carefully analyzed for purity and screen size. The bag filling and bag handling operations are completely mechanized and permit the movement of 5,000 tons per day with relative ease. The individual storage bins hold 200 tons of each product and act mainly as a surge preceding the dispatching of the product to truck or railroad car or to the boat loading facilities. To provide for the large volume of bulk movement encountered, we store 20,000 tons of product in covered storage which moves by conveyor to the dock loading tower 750 feet in the Detroit River. Our facilities will handle the largest boats the new St. Lawrence Seaway accommodates. Boat loading is carried out at the rate of 750 tons per hour and to eliminate the products of attrition involved in handling, a final clean-up screening to ensure the quality of the product is located in this area.
We maintain a laboratory for quality control in the mill for testing products before entering the loading areas. Two boxcar loading points and three truck loading points are included, coupled with scales to provide quick, efficient service and to facilitate movement of boxcars, we use trackmobiles for switching and tending. Outside storage areas will ac commodate 100,000 tons of sized product and may be re covered at the rate of 500 tons per hour which duplicates the normal expected speed of flow in the mill. Duplicate process lines coming from the run-of-mine bins permit repairs to our mill processing equipment without disrupting operations and permits custom hoisting of product on a single side, for an indefinite period, if circumstances require it. To assure continuity of movement during the winter season, barges carrying 1,700 tons move daily to storage depots.
Compaction ProcessAs an integrated segment of our milling process, we recently
initiated a compaction program. In the course of mining and crushing and screening, the resulting fractional proportion of fine salt particles produced by attrition is not in balance with the present market requirement. To control, within limits, the ratio of saleable tonnage to the total amount of salt pro cessed, the compaction program has been designed to provide for the recovery and reconstitution of the fine salt. This method of compaction of granular solids is an allomorphic process which upgrades the fines to a particle size more ac ceptable to the trade. At present, related methods now employed for this purpose such as briquetting and extruding are unsuited to high capacity low cost production require ments.
The nucleus of this process is the compacting mill which consists of two 24" x 24" face smooth rolls both driven,
turning at 28 r.p.m. In operation, the fines passing through the nip are subject to a sufficient high pressure to emerge as a ribbon of material, which after a short period of curing, may be granulated to the required particle size. By feeding the millwith an aggregate preheated to a minimum of 2000F., the curing period is effectively shortened and the amount of power required to achieve plastic deformation of the granules is also reduced.
The roll shafts are mounted in pressure lubricated sleeve bearings designed for an operating force of 250,000 Ibs. Pres sure on the rolls is maintained hydraulically, and power tp the rolls is supplied by a 150 h.p. motor. A head of the material to be compacted is introduced into an inverted type hopper above the mill. This ensures a positive choke feed by gravity into the nip of the rolls.
The process of reconstitution as we have initiated it is capable of handling fines and multi-size particles, within the fines range, and of varying consistencies. Compaction subjects the material to a momentary line pressure of 21,000 Ibs. per lineal inch, the object of the pressure being to eliminate voids by forcible rearrangement of the particles, and thus restore the compacted material to its original crystal density. The pressure must be great enough to actually deform the granular masses during this period of rearrangement. Experience to date indicates we are making a product with characteristics entirely suitable as a saleable product.
The Salt BedThe 18- to 21-foot section of salt exposed in the
mine consists predominantly of white to clear translucent, medium- to coarse-grained salt of 2-5 millimetre grain size. As shown in the accompany ing photographs, the salt bed has a well-banded, almost varved, character. The bedded structure is indicated by dark-grey to yellowish-brown bands generally 3-8 inches apart in the white salt. Where moist air has scoured the salt pillars in airways, it may be seen that the dark bands in the salt contain paper-thin lamellae of anhydrite, which stand out on the "weathered surface" of the salt. Thin, individual 3- to 8-inch beds or units in the face are remarkably persistent in the mine for long distances and must represent a period of uniform deposition broken only by changes in salinity and precipitation, which allowed precipitation of anhy drite for short periods, perhaps owing to influx of less saturated brine into the basin of deposition. Shaly interbeds are lacking.
A noteworthy feature is the presence in many places of large patches of very coarse-grained "pegmatitic," clear crystalline salt replacing the bedded salt. The patches of secondarily crystallized salt range from a few inches to several feet in diameter and are completely surrounded by bedded salt on all sides with no disturbance of the bedding abutting the pegmatitic patch. No dark bands transect the coarse pure pegmatitic salt, but fre quently at the bottom of the recrystallized patch of salt there will be an inch or more of medium-grey, aphanitic anhydrite; this suggests that the salt must have recrystallized in solution with a settling- out and concentration of the anhydrite and other impurites at the bottom of the recrystallized zone.
29
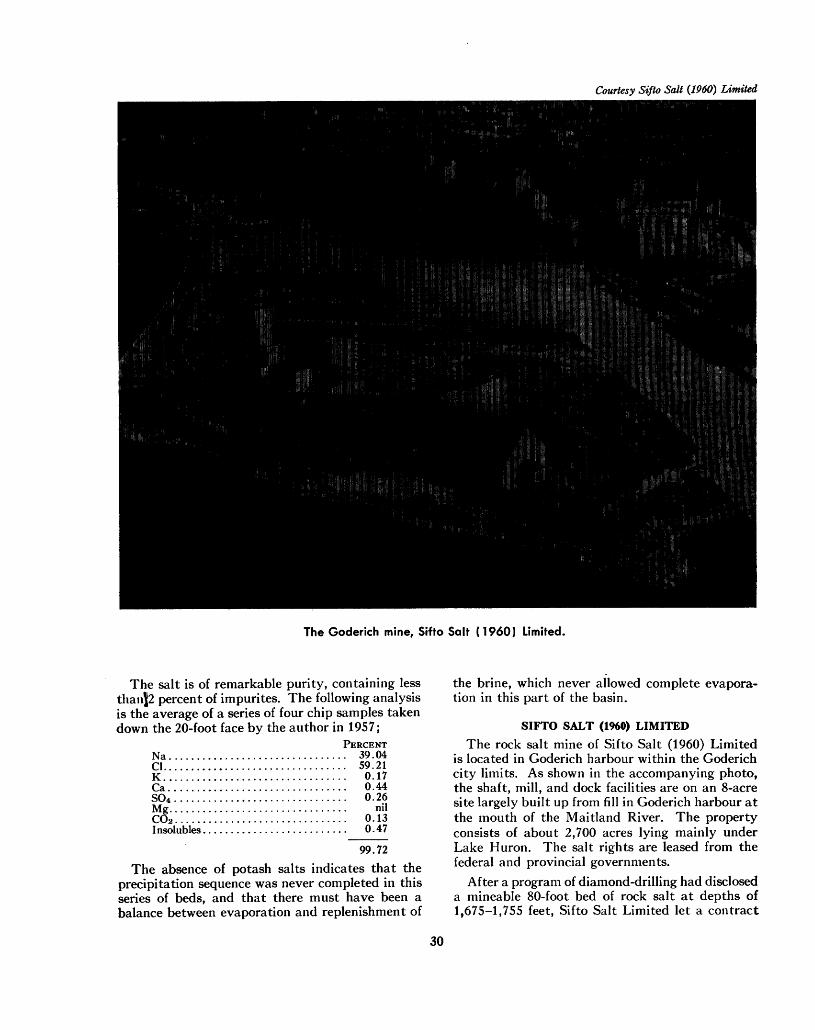
Courtesy Sif lo Salt (1960) Limited
The Goderich mine, Sifto Salt (1960) Limited.
The salt is of remarkable purity, containing less tliau]J2 percent of impurites. The following analysis is the average of a series of four chip samples taken down the 20-foot face by the author in 1957;
PERCENT Na................................ 39.04CI................................. 59.21K........Ca.......SO4 ......Mg.......CO2 Insolubles.
0.17 0.44 0.26
nil 0.13 0.47
99.72The absence of potash salts indicates that the
precipitation sequence was never completed in this series of beds, and that there must have been a balance between evaporation and replenishment of
the brine, which never allowed complete evapora tion in this part of the basin.
SIFTO SALT (1960) LIMITEDThe rock salt mine of Sifto Salt (1960) Limited
is located in Goderich harbour within the Goderich city limits. As shown in the accompanying photo, the shaft, mill, and dock facilities are on an 8-acre site largely built up from fill in Goderich harbour at the mouth of the Maitland River. The property consists of about 2,700 acres lying mainly under Lake Huron. The salt rights are leased from the federal and provincial governments.
After a program of diamond-drilling had disclosed a mineable 80-foot bed of rock salt at depths of 1,675-1,755 feet, Sifto Salt Limited let a contract
30
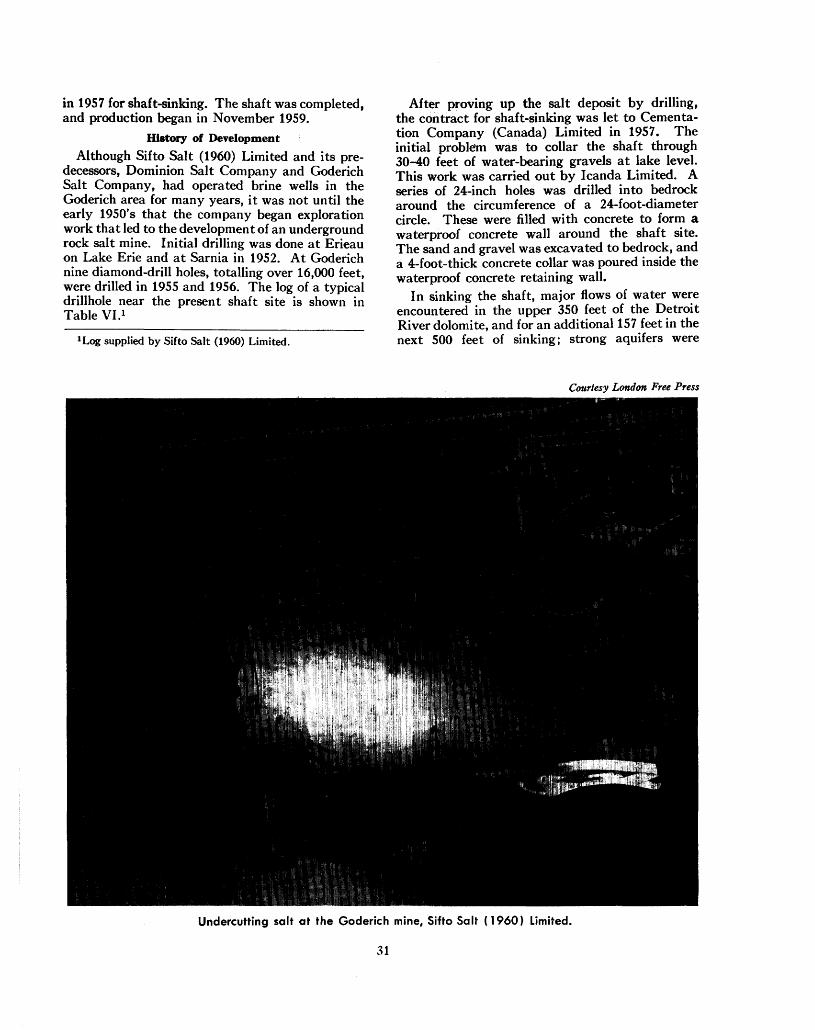
in 1957 for shaft-sinking. The shaft was completed, and production began in November 1959.
History of DevelopmentAlthough Sif to Salt (1960) Limited and its pre
decessors, Dominion Salt Company and Goderich Salt Company, had operated brine wells in the Goderich area for many years, it was not until the early 1950's that the company began exploration work that led to the development of an underground rock salt mine. Initial drilling was done at Erieau on Lake Erie and at Sarnia in 1952. At Goderich nine diamond-drill holes, totalling over 16,000 feet, were drilled in 1955 and 1956. The log of a typical drillhole near the present shaft site is shown in Table VI. 1
*Log supplied by Sifto Salt (1960) Limited.
After proving up the salt deposit by drilling, the contract for shaft-sinking was let to Cementa tion Company (Canada) Limited in 1957. The initial problem was to collar the shaft through 30-40 feet of water-bearing gravels at lake level. This work was carried out by Icanda Limited. A series of 24-inch holes was drilled into bedrock around the circumference of a 24-foot-diameter circle. These were filled with concrete to form a waterproof concrete wall around the shaft site. The sand and gravel was excavated to bedrock, and a 4-foot-thick concrete collar was poured inside the waterproof concrete retaining wall.
In sinking the shaft, major flows of water were encountered in the upper 350 feet of the Detroit River dolomite, and for an additional 157 feet in the next 500 feet of sinking; strong aquifers were
Courtesy London Free Press
Undercutting salt at the Goderich mine, Sifto Salt (1960) Limited.
31
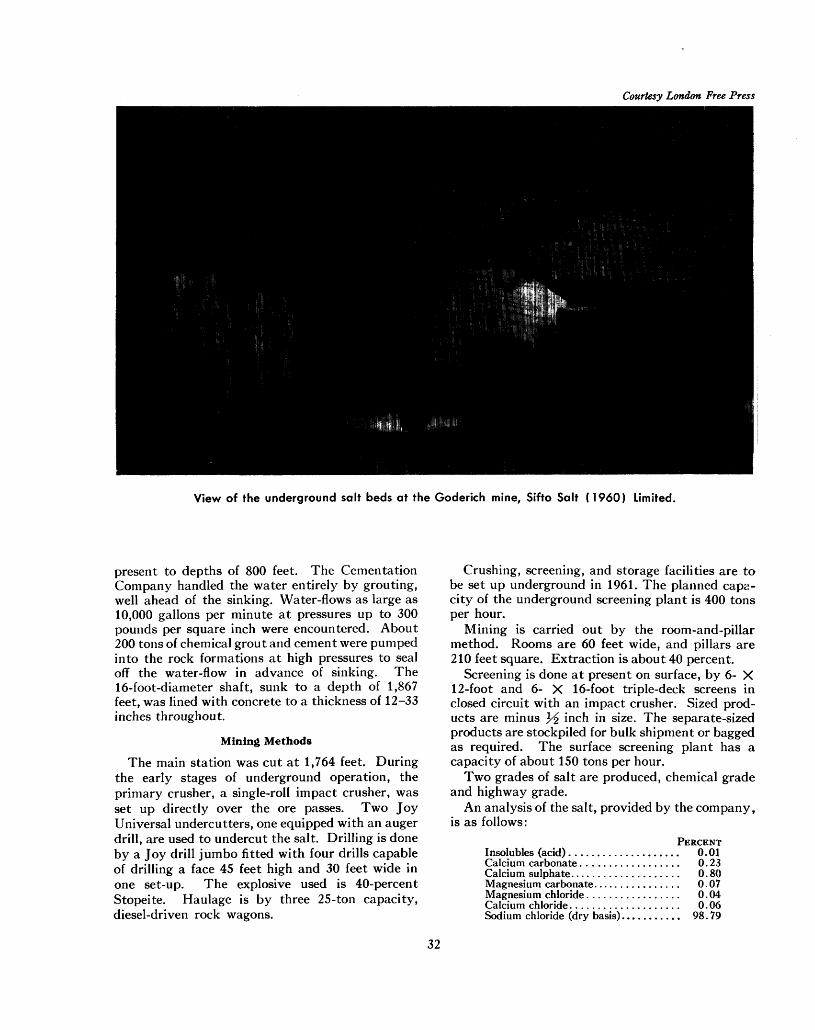
Courtesy London Free Press
View of the underground salt beds at the Goderich mine, Sifto Salt (1960) Limited.
present to depths of 800 feet. The Cementation Company handled the water entirely by grouting, well ahead of the sinking. Water-flows as large as 10,000 gallons per minute at pressures up to 300 pounds per square inch were encountered. About 200 tons of chemical grout and cement were pumped into the rock formations at high pressures to seal off the water-flow in advance of sinking. The 16-foot-diameter shaft, sunk to a depth of 1,867 feet, was lined with concrete to a thickness of 12-33 inches throughout.
Mining Methods
The main station was cut at 1,764 feet. During the early stages of underground operation, the primary crusher, a single-roll impact crusher, was set up directly over the ore passes. Two Joy Universal undercutters, one equipped with an auger drill, are used to undercut the salt. Drilling is done by a Joy drill jumbo fitted with four drills capable of drilling a face 45 feet high and 30 feet wide in one set-up. The explosive used is 40-percent Stopeite. Haulage is by three 25-ton capacity, diesel-driven rock wagons.
Crushing, screening, and storage facilities are to be set up underground in 1961. The planned capa city of the underground screening plant is 400 tons per hour.
Mining is carried out by the room-and-pillar method. Rooms are 60 feet wide, and pillars are 210 feet square. Extraction is about 40 percent.
Screening is done at present on surface, by 6- X 12-foot and 6- X 16-foot triple-deck screens in closed circuit with an impact crusher. Sized prod ucts are minus ^ inch in size. The separate-sized products are stockpiled for bulk shipment or bagged as required. The surface screening plant has a capacity of about 150 tons per hour.
Two grades of salt are produced, chemical grade and highway grade.
An analysis of the salt, provided by the company, is as follows:
PERCENTInsolubles (acid). ................... 0.01Calcium carbonate. . . ............... 0.23Calcium sulphate.................... 0.80Magnesium carbonate..... ...... ..... 0.07Magnesium chloride. ................ 0.04Calcium chloride.. ... . . ............. 0.06Sodium chloride (dry basis)........... 98.79
32

TABLE VI—LOG OF TYPICAL DRILLHOLE—GODERICH MINE
Depth Formation Description
feet0-31
31-291291-390390-632632-846 '846-956 956-1,077
1,077-1,158 1,158-1,196 1,196-1,261 1,261-1,531 1,531-1,915
OverburdenLucas (Detroit River Group)Amherstburg (Detroit River Group)Bois BlancBass IslandSalina (H unit)Salina (G unit)Salina (F unit)Salina (E unit)Salina (D unit)Salina (C unit)Salina (B unit)Salina (A unit)
Sand and gravel.Dolomite.Dolomite.Cherty limestone.Dolomite.Dolomite and shaly dolomite.
956-972 ft., salt; shaly dolomite; 1,012-1,037 ft., salt.Shaly dolomite.1,158-1,190 ft. salt.Shaly dolomite.Salt, interbedded shale, dolomite and anhydrite.Mineable salt horizon, 1,675-1,755 ft; dolomite and shaly dolomite.
TABLE VII—MIDRIM MINING COMPANY LIMITED—ADELAIDE SALT LEASE DRILLING- FINAL ASSAY RESULTS 27 NOVEMBER, 1956
From Department of Mines 8c Technical Surveys—Industrial Minerals Division, Chemical Laboratory, Ottawa.
Hole No.
Adelaide No. 2 .
Adelaide No. 3 .
Adelaide No. 4 .
Adelaide No. 5 .
Core Footage
1,694-1,724 1,724-1,730
1,698-1,727
1,700-1,737
1,699-1,7261,726-1,734
Core Width
feet 30
6
29
37
27 8
Sodium Chloride (NaCl)
percent "'99.34
96.37
"'99.38
"'99.50
"'99.60 98.80
Calcium (Ca)
percent 0.16 0.96
0.19
Sulphur (S04)
percent 0.28 1.81
0.35
Iron and Aluminum (Fe+Al)
percent 0.01 0.08
0.02
Potassium (K)
percent trace trace
0.04
Magnesium (Mg)
percent 0.06 0.11
0.02
Acid (insoluble)
percent 0.13 1.60
0.02
Not assayed
0.12 0.35
0.23 0.55
0.01 0.01
trace trace
0.02 0.04
0.02 0.02
Remarks
clean salt
clean salt
clean salt
clean salt
(^Sections to be mined.
SALT EXPLORATION
Salt Property of M id rim Mining Company1Exploratory drilling has been carried out on a
property near Strathroy, by Midrim Mining Com pany, with a view to establishing a salt mine. The company owns and holds under lease about 5,000 acres of land in Adelaide township, Middlesex county, north of the town of Adelaide, midway between Sarnia and London. The south boundary of the Midrim property adjoins highway No. 22, which is the main paved road between London and Sarnia. Canadian National Railway transportation is avilable at the village of Kerwood about 2 miles south of Adelaide.
The company states that diamond-drilling has indicated reserves of 37,000,000 tons of high-grade white salt in a 35-foot bed of salt of the A2 unit at a depth of about 1,700 feet.
x Data supplied by Midrim Mining Co.
Analyses of the salt bed encountered in four diamond-drill holes on the property were kindly supplied by the company. (See Table VII.)
The log of drillhole No. 5 in Adelaide township, located in lot 10, concession II, Northeast Range, is given in Table VIII. The mineable salt horizon occurs at depths of 1,699-1,734 feet.
DISPOSAL OF ATOMIC WASTES IN SALT MINES
The problem of disposal of atomic wastes has led to a study of the possibility of storing atomic wastes in salt mines. The Committee on Waste Disposal of the National Academy of Sciences and the National Research Council, Division of Earth Sciences, prepared a report on the problem (Chemi cal and Engineering News, 1958) at the request of the Atomic Energy Commission. Conclusions indicate that storage of waste in tanks is the safest and most economical method. Disposal of these tanks in salt mines is likely in the near future. Dis-
33
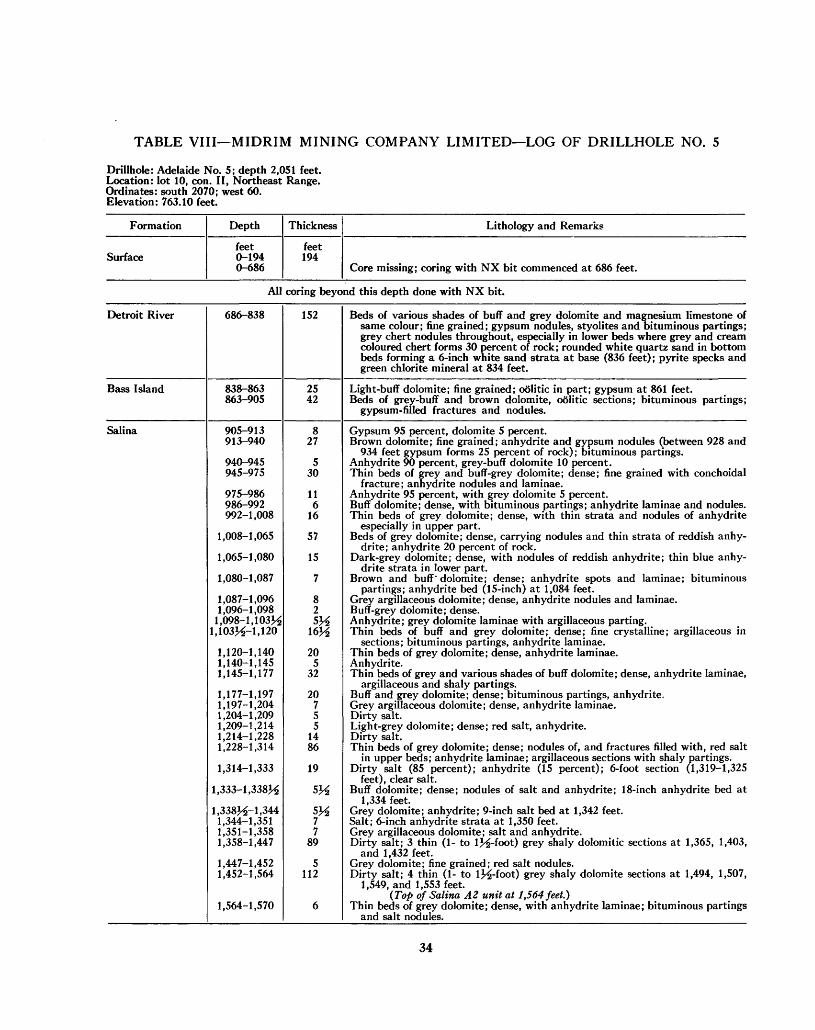
TABLE VIII—MIDRIM MINING COMPANY LIMITED—LOG OF DRILLHOLE NO. 5
Drillhole: Adelaide No. 5; depth 2,051 feet. Location: lot 10, con. II, Northeast Range. Ordinates: south 2070; west 60. Elevation: 763.10 feet.
Formation
Surface
Depth
feet 0-194 0-686
Thickness
feet 194
Lithology and Remarks
Core missing; coring with NX bit commenced at 686 feet.
All coring beyond this depth done with NX bit.
Detroit River
Bass Island
Salina
686-838
838-863863-905
905-913913-940
940-945945-975
975-986986-992992-1,008
1,008-1,065
1,065-1,080
1,080-1,087
1,087-1,0961,096-1,098
1,098-1,103341,103^-1,120
1,120-1,1401,140-1,1451,145-1,177
1,177-1,197 1,197-1,2041,204-1,2091,209-1,2141,214-1,2281,228-1,314
1,314-1,333
1,333-1,338^
1,338J^-1,3441,344-1,3511,351-1,3581,358-1,447
1,447-1,4521,452-1,564
1,564-1,570
152
2542
827
530
116
16
57
15
7
82SM
16^
205
32
20755
1486
19
5^
SM77
89
5112
6
Beds of various shades of buff and grey dolomite and magnesium limestone ofsame colour; fine grained; gypsum nodules, styolites and bituminous partings;grey chert nodules throughout, especially in lower beds where grey and creamcoloured chert forms 30 percent of rock; rounded white quartz sand in bottombeds forming a 6-inch white sand strata at base (836 feet) ; pyrite specks andgreen chlorite mineral at 834 feet.
Light-buff dolomite; fine grained; oolitic in part; gypsum at 861 feet.Beds of grey-buff and brown dolomite, oSlitic sections; bituminous partings;
gypsum-filled fractures and nodules.
Gypsum 95 percent, dolomite 5 percent.Brown dolomite; fine grained; anhydrite and gypsum nodules (between 928 and
934 feet gypsum forms 25 percent of rock) ; bituminous partings.Anhydrite 90 percent, grey-buff dolomite 10 percent.Thin beds of grey and buff-grey dolomite; dense; fine grained with conchoidal
fracture; anhydrite nodules and laminae.Anhydrite 95 percent, with grey dolomite 5 percent.Buff dolomite; dense, with bituminous partings; anhydrite laminae and nodules.Thin beds of grey dolomite; dense, with thin strata and nodules of anhydrite
especially in upper part.Beds of grey dolomite; dense, carrying nodules and thin strata of reddish anhy
drite; anhydrite 20 percent of rock.Dark-grey dolomite; dense, with nodules of reddish anhydrite; thin blue anhy
drite strata in lower part.Brown and buff' dolomite; dense; anhydrite spots and laminae; bituminous
partings; anhydrite bed (15-inch) at 1,084 feet.Grey argillaceous dolomite; dense, anhydrite nodules and laminae.Buff-grey dolomite; dense.Anhydrite; grey dolomite laminae with argillaceous parting.Thin beds of buff and grey dolomite; dense; fine crystalline; argillaceous in
sections; bituminous partings, anhydrite laminae.Thin beds of grey dolomite; dense, anhydrite laminae.Anhydrite.Thin beds of grey and various shades of buff dolomite; dense, anhydrite laminae,
argillaceous and shaly partings.Buff and grey dolomite; dense; bituminous partings, anhydrite. Grey argillaceous dolomite; dense, anhydrite laminae.Dirty salt.Light-grey dolomite; dense; red salt, anhydrite.Dirty salt.Thin beds of grey dolomite; dense; nodules of, and fractures filled with, red salt
in upper beds; anhydrite laminae; argillaceous sections with shaly partings.Dirty salt (85 percent); anhydrite (15 percent); 6-foot section (1,319-1,325
feet), clear salt.Buff dolomite; dense; nodules of salt and anhydrite; 18-inch anhydrite bed at
1,334 feet.Grey dolomite; anhydrite; 9-inch salt bed at 1,342 feet.Salt; 6-inch anhydrite strata at 1,350 feet.Grey argillaceous dolomite; salt and anhydrite.Dirty salt; 3 thin (1- to ij^-foot) grey shaly dolomitic sections at 1,365, 1,403,
and 1,432 feet.Grey dolomite; fine grained; red salt nodules.Dirty salt; 4 thin (1- to l^j-foot) grey shaly dolomite sections at 1,494, 1,507,
1,549, and 1,553 feet.(Top of Salina A2 unit at 1,564 feet.)
Thin beds of grey dolomite; dense, with anhydrite laminae; bituminous partingsand salt nodules.
34
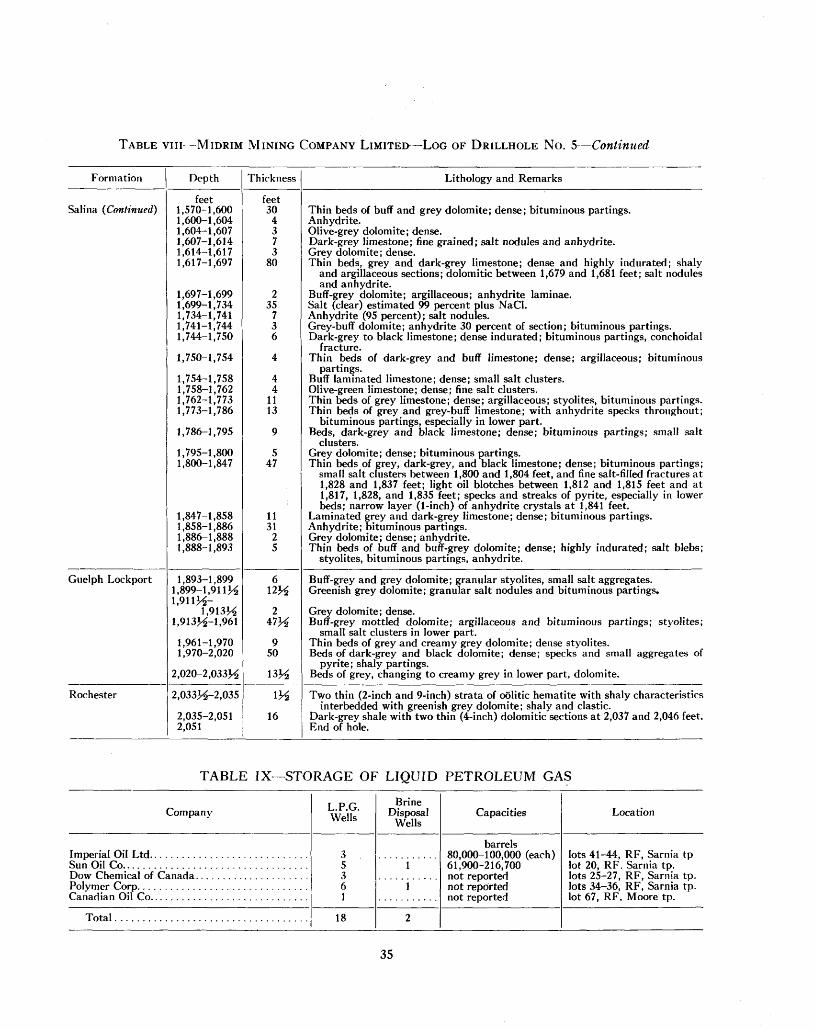
TABLE vin -MIDRIM MINING COMPANY LIMITED—LOG OF DRILLHOLE No. 5—Continued
Formation
Salina {Continued)
Guelph Lockport
Rochester
Depth
feet1,570-1,6001,600-1,6041,604-1,6071,607-1,6141,614-1,6171,617-1,697
1,697-1,6991,699-1,7341,734-1,7411,741-1,7441,744-1,750
1,750-1,754
1,754-1,7581,758-1,7621,762-1,7731,773-1,786
1,786-1,795
1,795-1,8001,800-1,847
1,847-1,8581,858-1,8861,886-1,8881,888-1,893
1,893-1,8991,899-1,911^1,911^-
1.913K1,913^-1,961
1,961-1,9701,970-2,020
2,020-2,033^
2,033^-2,035
2,035-2,0512,051
Thickness
feet30
4373
80
235
736
4
44
1113
9
547
1131
25
612K
247H
950
13M
1H
16
Lithology and Remarks
Thin beds of buff and grey dolomite; dense; bituminous partings.Anhydrite.Olive-grey dolomite; dense.Dark-grey limestone; fine grained; salt nodules and anhydrite.Grey dolomite; dense.Thin beds, grey and dark-grey limestone; dense and highly indurated; shaly
and argillaceous sections; dolomitic between 1,679 and 1,681 feet; salt nodulesand anhydrite.
Buff -grey dolomite; argillaceous; anhydrite laminae.Salt (clear) estimated 99 percent plus NaCl.Anhydrite (95 percent) ; salt nodules.Grey-buff dolomite; anhydrite 30 percent of section; bituminous partings.Dark-grey to black limestone; dense indurated; bituminous partings, conchoidal
fracture.Thin beds of dark-grey and buff limestone; dense; argillaceous; bituminous
partings.Buff laminated limestone; dense; small salt clusters.Olive-green limestone; dense; fine salt clusters.Thin beds of grey limestone; dense; argillaceous; styolites, bituminous partings.Thin beds of grey and grey-buff limestone; with anhydrite specks throughout;
bituminous partings, especially in lower part.Beds, dark-grey and black limestone; dense; bituminous partings; small salt
clusters.Grey dolomite; dense; bituminous partings.Thin beds of grey, dark-grey, and black limestone; dense; bituminous partings;
small salt clusters between 1,800 and 1,804 feet, and fine salt-filled fractures at1,828 and 1,837 feet; light oil blotches between 1,812 and 1,815 feet and at1,817, 1,828, and 1,835 feet; specks and streaks of pyrite, especially in lowerbeds; narrow layer (1-inch) of anhydrite crystals at 1,841 feet.
Laminated grey and dark-grey limestone; dense; bituminous partings.Anhydrite; bituminous partings.Grey dolomite; dense; anhydrite.Thin beds of buff and buff -grey dolomite; dense; highly indurated; salt blebs;
styolites, bituminous partings, anhydrite.
Buff -grey and grey dolomite; granular styolites, small salt aggregates.Greenish grey dolomite; granular salt nodules and bituminous partings.
Grey dolomite; dense.Buff -grey mottled dolomite; argillaceous and bituminous partings; styolites;
small salt clusters in lower part.Thin beds of grey and creamy grey dolomite; dense styolites.Beds of dark-grey and black dolomite; dense; specks and small aggregates of
pyrite; shaly partings.Beds of grey, changing to creamy grey in lower part, dolomite.
Two thin (2-inch and 9-inch) strata of oolitic hematite with shaly characteristicsinterbedded with greenish grey dolomite; shaly and clastic.
Dark-grey shale with two thin (4-inch) dolomitic sections at 2,037 and 2,046 feet.End of hole.
TABLE IX— STORAGE OF LIQUID PETROLEUM GAS
Company
Total
L.P.G.Wells
35361
18
Brine Disposal
Wells
1
1
2
Capacities
barrels 80,000-100,000 (each)61,900-216,700
Location
lots 41-44, RF, Sarnia tplot 20, RF. Sarnia tp.lots 25-27, RF, Sarnia tp.lots 34-36, RF, Sarnia tp.lot 67, RF. Moore tp.
35
posal in deep porous beds is the best distant-future possibility.
Since salt is impervious to water seepage, the mined-out spaces are dry. The relatively high thermal conductivity of salt and its high melting point would permit waste storage at moderate temperatures without effect on cavity walls. This assumes that salt plasticity is not increased by long- continued exposure to elevated temperatures. Since heat is generated by the wastes, there must be some provision for cooling.
STORAGE OF LIQUID PETROLEUM GAS IN SALT BEDS
In the Sarnia area, underground caverns for the storage of butane, propane, ethylene, propylene, etc., have been formed by solution of the B and A2 salt horizons. Petroleum products will not dissolve salt and are not contaminated by it. When hydro carbons are removed from the top of the cavity, brine from a brine pit or brine disposal well is simultaneously injected into the bottom of the cavity, which is kept full of liquid at all times.
Imperial Oil Limited has three Liquid Petroleum Gas (L.P.G.) storage wells in Sarnia township for the storage of butane, ethylene, and other products. These cavities are reported to have capacities of from 80,000 to 100,000 barrels each. Sun Oil Company has five L.P.G. storage wells and one brine displacement well for the storage of butane, fuel oil, gasolene, etc., in Sarnia township. These cavities have capacities of from 60,000 to over 200,000 barrels each. Dow Chemical of Canada have three L.P.G. storage wells in lots 25-27, R.F., Sarnia township. The Polymer Corporation has six L.P.G. wells and one brine disposal well in lots 33-36, R.F., Sarnia township. The Canadian Oil Company has one L.P.G. well in Moore township.
This data is summarized in Table IX.A comparison of costs of surface and underground
storage has been made (Chemical and Engineering News 1958, pp. 104-6). In Louisiana, storage capacity for 1,000,000 barrels was established underground at a cost of Si.00 per barrel. Surface L.P.G. storage costs are reported in the neighbour hood of SI2.00 per barrel.
36
Bibliography
Badger, W. L. and Standiford, F. C.1955: Engineering in salt manufacture; Chemical Engineering, Vol. 62, No. 3,
pp. 173-77, 180-83. Bishop, R. A.
1953: Saskatchewan exploratory progress and problems; Alberta Soc. Petro leum Geologists News Bull.
Briggs, L. I.1958: Evaporite facies; Jour. Sedimentary Petrology, Vol. 28, No. l, pp. 46-
56. Caley, J. F.
1945: Paleozoic geology of the Windsor-Sarnia area; Geol. Surv. Canada,Mem. 240.
Chemical Engineering1952: A radical tack in salt making: Chemical Engineering, Jan. 1952.
Chemical and Engineering News1957: News Item; Chemical and Engineering News, 29 Apr. 1957, pp. 104-6. 1958: Salt away atomic wastes; Chemical and Engineering News, 10 Feb.
1958, pp. 54-55. Cole, L. H.
1915: The salt deposits of Canada and the salt industry; Canada Dept.Mines, Mines Branch, Pub. No. 325.
1930: The salt industry of Canada; Canada Dept. Mines, Mines Branch,Pub. No. 716.
Dellwig, L. F.1955: Origin of Salina salt in Michigan; Jour. Sedimentary Petrology,
Vol. 25, No. 2, pp. 83-110. Evans, C. S.
1950: Underground hunting in the Silurian of southwestern Ontario; Geol.Assoc. Canada Proc., Vol. 3, pp. 55-85.
Gail, C. P.1954: The application of the freezing method to shaft sinking at the Ojibway
mine of the Canadian Rock Salt Company Limited; C.I.M.M. (paper presented at annual meeting, Toronto, April 1954).
Grieve, R. O.1955: Leaching (?) of Silurian salt beds in southwestern Ontario as evidenced
in wells drilled for oil and gas; C.I.M.M. Trans., Vol. LVIII, pp. 10-16.
Hardy, W. L.1957: Manufacture of sodium chloride; Industrial and Engineering Chem.,
Vol. 49, pp. 59, 60. Hester, A. S. and Diamond, H. W.
1955: Salt manufacture; Industrial and Engineering Chem., Vol. 47, pp. 672-83.
Kaufman, D. W. and Slawson, C. B.1950: Ripple marks in rock salt of the Salina formation; Jour. Geol., Vol. 58,
pp. 24-29. Landes, K. K.
1945a: The Salina and Bass Island rocks in the Michigan basin; U.S. Geol.Surv., prelim, map No. 40 (Oil and Gas Investigation Series).
1945b: The Mackinac breccia, subsurface stratigraphy, economic geology, from Geology of the Mackinac straits region; Michigan Geol. Surv., Pub. No. 44.
37
McfcMillan, R. T.1960: Salt, Chapter 40 of Industrial Minerals and Rocks (3rd edition);
A.I.M.E., pp. 727-28. Mamen, C.
1956: Rock salt mining at Ojibway; Canadian Mining Jour., vol. 77, pp. 37-43.
O'Day, M. F.1958: Safety with diesels at Ojibway rock salt mines; Canadian Mining
Jour., Sept., p. 107. Phalen, W. C.
1949: Salt, Chapter 40 of Industrial Minerals and Rocks (2nd edition);A.I.M.E., pp. 834-37.
Posnjak, E.1940: The deposition of calcium sulphate from sea water; American Jour.
Science, Vol. 35, pp. 247-72. Rice, W. M.
1960: The origin and mining of rock salt deposits in Canada; C.I.M.M.(paper presented at annual meeting, Toronto, April 1960).
Richards, R. B.1952: New salt process omits usual problems; Chem. Engineering, Vol. 59,
p. 140. Roliff, W. A.
1949: Salina-Guelph fields of southwestern Ontario; American Assoc. Petro leum Geologists, vol. 33, pp. 153-88.
Sanford, B. V.1957: Salt deposits at Ojibway from Geology of Canadian Industrial Min
erals; C.I.M.M. (Sixth Commonwealth Mining and Metallurgical Congress), p. 212.
Sanford, B. V. and Brady, W. B.1955: Paleozoic geology of the Windsor-Sarnia area; Geol. Surv. Canada,
Mem. 278 (supplement to mem. 240). Taft, R.
1946: Kansas and the nation's salt; Kansas Acad. Science, Vol. 49, No. 3,p. 246.
Trump, E. N.1944: Mining soluble salines by well; A.I.M.E. (T.P. 1733), Mining Tech
nology, Mav. Wilson, H. A.
1947: An outline of the history and development of the salt industry in Canada; C.I.M.M. Trans., Vol. L, p. 530.
2,000—1962—SSS8 mh
38


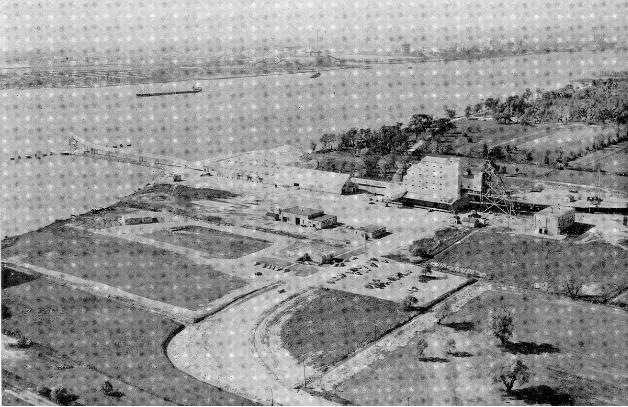
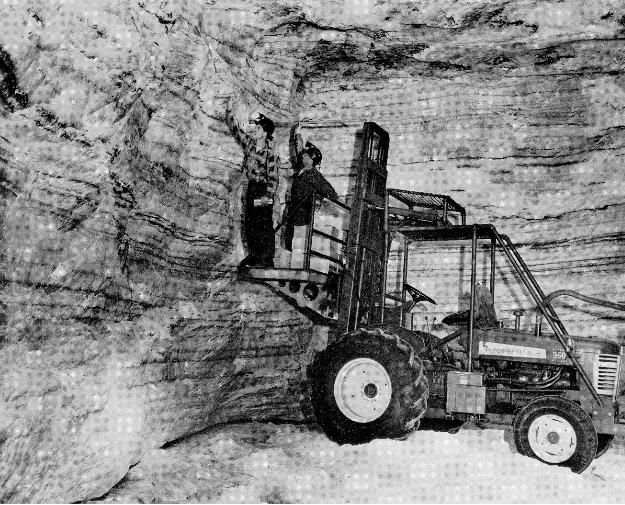
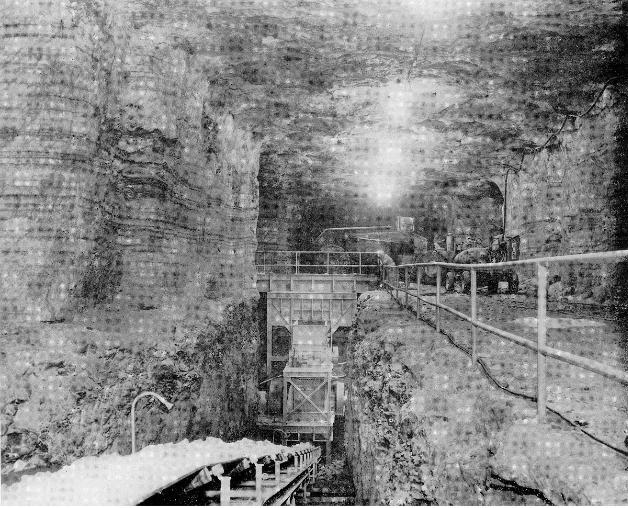
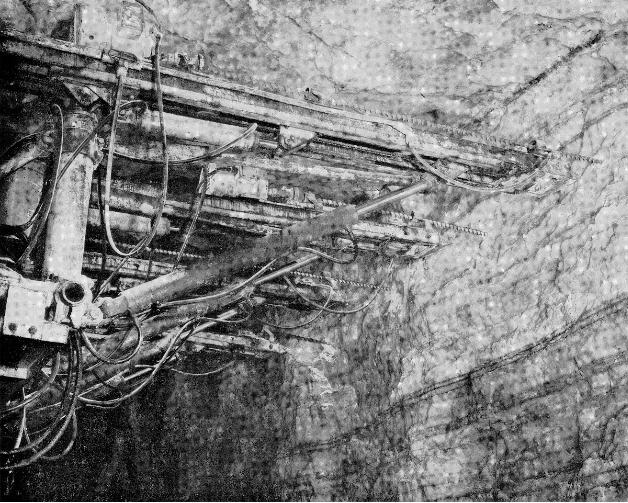
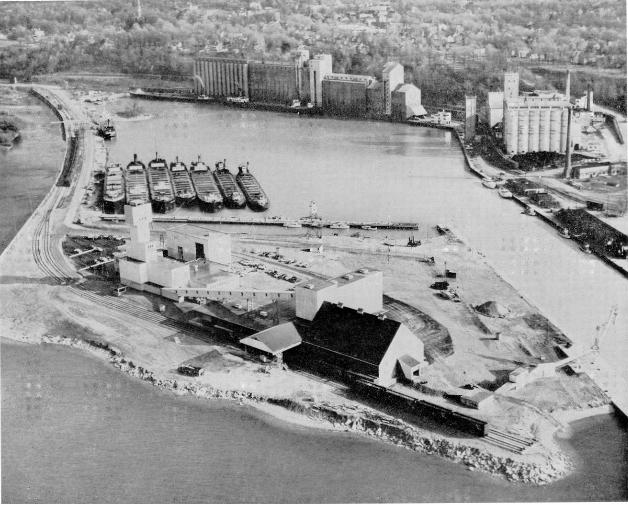
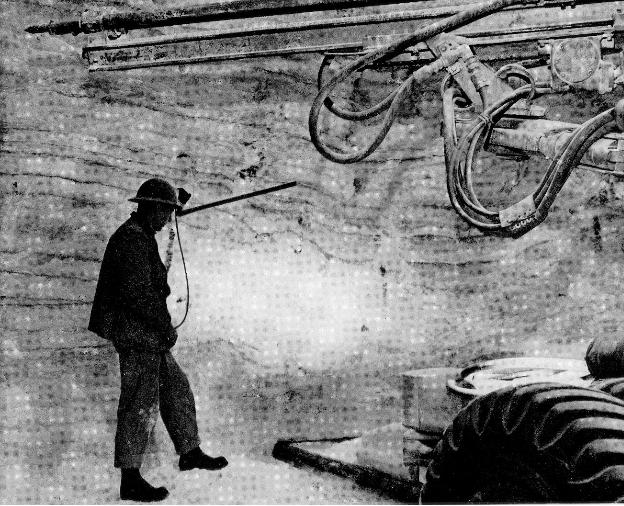
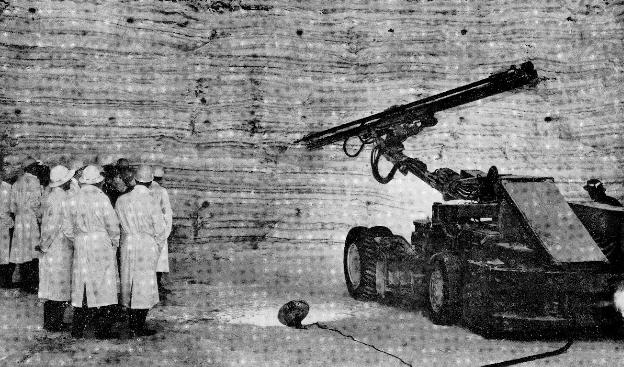
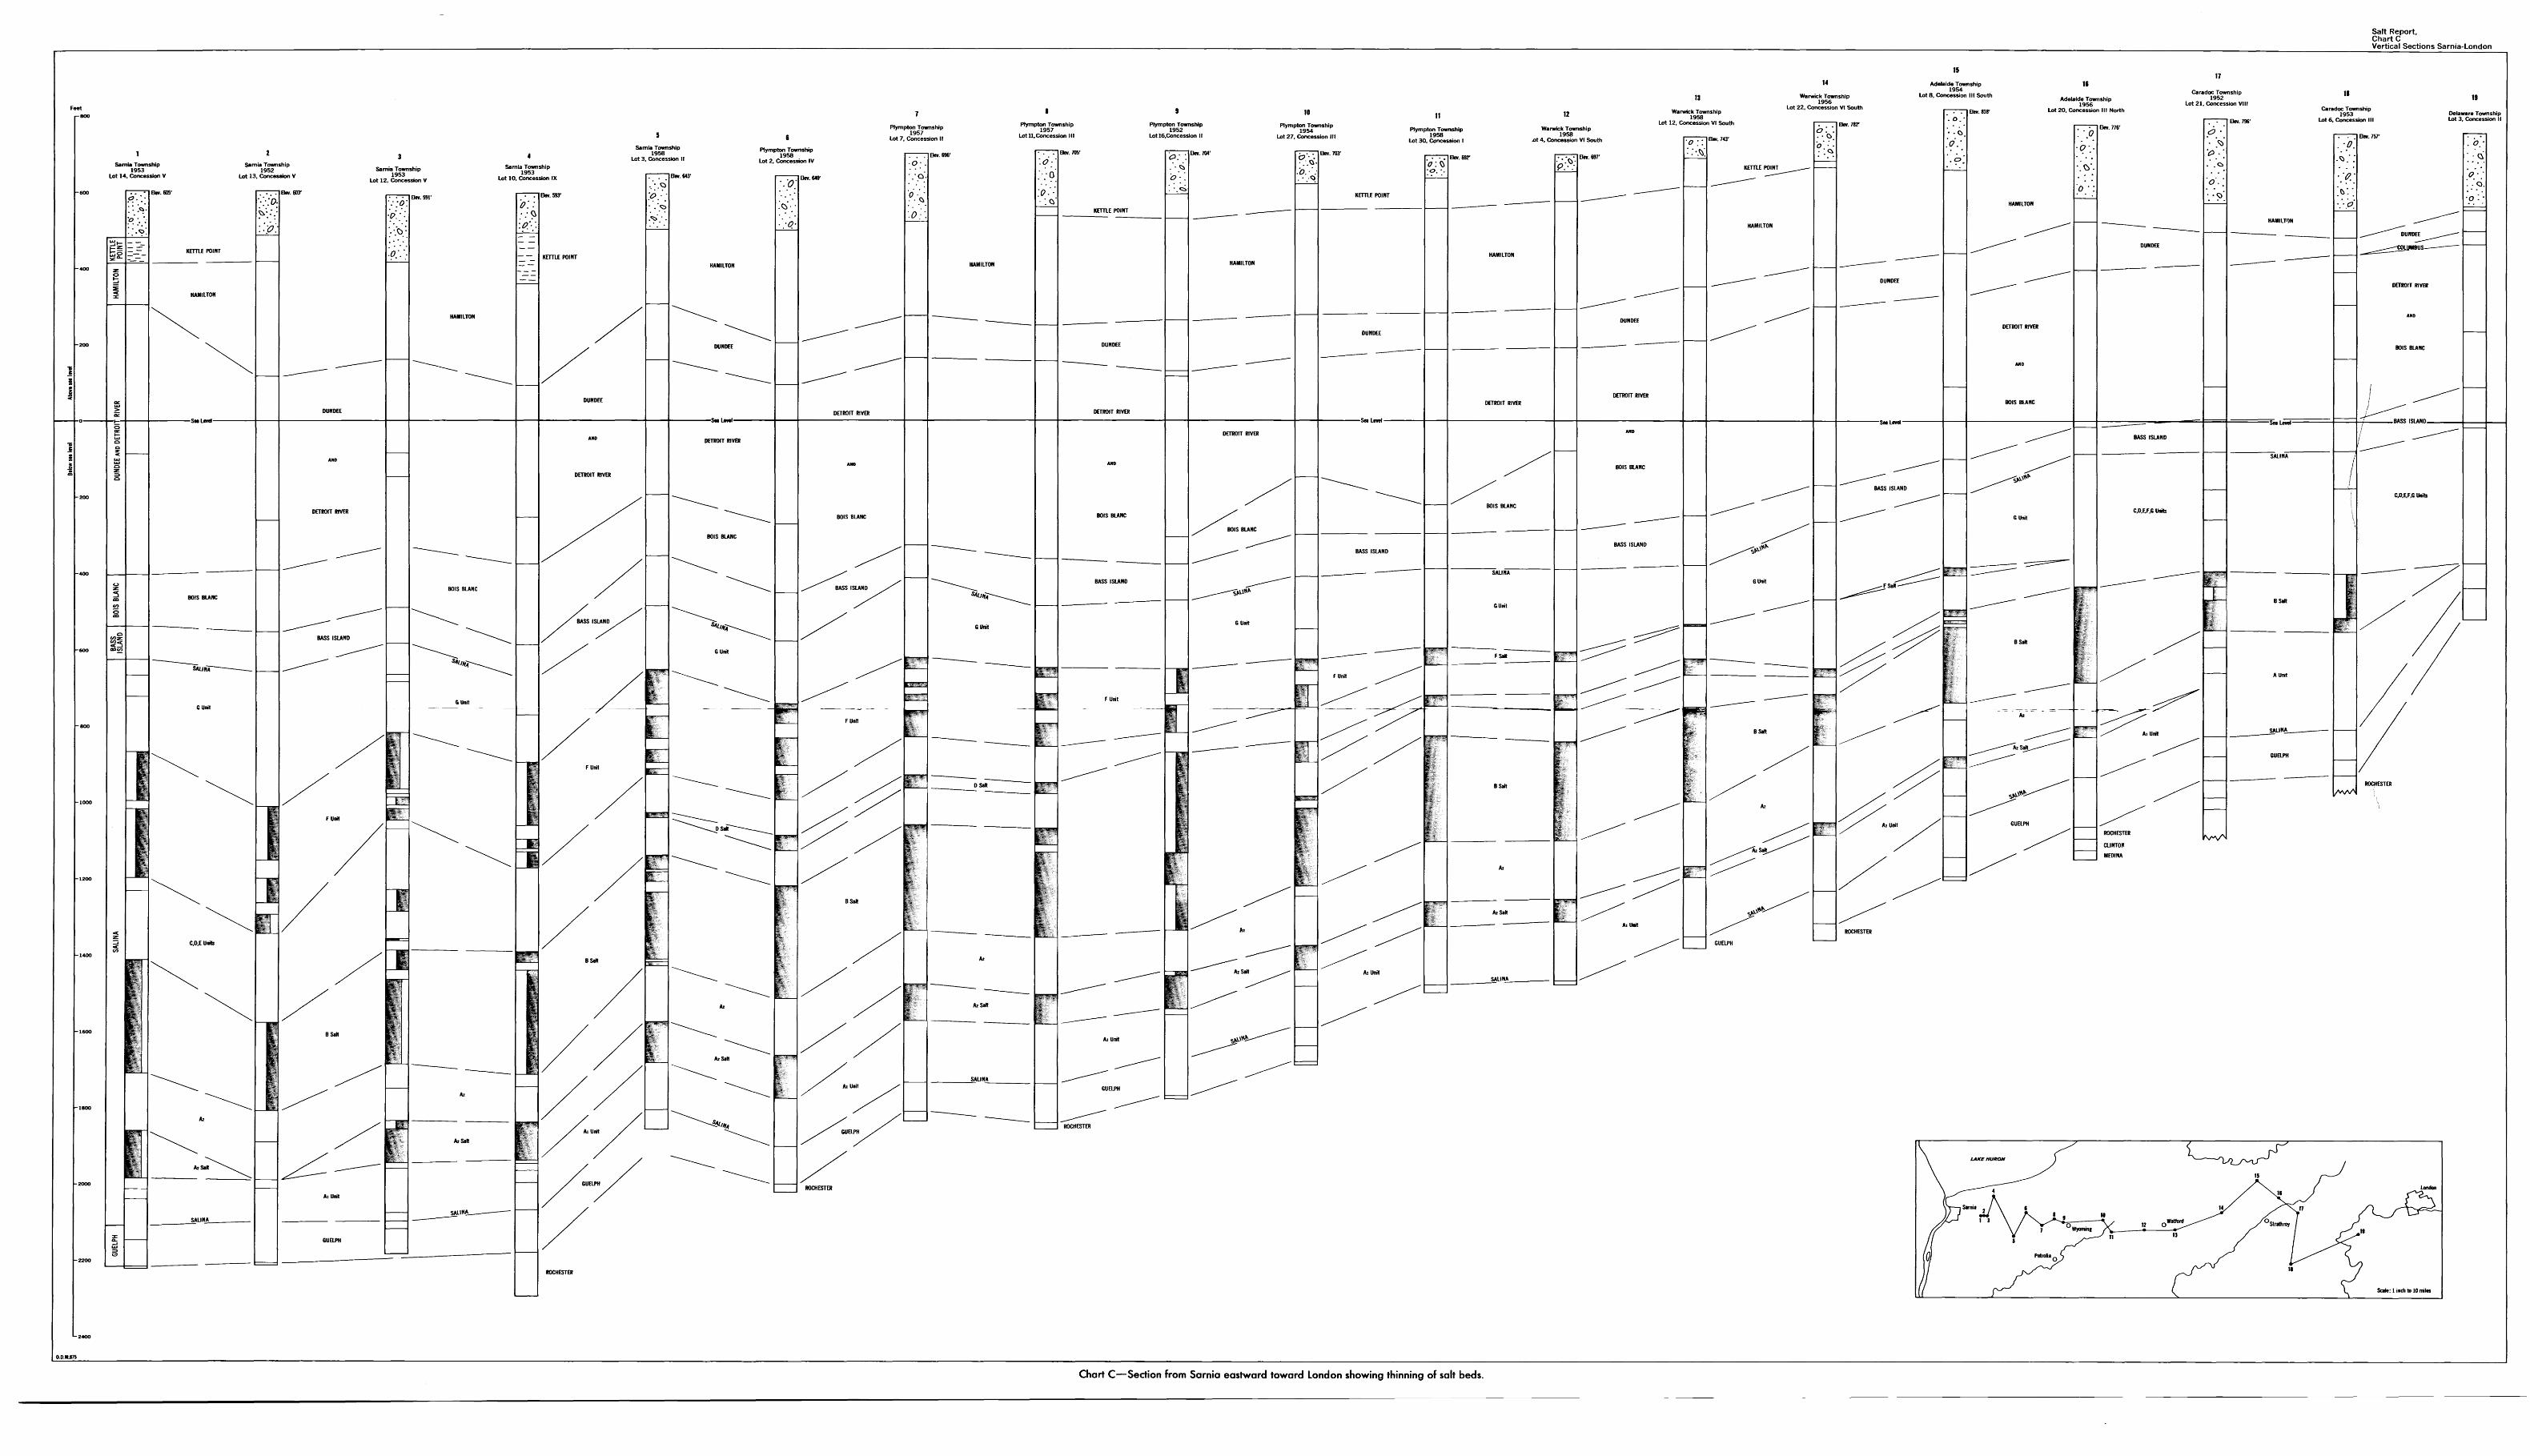
Salt Report,Chart CVertical Sections Sarnia-London
FeetI-8OO
Warwick Township1956
Lot 22. Concession VI South
Adelaide Township1954
Lot 8. Concession III South Adelaide Township1956
Lot 20, Concession III North
Caradoc Township1952
Lot 21. Concession VIII
Plympton Township1957
Lot 7, Concession II
Plympton Township1957
Lot 11.Concession III
Caradoc Township1953
Lot 6. Concession IIIDelaware Township Lot 3. Concession II
Chart C—Section from Sarnia eastward toward London showing thinning of salt beds.
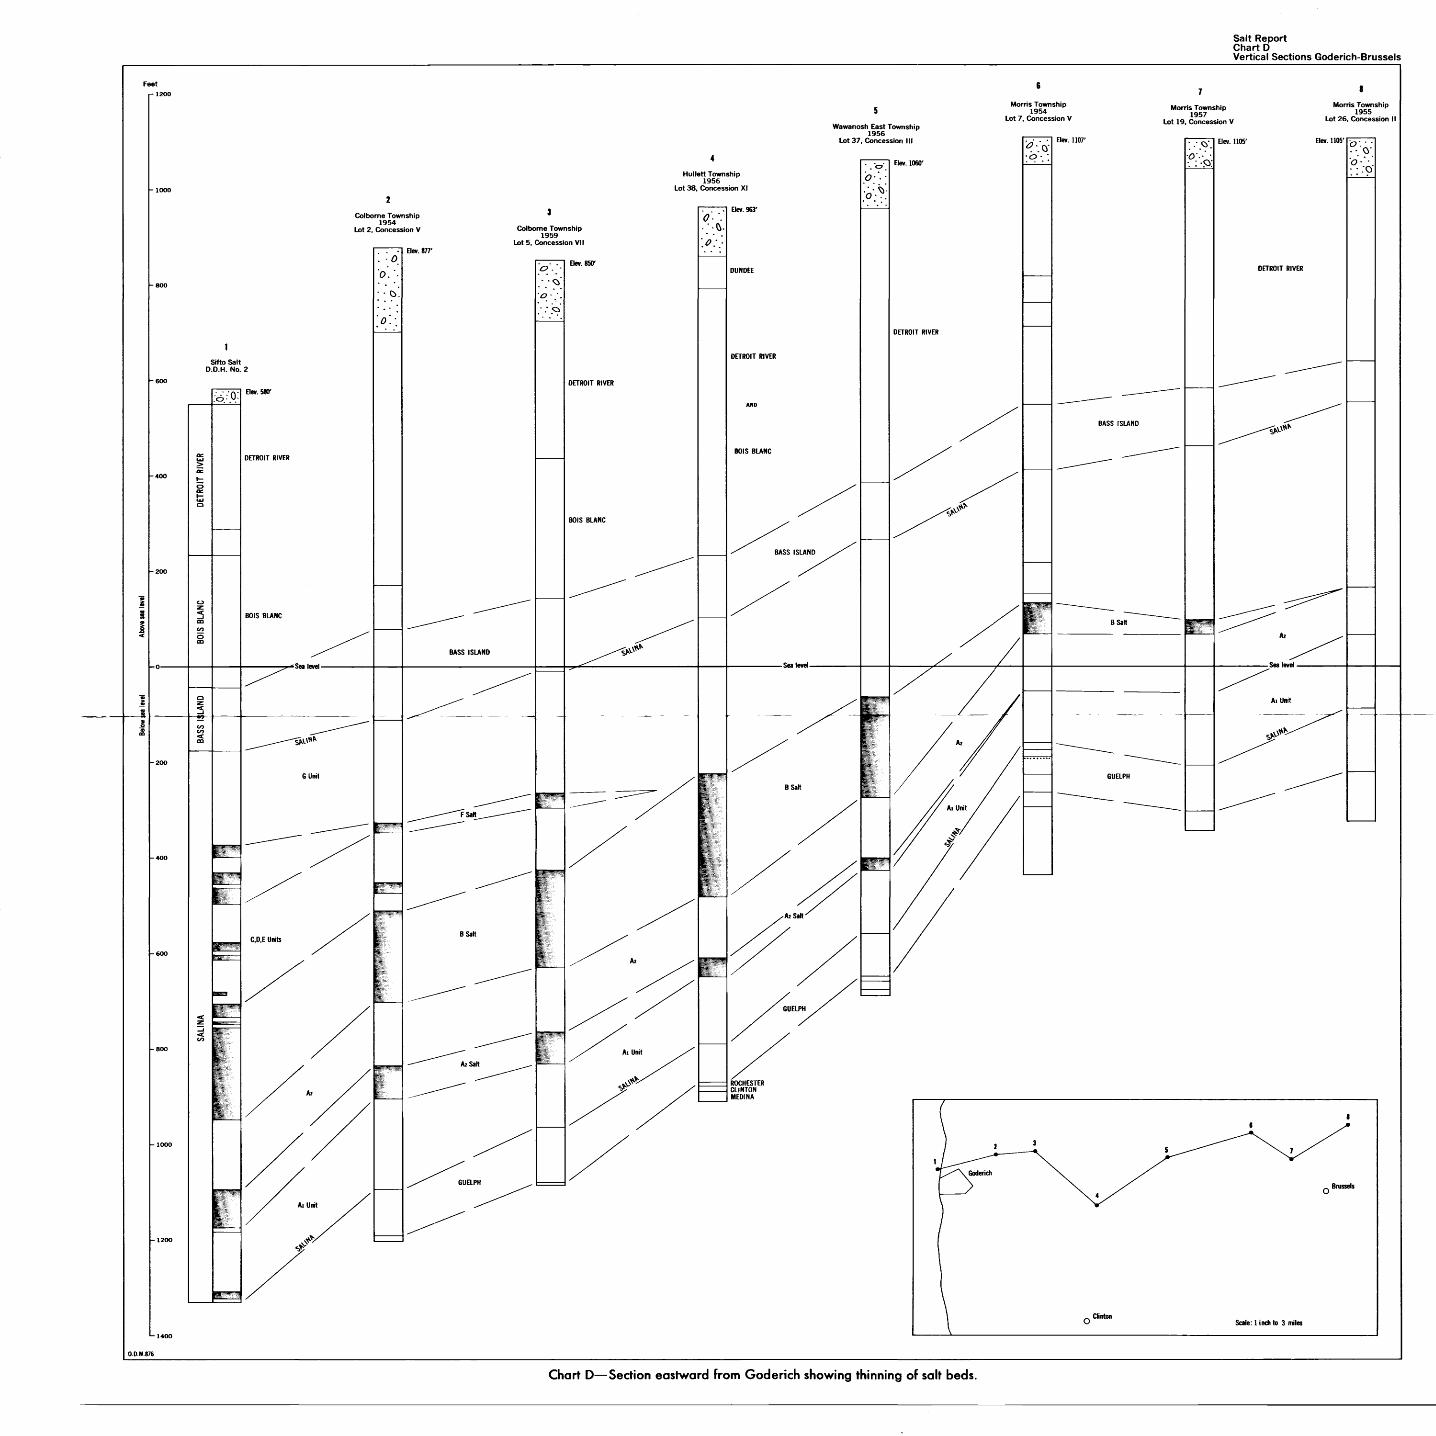
Salt ReportChart DVertical Sections Goderich-Brussels
Chart D—Section eastward from Goderich showing thinning of salt beds.
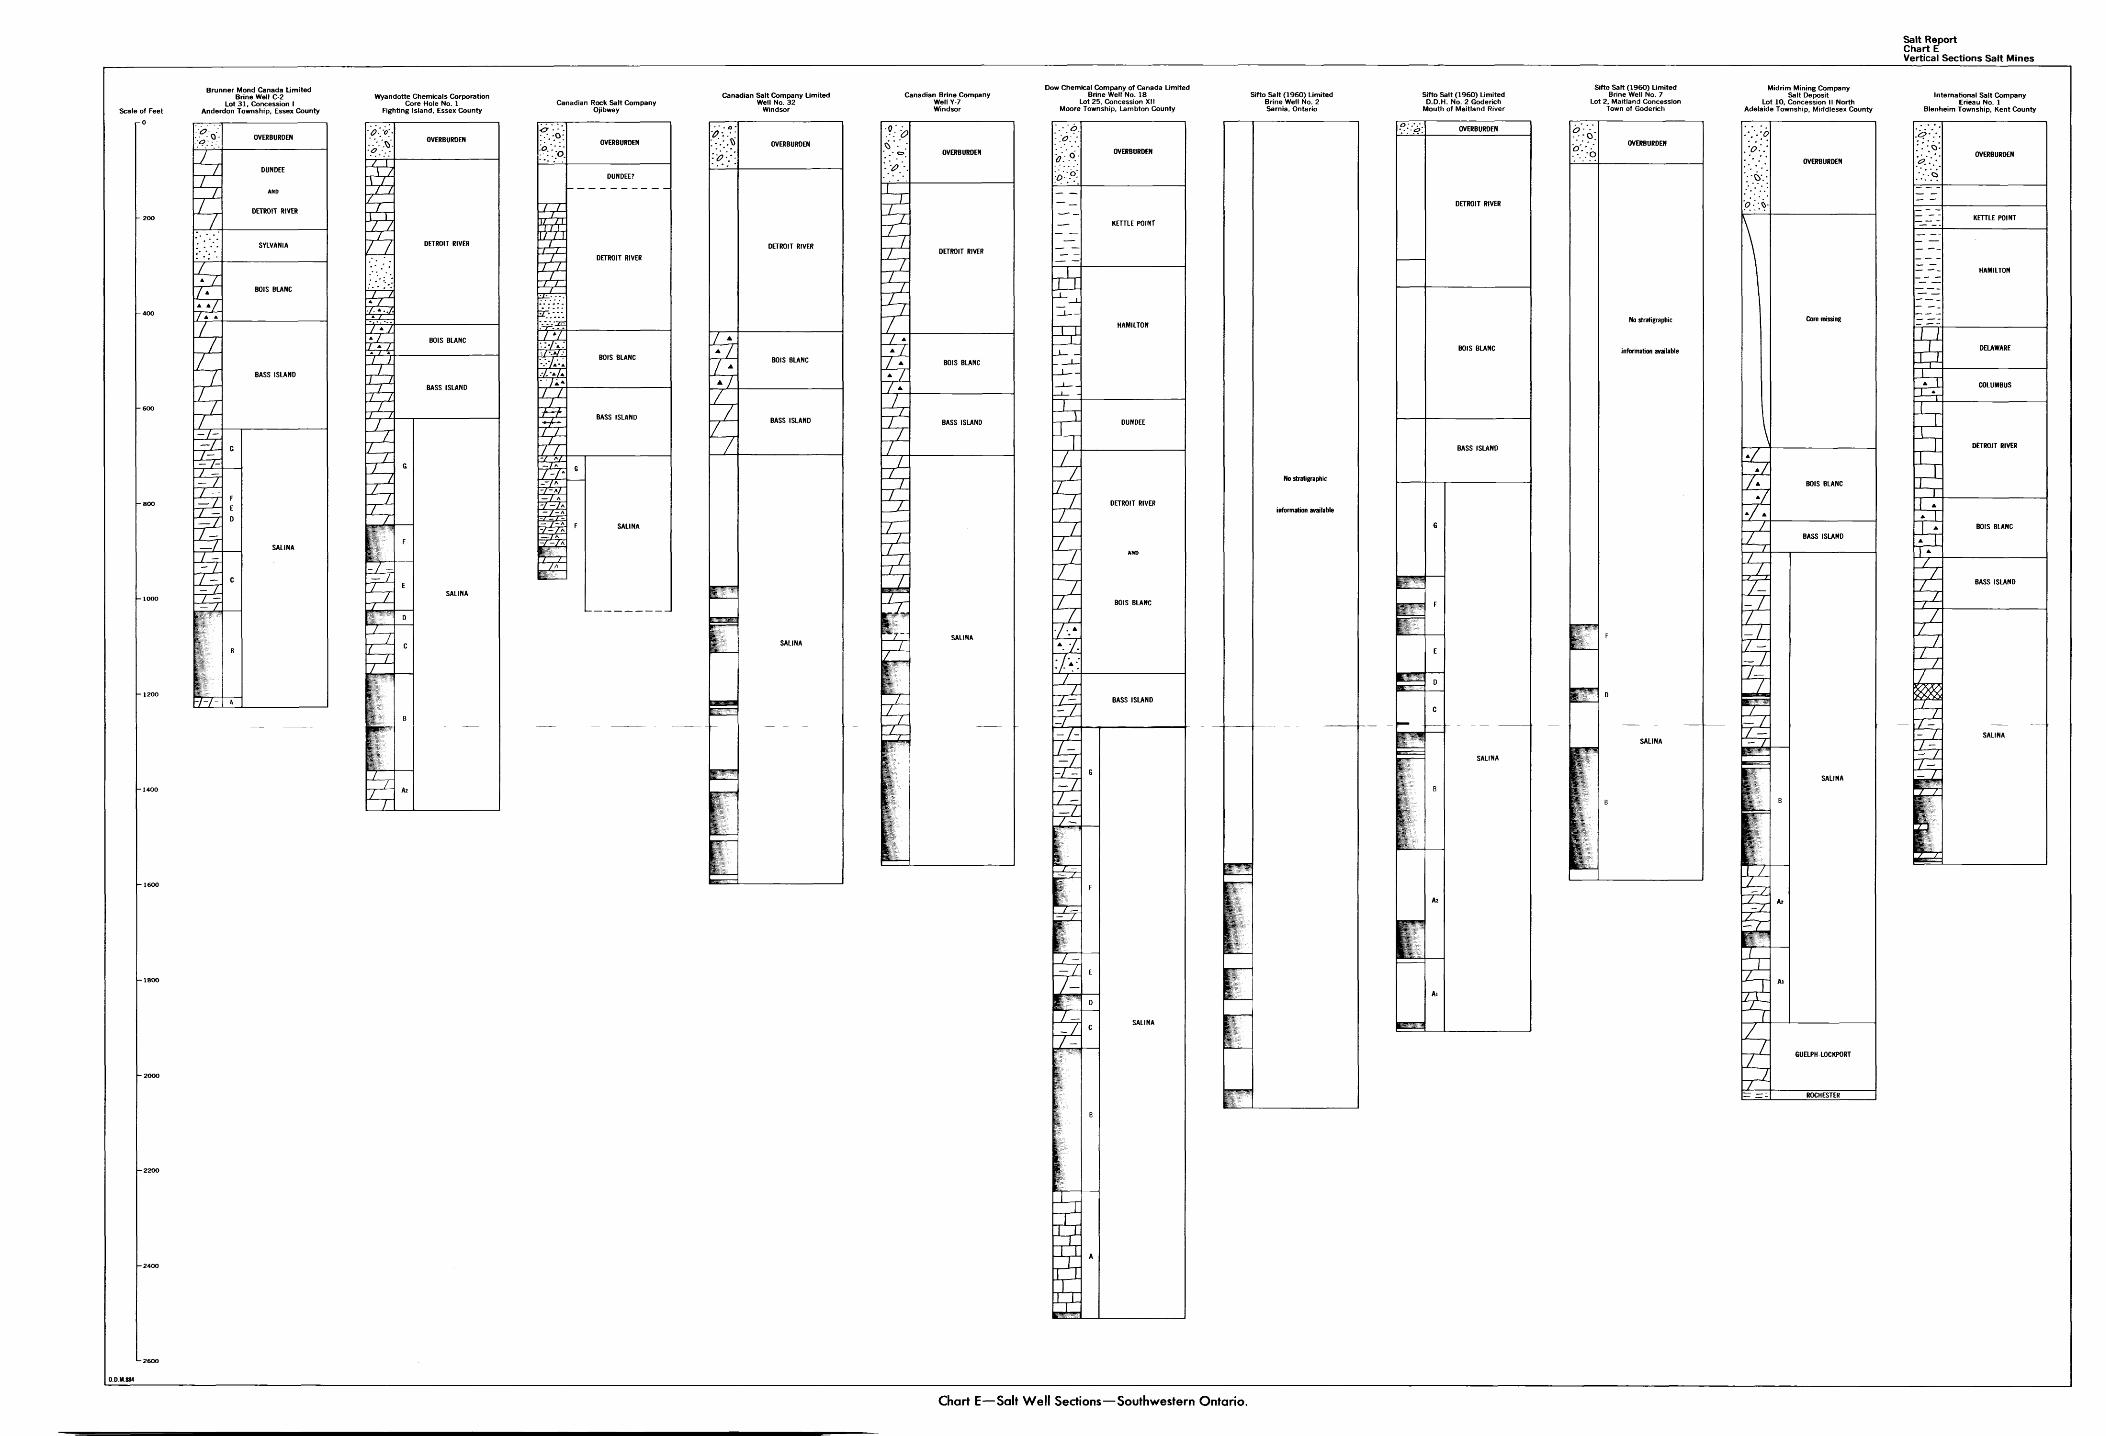
Salt ReportChart EVertical Sections Salt Mines
Brunner Mond Canada LimitedBrine Well C-2
Lot 31, Concession lAnderdon Township, Essex County
O'-
ZL
DUNDEE
AND
DETROIT RIVER
Wyandotte Chemicals CorporationCore Hole No. l
Fighting Island, Essex County
O. 'O
/T-LT/
f f
7 Z
II
Canadian Rock Salt Company Ojibway
Canadian Salt Company LimitedWell No. 32
Windsor
ITT7~73,T"T'\rn
LILTT
L
L
Canadian Brine Company Well Y-7 Windsor
7
OVERBURDEN
Dow Chemical Company of Canada LimitedBrine Well No. 18
Lot 25, Concession XIIMoore Township, Lambton County
o:r o
Z7
KETTLE POINT
Sifto Salt (1960) Limited Brine Well No. 2 Sarnia, Ontario
Sifto Salt (1960) Limited D.D.H. No. 2 Goderich
Mouth of Maitland River
Sifto Salt (1960) LimitedBrine Well No. 7
Lot 2, Maitland ConcessionTown of Goderich
No stratigraphic
information available
OVERBURDEN
DETROIT RIVER
:o
No stratigraphic
information available
Midrim Mining CompanySalt Deposit
Lot 10, Concession II North Adelaide Township, Middlesex County
L
Core missing
BOIS BLANC
GUELPH LOCKPORT
International Salt CompanyErieau No. l
Blenheim Township, Kent County
Lj.
OVERBURDEN
COLUMBUS
BASS ISLAND
Chart E—Salt Well Sections—Southwestern Ontario.