youth brigade welcome –solidarity bingo a “snapshot” of america –wealth and income unions...
TRANSCRIPT
Youth Brigade
Welcome– Solidarity Bingo
A “Snapshot” of America– Wealth and Income
Unions and Inequality– Present Challenges
To start…intros…Stuart Eimer Raised in Sayreville, NJ
– Working class union family…IBEW Local 3 in NYC
Rutgers University– Union scholarship…first to go to college
Graduate School @ University of Wisconsin – Shop Steward & Delegate to AFL-CIO Central Labor Council
Teach classes on social class, poverty, unions…– Research focuses on labor politics, labor history, central labor councils and
SEIU (including the YB)
Now live near Philly & teach Sociology at Widener University in Chester, PA
Who are you…Interviews Name and where you are from
Is your parent in a union? If yes, which union?
Why you decided to spend your summer working in the organizing department of a a union…not your typical summer job
Is there anything in particular you’d like to learn about the labor movement or our economy?

Solidarity Bingo… Go around the room and find
someone who knows the answer to one of the questions. If they know the answer, have them print their name in the box that they can answer. Each person may only sign one of your boxes. You may sign your own name in one box. If you get bingo down, across, or diagonally, yell BINGO! and you’ll win a prize.

Reflecting on History & Society… The role that unions and other social movements
played in shaping our nation is often invisible in our schools, media and society at large…
Much of what is taught in the schools or reported in the media does not critically examine the way our economy or political system has developed or how it works now
Who gets what and why in America…
“The arguments are fiercest where the facts are fewest.” – William James…famous dead psychologist and
philosopher
Look at two types of inequality: Wealth and Income
Income-money, wages, and payments that are periodically received from investments– For most people a paycheck
Income Distribution in America
So how is income distributed among our society’s population…
– How do we divide the economic pie?

Dividing the Income…
Income…
10 Volunteers Up Front…
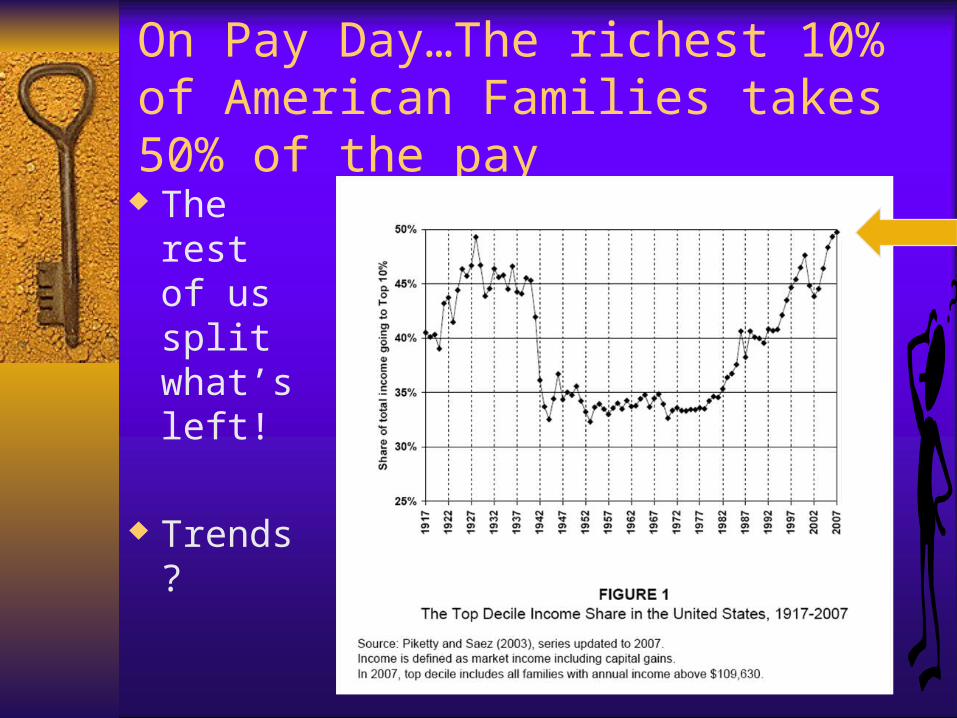
On Pay Day…The richest 10% of American Families takes 50% of the pay
The rest of us split what’s left!
Trends?
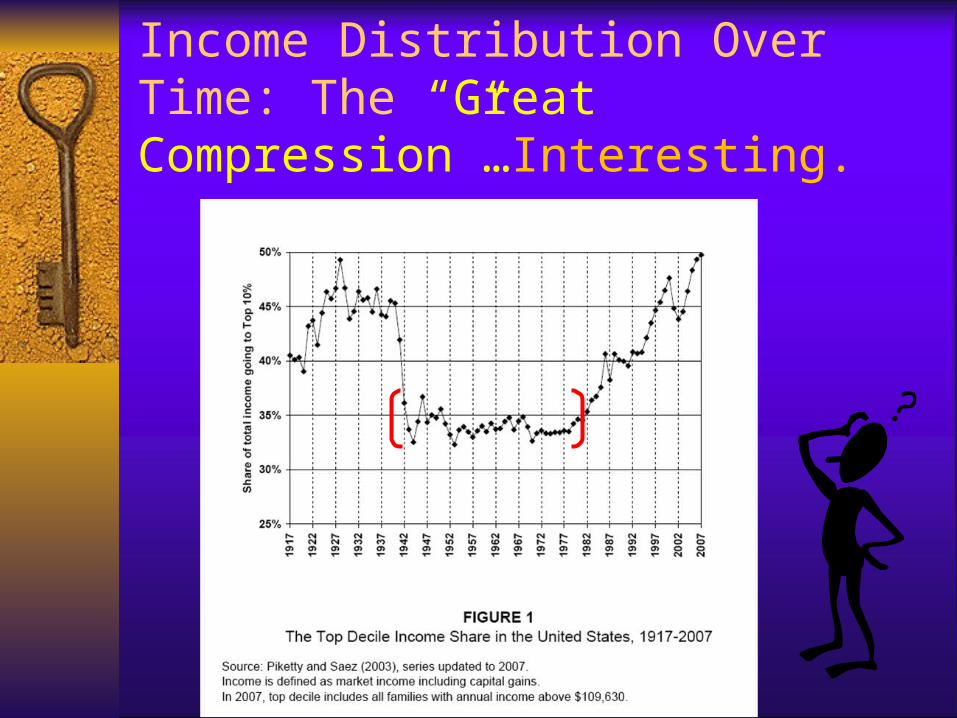
Income Distribution Over Time: The “Great Compression”…Interesting.

Another way to look at recent trends…
Can Anyone Interpret this Slide?
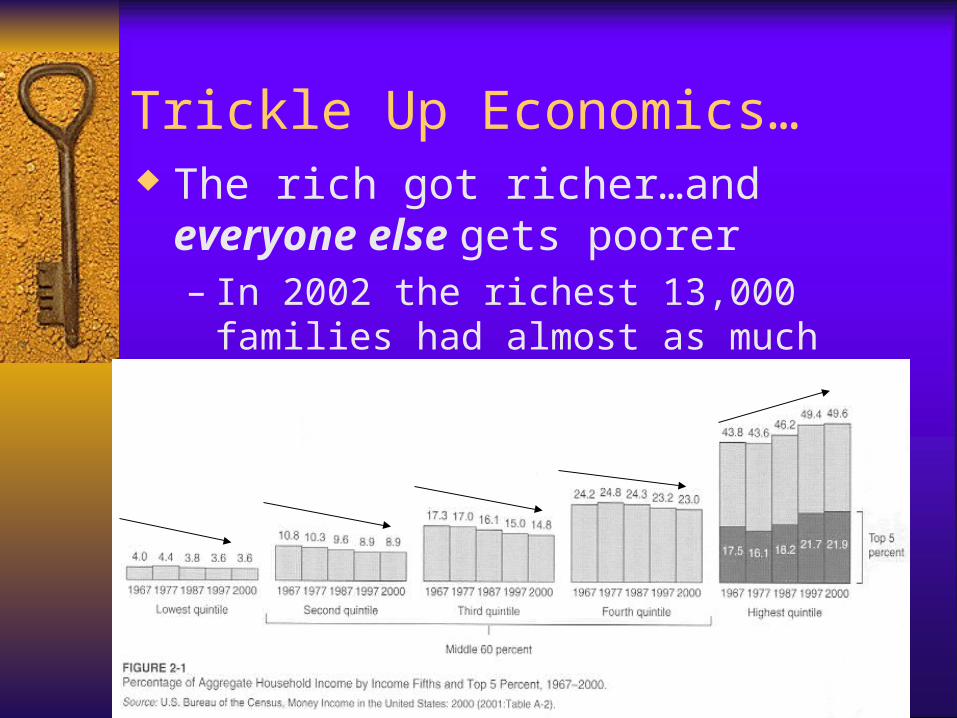
Trickle Up Economics… The rich got richer…and everyone else gets
poorer– In 2002 the richest 13,000 families had almost
as much income as the 20 million poorest…
14
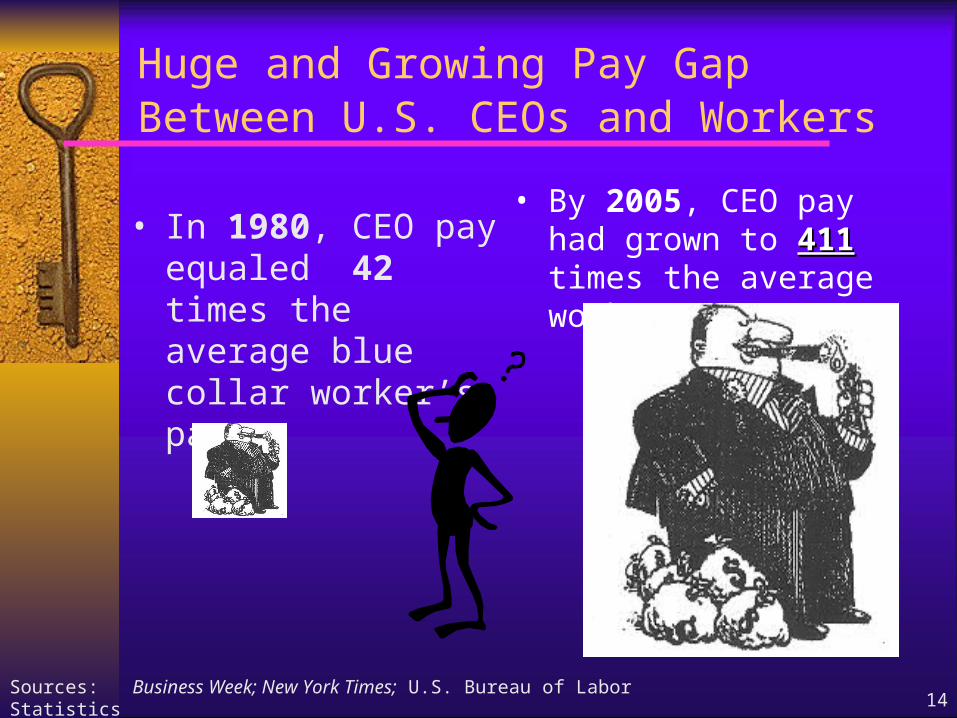
Huge and Growing Pay GapBetween U.S. CEOs and Workers
• In 1980, CEO pay equaled 42 times the average blue collar worker’s pay.
• By 2005, CEO pay had grown to 411 411 times the average worker’s pay
Sources: Business Week; New York Times; U.S. Bureau of Labor Statistics
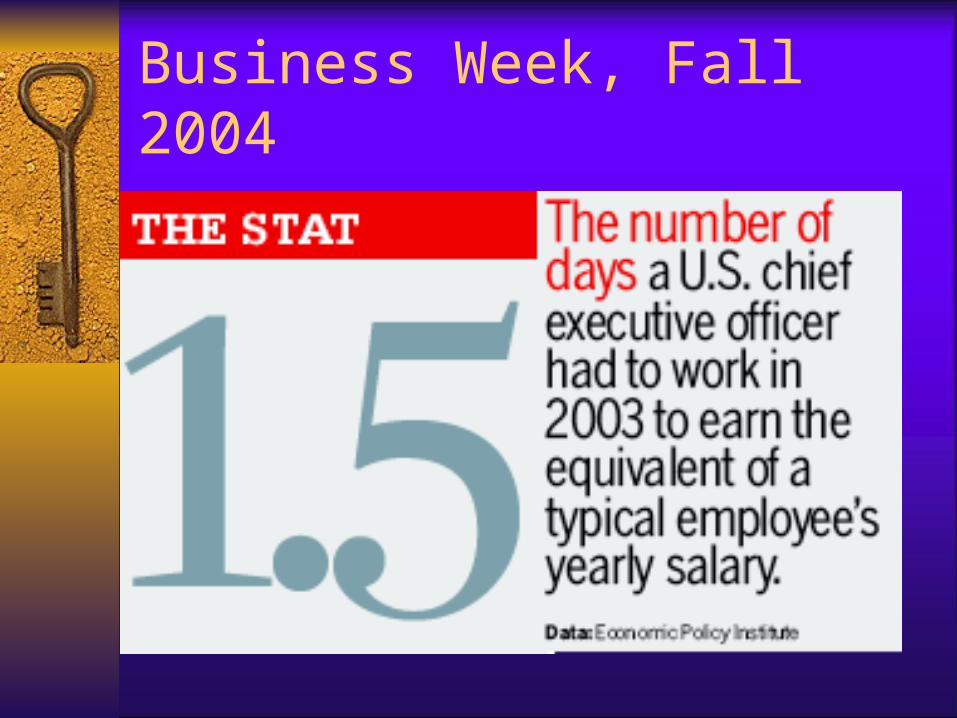
Business Week, Fall 2004
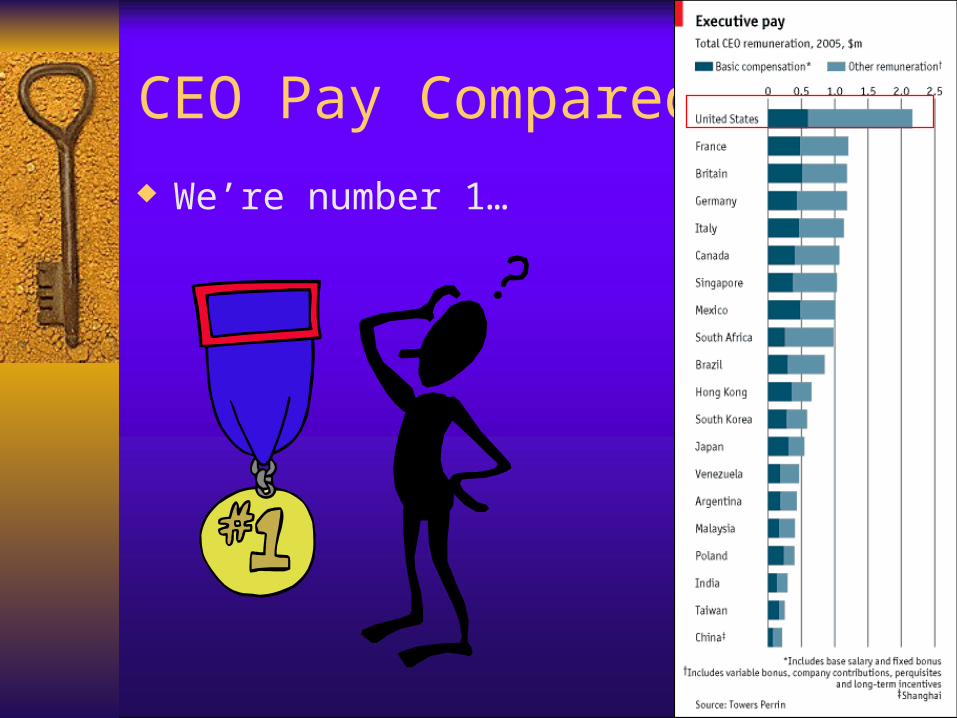
CEO Pay Compared….
We’re number 1…
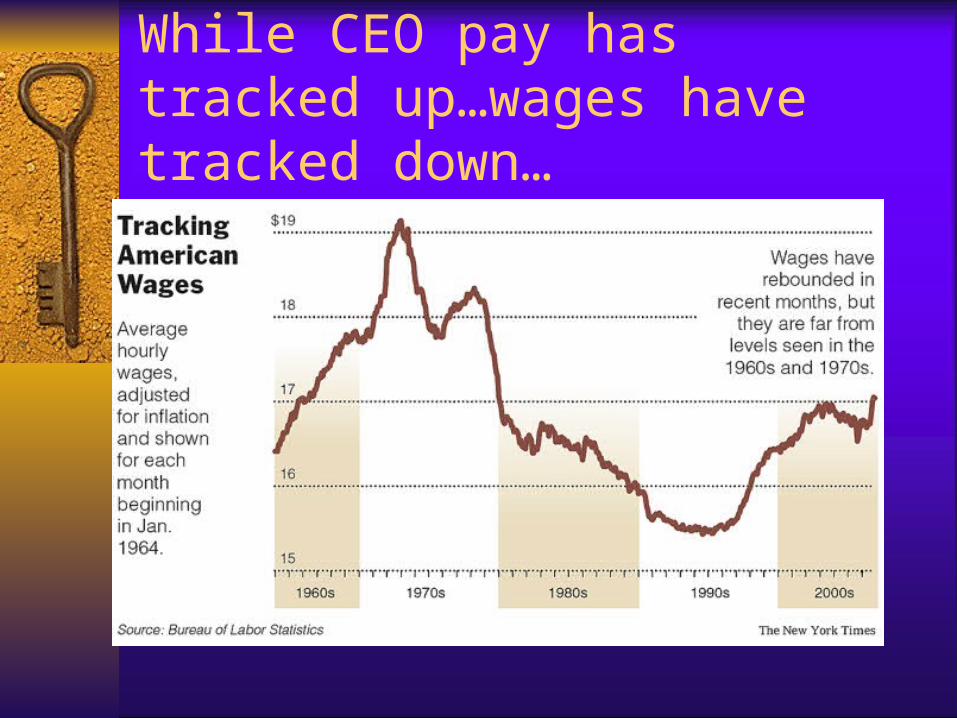
While CEO pay has tracked up…wages have tracked down…

Inequality is High in the US…
Ratio of Top 10% to Bottom 10%
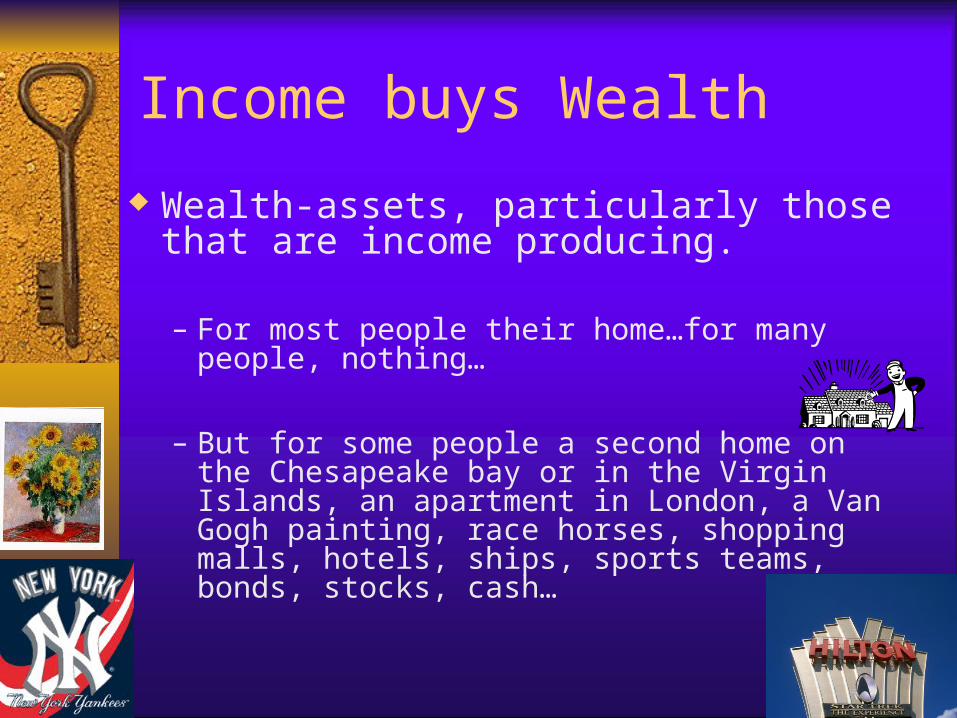
Income buys Wealth
Wealth-assets, particularly those that are income producing.
– For most people their home…for many people, nothing…
– But for some people a second home on the Chesapeake bay or in the Virgin Islands, an apartment in London, a Van Gogh painting, race horses, shopping malls, hotels, ships, sports teams, bonds, stocks, cash…

Wealth
So how wealth distributed among our society’s population…
– How do we divide the economic pie?
Dividing the Wealth…
Wealth…
10 Volunteers Up Front…

22
Fewer People Own More Wealth
Source:Edward N. Wolff, “Recent Trends in Wealth Ownership”
2007: richest 10% of the U.S. population owns 73% of all wealth.
1976: richest 10% of the U.S. population owns 50% of all wealth.
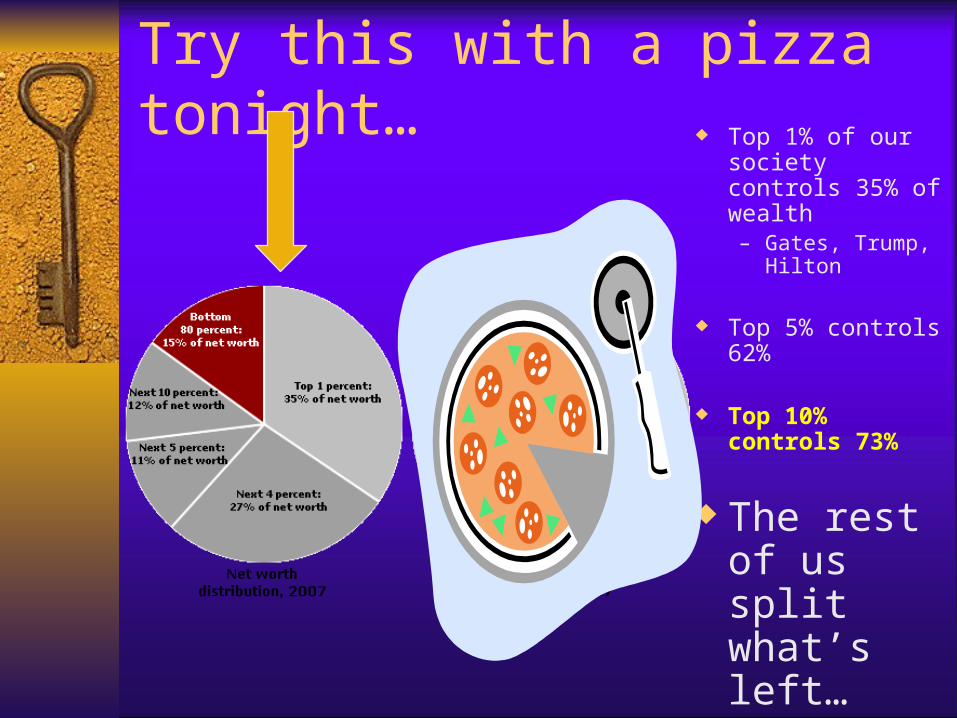
Try this with a pizza tonight… Top 1% of our
society controls 35% of wealth– Gates, Trump,
Hilton
Top 5% controls 62%
Top 10% controls 73%
The rest of us split what’s left…
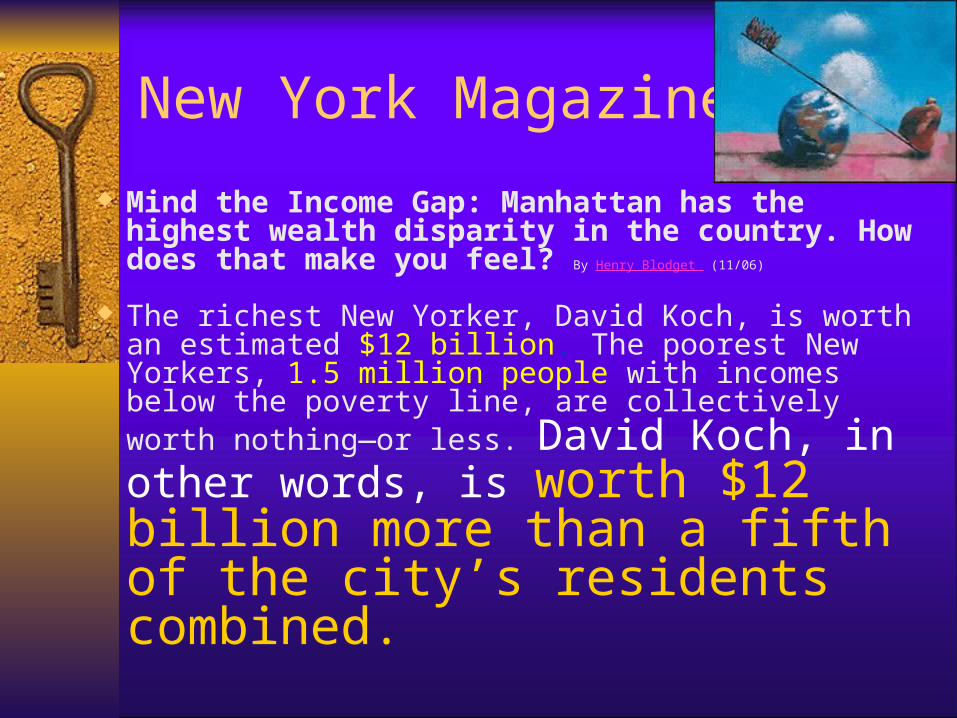
New York Magazine
Mind the Income Gap: Manhattan has the highest wealth disparity in the country. How does that make you feel? By Henry Blodget (11/06)
The richest New Yorker, David Koch, is worth an estimated $12 billion. The poorest New Yorkers, 1.5 million people with incomes below the poverty line, are collectively worth nothing—or less. David Koch, in other words, is worth $12 billion more than a fifth of the city’s residents combined.

See a Pattern Again???
Year Pct. Of Wealth Held by Top 1%
1922 32
1929 36
1939 31
1949 21
1958 24
1969 20
1989 38
1998 38
2007 34
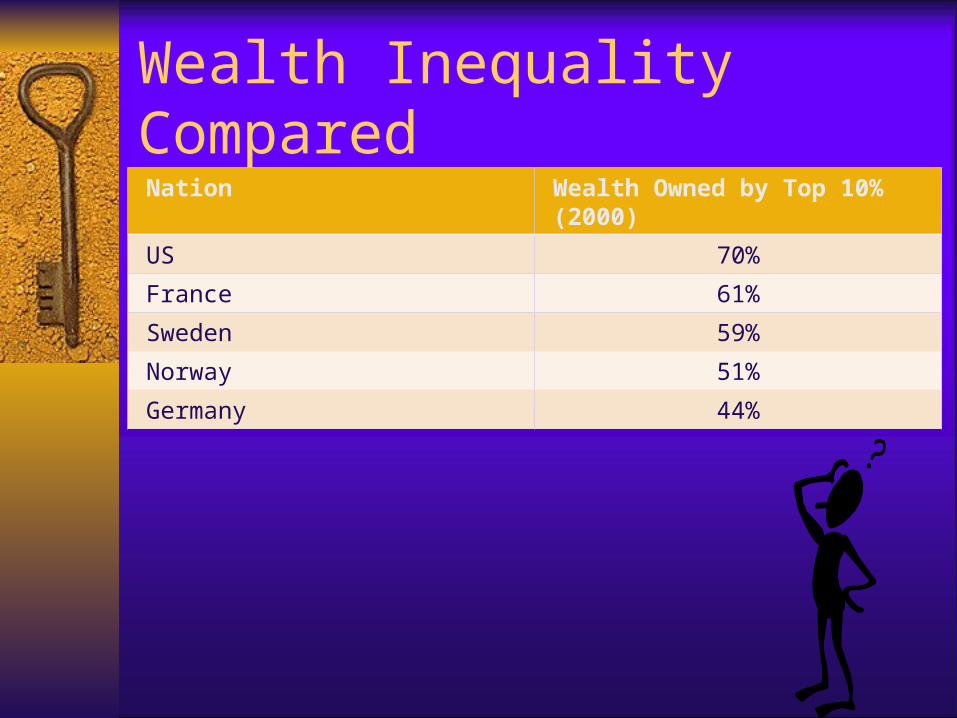
Wealth Inequality ComparedNation Wealth Owned by Top 10% (2000)
US 70%
France 61%
Sweden 59%
Norway 51%
Germany 44%
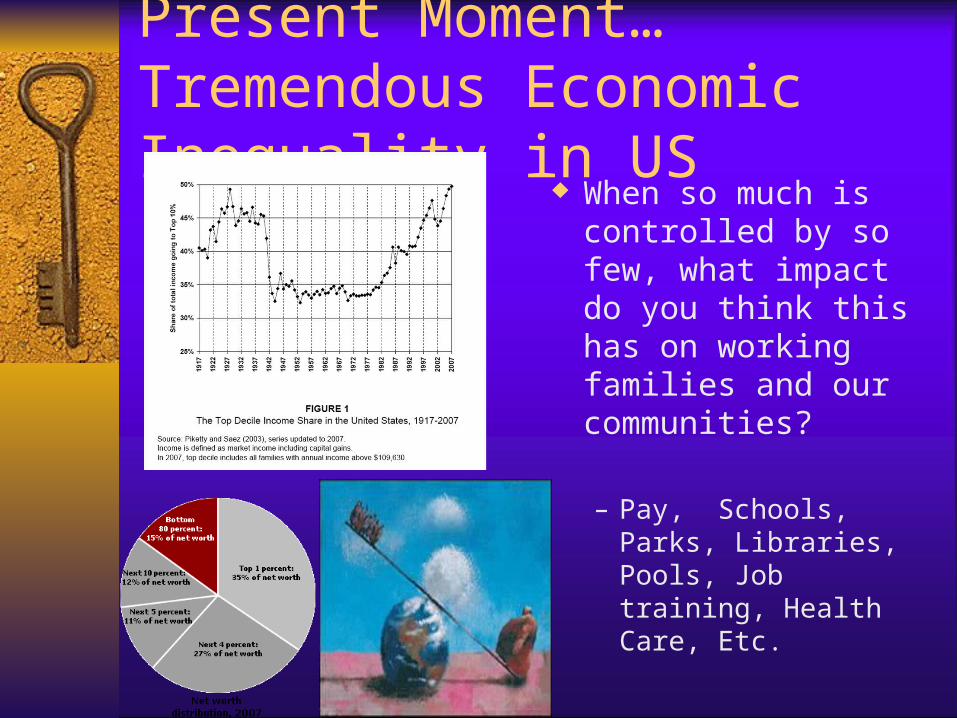
Present Moment…Tremendous Economic Inequality in US
When so much is controlled by so few, what impact do you think this has on working families and our communities?
– Pay, Schools, Parks, Libraries, Pools, Job training, Health Care, Etc.
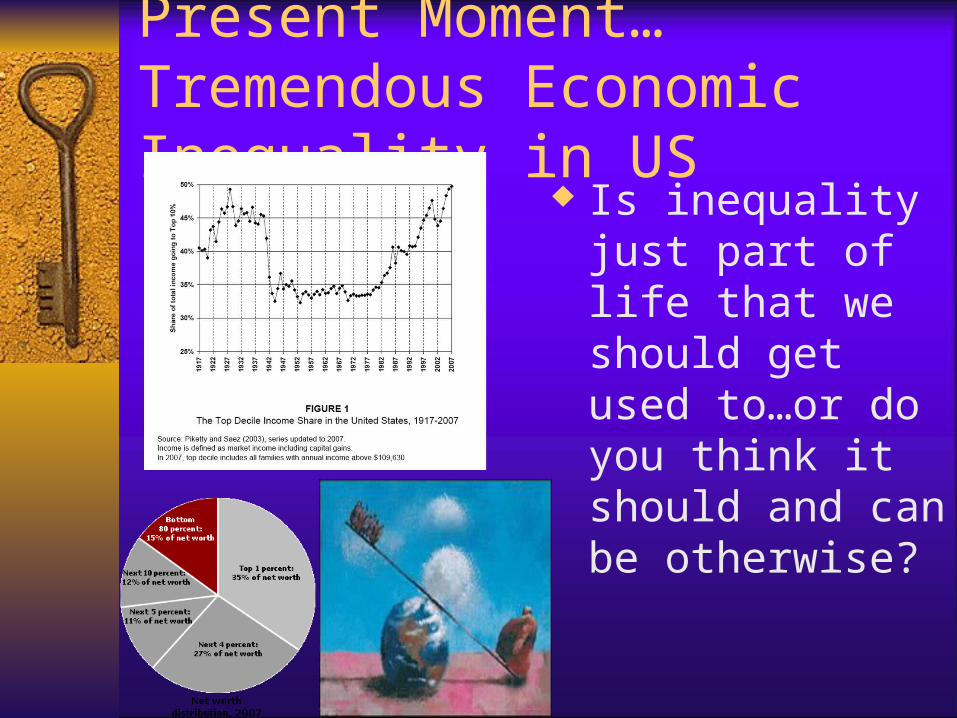
Present Moment…Tremendous Economic Inequality in US
Is inequality just part of life that we should get used to…or do you think it should and can be otherwise?


Quiz
Inequality matters…
Rank of the U.S. among the seventeen leading industrial nations with the largest percentage of their populations in poverty:
Quiz
Rank of the U.S. among the seventeen leading industrial nations with the largest percentage of their populations in poverty:
We’re # 1– (United Nations Human Development Report 1998,N.Y.C.)
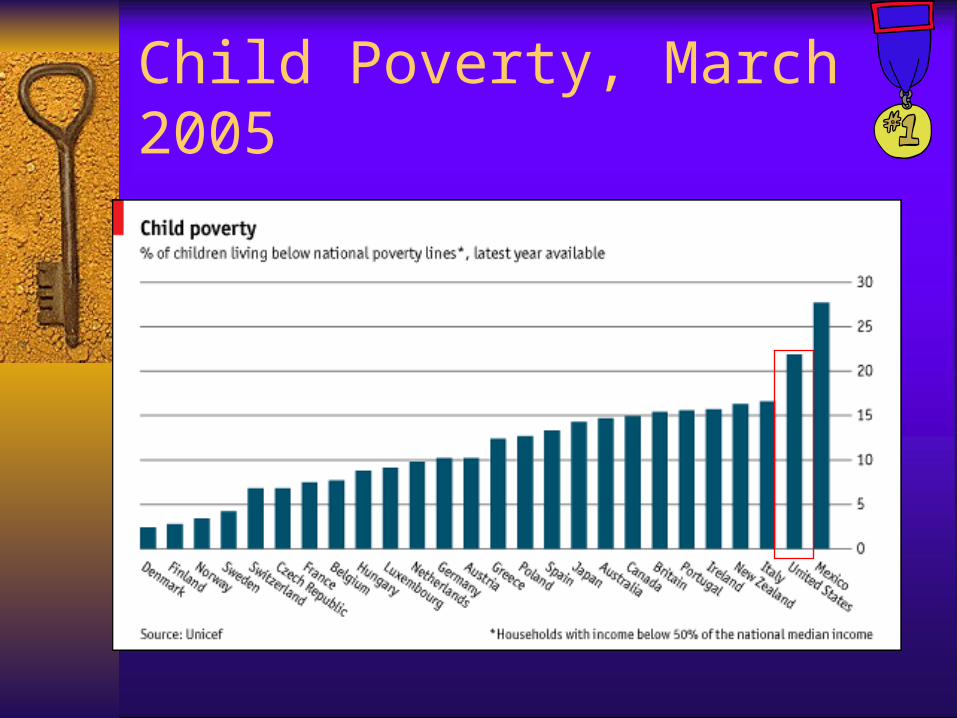
Child Poverty, March 2005
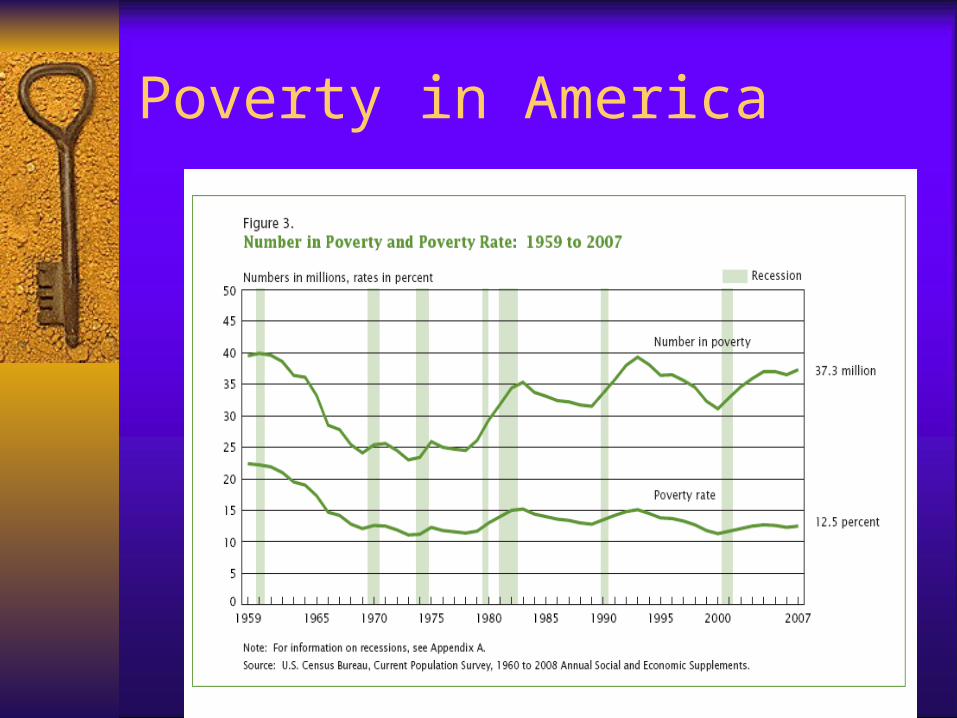
Poverty in America

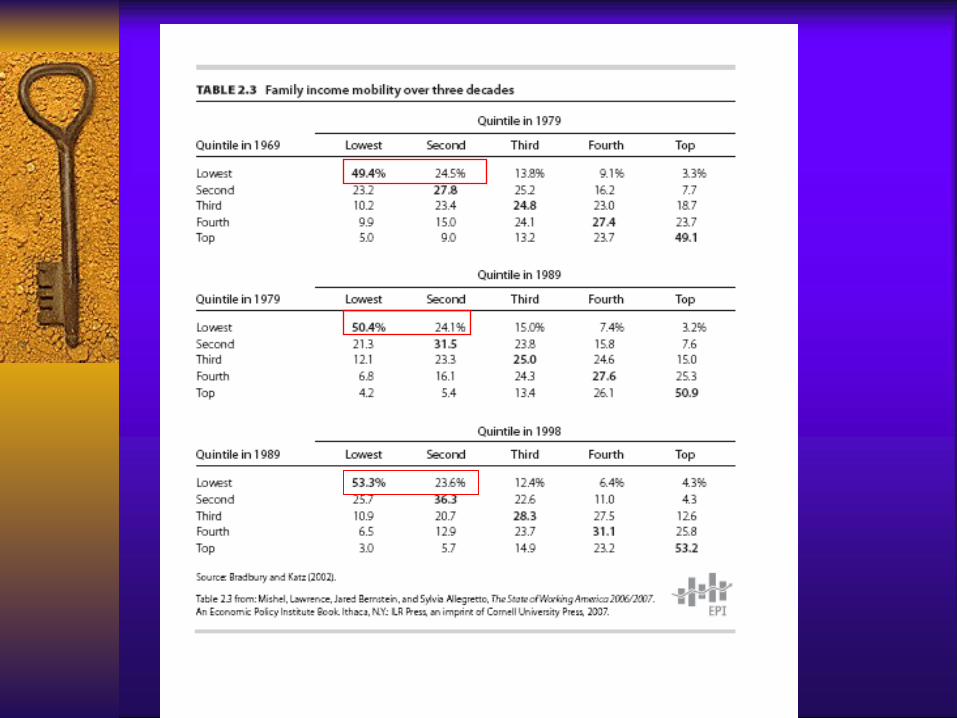
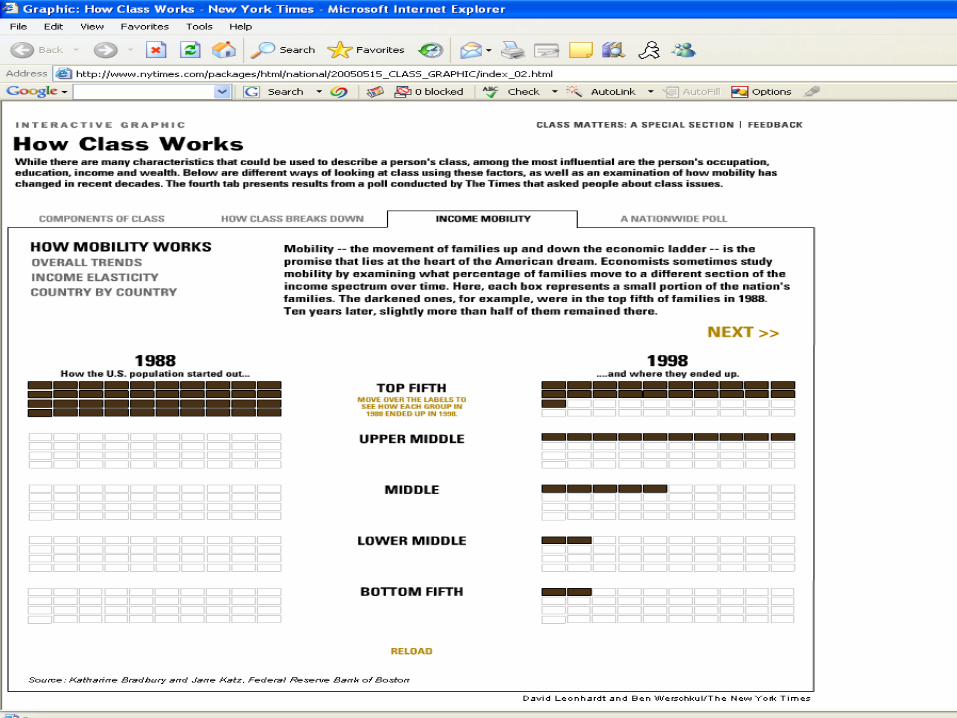
Social Mobility
O.K…immense inequality…and a lot of poverty…but if people in the bottom 90% don’t like it, they can always work harder and join the top 10%…
– Work hard and you’ll get ahead…Rags to riches..
Of the poorest 20 percent of Americans in 1989, what percent were still in the poorest 20 percent in 1998?


Mobility and Race
2/3 of the Black children born in the bottom 25% will remain in the bottom 25%
Reactions to this?
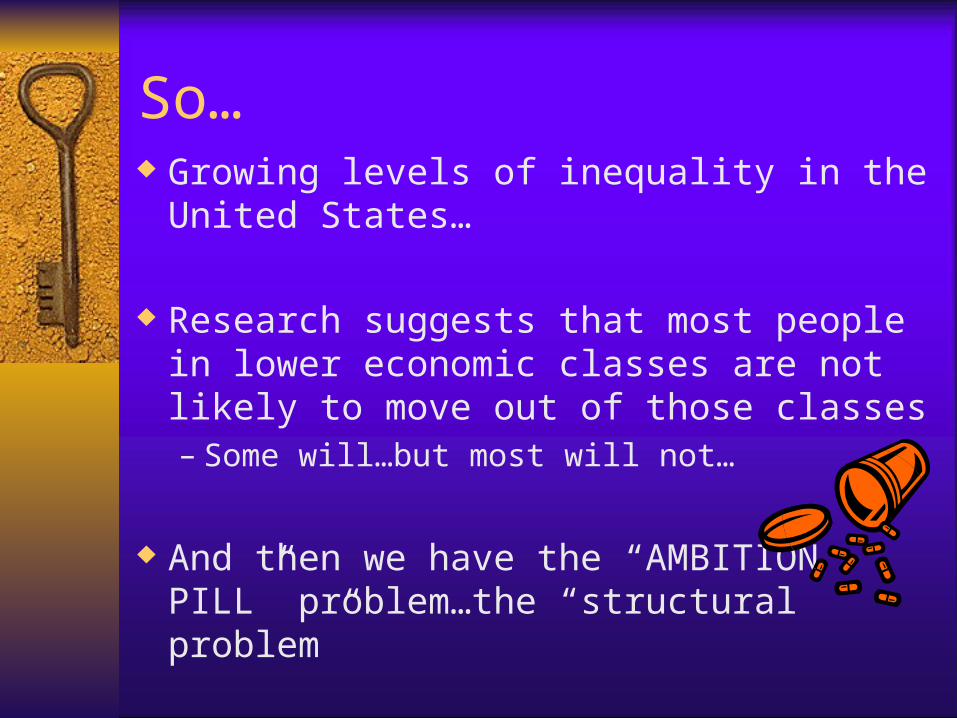
So… Growing levels of inequality in the United
States…
Research suggests that most people in lower economic classes are not likely to move out of those classes – Some will…but most will not…
And then we have the “AMBITION PILL” problem…the “structural problem”
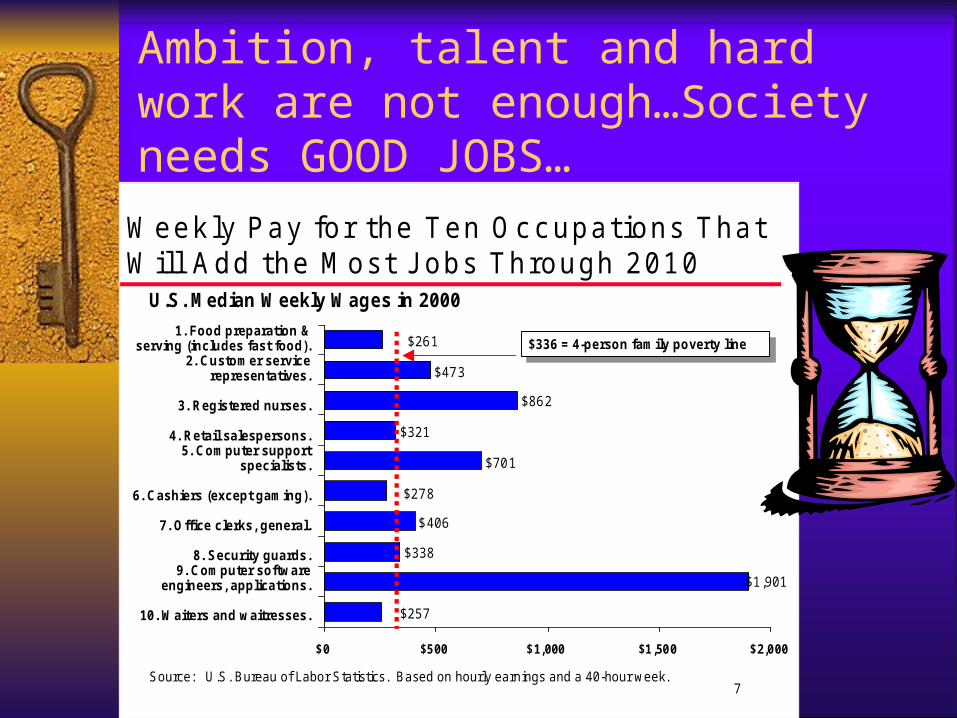
Ambition, talent and hard work are not enough…Society needs GOOD JOBS…
Occupations Adding the Most Jobs Projected increase Weekly Pay
1) Systems Analysts 577,000 $1,008
2) Retail Salespersons 563,000 $329
3) Cashiers 556,000 $280
4) General Managers 551,000 $797
5) Truck Drivers 493,000 $299
6) Office Clerks 463,000 $419
7) Registered Nurses 451,000 $750
8) Computer Support Specialists 439,000 $983
9) Personal Care and Home Health Aides 333,000 $321
10) Teaching Assistants 375,000 $315
11) Janitors, Cleaners and Maids 365,000 $324
12) Nursing Aides and Orderlies 325,000 $322
Source: 1999 BLS data; the 1999 poverty line for a family of four is $327/week. 7
$406
$701
$862
$473
$1 ,901
$338
$257
$278
$321
$261
$0 $500 $1,000 $1,500 $2,000
Week ly P ay for the T en Oc c upations T hat Will A dd the M os t J obs T hrough 2010
Source: U.S. Bureau of Labor Statistics. Based on hourly earnings and a 40-hour week.
U.S. Median Weekly Wages in 2000
$336 = 4-person family poverty line$336 = 4-person family poverty line1. Food preparation &
serving (includes fast food).2. Customer service
representatives.
3. Registered nurses.
4. Retail salespersons.5. Computer support
specialists.
6. Cashiers (except gaming).
7. Office clerks, general.
8. Security guards.9. Computer software
engineers, applications.
10. Waiters and waitresses.
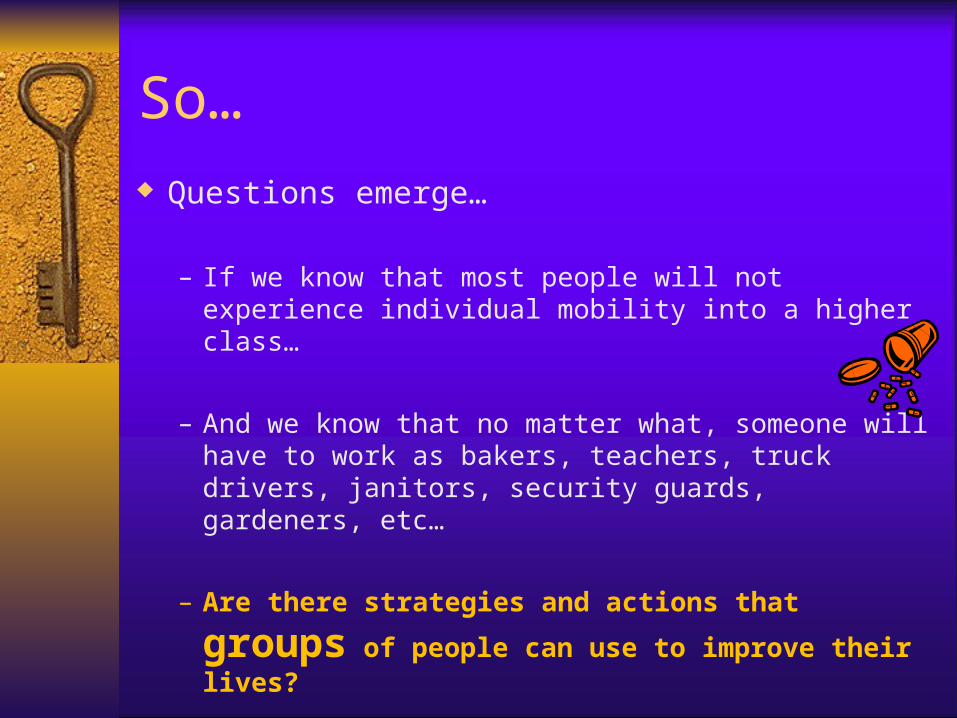
So…
Questions emerge…
– If we know that most people will not experience individual mobility into a higher class…
– And we know that no matter what, someone will have to work as bakers, teachers, truck drivers, janitors, security guards, gardeners, etc…
– Are there strategies and actions that groups of people can use to improve their lives?
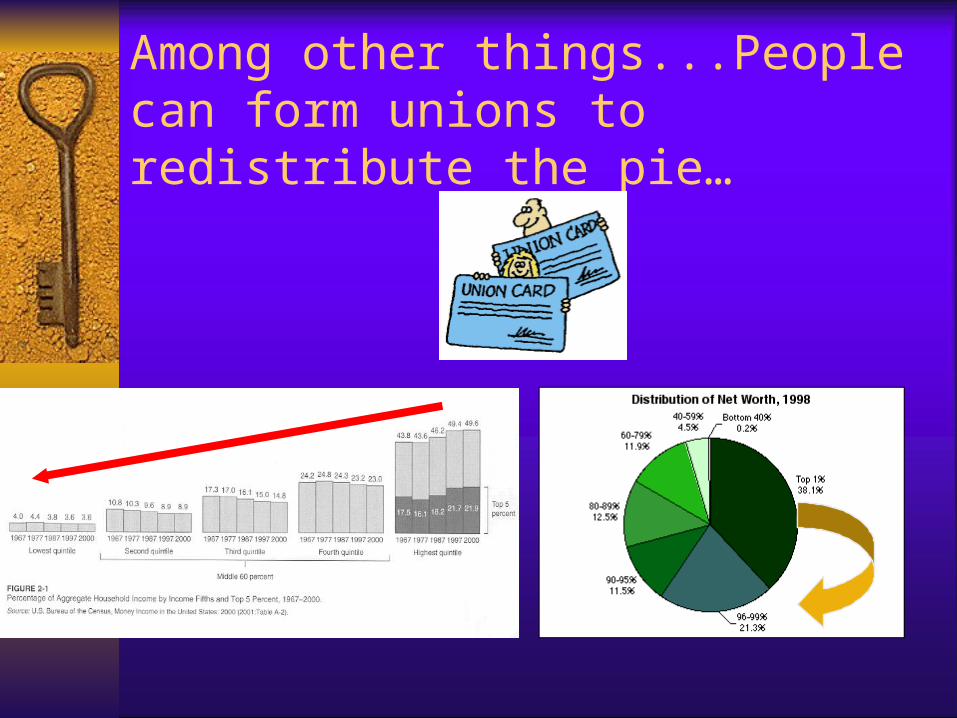
Among other things...People can form unions to redistribute the pie…

Anyone see a relationship…Inequality over Time Union Density over Time
Year Pct.Wealth Held by Top 1% of Households
1922 31.6
1929 36.3
1939 30.6
1949 20.8
1958 23.8
1969 20.1
What has happened to percentage of workers who are in unions over the last 40 years?
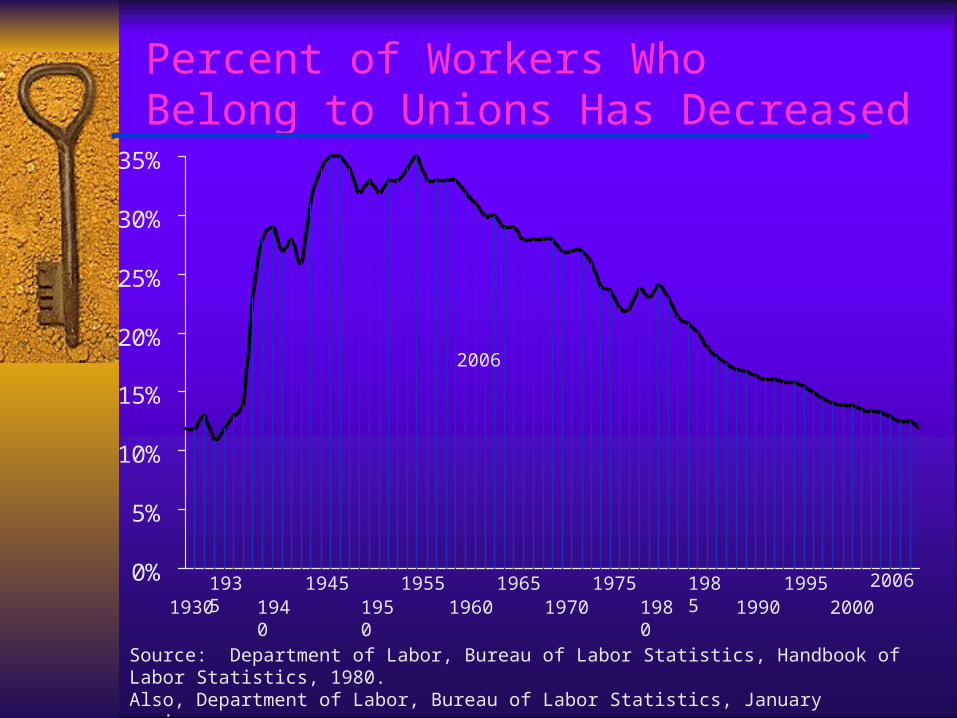
Source: Department of Labor, Bureau of Labor Statistics, Handbook of Labor Statistics, 1980.Also, Department of Labor, Bureau of Labor Statistics, January various years.
0%
5%
10%
15%
20%
25%
30%
35%
Percent of Workers WhoBelong to Unions Has Decreased
19301935
19401945
19501955
19601965
19701975
19801985
19901995
2000
2006
2006

Union Density by State - 1983
10% to 20%
21% & over
0% to 9%Source: Union Members in 1983, Bureau of Labor Statistics
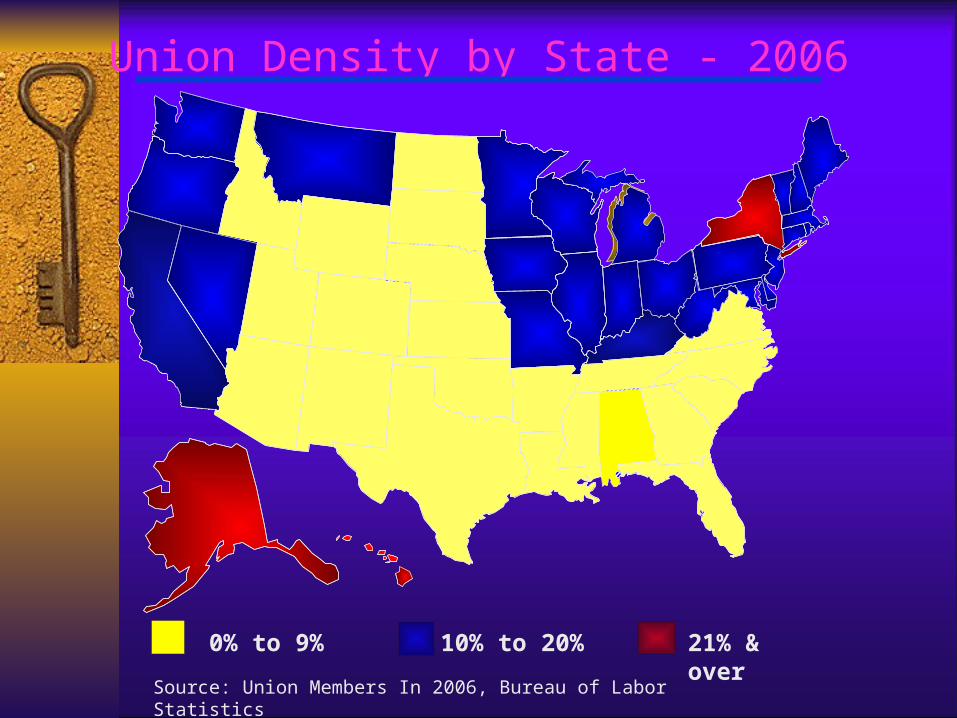
Union Density by State - 2006
0% to 9% 10% to 20% 21% & over
Source: Union Members In 2006, Bureau of Labor Statistics

At Present, Almost Nobody in America is in a union…
87% of workers
not in unions
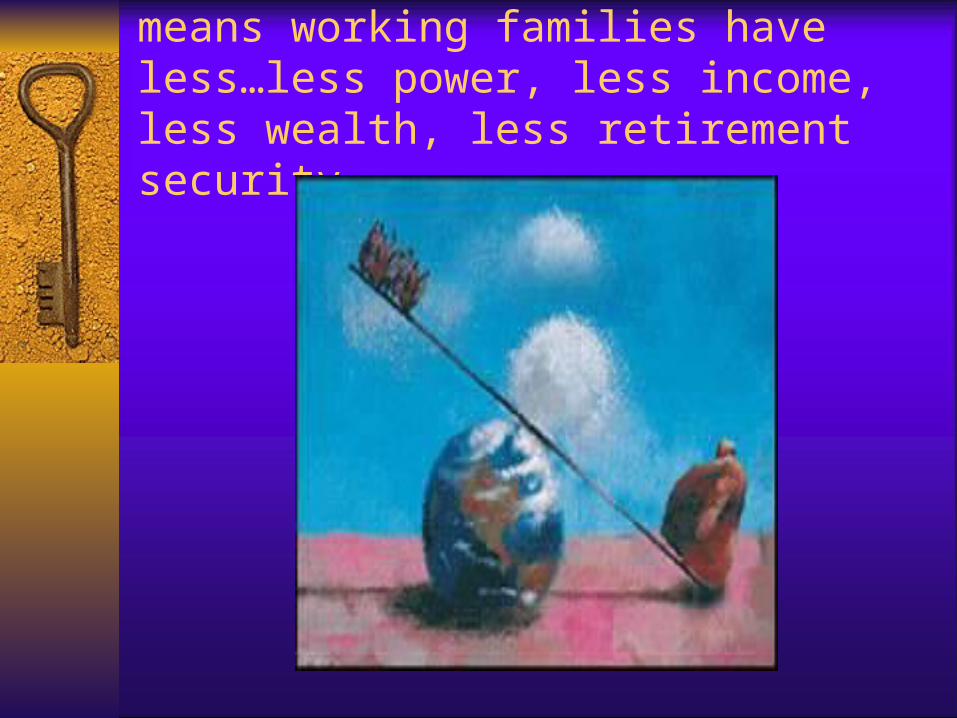
And the absence of unions means working families have less…less power, less income, less wealth, less retirement security…
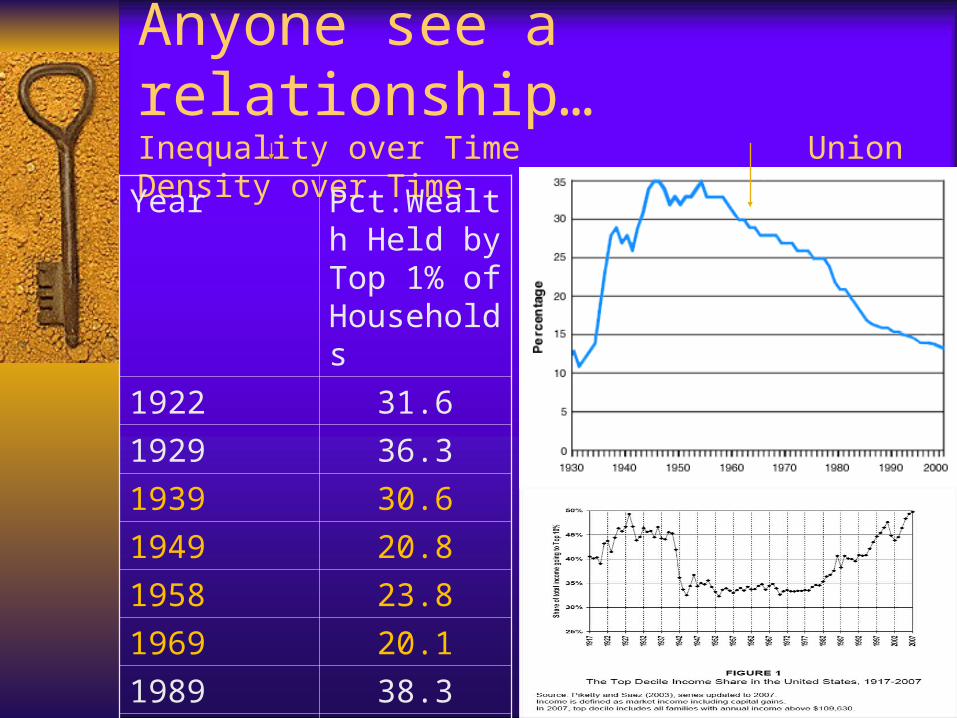
Anyone see a relationship…Inequality over Time Union Density over Time
Year Pct.Wealth Held by Top 1% of Households
1922 31.6
1929 36.3
1939 30.6
1949 20.8
1958 23.8
1969 20.1
1989 38.3
1995 38.5
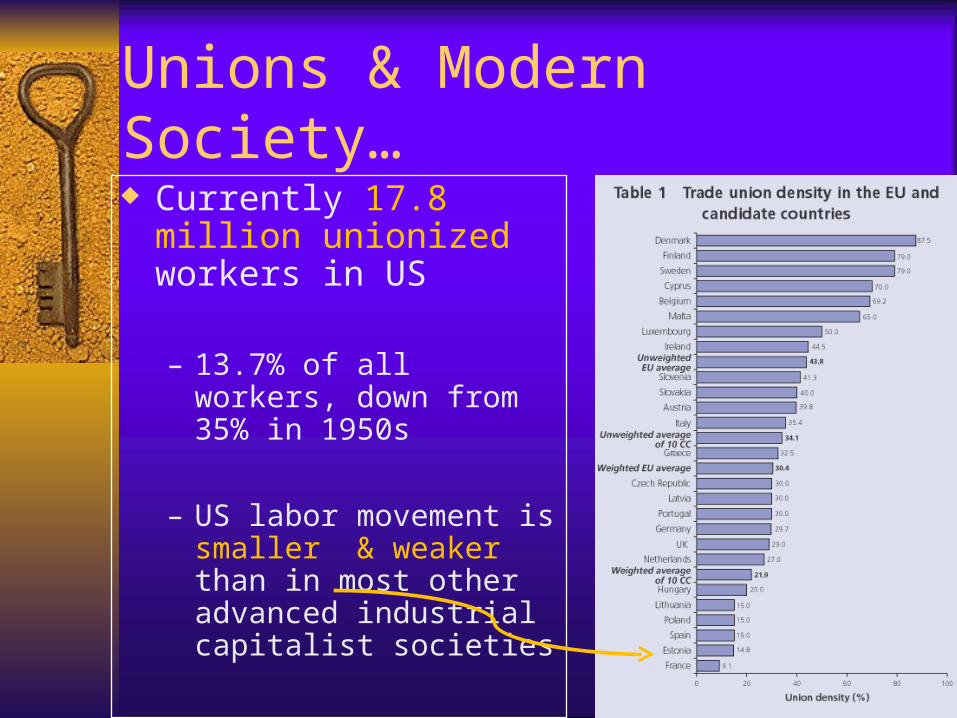
Unions & Modern Society…
Currently 17.8 million unionized workers in US
– 13.7% of all workers, down from 35% in 1950s
– US labor movement is smaller & weaker than in most other advanced industrial capitalist societies
Lunch…
I hope this has sparked your interest in unions and society…– We’ll explore the rise and fall of unions more
in the coming weeks
Right now…one hour for lunch…
Then a video and a walking tour of some NYC labor history.
A Historical Context for the here and now… Take a look around this workplace…exit
signs, sprinkler systems, stairways…
Do you think building owners and employers voluntarily put them in place?
Why do workplaces have these things?
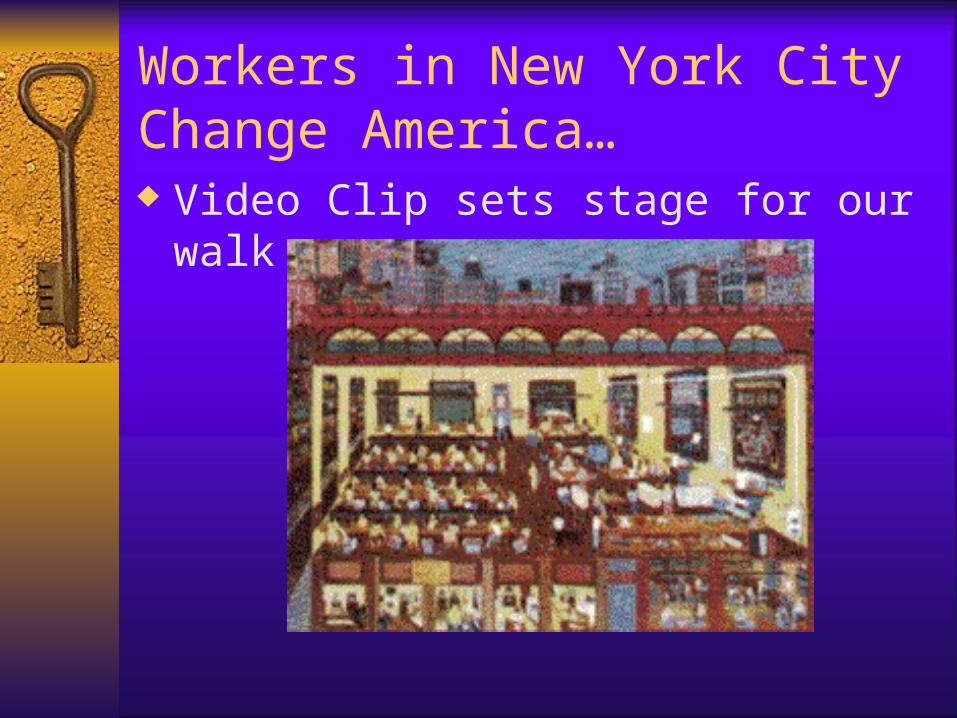
Workers in New York City Change America… Video Clip sets stage for our walk
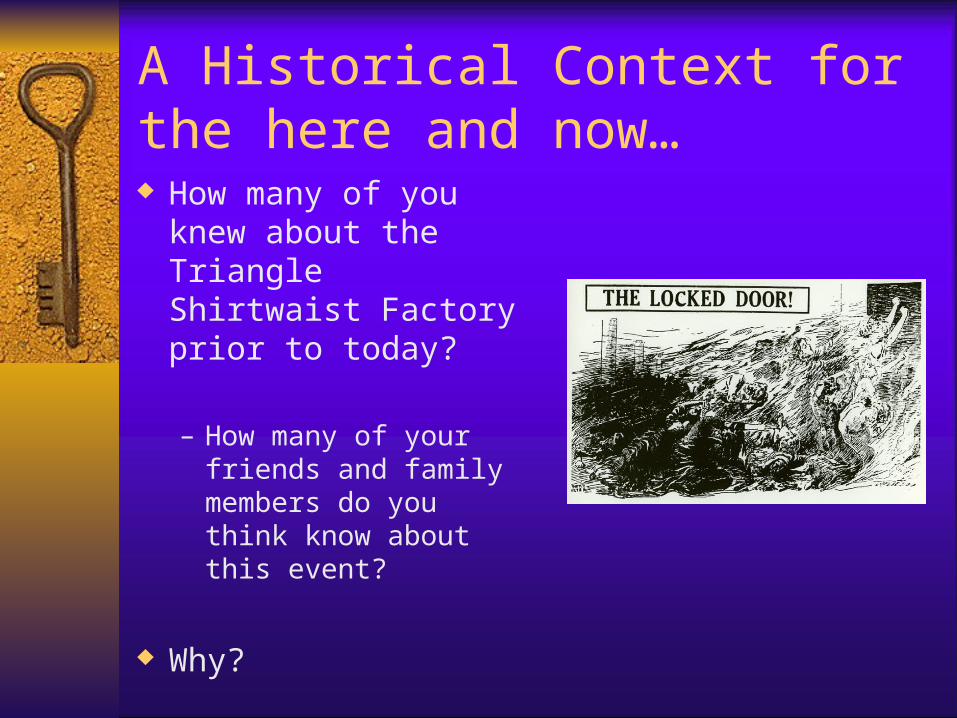
A Historical Context for the here and now… How many of you
knew about the Triangle Shirtwaist Factory prior to today?
– How many of your friends and family members do you think know about this event?
Why?
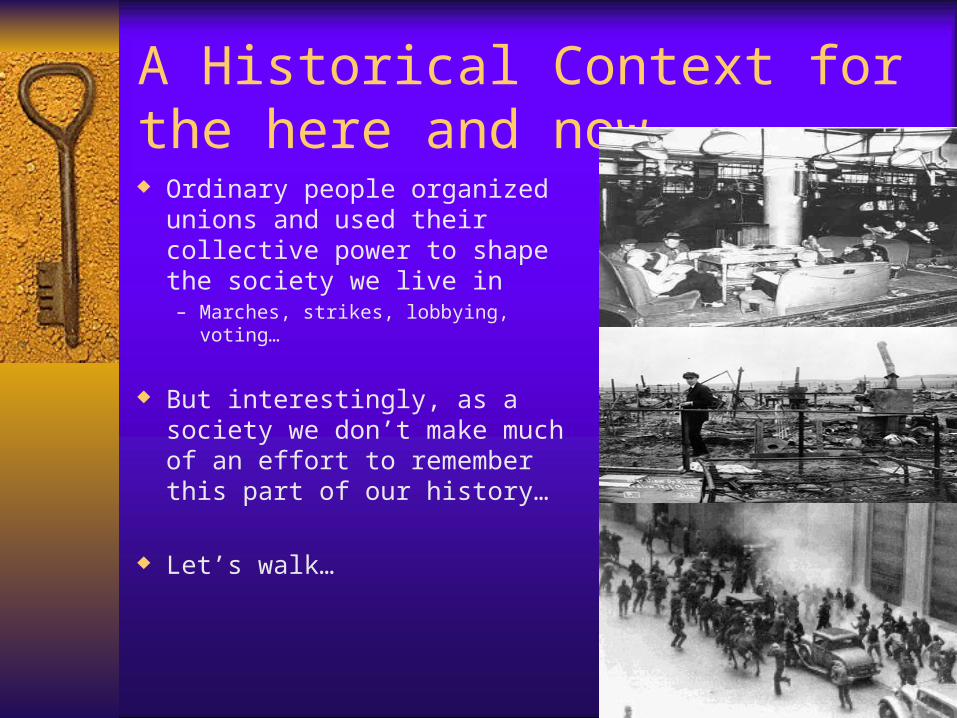
A Historical Context for the here and now… Ordinary people organized
unions and used their collective power to shape the society we live in– Marches, strikes, lobbying, voting…
But interestingly, as a society we don’t make much of an effort to remember this part of our history…
Let’s walk…