ys;j;alu - clcclc.lk/m/reports/clc_ar_201415.pdf · ys;j;alu “hithawathkama” ... to soar into...
TRANSCRIPT

ys;j;alu“ H i t h a w a t h k a m a ”
Commercial Leasing & Finance PLC | Annual Report 2014/15
Com
mercial L
easing & F
inance PL
C | A
nnual Report 2014/15
Building relationships, building lives.

Contents
For a more interactive report, go online at
http://www.clc.lk
Who We are / 2Highlights of 2014/15 / 4Financial Highlights / 6Chariman’s Message / 10Director’s Review / 12CEO’s Message / 14The Board of Directors / 18Management Team / 23Regional Management Team / 26Management Discussion & Analysis / 30Branch Network / 35Financial Review / 36Sustainability Report / 40Corporate Governance / 43Risk Management / 70Directors Report / 76Audit Committee Report / 80Integrated Risk Management Committee Report / 81Remuneration Committee Report / 82Nomination Committee Report / 83Related Party Transaction Review Committee Report / 84Directors’ Statement on Internal Control over Financial Reporting / 85Chief Executive Officer’s and Chief Financial Officer’s Responsibility Statement / 86Independent Auditors’ Report / 87Statement of Profit or Loss and Other Comprehensive Income / 88Statement of Financial Position / 89Statement of Changes in Equity / 90Statement of Cash Flows / 92Notes to the Financial Statements / 94Shareholder Information / 169Summarised Quarterly Statistics / 171Ten Year Summary / 172Sources and Distribution of Income / 173Statement of Value Added / 174Glossary Terms / 175Notice of Meeting / 179Notes / 180Form of Proxy / 183Corporate Information / IBC

ys;j;alu“ H i t h a w a t h k a m a ”
Building relationships, building lives.
We don’t see ourselves as just another finance company. Instead, our business is designed to build better lives, by offering myriad financial products and services that empower all Sri Lankan communities. Today, we are proud to have established solid relationships with our customers across the island through our corporate philosophy of “Hithawathkama”. We believe that we understand Sri Lankan’s needs better than most and we’ve used our unique insights to shape many lifestyles, understand people’s dreams, goals and aspirations for the future.
Building on 27 years of expertise and sound strategy, Commercial Leasing & Finance PLC (CLC) now boasts strong fundamentals in finance and corporate governance, backed by the strength of the LOLC Group. Today, we are committed to the integration of long-term sustainability and good governance in order to improve individual livelihoods and drive national development.
And that is how we will foster the spirit of “Hithawathkama”, as we continue to build strong relationships and better lives for the thousands of Sri Lankans we pledge to serve.
“Hithavathkama”
At CLC we have adopted the word Hithavathkama to sum up our corporate philosophy; a word that describes how we create value for our customers and partners, helping them grow by enhancing their wealth.
In this context, hitha signifies the warmth, trust and confidence of our stakeholder relationships, while wathkama indicates the financial returns and value we create for them each day.

2Commercial Leasing & Finance PLC
ys;j;alu
Commercial Leasing & Finance PLC (CLC) is one of Sri Lanka’s leading Non Banking Financial Service Providers offering solutions ranging from leasing, fixed deposits, savings, loans, flexi cash to factoring. With 58 customer touch points spread across the country, CLC has become a trusted brand, synonymous with stability and dependability, playing an invaluable role as a key catalyst in financial empowerment.
CLC will continue to grow and expand with its unique operating philosophy “Hithawathkama” which encapsulates how the trust and progress of all our stakeholders will continue to be the priority in our hearts and minds.
About Us
WhoWe are

3Annual Report 2014/15
To soar into the future, giving wings to the dreams, hopes and aspirations of our people and everyone who has a stake in the success of our enterprise.
To forge ahead to reach new frontiers, to touch new horizons, seeking new challenges and exploring new opportunities.
Together with our people with diverse strengths, committed to achieving personnel excellence and the continuous growth of our enterprise.
In order to make our vision a reality, we always strive:
To provide innovative financial solutions of highest possible quality at an optimum value.
To ensure utmost customer focus and dedication to superior customer service.
To provide best returns to our stakeholders through the strength of our customer, strategic partner and employee satisfaction.
To serve our customers with utmost care.
To serve our customers professionally.
To do work with utmost integrity.
Be performance driven.
To work as a team and treat fellow colleagues as one family.
Core Values
Vision
Mission

4Commercial Leasing & Finance PLC
ys;j;alu
Highlights of 2014/15
ATM Launch
Facebook Launch
Winner of the Silver Award at the SLITAD People’s Development Awards 2014.
Gampola Branch Opening
Grandpass Branch Opening Dehiwala Branch Opening

5Annual Report 2014/15
Minuwangoda Branch Opening
Long Service Awards
3W Consultancy Training held at Thulhiriya
Wattala Branch Opening
Branch Performance Awards
Sports Day

6Commercial Leasing & Finance PLC
ys;j;alu
Financial Highlights
Company
For the year ended 31st March 2011 2012 2013 2014 2015
Performance indicators (Rs. Mn)Interest income 3,402 5,317 5,996 7,514 7,590 Interest expense 1,309 2,167 2,515 3,039 2,406 Net interest income 2,093 3,150 3,481 4,475 5,184 Profit before tax 741 3,245 1,603 1,289 1,728 Profit after tax 664 2,964 1,168 936 1,426
Executions (leases and loans) 12,926 15,262 11,232 18,593 22,762 Factoring funds in use 2,954 3,005 2,859 2,231 2,778
Financial position(Rs. Mn)Total assets 21,351 26,398 27,229 32,934 42,385Net lending portfolio 18,339 24,101 24,985 27,570 32,982Outstanding borrowings 14,880 16,974 14,660 14,369 20,095Deposits from customers - 385 2,962 7,534 9,381 Shareholders funds 3,695 6,763 7,837 8,856 10,115
Key indicatorsEarnings per share(Adjusted)(Rs. per share) 0.10 0.46 0.18 0.15 0.22 Net asset value per share(Adjusted)(Rs. per share) 0.58 1.06 1.23 1.39 1.59
Interest cover(times) 1.57 2.49 1.63 1.42 1.72Debt to equity ratio (times) 4.03 2.57 2.25 2.47 2.91 Return on equity (%) 23.20 56.69 16.01 11.21 15.03Return on average total assets (%) 3.92 12.42 4.36 3.11 3.79Non performing ratio (%) 0.76 2.80 2.98 2.44 1.96
Capital adequacyCore capital ratio (%) - 25.01 29.53 27.63 28.27Total risk weighted capital ratio (%) - 25.01 29.53 27.63 25.57

7Annual Report 2014/15
Total Assets to ROA
0
10,000
20,000
30,000
40,000
50,000
0
2
4
6
8
10
12
14
Total assetsReturn on average total assets
2011 2012 2013 2014 2015
Rs. Mn %
Shareholders' Funds and ROE
0
2,000
4,000
6,000
8,000
10,000
12,000
0
10
20
30
40
50
60
Shareholders fundsReturn on equi�
2011 2012 2013 2014 2015
Rs. Mn %
Deposits from customers
0
2,000
4,000
6,000
8,000
10,000
2012 2013 2014 2015
Rs. Mn
Interest income to interest expense
0
1,000
2,000
3,000
4,000
5,000
6,000
7,000
8,000
Rs. Mn
Interest incomeInterest expense
2010/11 2011/12 2012/13 2013/14 2014/15
Net lending portfolio
0
5,000
10,000
15,000
20,000
25,000
30,000
35,000
2011 2012 2013 2014 2015
Rs. Mn
Executions
0
5,000
10,000
15,000
20,000
25,000
2010/11 2011/12 2012/13 2013/14 2014/15
Rs. Mn

8
HowWe buildBetter Lives
Management ReviewsChairman’s Message | Director’s Review | CEO’s Message | The Board of Directors | Management Team | Regional Management Team
Backed by strong financial capabilities, we build better lives...We are helping to create better lifestyles by generating wealth, which in turn drive national development.
With a solid growth strategy and strong operating performance, we’re driving national development, generating wealth and creating better lifestyles.
ys;j;alu“ H i t h a w a t h k a m a ”

Annual Report 2014/15

10Commercial Leasing & Finance PLC
ys;j;alu
Ishara NanayakkaraChairman
Chairman’s Message

11Annual Report 2014/15
It is my pleasure to welcome you to the 23rd Annual General meeting of Commercial Leasing & Finance PLC (CLC) and to present to you the Annual Report and Audited Financial Statements for the year ended 31st March 2015. In the year under review, the Company achieved an excellent performance and surpassed last year’s, to record its best results to date.
CLC’s revenue reached Rs. 8 Billion contributing a significant 18% to LOLC Group’s revenues whilst Profit Before Tax grew by 34% to Rs. 1.7 Billion. Profit After Tax reached Rs. 1.4 Billion growing by 52% over the previous year. It is noteworthy that our performance primarily represents the performance of the second half of the year due to a lacklustre industry performance in the first half.
The year was a momentous one for another reason. Under the Central Bank directed consolidation programme for the NBFI sector, CLC acquired BRAC Lanka Finance PLC, a microfinance entity which caters to the lowest income segments in the country at the grassroots level. In December 2013, LOLC parented with BRAC Bangladesh, the largest NGO of the world to acquire Nanda Investments Finance PLC. which was then renamed as BRAC Lanka Finance PLC. Although now a 94.35% owned subsidiary of CLC, BRAC will stand alone as an entity which caters to the lower end of the micro finance segment with a unique model of its own. With women empowerment as one of its primary objectives, BRAC Lanka focuses on lending exclusively to women entrepreneurs with 95% of its workforce comprising women. In addition to directly empowering via employment, having a female workforce also facilitates better communication and understanding and hence more enduring partnerships with its key stakeholder group.
Becoming a member of the LOLC Group has had an inspiring impact on BRAC’s performance, within a mere span of 6 months. The Company was able to achieve a remarkable turnaround, to record a Profit Before Tax of Rs. 195.7 Million from a profit of Rs. 21.7 Million during the previous year, thus recording a profit growth of 799%. BRAC’s total portfolio also grew considerably by 180% to Rs. 3 Billion whilst the total disbursement during the year was Rs. 4.8 Billion compared with Rs. 1 Billion in the previous year. The establishment and implementation of our inhouse IT systems, standards and management practices, and the transfer of expertise and knowledge of LOLC’s experience in the Microfinance sector, combined with the access to new funding lines, which saw a decline in the cost of funds; were key factors which supported this turnaround during the year and will place BRAC on a sound platform to reach greater heights.
CLC’s financial products have primarily benefited the micro sector of the economy. We have thus been the incubator for many micro enterprises and progressively, the facilitator of their progression to small to medium scale (SME) enterprises. Moreover, Brand CLC has become a household name in the multitude of rural and semi urban locations we operate in. This has enabled CLC to become an integral part of the empowerment and enrichment of these communities. The new entrant BRAC Lanka currently has 82 customer centres and a customer base of 70,000. Thus the inclusion of BRAC has added a grassroots level market segment to CLC’s portfolio, offering many synergies and providing an ideal opportunity to widen our growth prospects in the years ahead.
CLC’s success has been based on a win-win model -of facilitating economic development in Sri Lanka. It will continue to expand in the micro and SME sectors in the next few years and capitalize on the numerous opportunities that still remain untapped. The Company also plans to become a ‘One stop shop’ for financing requirements of all our customers such as Capital revenue, Working Capital revenue, and Leasing products.
CLC is one of the few Sri Lankan finance companies to be funded by leading international funding agencies such as FMO, the Development bank of Netherlands, Proparco the French Development Agency and DEG a subsidiary of the German Development Bank KFW. These agencies together account for 22 % of your Company’s funding and the partnerships are a valuable endorsement of the role we play in Sri Lanka’s economic progress. Furthermore, these partnerships also stand as testimony to the high standards of governance and management we strive for at CLC. We also appreciate the opportunity these relationships offer to continuously raise the bar for ourselves- whether it be in technical know how or governance or by being abreast of the latest in best practices. CLC will continue to strengthen the current relationships and also look to establish new sources of funding.
Acknowledgements :I would like to convey my sincere appreciation to the Board for their guidance, and continual support and to the team at CLC whose unreserved commitment, tireless effort and talents have been the cornerstone of the Company’s success. My sincere gratitude also extends to our customers, funding partners, Business Introducers, shareholders, and all other stakeholders for their constant support as we look to the year ahead with renewed vigour..
Ishara NanayakkaraChairman
21st May, 2015

12Commercial Leasing & Finance PLC
ys;j;alu
Director’s ReviewKapila JayawardenaDirector

13Annual Report 2014/15
The Economic Environment :
Demonstrating resilience in the face of domestic as well as external challenges, the Sir Lankan economy continued on the momentum we’ve experienced since 2013; to grow at a robust 7.4%, compared with a growth of 7.2% in 2013 and 6.3% in 2012. Accordingly, GDP Per Capita increased to US Dollars 3,625 in 2014 from US Dollars 3,280 in the previous year. The economy was driven by domestic consumption expenditure that constitutes the largest share of aggregate demand, while investments, particularly on construction, also provided an impetus to the economic expansion during the year. Sri Lankan government policy to a large extent remained stable, and the low inflation levels and a low interest rate regime in 2014 were largely conducive to business. Moreover the exchange rate also remained stable to support growth in our business. Strong macro economic growth is expected to continue in 2015; which as per the IMF’s projections is to average 6.5% per year until 2020.
Performance :
The Company’s record performance was reflective of all indicators; with profits reaching the highest, the balance sheet growing to the largest ever and customer base and products reaching the highest. Several internal measures contributed to this growth during the year. For one, significant investments in training and development of our people with a focus on soft skills development was a key factor. Moreover, the Company also introduced branch performance awards to reward the best performing teams, which helped enhance performance whilst further encouraging the team spirit which is valued at CLC.
CLC’s acquisition of BRAC Lanka Finance during the year was another significant milestone which would create many synergies for CLC and BRAC and enable the Company to enhance the value we create for all our stake holders. The
LOLC Group’s shared services model, a key component of its agile business model, also continued to be a key strength which CLC will continue to leverage on, to provide customised state of the art IT solutions for a competitive advantage.
CLC thus looks to the next year and beyond with much optimism, and I am confident that year 2015/16 will see us surpass this year’s achievements and be another record breaking year. CLC will look to create and meet new opportunities to keep expanding its potential as a financial services provider. Towards this end, the development of new products and new distribution channel, will take priority in the year ahead.
Appreciation :
I would like to convey my sincere appreciation to my colleagues on the Board for their support and guidance. My congratulations and appreciation to the entire team at CLC, for their unreserved effort and commitment which propel the company to keep surpassing their own achievements and to constantly raise the bar for themselves and the Company. My sincere appreciation also to our customers, funding partners, shareholders, business introducers and other stakeholders for their constant support and confidence in brand CLC and its potential to create value for all its stakeholders.
Kapila JayawardenaDirector
21st May, 2015
Dear Shareholder, The year has been a momentous one with a remarkable performance by CLC and one which was well supported by a conducive economic environment. The economic environment is discussed at length in the MD&A that follows later on in this report, and let me hence provide a brief overview of a few salient points.

14Commercial Leasing & Finance PLC
ys;j;alu
Krishan ThilakaratneDirector/Chief Executive Officer
CEO’s Message

15Annual Report 2014/15
Dear Stakeholder, It is my pleasure and privilege to share with you the performance and outlook of Commercial Leasing & Finance PLC (CLC) as it ends an year with another remarkable performance which has surpassed previous year’s, to be its highest ever.
Performance highlights :The year under review was record breaking in many ways. Our portfolio grew by 20% to reach Rs. 33 Billion during the year, whilst revenue reached Rs. 8 Billion contributing 18% to LOLC Group’s revenues and 21% of the Group’s PBT. Profit Before Tax grew by 34% to Rs. 1.7 Billion and Profit After Tax reached Rs. 1.4 Billion representing an increase of 52%. CLC’s capital surpassed Rs. 10 Billion during the year. Our NPA ratio also continued to be exceptional at 1.96% as at 31st March 2015, compared with the industry average of 6.7%.
Furthermore, the Company was able to maintain gearing well below industry averages and norms at 2.9 times, vis a vis an industry average which is over 7 times.
The Company’s public deposits amounted to Rs. 9.4 Billion during the year accounting for 32% of its funding. Moreover, we also continued to have a healthy mix in our funding portfolio with bank borrowings constituting 46% and overseas borrowings making up another 22%, a fact which underpins our stability and growth potential.
Another key highlight of the year was CLC’s acquisition of BRAC Lanka Finance to become a 94.35% owned subsidiary of CLC. Although this initiative took place under the Central Bank’s directive for consolidation in the MBFI sector, CLC recognised it to be rife with opportunities to harness as well create many synergies with CLC. For us it was thus more than mere consolidation of two entities but an opportunity for CLC to expand its portfolio to include a new income category.
Our Factoring arm, Commercial Factors also performed well during the year achieving a portfolio growth of 33.8% to reach 2.4 Billion in 2014/15 from Rs. 1.8 Billion in the previous year. The contribution from the branches to the Factoring portfolio grew by a significant 136% to Rs 985 Million whilst the number of clients utilising the Factoring portfolio at branches increased by 73% to 218 as at 31st March 2015, compared with a portfolio of Rs. 417 Million and 126 clients as at 31, March 2014. Our strategy of
pioneering Factoring into outstation areas to reach a market which was hitherto been neglected, has proven to be a success and Commercial Factors will continue to expand the factoring business in the regions.
Context of performance : CLC’s performance during the year was enabled by many factors. An environment of low interest rates and inflation and a stable exchange rate combined with favourable weather patterns during the second half of the year which facilitated agricultural growth, were key environmental factors which supported our performance during the year. The favourable macro economic conditions contributed to the high liquidity in the banking industry, which in turn saw a high credit demand encouraged by low interest rates.
A Brand Value - That Creates Value Our internal strength of being the preferred brand in the market segment, due to the quality of our service and the value we provide, was a key factor which enabled us to capitalize on the numerous opportunities in this conducive environment. The Company has now extended its footprint to 58 branches with 5 new branches being opened during the year. CLC continues to be a very strong brand, and particularly so in the outstation market. We see much potential to further grow our brand in the metropolitan areas and in partnership with key businesses such as leading automobile vendors.
CLC’s business activities have been based on its philosophy that lending should primarily be for economic value creation rather than to finance consumption. Hence, our marketing activities engage customers and prospective customers who would seek our products for a purpose such as to upgrade their business or create a source of income generation.
It is noteworthy that our lending portfolio is well diversified into many different asset classes, many different industries, customer segments, demographics and geographic regions. We are thus proud to have been able to add value to many different sectors in the country and particularly in to segments which are neglected by the larger financial

16Commercial Leasing & Finance PLC
ys;j;alu
institutions. CLC has thus, emerged as one of the leading financial institutions in the country, by making a real impact on the real livelihoods and real economy of the country.
Our focus on ensuring that our Information Technology is state of the art and the best combined with the shared services of LOLC Group will continue. During the year under review, CLC signed up with HNB –which has one of the largest ATM networks in the country, to facilitate our deposit customers to transact using HNB’s island wide ATM network from 2015. The year ahead will also see us offer our customers internet based online transactions including opportunity for utility bill payments; taking us closer to our objective to be the financial service provider offering the most convenience.
We are proud to note that the Company enjoys a staff retention ratio of over 90% which is well above industry average and is a preferred employer in the industry. The commitment, loyalty and talents of our people will continue to be the key factor in propelling the company forward.
Future outlook In addition to the offer of advanced solutions and convenience, our deposit clients benefit from a good return and the unmatched safety of their investments. As CLC is today one of the strongest and safest brands, with an equity of Rs. 10 Billion, an A- ICRA Lanka rating and a well diversified asset portfolio.
The low interest environment is expected to continue during the remainder of 2015, thus auguring well for a continued growth in credit demand and capital investments in the country.
CLC will continue to innovate and introduce new products and expand its footprint, whilst investing in new channels of distribution and establishing new business partnerships to create value to all our stakeholders.
CEO’s Message
CLC’s business activities have been based on its philosophy that lending should primarily be for economic value creation rather than to finance consumption. Hence, our marketing activities engage customers and prospective customers who would seek our products for a purpose such as to upgrade their business or create a source of income generation.

17Annual Report 2014/15
The synergies that we enjoy from being a member of the LOLC Group, and the trust earned by brand CLC as the first choice in the micro and SME market in Sri Lanka, will continue to be key strengths which we will leverage on.
AcknowledgementI would like to convey my sincere appreciation to the Board of Directors for their guidance and the trust and confidence placed in CLC and its people. My appreciation also extends to the entire team that makes up CLC, all our business partners, funding agencies, banks and other Financial institutions and the regulators for their continuous support and our customers for the continuous loyalty and patronage.
Our journey has been one made possible, in unison with all our stakeholders and one that will continue to be driven by the goal of benefiting all our stakeholders and adding value to the lives of all Sri Lankans.
Krishan ThilakaratneDirector/Chief Executive Officer
21st May, 2015

18Commercial Leasing & Finance PLC
ys;j;alu
The Board of Directors
Mr. Ishara Nanayakkara Chairman
Mrs. Kalsha Amarasinghe Non Executive Director
Mr. Kapila Jayawardena Non Executive Director
Mr. Priyantha Fernando Senior Independent Non Executive Director

19Annual Report 2014/15
Miss. Chrishanthi EmmanuelDirector, LOLC Corporate Services (Pvt) Ltd, Secretaries
Dr. Harsha Cabral, PC Independent Non Executive Director
Mr. Krishan Thilakaratne Director/CEO

20Commercial Leasing & Finance PLC
ys;j;alu
Mr. I C NanayakkaraNon-Executive Director / Chairman
Mr. Ishara Nanayakkara joined the Board of Commercial Leasing & Finance PLC in June 2008. He is an astute businessman who holds directorial positions in many corporates and conglomerates in Sri Lanka. He joined the Board of Lanka ORIX Leasing Company PLC in January 2002 and presently holds the position of Deputy Chairman. He is also the Deputy Chairman of Lanka ORIX Finance PLC.
He chairs the Board of LOLC Micro Credit Limited and BRAC Lanka Finance PLC backed by the professional expertise in the industry for over a decade. He also serves on the Board of PRASAC Micro Finance Institution; Cambodia’s largest Micro Finance Institution. His expertise in micro finance in the region is evident in the recent investment in Thaneakea Phum Cambodia Ltd (TPC Micro Finance), the 5th largest microfinance company in Cambodia along with the green field operations in Myanmar via Myanmar Micro Finance Company Ltd of which he is the founding Chairman.
Mr. Nanayakkara is the Deputy Chairman of Seylan Bank PLC, a premier commercial bank in the country. His exposure in general and life insurance through LOLC Insurance Company Ltd, stock brokering through LOLC Securities Ltd, factoring through LOLC Factors Ltd, micro financing and Islamic finance, manifests his vision of catering the entire value chain of the finance sector.
His Business philosophy based on sustainable development has made LOLC enter into many new business ventures with high potential for growth in all three spheres, economic, social and environmental.
Accordingly he serves the Board of Sierra Constructions Ltd, AgStar PLC, Lanka Century Investment PLC and Associated Battery Manufacturers (Cey) Ltd in line with the Group’s vision to expand into strategic investments such as Agriculture & Plantation, Trading & Manufacturing, Leisure and Construction.
His need to diversify LOLC group into a key conglomerate that operates in the growth sectors of the economy is further reflected through the vital role played by him in Brown & Company PLC and Browns Investments PLC as the Executive Chairman. Browns Group is a renowned
conglomerate with leading market position in trade, leisure, manufacturing, consumer appliances and agriculture equipment.
Mr. Nanayakkara was appointed as the Chairman of FLC Holdings PLC, FLC Hydro Power PLC, and as a Director in Pussellawa Plantations Ltd, Ceylon Estate Teas (Pvt) Ltd and FLMC Plantations (Pvt) Ltd subsequent to the recent acquisition.
He holds a diploma in Business Accounting from Australia.
Mr. W D K Jayawardena Non-Executive DirectorMr. Kapila Jayawardena counts over thirty years’ experience in Banking, Financial Management and Corporate Management. He joined the Board of Commercial Leasing & Finance PLC in June 2008. Mr. Jayawardena was appointed as the Group Managing Director/CEO of Lanka ORIX Leasing Co., PLC in 2007. He was the former CEO/Country Head of Citibank Sri Lanka & Maldives.
Mr. Jayawardena has played a pivotal role in the banking sector contributing to the financial market reforms development and regularly advising regulators on prudential requirements and has widespread experience in introducing innovative financial service products to the market.
LOLC Group is one of the largest conglomerates in Sri Lanka with presence in diversified industries such as Financial Services, Trading, Manufacturing, Construction, Leisure and Renewable Energy.
As an individual with extensive international and domestic financial experience, Mr. Jayawardena was a key member of the following committees:
• ChairmanSriLankaBank’sAssociation(SLBA)2003/2004
• MemberoftheFinancialServicesReformsCommittee(FSRC) 2003/ 2004
• DirectorofLankaClearandwasinstrumentalincompleting the automated clearing project for the Sri Lankan banking industry 2004
• PresidentoftheAmericanChamberofCommerceSriLanka 2006/2007
• MemberoftheinauguralSovereignratingsteamforSriLanka
• MemberoftheNationalCouncilofEconomicDevelopment (NCED)
The Board of Directors

21Annual Report 2014/15
• BoardMemberoftheUnitedStates-SriLankaFulbrightCommission
Presently, Mr. Jayawardena holds Chairmanship/directorship in the following companies:
• LankaORIXLeasingCompanyPLC–GroupManagingDirector/CEO
• LankaORIXFinancePLC-Chairman
• LOLCInsuranceCompanyLimited-Chairman
• LOLCSecuritiesLimited-Chairman
• EdenHotelsLankaPLC-Chairman
• PalmGardenHotelsPLC-Chairman
• LOLCGeneralInsuranceLtd-Chairman
• LOLCMicroCreditLtd-Director
• CommercialLeasing&FinancePLC-Director
• Brown&Co.,PLC-Director
• BrownsInvestmentsPLC-Director
• SeylanBankPLC-Director
• BRACLankaFinancePLC-Director
• RiverinaResorts(Pvt)Ltd-Director
• FLCHoldingsPLC-Director
• PussellawaPlantationsLimited-Director
• FLCHydroPowerPLC-Director
• FLMCPlantations(Pvt)Ltd-Director
Qualifications : Master of Business Administration, American University of Asia, Fellow of the Institute of Bankers, Sri Lanka, Associate of the Institute of Cost and Executive Accountants, London.
Mrs. K U Amarasinghe Non-Executive Director
Mrs. Kalsha Amarasinghe was appointed to the Board in June 2008. She holds an Honours Degree in Economics.
She serves on the Boards of Lanka ORIX Leasing Company PLC, LOLC Micro Credit Ltd, LOLC Insurance Co. Ltd, Palm Garden Hotels PLC and Eden Hotel Lanka PLC. She also serves as a Director on the Boards of Lanka ORIX Finance PLC, Brown & Company PLC, Browns Investments PLC, Riverina Resorts (Pvt) Ltd, FLC Hydro Power PLC, FLC Holdings PLC, Pussellawa Plantations Ltd, Melfort Green Teas (Private) Ltd and FLMC Plantations (Pvt) Ltd
Mr. P D J Fernando Senior Independent Non-Executive Director
Mr Priyantha Fernando was appointed to the Board of CLC in March 2012.
Mr Fernando has more than 35 years of experience at the Central Bank where he rose to the position of the Deputy Governor. He was the Deputy Governor of the Central Bank in 2010/2011, in charge of the Financial System Stability and the Corporate Services clusters. Mr Fernando has extensive experience and expertise in the fields of Banking and Financial Sector particularly at the policy making levels in financial regulation and supervision, Information technology, national accounting, macro-economic analysis and statistics, finance and fund management. At the Central Bank he was the chairman of the Financial Stability Committee, member of the Monetary policy Committee, member of the Risk Management Committee and Chairman of the National Payment Council. He also functioned as the secretary to the Monetary Board during 2009/2010.
He was an ex-officio board member in several regulatory organizations namely the Securities Exchange Commission, the Insurance Board of Sri Lanka, the Chairman of the Credit Information Bureau, Institute of Bankers –Sri Lanka and have also served as a Board Member at Employers Trust Fund, Lanka Clear (Pvt) Ltd and Lanka Financial Services Bureau.
During his career, he has initiated and spearheaded several key projects of national importance, especially in the area of developing the infrastructure for the national payments and settlement system.
Mr. Fernando has served a number of committees at national level covering a range of subjects representing the Central Bank.
He has been appointed the Chairman of Golden Key Credit Card Company and currently serves in the boards of the Union Bank of Sri Lanka PLC, Hambana Petro Chemicals (Pvt) Ltd, Taprobane Holdings Ltd, Ceylon Leather Products PLC, Commercial Insurance Brokers (Pvt) Ltd and Thomas Cook Travels Sri Lanka.

22Commercial Leasing & Finance PLC
ys;j;alu
Dr. H Cabral, PC Independent Non-Executive Director
Dr Harsha Cabral was appointed to the Board as an Independent Non Executive Director in December 2011. He is a President’s Counsel and holds a PhD in Corporate Law (University of Canberra) Australia. Dr Cabral is a Senior Counsel in Corporate Law with 28 years of experience, specialising in Company Law, Intellectual Property Law, Commercial Law, International Trade Law & Commercial Arbitration.
He serves as a Commissioner, Law Commission of Sri Lanka. He is a Member of the Advisory Commission in Company Law, Sri Lanka (key member in drafting the new Companies Act No. 07 of 2007), member of the Ministerial Committee appointed to reform the Law on Commercial Arbitration. He is a Council member of the University of Colombo, member of the Council of Legal Education in Sri Lanka, member of the Academic Board of Studies of the Institute of Chartered Accountants of Sri Lanka and a member of the Corporate Governance Committee of the Institute of Chartered Accountants of Sri Lanka.
He is currently serving on the Boards of Diesel & Motor Engineering PLC (DIMO), Richard Pieris & Co. Distributors Ltd., Tokyo Cement Company (Lanka) PLC, Tokyo Super Cement Co (Private) Ltd., Tokyo Cement Power (Lanka) Ltd, Hayleys PLC. Hambana Petrochemicals Ltd, Lanka ORIX Finance PLC, Tokyo Eastern Cement Company Ltd, Browns Investments PLC, Just in Time Consultancy (Pvt ) Ltd, Imperial Institute of Higher Education (Pvt) Ltd and Alumex PLC. He is also the Chairman of Tokyo Cement Group.
Dr Cabral is a lecturer and examiner of the University of Colombo, Council member and faculty member of Institute for the Development of Commercial Law & Practice, and the Vice President of Business Recovery & Insolvency Practitioners Association of Sri Lanka.
He is the author of several books on Company Law & Intellectual Property Law.
Mr. D M D K Thilakaratne Director/Chief Executive Officer
Mr Krishan Thilakaratne is the Director/ CEO of Commercial Leasing & Finance PLC, General Manager of LOLC Al-Falaah - Islamic Business Unit of LOLC Group and also the Head of the Valuation Unit of LOLC under LOLC Motors Ltd. He also serves on the Board of Commercial Insurance Brokers (Pvt) Ltd., the largest Insurance Broker in Sri Lanka which is an associate Company of Commercial Leasing & Finance PLC.
He previously held the positions of CEO, Lanka ORIX Factors Ltd, and CEO, Auto Finance of LOLC. He is an Associate Member of the Institute of Bankers of Sri Lanka and joined the LOLC Group in 1995.
Miss. Chrishanthi EmmanuelDirector, LOLC Corporate Services (Pvt) Ltd, Secretaries
Miss Chrishanthi Emmanuel is a Fellow of the Institute of Chartered Secretaries and Administrators - UK and a Fellow of the Institute of Chartered Corporate Secretaries (Sri Lanka).
The Board of Directors

23Annual Report 2014/15
Management Team
Mr. Krishan Thilakaratne - Director/Chief Executive OfficerMr. Jude Anthony - Deputy General Manager - Branch NetworkMr. Nihal Weerapana - Deputy General Manager - RecoveriesMrs. Deepmalie Abhayawardane - Assistant General Manager - FactoringMr. Tharanga Indrapala - Assistant General Manager - OperationsMrs. Nishanthi Kariyawasam - Head of Finance

24Commercial Leasing & Finance PLC
ys;j;alu
Mr. Lasantha Peiris - Head of IT OperationsMr. Upul Samarasinghe - Assistant General Manager - CreditMr. Lal Abeyrathne - Head of Marketing - FactoringMr. Prasanna Dayarathna - Chief Manager - Operations (Factoring)Mr. Prasanna Karandagolla - Chief Manager - Polonnaruwa RegionMr. Terrence Kaushalya - Chief Manager - Saving & Deposits
Management Team

25Annual Report 2014/15
Mr. Pradeep Madurasinghe - Chief Manager - Negombo RegionMr. Dishan Obeysinghe - Chief Manager - Asset Backed FinanceMr. Ruwan Wickremeratne - Chief Manager - RecoveriesMr. Jagath Jayasekara - Manager - Human ResourcesMr. Rasika Alwis - Head of AdministrationMr. Hasitha Hemasiri - Assistant Manager - Customer ServicesMr. Prasad Perera - Assistant Manager - Marketing Communications

26Commercial Leasing & Finance PLC
ys;j;alu
Regional Management Team
Mr. Samitha Aruggoda - Chief Manager - Gampaha RegionMr. Sarath Gamage - Chief Manager - Anuradhapura RegionMr. Prasanna Goonethilleke - Chief Manager - Kurunegala RegionMr. Suneetha Samarawickrama - Chief Manager - Colombo RegionMr. Sunil Shantha - Chief Manager - Galle RegionMr. Sarath Wijenayake - Chief Manager - Ratnapura Region

27Annual Report 2014/15
Mr. Sampath Palliyaguru - Manager - Matara RegionMr. Janaka Karunaratne - Manager - Kandy RegionMr. Harsha Kumarage - Assistant Regional Manager - Anuradhapura Region

Needs
Operational ReviewsManagement Discussion & Analysis | Branch Network | Financial Review | Sustainability Report | Corporate Governance | Risk Management
Our corporate philosophy “Hithawathkama” helps us to understand the needs of Sri Lankans. Our portfolio of financial products and services helps them grow their wealth.
UnderstandingSri Lankan
ys;j;alu“ H i t h a w a t h k a m a ”


30Commercial Leasing & Finance PLC
ys;j;alu
Commercial Leasing & Finance PLC (CLC) recorded an exceptional 2014/15 financial year in both financial and operational terms. Apart from creating greater value for our shareholders, we were able to improve several operational aspects which supported the strong growth experienced by CLC during the year. Furthermore, we continued our quest to improve and streamline our processes to provide efficient service for our customers while maintaining strict internal controls. CLC is among the largest non-banking financial institutions in Sri Lanka with 27 years’ experience in the financial sector.
A key process improvement undertaken during the period was the redesigning of documentation for our loan and lease products, which now offers customers greater ease in doing transactions due to minimal documentation requirements. We have also taken the initiative to ensure that customers reap the benefits of technological advancements such as SLIPS, Online transacting and our ATM network, by connecting with the customers and vendors in real-time.
Business ChannelsThe sector performed well during the period under review due to reduction of tax rates on importing vehicles, reduction in fuel prices and the low interest regime that prevailed through the year. In addition, CLC’s ability to source low cost funds has helped in offering competitive lending rates to target customers.
The deep domain experience and the strength of the sales and marketing team were key factors in achieving set targets during the year. The introduction of new products along with CLC’s exclusive business model fuelled further growth. Our employees are encouraged to pursue excellence and are supported with comprehensive training programmes to enhance their skills.
During the year, 5 new branches were opened in strategic locations to enhance our reach to offer greater customer convenience. The introduction of branch performance awards by dividing branches into three categories has helped drive higher productivity and resulted in stronger results for the company.
Management Discussion & Analysis
Going ahead, we will endeavour to expand our portfolio of products and services, while ensuring geographical expansion across the length and breadth of the country. The severe competition and price wars in the industry in which we operate requires us to create a distinctive positioning for our company and product portfolio in such a manner that customers opt for CLC products for its outstanding service levels and innovative products. Our success in this segment can be attributed to one of the strongest marketing teams in the industry, which has the capability to drive growth and achieve corporate objectives.
Leasing & LoansThe leasing sector experienced a YoY growth of 18.63%. The Net advances portfolio of CLC, which primarily consists of leases, loans and flexi cash, increased from Rs. 25.7 Billion in March 2014 to Rs. 30.5 Billion in March 2015. In a sectoral analysis, advances to the Services sector (Rs. 8.4 Billion) and Trade sector (Rs. 7.9 Billion) accounted for the highest increase in advances.
Since industry focus was on financial sector consolidation in the first half of the year, the usual heightened competition was absent. However, there was a visible shift by the banking sector to stake a share in traditional NBFI products, as they were in a position to offer more competitive rates.
In the leasing industry, a favourable import duty structure for Hybrid and Light Commercial Vehicles (LCVs) was announced by the government. In post budget 2014, there was a shift in duty concessions from Hybrids to motor cars below 1000cc. Infrastructure development projects across Sri Lanka rendered lending for construction vehicles and equipment a lucrative business avenue for the company.
During the year, net interest income from the portfolio improved due to decrease in interest expenses.
During the year under review, we expanded the number of products in our portfolio and stepped up promotional efforts to attract a greater number of customers while leveraging on new partnerships. Two new advanced products Flexi cash, an innovative working capital solution for businesses; and Flexi loan, a product with variable interest rates were introduced
31Annual Report 2014/15
during the year. The company undertook three major marketing campaigns for Flexi cash, Alto and Hybrid vehicles, in addition to many regional promotional activities. In the first year of its launch, the net value of the Flexi cash portfolio rose from Rs. 333 Million to Rs. 2.06 Billion, amassing a total number of 1,300 contracts, which demonstrates the dynamism of CLC in the industry. We forged new partnerships with two prominent vehicle importing companies, in addition to our other existing partnerships.
CLC continued to consolidate its position as the single largest player in the market for financing Light Commercial Vehicles (LCVs). Currently, 17% of all LCVs sold in the country are financed by CLC. The company enjoys a strong presence in the agricultural sector and is one of the largest players in tractor financing.
We believe that product innovation and the adoption of new technology in tandem with increased product marketing activities will define the future growth of CLC’s advances portfolio. Looking ahead, our focus will be on growing the corporate lending sector, as we have recently set up a corporate lending unit under the Asset Backed Finance Business unit. In the meantime, we will continue to break new ground in personal lending, while leveraging on synergies with the Savings & Deposits arms to drive greater product innovation.
DepositsCLC’s deposits arm continued its strong growth trajectory by reaching Rs. 9.4 Billion in deposits in the financial year under review, compared to Rs. 7.5 Billion in the previous year. The period witnessed a 24% growth in fixed deposits, which reflects the public trust towards the company. We also continued to strengthen our customer service levels which helped to boost the deposit base of the company further. Customers are becoming increasingly cautious about the security of their investments and are seeking companies that have built a strong legacy of trust. In this context, CLC is emerging as the preferred choice for clients who understand the value of our heritage. CLC’s strengths and group synergies with parent company LOLC helps us retain shareholder wealth and grow customer confidence.
We continued to encourage healthy competition between branches to recognise the best performing ones. Bambalapitiya branch was selected as the best deposit mobilization branch of the year. Moreover, we continued to add value to our existing product portfolio by introducing new value-added features and by focusing on enhancing service quality to exceed customers’ expectations. Our technologically advanced products and service standards offer us a unique positioning and we will continue to fine-tune our delivery further.
Deposits and savings products are one of the key funding sources for CLC. Customers have the option of selecting investment instruments according to their need. We continue to forge ahead in new product development by using cutting-edge technology to add more value to the existing product range. One of our primary goals is to inculcate savings habits among people by reaching the unbanked segment of the society by promoting savings products.
FactoringThe pace of competition in the arena of factoring has been rising steadily, as companies engaged in Factoring rose to 10 in number during the year from 7 in the previous year. In addition, many other finance companies and banks have begun offering similar products such as Cheque Discounting, Speed draft and so on, enabling entrepreneurs to fulfil their working capital requirements without pledging their receivables.
Some of the other challenges faced by the company during the year were high level of excess liquidity in the banking sector and low demand for credit due to slow growth in existing businesses experienced throughout the year. CLC’s Factoring arm was buoyed by its strong business model while operating against this challenging backdrop in 2014/15. However, we were quick to leverage on the stable economic and political environment that prevailed during the year and expect this to lead to growth of trading and service business sectors which, in turn, will open up avenues for us to seize opportunities in lending and providing working capital solutions.

32Commercial Leasing & Finance PLC
ys;j;alu
The Factoring portfolio increased from Rs. 1.8 Billion in 2013/14 to Rs. 2.4 Billion in 2014/15, which reflects a sharp growth of 33.8%. The factoring arm contributes 7% to the company’s total portfolio and 7% to its income. The active client base grew from 290 clients in 2013/14 to 398 in 2014/15. During the year under review, we persisted with the previous year’s strategy to diversify our market segment from Corporate to SMEs through branch factoring programmes. We leveraged on offering more flexible and customized solutions to suit working capital related requirements, and expanded service standards through SLIP transfers and Fax transfers. All these improvements helped us achieve our targets for the year. The branch Factoring portfolio which stood at Rs. 417 Mn and 126 clients as at 31st March 2014 grew to 218 clients contributing Rs. 985 mn to the total Factoring portfolio of Rs. 2,413 mn as at 31st March 2015, which is a 73% increase in number of clients and a 136% increase in the branch factoring portfolio.
Factoring fits well into the overall company’s basket of products as it is the only product that can be offered without collateral but against receivables. The robust performance of the Factoring unit in the year under review and our dynamic strategies for the future will no doubt consolidate and improve Commercial Factors’ position as one of the largest factoring related solutions providers in the country.
Building Human CapitalCLC has built up a strong reputation for professionally trained and courteous staff that are well-versed in all aspects of the company and who engage closely with customers to customize financial solutions for them. The company continues to invest in its people through talent acquisition, talent development and talent retention, and by offering its employees a superior work culture with numerous opportunities for career progression. Building competencies through formal training and development programmes has helped us attract and retain the best and brightest talent. In turn, we have reached out to share and impart our knowledge with academia wherever possible, so as to share our best practices with the rest of the industry. Not only is CLC perceived as possessing a competitive talent acquisition team, it is also known for its pioneering thought leadership in the industry.
Management Discussion & Analysis
The CLC team consists of young and dynamic professionals, with 77% belonging to the 18-35 age groups, which signifies a strong potential for developing this talent for the sustainable future of the company. The company enjoys an average monthly retention rate of 98% and above industry average year-to-date retention rate of 85% largely due to the myriad opportunities for professional growth and dynamic and pleasant work culture. We are focused on creating an internal pipeline of leadership, having introduced a comprehensive development program facilitated by 3W Consulting for Branch and Regional Managers, which is considered a significant milestone in developing leadership skills and competencies.
CLC has adopted a lateral hiring strategy, which is, hiring candidates with industry experience and then steeping them in our culture, mainly due to the fact that they are able to achieve set budgets within a short time span, as against the industry norm of hiring fresh school leavers. As a result, we have built up a strong talent pool built around the concept of ‘Hithavathkama’. The Human Resources team won the Silver award at the SLITAD awards in December 2014.
Looking ahead, the objective of the HR team is to introduce management training programmes while stepping up recruitment initiatives. Greater Environment, Health & Safety (EHS) and efforts at reducing carbon footprint are being initiated along with an increased focus on training frontline employees. CLC’s success can be strongly attributed to its professional team of employees and in the year ahead, every effort will be made to consolidate and build on this reputation further.
Customer ServiceCustomer service is a hub which interconnects all other departments and we will continue to strengthen this function. The professionalism of our service is directly reflected in our high customer retention levels. The Customer Service Hotline continues to be a key touch point between staff and customers. The Marketing Call Centre set up last year, which is dedicated to handle all inbound calls on advertisements, product promotions and marketing campaigns, performs a useful role in streamlining the company’s connection with customers and other

33Annual Report 2014/15
stakeholders. We have also made efforts to constantly enhance service levels through new technology and the year ahead will see CLC offering superior mobile banking facilities to customers.
Our staff is also equipped to handle customer inquiries relating to the entire product range. Teamwork and high communication skills were factors that played a major role in our enhanced performance during the year. The work culture and ambience was improved during the year with extensive refurbishment which enhanced comfort levels and a spacious feeling for both staff and customers. Some key processes were analysed and paradigm shifts made so that maximum efficiency could be achieved. Continuous training and updating of frontline staff was also accomplished.
Going ahead, continuous training of human resources will be a key focus area, while we will ramp up our adoption of technology by upgrading processes and procedures so that they meet the evolving expectations of our customers.
CreditDuring the year under review, the company focused on improving systems and processes in the Credit division, to minimize delivery time to customers which would ultimately result in improved customer satisfaction. We were able to strategically strengthen the structure of our collection division, improve credit policies and infuse greater controls of procedures, which together improved efficiencies in the Credit function. A strong risk framework is in place and underpinned our success during the year.
Moreover, a concentrated effort was made to empower Branch Managers and Regional Managers by decentralizing decision-making process, so that they are fully equipped to approve files at regional level. This, along with other process developments and improvements, enhanced our credit division out put. Continuous internal credit training programmes were conducted with a view to enhance the credit knowledge of the frontline staff. Furthermore, marketing staff in the company underwent external credit training and risk evaluation programmes, to ensure that they have a 360-degree understanding of the business.
Our astute portfolio management guided by our robust risk and governance policies has resulted in low Non Performing Loan (NPL) ratios. We pride ourselves on our diversified
portfolio that strikes the right balance between assessed risks and secure options through portfolio diversification. Recoveries were closely monitored to ensure that stability was maintained throughout the year.
RecoveriesAdverse weather conditions in the first half of the 2014/15 financial year resulted in a low growth in the leasing segment, especially in the north and north-east. However, improved weather conditions in the second half of the year coupled with a low interest and inflation regime reflected a strong pick-up in growth across all the regions. The Recoveries division ended the year on a high, recording positive results.
Cognizant of the hardships our customers had to endure due to unfavourable weather, we extended them the fullest support in the first part of the year; offering grace periods and restructuring loans and leases, so that customers engaged in agriculture and agri related businesses could tide over a difficult period. CLC’s Recoveries Team is focused and mindful of its social responsibility to provide support to our customer base.
This resilient performance by the recoveries team was achieved owing to the extensive training that has been given to our staff for them to deal with extraordinary situations such as the one we faced during the first half of the year, and they are now equipped to react and adapt to situations as they develop. The activities of the collection team is monitored on a daily basis and they have been empowered with relevant data to carry out their functions smoothly. In order to streamline the system further, delinquency meetings were carried out at all branches to address relevant issues in a timely manner. Going forward, we plan to centralize call centre activities to maximize productivity and provide training to staff in handling of new products.
Marketing CommunicationsBrand CLC grew from strength to strength in the year under review. CLC was listed 44th out of top 100 brands in Sri Lanka by LMD Brands Annual Magazine in 2014/15. The brand was further nominated for SLIM- Nielsen’s ‘People’s Financial Service Provider of the Year’ award in 2015. These accolades are the result of close customer engagement and acting on customer feedback to better meet and surpass their expectations. During the year, CLC’s official Facebook

34Commercial Leasing & Finance PLC
ys;j;alu
Management Discussion & Analysis
page was launched, which opened a new interface for the company to interact with its customers and step up to its digital media presence. The CLC Facebook page has witnessed a significant growth in fans since its launch in January 2015. However, majority of our customer segment hails from rural and developing areas, therefore, we will continue to maintain our presence in traditional media as well.
We are focused on enhancing brand equity and brand engagement online, so that the division is in a better position to offer recommendations to enhance business through insights into competition and market trends. The popularity of the CLC brand has been proved by being a nominee of a SLIM-Nielsen Award. The company’s unique operating philosophy of ‘Hithavathkama’ is cascaded across all its communications and underpins the company’s corporate culture.
Future OutlookCLC stands on a strong footing today as one of the most prominent and trusted financial services brands, reflecting an equity capital of Rs. 10 Billion and an A- ICRA rating. The company is innovating its portfolio of products and services to better benefit from forecasted growth in credit demand and capital investments in the country. CLC staff drives its success quotient. Therefore, existing and potential customers can expect even greater levels of personalized service across the company’s extensive branch network. The company plans to leverage on its strength and group synergies as a member of the LOLC Group to achieve even greater financial and operational results in the upcoming financial year.

35Annual Report 2014/15
Branch Network
Nelliady
Jaffna
Killinochchi
Mannar Parakramapura
Kebitigollewa
Trincomalee
Serunuwara
Batticaloa
Kalmunai
Ampara
Monaragala
BadullaNuwara Eliya
Welimada
RatnapuraMaharagama
Kalutara
NugegodaBambalapitiya
Pettah
KiribathgodaKaduwela
Avissawella
Kalawana
Tissamaharama
Embilipitiya
UdugamaAmbalangoda
Pitigala
Baduraliya
GalleMatara
Anuradhapura
Nochchiyagama
Dambulla
Polonnaruwa
Bakamuna
Puttalam
ChilawKurunegala
Matale
Mahiyanganaya
KandyWarakapola
Gampaha
Kuliyapitiya
Negombo
Wennappuwa
Medawachchiya
Vavuniya
CLC Branches
Post Office Services Centers
Specialised Factoring Branches
Dehiwala
Grandpass
Minuwangoda
Wattala
Gampola
Nawala

36Commercial Leasing & Finance PLC
ys;j;alu
Financial Review
OverviewThe Company closed the financial year ending 31st March 2015, recording strong performance with a profit before income tax reaching Rs. 1,728Mn, reporting a growth of 34% over the previous year. The Company maintained the growth momentum to achieve an after tax profit growth of 52% moving to 1,426Mn from Rs.936Mn whilst the earnings per share rose to Rs.0.22 from Rs.0.15 during the year. This strong growth in profitability was achieved amidst lower margins experienced during the year as a result of the drop in lending rates.
In September 2014, the Company acquired 59.33% of the voting rights of BRAC Lanka Finance PLC(BRAC) whose principal activity is the provision of micro financial services. In the mandatory offer made subsequently, an additional stake of 35.02% was acquired in November 2014, increasing its ownership to 94.35%. Group figures in the profit or loss statement reflects seven months performance of BRAC Lanka Finance PLC (BRAC) together with 12 months performance of the Company. BRAC contributed Rs.157Mn to the bottom line of the Group while the contribution from its associate company with 40% ownership, Commercial Insurance Brokers Ltd., was marginal.
Interest IncomeThe primary source of income of the Company increased marginally over the previous year to Rs.7,590Mn from Rs.7,514Mn due to thinning margins with the relatively low lending rate regime prevailing across the industry.
In Rs.Mn
Interest incomeFY
2014/2015FY
2013/2014Variance
%
Leasing 2,821 3,163 (11)
Loans & advances 3,451 2,646 30
Hire purchase 122 495 (75)
Factoring 521 695 ( 25)
Overdue interest 536 446 20
Other 139 69 99
Total 7,590 7,514 1
2014/15
2013/14
LeasingLoans & advances Hire purchaseFactoringOverdue interestOther
37%
7%7%
45%
42%
35%
9%6%
1%
7%
2%
2%
Components of interest income
Interest income on leasing and hire purchase declined from Rs.3,163 Mn to Rs.2,821 Mn and Rs.495 Mn To Rs.122 Mn respectively mainly due to the shift in the product mix. Interest income on loans reached to Rs.3,451 Mn from Rs.2,646 Mn. Leasing and loan interest income represents 82% of the total interest income compared to 77% over the corresponding last year. Factoring income stood at Rs.521 Mn, with a decrease of 25% from Rs.695 Mn. The overdue interest income grew by 20% to reach Rs.536 Mn compared with Rs.446 Mn in the previous year.
Interest ExpenseInterest expense reduced by 21% to Rs.2,406 Mn from Rs.3,039Mn mainly due to the low interest regime prevalent market-wide, strong fund management strategies and conscious efforts made to tap low cost funding. This is a significant performance considering the higher level of borrowings sourced by the company by way of deposits and borrowings to support the aggressive business growth.
37Annual Report 2014/15
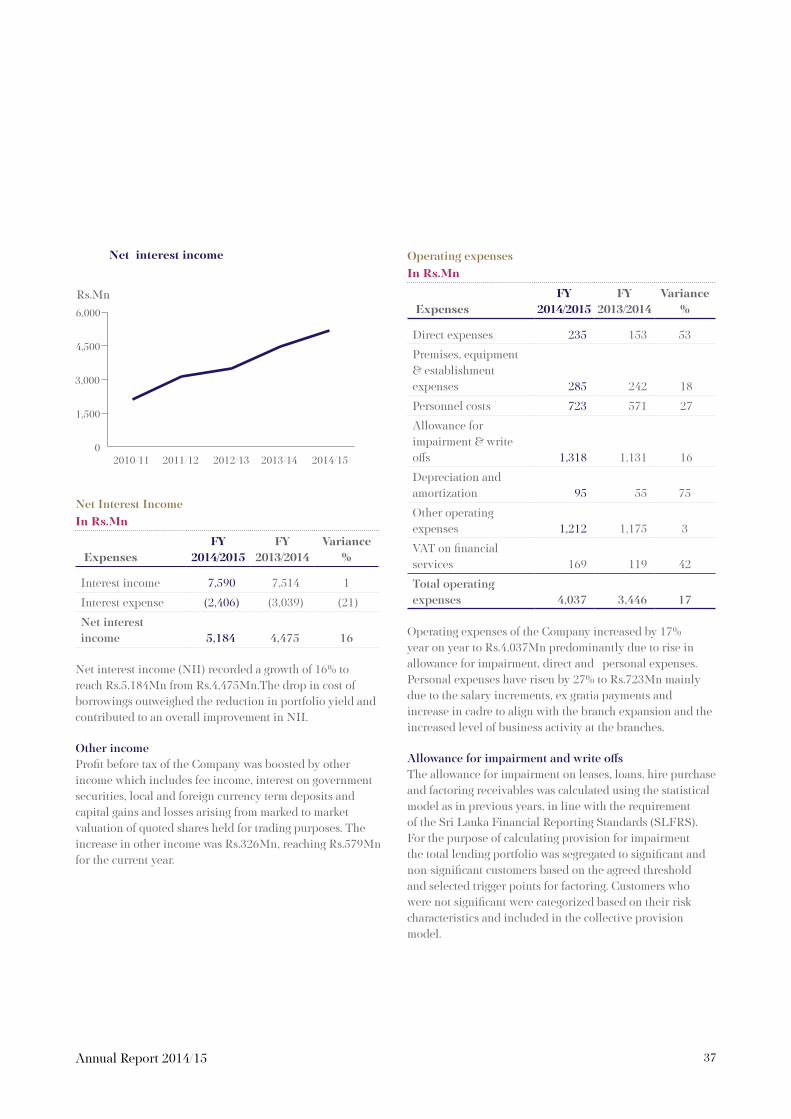
Net Interest IncomeIn Rs.Mn
ExpensesFY
2014/2015FY
2013/2014Variance
%
Interest income 7,590 7,514 1
Interest expense (2,406) (3,039) (21)
Net interest income 5,184 4,475 16
Net interest income (NII) recorded a growth of 16% to reach Rs.5,184Mn from Rs.4,475Mn.The drop in cost of borrowings outweighed the reduction in portfolio yield and contributed to an overall improvement in NII.
Other incomeProfit before tax of the Company was boosted by other income which includes fee income, interest on government securities, local and foreign currency term deposits and capital gains and losses arising from marked to market valuation of quoted shares held for trading purposes. The increase in other income was Rs.326Mn, reaching Rs.579Mn for the current year.
Operating expensesIn Rs.Mn
ExpensesFY
2014/2015FY
2013/2014Variance
%
Direct expenses 235 153 53
Premises, equipment & establishment expenses 285 242 18
Personnel costs 723 571 27
Allowance for impairment & write offs 1,318 1,131 16
Depreciation and amortization 95 55 75
Other operating expenses 1,212 1,175 3
VAT on financial services 169 119 42
Total operating expenses 4,037 3,446 17
Operating expenses of the Company increased by 17% year on year to Rs.4,037Mn predominantly due to rise in allowance for impairment, direct and personal expenses. Personal expenses have risen by 27% to Rs.723Mn mainly due to the salary increments, ex-gratia payments and increase in cadre to align with the branch expansion and the increased level of business activity at the branches.
Allowance for impairment and write offsThe allowance for impairment on leases, loans, hire purchase and factoring receivables was calculated using the statistical model as in previous years, in line with the requirement of the Sri Lanka Financial Reporting Standards (SLFRS). For the purpose of calculating provision for impairment the total lending portfolio was segregated to significant and non-significant customers based on the agreed threshold and selected trigger points for factoring. Customers who were not significant were categorized based on their risk characteristics and included in the collective provision model.
Net interest income
0
1,500
3,000
4,500
6,000
2010/11 2011/12 2012/13 2013/14 2014/15
Rs.Mn

38Commercial Leasing & Finance PLC
ys;j;alu
Impairment loss for the year increased from Rs.1,131Mn to Rs.1,318Mn. This was due to an additional provisioning being made on identified facilities in arrears including few factoring facilities under litigation. The Company’s impairment balances remain healthy and conservative and well over the stipulated regulatory levels at the year end.
In Rs Mn
FY2014/2015
FY2013/2014
Individual impairment charge 758 855
Collective impairment charge 560 276
Total impairment charge 1,318 1,131
Individual impairment loss recorded a marginal decrease compared to the previous year but the collective impairment provision showed an increase in line with the prudent provisioning policy adopted by the Company.
Financial Review
Rs.353Mn to Rs.302Mn due to part reversal of deferred tax asset in the year under review. The Company paid Rs.204Mn as VAT on financial services, NBT on financial services and Crop insurance levy which is included in direct expenses.
Asset growthThe Company’s balance sheet strengthened, supported by the aggressive growth in the lending portfolio increasing total assets to Rs. 42,385 Mn from Rs.32,934 Mn, 29% higher than the previous year. During the year, the company grew its net lending portfolio including factoring from Rs.27,570 Mn to Rs.32,982 Mn recording a rupee growth of Rs.5,412Mn. The net lending portfolio accounts for 78% of the total assets, a reduction of 6% from 84% in the previous year. The ratio dipped with the investment of Rs.968Mn in the subsidiary company, BRAC. The growth of the assets was also supported by the increase in financial investment mainly in foreign currency term deposits.
Total assets to net lending portfolio
0
10,000
20,000
30,000
40,000
50,000
Total assets
Net lending portfolio
2011 2012 2013 2014 2015
Rs. Mn.
NPL ratio
0
1
2
3
4
2011 2012 2013 2014 2015
%
The Company strengthened the recovery efforts to create stability of the lending portfolio. The non-performing loan ratio, the measure of the quality of the lending portfolio has improved from 2.44% to 1.96% since 31st March 2014.This is well below the industry peers.
TaxationThe current year’s profit after tax reached Rs.1,426Mn after providing Rs.302Mn for taxation. Rs.443Mn has been provided as income taxes and Rs.141Mn has been reversed as deferred tax. The Company’s tax expense dipped by 14%, from
The asset base of the Group stood at Rs.45,429Mn mainly supported by the growth of the loan book of the Company and BRAC. During the year, the Group disbursed Rs.27,530Mn in leases, loans and hire purchase.
Net asset per share of the company was Rs.1.59, up from Rs. 1.39 since 31st March 2014. Further, the Return on Average Assets(ROAA) has improved to 3.79% from 3.11% reflecting the company’s efficiency in asset and liability management.

39Annual Report 2014/15
Deposits from customersThe customer deposit base grew from Rs 7,534Mn to Rs.9,381 Mn, a growth of 25% over last year despite fluctuating interest rates. This accounted for 32% of the funding mix. The growth was largely driven by the concentrated efforts made on fund mobilization, supported by the strong brand image. Launching of CLC ATM/Debit card in April 2015 will help the Company to improve its savings deposit base further.
FundingTotal sources of funding of the Company increased from Rs.21,989Mn to 29,551Mn.During the period under review, the Company received long term loans amounting to Rs.2.4Bn and short term borrowings equivalent to Rs.7.7Bn out of which Rs.3.8Bn was borrowed against foreign currency fixed deposit.
Foreign funding agenciesSecuritizationOther long termShort termCustomer depositsOthers
22%
9%
34%
1%
3%
32%
Funding mix as at 31-3-2015
30%
8%8%
19%
1%
34%
Funding mix as at 31-3-2014
CapitalizationThe equity of the Company reached Rs.10,115Mn, an increase from Rs.8,856Mn with the earnings from operations. The Company’s rich repository of capital continued to energize and strengthen the company’s growth prospects. Return on Average Equity (ROAE) increased to 15.03% from 11.21% over previous year.
Core capital and total risk weighted capital ratio, Capital Adequacy Ratios (CAR) stood at 28.27% and 25.57% respectively as at financial year end 31st March 2015, well above the stipulated regulatory minimum of 5% and 10% each. The regulatory capital computation excludes Rs.968Mn invested in subsidiary company.
The market capitalization of the Company exceeded Rs.25Bn as at 31st March 2015 with a closing share price of Rs.4.00,which resulted in a Price Earning(PE) ratio of eighteen (times).
The strong performance of the Company during the year and the strong balance sheet, positions the Company to derive stronger performance in the coming years.
The Company is planning to raise Rs.5Bn through a 5 year listed senior debenture with the objective of growing the portfolio and minimising maturity mismatches in assets and liabilities.
Capital adequacy - core capital ratio
22
23
25
26
28
30
2012 2013 2014 2015
%
40Commercial Leasing & Finance PLC
ys;j;alu
Sustainability Report
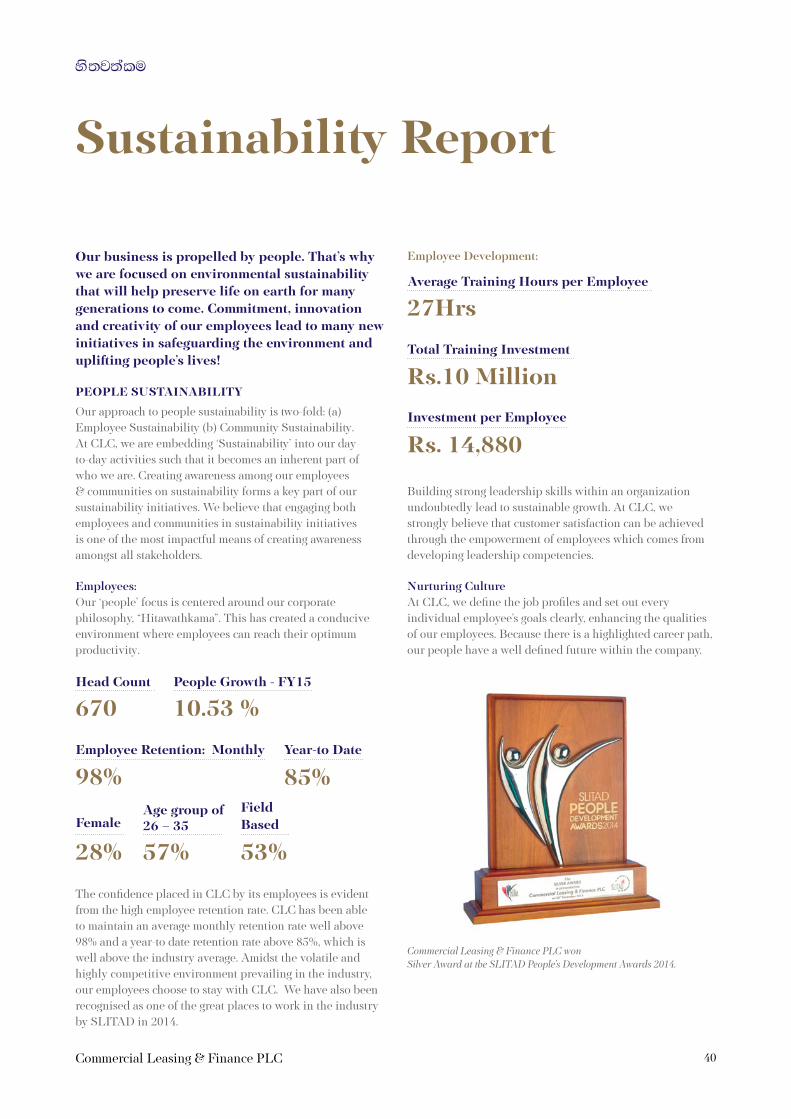
Our business is propelled by people. That’s why we are focused on environmental sustainability that will help preserve life on earth for many generations to come. Commitment, innovation and creativity of our employees lead to many new initiatives in safeguarding the environment and uplifting people’s lives!
PEOPLE SUSTAINABILITY
Our approach to people sustainability is two-fold: (a) Employee Sustainability (b) Community Sustainability. At CLC, we are embedding ‘Sustainability’ into our day-to-day activities such that it becomes an inherent part of who we are. Creating awareness among our employees & communities on sustainability forms a key part of our sustainability initiatives. We believe that engaging both employees and communities in sustainability initiatives is one of the most impactful means of creating awareness amongst all stakeholders.
Employees:Our ‘people’ focus is centered around our corporate philosophy, “Hitawathkama”. This has created a conducive environment where employees can reach their optimum productivity.
27Hrs
Rs. 14,880
Rs.10 Million
Average Training Hours per Employee
Investment per Employee
Total Training Investment
The confidence placed in CLC by its employees is evident from the high employee retention rate. CLC has been able to maintain an average monthly retention rate well above 98% and a year-to date retention rate above 85%, which is well above the industry average. Amidst the volatile and highly competitive environment prevailing in the industry, our employees choose to stay with CLC. We have also been recognised as one of the great places to work in the industry by SLITAD in 2014.
Employee Development:
670
85%
57%
98%
10.53 %
28% 53%
Head Count
Year-to Date
Age group of 26 – 35
Employee Retention: Monthly
People Growth - FY15
FemaleField Based
Building strong leadership skills within an organization undoubtedly lead to sustainable growth. At CLC, we strongly believe that customer satisfaction can be achieved through the empowerment of employees which comes from developing leadership competencies.
Nurturing CultureAt CLC, we define the job profiles and set out every individual employee’s goals clearly, enhancing the qualities of our employees. Because there is a highlighted career path, our people have a well defined future within the company.
Commercial Leasing & Finance PLC won Silver Award at the SLITAD People’s Development Awards 2014.

41Annual Report 2014/15
and they strive hard to reach their goals. The company provides them with ample support in the form of training and development programmes, workshops and an open door policy to discuss any issues with senior management. A strong sense of teamwork and cooperation abounds in our work culture, engendering a sense of a shared vision. Employees undergo a 360-degree review process, whereby their strengths and weaknesses are identified and they are given the necessary tools to strengthen weaker areas, so that they can realize their full potential. The company constantly develops pipelines of leadership to take it on its sustainable journey.
We are focused on creating an internal pipeline of leadership, having introduced a comprehensive development programme facilitated by 3W Consulting for Branch and Regional Managers, which is considered a significant milestone in developing leadership skills and competencies
Leadership teams at CLC are familiarized with the various aspects of ‘Sustainability’ to safeguard the environment and act promptly and responsibly to arrest and curtail factors that may endanger health and safety, or the environment.
Developing a Customer-centric MindsetAt CLC, our employees work consistently on providing customers with superior service, with each area of the business ensuring consistency during each interaction with the customer. Delivering consistency across all customer touch points is our chief endeavour as we believe it drives customer loyalty. By delivering consistent customer care excellence, we not only create a loyal customer base, but we also encourage and motivate our employees to persist in raising the bar when it comes to delivering excellence. This is achieved through training and communicating clear deliverables. CLC engages closely with customer to gain feedback and identify weak areas that can be strengthened further.
Maintaining Work-Life BalanceAT CLC, we cherish and uphold the concept of work-life balance. Alongside encouraging employees to deliver high productivity, we simultaneously encourage their participation in other initiatives outside of their job roles to remain engaged with the company and to maintain an ideal work-life balance. The annual dinner dance, sports day and
the annual trip are eagerly-awaited events in the company’s calendar and witness active participation by employees. Our staff also takes part in mercantile competitions. These social activities have proven to be beneficial for employees’ well being and communicate the company’s ‘Hitawathkama’ philosophy across the enterprise.
Community Engagement
“Water is the foundation of life!
On 22nd of September 2014, 77families in Udayarkaddu village in Mullativu District was given access to tube well water”
Our idea of community sustainability is based on the belief that communities are made up of social, economic, and environmental aspects that are inalienable from each other and if, as a company, we can balance all these aspects, we will be leaving behind a legacy of sustainability. By sharing our resources with the community, we not only forge closer ties, but we also strengthen the capability of the under-served to hope for a brighter tomorrow.
Employees at CLC – Killinochchi branch witnessed the hardship that local villagers faced to fetch drinking water for their daily survival. There are 77 families in the village of Udayarkaddu, who had to travel more than 4 kilometres by foot to fetch water for their daily chores. During the heavy drought period, villagers needed to walk even further to source water.

42Commercial Leasing & Finance PLC
ys;j;alu
Sustainability Report
ENVIRONMENT
“Think, Act, Save”Reduction of purchasing new envelopes |
Switch-off not Stand-by | Healthy lifestyle by walking
Environmental sustainability allows for the needs of mankind to be fulfilled without having e a harmful impact on the ability of future generations to meet their needs. The social, environmental, and economic consequences of rapid population growth, climate change, global warming, unbridled economic growth and over-consumption of our natural resources are being felt globally. We believe it behoves each one of us to arrest this unsustainable approach and stop and think about how we can make a positive difference in our immediate environment. At CLC, we value employees who care for the environment and we encourage our people to act responsibly in order to nurture the planet’s valuable natural resources.
CLC launched an internal sustainability initiative “Think, Act, Save” where employees are encouraged to suggest new ideas to save resources which will result in the reduction of the company’s carbon footprint.
Employee driven initiatives to save planet!Recycling of envelopes – At CLC, we use envelopes for inter-department, intern-company document transfers on a day-to-day basis. Employees suggested reuse of envelopes as many times as possible before being disposed. This resulted in 40% reduction of purchase of new envelopes.
Switching off Lights and Equipment – Awareness was created among employees to switch-off lights, and to use daylight whenever possible to illuminate the work environment by opening blinds. Furthermore, employees were educated to shut down PCs and other electronic devices without keeping them on sleep mode.
Use of elevators – Posters were displayed near the elevators to encourage employees to use the stair case and gain health benefits. This helped CLC reduce power consumption as well as instil a sustainable healthy lifestyle for the CLC employees.
CLC employees came together and helped to provide a long-lasting solution for the drought-affected village by installing a tube well water pump in Udayarkaddu, in Mullaitivu District. The CLC Killinochchi branch took the ownership of maintaining the tube well water pump so as to sustain this facility into the future and to provide villagers access to water.
By supporting this village and giving them access to the basic human right of water has empowered the people to advance to the next step and allowed families to provide a better future for the next generation.

43Annual Report 2014/15
Corporate Governance
The framework of rules and practices (both external and internal) by which the Board of Directors ensure accountability, fairness, and transparency in Commercial Leasing & Finance PLC (CLC) with all its stakeholders is detailed below. This framework consists of:
(1) explicit and implicit contracts between CLC and its stakeholders including shareholders, financiers, customers, management, employees, government, and the community, for distribution of responsibilities, rights, and rewards;
(2) procedures for reconciling conflicting interests of stakeholders in accordance with their duties, privileges, and roles; and
(3) procedures for proper supervision, control, and information-flows, to serve as a system of checks-and-balances.
Instruments of GovernanceThe external instruments of governance at CLC include:
• TheCompaniesActNo.7of2007
• TheFinanceBusinessActNo.42of2011,includingrules and directions issued to finance companies from time to time by the Monetary Board of the CBSL and any amendments thereto.
• TheListingRulesoftheColomboStockExchange
The internal instruments of governance include the following:
• ArticlesofAssociation
• TheRoleoftheBoard
• Boardapprovedpoliciesandprocedures
• Processesforinternalcontrolsandantimoneylaundering
Policies and procedures have been established taking into consideration governance principles that define the structure and responsibility of the Board, ensure legal and regulatory compliance, protect stakeholder interests, manage risk and enhance the integrity of financial reporting. A whistle blowing policy has been introduced and the number of the related “hot line” has been publicized to all employees. This was done to enhance accountability, so that deliberate deviations from controls and / or processes and procedures could be highlighted by any employee and thus addressed promptly.
Board of DirectorsThe members of the Board consist of persons with multiple industrial/professional backgrounds in which they have achieved eminence, who contribute effectively to decisions made by the Board to guide CLC towards achieving its objectives. In accordance with best practices, the offices of Chairman and Chief Executive Officer are separate, and the Chairman is a non-executive director. This ensures a balance of power and enhances accountability. To bring in a greater element of independence, the Board appointed Mr. Priyantha Fernando as the Senior Independent Director.
Monitoring and Evaluation by the BoardCLC has in place a number of mandatory and voluntary Board sub committees to fulfil regulatory requirements and for better governance of its activities. These committees meet periodically to deliberate on matters falling within their respective charters/terms of reference and their recommendations are duly communicated to the main Board.
The following mechanisms are in place for the Board to oversee the accomplishment of the targets in the business plan:
• reviewCLC’sperformanceatmonthlyboardmeetings;
• seekingrecommendationsthroughBoardappointedsubcommittees on governance, including compliance with internal controls, human resources, risk management, credit and IT;
• reviewofstatutoryandothercompliancesthroughamonthly paper on compliance submitted to the Board covering the operations of CLC.
Performance of the BoardAs required by the Finance Companies Corporate Governance Direction, CLC has established a well defined self evaluation mechanism undertaken by each director annually to evaluate performance of the Board. These evaluations are subsequently tabled at a Board meeting and the records are maintained by the Company Secretary.
Engagement with ShareholdersThe shareholders of CLC have multiple ways of engaging with the Board including the following:
• AnnualGeneralMeetingsarethemainforumatwhichthe Board maintains effective communication with its shareholders on matters which are relevant and of concern to the general membership such as CLC’s performance and their return on investment;
44Commercial Leasing & Finance PLC
ys;j;alu
• AccesstotheBoardandtheCompanySecretaries;
• WrittencorrespondencefromtheCompanySecretariestoinform shareholders of relevant matters;
• CLC’swebsitewhichisaccessiblebyallstakeholdersandthe general public;
• DisclosuresdisseminatedthroughtheColomboStockExchange including interim reporting.
Engagement with EmployeesIn terms of engaging with the employees, the key channels used by the Board include the following:
• TheChiefExecutiveOfficeristhemainlinkbetweentheBoard and the rest of the employees.
• BoardmembersandBoardsubcommitteesconducteffective dialogue with the members of the Management on matters of strategic direction.
Avoiding Conflicts of InterestThe Governance structure at CLC ensures that the Directors take all necessary steps to avoid conflicts of interest in their activities with, and commitments to other organizations or related parties. If a Director has a conflict of interest in a matter to be considered by the Board, such matters are disclosed and discussed at board meetings, where
independent directors who have no material interest in the transaction are present.
External AuditM/s KPMG, Chartered Accountants were reappointed as external auditors of the Company by the shareholders at the Annual General Meeting held in September 2014. Their services were also engaged to seek:
a) an assessment of the Company’s compliance with the requirements of the Finance Companies Corporate Governance Direction No. 3 of 2008 issued by the Monetary Board; and
b) the Company’s level of adherence to the internal controls on financial reporting.
The Directors confirm that no significant deviations have been observed by the external auditors and that the Company has not engaged in any activity that contravenes any applicable law or regulation. To the best of the knowledge of the Directors the Company has been in compliance with all prudential requirements, regulations and laws.
Direction No.
Reference to the Finance Companies Corporate Governance Direction No. 3 0f 2008
CLC’s Level of compliance
2 The Responsibilities of the Board of Directors
2.1 The Board of Directors shall strengthen the safety and soundness of the finance company by:
a. approving and overseeing the finance company’s strategic objectives and corporate values and ensuring that such objectives and values are communicated throughout the finance company;
Complied with
b. approving the overall business strategy of the finance company, including the overall risk policy and risk management procedures and mechanisms with measurable goals, for at least the immediate next three years;
Complied withA financial forecast for the period 2016 to 2018 has been approved by the Board.
All identified risks have been taken into account when preparing this forecast. Further, a Risk Management Policy has been approved by the Board which includes risk management procedures and mechanisms.
Corporate Governance

45Annual Report 2014/15
Direction No.
Reference to the Finance Companies Corporate Governance Direction No. 3 0f 2008
CLC’s Level of compliance
c. identifying risks and ensuring implementation of appropriate systems to manage the risks prudently;
Complied withThe Board has delegated this function to its subcommittee, the Integrated Risk Management Committee (IRMC).
Approved minutes of the quarterly IRMC meetings are tabled at Board Meetings for review and guidance.
Risk Management Reports on Liquidity and Maturity of Deposits are submitted to the Board on a monthly basis.
d. approving a policy of communication with all stakeholders, including depositors, creditors, shareholders and borrowers;
Complied with
e. reviewing the adequacy and the integrity of the finance company’s internal control systems and management information systems;
Complied withThe Board has delegated this function to its Audit Committee. The approved minutes of the Audit Committee meetings are tabled at Board Meetings for review and guidance. The Committee reviews the Internal Audit Reports submitted by the Internal Auditors of the Company (Enterprise Risk Management Division).
On behalf of the Board, the Committee performs a comprehensive exercise that entails reviewing of all aspects of MIS including operational and regulatory risks. MIS reviews of all products have been periodically carried out by the Internal Audit and reported to the Audit Committee.
A representative from the Company participates at the Group IT Steering Committee meetings which are held on a quarterly basis to address IT issues of the Company. Specific reports are presented to the Committee when necessary. The Board has also approved an IT Security Policy which covers the system and physical data that is used for generating management reports with accuracy. All IT security policies are approved prior to deploying and accuracy of reports are checked during the relevant application control review stage and presented to the management. Audit logs and reports are reviewed and verified on a regular basis.

46Commercial Leasing & Finance PLC
ys;j;alu
Direction No.
Reference to the Finance Companies Corporate Governance Direction No. 3 0f 2008
CLC’s Level of compliance
f. identifying and designating key management personnel, who are in a position to:
(i) influence policy;
(ii) direct activities; and
(iii) exercise control over business activities, operations and risk management;
Complied withBoard members including the CEO and members of the Operational Management have been identified and designated as KMPs by the Board as defined in the Sri Lanka Accounting Standards.
This is annually reviewed by the Board.
g. defining the areas of authority and key responsibilities for the Board and for the key management personnel;
Complied withArticles 76-78 of the Company’s Articles of Association defines the powers and duties of the Board Directors.
Further the responsibilities of the Board have been defined and approved based on the role of the board of its parent company, Lanka ORIX Leasing Company PLC.
The areas of authority and responsibilities of the key management personnel defined in individual job descriptions have been approved by the Board.
h. ensuring that there is appropriate oversight of the affairs of the finance company by key management personnel, that is consistent with the finance company’s policy;
Complied withThe Company has a policy on Oversight of the affairs of the Company by KMPs including a process to review the delegation process approved by the Board.
Delegated authority given to key management personal is reviewed periodically by the Board to ensure that they remain relevant to the needs of the company.
i. periodically assessing the effectiveness of its governance practices, including:
(i) the selection, nomination and election of directors and appointment of key management personnel;
(ii) the management of conflicts of interests; and
(iii) the determination of weaknesses and implementation of changes where necessary;
Complied withA Board approved procedure is in place for the appointment of Directors. Election of directors is effected in accordance with the requirements of the directions issued by the Central Bank of Sri Lanka and the Companies Act No. 7 of 2007
Directors are selected and nominated to the Board for skills and experience in order to bring about an objective judgment on issues of strategy, performance and resources. Effectiveness of this process is ascertained by their contribution at board meetings in their respective fields.
A Nomination Committee has been appointed to assist the Board in identifying qualified individuals as potential directors.
KMPs are selected and recruited in terms of the HR policy of the Company. KMPs directly report to the CEO and performance appraisals are completed at least twice a year.
Corporate Governance

47Annual Report 2014/15
Direction No.
Reference to the Finance Companies Corporate Governance Direction No. 3 0f 2008
CLC’s Level of compliance
Conflicts of interest are managed on a monthly basis where directors disclose their directorships in other companies. KMPs declare any interest annually. Weaknesses are identified from the above processes and changes may be implemented where necessary.
Annual Self Evaluations of directors were tabled subsequent to the financial year end, to determine any weaknesses of the above process and to implement changes where necessary.
j. ensuring that the finance company has an appropriate succession plan for key management personnel;
Complied with
k. meeting regularly with the key management personnel to review policies, establish lines of communication and monitor progress towards corporate objectives;
Complied withKey Management Personnel are called in by the members of the Board during board and board committee meetings when the need arises to explain matters relating to their area of functions.
l. understanding the regulatory environment; Complied withAs a practice the Company Secretary includes an agenda item in monthly board meetings tabling correspondence with regulators which enable the directors to understand the regulatory environment, concerns and changes and make appropriate decisions.
A monthly compliance report is also submitted to the Board. This report includes details of weekly, monthly, and annual returns duly submitted to the CBSL and the requirements of all the directions issued by the Monetary Board and the Company’s current position with regard to each direction.
A monthly confirmation is provided by the HOF of statutory payments made such as VAT, VAT on financial services, WHT on FD’s and savings interest, EPF, ETF, PAYE Stamp duty and Economic Service Charge
m. exercising due diligence in the hiring and oversight of external auditors.
Complied withThe Board Audit Committee is responsible for hiring and overseeing the external auditors.
Article 122 of the Company’s Articles of Association lays down a process for appointing of external auditors at the AGM.
The Audit Committee is governed by a Board approved Audit Charter/TOR. This is periodically reviewed by the Board to ensure that it remains relevant.
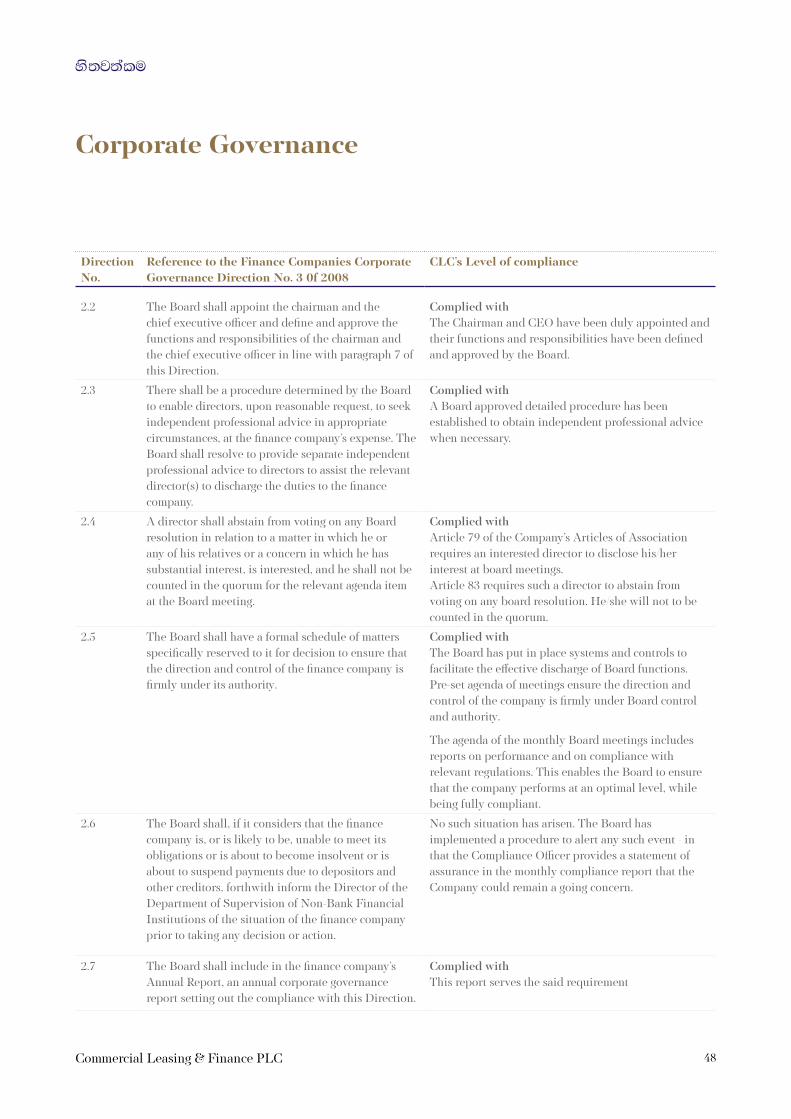
48Commercial Leasing & Finance PLC
ys;j;alu
Direction No.
Reference to the Finance Companies Corporate Governance Direction No. 3 0f 2008
CLC’s Level of compliance
2.2 The Board shall appoint the chairman and the chief executive officer and define and approve the functions and responsibilities of the chairman and the chief executive officer in line with paragraph 7 of this Direction.
Complied withThe Chairman and CEO have been duly appointed and their functions and responsibilities have been defined and approved by the Board.
2.3 There shall be a procedure determined by the Board to enable directors, upon reasonable request, to seek independent professional advice in appropriate circumstances, at the finance company’s expense. The Board shall resolve to provide separate independent professional advice to directors to assist the relevant director(s) to discharge the duties to the finance company.
Complied withA Board approved detailed procedure has been established to obtain independent professional advice when necessary.
2.4 A director shall abstain from voting on any Board resolution in relation to a matter in which he or any of his relatives or a concern in which he has substantial interest, is interested, and he shall not be counted in the quorum for the relevant agenda item at the Board meeting.
Complied withArticle 79 of the Company’s Articles of Association requires an interested director to disclose his/her interest at board meetings. Article 83 requires such a director to abstain from voting on any board resolution. He/she will not to be counted in the quorum.
2.5 The Board shall have a formal schedule of matters specifically reserved to it for decision to ensure that the direction and control of the finance company is firmly under its authority.
Complied withThe Board has put in place systems and controls to facilitate the effective discharge of Board functions. Pre-set agenda of meetings ensure the direction and control of the company is firmly under Board control and authority.
The agenda of the monthly Board meetings includes reports on performance and on compliance with relevant regulations. This enables the Board to ensure that the company performs at an optimal level, while being fully compliant.
2.6 The Board shall, if it considers that the finance company is, or is likely to be, unable to meet its obligations or is about to become insolvent or is about to suspend payments due to depositors and other creditors, forthwith inform the Director of the Department of Supervision of Non-Bank Financial Institutions of the situation of the finance company prior to taking any decision or action.
No such situation has arisen. The Board has implemented a procedure to alert any such event - in that the Compliance Officer provides a statement of assurance in the monthly compliance report that the Company could remain a going concern.
2.7 The Board shall include in the finance company’s Annual Report, an annual corporate governance report setting out the compliance with this Direction.
Complied withThis report serves the said requirement
Corporate Governance
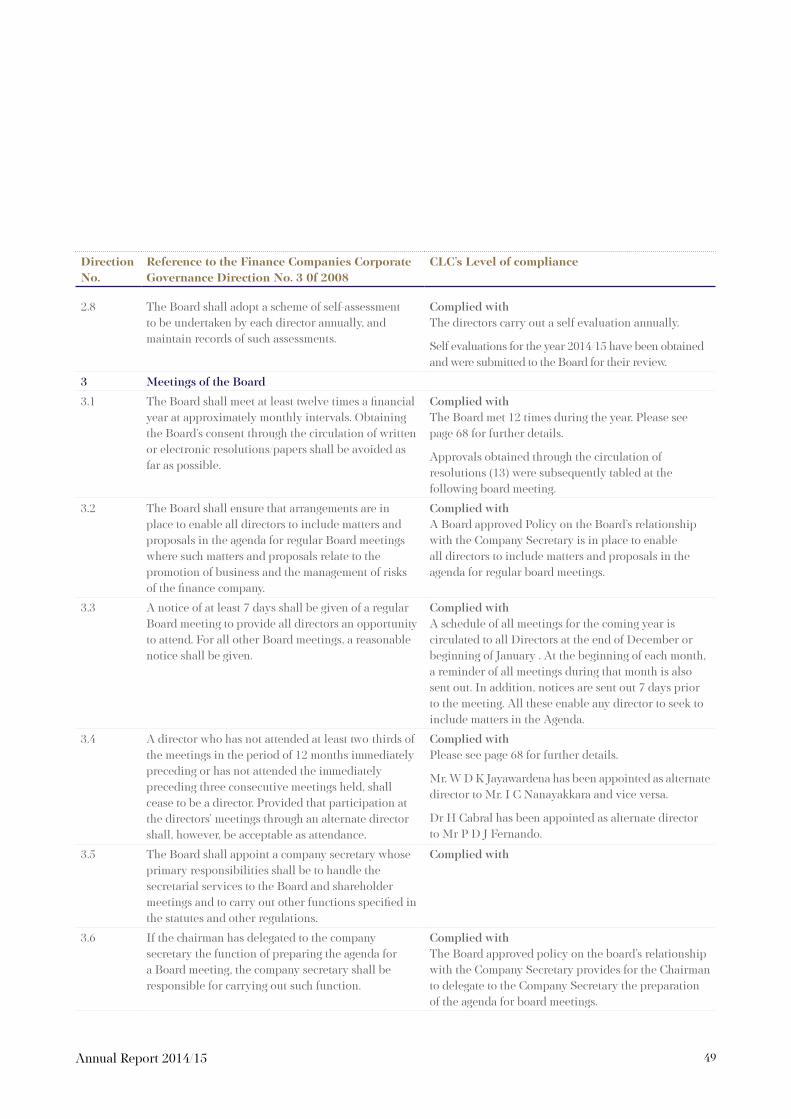
49Annual Report 2014/15
Direction No.
Reference to the Finance Companies Corporate Governance Direction No. 3 0f 2008
CLC’s Level of compliance
2.8 The Board shall adopt a scheme of self-assessment to be undertaken by each director annually, and maintain records of such assessments.
Complied withThe directors carry out a self evaluation annually.
Self evaluations for the year 2014/15 have been obtained and were submitted to the Board for their review.
3 Meetings of the Board
3.1 The Board shall meet at least twelve times a financial year at approximately monthly intervals. Obtaining the Board’s consent through the circulation of written or electronic resolutions/papers shall be avoided as far as possible.
Complied withThe Board met 12 times during the year. Please see page 68 for further details.
Approvals obtained through the circulation of resolutions (13) were subsequently tabled at the following board meeting.
3.2 The Board shall ensure that arrangements are in place to enable all directors to include matters and proposals in the agenda for regular Board meetings where such matters and proposals relate to the promotion of business and the management of risks of the finance company.
Complied withA Board approved Policy on the Board’s relationship with the Company Secretary is in place to enable all directors to include matters and proposals in the agenda for regular board meetings.
3.3 A notice of at least 7 days shall be given of a regular Board meeting to provide all directors an opportunityto attend. For all other Board meetings, a reasonable notice shall be given.
Complied withA schedule of all meetings for the coming year is circulated to all Directors at the end of December or beginning of January . At the beginning of each month, a reminder of all meetings during that month is also sent out. In addition, notices are sent out 7 days prior to the meeting. All these enable any director to seek to include matters in the Agenda.
3.4 A director who has not attended at least two-thirds of the meetings in the period of 12 months immediately preceding or has not attended the immediately preceding three consecutive meetings held, shall cease to be a director. Provided that participation at the directors’ meetings through an alternate director shall, however, be acceptable as attendance.
Complied withPlease see page 68 for further details.
Mr. W D K Jayawardena has been appointed as alternate director to Mr. I C Nanayakkara and vice versa.
Dr H Cabral has been appointed as alternate director to Mr P D J Fernando.
3.5 The Board shall appoint a company secretary whose primary responsibilities shall be to handle the secretarial services to the Board and shareholder meetings and to carry out other functions specified in the statutes and other regulations.
Complied with
3.6 If the chairman has delegated to the company secretary the function of preparing the agenda for a Board meeting, the company secretary shall be responsible for carrying out such function.
Complied withThe Board approved policy on the board’s relationship with the Company Secretary provides for the Chairman to delegate to the Company Secretary the preparation of the agenda for board meetings.

50Commercial Leasing & Finance PLC
ys;j;alu
Direction No.
Reference to the Finance Companies Corporate Governance Direction No. 3 0f 2008
CLC’s Level of compliance
3.7 All directors shall have access to advice and services of the company secretary with a view to ensuring that Board procedures and all applicable laws, directions, rules and regulations are followed.
Complied withThe Board approved policy on board’s relationship with the Company Secretary provides that all directors shall have access to the advice/services of the Company Secretary.
3.8 The company secretary shall maintain the minutes of Board meetings and such minutes shall be open for inspection at any reasonable time, on reasonable notice by any director
Complied with
3.9 Minutes of Board meetings shall be recorded in sufficient detail so that it is possible to gather fromthe minutes, as to whether the Board acted with due care and prudence in performing its duties. The minutes of a Board meeting shall clearly contain or refer to the following:
(a) a summary of data and information used by the Board in its deliberations;
(b) the matters considered by the Board;
(c) the fact-finding discussions and the issues of contention or dissent which may illustrate whether the Board was carrying out its duties with due care and prudence;
(d) the explanations and confirmations of relevant executives which indicate compliance with the Board’s strategies and policies and adherence to relevant laws and regulations;
(e) the Board’s knowledge and understanding of the risks to which the finance company is exposed and an overview of the risk management measures adopted; and
(f) the decisions and Board resolutions.
Complied withDetailed minutes are kept covering the given criteria.
4 Composition of the Board
4.1 The number of directors on the Board shall notbe less than 5 and not more than 13.
Complied withThe Board comprises 6 directors.
4.2 The total period of service of a director other than a director who holds the position of chief executive officer or executive director shall not exceed nine years. The total period in office of a non executive director shall be inclusive of the total period of service served by such director up to the date of this Direction.
Complied withNo director has completed 9 years as a non executive director.
Corporate Governance

51Annual Report 2014/15
Direction No.
Reference to the Finance Companies Corporate Governance Direction No. 3 0f 2008
CLC’s Level of compliance
4.3 An employee of a finance company may be appointed, elected or nominated as a director of the finance company (hereinafter referred to as an “executive director”) provided that the number of executive directors shall not exceed one-half of the number of directors of the Board. In such an event, one of the executive directors shall be the chief executive officer of the company.
Complied withThere is 1 Executive Director (the CEO) and 5 Non Executive Directors on the Board
4.4 The number of independent non-executivedirectors of the Board shall be at least one fourth of the total numbers of directors. A non-executive director shall not be considered independent if such director:
a) has shares exceeding 2% of the paid up capital of the finance company or 10% of the paid up capital of another finance company;
b) has or had during the period of two years immediately preceding his appointment as director, any business transactions with the finance company as described in paragraph 9 hereof, aggregate value outstanding of which at any particular time exceeds 10% of the capital funds of the finance company as shown in its last audited balance sheet;
c) has been employed by the finance company during the two year period immediately preceding the appointment as director;
d) has a relative, who is a director or chief executive officer or a key management personnel or holds shares exceeding 10% of the paid up capital of the finance company or exceeding 12.5% of the paid up capital of another finance company.
e) represents a shareholder, debtor, or such other similar stakeholder of the finance company;
f) is an employee or a director or has a share holding of 10% or more of the paid up capital in a company or business organization:
(i) which has a transaction with the finance company as defined in paragraph 9, aggregate value outstanding of which at any particular time exceeds 10% of the capital funds as shown in its last audited balance sheet of the finance company; or
Complied withThere are 2 independent non-executive directors on the Board.
P D J Fernando, Senior Independent Director
Dr H Cabral, PC, Independent Director
The Company is currently in discussion with the CBSL, regarding the designation of these directors as independent.

52Commercial Leasing & Finance PLC
ys;j;alu
Direction No.
Reference to the Finance Companies Corporate Governance Direction No. 3 0f 2008
CLC’s Level of compliance
(ii) in which any of the other directors of the finance company is employed or is a director or holds shares exceeding 10% of the capital funds as shown in its last audited balance sheet of the finance company; or
(iii) in which any of the other directors of the finance company has a transaction as defined in paragraph 9, aggregate value outstanding of which at any particular time exceeds 10% of the capital funds, as shown in its last audited balance sheet of the finance company.
4.5 In the event an alternate director is appointed to represent an independent non-executive director, theperson so appointed shall also meet the criteria that apply to the independent non-executive director.
Complied withDr H Cabral has been appointed as alternate director to Mr P D J Fernando. This appointment fulfills the independent criteria specified by this direction.
4.6 Non-executive directors shall have necessary skills and experience to bring an objective judgment to bear on issues of strategy, performance and resources.
Complied withDirectors profiles are provided on pages 18 to 22.
4.7 A meeting of the Board shall not be duly constituted, although the number of directors required to constitute the quorum at such meeting is present, unless at least one half of the number of directors that constitute the quorum at such meeting are non-executive directors.
Complied withDetails of attendance at meetings are provided on page 68.
4.8 The independent non-executive directors shall be expressly identified as such in all corporate communications that disclose the names of directors of the finance company. The finance company shall disclose the composition of the Board, by category of directors, including the names of the chairman, executive directors, non-executive directors and independent non-executive directors in the annual corporate governance report which shall be an integral part of its Annual Report.
Complied withThe current directorate is as given below :Mr I C Nanayakkara, Non Executive Chairman Mr W D K Jayawardena, Non Executive Director Mrs K U Amarasinghe, Non Executive DirectorMr P D J Fernando, Senior Independent Director*Dr H Cabral, PC, Independent Director* Mr D M D K Thilakaratne, Executive Director/CEO
* The Company is currently in discussion with the CBSL, regarding the designation of these directors as independent.
The directors profiles are given on pages 18 to 22.
4.9 There shall be a formal, considered and transparent procedure for the appointment of new directors tothe Board. There shall also be procedures in place for the orderly succession of appointments to the Board.
Complied withThe Company’s Articles 70-74 address the general procedure for appointment and removal of Directors. Further a Board approved procedure is in place for the board members to select and appoint new directors to the board.
On 29th October 2014, the Board formed a Nomination Committee to bring in greater transparency for the orderly succession of appointments to the Board.
Corporate Governance

53Annual Report 2014/15
Direction No.
Reference to the Finance Companies Corporate Governance Direction No. 3 0f 2008
CLC’s Level of compliance
4.10 All directors appointed to fill a casual vacancy shall be subject to election by shareholders at the first general meeting after their appointment.
Complied withArticle 70 of the Company’s Articles of Association provides that directors appointed shall be subject to election by shareholders at the first AGM.
4.11 If a director resigns or is removed from office, the Board shall announce to the shareholders and notify the Director of the Department of Supervision of Non-Bank Financial Institutions of the Central Bank of Sri Lanka, regarding the resignation of the director or removal and the reasons for such resignation or removal, including but not limited to information relating to the relevant director’s disagreement with the Board, if any.
No such situation has arisen during the year under review.
5 Criteria to assess the fitness and propriety of directors
5.1 Subject to the transitional provisions contained herein, a person over the age of 70 years shall not serve as a director of a finance company
Complied withThe Board of Directors have been assessed as fit and proper in terms of the Finance Companies (Assessment of Fitness and Propriety of Directors and Officers Performing Executive Functions) Direction No. 3 of 2011
The age of the current directors is within the period permitted under this direction.
5.2 A director of a finance company shall not hold office as a director or any other equivalent position in more than 20 companies/societies/bodies, corporate, including associate companies and subsidiaries of the finance company.
Complied with
6 Delegation of Functions
6.1 The Board shall not delegate any matters to a board committee, chief executive officer, executive directors or key management personnel, to an extent that such delegation would significantly hinder or reduce the ability of the Board as a whole to discharge its functions.
Complied withThe Board has established a procedure under which powers have been delegated to the Director/CEO as sanctioned by the Company’s Articles of Association.
Article 77 of the Company’s Articles of Association empowers the Board to delegate its powers to a committee of directors or to a director or employee upon such terms and conditions and with such restrictions as the Board may think fit.
6.2 The Board shall review the delegation processes in place on a periodic basis to ensure that they remain relevant to the needs of the finance company.
Complied withThe delegated powers are reviewed periodically by the Board and a process to review the delegation process has been approved by the Board.

54Commercial Leasing & Finance PLC
ys;j;alu
Direction No.
Reference to the Finance Companies Corporate Governance Direction No. 3 0f 2008
CLC’s Level of compliance
7 The Chairman and the Chief Executive Officer
7.1 The roles of chairman and chief executive officer shall be separated and shall not be performed by the one and the same person.
Complied with
7.2 The chairman shall be a non-executive director. In the case where the chairman is not an independent non-executive director, the Board shall designate an independent non-executive director as the Senior Director with suitably documented terms of reference to ensure a greater independent element. The designation of the Senior Director shall be disclosed in the finance company’s Annual Report.
Complied withThe Chairman is a non-executive director.
The Board has designated Mr P D J Fernando as the Senior Independent Director to ensure a greater element of independence.
7.3 The Board shall disclose in its corporate governance report, which shall be an integral part of its AnnualReport, the name of the chairman and the chief executive officer and the nature of any relationship[including financial, business, family or other material/ relevant relationship(s)], if any, between the chairman and the chief executive officer and the relationships among members of the Board.
Complied withThere is no financial, business, family or other relationship between the Chairman and the CEO.
Mr I C Nanayakkara and Mrs K U Amarasinghe share a family relationship.
There is no financial, business, family or other material relationship between any other members of the Board .
A process has been developed for directors to disclose any relationships between the Chairman and the CEO and or between any other board members.
7.4 The chairman shall:
(a) provide leadership to the Board;
(b) ensure that the Board works effectively and discharges its responsibilities; and
(c) ensure that all key issues are discussed by the Board in a timely manner.
Complied with
7.5 The chairman shall be primarily responsible for the preparation of the agenda for each Board meeting.The chairman may delegate the function of preparing the agenda to the company secretary.
Complied withThe Chairman has delegated this function to the Company Secretary. This has been included in the “Policy on Board’s relationship with the Company Secretary” approved by the Board.
7.6 The chairman shall ensure that all directors are informed adequately and in a timely manner of the issues arising at each Board meeting.
Complied withThe Chairman ensures that all directors are properly briefed on issues arising at Board Meetings by submission of the agenda and board papers with sufficient time prior to meetings.
Further, minutes of previous month’s board meeting are distributed to the Board members and tabled at the next board meeting for review and approval.
Corporate Governance

55Annual Report 2014/15
Direction No.
Reference to the Finance Companies Corporate Governance Direction No. 3 0f 2008
CLC’s Level of compliance
7.7 The chairman shall encourage each director to make a full and active contribution to the Board’s affairs and take the lead to ensure that the Board acts in the best interests of the finance company.
Complied with
7.8 The chairman shall facilitate the effective contribution of non-executive directors in particular and ensure constructive relationships between executive and non-executive directors.
Complied with
7.9 Subject to the transitional provisions contained herein, the chairman, shall not engage in activities involving direct supervision of key management personnel or any other executive duties whatsoever.
Complied with
7.10 The chairman shall ensure that appropriate steps are taken to maintain effective communication with shareholders and that the views of shareholders are communicated to the Board.
Complied withA Board approved communication policy covers this aspect.
The annual general meeting of the Company is the main forum at which the Board maintains effective communication with shareholders.
Periodic announcements made to the Colombo Stock Exchange also contribute towards this purpose.
7.11 The chief executive officer shall function as the apex executive-in-charge of the day-to-day-managementof the finance company’s operations and business.
Complied with
8 Board appointed Committees
8.1 Every finance company shall have at least the two Board committees set out in paragraphs 8(2) and 8(3) hereof. Each committee shall report directly to the Board. Each committee shall appoint a secretary to arrange its meetings, maintain minutes, records and carry out such other secretarial functions under the supervision of the chairman of the committee. The Board shall present a report on the performance, duties and functions of each committee at the annual general meeting of the company.
Complied withPlease refer the reports on pages 80 to 84.
8.2 Audit Committee Please refer page 80 for the Committee Report
a. The chairman of the committee shall be a non-executive director who possesses qualifications and experience in accountancy and/or audit.
Complied withMr. W D K Jayawardena, Non Executive Director, has been appointed as the Chairman of the Audit Committee by the Board.

56Commercial Leasing & Finance PLC
ys;j;alu
Direction No.
Reference to the Finance Companies Corporate Governance Direction No. 3 0f 2008
CLC’s Level of compliance
His qualifications are as follows:- MBA in Financial Management - Fellow of the Institute of Bankers - Over 28 years of Banking (of which 9 years was as
CEO of Citibank Sri Lanka) - Associate of the Institute of Cost and Executive
Accountants
As Mr Jayawardena is also the Managing Director of LOLC, in order to give clarity to his non-executive status at CLC, members of the operational management were identified as KMPs. A majority of these KMPs are direct employees of CLC
b. The Board members appointed to the committee shall be non-executive directors.
Complied withThe remaining members of the Committee are Independent Non Executive Directors: Mr. P D J Fernando and Dr. H Cabral, PC.
c. The committee shall make recommendations on matters in connection with: (i) the appointment of the external auditor for
audit services to be provided in compliance with the relevant statutes;
(ii) the implementation of the Central Bank guidelines issued to auditors from time to time;
(iii) the application of the relevant accounting standards; and
(iv) the service period, audit fee and any resignation or dismissal of the auditor, provided that the engagement of an audit partner shall not exceed five years, and that the particular audit partner is not re-engaged for the audit before the expiry of three years from the date of the completion of the previous term.
Complied withA formal Agenda for Audit Committee meetings including items prescribed by the Direction is followed for the conduct of Audit Committee meetings.
The implementation of CBSL guidelines and relevant accounting standards; and the evaluation of the service period, fees and rotation of external auditors are carried out by the Audit Committee in consultation with the Chief Financial Officer.
d. The committee shall review and monitor the external auditor’s independence and objectivity and the effectiveness of the audit processes in accordance with applicable standards and best practices.
Complied withThe external Auditors are independent as they report direct to the Audit Committee of the Board.
Further, the Auditor’s Engagement Letter submitted to the committee evidence the external auditor’s independence, and that the audit is carried out in accordance with SLAuS.
Corporate Governance

57Annual Report 2014/15
Direction No.
Reference to the Finance Companies Corporate Governance Direction No. 3 0f 2008
CLC’s Level of compliance
e. The committee shall develop and implement a policy with the approval of the Board on the engagement of an external auditor to provide non-audit services that are permitted under the relevant statutes, regulations, requirements and guidelines. In doing so, the committee shall ensure that the provision by an external auditor of non-audit services does not impair the external auditor’s independence or objectivity. When assessing the external auditor’s independence or objectivity in relation to the provision of non-audit services, the committee shall consider:(i) whether the skills and experience of the auditor
make it a suitable provider of the non-audit services;
(ii) whether there are safeguards in place to ensure that there is no threat to the objectivity and/or independence in the conduct of the audit resulting from the provision of such services by the external auditor; and
(iii) whether the nature of the non-audit services, the related fee levels and the fee levels individually and in aggregate relative to the auditor, pose any threat to the objectivity and/or independence of the external auditor.
Complied withThe Board has approved a specific procedure for engagement of the external auditors for providing non-audit services.
f. The committee shall, before the audit commences, discuss and finalize with the external auditors thenature and scope of the audit, including: (i) an assessment of the finance company’s
compliance with Directions issued under the Act and the management’s internal controls over financial reporting;
(ii) the preparation of financial statements in accordance with relevant accounting principles and reporting obligations; and
(iii) the co-ordination between auditors where more than one auditor is involved.
Complied with

58Commercial Leasing & Finance PLC
ys;j;alu
Direction No.
Reference to the Finance Companies Corporate Governance Direction No. 3 0f 2008
CLC’s Level of compliance
g. The committee shall review the financial information of the finance company, in order to monitor the integrity of the financial statements of the finance company, its annual report, accounts and periodical reports prepared for disclosure, and the significant financial reporting judgments contained therein. In reviewing the finance company’s annual report and accounts and periodical reports before submission to the Board, the committee shall focus particularly on:
(i) major judgmental areas;
(ii) any changes in accounting policies and practices;
(iii) significant adjustments arising from the audit;
(iv) the going concern assumption; and
(v) the compliance with relevant accounting standards and other legal requirements.
Complied withThe Committee has a process to review financial information of the Company when the quarterly and annual audited financial statements and the reports prepared for disclosure are presented to the committee.
The Board has reviewed the financial information for the year under review and has confirmed that they are satisfied with the integrity and adequacy of the said information.
h. The committee shall discuss issues, problems and reservations arising from the interim and final audits, and any matters the auditor may wish to discuss including those matters that may need to be discussed in the absence of key management personnel, if necessary
Complied withThe Committee met the external auditors at all 6 meetings held during the year.
Furthermore the auditors met the Committee in the absence of the executive management twice during the year.
i. The committee shall review the external auditor’s management letter and the management’s response thereto.
Complied withThe management letter for 2013/14 has been reviewed by the Audit Committee.
Corporate Governance

59Annual Report 2014/15
Direction No.
Reference to the Finance Companies Corporate Governance Direction No. 3 0f 2008
CLC’s Level of compliance
j. The committee shall take the following steps with regard to the internal audit function of the finance company:(i) Review the adequacy of the scope, functions
and resources of the internal audit department, and satisfy itself that the department has the necessary authority to carry out its work;
(ii) Review the internal audit programme and results of the internal audit process and, where necessary, ensure that appropriate actions are taken on the recommendations of the internal audit department;
(iii) Review any appraisal or assessment of the performance of the head and senior staff members of the internal audit department;
(iv) Recommend any appointment or termination of the head, senior staff members and outsourced service providers to the internal audit function;
(v) Ensure that the committee is apprised of resignations of senior staff members of the internal audit department including the chief internal auditor and any outsourced service providers, and to provide an opportunity to the resigning senior staff members and outsourced service providers to submit reasons for resigning;
(vi) Ensure that the internal audit function is independent of the activities it audits and that it is performed with impartiality, proficiency and due professional care;
Complied with
The Committee has considered the scope of the internal audit function and noted the adequacy of resources and that necessary authority had been allocated to carry out its work.
The Audit Plan for 2014 was tabled by the Head of Internal Audit and discussed at a Committee meeting and results of the internal audit process has been reviewed and appropriate actions obtained where necessary. Furthermore an Internal Audit Plan for 2015/16 has been recommended by the Committee.
An overall assessment of performance of the senior staff members and the Head of Internal Audit for the year 2014/15 has been carried out by the Committee.
The Committee is satisfied that the internal audit function is performed with independence, impartiality and proficiency.The internal auditor reports direct to the Board Audit Committee.
k. The committee shall consider the major findings of internal investigations and management’s responses thereto;
Complied with
l. The chief finance officer, the chief internal auditor and a representative of the external auditors may normally attend meetings. Other Board members and the chief executive officer may also attend meetings upon the invitation of the committee. However, at least once in six months, the committee shall meet with the external auditors without the executive directors being present.
Complied with

60Commercial Leasing & Finance PLC
ys;j;alu
Direction No.
Reference to the Finance Companies Corporate Governance Direction No. 3 0f 2008
CLC’s Level of compliance
m. The committee shall have:
(i) explicit authority to investigate into any matter within its terms of reference;
(ii) the resources which it needs to do so;
(iii) full access to information; and
(iv) authority to obtain external professional advice and to invite outsiders with relevant experience to attend, if necessary.
Complied withThe Board approved Terms of Reference of the Audit Committee ensures that it has the authority for points i to iv as required by the direction.
n. The committee shall meet regularly, with due notice of issues to be discussed and shall record its conclusions in discharging its duties and responsibilities.
Complied withDuring the year 2014/15 the Committee has held 6 meetings and conclusions of such meetings have been recorded by the Secretary in the Minutes of the relevant meetings.
o. The Board shall, in the Annual Report, disclose in an informative way,
(i) details of the activities of the audit committee;
(ii) the number of audit committee meetings held in the year; and
(iii) details of attendance of each individual member at such meetings.
Complied withPlease refer report on page 80.
p. The secretary to the committee (who may be the company secretary or the head of the internal auditfunction) shall record and keep detailed minutes of the committee meetings
Complied with
q. The committee shall review arrangements by which employees of the finance company may, in confidence, raise concerns about possible improprieties in financial reporting, internal control or other matters. Accordingly, the committee shall ensure that proper arrangements are in place for the fair and independent investigation of such matters and for appropriate follow-up action and toact as the key representative body for overseeing the finance company’s relations with the external auditor.
Complied withA whistle blowing policy has been introduced and the number of the related “hot line” has been publicized to all company employees. This was done to enhance accountability, so that deliberate deviations from controls and / or processes and procedures could be highlighted by any employee and thus addressed promptly.
Corporate Governance

61Annual Report 2014/15
Direction No.
Reference to the Finance Companies Corporate Governance Direction No. 3 0f 2008
CLC’s Level of compliance
8.3 Integrated Risk Management Committee Please refer page 81 for the Committee Report.
a. The committee shall consist of at least one non-executive director, CEO and key management personnel supervising broad risk categories, i.e., credit, market, liquidity, operational and strategic risks. The committee shall work with key management personnel closely and make decisions on behalf of the Board within the framework of the authority and responsibility assigned to the committee.
Complied withThe Integrated Risk Management Committee comprises:
P D J Fernando Committee Chairman/Senior Independent Director
Mrs. K U Amarasinghe Non Executive Director D M D K Thilakaratne Director/CEOMrs. S Wickremasekera Chief Risk OfficerMrs. S Kotakadeniya Chief Financial Officer J Kelegama Chief Credit Officer R Perera Group Treasurer C Dias Chief Information Officer N Weerapane Deputy General Manager/
Recoveries
b. The committee shall assess all risks, i.e., credit, market, liquidity, operational and strategic risks to the finance company on a monthly basis through appropriate risk indicators and management information. In the case of subsidiary companies and associate companies, risk management shall be done, both on the finance company basis and group basis
Complied withAs delegated by the Committee the Chief Risk Officer assesses risks which have been identified by heads of divisions on a monthly basis and summarized and submitted to the quarterly Committee meetings.
ERM has set up number of risk indicators under different risk categories as follows.
Liquidity RiskOperational RiskStrategic RiskCredit RiskBusiness RiskProfitability Risk
c. The committee shall review the adequacy and effectiveness of all management level committees such as the credit committee and the asset-liability committee to address specific risks and to manage those risks within quantitative and qualitative risk limits as specified by the committee
Complied withDuring the year the Committee monitored the activities of the ALCO through direct reports from the General Manager Treasury, as well as minutes of ALCO meetings which are tabled at the quarterly IRMC meetings.
Matters reported by the GM Treasury include • FundingGapanalysedthroughMaturityGap
Analysis• ForeignCurrencyPosition• IntercompanyExposures• Costoffunds• Investments• Borrowings

62Commercial Leasing & Finance PLC
ys;j;alu
Direction No.
Reference to the Finance Companies Corporate Governance Direction No. 3 0f 2008
CLC’s Level of compliance
The lending rates are also periodically reviewed by the ALCO in line with regulatory requirements and market trends. Credit facilities are approved based on rates decided by the ALCO within the delegated authority limits.
d. The committee shall take prompt corrective action to mitigate the effects of specific risks in case such risks are at levels beyond the prudent levels decided by the committee on the basis of the finance company’s policies and regulatory and supervisory requirements.
Complied withDecisions taken at Committee Meetings are followed up by the ERM team.
All reported risks are constantly monitored and remedial corrective action is taken if an adverse movement of the risk is evident.
e. The committee shall meet at least quarterly to assess all aspects of risk management including updated business continuity plans.
Complied with4 meetings were held during the financial year 2014/15.
f. The committee shall take appropriate actions against the officers responsible for failure to identify specific risks and take prompt corrective actions as recommended by the committee, and/or as directed by the Director of the Department of Supervision of Non-Bank Financial Institutions of the Central Bank of Sri Lanka.
Complied withSpecific risks and limits are identified by the IRMC and decisions are taken collectively.
Moreover a formal documented disciplinary action procedure involving Internal Audit & HR is in place.
g. The committee shall submit a risk assessment report within a week of each meeting to the Board seeking the Board’s views, concurrence and/or specific directions.
The CRO submits a summary report to the Members of the Board after the committee meeting. This includes the risks discussed at the meeting, mitigation actions proposed by ERM and the responses received from the risk owners. Measures will be taken to dispatch the report within a week of each Meeting.
Further, approved Committee minutes are tabled at the subsequent Board meeting seeking the board’s views and specific direction.
h. The committee shall establish a compliance function to assess the finance company’s compliance with laws, regulations, directions, rules, regulatory guidelines, internal controls and approved policies on all areas of business operations. A dedicated compliance officer selected from key management personnel shall carry out the compliance function and report to the committee periodically.
Complied withA Compliance Officer has been appointed by the Board. She monitors compliance of CBSL rules, regulations and directions issued under the Finance Business Act and submits a monthly compliance report to the Board for their review.
Monitoring compliance of other applicable laws, internal controls and approved policies on all areas of business operations is carried out by the ERM division under the supervision of the CRO.
Corporate Governance

63Annual Report 2014/15
Direction No.
Reference to the Finance Companies Corporate Governance Direction No. 3 0f 2008
CLC’s Level of compliance
9 Related party transactions
9.1 The following shall be in addition to the provisions contained in the Finance Companies (Lending) Direction, No. 1 of 2007 and the Finance Companies (Business Transactions with Directors and their Relatives) Direction, No. 2 of 2007 or such other directions that shall repeal and replace the said directions from time to time.
9.2 The Board shall take the necessary steps to avoid any conflicts of interest that may arise from any transaction of the finance company with any person, and particularly with the following categories of persons who shall be considered as “related parties” for the purposes of this Direction:a) A subsidiary of the finance company;b) Any associate company of the finance company;c) A director of the finance company;d) A key management personnel of the finance
company;e) A relative of a director or a key management
personnel of the finance company ;f) A shareholder who owns shares exceeding 10%
of the paid up capital of the finance company;g) A concern in which a director of the finance
company or a relative of a director or a shareholder who owns shares exceeding 10% of the paid up capital of the finance company, has substantial interest.
9.2-9.4 Complied withA Board approved process is in place to ensure that the Company does not engage in related party transactions as defined in this direction and to enable directors to take measures to avoid a conflict of interest.
Transactions with related parties are made with the sanction of the Board subject to such transactions being in the normal course of business.
Further, Directors are individually requested to declare their transactions with the company at each Board meeting and in the annual declaration.
A Board approved procedure is in place to ensure that the Directors and the CEO make relevant disclosures in a timely manner, in the event they make an acquisition or disposal of shares in the entity, to facilitate disclosure.
9.3 The transactions with a related party that are covered in this Direction shall be the following:a) Granting accommodation,b) Creating liabilities to the finance company
in the form of deposits, borrowings and investments,
c) providing financial or non-financial services to the finance company or obtaining those services from the finance company,
d) creating or maintaining reporting lines and information flows between the finance company and any related party which may lead to share proprietary, confidential or otherwise sensitive information that may give benefits to such related party.

64Commercial Leasing & Finance PLC
ys;j;alu
Direction No.
Reference to the Finance Companies Corporate Governance Direction No. 3 0f 2008
CLC’s Level of compliance
9.4 The Board shall ensure that the finance company does not engage in transactions with a related party in a manner that would grant such party “more favourable treatment” than that which is accorded to other similar constituents of the finance company. For the purpose of this paragraph, “more favourable treatment” shall mean:
a) Granting of “total net accommodation” to a related party, exceeding a prudent percentage of the finance company’s regulatory capital, as determined by the Board. The “total net accommodation” shall be computed by deducting from the total accommodation, the cash collateral and investments made by such related party in the finance company’s share capital and debt instruments with a remaining maturity of 5 years or more.
b) Charging of a lower rate of interest than the finance company’s best lending rate or paying a rate of interest exceeding the rate paid for a comparable transaction with an unrelated comparable counterparty;
c) Providing preferential treatment, such as favourable terms, covering trade losses and/or waiving fees/ commissions, that extends beyond the terms granted in the normal course of business with unrelated parties;
d) Providing or obtaining services to or from a related-party without a proper evaluation procedure;
e) Maintaining reporting lines and information flows between the finance company and any related party which may lead to share proprietary, confidential or otherwise sensitive information that may give benefits to such related party, except as required for the performance of legitimate duties and functions.
On 29th October 2014 the Board appointed a Related Party Transaction Review Committee comprising the following membership:
P D J Fernando, Committee Chairman (Senior Independent Director) W D K Jayawardena, Non Executive Director Mrs K U Amarasinghe, Non Executive Director K Thilakaratne, Director/CEOMrs N Kariyawasam, Head of Finance & Compliance OfficerR Perer, GM TreasuryJ Kelegama, Chief Credit OfficerMrs S Kotakadeniya, Chief Financial Officer
The Committee was formed in order to adhere to the Code of Best Practice on Related Party Transactions (RPTs) issued by the Securities & Exchange Commission of Sri Lanka under sections 13 (c) of the SEC Act No. 36 of 1987 (as amended). Under the said direction all public listed companies were required to adopt the code with effect from 1st January 2014 on a voluntary basis for an initial period of two years from the effective date.
During the financial year, the Committee has held two meetings.
The Company will further strengthen the favourable treatment monitoring mechanism by implementing an on line system.
Corporate Governance

65Annual Report 2014/15
Direction No.
Reference to the Finance Companies Corporate Governance Direction No. 3 0f 2008
CLC’s Level of compliance
10 Disclosures
10.1 The Board shall ensure that: (a) annual audited financial statements and periodical financial statements are prepared and published in accordance with the formats prescribed by the regulatory and supervisory authorities and applicable accounting standards, and that (b) such statements are published in the newspapers in an abridged form, in Sinhala, Tamil and English.
Complied withThe financial statements are prepared in accordance with the new SLFRS and the formats prescribed by the regulators.
Annual financial statements are disclosed in the annual report; biannual (unaudited) financial statements are published in newspapers in all three languages and the quarterly statements are posted on the CSE website.
10.2 The Board shall ensure that at least the following disclosures are made in the Annual Report:
a. A statement to the effect that the annual audited financial statements have been prepared in line withapplicable accounting standards and regulatory requirements, inclusive of specific disclosures.
Complied withPlease refer the Directors Report on pages 76 to 79.
b. A report by the Board on the finance company’s internal control mechanism that confirms that the financial reporting system has been designed to provide a reasonable assurance regarding the reliability of financial reporting, and that the preparation of financial statements for external purposes has been done in accordance with relevant accounting principles and regulatory requirements.
Complied withPlease refer the Directors Statement on Internal Controls over financial reporting on page 85.
c. The external auditor’s certification on the effectiveness of the internal control mechanism in respect of any statements prepared or published after March 31, 2010.
Complied withThe Company has obtained a certification on the effectiveness of the internal controls over financial reporting from M/s KPMG, Chartered Accountants .
d. Details of directors, including names, transactions with the finance company.
Complied withPlease refer the Directors Report on pages 76 to 79 and Note 39.2 to the Financial Statements.
e. Fees/remuneration paid by the finance company to the directors in aggregate, in the Annual Reports published after January 1, 2010.
Complied withPlease refer the Directors Report on page 76.
f. Total net accommodation as defined in paragraph 9(4) outstanding in respect of each category of related parties and the net accommodation outstanding in respect of each category of related parties as a percentage of the finance company’s capital funds.
Complied withTotal net accommodation outstanding in respect of each category of related party is found under Note 39 to the Financial Statements
Net accommodations granted to related parties as a percentage of capital funds of the Company at the year-end was 2.48%

66Commercial Leasing & Finance PLC
ys;j;alu
Direction No.
Reference to the Finance Companies Corporate Governance Direction No. 3 0f 2008
CLC’s Level of compliance
g. The aggregate values of remuneration paid by the finance company to its key management personnel and the aggregate values of the transactions of the finance company with its key management personnel during the financial year, set out by broad categories such as remuneration paid, accommodation granted and deposits or investments made in the finance company.
Complied withPlease refer Note 39.2 to the Financial Statements.
h. A report setting out details of the compliance with prudential requirements, regulations, laws and internal controls and measures taken to rectify any non - compliances.
Complied withStatus of compliance with prudential requirements, regulations and laws are in the Directors report set out in pages 76 to 79.
i. A statement of the regulatory and supervisory concerns on lapses in the finance company’s risk management, or non compliance with the Act, and rules and directions that have been communicated by the Director of the Department of Supervision of Non-Bank Financial Institutions, if so directed by the Monetary Board to be disclosed to the public, together with the measures taken by the finance company to address such concerns.
Complied withThere were no significant supervisory concerns / lapses in the Company’s risk management and compliance with this direction to be directed by the Monetary Board to be disclosed to the public
j. The external auditor’s certification of the compliance with the Corporate Governance directions in the annual corporate governance reports published after 17th September 2013.
Complied withThe Company has engaged the services of the external auditors to assess the company’s level of compliance with the Finance Companies Corporate Governance Direction No. 3 of 2008 issued by the Monetary Board.
Corporate Governance

67Annual Report 2014/15
Section No.
Rules of the Colombo Stock Exchange Level of compliance
7.10 Rules on Corporate Governance
7.10 Statement confirming that as at the date of the annual report, the Company is in compliance with these rules.
Complied withThe Company is compliant with the listing rules of the Colombo Stock Exchange.
For further details please see below.
7.10.1 Non Executive DirectorsThe Board of Directors of a listed entity shall include at least : two non executive directors; or such number of non executive directors equivalent to one third of the total number of directors, whichever is higher .
Complied withAs at 31st March 2015, the Board comprised 6 directors of whom 5 were non executive directors.
7.10.2 Independent DirectorsWhere the constitution of the Board of Directors includes only two non executive directors in terms of 7.10.1, both such non executive directors shall be independent. In all other instances two or 1/3rd of the non executive directors appointed to the Board, whichever is higher shall be independent.
Complied withAs at 31st March 2015 the Board comprised 2 independent directors from whom signed declarations of independence were obtained.
The Company is currently in discussion with the CBSL, regarding the designation of these directors as independent.
7.10.3-4 Directors disclosuresAnnual determination as to the independence or non independence of each non executive director
Complied withThe Board has determined the independent/ non independent status based on the criteria set out by the CSE.
Please refer directors profiles on pages 18 to 22.
7.10.5 Remuneration CommitteeShall comprise of a minimum of two independent non executive directors or of non executive directors a majority of whom shall be independent, which ever shall be higher
Complied withAs at 31st March 2015 the Committee comprised 3 Non executive directors of whom 2 were independent.
For further details, please see the Committee Report on page 82.
7.10.6 Audit CommitteeShall comprise of a minimum of two independent non executive directors or of non executive directors a majority of whom shall be independent, which ever shall be higher
Complied withAs at 31st March 2015 the Committee comprised 3 Non executive directors of whom 2 were independent.
For further details, please see the Committee Report on page 80.
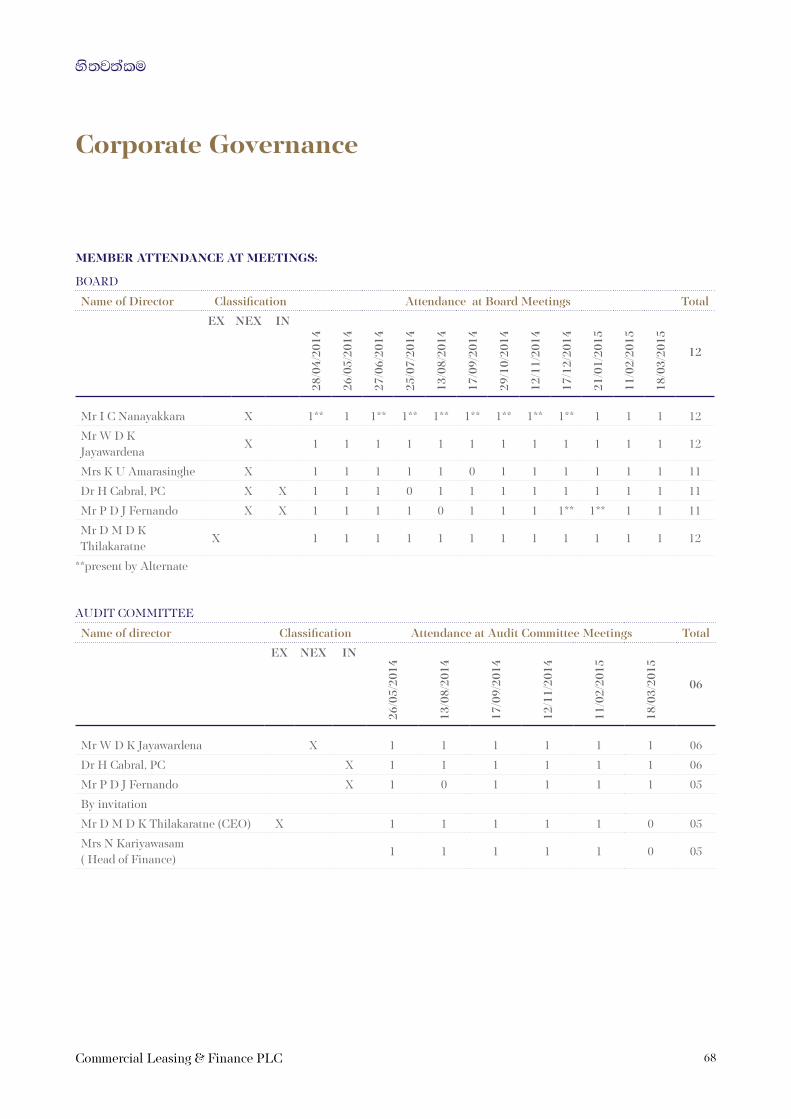
68Commercial Leasing & Finance PLC
ys;j;alu
MEMBER ATTENDANCE AT MEETINGS:
BOARD
Name of Director Classification Attendance at Board Meetings Total
EX NEX IN28
/04/
2014
26/0
5/20
14
27/0
6/20
14
25/0
7/20
14
13/0
8/20
14
17/0
9/20
14
29/1
0/20
14
12/1
1/20
14
17/1
2/20
14
21/0
1/20
15
11/0
2/20
15
18/0
3/20
15
12
Mr I C Nanayakkara X 1** 1 1** 1** 1** 1** 1** 1** 1** 1 1 1 12
Mr W D K Jayawardena
X 1 1 1 1 1 1 1 1 1 1 1 1 12
Mrs K U Amarasinghe X 1 1 1 1 1 0 1 1 1 1 1 1 11
Dr H Cabral, PC X X 1 1 1 0 1 1 1 1 1 1 1 1 11
Mr P D J Fernando X X 1 1 1 1 0 1 1 1 1** 1** 1 1 11
Mr D M D K Thilakaratne
X 1 1 1 1 1 1 1 1 1 1 1 1 12
**present by Alternate
AUDIT COMMITTEE
Name of director Classification Attendance at Audit Committee Meetings Total
EX NEX IN
26/0
5/20
14
13/0
8/20
14
17/0
9/20
14
12/1
1/20
14
11/0
2/20
15
18/0
3/20
15
06
Mr W D K Jayawardena X 1 1 1 1 1 1 06
Dr H Cabral, PC X 1 1 1 1 1 1 06
Mr P D J Fernando X 1 0 1 1 1 1 05
By invitation
Mr D M D K Thilakaratne (CEO) X 1 1 1 1 1 0 05
Mrs N Kariyawasam ( Head of Finance)
1 1 1 1 1 0 05
Corporate Governance

69Annual Report 2014/15
INTEGRATED RISK MANAGEMENT COMMITTEE
Name of director/member Classification Attendance at IRMC Committee Meetings Total
EX NEX IN 28/04/2014 25/07/2014 29/10/2014 11/02/2015 04
Mr P D J Fernando (AWEF 21.01.2015) X 1 1 0 1 3
Mr W D K Jayawardena (RWEF 21.01.2015)
X 1 1 1 1 4
Mrs K U Amarasinghe X 1 1 1 1 4
Mr D M D K Thilakaratne (CEO) X 1 1 1 1 4
NOMINATION COMMITTEE
Name of director/member Classification Attendance at Nomination Committee Meetings
Total
EX NEX IN 18/03/2015 01
Mr. P D J Fernando X 1 01
Mr. I C Nanayakkara X 1 01
Mr. W D K Jayawardena X 1 01
RELATED PARTY TRANSACTION REVIEW COMMITTEE
Name of director/member Classification Attendance at RPTR Committee Meetings
Total
EX NEX IN 12/11/2014 11/02/2015 02
Mr P D J Fernando X X 1 1 02
Mr W D K Jayawardena X 1 1 02
Mrs K U Amarasinghe X 1 1 02
Mr D M D K Thilakaratne (CEO) X 1 1 02

70Commercial Leasing & Finance PLC
ys;j;alu
Risk Management at LOLC is a centralized function at group level and therefore the same risk governance structures which are in place and operational for LOLC are replicated for Commercial Leasing & Finance PLC as well. This level of replication is done to retain the uniformity and currency of risk management practices within the group .Further this enable us to roll out new initiatives and mechanisms in a very short time span within any company of the group as the learning curve is cut short due to the uniformity of the processes.
Risk Management is an organization wide effort and a responsibility which cascades down from the board of management to the operational level employees. Having defined risk as “Anything which hinders the achievement of the organizational objectives” highlights the importance of having an organizational wide risk management mechanism which is robust, flexible and reliable. With a vision in
Risk Management
risk management of “Building an organizational Culture where Protection, Assurance, Reliability, Accountability, Transparency and Confidentiality are treasured and lasting values“, we have embarked on a journey of making every employee of the group a risk manager, thus every action and decision taken with in their scope of duty is embedded with a reasonable assessment of risk.
CLC being a part of the LOLC conglomerate requires that optimal yet feasible structures and mechanisms are adopted in risk management. At CLC Enterprise Risk Management is a group level centralized function and is a union of Risk Management, Internal Audit & Information Systems Audit . All three functions maintain their total independence by having reporting lines to the chairman and the board of management via the Integrated Risk Management Committee and the Audit Committee.
Board of Management
Audit Committee
Internal Audit
Information Systems Audit
Risk Management
Integrated Risk Management
Committee

71Annual Report 2014/15
Synergy of functions The risk management function primarily forms the independent reporting line on risk to the board of management while the audit function forms the monitoring arm to ascertain the adequacy , reliability and the consistency of the internal control framework. The IS audit function review the controls ensuring the confidentiality , Integrity and the availability of the IT systems and the internal controls governing the ICT related functions. In addition it plays a supporting role to both the internal audit and risk management in monitoring and advising on the technological risks.
and the growth volumes of its’ operations has necessitated strengthening the audit team and this was done towards the final quarter of the year under review. At present, part of the audit team is dedicated to review main operational centers & processes of CLC while the others are dispersed among the regional operational centres thus giving the audit team easy access to core business locations. The Audit team look beyond the traditional auditing and focusses on process efficiency improvements too. The audit function plays a more active role by verifying to ensure that their recommendations are implemented by obtaining an all clear sign off from the auditee in addition to the follow up audits conducted by the auditors. Further random branch reviews are undertaken which covers aspects beyond traditional auditing such as Branch Administration and management as well as the level of knowledge and awareness on operations of the branch staff.
The risk management function draws information from various sources, both internal and external .They appraise the management of the potential risks arising and recommend action for the mitigation, avoidance or capitalizing on the opportunities. The risks identified and addressed are constantly monitored and any adverse movement of such risk indicators are highlighted for appropriate action.
We understand that it is vital to keep in touch with the latest developments in our business environment and to maintain the relevant skills and the knowledge. Therefore we make a conscious effort to train and acquire the diverse knowledge and the skills set required to effectively manage the risks with in the organisation. In this regard special attention is paid to training and development of the staff of the enterprise risk management department.
Risk Management
Internal Audit
Information Systems
Audit
CLC being a part of the LOLC conglomerate requires that optimal yet feasible structures and mechanisms are adopted in risk management. At CLC Enterprise Risk Management is a group level centralized function and is a union of Risk Management, Internal Audit & Information Systems Audit.
The above three functions complement each other and draw from the synergies to make an effective risk governance structure which maintains close ties with the compliance function. The internal audit does a comprehensive review of processes, operations & on branches of CLC subject to the resources available. Audit Resources are allocated based on the perceived risk of operations of the entity and the significance of it’s operations to the overall performance of the organization . The IT audits cover the business applications , ICT infrastructure and the related processes. The expansion of the branch network of CLC

72Commercial Leasing & Finance PLC
ys;j;alu
Towards our vision We believe in empowering all stake holders in managing risks .In this aspect, the ERM division addresses the new recruits with a view of enhancing their awareness on risks faced in performing their day to day operations and on appropriate actions to be taken. This effort is to be complimented by risk trainings for identified business units which are proposed to be held in coordination with the human resource department in future . During the year we increased our consultative engagements with the other business units in order to manage risks on a proactive basis and such engagements totalled 128 man hours for the last six months of the financial year . We are continuing with this initiative as it give us a pre-emptive strike capability on identified risk sources. This allows us for early identification of the risks and enable us to put the appropriate risk management strategies in place.
The dynamic nature of the operations and the expansions require us to increase our access to information and transaction related data. We have deployed data analytic techniques which enable us to have a more holistic view of the operations of the organization .The enhanced capabilities of the Risk monitoring system compliments our ability to respond to emerging risks more effectively and efficiently.
In the next financial year we are planning to shift towards continuous auditing and monitoring yet maintaining the appropriate mix between currency of information and historical data for auditing & risk management purposes . Further we are looking towards enhancing our forecasting abilities which would help the management to have a futuristic view of the risks faced which will ultimately add sustainable value to the organization.
Risk Management
Risk Profile This is a high level categorisation of perceived risk and is used only for the illustration purposes of this report .
Risk Levels Risk Score
Very High 5
High 4
Medium 3
Low 2
Very Low 1
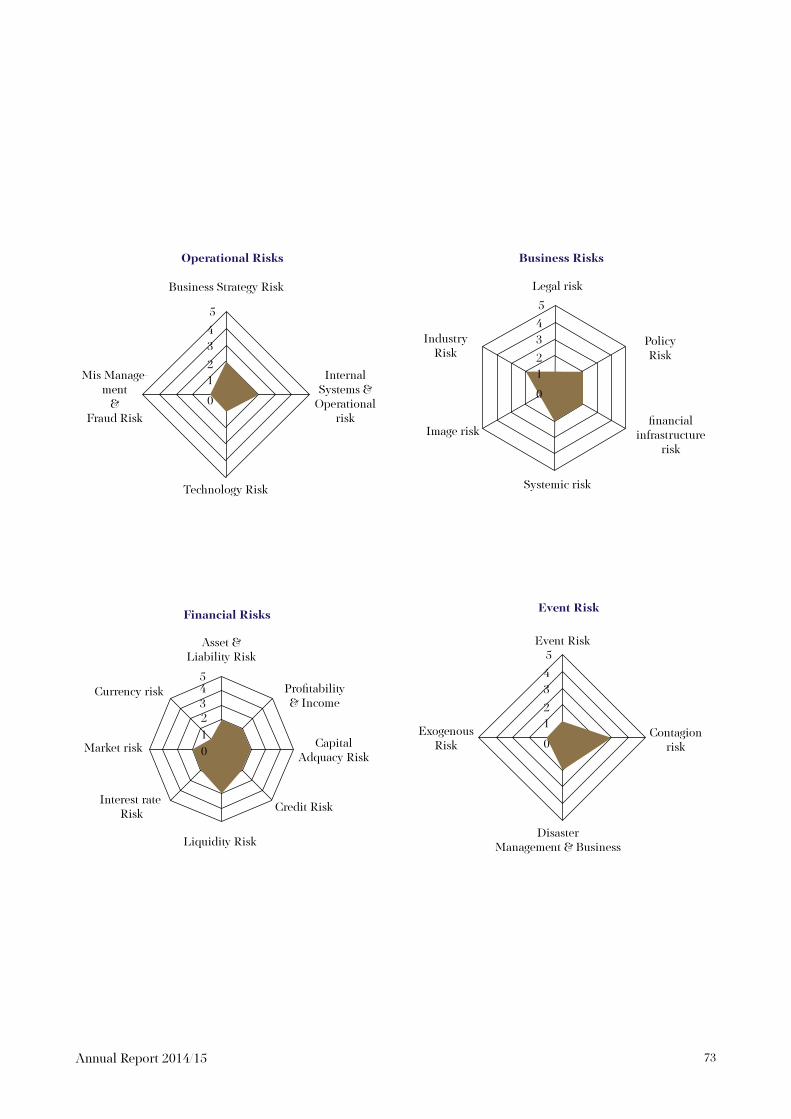
73Annual Report 2014/15
Business Risks
Legal risk
Systemic risk
Image risk
Industry Risk
Policy Risk
nancial infrastructure
risk
0
12
34
5
Currency risk
Market risk
Liquidi� Risk
Credit Risk
CapitalAdquacy Risk
Pro�tabili�& Income
Asset &Liabili� Risk
Financial Risks
Interest rate Risk
012345
DisasterManagement & Business
Event Risk
Contagion risk0
12
34
5
Exogenous Risk
Event Risk
Technology Risk
Business Strategy Risk
Internal Systems &
Operational risk
0
12
34
5
Mis Manage-ment
&Fraud Risk
Operational Risks

74
Our decades of expertise in the industry help us to navigate successfully amidst market challenges. As a result, we have been able to create better lifestyles and help Sri Lankans explore new horizons.
Statutory Reports & Financial InformationDirectors Report | Audit Committee Report | Integrated Risk Management Committee Report | Remuneration Committee Report | Nomination Committee Report | Related Party Transaction Review Committee Report | Directors’ Statement on Internal Control over Financial Reporting | Chief Executive Officer’s and Chief Financial Officer’s Responsibility Statement | Independent Auditors’ Report | Statement of Profit or Loss and Other Comprehensive Income | Statement of Financial Position | Statement of Changes in Equity | Statement of Cash Flows | Notes to the Financial Statements | Shareholder Information | Summarised Quarterly Statistics | Ten Year Summary | Sources and Distribution of Income | Statement of Value Added | Glossary Terms | Notice of Meeting | Notes | Form of Proxy | Corporate Information
CreatingBetter
Lifestyles
ys;j;alu“ H i t h a w a t h k a m a ”

Annual Report 2014/15
Financial Calendar 2014/15
1st Quarter Results 2014/2015 released on 15th August 20142nd Quarter Results 2014/2015 released on 13th November 20143rd Quarter Results 2014/2015 released on 13th February 20154th Quarter Results 2014/2015 released on 29th May 2015Annual Report for 2014/2015 released on August 201523rd Annual General Meeting on August 2015
Proposed Financial Calendar 2015/16
1st Quarter Results 2015/2016 will be released on 14th August 20152nd Quarter Results 2015/2016 will be released on 13th November 20153rd Quarter Results 2015/2016 will be released on 15th February 2016 4th Quarter Results 2015/2016 will be released on 31st May 2016Annual Report for 2015/2016 will be released in June 201624th Annual General Meeting in June 2016

76Commercial Leasing & Finance PLC
ys;j;alu
Directors Report
Your Directors have pleasure in presenting their Annual Report together with the Audited Financial Statements for the year ended 31st March 2015.
Principal Activities and Nature of Operations During the year, the principal activities of the Company comprised provision of leasing, hire purchase, loans, receivable financing, and mobilizing of fixed and savings deposits.
Markets Served The Company operates in all provinces of Sri Lanka with the largest concentration of branches being in Western and North Central Provinces.
Directorate The Directors during the year under review were as follows:
1. Mr. I C Nanayakkara (Alternate to Mr W D K Jayawardena)
Chairman -Non Executive Director
2. Mr. W D K Jayawardena(Alternate to Mr I C Nanayakkara)
Non Executive Director
3. Mrs. K U Amarasinghe Non Executive Director
4. Mr. P D J Fernando Senior Independent Non Executive Director *
5. Dr. H Cabral, PC(Alternate to Mr P D J Fernando)
Independent Non Executive Director*
6. Mr. D M D K Thilakaratne Executive Director/CEO
* The Company is currently in discussion with the CBSL, regarding the designation of these directors as independent
Recommendations for re-election of DirectorsIn terms of Article 75 of the Articles of Association Mr W D K Jayawardena and Mr D M D K Thilakaratne retire by rotation at the Annual General Meeting of the Company and offer themselves for re-election. The Board recommends their re-election.
Directors Interests in Contracts The Directors have made the declarations required by the Companies Act No. 7 of 2007. These have been noted by the
Board, recorded in the Minutes and entered into the Interest Register which is maintained by the Company.
Lists of companies on which these Directors serve have been included on pages 78 to 79.
Directors’ Remuneration The Company paid Rs.32,701,110/00 as Directors’ remuneration for the financial year ended 31st March 2015.
Directors Shareholding
Directors Name As At 31.03.2015
As at 31.03.2014
1 Mr. I C Nanayakkara Nil Nil
2 Mr. W D K Jayawardena Nil Nil
3 Mrs. K U Amarasinghe Nil Nil
4 Mr. P D J Fernando Nil Nil
5 Dr. H Cabral, PC Nil Nil
6 Mr. D M D K Thilakaratne Nil Nil
Shareholding Structure The stated capital of the Company is Rs. 1,425,946,629/- divided into 6,377,711,170 shares.
Meetings of the Board of DirectorsTwelve regular monthly meetings were held during the year. A schedule of Directors attendance at board meetings and subcommittee meetings has been included on pages 68 to 69.
Corporate GovernanceCLC is governed by the requirements of the Finance Companies (Corporate Governance) Direction no. 3 of 2008 and the Listing Rules of the Colombo Stock Exchange and subsequent amendments thereto. The manner in which CLC ensures adherence with the above requirements has been disclosed on pages 43 to 69.
Board Sub Committees In compliance with regulatory guidelines and also with best practices, the Board has formed the following sub committees:
• AuditCommittee• IntegratedRiskManagementCommittee• RemunerationCommittee• NominationCommittee• RelatedPartyTransactionReviewCommittee
77Annual Report 2014/15
The reports of these Committees can be found on pages 80 to 84.
Compliance with Laws and Regulations The Company has not engaged in any activity that contravenes any applicable law or regulation, and to the best of the knowledge of the Directors the Company has been in compliance with all prudential requirements, regulations and laws.
BRAC Lanka Finance PLC - Subsidiary Under the Financial Sector Consolidation Program of the Central Bank of Sri Lanka, the Company acquired BRAC Lanka Finance PLC, formerly known as Nanda Investments and Finance PLC. At the conclusion of the mandatory offer the Company held 94.35% of its total number of shares. The remaining 5.65% of the number of shares were acquired according to the provisions of Section 246 of the Companies Act of 2007. The transfer of the said 5.65% of the total number of shares is pending approval by the Securities and Exchange Commission of Sri Lanka.
Commercial Insurance Brokers (Private) Limited - Associate Company The Company holds 40% of the equity of Commercial Insurance Brokers (Private) Limited. The following two directors have been nominated to its Board by the Company:
• Mr.DMDKThilakaratne• Mr.PDJFernando
During the past 28 years CIB has been engaged in the business of life and general insurance. It is one of the premier insurance broking firms in the country.
Events after the reporting date No circumstances have arisen since the reporting date that would require disclosure.
Human Resources The total staff strength of the Company as at end March 2015 was 670 (2014 – 610).
Going Concern The Directors after making necessary inquiries have the expectation that the Company has adequate resources to continue in operational existence for the foreseeable future. Therefore the going concern basis has been adopted in the preparation of the financial statements.
Financial Statements & Auditor’s Report and Directors’ Responsibility for Financial Reporting The financial statements and the auditor’s report are given on pages 87 to 168.
The Directors are responsible for the preparation of financial statements of the Company to reflect a true and fair view of the state of its affairs. The Directors are of the view that the financials have been prepared in accordance with the requirements of the Sri Lanka Accounting Standards, the Companies Act No. 7 of 2007, the Finance Business Act No. 42 of 2011 and all relevant directions of the Central Bank of Sri Lanka.
Significant Accounting Policies The Accounting Policies adopted in the preparation of the financial statements and any changes thereof where applicable have been included in the Notes to the financial statements on pages 94 to 115.
Transactions with related parties Details of related party transactions are disclosed in the financial statements on pages 147 to 153 under Note 39.
Statutory Payments For the year under review, all known statutory payments have been made and all retirement gratuities have been provided for. Further, all management fees and payments to related parties for the year under review have been reflected in the accounts.
Auditors M/s KPMG, the Auditors of the company retire and offer themselves for reappointment. The Board recommends their re-appointment for the year 2015/2016 at a fee to be decided upon by the Board.
Auditor’s remuneration is given in the Note 9 to the Audited financial statements on page 117.
As far as the Directors are aware, the Auditors do not have any other relationship with the Company or any of its subsidiaries nor do they have any interest in contracts with the Company or any of its subsidiaries.
Annual General Meeting The Annual General Meeting of the Company will be held on 25th August 2015 at 10.30am, at Park Premier Banquet

78Commercial Leasing & Finance PLC
ys;j;alu
Hall, Excel World Entertainment Park, No. 338, T B Jayah Mawatha, Colombo 10. Should you be unable to attend, please complete the proxy form in the manner instructed therein and return it to the Company.
For and on behalf of the Board of Directors of Commercial Leasing & Finance PLC
D M D K Thilakaratne Director/ CEO
21st May 2015Colombo 04
Directors Report
Directorships held by the Directors
Name Directorships held
Mr. I C Nanayakkara
Chairman:Commercial Leasing & Finance PLCBrown & Company PLCLOLC Micro Credit Limited Browns Investments PLCBRAC Lanka Finance PLC F L C Holdings PLC F L C Hydro Power PLC
Deputy Chairman:Lanka ORIX Leasing Company PLCLanka ORIX Finance PLC Seylan Bank PLC
Director:PRASAC Micro Finance Institute Sierra Constructions (Private) Limited AgStar PLC LOLC Myanmar Microfinance Co. Ltd Associated Battery Manufacturers (Ceylon) LtdLanka Century Investments PLC F L M C Plantations (Pvt) Ltd.Pussellawa Plantations LtdCeylon Estate Teas (Pvt) Ltd
Mr. W D K Jayawardena
Chairman:LOLC Insurance Company LimitedLOLC Securities LtdLanka ORIX Finance PLC Eden Hotel Lanka PLCLOLC General Insurance LimitedPalm Garden Hotels PLC
Managing Director/ Group CEO:Lanka ORIX Leasing Company PLC
Director:LOLC Micro Credit LimitedCommercial Leasing & Finance PLCBrown & Co. PLCBrowns Investments PLC Riverina Resorts (Pvt) LtdBRAC Lanka Finance PLC Seylan Bank PLC Pusselawa Plantation Limited FLC Holdings PLCFLC Hydro Power PLCF L M C Plantations (Pvt) Ltd.

79Annual Report 2014/15
Name Directorships held
Mrs. K U Amarasinghe
Director:Commercial Leasing & Finance PLCLanka ORIX Finance PLCLanka ORIX Leasing Company PLCLOLC Insurance Company LimitedLOLC Micro Credit LimitedEden Hotel Lanka PLCPalm Garden Hotels PLCBrown & Co. PLCBrowns Investments PLC Riverina Resorts (Pvt) Ltd FLC Hydro Power PLCFLC Holdings PLCPussellawa Plantations LtdMelfort Green Teas (Private) LtdF L M C Plantations (Pvt) Ltd.
Dr Harsha Cabral, PC
Chairman :Tokyo Cement Company (Lanka) PLCTokyo Super Cement Company (Private) LtdTokyo Cement Power Company LtdTokyo Eastern Cement Company LtdDirector :Diesel & Motor Engineering PLC (DIMO)Richard Pieris & Co. Distributors Ltd.Hayleys PLCLanka ORIX Finance PLCCommercial Leasing & Finance PLCHambana Petro Chemicals LtdAlumex PLC Browns Investments PLCJust in Time Consultancy (Pvt) LtdImperial Institute of Higher Education (Pvt) Ltd BRAC Lanka Finance PLC (RWEF 18.06.15)
Name Directorships held
Mr. P D J Fernando
Chairman:Golden Key Credit Card Company.
Director : Commercial Leasing & Finance PLCUnion Bank of Colombo PLCTaprobane Holdings LtdHambana Petro Chemicals LtdCommercial Insurance Brokers (Pvt) LtdCeylon Leather Products PLC Thomas Cook Sri LankaBRAC Lanka Finance PLC (RWEF 18.06.15)
Mr. D M D K Thilakaratne
Director:Commercial Leasing & Finance PLCCommercial Insurance Brokers (Pvt) LtdCommercial Factors Limited

80Commercial Leasing & Finance PLC
ys;j;alu
Audit Committee Report
CompositionThe Audit Committee was established for the purpose of assisting the Board in fulfilling their responsibilities relating to financial governance. The Committee comprises Non executive directors, with the majority of them being independent:
Mr. W D K Jayawardane
Committee Chairman /Non Executive Director
Mr. P D J Fernando Senior Independent Non Executive Director
Dr H Cabral, PC Independent Non Executive Director
Terms of ReferenceThe Audit Committee is governed by the Audit Charter which defines its terms of reference. The composition and scope of the committee meets the requirements set out in the Finance Companies Corporate Governance Direction No 3 of 2008 and the Listing Rules of the Colombo Stock Exchange. The Committee Charter was last reviewed and revised by the Board in February 2014. The Audit Committee Chairman counts over thirty years’ experience in Banking, Financial Management and Corporate Management and holds a Master’s degree in Business Administration, from the American University of Asia. He is a Fellow of the Institute of Bankers and an Associate of the Institute of Cost and Executive Accountants, London.
Meetings and MethodologyThe Committee meets quarterly and additional meetings are held as and when a need arises. Six meetings were held during the year and the members’ attendance at Audit Committee meetings is provided on page 68. The CEO and the Head of Finance were present at five meetings. Minutes of such meetings which include details of matters discussed are reported regularly at Board meetings. The audit partner was invited to attend all six meetings and on two occasions the auditors were able to meet with the Audit Committee members without the presence of the other directors and members of the management.
The Committee has been mandated to ensure that a sound Financial Reporting System is established by: reviewing the appropriateness of procedures in place for the identification, evaluation and management of business risks; ensuring that internal controls relating to all areas of operations, including Human Resources and IT enhance good governance while
not impeding business; seeking assurance that agreed control systems are in place, are operating efficiently and are regularly monitored; ensuring that appropriate controls are put in place prior to the implementation of significant business changes, facilitating monitoring of the changes; reviewing internal and external audit functions; and ensuring compliance with applicable laws, regulations, listing rules and established policies of the Company.
Activities of the CommitteeDuring the year under review, the Committee reviewed interim and annual financial statements prior to publication, checking and recommending changes in accounting policies, significant estimates and judgments made by the management, compliance with relevant accounting standards/regulatory requirements, and issues arising from internal and external audit.
Effectiveness of the Company’s internal controls was evaluated through reports provided by the management, and by the internal and external auditors. The Committee is satisfied that an effective system of internal control is in place to provide the assurance on safeguarding the assets and the integrity of financial reporting. On behalf of the Audit Committee, the Internal Auditor performs a comprehensive exercise that entails reviewing of all aspects of MIS including operational and regulatory risks.
The Committee addressed the external auditors findings reported in the Management Letter relating to the previous financial year’s (2013/14) audit.
The Committee reviewed the independence and objectivity of the external auditors, M/s KPMG, Chartered Accountants and has received a declaration confirming that they do not have any relationship or interest in the Company as required by the Companies Act No. 7 of 2007.
W D K JayawardenaChairmanAUDIT COMMITTEE
Colombo21st May 2015

81Annual Report 2014/15
Integrated Risk Management Committee Report
CompositionThe Integrated Risk Management Committee (IRMC) was established to assist the Board in performing its oversight function in relation to different types of risk faced by the Company in its business operations and ensures adequacy and effectiveness of the risk management framework of the Company. The Committee comprises the following members:
Mr. P D J Fernando Committee Chairman/Senior Independent Non Executive Director(Mr W D K Jayawardena stepped down as Committee Chairman and appointed Mr P D J Fernando w.e.f. 21.01.2015 as recommended by the CBSL)
Mrs. K U Amarasinghe Non Executive Director
Mr. D M D K Thilakaratne Director/CEO
Mrs. S Wickremasekera Chief Risk Officer
Mrs. S Kotakadeniya Chief Financial Officer
Mr. J Kelegama Chief Credit Officer
Mr. R Perera Group Treasurer
Mr. C Dias Chief Information Officer
Mr. N Weerapane Deputy General Manager/Recoveries
Pursuant to a recommendation of the Central Bank of Sri Lanka , Mr W D K Jayawardena stepped down as Committee Chairman in January and the Senior Independent Director Mr Priyantha Fernando was appointed Committee Chairman instead.
Terms of ReferenceThe IRMC has adopted the provisions of section 8 (3) of the Finance Companies Corporate Governance Direction No. 3 of 2008 issued by the Monetary Board of the Central Bank of Sri Lanka as its Terms of Reference. The composition and the scope of work of the Committee are in conformity with the provisions of the aforesaid Direction.
Meetings and MethodologyDuring the year the Committee met 4 times on a quarterly basis. Credit, Operational, Market and Liquidity Risks are monitored by divisional heads and reported to the Chief Risk Officer on a monthly basis. These risks are then
reviewed and assessed monthly by the Chief Risk Officer and summarized reports are submitted quarterly to the Committee for concurrence and/or specific directions in order to ensure that the risks are managed appropriately.
Activities of the CommitteeAs delegated by the Committee the Chief Risk Officer submits a risk assessment report to the Board, subsequent to each meeting within a week of each meeting, stating the risk mitigation actions pursued and seeking the Board’s views. In addition proceedings of meetings are also tabled at a subsequent meeting of the Board. The attendance of members at meetings is stated on page 69.
The Committee works closely with the key management personnel and the Board in fulfilling its duties in risk management. During the year the Committee reviewed risk indicators designed to monitor the level of specific risks, with a view to determining the adequacy of such indicators; reviewed actual results computed monthly against each risk indicator and took prompt corrective action to mitigate the effects of the specific risk; reviewed the effectiveness of the compliance function to assess the Company’s compliance with laws, regulatory guidelines, internal controls and approved policies in all areas of business operations.
P D J Fernando ChairmanINTEGRATED RISK MANAGEMENT COMMITTEE
Colombo21st May 2015

82Commercial Leasing & Finance PLC
ys;j;alu
Remuneration Committee Report
CompositionThe Remuneration Committee was established to assist the Board in evaluating and recommending remuneration for Board members including the Managing Director. The Committee comprises three non executive directors with the majority of them being independent.
Mr. I C Nanayakkara Committee Chairman/Non Executive Director
Mr. P D J Fernando Senior Independent Non Executive Director
Dr. H Cabral, PC Independent Non Executive Director
Terms of ReferenceThe Remuneration Committee is governed by its Remuneration Policy which has vested it with powers to evaluate, assess and recommend to the Board for approval any fee, remuneration and ex gratia to be paid out to its directors including the chief executive officer based on: the need of the Company to be competitive; the need to attract, motivate and retain talent; and the need to encourage and reward high levels of performance and achievement of corporate goals and objectives. The composition of the Committee meets the requirements set out in the Listing Rules of the Colombo Stock Exchange.
Meetings & MethodologyThe Committee is responsible for determining the remuneration policy relating to the Director/CEO; periodically evaluating the performance of the Director/CEO against the set targets and goals and determining the basis for revising remuneration, benefits and other payments of performance based incentives; determining the remuneration policy relating to executive and Non executive directors including alternate directors and recommending these to the Board for adoption.
All independent directors receive a fee for attending board meetings and committee meetings. They do not receive any performance or incentive payments. Directors’ emoluments have been disclosed on page 117 under Note 9 of the financial statements.
There were no Remuneration Committee meetings held during the year under review.
I C NanayakkaraChairmanREMUNERATION COMMITTEE
Colombo21st May 2015
83Annual Report 2014/15
Nomination Committee Report
CompositionThe Nomination Committee was established on 29th October 2014, to assist the Board in assessing the skills required and recommending director nominees for election to the board (subject to ratification by the shareholders) and to nominate members to its sub committees to effectively discharge their duties and responsibilities.
The three-member Committee comprises the Senior Independent Director and two Non-Executive Directors. Its meetings are chaired by the Senior Independent Director to ensure that its responsibilities are discharged effectively.
Mr. P D J Fernando Committee Chairman/Senior Independent Non Executive Director
Mr. I C Nanayakkara Non Executive Director
Mr. W D K Jayawardena Non Executive Director
Terms of ReferenceThe Board established this Committee voluntarily and its charter defines its purpose including the following duties and responsibilities:
(1) Assisting the Board in identifying qualified individuals to become Board members and determining the composition of the Board of Directors and its committees;
(2) Oversight of the evaluation of the Board and its Committees, as well as senior management of the company, including succession planning;
(3) Annually review the composition of each sub-committee and present recommendations/nominations for committee memberships to the Board
(4) Maintain records & minutes of meetings and activities of the Committee.
(5) Perform any other activities consistent with this Charter, and the scope of the Nomination committee or as deemed necessary and appropriate by the Committee and the Board.
Activities of the CommitteeDuring the year the Committee assessed the composition of the Board and its Sub Committees and was satisfied that the requirements of the relevant regulations of the CBSL and CSE had been fulfilled.
One Committee meeting was held during the year under review and proceedings of the meeting were reported to the Board. Attendance of the committee members at the meeting is on page 69.
P D J Fernando ChairmanNOMINATION COMMITTEE
Colombo21st May 2015

84Commercial Leasing & Finance PLC
ys;j;alu
Related Party Transaction Review Committee Report
CompositionOn 29th October 2014 the Board appointed a Related Party Transaction Review Committee comprising the following membership:
Mr. P D J Fernando Committee Chairman/ Senior Independent Non Executive Director
Mr. W D K Jayawardena Non Executive Director
Mrs. K U Amarasinghe Non Executive Director
Mr. D M D K Thilakaratne Director/ CEO
Mrs. S Kotakadeniya Chief Financial Officer
Mr. R Perera General Manager Treasury
Mr. J Kelegama Chief Credit Officer
Mrs. N Kariyawasam Head of Finance
Terms of ReferenceThe Committee was formed in order to adhere to the Code of Best Practice on Related Party Transactions (RPTs) issued by the Securities & Exchange Commission of Sri Lanka under sections 13 (c) of the SEC Act No. 36 of 1987 (as amended). Under the said direction all public listed companies were required to adopt the code with effect from 1st January 2014 on a voluntary basis for an initial period of two years from the effective date.
Activities of the CommitteeThe Committee reviewed related party transactions entered into by the Company during the year under review. The Committee met twice and the attendance of committee members at meetings is on page 69.
P D J Fernando ChairmanRELATED PARTY TRANSACTION REVIEW COMMITTEE
Colombo21st May 2015
85Annual Report 2014/15
Directors’ Statement on Internal Control over Financial Reporting
ResponsibilityIn line with the Finance Companies Direction No. 03 of 2008 section 10(2) b), the Board of Directors present this report on Internal Control over Financial Reporting.
The Board of Directors (“the Board”) is responsible for the adequacy and effectiveness of the internal control mechanism in place at the Commercial Leasing & Finance PLC. (“the Company”).
The Board has established an on-going process for identifying, evaluating and managing the significant risks faced by the Company and this process includes the system of Internal Control over Financial Reporting. The process is regularly reviewed by the Board.
The Board is of the view that the system of Internal Control over Financial Reporting in place, is sound and adequate to provide reasonable assurance regarding the reliability of Financial Reporting, and that the preparation of Financial Statements for external purposes is in accordance with relevant accounting principles and regulatory requirements.
The management assists the Board in the implementation of the Board’s policies and procedures pertaining to Internal Control over Financial Reporting. In assessing the Internal Control System over Financial Reporting, identified officers of the Company collated all procedures and controls that are connected with significant accounts and disclosures of the Financial Statements of the Company & continue to review & update every year. These in turn are being observed and checked by the Internal Audit Department of the Company for suitability of design and effectiveness on an on-going basis.
ConfirmationBased on the above processes, the Board confirms that the Financial Reporting System of the Company has been designed to provide reasonable assurance regarding the reliability of Financial Reporting and the preparation of Financial Statements for external purposes and has been done in accordance with Sri Lanka Accounting Standards and regulatory requirements of the Central Bank of Sri Lanka.
External Auditor’s CertificationThe External Auditors have submitted a certification on the process adopted by the Directors on the system of internal controls over financial reporting. The matters addressed by the External Auditor’s in this respect, will be taken in to consideration & appropriate steps will be taken to incorporate same, where applicable.
By order of the Board
I C Nanayakkara Chairman
Krishan ThilakaratneDirector/CEO
W D K JayawardenaChairman/Audit Committee
21st May 2015

86Commercial Leasing & Finance PLC
ys;j;alu
Chief Executive Officer’s and Chief Financial Officer’s Responsibility Statement
The financial statements are prepared in compliance with the Sri Lankan Financial Reporting Standards (SLFRS/LKAS) issued by the institute of Chartered accountant of Sri Lanka, the requirements of the Companies Act No.7 of 2007, the Finance Business Act No.42 of 2011 and the Listing Rules of the Colombo Stock Exchange.
Accordingly, the company has prepared financial statements which comply with SLFRSs/ LKASs and related interpretations applicable for period ended 31 March 2015, together with the comparative period data as at and for the year ended 31 March 2014, as described in the accounting policies.
We accept responsibility for the integrity and accuracy of these financial statements. Significant accounting policies have been applied consistently. Application of significant accounting policies and estimates that involve a high degree of judgment and complexity were discussed with the Audit Committee and the external auditors. Estimate and judgment relating to the financial statements were made on a prudent and reasonable basis, in order to ensure that the financial statements are true and fair. To ensure this, our internal auditors have conducted periodic audits to provide reasonable assurance that the established policies and procedures of the company were consistently followed.
We confirm that to the best of our knowledge, the financial statements and other financial information included in this annual report, fairly present in all material respects the financial position, results of operations and cash flows of the company as of, and for, the periods presented in this annual report.
We are responsible for establishing and maintaining internal controls and procedures. We have designed such controls and procedures, or caused such controls and procedures to be designed under our supervision, to ensure that material information relating to the company is made
known to us and for safeguarding the company’s assets and preventing and detecting fraud and error. We have evaluated the effectiveness of the company’s internal controls and procedures and are satisfied that the controls and procedures were effective as of the end of the period covered by this annual report. We confirm, based on our evaluations that there were no significant deficiencies and material weaknesses in the design or operation of internal controls and any fraud that involves management or other employees.
The financial statements were audited by Messrs. KPMG, Chartered Accountants, the Independent Auditors. The Audit Committee pre - approves the audit and non-audit services provided by KPMG in order to ensure that the provision of such services does not impair KPMG’s independence and objectivity. The Audit Committee also reviews the external audit plan and the management letters and follows up on any issues raised during the statutory audit. The Audit Committee also meets with the external and internal auditors to review the effectiveness of the audit.
We confirm that the company has complied with all applicable laws and regulations and guidelines and that there are no material litigations that are pending against the company other than those arising in the normal course of conducting business.
Sunjeevani KotakadeniyaChief Financial Officer - LOLC Group
Krishan ThilakaratneDirector/CEO
21st May 2015

87Annual Report 2014/15
Independent Auditors’ Report
TO THE SHAREHOLDERS OF COMMERCIAL LEASING & FINANCE PLC
Report on the Financial StatementsWe have audited the accompanying financial statements of Commercial Leasing & Finance PLC, (“the Company”), and the consolidated financial statements of the Company and its subsidiary (“Group”), which comprise the statement of financial position as at March 31, 2015, and the statement of profit or loss and other comprehensive income, statement of changes in equity and, cash flow statement for the year then ended, and a summary of significant accounting policies and other explanatory information.
Board’s Responsibility for the Financial Statements The Board of Directors (“Board”) is responsible for the preparation of these financial statements that give a true and fair view in accordance with Sri Lanka Accounting Standards, and for such internal control as Board determines is necessary to enable the preparation of financial statements that are free from material misstatement, whether due to fraud or error.
Auditors’ ResponsibilityOur responsibility is to express an opinion on these financial statements based on our audit. We conducted our audit in accordance with Sri Lanka Auditing Standards. Those standards require that we comply with ethical requirements and plan and perform the audit to obtain reasonable assurance about whether the financial statements are free from material misstatement.
An audit involves performing procedures to obtain audit evidence about the amounts and disclosures in the financial statements. The procedures selected depend on the auditors’ judgment, including the assessment of the risks of material misstatement of the financial statements, whether due to fraud or error. In making those risk assessments, the auditor considers internal control relevant to the entity’s preparation of the financial statements that give a true and fair view in order to design audit procedures that are appropriate in the circumstances, but not for the purpose of expressing an opinion on the effectiveness of the entity’s internal control.
An audit also includes evaluating the appropriateness of accounting policies used and the reasonableness of accounting estimates made by Board, as well as evaluating the overall presentation of the financial statements.
We believe that the audit evidence we have obtained is sufficient and appropriate to provide a basis for our audit opinion.
OpinionIn our opinion, the consolidated financial statements give a true and fair view of the financial position of the Group as at March 31, 2015, and of its financial performance and cash flows for the year then ended in accordance with Sri Lanka Accounting Standards.
Report on Other Legal and Regulatory RequirementsAs required by section 163 (2) of the Companies Act No. 07 of 2007, we state the following:
a) The basis of opinion and scope and limitations of the audit are as stated above
b) In our opinion:
- we have obtained all the information and explanations that were required for the audit and, as far as appears from our examination, proper accounting records have been kept by the Company,
⁻ The financial statements of the Company give a true and fair view of its financial position as at March 31, 2015, and of its financial performance and cash flows for the year then ended in accordance with Sri Lanka Accounting Standards.
⁻ The financial statements of the Company, and the Group comply with the requirements of sections 151 and 153 of the Companies Act No. 07 of 2007.
CHARTERED ACCOUNTANTSColombo,21st May 2015.

88Commercial Leasing & Finance PLC
ys;j;alu
Statement of Profit or Loss and Other Comprehensive Income
Group CompanyFor the year ended 31st March 2015 2015 2014
Note Rs. Rs. Rs.
Interest income 4 7,907,048,946 7,589,689,494 7,514,197,452
Interest Expense 5 (2,449,180,012) (2,406,103,135) (3,039,090,127)Net interest income 5,457,868,934 5,183,586,359 4,475,107,325
Other income 6 788,012,983 578,882,586 252,729,184
Operating expensesDirect expenses (236,619,329) (234,511,377) (153,439,557)Premises, equipment & establishment expenses (310,448,989) (284,503,948) (242,029,001)Personnel costs (845,451,266) (723,426,263) (571,069,725)Allowance for impairment & write offs 7 (1,350,924,860) (1,317,730,605) (1,131,450,042)Depreciation and amortization 8 (130,593,987) (95,379,925) (54,545,531)Other operating expenses (1,275,176,170) (1,212,143,049) (1,174,570,840)Results from operating activities before value added tax and NBT 9 2,096,667,316 1,894,773,778 1,400,731,813
Value added tax on financial services and NBT 10 (190,401,799) (169,138,645) (119,115,780)Results from operating activities 1,906,265,517 1,725,635,133 1,281,616,033
Share of profit of equity accounted investee (net of tax) 2,625,839 2,625,839 7,137,976
Profit before income tax expense 1,908,891,356 1,728,260,972 1,288,754,009 Income tax expense 11 (315,882,413) (302,239,653) (352,795,118)Profit for the year 1,593,008,943 1,426,021,319 935,958,891
Other comprehensive income
Revaluation surplus 26.2 - - 98,787,980 Deferred tax on revaluation - - (19,680,635)Actuarial losses on defined benefit plan 34.2 (664,378) (582,503) (10,205,511)Net Change in fair value of available for sale finance assets 10,927,788 11,074,735 29,358,066 Effective portion of changes in fair value of cash flow hedges (177,335,936) (177,335,933) (15,149,239)Other comprehensive income/ (expense) for the year, net of tax (167,072,526) (166,843,700) 83,110,661 Total comprehensive income for the year 1,425,936,417 1,259,177,619 1,019,069,552
Earnings per share 12 0.25 0.22 0.15
Profit attributable to;Equity holders of the company 1,589,109,547 1,426,021,319 935,958,891 Non controlling interest 3,899,396 - -Profit for the year 1,593,008,943 1,426,021,319 935,958,891
Total Comprehensive Income attributable to;Equity holders of the company 1,422,049,945 1,259,177,619 1,019,069,552 Non controlling interest 3,886,472 - -
1,425,936,417 1,259,177,619 1,019,069,552
The Accounting Policies and Notes form an integral part of these Financial Statements.
Figures in brackets indicate deductions

89Annual Report 2014/15
Statement of Financial Position
Group CompanyAs at 31st March 2015 2015 2014
Note Rs. Rs. Rs.
ASSETSCash and cash equivalents 13.1 639,716,513 515,679,795 736,358,424 Financial assets held for trading 14 228,344,666 228,344,666 215,068,436 Other investments 15 5,893,126,212 5,874,611,522 2,545,327,729 Rentals receivable on leases & hire purchases 16 12,815,031,878 12,718,721,039 12,707,422,540 Loans and advances 17 20,800,941,259 17,849,802,717 13,059,739,309 Factoring receivables 18 2,413,882,879 2,413,882,879 1,803,034,055 Due from related companies 19 1,406,416 3,301,539 52,432,438 Value Added Tax (VAT) recoverable 368,174,507 367,619,634 370,890,238 Current tax assets 20 17,482,034 14,300,502 9,792,039 Other current assets 21 845,886,045 308,684,692 278,464,780 Equity accounted investees 22 71,456,726 71,456,726 71,530,887 Investment properties 23 10,700,000 10,700,000 14,038,000 Investments in Subsidiaries 24 - 967,862,518 -Deferred tax assets 33.1 979,278 - -Goodwill 25 253,210,966 - -Property, plant and equipment 26 1,068,738,940 1,040,374,016 1,069,814,268 Total Assets 45,429,078,319 42,385,342,245 32,933,913,143
LIABILITIES AND EQUITYLiabilitiesBank overdraft 13.2 1,326,488,496 1,310,844,519 655,802,303 Derivative liabilities 27 289,491,818 289,491,818 97,551,618 Other financial liabilities due to customers 28 9,795,028,601 9,701,569,972 7,678,277,663 Loans and borrowings-current 29.2 13,974,854,681 12,777,127,874 6,079,289,334 Loans and borrowings- non current 29.2 5,621,015,401 5,621,015,401 7,357,846,071 Current tax liabilities 30 398,471,780 363,234,642 325,847,577 Due to related companies 31 1,753,721,991 386,278,266 276,213,293 Trade and other payables 32 1,579,624,434 1,302,811,310 956,615,589 Deferred tax liabilities 33.2 469,356,358 469,356,358 609,923,788 Employee benefits 34 54,496,137 48,226,366 40,337,807 Total Liabilities 35,262,549,697 32,269,956,526 24,077,705,043
EquityStated capital 35 1,425,946,629 1,425,946,629 1,425,946,629 Reserves 36 707,222,044 750,303,507 1,134,338,837 Retained earnings 37 7,990,107,736 7,939,135,583 6,295,922,634 Total Equity 10,123,276,409 10,115,385,719 8,856,208,100 Non-controlling interests 43,252,213 - -
10,166,528,622 - -Total Liabilities & Equity 45,429,078,319 42,385,342,245 32,933,913,143
Net Assets Value Per Share 1.59 1.59 1.39
The accounting Policies and Notes form an integral part of these Financial Statements.Figures in brackets indicate deduction.
These Financial Statements are prepared and presented in compliance with the requirements of Companies Act No. 7 of 2007.
Mrs. S.S. KotakadeniyaChief Financial Officer-LOLC Group
The Board of Directors is responsible for the preparation and presentation of these financial statements.Approved and Signed for and on behalf of the Board by;
Mr. I.C. Nanayakkara Mr. D.M.D.K.ThilakaratneChairman Director / CEO
Colombo,21st May 2015.

90Commercial Leasing & Finance PLC
ys;j;alu
Group Stated Capital RevaluationReserve
HedgingReserve
Available-forSale Reserve
GeneralReserve
StatutoryReserve Fund
InvestmentFund
RetainedEarnings
Total Non-controlling
Interest
Total Equity
Rs. Rs. Rs. Rs. Rs. Rs. Rs. Rs. Rs. Rs. Rs.
Balance as at 01st April 2014 1,425,946,629 135,980,246 (2,734,323) 29,335,085 288,079,789 394,602,842 289,075,199 6,295,922,634 8,856,208,100 - 8,856,208,100
Total comprehensive income for the year
Profit for the year - - - - - - - 1,589,109,547 1,589,109,547 3,899,396 1,593,008,943
Other comprehensive income - - (177,335,936) 10,936,088 - - - (659,754) (167,059,602) (12,924) (167,072,526)
Total comprehensive income for the period - - (177,335,936) 10,936,088 - - - 1,588,449,793 1,422,049,945 3,886,472 1,425,936,417
Transactions with Owners directly recorded in the Equity
Acquisition of NCI - - - - - - - (154,981,637) (154,981,637) 39,365,741 (115,615,895)
Transferred to/(from) during the year - - - - (56,300,000) 84,658,253 (289,075,199) 260,716,946 - - -
- - - - (56,300,000) 84,658,253 (289,075,199) 260,716,946 - - -
Balance as at 31 March 2015 1,425,946,629 135,980,246 (180,070,259) 40,271,173 231,779,789 479,261,095 - 7,990,107,736 10,123,276,408 43,252,213 10,166,528,622
Company Stated Capital
RevaluationReserve
HedgingReserve
Available-forSale Reserve
GeneralReserve
StatutoryReserve Fund
InvestmentFund
RetainedEarnings
TotalEquity
Rs. Rs. Rs. Rs. Rs. Rs. Rs. Rs. Rs.
Balance as at 01 April 2013 1,425,946,629 56,872,900 12,414,916 (22,981) 288,079,789 347,804,897 191,689,684 5,514,352,714 7,837,138,548
Total comprehensive income for the year
Profit for the year - - - - - - - 935,958,891 935,958,891
Other comprehensive income - 79,107,345 (15,149,239) 29,358,066 - - - (10,205,511) 83,110,661
Total comprehensive income for the period - 79,107,345 (15,149,239) 29,358,066 - - - 925,753,380 1,019,069,552
Transferred to/(from) during the year - - - - - 46,797,945 97,385,515 (144,183,460) -
Balance as at 31 March 2014 1,425,946,629 135,980,246 (2,734,323) 29,335,085 288,079,789 394,602,842 289,075,199 6,295,922,634 8,856,208,100
Total comprehensive income for the year
Profit for the year - - - - - - - 1,426,021,319 1,426,021,319
Other comprehensive income - - (177,335,933) 11,074,735 - - - (582,503) (166,843,700)
Total comprehensive income for the period - - (177,335,933) 11,074,735 - - - 1,425,438,816 1,259,177,619
Transferred to/(from) during the year - - - - - 71,301,066 (289,075,199) 217,774,133 -
Balance as at 31 March 2015 1,425,946,629 135,980,246 (180,070,256) 40,409,820 288,079,789 465,903,908 - 7,939,135,583 10,115,385,719
The Accounting Policies and Notes form an integral part of these Financial Statements.
Figures in brackets indicate deductions.
Statement of Changes in Equity

91Annual Report 2014/15
Group Stated Capital RevaluationReserve
HedgingReserve
Available-forSale Reserve
GeneralReserve
StatutoryReserve Fund
InvestmentFund
RetainedEarnings
Total Non-controlling
Interest
Total Equity
Rs. Rs. Rs. Rs. Rs. Rs. Rs. Rs. Rs. Rs. Rs.
Balance as at 01st April 2014 1,425,946,629 135,980,246 (2,734,323) 29,335,085 288,079,789 394,602,842 289,075,199 6,295,922,634 8,856,208,100 - 8,856,208,100
Total comprehensive income for the year
Profit for the year - - - - - - - 1,589,109,547 1,589,109,547 3,899,396 1,593,008,943
Other comprehensive income - - (177,335,936) 10,936,088 - - - (659,754) (167,059,602) (12,924) (167,072,526)
Total comprehensive income for the period - - (177,335,936) 10,936,088 - - - 1,588,449,793 1,422,049,945 3,886,472 1,425,936,417
Transactions with Owners directly recorded in the Equity
Acquisition of NCI - - - - - - - (154,981,637) (154,981,637) 39,365,741 (115,615,895)
Transferred to/(from) during the year - - - - (56,300,000) 84,658,253 (289,075,199) 260,716,946 - - -
- - - - (56,300,000) 84,658,253 (289,075,199) 260,716,946 - - -
Balance as at 31 March 2015 1,425,946,629 135,980,246 (180,070,259) 40,271,173 231,779,789 479,261,095 - 7,990,107,736 10,123,276,408 43,252,213 10,166,528,622
Company Stated Capital
RevaluationReserve
HedgingReserve
Available-forSale Reserve
GeneralReserve
StatutoryReserve Fund
InvestmentFund
RetainedEarnings
TotalEquity
Rs. Rs. Rs. Rs. Rs. Rs. Rs. Rs. Rs.
Balance as at 01 April 2013 1,425,946,629 56,872,900 12,414,916 (22,981) 288,079,789 347,804,897 191,689,684 5,514,352,714 7,837,138,548
Total comprehensive income for the year
Profit for the year - - - - - - - 935,958,891 935,958,891
Other comprehensive income - 79,107,345 (15,149,239) 29,358,066 - - - (10,205,511) 83,110,661
Total comprehensive income for the period - 79,107,345 (15,149,239) 29,358,066 - - - 925,753,380 1,019,069,552
Transferred to/(from) during the year - - - - - 46,797,945 97,385,515 (144,183,460) -
Balance as at 31 March 2014 1,425,946,629 135,980,246 (2,734,323) 29,335,085 288,079,789 394,602,842 289,075,199 6,295,922,634 8,856,208,100
Total comprehensive income for the year
Profit for the year - - - - - - - 1,426,021,319 1,426,021,319
Other comprehensive income - - (177,335,933) 11,074,735 - - - (582,503) (166,843,700)
Total comprehensive income for the period - - (177,335,933) 11,074,735 - - - 1,425,438,816 1,259,177,619
Transferred to/(from) during the year - - - - - 71,301,066 (289,075,199) 217,774,133 -
Balance as at 31 March 2015 1,425,946,629 135,980,246 (180,070,256) 40,409,820 288,079,789 465,903,908 - 7,939,135,583 10,115,385,719
The Accounting Policies and Notes form an integral part of these Financial Statements.
Figures in brackets indicate deductions.
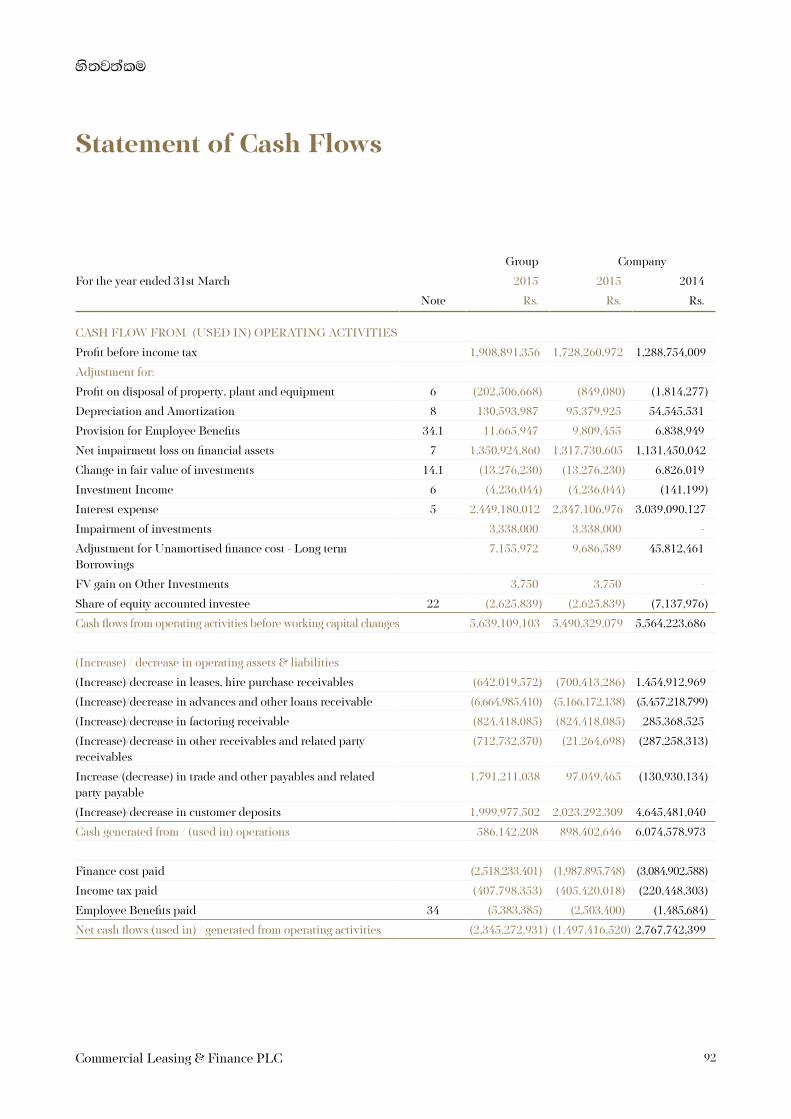
92Commercial Leasing & Finance PLC
ys;j;alu
Statement of Cash Flows
Group Company
For the year ended 31st March 2015 2015 2014
Note Rs. Rs. Rs.
CASH FLOW FROM/ (USED IN) OPERATING ACTIVITIES
Profit before income tax 1,908,891,356 1,728,260,972 1,288,754,009
Adjustment for:
Profit on disposal of property, plant and equipment 6 (202,506,668) (849,080) (1,814,277)
Depreciation and Amortization 8 130,593,987 95,379,925 54,545,531
Provision for Employee Benefits 34.1 11,665,947 9,809,455 6,838,949
Net impairment loss on financial assets 7 1,350,924,860 1,317,730,605 1,131,450,042
Change in fair value of investments 14.1 (13,276,230) (13,276,230) 6,826,019
Investment Income 6 (4,236,044) (4,236,044) (141,199)
Interest expense 5 2,449,180,012 2,347,106,976 3,039,090,127
Impairment of investments 3,338,000 3,338,000 -
Adjustment for Unamortised finance cost - Long term Borrowings
7,155,972 9,686,589 45,812,461
FV gain on Other Investments 3,750 3,750 -
Share of equity accounted investee 22 (2,625,839) (2,625,839) (7,137,976)
Cash flows from operating activities before working capital changes 5,639,109,103 5,490,329,079 5,564,223,686
(Increase) / decrease in operating assets & liabilities
(Increase)/decrease in leases, hire purchase receivables (642,019,572) (700,413,286) 1,454,912,969
(Increase)/decrease in advances and other loans receivable (6,664,985,410) (5,166,172,138) (5,457,218,799)
(Increase)/decrease in factoring receivable (824,418,085) (824,418,085) 285,368,525
(Increase)/decrease in other receivables and related party receivables
(712,732,370) (21,264,698) (287,258,313)
Increase/(decrease) in trade and other payables and related party payable
1,791,211,038 97,049,465 (130,930,134)
(Increase)/decrease in customer deposits 1,999,977,502 2,023,292,309 4,645,481,040
Cash generated from / (used in) operations 586,142,208 898,402,646 6,074,578,973
Finance cost paid (2,518,233,401) (1,987,895,748) (3,084,902,588)
Income tax paid (407,798,353) (405,420,018) (220,448,303)
Employee Benefits paid 34 (5,383,385) (2,503,400) (1,485,684)
Net cash flows (used in) / generated from operating activities (2,345,272,931) (1,497,416,520) 2,767,742,399

93Annual Report 2014/15
Group Company
For the year ended 31st March 2015 2015 2014
Note Rs. Rs. Rs.
CASH FLOW FROM INVESTING ACTIVITIES
Net cash and cash equivalents on acquisition of subsidiary (1,057,041,156) (967,862,518) -
Acquisition of property, plant and equipment (98,146,620) (65,939,675) (661,301,448)
Acquisition / (Disposal) of investment properties 526,357,588 - (14,038,000)
Purchase of financial investments (2,405,192,189) (3,318,212,808) (2,032,539,933)
Purchase of quoted shares 14.1 - - (216,803,911)
Proceeds from the sale of property, plant and equipment 849,080 849,080 7,095,165
Dividend received from investments 6,936,044 6,936,044 141,199
Net cash used in investing activities (3,026,237,253) (4,344,229,877) (2,917,446,929)
CASH FLOW FROM FINANCING ACTIVITIES
Net Movement in Interest bearing loans and borrowings 7,734,000,000 7,734,000,000 (3,565,249,269)
Net Movement in Derivatives 14,604,267 14,604,267 6,321,484
Proceeds from long-term interest bearing loans and borrowings 29.1 2,401,000,000 2,401,000,000 8,226,591,727
Repayments of long-term interest bearing loans and borrowings 29.1 (5,545,422,187) (5,183,678,715) (4,330,808,319)
Net cash flows generated from financing activities 4,604,182,080 4,965,925,552 336,855,624
Net (decrease) / increase in cash and cash equivalents (767,328,105) (875,720,845) 187,151,094
Cash and cash equivalents at the beginning of the year 80,556,121 80,556,121 (106,594,973)
Cash and cash equivalents at the end of the year (Note A) (686,771,983) (795,164,724) 80,556,121
Note A
Cash in Hand and favourable bank balances 13.1 639,716,513 515,679,795 736,358,424
Unfavourable bank balances used for cash management purposes 13.2 (1,326,488,496) (1,310,844,519) (655,802,303)
Cash and cash equivalents at the end of the year (686,771,983) (795,164,724) 80,556,121
The Accounting Policies and Notes form an integral part of these Financial Statements.
Figures in brackets indicate deductions.

94Commercial Leasing & Finance PLC
ys;j;alu
1. CORPORATE INFORMATION
1.1 GeneralCommercial Leasing & Finance PLC was incorporated as a Private Limited Company in April 1988 and in 1992 converted into a Public Limited Company and listed in the Colombo Stock Exchange. In 2008 with the acquisition by Lanka Orix Leasing Company PLC, the company submitted an application to delist from Colombo Stock Exchange and it was treated as delisted with effect from July 01, 2009. Further to Finance Leasing Act No 56 of 2000, on 07th December 2011, the Company has obtained the License to carry on Finance Business under the Finance Business Act No 42 of 2011. Company has relisted in Colombo Stock Exchange in June 2012 in compliance with the CBSL Directions with the divestment of 10% of the stated capital.
Ordinary shares of the Company are listed on the Diri savi board of the Colombo Stock Exchange (CSE).
The Consolidated Financial Statements of the Company as at and for the year ended 31st March 2015 comprise of the Company and its subsidiary (together referred to as the “Group” and individually as “Group entities”) and the Group’s interest in associates.
The registered office and the principal place of business of the Company is located at No.68, Bauddhaloka Mawatha,Colombo 04.
1.2 Parent entity and Ultimate Parent CompanyLanka ORIX Leasing Company PLC is the holding company of the Group and therefore, it does not have an identifiable immediate or ultimate parent of its own.
1.3 Principal Activities and Nature of OperationsThe principal activities of the Company comprised of leasing, hire purchase, loans, factoring and mobilization of public deposits. There were no significant changes in the nature of the principal activities of the Company during the financial year under review.
Description of the nature of operations and principle activities of the associate company and subsidiary company are given on note 22 and 24 respectively to these Financial Statements with any changes to the principal activities during the financial year under review.
1.4 Number of EmployeesThe staff strength of the Company as at 31stMarch 2015 was 670. (31.3.2014 - 610)
2. BASIS OF PREPARATION
2.1 Statement of ComplianceThe Financial Statements of the Company and those consolidated with such are prepared in accordance with the Sri Lanka Accounting Standards (LKASs/SLFRSs) laid down by the Institute of Chartered Accountants of Sri Lanka (ICASL) and the requirements of the Companies Act No.7 of 2007.
The presentation of these Financial Statements is also in compliance with the requirements of the Finance Business Act no 42 of 2011.
2.2 Presentation of Financial StatementsThe assets and liabilities of the Group presented in the Statement of Financial Position are grouped by nature and listed in-order to reflect their relative liquidity and maturity pattern. An analysis regarding recovery or settlement within twelve months after the reporting date (current) and more than twelve months after the reporting date (non-current) is presented in note 38 (Maturity analysis).
Financial assets and financial liabilities are offset and the net amount reported in the Statement of Financial Position only when there is a legally enforceable right to off-set the recognised amounts and there is an intention to settle on a net basis, or to realize the assets and settle the liability simultaneously. Income and expenses are not offset in the Statement of Profit or Loss unless required or permitted by an accounting standard or an interpretation, and as specially disclosed in the accounting policies of the Group.
2.3 Basis of Measurement The Financial Statements of the Group and the Company have been prepared on the historical cost basis and applied consistently with no adjustments being made for inflationary factors affecting the financial Statements, except for the following material items in the Statement of Financial Position;
• Financial instruments at Fair Value through Profit or Loss are measured at fair value.
Notes to the Financial Statements

95Annual Report 2014/15
• Derivative financial instruments are measured at fair value.
• Available-for-sale financial assets are measured at fair value.
• The liability for defined benefit obligations are measured at present value, based on an actuarial valuation as explained in note 34.
• Lands and buildings are measured at the revalued amounts.
• Investment properties are measured at fair value
2.4 Functional and presentation currencyThe functional currency is the currency of the primary economic environment in which the entities of the Group operates. These Financial Statements are presented in Sri Lankan Rupees (LKR), which is the Group’s functional currency and the presentation currency. All financial information has been rounded to the nearest Rupee unless stated otherwise.
2.5 Use of Significant Judgments, Estimates and Assumptions
The preparation of the financial statements in conformity with SLFRSs/LKASs requires management to make judgments, estimates and assumptions that affect the application of accounting policies and the reported amounts of assets, liabilities, income and expenses. Actual results may differ from these estimates.
Estimates and underlying assumptions are based on historical experience and various other factors that are believed to be reasonable under the circumstances, the results which form the basis of making the judgments about the carrying amount of assets and liabilities that are not readily apparent from other sources.
Estimates and underlying assumptions are reviewed on an ongoing basis. Revisions to accounting estimates are recognised in the period in which the estimates are revised and in any future periods affected.
Information about critical judgments, estimates and assumptions in applying accounting policies that have the most significant effect on the amounts recognised in the
financial statements are included in the following notes to these Financial Statements.
Critical accounting estimate/judgement
Disclosure reference Note
Financial Instruments – fair value disclosure
14 & 15
Useful lives of property, plant and equipment
3.6.1.7
Goodwill on acquisition 25
Employee benefits 34
Collective allowance for impairment
16.2.3 , 17.1.1 & 18.1
Determination in fair value of investment property
23
2.6 Comparative InformationTo facilitate comparison relevant balances pertaining to the previous year have been reclassified to confirm to current classification and presentation.
2.7 Materiality and AggregationAs per LKAS – 01 “Presentation of Financial Statements”, each material class of similar items are presented separately in the Financial Statements. Items of dissimilar nature or function are presented separately unless they are immaterial.
2.8 Going Concern The Board of Directors is satisfied that the Group has adequate resources to continue its operations in the foreseeable future and management is not aware of any material uncertainties that may cast significant doubt upon the Group’s ability to continue as a going concern. Therefore going-concern basis has been adopted in preparing these Financial Statements.
2.9 Directors’ Responsibility for the Financial Statements
The Board of Directors are responsible for the preparation and fair presentation of these Financial Statements in accordance with Sri Lanka Accounting Standards and as per the provisions of the Companies Act No. 07 of 2007. This responsibility includes: designing, implementing and maintaining internal controls relevant to the preparation and fair presentation of Financial Statements that are free

96Commercial Leasing & Finance PLC
ys;j;alu
from material misstatement, whether due to fraud or error; selecting and applying appropriate accounting policies; and making accounting estimates that are reasonable in the circumstances.
These Financial Statements include the following components;
• AStatementofFinancialPositionprovidingtheinformation on the financial position of the Group and the Company as at the year end;
• AStatementofProfitorLossandOtherComprehensiveIncome providing the information on the financial performance and other comprehensive income of the Group and the Company for the year under review;
• AStatementofChangesinEquitydepictingallchangesin shareholders’ funds during the year under review of the Group and the Company;
• AStatementofCashFlowsprovidingtheinformationtothe users, on the ability of the Group and the Company to generate cash and cash equivalents and the needs of entities to utilize those cash flows; and
• NotestotheFinancialStatementscomprisingAccounting Policies and other explanatory information.
2.10 Approval of Financial Statements by the Board of Directors
The Financial Statements of the Group and the Company for the year ended 31st March 2015 (including comparatives) were approved and authorized for issue by the Board of Directors on 21st May 2015.
2.11 Changes in accounting policiesExcept for the changes below, the Group has consistently applied the accounting policies as set out in these consolidated financial statements.
The Group has adopted the following new standards and amendments to standards, including any consequential amendments to other standards, with a date of initial application of 1 April 2014.
1. SLFRS 10 Consolidated Financial Statements
2. SLFRS 12 Disclosure of Interests in Other Entities
3. SLFRS 13 Fair Value Measurement
4. Disclosures – Offsetting Financial Assets and Financial Liabilities (Amendments to SLFRS 7)
5. Presentation of Items of Other Comprehensive Income (Amendments to LKAS 1)
6. LKAS 19 Employee Benefits (2014)
The nature and the effects of the changes are explained below.
2.11.1 Subsidiaries, including structured entitiesAs a result of SLFRS 10, the Group has changed its accounting policy for determining whether it has control over and consequently whether it consolidates other entities. SLFRS 10 introduces a new control model that focuses on whether the Group has power over an investee, exposure or rights to variable returns from its involvement with the investee and the ability to use its power to affect those returns.
In accordance with the transitional provisions of SLFRS 10, the Group reassessed its control conclusions as of 1 April 2014. The change did not have any impact on the Group’s financial statements.
SLFRS 10 - Consolidated Financial StatementsSLFRS 10 Consolidated Financial Statements, which replaces LKAS 27 Consolidated and Separate Financial Statements and SIC-12 Consolidation-Special Purpose Entities. Additionally, the ICASL published SLFRS - 12 Disclosure of Interests in Other Entities and LKAS 27 Separate Financial Statements.
The main changes from LKAS 27 and SIC-12 are a single control model is applied to determine whether an investee should be consolidated, Control assessment includes consideration of substantive potential voting rights as opposed to currently exercisable potential voting rights, Guidance is provided for assessing whether the investor is a principal or an agent in respect of its relationship with the investee. A principal could consolidate an investee whereas an agent would not because the linkage between power
Notes to the Financial Statements
97Annual Report 2014/15
and returns is not present. SLFRS 10 is effective for annual periods beginning on or after 1st January 2014.
2.11.2 Interests in other entitiesAs a result of SLFRS 12, the Group has expanded disclosures about its interests in subsidiaries.
SLFRS 12 - Disclosure of Interests in Other EntitiesSLFRS 12 Disclosure of Interests in Other Entities is a consolidated disclosure standard requiring disclosures about an entity’s interests in subsidiaries, joint arrangements, associates and unconsolidated ‘structured entities’.
The objective of SLFRS 12 is to require the disclosure of information that enables users of Financial Statements to evaluate the nature of, and risks associated with, its interests in other entities, the effects of those interests on its financial position, financial performance and cash flows.
SLFRS 12 was effective for annual periods beginning on or after 1st January 2014.
2.11.3 Fair value measurementIn accordance with the transitional provisions of SLFRS 13, the Group has applied the new definition of fair value, as set out in Note 44, prospectively. The change had no significant impact on the measurements of the Group’s assets and liabilities, but the group has included new disclosures in the financial statements, which are required under SLFRS 13.
These new disclosure requirements are not included in the comparative information. However, to the extent that disclosures were required by other standards before the effective date of SLFRS 13, the Group has provided the relevant comparative disclosures under those standards.
Fair Value Measurement - SLFRS 13SLFRS 13 Fair Value Measurement applies to SLFRSs that require or permit fair value measurement or disclosures and provides a single SLFRS framework for measuring fair value and disclosures on fair value measurement. The Standard defines fair value on the basis of an ‘exit price’ notion and uses a ‘fair value hierarchy’, which results in a market-based, rather than entity-specific, measurement.
SLFRS 13, defines fair value, sets out in a single SLFRS a framework for measuring fair value disclosures on fair value measurements.
SLFRS 13, is effective for annual periods beginning on or after 1 January 2015.
2.11.4 Offsetting financial assets and financial liabilitiesAs a result of the amendments to SLFRS 7, the Group has expanded disclosures about offsetting financial assets and financial liabilities.
2.11.5 Presentation of items of Other Comprehensive Income (OCI)
As a result of the amendments to LKAS 1, the Group has modified the presentation of items of OCI in its statement of profit or loss and OCI, to present items that would be reclassified to profit or loss in the future separately from those that would never be. Comparative information has been re-presented on the same basis.
2.11.6 Post-employment defined benefit plansAs a result of LKAS 19, the Group has changed its accounting policy with respect to the basis for determining the income or expense related to its defined benefit plans.
Under LKAS 19, the Group determines the net interest expense (income) on the net defined benefit liability (asset) for the period by applying the discount rate used to measure the defined benefit obligation at the beginning of the annual period to the then-net defined benefit liability (asset), taking into account any changes in the net defined benefit liability (asset) during the period as a result of contributions and benefit payments. Consequently, the net interest on the net defined benefit liability (asset) now comprises:
1. Interest cost on the defined benefit obligation
2. Interest income on plan assets
3. Interest on the effect on the asset ceiling
The change did not have any impact on the Group’s financial statements.
2.12 New Accounting Standards Issued But Not Effective at Reporting Date
The Accounting standards issued but not effective at the reporting date is given below with expected impact on company financial statements. The company will apply the accounting standards when they become effective.

98Commercial Leasing & Finance PLC
ys;j;alu
2.12.1 SLFRS 9 – “Financial Instruments” SLFRS 9 – “Financial Instruments” replaces the existing guidance in LKAS 39 – Financial Instruments: Recognition and Measurement. SLFRS 9 includes revised guidance on the classification and measurement of financial instruments including a new expected credit loss model for calculating impairment on financial assets.
SLFRS 9 is effective for annual period beginning on or after 1st January 2018 with early adoption permitted.
2.12.2 SLFRS 15 – Revenue Recognition from Customer Contracts
SLFRS 15 – “Revenue from Contracts with Customers” establishes a comprehensive framework for determining whether, how much and when revenue is recognised. It replaces existing revenue recognition guidance LKAS 18 Revenue, LKAS 11 Construction Contracts.
SLFRS 15 is effective for annual reporting period beginning on or after 1st January 2017, with early adoption permitted.
The Group is assessing the potential impact on its Consolidated Financial Statements resulting from the above standards.
However,the following new or amended standards are not expected to have an impact on the Consolidated Financial Statements.
• SLFRS 14 Regulatory Deferral Accounts-effective from 01st January 2016
• Agriculture: Bearer Plants(Amendments to LKAS 16 and LKAS 41-effective from 01st January 2016
3. SIGNIFICANT ACCOUNTING POLICIES
The accounting policies set out below have been applied consistently to all periods presented in these Consolidated Financial Statements unless otherwise indicated.
These accounting policies have been applied consistently by entities within the Group.
3.1 Basis of Consolidation3.1.1 Business combinationsThe Group measures goodwill as the fair value of the consideration transferred including the recognised amount of any non-controlling interest in the acquiree, less the net
recognised amount (generally fair value) of the identifiable assets acquired and liabilities assumed, all measured as of the acquisition date. When the excess is negative, a bargain purchase gain is recognised immediately in Profit or Loss.
The Group elects on a transaction-by-transaction basis whether to measure non-controlling interest at its fair value, or at its proportionate share of the recognised amount of the identifiable net assets, at the acquisition date.
Transaction costs, other than those associated with the issue of debt or equity securities, that the Group incurs in connection with a business combination are expensed as incurred.
3.1.2 SubsidiariesSubsidiaries are entities controlled by the Group. Control exists when the Company has the power, directly or indirectly, to govern the financial and operational policies of an entity so as to obtain benefits from its activities. In assessing control, potential voting rights that presently are exercisable or convertible are taken into account.
The Financial Statements of subsidiaries are included in the consolidated Financial Statements from the date that control commences until the date that control ceases. Acquisition of subsidiaries are accounted for using the acquisition method of accounting.
The accounting policies of subsidiaries have been changed where necessary to align them with the policies adopted by the Group. If a member of the group uses accounting policies other than those adopted in the consolidated Financial Statements for similar transactions and events in similar circumstances, appropriate adjustments are made to its Financial Statements in preparing the consolidated Financial Statements.
Any goodwill arising on the acquisition of a foreign operation and any fair value adjustments to the carrying amounts of assets and liabilities arising on the acquisition are treated as assets and liabilities of the foreign operation and translated at the closing rate.
3.1.3 Non-controlling interestsNon-controlling Interests is the equity in a subsidiary not attributable, directly or indirectly, to the parent are presented in the Statement of Financial Position
Notes to the Financial Statements

99Annual Report 2014/15
within Equity, separately from the Equity attributable to Shareholders Holders of the Parent (Company).
3.1.4 Acquisition of Non-controlling interestsSubsequent to the acquisition of control, any further acquisition of net assets from non-controlling interest is accounted for as transactions with owners in their capacity as owners. Therefore no goodwill or gain on bargain purchase is recognised as a result of such transactions.
Any difference between the amount by which the non-controlling interests is adjusted and the fair value of the consideration paid or received shall be recognised directly in equity and attributed to the owners of the parent.
3.1.5 Transactions do not result a change in controlChanges in the Group’s interest in a subsidiary that do not result in a loss of control status are accounted for as transactions with owners in their capacity as owners. Adjustments to non-controlling interests and parent’s equity are based on a proportionate amount of the net assets of the subsidiary. No adjustments are made to goodwill recognised and no gain or loss is recognised in Profit or Loss.
3.1.6 Common control transactionsA business combination involving entities or businesses under common control is a business combination in which all of the combining entities or businesses ultimately are controlled by the same party or parties both before and after the combination, and that control is not transitory.
The acquirer of the common control transaction applies book value accounting for all common control transactions.
In applying book value accounting, no entries are recognised in Profit or Loss; instead, the result of the transaction is recognised in equity as arising from a transaction with shareholders.
3.1.7 Loss of ControlThe parent can lose control of a subsidiary with or without a change in absolute or relative ownership levels. Upon the loss of control, the Group derecognises the assets and liabilities of the subsidiary, any minority interests and the other components of equity related to the subsidiary. Any surplus or deficit arising on the loss of control is recognised in the Statement of Profit or Loss.
If the Group retains any interest in the previous subsidiary, then such interest is measured at fair value at the date that control is lost. Subsequently it is accounted for as an equity-accounted investee or as other financial asset depending on the level of influence retained.
3.1.8 Equity accounted Investees - AssociatesAssociates are those entities in which the Group has significant influence, but not control, over the financial and operating activities. Significant influence is presumed to exist when the Group holds between twenty and fifty percent of the voting power of another entity.
Associates are accounted for using the equity method (equity accounted investees) and are initially recognised at cost in the terms of Sri Lanka Accounting Standards – LKAS 28 on “Investment in Associates”. The Group’s investment in associate includes goodwill identified on acquisition, net of any accumulated impairment losses.
The Consolidated Financial Statements include the Group’s share of the income and expenses and equity movements of equity accounted investees, after adjustments to align the accounting policies with those of the Group, from the date that significant influence commences until the date that significant influence ceases.
Acquisitions of additional stakes of equity accounted investees, until the control is established, are accounted as goodwill within the equity accounted investment if consideration paid is more than the net asset acquired or taken into to profit or loss as gain on bargain purchase if the net asset acquired is more than the consideration paid.
When the Group’s share of losses exceeds its interest in an equity accounted investee, the carrying amount of that interest (including any long-term investments) is reduced to zero and the recognition of further losses is discontinued except to the extent that the Group has an obligation or has made payments on behalf of the investee. Associate Companies of the Group which have been accounted for under the equity method of accounting are disclosed under Note 22 to these Financial Statements.
3.1.9 Reporting DateThe Group’s Subsidiary Company has a common financial year end which ends on 31st March. The financial year of Commercial Insurance Brokers Limited, an associate company of the Group ends on 31st December.

100Commercial Leasing & Finance PLC
ys;j;alu
The difference between the reporting date of the associate company and that of the parent does not exceed three months.
3.1.10 Balances and Transactions Eliminated on Consolidation
Intragroup balances and transactions, including income, expenses and dividends, are eliminated in full. Profits and losses resulting from intragroup transactions that are recognised in assets, such as inventory and fixed assets, are eliminated in full.
Unrealized gains arising from transactions with equity-accounted investees are eliminated against the investment to the extent of the Group’s interest in the investee.
3.1.11 AcquisitionsAll business combinations have been accounted for by applying the acquisition method in accordance with the SLFRS 3 - Business Combinations. Applying this method involves the entity that obtains control over the other entity to recognise the fair value of assets acquired and liabilities and contingent liabilities assumed, including those not previously recognised.
3.1.12 Cost of AcquisitionThe cost of an acquisition is measured as the fair value of the assets given, equity instruments issued and liabilities incurred or assumed at the date of exchange. This excludes any transaction costs incurred.
3.1.13 Goodwill on AcquisitionGoodwill represents the excess of the cost of any acquisition of a subsidiary or an associate over the Group’s interest in the net fair value of the identifiable assets, liabilities and contingent liabilities acquired.
The Group tests the goodwill for impairment annually and assess for any indication of impairment to ensure that its carrying amount does not exceed the recoverable amount. If an impairment loss is identified, it is recognised immediately to the Statement of Profit or Loss . For the purpose of impairment testing, goodwill acquired in a business combination is, from the acquisition date, allocated to groups of cash-generating units that are expected to benefit from the synergies of the combination.
The impairment loss is allocated first to reduce the carrying amount of any goodwill allocated to the unit and then to the other assets pro-rata to the carrying amount of each asset in the unit. Where goodwill forms part of a cash-generating unit and part of the operation within that unit is disposed of, the goodwill associated with the operation disposed of is included in the carrying amount of the operation when determining the gain or loss on disposal of the operation.
Carrying amount of the goodwill arising on acquisition of subsidiaries and joint ventures is presented as an intangible and the goodwill on an acquisition of an equity accounted investment is included in the carrying value of the investment.
3.1.14 Gain on Bargain Purchase (negative goodwill)If the Group’s interest in the net fair value of the identifiable assets, liabilities and contingent liabilities exceeds the cost of the acquisition of the entity, the Group will reassess the measurement of the acquiree’s identifiable assets and liabilities and the measurement of the cost and recognise the difference immediately in the Consolidated Statement of Profit or Loss.
3.2 Foreign currency 3.2.1 Foreign Currency TransactionsTransactions in foreign currencies are translated into the functional currency (Sri Lankan Rupees-LKR) at exchange rates at the dates of the transactions.
Monetary assets and liabilities denominated in foreign currencies at the reporting date are retranslated to the functional currency at the exchange rate at that date. The foreign currency gain or loss on monetary items are the difference between amortized cost in the functional currency at the beginning of the year, adjusted for effective interest and payments during the year, and the amortized cost in foreign currency translated at the exchange rate at the end of the year.
Non-monetary assets and liabilities denominated in foreign currencies that are measured at fair value are retranslated to the functional currency at the exchange rate at the date that the fair value was determined. Non-monetary items in a foreign currency that are measured in terms of historical cost are translated using the exchange rate at the date of the transaction.
Notes to the Financial Statements

101Annual Report 2014/15
Foreign currency differences arising on retranslation are recognised in Statement of Profit or Loss .
3.3 Financial instruments3.3.1 Financial AssetsFinancial assets are within the scope of LKAS 39 are classified appropriately as fair value through Profit or Loss (FVTPL), loans and receivables (L & R), held to maturity (HTM), available-for-sale (AFS) at its initial recognition.
All the financial assets are recognised at fair value at its initial recognition.
3.3.1.1 Financial Assets at Fair Value Through Profit or Loss (FVTPL)
A financial asset is classified at fair value through Profit or Loss if it is classified as held for trading or is designated as such upon initial recognition. Financial assets are designated at fair value through Profit or Loss if the Group manages such investments and makes purchase and sale decisions based on their fair value in accordance with the Group’s documented risk management or investment strategy. Upon initial recognition, transaction costs are recognised in Profit or Loss as incurred.
Financial assets at fair value through Profit or Loss are measured at fair value, and subsequent therein are recognised in Profit or Loss.
The Group’s investments in certain equity securities and derivative instruments which are not accounted under hedge accounting are classified under fair value through profit or loss.
3.3.1.2 Loans and ReceivablesLoans and receivables are financial assets with fixed or determinable payments that are not quoted in an active market. Such assets are recognised initially at fair value plus any directly attributable transaction costs. Subsequent to initial recognition, loans and receivables are measured at amortized cost using the effective interest method, less any impairment losses.
Loans and receivables of the Group comprise of the following,
3.3.1.2.1 Rental receivables on Finance Leases and Hire purchases
Assets leased to customers which transfer substantially all the risks and rewards associated with ownership other than legal title, are classified as finance leases. Amounts receivable under finance leases are included under “Lease Rentals Receivable”. Leasing balances are stated in the Statement of Financial Position after deduction of initial rentals received, unearned lease income and the provision for impairment.
Assets sold to customers under fixed rate hire agreements, which transfer all risk and rewards as well as the legal title at the end of such contractual period are classified as ‘Hire Purchase Receivable’. Such assets are accounted for in a similar manner as finance leases.
3.3.1.2.2 Rental receivables on Operating Leases Leases where the Company as the lessor effectively retains substantially all the risk and rewards incidental to the ownership are classified as operating leases. Lease rentals from operating leases are recognised as income on a straight-line basis over the lease term.
3.3.1.2.3 Advances and Other Loans to CustomersAdvances and other loans to customers comprised of revolving loans, loans with fixed instalments.
Revolving loans to customers are reflected in the statement of financial position at amounts disbursed less repayments and allowance for impairment losses. Loans to customers with fixed instalments are stated in the statement of financial position net of possible loan losses and net of interest, which is not accrued to revenue.
After initial measurement, ‘loans and advances’ are subsequently measured at amortised cost using the EIR, less allowance for impairment except when the Company recognises loans and receivables at fair value through profit or loss. Amortised cost is calculated by taking into account any discount or premium on acquisition and fees and costs that are an integral part of the EIR. The amortisation is included in ‘Interest Income’ in the Statement of Profit or Loss . The losses arising from impairment are recognised in the Statement of Profit or Loss .
Revolving loans to customers are reflected in the statement of financial position at amounts disbursed less repayments and allowance for impairment losses. Loans to customers
102Commercial Leasing & Finance PLC
ys;j;alu
with fixed instalments are stated in the statement of financial position net of possible loan losses and net of interest, which is not accrued to revenue.
3.3.1.2.4 Trade ReceivablesTrade receivables are stated at the amounts they are estimated to realize, net of provisions for impairment. An allowance for impairment losses is made where there is objective evidence that the Group will not be able to recover all amounts due according to the original terms of receivables. Impaired receivables are written-off when identified.
3.3.1.3 Held-to-Maturity Financial AssetsIf the company has the positive intent and ability to hold debt securities to maturity, then such financial assets are classified as held-to-maturity. Held-to-maturity financial assets are recognised initially at fair value plus any directly attributable transaction costs. Subsequent to initial recognition held-to-maturity financial assets are measured at amortized cost using the effective interest method, less any impairment losses.
Any sale or reclassification of a more than an insignificant amount of held-to-maturity investments not close to their maturity would result in the reclassification of all held-to-maturity investments as available-for-sale, and prevent the company from classifying investment securities as held-to-maturity for the current and the following two financial years.
The Company does not have any financial assets designated as “held to maturity” as at the reporting date of financial assets.
3.3.1.4 Available-for-Sale Financial AssetsAvailable-for-sale financial assets are non-derivative financial assets that are designated as available for- sale and that are not classified in any of the previous categories of financial assets. Available-for-sale financial assets are recognised initially at fair value plus any directly attributable transaction costs.
Subsequent to initial recognition, these are measured at fair value and changes therein, other than impairment losses are recognised in other comprehensive income and presented within equity in the fair value reserve. When an investment is derecognised, the cumulative gain or loss in other comprehensive income is transferred to Profit or Loss.
Available-for-sale financial assets comprise of Treasury Bonds.
3.3.1.5 Cash and Cash EquivalentsCash and cash equivalents comprise of cash in hand and cash at banks and other highly liquid financial assets which are held for the purpose of meeting short-term cash commitments with original maturities of less than three months which are subject to insignificant risk of changes in their fair value.
Bank overdrafts that are repayable on demand and form an integral part of the Company cash management are included as a component of cash and cash equivalents for the purpose of the Statement of Cash Flows.
3.3.2 Financial Liabilities The Group initially recognises debt securities, deposits from customers and loans & borrowings on the date that they are originated. All other financial liabilities are recognised at initially on the trade date, which is the date that the Group becomes party to the contractual provisions of the instruments.
The Group derecognises a financial liability when its contractual obligations are discharged, cancelled or expired.
The Group classifies non-derivative financial liabilities into the other financial liabilities category. Such financial liabilities are recognised initially at fair value plus any directly attributable transaction cost. Subsequent to initial recognition, these financial liabilities are measured at amortized cost using effective interest rate method.
Other financial liabilities comprise of loans & borrowings, bank overdraft, customer deposits and trade and other payables.
3.3.3 Accounting for Non-derivative Financial Instruments
3.3.3.1 RecognitionThe Group initially recognises loans and advances, deposits, debt securities and subordinated liabilities on the date at which they are originated. All the financial assets and liabilities other than regular purchases and sales are recognised on the date the Group becomes a party to the contractual provisions of the instrument.
Notes to the Financial Statements

103Annual Report 2014/15
3.3.3.2 De-recognitionThe Group derecognises a financial asset when the contractual rights to the cash flows from the financial asset expires, or when it transfers the financial asset in a transaction in which substantially all the risks and rewards of ownership of the financial asset are transferred or in which the Group neither transfers nor retains substantially all the risks and rewards of ownership and it does not retain control of the financial asset. Any interest in transferred financial assets that qualify for de-recognition that is created or retained by the Group is recognised as a separate asset or liability in the statement of financial position. On de-recognition of a financial asset, the difference between the carrying amount of the asset (or the carrying amount allocated to the portion of the asset transferred), and the sum of
(i) the consideration received (including any new asset obtained less any new liability assumed) and
(ii) any cumulative gain or loss that had been recognised in other comprehensive income is recognised in Profit or Loss.
The Group enters into transactions whereby it transfers assets recognised on its statement of financial position, but retains either all or substantially all of the risks and rewards of the transferred assets or a portion of them. If all or substantially all risks and rewards are retained, then the transferred assets are not derecognised.
Transactions in which the Group neither retains nor transfers substantially all the risks and rewards of ownership of a financial asset and it retains control over the asset, the Group continues to recognise the asset to the extent of its continuing involvement, determined by the extent to which it is exposed to changes in the value of the transferred asset.
3.3.3.3 OffsettingFinancial assets and liabilities are offset and the net amount presented in the statement of financial position when, and only when, the Group has a legal right to offset the amounts and intends either to settle on a net basis or to realize the asset and settle the liability simultaneously.
3.3.3.4 Amortized cost measurementThe amortized cost of a financial asset or liability is the amount at which the financial asset or liability is measured
at initial recognition, minus principal repayments, plus or minus the cumulative amortization using the effective interest method of any difference between the initial amount recognised and the maturity amount, minus any reduction for impairment.
3.3.3.5 Fair value measurement Fair value is the amount for which an asset could be exchanged, or a liability settled, between knowledgeable, willing parties in an arm’s length transaction on the measurement date.
When available, the Company measures the fair value of an instrument using quoted prices in an active market for that instrument. A market is regarded as active if quoted prices are readily and regularly available and represent actual and regularly occurring market transactions on an arm’s length basis.
If a market for a financial instrument is not active, the Company establishes fair value using valuation techniques. Valuation techniques include using recent arm’s length transactions between knowledgeable, willing parties (if available), reference to the current fair value of other instruments that are substantially the same, discounted cash flow analyses and other equity pricing models.
The chosen valuation technique makes maximum use of market inputs, relies as little as possible on estimates specific to the Company, incorporates all factors that market participants would consider in setting a price, and is consistent with accepted economic methodologies for pricing financial instruments.
The best evidence of the fair value of a financial instrument at initial recognition is the transaction price, i.e. the fair value of the consideration given or received, unless the fair value of that instrument is evidenced by comparison with other observable current market transactions in the same instrument or based on a valuation technique whose variables include only data from observable markets. When transaction price provides the best evidence of fair value at initial recognition, the financial instrument is initially measured at the transaction price and any difference between this price and the value initially obtained from a valuation model is subsequently recognised in Statement of Financial Performance.

104Commercial Leasing & Finance PLC
ys;j;alu
Valuation of Financial InstrumentsThe Group measures the fair values using the following fair value hierarchy that reflects the significance of the inputs used in making the measurements.
Level 1 – Quoted market price (unadjusted) in an active market of an identical instrument.
Level 2 – Valuation techniques based on observable inputs, either directly (i.e., as prices) or indirectly (i.e., derived from prices), this category included instruments valued using: quoted market prices in active markets similar instruments; quoted prices for identical or similar instruments in markets are considered less than active: or other valuation techniques where all significant inputs are directly observable from market data.
Level 3 – Valuation techniques use significant unobservable inputs. This category includes all instruments where the valuation technique includes inputs not based on observable data and the unobservable inputs have a significant effect on the instrument’s valuation
This category includes instruments that are valued based on quoted prices for similar instruments where significant unobservable adjustments or assumptions are required to reflect differences between the instruments.
Fair values of financial assets and financial liabilities that are traded in active markets are based on quoted market prices or dealer price quotations. For all other financial instruments the Company determines fair values using valuation techniques
Valuation techniques include comparison to similar instruments for which market observable prices exist, other equity pricing models and other valuation models.
The objective of valuation techniques is to arrive at a fair value determination that reflects the price of the financial instruments at the reporting date that would have been determined by market participants acting at arm’s length.
The Group widely recognised valuation models for determining the fair value of common and more simple financial instruments. Observable prices and model inputs are usually available in the market for listed debt and equity securities. Availability of observable market inputs reduces the need of management judgment and estimation and also
reduces the uncertainty associated with determination of fair values. Availability of observable market prices and inputs varies depending on the products and markets are is prone to changes based on specific events and general conditions in the financial markets.
3.3.4 Impairment of Financial InstrumentsAt each reporting date the Company assesses whether there is objective evidence that financial assets not carried at fair value through Profit or Loss are impaired. A financial asset or a group of financial assets is (are) impaired when objective evidence demonstrates that a loss event has occurred after the initial recognition of the asset(s), and that the loss event has an impact on the future cash flows of the asset(s) that can be estimated reliably.
Objective evidence that financial assets (including equity securities) are impaired can include:
• significant financial difficulty of the borrower or issuer,
• default or delinquency by a borrower
• restructuring of a loan or advance by the Company on terms that the Company would not otherwise consider
• indications that a borrower or issuer will enter bankruptcy,
• the disappearance of an active market for a security
• other observable data relating to a group of assets such as adverse changes in the payment status of borrowers or issuers in the group of economic conditions that correlate with defaults in the group.
In addition, for an investment in an equity security, a significant or prolonged decline in its fair value below its cost is objective evidence of impairment.
Impairment of Financial Assets carried at Amortized CostThe Group considers evidence of impairment for loans and advances at both a specific and collective basis. All individually significant loans and advances and held-to-maturity investment securities are assessed for specific impairment. All individually significant loans and advances and held-to-maturity investment securities found not to be specifically impaired are then collectively assessed for any impairment that has been incurred but not yet identified.
Notes to the Financial Statements
105Annual Report 2014/15
Loans and advances that are not individually significant are collectively assessed for impairment by grouping them together with similar risk characteristics based on product types.
In assessing collective impairment the Group uses statistical modelling of historical trends of the probability of default, timing of recoveries and the amount of loss incurred, adjusted for management’s judgment as to whether current economic and credit conditions are such that the actual losses are likely to be greater or less than suggested by historical modelling, Default rates, loss rates and the expected timing of future recoveries are regularly taken into account to ensure that they remain appropriate.
Impairment losses on assets carried at amortized cost are measured as the difference between the carrying amount of the financial asset and the present value of estimated future cash flows discounted at the asset’s original effective interest rate. Impairment losses are recognised in Profit or Loss and reflected in an allowance account against loans and advances. Interest on impaired assets continues to be recognised through the unwinding of the discount. When a subsequent event causes the amount of impairment loss to decrease, the decrease in impairment loss is reversed through Profit or Loss.
Impairment of Financial Investments - Available for SaleImpairment losses on available-for-sale financial assets are recognised by reclassifying the losses accumulated in the fair value reserve in equity to profit or loss. The cumulative loss that is reclassified from equity to profit or loss is the difference between the acquisition cost, net of any principal repayment and amortisation, and the current fair value, less any impairment loss recognised previously in profit or loss. Changes in cumulative impairment losses attributable to application of the effective interest method are reflected as a component of interest income. If, in a subsequent period, the fair value of an impaired available-for-sale debt security increases and the increase can be related objectively to an event occurring after the impairment loss was recognised, then the impairment loss is reversed, with the amount of the reversal recognised in profit or loss. However, any subsequent recovery in the fair value of an impaired available-for-sale equity security is recognised in other comprehensive income.
In the case of equity investments classified as available for sale, objective evidence would also include a ‘significant’ or ‘prolonged’ decline in the fair value of the investment below its cost. Where there is evidence of impairment, the cumulative loss measured as the difference between the acquisition cost and the current fair value, less any impairment loss on that investment previously recognised in the Statement of Profit or Loss is removed from equity and recognised in the Statement of Profit or Loss Income. However, any subsequent recovery in the fair value of an impaired available-for-sale equity security is recognised in Other Comprehensive Income
Reversal of Impairment LossIf, in a subsequent period, the fair value of an impaired available-for-sale debt security increases and the increase can be objectively related to an event occurring after the impairment loss was recognised in Profit or Loss, the impairment loss is reversed, with the amount of the reversal recognised in Profit or Loss. However, any subsequent recovery in the fair value of an impaired available-for-sale equity security is recognised in Other Comprehensive Income. The Group writes off certain loans and advances and investment securities when they are determined to be uncollectible.
Stated capital Ordinary shares Ordinary shares are classified as equity. Incremental costs directly attributable to the issue of ordinary shares are recognised as a deduction from equity, net of any tax effects.
3.3.4.1 De-recognition of Financial Assets and Financial Liabilities
Financial AssetsFinancial assets (or, where applicable or a part of a financial asset or part of a group of similar financial assets) is derecognised when;
• The rights to receive cash flows from the asset have expired; or
• The Group has transferred its rights to cash flows from the asset or has assumed an obligation to pay the received cash flows in full without material delay to a third party under a ‘passthrough’ arrangement; and either:

106Commercial Leasing & Finance PLC
ys;j;alu
• the Group has transferred substantially all the risks and rewards of the assets, or
• the Group has neither transferred nor retained substantially all the risks and rewards of the asset, but has transferred control of the asset.
When the Group has transferred its rights to receive cash flow from an asset or has entered in to a pass through arrangement, and has neither transferred nor retained substantially all of the risks and rewards of the assets nor transferred control of it, the asset is recognised to the extent of the Group’s continuing involvement in it. In that case, the Group also recognises an associated liability. The transferred assets and the associated liabilities are measured on a basis that reflects the right and obligation that the Group has retained.
Continuing involvement that takes the form of a guarantee over the transferred asset is measured at the lower of the original carrying amount of the asset and the maximum amount of consideration that the Company could be required to repay.
Financial LiabilitiesA financial liability is derecognised when the obligation under liability is discharged or cancelled or expired. Where an existing financial liability is replaced by another from the same lender on substantially different terms, or the terms of an existing liability are substantially modified, such an exchange or modification is treated as a derecognition of the original liability and the recognition of a new liability, and the difference in the respective carrying amounts are recognised in the profit or loss.
3.4 Accounting for Derivative Financial InstrumentsDerivatives are initially recognised at fair value on the date on which a derivative contract is entered into and are subsequently re-measured at their fair value. Fair values are obtained from quoted market prices in active markets, or using valuation techniques. All derivatives are carried as assets when the fair value is positive and as liabilities when the fair value is negative.
3.4.1 Hedge accountingThe Group holds derivative financial instruments to hedge its foreign currency risk exposure. On initial designation of the derivative as the hedge instrument, the company formally documents the relationship between the hedging
instrument and hedged item, its risk management objective and its strategy in undertaking the hedge.
Central treasury documents the assessment, both at hedge inception and on an on-going basis, of whether or not the hedging instruments, primarily forward rate contracts, that are used in hedging transactions are highly effective in offsetting the changes attributable to the hedged risks in the fair values or cash flows of the hedged items.
Derivatives are recognised initially at fair value; any attributable transaction costs are recognised in profit or loss as incurred. Subsequent to initial recognition, derivatives are measured at fair value, and changes therein are accounted for as described below.
3.4.1.1 Cash flow hedgeWhen a derivative is designated as the hedging instrument in a hedge of the variability in cash flows attributable to a particular risk associated with a recognised asset or liability or a highly probable forecast transaction that could affect profit or loss, the effective portion of changes in the fair value of the derivative is recognised in other comprehensive income and presented in the hedging reserve in equity. Any ineffective portion of changes in the fair value of the derivative is recognised immediately in profit or loss.
When the hedged item is a non-financial asset, the amount accumulated in equity is retained in other comprehensive income and reclassified to profit or loss in the same period or periods during which the non-financial item affects profit or loss. In other cases as well, the amount accumulated in equity is reclassified to profit or loss in the same period that the hedged item affects profit or loss.
If the hedging instrument no longer meets the criteria for hedge accounting, expires or is sold, terminated or exercised, or the designation is revoked, then hedge accounting is discontinued prospectively. If the forecast transaction is no longer expected to occur, then the balance in equity is reclassified to profit or loss.
3.4.1.2 Hedge Effectiveness TestingTo qualify for hedge accounting, at the inception of the hedge and throughout its life, each hedge must be expected to be highly effective and demonstrate actual effectiveness on an on-going basis. The documentation of each hedging relationship sets out how the effectiveness of the hedge is assessed.
Notes to the Financial Statements

107Annual Report 2014/15
The method adopted by the Company to assess hedge effectiveness is based on its risk management strategy. For expected effectiveness, the hedging instrument must be expected to be highly effective in offsetting changes in cash flows attributable to the hedged risk during the period for which the hedge is designated. For actual effectiveness to be achieved, the changes in fair value or cash flows must offset each other in the range of 80% to 125%. The ineffective portion of will be recognised immediately in income statement. In measuring the effectiveness the forecasted transaction of entering into another forward contract is also taken into consideration.
3.4.2 Other non-trading derivatives (Derivatives that do not qualify for Hedge Accounting)
When a derivative financial instrument is not designated in a hedge relationship that qualifies for hedge accounting, all changes in its fair value are recognised immediately in profit or loss.
3.4.2.1 Reclassification of Financial InstrumentsThe Group reclassifies non-derivative financial assets out of the ‘held for trading’ category and into the ‘available-for-sale’, ‘loans and receivables’ or ‘held to maturity’ categories as permitted by LKAS 39. Further, in certain circumstances, the Group is permitted to reclassify financial instruments out of the ‘available-for-sale’ category and into the ‘loans and receivables’ category. Reclassifications are recorded at fair value at the date of reclassification, which becomes the new amortised cost.
For a financial asset with a fixed maturity reclassified out of the ‘available-for-sale’ category, any previous gain or loss on that asset that has been recognised in equity is amortised to Profit or Loss over the remaining life of the investment using the EIR. Any difference between the new amortised cost and the expected cash flows is also amortised over the remaining life of the asset using EIR. In the case of a financial asset does not have a fixed maturity, the gain or loss is recognised in the Profit or Loss when such a financial asset is sold or disposed of. If the financial asset is subsequently determined to be impaired, then the amount recorded in equity is recycled to the Statement of Profit or Loss .
The group may reclassify a non-derivative trading asset out of the ‘held for trading’ category and into the ‘loans and receivables’ category if it meets the definition of loans and receivables and the Group has the intention and ability to hold the financial asset for the foreseeable future or until maturity. If a financial asset is reclassified, and if the Group
subsequently increases its estimates of future cash receipts as a result of increased recoverability of those cash receipts, the effect of that increase is recognised as an adjustment to the EIR from the date of the change in estimate. Reclassification is at the election of management, and is determined on an instrument-by-instrument basis.
3.5 Investment Properties3.5.1 Basis of RecognitionInvestment property is the property held either to earn rental income or for capital appreciation or for both, but not for sale in the ordinary course of business, use in the production or supply of goods or services or for administrative purposes.
3.5.2 Basis of Measurement3.5.2.1 Fair value ModelInvestment properties are initially recognised at cost. Subsequent to initial recognition the investment properties are stated at fair values, which reflect market conditions at the reporting date. Gains or losses arising from changes in fair value are included in the Statement of Profit or Loss in the year in which they arise.
Where Group companies occupy a significant portion of the investment property of a subsidiary, such investment properties are treated as property, plant and equipment in the Consolidated Financial Statements, and accounted for as per LKAS 16- Property, Plant and Equipment.
3.5.2.2 De-recognition Investment properties are de-recognised when either they have been disposed of or when the investment property is permanently withdrawn from use and no future economic benefit is expected from its disposal. Any gains or losses on the retirement or disposal of an investment property are recognised in the Statement of Profit or Loss in the year of retirement or disposal.
3.5.2.3 Subsequent Transfers to/from Investment PropertyTransfers are made to investment property when, and only when, there is a change in use, evidenced by the end of owner occupation, commencement of an operating lease to another party or completion of construction or development.
Transfers are made from investment property when, and only when, there is a change in use, evidenced by commencement of owner occupation or commencement of development with a view to sale.

108Commercial Leasing & Finance PLC
ys;j;alu
For a transfer from investment property to owner occupied property or inventories, the deemed cost of property for subsequent accounting is its fair value at the date of change in use. If the property occupied by the Company as an owner occupied property becomes an investment property, the Company, accounts for such property in accordance with the policy stated under property, plant and equipment up to the date of change in use.
For a transfer from inventories to investment property, any difference between the fair value of the property at that date and its previous carrying amount is recognised in the Statement of Profit or Loss . When the Company completes the construction or development of a self-constructed investment property, any difference between the fair value of the property at that date and its previous carrying amount is recognised in the Statement of Profit or Loss .
3.5.2.4 Determining Fair Value External and independent valuer, having appropriate recognised professional qualifications and recent experience in the location and category of property being valued, values the investment property portfolio as at each reporting date. In financial periods within that period the fair value is determined by the Board of Directors.
The fair values are based on market values, being the estimated amount for which a property could be exchanged on the date of the valuation between a willing buyer and a willing seller in an arm’s length transaction after proper marketing wherein the parties had each acted knowledgeably.
3.6 Property, Plant and Equipment 3.6.1 Freehold Property, Plant & Equipment3.6.1.1 Basis of Recognition Property, plant and equipment are recognised if it is probable that future economic benefits associated with the asset will flow to the Company and cost of the asset can be reliably measured.
3.6.1.2 Basis of MeasurementItems of property, plant and equipment are measured at cost/revaluation less accumulated depreciation and accumulated impairment losses.
Cost includes expenditure that is directly attributable to the acquisition of the asset. The cost of self-constructed assets includes the cost of materials and direct labour, any other
costs directly attributable to bringing the assets to a working condition for their intended use, the costs of dismantling and removing the items and restoring the site at which they are located and capitalized borrowing costs.
Purchased software that is integral to the functionality of the related equipment is capitalized as part of that equipment.
When parts of an item of property, plant and equipment have different useful lives, they are accounted for as separate items of property, plant and equipment.
3.6.1.3 Cost ModelThe Company applies the cost model to all property, plant and equipment except freehold land and buildings; which records at cost of purchase together with any incidental expenses thereon less any accumulated depreciation and accumulated impairment losses if any.
3.6.1.4 Revaluation ModelThe Company revalues its land and buildings which are measured at its fair value at the date of revaluation less any subsequent accumulated depreciation and accumulated impairment losses. Revaluations are made with sufficient regularity to ensure that the carrying amount does not differ materially from that which would be determined using fair value at the reporting date.
On revaluation of lands and buildings, any increase in the revaluation amount is credited to the revaluation reserve through other comprehensive income in shareholder’s equity unless it off sets a previous decrease in value of the same asset that was recognised in the Statement of Profit or Loss . A decrease in value is recognised in the Statement of Profit or Loss where it exceeds the increase previously recognised in the revaluation reserve. Upon disposal, any related revaluation reserve is transferred from the revaluation reserve to retained earnings and is not taken into account in arriving at the gain or loss on disposal.
3.6.1.5 Subsequent Cost Subsequent expenditure is capitalised only when it is probable that the future economic benefits associated with the expenditure will flow to the Company. Ongoing repairs and maintenance are expensed as incurred.
3.6.1.6 Reclassification to investment propertyWhen the use of a property changes from owner-occupied to investment property, the property is re-measured to fair
Notes to the Financial Statements

109Annual Report 2014/15
value and reclassified as investment property. Any gain arising on re-measurement is recognised in Profit or Loss to the extent that it reverses a previous impairment loss on the specific property, with any remaining gain recognised and presented in the revaluation reserve in equity. Any loss is recognised immediately in Profit or Loss.
3.6.1.7 Depreciation Depreciation is based on the cost of an asset less its residual value. Significant components of individual assets are assessed and if a component has a useful life that is different from the remainder of that asset, that component is depreciated separately.
Depreciation is recognised in Profit or Loss on a straight-line basis over the estimated useful life of each component of an item of property, plant and equipment. Leased assets are depreciated over the shorter of the lease term and their useful lives unless it is reasonably certain that the Company will obtain ownership by the end of the lease term. Lands are not depreciated.
Depreciation of an asset begins when it is available for use and ceases at the earlier of the date that the asset is classified as held for sale and the date that the asset is de-recognised.
Depreciation methods, useful life values are assessed at the reporting date. The estimated useful lives for the current year are as follows:
Free-hold building 40 yearsFixtures 05 yearsOffice Furniture 05 yearsOffice Equipment 05 yearsFree-hold motor Vehicles 04 yearsComputer Equipment 05 years
3.6.1.8 De-recognitionAn item of property, plant and equipment is de-recognised upon disposal or when no future economic are expected from its use or disposal.
The gain or loss on disposal of an item of property, plant and equipment is determined by comparing the proceeds from disposal with the carrying amount of the property, plant and equipment, and is recognised net within other income/other expenses in the Statement of Profit or Loss . When revalued assets are sold, the amounts included in the revaluation surplus reserve are transferred to retained earnings.
3.6.2 Operating Lease AssetsWhen acting as lessor, the Company includes the assets subject to operating leases in ‘Property, Plant and Equipment’ and accounts for them accordingly. Impairment losses are recognised to the extent that residual values are not fully recoverable and the carrying value of the assets is thereby impaired.
3.6.3 Capital Work-in-ProgressCapital work-in-progress represents the accumulated cost of materials and other costs directly related to the construction of an asset. Capital work in progress is transferred to the respective asset accounts at the time it is substantially completed and ready for its intended use.
3.7 Impairment of Non-financial AssetsThe carrying amounts of the Company’s non-financial assets are reviewed at each reporting date to determine whether there is any indication of impairment. If any such indication exists, then the asset’s recoverable amount is estimated. An impairment loss is recognised if the carrying amount of an asset or its related Cash-Generating Unit (CGU) exceeds its estimated recoverable amount.
The Company’s corporate assets do not generate separate cash inflows and are utilized by more than one CGU. Corporate assets are allocated to CGUs on a reasonable and consistent basis and tested for impairment as part of the testing of the CGU to which the corporate asset is allocated.
Impairment losses are recognised in Profit or Loss. Impairment losses recognised in respect of CGUs are allocated first to reduce the carrying amount of any goodwill allocated to the CGU (group of CGUs), and then to reduce the carrying amounts of the other assets in the CGU (group of CGUs) on a pro rata basis.
An impairment losses recognised in prior periods are assessed at each reporting date for any indications that the loss has decreased or no longer exists. An impairment loss is reversed if there has been a change in the estimates used to determine the recoverable amount. An impairment loss is reversed only to the extent that the asset’s carrying amount does not exceed the carrying amount that would have been determined, net of depreciation, if no impairment loss had been recognised.
110Commercial Leasing & Finance PLC
ys;j;alu
3.8 Tax expenseTax expense comprises current, deferred tax and other statutory taxes. Income tax and deferred tax expense is recognised in Statement of Profit or Loss except to the extent that it relates to items recognised in the Statement of Other Comprehensive Income or Statement of Changes in equity.
3.8.1 Current tax expenseCurrent tax is the expected tax payable or recoverable on the taxable income or loss for the year, using tax rates enacted or substantively enacted at the reporting date, and any adjustment to tax payable in respect of previous years. Current tax payable also includes any tax liability arising from the tax on dividend income.
The provision for income tax is based on the elements of income and expenditure as reported in the Financial Statements and computed in accordance with the provisions of the Inland Revenue Act. No 10 of 2006 and subsequent amendments thereto.
Current tax assets and liabilities for the current and prior periods are measured at the amount expected to be recovered from or paid to the Commissioner General of Inland Revenue.
3.8.2 Deferred taxDeferred tax is recognised in respect of temporary differences between the carrying amounts of assets and liabilities for financial reporting purposes and the amounts used for taxation purposes. Deferred tax is not recognised for:
• temporary differences on the initial recognition of assets or liabilities in a transaction that is not a business combination and that affects neither accounting nor taxable profit or loss;
• Temporary differences related to investments in subsidiaries and jointly controlled entities to the extent that it is probable that they will not reverse in the foreseeable future; and
• Taxable temporary differences arising on the initial recognition of goodwill.
• Taxable temporary differences arising on subsidiaries, associates or joint ventures who have not distributed their entire profits to the parent or investor.
Deferred tax is measured at the tax rates that are expected to be applied to temporary differences when they reverse, based on the laws that have been enacted or substantively enacted by the reporting date.
Deferred tax assets and liabilities are offset if there is a legally enforceable right to offset current tax liabilities and assets, and they relate to income taxes levied by the same tax authority on the same taxable entity, or on different tax entities, but they intend to settle current tax liabilities and assets on a net basis or their tax assets and liabilities will be realized simultaneously.
A deferred tax asset is recognised for unused tax losses, tax credits and deductible temporary differences, to the extent that it is probable that future taxable profits will be available against which they can be utilized. Deferred tax assets are reviewed at each reporting date and are reduced to the extent that it is no longer probable that the related tax benefit will be realized.
Deferred tax assets and liabilities are not discounted.
The net increase in the carrying amount of deferred tax liability net of deferred tax asset is recognised as deferred tax expense and conversely any net decrease is recognised as reversal to deferred tax expense, in the Statement of Profit or Loss .
3.8.3 Withholding Tax on DividendsDividend distributed out of taxable profit of the local companies attracts a 10% deduction at source and is not available for set off against the tax liability of the Company. Withholding tax that arises from the distribution of dividends by the Company is recognised at the same time as the liability to pay the related dividend is recognised.
3.8.4 Economic Service Charge (ESC)As per the provisions of Economic Service Charge Act No. 13 of 2006 and subsequent amendments thereto, ESC is payable on the liable turnover at specified rates. ESC is deductible from the income tax liability. Any unclaimed amount can be carried forward and set off against the income tax payable in the five subsequent years as per the relevant provision in the Act.
3.8.5 Nation Building Tax (NBT)As per the provisions of the Nation Building Tax Act, No. 9 of 2009 and the subsequent amendments thereto, Nation
Notes to the Financial Statements

111Annual Report 2014/15
Building Tax should be payable at the rate of 2% with effect from 1 January 2011 on the liable turnover as per the relevant provisions of the Act.
3.8.6 Value Added Tax on Financial Services (VAT on FS)
VAT on Financial Services is calculated in accordance with the amended VAT Act No. 7 of 2003 and subsequent amendments thereto. The base for the computation of VAT on Financial Services is the accounting profit before income tax adjusted for the economic depreciation and emoluments of employees. VAT on financial services is computed on the prescribed rate of 11%.
The VAT on Financial service is recognised as expense in the period it becomes due.
3.8.7 Crop Insurance Levy (CIL)As per the provisions of the Section 14 of the Finance Act No. 12 of 2013, the CIL was introduced with effect from April 01, 2013 and is payable to the National Insurance Trust Fund. Currently, the CIL is payable at 1% of the profit after tax.
3.8.8 Borrowing CostsBorrowing costs that are directly attributable to the acquisition, construction or production of qualifying assets that take a substantial period of time to get ready for its intended use or sale, are capitalized as part of the assets.
Borrowing costs that are not directly attributable to the acquisition, construction or production of a qualifying asset are recognised in Profit or Loss using the effective interest method.
3.8.9 Other Non-Financial Liabilities and ProvisionsLiabilities are recognised in the Statement of Financial Position when there is a present obligation as a result of a past event, the settlement of which is expected to result in an outflow of resources embodying economic benefits. Obligations payable at the demand of the creditor within one year of the reporting date are treated as current liabilities. Liabilities payable after one year from the reporting date are treated as non-current liabilities.
3.8.10 Deposits due to CustomersDeposits include term deposits and certificates of deposits. They are stated in the Statement of Financial Position at amount payable. Interest paid / payable on these deposits
based on effective interest rate is charged to the Statement of Profit or Loss .
3.8.11 Deposit Insurance Scheme In terms of the Finance Companies Direction No 2 of 2010 “Insurance of Deposit Liabilities” issued on 27th September 2010, all Registered Finance Companies are required to insure their deposit liabilities in the Deposit Insurance Scheme operated by the Monetary Board in terms of Sri Lanka Deposit Insurance
Scheme Regulations No 1 of 2010 issued under Sections 32A to 32E of the Monetary Law Act with effect from 1st October 2010.
• Deposits to be insured include time and savings deposit liabilities and exclude the following.
• Deposit liabilities to member institutions
• Deposit liabilities to Government of Sri Lanka
• Deposit liabilities to shareholders, directors, key management personnel and other related parties as defined in Finance Companies Act Direction No 03 of 2008 on Corporate Governance of Registered Finance Companies
• Deposit liabilities held as collateral against any accommodation granted
• Deposit liabilities falling within the meaning of dormant deposits in terms of the Finance Companies Act, funds of which have been transferred to Central Bank of Sri Lanka
Registered Finance Companies are required to pay a premium of 0.15% on eligible deposit liabilities as at end of the month to be payable within a period of 15 days from the end of the respective month.
3.9 Debt Securities IssuedThese represent the funds borrowed by the Group for long-term funding requirements. Subsequent to initial recognition debt securities issued are measured at their amortised cost using the effective interest method, except where the Group designates debt securities issued at fair value through profit or loss. Interest paid/payable is recognised in profit or loss.

112Commercial Leasing & Finance PLC
ys;j;alu
3.10 Other LiabilitiesOther liabilities are recorded at amounts expected to be payable at the Reporting date.
3.11 Employee Benefits3.11.1 Defined Contribution Plans A Defined Contribution Plan is a post-employment benefit plan under which an entity pays fixed contributions into a separate entity and will have no legal or constructive obligation to pay further amounts. Obligations for contributions to Defined Contribution Plans are recognised as an employee benefit expense in the Statement of Profit or Loss in the periods during which services are rendered by employees.
3.11.1.1 Employees’ Provident Fund (EPF)The Company and employees contribute 12% and 8% respectively on the salary of each employee to the above mentioned funds.
3.11.1.2 Employees’ Trust Fund (ETF)The Company contributes 3% of the salary of each employee to the Employees’ Trust Fund.
3.11.2 Defined Benefits Plans A defined benefit plan is a post-employment benefit plan other than a defined contribution plan. The Group’s net obligation in respect of defined benefit pension plans is calculated by estimating the amount of future benefit that employees have earned in return for their service in the current and prior periods; that benefit is discounted to determine its present value. Any unrecognised past service costs are deducted.
The calculation is performed every three years by a qualified actuary using the projected unit credit method. For the purpose of determining the charge for any period before the next regular actuarial valuation falls due, an approximate estimate provided by the qualified actuary is used.
When the benefits of a plan are improved, the portion of the increased benefit related to past service by employees is recognised in Profit or Loss on a straight-line basis over the average period until the benefits become vested. To the extent that the benefits vest immediately, the expense is recognised immediately in Profit or Loss.
The Group recognises all actuarial gains and losses arising from the defined benefit plan in other comprehensive income (OCI) and all other expenses related to defined benefit plans are recognise as personnel expenses in Statement of Profit or Loss . This retirement benefit obligation is not externally funded.
However, according to the Payment of Gratuity Act No.12 of 1983, the liability for the gratuity payment to an employee arises only on the completion of 5 years of continued service with the Company.
3.11.3 Short-term Employee BenefitsShort-term employee benefit obligations are measured on an undiscounted basis and are expensed as the related service is provided. A liability is recognised for the amount expected to be paid under short-term cash bonus if the company has a present legal or constructive obligation to pay this amount as a result of past service provided by the employee, and the obligation can be estimated reliably.
3.12 Provisions, Contingent Assets and Contingent Liabilities
Provisions are made for all obligations (legal or constructive) existing as at the reporting date when it is probable that such an obligation will result in an outflow of resources and a reliable estimate can be made of the quantum of the outflow. The amount recognised is the best estimate of the consideration required to settle the present obligation at the reporting date, taking into account the risks and uncertainties surrounding the obligation at that date.
All contingent liabilities are disclosed as a note to the Financial Statements unless the outflow of resources is remote. Contingent assets are disclosed, where inflow of economic benefit is probable.
Statement of Profit or Loss and Other Comprehensive Income
3.13 Revenue RecognitionRevenue is recognised to the extent that it is probable that the economic benefits will flow to the Group, and the revenue and associated costs incurred or to be incurred can be reliably measured. Revenue is measured at the fair value of the consideration received or receivable, taking into account contractually defined terms of payment.
Notes to the Financial Statements

113Annual Report 2014/15
3.13.1 Interest Income on Leases, Hire Purchases, Micro Finance and Loans and Advances
Interest income and expense are recognised in Profit or Loss using the effective interest method. The effective interest rate is the rate that exactly discounts the estimated future cash payments and receipts through the expected life of the financial asset or liability (or, where appropriate, a shorter period) to the carrying amount of the financial asset or liability. When calculating the effective interest rate, the Group estimates future cash flows considering all contractual terms of the financial instrument, but not future credit losses.
The calculation of the effective interest rate includes all transaction costs and fees paid or received that are an integral part of the effective interest rate. Transaction costs include incremental costs that are directly attributable to the acquisition or issue of a financial asset or liability.
Interest income and expense presented in the Statement of Profit or Loss includes,
• interest on financial assets and financial liabilities measured at amortized cost calculated on an effective interest basis
• interest on available for sale investment securities calculated on an effective interest basis
Interest income and expense on all trading assets and liabilities are considered to be incidental to the Company’s trading operations and are presented together with all other changes in the fair value of trading assets and liabilities in net trading income.
Fair value changes on other derivatives held for risk management purposes, and other financial assets and liabilities carried at fair value through Profit or Loss, are presented in net income from other financial instruments at fair value through Profit or Loss in the Statement of Profit or Loss .
The excess of aggregated contract receivable over the cost of the assets constitutes the total unearned income at the commencement of a contract. The unearned income is recognised as income over the term of the facility commencing with the month that the facility is executed in proportion to the declining receivable balance, so as to produce a constant periodic rate of return on the net investment.
Collection on service charge from micro finance facilities are accounted on cash basis.
3.13.2 Fees and Other IncomeFees and commission income and expense that are integral to the effective interest rate on a financial asset or liability are included in the measurement of the effective interest rate.
Other fees and commission income, including account servicing fees are recognised as the related services are performed.
Profit or loss on contracts terminated, collections on contracts written off, interest on overdue rentals, interest on revolving loans, interest earned on property sale and buy back agreements are accounted for on cash basis
3.13.3 Net income from other financial instruments at fair value through Profit or Loss
Net income from other financial instruments at fair value through Profit or Loss relates to non-trading derivatives held for risk management purposes that do not form part of qualifying hedge relationships and financial assets and liabilities designated at fair value through Profit or Loss, and include all realized and unrealized fair value changes, interest, dividends and foreign exchange differences.
3.13.4 Factoring IncomeRevenue is derived from two sources, Funding and providing Sales Ledger Related Services.
Funding - Discount income relating to factoring transactions is recognised at the end of a given accounting month. In computing this discount, a fixed rate agreed upon at the commencement of the factoring agreement is applied on the daily balance in the client’s current account.
Sales Ledger Related Services - A service charge is levied as stipulated in the factoring agreement.
Income is accounted for on an accrual basis and deemed earned on disbursement of advances for invoices factored.
The above revenue components are accounted on an accrual basis.

114Commercial Leasing & Finance PLC
ys;j;alu
3.13.5 Other IncomeRent income and non-operational interest income are accounted for on accrual basis.
Dividend income is recognised when the right to receive payment is established.
Gain on disposal of property, plant and equipment and other non-current assets, including investments held by the Group have been accounted for in the Statement of Profit or Loss Income, after deducting from the net sales proceeds on disposal of the carrying amount of such assets.
3.13.6 Rental IncomeRental income from investment property is recognised in Profit or Loss on a straight-line basis over the term of the lease. Lease incentives granted are recognised as an integral part of the total rental income, over the term of the lease. Rental income from subleased property is recognised as other income.
3.14 Expenses RecognitionExpenses are recognised in the Statement of Profit or Loss on the basis of a direct association between the cost incurred and the earning of specific items of income. All expenditure incurred in the running of the business and in maintaining the property, plant & equipment in a state of efficiency has been charged to income in arriving at the profit for the year.
For the presentation of the Statement of Profit or Loss the Directors are of the opinion that the nature of the expenses method present fairly the element of the Company’s performance, and hence such presentation method is adopted.
3.15 Earnings per ShareThe Group presents basic earnings per share data for its ordinary shares. Basic earnings per share is calculated by dividing the Profit or Loss attributable to ordinary shareholders of the Group by the weighted average number of ordinary shares outstanding during the year.
3.16 Cash Flow StatementThe Cash Flow Statement has been prepared using the ‘Indirect Method’ of preparing Cash Flows in accordance with the Sri Lanka Accounting Standard 7 ‘Cash Flow Statements.’ Cash and cash equivalents comprise short term,
highly liquid investments that are readily convertible to known amounts of cash and are subject to an insignificant risk of changes in value.
Cash and cash equivalents comprise of cash in hand and cash at banks and other highly liquid financial assets which are held for the purpose of meeting short-term cash commitments with original maturities of less than three months which are subject to insignificant risk of changes in their fair value.
3.17 Movement of Reserves Movement of Reserves is disclosed in the Statement of Changes in Equity.
3.18 Related Party TransactionsTransactions with related parties are conducted on normal business terms. The relevant disclosures are given in Notes 39 to the Financial Statements.
3.19 Transactions with Related PartiesThe Company carries out transactions in the ordinary course of its business with parties who are defined as related parties in Sri Lanka Accounting Standard 24.
3.19.1 Transactions with Key Management PersonnelAccording to Sri Lanka Accounting Standard 24 “Related Party Disclosures”, Key management personnel, are those having authority and responsibility for planning, directing and controlling the activities of the entity. Accordingly, the company has pre-defined approved list of key management personnel.
The immediate family member is defined as spouse or dependent. Dependent is defined as anyone who depends on the respective Key Management Personnel for more than 50% of his/her financial needs.
3.20 Operating SegmentsAn operating segment is a component of the Company that engages in business activities from which it may earn revenues and incur expenses, including revenues and expenses that relate to transactions with any of the Company’s other components. All operating segments operating results are reviewed regularly by Board of Directors of the Company to make decisions about resources to be allocated to the segment and to assess its performance, and for which discrete financial information is available.
Notes to the Financial Statements

115Annual Report 2014/15
Accordingly, the segment comprises of financial services are described in Note 45.
Segment results, assets and liabilities include items directly attributable to a segment as well as those that can be allocated on a reasonable basis. Segment capital expenditure is the total cost incurred during the period to acquire segment assets that are expected to be used for more than one period.
Expenses that cannot be directly identified to a particular segment are allocated on bases decided by the management and applied consistently throughout the year.
3.21 Subsequent Events All material subsequent events have been considered and where appropriate adjustments or disclosures have been made in the respective Notes to the Financial Statements.
3.22 Commitments and ContingenciesAll discernible risks are accounted for in determining the amount of all known liabilities. Contingent Liabilities are possible obligations whose existence will be confirmed only by uncertain future events or present obligations where the transfer of economic benefit is not probable or cannot be reliably measured. Contingent Liabilities are not recognised in the statement of financial position but are disclosed unless they are remote.
3.23 Capital Management The Board of Directors monitors the return on capital investment on a month basis. This review is mainly carried out through return on investment analysis prepared on a quarterly basis. The plan forecasts are also reviewed on a monthly basis to ensure that targets are met in order to manage the capital invested on the Company.
The Board of Directors also decides and monitors the level of dividends to ordinary shareholders. The Company does not subject to any externally impose capital requirements. However companies within the group have such requirement based on the industry in which such company established. The group companies which require externally imposed capital will monitor such requirement on a regular basis and report to respective legal authority in order to ensure compliance with such regulatory requirement.

116Commercial Leasing & Finance PLC
ys;j;alu
Group Company
For the year ended 31st March 2015 2015 2014
Rs. Rs. Rs.
4 INTEREST INCOME
Interest income on -
Finance Lease 2,828,721,955 2,820,335,073 3,162,956,843
Hire Purchase 132,104,916 122,103,528 495,423,571
Loans and Advances 3,746,080,144 3,450,943,098 2,645,629,956
Hire rentals 17,510,651 17,510,651 14,045,763
Overdue Rental 539,867,806 536,033,670 445,595,317
Factoring 521,283,619 521,283,619 694,703,244
Rentals & sales proceeds - contracts written off 121,479,855 121,479,855 55,842,758
7,907,048,946 7,589,689,494 7,514,197,452
5 INTEREST ExPENSE
Interest on other financial liabilities due to customers 897,198,422 889,576,569 625,573,069
Interest on commercial papers and promissory notes - - 2,505,044
Interest on bank overdrafts and other short-term borrowings 274,940,652 274,940,652 805,850,937
Interest on long term borrowings 976,635,835 941,180,811 1,227,550,930
Interest on securitisation 241,408,944 241,408,944 326,936,821
Costs incidental to obtaining loans 58,996,159 58,996,159 50,673,326
2,449,180,012 2,406,103,135 3,039,090,127
6 OTHER INCOME
Dividend Income 4,236,044 4,236,044 141,199
Interest received from government securities 183,699,558 183,908,189 69,633,271
Interest income on commercial papers and fixed deposits 100,177,420 100,165,637 5,691,938
Gain on disposal of property, plant and equipment 202,506,668 849,080 1,814,277
Appreciation in market value of quoted investments 13,276,230 13,276,230 (6,826,019)
Supplier commissions/Admin fees - - 229,900
Administration fees - Lanka ORIX Finance PLC - - 1,007,483
Documentation fees 118,118,315 118,118,315 102,709,147
Staff loan interest 16,052,403 15,949,749 17,405,549
Commission Income 57,522,388 57,522,388 41,563,285
Three wheeler handling fees - - 2,437,100
Sundry income 36,113,950 31,896,047 16,922,054
Foreign exchange gain / (loss) 53,609,965 52,960,907 -
Rental income 2,700,042 - -
788,012,983 578,882,586 252,729,184
Notes to the Financial Statements

117Annual Report 2014/15
Group Company
For the year ended 31st March 2015 2015 2014
Rs. Rs. Rs.
7 ALLOWANCE FOR IMPAIRMENT AND WRITE OFFS
Lease receivables 620,134,912 611,884,101 513,928,739
Hire purchases 90,841,891 77,230,687 38,456,995
Advances & loans 387,240,970 376,108,730 227,388,788
Factoring 213,569,261 213,569,261 351,675,520
Insurance Receivables 38,937,826 38,937,826 -
Available-for-sale investment securities 200,000 - -
1,350,924,860 1,317,730,605 1,131,450,042
8 DEPRECIATION AND AMORTIzATION
Depreciation of property, plant and equipment (Note 26) 102,960,860 95,379,925 54,545,531
Written off of intangible assets (Note 26.6) 27,633,127 - -
130,593,987 95,379,925 54,545,531
9 RESULT FROM OPERATING ACTIVITIES
Profit from ordinary activities before VAT on financial services, NBT and tax stated after charging all expenses including the following:
Directors' fees & Emoluments 32,701,110 32,701,110 24,025,332
Auditors' remuneration - statutory audit 1,675,000 1,125,000 1,025,000
- audit related services 1,280,000 800,000 725,000
Depreciation on Property Plant & Equipment 102,960,860 95,379,925 54,545,531
Legal and professional expenses 14,455,151 14,045,211 38,414,936
Personnel costs (Note 9.1) 845,451,266 723,426,263 571,069,725
9.1 Personnel Costs
Salaries and other benefits 770,793,783 669,830,669 526,927,919
Defined contribution plan cost - EPF 51,797,237 35,028,911 29,839,886
- ETF 11,194,299 8,757,228 7,462,971
Defined benefit plan costs - retiring gratuity 11,665,947 9,809,455 6,838,949
845,451,266 723,426,263 571,069,725

118Commercial Leasing & Finance PLC
ys;j;alu
Group Company
For the year ended 31st March 2015 2015 2014
Rs. Rs. Rs.
10 VALUE ADDED TAx ON FINANCIAL SERVICES AND NBT
Value added tax on financial services 174,843,802 153,580,648 115,162,815
Nation Building tax on financial services 15,557,997 15,557,997 3,952,965
190,401,799 169,138,645 119,115,780
11 INCOME TAx ExPENSE
Current tax expense (Note 11.1) 475,659,283 442,807,082 246,623,512
Deferred tax (reversal) / charge (Note 33.3) (159,776,870) (140,567,429) 106,171,606
Current income tax expense 315,882,413 302,239,653 352,795,118
The Company is liable for tax at the rate of 28% on its taxable income in accordance with the Inland Revenue Act No 10 of 2006 and subsequent amendments made thereon.
11.1 Current Tax Expense
Current year income tax expense on ordinary activities (Note 11.2) 472,974,193 441,158,352 204,660,899
Under provision of taxes in respect of previous years 2,685,090 1,648,730 41,962,613
475,659,283 442,807,082 246,623,512
11.2 Numerical Reconciliation of accounting profits to income tax expense,
Accounting profit before income tax 1,908,891,356 1,728,260,972 1,288,754,009
Aggregate disallowable expenses 8,262,579,160 8,000,522,847 6,643,793,532
Aggregate tax deductible expenses (8,482,276,969) (8,153,218,275) (7,201,615,760)
Taxable profit 1,689,193,547 1,575,565,544 730,931,781
Income tax at 28 % 472,974,193 441,158,352 204,660,899
Current income tax expense 472,974,193 441,158,352 204,660,899
11.3 Deferred tax has been computed using the enacted tax rate of 28%
Notes to the Financial Statements

119Annual Report 2014/15
Group Company
For the year ended 31st March 2015 2015 2014
Rs. Rs. Rs.
12 EARNINGS PER SHARE
Amount Used as the Numerator
Net profit attributable to equity holders of the Company 1,593,008,943 1,426,021,319 935,958,891
Number of Ordinary Shares Used as the Denominator
Weighted average number of ordinary shares in issue (shares) 6,377,711,170 6,377,711,170 6,377,711,170
Earnings per Share 0.25 0.22 0.15
Basic earnings per share is calculated by dividing the net profit for the year attributable to the ordinary shareholders by the weighted average number of ordinary shares outstanding during the year.
Group Company
As at 31st March 2015 Rs.
2015 Rs.
2014 Rs.
13 CASH AND CASH EqUIVALENTS
Components of Cash Equivalents
13.1 Favourable Cash & Cash Equivalent Balances
Cash in hand 21,738,589 20,161,552 13,212,011
Cash in saving account - - 27,095
Investment in REPO 88,700,000 - -
Balances with banks 529,277,924 495,518,243 723,119,318
639,716,513 515,679,795 736,358,424
13.2 Unfavourable Cash & Cash Equivalent Balances
Bank overdraft (1,326,488,496) (1,310,844,519) (655,802,303)
Total cash and cash equivalents in the cash flow statement (686,771,983) (795,164,724) 80,556,121

120Commercial Leasing & Finance PLC
ys;j;alu
Group Company
As at 31st March 2015 2015 2014
Rs. Rs. Rs.
14 FINANCIAL ASSETS HELD FOR TRADING
Equity shares (Note 14.1) 228,344,666 228,344,666 215,068,436
228,344,666 228,344,666 215,068,436
14.1 Equity Shares
Balance as at beginning of the year 215,068,436 215,068,436 5,090,543
Investments made during the period - - 216,803,911
Marked to market adjustments 13,276,230 13,276,230 (6,826,019)
Balance as at end of the year 228,344,666 228,344,666 215,068,436
Group Company
14.2 Equity shares - As at 31st March As at 31st March As at 31st March
2015 2014
Portfolio No. of Cost Fair Value No. of Cost Fair Value No. of Cost Fair Value
Shares Rs. Rs Shares Rs. Rs Shares Rs. Rs
Colombo Drydocks
PLC
4,315 85,997 714,133 4,315 85,997 714,133 4,315 85,997 753,831
DFCC Bank PLC 38 380 7,706 38 380 7,706 38 380 5,468
Overseas Realty Ceylon PLC
113,680 1,664,891 2,671,480 113,680 1,664,891 2,671,480 113,680 1,664,891 2,330,440
Seylan Bank PLC 74,261 1,104,210 4,708,147 74,261 1,104,210 4,708,147 74,261 1,104,210 2,747,657
Hayleys Limited 734,144 216,803,911 220,243,200 734,144 216,803,911 220,243,200 734,144 216,803,911 209,231,040
219,659,389 228,344,666 219,659,389 228,344,666 219,659,389 215,068,436
Notes to the Financial Statements

121Annual Report 2014/15
Group Company
As at 31st March 2015 2015 2014
Rs. Rs. Rs.
15 OTHER INVESTMENTS
Financial investments - Available-for-sale (Note 15.1) 355,209,540 352,146,025 276,776,250
Loans and receivables (Note 15.2) 5,529,916,672 5,514,465,497 2,268,543,679
Derivative assets held for risk management (Note 15.3) 8,000,000 8,000,000 7,800
5,893,126,212 5,874,611,522 2,545,327,729
15.1 Financial Investments - Available-for-sale
Investments in treasury bonds (Note 15.1.1) 355,019,790 351,967,275 276,593,750
Unquoted Shares (Note 15.1.2) 389,750 178,750 182,500
Specific allowances for impairment (15.1.3) (200,000) - -
355,209,540 352,146,025 276,776,250
15.1.1 Investments in Treasury Bonds Group Company
As at 31st March 2015 As at 31st March 2015 As at 31st March 2014
Cost Fair Value Cost Fair Value Cost Fair Value
Rs. Rs. Rs. Rs. Rs. Rs.
Softlogic Finance PLC 37,585,520 38,842,000 37,585,520 38,842,000 37,585,520 37,892,000
Entrust Securities PLC 19,015,800 25,120,000 19,015,800 25,120,000 19,015,800 24,260,000
First Capital Treasuries Limited 83,845,470 79,437,050 83,845,470 79,437,050 19,546,680 19,010,000
Wealth Trust Securities Limited 11,239,800 12,648,125 11,239,800 12,648,125 11,239,800 11,881,250
Capital Alliance 180,481,520 195,920,100 180,481,520 195,920,100 180,481,520 183,550,500
Bank of Ceylon 3,199,462 3,052,515 - - - -
335,367,572 355,019,790 332,168,110 351,967,275 267,869,320 276,593,750
15.1.2 Unquoted Shares
Group Company
As at 31st March 2015 As at 31st March 2015 As at 31st March 2014
No. of Cost Fair Value No. of Cost Fair Value No. of Cost Fair Value
Shares Rs. Rs. Shares Rs. Rs. Shares Rs. Rs.
Equity Investments
Lanka Ltd
16,875 172,500 168,750 16,875 172,500 168,750 17,250 172,500 172,500
Credit Information
Bureau
110 21,000 21,000 100 10,000 10,000 100 10,000 10,000
Finance Houses
Consortium (Pvt) Ltd.
20,000 200,000 200,000 - - - - - -
389,750 178,750 182,500

122Commercial Leasing & Finance PLC
ys;j;alu
Group Company
As at 31st March 2015 2015 2014
Rs. Rs. Rs.
15.1.3 Specific allowances for impairment
As at 01 April - - -
Impairment loss for the period 200,000 - -
Balance as at 31 March 200,000 - -
Group Company
15.2 Loans and Receivables As at 31st March As at 31st March As at 31st March
2015 2015 2014
Rs. Rs. Rs.
Treasury Bills & Repos 1,765,451,175 1,750,000,000 1,464,638,200
Investments in term deposits 3,764,465,497 3,764,465,497 50,465,753
Commercial Papers - - 753,439,726
5,529,916,672 5,514,465,497 2,268,543,679
15.3 Derivative Assets Held for Risk Management
Forward rate contracts (Note.15.3.1) 8,000,000 8,000,000 7,800
15.3.1 Forward rate contracts The company uses a mixture of forward foreign exchange contracts to hedge the foreign currency translation risk on its
foreign borrowings.
The fair value of the derivatives designated as cash flow hedges are as follows,
Group Company
As at 31st March 2015 As at 31st March 2015 As at 31st March 2014
Assets Liabilities Assets Liabilities Assets Liabilities
8,000,000 289,491,818 8,000,000 289,491,818 7,800 97,551,618
The time period in which the hedged cashflows are expected to occur and affect the statement of profit or loss are a follows;
Group Company
As at 31st March 2015 As at 31st March 2015 As at 31st March 2014
Within 1 Year 1-5 Years Over 5 Years Within 1 Year 1-5 Years Over 5 Years Within 1 Year 1-5 Years Over 5 Years
4,884,350,967 - - 4,884,350,967 - - 6,486,949,193 - -
For the year ended 31 March 2015 net loss of Rs.177 Mn (2014: Net loss of Rs. 15Mn) relating to the effective portion of cash flow hedges were recognised in other comprehensive income.
Notes to the Financial Statements

123Annual Report 2014/15
Group Company
As at 31st March 2015 2015 2014
Rs. Rs. Rs.
16 RENTALS RECEIVABLE ON LEASES AND HIRE PURCHASES
Finance lease receivables (Note 16.1) 12,615,404,889 12,574,150,592 12,089,856,060
Hire purchase receivables (Note 16.2) 199,626,989 144,570,447 617,566,480
12,815,031,878 12,718,721,039 12,707,422,540
Rentals Receivable on Leases and Hire Purchases
Gross rental receivables 17,485,019,485 17,323,924,023 17,935,896,570
Unearned income (4,376,295,328) (4,342,061,814) (4,627,329,435)
Total Rentals Receivable ( Note 16.4) 13,108,724,157 12,981,862,209 13,308,567,135
Allowance for impairment (Note 16.3) (293,692,279) (263,141,170) (601,144,595)
Net receivables 12,815,031,878 12,718,721,039 12,707,422,540
16.1 Finance Lease Receivables
Gross rentals receivable 17,203,130,870 17,136,810,942 17,111,590,959
Unearned income (4,336,118,736) (4,321,267,966) (4,471,251,747)
12,867,012,134 12,815,542,976 12,640,339,212
Allowance for impairment (Note 16.1.3) (251,607,245) (241,392,384) (550,483,152)
12,615,404,889 12,574,150,592 12,089,856,060
Finance Lease Receivables
Receivables within one year (Note 16.1.1) 4,151,981,990 4,147,516,242 3,822,887,085
Receivable from one to five years (Note 16.1.2) 8,240,771,668 8,198,916,548 8,351,165,203
Overdue rental receivable 474,258,477 469,110,186 466,286,924
(-) Allowance for impairment (251,607,245) (241,392,384) (550,483,152)
12,615,404,889 12,574,150,592 12,089,856,060
16.1.1 Receivables within One Year
Gross rentals receivable 6,373,357,379 6,368,360,956 6,155,401,295
Unearned income (2,221,375,389) (2,220,844,714) (2,332,514,210)
4,151,981,990 4,147,516,242 3,822,887,085

124Commercial Leasing & Finance PLC
ys;j;alu
Group Company
As at 31st March 2015 2015 2014
Rs. Rs. Rs.
16.1.2 Receivable from One to Five Years
Gross rentals receivable 10,355,515,014 10,299,339,800 10,489,902,740
Unearned income (2,114,743,346) (2,100,423,252) (2,138,737,537)
8,240,771,668 8,198,916,548 8,351,165,203
16.1.3 Allowance for Impairment
Specific Allowance for Impairment
Balance as at 1st April 409,263,307 408,463,271 -
Charge / (Reversal) for the year 365,584,849 358,290,354 408,463,271
Write offs (748,058,656) (748,058,656) -
Balance as at 31st March 26,789,500 18,694,969 408,463,271
Collective Allowance for Impairment
Balance as at 1st April 143,183,895 142,019,881 397,467,221
Charge / (Reversal) for the year 254,550,063 253,593,747 105,465,468
Write offs (172,916,213) (172,916,213) (360,912,808)
Balance as at 31st March 224,817,745 222,697,415 142,019,881
Total allowances for impairment 251,607,245 241,392,384 550,483,152
16.2 Rentals Receivable on Hire Purchases
Gross rentals receivable 281,888,615 187,113,081 824,305,611
Unearned income (40,176,592) (20,793,848) (156,077,688)
241,712,023 166,319,233 668,227,923
Allowance for impairment (Note 16.2.3) (42,085,034) (21,748,786) (50,661,443)
Net receivables 199,626,989 144,570,447 617,566,480
Hire Purchase Receivables
Receivables within one year (Note 16.2.1) 140,888,014 130,163,211 417,309,455
Receivables from one to five years (Note 16.2.2) 66,627,829 14,097,849 184,086,808
Overdue rental receivable 34,196,180 22,058,173 66,831,660
(-) Allowance for impairment (Note 16.2.3) (42,085,034) (21,748,786) (50,661,443)
199,626,989 144,570,447 617,566,480
Notes to the Financial Statements

125Annual Report 2014/15
Group Company
As at 31st March 2015 2015 2014
Rs. Rs. Rs.
16.2.1 Receivables within One Year
Gross rentals receivable 162,418,684 150,417,797 543,480,869
Unearned income (21,530,670) (20,254,586) (126,171,414)
140,888,014 130,163,211 417,309,455
16.2.2 Receivables from One to Five Years
Gross rentals receivable 85,273,751 14,637,111 213,993,082
Unearned income (18,645,922) (539,262) (29,906,274)
66,627,829 14,097,849 184,086,808
16.2.3 Allowance for Impairment
Specific Allowance for Impairment
Balance as at 1st April 46,469,820 43,727,622 -
Charge / (Reversal) for the year 47,858,891 38,380,432 43,727,622
Write offs (81,942,452) (81,942,452) -
Balance as at 31st March 12,386,259 165,602 43,727,622
Collective Allowance for Impairment
Balance as at 1st April 10,916,667 6,933,821 211,470,855
Charge / (Reversal) for the year 42,982,999 38,850,254 (5,270,627)
Write offs (24,200,891) (24,200,891) (199,266,408)
Balance as at 31st March 29,698,775 21,583,184 6,933,821
Total allowances for impairment 42,085,034 21,748,786 50,661,443
16.3 Allowance for Impairment for Leases and Hire Purchases Receivables
Balance as at 1st April 609,833,689 601,144,595 608,938,076
Charge / (Reversal) for the year 710,976,803 689,114,788 552,385,734
Write offs (1,027,118,212) (1,027,118,212) (560,179,215)
Balance as at 31st March 293,692,279 263,141,170 601,144,595

126Commercial Leasing & Finance PLC
ys;j;alu
Group Company
Gross Amountas at 31.03.2015
Rs.
% Gross Amount as at 31.03.2015
Rs.
% Gross Amountas at 31.03.2014
Rs.
%
16.4 Concentration by Sector
Manufacturing 778,974,767 6% 778,974,767 6% 404,993,454 3%
Agriculture 2,221,573,903 17% 2,221,573,903 17% 1,782,258,127 13%
Trade 2,955,541,679 23% 2,955,541,679 23% 2,556,314,152 19%
Transport 1,678,587,943 13% 1,551,725,994 12% 908,224,065 7%
Construction 406,616,560 3% 406,616,560 3% 249,005,261 2%
Services 3,056,118,151 23% 3,056,118,152 24% 3,519,992,328 26%
Micro and Others 2,011,311,154 15% 2,011,311,154 15% 3,887,779,749 29%
13,108,724,157 12,981,862,209 13,308,567,135
Lease & Hire Purchase receivables amounting to Rs.8,848,511,589 /- assigned under funding arrangement (2014- Rs. 12,557,408,184/-) also included under lease and hire purchase receivables.
Group Company
As at 31st March 2015 2015 2014
Rs. Rs. Rs.
17 LOANS AND ADVANCES
Advances and loans 20,800,941,259 17,849,802,717 13,059,739,309
20,800,941,259 17,849,802,717 13,059,739,309
17.1 Rentals Receivable on Loans to Customers
Rentals receivable on loans to customers 20,615,631,848 17,663,790,863 12,896,914,946
Overdue loan instalments 434,658,195 421,051,210 277,325,621
Total Rentals Receivable (Note 17.2) 21,050,290,043 18,084,842,073 13,174,240,567
Allowance for impairment (Note 17.1.1) (249,348,784) (235,039,356) (114,501,257)
20,800,941,259 17,849,802,717 13,059,739,309
Notes to the Financial Statements

127Annual Report 2014/15
Group Company
As at 31st March 2015 2015 2014
Rs. Rs. Rs.
17.1.1 Allowance for Impairment
Specific Allowance for Impairment
Balance as at 1st April 77,754,254 75,831,857 -
Charge / (Reversal) for the year 110,489,599 105,594,274 75,831,857
Write off (170,147,182) (170,147,182) -
Balance as at 31st March 18,096,671 11,278,949 75,831,857
Collective Allowance for Impairment
Balance as at 1st April 39,924,191 38,669,400 48,246,277
Charge / (Reversal) for the year 276,751,371 270,514,456 151,556,931
Write off (85,423,449) (85,423,449) (161,133,808)
Balance as at 31st March 231,252,113 223,760,407 38,669,400
Total allowances for impairment 249,348,784 235,039,356 114,501,257
17.2 Concentration by Sector
Group Company
Gross Amountas at 31.03.2015
Rs.
% Gross Amount as at 31.03.2015
Rs.
% Gross Amountas at 31.03.2014
Rs.
%
Manufacturing 1,997,461,191 9% 978,265,191 5% 419,867,877 3%
Agriculture 2,034,145,538 10% 1,289,853,538 7% 664,862,004 5%
Trade 5,823,040,437 28% 5,034,272,437 28% 3,452,561,085 26%
Transport 2,201,941,701 10% 2,181,316,701 12% 924,956,653 7%
Construction 839,427,020 4% 834,840,020 5% 414,531,615 3%
Services 5,544,639,880 26% 5,379,999,880 30% 4,840,561,703 37%
Micro and Others 2,609,634,276 12% 2,386,294,305 13% 2,456,899,631 19%
21,050,290,043 18,084,842,073 13,174,240,567
Group Company
As at 31st March 2015 2015 2014
Rs. Rs. Rs.
18 FACTORING RECEIVABLES
Factoring receivables 2,778,117,011 2,778,117,011 2,231,288,982
Allowance for impairment (Note 18.1) (364,234,132) (364,234,132) (428,254,927)
Balance as at 31 March 2,413,882,879 2,413,882,879 1,803,034,055

128Commercial Leasing & Finance PLC
ys;j;alu
Group Company
As at 31st March 2015 2015 2014
Rs. Rs. Rs.
18.1 Allowance for Impairment
Specific Allowance for Impairment
Balance as at 1st April 404,104,713 404,104,713 418,761,258
Charge / (Reversal) for the year 216,509,423 216,509,423 327,525,306
Write off (277,590,056) (277,590,056) (342,181,851)
Balance as at 31st March 343,024,081 343,024,081 404,104,713
Collective Allowance for Impairment
Balance as at 1st April 24,150,214 24,150,214 -
Charge / (Reversal) for the year (2,940,162) (2,940,162) 24,150,214
Balance as at 31st March 21,210,052 21,210,052 24,150,214
Total allowances for impairment 364,234,132 364,234,132 428,254,927
Group Company
Gross Amountas at 31.03.2015
Rs.
% Gross Amount as at 31.03.2015
Rs.
% Gross Amountas at 31.03.2014
Rs.
%
18.2 Concentration by Sector
Agriculture 389,521,865 14% 389,521,865 14% 3,587,994 0%
Manufacturing 1,148,559,657 41% 1,148,559,657 41% 579,723,289 26%
Services 206,552,515 7% 206,552,515 7% 64,886,768 3%
Trading 869,578,233 31% 869,578,233 31% 1,258,093,922 56%
Transport 163,904,741 6% 163,904,741 6% 324,997,009 15%
2,778,117,011 2,778,117,011 2,231,288,982
Group Company
As at 31st March 2015 2015 2014
Rs. Rs. Rs.
19 DUE FROM RELATED PARTIES
Lanka Orix Finance PLC - - 274,383
LOLC Motors Limited 1,317,000 - 2,158,055
Galoya Plantations Limited - - 50,000,000
BRAC Lanka Finance PLC - 3,212,123 -
Dikwella Resort (Private) Limited 2,055 2,055 -
Eden Hotel Lanka PLC 24,028 24,028 -
Browns & Company PLC 40,419 40,419 -
Excel Restaurant (Private) Limited 564 564 -
Green Paradise Resorts (Private) Limited 22,350 22,350 -
1,406,416 3,301,539 52,432,438
Notes to the Financial Statements

129Annual Report 2014/15
Group Company
As at 31st March 2015 2015 2014
Rs. Rs. Rs.
20 CURRENT TAx ASSETS
With-Holding Tax recoverable 14,300,502 14,300,502 9,792,039
Nation Building Tax (NBT) recoverable 3,073,688 - -
Other tax recoverable 107,844 - -
17,482,034 14,300,502 9,792,039
21 OTHER CURRENT ASSETS
Financial Assets
Loans to employees (Note 21.1) 82,672,153 82,672,153 92,617,646
Advance to share issue - LOLC Myanmar Micro Finance LTD 66,800,000 66,800,000 -
Receivable from ODEL PLC 525,000,000 - -
Amount reserved for Force buy - BRAC shares 54,039,138 54,039,138 -
Other Financial Assets 14,321,308 - -
742,832,599 203,511,291 92,617,646
Non-financial Assets
Prepayments and advances 59,688,973 52,380,040 44,200,066
Other non-financial receivables 43,364,473 52,793,361 141,647,068
103,053,446 105,173,401 185,847,134
Total other current assets 845,886,045 308,684,692 278,464,780
21.1 Loans to Employees
Balance at the beginning of the year 92,617,646 92,617,646 75,030,264
Loans granted during the year 62,415,150 62,415,150 65,491,370
Loans recovered during the year (72,360,643) (72,360,643) (47,903,988)
Balance at end of the year 82,672,153 82,672,153 92,617,646

130Commercial Leasing & Finance PLC
ys;j;alu
Group Company
As at 31st March 2015 As at 31st March 2015 As at 31st March 2014
Principle Activity Holding % No. of Shares Balance (Rs.) Holding % No. of Shares Balance (Rs.) Holding % No. of Shares Balance (Rs.)
22 EqUITY ACCOUNTED INVESTEES
Commercial Insurance Brokers Limited Insurance
Brokering
40% 240,000 800,000 40% 240,000 800,000 40% 240,000 800,000
Add : Share of profits applicable to the Company
Balance at the beginning of the year 70,730,887 70,730,887 63,592,910
Current year's share of profits before taxation 6,144,677 6,144,677 11,055,576
Taxation (3,067,290) (3,067,290) (3,946,608)
Current year's share of profits after taxation 3,077,387 3,077,387 7,108,968
Actuarial loss (627,149) (627,149) 29,009
Income tax on other comprehensive income 175,602 175,602
Dividends received during the year (2,700,000) (2,700,000) -
Sub Total 70,656,726 70,656,726 70,730,887
Balance at the end of the year 71,456,726 71,456,726 71,530,887
22.1 Current Year's share of profit
The Share of Equity Accounted Investee profit is based on the audited Financial Statements for the year ended 31st December 2014.
Summarized Financial data as at 31st December 2014 of Commercial Insurance Brokers (Pvt) Ltd is stated below.
Group Company
31st December 2014 2014 2013
Rs. Rs. Rs.
Revenue 199,709,364 199,709,364 198,879,374
Profit before tax 15,361,692 15,361,692 27,638,939
Profit after tax 7,693,468 7,693,468 17,772,420
Total assets 230,676,813 230,676,813 245,950,528
Total liabilities 50,420,943 50,420,943 67,759,257
Group Company
2015 2015 2014
Rs. Rs. Rs.
23 INVESTMENT PROPERTIES
Balance at the beginning of the year 14,038,000 14,038,000 -
Change in fair value during the year (3,338,000) (3,338,000) 14,038,000
Balance at the end of the year 10,700,000 10,700,000 14,038,000
Notes to the Financial Statements

131Annual Report 2014/15
Group Company
As at 31st March 2015 As at 31st March 2015 As at 31st March 2014
Principle Activity Holding % No. of Shares Balance (Rs.) Holding % No. of Shares Balance (Rs.) Holding % No. of Shares Balance (Rs.)
22 EqUITY ACCOUNTED INVESTEES
Commercial Insurance Brokers Limited Insurance
Brokering
40% 240,000 800,000 40% 240,000 800,000 40% 240,000 800,000
Add : Share of profits applicable to the Company
Balance at the beginning of the year 70,730,887 70,730,887 63,592,910
Current year's share of profits before taxation 6,144,677 6,144,677 11,055,576
Taxation (3,067,290) (3,067,290) (3,946,608)
Current year's share of profits after taxation 3,077,387 3,077,387 7,108,968
Actuarial loss (627,149) (627,149) 29,009
Income tax on other comprehensive income 175,602 175,602
Dividends received during the year (2,700,000) (2,700,000) -
Sub Total 70,656,726 70,656,726 70,730,887
Balance at the end of the year 71,456,726 71,456,726 71,530,887
22.1 Current Year's share of profit
The Share of Equity Accounted Investee profit is based on the audited Financial Statements for the year ended 31st December 2014.
Summarized Financial data as at 31st December 2014 of Commercial Insurance Brokers (Pvt) Ltd is stated below.
Group Company
31st December 2014 2014 2013
Rs. Rs. Rs.
Revenue 199,709,364 199,709,364 198,879,374
Profit before tax 15,361,692 15,361,692 27,638,939
Profit after tax 7,693,468 7,693,468 17,772,420
Total assets 230,676,813 230,676,813 245,950,528
Total liabilities 50,420,943 50,420,943 67,759,257
Group Company
2015 2015 2014
Rs. Rs. Rs.
23 INVESTMENT PROPERTIES
Balance at the beginning of the year 14,038,000 14,038,000 -
Change in fair value during the year (3,338,000) (3,338,000) 14,038,000
Balance at the end of the year 10,700,000 10,700,000 14,038,000
23.1 Valuation of Investment Properties
The fair value of the investment properties were determined as at 31st March 2015, by Mr. P. W Senaratne, an independent
valuers who hold recognised and relevant professional qualification and have recent experience in the location and category of the
investments properties.
Group Company
Property & Location Land Extent Building
Extent
Historical
Cost
Fair Value Fair Value
2015 2015 2014
Kodagoda,Imaduwa, Galle 0A. 0R 30P 1,632 sqft 7,500,000 4,000,000 4,000,000 7,500,000
Imaduwa, Galle 0A. 0R 3.66P 958 sqft 6,000,000 6,700,000 6,700,000 6,000,000
23.2 There were no restrictions on the title of the investment properties as at the reporting date. Further there were no items pledged as
securities for liabilities.

132Commercial Leasing & Finance PLC
ys;j;alu
24 SUBSIDIARY COMPANIES Company
As at 31 March Principle Activity 2015 2014
No. of
Shares
Holding % Cost (Rs.) No. of
Shares
Holding % Cost (Rs.)
BRAC Lanka Finance PLC Leasing, Hire purchase, Secured
Loans,Micro Finance,Property
mortgaged loans and mobilization
of public deposits.
99,779,641 94.35% 967,862,518 - - -
99,779,641 967,862,518
25 ACqUISITION OF SUBSIDIARY
The provisional fair values of the identifiable assets and liabilities of BRAC Lanka Finance PLC (based on un-audited financial
statements) as at the date of acquisition were;
Amount
Rs.
Assets
Short term investments 931,673,956
Trade and other current assets 1,666,728,091
Property, plant and equipment 98,813,199
Intangible Assets 20,967,127
Investment property 236,291,712
2,954,474,085
Liabilities
Bank overdrafts 89,178,638
Deposit liabilities 111,670,650
Interest bearing loans & borrowings 1,562,000,894
MICRO Finance Fund Account 40,195,450
Income Tax Payable 4,763,266
Deferred taxation 18,230,163
Retirement benefit obligations 7,211,389
Trade and other payables 522,187,978
2,355,438,428
Equity
Stated capital 171,180,454
Reserves 191,912,260
Retained earnings 235,942,943
599,035,657
Notes to the Financial Statements
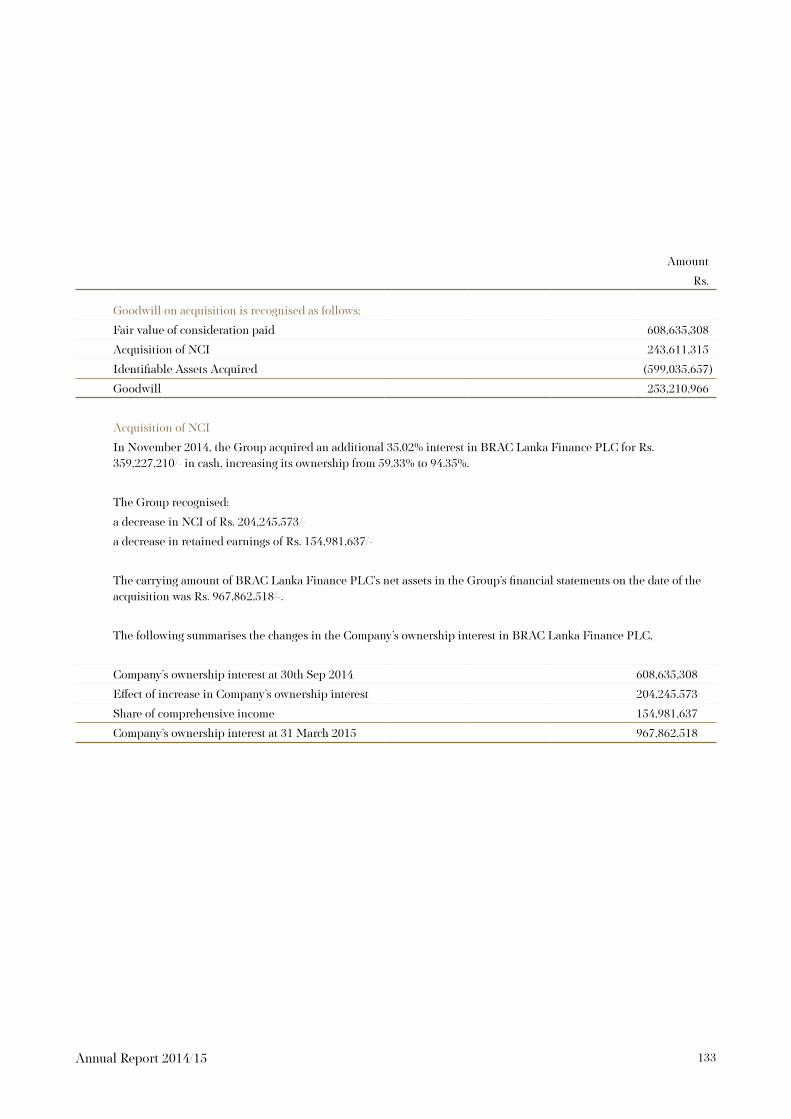
133Annual Report 2014/15
Amount
Rs.
Goodwill on acquisition is recognised as follows;
Fair value of consideration paid 608,635,308
Acquisition of NCI 243,611,315
Identifiable Assets Acquired (599,035,657)
Goodwill 253,210,966
Acquisition of NCI
In November 2014, the Group acquired an additional 35.02% interest in BRAC Lanka Finance PLC for Rs. 359,227,210/- in cash, increasing its ownership from 59.33% to 94.35%.
The Group recognised:
a decrease in NCI of Rs. 204,245,573/-
a decrease in retained earnings of Rs. 154,981,637/-
The carrying amount of BRAC Lanka Finance PLC's net assets in the Group’s financial statements on the date of the acquisition was Rs. 967,862,518/-.
The following summarises the changes in the Company’s ownership interest in BRAC Lanka Finance PLC,
Company’s ownership interest at 30th Sep 2014 608,635,308
Effect of increase in Company’s ownership interest 204,245,573
Share of comprehensive income 154,981,637
Company’s ownership interest at 31 March 2015 967,862,518

134Commercial Leasing & Finance PLC
ys;j;alu
26 PROPERTY, PLANT AND EqUIPMENT
Group Freehold Lands
FreeholdBuildings
Freehold Motor Vehicles
Furniture & Fittings
Office Equipment
Computers Assets forOperating Leases
Plant &Machinery
Total
Rs. Rs. Rs. Rs. Rs. Rs. Rs. Rs. Rs.
Cost/Valuation
Balance as at 1st April 2014 701,739,040 158,837,469 98,382,623 78,971,797 128,920,403 122,170,961 89,254,313 - 1,378,276,606
Acquisition through business combination (Note 25) 61,031,780 21,676,508 10,322,446 8,209,693 12,899,112 - - 2,186,033 116,325,572
Additions - - 5,738,527 31,457,015 22,635,022 9,894,686 13,400,000 - 83,125,250
Disposals (61,031,780) (21,676,508) (5,830,249) (2,232,200) - - - - (90,770,737)
Balance as at 31st March 2015 701,739,040 158,837,469 108,613,347 116,406,305 164,454,537 132,065,647 102,654,313 2,186,033 1,486,956,691
-
Accumulated Depreciation -
Balance as at 1st April 2014 - 23,837,469 53,372,917 39,169,266 58,149,022 81,688,938 52,244,727 - 308,462,339
Acquisition through business combination (Note 25) - 848,548 8,769,983 2,618,120 3,269,570 - - 2,006,153 17,512,373
Charge for the year - 6,628,253 22,384,938 19,431,047 29,636,496 17,101,246 7,647,908 130,973 102,960,860
Disposals - (2,655,372) (5,830,249) (2,232,200) - - - - (10,717,821)
Balance as at 31st March 2015 - 28,658,897 78,697,588 58,986,232 91,055,088 98,790,184 59,892,635 2,137,126 418,217,751
Carrying value
As at 31 March 2015 701,739,040 130,178,572 29,915,759 57,420,073 73,399,449 33,275,463 42,761,678 48,907 1,068,738,940
Company
Cost/Valuation
Balance as at 1st April 2014 701,739,040 158,837,469 98,382,623 78,971,797 128,920,403 122,170,961 89,254,313 - 1,378,276,606
Additions 23,773,107 18,871,881 9,894,686 13,400,000 65,939,674
Disposals (1,330,249) (2,232,200) (3,562,449)
Balance as at 31st March 2015 701,739,040 158,837,469 97,052,374 100,512,704 147,792,284 132,065,647 102,654,313 - 1,440,653,831
-
Accumulated Depreciation -
Balance as at 1st April 2014 - 23,837,469 53,372,917 39,169,266 58,149,022 81,688,938 52,244,727 - 308,462,339
Charge for the year 4,821,429 22,326,428 16,148,620 27,334,295 17,101,246 7,647,908 95,379,925
Disposals (1,330,249) (2,232,200) (3,562,449)
Balance as at 31st March 2015 - 28,658,898 74,369,095 53,085,685 85,483,317 98,790,184 59,892,635 - 400,279,815
Carrying value
As at 31 March 2015 701,739,040 130,178,571 22,683,279 47,427,019 62,308,967 33,275,463 42,761,678 - 1,040,374,016
As at 31 March 2014 701,739,040 135,000,000 45,009,707 39,802,531 70,771,381 40,482,023 37,009,586 - 1,069,814,268
Notes to the Financial Statements

135Annual Report 2014/15
26 PROPERTY, PLANT AND EqUIPMENT
Group Freehold Lands
FreeholdBuildings
Freehold Motor Vehicles
Furniture & Fittings
Office Equipment
Computers Assets forOperating Leases
Plant &Machinery
Total
Rs. Rs. Rs. Rs. Rs. Rs. Rs. Rs. Rs.
Cost/Valuation
Balance as at 1st April 2014 701,739,040 158,837,469 98,382,623 78,971,797 128,920,403 122,170,961 89,254,313 - 1,378,276,606
Acquisition through business combination (Note 25) 61,031,780 21,676,508 10,322,446 8,209,693 12,899,112 - - 2,186,033 116,325,572
Additions - - 5,738,527 31,457,015 22,635,022 9,894,686 13,400,000 - 83,125,250
Disposals (61,031,780) (21,676,508) (5,830,249) (2,232,200) - - - - (90,770,737)
Balance as at 31st March 2015 701,739,040 158,837,469 108,613,347 116,406,305 164,454,537 132,065,647 102,654,313 2,186,033 1,486,956,691
-
Accumulated Depreciation -
Balance as at 1st April 2014 - 23,837,469 53,372,917 39,169,266 58,149,022 81,688,938 52,244,727 - 308,462,339
Acquisition through business combination (Note 25) - 848,548 8,769,983 2,618,120 3,269,570 - - 2,006,153 17,512,373
Charge for the year - 6,628,253 22,384,938 19,431,047 29,636,496 17,101,246 7,647,908 130,973 102,960,860
Disposals - (2,655,372) (5,830,249) (2,232,200) - - - - (10,717,821)
Balance as at 31st March 2015 - 28,658,897 78,697,588 58,986,232 91,055,088 98,790,184 59,892,635 2,137,126 418,217,751
Carrying value
As at 31 March 2015 701,739,040 130,178,572 29,915,759 57,420,073 73,399,449 33,275,463 42,761,678 48,907 1,068,738,940
Company
Cost/Valuation
Balance as at 1st April 2014 701,739,040 158,837,469 98,382,623 78,971,797 128,920,403 122,170,961 89,254,313 - 1,378,276,606
Additions 23,773,107 18,871,881 9,894,686 13,400,000 65,939,674
Disposals (1,330,249) (2,232,200) (3,562,449)
Balance as at 31st March 2015 701,739,040 158,837,469 97,052,374 100,512,704 147,792,284 132,065,647 102,654,313 - 1,440,653,831
-
Accumulated Depreciation -
Balance as at 1st April 2014 - 23,837,469 53,372,917 39,169,266 58,149,022 81,688,938 52,244,727 - 308,462,339
Charge for the year 4,821,429 22,326,428 16,148,620 27,334,295 17,101,246 7,647,908 95,379,925
Disposals (1,330,249) (2,232,200) (3,562,449)
Balance as at 31st March 2015 - 28,658,898 74,369,095 53,085,685 85,483,317 98,790,184 59,892,635 - 400,279,815
Carrying value
As at 31 March 2015 701,739,040 130,178,571 22,683,279 47,427,019 62,308,967 33,275,463 42,761,678 - 1,040,374,016
As at 31 March 2014 701,739,040 135,000,000 45,009,707 39,802,531 70,771,381 40,482,023 37,009,586 - 1,069,814,268

136Commercial Leasing & Finance PLC
ys;j;alu
26.1 Property, plant & equipment included fully depreciated assets that are still in use having a gross amount of Rs. 152,078,567- as at 31st March 2015 (2013/14 - Rs.83,435,185/-)
26.2 The Company's land & building at No. 68 Bauddhaloka Mawatha, Colombo 04, was revalued based on the fair value by Mr. P.W Senaratna, an Independent Chartered Valuer, as at 31st March 2014, at Rs.258,500,000/-. The resultant revaluation surplus is Rs. 98,787,980/- and is included in revaluation Reserve.
26.3 If land and buildings were measured using the cost model,the carrying amounts would be as follows:
As at 31March Group Company
2015 2015 2014
Rs. Rs. Rs.
Cost 112,749,688 66,446,828 66,446,828
Accumulated depreciation (24,367,533) (17,212,161) (15,550,990)
88,382,155 49,234,667 50,895,838
26.4 Information on Freehold Land and Building of the Company
Location Valuation of Net Book Value of Extent Extent Accommodation
Land Building Land Building Land Building
(Sq.Ft)
Bauddhaloka
Mawatha,Colombo-04
123,500,000 135,000,000 123,500,000 130,178,571 19 Perches 21,890 Head Office
No 305/5.Rajagiriya road,
Nawala
578,239,040 - 578,239,040 - 0A- 3R-
19.14P
- Nawala -
Riyapola
26.5 There were no restrictions on the title of the property plant and equipment as at the reporting date. Further there were no items
pledged as securities for liabilities.
26.6 Intangible Assets
Group Company
2015 2015 2014
Rs. Rs. Rs.
Balance as at 01.04.2014 - - -
Acquisition through business combination (Note 25) 20,967,127 - -
Addition 6,666,000 - -
Written off (27,633,127) - -
Balance as at 31.03.2015 - - -
Notes to the Financial Statements
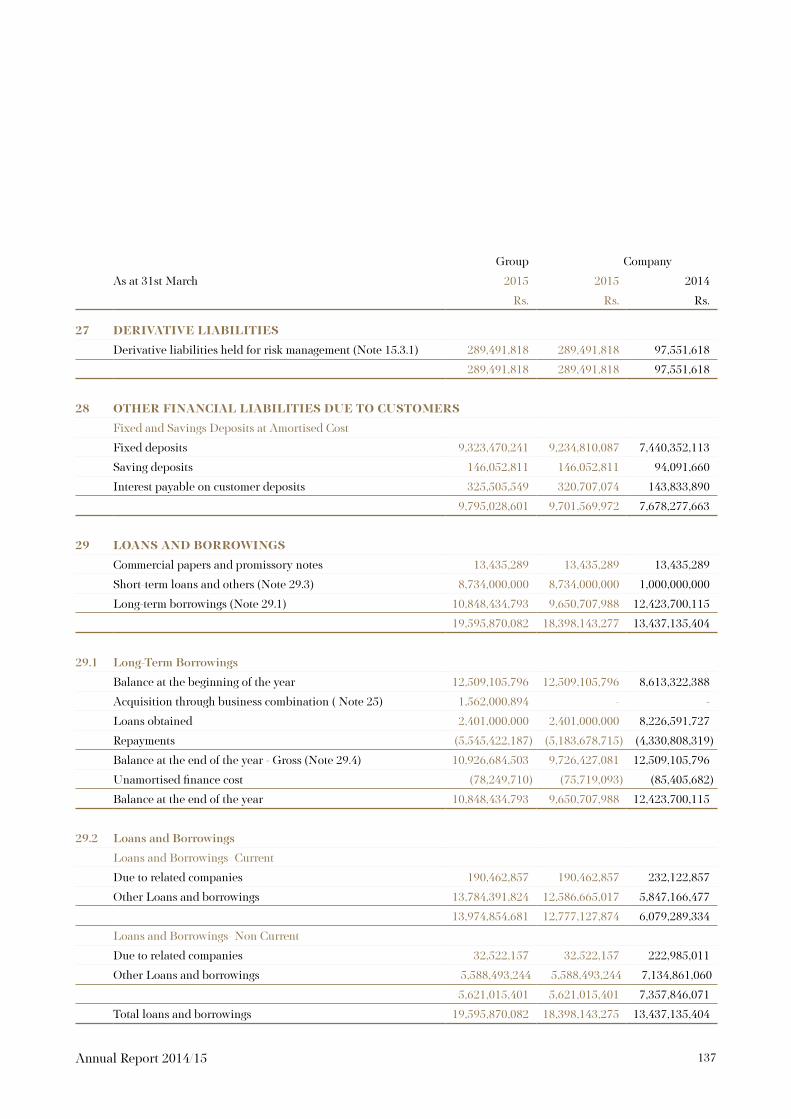
137Annual Report 2014/15
Group Company
As at 31st March 2015 2015 2014
Rs. Rs. Rs.
27 DERIVATIVE LIABILITIES
Derivative liabilities held for risk management (Note 15.3.1) 289,491,818 289,491,818 97,551,618
289,491,818 289,491,818 97,551,618
28 OTHER FINANCIAL LIABILITIES DUE TO CUSTOMERS
Fixed and Savings Deposits at Amortised Cost
Fixed deposits 9,323,470,241 9,234,810,087 7,440,352,113
Saving deposits 146,052,811 146,052,811 94,091,660
Interest payable on customer deposits 325,505,549 320,707,074 143,833,890
9,795,028,601 9,701,569,972 7,678,277,663
29 LOANS AND BORROWINGS
Commercial papers and promissory notes 13,435,289 13,435,289 13,435,289
Short-term loans and others (Note 29.3) 8,734,000,000 8,734,000,000 1,000,000,000
Long-term borrowings (Note 29.1) 10,848,434,793 9,650,707,988 12,423,700,115
19,595,870,082 18,398,143,277 13,437,135,404
29.1 Long-Term Borrowings
Balance at the beginning of the year 12,509,105,796 12,509,105,796 8,613,322,388
Acquisition through business combination ( Note 25) 1,562,000,894 - -
Loans obtained 2,401,000,000 2,401,000,000 8,226,591,727
Repayments (5,545,422,187) (5,183,678,715) (4,330,808,319)
Balance at the end of the year - Gross (Note 29.4) 10,926,684,503 9,726,427,081 12,509,105,796
Unamortised finance cost (78,249,710) (75,719,093) (85,405,682)
Balance at the end of the year 10,848,434,793 9,650,707,988 12,423,700,115
29.2 Loans and Borrowings
Loans and Borrowings- Current
Due to related companies 190,462,857 190,462,857 232,122,857
Other Loans and borrowings 13,784,391,824 12,586,665,017 5,847,166,477
13,974,854,681 12,777,127,874 6,079,289,334
Loans and Borrowings- Non Current
Due to related companies 32,522,157 32,522,157 222,985,011
Other Loans and borrowings 5,588,493,244 5,588,493,244 7,134,861,060
5,621,015,401 5,621,015,401 7,357,846,071
Total loans and borrowings 19,595,870,082 18,398,143,275 13,437,135,404

138Commercial Leasing & Finance PLC
ys;j;alu
Group Company
As at 31st March 2015 2015 2014
Rs. Rs. Rs.
29.3 Short-term loans and others
Commercial Bank of Ceylon 3,804,000,000 3,804,000,000 -
Hong Kong Bank 300,000,000 300,000,000 -
Bank of Ceylon 750,000,000 750,000,000 200,000,000
Union Bank 850,000,000 850,000,000 400,000,000
Sampath Bank 1,700,000,000 1,700,000,000 -
Hatton National Bank 930,000,000 930,000,000 -
Muslim Commercial Bank 200,000,000 200,000,000 400,000,000
Nations Trust Bank 200,000,000 200,000,000 -
8,734,000,000 8,734,000,000 1,000,000,000
29.4 Long-Term Borrowings
Commercial Bank of Ceylon 350,000,000 350,000,000 560,000,000
Bank of Ceylon 110,116,971 110,116,971 348,701,041
Hatton National Bank 1,051,300,000 351,300,000 590,930,000
People's Bank - - 124,999,988
Habib Bank 333,333,333 333,333,333 262,500,000
Sampath Bank 1,685,275,000 1,185,275,000 1,874,615,000
Ishara Traders 222,985,019 222,985,019 455,107,870
Nederlandses Development Finance Company (FMO) 3,628,478,666 3,628,478,666 4,109,727,443
PROPARCO 785,072,727 785,072,727 1,306,109,090
Triodos Investment Management - - 1,077,540,000
DEG 2,001,000,000 2,001,000,000 -
Securitisation loans 758,865,365 758,865,365 1,798,875,363
Public Bank 257,421 - -
10,926,684,502 9,726,427,081 12,509,105,796
30 CURRENT TAx LIABILITIES
Income tax payables 398,471,780 363,234,642 325,847,577
398,471,780 363,234,642 325,847,577
Notes to the Financial Statements

139Annual Report 2014/15
Group Company
As at 31st March 2015 2015 2014
Rs. Rs. Rs.
31 AMOUNT DUE TO RELATED COMPANIES
Lanka Orix Leasing Company PLC 1,247,974,494 379,047,769 269,747,963
LOLC Motors Limited - 1,483,000 -
Lanka Orix Finance PLC 2,653,108 2,653,108 -
LOLC Factors Limited 500,000,000 - 2,000,106
LOLC Realty Limited 1,350,000 1,350,000 3,240,000
LOLC Micro Credit Limited 1,744,389 1,744,389 1,225,224
1,753,721,991 386,278,266 276,213,293
32 TRADE AND OTHER PAYABLES
Financial liabilities
Accrued Expenses 355,445,372 231,929,501 204,470,881
Creditors for cost of equipment 574,323,926 549,080,964 237,163,463
Other payable 86,654,747 158,879,863 104,321,625
Interest payable 359,211,226 359,211,228 406,949,867
Loan Security Deposit 200,279,410 - -
Total financial liabilities 1,575,914,681 1,299,101,557 952,905,836
Non-Financial Liabilities
Dividend payable 3,709,753 3,709,753 3,709,753
Total non-financial liabilities 3,709,753 3,709,753 3,709,753
Total trade and other payables 1,579,624,434 1,302,811,310 956,615,589
Group Company
As at 31st March 2015 As at 31st March 2015 As at 31st March 2014
TemporaryDifference
Tax Effect
TemporaryDifference
Tax Effect
TemporaryDifference
Tax Effect
33 DEFERRED TAx ASSETS & LIABILITIES
33.1 Recognised Deferred Tax Assets
Property, Plant & Equipment 2,117,331 592,853 - - - -
Lease Receivables 655,020 183,406 - - - -
Employee Benefits (6,269,771) (1,755,536) - - - -
(3,497,420) (979,278) - - - -

140Commercial Leasing & Finance PLC
ys;j;alu
Group Company
2015 2015 2014
Rs. Rs. Rs.
33.1.2 Movement in recognised deferred tax assets
Balance as at the beginning of the period - - -
Acquisition Through business combination 18,230,163 - -
Originations / Reversal to the Income Statement (19,209,441) - -
(979,278) - -
Group Company
As at 31st March 2015 As at 31st March 2015 As at 31st March 2014
TemporaryDifference
Tax Effect
TemporaryDifference
Tax Effect TemporaryDifference
Tax Effect
33.2 Recognised Deferred Tax Liabilities
Property, Plant & Equipment 128,036,586 35,850,244 128,036,586 35,850,244 135,842,452 38,035,887
Lease Receivables 1,526,174,506 427,328,862 1,526,174,506 427,328,862 2,012,506,620 563,501,854
Employee Benefits (48,226,366) (13,503,382) (48,226,366) (13,503,382) (40,337,808) (11,294,586)
Revaluation of Property, plant and equipment
70,287,980 19,680,635 70,287,980 19,680,635 70,287,980 19,680,635
1,676,272,706 469,356,358 1,676,272,706 469,356,358 2,178,299,247 609,923,788
Group Company
As at 31st March As at 31st March
2015 2015 2014
Rs. Rs. Rs.
33.2.1 Amount originating / (reversing) during the year
Recognised in statement of comprehensive income (Note 33.4) (159,776,870) (140,567,429) 106,171,606
Recognised in other comprehensive income (Note 33.4) - - 19,680,635
(159,776,870) (140,567,429) 125,852,241
33.3 Deferred Tax Expense
Deferred Tax Assets
Originations / reversal during the period (19,209,441) - -
Deferred Tax Liabilities
Originations / reversal during the period (140,567,429) (140,567,429) 106,171,606
(159,776,870) (140,567,429) 106,171,606
Notes to the Financial Statements

141Annual Report 2014/15
33.4 Deferred Tax Expenses recognised in OCI
According to Sri Lanka Accounting Standard - LKAS 12 “Income Taxes”, deferred tax shall be charged or credited directly to equity if the tax relates to items that are credited or charged, in the same or in a different period, directly to equity. Accordingly, the deferred tax liability arising on revaluation of Property, Plant & Equipment of Rs. 19,680,635/ for 2013/14 of the Company was charged directly to revaluation reserve in the Statement of Changes in Equity in 2013/14.
Group Company
2015 2015 2014
Rs. Rs. Rs.
34 EMPLOYEE BENEFITS
Present Value of Unfunded Gratuity
Balance as at the beginning of the year 40,337,807 40,337,807 24,779,031
Acquisition Through business combination 7,211,389 - -
Benefit paid during the year (5,383,385) (2,503,400) (1,485,684)
Expense recognised in the income statement (Note 34.1) 11,665,947 9,809,455 6,838,949
Expense recognised in the other comprehensive income (Note 34.2) 664,378 582,503 10,205,511
54,496,137 48,226,366 40,337,807
34.1 Expense Recognised in the Income Statement
Current service cost 7,423,212 5,775,675 3,765,821
Interest on obligation 4,242,735 4,033,780 3,073,128
11,665,947 9,809,455 6,838,949
34.2 Expenses Recognised in other comprehensive income
Actuarial Gain / (Loss) 664,378 582,503 10,205,511
664,378 582,503 10,205,511
The employee benefit liability was actuarial valued under the projected Unit Credit (PUC) method by professionally qualified actuary firm Messers Piyal S. Goonethilake and Associates on 31st March 2015.
The principle financial assumptions used in the valuation for the current and comparative years are as follows;
2015 2014
Actuarial Assumptions
Rate of discount 9.5% 10.00%
Salary increment rates 8.5% 9.00%
Retirement age 55 years 55 years
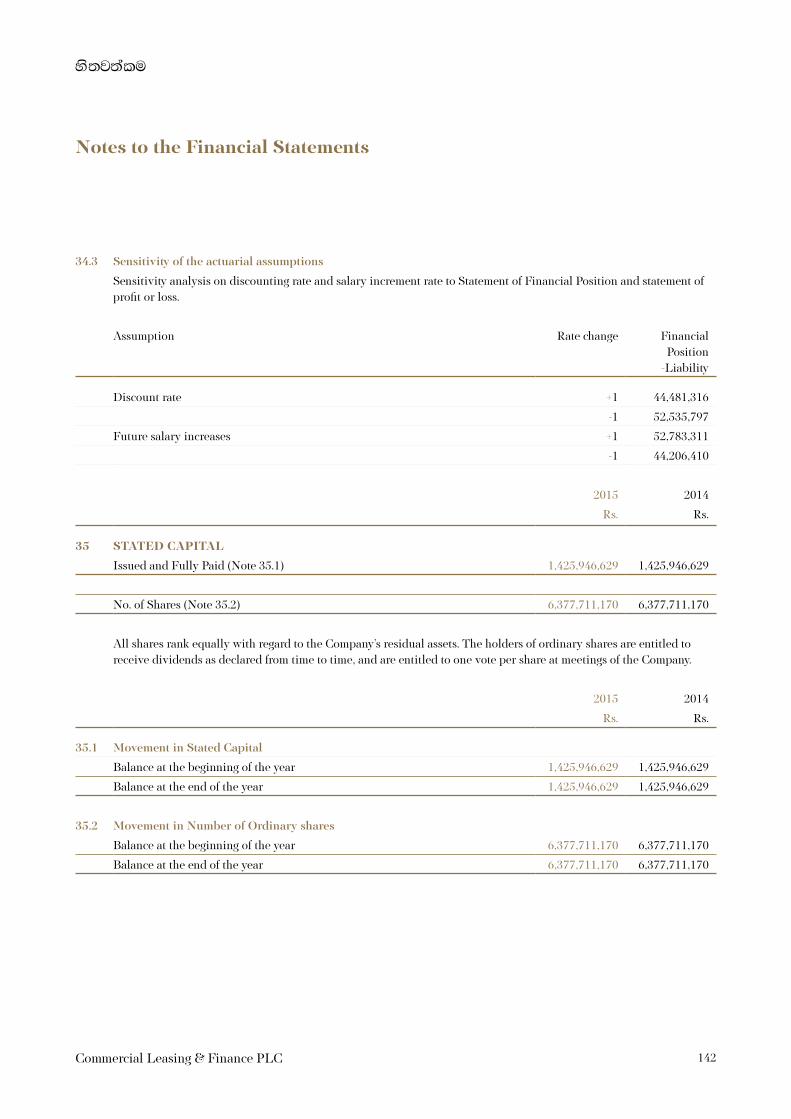
142Commercial Leasing & Finance PLC
ys;j;alu
34.3 Sensitivity of the actuarial assumptions
Sensitivity analysis on discounting rate and salary increment rate to Statement of Financial Position and statement of profit or loss.
Assumption Rate change FinancialPosition
-Liability
Discount rate +1 44,481,316
-1 52,535,797
Future salary increases +1 52,783,311
-1 44,206,410
2015 2014
Rs. Rs.
35 STATED CAPITAL
Issued and Fully Paid (Note 35.1) 1,425,946,629 1,425,946,629
No. of Shares (Note 35.2) 6,377,711,170 6,377,711,170
All shares rank equally with regard to the Company’s residual assets. The holders of ordinary shares are entitled to receive dividends as declared from time to time, and are entitled to one vote per share at meetings of the Company.
2015 2014
Rs. Rs.
35.1 Movement in Stated Capital
Balance at the beginning of the year 1,425,946,629 1,425,946,629
Balance at the end of the year 1,425,946,629 1,425,946,629
35.2 Movement in Number of Ordinary shares
Balance at the beginning of the year 6,377,711,170 6,377,711,170
Balance at the end of the year 6,377,711,170 6,377,711,170
Notes to the Financial Statements
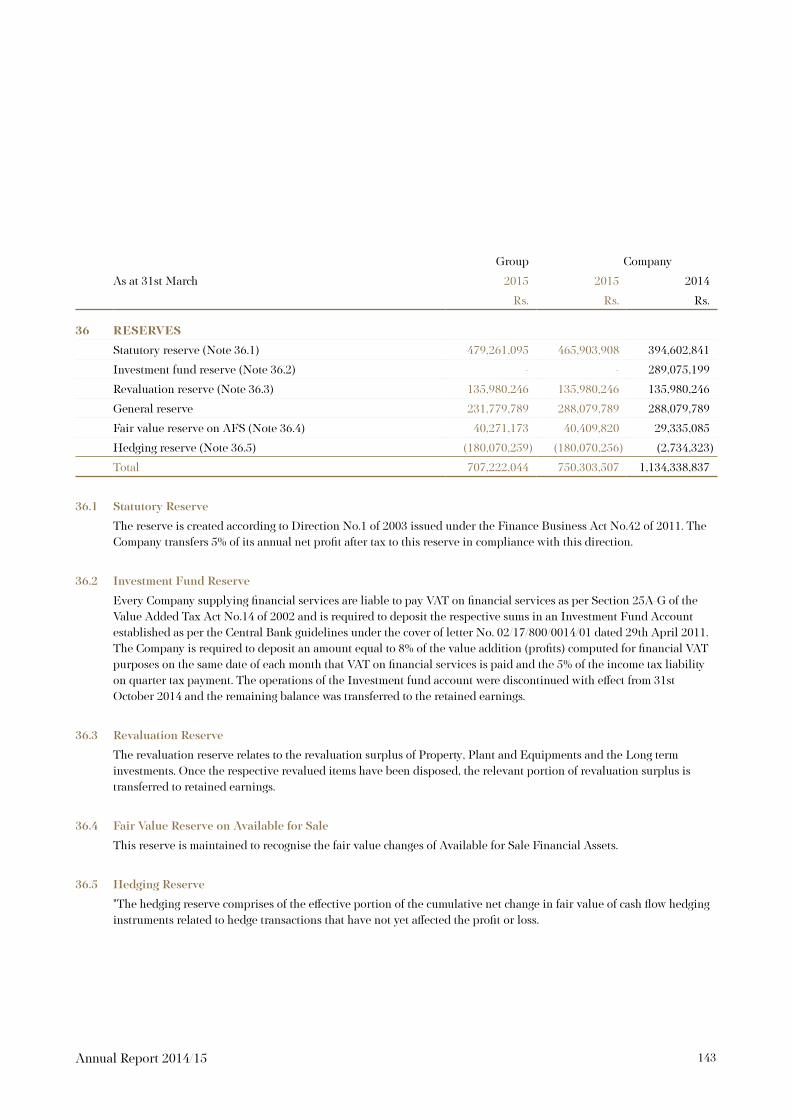
143Annual Report 2014/15
Group Company
As at 31st March 2015 2015 2014
Rs. Rs. Rs.
36 RESERVES
Statutory reserve (Note 36.1) 479,261,095 465,903,908 394,602,841
Investment fund reserve (Note 36.2) - - 289,075,199
Revaluation reserve (Note 36.3) 135,980,246 135,980,246 135,980,246
General reserve 231,779,789 288,079,789 288,079,789
Fair value reserve on AFS (Note 36.4) 40,271,173 40,409,820 29,335,085
Hedging reserve (Note 36.5) (180,070,259) (180,070,256) (2,734,323)
Total 707,222,044 750,303,507 1,134,338,837
36.1 Statutory Reserve
The reserve is created according to Direction No.1 of 2003 issued under the Finance Business Act No.42 of 2011. The Company transfers 5% of its annual net profit after tax to this reserve in compliance with this direction.
36.2 Investment Fund Reserve
Every Company supplying financial services are liable to pay VAT on financial services as per Section 25A-G of the Value Added Tax Act No.14 of 2002 and is required to deposit the respective sums in an Investment Fund Account established as per the Central Bank guidelines under the cover of letter No. 02/17/800/0014/01 dated 29th April 2011. The Company is required to deposit an amount equal to 8% of the value addition (profits) computed for financial VAT purposes on the same date of each month that VAT on financial services is paid and the 5% of the income tax liability on quarter tax payment. The operations of the Investment fund account were discontinued with effect from 31st October 2014 and the remaining balance was transferred to the retained earnings.
36.3 Revaluation Reserve
The revaluation reserve relates to the revaluation surplus of Property, Plant and Equipments and the Long term investments. Once the respective revalued items have been disposed, the relevant portion of revaluation surplus is transferred to retained earnings.
36.4 Fair Value Reserve on Available for Sale
This reserve is maintained to recognise the fair value changes of Available for Sale Financial Assets.
36.5 Hedging Reserve
"The hedging reserve comprises of the effective portion of the cumulative net change in fair value of cash flow hedging instruments related to hedge transactions that have not yet affected the profit or loss.
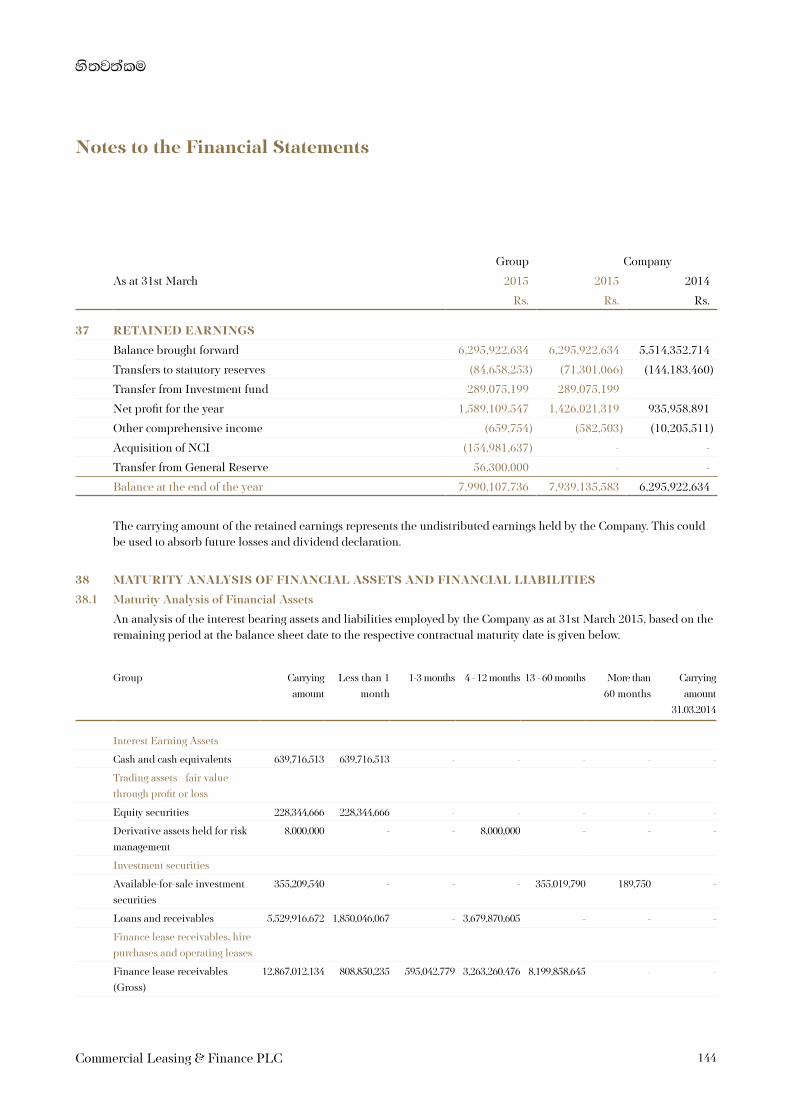
144Commercial Leasing & Finance PLC
ys;j;alu
Group Company
As at 31st March 2015 2015 2014
Rs. Rs. Rs.
37 RETAINED EARNINGS
Balance brought forward 6,295,922,634 6,295,922,634 5,514,352,714
Transfers to statutory reserves (84,658,253) (71,301,066) (144,183,460)
Transfer from Investment fund 289,075,199 289,075,199
Net profit for the year 1,589,109,547 1,426,021,319 935,958,891
Other comprehensive income (659,754) (582,503) (10,205,511)
Acquisition of NCI (154,981,637) - -
Transfer from General Reserve 56,300,000 - -
Balance at the end of the year 7,990,107,736 7,939,135,583 6,295,922,634
The carrying amount of the retained earnings represents the undistributed earnings held by the Company. This could be used to absorb future losses and dividend declaration.
38 MATURITY ANALYSIS OF FINANCIAL ASSETS AND FINANCIAL LIABILITIES
38.1 Maturity Analysis of Financial Assets
An analysis of the interest bearing assets and liabilities employed by the Company as at 31st March 2015, based on the remaining period at the balance sheet date to the respective contractual maturity date is given below.
Group Carrying
amount
Less than 1
month
1-3 months 4 - 12 months 13 - 60 months More than
60 months
Carrying
amount
31.03.2014
Interest Earning Assets
Cash and cash equivalents 639,716,513 639,716,513 - - - - -
Trading assets - fair value
through profit or loss
Equity securities 228,344,666 228,344,666 - - - - -
Derivative assets held for risk
management
8,000,000 - - 8,000,000 - - -
Investment securities
Available-for-sale investment
securities
355,209,540 - - - 355,019,790 189,750 -
Loans and receivables 5,529,916,672 1,850,046,067 - 3,679,870,605 - - -
Finance lease receivables, hire
purchases and operating leases
Finance lease receivables
(Gross)
12,867,012,134 808,850,235 595,042,779 3,263,260,476 8,199,858,645 - -
Notes to the Financial Statements

145Annual Report 2014/15
Carrying
amount
Less than 1
month
1-3 months 4 - 12 months 13 - 60 months More than
60 months
Carrying
amount
31.03.2014
Hire purchase receivables
(Gross)
241,712,023 10,349,296 102,243,314 113,804,090 15,268,127 47,196 -
Advances and other loans
Loans and advances (Gross) 21,050,290,043 845,689,501 879,123,285 5,956,306,691 13,366,140,239 3,030,326 -
Factoring receivables (Gross) 2,778,117,011 2,403,944,856 63,804,637 35,540,096 274,827,423 - -
Trade and other current assets
Loans to staff 82,672,153 1,589,903 4,769,710 4,776,976 4,769,710 66,765,853 -
43,780,990,755 6,788,531,039 1,644,983,725 13,061,558,934 22,215,883,934 70,033,125 -
Maturity Analysis of Financial Liabilities
Interest Bearing Liabilities
Non-derivative liabilities
Bank overdrafts 1,326,488,496 1,326,488,496 - - - - -
Deposits liabilities
Other financial liabilities due to
customers
9,795,028,601 1,152,819,738 3,281,871,942 4,298,395,272 1,057,652,645 4,289,004 -
Interest bearing borrowings
Commercial papers and
promissory notes
13,435,289 1,919,327 1,919,327 3,838,654 5,757,981 - -
Short term loans and others 8,734,000,000 8,734,000,000 - - - - -
Long-term borrowings 10,848,434,793 174,824,793 494,998,548 3,365,744,714 5,462,866,737 1,350,000,001 -
Other current liabilities
Derivative liabilities 289,491,818 5,099,881 277,767,841 6,624,096 - - -
31,006,878,997 11,395,152,235 4,056,557,659 7,674,602,736 6,526,277,363 1,354,289,005 -
Company
Interest Earning Assets
Cash and cash equivalents 515,679,795 515,679,795 - - - - 736,358,424
Trading assets - fair value
through profit or loss
Equity securities 228,344,666 228,344,666 - - - - 215,068,436
Derivative assets held for risk
management
8,000,000 - - 8,000,000 - - 7,800

146Commercial Leasing & Finance PLC
ys;j;alu
Carrying
amount
Less than 1
month
1-3 months 4 - 12 months 13 - 60 months More than
60 months
Carrying
amount
31.03.2014
Investment securities
Available-for-sale investment
securities
352,146,025 - - - 351,967,275 178,750 276,776,250
Loans and receivables 5,514,465,497 1,834,594,892 - 3,679,870,605 - - 2,268,543,679
Finance lease receivables, hire
purchases and operating leases
Finance lease receivables
(Gross)
12,815,542,976 803,701,941 555,930,126 3,256,994,361 8,198,916,548 - 12,640,339,212
Hire purchase receivables
(Gross)
166,319,233 33,281,084 20,773,028 98,167,271 14,097,849 - 668,227,923
Advances and other loans
Loans and advances (Gross) 18,084,842,073 829,728,687 797,652,999 3,091,320,147 13,366,140,239 - 13,174,240,567
Factoring receivables (Gross) 2,778,117,011 2,403,944,856 63,804,637 35,540,096 274,827,423 - 2,231,288,982
Trade and other current assets
Loans to staff 82,672,153 1,589,903 4,769,710 4,776,976 4,769,710 66,765,853 92,617,646
40,546,129,430 6,650,865,826 1,442,930,500 10,174,669,456 22,210,719,044 66,944,603 32,303,468,919
38.2 Maturity Analysis of Financial Liabilities
Interest Bearing Liabilities
Non-derivative liabilities
Bank overdrafts 1,310,844,519 1,310,844,519 - - - - 655,802,303
Deposits liabilities
Other financial liabilities due to
customers
9,701,569,972 1,140,386,263 3,259,807,442 4,258,692,272 1,042,683,995 - 7,678,277,663
Interest bearing borrowings
Commercial papers and
promissory notes
13,435,289 1,919,327 1,919,327 3,838,654 5,757,981 - 13,435,289
Short term loans and others 8,734,000,000 8,734,000,000 - - - - 1,000,000,000
Long-term borrowings 9,650,707,988 168,949,324 494,998,548 3,365,744,714 5,621,015,401 - 12,423,700,115
Other current liabilities
Derivative liabilities 289,491,818 5,099,881 277,767,841 6,624,096 - - 97,551,618
29,700,049,587 11,361,199,314 4,034,493,159 7,634,899,736 6,669,457,377 - 21,868,766,987
Notes to the Financial Statements

147Annual Report 2014/15
39 RELATED PARTY TRANSACTIONS
The Company carried out transactions in the ordinary course of it’s business with parties who are defined as related parties in Sri Lanka Accounting Standard 24 (LKAS 24) ‘ Related Party Disclosures’, the details of which are reported below.
39.1 Identity of Related Parties The Company has related party transactions with, its subsidiary BRAC Lanka Finance PLC, equity accounted investee
Commercial Insurance Brokers (Pvt) Ltd, Lanka ORIX Leasing Company PLC is the main shareholder of the Company and with its Directors.
39.2 Transactions with Key Management Personnel (i) Loans to Directors No loans have been given to the Directors of the Company.
(ii) Compensation of Key Management Personnel According to Sri Lanka accounting Standard 24 “ Related Party Disclosure” key management personnel, are those having
authority and responsibility for planning, directing and controlling the activities of the entity. Accordingly, the Board of directors of the company and it’s parent and personnel holding designation Assistant general manager and above have been classified as Key Management Personnel of the company.
Short-term employment benefits Group Company
2015 2015 2014
Rs. Rs. Rs.
Director fees and other emoluments 32,701,110 32,701,110 24,025,332
Other KMP emoluments 14,996,103 14,996,103 12,278,275
47,697,213 47,697,213 36,303,607
Long-term employment benefits There are no long term employment benefits to Key management Personnel during the year.
(iii) Related party Transactions Accordingly, the value of all transactions carried out by the Group Company with its Related Companies during the year ended 31 March 2015 are summarized bellow.

148Commercial Leasing & Finance PLC
ys;j;alu
GROUP
Name of the Company
Relationship Nature of the Transaction Transaction value for the
year ended31st March 2015
Rs.
Amount duefrom/(to) as at
31/3/2015 Rs.
Amount duefrom/(to) as at
31/3/2014 Rs.
Lanka ORIX Leasing Company PLC
Parent Interest expense (37,822,476)
Transfer of funds 19,739,549,047
Funds received (18,666,719,672)
Handling fee (330,195,165)
Guarantee Fees (3,375,000)
Restructuring Fees (130,000,000)
Asset Hire Expenses (21,821,997)
Settlement of expenses by LOLC (670,582,508)
Loan received 850,000,000
Interest Payable (10,961,687)
Loan Payable (850,000,000)
Secretarial fee paid (994,475)
Expense reimbursements (487,553) (1,247,974,494) -
Commercial Insurance Brokers (Pvt) Ltd
Associate Insurance Commission Received 38,253,269 6,110,793 4,821,464
Lanka ORIX Finance PLC
Interest expenses 2,251,783
Transfer of funds (274,383)
Fund received (4,904,891) (2,653,108) -
Settlement of expenses
LOLC Motors Limited
Fellow Subsidiary
Facilities Granted 78,061,495
Fund Transfer Settlement of Valuation Fee Income
11,037,687
Transfer of Vehicle from LOMO (2,452,462)
Valuation Fee Income of LOMO (11,231,300)
Sale of Motor Vehicle 2,800,000
Balance receivable (2,800,000) 1,317,000 -
Notes to the Financial Statements

149Annual Report 2014/15
Name of the Company
Relationship Nature of the Transaction Transaction value for the
year ended31st March 2015
Rs.
Amount duefrom/(to) as at
31/3/2015 Rs.
Amount duefrom/(to) as at
31/3/2014 Rs.
Lanka ORIX Information Technology Services Ltd
Fellow Subsidiary
Provision for information services 134,200,000
Payments (134,200,000)
Office Equipment purchase (2,752,551) - -
Browns & Company PLC
Fellow Subsidiary
Lease vehicle purchased 51,643,107
CLC Inventory(Stationery)Use by Browns & Company PLC
40,419 40,419 -
Ishara Traders Other Related Party
Lease vehicle purchased 14,589,500
Loan settled during the year 232,122,852
Interest paid 43,281,311 (222,985,018) -
LOLC Micro Credit Ltd.
Fellow Subsidiary
Yard fee (9,265,817)
Settlement of Expenses by LOMC (827,276)
Fund Received (62,700,000)
Fund Transfer (Settlement of Expenses by CLC)
72,273,927 (1,744,389) -
LOLC Factors Ltd. Fellow Subsidiary
Transfer of funds Settlement of expenses 2,000,106
Interest on Loan (12,405,282)
Loan received 500,000,000
Loan settled during the year (500,000,000) (500,000,000) -
LOLC Realty Ltd. Fellow Subsidiary
Rent Fee (16,200,000)
Fund Transfer Settlement of rent fee 18,090,000 (1,350,000) -
Green Paradise Resorts (Private) Limited
Fellow Subsidiary
CLC Inventory(Stationery) Use by Green Paradise Resorts
22,350 22,350 -

150Commercial Leasing & Finance PLC
ys;j;alu
Name of the Company
Relationship Nature of the Transaction Transaction value for the
year ended31st March 2015
Rs.
Amount duefrom/(to) as at
31/3/2015 Rs.
Amount duefrom/(to) as at
31/3/2014 Rs.
Excel Restaurant (Private) Limited
Fellow Subsidiary
CLC Inventory(Stationery) Use by Excel Restaurant
564 564 -
Eden Hotel Lanka PLC
Fellow Subsidiary
CLC Inventory(Stationery) Use by EDEN 24,028 24,028 -
Dikwella Resort (Private) Limited
Fellow Subsidiary
CLC Inventory(Stationery) Use by Dikwella Resorts
2,055 2,055 -
Browns Hotels and Resorts Limited
Fellow Subsidiary
CLC Inventory(Stationery) Use by Browns Hotels
8,223
Fund Received Settlement of Exp by Browns Hotels
(8,223) - -
Galoya Holdings Limited
Fellow Subsidiary
Facilities Granted 2,625,000 - -
Galoya Plantations Limited
Fellow Subsidiary
Facilities Granted 357,278,800 - -
Taprobane Holdings PLC
Other Related party
Interest received on Commercial Paper 63,075,906
Cash received on maturity of Commercial Paper
750,000,000 - -
LOLC Life Insurance Limited
Fellow Subsidiary
Insurance premium payment (2,865,000) - -
LOLC General Insurance Limited
Fellow Subsidiary
Insurance premium payment (92,477) - -
Notes to the Financial Statements

151Annual Report 2014/15
Name of the Company
Relationship Nature of the Transaction Transaction value for the
year ended31st March 2015
Rs.
Amount duefrom/(to) as at
31/3/2015 Rs.
Amount duefrom/(to) as at
31/3/2014 Rs.
COMPANY
Lanka ORIX Leasing Company PLC
Parent Interest expense (26,154,512)
Transfer of funds 19,739,549,047
Funds received (18,666,719,672)
Handling fee (330,195,165)
Guarantee Fees (3,375,000)
Restructuring Fees (130,000,000)
Asset Hire Expenses (21,821,997)
Settlement of expenses by LOLC (670,582,508) (379,047,769) (269,747,963)
BRAC Lanka Finance PLC
Subsidiary Interest on Loan 43,907,729
Facility Granted 1,250,000,000
Loan settlement (1,250,000,000) - -
Fund Transfer 3,212,124 3,212,124 -
Commercial Insurance Brokers (Pvt) Ltd
Associate Insurance Commission Received 38,253,269 6,110,793 4,821,464
Lanka ORIX Finance PLC
Interest expenses 2,251,783
Transfer of funds (274,383)
Fund received (4,904,891) (2,653,108) 274,383
Settlement of expenses
LOLC Motors Limited
Fellow Subsidiary
Facilities Granted 78,061,495
Fund Transfer Settlement of Valuation Fee Income
11,037,687
Transfer of Vehicle from LOMO (2,452,462)
Settlement of expenses LOMO (994,979)
Valuation Fee Income of LOMO (11,231,300) (1,483,000) 2,158,055

152Commercial Leasing & Finance PLC
ys;j;alu
Name of the Company
Relationship Nature of the Transaction Transaction value for the
year ended31st March 2015
Rs.
Amount duefrom/(to) as at
31/3/2015 Rs.
Amount duefrom/(to) as at
31/3/2014 Rs.
Lanka ORIX Information Technology Services Ltd
Fellow Subsidiary
Provision for information services 134,200,000
Payments (134,200,000) - -
Browns & Company PLC
Fellow Subsidiary
Lease vehicle purchased 51,643,107
CLC Inventory(Stationery) Use by Browns & Company PLC
40,419 40,419 -
Ishara Traders Other Related Party
Lease vehicle purchased 8,900,000
Loan settled during the year 232,122,852
Interest paid 43,281,311 (222,985,018) (455,107,870)
LOLC Micro Credit Ltd.
Fellow Subsidiary
Yard fee (9,265,817)
Settlement of Expenses by LOMC (827,276)
Fund Received (62,700,000)
Fund Transfer (Settlement of Expenses by CLC)
72,273,927 (1,744,389) (1,225,223)
LOLC Factors Ltd. Fellow Subsidiary
Transfer of funds Settlement of expenses 2,000,106 - (2,000,106)
LOLC Realty Ltd. Fellow Subsidiary
Rent Fee (16,200,000)
Fund Transfer Settlement of rent fee 18,090,000 (1,350,000) (3,240,000)
Green Paradise Resorts (Private) Limited
Fellow Subsidiary
CLC Inventory(Stationery) Use by Green Paradise Resorts
22,350 22,350 -
Excel Restaurant (Private) Limited
Fellow Subsidiary
CLC Inventory(Stationery) Use by Excel Restaurant
564 564 -
Notes to the Financial Statements

153Annual Report 2014/15
Name of the Company
Relationship Nature of the Transaction Transaction value for the
year ended31st March 2015
Rs.
Amount duefrom/(to) as at
31/3/2015 Rs.
Amount duefrom/(to) as at
31/3/2014 Rs.
Eden Hotel Lanka PLC
Fellow Subsidiary
CLC Inventory(Stationery) Use by EDEN 24,028 24,028 -
Dikwella Resort (Private) Limited
Fellow Subsidiary
CLC Inventory(Stationery) Use by Dikwella Resorts
2,055 2,055 -
Browns Hotels and Resorts Limited
Fellow Subsidiary
CLC Inventory(Stationery) Use by Browns Hotels
8,223
Fund Received Settlement of Exp by Browns Hotels
(8,223) - -
Galoya Holdings Limited
Fellow Subsidiary
Facilities Granted 2,625,000 - -
Galoya Plantations Limited
Fellow Subsidiary
Facilities Granted 357,278,800 - -
Taprobane Holdings PLC
Other Related party
Interest received on Commercial Paper 63,075,906
Cash received on maturity of Commercial Paper
750,000,000 - -
There are no related party transactions other than those disclosed in Note 39 to the financial statements.
39.3 Related party transactions exceeding 10%of the equity or 5% of the total assets of the entity as per Audited financial statements,whichever is lower;
There are no related party transactions that requires specified disclosure in accordance with the continuing listing requirements of Colombo Stock Exchange.

154Commercial Leasing & Finance PLC
ys;j;alu
As at 31st March
Group Company
2015 2015 2014
Rs. Rs. Rs.
40 CONTINGENT LIABILITIES
Guarantees issued to banks and other institutions 3,850,500 3,850,500 7,150,500
41 CAPITAL COMMITMENTS
There were no significant capital commitments which have been approved or contracted for by the Company as at the reporting date except for the following.
As at 31st March
Group Company
2015 2015 2014
Rs. Rs. Rs.
Forward exchange contracts 4,884,350,967 4,884,350,967 6,727,114,122
On this commitment the Company will receive Euro 5,939,975 and US $ 20,629,960, and company will pay Euro 5,939,975 on conversion.
42 EVENTS AFTER REPORTING PERIOD
There have been no material events occurring after the reporting period that require adjustment to or disclosure in these Financial Statements.
43 OTHER MATTERS
The government has announced a super gain tax applicable for the year of assessment 2013/14 . However implications on the Group (if any) are yet to be evaluated after the relevant gazette notification is issued by the Department of Inland Revenue.
Notes to the Financial Statements

155Annual Report 2014/15
44 VALUATION OF FINANCIAL INSTRUMENTS
44.1 Fair Value Hierarchy
GroupCarrying
amount Level 1 Level 2 Level 3 Total
As at 31 March 2015 (Rs.) (Rs.) (Rs.) (Rs.) (Rs.)
Assets
Equity Securities 228,344,666 228,344,666 - - 228,344,666
Derivative assets held for risk management
8,000,000 - 8,000,000 - 8,000,000
236,344,666 228,344,666 8,000,000 - 236,344,666
Investment securities
Available-for-sale investment securities
Corporate bonds 355,209,540 355,209,540 - - 355,209,540
Government securities 1,765,451,175 - - 1,765,451,175 1,765,451,175
Unquoted equity securities 189,750 - - 189,750 189,750
2,120,850,465 355,209,540 - 1,765,640,925 2,120,850,465
2,357,195,131 583,554,206 8,000,000 1,765,640,925 2,357,195,131
44.2 Financial instruments not measured at fair valueThe following table sets out the fair values of financial instruments not measured at fair value and analyses them by the level in the fair value hierarchy into which each fair value measurement is categorised.
Group Level 1 Level 2 Level 3 Total FairValue
Total Carryingamount
As at 31 March 2015 (Rs.) (Rs.) (Rs.) (Rs.) (Rs.)
Assets
Investment securities
Government securities - 355,019,790 1,765,451,175 2,120,470,965 2,120,470,965
Others - 3,764,465,497 3,764,465,497 3,764,465,497
- 355,019,790 5,529,916,672 5,884,936,462 5,884,936,462
Finance lease receivables, hire purchases and operating leasesFinance lease receivables - 12,339,046,929 - 12,339,046,929 12,615,404,889
Hire purchase receivables - 288,090,549 - 288,090,549 199,626,989
- 12,627,137,479 - 12,627,137,479 12,815,031,878
Advances and other loans
Advances and loans - 17,949,817,177 - 17,949,817,177 20,800,941,259
Factoring receivables - - 2,413,882,879 2,413,882,879 2,413,882,879
- 17,949,817,177 2,413,882,879 20,363,700,056 23,214,824,138

156Commercial Leasing & Finance PLC
ys;j;alu
Group Level 1 Level 2 Level 3 Total FairValue
Total Carryingamount
As at 31 March 2015 (Rs.) (Rs.) (Rs.) (Rs.) (Rs.)
Assets
Trade and other current assets
Trade receivable - - 82,672,153 82,672,153 82,672,153
Other financial assets 529,327,791 - 529,327,791 529,327,791
529,327,791 - 82,672,153 611,999,944 611,999,944
529,327,791 30,931,974,446 8,026,471,704 39,487,773,941 42,526,792,421
Liabilities
Deposits liabilities - 9,795,028,601 - 9,795,028,601 9,795,028,601
Interest bearing borrowings
Commercial papers & Promissory Notes
- - - - 13,435,289
Short-term loans and others - - - - 8,734,000,000
Long-term borrowings - - - - 10,926,684,503
- - - - 19,674,119,793
Trade and other payables
Trade payables - - - - 574,323,926
Other financial liabilities - - - - 1,001,590,755
- - - - 1,575,914,681
- 9,795,028,601 - 9,795,028,601 31,045,063,075
Company Carryingamount
Level 1 Level 2 Level 3 Total
As at 31 March 2015 (Rs.) (Rs.) (Rs.) (Rs.) (Rs.)
Trading assets - fair value through profit or loss
Corporate bonds - - - - -
Government securities - - - - -
Equity Securities 228,344,666 228,344,666 - - 228,344,666
Derivative assets held for risk management
8,000,000 - 8,000,000 - 8,000,000
236,344,666 228,344,666 8,000,000 - 236,344,666
Investment securities
Available-for-sale investment securities
Corporate bonds 352,146,025 352,146,025 - - 352,146,025
Notes to the Financial Statements
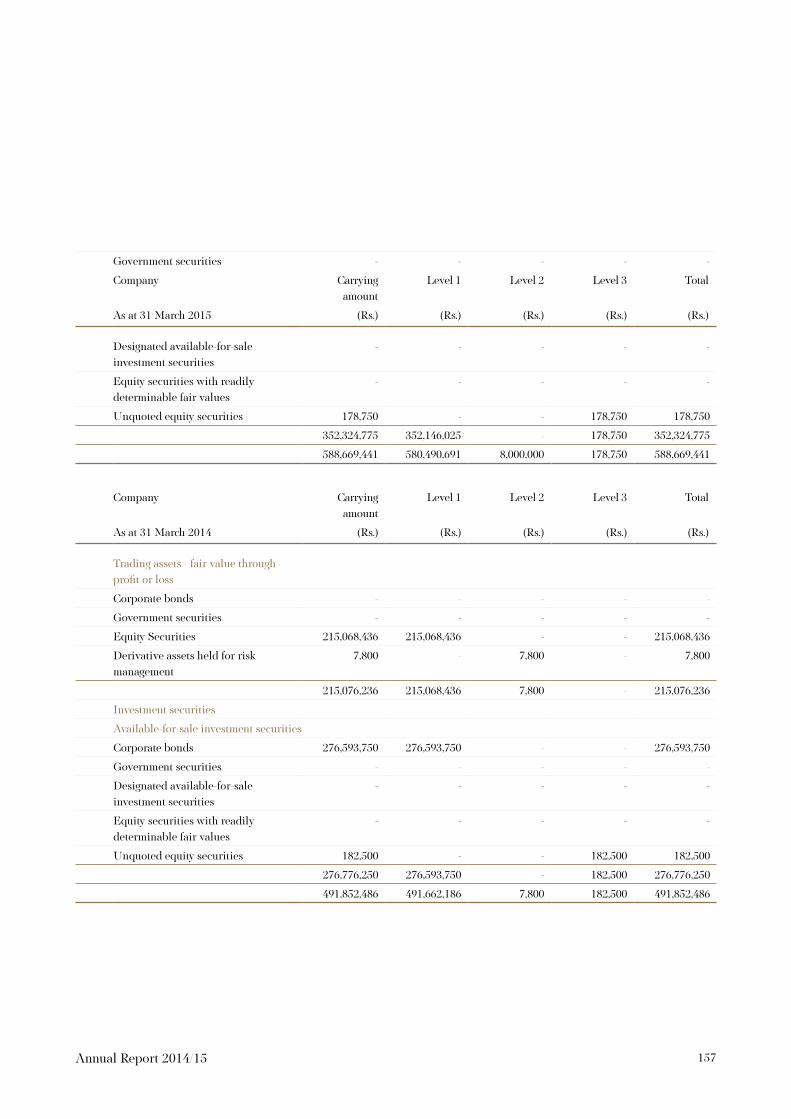
157Annual Report 2014/15
Government securities - - - - -
Company Carryingamount
Level 1 Level 2 Level 3 Total
As at 31 March 2015 (Rs.) (Rs.) (Rs.) (Rs.) (Rs.)
Designated available-for-sale investment securities
- - - - -
Equity securities with readily determinable fair values
- - - - -
Unquoted equity securities 178,750 - - 178,750 178,750
352,324,775 352,146,025 - 178,750 352,324,775
588,669,441 580,490,691 8,000,000 178,750 588,669,441
Company Carryingamount
Level 1 Level 2 Level 3 Total
As at 31 March 2014 (Rs.) (Rs.) (Rs.) (Rs.) (Rs.)
Trading assets - fair value through profit or loss
Corporate bonds - - - - -
Government securities - - - - -
Equity Securities 215,068,436 215,068,436 - - 215,068,436
Derivative assets held for risk management
7,800 - 7,800 - 7,800
215,076,236 215,068,436 7,800 - 215,076,236
Investment securities
Available-for-sale investment securities
Corporate bonds 276,593,750 276,593,750 - - 276,593,750
Government securities - - - - -
Designated available-for-sale investment securities
- - - - -
Equity securities with readily determinable fair values
- - - - -
Unquoted equity securities 182,500 - - 182,500 182,500
276,776,250 276,593,750 - 182,500 276,776,250
491,852,486 491,662,186 7,800 182,500 491,852,486

158Commercial Leasing & Finance PLC
ys;j;alu
Company As at 31 March 2015
Level 1 Level 2 Level 3 Total Fair Value
Total Carrying amount
(Rs.) (Rs.) (Rs.) (Rs.) (Rs.)
Assets
Investment securities
Government securities - 351,967,275 1,750,000,000 2,101,967,275 2,101,967,275
Others - 3,764,644,247 3,764,644,247 3,764,644,247
- 351,967,275 5,514,644,247 5,866,611,522 5,866,611,522
Finance lease receivables, hire purchases and operating leases
Finance lease receivables - 12,297,792,632 - 12,297,792,632 12,574,150,592
Hire purchase receivables - 233,034,007 - 233,034,007 144,570,447
- 12,530,826,639 - 12,530,826,639 12,718,721,039
Advances and other loans
Advances and loans - 14,998,678,635 14,998,678,635 17,849,802,717
Factoring receivables - - 2,413,882,879 2,413,882,879 2,413,882,879
- 14,998,678,635 2,413,882,879 17,412,561,514 20,263,685,596
Trade and other current assets
Trade receivable - - 82,672,153 82,672,153.49 82,672,153
Other financial assets - - - - -
- - 82,672,153 82,672,153 82,672,153
- 27,881,472,549 8,011,199,279 35,892,671,828 38,931,690,310
Liabilities
Deposits liabilities - 8,481,734,594 - 8,481,734,594 9,380,862,898
Interest bearing borrowings
Commercial papers & Promissory Notes - - - - 13,435,289
Short-term loans and others - - - - 8,734,000,000
Long-term borrowings - - - - 9,726,427,081
- - - - 18,473,862,370
Trade and other payables
Trade payables - - - - 549,080,964
Other financial liabilities - - - - 750,020,593
- - - - 1,299,101,557
- 8,481,734,594 - 8,481,734,594 29,153,826,825
Notes to the Financial Statements

159Annual Report 2014/15
Company As at 31 March 2014
Level 1 Level 2 Level 3 Total Fair Value
Total Carrying amount
(Rs.) (Rs.) (Rs.) (Rs.) (Rs.)
Assets
Investment securities
Loans & receivables - - - - -
Corporate bonds - - - - -
Government securities - 276,593,750 1,464,638,200 1,741,231,950 1,741,231,950
Others - - 804,084,229 804,084,229 804,084,229
- 276,593,750 2,268,722,429 2,545,316,179 2,545,316,179
Finance lease receivables, hire purchases and operating leases
Finance lease receivables - 12,101,227,126 - 12,101,227,126 12,089,856,060
Hire purchase receivables - 1,099,274,179 - 1,099,274,179 617,566,480
- 13,200,501,306 - 13,200,501,306 12,707,422,540
Advances and other loans
Advances and loans - 9,834,024,758 9,834,024,758 13,059,739,309
Factoring receivables - - 1,803,034,055 1,803,034,055 1,803,034,055
- 9,834,024,758 1,803,034,055 11,637,058,813 14,862,773,365
Trade and other current assets
Trade receivable - - - - -
Other financial assets - - - - 92,617,646
- - - - 92,617,646
- 23,311,119,814 4,071,756,485 27,382,876,299 30,208,129,730
Liabilities
Deposits liabilities - 7,319,014,290 - 7,319,014,290 7,678,277,663
Interest bearing borrowings
Commercial papers & Promissory Notes
- - - - 13,435,289
Short-term loans and others - - - - 1,000,000,000
Debentures - - - - -
Finance lease liabilities - - - - -
Long-term borrowings - - - - 12,423,700,115
- - - - 13,437,135,404
Trade and other payables
Trade payables - - - - 237,163,463
Other financial liabilities - - - - 715,742,373
- - - - 952,905,836
- 7,319,014,290 - 7,319,014,290 22,068,318,902

160Commercial Leasing & Finance PLC
ys;j;alu
45 SEGMENT INFORMATION
Group Business Segment
Leasing Hire Purchase Loans Factoring Others Total
Rs.' 000 Rs.' 000 Rs.' 000 Rs.' 000 Rs.' 000 Rs.' 000
For the year ended 31 March 2015
Total revenue 3,176,330,622 194,588,081 4,011,012,488 521,283,619 791,847,119 8,695,061,930
Net interest cost (883,751,911) (13,984,548) (1,390,124,087) (161,319,466) - (2,449,180,012)
Profit before operating expenses 2,292,578,711 180,603,533 2,620,888,401 359,964,153 791,847,119 6,245,881,918
Operating expenses (1,649,997,573) (171,823,967) (1,549,175,436) (375,270,859) (402,946,768) (4,149,214,603)
Value Added Tax on financial services - (1,809,919) (188,591,880) - - (190,401,799)
Profit from operations 642,581,138 6,969,647 883,121,085 (15,306,706) 388,900,351 1,906,265,516
For the year ended 31 March 2015
Capital expenditure - - - - 98,146,620 98,146,620
Depreciation of property plant and
equipment
- - - - 130,593,987 130,593,987
Provision for/(reversal of provision
for)doubtful debts and bad debts
written off
620,134,912 90,841,891 387,240,970 213,569,261 39,137,826 1,350,924,860
As at 31- March -2015
Total assets 12,615,404,889 199,626,989 20,800,941,259 2,413,882,879 9,399,222,303 45,429,078,319
Total liabilities 12,286,724,847 194,425,935 19,326,772,524 2,242,810,300 1,211,816,094 35,262,549,698
Company Business Segment
Leasing Hire Purchase Loans Factoring Others Total
Rs.' 000 Rs.' 000 Rs.' 000 Rs.' 000 Rs.' 000 Rs.' 000
For the year ended 31 March 2015
Total revenue 3,167,943,741 184,586,693 3,715,875,441 521,283,619 578,882,586 8,168,572,080
Interest cost (942,471,724) (10,842,967) (1,279,797,000) (172,991,444) - (2,406,103,135)
Profit before operating expenses 2,225,472,017 173,743,726 2,436,078,441 348,292,175 578,882,586 5,762,468,945
Operating expenses (1,601,512,242) (154,343,565) (1,443,982,171) (368,448,201) (299,408,990) (3,867,695,169)
Value Added Tax on financial
services
- (1,381,236) (167,757,409) - - (169,138,645)
Profit from operations 623,959,775 18,018,925 824,338,861 (20,156,026) 279,473,596 1,725,635,132
Notes to the Financial Statements

161Annual Report 2014/15
Company Business Segment
Leasing Hire Purchase Loans Factoring Others Total
Rs.' 000 Rs.' 000 Rs.' 000 Rs.' 000 Rs.' 000 Rs.' 000
For the year ended 31 March 2014
Total revenue 3,461,715,538 580,045,622 2,777,733,048 694,703,244 252,729,184 7,766,926,636
Net interest cost (1,348,582,693) (68,887,459) (1,424,897,872) (196,722,103) - (3,039,090,127)
Profit before operating expenses 2,113,132,845 511,158,163 1,352,835,177 497,981,141 252,729,184 4,727,836,509
Operating expenses (1,502,209,620) (277,518,084) (860,089,730) (584,573,911) (106,666,316) (3,331,057,661)
Value Added Tax on financial
services
- (5,199,905) (109,962,910) - - (115,162,815)
Profit from operations 610,923,225 228,440,173 382,782,537 (86,592,771) 146,062,868 1,281,616,033
For the year ended 31 March 2015
Allowance for impairment
and write off
611,884,101 77,230,687 376,108,730 213,569,261 38,937,826 1,317,730,605
For the year ended 31 March 2014
Allowance for impairment
and write off
513,928,739 38,456,995 227,388,788 351,674,520 - 1,131,449,042
As at 31 March 2015
Total assets 12,089,856,060 617,566,480 13,059,739,309 1,803,034,055 14,815,146,340 42,385,342,245
Total liabilities 10,313,182,294 526,811,540 10,896,796,746 1,504,417,137 9,028,748,811 32,269,956,528
As at 31 March 2014
Total assets 12,089,856,060 617,566,480 13,059,739,309 1,803,034,055 5,363,717,238 32,933,913,143
Total liabilities 10,313,182,294 526,811,540 10,896,796,746 1,504,417,137 836,497,326 24,077,705,043

162Commercial Leasing & Finance PLC
ys;j;alu
46 FINANCIAL RISK MANAGEMENT
Overview The Company has exposure to the following risks from financial instruments:
1 Credit risk
2 Liquidity risk
3 Market risk
4 Operational risk
This note presents information about the Company’s exposure to each of the above risks, the Company’s objectives, policies and processes for measuring and managing risk, and the Company’s management of capital.
Risk management framework The board of directors has overall responsibility for the establishment and oversight of the Company’s risk management
framework. The Board has established the Integrated Risk Management Committee (IRMC), which are responsible for developing and monitoring Company risk management policies in their specified areas. All Board committees have both executive and non-executive members and report regularly to the board of directors on their activities.
The Company’s risk management policies are established to identify and analyse the risks faced by the Company, to set appropriate risk limits and controls, and to monitor risks and adherence to limits. Risk management policies and systems are reviewed regularly to reflect changes in market conditions, products and services offered. The Company, through its training and management standards and procedures, aims to develop a disciplined and constructive control environment, in which all employees understand their roles and obligations.
The Company Audit Committee and the IRMC are responsible for monitoring compliance with the Company’s risk management policies and procedures, and for reviewing the adequacy of the risk management framework in relation to the risks faced by the Company. The Company Audit Committee is assisted in these functions by Enterprise Risk Management division (ERM). ERM undertakes both regular and ad-hoc reviews of risk management controls and procedures, the results of which are reported to the Company Audit Committee.
Credit risk Credit risk is the risk of financial loss to the Company if a customer or counterparty to a financial instrument fails to
meet its contractual obligations, and arises principally from the Company’s loans and advances to customers and other Company’s, and investment debt securities. For risk management purposes, credit risk arising on trading assets is managed independently.
Management of credit risk Facilities granted to customers (Lease / Hire purchase / Loans) Credit department has a Credit committee formed internally, is responsible for management of the Company’s credit risk,
including:
1. Formulating credit policies in consultation with Branch and Regional Heads, covering collateral requirements, credit assessment, risk grading and reporting, documentary and legal procedures, and compliance with regulatory and statutory requirements.
Notes to the Financial Statements

163Annual Report 2014/15
2. Establishing the authorization structure for the approval and renewal of credit facilities. Authorization limits are allocated to branch and Regional Heads, Senior Marketing Officers at Head Office. Larger facilities require approval by Company/Group Credit, Head of Company Credit, Company Credit Committee or the board of directors as appropriate.
3. Reviewing and assessing credit risk. Company Credit assesses all credit exposures in excess of designated limits, prior to facilities being committed to customers by the business unit concerned. Renewals and reviews of facilities are subject to the same review process.
4. Limiting concentrations of exposure to counterparties, geographies and industries (for loans and advances), and by issuer, credit rating band and market liquidity (for investment securities).
5. Developing and maintaining the Company’s risk grading in order to categorize exposures according to the degree of risk of financial loss faced and to focus management on the attendant risks. The risk grading system is used in determining where impairment provisions may be required against specific credit exposures. The current risk grading framework consists of eight grades reflecting varying degrees of risk of default and the availability of collateral or other credit risk mitigation. The responsibility for setting risk grades lies with the final approving executive/committee as appropriate. Risk grades are subject to regular reviews by Company Risk.
6. Reviewing compliance of business units with agreed exposure limits, including those for selected industries, country risk and product types. Regular reports on the credit quality of local portfolios are provided to Company Credit who may require appropriate corrective action to be taken.
7. Providing advice, guidance and specialist skills to business units to promote best practice throughout the Company in the management of credit risk.
Each Branch and Regional Head is required to implement Company credit policies and procedures, with credit approval authorities delegated from the Company Credit Committee. Each Branch and Regional Head is responsible for the quality and performance of its credit portfolio and for monitoring and controlling all credit risks in its portfolios, including those subject to central approval.
Regular audits of business units and Company Credit processes are undertaken by ERM.
Allowances for impairment The Company establishes an allowance for impairment losses on assets carried at amortized cost that represents its
estimate of incurred losses in its lease and loan portfolio. The main components of this allowance are a specific loss component that relates to individually significant exposures, and, for assets measured at amortised cost, a collective loan loss allowance established for groups of homogeneous assets as well as for individually significant exposures that were subject to individual assessment for impairment but not found to be individually impaired.
Write-off policy The Company writes off a loan or an investment debt security balance, and any related allowances for impairment
losses, when Board of Directors determines that the loan or security is uncollectible. This determination is made after considering information such as the occurrence of significant changes in the borrower’s/issuer’s financial position such that the borrower/issuer can no longer pay the obligation, or that proceeds from collateral will not be sufficient to pay back the entire exposure. For smaller balance standardized loans, write-off decisions generally are based on a product-specific past due status.

164Commercial Leasing & Finance PLC
ys;j;alu
Exposure to credit risk
Group Company
Finance lease Hire Purchase Total Finance lease Hire Purchase Total
Rs' Rs' Rs' Rs' Rs' Rs'
1. Lease and hire purchase portfolio
Carrying amount 12,615,404,889 199,626,989 12,815,031,878 12,574,150,592 144,570,447 12,718,721,039
Assets at amortized cost
Individually impaired
Gross amount 26,789,500 12,386,259 39,175,759 18,694,969 165,602 18,860,571
Allowance for impairment (26,789,500) (12,386,259) (39,175,759) (18,694,969) (165,602) (18,860,571)
Carrying amount - - - - - -
for the rest of portfolio where
collective impairment is applicable
Gross amount 12,840,222,633 229,325,764 13,069,548,397 12,796,848,007 166,153,631 12,963,001,638
Allowance for impairment (224,817,745) (29,698,775) (254,516,520) (222,697,415) (21,583,184) (244,280,599)
Carrying amount 12,615,404,888 199,626,989 12,815,031,877 12,574,150,592 144,570,447 12,718,721,039
12,615,404,888 199,626,989 12,815,031,877 12,574,150,592 144,570,447 12,718,721,039
Advances andloans
Factoringreceivables
Total Advances andloans
Factoringreceivables
Total
Rs' Rs' Rs' Rs' Rs' Rs'
2. Advances and other loans
Carrying amount 20,800,941,259 2,413,882,879 23,214,824,138 17,849,802,717 2,413,882,879 20,263,685,596
Assets at amortized cost
Individually impaired
Gross amount 18,096,671 343,024,081 361,120,752 11,278,949 343,024,081 354,303,030
Allowance for impairment (18,096,671) (343,024,081) (361,120,752) (11,278,949) (343,024,081) (354,303,030)
Carrying amount - - - - - -
for the rest of portfolio where collective impairment is applicable
Gross amount 21,032,193,372 2,435,092,931 23,467,286,303 18,073,563,124 2,435,092,931 20,508,656,055
Allowance for impairment (231,252,113) (21,210,052) (252,462,164) (223,760,407) (21,210,052) (244,970,459)
Carrying amount 20,800,941,259 2,413,882,879 23,214,824,139 17,849,802,717 2,413,882,879 20,263,685,596
20,800,941,259 2,413,882,879 23,214,824,139 17,849,802,717 2,413,882,879 20,263,685,596
Notes to the Financial Statements

165Annual Report 2014/15
3. Trade & Other Receivables The Company’s exposure to credit risk is influenced mainly by the individual characteristics of each customer. However,
management also considers the demographics of the Company’s customer base, including the default risk of the industry in which customers operate, as these factors may have an influence on credit risk.
The Credit Committee has established a credit policy under which each new customer is analysed individually for creditworthiness before the Company’s standard payment and delivery terms and conditions are offered. The Company’s review includes external ratings, when available, and in some cases Company references. Purchase limits are established for each customer, which represents the maximum open amount without requiring approval from the Credit Committee ; these limits are reviewed quarterly. Customers that fail to meet the Company’s benchmark creditworthiness may transact with the Company only on a prepayment basis.
More than 59 percent of the Company’s customers have been transacting with the Company for over one year. In monitoring customer credit risk, customers are Companied according to their credit characteristics, including whether they are an individual or legal entity, whether they are a wholesale, retail or end-user customer, geographic location, industry, aging profile, maturity and existence of previous financial difficulties.
4. Cash and cash equivalents The Company held cash and cash equivalents of Rs.516 Million at 31 March 2015 (2014: Rs.736 Million) which
represents its maximum credit exposure on these assets.
5. Excessive risk concentration Concentrations arise when a number of counterparties are engaged in similar business activities, or activities in the
same geographical region, or have economic features that would cause their ability to meet contractual obligations to be similarly affected by changes in economic, political or other conditions. Concentrations indicate the relative sensitivity of the Company’s performance to developments affecting a particular industry.
In order to avoid excessive concentrations of risk, the Company’s policies and procedures include specific guidelines to focus on maintaining a diversified portfolio. Identified concentrations of credit risks are controlled and managed accordingly. Selective hedging is used within the Company to manage risk concentrations at both the relationship and industry levels.
Liquidity risk Liquidity risk is the risk that the Company will encounter difficulty in meeting obligations associated with its financial
liabilities that are settled by delivering cash or another financial asset.
Management of liquidity risk The Company’s approach to managing liquidity is to ensure, as far as possible, that it will always have sufficient liquidity
to meet its liabilities when due, under both normal and stressed conditions, without incurring unacceptable losses or risking damage to the Company’s reputation.
Company central Treasury receives information from other business units regarding the liquidity profile of their financial assets and liabilities and details of other projected cash flows arising from projected future business. Company central Treasury then maintains a portfolio of short-term liquid assets, largely made up of short-term liquid investment securities, loans and advances to Company’s and other inter-Company facilities, to ensure that sufficient liquidity is maintained within the Company as a whole. The liquidity requirements of business units and subsidiaries are met through short-term loans from Company central Treasury to cover any short-term fluctuations and longer term funding to address any structural liquidity requirements.
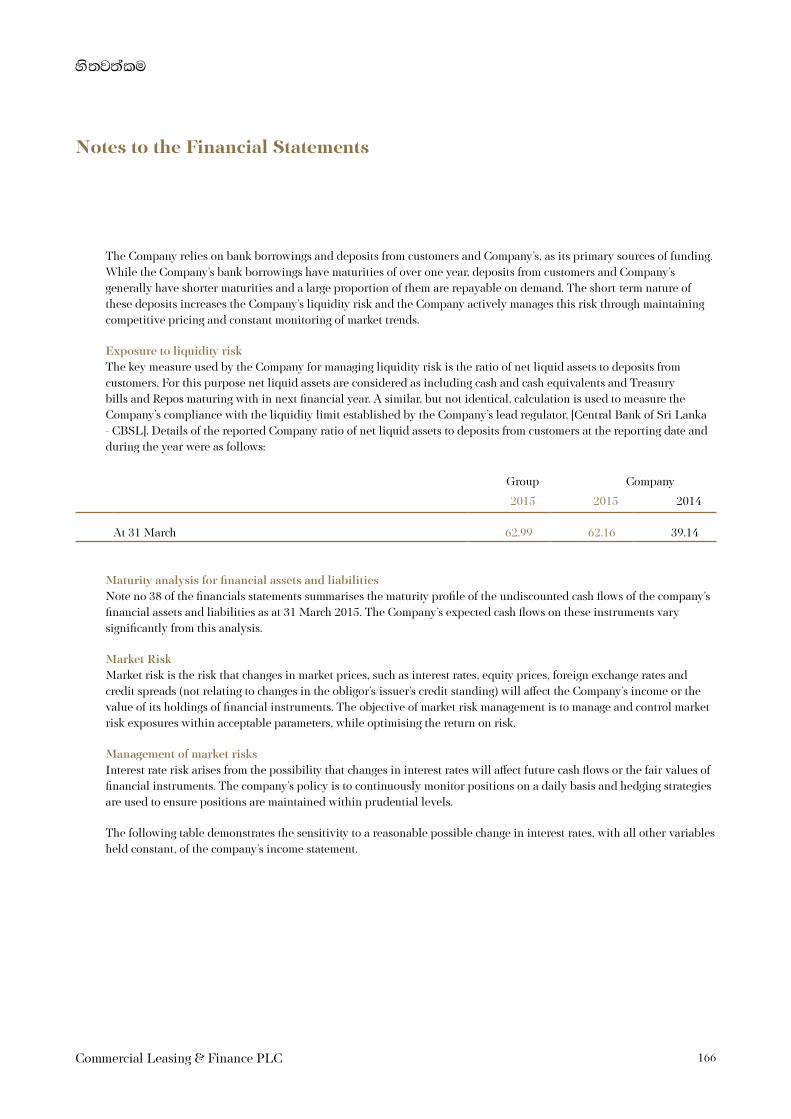
166Commercial Leasing & Finance PLC
ys;j;alu
The Company relies on bank borrowings and deposits from customers and Company’s, as its primary sources of funding. While the Company’s bank borrowings have maturities of over one year, deposits from customers and Company’s generally have shorter maturities and a large proportion of them are repayable on demand. The short-term nature of these deposits increases the Company’s liquidity risk and the Company actively manages this risk through maintaining competitive pricing and constant monitoring of market trends.
Exposure to liquidity risk The key measure used by the Company for managing liquidity risk is the ratio of net liquid assets to deposits from
customers. For this purpose net liquid assets are considered as including cash and cash equivalents and Treasury bills and Repos maturing with in next financial year. A similar, but not identical, calculation is used to measure the Company’s compliance with the liquidity limit established by the Company’s lead regulator, [Central Bank of Sri Lanka - CBSL]. Details of the reported Company ratio of net liquid assets to deposits from customers at the reporting date and during the year were as follows:
Group Company
2015 2015 2014
At 31 March 62.99 62.16 39.14
Maturity analysis for financial assets and liabilities Note no 38 of the financials statements summarises the maturity profile of the undiscounted cash flows of the company’s
financial assets and liabilities as at 31 March 2015. The Company’s expected cash flows on these instruments vary significantly from this analysis.
Market Risk Market risk is the risk that changes in market prices, such as interest rates, equity prices, foreign exchange rates and
credit spreads (not relating to changes in the obligor’s/issuer’s credit standing) will affect the Company’s income or the value of its holdings of financial instruments. The objective of market risk management is to manage and control market risk exposures within acceptable parameters, while optimising the return on risk.
Management of market risks Interest rate risk arises from the possibility that changes in interest rates will affect future cash flows or the fair values of
financial instruments. The company’s policy is to continuously monitor positions on a daily basis and hedging strategies are used to ensure positions are maintained within prudential levels.
The following table demonstrates the sensitivity to a reasonable possible change in interest rates, with all other variables held constant, of the company’s income statement.
Notes to the Financial Statements

167Annual Report 2014/15
Group Company
If Market rates up by 1 % the effect
of the same to the Interest Income/
(Expense)Rs.
If Market rates drop by 1 % the
effect of the same to the Interest
Income/(Expense)Rs
If Market rates up by 1 % the effect
of the same to the Interest Income/
(Expense)Rs
If Market rates drop by 1 % the
effect of the same to the Interest
Income/(Expense)Rs
Effect on Rate sensitive Assets 210,502,900 (210,502,900) 180,848,421 (180,848,421)
Effect on Rate sensitive Liabilities (117,058,805) 117,058,805 (120,235,698) 120,235,698
Sensitivity of profit or loss 93,444,095 (93,444,095) 60,612,723 (60,612,723)
Operational Risk Operational risk is the risk of direct or indirect loss arising from a wide variety of causes associated with the Company’s
involvement with financial instruments, including processes, personnel, technology and infrastructure, and from external factors other than credit, market and liquidity risks such as those arising from legal and regulatory requirements and generally accepted standards of corporate behaviour.
The Company’s objective is to manage operational risk so as to balance the avoidance of financial losses and damage to the Company’s reputation with overall cost effectiveness and to avoid control procedures that restrict initiative and creativity.
The primary responsibility for the development and implementation of controls to address operational risk is assigned to senior management within each business unit. This responsibility is supported by the development of overall Company standards for the management of operational risk in the following areas:
Requirements for appropriate segregation of duties, including the independent authorisation of transactions;
• Requirements for the reconciliation and monitoring of transactions;
• compliance with regulatory and other legal requirements;
• documentation of controls and procedures;
• requirements for the periodic assessment of operational risks faced, and the adequacy of controls and procedures to address the risks identified;
• requirements for the reporting of operational losses and proposed remedial action;
• training and professional development;
• ethical and business standards; and
• risk mitigation, including insurance where this is effective.
Compliance with Company standards is supported by a programme of periodic reviews undertaken by ERM. The results of ERM reviews are discussed with the department heads to which they relate, with summaries submitted to the Audit Committee and senior management of the Company.
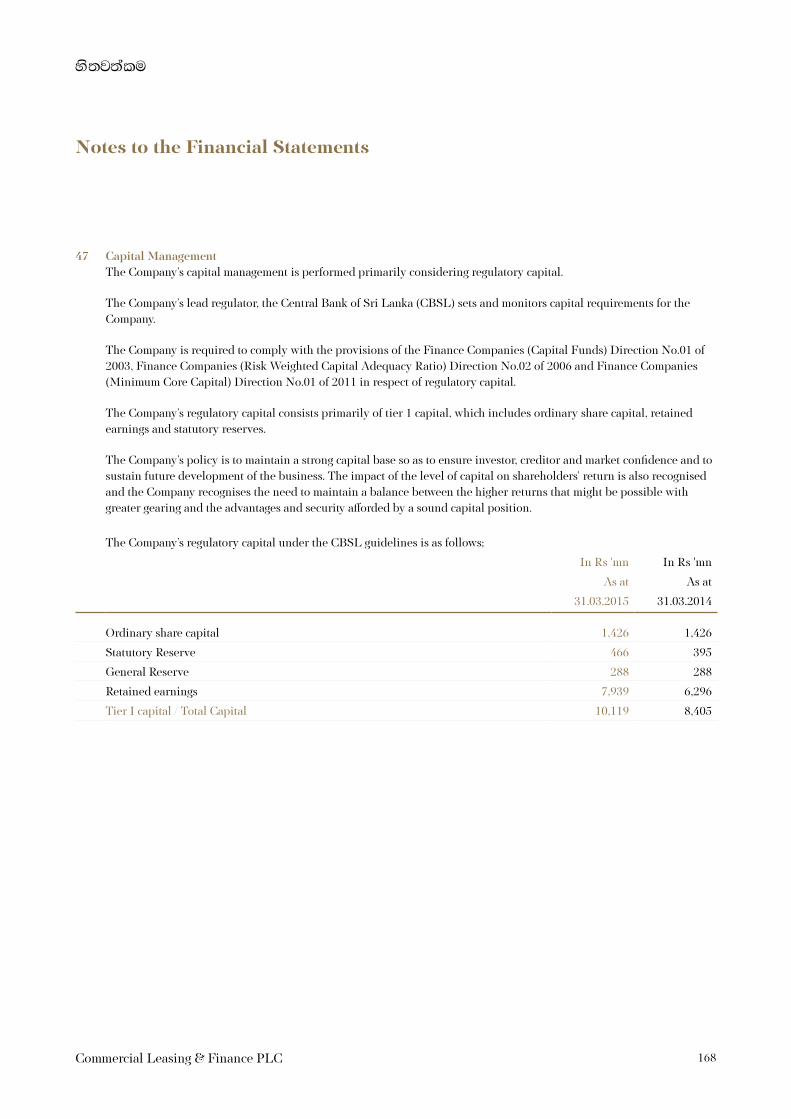
168Commercial Leasing & Finance PLC
ys;j;alu
47 Capital Management The Company’s capital management is performed primarily considering regulatory capital.
The Company’s lead regulator, the Central Bank of Sri Lanka (CBSL) sets and monitors capital requirements for the Company.
The Company is required to comply with the provisions of the Finance Companies (Capital Funds) Direction No.01 of 2003, Finance Companies (Risk Weighted Capital Adequacy Ratio) Direction No.02 of 2006 and Finance Companies (Minimum Core Capital) Direction No.01 of 2011 in respect of regulatory capital.
The Company’s regulatory capital consists primarily of tier 1 capital, which includes ordinary share capital, retained earnings and statutory reserves.
The Company’s policy is to maintain a strong capital base so as to ensure investor, creditor and market confidence and to sustain future development of the business. The impact of the level of capital on shareholders’ return is also recognised and the Company recognises the need to maintain a balance between the higher returns that might be possible with greater gearing and the advantages and security afforded by a sound capital position.
The Company’s regulatory capital under the CBSL guidelines is as follows;
In Rs 'mn In Rs 'mn
As at As at
31.03.2015 31.03.2014
Ordinary share capital 1,426 1,426
Statutory Reserve 466 395
General Reserve 288 288
Retained earnings 7,939 6,296
Tier I capital / Total Capital 10,119 8,405
Notes to the Financial Statements
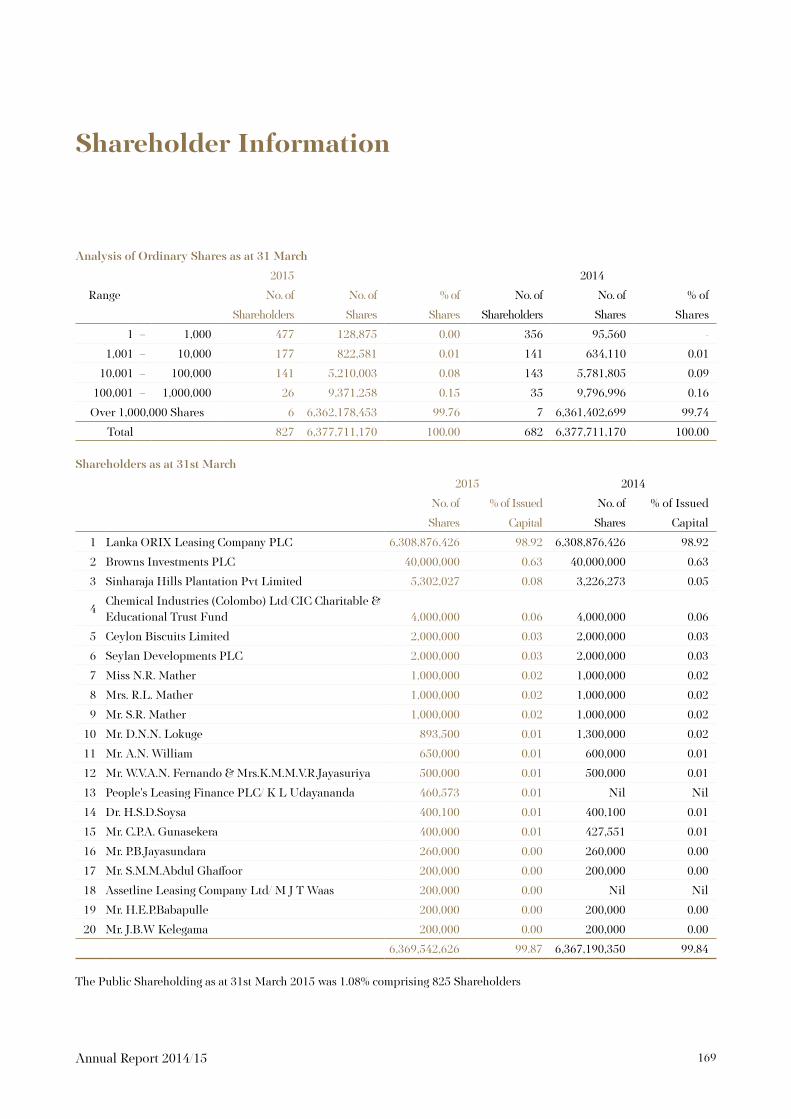
169Annual Report 2014/15
Shareholder Information
Analysis of Ordinary Shares as at 31 March
2015 2014
Range No. of No. of % of No. of No. of % of
Shareholders Shares Shares Shareholders Shares Shares
1 – 1,000 477 128,875 0.00 356 95,560 -
1,001 – 10,000 177 822,581 0.01 141 634,110 0.01
10,001 – 100,000 141 5,210,003 0.08 143 5,781,805 0.09
100,001 – 1,000,000 26 9,371,258 0.15 35 9,796,996 0.16
Over 1,000,000 Shares 6 6,362,178,453 99.76 7 6,361,402,699 99.74
Total 827 6,377,711,170 100.00 682 6,377,711,170 100.00
Shareholders as at 31st March
2015 2014
No. of % of Issued No. of % of Issued
Shares Capital Shares Capital
1 Lanka ORIX Leasing Company PLC 6,308,876,426 98.92 6,308,876,426 98.92
2 Browns Investments PLC 40,000,000 0.63 40,000,000 0.63
3 Sinharaja Hills Plantation Pvt Limited 5,302,027 0.08 3,226,273 0.05
4Chemical Industries (Colombo) Ltd/CIC Charitable & Educational Trust Fund 4,000,000 0.06 4,000,000 0.06
5 Ceylon Biscuits Limited 2,000,000 0.03 2,000,000 0.03
6 Seylan Developments PLC 2,000,000 0.03 2,000,000 0.03
7 Miss N.R. Mather 1,000,000 0.02 1,000,000 0.02
8 Mrs. R.L. Mather 1,000,000 0.02 1,000,000 0.02
9 Mr. S.R. Mather 1,000,000 0.02 1,000,000 0.02
10 Mr. D.N.N. Lokuge 893,500 0.01 1,300,000 0.02
11 Mr. A.N. William 650,000 0.01 600,000 0.01
12 Mr. W.V.A.N. Fernando & Mrs.K.M.M.V.R.Jayasuriya 500,000 0.01 500,000 0.01
13 People's Leasing Finance PLC/ K L Udayananda 460,573 0.01 Nil Nil
14 Dr. H.S.D.Soysa 400,100 0.01 400,100 0.01
15 Mr. C.P.A. Gunasekera 400,000 0.01 427,551 0.01
16 Mr. P.B.Jayasundara 260,000 0.00 260,000 0.00
17 Mr. S.M.M.Abdul Ghaffoor 200,000 0.00 200,000 0.00
18 Assetline Leasing Company Ltd/ M J T Waas 200,000 0.00 Nil Nil
19 Mr. H.E.P.Babapulle 200,000 0.00 200,000 0.00
20 Mr. J.B.W Kelegama 200,000 0.00 200,000 0.00
6,369,542,626 99.87 6,367,190,350 99.84
The Public Shareholding as at 31st March 2015 was 1.08% comprising 825 Shareholders

170Commercial Leasing & Finance PLC
ys;j;alu
Highest, Lowest and Closing Share Prices as at 31 March
2015 2014
Rs. Rs.
Highest 5.50 5.00
Lowest 3.80 3.30
Closing 4.00 3.80 Shareholding as at 31 March
2015 2014
No. of % of No. of % of
Residents 6,377,683,170 100.00 6,377,710,170 100.00
Non Residents 28,000 - 1,000 -
Total 6,377,711,170 100.00 6,377,711,170 100.00
Shareholder Information

171Annual Report 2014/15
Summarised quarterly Statistics
Company Income Statement (Rs.‘000)
2014/15 2013/14
For the 3 month ended 30-Jun 30-Sep 31-Dec 31-Mar 30-Jun 30-Sep 31-Dec 31-Mar
Gross income 1,825,897 1,940,630 1,963,138 1,860,024 1,745,967 1,890,863 1,932,681 1,944,687
Other Income/(Expenses) 136,989 109,307 96,677 238,535 49,835 12,524 18,760 178,748
Interest Costs (636,069) (580,405) (596,725) (592,904) (668,517) (661,955) (778,583) (930,036)
Profit before operating expenses 1,326,817 1,469,532 1,463,090 1,505,656 1,127,285 1,241,432 1,172,858 1,193,399
Other operating expenses (945,528) (781,337) (832,488) (1,477,481) (719,779) (898,562) (758,113) (1,069,764)
Results from operating activities 381,289 688,195 630,602 28,175 407,506 342,870 414,745 123,635
Income tax expense (106,273) (192,696) (178,216) 174,946 (112,995) (117,453) (129,465) 7,117
Net profit after tax 275,016 495,499 452,386 203,121 294,511 225,417 285,280 130,752
Balance sheet (Rs.‘000) As at 30-Jun-14 30-Sep -14 31-Dec -14 31-Mar -15 30-Jun-13 30-Sep-13 31-Dec-13 31-Mar-14
Assets 33,400,106 37,444,128 39,845,975 42,385,342 28,416,689 29,447,081 31,772,053 32,933,914
Liabilities 24,290,786 27,801,545 29,628,250 32,269,957 20,326,808 21,106,555 23,184,257 24,077,705
Net Assets 9,109,320 9,642,583 10,217,725 10,115,386 8,089,881 8,340,526 8,587,796 8,856,209
Share capital & reserves 9,109,320 9,642,583 10,217,725 10,115,386 8,089,881 8,340,526 8,587,796 8,856,209
Share capital 1,425,947 1,425,947 1,425,947 1,425,947 1,425,947 1,425,947 1,425,947 1,425,947
Reserves 7,683,373 8,216,636 8,791,778 8,689,439 6,663,934 6,914,579 7,161,849 7,430,262
Group Income Statement (Rs.‘000)
2014/15 2013/14
For the 3 months ended 30-Jun 30-Sep 31-Dec 31-Mar 30-Jun 30-Sep 31-Dec 31-Mar
Gross income 1,825,897 1,969,555 2,056,775 2,054,821 - - - -
Other Income/(Expenses) 136,989 95,665 115,543 442,442 - - - -
Interest Costs (636,069) (617,491) (623,999) (571,621) - - - -
Profit before operating expenses 1,326,817 1,447,729 1,548,319 1,925,642 - - - -
Other operating expenses (945,528) (770,912) (908,235) (1,714,941) - - - -
Results from operating activities 381,289 676,818 640,084 210,701 - - - -
Income tax expense (106,273) (192,695) (178,883) 161,968 - - - -
Net profit after tax 275,016 484,123 461,201 372,669 - - - -
Balance sheet (Rs.‘000) As at 30-Jun-14 30-Sep -14 31-Dec -14 31-Mar -15 30-Jun-13 30-Sep-13 31-Dec-13 31-Mar-14
Assets 33,400,106 37,935,440 41,746,088 45,429,078 - - - -
Liabilities 24,290,786 28,058,120 31,644,037 35,262,550 - - - -
Net Assets 9,109,320 9,877,320 10,102,051 10,166,529 - - - -
Share capital,reserves & non controlling interest 9,109,320 9,877,320 10,102,051 10,166,529 - - - -
Share capital 1,425,947 1,425,947 1,425,947 1,425,947 - - - -
Reserves 7,683,373 8,212,712 8,641,005 8,697,330 - - - -
Non controlling interest - 238,661 35,099 43,252

172Commercial Leasing & Finance PLC
ys;j;alu
Ten Year Summary
Company
For the year ended 31st December 31st March
(Rs. 'Mn) 2005 2006 2007 2008/09 2010 2011 2012 2013 2014 2015
Operating Results
Profit before interest 766 1,053 1,399 2,146 1,722 2,047 5,405 4,110 4,321 4,132
Profit before tax 313 368 406 514 362 741 3,245 1,603 1,289 1,728
Profit after tax 209 268 328 415 354 664 2,964 1,168 936 1,426
Assets
Total assets 5,927 7,745 7,976 9,451 12,534 21,351 26,398 27,229 32,934 42,385
Liabilities
Total Liabilities 5,321 6,708 6,681 7,776 10,505 17,656 19,635 19,392 24,078 32,270
Shareholders' Funds
Stated capital 261 418 418 418 418 1,426 1,426 1,426 1,426 1,426
Reserves 344 620 878 1,257 1,612 2,269 5,337 6,411 7,430 8,689
Shareholders' funds 605 1,038 1,296 1,675 2,030 3,695 6,763 7,837 8,856 10,115
Investor Ratios
Long term borrowings to shareholders funds 2.25:1 2.22:1 2.02:1 0.94:1 0.69:1 1.85:1 1.43:1 0.58:1 0.83:1 0.66:1
Total borrowings to shareholders funds 6.18:1 5.63:1 4.1:1 4.64:1 4.55:1 4.19:1 2.73:1 1.87:1 1.62:1 2.91:1
Book value per share (Rs.) -Adjusted 0.09 0.16 0.20 0.26 0.32 0.58 1.06 1.23 1.39 1.59
Earnings per share(Rs.)-Adjusted 0.03 0.04 0.05 0.07 0.06 0.10 0.46 0.18 0.15 0.22
Return on capital employed(%) 28 26 25 28 19 23 57 16 11 15
Return on assets(%) 4 3 4 2 3 4 12 4 3 4
Gross dividends(Rs. Mn) 79.41 70.58 70.58 35.29 - - - - - -
Non Financial Information
Number of branches 10 11 11 22 26 40 50 53 53 58
Number of employees 188 211 221 276 388 413 511 539 610 670

173Annual Report 2014/15
Sources and Distribution of Income
Company
2007 2008/09 2009/10 2010/11 2011/12 2012/13 2013/14 2014/15
Rs.'000 Rs.'000 Rs.'000 Rs.'000 Rs.'000 Rs.'000 Rs.'000 Rs.'000
Sources of income
Lease income 889,209 771,110 510,411 854,536 1,837,041 2,591,200 3,162,957 2,820,335
Hire purchase income 955,694 1,571,718 1,414,179 1,633,327 1,708,993 1,055,987 495,423 122,104
Loan income - 7,323 113,129 292,738 732,975 1,330,038 2,645,630 3,450,943
Vehicle hire income 48,380 56,241 42,242 34,133 16,583 13,189 14,046 17,511
Factoring income 113,867 270,410 304,777 460,887 830,050 723,414 694,703 521,284
Interest on overdue rentals 60,659 147,073 110,733 126,866 191,754 281,793 445,595 536,034
Collection from contracts written off 55,843 121,480
Other income 23,169 116,001 116,001 177,757 2,205,055 217,184 259,867 581,506
2,090,978 2,939,876 2,611,472 3,580,244 7,522,451 6,212,805 7,774,064 8,171,197
Distribution of income
To banks and other lenders 1,000,460 1,640,440 1,362,588 1,309,331 2,167,290 2,514,873 3,039,090 2,406,103
To government as taxation 472,061 166,050 166,050 224,778 366,115 550,047 471,911 471,378
To employees as emoluments 134,165 214,870 253,183 381,732 411,034 464,518 571,070 723,426
To providers of services 100,162 228,494 386,355 847,652 1,299,046 1,185,150 1,570,038 1,731,158
To shareholders as dividends 70,583 35,292 - - - -
Depreciation 51,012 66,023 52,636 44,047 47,360 57,178 54,546 95,380
Provision for doubtful debts 53,527 80,454 85,436 115,414 267,322 272,586 1,131,450 1,317,731
Reserves(including provision for deferred taxation) 209,008 508,253 305,224 657,290 2,964,284 1,168,453 935,959 1,426,021
2,090,978 2,939,876 2,611,472 3,580,244 7,522,451 6,212,805 7,774,064 8,171,197
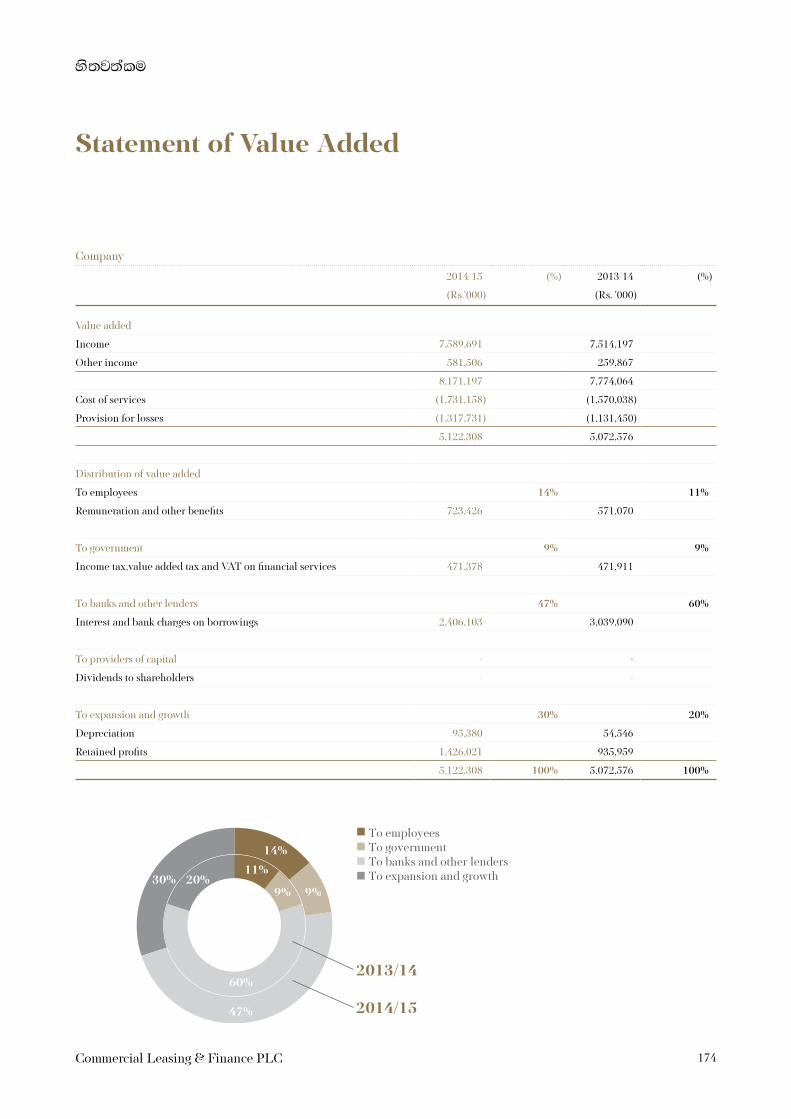
174Commercial Leasing & Finance PLC
ys;j;alu
Company
2014/15 (%) 2013/14 (%)
(Rs.'000) (Rs. '000)
Value added
Income 7,589,691 7,514,197
Other income 581,506 259,867
8,171,197 7,774,064
Cost of services (1,731,158) (1,570,038)
Provision for losses (1,317,731) (1,131,450)
5,122,308 5,072,576
Distribution of value added
To employees 14% 11%
Remuneration and other benefits 723,426 571,070
To government 9% 9%
Income tax,value added tax and VAT on financial services 471,378 471,911
To banks and other lenders 47% 60%
Interest and bank charges on borrowings 2,406,103 3,039,090
To providers of capital - -
Dividends to shareholders - -
To expansion and growth 30% 20%
Depreciation 95,380 54,546
Retained profits 1,426,021 935,959
5,122,308 100% 5,072,576 100%
Statement of Value Added
2014/15
2013/14
To employeesTo governmentTo banks and other lendersTo expansion and growth
9%30%
14%
47%
11%
9%
60%
20%

175Annual Report 2014/15
Glossary Terms
AAccounting PoliciesThe specific principles, bases, conventions, rules and practices adopted by an entity in preparing and presenting financial statements.
Accrual BasisRecognizing the effects of transactions and events when they occur, without waiting for receipt or payment of cash or cash equivalents.
Associate Company-Equity accounted investeeAn associate is an entity in which the investor has significant influence and which is neither a subsidiary nor an interest in a joint venture
Available- For-Sale Financial AssetsNon derivative financial assets that are designated as available for sale or are not classified as
(a) Loans and receivables,
(b) Held to maturity investments or
(c) Financial assets at fair value through profit or loss.
CCash Basis
Recognising the effects of transactions and events when receipts or payments of cash or cash equivalent occur.
Cash EquivalentsShort term highly liquid investment that are readily convertible to known amount of cash and which are subject to an insignificant risk in change in value.
Consolidated Financial StatementsFinancial Statements of a Group presented as those of a single company.
ContingenciesA condition or situation existing on the statement of financial position where the outcome will be confirmed only by occurrence or non occurrence of one or more future event.
Corporate GovernanceThe process by which corporate entities are governed. It covers the way in which power is exercised over the management and direction of entity ,the supervision of executive actions and accountability to owners and others.
Credit RiskCredit Risk is the potential that a borrower or counterparty will fail to meet its obligations in accordance with agreed terms & conditions.
DDeferred TaxationSum set aside for tax in the financial statements that may become payable/receivable in a financial year other than the current financial year.
DepreciationDepreciation is the allocation of the depreciable amount of an asset over its estimated useful life.
EExecutionsAdvances granted to customers under leasing, hire purchase and loan facilities.
FFair ValueFair value is the amount for which an asset could be exchanged or a liability settled between knowledgeable, willing parties in an arm’s length transaction.
Financial AssetsAny asset that is cash, an equity instrument of another entity or contractual right to receive cash or another financial asset from another entity.
Finance LeaseA contract where by a lessor conveys to the lessee the right to use an asset for rent over an agreed period of time which is sufficient to amortise the capital outlay of the lessor. The lessor retains ownership of the asset but transfers substantially all the risk and rewards incidental to ownership of the asset to the lessee.

176Commercial Leasing & Finance PLC
ys;j;alu
Financial LiabilityIs a contractual obligation to deliver cash or another financial asset to another entity
GGoodwillAny excess of the cost of the acquisition over the acquirer’s interest in the fair value of the identifiable assets and liabilities acquired as at the date of the exchange transaction and is recognised as an asset.
Gross PortfolioTotal rental receivable of the advances granted to customers under leasing, hire purchase and loan facilities.
HHire PurchaseA hire purchase is a contract between hirer and financier where the hirer takes on hire a particular article from the financier, with the option to purchase the article at the conclusion of the agreed rental payments.
IImpairmentAmount by which the carrying amount of an asset or cash generating unit exceeds its recoverable amount.
Interest CostThe sum of monies accrued and payable to the sources of borrowed working capital.
Investment PropertyInvestment Property is a property (land or a building - or part of a building -or both) held (by the owner or by the lessee under a finance lease) to earn rentals or for capital appreciation or both rather than for use in the production or supply of goods or services or for administrative purposes or sale in the ordinary course of business.
KKey Management PersonnelKey Management Personnel are those persons having authority and responsibility for planning, directing and controlling the activities of the entity, directly or indirectly.
LLeaseA lease is an agreement whereby the lessor conveys to the lessee in return for a payment or series of payments the right to use an asset for an agreed period of time.
NNegative GoodwillAny excess, as at the date of the exchange transaction, of the acquirer’s interest in the fair values of the identifiable assets and liabilities acquired over the cost of the acquisition and is treated as income in the period it arises.
Net PortfolioTotal rental instalment receivable excluding interest of the advances granted to customers under leasing, hire purchase and loan facilities.
Non Controlling InterestPart of the net results of operations and of net assets of a subsidiary attributable to interests who are not owned, directly or indirectly through subsidiaries, by the Parent.
Non Performing PortfolioFacilities granted to customers who are in default for more than six months.
OOperating LeaseAn operating lease is a lease other than a finance lease.
PProvisionAmount set aside against possible losses or net receivable of facilities granted to customers, as a result of them becoming partly or wholly uncollectible.
RRelated PartiesParties are considered to be related if one party has the ability to control the other party or exercise significant influence over the other party in making financial or operating decisions.
Glossary Terms

177Annual Report 2014/15
Related Party TransactionsA transfer of resources or obligations between related parties, regardless of whether a price is charged.
Residual ValueThe estimated amount that is currently realisable from disposal of asset, after deducting estimated cost of disposal, if the asset was already of the age and in the condition expected at the end of its useful life.
SSegmental AnalysisAnalysis of information by different products
Shareholder’s Funds(equity)Total of issued and fully paid ordinary share capital and reserves.
Stated CapitalAll amount received by the Company or due and payable to the Company-
(a) In respect of the issue of shares ,
(b) In respect of calls on shares.
Subsidiary CompanySubsidiary is a company that is controlled (power to govern the financial and operating policies of an enterprise so as to obtain benefits from its activities) by another company known as the Parent.
Substance over FormThe consideration that the accounting treatment and the presentation in Financial Statements of transactions and the events should be governed by their substance and financial reality and not merely by legal form.
UUnearned IncomeUnearned income is an accounting method used by lending institutions to deal with long-term, fixed-income securities. Initially recorded as a liability, the unearned income will eventually be recorded as income in the lending institution’s books over the life of the loan as time passes and the income is earned.
VValue AdditionValue of wealth created by providing leasing and other related services considering the cost of providing such services.
RATIOSMethod of computation and indicates
DDebt to Equity(Gearing)RatioTotal debts divided by equity. The extent to which debt contributes to fund total assets, compared to the contribution from equity.
EEarnings Per Share (EPS)Profit attributable to ordinary shareholders divided by the weighted average number of ordinary shares outstanding during the year. Share of current year’s earnings attributable to an ordinary shares in use.
IInterest CoverEarnings before interest and tax divided by interest expense. Ability to cover or service interest charges of the debt holders.
MMarket CapitalisationNumber of ordinary shares in issue multiplied by market value of a share. Total market value of all ordinary shares in issue.
NNet Assets Value per Ordinary ShareOrdinary shareholders’ funds divided by the number of ordinary shares in issue. Book value of an ordinary share.

178Commercial Leasing & Finance PLC
ys;j;alu
Non Performing RatioTotal gross non-performing portfolio divided by total gross portfolio. Percentage of total gross non-performing portfolio against the total gross portfolio.
PPrice Earnings Ratio (PER Ratio)Market price of a share divided by earnings per share (EPS). Number of years that would be taken to recoup shareholders’ capital outlay in the form of earnings.
RReturn On Assets(ROA)Net profit expressed as a percentage of average total assets. Overall effectiveness in generating profit with available assets; earning power of invested total capital.
Return on Equity (ROE)Net profit, less preference share dividends if any, expressed as a percentage of average ordinary share holders’ funds. Earning power on shareholders’ book value of investment (equity).
Glossary Terms

179Annual Report 2014/15
NOTICE IS HEREBY GIVEN THAT THE 23RD ANNUAL GENERAL MEETING of Commercial Leasing & Finance PLC
will be held on 25th August 2015 at 10.30am at Park Premier Banquet Hall, Excel World Entertainment Park, No. 338, T B
Jayah Mawatha, Colombo 10 for the following purposes:
1. To receive and consider the Annual Report and Financial Statements for the year ended 31st March, 2015, with the Report of the Auditors thereon.
2. To re-elect as Director Mr W D K Jayawardena, who retires by rotation in terms of Article 75 of the Articles of Association of the Company.
3. To re-elect as Director Mr D M D K Thilakaratna, who retires by rotation in terms of Article 75 of the Articles of Association of the Company.
4. To re-appoint as auditors M/s KPMG, Chartered Accountants at a remuneration to be fixed by the Directors.
BY ORDER OF THE BOARDCommercial Leasing & Finance PLC
LOLC Corporate Services (Private) Limited Secretaries
30th July 2015Rajagiriya (in the greater Colombo)
NOTE:
1) A member entitled to attend and vote at the Meeting is entitled to appoint a Proxy to attend and vote instead of him/her. A Proxy need not be a member of the Company
2) The completed Form of Proxy should be deposited at the registered office of the Company, 68, Bauddhaloka Mawatha, Colombo 04, not later than 10.30am on 23rd August 2015.
3) A Form of Proxy accompanies this Notice
Notice of Meeting

180Commercial Leasing & Finance PLC
ys;j;alu
Notes

181Annual Report 2014/15
Notes

182Commercial Leasing & Finance PLC
ys;j;alu
Notes

183Annual Report 2014/15
I / We .......................................................................................................................................................................................................................................................
of …………………………………………………………………………………………………………………………………….………………………….....................................…being a member/
members of the Commercial Leasing & Finance PLC hereby appoint …..……………………………………………………………………………………………………
………………..……………………………................……of ………………………………………………………………………………………………………………………………......….whom failing
Mr Ishara Chinthaka Nanayakkara of Colombo or failing him
Mr Waduthanthri Dharshan Kapila Jayawardena of Colombo or failing him
Mrs Kalsha Upeka Amarasinghe of Colombo or failing her
Mr Priyantha Damian Joseph Fernando of Colombo or failing him
Dr Harsha Cabral, PC of Colombo or failing him
Mr Don Manuwelge Don Krishan Thilakaratne of Colombo
as my/our proxy to represent me/us * and vote on my/our behalf at the Annual General Meeting of Commercial Leasing & Finance PLC to be held on 25th August 2015 and at any adjournment thereof and at every poll which may be taken in consequence of the aforesaid Meeting.
For Against
1 To re-elect as Director Mr W D K Jayawardena, who retires by rotation in terms of Article 75 of the Articles of Association of the Company.
2 To re-elect as Director Mr D M D K Thilakaratne, who retires by rotation in terms of Article 75 of the Articles of Association of the Company.
3 To re-appoint as auditors M/s KPMG Chartered Accountants at a remuneration to be fixed by the Directors
dated this ……….………………….. day of ……………., Two Thousand Fifteen
……………………………………........…Signature of Shareholder
NOTE:
1) a proxy need not be a member of the company
2) Instruction as to completion appear on the reverse hereof
Form of Proxy

184Commercial Leasing & Finance PLC
ys;j;alu
INSTRUCTIONS AS TO COMPLETION
1 Please return the completed Form of Proxy after filling in legibly your full name and address, signing on the space provided and filling in the date of signature.
2 The completed Form of Proxy should be deposited at the registered office of the Company, 68, Bauddhaloka Mawatha, Colombo 04 not less than 48 hours before the time appointed for the holding of the Meeting.
Form of Proxy

Corporate Information
Name of the CompanyCommercial Leasing & Finance PLC
Country of IncorporationSri Lanka
Legal Form A quoted public company with limited liability
Date of Incorporation 22nd April 1988
Company Registration No.PQ 131/PB/PQ
Stock Exchange ListingThe ordinary shares of the Company were listed on the Diri Savi Board of the Colombo Stock Exchange on 5th June 2012.
Credit RatingICRA Lanka assigned the company an issuer rating of (SL)A- (Stable).
Registered Office and Head Office No. 68, Bauddhaloka Mawatha, Colombo 04. Tel: 0114526500/526Fax: 0114526559Website: http://www.clc.lk
DirectorsMr. I C Nanayakkara – Non-Executive Chairman (alternate to Mr. W D K Jayawardena)Mr. W D K Jayawardena – Non-Executive Director (alternate to Mr. I C Nanayakkara )Mrs. K U Amarasinghe – Non-Executive DirectorMr. P D J Fernando – Senior Independent DirectorDr H Cabral, PC – Independent Director (alternate to Mr. P D J Fernando)Mr. D M D K Thilakaratne –Executive Director/ CEO
Secretaries LOLC Corporate Services (Private) Limited 100/1 Sri Jayawardenapura Mawatha RajagiriyaTel: 011 5880354/7 0115880880 (general)
Auditors KPMG, Chartered Accountants
Lawyers Julius & Creasy, Attorneys-at-LawNithya Partners
Registrars PW Corporate Secretarial (Private) LtdNo. 3/17 Kynsey Road, Colombo 8.Tel: 011 4897733-5
Principal Activities During the year the principal activities of the Company comprised provision of leasing, hire purchase, loans and mobilizing of fixed and savings deposits.
Bankers Bank of Ceylon Citi Bank N A Hatton National Bank PLC Hongkong and Shanghai Banking Corporation Ltd Deutsche Bank Nation Trust Bank PLC Commercial Bank of Ceylon PLCNDB BankSeylan Bank PLCMCB BankSampath Bank PLC DFCC Vardhana Bank Union Bank of Colombo PLC People’s BankHabib Bank

Com
mercial L
easing & F
inance PL
C | A
nnual Report 2014/15
www.clc.lk