yukon river fall chum salmon stock status and fall season salmon
TRANSCRIPT

Special Publication No. 09-24
Yukon River Fall Chum Salmon Stock Status and Fall Season Salmon Fisheries, 2009; a Report to the Alaska Board of Fisheries
by
Bonnie M. Borba,
Daniel J. Bergstrom,
and
Fred J. Bue
December 2009
Alaska Department of Fish and Game Divisions of Sport Fish and Commercial Fisheries
Symbols and Abbreviations The following symbols and abbreviations, and others approved for the Système International d'Unités (SI), are used without definition in the following reports by the Divisions of Sport Fish and of Commercial Fisheries: Fishery Manuscripts, Fishery Data Series Reports, Fishery Management Reports, and Special Publications. All others, including deviations from definitions listed below, are noted in the text at first mention, as well as in the titles or footnotes of tables, and in figure or figure captions.
Weights and measures (metric) centimeter cm deciliter dL gram g hectare ha kilogram kg kilometer km liter L meter m milliliter mL millimeter mm Weights and measures (English) cubic feet per second ft3/s foot ft gallon gal inch in mile mi nautical mile nmi ounce oz pound lb quart qt yard yd Time and temperature day d degrees Celsius °C degrees Fahrenheit °F degrees kelvin K hour h minute min second s Physics and chemistry all atomic symbols alternating current AC ampere A calorie cal direct current DC hertz Hz horsepower hp hydrogen ion activity pH (negative log of) parts per million ppm parts per thousand ppt, ‰ volts V watts W
General Alaska Administrative Code AAC all commonly accepted abbreviations e.g., Mr., Mrs.,
AM, PM, etc. all commonly accepted professional titles e.g., Dr., Ph.D., R.N., etc. at @ compass directions:
east E north N south S west W
copyright © corporate suffixes:
Company Co. Corporation Corp. Incorporated Inc. Limited Ltd.
District of Columbia D.C. et alii (and others) et al. et cetera (and so forth) etc. exempli gratia (for example) e.g. Federal Information Code FIC id est (that is) i.e. latitude or longitude lat. or long. monetary symbols (U.S.) $, ¢ months (tables and figures): first three letters Jan,...,Dec registered trademark ® trademark ™ United States (adjective) U.S. United States of America (noun) USA U.S.C. United States
Code U.S. state use two-letter
abbreviations (e.g., AK, WA)
Measures (fisheries) fork length FL mideye to fork MEF mideye to tail fork METF standard length SL total length TL Mathematics, statistics all standard mathematical signs, symbols and abbreviations alternate hypothesis HA base of natural logarithm e catch per unit effort CPUE coefficient of variation CV common test statistics (F, t, χ2, etc.) confidence interval CI correlation coefficient (multiple) R correlation coefficient (simple) r covariance cov degree (angular ) ° degrees of freedom df expected value E greater than > greater than or equal to ≥ harvest per unit effort HPUE less than < less than or equal to ≤ logarithm (natural) ln logarithm (base 10) log logarithm (specify base) log2, etc. minute (angular) ' not significant NS null hypothesis HO percent % probability P probability of a type I error (rejection of the null hypothesis when true) α probability of a type II error (acceptance of the null hypothesis when false) β second (angular) " standard deviation SD standard error SE variance population Var sample var

SPECIAL PUBLICATION NO. 09-24
YUKON RIVER FALL CHUM SALMON STOCK STATUS AND FALL SEASON SALMON FISHERIES, 2009; A REPORT TO THE
ALASKA BOARD OF FISHERIES
by
Bonnie M. Borba, Division of Commercial Fisheries, Fairbanks
Daniel J. Bergstrom,
Division of Commercial Fisheries, Anchorage
and
Fred J. Bue, Division of Commercial Fisheries, Fairbanks
Alaska Department of Fish and Game Division of Sport Fish, Research and Technical Services 333 Raspberry Road, Anchorage, Alaska, 99518-1565
December 2009

The Special Publication series was established by the Division of Sport Fish in 1991 for the publication of techniques and procedures manuals, informational pamphlets, special subject reports to decision-making bodies, symposia and workshop proceedings, application software documentation, in-house lectures, and became a joint divisional series in 2004 with the Division of Commercial Fisheries. Special Publications are intended for fishery and other technical professionals. Special Publications are available through the Alaska State Library, Alaska Resources Library and Information Services (ARLIS) and on the Internet: http://www.sf.adfg.state.ak.us/statewide/divreports/html/intersearch.cfm. This publication has undergone editorial and peer review.
Bonnie M. Borba and Fred J. Bue Alaska Department of Fish and Game, Division of Commercial Fisheries,
1300 College Road, Fairbanks, Alaska 99701, USA and
Daniel J. Bergstrom Alaska Department of Fish and Game, Division of Commercial Fisheries
333 Raspberry Road, Anchorage, Alaska 99518, USA This document should be cited as: Borba, B. M,. D. J. Bergstrom, and F. J. Bue. 2009. Yukon River fall chum salmon stock status and fall season
salmon fisheries, 2009; a report to the Alaska Board of Fisheries. Alaska Department of Fish and Game, Special Publication No. 09-24, Anchorage.
The Alaska Department of Fish and Game (ADF&G) administers all programs and activities free from discrimination based on race, color, national origin, age, sex, religion, marital status, pregnancy, parenthood, or disability. The department administers all programs and activities in compliance with Title VI of the Civil Rights Act of 1964, Section 504 of the Rehabilitation Act of 1973, Title II of the Americans with Disabilities Act (ADA) of 1990, the Age Discrimination Act of 1975, and Title IX of the Education Amendments of 1972.
If you believe you have been discriminated against in any program, activity, or facility please write: ADF&G ADA Coordinator, P.O. Box 115526, Juneau, AK 99811-5526
U.S. Fish and Wildlife Service, 4401 N. Fairfax Drive, MS 2042, Arlington, VA 22203 Office of Equal Opportunity, U.S. Department of the Interior, 1849 C Street NW MS 5230, Washington DC 20240
The department’s ADA Coordinator can be reached via phone at the following numbers: (VOICE) 907-465-6077, (Statewide Telecommunication Device for the Deaf) 1-800-478-3648,
(Juneau TDD) 907-465-3646, or (FAX) 907-465-6078 For information on alternative formats and questions on this publication, please contact:
ADF&G Division of Sport Fish, Research and Technical Services, 333 Raspberry Road, Anchorage, AK 99518 (907) 267-2375.

TABLE OF CONTENTS Page
LIST OF TABLES........................................................................................................................................................iii
LIST OF FIGURES......................................................................................................................................................iii
ABSTRACT ..................................................................................................................................................................1
INTRODUCTION.........................................................................................................................................................1
STOCK ASSESSMENT BACKGROUND...................................................................................................................2
Escapement....................................................................................................................................................................3 Harvest and Management Review .................................................................................................................................4 Exploitation Rates and Yield .........................................................................................................................................6 Outlook..........................................................................................................................................................................7 Coho Salmon Stock Status ............................................................................................................................................7
2010 ALASKA BOARD OF FISHERIES REGULATORY PROPOSALS AFFECTING YUKON RIVER FALL CHUM AND COHO SALMON ...................................................................................................................................8
RESEARCH AND ASSESSMENT ..............................................................................................................................9
U.S./Canada Joint Technical Committee Plan...............................................................................................................9
Current Programs.........................................................................................................................................................10
Main River Sonar.........................................................................................................................................................10 Mixed Stock Analysis..................................................................................................................................................10 Border Sonar................................................................................................................................................................10 Tributary Sonar............................................................................................................................................................10 Weirs and Escapement Ground Surveys......................................................................................................................11 Test Fish Wheels and Nets ..........................................................................................................................................11
REFERENCES CITED ...............................................................................................................................................12
ii

iii
LIST OF TABLES Table Page 1. Fall chum salmon passage estimates and escapement estimates for selected spawning areas, Yukon
River drainage, 1971–2009. ..........................................................................................................................14 2. Fall chum salmon estimated brood year production and return per spawner estimates, Yukon Area,
1974–2008.....................................................................................................................................................18 3. Yukon River drainage fall chum salmon management plan, 5AAC 01.249, 2009........................................20 4. Estimated fall chum salmon subsistence and personal use harvest in numbers of fish by district, Yukon
River, 1979–2008. .........................................................................................................................................21 5. Estimated coho salmon subsistence and personal use harvest in numbers of fish by district, Yukon
River, 1979–2008. .........................................................................................................................................23 6. Commercial harvest of fall chum salmon by district, Yukon River, 1961–2009. .........................................25 7. Commercial harvest of coho salmon by district, Yukon River, 1961–2009..................................................27 8. Coho escapement estimates for selected spawning areas, Yukon River drainage, 1972–2009. ....................29 9. Value of commercial fall fishery to Yukon Area fishermen, 1977–2009......................................................32 10. Number of commercial permit holders by district participating in the fall season salmon fishery, Yukon
Area, 1971–2009. ..........................................................................................................................................34
LIST OF FIGURES Figure Page 1. Alaskan portion of the Yukon River drainage showing communities and fishing districts...........................35 2. Total run reconstruction based on estimated harvest and escapement of fall chum salmon, Yukon River
drainage, 1974–2008 with the 2009 run size estimate...................................................................................36 3. Estimated fall chum salmon harvest and escapement with exploitation rate, Yukon Area, 1974–2009. ......37 4. Subsistence (top) and commercial (bottom) harvest of coho salmon, Yukon River drainage, Alaska,
1961–2009.....................................................................................................................................................38 5. Total commercial harvest of fall chum and coho salmon combined (top) and percent (bottom) of
harvest by species in the Yukon River drainage, Alaska, 1961–2009...........................................................39 6. Total subsistence and personal use harvest of fall chum and coho salmon combined (top) and percent
(bottom) of harvest by species in the Yukon River drainage, Alaska, 1961–2008........................................40 7. Yields of fall chum salmon based on parent year escapements and resulting brood year returns, 1974-
2005...............................................................................................................................................................41 8. Subsistence (top) and commercial (bottom) harvest of fall chum salmon, Yukon River drainage,
Alaska, 1961–2009........................................................................................................................................42 9. Coho salmon escapement estimates for Delta Clearwater River, Nenana River Index Areas, Clearwater
Lake and Outlet, and Richardson Clearwater River, 1972–2009. .................................................................43 10. Historical coho salmon assessment based on passage at Pilot Station sonar, Yukon Area, 1995–2008
and preliminary 2009.....................................................................................................................................44 11. Total commercial harvest of fall chum salmon (top) and percent (bottom) of harvest by district, Yukon
River drainage, 1961–2009. ..........................................................................................................................45 12. Total commercial harvest of coho salmon (top) and percent (bottom) of harvest in the Yukon River
drainage, 1961–2009. ....................................................................................................................................46

ABSTRACT Yukon River fall chum salmon Oncorhynchus keta were delisted as stocks of concern by the Alaska Board of Fisheries (BOF) in 2007. The minimum drainagewide escapement goal of 300,000 fish has been exceeded since 2001, and the upper end of the goal was exceeded in 2003 and 2005 through 2007. Since 2001, most tributary escapement goals have also been met, with weakness primarily in the Porcupine River drainage, including Sheenjek and Fishing Branch River goals. A record run occurred in 2005 and all escapements exceeded the upper ends of their respective goals, including Porcupine River systems; however, production from those escapements appears to be extremely low. Exploitation rates have been on the increase since low production years in the early 2000s. However, harvest rates still remain low compared to historical levels (pre-1992) as changes occurred in subsistence harvest patterns after several extremely poor runs and poor commercial markets prior to 2007. The last 2 decades have seen uncommonly large swings in fall chum salmon production, making fishery management even more difficult. Escapement and harvest monitoring projects are in place to aid in managing for sustained yield objectives. Proposal 199 has been submitted to the BOF for consideration of changes to the Yukon River Coho Salmon Management Plan (5 AAC 05.369) to allow late season harvests after the majority of fall chum salmon have migrated through. Proposal 194, Yukon River Drainage Fall Chum Salmon Management Plan (5 AAC 01.249), was submitted to revise management triggers for subsistence and commercial fisheries.
Key words: Yukon River, fall chum salmon, Oncorhynchus keta, coho salmon, Oncorhynchus kisutch, commercial, fishing, ADF&G, Alaska Board of Fisheries.
INTRODUCTION Yukon Area includes all waters of Alaska within the Yukon River drainage and coastal waters from Naskonat Peninsula to Point Romanof, northeast of the village of Kotlik. For management purposes, Yukon Area is divided into 7 districts and 10 subdistricts (Figure 1). Commercial fishing may be allowed along the entire 1,224 miles of Yukon River in Alaska and along the lower 225 miles of Tanana River. Coastal District includes the majority of coastal marine waters within Yukon Area and is only open to subsistence fishing. Lower Yukon Area (Districts 1, 2, and 3) includes coastal waters of the Yukon River delta and that portion of the Yukon River drainage downstream of Old Paradise Village (river mile 301). Upper Yukon Area (Districts 4, 5, and 6) is the Alaskan portion of the Yukon River drainage upstream of Old Paradise Village.
Chinook (Oncorhynchus tshawytscha), chum (O. keta), and coho (O. kisutch) salmon are harvested in Yukon River commercial, subsistence, personal use, and sport fisheries. Subsistence fishing in portions of Yukon Area is under dual management authority of the Alaska Department of Fish and Game (ADF&G) and the U.S. Fish and Wildlife Service (USFWS). Chum salmon in Yukon River consists of an earlier and typically more abundant summer chum salmon run, and a later fall chum salmon run. No directed commercial fishing has occurred for pink (O. gorbuscha) salmon, which overlap in run timing with summer chum salmon. However, sporadic sales of incidental harvests of pink salmon have been documented.
The Policy for the Management of Sustainable Salmon Fisheries (SSFP; 5 AAC 39.222, 2001) directs ADF&G to provide the Alaska Board of Fisheries (BOF) with reports on the status of salmon stocks and identify any salmon stocks that present a concern related to yield, management, or conservation during regular BOF meetings. This report provides ADF&G’s assessment of Yukon Area fall chum salmon stock status and also provides a review of the fall season fishery, including coho salmon.
In response to guidelines established in the SSFP, the BOF classified Yukon River fall chum salmon as a stock of yield concern and classified Toklat and Fishing Branch Rivers fall chum salmon as a stock of management concerns at its September 2000 work session. A stock of
1

management concern is defined as “a concern arising from a chronic inability, despite use of specific management measures, to maintain escapements for a salmon stock within the bounds of the sustainable escapement goal (SEG), biological escapement goal (BEG), optimum escapement goal (OEG), or other specified management objectives for the fishery” (5 AAC 39.222(f)(21)). A “yield concern” is defined as, “a concern arising from a chronic inability, despite use of specific management measures, to maintain expected yields, or harvestable surpluses, above a stock’s escapement needs” (5AAC 39.222(f)(42)). The SSFP further defines chronic inability as the continuing or anticipated inability to meet escapement objectives (management concern) or average surplus yield (yield concern) over a 4- to 5-year period. The determination for the entire Yukon River fall chum salmon as a stock of yield concern was based on substantial decrease in yields and harvestable surpluses during the period 1998–2000, and the anticipated very low run expected in 2001. The determination for Toklat and Fishing Branch rivers as stocks of management concern was based on escapements not meeting the OEG of 33,000 for Toklat River from 1996 to 2000, and not meeting the escapement objective of 50,000–120,000 salmon for Fishing Branch River from 1997 to 2000. An action plan was subsequently developed by ADF&G (ADF&G 2000) and acted upon by the BOF in January 2001.
Yukon River fall chum salmon classification as a yield concern was continued at the January 2004 BOF meeting because the combined commercial and subsistence harvests showed a substantial decrease in fall chum salmon yield from the 10-year period (1989–1998) to the more recent 5-year (1999–2003) average (Bue et al. 2004). Toklat River stock was removed from management concern classification as a result of the BEG review presented at that BOF meeting. However, as a component of the Yukon River drainage, Toklat River fall chum salmon stock was included in the drainagewide yield concern classification. Fishing Branch River stock was also removed from the management concern classification because management of that portion of the drainage is covered by an annex to the Pacific Salmon Treaty, the U.S./Canada Yukon River Salmon Agreement (Agreement), which is governed under the authority of the Yukon River Panel (Panel).
In January 2007, the BOF determined that Yukon River fall chum salmon stock no longer met the criteria for a yield concern. Run strength was poor from 1998 through 2002; however, steady improvement had been observed since 2003 (JTC 2006). The 2005 run was the largest in 30 years and 2006 was above average for an even-numbered year run; the drainagewide OEG of 300,000 fall chum salmon was exceeded in the preceding 5 years. The 5-year average (2002–2006) total reconstructed run of approximately 950,000 fish was greater than the 1989–1998 10-year average of approximately 818,000 fish, which indicated a return to historical run levels. This report provides stock assessment through the 2009 fall season fishery.
STOCK ASSESSMENT BACKGROUND Fall chum salmon run strength was poor from 1998 through 2002, with dramatic improvements in drainagewide run size since 2003. The 2000 fall chum salmon run was the worst on record, with 1998 and 2001 close behind as all time low runs. The drainagewide OEG of 300,000 fall chum salmon has been exceeded every year since 2001 (Figure 2) and most tributary escapement goals were met throughout the Alaska portion of the drainage.
2

ESCAPEMENT Because fall chum salmon congregate in fairly unique areas of the drainage in search of upwelling warmer waters to incubate their eggs in a shorter time frame than summer chum salmon habitats would allow, monitoring of major spawning escapements was nearly complete between 1995 and 2007. Analysis of BEGs conducted by Eggers (2001) provided a drainagewide goal, as well as tributary goals for main monitored systems in the upper Yukon River drainage, including Tanana River.
Biological escapement goals in Chandalar and Delta rivers have been met or exceeded in each of the past 10 years, except for low escapements in 2000 (Table 1). Sheenjek River BEG is based on estimated passage for only one bank and the goal has only been met 4 times since 1997. Escapement objectives for fall chum salmon stocks in Yukon River Canadian mainstem and Fishing Branch River were originally recommended by the U.S./Canada Joint Technical Committee (JTC) and specifically stipulated in the Agreement. Because of poor runs in the early 2000s, the Panel agreed to lower escapement targets through 2005 for Canadian mainstem fall chum salmon stock to allow for some U.S. subsistence and Canadian aboriginal harvest, while rebuilding the stock over 3 life cycles. However, the escapement objective of >80,000 for this stock had been exceeded since 2002 and since 2006, goals were again based on rebuilt status.
Escapement in Fishing Branch River in Canada has only met the escapement objective established in 1987 of 50,000 to 120,000 fall chum salmon once in the past 12 years, in 2005. ADF&G developed a BEG for this stock of 27,000 to 56,000 in conjunction with total run reconstruction analysis in 2000 (Eggers 2001); however, this goal has only been met 4 times since 1997. Like the Canadian mainstem stock, the Fishing Branch River fall chum salmon stock is managed based on recommendations of the Panel that are addressed annually. The Panel agreed to an interim management goal of 28,000 fish for the 2006 season and 33,667 fish in 2007, which were both exceeded. For the years 2008–2010, JTC has recommended an Interim Management Escapement Goal (IMEG) range of 22,000–49,000 fall chum salmon for Fishing Branch River (JTC 2009). This recommendation was based on the Bue and Hasbrouck1 percentile method of determining an SEG. The IMEG for Fishing Branch River was nearly achieved in 2008 and was met in 2009.
In 1993, the BOF established the Toklat River OEG of 33,000 fall chum salmon based on an average return for this system. As part of the total run reconstruction analysis conducted by Eggers (2001), a BEG range of 15,000 to 33,000 fall chum salmon was recommended and adopted by ADF&G. The BOF removed the OEG from regulation in 2004. Based on the BEG range, the goal has been met each year from 2002 to 2005; however, assessment of the area has been hampered by the later freeze ups and counts used for developing an annual population estimate have not been achieved since 2005. The results of mark–recapture projects on both Kantishna and Tanana rivers suggest that the index streams of Toklat and Delta rivers support a relatively small proportion of fall chum salmon. A radiotelemetry study conducted in 2008 has confirmed major mainstem spawning in Tanana River between Fairbanks and Delta Junction.
Some have contended that overharvest caused poor runs between 1997 and 2001. However, parent year escapement from 1994 through 1996 were some of the largest escapements on
1 Bue, B. G., and J. J. Hasbrouck. Unpublished. Escapement goal review of salmon stocks of Upper Cook Inlet, Report to the Alaska Board of
Fisheries, 2001. Alaska Department of Fish and Game, Anchorage.
3

record, yet they produced the extremely poor fall chum salmon runs from 1998 through 2000 (Figure 2). Extremely poor production from those very large escapements, in some cases dramatically less than 1.0 return per spawner, resulted in the extremely poor runs observed (Table 2). Because escapements in these parent years were deemed more than adequate, resulting poor runs cannot be attributed to overharvest (Figure 3). Most individuals in the scientific community attribute poor production to poor ocean environments (Scheuerell and Williams 2005). Poor wild-stock runs occurred throughout Western Alaska during 1998 through 2002. As shown in the past, low escapements can produce large returns and a particularly strong return in 2005 was observed from brood year 2001.
Escapement goals are reviewed prior to each BOF cycle meeting. Current fall chum salmon BEGs within the Yukon River drainage were developed in 2000 (Eggers 2001) and reevaluated in 2003 (ADF&G 2004) and 2006 (Brannian et al. 2006). The 2009 review team recommends continuing the existing fall chum salmon drainagewide escapement goal range, but changing it from a BEG to an SEG as described in Fleischman and Borba (2009). Additionally, the review team recommends eliminating the Tolkat River BEG because a population estimate can no longer be developed for this stock due to changes in the environment (Volk et al. 2009). All other existing goals are recommended to continue without revision.
Current and proposed BEGs and SEGs for Yukon River fall chum salmon are as follows:
Stream (Project Type) Current Goal Recommended Range Type of Goal Yukon Drainage (multiple) 300,000–600,000 Revise Type SEG Tanana River (mark-recapture) 61,000–136,000 No Revision BEG Delta River (foot surveys) 6,000–13,000 No Revision BEG Toklat River (foot survey) 15,000–33,000 Eliminate Eliminate Upper Yukon R. Tributaries (multiple) 152,000–312,000 No Revision BEG Chandalar River (sonar) 74,000–152,000 No Revision BEG Sheenjek River (sonar) 50,000–104,000 No Revision BEG Canadian Upper Yukon River (sonar) >80,000a No Revision IMEGb Fishing Branch River (weir) 50,000–120,000a No Revision IMEGb a U.S./Canada escapement goals based on Yukon Salmon Agreement. b Interim Management Escapement Goals (IMEG) are set by the U.S./Canada Panel. The current IMEG for
Fishing Branch River is 22,000 to 49,000 fall chum salmon through 2010.
HARVEST AND MANAGEMENT REVIEW Management of the fall season fishery is prescribed in 5 AAC 01.249. Yukon River Drainage Fall Chum Salmon Management Plan that was amended by the BOF in January 2004. The plan aligned the escapement goal threshold with the lower end of the established BEG range of 300,000 to 600,000 fall chum salmon. This provides more subsistence fishing opportunity in years of poor runs than had previously been allowed while still attaining escapement goals. Drainagewide commercial fishing is allowed on the projected surplus above 600,000 fish which provides for subsistence use priority and bolsters escapement on strong runs. The management plan describes recommended fishery actions based on estimates of run size (Table 3). Yukon River coho salmon have a slightly later, but overlapping, run timing with fall chum salmon and ADF&G follows guidelines adopted by the BOF in Yukon River Coho Salmon Management Plan (5 AAC 05.369). ADF&G monitors run abundance and harvest levels inseason relative to
4

established individual tributary BEGs/SEGs and the drainagewide BEG to assess changes in productivity and benefits to users (ADF&G 2004).
In most years, fall chum salmon are the primary species of management concern and harvest of coho salmon are often considered incidental in fall season fisheries (Figures 4–6). The dramatic decline of salmon stocks from 1998 through 2002, followed by the rapid recovery beginning in 2003 has significantly changed the character of Yukon River salmon fisheries. Many fishermen moved away from using long-established fish camps, fishing gear fell into disrepair or was replaced with other types, and market interest shifted to other available fisheries outside the region. With recent run size improvements, fishermen and markets are again becoming optimistic. Management has had to adapt to shifts in efficiency and distribution of fishing effort. Generally, the amended fall chum and coho salmon management plans have worked well in attaining target escapement goals and providing fishing opportunities for subsistence and commercial fishermen. The plans have also provided flexibility to incorporate most coho salmon management considerations in these overlapping fisheries.
Combined commercial and subsistence harvests (Busher et al. In prep) show a substantial decrease from the 1980s and 1990s compared to the recent 5-year (2004–2008) average (Tables 4–7 and Figure 3). Conservative management strategies based on fall chum salmon management action plans adopted by the BOF in 2001 have contributed to success in achieving escapement goals. However, as production rates increased, there has been underutilization of the fall chum salmon stock. Furthermore, coho salmon harvests have been constrained as a consequence of management strategies conserving the overlapping fall chum salmon run.
Parent year escapements that produced fall chum salmon runs in 2005, 2006, and 2007 were low, and run outlooks for those years were only moderate. Therefore, the management strategy in those years was to wait until inseason assessment indicated there would be adequate surplus before a commercial fishery was opened. Subsistence fishermen were not restricted, but their utilization had shifted to a lower level after the recent series of poor runs so their annual harvest was below average. Once managers were certain that surpluses were available, a large portion of the run had already passed through the major commercial fishery, thereby missing harvest opportunity.
Harvesting power of commercial fisheries declined due to loss of markets, increased operating costs, and unpredictability of run strength, further compounding underutilization. In 2008, strength of the preceding summer chum salmon run (average) indicated that the fall chum salmon run would be large enough to provide commercial opportunity. The fall season management strategy was to continue commercial fishing during the transition period when both summer and fall chum salmon runs overlapped, with the goal of increasing fishing time in order to offset the lower harvest rate. By fishing during the transition, harvest volume was reasonably good, markets and fishermen remained interested, and risk of overharvesting either stock was relatively low because neither stock is in large abundance during that time. Unfortunately, the 2008 run was slow to develop. Management delayed commercial fishing for 3 weeks mid season to assure adequate numbers of fall chum salmon were in the river for escapement needs and subsistence opportunity.
In 2009, this same early season strategy was initiated, but the fall chum salmon run was even slower to develop. Commercial fishing in Districts 1 and 2 was suspended at the first quarter point in the run, with a total Yukon Area harvest of approximately 25,000 fall chum salmon and
5

8,000 coho salmon. Genetic stock identification of Pilot Station sonar test fishery samples from initial openings indicated a majority of chum salmon caught were summer chum salmon. Although Pilot Station sonar indicated the run was very poor, it was not necessary to impose total subsistence fishing closures as outlined in the management plan, because extremely low water levels and difficulties test fishing for species apportionment were suspected of underestimating fall chum salmon abundance. Subsistence fishermen throughout the drainage were provided opportunity to harvest salmon from the first pulse, which typically comprise the highest flesh quality for human consumption. Subsistence fishing periods were reduced by one third during the middle of the run to bolster escapements, and then returned to the standard schedule late in the season to facilitate harvesting salmon for dog food when lower temperatures are better for preserving fish.
On September 6, commercial fishing in District 1 was reopened with harvest directed at coho salmon after most fall chum salmon had passed. The coho salmon management plan does not allow commercial fishing when the fall chum salmon run is projected to be less than 550,000 fish. However, there was a determination that initiation of a coho salmon-directed fishery late in the season after the vast majority of the fall chum salmon run had passed through fishing districts would not have a significant impact on escapement or allocations of fall chum salmon. The BOF responded to a request for an emergency regulation to discuss this issue by teleconference on September 8, 2009. An emergency regulation was adopted stating if the commissioner determines that there is a harvestable surplus of coho salmon above escapement needs and those necessary for subsistence uses, and that a directed coho salmon commercial fishery will not have a significant impact on escapement or allocation of fall chum salmon, the commissioner may, by emergency order, open a directed coho salmon commercial fishery. The BOF further acted by adding a review of the coho salmon management plan to the agenda of the regular AYK BOF meeting for public input. Although late season periods landed few fish as most coho salmon had already passed, the harvest averaged 77% coho salmon during late season commercial fishing periods in District 1. In the upper river, 4 commercial fishing periods were announced for District 6 after September 18, when the majority of fall chum salmon had passed. The potential for commercial harvests of coho salmon would have been greater in 2009 if not for the fall chum salmon conservation concerns and actions.
EXPLOITATION RATES AND YIELD Annual total run estimates can be coupled with total inriver harvests to estimate exploitation rates exerted on fall chum salmon for the years 1974–2009 (Figure 3). Total exploitation rates exerted by Yukon River fisheries on fall chum salmon over 36 years averaged about 17.4%, ranging from as high as 67.5% in 1982 to as low as 6.4% in 2002. Exploitation rates on 2 of the lowest runs, approximately 239,000 fish, in 2000 and 334,000 fish in 2001, were 11.9% and 21.2%, respectively. Exploitation rates have been increasing slightly since 2002 with improvements in run size and reestablishment of market interest; however, current exploitation rates are much lower than historical rates (averaging 51% pre-1992 to an average of 20% post-1991), partly due to highly variable runs occurring in the last 2 decades which are highly unpredictable.
Yields based on brood return from individual escapements have also become highly variable in the last 2 decades (Figure 7). Yields from brood years pre-1992 averaged 400,000 fish and ranged from 27,000 in 1975 to 840,000 in 1977, whereas yields after 1991 average 143,000 fall
6

chum salmon, with 6 of the last 13 brood year returns (through 2005) resulting in negative yields representing substantially less production. Production levels for years 1974 through 1992 allowed for average harvests of 456,000 fish, whereas current production levels and conservative management actions through this period of high and low production extremes has reduced harvests to less than 200,000 fish. Harvests from 1999–2003 were at all time lows that averaged only 62,000 fall chum salmon drainagewide, whereas harvests from 2004–2008 average 211,000 fall chum salmon; this level of harvest is comparable to average harvest taken from 1994–1998 (Figure 2). As a result of previous poor fall chum salmon runs in the early 2000s and subsequent fishing restrictions and closures, it appears subsistence fishing effort and harvest has remained relatively low even in those years with much larger runs, as in 2003 and 2005 through 2008 (Figures 2 and 8). With the exception of 1995, fall chum salmon commercial harvests (Figure 8) have been low since 1992, partly due to weak market conditions, but also because of uncertainty in predicting run strength. Most recently this has resulted in underutilization of the stock in commercial fisheries in 2003, and 2005 through 2007. Fall chum salmon runs in 2008 and 2009 were fully utilized, with most escapement objectives attained and below average harvests due to below average available surpluses.
OUTLOOK The preliminary outlook for 2010 is for a fall chum salmon run size ranging from 545,000 to 824,000 fish. Prior to 1992, fall chum salmon exhibited a strong odd-even year abundance cycle, with even-numbered years producing average returns of 660,000 fish, while odd-numbered years averaged 1 million fish. However, since 1993, wide swings in productivity have made predictions of run size extremely difficult. There have been 2 even-numbered years, 1996 and 2006, that exceeded 1 million fish, and 6 of the last 9 odd-numbered years have been well below average. Although the 2001 brood year produced a record brood year return of 3 million fish, most of which returned in 2005 and 2006, production from the large escapement in 2005 is indicating a record low return per spawner of 0.26. During this time, leading up to record returns, information from Bering Sea studies known as BASIS and trawl bycatch data indicated a higher abundance of all salmon species, particularly chum salmon that also peaked in 2005 (JTC 2008). Bycatch has since dropped off to a record low in 2008, with a slight increase in 2009, but it is unknown if these results reflect truly low abundance or changes in fishing patterns. Given inherent difficulties in managing this complex fishery, a return within the projected range would be anticipated to provide for normal subsistence harvests, and possibly commercial fisheries.
COHO SALMON STOCK STATUS Subsistence coho salmon harvests have been relatively stable during the past decade, while commercial harvests have shown an increase (Tables 5 and 7). Commercial markets for coho salmon improved before fall chum salmon, and conservative management strategies for fall chum salmon have resulted in fishing later in the season when coho salmon abundance is generally higher.
There is only one established escapement goal for coho salmon in the Yukon River drainage, which is an SEG for Delta Clearwater River of 5,200–17,000 (Table 8 and Figure 9). The lower end of the SEG has been exceeded since 1993 and the upper end of the SEG has been exceeded 7 times through 2008. The 2009 boat count survey of Delta Clearwater River estimated 16,850 coho salmon, which is near the upper end of the SEG range. Several areas in Nenana River and
7

upper Tanana River drainages are also monitored, but no escapement goals exist for these systems (Figure 9). The 2009 Pilot Station sonar passage index of 207,000 coho salmon was well above the 2004–2008 average of 163,000 fish, but is suspect. Problems with apportionment of salmon catches at the test net fishery in 2009 at Pilot Station sonar may have artificially inflated the coho salmon passage estimate (Figure 10) as assessment projects upriver did not confirm a near record run. Outlooks for the coming season are based on the level of escapement achieved across various projects based on the parent year of age-4 fish. The 2010 run is expected to be average based on the escapements observed in 2006 (Table 8).
2010 ALASKA BOARD OF FISHERIES REGULATORY PROPOSALS AFFECTING YUKON RIVER FALL CHUM
AND COHO SALMON There are a several proposals before the BOF that affect fall chum and coho salmon management.
Subsistence and Commercial Proposals
Proposal 85 – Extends Subdistricts 4-B and 4-C drift gillnet area for Chinook and fall chum salmon.
Extending the area of use of drift gillnet gear may shift subsistence harvest patterns between subsistence gear types and locations, and to different stocks than that of current set gillnet and fish wheel gear.
Proposal 88 – Prohibits drift gillnet gear for subsistence and commercial fishing.
Prohibiting use of drift gillnets, the primary gear type already in use, would affect many subsistence and commercial fishermen from Subdistrict 4-A downstream 500 miles. Such an action would produce competition for the limited number of set gillnet sites, and would also create an overall reduction in harvest efficiency.
Proposal 194 – Revises management triggers in 5 AAC 01.249. Yukon River Drainage Fall Chum Salmon Management Plan.
This proposal would allow commercial fishing on fall chum salmon at lower run sizes (Table 3). A majority of fall chum salmon subsistence harvest is taken in Upper Yukon Area (Table 4).
Proposal 199 – Modifies 5 AAC 05.369. Yukon River Coho Salmon Management Plan for late season harvests.
This proposal would allow directed coho salmon commercial fishing late in the season if the commissioner determines that there is a harvestable surplus of coho salmon above escapement needs and those necessary for subsistence uses, and that a directed coho salmon commercial fishery will not have a significant impact on escapement or allocation of fall chum salmon.
8

Commercial Proposals
Proposal 97 – Reallocate commercial fall chum salmon harvest.
This proposal would reallocate commercial harvest from Lower Yukon Area to Upper Yukon Area. Currently, a majority of commercial harvest, value, and fishing effort is located in Lower Yukon Area (Tables 6, 9 and 10; Figure 11). Harvests of coho salmon would also be shifted because they are normally caught incidentally to fall chum salmon (Tables 5 and 7; Figures 5, 6, and 12).
RESEARCH AND ASSESSMENT Long-term stock assessment information is needed to assess how various fall chum salmon stocks in the Yukon River drainage can support sustained fisheries. Little stock assessment information is available for Yukon River salmon prior to statehood. Additionally, most stock assessment information collected during the 1960s and 1970s consisted of aerial surveys conducted on a periodic basis, which provided crude indices of spawning abundance. Long-term and accurate estimates of abundance and stock composition are needed, along with harvest estimates from various fisheries in the Yukon River drainage. Progress toward these objectives has been made since the late 1980s, with the most complete coverage of escapement assessment projects occurring between 1995 and 2007. Loss of USFWS Office of Subsistence Management (OSM) funding since 2008 for the Tanana and Kantishna river mark–recapture project has left analysis incomplete. Run reconstructions and escapement goal analysis becomes much more difficult with loss of coverage of component stocks. It was hoped that genetic mixed stock analysis (MSA), available since 2004 for fall chum salmon, could substitute for escapement projects because data is timelier. Some aspects of deriving MSA estimates, such as stock assignments, are not as clear (for example, Sheenjek and Chandalar cannot be distinguished from one another and small stocks such as Fishing Branch River are most likely underrepresented in any sampling protocol), and estimates by stock provided are dependent on the accuracy of Pilot Station sonar assessment of passage, which is typically conservative.
ADF&G, several federal agencies, non-governmental organizations, and various organized groups of fishermen operate salmon stock assessment projects throughout the Yukon River drainage, which is used by the Division of Commercial Fisheries to manage Alaskan Yukon River salmon fisheries. Preseason forecasts are based upon historic performance of parent spawning and are generally expressed as below average, average, or above average. Inseason run assessment tools include: (1) abundance indices from test fisheries, (2) sonar counts of fish passage, (3) various escapement assessment projects in tributary systems, (4) commercial and subsistence catch data, (5) catch per effort data from monitored fisheries, and (6) inseason MSA from lower river test fisheries.
U.S./CANADA JOINT TECHNICAL COMMITTEE PLAN The U.S./Canada Yukon River Joint Technical Committee completed a research plan in 2005, with the intent that it would be periodically updated based on changes in priorities and on completing projects that fill initial data gaps. The goals, issues, and comprehensive listing of all research needs contained in this plan provide a framework for research in the entire Yukon River basin, as well as other plans in the region. The intent of the plan is to help management meet and protect escapements while maximizing harvests. This plan provides focus and direction for
9

research time and monies, and is used by agencies internally and to communicate with an international public. Projects can be prioritized, and personnel and equipment allocated to those projects agreed to be most important.
CURRENT PROGRAMS Main river sonar, tributary sonar, weir, and spawning ground surveys are used to monitor spawning populations or major segments of those populations. Other information collected at ground-based assessment projects may include, but is not limited to, sex and length composition, scales for age determination, samples for genetic stock identification, and data on resident species.
MAIN RIVER SONAR This main river sonar project, located near Pilot Station (river mile 123), estimates fish passage and uses a drift gillnet test fishery to apportion fish passage estimates to species. The Yukon River Drainage Fall Chum Salmon Management Plan utilizes daily projected passage estimates at Pilot Station, with varying levels of management actions dependent on projected inseason passage estimates for fall chum and coho salmon.
MIXED STOCK ANALYSIS The USFWS’ genetic laboratory works in cooperation with ADF&G’s Pilot Station sonar project to estimate contribution of fall chum salmon stock components to the total run. Funding to collect and analyze genetic samples is provided through USFWS OSM. The intent is to develop an efficient technique that provides timely information on stock-specific harvests low in the drainage to support discrete stock management in a mixed-stock fishery. The project has been operated since 2004 and indicates a good relationship in most years between inseason stock compositions at Pilot Station sonar, with postseason run reconstruction based on escapement estimates.
BORDER SONAR ADF&G and Canadian Department of Fisheries and Oceans (DFO), supported by U.S./Canada Treaty Implementation and Research and Enhancement (R&E) funding, have been operating a sonar downstream from the community of Eagle, Alaska to provide population estimates of salmon crossing the U.S./Canada Border. This project directly assists in assessment of U.S. management and treaty commitments for escapement of Canadian origin salmon stocks. Estimates for fall chum salmon have been available since 2006. Data collected thus far showed a good relationship between sonar-based and DFO mark–recapture estimates for fall chum salmon. Beginning in 2008, the Panel agreed to base Canadian escapement goals for fall chum salmon on sonar estimates. DFO operated the mark–recapture project in 2008 during transition, but the project was discontinued in 2009.
TRIBUTARY SONAR Chandalar River is a major producer of fall chum salmon in upper Yukon River in Alaska, accounting for as much as 42% of the overall fall chum salmon run, and averaging 29% during the time period from 1995–2008. Chandalar River has been monitored annually using sonar since 1995, except 2009.
10

11
Sheenjek River is a tributary of Porcupine River that has been monitored annually since 1974 using various methods of assessment, from aerial surveys to sonar technology. This system provides the second largest upper Yukon River U.S. stock, contributing between 5% and 30% annually (1995–2004). Sonar operations since 2005 include monitoring of both banks of the river, compared to just the right bank operations previously employed. Between 2005 and 2009, the left bank has most consistently represented an average of 38% of total passage, with the exception of 2008 when the left bank averaged only 16%. The bank primarily used for migration at a given time seems to be linked to high water events and amount of cloud cover.
WEIRS AND ESCAPEMENT GROUND SURVEYS Fishing Branch River forms part of the headwaters of Porcupine River and is located in Canada. Fishing Branch River has been monitored primarily by weir since 1971, with some aerial survey work contributing to weir estimates prior to 1984. This system is currently a minor producer, averaging 5% during the time period from 1995–2008, with the greatest contribution being 24% in 1975.
Delta River serves as an index area for upper Tanana River stocks. Delta River has been monitored by replicate foot surveys since 1974 from which population estimates are derived. Based on the mark–recapture project that provided population estimates for upper Tanana River from 1995–2007, Delta River, on average, represents 10% of the stock. A radiotelemetry project was conducted in 2008 on fall chum salmon bound for upper Tanana River, and preliminary analysis indicated that 10% of the tags were tracked to Delta River.
The Toklat River springs area was previously an index for the Kantishna River portion of the Tanana River drainage. Population estimates were derived by various methods (Table 1) from 1974 through 2005 based on thorough counts of salmon congregating at this location. Changes in environmental conditions have prevented estimation of population abundance in recent years. The site is still used for collecting data on escapement age, sex, and length for fall chum salmon, and a coho salmon survey is conducted in nearby Geiger Creek.
TEST FISH WHEELS AND NETS There are 3 fish wheel projects currently associated with assessment of fall chum and coho salmon. One is located in mainstem Yukon River near the mouth of Tanana River (Subdistrict 5-A); another is located upstream near Rapids (Subdistrict 5-B); and the third is located in the Tanana River drainage downstream from Nenana (District 6). All 3 of these fish wheels provide indices of fall chum and coho salmon abundance through catch per unit effort (CPUE) information. Additionally, test drift gillnet projects are operated to provide CPUE in mainstem Yukon River in lower Yukon (District 1) and in Mt. Village (District 2). Test drift gillnet sites in the lower Yukon projects are also used to provide inseason estimates of age composition and sex ratios, and postseason, ages are used to develop the brood table for the aggregate of fall chum salmon.

REFERENCES CITED ADF&G (Alaska Department of Fish and Game). 2000. Yukon River fall chum salmon stock status and development of
management/action plan options. Alaska Department of Fish and Game, Division of Commercial Fisheries, Regional Information Report 3A00-37, Anchorage. http://www.sf.adfg.state.ak.us/FedAidPDFs/RIR.3A.2000.37.pdf
ADF&G (Alaska Department of Fish and Game). 2004. Escapement goal review of select AYK Region salmon stocks. Alaska Department of Fish and Game, Division of Commercial Fisheries, Regional Information Report 3A04-01, Anchorage. http://www.sf.adfg.state.ak.us/FedAidpdfs/RIR.3A.2004.01.pdf
Brannian, L. K., M. J. Evenson, and J. R. Hilsinger. 2006. Escapement goal recommendations for select Arctic-Yukon-Kuskokwim region salmon stocks, 2007. Alaska Department of Fish and Game, Fishery Manuscript No. 06-07, Anchorage. http://www.sf.adfg.state.ak.us/FedAidPDFs/fm06-07.pdf
Bue, F. J., B. M. Borba, and D. J. Bergstrom. 2004. Yukon River fall chum salmon stock status and action plan. A Report to the Board of Fisheries. Alaska Department of Fish and Game, Division of Commercial Fisheries, Regional Information Report 3A04-05. Anchorage. http://www.sf.adfg.state.ak.us/FedAidpdfs/RIR.3A.2004.05.pdf
Busher, William H., T. Hamazaki, and D. M. Jallen. In prep. Subsistence and personal use salmon harvests in the Alaskan portion of the Yukon River drainage, 2008. Alaska Department of Fish and Game, Fishery Data Series, Anchorage.
Eggers, D. M. 2001. Biological escapement goals for Yukon River fall chum salmon. Alaska Department of Fish and Game, Division of Commercial Fisheries, Regional Information Report 3A01-10, Anchorage. http://www.sf.adfg.state.ak.us/FedAidpdfs/RIR.3A.2001.10.pdf
Fleischman, S. J., and B. M. Borba. 2009. Escapement estimation, spawner-recruit analysis, and escapement goal recommendation for fall chum salmon in the Yukon River drainage. Alaska Department of Fish and Game, Fishery Manuscript Series No. 09-08, Anchorage.
JTC (Joint Technical Committee of the Yukon River US/Canada Panel). 2006. Yukon River salmon 2005 season summary and 2006 season outlook. Alaska Department of Fish and Game, Division of Commercial Fisheries, Regional Information Report 3A06-03, Anchorage. http://www.sf.adfg.state.ak.us/FedAidpdfs/RIR.3A.2006.03.pdf
JTC (Joint Technical Committee of the Yukon River US/Canada Panel). 2008. Yukon River salmon 2007 season summary and 2008 season outlook. Alaska Department of Fish and Game, Division of Commercial Fisheries, Regional Information Report 3A08-01, Anchorage.
http://www.sf.adfg.state.ak.us/FedAidpdfs/RIR.3A.2008.01.pdf
JTC (Joint Technical Committee of the Yukon River US/Canada Panel). 2009. Yukon River salmon 2008 season summary and 2009 season outlook. Alaska Department of Fish and Game, Division of Commercial Fisheries, Regional Information Report 3A09-01, Anchorage.
http://www.sf.adfg.state.ak.us/FedAidpdfs/RIR.3A.2009.01.pdf
Scheuerell, M. D., and J. G. Williams. 2005. Forecasting climate-induced changes in the survival of Snake River spring/summer Chinook salmon (Oncorhynchus tshawytscha). Fisheries Oceanography 14:6:448–457.
Volk, E., M. J. Evenson, and R. H. Clark. 2009. Escapement goal recommendations for select Arctic-Yukon-Kuskokwim Region salmon stocks, 2010. Alaska Department of Fish and Game, Fishery Manuscript No. 09-07, Anchorage. http://www.sf.adfg.state.ak.us/FedAidPDFs/FMS09-07.pdf
12

TABLES AND FIGURES
13

Table 1.–Fall chum salmon passage estimates and escapement estimates for selected spawning areas, Yukon River drainage, 1971–2009.
Alaska Yukon Tanana River Drainage Upper Yukon River Drainage Canada River Kantishna / Upper Mainstem Mainstem Toklat Rivers Bluff Tanana River Fishing Tagging
Sonar Toklat Tagging Delta Cabin Tagging Chandalar Sheenjek Branch Escapement Year Estimate River a Estimate b River c Slough d Estimate e River f River g River h Estimate i
1971 312,800 j 1972 35,125 k 1973 15,989 1974 41,798 5,915 l 89,966 m 31,525 1975 92,265 3,734 173,371 m 353,282 1976 52,891 6,312 26,354 m 36,584 j 1977 34,887 16,876 45,544 m 88,400 j 1978 37,001 11,136 l 32,449 m 40,800 j 1979 158,336 8,355 l 91,372 m 119,898 j 1980 26,346 5,137 l 3,190 n 28,933 m 55,268 j 22,912 1981 15,623 23,508 l 6,120 n 74,560 57,386 o 47,066 p 1982 3,624 4,235 l 1,156 31,421 15,901 j 31,958 1983 21,869 7,705 l 12,715 49,392 27,200 j 90,875 1984 16,758 12,411 l 4,017 27,130 15,150 j 56,633 p 1985 22,750 17,276 2,655 n 152,768 q 56,016 62,010 1986 17,976 6,703 3,458 59,313 84,207 q, r 31,723 87,940 1987 22,117 21,180 l 9,395 52,416 153,267 q, r 48,956 80,776 1988 13,436 18,024 l 4,481 n 33,619 45,206 r 23,597 36,786 1989 30,421 21,342 5,386 n 69,161 99,116 r 43,834 35,750 1990 34,739 8,992 1,632 78,631 77,750 r 35,000 s 51,735 1991 13,347 32,905 7,198 86,496 37,733 78,461 1992 14,070 8,893 3,615 n 78,808 22,517 49,082 1993 295,000 27,838 19,857 l 5,550 n 42,922 28,707 29,743 1994 407,000 76,057 23,777 2,277 n 150,565 65,247 98,358 1995 1,053,245 54,513 t 20,587 l 19,460 268,173 280,999 241,855 51,971 u 158,092
14
-continued-
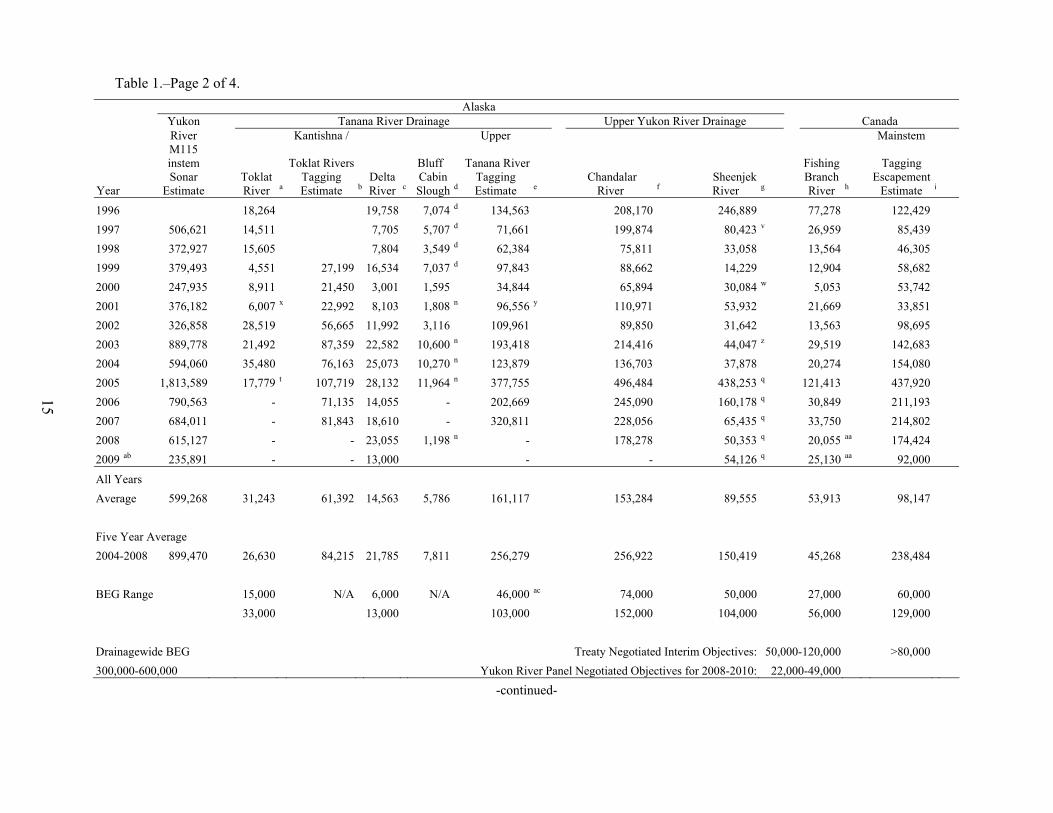
Table 1.–Page 2 of 4.
Alaska Yukon Tanana River Drainage Upper Yukon River Drainage Canada River Kantishna / Upper Mainstem
M115 instem Toklat Rivers Bluff Tanana River Fishing Tagging
Sonar Toklat Tagging Delta Cabin Tagging Chandalar Sheenjek Branch Escapement Year Estimate River a Estimate b River c Slough d Estimate e River f River g River h Estimate i
1996 18,264 19,758 7,074 d 134,563 208,170 246,889 77,278 122,429 1997 506,621 14,511 7,705 5,707 d 71,661 199,874 80,423 v 26,959 85,439 1998 372,927 15,605 7,804 3,549 d 62,384 75,811 33,058 13,564 46,305 1999 379,493 4,551 27,199 16,534 7,037 d 97,843 88,662 14,229 12,904 58,682 2000 247,935 8,911 21,450 3,001 1,595 34,844 65,894 30,084 w 5,053 53,742 2001 376,182 6,007 x 22,992 8,103 1,808 n 96,556 y 110,971 53,932 21,669 33,851 2002 326,858 28,519 56,665 11,992 3,116 109,961 89,850 31,642 13,563 98,695 2003 889,778 21,492 87,359 22,582 10,600 n 193,418 214,416 44,047 z 29,519 142,683 2004 594,060 35,480 76,163 25,073 10,270 n 123,879 136,703 37,878 20,274 154,080 2005 1,813,589 17,779 t 107,719 28,132 11,964 n 377,755 496,484 438,253 q 121,413 437,920 2006 790,563 - 71,135 14,055 - 202,669 245,090 160,178 q 30,849 211,193 2007 684,011 - 81,843 18,610 - 320,811 228,056 65,435 q 33,750 214,802 2008 615,127 - - 23,055 1,198 n - 178,278 50,353 q 20,055 aa 174,424 2009 ab 235,891 - - 13,000 - - 54,126 q 25,130 aa 92,000
All Years Average 599,268 31,243 61,392 14,563 5,786 161,117 153,284 89,555 53,913 98,147 Five Year Average 2004-2008 899,470 26,630 84,215 21,785 7,811 256,279 256,922 150,419 45,268 238,484 BEG Range 15,000 N/A 6,000 N/A 46,000 ac 74,000 50,000 27,000 60,000 33,000 13,000 103,000 152,000 104,000 56,000 129,000 Drainagewide BEG Treaty Negotiated Interim Objectives: 50,000-120,000 >80,000 300,000-600,000 Yukon River Panel Negotiated Objectives for 2008-2010: 22,000-49,000
15
-continued-

Table 1.–Page 3 of 4.
Note: Latest table revision December 4, 2009. a Total abundance estimates for upper Toklat River drainage spawning index area using stream life curve method developed with 1987 to 1993 data. b Fall chum salmon passage estimate for Kantishna and Toklat river drainages is based on tag deployment from a fish wheel located at the lower end of
Kantishna River and recaptures from three fish wheels; two located on Toklat River (1999 to 2007) about eight miles upstream of the mouth and one fish wheel on Kantishna River (2000 and 2007) near Bear Paw River.
c Population estimate generated from replicate foot surveys and stream life data (area under the curve method), unless otherwise noted. d Peak counts from foot surveys unless otherwise noted. e Fall chum salmon passage estimate for upper Tanana River drainage based on tag deployment from a fish wheel (two fish wheels in 1995) located just
upstream of Kantishna River and recaptures from one fish wheel (two fish wheels from 1995 to 1998) located downstream from the village of Nenana. f Side-scan sonar estimate from 1986 through 1990. Split beam sonar estimate from 1995 through 2006. DIDSON sonar estimate in 2007 to present. g Side-scan sonar estimate from 1986 through 1999, 2001, and 2002. Split-beam sonar estimate from 2003 through 2004. DIDSON sonar estimate since 2005.
Counts prior to 1986 are considered conservative, approximating the period from the end of August through middle of the fourth week of September. Since 1991, total abundance estimates are for the approximate period second week in August through the middle of the fourth week of September.
h Total escapement estimated using weir count unless otherwise indicated. Counts for 1974, 1975, and 1998 revised from DFO, February 23, 2000. i Estimated border passage minus Canadian mainstem harvest and excluding Canadian Porcupine River drainage escapement. Based on mark-recapture from
1980 to 2007 and sonar thereafter. j Total escapement estimated using weir to aerial survey expansion factor of 2.72. 16
k Weir installed on September 22, 1972. Estimate consists of a weir count of 17,190 after September 22 and a tagging passage estimate of 17,935 prior to weir installation.
l Total escapement estimate generated from the migratory time density curve method. m Total escapement estimate using sonar to aerial survey expansion factor of 2.22. n Peak counts aerial surveys. o In 1981, the initial aerial survey count was doubled before applying the weir to aerial expansion factor of 2.72 since only half of the spawning area was
surveyed. p In 1984, the escapement estimate based on mark-recapture program is unavailable. Estimate is based on assumed average exploitation rate. q Sonar counts included both banks in 1985-1987 and 2005 to present. r Expanded estimates, using Chandalar River fall chum salmon run timing data, for the approximate period from mid-August through the middle of the fourth
week of September 1986-1990. s Population of spawners was reported by DFO as between 30,000 to 40,000 fish considering aerial survey timing. For purpose of this table, an average of
35,000 fall chum salmon was estimated to pass by the weir. Note: A single survey flown October 26, 1990, counted 7,541 chum salmon. A population estimate of approximately 27,000 fish was made through date of survey, based upon historic average aerial to weir expansion of 28%.
t Minimal estimate because of late timing of ground surveys with respect to peak of spawning. u Minimal count because weir was closed while submerged due to high water, during the period August 31 to September 8, 1995.

Table 1.–Page 4 of 4.
v The passage estimate includes an additional 15,134 salmon that were estimated to have passed during 127 hours that the sonar was inoperable due to high water from August 29 until September 3, 1997.
w Project ended early; sonar passage estimate was 18,652 (62% of normal run timing). The total sonar passage estimate, 30,083, was expanded to reflect the 1986-1999 average run timing through September 24.
x Minimal estimate because Sushana River was breached by the main channel and uncountable. y Due to low numbers of tags deployed and recovered on Tanana River the estimate has a large range in confidence interval (95% CI + 41,172). z Project ended on peak daily passages due to late run timing; estimate was expanded based on run timing (87%) at Rapids. aa Project estimated for late run timing through October 25 as project ended on October 10, 2008 and October 12, 2009. ab Preliminary. ac Upper Tanana River goal is Tanana River drainage BEG (61,000 to 136,000) minus the lower and upper ranges of Toklat River goal based on Eggers (2001),
and is not an established BEG.
17

Table 2.–Fall chum salmon estimated brood year production and return per spawner estimates, Yukon Area, 1974–2008.
(P) Estimated Brood Year Return (R) (R/P)
Estimated Annual Totals Number of Salmon a Percent Total Brood Return/
Year Escapement b Catch Return Age 3 Age 4 Age 5 Age 6 Age 3 Age 4 Age 5 Age 6 Year Returna Spawner
1974 436,485 478,875 915,360 91,751 497,755 68,693 0 0.139 0.756 0.104 0.000 658,199 1.51 1975 1,465,213 473,062 1,938,275 150,451 1,225,440 61,401 123 0.105 0.853 0.043 0.000 1,437,415 0.98 1976 268,841 339,043 607,884 102,062 587,479 137,039 4,316 0.123 0.707 0.165 0.005 830,895 3.09 1977 514,843 447,918 962,761 102,660 1,075,198 175,688 4,189 0.076 0.792 0.129 0.003 1,357,735 2.64 1978 320,487 434,030 754,517 22,222 332,230 90,580 0 0.050 0.747 0.204 0.000 445,032 1.39 1979 780,818 615,377 1,396,195 41,114 769,496 274,311 3,894 0.038 0.707 0.252 0.004 1,088,814 1.39 1980 263,167 488,373 751,540 8,377 362,199 208,962 3,125 0.014 0.622 0.359 0.005 582,663 2.21 1981 551,192 683,391 1,234,583 45,855 955,725 278,386 8,888 0.036 0.742 0.216 0.007 1,288,853 2.34 1982 179,828 373,519 553,347 11,327 400,323 166,754 679 0.020 0.691 0.288 0.001 579,083 3.22 1983 347,157 525,485 872,642 12,569 875,355 223,468 2,313 0.011 0.786 0.201 0.002 1,113,704 3.21 1984 270,042 412,323 682,365 7,089 408,040 174,207 8,516 0.012 0.683 0.291 0.014 597,852 2.21 1985 664,426 515,481 1,179,907 46,635 874,819 270,984 3,194 0.039 0.732 0.227 0.003 1,195,632 1.80 1986 376,374 318,028 694,402 0 429,749 368,513 4,353 0.000 0.535 0.459 0.005 802,614 2.13 1987 651,943 406,143 1,058,086 12,413 617,519 290,767 7,720 0.013 0.665 0.313 0.008 928,418 1.42 1988 325,137 353,685 678,822 41,003 175,236 152,368 10,894 c 0.108 0.462 0.401 0.029 379,501 1.17 1989 506,173 545,166 1,051,339 2,744 282,905 345,136 c 20,290 0.004 0.435 0.530 0.031 651,075 1.29 1990 369,654 352,007 721,661 710 579,452 c 418,448 30,449 0.001 0.563 0.407 0.030 1,029,059 2.78 1991 591,132 439,096 1,030,228 3,663 c 1,024,800 369,103 12,167 0.003 0.727 0.262 0.009 1,409,733 2.38 1992 324,253 148,846 473,099 6,763 653,648 197,073 3,907 0.008 0.759 0.229 0.005 861,392 2.66 1993 352,688 91,015 443,703 7,745 451,327 102,420 3,235 0.014 0.799 0.181 0.006 564,727 1.60
1994 769,920 169,225 939,145 4,322 225,243 149,527 1,603 c 0.011 0.592 0.393 0.004 380,695 0.49
18
-continued-

Table 2.–Page 2 of 2.
(P) Estimated Brood Year Return (R) (R/P)
Estimated Annual Totals Number of Salmon Percent Total Brood Return
Year Escapement Catch Return Age 3 Age 4 Age 5 Age 6 Age 3 Age 4 Age 5 Age 6 Year Return Spawner
1995 1,009,155 461,147 1,470,302 2,371 266,955 68,918 c 383 0.007 0.788 0.204 0.001 338,627 0.34 1996 800,022 260,923 1,060,945 420 165,691 c 136,906 8,295 0.001 0.532 0.440 0.027 311,312 0.39 1997 494,831 170,059 664,890 3,087 c 244,801 118,343 3,332 0.008 0.662 0.320 0.009 369,563 0.75 1998 263,121 70,820 333,941 651 269,653 57,962 6,694 0.002 0.805 0.173 0.020 334,960 1.27 1999 288,962 131,175 420,137 29,097 705,152 174,424 13,721 0.032 0.764 0.189 0.015 922,394 3.19 2000 210,756 28,543 239,299 8,446 297,012 115,488 0 0.020 0.706 0.274 0.000 420,946 2.00 2001 337,765 44,976 382,741 136,038 2,157,674 675,688 33,600 0.045 0.719 0.225 0.011 3,003,001 8.89 2002 397,977 27,411 425,388 0 444,507 236,656 12,831 0.000 0.651 0.346 0.019 683,312 1.72 2003 695,363 79,529 774,892 24,263 849,743 426,811 16,982 0.018 0.645 0.324 1,317,798 d >1.902004 537,873 76,296 614,169 0 326,466 180,928 507,394 e >0.942005 1,996,700 290,183 2,286,883 2,228 2006 873,987 270,471 1,144,458 2007 916,606 203,393 1,119,999 2008 559,541 208,795 768,336
2007 Avg. 563,320 315,442 878,762
487,323 All Brood Years (1974–2002) 31,089 598,462 210,628 7,335 0.0324 0.6889 0.2698 0.0094 847,145 2.09 371,738 Even Brood Years (1974–2002) 20,343 388,548 178,612 6,377 0.0340 0.6540 0.3022 0.0109 593,168 1.88 611,164 Odd Brood Years (1974–2002) 42,603 823,369 244,931 8,361 0.0307 0.7264 0.2351 0.0077 1,119,264 2.30
19
a The estimated number of salmon which returned are based upon annual age composition observed in lower Yukon test nets each year, weighted by test fish CPUE.
b Contrast in escapement data is 11.10. c Based upon expanded test fish age composition estimates for years in which the test fishery terminated early (both in 1994 and 2000). d Brood year return for 3, 4, and 5 year fish indicate that production (R/P) from brood year 2003 was at least 1.90. Recruits estimated for incomplete brood year. e Brood year return for 3 and 4 year fish indicate that production (R/P) from brood year 2004 was at least 0.94. Recruits estimated for incomplete brood year.
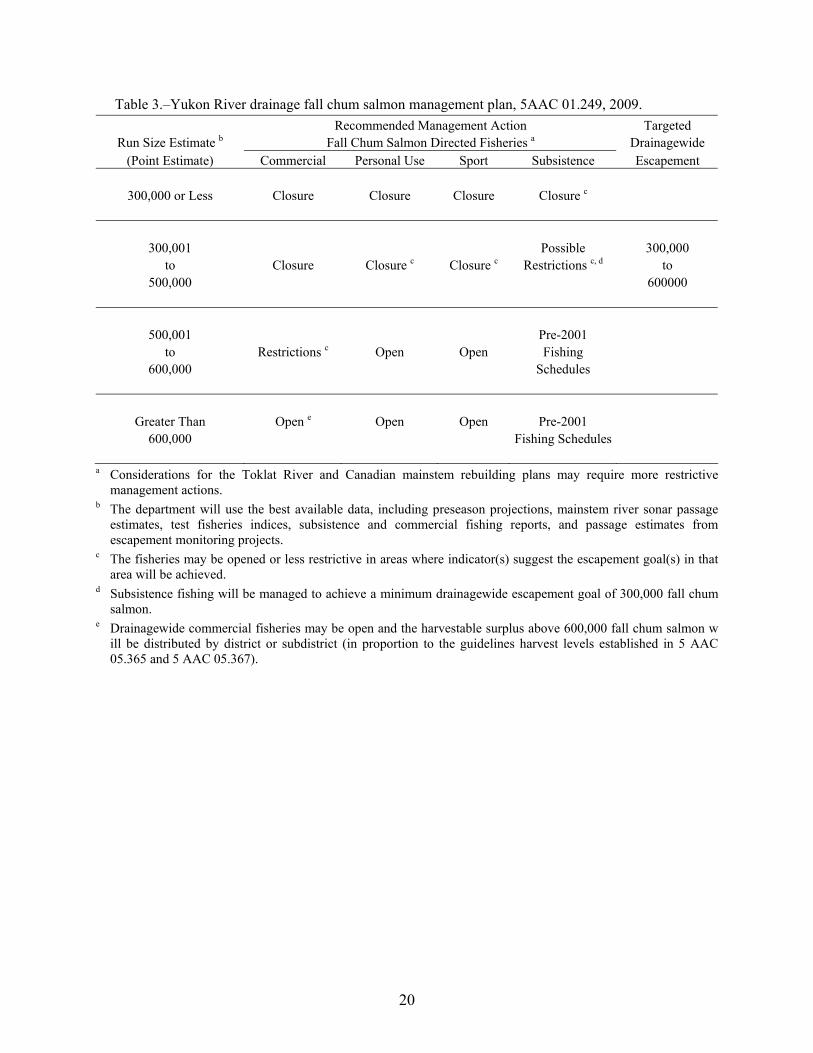
Table 3.–Yukon River drainage fall chum salmon management plan, 5AAC 01.249, 2009. Recommended Management Action Targeted
Run Size Estimate b Fall Chum Salmon Directed Fisheries a Drainagewide (Point Estimate) Commercial Personal Use Sport Subsistence Escapement
300,000 or Less Closure Closure Closure Closure c
300,001 Possible 300,000 to Closure Closure c Closure c Restrictions c, d to
500,000 600000
500,001 Pre-2001 to Restrictions c Open Open Fishing
600,000 Schedules
Greater Than Open e Open Open Pre-2001 600,000 Fishing Schedules
a Considerations for the Toklat River and Canadian mainstem rebuilding plans may require more restrictive
management actions. b The department will use the best available data, including preseason projections, mainstem river sonar passage
estimates, test fisheries indices, subsistence and commercial fishing reports, and passage estimates from escapement monitoring projects.
c The fisheries may be opened or less restrictive in areas where indicator(s) suggest the escapement goal(s) in that area will be achieved.
d Subsistence fishing will be managed to achieve a minimum drainagewide escapement goal of 300,000 fall chum salmon.
e Drainagewide commercial fisheries may be open and the harvestable surplus above 600,000 fall chum salmon w ill be distributed by district or subdistrict (in proportion to the guidelines harvest levels established in 5 AAC 05.365 and 5 AAC 05.367).
20

Table 4.–Estimated fall chum salmon subsistence and personal use harvest in numbers of fish by district, Yukon River, 1979–2008.
Lower Yukon Upper Yukon District 1 District 2 District 3 Subtotal District 4 District 5 District 6 Subtotal Total
Est. % of Est. % of Est. % of Est. % of Est. % of Est. % of Est. % of Est. % of SubsistenceYear Harvest Harvest Harvest Harvest Harvest Harvest Harvest Harvest Harvest Harvest Harvest Harvest Harvest Harvest Harvest Harvest Harvesta
1979 15,788 7% 14,622 6% 2,443 1% 32,853 14% 37,896 16% 110,792 47% 51,766 22% 200,454 86% 233,3071980 7,433 4% 12,435 7% 2,320 1% 22,188 13% 23,675 14% 76,466 44% 50,328 29% 150,469 87% 172,6571981 15,540 8% 11,770 6% 3,043 2% 30,353 16% 19,973 11% 111,567 59% 26,632 14% 158,172 84% 188,5251982 10,016 8% 9,511 7% 1,659 1% 21,186 16% 20,319 15% 71,828 54% 19,564 15% 111,711 84% 132,8971983 8,238 4% 10,341 5% 2,863 1% 21,442 11% 34,209 18% 105,103 54% 32,174 17% 171,486 89% 192,9281984 8,885 5% 11,394 7% 2,233 1% 22,512 13% 31,152 18% 98,433 56% 22,726 13% 152,311 87% 174,8231985 13,275 6% 11,544 6% 2,290 1% 27,109 13% 25,275 12% 117,125 57% 36,963 18% 179,363 87% 206,4721986 9,000 5% 13,483 8% 1,785 1% 24,268 15% 26,496 16% 88,124 54% 25,155 15% 139,775 85% 164,0431987 18,467 8% 13,454 6% 2,853 1% 34,774 15% 41,901 18% 113,498 50% 36,595 16% 191,994 85% 226,7681988 5,475 4% 8,600 6% 1,747 1% 15,822 10% 18,379 12% 84,209 54% 36,403 24% 138,991 90% 154,8131989 4,914 2% 10,015 5% 1,019 0% 15,948 8% 24,544 12% 112,001 53% 58,654 28% 195,199 92% 211,1471990 5,335 3% 6,187 4% 2,056 1% 13,578 8% 19,241 11% 90,513 54% 44,568 27% 154,322 92% 167,9001991 3,935 3% 5,628 4% 615 0% 10,178 7% 20,875 14% 74,002 51% 40,469 28% 135,346 93% 145,5241992 5,216 5% 7,382 7% 1,493 1% 14,091 13% 22,097 21% 45,701 42% 25,713 24% 93,511 87% 107,6021993 7,770 10% 3,094 4% 1,449 2% 12,313 16% 10,832 14% 43,764 57% 10,016 13% 64,612 84% 76,9251994 4,887 4% 4,151 3% 862 1% 9,900 8% 13,325 11% 66,396 54% 33,597 27% 113,318 92% 123,2181995 4,698 4% 3,317 3% 1,672 1% 9,687 7% 14,057 11% 57,594 44% 50,031 38% 121,682 93% 131,3691996 4,147 3% 5,287 4% 2,706 2% 12,140 9% 16,786 13% 63,473 49% 36,823 28% 117,082 91% 129,2221997 3,132 3% 4,680 5% 787 1% 8,599 9% 11,734 12% 55,258 58% 19,834 21% 86,826 91% 95,4251998 3,163 5% 4,482 7% 1,561 2% 9,206 15% 7,898 13% 31,393 50% 14,372 23% 53,663 85% 62,8691999 6,502 7% 4,594 5% 415 0% 11,511 13% 9,174 10% 53,580 60% 15,732 17% 78,486 87% 89,9972000 5,294 27% 1,425 7% 598 3% 7,317 38% 1,759 9% 9,920 51% 311 2% 11,990 62% 19,3072001 3,437 10% 3,256 9% 700 2% 7,393 21% 3,352 10% 20,873 59% 3,536 10% 27,761 79% 35,1542002 1,881 10% 1,618 8% 164 1% 3,663 19% 1,549 8% 10,976 57% 3,205 17% 15,730 81% 19,3932003 2,139 4% 2,901 5% 738 1% 5,778 10% 9,750 17% 28,270 49% 13,380 23% 51,400 90% 57,1782004 2,067 3% 2,421 4% 298 0% 4,786 8% 7,797 12% 40,670 65% 9,183 15% 57,650 92% 62,436
21
-continued-

Table 4.–Page 2 of 2.
Lower Yukon Upper Yukon District 1 District 2 District 3 Subtotal District 4 District 5 District 6 Subtotal Total
Est. % of Est. % of Est. % of Est. % of Est. % of Est. % of Est. % of Est. % of SubsistenceYear Harvest Harvest Harvest Harvest Harvest Harvest Harvest Harvest Harvest Harvest Harvest Harvest Harvest Harvest Harvest Harvest Harvesta
2005 2,889 3% 3,257 4% 1,304 1% 7,450 8% 9,405 10% 51,663 56% 23,079 25% 84,147 92% 91,5972006 b 3,902 5% 4,015 5% 480 1% 8,397 10% 6,335 8% 52,143 62% 17,258 21% 75,736 90% 84,1332007 b 4,390 4% 3,472 4% 925 1% 8,787 9% 8,576 9% 51,457 52% 30,066 30% 90,099 91% 98,8862008 b 2,823 3% 3,522 4% 1,821 2% 8,166 9% 7,412 8% 57,258 64% 16,316 18% 80,986 91% 89,152
5 Yr A vg 2004-2008 3,214 4% 3,337 4% 966 1% 7,517 9% 7,905 9% 50,638 60% 19,180 22% 77,724 91% 85,24110 Yr A v g 1999-2008 3,532 8% 3,048 5% 744 1% 7,325 14% 6,511 10% 37,681 58% 13,207 18% 57,399 86% 64,72315 Yr A v g 1994-2008 3,690 6% 3,493 5% 1,002 1% 8,185 13% 8,594 11% 43,395 55% 19,115 21% 71,104 87% 79,28920 Yr A v g 1989-2008 4,126 6% 4,235 5% 1,083 1% 9,444 12% 11,325 12% 50,845 54% 23,307 22% 85,477 88% 94,922
22
a Total harvest does not include Coastal District. b Preliminary data.

Table 5.–Estimated coho salmon subsistence and personal use harvest in numbers of fish by district, Yukon River, 1979–2008.
Lower Yukon Upper Yukon District 1 District 2 District 3 Subtotal District 4 District 5 District 6 Subtotal Total Est. % of Est. % of Est. % of Est. % of Est. % of Est. % of Est. % of Est. % of Subsistence
Year Harvest Harvest Harvest Harvest Harvest Harvest Harvest Harvest Harvest Harvest Harvest Harvest Harvest Harvest Harvest Harvest Harvesta
1979 3,184 33% 1,132 12% 74 1% 4,390 45% 197 2% 595 6% 4,612 47% 5,404 55% 9,7941980 1,808 9% 4,801 24% 91 0% 6,700 33% 7,734 38% 561 3% 5,163 26% 13,458 67% 20,1581981 3,769 18% 3,736 18% 510 2% 8,015 38% 2,239 11% 1,713 8% 9,261 44% 13,213 62% 21,2281982 11,192 31% 10,229 28% 675 2% 22,096 62% 2,952 8% 3,428 10% 7,418 21% 13,798 38% 35,8941983 3,590 15% 6,072 25% 917 4% 10,579 44% 3,946 17% 2,448 10% 6,932 29% 13,326 56% 23,9051984 6,095 12% 7,066 14% 740 2% 13,901 28% 2,867 6% 17,467 36% 14,785 30% 35,119 72% 49,0201985 3,246 10% 4,834 15% 376 1% 8,456 26% 3,949 12% 8,098 25% 11,761 36% 23,808 74% 32,2641986 2,725 8% 9,140 27% 954 3% 12,819 37% 2,458 7% 5,870 17% 13,321 39% 21,649 63% 34,4681987 6,529 13% 6,894 14% 754 2% 14,177 29% 3,479 7% 6,885 14% 24,195 50% 34,559 71% 48,7361988 6,238 9% 7,104 10% 1,667 2% 15,009 21% 4,714 7% 19,858 28% 31,348 44% 55,920 79% 70,9291989 5,349 13% 5,039 12% 537 1% 10,925 26% 4,030 10% 7,269 17% 19,572 47% 30,871 74% 41,7961990 3,309 7% 6,344 14% 1,026 2% 10,679 24% 3,614 8% 11,580 26% 18,768 42% 33,962 76% 44,6411991 1,808 5% 3,297 9% 1,340 4% 6,445 17% 4,451 12% 4,931 13% 21,561 58% 30,943 83% 37,3881992 5,485 11% 6,587 13% 1,549 3% 13,621 26% 8,429 16% 12,376 24% 17,554 34% 38,359 74% 51,9801993 2,383 15% 1,695 11% 279 2% 4,357 28% 1,167 7% 5,984 38% 4,304 27% 11,455 72% 15,8121994 3,353 8% 3,881 9% 363 1% 7,597 18% 3,601 9% 4,174 10% 26,489 63% 34,264 82% 41,8611995 2,403 8% 2,142 7% 891 3% 5,436 19% 1,934 7% 2,205 8% 19,219 67% 23,358 81% 28,7941996 2,445 8% 3,475 11% 444 1% 6,364 21% 2,467 8% 6,588 22% 15,091 49% 24,146 79% 30,5101997 1,823 8% 2,424 10% 766 3% 5,013 21% 3,754 15% 3,583 15% 11,945 49% 19,282 79% 24,2951998 2,171 12% 2,297 13% 400 2% 4,868 27% 2,593 15% 2,839 16% 7,481 42% 12,913 73% 17,7811999 1,730 8% 2,793 13% 610 3% 5,133 24% 2,049 10% 4,241 20% 9,541 46% 15,831 76% 20,9642000 1,067 7% 2,351 16% 94 1% 3,512 24% 1,068 7% 4,987 34% 5,150 35% 11,205 76% 14,7172001 1,274 6% 1,440 7% 0 0% 2,714 13% 2,266 10% 7,674 35% 9,000 42% 18,940 87% 21,6542002 1,295 8% 1,233 8% 115 1% 2,643 17% 1,023 7% 2,076 14% 9,519 62% 12,618 83% 15,2612003 1,260 5% 1,586 7% 711 3% 3,557 15% 5,773 24% 3,887 16% 10,912 45% 20,572 85% 24,1292004 1,175 6% 1,500 7% 284 1% 2,959 14% 4,766 23% 1,423 7% 11,817 56% 18,006 86% 20,9652005 976 4% 1,110 4% 217 1% 2,303 9% 2,971 11% 2,159 8% 19,645 73% 24,775 91% 27,078
23
-continued-

Table 5.–Page 2 of 2.
Lower Yukon Upper Yukon District 1 District 2 District 3 Subtotal District 4 District 5 District 6 Subtotal Total Est. % of Est. % of Est. % of Est. % of Est. % of Est. % of Est. % of Est. % of Subsistence
Year Harvest Harvest Harvest Harvest Harvest Harvest Harvest Harvest Harvest Harvest Harvest Harvest Harvest Harvest Harvest Harvest Harvesta
2006 b 1,177 6% 2,459 13% 83 0% 3,719 19% 1,302 7% 3,779 19% 10,850 55% 15,931 81% 19,6502007 b 2,265 10% 2,347 11% 739 3% 5,351 24% 2,952 13% 5,620 26% 7,980 36% 16,552 76% 21,9032008 b 1,211 7% 1,997 12% 410 2% 3,618 22% 1,490 9% 3,203 19% 8,478 50% 13,171 78% 16,789
5 Yr Avg 2004-2008 1,361 7% 1,883 9% 347 2% 3,590 18% 2,696 13% 3,237 16% 11,754 54% 17,687 82% 21,27710 Yr Avg 1999-2008 1,343 7% 1,882 10% 326 2% 3,551 18% 2,566 12% 3,905 20% 10,289 50% 16,760 82% 20,31115 Yr Avg 1994-2008 1,708 7% 2,202 10% 408 2% 4,319 19% 2,667 12% 3,896 18% 12,208 51% 18,771 81% 23,09020 Yr Avg 1989-2008 2,198 8% 2,800 10% 543 2% 5,541 20% 3,085 11% 5,029 19% 13,244 49% 21,358 80% 26,898a Total harvest does not include Coastal District. 24
b Preliminary data.

Table 6.–Commercial harvest of fall chum salmon by district, Yukon River, 1961–2009.
Lower Yukon Upper Yukon Lower Upper Total District 1 District 2 District 3 Yukon Subtotal District 4 District 5 District 6 Yukon Subtotal Commercial
Year a Harvest Harvest
(%) Harvest Harvest
(%) HarvestHarvest
(%) HarvestHarvest
(%) Harvest bHarvest
(%) Harvest b Harvest
(%) Harvest bHarvest
(%) Harvest bHarvest
(%) Harvest 1961 42,461 100.0% 0 0.0% 0 0.0% 42,461 100.0% 0 0.0% - 0.0% - 0.0% 0 0.0% 42,461 1962 53,116 100.0% 0 0.0% 0 0.0% 53,116 100.0% 0 0.0% - 0.0% - 0.0% 0 0.0% 53,116 1963 0 0.0% 0 0.0% 0 0.0% 0 0.0% 0 0.0% - 0.0% - 0.0% 0 0.0% 0 1964 8,347 100.0% 0 0.0% 0 0.0% 8,347 100.0% 0 0.0% - 0.0% - 0.0% 0 0.0% 8,347 1965 22,936 98.4% 0 0.0% 0 0.0% 22,936 98.4% 381 1.6% - 0.0% - 0.0% 381 1.6% 23,317 1966 69,836 98.3% 0 0.0% 1,209 1.7% 71,045 100.0% 0 0.0% - 0.0% - 0.0% 0 0.0% 71,045 1967 36,451 95.2% 0 0.0% 1,823 4.8% 38,274 100.0% 0 0.0% - 0.0% - 0.0% 0 0.0% 38,274 1968 49,857 94.2% 0 0.0% 3,068 5.8% 52,925 100.0% 0 0.0% - 0.0% - 0.0% 0 0.0% 52,925 1969 128,866 98.1% 0 0.0% 1,722 1.3% 130,588 99.5% 722 0.5% - 0.0% - 0.0% 722 0.5% 131,310 1970 200,306 95.6% 4,858 2.3% 3,285 1.6% 208,449 99.5% 1,146 0.5% - 0.0% - 0.0% 1,146 0.5% 209,595 1971 188,533 99.4% 0 0.0% 0 0.0% 188,533 99.4% 1,061 0.6% - 0.0% - 0.0% 1,061 0.6% 189,594 1972 136,711 89.8% 12,898 8.5% 1,313 0.9% 150,922 99.2% 1,254 0.8% - 0.0% - 0.0% 1,254 0.8% 152,176 1973 173,783 74.9% 45,304 19.5% 0 0.0% 219,087 94.4% 13,003 5.6% - 0.0% - 0.0% 13,003 5.6% 232,090 1974 176,036 60.7% 53,540 18.5% 552 0.2% 230,128 79.4% 9,213 3.2% 23,551 8.1% 26,884 9.3% 59,648 20.6% 289,776 1975 158,183 57.5% 51,666 18.8% 5,590 2.0% 215,439 78.3% 13,666 5.0% 27,212 9.9% 18,692 6.8% 59,570 21.7% 275,009 1976 105,851 67.7% 21,212 13.6% 4,250 2.7% 131,313 84.0% 1,742 1.1% 5,387 3.4% 17,948 11.5% 25,077 16.0% 156,390 1977 131,758 51.1% 51,994 20.2% 15,851 6.1% 199,603 77.4% 13,980 5.4% 25,730 10.0% 18,673 7.2% 58,383 22.6% 257,986 1978 127,947 51.8% 51,646 20.9% 11,527 4.7% 191,120 77.4% 12,709 5.1% 26,236 10.6% 16,946 6.9% 55,891 22.6% 247,011 1979 109,406 28.9% 94,042 24.9% 25,955 6.9% 229,403 60.6% 52,098 13.8% 55,556 14.7% 41,355 10.9% 149,009 39.4% 378,412 1980 106,829 35.7% 83,881 28.1% 13,718 4.6% 204,428 68.4% 32,730 10.9% 42,245 14.1% 19,519 6.5% 94,494 31.6% 298,922 1981 167,834 34.5% 154,883 31.9% 19,043 3.9% 341,760 70.3% 19,851 4.1% 94,793 19.5% 29,608 6.1% 144,252 29.7% 486,012 1982 97,484 43.3% 96,581 42.9% 5,815 2.6% 199,880 88.7% 4,061 1.8% 13,979 6.2% 7,370 3.3% 25,410 11.3% 225,290 1983 124,371 40.6% 85,645 28.0% 10,018 3.3% 220,034 71.9% 6,114 2.0% 43,993 14.4% 35,994 11.8% 86,101 28.1% 306,135 1984 78,751 37.9% 70,803 34.1% 6,429 3.1% 155,983 75.1% 9,841 4.7% 24,117 11.6% 17,785 8.6% 51,743 24.9% 207,726 1985 129,948 48.1% 40,490 15.0% 5,164 1.9% 175,602 65.0% 26,977 10.0% 25,338 9.4% 42,352 15.7% 94,667 35.0% 270,269 1986 59,352 42.4% 51,307 36.6% 2,793 2.0% 113,452 81.0% 2,045 1.5% 22,448 16.0% 2,074 1.5% 26,567 19.0% 140,019 1987 0 0.0% 0 0.0% 0 0.0% 0 0.0% 0 0.0% 0 0.0% 0 0.0% 0 0.0% 0 1988 45,317 33.1% 31,861 23.3% 2,090 1.5% 79,268 57.9% 17,083 12.5% 16,989 12.4% 23,650 17.3% 57,722 42.1% 136,990
25
-continued-

Table 6.–Page 2 of 2. Lower Yukon Upper Yukon Lower Upper Total District 1 District 2 District 3 Yukon Subtotal District 4 District 5 District 6 Yukon Subtotal Commercial
Year a Harvest Harvest
(%) Harvest Harvest
(%) HarvestHarvest
(%) HarvestHarvest
(%) Harvest bHarvest
(%) Harvest bHarvest
(%) Harvest bHarvest
(%) Harvest bHarvest
(%) Harvest 1989 77,876 27.4% 97,096 34.2% 15,332 5.4% 190,304 67.0% 15,183 5.3% 22,204 7.8% 56,443 19.9% 93,830 33.0% 284,134 1990 27,337 20.1% 37,173 27.3% 3,715 2.7% 68,225 50.1% 8,166 6.0% 8,976 6.6% 50,717 37.3% 67,859 49.9% 136,084 1991 59,724 23.5% 102,628 40.4% 9,213 3.6% 171,565 67.5% 6,091 2.4% 32,114 12.6% 44,448 17.5% 82,653 32.5% 254,218 1992 0 0.0% 0 0.0% 0 0.0% 0 0.0% 0 0.0% 0 0.0% 19,022 100.0% 19,022 100.0% 19,022 1993 0 0.0% 0 0.0% 0 0.0% 0 0.0% 0 0.0% 0 0.0% 0 0.0% 0 0.0% 0 1994 0 0.0% 0 0.0% 0 0.0% 0 0.0% 0 0.0% 3,630 45.4% 4,369 54.6% 7,999 100.0% 7,999 1995 79,345 28.0% 90,831 32.1% 0 0.0% 170,176 60.1% 8,731 3.1% 30,033 10.6% 74,117 26.2% 112,881 39.9% 283,057 1996 33,629 31.8% 29,651 28.1% 0 0.0% 63,280 59.9% 2,918 2.8% 21,858 20.7% 17,574 16.6% 42,350 40.1% 105,630 1997 27,483 47.2% 24,326 41.8% 0 0.0% 51,809 89.0% 2,458 4.2% 3,920 6.7% 0 0.0% 6,378 11.0% 58,187 1998 0 0.0% - 0 0.0% - 0 0.0% - 0 0.0% 0 0.0% - 0 0.0% 0 0.0% 0 0.0% 0 1999 9,987 49.0% 9,703 47.6% 0 0.0% 19,690 96.7% 681 3.3% 0 0.0% 0 0.0% 681 3.3% 20,371 2000 0 0.0% - 0 0.0% - 0 0.0% - 0 0.0% 0 0.0% - 0 0.0% 0 0.0% 0 0.0% 0 2001 0 0.0% - 0 0.0% - 0 0.0% - 0 0.0% 0 0.0% - 0 0.0% 0 0.0% 0 0.0% 0 2002 0 0.0% - 0 0.0% - 0 0.0% - 0 0.0% 0 0.0% - 0 0.0% 0 0.0% 0 0.0% 0 2003 5,586 50.8% 0 0.0% 0 0.0% 5,586 50.8% 1,315 12.0% 0 0.0% 4,095 37.2% 5,410 49.2% 10,996 2004 660 16.1% 0 0.0% 0 0.0% 660 16.1% 0 0.0% 0 0.0% 3,450 83.9% 3,450 83.9% 4,110 2005 130,525 72.4% 0 0.0% 0 0.0% 130,525 72.4% 0 0.0% 0 0.0% 49,637 27.6% 49,637 27.6% 180,162 2006 101,254 58.0% 39,905 22.9% 0 0.0% 141,159 80.9% 0 0.0% 10,030 5.7% 23,353 13.4% 33,383 19.1% 174,542 2007 38,852 42.8% 35,826 39.5% 0 0.0% 74,678 82.4% 0 0.0% 427 0.5% 15,572 17.2% 15,999 17.6% 90,677 2008 67,704 56.8% 41,270 34.6% 0 0.0% 108,974 91.4% 0 0.0% 4,556 3.8% 5,735 4.8% 10,291 8.6% 119,265 2009 c 11,911 47.1% 12,072 47.8% 0 0.0% 23,983 94.9% 0 0.0% 0 0.0% 1,286 5.1% 1,286 5.1% 25,269
5 Yr Avg 2004-2008 67,799 49.2% 23,400 19.4% 0 0.0% 91,199 68.6% 0 0.0% 3,003 2.0% 19,549 29.4% 22,552 31.4% 113,751 10 Yr Avg 1999-2008 35,457 34.6% 12,670 14.5% 0 0.0% 48,127 49.1% 200 1.5% 1,501 1.0% 10,184 18.4% 11,885 20.9% 60,012 15 Yr Avg 1994-2008 33,002 30.2% 18,101 16.4% 0 0.0% 51,102 46.6% 1,074 1.7% 4,964 6.2% 13,193 18.8% 19,231 26.7% 70,333 20 Yr Avg 1989-2008 32,998 26.2% 25,420 17.4% 1,413 0.6% 59,832 44.2% 2,277 2.0% 6,887 6.0% 18,427 22.8% 27,591 30.8% 87,423
26
a Numbers of fish harvested are based on reports from State TIX and Zephyr programs. b Estimated harvest is the number of fish sold in the round, plus the estimated number of females to produce roe sold. c Preliminary data.

Table 7.–Commercial harvest of coho salmon by district, Yukon River, 1961–2009.
Lower Yukon Upper Yukon Lower Upper District 1 District 2 District 3 Yukon Subtotal District 4 District 5 District 6 Yukon Subtotal Alaska
Year a Harvest Harvest
(%) Harvest Harvest
(%) HarvestHarvest
(%) HarvestHarvest
(%) Harvest bHarvest
(%) Harvest bHarvest
(%) Harvest bHarvest
(%) Harvest bHarvest
(%) Total
Harvest1961 2,855 100.0% 0 0.0% 0 0.0% 2,855 100.0% - 0.0% - 0.0% - 0.0% - 0.0% 2,8551962 22,926 100.0% 0 0.0% 0 0.0% 22,926 100.0% - 0.0% - 0.0% - 0.0% - 0.0% 22,9261963 5,572 100.0% 0 0.0% 0 0.0% 5,572 100.0% - 0.0% - 0.0% - 0.0% - 0.0% 5,5721964 2,446 100.0% 0 0.0% 0 0.0% 2,446 100.0% - 0.0% - 0.0% - 0.0% - 0.0% 2,4461965 350 100.0% 0 0.0% 0 0.0% 350 100.0% - 0.0% - 0.0% - 0.0% - 0.0% 3501966 19,254 100.0% 0 0.0% 0 0.0% 19,254 100.0% - 0.0% - 0.0% - 0.0% - 0.0% 19,2541967 9,925 89.8% 0 0.0% 1,122 10.2% 11,047 100.0% - 0.0% - 0.0% - 0.0% - 0.0% 11,0471968 13,153 98.9% 0 0.0% 150 1.1% 13,303 100.0% - 0.0% - 0.0% - 0.0% - 0.0% 13,3031969 13,989 92.7% 0 0.0% 1,009 6.7% 14,998 99.4% 95 0.6% - 0.0% - 0.0% 95 0.6% 15,0931970 12,632 95.8% 0 0.0% 0 0.0% 12,632 95.8% 556 4.2% - 0.0% - 0.0% 556 4.2% 13,1881971 12,165 99.7% 0 0.0% 0 0.0% 12,165 99.7% 38 0.3% - 0.0% - 0.0% 38 0.3% 12,2031972 21,705 97.6% 506 2.3% 0 0.0% 22,211 99.9% 22 0.1% - 0.0% - 0.0% 22 0.1% 22,2331973 34,860 95.1% 1,781 4.9% 0 0.0% 36,641 100.0% 0 0.0% - 0.0% - 0.0% - 0.0% 36,6411974 13,713 81.7% 176 1.0% 0 0.0% 13,889 82.8% 0 0.0% 1,409 8.4% 1,479 8.8% 2,888 17.2% 16,7771975 2,288 89.9% 200 7.9% 0 0.0% 2,488 97.7% 0 0.0% 5 0.2% 53 2.1% 58 2.3% 2,5461976 4,064 78.4% 17 0.3% 0 0.0% 4,081 78.7% 0 0.0% 0 0.0% 1,103 21.3% 1,103 21.3% 5,1841977 31,720 81.6% 5,319 13.7% 538 1.4% 37,577 96.7% 0 0.0% 2 0.0% 1,284 3.3% 1,286 3.3% 38,8631978 16,460 62.9% 5,835 22.3% 758 2.9% 23,053 88.2% 32 0.1% 1 0.0% 3,066 11.7% 3,099 11.8% 26,1521979 11,369 66.2% 2,850 16.6% 0 0.0% 14,219 82.8% 155 0.9% 0 0.0% 2,791 16.3% 2,946 17.2% 17,1651980 4,829 55.2% 2,660 30.4% 0 0.0% 7,489 85.6% 30 0.3% 0 0.0% 1,226 14.0% 1,256 14.4% 8,7451981 13,129 55.4% 7,848 33.1% 419 1.8% 21,396 90.4% 0 0.0% 0 0.0% 2,284 9.6% 2,284 9.6% 23,6801982 15,115 40.7% 14,179 38.1% 87 0.2% 29,381 79.0% 15 0.0% 0 0.0% 7,780 20.9% 7,795 21.0% 37,1761983 4,595 34.5% 2,557 19.2% 0 0.0% 7,152 53.7% 0 0.0% 0 0.0% 6,168 46.3% 6,168 46.3% 13,3201984 29,472 36.3% 43,064 53.0% 621 0.8% 73,157 90.0% 1,095 1.3% 0 0.0% 7,006 8.6% 8,101 10.0% 81,2581985 27,676 48.0% 17,125 29.7% 171 0.3% 44,972 78.0% 938 1.6% 0 0.0% 11,760 20.4% 12,698 22.0% 57,6701986 24,824 52.5% 21,197 44.9% 793 1.7% 46,814 99.1% 0 0.0% 0 0.0% 441 0.9% 441 0.9% 47,255
27
-continued-

Table 7.–Page 2 of 2 Lower Yukon Upper Yukon Lower Upper District 1 District 2 District 3 Yukon Subtotal District 4 District 5 District 6 Yukon Subtotal Alaska
Year a Harvest Harvest
(%) Harvest Harvest
(%) HarvestHarvest
(%) HarvestHarvest
(%) Harvest bHarvest
(%) Harvest bHarvest
(%) Harvest bHarvest
(%) Harvest bHarvest
(%) Total
Harvest1987 0 0.0% 0 0.0% 0 0.0% 0 0.0% 0 0.0% 0 0.0% 0 0.0% 0 0.0% 01988 36,028 41.8% 34,758 40.3% 1,419 1.6% 72,205 83.8% 2 0.0% 8 0.0% 13,972 16.2% 13,982 16.2% 86,1871989 24,670 29.6% 38,397 46.1% 3,988 4.8% 67,055 80.6% 3 0.0% 84 0.1% 16,079 19.3% 16,166 19.4% 83,2211990 13,354 29.4% 16,405 36.1% 918 2.0% 30,677 67.5% 0 0.0% 0 0.0% 14,804 32.5% 14,804 32.5% 45,4811991 54,095 50.7% 40,898 38.3% 1,905 1.8% 96,898 90.8% 14 0.0% 0 0.0% 9,774 9.2% 9,788 9.2% 106,6861992 0 0.0% 0 0.0% 0 0.0% 0 0.0% 0 0.0% 0 0.0% 7,979 100.0% 7,979 100.0% 7,9791993 0 0.0% 0 0.0% 0 0.0% 0 0.0% 0 0.0% 0 0.0% 0 0.0% 0 0.0% 01994 0 0.0% 0 0.0% 0 0.0% 0 0.0% 0 0.0% 0 0.0% 4,451 100.0% 4,451 100.0% 4,4511995 21,625 46.0% 18,488 39.3% 0 0.0% 40,113 85.3% 0 0.0% 0 0.0% 6,900 14.7% 6,900 14.7% 47,0131996 27,705 49.5% 20,974 37.5% 0 0.0% 48,679 87.0% 161 0.3% 0 0.0% 7,142 12.8% 7,303 13.0% 55,9821997 21,450 60.7% 13,056 37.0% 0 0.0% 34,506 97.7% 814 2.3% 0 0.0% 0 0.0% 814 2.3% 35,3201998 0 0.0% 0 0.0% 0 0.0% 0 0.0% 0 0.0% 0 0.0% 0 0.0% 0 0.0% 01999 855 53.4% 746 46.6% 0 0.0% 1,601 100.0% 0 0.0% 0 0.0% 0 0.0% 0 0.0% 1,6012000 0 0.0% 0 0.0% 0 0.0% 0 0.0% 0 0.0% 0 0.0% 0 0.0% 0 0.0% 02001 0 0.0% 0 0.0% 0 0.0% 0 0.0% 0 0.0% 0 0.0% 0 0.0% 0 0.0% 02002 0 0.0% 0 0.0% 0 0.0% 0 0.0% 0 0.0% 0 0.0% 0 0.0% 0 0.0% 02003 9,757 38.7% 0 0.0% 0 0.0% 9,757 38.7% 367 1.5% 0 0.0% 15,119 59.9% 15,486 61.3% 25,2432004 1,583 7.8% 0 0.0% 0 0.0% 1,583 7.8% 0 0.0% 0 0.0% 18,649 92.2% 18,649 92.2% 20,2322005 36,533 62.7% 0 0.0% 0 0.0% 36,533 62.7% 0 0.0% 0 0.0% 21,778 37.3% 21,778 37.3% 58,3112006 39,323 60.6% 14,482 22.3% 0 0.0% 53,805 82.9% 0 0.0% 0 0.0% 11,137 17.1% 11,137 17.1% 64,9422007 21,720 48.7% 21,487 48.2% 0 0.0% 43,207 96.9% 0 0.0% 0 0.0% 1,368 3.1% 1,368 3.1% 44,5752008 13,946 39.1% 19,246 53.9% 0 0.0% 33,192 93.0% 0 0.0% 91 0.3% 2,408 6.7% 2,499 7.0% 35,6912009 c 5,992 74.7% 1,577 19.6% 0 0.0% 7,569 94.3% 0 0.0% 0 0.0% 457 5.7% 457 5.7% 8,026
5 Yr Avg 2004-2008 22,621 43.8% 11,043 24.9% 0 0.0% 33,664 68.7% 0 0.0% 18 0.1% 11,068 31.3% 11,086 31.3% 44,75010 Yr Avg 1999-2008 12,372 31.1% 5,596 17.1% 0 0.0% 17,968 48.2% 37 0.2% 9 0.0% 7,046 21.6% 7,092 21.8% 25,06015 Yr Avg 1994-2008 12,966 31.1% 7,232 19.0% 0 0.0% 20,198 50.1% 89 0.3% 6 0.0% 5,930 22.9% 6,026 23.2% 26,22420 Yr Avg 1989-2008 14,331 28.8% 10,209 20.3% 341 0.4% 24,880 49.5% 68 0.2% 9 0.0% 6,879 25.2% 6,956 25.5% 31,836
28
a Numbers of fish harvested are based on reports from State TIX and Zephyr programs. b Estimated harvest is the number of fish sold in the round, plus the estimated number of females to produce roe sold. c Preliminary data.

Table 8.–Coho escapement estimates for selected spawning areas, Yukon River drainage, 1972–2009. East River Delta Fork Mainstem Kantishna River Drainage Nenana River Drainage Delta Clearwater Clearwater Richardson Andreafsky Sonar Anvik Geiger Barton Lost Nenana Wood Seventeen Lignite Clearwater River Lake and Clearwater
Yeara River b Estimate c River Creek d Creek Slough Mainstem e Creek Slough Springs d River f Tributaries g Outlet River h
1972 632 417 454 i
1973 3,322 551 375
1974 1,388 27 3,954 i 560 652
1975 943 956 5,100 1,575 j 4 i
1976 467 h 25 h i 118 281 1,920 1,500 j 80 i
1977 81 h 60 524 h 310 d 1,167 4,793 730 j 327
1978 350 300 d 466 4,798 570 j
1979 227 1,987 8,970 1,015 j 372
1980 3 h i 499 h 1,603 d 592 3,946 1,545 j 611
1981 1,657 h 274 849 k l 1,005 8,563 m 459 h 550
1982 81 1,436 k l 8,365 m
1983 42 766 1,042 k 103 8,019 m 253 88
1984 20 h i 2,677 8,826 k 11,061 1,368 428
1985 42 h i 1,584 4,470 k 2,081 6,842 750
1986 5 496 794 1,664 k 218 j 10,857 1,800 146 h
1987 1,175 2,511 2,387 k 3,802 22,300 4,225 j
1988 1,913 n 1,203 159 437 348 2,046 k 21,600 825 j
1989 155 12 h 412 k 824 h 12,600 1,600 j 483
1990 211 688 1,308 15 h 8,325 2,375 j
1991 427 467 h 564 447 52 23,900 3,150 j
1992 77 55 h 372 490 3,963 229 j 500
1993 138 141 484 419 666 k o 581 10,875 3,525 j 1994 410 2,000 k p 944 1,648 1,317 k q 2,909 244 62,675 17,565 3,425 j 5,800 1995 10,901 101,806 142 192 k r 4,169 2,218 500 k 2,972 j 20,100 6,283 3,625 j 1996 8,037 233 0 k 2,040 2,171 201 i s 3,668 m 282 14,075 3,300 1,125 h 1997 9,472 104,343 274 1,524 t 1,446 i s 1,996 50 n aa 11,525 2,375 2,775 j 1998 7,193 136,906 157 1,360 i 2,771 i 370 v w 1,413 z 175 n 11,100 2,775 2,775 j 1999 2,963 62,521 29 1,002 i 745 i w 662 k 10,975 2,805 2000 8,451 175,421 142 55 h i 66 h i w 879 j k 95 9,225 2,358 1,025 j 2,175
29
-continued-

Table 8.–Page 2 of 3. East River Delta Fork Mainstem Kantishna River Drainage Nenana River Drainage Delta Clearwater Clearwater Richardson Andreafsky Sonar Anvik Geiger Barton Lost Nenana Wood Seventeen Lignite Clearwater River Lake and Clearwater
Yeara River b Estimate c River Creek d Creek Slough Mainstem e Creek Slough Springs d River f Tributaries g Outlet River h
2001 15,896 137,769 262 h 578 242 855 699 3,741 135 46,875 11,982 4,425 j 1,531 2002 3,577 122,566 744 0 328 935 1,910 130 38,625 9,873 5,900 j 874 2003 8,231 269,081 973 85 658 3,055 4,535 67 105,850 27,057 8,800 6,232 2004 11,146 188,350 583 220 450 840 3,370 91 37,950 9,701 2,925 8,626 2005 5,303 184,281 625 430 325 i 1,030 3,890 378 34,293 8,766 2,100 2,024 2006 131,919 194 160 i 634 1,916 168 16,748 4,281 4,375 271 2007 173,289 63 520 605 1,733 334 14,650 3,961 2,075 553 2008 135,570 183 1,342 1,539 578 1,652 343 7,500 1,917 1,275 265 2009 x 206,621 137 410 470 680 113 16,850 4,307 5,450 155
All Years Average 7,288 152,175 503 270 422 859 1,004 1,433 1,593 143 17,203 7,457 2,253 1,343 Five Year Average 2004-2008 8,225 162,682 - 464 - 450 599 737 2,512 263 22,228 5,725 2,550 2,348 Interim Escapement Objective 5,200 to 17,000 y
30
a Only peak counts presented. Survey rating is fair to good, unless otherwise noted. b Weir count, unless otherwise indicated. c Passage estimates for coho salmon are incomplete. The sonar project is terminated prior to the end of the coho salmon run. d Foot survey, unless otherwise indicated. e Mainstem Nenana River between confluence's of Lost Slough and Teklanika River. f Boat survey counts in the lower 17.5 river miles, unless otherwise indicated. g Helicopter surveys counted tributaries of Delta Clearwater River, outside of the normal mainstem index area, from 1994 to 1999 after which an expansion factor was used to estimate
escapement to areas. h Aerial survey, fixed winged or helicopter. i Poor survey. j Boat survey. k Weir count. l Coho weir was operated at the mouth of Clear Creek (Shores Landing). m Expanded estimate based on partial survey counts and historic distribution of spawners from 1977 to 1980. n West Fork Andreafsky was also surveyed and 830 chum salmon were observed.
-continued-

Table 8.–Page 3 of 3. o Weir project terminated on October 4, 1993. Weir normally operated until mid to late October. p A total of 298 coho salmon were passed between September 11 and October 4, 1994. However, it was estimated that 1,500 to 2,000 coho salmon passed the weir site within a 24-hour
period beginning at approximately noon on October 4. Weir operated from August 18 through morning of October 5, 1994. q Weir project terminated September 27, 1994. Weir normally operated until mid-October. r An additional 1,000 coho salmon were estimated pooled downstream of weir on October 2, 1995, just prior to weir removal. s Beginning at confluence of Clear Creek, the survey includes counts of both Glacier and Wood Creeks to their headwaters. t Survey of western floodplain only. u Estimated count by Perry Corsetti, Healy school teacher, operating a school project weir, after coho salmon were illegally (shot) taken from spawning grounds prior to October 9, 1997. v Combination foot and boat survey. w No survey of Wood Creek due to obstructions in creek. x Preliminary. y Interim escapement objective established March, 1993, based on boat survey counts of coho salmon in the lower 17.5 river miles during the period October 21 through 27. SEG
established in 2004.
31

Table 9.–Value of commercial fall fishery to Yukon Area fishermen, 1977–2009.
Fall Chum Coho Lower Yukon Upper Yukon Lower Yukon Upper Yukon Value by Species Value by Area Year $/lb Value $/lb $/lb Roe Value $/lb $/lb Roe Value $/lb $/lb Roe Value Fall Chum Coho Lower Upper Total 1977 0.45 718,571 0.22 102,170 0.50 140,914 0.27 2,251 820,741 143,165 859,485 104,421 963,9061978 0.47 691,854 0.25 103,091 0.60 96,823 0.24 6,105 794,945 102,928 788,677 109,196 897,8731979 0.68 1,158,485 0.29 347,814 0.80 83,466 0.25 6,599 1,506,299 90,065 1,241,951 354,413 1,596,3641980 0.28 394,162 0.27 198,088 0.36 17,374 0.29 2,374 592,250 19,748 411,536 200,462 611,9981981 0.55 1,503,744 0.35 356,805 0.60 87,385 0.35 4,568 1,860,549 91,953 1,591,129 361,373 1,952,5021982 0.55 846,492 0.28 53,258 0.69 135,828 0.37 18,786 899,750 154,614 982,320 72,044 1,054,3641983 0.34 591,011 0.19 128,950 0.35 17,497 0.31 11,472 719,961 28,969 608,508 140,422 748,9301984 0.32 374,359 0.26 103,417 0.50 256,050 0.24 12,823 477,776 268,873 630,409 116,240 746,6491985 0.47 634,616 0.25 178,125 0.53 176,254 0.33 26,797 812,741 203,051 810,870 204,922 1,015,7921986 0.49 399,321 0.14 30,309 0.71 211,942 0.21 556 429,630 212,498 611,263 30,865 642,1281987 - 0 - 0 - 0 - 0 0 0 0 0 0 1988 1.01 638,700 0.32 151,300 1.38 734,400 0.37 34,116 790,000 768,516 1,373,100 185,416 1,558,5161989 0.50 713,400 0.28 223,996 0.66 323,300 0.35 33,959 937,396 357,259 1,036,700 257,955 1,294,6551990 0.45 238,165 0.29 174,965 0.66 137,302 0.34 37,026 413,130 174,328 375,467 211,991 587,4581991 0.34 438,310 0.23 3.56 157,831 0.44 300,182 0.30 2.50 21,556 596,141 321,738 738,492 179,387 917,8791992 - 0 0.39 4.50 54,161 - 0 0.39 2.18 19,529 54,161 19,529 0 73,690 73,6901993 - 0 - 0 - 0 - 0 0 0 0 0 0 1994 - 0 0.16 1.50 8,517 - 0 0.48 1.50 8,739 8,517 8,739 0 17,256 17,2561995 0.15 185,036 0.13 2.96 167,571 0.29 80,019 0.14 2.51 11,292 352,607 91,311 265,055 178,863 443,9181996 0.10 48,579 0.13 1.71 45,438 0.26 2.96 96,795 0.09 2.16 13,020 94,017 109,815 145,374 58,458 203,8321997 0.22 86,526 0.17 1.75 7,252 0.32 79,973 0.20 1,062 93,778 81,035 166,499 8,314 174,8131998 - 0 - 0 - 0 - 0 0 0 0 0 0 1999 0.25 35,639 0.20 876 0.35 3,620 - 0 36,515 3,620 39,259 876 40,1352000 - 0 - 0 - 0 - 0 0 0 0 0 0 2001 - 0 - 0 - 0 - 0 0 0 0 0 0 2002 - 0 - 0 - 0 - 0 0 0 0 0 0
32
-continued-

Table 9.–Page 2 of 2.
Fall Chum Coho Lower Yukon Upper Yukon Lower Yukon Upper Yukon Value by Species Value by Area
Year $/lb Value $/lb $/lb Roe Value $/lb $/lb Roe Value $/lb $/lb Roe Value Fall Chum Coho Lower Upper Total 2003 0.15 5,993 0.10 3,398 0.25 18,168 0.05 5,095 9,391 23,263 24,161 8,493 32,6542004 0.25 1,126 0.05 848 0.25 2,774 0.06 6,372 1,974 9,146 3,900 7,220 11,1202005 0.32 316,698 0.14 48,159 0.32 83,793 0.12 19,182 364,857 102,975 400,491 67,341 467,8322006 0.20 202,637 0.14 33,806 0.20 50,299 0.19 11,137 236,443 61,436 252,936 44,943 297,8792007 0.27 144,256 0.20 16,907 0.39 127,869 0.20 1,368 161,163 129,237 272,125 18,275 290,4002008 0.55 428,969 0.27 22,089 0.97 216,777 0.20 3,717 451,058 220,494 645,746 25,806 671,5522009 0.70 110,408 0.19 1,262 1.00 52,303 0.15 467 111,670 52,770 162,711 1,729 164,440
10 Year Average 0.28 113,532 0.16 12,608 0.39 50,330 0.12 4,687 126,140 55,017 163,862 17,295 181,157
(1999-2008) 2009 vs.
10 Year Avg 146.2% -2.8% 20.9% -90.0% 156.4% 3.9% # 28.0% -90.0% -11.5% -4.1% -0.7% -90.0% -9.2%33

34
Table 10.–Number of commercial permit holders by district participating in the fall season salmon fishery, Yukon Area, 1971–2009.
Fall Chum and Coho Salmon Season a Yukon Lower Yukon Area Upper Yukon Area Area
Year District 1 District 2 District 3 Subtotal b District 4 District 5 District 6 Subtotal Total1971 352 - - 352 - - - - 3521972 353 75 3 431 - - - - 4311973 445 183 0 628 - - - - 6281974 322 121 6 449 17 23 22 62 5111975 428 185 12 625 44 33 33 110 7351976 422 194 28 644 18 36 44 98 7421977 337 172 37 546 28 34 32 94 6401978 429 204 28 661 24 43 30 97 7581979 458 220 32 710 31 44 37 112 8221980 395 232 23 650 33 43 26 102 7521981 462 240 21 723 30 50 30 110 8331982 445 218 15 678 15 24 25 64 7421983 312 224 18 554 13 29 23 65 6191984 327 216 12 536 18 39 26 83 6191985 345 222 13 559 22 39 25 86 6451986 282 231 14 510 1 21 16 38 5481987 0 0 0 0 0 0 0 0 01988 328 233 13 563 20 20 32 72 6351989 332 229 22 550 20 24 28 72 6221990 301 227 19 529 11 11 27 49 5781991 319 238 19 540 8 21 25 54 5941992 0 0 0 0 0 0 22 22 221993 0 0 0 0 0 0 0 0 01994 0 0 0 0 0 1 11 12 121995 189 172 0 357 4 12 20 36 3931996 158 109 0 263 1 17 17 35 2981997 176 130 0 304 3 8 0 11 3151998 0 0 0 0 0 0 0 0 01999 146 110 0 254 4 0 0 4 2582000 0 0 0 0 0 0 0 0 02001 0 0 0 0 0 0 0 0 02002 0 0 0 0 0 0 0 0 02003 75 0 0 75 2 0 5 7 822004 26 0 0 26 0 0 6 6 322005 177 0 0 177 0 0 7 7 1842006 218 71 0 289 0 4 11 15 3042007 181 122 0 303 0 2 8 10 3132008 251 180 0 431 0 3 10 13 4442009 165 130 0 292 0 0 2 2 294
Average 1971-2008 235 129 9 366 10 17 17 44 4071999-2008 107 48 0 156 1 1 5 6 1622004-2008 171 75 0 245 0 2 8 10 255
a Number of permit holders which made at least one delivery. b Since 1984, the subtotal for Lower Yukon Area was the unique number of permits fished. Before 1984, the
subtotals are additive for Districts 1, 2, and 3. Some individual fishermen in the Lower Yukon Area may have operated in more than one district during the year.

35
Figure 1.–Alaskan portion of the Yukon River drainage showing communities and fishing districts.

500
1,000
1,500
2,000
2,500
1974
1976
1978
1980
1982
1984
1986
1988
1990
1992
1994
1996
1998
2000
2002
2004
2006
2008
Fall
Chu
m S
alm
on (T
hous
ands
)
Escapement Alaska HarvestCanadian Harvest Escapement Objective (400,000)Optimal Escapement Goal 350,000 BEG Range 300,000-600,000
1974 to 2008 Average Reconstructed Run Size: 875,000 Fall Chum Salmon
2004 and 2005 Parent Year Escapementsfor 2009 Return in white
2009 Preliminary Run Size Estimate between 450,000 and 560,000
Note: The drainagewide escapement goal of 400,000 fall chum salmon was established in 1993. In 1996, an optimal
escapement goal of 350,000 fall chum salmon was established in the Yukon River Fall Chum Salmon Management Plan and was utilized in 1998, 2000, and 2001. In 2004, a drainagewide escapement goal range of 300,000 to 600,000 fall chum salmon was established.
Figure 2.–Total run reconstruction based on estimated harvest and escapement of fall chum salmon, Yukon River drainage, 1974–2008 with the 2009 run size estimate.
36

0
500
1,000
1,500
2,000
2,500
1974 1977 1980 1983 1986 1989 1992 1995 1998 2001 2004 2007
Year
Num
ber o
f Sal
mon
(tho
usan
ds)
0.00
0.10
0.20
0.30
0.40
0.50
0.60
0.70
0.80
0.90
1.00
Expl
oita
tion
Rat
e (P
erce
nt)
EscapementCommercial HarvestSubsistence HarvestExploitation Rate
2009 data is preliminary
Note: 2009 data is preliminary.
Figure 3.–Estimated fall chum salmon harvest and escapement with exploitation rate, Yukon Area, 1974–2009.
37

Figure 4.–Subsistence (top) and commercial (bottom) harvest of coho salmon, Yukon River
drainage, Alaska, 1961–2009.
10
20
30
40
50
60
70
80
1961 1963196519671969197119731975
5 Year Averages 2009 Subsistence Harvest is Preliminary.(2004-2008 Average = 21,000)
Coh
o Sa
lmon
(Tho
usan
ds)
Estimates prior to 1979are considered minimums.
19771979198119831985198719891991199319951997199920012003200520072009
120 5 Year Averages
100 2009 Commercial Harvest (8,369)
80
Coh
o Sa
lmon
(Tho
usan
ds)
60
40
20
19611963 196519671969197119731975197719791981198319851987198919911993199519971999200120032005 20072009
Females to Produce Roe SoldFish Sold in the Round. (Does not include ADF&G test fish sales.)Estimated Females to Produce Illegal Roe Sales
38

100
200
300
400
500
600
1961 1965 1969 1973 1977 1981 1985 1989 1993 1997 2001 2005 2009
Num
ber
of S
alm
on(T
hous
ands
)
Fall Chum Salmon Coho Salmon
Average1961-2009
0%
20%
40%
60%
80%
100%
1961 1965 1969 1973 1977 1981 1985 1989 1993 1997 2001 2005 2009
Perc
ent o
f Har
vest
Fall Chum Salmon Coho Salmon
Average1961-2009
22%
78%
Figure 5.–Total commercial harvest of fall chum and coho salmon combined (top) and percent (bottom) of harvest by species in the Yukon River drainage, Alaska, 1961–2009.
39

50
100
150
200
250
300
1961 1965 1969 1973 1977 1981 1985 1989 1993 1997 2001 2005 2009
Num
ber
of S
alm
on b
y S
peci
es(T
hous
ands
)
Fall Chum Salmon Coho Salmon
Average1961-2008
0%
20%
40%
60%
80%
100%
1961 1965 1969 1973 1977 1981 1985 1989 1993 1997 2001 2005 2009
Perc
net o
f Har
vest
by
Spec
ies
Fall Chum Salmon Coho Salmon
Average1961-2008
19%
81%
Figure 6.–Total subsistence and personal use harvest of fall chum and coho salmon combined (top)
and percent (bottom) of harvest by species in the Yukon River drainage, Alaska, 1961–2008.
40
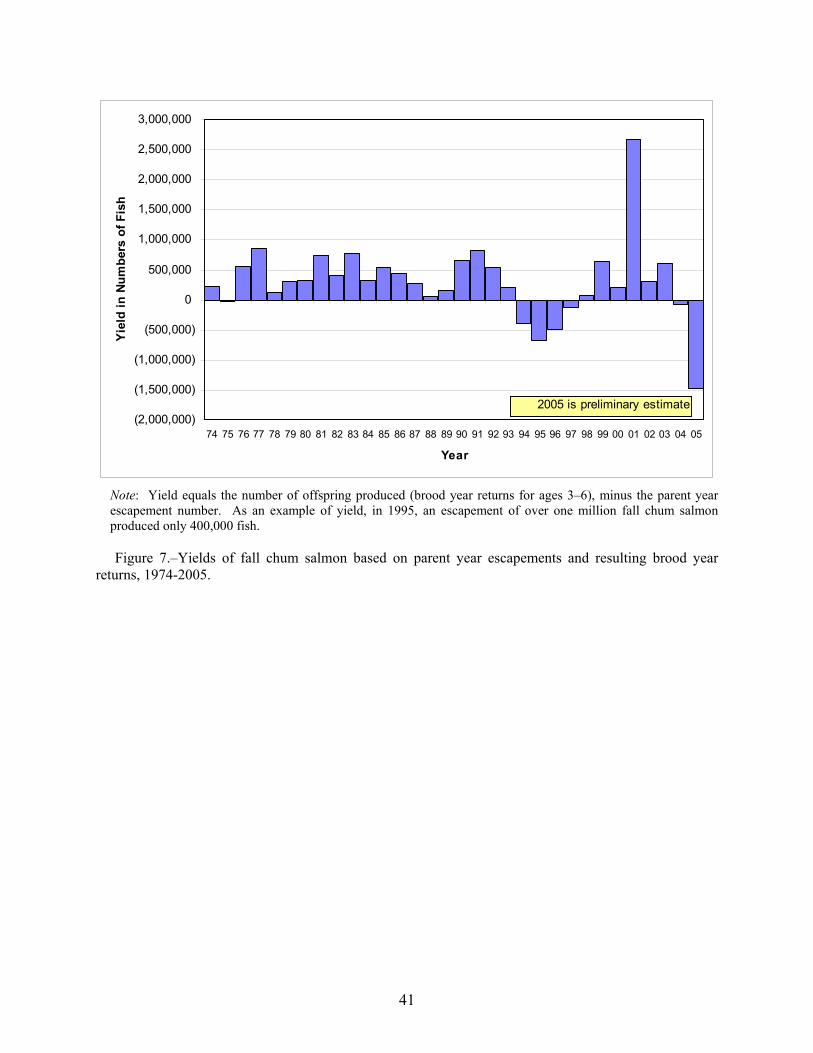
41
(2,000,000)
(1,500,000)
(1,000,000)
(500,000)
0
500,000
1,000,000
1,500,000
2,000,000
2,500,000
3,000,000
74 75 76 77 78 79 80 81 82 83 84 85 86 87 88 89 90 91 92 93 94 95 96 97 98 99 00 01 02 03 04 05
Year
Yie
ld in
Num
bers
of F
ish
2005 is preliminary estimate
Note: Yield equals the number of offspring produced (brood year returns for ages 3–6), minus the parent year
escapement number. As an example of yield, in 1995, an escapement of over one million fall chum salmon produced only 400,000 fish.
Figure 7.–Yields of fall chum salmon based on parent year escapements and resulting brood year returns, 1974-2005.

50
100
150
200
250
300
1961
1963
1965
1967
1969
1971
1973
1975
1977
1979
1981
1983
1985
1987
1989
1991
1993
1995
1997
1999
2001
2003
2005
2007
2009
Fall
Chu
m S
alm
on( T
hous
ands
)
Estimates prior to 1979 are considered minimums.
Five Year Averages2009 Subsistence Harvest is Preliminary.(2004-2008 Average = 85,000)
50
100 150 200 250 300 350 400 450 500
1961 1963 1965 1967 1969 1971 1973 1975197719791981198319851987198919911993199519971999 2001 2003 2005 20072009
Fall
Chu
m S
alm
on( T
hous
ands
)
Females to Produce Roe SoldFish Sold in the Round. (Does not include ADF&G test fish sales.) Estimated Females to Produce Illegal Roe Sales, 1987
Five Year Averages
2009 Preliminary Commercial Harvest
(26,000)
Figure 8.–Subsistence (top) and commercial (bottom) harvest of fall chum salmon, Yukon River
drainage, Alaska, 1961–2009.
42

120 Number of Salmon (thousands)
Delta Clearwater River100
SEG Range: 5,200 to 17,000 established 200480 Prior goal >9,000
60 40 20
1972 1974 1976 1978 1980 1982 2002 2004 2006 1984 1986 1988 1990 1992 1994 1996 1998 2000 2008
14
Figure 9.–Coho salmon escapement estimates for Delta Clearwater River, Nenana River Index Areas, Clearwater Lake and Outlet, and Richardson Clearwater River, 1972–2009.
2 4 6 8
10 12 Number of Salmon (thousands)
Nenana River Index Areas Complete Index of 4 SystemsIncomplete Indexes
1972 1974 1976 1978 1980 1982 2002 2004 2006 1984 1986 1988 1990 1992 1994 1996 1998 2000 2008
1 2 3 4 5 6 7 8 9
10 Number of Salmon (thousands)
Clearwater Lake and Outlet
1972 1974 1976 1978 1980 1982 2002 2004 2006 1984 1986 1988 1990 1992 1994 1996 1998 2000 2008
1 2 3 4 5 6 7 8 9
10 Number of Salmon (thousands)
Richardson Clearwater River
1972 1974 1976 1978 1980 1982 2002 2004 2006 1984 1986 1988 1990 1992 1994 1996 1998 2000 2008
43

0
50
100
150
200
250
300
1995 1996 1997 1998 1999 2000 2001 2002 2003 2004 2005 2006 2007 2008 2009
(Tho
usan
ds)
Year
Num
ber o
f Coh
o Sa
lmon
Annual Passage
Average Passage
?
Figure 10.–Historical coho salmon assessment based on passage at Pilot Station sonar, Yukon Area,
1995–2008 and preliminary 2009.
44

50100150200250300350400450500
1961 1965 1969 1973 1977 1981 1985 1989 1993 1997 2001 2005 2009
Num
ber o
f Sal
mon
(Tho
usan
ds)
Dist. 1 Dist. 2 Dist. 3 Dist. 4 Dist. 5 Dist. 6
Five Year Average
0%
20%
40%
60%
80%
100%
1961 1965 1969 1973 1977 1981 1985 1989 1993 1997 2001 2005 2009
Perc
ent o
f Har
vest
Dist. 1 Dist. 2 Dist. 3 Dist. 4 Dist. 5 Dist. 6
49%
19%
2%
29%
Five Year Average
Figure 11.–Total commercial harvest of fall chum salmon (top) and percent (bottom) of
harvest by district, Yukon River drainage, 1961–2009.
45

46
20
40
60
80
100
120
1961 1965 1969 1973 1977 1981 1985 1989 1993 1997 2001 2005 2009
Num
ber o
f Sal
mon
(Tho
usan
ds)
Dist. 1 Dist. 2 Dist. 3 Dist. 4 Dist. 5 Dist. 6
Five-Year Average
0%
20%
40%
60%
80%
100%
1961 1965 1969 1973 1977 1981 1985 1989 1993 1997 2001 2005 2009
Perc
ent o
f Har
vest
Dist. 1 Dist. 2 Dist. 3 Dist. 4 Dist. 5 Dist. 6
Five-Year Average
44%
25%
31%
Figure 12.–Total commercial harvest of coho salmon (top) and percent (bottom) of harvest in
the Yukon River drainage, 1961–2009.