zale corporation 2011 annual report board...
TRANSCRIPT

2011 ANNUAL REPORT
35512 Merrill.indd 2 10/11/11 1:45 PM
ZALE CORPORATION 2011 ANNUAL REPORT
35512 Merrill.indd 1 10/7/11 9:00 PM
2011 ANNUAL REPORT
35512 Merrill.indd 2 10/11/11 1:45 PM
ZALE CORPORATION 2011 ANNUAL REPORT
35512 Merrill.indd 1 10/7/11 9:00 PM
Corporate Information
Board of Directors
John B. Lowe, Jr. Yuval Braverman David F. Dyer Kenneth B. GilmanChairman of the Board Director Director DirectorAudit Committee Member Compensation Committee Member Audit Committee Member Audit Committee ChairmanNominating and Corporate Nominating and Corporate Compensation Committee Chairman Compensation Committee MemberGovernance Committee Member Governance Committee Chairman President and Chief Executive Retired Chief Executive Officer—Chairman—TDIndustries, Inc. President—J & J Zaidman, Inc. Officer—Chico’s FAS, Inc. Asbury Automotive Group, Inc.
Theo Killion Stefan L. Kaluzny Peter MorrowDirector Director DirectorChief Executive Officer Managing Director— Managing Director—
Sycamore Partners Sycamore Partners
Officers of the Company
Theo Killion Matthew W. Appel Gilbert P. Hollander Richard A. LennoxChief Executive Officer Chief Administrative Officer and Executive Vice President, Executive Vice President,
Chief Financial Officer Chief Merchant and Sourcing Officer Chief Marketing Officer
Jeannie Barsam Brad Furry John A. Legg Becky MickSenior Vice President, Senior Vice President, Senior Vice President, Senior Vice President,Merchandise Planning and Chief Information Officer Supply Chain Chief Stores OfficerAllocation
Toyin OgunSenior Vice President,Human Resources andCustomer Service
Shareholder Information
Executive Offices Independent Public Notice of Annual Meeting901 West Walnut Hill Lane Accountants Zale Corporation’s Annual Meeting of Shareholders will be held at 10 a.m.Irving, Texas 75038-1003 Ernst & Young LLP Friday, December 2, 2011 at the Company’s principal executive office at972-580-4000 901 West Walnut Hill Lane, Irving, Texas 75038.
Stock ListingTransfer Agent & Registrar New York Stock Exchange Common Stock InformationWells Fargo Bank, NA Common Stock—Symbol: ZLC The Common Stock is listed on the NYSE under the symbol ZLC. TheShareowner Services following table sets forth the high and low sale prices for the Common Stock161 North Concord Exchange Form 10-K Requests for each fiscal quarter during the two most recent fiscal years.South Saint Paul, MN 55075 Investors may obtain, without800-468-9716 charge, a copy of the Company’s 2011 2010http://www.wellsfargo.com/ Form 10-K and Annual Report as Quarter High Low High Lowshareownerservices filed with the Securities and
First $2.70 $1.53 $8.20 $4.73Exchange Commission for the yearInvestor Information/ ended July 31, 2011. The Company’s Second $5.76 $2.72 $5.51 $2.08Investor Relations Form 10-K and Annual Report are Third $4.92 $3.40 $3.80 $1.83901 West Walnut Hill Lane available online at www.zalecorp.com.
Fourth $6.81 $3.25 $3.27 $1.39Mail Station 7A-5Irving, Texas 75038-1003 Internet Access
As of October 10, 2011, the outstanding shares of Common Stock [email protected] www.zalecorp.comheld by approximately 550 holders of record.
CertificationsZale Corporation has filed the required certifications of its Chief Executive Officer and Chief Financial Officer under Section 302 of the Sarbanes-Oxley Act of 2002 asExhibits 31.1 and 31.2 to the Company’s Annual Report on Form 10-K for the year ended July 31, 2011. The certification of the Company’s Chief Executive Officerregarding compliance with the New York Stock Exchange corporate governance listing standards required by NYSE Rule 303A.12 will be filed with the NYSE followingthe 2011 Annual Meeting of Stockholders. Last year, the Company filed this certification with the NYSE in December 2010 following the 2010 Annual Meeting ofStockholders.
Cautionary Notice Regarding Forward-Looking StatementsThis annual report contains certain forward-looking statements, including statements regarding the Company’s objectives and expectations with respect to its financialplan, sales and earnings, merchandising and marketing strategies, acquisitions and dispositions, share repurchases, store openings, renovations, remodeling andexpansion, inventory management and performance, liquidity and cash flows, capital structure, capital expenditures, development of its information technology andtelecommunications plans and related management information systems, e-commerce initiatives, human resources initiatives, and other statements regarding theCompany’s plans and objectives. Forward-looking statements are not guarantees of future performance and a variety of factors could cause the Company’s actual resultsto differ materially from the results expressed in the forward-looking statements. For a discussion of these factors, see Item 1A of the Form 10-K of the Company for thefiscal year ended July 31, 2011 which is part of this Annual Report. The Company disclaims any obligation to update or revise publicly or otherwise any forward-lookingstatements to reflect subsequent events, new information or future circumstances.
30OCT200914471655
Letter to our shareholdersDear Shareholders, wedding businesses. During fiscal 2011, bridal, anni-
versary bands, diamond earrings and pendants hadIn fiscal 2011, our team was focused on executing the positive comp performance all 12 months, and soli-first year of our multi-year turnaround plan designed taires had 10 months of positive comp results. Weto return the Company to profitability. Our financial introduced two successful bridal events during theperformance exemplifies the consistent progress we year that were supported by catalogs, in-storehave made in stabilizing the business. In fiscal 2011, we: marketing and strong online campaigns. During
Holiday, our television and online marketing were• Achieved growth in comparable store sales of 8.1% anchored by messaging that proclaimed Zales and
and revenue growth of 7.8% to $1.74 billion; Peoples as The Diamond Store. Finally, we made a signif-icant investment in training our Store teams in the
• Posted ten consecutive months (October 2010 highly technical skills needed to sell diamonds. Wethrough July 2011) of positive comparable store partnered with the Diamond Council of America tosales and three consecutive quarters of positive provide 45 hours of training to our jewelry consul-comparable store sales for all brands; tants in order to have them DCA certified as
authorities on diamonds. We began fiscal 2011 with• Achieved gross margin on sales of 50.5% after 15% of our full-time consultants certified and ended
absorbing last-in, first-out (LIFO) inventory the year with approximately 50% certified. Returningcharges, related to significant increases in to The Diamond Store and all that the claim implies willcommodity costs, of $17 million; and take time, but the financial results we have seen in the
wedding categories and the positive responses that we• Improved Operating Margin by $87 million over have received in focus groups and surveys indicate that
fiscal 2010. we are making significant progress.
The improvements in our business were the result of As we worked to achieve our objective of 80% Core,successfully executing the initiatives in our multi-year Gil Hollander, our Chief Merchant and Sourcingturnaround plan, including: Officer, and his team were working to develop propri-
etary brands that would help elevate the emotionalRebuilding the Core merchandise assortment. connection our guests have with the Zale family ofIn fiscal 2011, we made significant progress in brands. Our three branded merchandise introduc-rebuilding our Core merchandise assortment, which tions this fall, Vera Wang LOVE, Jessica Simpson’shad declined to 60% of our total inventory in Diamonds are a Girl’s Best Friend and the expansion ofJanuary 2010. Core merchandise is product that has our Persona bead collection in the United States, domore predictable margin and turn characteristics in just that.line with, or above, category averages. By the end offiscal 2011, we accomplished our goal of returning our Vera Wang is an instantly recognizable, world-classCore assortment to 80%, while maintaining merchan- brand that is synonymous with bridal. She used herdise margin performance. The changes made in our highly developed design aesthetic to create a line ofCore assortment have been fundamental to our engagement rings, wedding bands and solitaire bridalimproved business performance in fiscal 2011. jewelry exclusively for Zale. The Vera Wang LOVE
collection is beautiful jewelry that will add anReturning to The Diamond Store. During the emotional halo to our wedding business.year, we reintroduced Zales and Peoples as TheDiamond Store. The re-establishment of our diamond Jessica Simpson has worked with our team to createauthority is vital, as product categories that contain the Diamonds are a Girl’s Best Friend collection. Jessicadiamonds represent 75% of our business. From a has successfully designed more than 22 product cate-merchandising standpoint, we focused first on the gories including handbags, sportswear and shoes. The

30OCT200914471655
collection at Zales, Zales Outlet and Peoples will Simpson collection, with price points beginning at $79,feature pendants, earrings and bracelets using and the Persona bead collection, with beads as low asbutterfly, heart and cross designs. With prices ranging $25, are just two examples of this work.from $79 to $1,099, Ms. Simpson’s collection will bethe highlight of our diamond fashion business for fiscal Making strategic investments in people to2012. enhance capabilities. We are committed to
making deliberate, thoughtful investments in people toBy having exclusive partnerships with powerful brands support and accelerate our strategy of returning tolike Vera Wang and Jessica Simpson, we will provide profitability. Investing in the Zale team included stra-our guests with beautiful merchandise created by tegic hiring in the field as well as our Store Supportrenowned designers that they can only get at Zale Center. In August 2010, John Legg joined Zale asbrands. Senior Vice President, Supply Chain. John is respon-
sible for warehousing, logistics, quality, manufacturingFinally, we have expanded our successful Persona and indirect sourcing at the Company. John’s 25 yearscollection to more than 800 Zales, Zales Outlet and of retail supply chain experience has been instru-Gordon’s stores in the United States from our initial mental in improving functions under his management.test of 200 stores. This bead collection will allow In March 2011, Jeannie Barsam, a retail leader withguests to design an affordable gift that is as individual more than 20 years of experience, joined Zale asas their feelings for their loved ones. Senior Vice President, Merchandise Planning and Allo-
cation. Since joining, Jeannie has built a team focusedOur eCommerce business, led by Richard Lennox, on driving inventory efficiency in order to improveChief Marketing Officer, continues to grow and now sales and grow profitability. Also in March 2011,includes five web stores. During the year, we effec- Toyin Ogun joined Zale as Senior Vice President,tively used the eCommerce platform to grow our Human Resources and Customer Service. Toyindiamond business through our Design Your Own ring brings more than 25 years of diverse human resourcesoption and through an expanded 365 day per year experience to his assignment and brings in-depthbridal campaign. We recently added functionality to knowledge in the areas of recruitment, performanceenhance multi-channel integration by adding a management and organizational development. Inship-to-store function and by offering in-store July 2011, Toyin became a board member of theordering in select stores. During the fiscal year, we Diamond Council of America, reinforcing ourlaunched a mobile platform allowing our customers to commitment to the education and development ofquickly and easily interact with our brands. No matter our Store teams. In September 2011, Brad Furrywhich channel our consumers choose–in store, online joined Zale as Senior Vice President, Chief Informa-or via mobile–we want to provide the best guest expe- tion Officer. Brad brings more than 28 years ofrience possible. information technology and applications development
experience to Zale. These appointments exemplifyRe-establish the price/value proposition. In the strategic investments we have made in organiza-fiscal 2011, we experienced significant cost increases tional capability to drive our turnaround initiatives.in our key commodities of gold, silver and diamonds.While we implemented price increases at several In the Stores area, we completed a rigorous talentpoints during our spring season, the most significant review of our leadership team at the District Managerincreases took place in early July. The volatility in these level before the last Holiday season. This year, wecommodity markets is an issue we will closely monitor completed a similar review of talent at the Storeduring 2012. In recognition of the economic pressures Manager level. Delivering a great guest experiencemany of our guests are facing, we have been careful to begins with strong leadership. Becky Mick, our Chiefoffer opening price points in every merchandise cate- Stores Officer, has successfully raised the bar ongory to keep our brands accessible. The Jessica talent, financial accountability and driving results.

21JUN201014185307
30OCT200914471655
Improving our financial foundation. Having Finally, in May 2011 Matt Appel assumed the additionalsecured the liquidity necessary to execute our turn- role of Chief Administrative Officer. In this role, Mattaround program in fiscal 2010, our focus in 2011 was is responsible for real estate, merchandise planningon improving this foundation. In April, we extended and allocation, information technology, financial prod-the maturity of $120 million of our asset-backed ucts, supply chain and logistics, as well as ongoingcredit facility, which was scheduled to mature in management of the Company’s finance and controlAugust 2011. With this extension, all commitments functions. Matt’s leadership over the past two yearsunder our credit facility now mature on April 30, has been instrumental in creating the financial founda-2014, under the same terms. tion to execute the business turnaround. We look
forward to his continued contributions in his newIn September 2010, the Company entered into an role.agreement with Citibank to provide the private labelcredit card program for the Zales, Zales Outlet and In summary, we have made significant progress acrossGordon’s brands in the United States. In August 2011, the Company that positions us for improved perform-we announced the launch of a new credit program that ance. As we move forward, we will continue to beprovides our customers with financing options that methodical and deliberate in the execution of ourare additive to our current credit program. Select plans. We intend to strike the appropriate balancecustomers, whose credit applications have been between sales and margin to allow us to continue todeclined by Citibank, will be offered credit under this deliver gross margins above 50% to fuel the recoveryprogram providing them with an affordable option to of the business.finance merchandise. Monterey Financial Services, anationally recognized consumer finance company On behalf of your Board of Directors, officers and theservicing the retail community, is our first partner. more than 12,600 employees at Zale Corporation, weThis new offering is available in Zales, Zales Outlet and are grateful for your continuing support of our effortsGordon’s stores in the United States. to grow our business and increase profitability.
Strengthening retail expertise on our Board of Sincerely,Directors. During 2011, we added considerableretail breadth and experience to our Board of Direc-tors. In September 2010, Ken Gilman joined ourBoard. Mr. Gilman brings deep retail experience with25 years at Limited Brands, serving in numerouscapacities including Chief Financial Officer and ChiefAdministrative Officer. In February 2011, David Dyer Theo Killionjoined our Board. Mr. Dyer is President and Chief Chief Executive OfficerExecutive Officer of Chico’s. He has 37 years of expe-rience and visionary leadership in retail, includingTommy Hilfiger, Lands’ End, Home Shopping Networkand J. Crew Catalog. These new Board members havealready added significant value to our Company.

(This page has been left blank intentionally.)

UNITED STATESSECURITIES AND EXCHANGE COMMISSION
Washington, D.C. 20549
Form 10-K
For the fiscal year ended July 31, 2011
Zale Corporation
A Delaware CorporationIRS Employer Identification No. 75-0675400
SEC File Number 1-04129
901 W. Walnut Hill LaneIrving, Texas 75038-1003
(972) 580-4000
Zale Corporation’s common stock, par value $0.01 per share, is registered pursuant to Section 12 (b) of theSecurities Exchange Act of 1934 (the ‘‘Act’’) and is listed on the New York Stock Exchange. Zale Corporation isnot a well-known seasoned issuer. Zale Corporation does not have any securities registered under Section 12(g)of the Act. Zale Corporation is required to file reports pursuant to Section 13 of the Act. Zale Corporation(1) has filed all reports required to be filed by Section 13 or 15(d) of the Act during the preceding 12 months,and (2) has been subject to such filing requirements for the past 90 days.
Zale Corporation was not required to submit electronically and post on the Company’s website InteractiveData Files required to be submitted and posted pursuant to Rule 405 of Regulation S-T during the preceding12 months due to the Rule not being applicable to the Company for the current and previous periods.
Disclosure of the delinquent filers pursuant to Item 405 of Regulation S-K will be contained in ourdefinitive Proxy Statement, portions of which are incorporated by reference in Part III of this Form 10-K.
The aggregate market value of Zale Corporation’s common stock (based upon the closing sales pricequoted on the New York Stock Exchange) held by non-affiliates as of January 31, 2011 was $149,504,600. Forthis purpose, directors and officers have been assumed to be affiliates. As of September 13, 2011, 32,162,161shares of Zale Corporation’s common stock were outstanding.
Zale Corporation is an accelerated filer.
Zale Corporation is not a shell company.
DOCUMENTS INCORPORATED BY REFERENCE.
Portions of Zale Corporation’s definitive Proxy Statement for the 2011 Annual Meeting of Stockholders tobe held on December 2, 2011 are incorporated by reference into Part III.

ZALE CORPORATION AND SUBSIDIARIES
TABLE OF CONTENTS
Page
PART I.
Item 1. Business . . . . . . . . . . . . . . . . . . . . . . . . . . . . . . . . . . . . . . . . . . . . . . . . . . . . . 1
Item 1A. Risk Factors . . . . . . . . . . . . . . . . . . . . . . . . . . . . . . . . . . . . . . . . . . . . . . . . . . 9
Item 1B. Unresolved Staff Comments . . . . . . . . . . . . . . . . . . . . . . . . . . . . . . . . . . . . . . 13
Item 2. Properties . . . . . . . . . . . . . . . . . . . . . . . . . . . . . . . . . . . . . . . . . . . . . . . . . . . . 13
Item 3. Legal Proceedings and Other Matters . . . . . . . . . . . . . . . . . . . . . . . . . . . . . . . 14
Item 4. Reserved . . . . . . . . . . . . . . . . . . . . . . . . . . . . . . . . . . . . . . . . . . . . . . . . . . . . 14
Item 4A. Executive Officers of the Registrant . . . . . . . . . . . . . . . . . . . . . . . . . . . . . . . . . 14
PART II.
Item 5. Market For Registrant’s Common Equity, Related Stockholder Matters andIssuer Purchases of Equity Securities . . . . . . . . . . . . . . . . . . . . . . . . . . . . . . 16
Item 6. Selected Financial Data . . . . . . . . . . . . . . . . . . . . . . . . . . . . . . . . . . . . . . . . . . 18
Item 7. Management’s Discussion and Analysis of Financial Condition and Results ofOperations . . . . . . . . . . . . . . . . . . . . . . . . . . . . . . . . . . . . . . . . . . . . . . . . . 20
Item 7A. Quantitative and Qualitative Disclosures About Market Risk . . . . . . . . . . . . . . . 33
Item 8. Financial Statements and Supplementary Data . . . . . . . . . . . . . . . . . . . . . . . . . 34
Item 9. Changes in and Disagreements With Accountants on Accounting and FinancialDisclosure . . . . . . . . . . . . . . . . . . . . . . . . . . . . . . . . . . . . . . . . . . . . . . . . . . 34
Item 9A. Controls and Procedures . . . . . . . . . . . . . . . . . . . . . . . . . . . . . . . . . . . . . . . . . 34
Item 9B. Other Information . . . . . . . . . . . . . . . . . . . . . . . . . . . . . . . . . . . . . . . . . . . . . 35
PART III.
Item 10. Directors, Executive Officers and Corporate Governance . . . . . . . . . . . . . . . . . . 36
Item 11. Executive Compensation . . . . . . . . . . . . . . . . . . . . . . . . . . . . . . . . . . . . . . . . . 36
Item 12 Security Ownership of Certain Beneficial Owners and Management and RelatedStockholder Matters . . . . . . . . . . . . . . . . . . . . . . . . . . . . . . . . . . . . . . . . . . . 36
Item 13. Certain Relationships and Related Transactions, and Director Independence . . . 36
Item 14. Principal Accountant Fees and Services . . . . . . . . . . . . . . . . . . . . . . . . . . . . . . 36
PART IV.
Item 15. Exhibits and Financial Statements Schedules . . . . . . . . . . . . . . . . . . . . . . . . . . . 37

PART I
ITEM 1. BUSINESS
General
We are, through our wholly owned subsidiaries, a leading specialty retailer of fine jewelry. At July 31,2011, we operated 1,163 specialty retail jewelry stores and 666 kiosks located mainly in shopping mallsthroughout the United States of America, Canada and Puerto Rico.
We were incorporated in Delaware in 1993. Our principal executive offices are located at 901 W.Walnut Hill Lane, Irving, Texas 75038-1003. Our telephone number at that address is (972) 580-4000, andour internet address is www.zalecorp.com.
During the fiscal year ended July 31, 2011, we generated $1.7 billion of revenues. We compete in theapproximately $64 billion U.S. and Canadian retail jewelry industry by leveraging our established brandnames, economies of scale and geographic and demographic diversity. We have significant brand namerecognition as a result of each of our brands’ long-standing presence in the industry and our national andregional advertising campaigns. We believe that brand name recognition is an important advantage injewelry retailing as jewelry products are generally unbranded and consumers must trust a retailer’sreliability, credibility and commitment to customer service.
Business Segments
We report our operations under three business segments: Fine Jewelry, Kiosk Jewelry and All Other.An overview of each business segment follows below. During fiscal year 2011, Fine Jewelry generated$1.5 billion, or 86 percent of our revenues and Kiosk Jewelry generated $239 million, or 14 percent of ourrevenues.
Fine Jewelry
Fine Jewelry is comprised of five brands, predominantly focused on the value-oriented consumer asour core customer target. Each brand specializes in fine jewelry and watches, with merchandise andmarketing emphasis focused on diamond products. Zales Jewelers� is our national brand in the U.S.providing moderately priced jewelry to a broad range of customers. Zales Outlet� operates in outlet mallsand neighborhood power centers and capitalizes on Zales Jewelers’� national advertising and brandrecognition. Gordon’s Jewelers� is a value-oriented regional jeweler. Peoples Jewellers�, Canada’s largestfine jewelry retailer, provides customers with an affordable assortment and an accessible shoppingexperience. Mappins Jewellers� offers Canadian customers a broad selection of merchandise fromengagement rings to fashionable and contemporary fine jewelry. In addition, we have made a strategicdecision to expand our brand reach through the e-commerce sites, www.zales.com, www.zalesoutlet.com,www.gordonsjewelers.com and www.peoplesjewellers.com.
Zales Jewelers and Gordon’s Jewelers
Zales, our U.S. based flagship, is a leading brand name in jewelry retailing in the U.S., operating650 stores in 50 states and Puerto Rico with an average store size of 1,686 square feet. Gordon’s operates168 stores in 27 states and Puerto Rico with an average store size of 1,517 square feet.
Zales is positioned as ‘‘The Diamond Store Since 1924’’ given its emphasis on diamond jewelryespecially in the bridal and fashion segments. The Zales brand complements its merchandise assortmentswith promotional strategies to increase sales during traditional gift-giving periods and throughout the year.We believe that the prominence of diamond jewelry in our product selection and Zales’ reputation forcustomer service for over 85 years fosters an image of product expertise, quality and trust amongconsumers.
1

Gordon’s was founded in 1905 and its customers share similar demographic characteristics with theZales customer. Gordon’s features items in every major jewelry category including exclusive bridal designs,branded watches, gemstones, gold merchandise, and diamond fashion and solitaire products.
Zales Jewelers’ and Gordon’s Jewelers’ combined revenues accounted for 59 percent of our totalrevenues, with an average transaction value of $422 in fiscal year 2011. Additionally, both brands operateas multi-channel retailers and serve internet customers through the e-commerce sites: www.zales.com andwww.gordonsjewelers.com, which accounted for approximately four percent of our total revenues in fiscalyear 2011. Internet sales totaled $74.3 million in fiscal year 2011 compared to $63.8 million in fiscal year2010.
Peoples Jewellers and Mappins Jewellers
In Canada, we operate 213 stores in nine provinces and enjoy the largest market share of any specialtyjewelry retailer in Canada. Canadian operations consist of two brands, Peoples Jewellers and MappinsJewellers, and accounted for 17 percent of our total revenues in fiscal year 2011. The average store size is1,613 square feet with an average transaction value of $335 in fiscal year 2011. Beginning in October 2010,Peoples Jewellers serves internet customers through the e-commerce site, www.peoplesjewellers.com.
Peoples Jewellers and Mappins Jewellers are two of the most recognized brand names in Canada.Peoples was founded in 1919 and offers jewelry at affordable prices, attracting a wide variety of Canadiancustomers. Using the trademark ‘‘Peoples the Diamond Store’’ in Canada, Peoples emphasizes its diamondbusiness while also offering a wide selection of gold jewelry, gemstone jewelry and watches. Since 2000, thePeoples brand has built recognition through an aggressive television campaign. Over the past five years,Peoples had the largest television campaign of any Canadian jewelry retailer. Mappins Jewellersdifferentiates itself by offering exclusive merchandise primarily in its bridal assortment and brandedjewelry lines.
Zales Outlet
We operate 132 Zales Outlet stores in 35 states and Puerto Rico, sales from which accounted for10 percent of our total revenues in fiscal year 2011. The average store size is 2,360 square feet, with anaverage transaction value of $455 in fiscal year 2011.
The outlet concept has evolved into three differentiated formats: power strip centers, traditionaloutlet malls and destination centers. Zales Outlet was established as an extension of the Zales brand andcapitalizes on Zales’ national advertising and brand recognition. Our stores feature items in every majorjewelry category including branded watches, gemstones, gold merchandise, and diamond fashion andsolitaire products.
Kiosk Jewelry
Kiosk Jewelry operates under the brand names Piercing Pagoda�, Plumb Gold�, and Silver and GoldConnection� (collectively, ‘‘Piercing Pagoda’’) through mall-based kiosks, and targets the opening pricepoint jewelry customer. In May 2010, we expanded our presence in Kiosk Jewelry through the e-commercesite, www.pagoda.com. At July 31, 2011, Piercing Pagoda operated 666 locations in 41 states and PuertoRico, sales from which accounted for 14 percent of our total revenues in fiscal year 2011. Kiosk Jewelryspecializes in gold, silver and non-precious metal products, including entry level diamond merchandise,that capitalize on the latest fashion trends.
At the entry level price point, Kiosk Jewelry services fashion conscious customers of all ages. KioskJewelry offers an extensive collection of bracelets, earrings, charms, rings, and 14 karat and 10 karat goldchains, as well as a selection of silver and diamond jewelry, all in basic styles at moderate prices. Inaddition, trained associates perform ear-piercing services on site.
2

Kiosks are generally located in high traffic areas that are easily accessible and visible within regionalshopping malls. The kiosk locations average 188 square feet in size, with an average transaction value of$41 in fiscal year 2011.
All Other
We provide insurance and reinsurance facilities for various types of insurance coverage, which aremarketed primarily to our private label credit card customers, through Zale Indemnity Company, Zale LifeInsurance Company, Jewel Re-Insurance Ltd. and ZCSC, LLC. These four companies are the insurers(either through direct written or reinsurance contracts) of our customer credit insurance coverage. Inaddition to providing merchandise replacement coverage for certain perils, credit insurance coverageprovides protection to the creditor and cardholder for losses associated with the disability, involuntaryunemployment, leave of absence or death of the cardholder. Zale Life Insurance Company also providesgroup life insurance coverage for our eligible employees. Zale Indemnity Company, in addition to writingdirect credit insurance contracts, has certain discontinued lines of insurance that it continues to service.Credit insurance operations are dependent on our retail sales through our private label credit cards. Infiscal year 2011, 36 percent of our private label credit card purchasers purchased some form of creditinsurance. Under the current private label arrangement with Citibank, our insurance affiliates provideinsurance to holders of our U.S. private label credit card and receive payments for such insuranceproducts. On May 7, 2010, we entered into a five year Private Label Credit Card Program Agreement (the‘‘TD Agreement’’) with TD Financing Services Inc. (‘‘TDFS’’), a wholly-owned subsidiary of Toronto-Dominion Bank, to provide financing for our Canadian customers to purchase merchandise throughprivate label credit cards beginning July 1, 2010. In addition, TDFS will provide credit insurance for ourCanadian customers and will receive 40 percent of the net profits and the remaining 60 percent will be paidto us. The TD Agreement replaced the agreement with Citi Cards Canada Inc., which expired on June 30,2010. In fiscal year 2011, All Other accounted for approximately one percent of our total revenues.
Industry and Competition
Jewelry retailing is highly fragmented and competitive. We compete with a large number ofindependent regional and local jewelry retailers, as well as with other national jewelry chains. We alsocompete with other types of retailers who sell jewelry and gift items such as department stores, discounters,direct mail suppliers, online retailers and television home shopping programs. Certain of our competitorsare non-specialty retailers, which are larger and have greater financial resources than we do. The mallswhere most of our stores are located typically contain competing national chains, independent jewelrystores and/or department store jewelry departments. We believe that we also are competing for consumers’discretionary spending dollars and, therefore, compete with retailers who offer merchandise other thanjewelry. Therefore, we compete primarily on the basis of our reputation for high quality products, brandrecognition, store location, distinctive and value-oriented merchandise, personalized customer service andability to offer private label credit card programs to customers wishing to finance their purchases. Oursuccess also is dependent on our ability to both create and react to customer demand for specificmerchandise categories.
The U.S. and Canadian retail jewelry industry accounted for approximately $64 billion of sales in2010, according to publicly available data. We have a three percent market share in the combined U.S. andCanadian markets. The largest jewelry retailer in the combined U.S. and Canadian markets is believed tobe Wal-Mart Stores, Inc. Other significant segments of the fine jewelry industry include national chaindepartment stores (such as J.C. Penney Company, Inc.), mass merchant discount stores (such as Wal-MartStores, Inc.), other general merchandise stores, specialty retail jewelers (such as Signet Jewelers Limited)and apparel and accessory stores. The remainder of the retail jewelry industry is comprised primarily ofcatalog and mail order houses, direct-selling establishments, TV shopping networks (such as QVC, Inc.)and online jewelers.
3

We hold no material patents, licenses, franchises or concessions; however, our established trademarksand trade names are essential to maintaining our competitive position in the retail jewelry industry.
Operations by Brand
The following table presents revenues, average sales per location and the number of locations for eachof our brands for the periods indicated.
Year Ended July 31,
Revenues (in thousands) 2011 2010 2009
Zales (including zales.com) . . . . . . . . . . . . . . $ 851,748 $ 788,491 $ 879,424Gordon’s (including gordonsjewelers.com) . . . . 174,475 174,586 230,995Zales Outlet . . . . . . . . . . . . . . . . . . . . . . . . . 166,317 154,747 168,497Peoples and Mappins (including
peoplesjewellers.com)(a)(b) . . . . . . . . . . . . . 298,107 260,683 256,710Piercing Pagoda (including pagoda.com)(c) . . . 239,231 226,187 232,809Insurance . . . . . . . . . . . . . . . . . . . . . . . . . . . 12,685 11,611 11,309
$1,742,563 $1,616,305 $1,779,744
Average Sales Per Location (in thousands)(d):
Zales . . . . . . . . . . . . . . . . . . . . . . . . . . . . . . $ 1,184 $ 1,079 $ 1,142Gordon’s . . . . . . . . . . . . . . . . . . . . . . . . . . . 940 875 965Zales Outlet . . . . . . . . . . . . . . . . . . . . . . . . . 1,229 1,147 1,149Peoples and Mappins . . . . . . . . . . . . . . . . . . 1,409 1,212 1,213Piercing Pagoda . . . . . . . . . . . . . . . . . . . . . . 356 338 330
(a) In October 2010, we commenced operations of an e-commerce site for Peoples Jewellers.
(b) Reflects all revenue from Canadian operations, which constitutes all of our foreign operations.Long-lived assets from foreign operations totaled approximately $30.9 million, $35.4 million and$40.6 million at July 31, 2011, 2010 and 2009, respectively.
(c) In May 2010, we commenced operations of an e-commerce site for Piercing Pagoda.
(d) Based on merchandise sales for locations open a full 12 months during the applicable year.
4
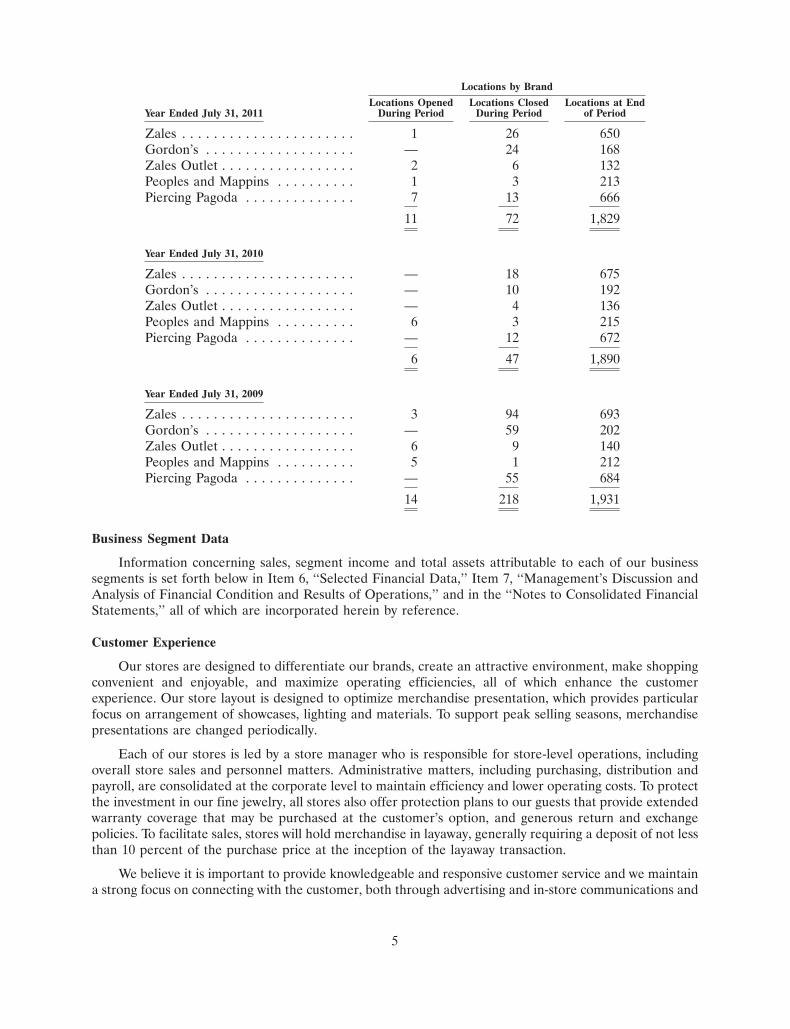
Locations by Brand
Locations Opened Locations Closed Locations at EndYear Ended July 31, 2011 During Period During Period of Period
Zales . . . . . . . . . . . . . . . . . . . . . . 1 26 650Gordon’s . . . . . . . . . . . . . . . . . . . — 24 168Zales Outlet . . . . . . . . . . . . . . . . . 2 6 132Peoples and Mappins . . . . . . . . . . 1 3 213Piercing Pagoda . . . . . . . . . . . . . . 7 13 666
11 72 1,829
Year Ended July 31, 2010
Zales . . . . . . . . . . . . . . . . . . . . . . — 18 675Gordon’s . . . . . . . . . . . . . . . . . . . — 10 192Zales Outlet . . . . . . . . . . . . . . . . . — 4 136Peoples and Mappins . . . . . . . . . . 6 3 215Piercing Pagoda . . . . . . . . . . . . . . — 12 672
6 47 1,890
Year Ended July 31, 2009
Zales . . . . . . . . . . . . . . . . . . . . . . 3 94 693Gordon’s . . . . . . . . . . . . . . . . . . . — 59 202Zales Outlet . . . . . . . . . . . . . . . . . 6 9 140Peoples and Mappins . . . . . . . . . . 5 1 212Piercing Pagoda . . . . . . . . . . . . . . — 55 684
14 218 1,931
Business Segment Data
Information concerning sales, segment income and total assets attributable to each of our businesssegments is set forth below in Item 6, ‘‘Selected Financial Data,’’ Item 7, ‘‘Management’s Discussion andAnalysis of Financial Condition and Results of Operations,’’ and in the ‘‘Notes to Consolidated FinancialStatements,’’ all of which are incorporated herein by reference.
Customer Experience
Our stores are designed to differentiate our brands, create an attractive environment, make shoppingconvenient and enjoyable, and maximize operating efficiencies, all of which enhance the customerexperience. Our store layout is designed to optimize merchandise presentation, which provides particularfocus on arrangement of showcases, lighting and materials. To support peak selling seasons, merchandisepresentations are changed periodically.
Each of our stores is led by a store manager who is responsible for store-level operations, includingoverall store sales and personnel matters. Administrative matters, including purchasing, distribution andpayroll, are consolidated at the corporate level to maintain efficiency and lower operating costs. To protectthe investment in our fine jewelry, all stores also offer protection plans to our guests that provide extendedwarranty coverage that may be purchased at the customer’s option, and generous return and exchangepolicies. To facilitate sales, stores will hold merchandise in layaway, generally requiring a deposit of not lessthan 10 percent of the purchase price at the inception of the layaway transaction.
We believe it is important to provide knowledgeable and responsive customer service and we maintaina strong focus on connecting with the customer, both through advertising and in-store communications and
5

service. Our goal is to form and sustain an effective relationship with the customer from the first sale. Wehave a centralized customer service call center to effectively address customer service issues at loweraggregate cost.
We continue to focus on the level and frequency of our employee education and training programs,particularly with store managers and jewelry consultants. We provide selling and merchandise producttraining for all store personnel. In fiscal year 2011, we launched a new training program, Engage, designedto ensure our jewelry consultants across all brands will provide a consistent customer experience. We havealso continued to expand Diamond Council of America (‘‘DCA’’) training to our store managers, districtmanagers, regional directors and certain jewelry consultants to provide a more in-depth understanding ofthe technical aspects of selling diamonds. At July 31, 2011, 48 percent of our store personnel were DCAcertified compared to 15 percent last year.
Purchasing and Inventory
We purchase the majority of our merchandise in finished form from a network of established suppliersand manufacturers located primarily in the United States, India, Southeast Asia and Italy. We have a directsourcing team that purchases products from 20 countries and we operate a manufacturing subsidiary that isour largest supplier of finished products. At the end of fiscal year 2011, approximately four percent and15 percent of our total inventory represented raw materials and finished goods related to ourmanufacturing program and distribution center, respectively. All purchasing is done through buying officesat our corporate headquarters (‘‘Store Support Center’’). Consignment inventory has historically consistedof test programs, merchandise at higher price points or merchandise that otherwise does not warrant therisk of ownership. We had $53.5 million and $81.1 million of consignment inventory on hand at July 31,2011 and 2010, respectively. During fiscal years 2011 and 2010, we purchased approximately 17 percent and20 percent, respectively, of our finished merchandise from our top five vendors with no single vendorexceeding five percent in 2011. If our supply with these top vendors were disrupted, particularly at certaincritical times during the year, our sales could be adversely affected in the short term until alternativesupply arrangements could be established.
We maintain stringent inventory control systems, extensive security systems and loss preventionprocedures to minimize inventory losses. We screen employment applicants and provide our storepersonnel with training in loss prevention. Despite such precautions, we experience theft losses from timeto time, and maintain insurance to cover such external losses.
As a specialty retail jeweler, we are affected by industry-wide fluctuations in the prices of diamonds,gold, silver and other metals and stones. The supply and prices of diamonds in the principal world marketsare significantly influenced by a single entity, Diamond Trading Company, which has traditionallycontrolled the sale of a substantial majority of the world’s supply of diamonds and sells rough diamonds toworldwide diamond cutters at prices determined in its sole discretion. The availability of diamonds toDiamond Trading Company and our suppliers is to some extent dependent on the political environment indiamond-producing countries and on continuation of prevailing supply and marketing arrangements forraw diamonds. Until alternate sources are developed, any sustained interruption in the supply of diamondscould adversely affect us and the retail jewelry industry as a whole. The inverse is true with respect to anyoversupply from diamond-producing countries, which could cause diamond prices to fall.
Proprietary Credit
Our private label credit card programs help facilitate the sale of merchandise to customers who wishto finance their purchases rather than use cash or other payment sources. We offer revolving and interestfree credit plans under our private label credit card programs, which allows our jewelry consultants toprovide the customer with a variety of financing options. Approximately 32 percent and 34 percent of ourU.S. sales (excluding Piercing Pagoda which does not offer proprietary credit) were financed by proprietary
6

credit in fiscal years 2011 and 2010, respectively. Our Canadian propriety credit card sales representedapproximately 21 percent and 22 percent of Canadian sales for fiscal years 2011 and 2010, respectively.
In March 2001, we entered into a 10-year agreement with Citibank under which Citibank issuedprivate label credit cards branded with an appropriate trademark, and provided financing for our U.S.customers to purchase merchandise in exchange for payment by us of a merchant fee based on apercentage of each credit card sale. The merchant fee varied according to the credit plan that was chosenby the customer (i.e., revolving, interest free). The agreement also enabled us to write credit insurance. InSeptember 2010, prior to the scheduled expiration of the Citibank agreement in March 2011, we enteredinto a five year agreement to amend and restate various terms of the Merchant Services Agreement withCitibank, to provide financing for our U.S. customers beginning October 1, 2010.
In May 2010, we entered into a five year Private Label Credit Card Program Agreement with TDFS toprovide financing for our Canadian customers to purchase merchandise through private label credit cardsbeginning July 1, 2010. The agreement with TDFS replaced the agreement with Citi Cards Canada Inc.,which expired on June 30, 2010.
In August 2011, we entered into an agreement with Monterey Financial Services, Inc. to providealternative financing options to our U.S. customers who have been declined by Citibank.
Employees
As of July 31, 2011, we had approximately 12,600 employees, of whom approximately 14 percent wereCanadian employees and less than one percent of whom were represented by unions. Additionally, weusually hire temporary employees during November and December of each year, the Holiday season.
Seasonality
As a specialty retailer of fine jewelry, our business is seasonal in nature, with our second fiscal quarter,which includes the holiday months of November and December, accounting for a disproportionatelygreater percentage of annual sales and cash flow than the other three quarters. Other important periodsinclude Valentine’s Day and Mother’s Day. We expect such seasonality to continue.
Information Technology
Our technology systems provide information necessary for: (i) store operations; (ii) inventory control;(iii) profitability monitoring by certain measures (merchandise category, buyer, store); (iv) customerservice; (v) expense control programs; and (vi) overall management decision support. Significant dataprocessing systems include point-of-sale reporting, purchase order management, replenishment,warehouse management, merchandise planning and control, payroll, general ledger, sales audit andaccounts payable. Bar code ticketing and scanning are used at all point-of-sale terminals to ensure accuratesales and margin data compilation and to provide for inventory control monitoring. Information is madeavailable online to merchandising staff on a timely basis, thereby increasing the merchants’ ability to beresponsive to changes in customer behavior.
Our information technology systems and processes allow management to monitor, review and controloperational performance on a daily, monthly, quarterly and annual basis for each store and eachtransaction. Senior management can review and analyze activity by store, amount of sale, terms of sale oremployees who sell the merchandise.
We have a data center operations services agreement with a third party for the management of ourclient server systems, Local Area Network operations, Wide Area Network management and technologysupport. In June 2010, we entered into a new services agreement that supersedes the agreement that wasscheduled to expire in 2012. The new agreement requires fixed payments totaling $34.5 million over a
7

74-month period plus a variable amount based on usage. We believe that by outsourcing our data centeroperations, we are better able to focus our resources on developing and executing our strategic initiatives.
We have historically upgraded, and expect to continue to upgrade, our information systems to improveoperations and support future growth. We estimate we will make capital expenditures of approximately$8 million in fiscal year 2012 for enhancements to our information systems and infrastructure.
Regulation
Our operations are affected by numerous federal and state laws that impose disclosure and otherrequirements upon the origination, servicing and enforcement of credit accounts and limitations on themaximum amount of finance charges that may be charged by a credit provider. In addition to our privatelabel credit cards, credit to our customers is provided primarily through bank cards such as Visa�,MasterCard�, and Discover�. Regulations implementing the Credit Card Accountability Responsibilityand Disclosure Act of 2009 imposed new restrictions on credit card pricing, finance charges and fees,customer billing practices and payment application that have negatively impacted the availability of creditto our customers. Any change in the regulation of credit which would materially limit the availability ofcredit to our traditional customer base could adversely affect our results of operations or financialcondition.
We are subject to the jurisdiction of various state and other taxing authorities. From time to time,these taxing authorities conduct reviews or audits of the Company.
The sale of insurance products is also regulated. Our four wholly-owned insurance companies arerequired to file reports with various insurance commissions, and are also subject to regulations relating tocapital adequacy, the payment of dividends and the operation of their businesses generally. State laws alsoimpose registration and disclosure obligations with respect to the credit and other insurance products thatwe sell to our customers. In addition, the providers of our private label credit programs are subject todisclosure and other requirements under state and federal law and are subject to review by the FederalTrade Commission and the state and federal banking regulators.
Merchandise in the retail jewelry industry is frequently sold at a discount off the ‘‘regular’’ or‘‘original’’ price. We are subject to federal and state regulations requiring retailers offering merchandise atpromotional prices to offer the merchandise at regular or original prices for stated periods of time.Additionally, we are subject to certain truth-in-advertising and various other laws, including consumerprotection regulations that regulate retailers generally and/or the promotion and sale of jewelry inparticular.
The U.S. Dodd-Frank Act requires the Securities and Exchange Commission (‘‘SEC’’) to issue rules,which are still being prepared, for the disclosure and reporting on the use of certain minerals, includinggold, which come from the conflict zones of the Democratic Republic of Congo and adjoining countries.The supply chain for gold and other minerals is complex and it is estimated that the rules will likely add tothe Company’s costs, but this increase is not expected to be material.
Available Information
We provide links to our filings with the SEC and to the SEC filings of our directors and executiveofficers under Section 16 (Forms 3, 4 and 5) of the Securities Exchange Act of 1934, as amended (the‘‘Exchange Act’’), free of charge, on our website at www.zalecorp.com, under the heading ‘‘InvestorRelations’’ in the ‘‘SEC Filings’’ section. These links are automatically updated, so the filings are availableimmediately after they are made publicly available by the SEC. These filings also are available through theSEC’s EDGAR system at www.sec.gov.
Our certificate of incorporation and bylaws as well as the charters for the compensation, audit,nominating and corporate governance committees of our Board of Directors and the corporate governance
8

guidelines are available on our website at www.zalecorp.com, under the heading ‘‘About Zale Corporation’’in the ‘‘Corporate Governance’’ section.
We have a Code of Business Conduct and Ethics (the ‘‘Code’’). All of our directors, executive officersand employees are subject to the Code. The Code is available on our web site at www.zalecorp.com, underthe heading ‘‘About Zale Corporation’’ in the ‘‘Corporate Governance’’ section. Waivers of the Code, ifany, for directors and executive officers would be disclosed in a SEC filing on Form 8-K or, to the extentpermitted by law, on our website.
ITEM 1A. RISK FACTORS
We make forward-looking statements in this Annual Report on Form 10-K and in other reports we filewith the SEC. In addition, members of our senior management make forward-looking statements orally inpresentations to analysts, investors, the media and others. Forward-looking statements include statementsregarding our objectives and expectations with respect to our financial plan, sales and earnings,merchandising and marketing strategies, acquisitions and dispositions, share repurchases, store openings,renovations, remodeling and expansion, inventory management and performance, liquidity and cash flows,capital structure, capital expenditures, development of our information technology andtelecommunications plans and related management information systems, e-commerce initiatives, humanresource initiatives and other statements regarding our plans and objectives. In addition, the words ‘‘plansto,’’ ‘‘anticipate,’’ ‘‘estimate,’’ ‘‘project,’’ ‘‘intend,’’ ‘‘expect,’’ ‘‘believe,’’ ‘‘forecast,’’ ‘‘can,’’ ‘‘could,’’‘‘should,’’ ‘‘will,’’ ‘‘may,’’ or similar expressions may identify forward-looking statements, but some of thesestatements may use other phrasing. These forward-looking statements are intended to relay ourexpectations about the future, and speak only as of the date they are made. We disclaim any obligation toupdate or revise publicly or otherwise any forward-looking statements to reflect subsequent events, newinformation or future circumstances.
Forward-looking statements are not guarantees of future performance and a variety of factors couldcause our actual results to differ materially from the anticipated or expected results expressed in orsuggested by these forward-looking statements.
If the general economy performs poorly, discretionary spending on goods that are, or are perceived tobe, ‘‘luxuries’’ may not grow and may decrease.
Jewelry purchases are discretionary and may be affected by adverse trends in the general economy(and consumer perceptions of those trends). In addition, a number of other factors affecting consumerssuch as employment, wages and salaries, business conditions, energy costs, credit availability and taxationpolicies, for the economy as a whole and in regional and local markets where we operate, can impact salesand earnings. The economic downturn that began in 2008 has significantly impacted our sales and thecontinuation of this downturn, and particularly its worsening, would have a material adverse impact on ourbusiness and financial condition.
The concentration of a substantial portion of our sales in three relatively brief selling periods meansthat our performance is more susceptible to disruptions.
A substantial portion of our sales are derived from three selling periods—Holiday (Christmas),Valentine’s Day and Mother’s Day. Because of the briefness of these three selling periods, the opportunityfor sales to recover in the event of a disruption or other difficulty is limited, and the impact of disruptionsand difficulties can be significant. For instance, adverse weather (such as a blizzard or hurricane), asignificant interruption in the receipt of products (whether because of vendor or other product problems),or a sharp decline in mall traffic occurring during one of these selling periods could materially impact salesfor the affected period and, because of the importance of each of these selling periods, commensuratelyimpact overall sales and earnings.
9
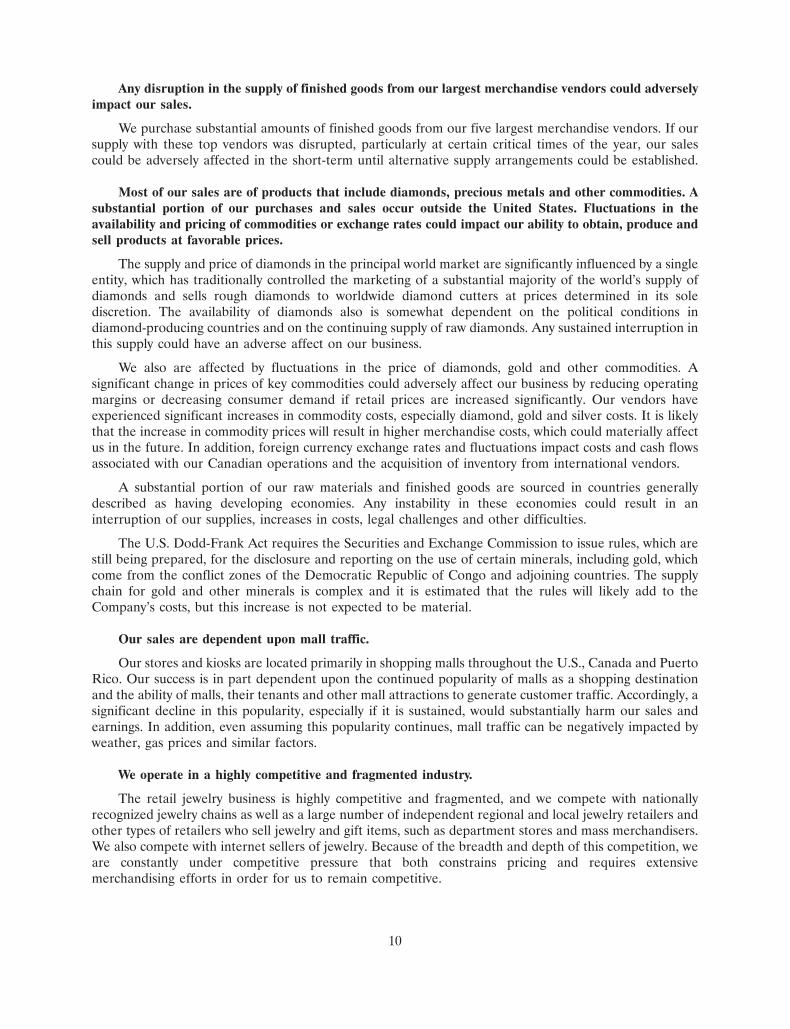
Any disruption in the supply of finished goods from our largest merchandise vendors could adverselyimpact our sales.
We purchase substantial amounts of finished goods from our five largest merchandise vendors. If oursupply with these top vendors was disrupted, particularly at certain critical times of the year, our salescould be adversely affected in the short-term until alternative supply arrangements could be established.
Most of our sales are of products that include diamonds, precious metals and other commodities. Asubstantial portion of our purchases and sales occur outside the United States. Fluctuations in theavailability and pricing of commodities or exchange rates could impact our ability to obtain, produce andsell products at favorable prices.
The supply and price of diamonds in the principal world market are significantly influenced by a singleentity, which has traditionally controlled the marketing of a substantial majority of the world’s supply ofdiamonds and sells rough diamonds to worldwide diamond cutters at prices determined in its solediscretion. The availability of diamonds also is somewhat dependent on the political conditions indiamond-producing countries and on the continuing supply of raw diamonds. Any sustained interruption inthis supply could have an adverse affect on our business.
We also are affected by fluctuations in the price of diamonds, gold and other commodities. Asignificant change in prices of key commodities could adversely affect our business by reducing operatingmargins or decreasing consumer demand if retail prices are increased significantly. Our vendors haveexperienced significant increases in commodity costs, especially diamond, gold and silver costs. It is likelythat the increase in commodity prices will result in higher merchandise costs, which could materially affectus in the future. In addition, foreign currency exchange rates and fluctuations impact costs and cash flowsassociated with our Canadian operations and the acquisition of inventory from international vendors.
A substantial portion of our raw materials and finished goods are sourced in countries generallydescribed as having developing economies. Any instability in these economies could result in aninterruption of our supplies, increases in costs, legal challenges and other difficulties.
The U.S. Dodd-Frank Act requires the Securities and Exchange Commission to issue rules, which arestill being prepared, for the disclosure and reporting on the use of certain minerals, including gold, whichcome from the conflict zones of the Democratic Republic of Congo and adjoining countries. The supplychain for gold and other minerals is complex and it is estimated that the rules will likely add to theCompany’s costs, but this increase is not expected to be material.
Our sales are dependent upon mall traffic.
Our stores and kiosks are located primarily in shopping malls throughout the U.S., Canada and PuertoRico. Our success is in part dependent upon the continued popularity of malls as a shopping destinationand the ability of malls, their tenants and other mall attractions to generate customer traffic. Accordingly, asignificant decline in this popularity, especially if it is sustained, would substantially harm our sales andearnings. In addition, even assuming this popularity continues, mall traffic can be negatively impacted byweather, gas prices and similar factors.
We operate in a highly competitive and fragmented industry.
The retail jewelry business is highly competitive and fragmented, and we compete with nationallyrecognized jewelry chains as well as a large number of independent regional and local jewelry retailers andother types of retailers who sell jewelry and gift items, such as department stores and mass merchandisers.We also compete with internet sellers of jewelry. Because of the breadth and depth of this competition, weare constantly under competitive pressure that both constrains pricing and requires extensivemerchandising efforts in order for us to remain competitive.
10
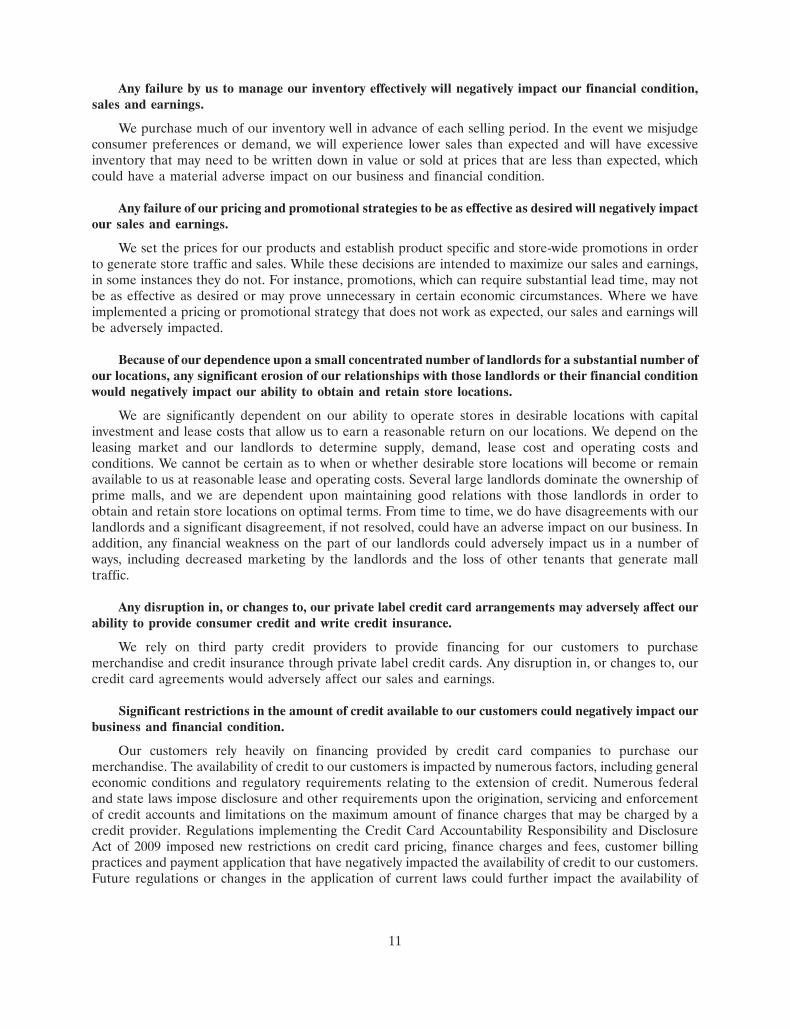
Any failure by us to manage our inventory effectively will negatively impact our financial condition,sales and earnings.
We purchase much of our inventory well in advance of each selling period. In the event we misjudgeconsumer preferences or demand, we will experience lower sales than expected and will have excessiveinventory that may need to be written down in value or sold at prices that are less than expected, whichcould have a material adverse impact on our business and financial condition.
Any failure of our pricing and promotional strategies to be as effective as desired will negatively impactour sales and earnings.
We set the prices for our products and establish product specific and store-wide promotions in orderto generate store traffic and sales. While these decisions are intended to maximize our sales and earnings,in some instances they do not. For instance, promotions, which can require substantial lead time, may notbe as effective as desired or may prove unnecessary in certain economic circumstances. Where we haveimplemented a pricing or promotional strategy that does not work as expected, our sales and earnings willbe adversely impacted.
Because of our dependence upon a small concentrated number of landlords for a substantial number ofour locations, any significant erosion of our relationships with those landlords or their financial conditionwould negatively impact our ability to obtain and retain store locations.
We are significantly dependent on our ability to operate stores in desirable locations with capitalinvestment and lease costs that allow us to earn a reasonable return on our locations. We depend on theleasing market and our landlords to determine supply, demand, lease cost and operating costs andconditions. We cannot be certain as to when or whether desirable store locations will become or remainavailable to us at reasonable lease and operating costs. Several large landlords dominate the ownership ofprime malls, and we are dependent upon maintaining good relations with those landlords in order toobtain and retain store locations on optimal terms. From time to time, we do have disagreements with ourlandlords and a significant disagreement, if not resolved, could have an adverse impact on our business. Inaddition, any financial weakness on the part of our landlords could adversely impact us in a number ofways, including decreased marketing by the landlords and the loss of other tenants that generate malltraffic.
Any disruption in, or changes to, our private label credit card arrangements may adversely affect ourability to provide consumer credit and write credit insurance.
We rely on third party credit providers to provide financing for our customers to purchasemerchandise and credit insurance through private label credit cards. Any disruption in, or changes to, ourcredit card agreements would adversely affect our sales and earnings.
Significant restrictions in the amount of credit available to our customers could negatively impact ourbusiness and financial condition.
Our customers rely heavily on financing provided by credit card companies to purchase ourmerchandise. The availability of credit to our customers is impacted by numerous factors, including generaleconomic conditions and regulatory requirements relating to the extension of credit. Numerous federaland state laws impose disclosure and other requirements upon the origination, servicing and enforcementof credit accounts and limitations on the maximum amount of finance charges that may be charged by acredit provider. Regulations implementing the Credit Card Accountability Responsibility and DisclosureAct of 2009 imposed new restrictions on credit card pricing, finance charges and fees, customer billingpractices and payment application that have negatively impacted the availability of credit to our customers.Future regulations or changes in the application of current laws could further impact the availability of
11

credit to our customers. If the amount of available credit provided to our customers is significantlyrestricted, which recently has been the trend, our sales and earnings would be negatively impacted.
We are dependent upon our revolving credit agreement, senior secured term loan and other third partyfinancing arrangements for our liquidity needs.
We have a revolving credit agreement and a senior secured term loan that contain various financialand other covenants. Should we be unable to fulfill the covenants contained in these loans, we would beunable to fund our operations without a significant restructuring of our business.
If the credit markets deteriorate, our ability to obtain the financing needed to operate our businesscould be adversely impacted.
We utilize a revolving credit agreement to finance our working capital requirements, including thepurchase of inventory, among other things. If our ability to obtain the financing needed to meet theserequirements was adversely impacted as a result of continued deterioration in the credit markets, ourbusiness could be significantly impacted. In addition, the amount of available borrowings under ourrevolving credit agreement is based, in part, on the appraised liquidation value of our inventory. Anydeclines in the appraised value of our inventory could impact our ability to obtain the financing necessaryto operate our business.
Any security breach with respect to our information technology systems could result in legal orfinancial liabilities, damage to our reputation and a loss of customer confidence.
During the course of our business, we regularly obtain and transmit through our informationtechnology systems customer credit and other data. If our information technology systems are breacheddue to the actions of outside parties, or otherwise, an unauthorized third party may obtain access toconfidential customer information. Any breach of our systems that results in unauthorized access tocustomer information could cause us to incur significant legal and financial liabilities, damage to ourreputation and a loss of customer confidence. In each case, these impacts could have an adverse effect onour business and results of operations.
Acquisitions and dispositions involve special risk, including the risk that we may not be able tocomplete proposed acquisitions or dispositions or that such transactions may not be beneficial to us.
We have made significant acquisitions and dispositions in the past and may in the future makeadditional acquisitions and dispositions. Difficulty integrating an acquisition into our existing infrastructureand operations may cause us to fail to realize expected return on investment through revenue increases,cost savings, increases in geographic or product presence and customer reach, and/or other projectedbenefits from the acquisition. In addition, we may not achieve anticipated cost savings or may be unable tofind attractive investment opportunities for funds received in connection with a disposition. Additionally,attractive acquisition or disposition opportunities may not be available at the time or pursuant to termsacceptable to us and we may be unable to complete acquisitions or dispositions.
Ineffective internal controls can have adverse impacts on the Company.
Under Federal law, we are required to maintain an effective system of internal controls over financialreporting. Should we not maintain an effective system, it would result in a violation of those laws and couldimpair our ability to produce accurate and timely financial statements. In turn, this could result inincreased audit costs, a loss of investor confidence, difficulties in accessing the capital markets, andregulatory and other actions against us. Any of these outcomes could be costly to both our shareholdersand us.
12

Changes in estimates, assumptions and judgments made by management related to our evaluation ofgoodwill and other long-lived assets for impairment could significantly affect our financial results.
Evaluating goodwill and other long-lived assets for impairment is highly complex and involves manysubjective estimates, assumptions and judgments by our management. For instance, management makesestimates and assumptions with respect to future cash flow projections, terminal growth rates, discountrates and long-term business plans. If our actual results are not consistent with our estimates, assumptionsand judgments made by management, we may be required to recognize impairments.
Additional factors may adversely affect our financial performance.
Increases in expenses that are beyond our control including items such as increases in interest rates,inflation, fluctuations in foreign currency rates, higher tax rates and changes in laws and regulations, maynegatively impact our operating results.
ITEM 1B. UNRESOLVED STAFF COMMENTS
Not applicable.
ITEM 2. PROPERTIES
We lease a 430,000 square foot facility, which serves as our corporate headquarters and primarydistribution facility. The lease for this facility extends through March 2018. The facility is located in LasColinas, a planned business development in Irving, Texas, near the Dallas/Fort Worth InternationalAirport. Our Canadian distribution operation is conducted in a leased 26,280 square foot facility inToronto, Ontario with a lease term through November 2014. We also lease a 20,000 square footdistribution and warehousing facility in Irving, Texas, with a lease term through February 2012, whichserves as the Piercing Pagoda distribution center.
We rent our store retail space under leases that generally range in terms from 5 to 10 years and maycontain minimum rent escalation clauses, while kiosk leases generally range from three to five years. Mostof the store leases provide for the payment of base rentals plus real estate taxes, insurance, common areamaintenance fees and merchants association dues, as well as percentage rents based on the store’s grosssales.
We lease 19 percent of our store and kiosk locations from Simon Property Group and 13 percent ofour store and kiosk locations from General Growth Management, Inc. No other lessor accounts for10 percent or more of our store and kiosk locations.
The following table indicates the expiration dates of our leases as of July 31, 2011:
PercentageTerm Expires Stores Kiosks Other(a) Total of Total
2012 . . . . . . . . . . . . . . . . . . . . . . . . . . 230 314 3 547 29.8%2013 . . . . . . . . . . . . . . . . . . . . . . . . . . 195 224 — 419 22.8%2014 . . . . . . . . . . . . . . . . . . . . . . . . . . 144 70 — 214 11.7%2015 . . . . . . . . . . . . . . . . . . . . . . . . . . 136 47 1 184 10.0%2016 and thereafter . . . . . . . . . . . . . . . 458 11 1 470 25.7%
1,163 666 5 1,834 100.0%
(a) Other includes the Store Support Center, distribution centers and storage facilities.
Management believes that substantially all of the store leases expiring in fiscal year 2012 that it wishesto renew (including leases which expired earlier and are currently being operated under month-to-month
13

extensions) will be renewed. We expect that leases will be renewed on terms not materially different thanthe terms of the expiring or expired leases. Management believes our facilities are suitable and adequatefor our business as presently conducted.
ITEM 3. LEGAL PROCEEDINGS AND OTHER MATTERS
Information regarding legal proceedings is incorporated by reference from Note 19 to ourconsolidated financial statements set forth, under the heading, ‘‘Contingencies,’’ in Part IV of this report.
ITEM 4. RESERVED
ITEM 4A. EXECUTIVE OFFICERS OF THE REGISTRANT
The following individuals serve as our executive officers of the Company. Executive officers areelected by the Board of Directors annually, each to serve until his or her successor is elected and qualified,or until his or her earlier resignation, removal from office or death.
Name Age Position
Theo Killion . . . . . . . . . . 60 Chief Executive OfficerMatthew W. Appel . . . . . . 55 Chief Administrative Officer and Chief Financial OfficerGilbert P. Hollander . . . . . 58 Executive Vice President, Chief Merchant and Sourcing OfficerRichard A. Lennox . . . . . . 46 Executive Vice President, Chief Marketing OfficerJeannie Barsam . . . . . . . . 50 Senior Vice President, Merchandise Planning and AllocationJohn A. Legg . . . . . . . . . . 49 Senior Vice President, Supply ChainBecky Mick . . . . . . . . . . . 49 Senior Vice President, Chief Stores OfficerToyin Ogun . . . . . . . . . . . 51 Senior Vice President, Human Resources and Customer Service
Executive Officers
The following is a brief description of the business experience of the Company’s executive officers forat least the past five years.
Mr. Theo Killion has served as Chief Executive Officer of the Company since September 23, 2010. Heserved as President of the Company from August 5, 2008 to September 23, 2010, and as Interim ChiefExecutive Officer from January 13, 2010 to September 23, 2010. From January 23, 2008 to August 5, 2008,Mr. Killion served as Executive Vice President of Human Resources, Legal and Corporate Strategy. FromMay 2006 to January 2008, Mr. Killion was employed with the executive recruiting firmBerglass+Associates, focusing on companies in the retail, consumer goods and fashion industries. FromApril 2004 through April 2006, Mr. Killion served as Executive Vice President of Human Resources atTommy Hilfiger. From 1996 to 2004, Mr. Killion served in various management positions with LimitedBrands.
Mr. Matthew W. Appel was appointed Chief Administrative Officer of the Company effective May 5,2011, and continues to serve as the Company’s Chief Financial Officer. Mr. Appel was named ExecutiveVice President of the Company effective May 2009 and appointed Chief Financial Officer of the Companyon June 15, 2009. From March 2007 to May 2009, Mr. Appel served as Vice President and Chief FinancialOfficer of ExlService Holdings, Inc. Prior to ExlService Holdings, Inc, Mr. Appel was Vice President, BPOProduct Management from 2006 to 2007 and Vice President, Finance and Administration BPO from 2003through 2005 at Electronic Data Systems Corporation. From 2001 to 2003, Mr. Appel was the Senior VicePresident, Finance and Accounting BPO at Affiliated Computer Services, Inc. Mr. Appel began his careerwith Arthur Andersen, where he spent seven years in their audit practice. Mr. Appel is a certified publicaccountant and certified management accountant.
14
Mr. Gilbert P. Hollander was appointed Executive Vice President and Chief Sourcing Officer inSeptember 2007, and was given the additional title of Chief Merchant on January 13, 2010. Prior to thatappointment, Mr. Hollander served as President, Corporate Sourcing/Piercing Pagoda beginning in May2006, and was given the additional title of Group Senior Vice President in August 2006. From January 2005to August 2006, he served as President, Piercing Pagoda. Prior to and up until that appointment,Mr. Hollander served as Vice President of Divisional Merchandise for Piercing Pagoda, to which he wasappointed in August 2003. Mr. Hollander served as Senior Vice President of Merchandising for PiercingPagoda from February 2000 to August 2003. Prior to February 2000, Mr. Hollander held variousmanagement positions within Piercing Pagoda beginning in May of 1997.
Mr. Richard A. Lennox was appointed Executive Vice President, Chief Marketing Officer of theCompany effective August 2009. Prior to joining the Company, Mr. Lennox served as Executive VicePresident, Marketing Director at J. Walter Thompson–New York. Mr. Lennox started at J. WalterThompson in 1989 and held various senior level marketing positions. He began his career in 1987 withAGB–London.
Ms. Jeannie Barsam was appointed Senior Vice President, Merchandise Planning and Allocation inMarch 2011. Prior to joining the Company, Ms. Barsam served as Senior Vice President, Planning andAllocation of Charlotte Russe, Inc. from November 2009 to February 2011. From December 2007 toNovember 2009, Ms. Barsam served as Senior Vice President, Merchandise Planning and Allocation ofThe Talbots, Inc. Prior to The Talbots, Inc., Ms. Barsam held various senior management positions withGap, Inc. from August 2000 to December 2007.
Mr. John A. Legg was appointed Senior Vice President, Supply Chain in August 2010. Prior to joiningthe Company, Mr. Legg served as Managing Director of Management Services International, LLC from2008 to 2010. From 2007 to 2008, Mr. Legg was Senior Vice President, Global Distribution and Logistics ofThe Warnaco Group, Inc. Prior to The Warnaco Group, Inc., Mr. Legg was Vice President, InternationalDistribution of Liz Claiborne, Inc., from 1999 to 2007.
Ms. Becky Mick was appointed Senior Vice President, Chief Stores Officer in July 2010. Ms. Mickserved as Vice President Zale North America since joining the Company in September 2008. Prior tojoining the Company, Ms. Mick served as Vice President, Director of Stores and Operations of The DisneyStore from May 2006 to April 2008. Ms. Mick served as Vice President of The Children’s Place fromAugust 2005 to May 2006. From 1997 to 2005, Ms. Mick held various management positions with OldNavy.
Mr. Toyin Ogun was appointed Senior Vice President, Human Resource and Customer Service inMarch 2011. Prior to joining the Company, Mr. Ogun served as Vice President, Human Resource of L.L.Bean, Inc. from October 2009 to March 2010. Mr. Ogun served as Senior Vice President and Chief TalentOfficer of Sears Holdings from August 2007 to August 2009. Prior to Sears Holdings, Mr. Ogun heldvarious senior management positions with Limited Brands, Inc. from February 1998 to August 2007.
15
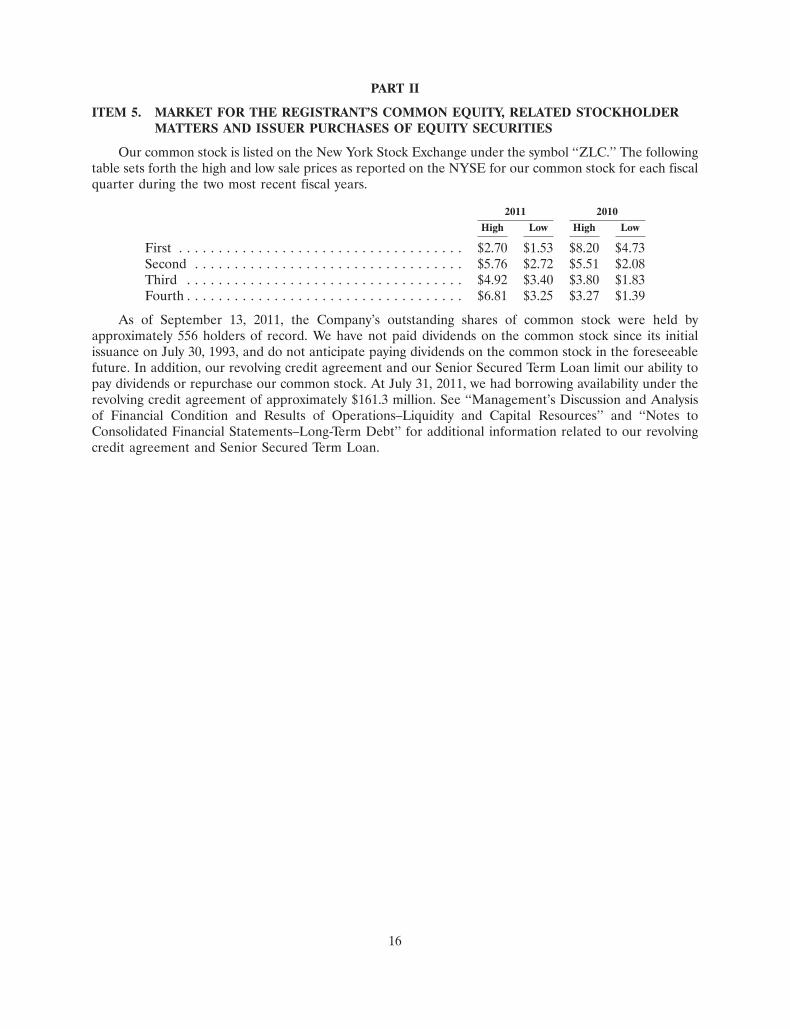
PART II
ITEM 5. MARKET FOR THE REGISTRANT’S COMMON EQUITY, RELATED STOCKHOLDERMATTERS AND ISSUER PURCHASES OF EQUITY SECURITIES
Our common stock is listed on the New York Stock Exchange under the symbol ‘‘ZLC.’’ The followingtable sets forth the high and low sale prices as reported on the NYSE for our common stock for each fiscalquarter during the two most recent fiscal years.
2011 2010
High Low High Low
First . . . . . . . . . . . . . . . . . . . . . . . . . . . . . . . . . . . . $2.70 $1.53 $8.20 $4.73Second . . . . . . . . . . . . . . . . . . . . . . . . . . . . . . . . . . $5.76 $2.72 $5.51 $2.08Third . . . . . . . . . . . . . . . . . . . . . . . . . . . . . . . . . . . $4.92 $3.40 $3.80 $1.83Fourth . . . . . . . . . . . . . . . . . . . . . . . . . . . . . . . . . . . $6.81 $3.25 $3.27 $1.39
As of September 13, 2011, the Company’s outstanding shares of common stock were held byapproximately 556 holders of record. We have not paid dividends on the common stock since its initialissuance on July 30, 1993, and do not anticipate paying dividends on the common stock in the foreseeablefuture. In addition, our revolving credit agreement and our Senior Secured Term Loan limit our ability topay dividends or repurchase our common stock. At July 31, 2011, we had borrowing availability under therevolving credit agreement of approximately $161.3 million. See ‘‘Management’s Discussion and Analysisof Financial Condition and Results of Operations–Liquidity and Capital Resources’’ and ‘‘Notes toConsolidated Financial Statements–Long-Term Debt’’ for additional information related to our revolvingcredit agreement and Senior Secured Term Loan.
16

10OCT201115234544
Corporate Performance Graph
The following graph shows a comparison of cumulative total returns for the Company, the S&P 500Index, the S&P 600 Specialty Store Index and the S&P 600 Smallcap Index for the period from July 31,2006 to July 31, 2011. The comparison assumes $100 was invested on July 31, 2006 in the Company’scommon stock and in each of the three indices and, for the S&P 500 Index, the S&P 600 Specialty StoreIndex and the S&P 600 Smallcap Index, assumes reinvestment of dividends. The Company has not paidany dividends during this period.
Do
llars
$140
$120
$100
$80
$60
$40
$20
$0
7/31
/200
6
1/31
/200
7
7/31
/200
7
1/31
/200
8
7/31
/200
8
1/31
/200
9
7/31
/200
9
1/31
/201
0
7/31
/201
0
1/31
/201
1
7/31
/201
1
ZALE CORP S&P 500 INDEX
S&P SMALLCAP 600 INDEX S&P 600 SPECIALTY STORE INDEX
7/31/06 1/31/07 7/31/07 1/31/08 7/31/08 1/31/09 7/31/09 1/31/10 7/31/10 1/31/11 7/31/11
Zale Corporation . . . . . . $100.00 $107.46 $ 82.90 $ 63.88 $ 86.37 $ 4.84 $23.12 $ 8.51 $ 6.87 $ 18.24 $ 21.91S&P 500 . . . . . . . . . . . . 100.00 113.75 116.13 111.12 103.25 68.20 82.64 90.79 94.07 110.94 112.56S&P Smallcap Spec . . . . 100.00 120.80 113.16 80.95 81.36 44.66 78.49 91.31 103.22 133.34 129.97S&P 600 Smallcap . . . . . 100.00 112.98 114.10 104.97 104.66 66.41 84.49 92.29 100.69 120.83 125.58
The stock price performance depicted in the above graph is not necessarily indicative of future priceperformance. The Corporate Performance Graph shall not be deemed ‘‘soliciting material’’ or to be ‘‘filed’’ withthe SEC, nor shall such information be incorporated by reference into any future filing by the Company underthe Securities Act or the Exchange Act, except to the extent that the Company specifically incorporates the graphby reference in such filing.
17
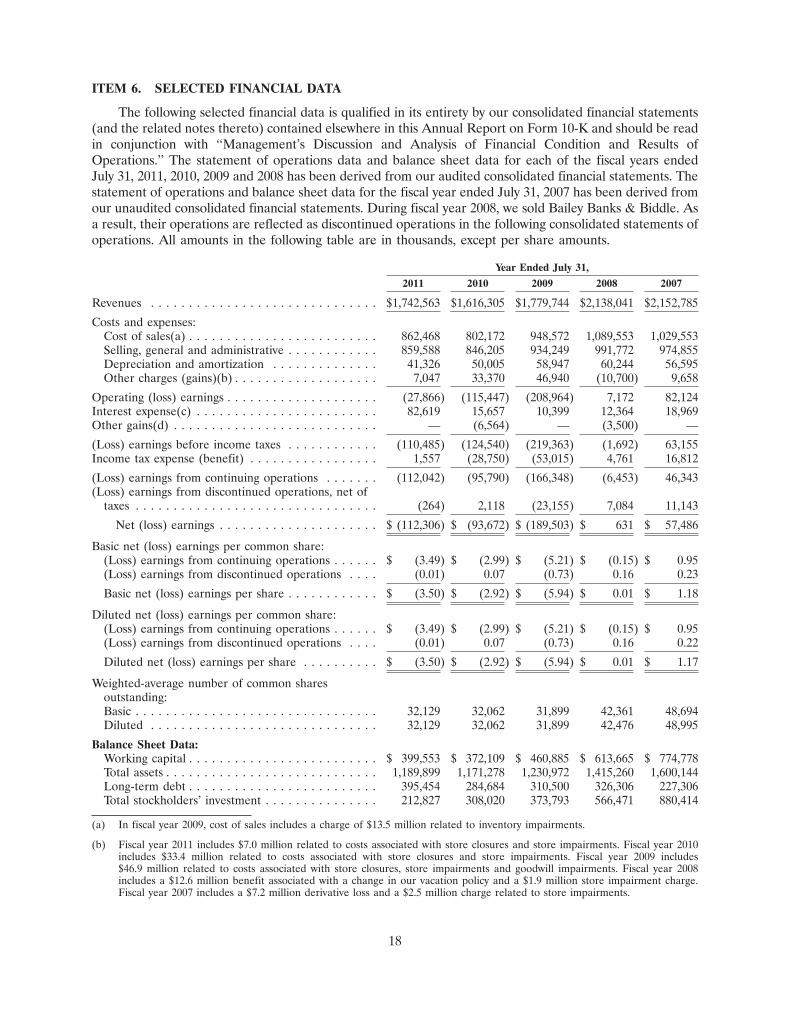
ITEM 6. SELECTED FINANCIAL DATA
The following selected financial data is qualified in its entirety by our consolidated financial statements(and the related notes thereto) contained elsewhere in this Annual Report on Form 10-K and should be readin conjunction with ‘‘Management’s Discussion and Analysis of Financial Condition and Results ofOperations.’’ The statement of operations data and balance sheet data for each of the fiscal years endedJuly 31, 2011, 2010, 2009 and 2008 has been derived from our audited consolidated financial statements. Thestatement of operations and balance sheet data for the fiscal year ended July 31, 2007 has been derived fromour unaudited consolidated financial statements. During fiscal year 2008, we sold Bailey Banks & Biddle. Asa result, their operations are reflected as discontinued operations in the following consolidated statements ofoperations. All amounts in the following table are in thousands, except per share amounts.
Year Ended July 31,
2011 2010 2009 2008 2007
Revenues . . . . . . . . . . . . . . . . . . . . . . . . . . . . . . $1,742,563 $1,616,305 $1,779,744 $2,138,041 $2,152,785
Costs and expenses:Cost of sales(a) . . . . . . . . . . . . . . . . . . . . . . . . . 862,468 802,172 948,572 1,089,553 1,029,553Selling, general and administrative . . . . . . . . . . . . 859,588 846,205 934,249 991,772 974,855Depreciation and amortization . . . . . . . . . . . . . . 41,326 50,005 58,947 60,244 56,595Other charges (gains)(b) . . . . . . . . . . . . . . . . . . . 7,047 33,370 46,940 (10,700) 9,658
Operating (loss) earnings . . . . . . . . . . . . . . . . . . . . (27,866) (115,447) (208,964) 7,172 82,124Interest expense(c) . . . . . . . . . . . . . . . . . . . . . . . . 82,619 15,657 10,399 12,364 18,969Other gains(d) . . . . . . . . . . . . . . . . . . . . . . . . . . . — (6,564) — (3,500) —
(Loss) earnings before income taxes . . . . . . . . . . . . (110,485) (124,540) (219,363) (1,692) 63,155Income tax expense (benefit) . . . . . . . . . . . . . . . . . 1,557 (28,750) (53,015) 4,761 16,812
(Loss) earnings from continuing operations . . . . . . . (112,042) (95,790) (166,348) (6,453) 46,343(Loss) earnings from discontinued operations, net of
taxes . . . . . . . . . . . . . . . . . . . . . . . . . . . . . . . . (264) 2,118 (23,155) 7,084 11,143
Net (loss) earnings . . . . . . . . . . . . . . . . . . . . . $ (112,306) $ (93,672) $ (189,503) $ 631 $ 57,486
Basic net (loss) earnings per common share:(Loss) earnings from continuing operations . . . . . . $ (3.49) $ (2.99) $ (5.21) $ (0.15) $ 0.95(Loss) earnings from discontinued operations . . . . (0.01) 0.07 (0.73) 0.16 0.23
Basic net (loss) earnings per share . . . . . . . . . . . . $ (3.50) $ (2.92) $ (5.94) $ 0.01 $ 1.18
Diluted net (loss) earnings per common share:(Loss) earnings from continuing operations . . . . . . $ (3.49) $ (2.99) $ (5.21) $ (0.15) $ 0.95(Loss) earnings from discontinued operations . . . . (0.01) 0.07 (0.73) 0.16 0.22
Diluted net (loss) earnings per share . . . . . . . . . . $ (3.50) $ (2.92) $ (5.94) $ 0.01 $ 1.17
Weighted-average number of common sharesoutstanding:Basic . . . . . . . . . . . . . . . . . . . . . . . . . . . . . . . . 32,129 32,062 31,899 42,361 48,694Diluted . . . . . . . . . . . . . . . . . . . . . . . . . . . . . . 32,129 32,062 31,899 42,476 48,995
Balance Sheet Data:Working capital . . . . . . . . . . . . . . . . . . . . . . . . . $ 399,553 $ 372,109 $ 460,885 $ 613,665 $ 774,778Total assets . . . . . . . . . . . . . . . . . . . . . . . . . . . . 1,189,899 1,171,278 1,230,972 1,415,260 1,600,144Long-term debt . . . . . . . . . . . . . . . . . . . . . . . . . 395,454 284,684 310,500 326,306 227,306Total stockholders’ investment . . . . . . . . . . . . . . . 212,827 308,020 373,793 566,471 880,414
(a) In fiscal year 2009, cost of sales includes a charge of $13.5 million related to inventory impairments.
(b) Fiscal year 2011 includes $7.0 million related to costs associated with store closures and store impairments. Fiscal year 2010includes $33.4 million related to costs associated with store closures and store impairments. Fiscal year 2009 includes$46.9 million related to costs associated with store closures, store impairments and goodwill impairments. Fiscal year 2008includes a $12.6 million benefit associated with a change in our vacation policy and a $1.9 million store impairment charge.Fiscal year 2007 includes a $7.2 million derivative loss and a $2.5 million charge related to store impairments.
18

(c) Fiscal year 2011 includes a charge of $45.8 million associated with the first amendment to our Senior Secured Term Loan.
(d) Fiscal year 2010 includes a gain of $8.3 million related to a decrease in the fair value of the warrants issued in connection withthe Senior Secured Term Loan and a $1.7 million charge related to debt issuance costs attributable to the warrants. Fiscal year2008 includes a gain of $3.5 million related to the sale of our interest in a diamond known as the ‘‘Incomparable Diamond.’’
Segment Data
We report our business under three segments: Fine Jewelry, Kiosk Jewelry and All Other. All Otherincludes insurance and reinsurance operations. Operating earnings by segment are calculated beforeunallocated corporate overhead, interest and taxes but include an internal charge for inventory carryingcost to evaluate segment profitability. Unallocated costs are before income taxes and include corporateemployee related costs, administrative costs, information technology costs, corporate facilities costs anddepreciation and amortization. All amounts in the following table are in thousands.
Year Ended July 31,
Selected Financial Data by Segment 2011 2010 2009 2008 2007
Revenues:Fine Jewelry(a) . . . . . . . . . . . . . . . . . . $1,490,647 $1,378,507 $1,535,626 $1,876,170 $1,876,580Kiosk(b) . . . . . . . . . . . . . . . . . . . . . . . 239,231 226,187 232,809 249,489 262,627All Other . . . . . . . . . . . . . . . . . . . . . . 12,685 11,611 11,309 12,382 13,578
Total revenues . . . . . . . . . . . . . . . . . $1,742,563 $1,616,305 $1,779,744 $2,138,041 $2,152,785
Depreciation and amortization:Fine Jewelry . . . . . . . . . . . . . . . . . . . . $ 28,009 $ 35,558 $ 42,407 $ 42,832 $ 39,933Kiosk . . . . . . . . . . . . . . . . . . . . . . . . . 3,361 4,120 4,899 5,296 5,625All Other . . . . . . . . . . . . . . . . . . . . . . — — — — —Unallocated . . . . . . . . . . . . . . . . . . . . . 9,956 10,327 11,641 12,116 11,037
Total depreciation and amortization . . $ 41,326 $ 50,005 $ 58,947 $ 60,244 $ 56,595
Operating (loss) earnings:Fine Jewelry(c) . . . . . . . . . . . . . . . . . . $ (16,312) $ (84,818) $ (192,683) $ 18,909 $ 100,531Kiosk(d) . . . . . . . . . . . . . . . . . . . . . . . 16,060 13,133 2,465 9,905 6,170All Other . . . . . . . . . . . . . . . . . . . . . . 7,831 4,731 5,706 5,641 6,780Unallocated(e) . . . . . . . . . . . . . . . . . . . (35,445) (48,493) (24,452) (27,283) (31,357)
Total operating (loss) earnings . . . . . . $ (27,866) $ (115,447) $ (208,964) $ 7,172 $ 82,124
Assets(f):Fine Jewelry(g) . . . . . . . . . . . . . . . . . . $ 805,245 $ 820,353 $ 868,227 $ 987,369 $1,250,967Kiosk . . . . . . . . . . . . . . . . . . . . . . . . . 85,999 85,631 107,457 118,601 120,660All Other . . . . . . . . . . . . . . . . . . . . . . 40,406 33,643 24,842 27,234 25,406Unallocated . . . . . . . . . . . . . . . . . . . . . 258,249 231,651 230,446 282,056 203,111
Total assets . . . . . . . . . . . . . . . . . . . $1,189,899 $1,171,278 $1,230,972 $1,415,260 $1,600,144
Capital expenditures:Fine Jewelry . . . . . . . . . . . . . . . . . . . . $ 8,818 $ 9,945 $ 18,702 $ 59,289 $ 47,433Kiosk . . . . . . . . . . . . . . . . . . . . . . . . . — — 420 3,266 3,036All Other . . . . . . . . . . . . . . . . . . . . . . — — — — —Unallocated . . . . . . . . . . . . . . . . . . . . . 6,497 4,705 9,235 22,582 28,791
Total capital expenditures . . . . . . . . . $ 15,315 $ 14,650 $ 28,357 $ 85,137 $ 79,260
(a) Includes $298.1, $260.7, $256.7, $321.9 and $272.0 million in fiscal years 2011, 2010, 2009, 2008 and 2007, respectively,related to foreign operations.
(b) Includes $2.8 million in fiscal year 2007, related to foreign operations. All foreign locations were closed in fiscal year2007.
(c) Includes $7.0 million and $32.3 million in fiscal years 2011 and 2010, respectively, related to charges associated withstore closures and store impairments. Fiscal year 2009 includes $46.5 million related to charges associated with store
19

closures, store impairments and goodwill impairments. Fiscal year 2009 also includes $13.5 million related to aninventory impairment charge. Fiscal year 2008 includes a $1.9 million store impairment charge. Fiscal year 2007 includesa $2.0 million store impairment charge.
(d) Fiscal year 2010 includes a $1.1 million charge associated with store impairments. Fiscal year 2009 includes $0.4 millionrelated to costs associated with store closures. Fiscal year 2007 includes a $0.5 million charge related to storeimpairments.
(e) Fiscal year 2008 includes a $12.6 million benefit associated with a change in our vacation policy. Fiscal year 2007includes a $7.2 million derivative loss. Also includes credits of $46.1, $55.5, $60.1, $66.8 and $66.7 million in fiscal years2011, 2010, 2009, 2008 and 2007, respectively, to offset internal carrying costs charged to the segments.
(f) Assets allocated to segments include fixed assets, inventories, goodwill and investments held by our insuranceoperations. Unallocated assets include cash, prepaid assets such as rent, corporate office improvements and technologyinfrastructure.
(g) Includes $30.9, $35.4, $40.6, $47.0 and $37.5 million of fixed assets in fiscal years 2011, 2010, 2009, 2008 and 2007,respectively, related to foreign operations.
ITEM 7. MANAGEMENT’S DISCUSSION AND ANALYSIS OF FINANCIAL CONDITION ANDRESULTS OF OPERATIONS
For important information regarding forward-looking statements made in this Management’sDiscussion and Analysis of Financial Condition and Results of Operations see ‘‘Item 1A—Risk Factors.’’
Overview
We are a leading specialty retailer of fine jewelry in North America. At July 31, 2011, we operated1,163 fine jewelry stores and 666 kiosks located primarily in shopping malls throughout the United Statesof America, Canada and Puerto Rico.
We report our business under three operating segments: Fine Jewelry, Kiosk Jewelry and All Other.Fine Jewelry is comprised of five brands, Zales Jewelers�, Zales Outlet�, Gordon’s Jewelers�, PeoplesJewellers� and Mappins Jewellers�, and is predominantly focused on the value-oriented consumer. Eachbrand specializes in fine jewelry and watches, with merchandise and marketing emphasis focused ondiamond products. These five brands have been aggregated into one reportable segment. Kiosk Jewelryoperates under the brand names Piercing Pagoda�, Plumb Gold�, and Silver and Gold Connection�through mall-based kiosks and is focused on the opening price point customer. Kiosk Jewelry specializes ingold, silver and non-precious metal products that capitalize on the latest fashion trends. All Other includesour insurance and reinsurance operations, which offer insurance coverage primarily to our private labelcredit card customers.
In fiscal year 2010, we began the execution of a multi-year strategy to stabilize the business and returnthe Company to profitability. The key elements of that strategy include:
• Rebuilding the core merchandise assortment.
We began rebuilding our core merchandise assortment, which had declined to 60 percent of ourinventory at January 31, 2010. At July 31, 2011, our core assortment increased to approximately80 percent. The increase in the core assortment has contributed to increased liquidity and positivecomparable store sales over the last three quarters of fiscal year 2011. The increased liquidity hasenabled our merchants to enhance our inventory by selectively pursuing other merchandise. In August2011, we entered into partnerships with Vera Wang and Jessica Simpson to develop exclusive weddingand diamond fashion collections.
• Creating a compelling marketing message that supports the core assortment.
In fiscal year 2011, we reintroduced Zales Jewelers and Peoples Jewellers as ‘‘The DiamondStore’’ by emphasizing our core diamond assortment in our marketing message. In fiscal year 2012, we
20

will also leverage the exclusive partnerships with Vera Wang and Jessica Simpson to enhance themarketing for our core assortment.
• Investing in personnel in key functions to enhance effectiveness.
In fiscal year 2011, we launched a new training program, Engage, designed to ensure our jewelryconsultants provide a consistent customer experience across all brands and expanded DiamondCouncil of America training to our store managers, district managers, regional directors and certainjewelry consultants to provide a more in-depth understanding of the technical aspects of sellingdiamonds. We have also invested in key functions in our store support center includingMerchandising, Human Resources, Marketing and Merchandise Planning to support our fieldoperations.
• Establishing the financial foundation needed to enhance liquidity and improve businessperformance.
In May 2010, we secured a $150 million Senior Secured Term Loan and extended our revolvingcredit agreement. In May 2010, we entered into an agreement with TD Financing Services, Inc.(‘‘TDFS’’), a wholly-owned subsidiary of Toronto-Dominion Bank, to provide financing for ourCanadian customers to purchase merchandise through private label credit cards. The agreement withTDFS replaced the agreement with Citi Cards Canada Inc., which expired on June 30, 2010. InSeptember 2010, prior to the scheduled expiration of the Citibank agreement in March 2011, weentered into a five-year agreement to amend and restate various terms of the Merchant ServicesAgreement with Citibank (South Dakota), N.A. to provide financing for our U.S. customers beginningOctober 1, 2010. In August 2011, we entered into an agreement with Monterey Financial Services, Inc.to provide alternative financing options to our U.S. customers who have been declined by Citibank.
Comparable store sales increased by 8.1 percent during fiscal year 2011. At constant exchange rates,which excludes the effect of translating Canadian currency denominated sales into U.S. dollars,comparable store sales increased by 7.1 percent for the fiscal year. Gross margin increased by 10 basispoints to 50.5 percent for the fiscal year ended July 31, 2011 compared to the same period in the prior year.The increase in gross margin was due to a 100 basis point increase in revenues recognized related towarranties, a 110 basis point decrease in inventory impairment charges as a result of improved sales and a25 basis point decrease in merchandise discounts. The increase was partially offset by a 220 basis pointincrease in the cost of merchandise, including an $11.3 million increase in the last-in, first-out (‘‘LIFO’’)inventory charge, and a change in the sales mix to lower margin merchandise. Operating margin improvedby 550 basis points to negative 1.6 percent compared to negative 7.1 percent in the same period in the prioryear primarily as a result of increased sales and a $26 million net decrease in store impairments and closurecharges.
During the fiscal year ended July 31, 2011 and 2010, the average Canadian currency rate appreciatedby approximately six percent and 12 percent, respectively, relative to the U.S. dollar. The appreciation inthe Canadian currency rate for the year ended July 31, 2011 resulted in a $15.6 million increase in reportedrevenues, offset by an increase in reported cost of sales and selling, general and administrative expenses of$7.5 million and $6.7 million, respectively. The appreciation in the Canadian currency rate for the yearended July 31, 2010 resulted in a $27.9 million increase in reported revenues, offset by an increase inreported cost of sales and selling, general and administrative expenses of $13.1 million and $11.0 million,respectively. In addition, as a result of the appreciation in the Canadian dollar, we recorded gainsassociated with the settlement of Canadian accounts payable totaling $1.4 million and $2.8 million duringthe fiscal years ended July 31, 2011 and 2010, respectively.
Net earnings associated with warranties totaled $72.6 million for the year ended July 31, 2011,compared to $51.1 million for the same period in the prior year. The increase in net earnings is primarilythe result of increased sales and a change in our warranty product from a two-year warranty to a lifetime
21

warranty in fiscal year 2007. The revenues related to lifetime warranties are recognized on a straight-linebasis over a five-year period.
Substantially all U.S. inventories represent finished goods, which are valued using the LIFO retailinventory method. We are required to determine the LIFO cost on an interim basis by estimating annualinflation trends, annual purchases and ending inventory. Actual annual inflation rates and inventorybalances as of the end of any fiscal year may differ from interim estimates. The inflation rates pertaining tomerchandise inventories, especially as they relate to diamond, gold, and silver costs, are primarycomponents in determining our LIFO inventory. As a result of recent commodity cost increases, we haverecorded LIFO charges in cost of sales totaling $17.0 million and $5.7 million during the fiscal years endedJuly 31, 2011 and 2010, respectively.
Comparable store sales include internet sales and exclude revenue recognized from warranties andinsurance premiums related to credit insurance policies sold to customers who purchase merchandiseunder our proprietary credit programs. The sales results of new stores are included beginning with theirthirteenth full month of operation. The results of stores that have been relocated, renovated or refurbishedare included in the calculation of comparable store sales on the same basis as other stores. However, storesclosed for more than 90 days due to unforeseen events (e.g., hurricanes, etc.) are excluded from thecalculation of comparable store sales.
Results of Operations
The following table sets forth certain financial information from our audited consolidated statementsof operations expressed as a percentage of revenues and should be read in conjunction with ourconsolidated financial statements and notes thereto included elsewhere in this Form 10-K.
Year Ended July 31,
2011 2010 2009
Revenues . . . . . . . . . . . . . . . . . . . . . . . . . . . . . . . . . . . . 100.0% 100.0% 100.0%
Costs and expenses:Cost of sales . . . . . . . . . . . . . . . . . . . . . . . . . . . . . . . 49.5 49.6 53.3Selling, general and administrative . . . . . . . . . . . . . . . 49.3 52.4 52.5Depreciation and amortization . . . . . . . . . . . . . . . . . . 2.4 3.1 3.3Other charges . . . . . . . . . . . . . . . . . . . . . . . . . . . . . . 0.4 2.1 2.6
Operating loss . . . . . . . . . . . . . . . . . . . . . . . . . . . . . . . . . (1.6) (7.1) (11.7)Interest expense . . . . . . . . . . . . . . . . . . . . . . . . . . . . . . . 4.7 1.0 0.6Other gains . . . . . . . . . . . . . . . . . . . . . . . . . . . . . . . . . . . — (0.4) —
Loss before income taxes . . . . . . . . . . . . . . . . . . . . . . . . . (6.3) (7.7) (12.3)Income tax expense (benefit) . . . . . . . . . . . . . . . . . . . . . . 0.1 (1.8) (3.0)
Loss from continuing operations . . . . . . . . . . . . . . . . . . . . (6.4) (5.9) (9.3)(Loss) earnings from discontinued operations, net of taxes . — 0.1 (1.3)
Net loss . . . . . . . . . . . . . . . . . . . . . . . . . . . . . . . . . . (6.4)% (5.8)% (10.6)%
Year Ended July 31, 2011 Compared to Year Ended July 31, 2010
Revenues. Revenues for fiscal year 2011 were $1,742.6 million, an increase of 7.8 percent comparedto revenues of $1,616.3 million for the same period in the prior fiscal year. Comparable store salesincreased 8.1 percent as compared to the same period in the prior year. The increase in comparable storesales was attributable to a 5.9 percent increase in average transaction value in our fine jewelry stores and a2.6 percent increase in the number of customer transactions. The increase in revenue was also due to$22.4 million in revenues recognized related to warranties and a $15.6 million increase related to the
22

appreciation of the Canadian currency rate, partially offset by a decrease in revenues related to 61 storesclosed (net of store openings) during fiscal year 2011.
Fine Jewelry contributed $1,490.6 million of revenues in the fiscal year ended July 31, 2011, anincrease of 8.1 percent as compared to $1,378.5 million for the same period in the prior year.
Kiosk Jewelry contributed $239.2 million of revenues in the fiscal year ended July 31, 2011 ascompared to $226.2 million in the prior year, representing an increase of 5.8 percent. The increase inrevenue is due primarily to a 3.4 percent increase in average transaction value.
All Other contributed $12.7 million in revenues for the fiscal year ended July 31, 2011 as compared to$11.6 million for the same period in the prior year, representing an increase of 9.3 percent.
During the fiscal year ended July 31, 2011, we opened four stores in Fine Jewelry and seven locationsin Kiosk Jewelry. In addition, we closed 59 stores in Fine Jewelry and 13 kiosks in Kiosk Jewelry.
Cost of Sales. Cost of sales includes cost related to merchandise sold, receiving and distribution,customer repairs and repairs associated with warranties. Cost of sales as a percentage of revenues was49.5 percent for the year ended July 31, 2011, compared to 49.6 percent for the same period in the prioryear. The decrease is due to a 110 basis point decrease in inventory impairment charges as a result ofimproved sales and a 25 basis point decrease in merchandise discounts compared to the same period in theprior year. The decrease was partially offset by a 125 basis point increase in the cost of merchandise,including an $11.3 million increase in the LIFO inventory charge, and a change in sale mix to lower marginmerchandise.
Selling, General and Administrative. Included in selling, general and administrative (‘‘SG&A’’) are storeoperating, advertising, buying, cost of insurance operations and general corporate overhead expenses.SG&A was 49.3 percent of revenues for the year ended July 31, 2011, compared to 52.4 percent for thesame period in the prior year. The 310 basis point improvement was primarily the result of improved sales.SG&A increased by $13.4 million to $859.6 million for the year ended July 31, 2011. The increase isprimarily the result of a $23.4 million increase in labor costs and store and corporate performance-basedcompensation associated with improved sales and a $5.7 million increase in credit card fees primarily dueto increased sales in the U.S. The increase was partially offset by a $7.6 million decrease in professionalfees and severance costs, a $5.8 million decrease related to fees paid to Citibank in fiscal year 2010 and a$3.2 million decrease in rent and occupancy costs.
Depreciation and Amortization. Depreciation and amortization as a percent of revenues for the yearended July 31, 2011 and 2010 was 2.4 percent and 3.1 percent, respectively. The decrease is primarily theresult of store closures and impairment charges recorded during fiscal years 2011 and 2010.
Other Charges. Other charges for the year ended July 31, 2011 includes a $6.8 million charge related tothe impairment of long-lived assets associated with underperforming stores and a $0.3 million chargeassociated with store closures. Other charges for the year ended July 31, 2010 includes a $29.9 millioncharge related to the impairment of long-lived assets associated with underperforming stores and a$3.4 million charge associated with store closures.
Interest Expense. Interest expense as a percent of revenues for the years ended July 31, 2011 and 2010was 4.7 percent and 1.0 percent, respectively. Interest expense increased by $67.0 million to $82.6 millionfor the year ended July 31, 2011. The increase is primarily due to a charge totaling $45.8 million associatedwith the first amendment to our Senior Secured Term Loan (‘‘Term Loan’’) on September 24, 2010. Inaccordance with Accounting Standards Codification (‘‘ASC’’) 470-50, Debt-Modifications andExtinguishments, the amendment is considered a significant modification, which required us to account forthe Term Loan and related unamortized costs as an extinguishment and record the amended Term Loan atfair value. The charge consisted of $20.3 million related to the unamortized discount associated with thewarrants issued in connection with the Term Loan, a $12.5 million amendment fee, $10.3 million related to
23

the unamortized debt issuance costs associated with the Term Loan and $2.7 million related to theprepayment premium and other costs associated with the amendment. The remaining $21.2 millionincrease in interest expense is due primarily to a $16.2 million increase in interest related to the Term Loanand an increase in the weighted-average effective interest rate associated with the revolving creditagreement to 3.7 percent as compared to 1.8 percent for the same period in the prior year.
Other Gains. Other gains for the year ended July 31, 2010 includes an $8.3 million gain related to adecrease in the fair value of the Warrants issued in connection with the Term Loan executed in May 2010and a $1.7 million charge related to debt issuance costs attributable to the Warrants.
Income Tax Expense (Benefit). Income tax expense totaled $1.6 million for the year ended July 31, 2011,compared to a $28.8 million income tax benefit for the year ended July 31, 2010. Income tax expense forthe year ended July 31, 2011 is primarily associated with earnings of our Canadian subsidiaries, partiallyoffset by the recognition of a $4.6 million tax refund associated with the Worker, Homeownership andBusiness Assistance Act of 2009 (‘‘WHBA’’). The income tax benefit for the year ended July 31, 2010 isprimarily the result of the recognition of a $33.4 million refund associated with the WHBA, partially offsetby tax expense primarily associated with our Canadian subsidiaries.
Year Ended July 31, 2010 Compared to Year Ended July 31, 2009
Revenues. Revenues for fiscal year 2010 were $1,616.3 million, a decrease of 9.2 percent compared torevenues of $1,779.7 million for the same period in the prior fiscal year. Comparable store sales decreased6.6 percent as compared to the same period in the prior year. The decline in comparable store sales wasdriven by a 5.9 percent decrease in the number of customer transactions in our fine jewelry stores and a4.0 percent decrease in the average transaction price. The decline was also due to a decrease in revenuesrelated to 41 stores closed (net of store openings), partially offset by an $18.2 million increase in revenuesrecognized related to lifetime warranties and a $27.9 million increase related to the appreciation of theCanadian currency rate.
Fine Jewelry contributed $1,378.5 million of revenues in the fiscal year ended July 31, 2010, a decreaseof 10.2 percent as compared to $1,535.6 million for the same period in the prior year.
Kiosk Jewelry contributed $226.2 million of revenues in the fiscal year ended July 31, 2010 ascompared to $232.8 million in the prior year, representing a decrease of 2.8 percent. The decrease relatesprimarily to a decline in the number of kiosks to 672 from 684 as of July 31, 2010 and 2009, respectively.
All Other contributed $11.6 million in revenues for the fiscal year ended July 31, 2010 as compared to$11.3 million for the same period in the prior year, representing an increase of 2.7 percent.
During the fiscal year ended July 31, 2010, we opened six stores in Fine Jewelry. In addition, we closed35 stores in Fine Jewelry and 12 kiosks in Kiosk Jewelry.
Cost of Sales. Cost of sales includes cost related to merchandise sold, receiving and distribution,customer repairs and repairs associated with warranties. Cost of sales as a percentage of revenues was49.6 percent for the year ended July 31, 2010, compared to 53.3 percent for the same period in the prioryear. The decrease is due to a 380 basis point improvement associated with a decline in merchandisediscounts compared to the same period in the prior year and a 150 basis point improvement in lifetimewarranty margins. The decrease was partially offset by a 100 basis point increase in the cost ofmerchandise.
Selling, General and Administrative. Included in SG&A are store operating, advertising, buying, cost ofinsurance operations and general corporate overhead expenses. SG&A was 52.4 percent of revenues forthe year ended July 31, 2010, compared to 52.5 percent for the same period in the prior year. SG&Adecreased by $88.0 million to $846.2 million for the year ended July 31, 2010. The decrease is the result ofa $36.9 million decrease in payroll related costs associated primarily with headcount reductions, a decrease
24

in rent and occupancy costs of $29.6 million due to store closures and rent reductions negotiated with ourlandlords, a $12.0 million decrease in promotional costs, a $10.3 million decrease in foreign currency lossesand a $6.9 million decrease in legal and severance costs. The decrease was partially offset by a $5.8 millioncharge during fiscal year 2010 related to fees paid to Citibank associated with our failure to meet theminimum required volume of credit sales and a $4.4 million increase in professional fees associated withthe restatement of our prior year financial statements and the related SEC investigation.
Depreciation and Amortization. Depreciation and amortization as a percent of revenues for the yearended July 31, 2010 and 2009 was 3.1 percent and 3.3 percent, respectively. The decrease is primarily theresult of store closures and impairment charges recorded during fiscal years 2010 and 2009.
Other Charges. Other charges for the year ended July 31, 2010 includes a $29.9 million charge relatedto the impairment of long-lived assets associated with underperforming stores and a $3.4 million chargeassociated with store closures. Other charges for the year ended July 31, 2009 includes a $27.0 millioncharge associated with store closures, a $14.9 million charge related to the impairment of long-lived assetsassociated with underperforming stores and a $5.0 million goodwill impairment charge related to areporting unit in Fine Jewelry.
Interest Expense. Interest expense as a percent of revenues for the years ended July 31, 2010 and 2009was 1.0 percent and 0.6 percent, respectively. Interest expense increased by $5.3 million to $15.7 million forthe year ended July 31, 2010. The increase is the result of interest expense totaling $5.1 million related tothe Term Loan executed in May 2010, partially offset by a decrease in the weighted-average effectiveinterest rate associated with the revolving credit agreement from 2.6 percent in the prior year to1.8 percent this year.
Other Gains. Other gains for the year ended July 31, 2010 includes an $8.3 million gain related to adecrease in the fair value of the Warrants issued in connection with the Term Loan executed in May 2010and a $1.7 million charge related to debt issuance costs attributable to the Warrants.
Income Tax Expense (Benefit). The income tax benefit totaled $28.8 million for the year ended July 31,2010, compared to $53.0 million for the year ended July 31, 2009. The income tax benefit for the yearended July 31, 2010 is the result of the recognition of refunds totaling $33.4 million associated with theWHBA, partially offset by $2.8 million of tax expense associated with our Canadian subsidiaries. Theincome tax benefit for fiscal year 2009 is the result of operating losses, partially offset by a net chargetotaling $13.9 million related to our decision to revoke our election under ASC 740, Income Taxes, toindefinitely reinvest certain foreign earnings outside the U.S. and a $12.5 million charge related touncertainties surrounding the utilization of net operating loss carryforwards.
Liquidity and Capital Resources
Our cash requirements consist primarily of funding ongoing operations, including inventoryrequirements, capital expenditures for new stores, renovation of existing stores, upgrades to ourinformation technology systems and distribution facilities and debt service. For fiscal year 2011, our cashrequirements were funded through cash flows from operations and our revolving credit agreement with asyndicate of lenders led by Bank of America, N.A. We manage availability under the revolving creditagreement by monitoring the timing of merchandise receipts and vendor payments. The average vendorpayment terms during the year ended July 31, 2011 and 2010 was approximately 46 days and 44 days,respectively. As of July 31, 2011, we had cash and cash equivalents totaling $35.1 million.
Net cash from operating activities decreased from $52.3 million for the year ended July 31, 2010 to ause of $47.0 million for the year ended July 31, 2011. The $99.3 million decrease is primarily the result of:(1) a $50.4 million increase in inventory; (2) a $28.8 million decrease in refunds under the WHBA; (3) a$15.2 million payment related to the Term Loan amendment; (4) a $21.2 million increase in interestpayments primarily related to the Term Loan; and (5) a $46.0 million increase related to the timing of
25

vendor payments. The decrease was partially offset by a $23.7 million decrease in cash payments related tolease terminations associated with closed stores and an increase in cash generated from operations.
In November 2009, the Worker, Homeownership and Business Assistance Act of 2009 (the ‘‘WHBA’’)was signed into law. The WHBA includes provisions that extend the time period in which net operatingloss carrybacks can be utilized from two years to five years, with certain limitations. In fiscal year 2011 and2010, we recognized tax benefits associated with the WHBA totaling $4.6 million and $33.4 million,respectively, related to operating losses generated in fiscal year 2009.
Our business is highly seasonal, with a disproportionate amount of sales (approximately 30 percent to40 percent) occurring in November and December of each year, the Holiday season. Other importantperiods include Valentine’s Day and Mother’s Day. We purchase inventory in anticipation of these periodsand, as a result, have higher inventory and inventory financing needs immediately prior to these periods.Owned inventory at July 31, 2011 was $720.8 million, an increase of $17.7 million compared to July 31,2010. The increase is the result of higher merchandise cost, additional merchandise purchased as a resultof increased sales, an increase in the Canadian exchange rate and lower inventory valuation reserves due toimproved inventory turn. The increase was partially offset by an $11.3 million increase in the LIFO reservecompared to the same period in the prior year.
Amended and Restated Revolving Credit Agreement
On May 10, 2010, we entered into an agreement to amend and restate various terms of the revolvingcredit agreement with Bank of America, N.A. and certain other lenders. The Amended and RestatedRevolving Credit Agreement (the ‘‘Revolving Credit Agreement’’) consisted of two tranches: (a) anextended tranche totaling $530 million, including seasonal borrowings of $88 million, maturing on April 30,2014 and (b) a non-extending tranche totaling $120 million, including seasonal borrowings of $20 million,maturing on August 11, 2011. The commitments under the agreement from both tranches total$650 million, including seasonal borrowings of $108 million. On April 21, 2011, the $120 millionnon-extending tranche was assigned to other lenders and the maturity date was extended to April 30, 2014,the maturity date for the remainder of the credit facility. Borrowings under the Revolving CreditAgreement are capped at the lesser of: (1) 73 percent of the cost of eligible inventory during Octoberthrough December and 69 percent for the remainder of the year (less certain reserves that may beestablished under the agreement), plus 85 percent of eligible credit card receivables or (2) 87.5 percent ofthe appraised liquidation value of eligible inventory (less certain reserves that may be established underthe agreement), plus 85 percent of eligible credit card receivables. The rate applied to the appraisedliquidation value was 90 percent prior to January 1, 2011. The Revolving Credit Agreement also containsan accordion feature that allows us to permanently increase commitments up to an additional $100 million,subject to approval by our lenders and certain other requirements. The Revolving Credit Agreement issecured by a first priority security interest and lien on merchandise inventory, credit card receivables andcertain other assets and a second priority security interest and lien on all other assets. At July 31, 2011, wehad borrowing availability under the Revolving Credit Agreement of $161.3 million.
Based on the most recent inventory appraisal performed as of June 2011, available borrowings underthe Revolving Credit Agreement will be determined under item (2) described in the preceding paragraph.The monthly borrowing rates calculated from the cost of eligible inventory are as follows: 61 and64 percent for August and September 2011, respectively; ranging from 72 to 74 percent for the period ofOctober through December 2011 and ranging from 60 to 64 percent for the period of January through July2012.
26

Borrowings under the Revolving Credit Agreement bear interest based on average excess availabilityat either: (i) LIBOR plus the applicable margin (ranging from 350 to 400 basis points) or (ii) the base rate(as defined in the Revolving Credit Agreement) plus the applicable margin (ranging from 250 to 300 basispoints). We are required to pay a quarterly unused commitment fee of 50 basis points based on thepreceding quarter’s unused commitment.
Excess availability (as defined in the Revolving Credit Agreement) cannot be less than $40 millionduring the term of the agreement and less than $50 million on one occasion for three consecutive businessdays in each four-month period, except for the period from September 1 through November 30, whenexcess availability can be less than $50 million on two occasions, but in no event can excess availability beless than $50 million more than four times during any 12 consecutive months. Excess availability wasapproximately $111.3 million as of July 31, 2011. The Revolving Credit Agreement contains various othercovenants including restrictions on the incurrence of certain indebtedness, liens, investments, acquisitionsand asset sales. As of July 31, 2011, we were in compliance with all covenants under the Revolving CreditAgreement.
We incurred debt issuance costs associated with the Revolving Credit Agreement totaling$14.1 million, including $1.1 million associated with the April 21, 2011 extension of the $120 millionportion of the credit facility. The debt issuance costs are included in other assets in the accompanyingconsolidated balance sheets and are amortized to interest expense on a straight-line basis over thefour-year life of the Revolving Credit Agreement.
Senior Secured Term Loan
On May 10, 2010, we entered into a $150 million Senior Secured Term Loan (the ‘‘Term Loan’’) and aWarrant and Registration Rights Agreement (as discussed below) with Z Investment Holdings, LLC, anaffiliate of Golden Gate Capital. The Term Loan matures on May 10, 2015 and is secured by a first prioritysecurity interest in substantially all current and future intangible assets not secured under the RevolvingCredit Agreement and a second priority security interest on merchandise inventory, credit card receivablesand certain other assets. The proceeds received were used to pay down amounts outstanding under theRevolving Credit Agreement after payment of debt issuance costs incurred pursuant to the RevolvingCredit Agreement and the Term Loan. Debt issuance costs associated with the Term Loan totaledapproximately $13.0 million, $1.7 million of which was attributable to the warrants issued in connectionwith the Term Loan (see more details below under Warrant and Registration Rights Agreement) andexpensed on the date of issuance.
On September 24, 2010, we amended the Term Loan with Z Investment Holdings, LLC. Theamendment eliminated the Minimum Consolidated EBITDA covenant and our option to pay a portion offuture interest payments in kind subsequent to July 31, 2010. As a result, all future interest payments willbe made in cash. In consideration for the amendment, we paid Z Investment Holdings, LLC an aggregateof $25.0 million, of which $11.3 million was used to pay down the outstanding principal balance of the TermLoan, $1.2 million was a prepayment premium and $12.5 million was an amendment fee. The outstandingbalance of the Term Loan after the amendment totaled $140.5 million. In accordance with ASC 470-50,Debt—Modifications and Extinguishments, the amendment was considered a significant modification, whichrequired us to account for the Term Loan and related unamortized costs as an extinguishment and recordthe amended Term Loan at fair value. As a result, we recorded a charge to interest expense totaling$45.8 million in the first quarter of fiscal year 2011. The charge consists of $20.3 million related to theunamortized discount associated with the warrants issued in connection with the Term Loan, the$12.5 million amendment fee, $10.3 million related to the unamortized debt issuance costs associated withthe Term Loan and $2.7 million related to the prepayment premium and other costs associated with theamendment.
27

The Term Loan bears interest at 15 percent payable on a quarterly basis. We may repay all or anyportion of the Term Loan with the following penalty prior to maturity: (i) 10 percent during the first year;(ii) 7.5 percent during the second year; (iii) 5.0 percent during the third year; (iv) 2.5 percent during thefourth year and (v) no penalty in the fifth year. Our ability to repay the Term Loan prior to maturity isrestricted by certain conditions under the Revolving Credit Agreement, including a fixed charge coverageratio that we currently do not meet.
The Term Loan contains various covenants, as defined in the agreement, including maintainingminimum store contribution thresholds for Piercing Pagoda and Zale Canada, as defined, and restrictionson the incurrence of certain indebtedness, liens, investments, acquisitions and asset sales. The PiercingPagoda and Zale Canada minimum store contribution threshold for the twelve-month period endingJuly 31, 2011 is $20 million and CAD $30 million, respectively. As of July 31, 2011, store contribution forPiercing Pagoda and Zale Canada would have to decline by more than 39 percent and 31 percent,respectively, to breach these covenants. The Piercing Pagoda minimum store contribution thresholds forfiscal year 2012 range from $21 million to $26 million. The Zale Canada minimum store contributionthresholds for fiscal year 2012 range from CAD $31 million to CAD $36 million. Liquidity (as defined inthe Term Loan) was $238.9 million as of July 31, 2011, which exceeded the $135 million minimum liquidityrequirement under the Term Loan by $103.9 million. As of July 31, 2011, we were in compliance with allcovenants under the Term Loan.
Warrant and Registration Rights Agreement
In connection with the execution of the Term Loan in May 2010, we entered into a Warrant andRegistration Rights Agreement (the ‘‘Warrant Agreement’’) with Z Investment Holdings, LLC. Under theterms of the Warrant Agreement, we issued 6.4 million A-Warrants and 4.7 million B-Warrants(collectively, the ‘‘Warrants’’) to purchase shares of our common stock, on a one-for-one basis, for anexercise price of $2.00 per share. The Warrants, which are currently exercisable and expire seven yearsafter issuance, represented 25 percent of our common stock on a fully diluted basis (including the sharesissuable upon exercise of the Warrants and excluding certain out-of-the-money stock options) as of thedate of the issuance. The A-Warrants were exercisable immediately; however, the B-Warrants were notexercisable until the shares of common stock to be issued upon exercise of the B-Warrants were approvedby our stockholders, which occurred on July 23, 2010. The number of shares and exercise price are subjectto customary antidilution protection. The Warrant Agreement also entitles the holder to designate two,and in certain circumstances three, directors to our board. The holders of the Warrants may, at theiroption, request that we register for resale all or part of the common stock issuable under the WarrantAgreement.
The fair value of the Warrants totaled $21.3 million as of the date of issuance and was recorded as along-term liability, with a corresponding discount to the carrying value of the Term Loan. On July 23, 2010,the stockholders approved the shares of common stock to be issued upon exercise of the B-Warrants. Thelong-term liability associated with the Warrants was marked-to-market as of the date of the stockholderapproval resulting in an $8.3 million gain during the fourth quarter of fiscal year 2010. The remainingamount of $13.0 million was reclassified to stockholders’ investment and is included in additional paid-incapital in the accompanying consolidated balance sheet. Issuance costs attributable to the Warrantstotaling $1.7 million were expensed on the date of issuance. As indicated above, the remainingunamortized discount as of September 24, 2010 totaling $20.3 million associated with the Warrants wascharged to interest expense during the first quarter of fiscal year 2011.
Private Label Credit Card Programs
On May 7, 2010, we entered into a five year Private Label Credit Card Program Agreement (the ‘‘TDAgreement’’) with TD Financing Services Inc. (‘‘TDFS’’) to provide financing for our Canadian customersto purchase merchandise through private label credit cards beginning July 1, 2010. In addition, TDFS
28

provides credit insurance for our customers and receives 40 percent of the net profits, as defined, and theremaining 60 percent is paid to us. The TD Agreement replaced the agreement with Citi CardsCanada Inc., which expired on June 30, 2010. The TD Agreement will automatically renew for successiveone-year periods, unless either party notifies the other in writing of its intent not to renew. The agreementmay be terminated at any time during the 90-day period following the end of a program year in the eventthat credit sales are less than $50 million in the immediately preceding year. If TDFS terminates theagreement as a result of a breach by us, we will be required to pay a termination fee of $1.0 million in thefirst year, $0.7 million in the second year or $0.3 million in the third year. As of July 31, 2011, credit salesexceeded the $50 million threshold for the program year ending June 30, 2011. Our customers use ourprivate label credit card to pay for approximately 21 percent of purchases in Canada.
On September 23, 2010, we entered into a five year agreement to amend and restate various terms ofthe Merchant Services Agreement (‘‘MSA’’) with Citibank (South Dakota), N.A. (‘‘Citibank’’), to providefinancing for our U.S. customers to purchase merchandise through private label credit cards beginningOctober 1, 2010. The MSA will automatically renew for successive two-year periods, unless either partynotifies the other in writing of its intent not to renew. In addition, the MSA can be terminated by eitherparty upon certain breaches by the other party and also can be terminated by Citibank if our net creditcard sales during any twelve-month period are less than $315 million or if net card sales during a twelve-month period decrease by 20 percent or more from the prior twelve-month period. After any termination,we may purchase or be obligated to purchase the credit card portfolio upon termination with Citibank as aresult of insolvency, material breaches of the MSA and violations of applicable law related to the creditcard program. As of July 31, 2011, we were in compliance with all covenants under the MSA. We will berequired to meet the net credit card sales threshold of $315 million beginning October 1, 2011, which weexpect to exceed. Our customers use our private label credit card to pay for approximately 32 percent ofpurchases in the U.S.
Lease Terminations
In connection with the sale of the Bailey Banks & Biddle brand in November 2007, we assigned thebrand’s store operating leases to the buyer, Finlay Fine Jewelry Corporation (‘‘Finlay’’). As a condition ofthis assignment, we remained contingently liable for the leases for the remainder of the respective leaseterms, which generally ranged from fiscal year 2009 through fiscal year 2017. On August 5, 2009, Finlayfiled for Chapter 11 bankruptcy protection and subsequently decided to liquidate. We recorded a$23.2 million charge during the fourth quarter of fiscal year 2009 associated with all 45 Bailey Banks &Biddle locations. The remaining liability for base rent payments under the remaining three leases whichhave not yet been settled as of July 31, 2011 totaled approximately $2.5 million. As of July 31, 2011, theremaining lease reserve associated with the Bailey Banks & Biddle lease obligations totaled $1.2 million.During the year ended July 31, 2011, we made payments totaling $5.4 million. In addition, the lease reservewas increased by $0.9 million as a result of changes in assumptions used to calculate the reserve.
During fiscal 2011 and 2010, we recorded lease termination charges related to certain Fine Jewelrystores closed in fiscal year 2009. As of July 31, 2011, the remaining lease reserve associated with the storeclosures totaled $0.6 million. During fiscal year 2011, we made payments totaling $4.9 million related tothe closures.
We were not able to finalize agreements with all of the landlords, and certain landlords have madedemands, or initiated legal proceedings to collect the remaining base rent payments associated with theterminated leases. While we believe we have made reasonable estimates and assumptions to record thesecharges, it is possible that a material change could occur and we may be required to record additionalcharges.
29

Capital Expenditures
During fiscal year 2011, we invested approximately $0.4 million in capital expenditures to convertthree stores to different nameplates and open one store in Fine Jewelry. We also opened seven stores inKiosk Jewelry. We invested approximately $8.4 million to remodel, relocate and refurbish 15 stores in FineJewelry and to complete store enhancement projects. We also invested $6.5 million in infrastructure,primarily related to our information technology. We anticipate investing approximately $30 million incapital expenditures in fiscal year 2012, including approximately $22 million in existing storerefurbishments and approximately $8 million in capital investments related to information technologyinfrastructure and support operations.
Contractual Obligations
Aggregate information about our contractual obligations as of July 31, 2011 is presented in thefollowing table (in millions):
Payments Due by Period
Less than More thanTotal 1 Year 1 - 3 Years 4 - 5 Years 5 Years Other
Long-term debt . . . . . . . . . . . . . . . . . . . . $ 395 $ — $255 $140 $ — $—Interest on Senior Secured Term Loan(a) . 79 21 42 16 — —Operating leases(b) . . . . . . . . . . . . . . . . . 686 170 252 160 104 —Operations services agreement(c) . . . . . . . 37 7 15 15 — —Other long-term liabilities(d) . . . . . . . . . . 6 — — — — 6
Total . . . . . . . . . . . . . . . . . . . . . . . . . . $1,203 $198 $564 $331 $104 $ 6
(a) The Senior Secured Term Loan requires fixed quarterly interest payments of 15 percent per annum on theoutstanding principal balance. This amount does not reflect any interest related to the revolving creditagreement, which would be based on the current effective rate, which was 3.7 percent as of July 31, 2011, andassumes no prepayments. In fiscal year 2011, we paid $10.4 million of interest related to our revolving creditagreement.
(b) Operating lease obligations relate to minimum payments due under store lease agreements. Most of the storeoperating leases provide for the payment of base rentals plus real estate taxes, insurance, common areamaintenance fees and merchant association dues. Excluded from our operating lease commitments are amountsrelated to real estate taxes, insurance, common area maintenance fees and merchant association dues. Suchamounts were approximately 22 percent of base rentals for the year ended July 31, 2011.
(c) Operations services agreement is with a third party for the management of our client server systems, Local AreaNetwork operations, Wide Area Network management and technical support.
(d) Other long-term liabilities reflect loss reserves related to credit insurance. We have reflected these paymentsunder ‘‘Other,’’ as the timing of these future payments is dependent on the actual processing of the claims.
Not included in the table above as contractual obligations are our obligations under employmentagreements and ordinary course purchase orders for merchandise, including certain merchandise onconsignment.
Recent Accounting Pronouncement
In October 2009, the Financial Accounting Standards Board (‘‘FASB’’) issued Accountings StandardsUpdate 2009-13, Multi-Deliverable Revenue Arrangements, (‘‘ASU 2009-13’’). ASU 2009-13 amends thecriteria under Accounting Standards Codification (ASC) Topic 605, Revenue Recognition, for separatingconsideration in multi-deliverable revenue arrangements. Under previous guidance, if vendor-specificobjective evidence or third-party evidence of fair value were not available, the arrangement was accounted
30

for as a single unit of accounting. The amendment allows management to estimate the selling price if eithervendor-specific objective evidence or third-party evidence are unavailable. As a result of the amendment,multi-deliverable arrangements are separated in more circumstances than under the previous guidance.We adopted this standard effective August 1, 2010. There was not a material impact from the adoption ofthis guidance on our consolidated financial statements.
In January 2010, the FASB issued Accounting Standards Update 2010-06, Improving Disclosures aboutFair Value Measurements (‘‘ASU 2010-06’’). ASU 2010-06 provides more robust disclosures about thetransfers between Levels 1 and 2, the activity in Level 3 fair value measurements and clarifies the level ofdisaggregation and disclosure related to the valuation techniques and inputs used. The new disclosures areeffective for interim and annual reporting periods beginning after December 15, 2009, except for theLevel 3 activity disclosures, which are effective for fiscal years beginning after December 15, 2010. Weadopted this standard, except for the Level 3 disclosures, effective February 1, 2010. There was not amaterial impact from the adoption of this guidance on our consolidated financial statements.
In May 2011, the FASB issued Accounting Standards Update 2011-04, Amendments to AchieveCommon Fair Value Measurement and Disclosure Requirements in U.S. GAAP and IFRSs (‘‘ASU 2011-04’’).ASU 2011-04 amends ASC Topic 820, Fair Value Measurements and Disclosures, to improve comparabilityof fair value measurements presented and disclosed in financial statements prepared in accordance withU.S. GAAP and International Financial Reporting Standards. The amendment is effective during interimand annual periods beginning after December 15, 2011. We do not expect a material impact from theadoption of this guidance on our consolidated financial statements.
In June 2011, the FASB issued Accounting Standards Update 2011-05, Presentation of ComprehensiveIncome (‘‘ASU 2011-05’’). ASU 2011-05 eliminates the option to present components of othercomprehensive income as part of the statement of changes in stockholders’ equity. The amendment willinstead require that all nonowner changes in stockholders’ equity be presented either in a singlecontinuous statement, referred to as the statement of comprehensive income, or in two separate butconsecutive statements. The amendment is effective for fiscal years beginning after December 15, 2011. Wedo not expect a material impact from the adoption of this guidance on our consolidated financialstatements.
Off-Balance Sheet Arrangements
We have no material off-balance sheet arrangements as of July 31, 2011.
Critical Accounting Policies and Estimates
Our significant accounting policies are disclosed in Note 1 of our consolidated financial statements.The following discussion addresses our most critical accounting policies, which are those that are bothimportant to the portrayal of our financial condition and results of operations and that require significantjudgment or use of complex estimates.
Merchandise Inventories. Merchandise inventories are stated at the lower of cost or market.Substantially all U.S. inventories represent finished goods which are valued using the LIFO retail inventorymethod. Merchandise inventory of Peoples Jewellers and Mappins Jewellers of Canada is valued using theretail inventory method. Under the retail method, inventory is segregated into categories of merchandisewith similar characteristics at its current average retail selling value. The determination of inventory at costand the resulting gross margins are calculated by applying an average cost-to-retail ratio to the retail valueof inventory. At the end of fiscal year 2011, approximately four percent and 15 percent of our totalinventory represented raw materials and finished goods related to our manufacturing program anddistribution center, respectively. This inventory is valued at the weighted-average cost of the items.
31

We are required to determine the LIFO cost on an interim basis by estimating annual inflation trends,annual purchases and ending inventory levels for the fiscal year. Actual annual inflation rates andinventory balances as of the end of any fiscal year may differ from interim estimates. We apply internallydeveloped indices that we believe accurately and consistently measure inflation or deflation in thecomponents of our merchandise (i.e., diamonds, gold and other metals and precious stones) and ouroverall merchandise mix. We believe our internally developed indices more accurately reflect inflation ordeflation in our own prices than the U.S. Bureau of Labor Statistics producer price indices or otherpublished indices.
We also reduce our inventory valuation for discontinued, slow-moving and damaged inventory. Thiswrite-down of inventory is equal to the difference between the cost of inventory and its estimated marketvalue based upon assumptions of targeted inventory turn rates, future demand, management strategy andmarket conditions. If actual market conditions are less favorable than those projected by management, orif management strategy changes, additional inventory write-downs may be required and, in the case of amajor change in strategy or downturn in market conditions, such write-downs could be significant.
Shrinkage is estimated for the period from the last inventory date to the end of the fiscal year on astore-by-store basis. Such estimates are based on experience and the shrinkage results from the lastphysical inventory. Physical inventories are taken at least once annually for all store locations and for thedistribution centers. The shrinkage rate from the most recent physical inventory, in combination withhistorical experience and significant changes in physical inventory results could impact our shrinkagereserve.
Impairment of Long-Lived Assets. Long-lived assets are periodically reviewed for impairment bycomparing the carrying value of the assets with their estimated undiscounted future cash flows. If theevaluation indicates that the carrying amount of the asset may not be recoverable, the potentialimpairment is measured based on a projected discounted cash flow method using a discount rate that isconsidered to be commensurate with the risk inherent in our current business model. Assumptions aremade with respect to cash flows expected to be generated by the related assets based upon updatedprojections. Any changes in key assumptions, particularly store performance or market conditions, couldresult in an unanticipated impairment charge. For instance, in the event of a major market downturn oradverse developments within a particular market or portion of our business, individual stores may becomeunprofitable, which could result in a write-down of the carrying value of the assets located in those stores.Any impairment would be recognized in operating results.
Goodwill. In accordance with ASC 350, Intangibles–Goodwill and Other, we test goodwill forimpairment annually, at the end of our second quarter, or more frequently if events occur which indicate apotential reduction in the fair value of a reporting unit’s net assets below its carrying value. We calculateestimated fair value using the present value of future cash flows expected to be generated using weighted-average cost of capital, terminal values and updated financial projections. As of the date of the test, the fairvalue of the Peoples Jewellers and Piercing Pagoda reporting units would have to decline by more than18 percent and 60 percent, respectively, to be considered for impairment. If our actual results are notconsistent with estimates and assumptions used to calculate fair value, we may be required to recognizeadditional goodwill impairments.
Revenue Recognition. We recognize revenue in accordance with ASC 605, Revenue Recognition.Revenue related to merchandise sales, which is approximately 92 percent of total revenues, is recognized atthe time of the sale, reduced by a provision for sales returns. The provision for sales returns is based onhistorical evidence of our return rate. Repair revenues are recognized when the service is complete and themerchandise is delivered to the customers. Premium revenues from our insurance businesses relate tocredit insurance policies sold to customers who purchase our merchandise under the proprietary creditprogram. Insurance premiums are recognized over the coverage period.
32

Revenues related to lifetime warranties are recognized on a straight-line basis over an estimated lifeof five years, while revenues related to the optional theft protection are recognized over the two-yearcontract period. In addition, we offer one-year warranties to our Kiosk Jewelry customers that arerecognized over the 12-month contract period. ASC 605-20 requires recognition of revenue related toextended warranty products in proportion to the costs expected to be incurred if sufficient historicalevidence exists to demonstrate the pattern of expected costs. We are recognizing revenues related towarranties on a straight-line basis as a result of our determination that we currently have insufficienthistorical evidence to recognize revenue in proportion to the costs. Once the appropriate level of historicalevidence is obtained, we believe revenue will be recognized on an accelerated basis which could have amaterial impact on our results of operations.
Self-Insurance. We are self-insured for certain losses related to general liability, workers’compensation and medical claims. Our liability represents an estimate of the ultimate cost of claimsincurred as of the balance sheet dates. The estimated liability is not discounted and is established basedupon analysis of historical data and actuarial estimates. While we believe these estimates are reasonablebased on the information currently available, if actual trends, including the severity or frequency of claims,medical cost inflation, or fluctuations in premiums differ from our estimates, our results of operationscould be impacted.
Other Reserves. We are involved in a number of legal and governmental proceedings as part of thenormal course of business. Reserves are established based on management’s best estimates of our potentialliability in these matters. These estimates have been developed in consultation with in-house and outsidecounsel and are based on a combination of litigation and settlement strategies. In addition, from time totime we close stores prior to the expiration of the lease term which requires us to record reservesassociated with the leases based on the present value of the remaining lease rentals, including commonarea maintenance and other charges, reduced by estimated sublease rentals that could reasonably beobtained. If our estimates and assumptions used to record these charges change, we may be required torecord additional charges.
Income taxes are estimated for each jurisdiction in which we operate. This involves assessing thecurrent tax exposure together with temporary differences resulting from differing treatment of items fortax and financial statement accounting purposes. Any resulting deferred tax assets are evaluated forrecoverability based on estimated future taxable income. To the extent that recovery is deemed not likely, avaluation allowance is recorded.
ITEM 7A. QUANTITATIVE AND QUALITATIVE DISCLOSURES ABOUT MARKET RISK
We are exposed to market risk from changes in interest rates, which may adversely affect our financialposition, results of operations and cash flows. We do not use derivative financial instruments for trading orother speculative purposes and are not party to any leveraged financial instruments.
The investments of our insurance subsidiaries, primarily stocks and bonds, had an approximate marketvalue at July 31, 2011 of $30.4 million.
Our Senior Secured Term Loan bears interest at a fixed rate of 15 percent and would not be affectedby interest rate changes. Future and existing borrowings under our revolving credit agreement would beaffected by interest rate changes. As of July 31, 2011, we had borrowings of $255 million under ourrevolving credit agreement. A one percent increase in the interest rate would increase annual interestexpense by approximately $3 million. The outstanding principal of our revolving credit agreement andSenior Secured Term Loan approximates fair value as of July 31, 2011.
Inflation. Substantially all U.S. inventories represent finished goods, which are valued using thelast-in, first-out (‘‘LIFO’’) retail inventory method. We are required to determine the LIFO cost on aninterim basis by estimating annual inflation trends, annual purchases and ending inventory. The inflation
33

rates pertaining to merchandise inventories, especially as they relate to gold, silver and diamond costs, areprimary components in determining our LIFO inventory. As a result of recent commodity cost increases,we have recorded LIFO charges in cost of sales totaling $17.0 million and $5.7 million during the fiscalyears ended July 31, 2011 and 2010, respectively. It is likely that the increase in commodity prices willcontinue to result in higher merchandise costs, which could materially affect us in the future.
Commodity Risk. Our results are subject to fluctuations in the underlying cost of diamonds, gold, silverand other metals which are key raw material components of the products sold by us. We principally addresscommodity risk through retail price point adjustments.
Foreign Currency Risk. We are not subject to significant gains or losses as a result of currencyfluctuations because most of our purchases are U.S. dollar-denominated. However, our Canadianoperations expose us to market risk from currency rate exposures, which may adversely affect our results ofoperations. During the fiscal year ended July 31, 2011 and 2010, the average Canadian currency rateappreciated by approximately six percent and 12 percent, respectively, relative to the U.S. dollar. Theappreciation in the Canadian currency rate for the year ended July 31, 2011 resulted in a $15.6 millionincrease in reported revenues, offset by an increase in reported cost of sales and selling, general andadministrative expenses of $7.5 million and $6.7 million, respectively. The appreciation in the Canadiancurrency rate for the year ended July 31, 2010 resulted in a $27.9 million increase in reported revenues,offset by an increase in reported cost of sales and selling, general and administrative expenses of$13.1 million and $11.0 million, respectively. In addition, as a result of the appreciation in the Canadiandollar, we recorded gains associated with the settlement of Canadian accounts payable totaling $1.4 millionand $2.8 million during the fiscal years ended July 31, 2011 and 2010, respectively.
ITEM 8. FINANCIAL STATEMENTS AND SUPPLEMENTARY DATA
We refer you to the Index to Consolidated Financial Statements attached hereto on page 40 for alisting of all financial statements. The consolidated financial statements are included on pages F-1 throughF-31. We incorporate these consolidated financial statements in this document by reference.
ITEM 9. CHANGES IN AND DISAGREEMENTS WITH ACCOUNTANTS ON ACCOUNTING ANDFINANCIAL DISCLOSURE
Not applicable.
ITEM 9A. CONTROLS AND PROCEDURES
Disclosure Controls and Procedures
Under the supervision and with the participation of our management, including our Chief ExecutiveOfficer and Chief Financial Officer, we have evaluated the effectiveness of our disclosure controls andprocedures as of the end of the period covered by this report. Based on that evaluation, the ChiefExecutive Officer and Chief Financial Officer have concluded that these disclosure controls andprocedures are effective in enabling us to record, process, summarize and report information required tobe included in the Company’s periodic SEC filings within the required time period, and that suchinformation is accumulated and communicated to the Company’s management, including the ChiefExecutive Officer and Chief Financial Officer, to allow timely decisions regarding required disclosure.
Our Management’s Report on Internal Control Over Financial Reporting is included on page F-1 ofthis Annual Report on Form 10-K. The report of Ernst & Young LLP, our independent registered publicaccounting firm, regarding the effectiveness of our internal control over financial reporting is included onpage F-3 of this Annual Report on Form 10-K.
34

Changes in Internal Control over Financial Reporting
There have been no changes in our internal controls over financial reporting during the quarter endedJuly 31, 2011 that have materially affected, or are reasonably likely to materially affect, our internal controlover financial reporting.
ITEM 9B. OTHER INFORMATION
Not applicable.
35
PART III
ITEM 10. DIRECTORS, EXECUTIVE OFFICERS AND CORPORATE GOVERNANCE
The information set forth under the headings ‘‘Proposal No. 1: Election of Directors,’’ ‘‘CorporateGovernance,’’ ‘‘Related Party Transactions,’’ and ‘‘Section 16(a) Beneficial Ownership ReportingCompliance’’ in our definitive Proxy Statement for the 2011 Annual Meeting of Stockholders isincorporated herein by reference.
ITEM 11. EXECUTIVE COMPENSATION
The information set forth under the headings ‘‘Compensation Discussion and Analysis,’’‘‘Compensation Committee Report,’’ ‘‘Executive Compensation,’’ ‘‘Compensation Committee Interlocksand Insider Participation,’’ ‘‘Director Compensation’’ and ‘‘Other Corporate Governance Policies-RiskManagement Related to Compensation Policies and Practices’’ in our definitive Proxy Statement for the2011 Annual Meeting of Stockholders is incorporated herein by reference.
ITEM 12. SECURITY OWNERSHIP OF CERTAIN BENEFICIAL OWNERS AND MANAGEMENTAND RELATED STOCKHOLDER MATTERS
The information set forth under the headings ‘‘Outstanding Voting Securities of the Company andPrincipal Holders Thereof’’ and ‘‘Equity Compensation Plan Information’’ in our definitive ProxyStatement for the 2011 Annual Meeting of Stockholders is incorporated herein by reference.
ITEM 13. CERTAIN RELATIONSHIPS AND RELATED TRANSACTIONS, AND DIRECTORINDEPENDENCE
The information set forth under the headings ‘‘Independence of Board of Directors’’ and ‘‘RelatedParty Transactions’’ in our definitive Proxy Statement for the 2011 Annual Meeting of Stockholders isincorporated herein by reference.
ITEM 14. PRINCIPAL ACCOUNTANT FEES AND SERVICES
The information set forth under the heading ‘‘Independent Registered Public Accounting Firm’’ inour definitive Proxy Statement for the 2011 Annual Meeting of Stockholders is incorporated herein byreference.
36

PART IV
ITEM 15. EXHIBITS AND FINANCIAL STATEMENTS SCHEDULES
The following documents are filed as part of this report.
1. Financial Statements
We make reference to the Index to Consolidated Financial Statements attached to this document onpage 40 for a listing of all financial statement documents included on pages F-1 through F-31.
2. Financial Statement Schedules
All other financial statements and financial statement schedules for which provision is made in theapplicable accounting regulation of the SEC are not required under the related instructions, are notmaterial or are not applicable and, therefore, have been omitted or are included in the consolidatedfinancial statements or notes thereto.
3. Exhibits
Each management contract or compensation plan required to be filed as an exhibit is identified by anasterisk (*).
The filings referenced for incorporation byExhibit reference are Zale Corporation filingsNumber Description of Exhibit (File No. 1-04129) unless otherwise noted
3.1a Restated Certificate of Incorporation of Zale October 31, 2001 Form 10-Q, Exhibit 3.1Corporation
3.1b Certificate of Amendment to Restated October 31, 2004 Form 10-Q, Exhibit 3.1Certificate of Incorporation of ZaleCorporation
3.2 Bylaws of Zale Corporation June 20, 2008 Form 8-K, Exhibit 3.1
4.1 Amended and Restated Credit Agreement, April 30, 2010 Form 10-Q, Exhibit 10.5dated as of May 10, 2010
4.2a Credit Agreement, dated as of May 10, 2010 April 30, 2010 Form 10-Q, Exhibit 10.6
4.2b First Amendment to Credit Agreement, July 31, 2010 Form 10-K, Exhibit 4.2bdated as of September 24, 2010
4.3 Warrant and Registration Rights Agreement, April 30, 2010 Form 10-Q, Exhibit 10.7dated as of May 10, 2010
4.4a Intercreditor Agreement, dated as of April 30, 2010 Form 10-Q, Exhibit 10.8May 10, 2010
4.4b First Amendment to Intercreditor July 31, 2010 Form 10-K, Exhibit 4.4bAgreement, dated as of September 24, 2010
4.5 Form of Assignment and Acceptance April 30, 2011 Form 10-Q, Exhibit 4.1Agreement, dated as of April 21, 2011
10.1* Zale Corporation Savings and Investment July 31, 2006 Form 10-K, Exhibit 10.1Plan, as amended
10.2* Form of Indemnification Agreement July 31, 2009 Form 10-K, Exhibit 10.2
37

The filings referenced for incorporation byExhibit reference are Zale Corporation filingsNumber Description of Exhibit (File No. 1-04129) unless otherwise noted
10.3* Zale Corporation Omnibus Stock Incentive July 31, 2000 Form 10-K, Exhibit 10.3aPlan
10.4a* Zale Corporation 2003 Stock Incentive Plan, July 31, 2006 Form 10-K, Exhibit 10.4aas amended
10.4b* Form of Incentive Stock Option Award July 31, 2008 Form 10-K, Exhibit 10.4bAgreement
10.4c* Form of Non-qualified Stock Option Award July 31, 2008 Form 10-K, Exhibit 10.4cAgreement
10.4d* Form of Restricted Stock Award Agreement July 31, 2008 Form 10-K, Exhibit 10.4d
10.4e* Form of Time-Vesting Restricted Stock Unit July 31, 2008 Form 10-K, Exhibit 10.4eAward Agreement
10.4f* Form of Performance-Based Restricted Stock July 31, 2008 Form 10-K, Exhibit 10.4fUnit Award Agreement
10.5* Outside Directors’ 1995 Stock Option Plan July 31, 2001 Form 10-K, Exhibit 10.3c
10.6a* Non-Employee Director Equity November 24, 2008 Form 8-K, Exhibit 10.1Compensation Plan
10.6b* Amendment to Zale Corporation December 24, 2009 Form 8-K, Exhibit 10.1Non-Employee Director EquityCompensation Plan
10.6c* Form of Stock Option Award Agreement November 17, 2005 Form 8-K, Exhibit 10.2
10.6d* Form of Restricted Stock Award Agreement November 17, 2005 Form 8-K, Exhibit 10.3
10.6e* Form of Restricted Stock Unit Agreement November 24, 2008 Form 8-K, Exhibit 10.2
10.6f* Form of Deferred Stock Unit Agreement November 24, 2008 Form 8-K, Exhibit 10.3
10.7* Form of Amended and Restated December 24, 2008 Form 8-K, Exhibit 10.2Employment Security Agreement withExecutive Vice Presidents
10.8* Form of Employment Security Agreement April 30, 2008 Form 10-Q, Exhibit 10.7for Corporate Senior Vice Presidents
10.9* Form of Employment Security Agreement April 30, 2008 Form 10-Q, Exhibit 10.7for Brand Senior Vice Presidents
10.10* Amended and Restated Employment Filed herewithSecurity Agreement for Theo Killion
10.11* Employment Security Agreement with April 30, 2009 Form 10-Q, Exhibit 10.2Matthew W. Appel
10.12* Offer Letter to Richard Lennox July 31, 2010 Form 10-K, Exhibit 10.12
10.13* Separation and Release Agreement with February 12, 2010 Form 8-K, Exhibit 10.3William Acevedo
10.14a* Amended and Restated Employment December 24, 2008 Form 8-K, Exhibit 10.1Agreement with Neal Goldberg
38

The filings referenced for incorporation byExhibit reference are Zale Corporation filingsNumber Description of Exhibit (File No. 1-04129) unless otherwise noted
10.14b* Separation and Release Agreement with February 12, 2010 Form 8-K, Exhibit 10.4Neal Goldberg
10.15* Separation and Release Agreement with July 31, 2010 Form 10-K, Exhibit 10.15Mary Kwan
10.16* Base Salaries and Target Bonus for the Filed herewithNamed Executives Officers
10.17* Zale Corporation Bonus Plan July 31, 2008 Form 10-K, Exhibit 10.8
10.18a Lease Agreement for Corporate July 31, 1996 Form 10-K, Exhibit 10.11Headquarters
10.18b First Amendment to Lease Agreement for July 31, 1996 Form 10-K, Exhibit 10.11aCorporate Headquarter
10.18c Second Amendment to Lease Agreement for July 31, 2004 Form 10-K, Exhibit 10.7cCorporate Headquarters
10.19 Master Agreement for Information July 31, 2006 Form 10-K, Exhibit 10.18Technology Services between ZaleDelaware, Inc. and ACS CommercialSolutions, Inc., dated as of August 1, 2005
10.20 Private Label Credit Card Program May 12, 2010 Form 8-K, Exhibit 10.1Agreement
10.21 Amended and Restated Merchant Services October 31, 2010 Form 10-Q, Exhibit 10.1Agreement with Citibank (South Dakota),N.A.
14 Code of Business Conduct and Ethics July 31, 2009 Form 10-K, Exhibit 14
21 Subsidiaries of the Registrant July 31, 2007 Form 10-K, Exhibit 21
23.1 Consent of Ernst & Young LLP Filed herewith
31.1 Rule 13a-14(a) Certification of Chief Filed herewithExecutive Officer
31.2 Rule 13a-14(a) Certification of Chief Filed herewithFinancial Officer
32.1 Section 1350 Certification of Chief Executive Filed herewithOfficer
32.2 Section 1350 Certification of Chief Financial Filed herewithOfficer
99.1 Audit Committee Charter July 31, 2004 Form 10-K, Exhibit 99.1
99.2 Compensation Committee Charter July 31, 2006 Form 10-K, Exhibit 99.2
99.3 Nominating/Corporate Governance July 31, 2004 Form 10-K Exhibit 99.3Committee Charter
39

INDEX TO CONSOLIDATED FINANCIAL STATEMENTS
Page
Management’s Report on Internal Control Over Financial Reporting . . . . . . . . . . . . . . . . . . . . . F-1Reports of Independent Registered Public Accounting Firm . . . . . . . . . . . . . . . . . . . . . . . . . . . . F-2Consolidated Statements of Operations . . . . . . . . . . . . . . . . . . . . . . . . . . . . . . . . . . . . . . . . . . F-4Consolidated Balance Sheets . . . . . . . . . . . . . . . . . . . . . . . . . . . . . . . . . . . . . . . . . . . . . . . . . . F-5Consolidated Statements of Cash Flows . . . . . . . . . . . . . . . . . . . . . . . . . . . . . . . . . . . . . . . . . . F-6Consolidated Statements of Stockholders’ Investment . . . . . . . . . . . . . . . . . . . . . . . . . . . . . . . . F-7Notes to Consolidated Financial Statements . . . . . . . . . . . . . . . . . . . . . . . . . . . . . . . . . . . . . . . F-8
40

MANAGEMENT’S REPORT ON INTERNAL CONTROL OVER FINANCIAL REPORTING
Our management is responsible for establishing and maintaining adequate internal control overfinancial reporting, as such term is defined in Rule 13a-15(f) promulgated under the Securities ExchangeAct of 1934, as amended. Under the supervision and with the participation of our management, includingour principal executive officer and principal financial officer, we conducted an evaluation of theeffectiveness of our internal control over financial reporting based on the framework in InternalControl–Integrated Framework issued by the Committee of Sponsoring Organizations of the TreadwayCommission (COSO). Based on our evaluation, our management concluded that our internal control overfinancial reporting was effective as of July 31, 2011. The effectiveness of our internal control over financialreporting was audited by Ernst & Young LLP, an independent registered public accounting firm, as statedin their report on page F-3.
/s/ THEO KILLION /s/ MATTHEW W. APPEL
Theo Killion Matthew W. AppelChief Executive Officer Chief Administrative OfficerSeptember 20, 2011 and Chief Financial Officer
September 20, 2011
F-1

REPORT OF INDEPENDENT REGISTERED PUBLIC ACCOUNTING FIRM
The Board of Directors and Stockholders of Zale Corporation:
We have audited the accompanying consolidated balance sheets of Zale Corporation and subsidiariesas of July 31, 2011 and 2010, and the related consolidated statements of operations, stockholders’investment, and cash flows for each of the three years in the period ended July 31, 2011. These financialstatements are the responsibility of the Company’s management. Our responsibility is to express anopinion on these financial statements based on our audits.
We conducted our audits in accordance with the standards of the Public Company AccountingOversight Board (United States). Those standards require that we plan and perform the audit to obtainreasonable assurance about whether the financial statements are free of material misstatement. An auditincludes examining, on a test basis, evidence supporting the amounts and disclosures in the financialstatements. An audit also includes assessing the accounting principles used and significant estimates madeby management, as well as evaluating the overall financial statement presentation. We believe that ouraudits provide a reasonable basis for our opinion.
In our opinion, the financial statements referred to above present fairly, in all material respects, theconsolidated financial position of Zale Corporation and subsidiaries at July 31, 2011 and 2010, and theconsolidated results of their operations and their cash flows for each of the three years in the period endedJuly 31, 2011, in conformity with U.S. generally accepted accounting principles.
We also have audited, in accordance with the standards of the Public Company Accounting OversightBoard (United States), Zale Corporation’s internal control over financial reporting as of July 31, 2011,based on criteria established in Internal Control-Integrated Framework issued by the Committee ofSponsoring Organizations of the Treadway Commission and our report dated September 20, 2011expressed an unqualified opinion thereon.
/s/ ERNST & YOUNG LLP
Dallas, TexasSeptember 20, 2011
F-2

REPORT OF INDEPENDENT REGISTERED PUBLIC ACCOUNTING FIRM
The Board of Directors and Stockholders of Zale Corporation:
We have audited Zale Corporation’s internal control over financial reporting as of July 31, 2011, basedon criteria established in Internal Control—Integrated Framework issued by the Committee of SponsoringOrganizations of the Treadway Commission (the COSO criteria). Zale Corporation’s management isresponsible for maintaining effective internal control over financial reporting, and for its assessment of theeffectiveness of internal control over financial reporting included in the accompanying Management’sReport on Internal Control over Financial Reporting. Our responsibility is to express an opinion on theCompany’s internal control over financial reporting based on our audit.
We conducted our audit in accordance with the standards of the Public Company AccountingOversight Board (United States). Those standards require that we plan and perform the audit to obtainreasonable assurance about whether effective internal control over financial reporting was maintained inall material respects. Our audit included obtaining an understanding of internal control over financialreporting, assessing the risk that a material weakness exists, testing and evaluating the design andoperating effectiveness of internal control based on the assessed risk, and performing such otherprocedures as we considered necessary in the circumstances. We believe that our audit provides areasonable basis for our opinion.
A company’s internal control over financial reporting is a process designed to provide reasonableassurance regarding the reliability of financial reporting and the preparation of financial statements forexternal purposes in accordance with generally accepted accounting principles. A company’s internalcontrol over financial reporting includes those policies and procedures that (1) pertain to the maintenanceof records that, in reasonable detail, accurately and fairly reflect the transactions and dispositions of theassets of the company; (2) provide reasonable assurance that transactions are recorded as necessary topermit preparation of financial statements in accordance with generally accepted accounting principles,and that receipts and expenditures of the company are being made only in accordance with authorizationsof management and directors of the company; and (3) provide reasonable assurance regarding preventionor timely detection of unauthorized acquisition, use, or disposition of the company’s assets that could havea material effect on the financial statements.
Because of its inherent limitations, internal control over financial reporting may not prevent or detectmisstatements. Also, projections of any evaluation of effectiveness to future periods are subject to the riskthat controls may become inadequate because of changes in conditions, or that the degree of compliancewith the policies or procedures may deteriorate.
In our opinion, Zale Corporation maintained, in all material respects, effective internal control overfinancial reporting as of July 31, 2011, based on the COSO criteria.
We also have audited, in accordance with the standards of the Public Company Accounting OversightBoard (United States), the consolidated balance sheets of Zale Corporation and subsidiaries as of July 31,2011 and 2010, and the related consolidated statements of operation, stockholders’ investment, and cashflows for each of the three years in the period ended July 31, 2011 of Zale Corporation and our reportdated September 20, 2011 expressed an unqualified opinion thereon.
/s/ ERNST & YOUNG LLP
Dallas, TexasSeptember 20, 2011
F-3
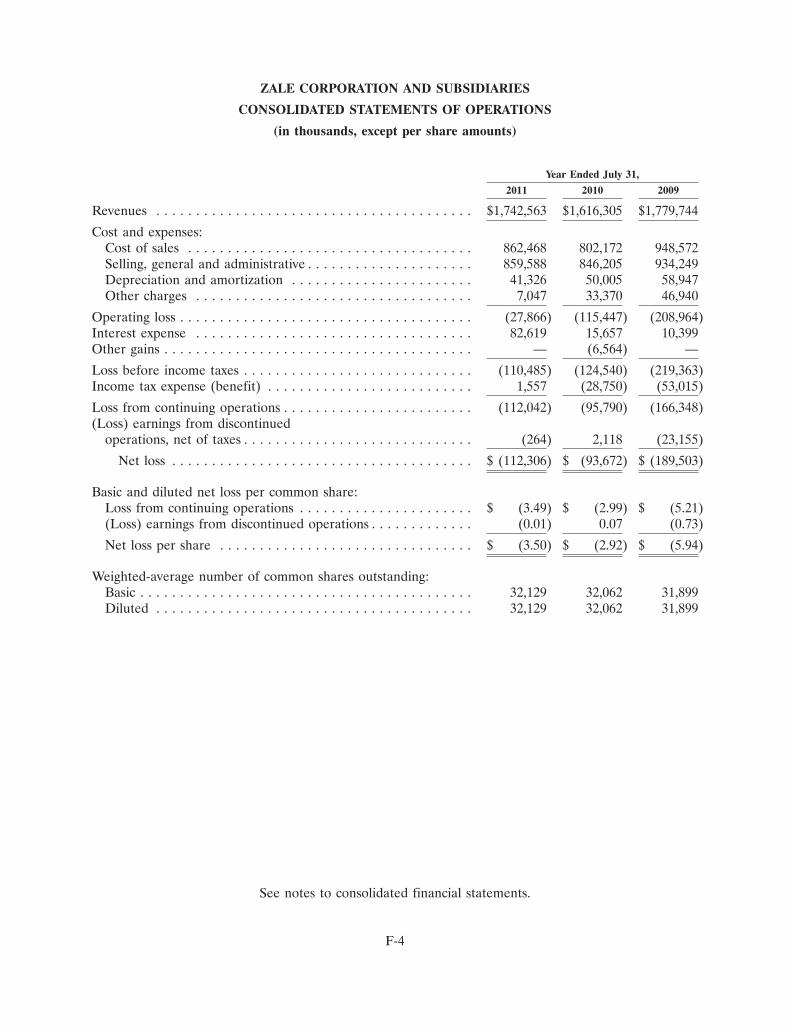
ZALE CORPORATION AND SUBSIDIARIES
CONSOLIDATED STATEMENTS OF OPERATIONS
(in thousands, except per share amounts)
Year Ended July 31,
2011 2010 2009
Revenues . . . . . . . . . . . . . . . . . . . . . . . . . . . . . . . . . . . . . . . . $1,742,563 $1,616,305 $1,779,744
Cost and expenses:Cost of sales . . . . . . . . . . . . . . . . . . . . . . . . . . . . . . . . . . . . 862,468 802,172 948,572Selling, general and administrative . . . . . . . . . . . . . . . . . . . . . 859,588 846,205 934,249Depreciation and amortization . . . . . . . . . . . . . . . . . . . . . . . 41,326 50,005 58,947Other charges . . . . . . . . . . . . . . . . . . . . . . . . . . . . . . . . . . . 7,047 33,370 46,940
Operating loss . . . . . . . . . . . . . . . . . . . . . . . . . . . . . . . . . . . . . (27,866) (115,447) (208,964)Interest expense . . . . . . . . . . . . . . . . . . . . . . . . . . . . . . . . . . . 82,619 15,657 10,399Other gains . . . . . . . . . . . . . . . . . . . . . . . . . . . . . . . . . . . . . . . — (6,564) —
Loss before income taxes . . . . . . . . . . . . . . . . . . . . . . . . . . . . . (110,485) (124,540) (219,363)Income tax expense (benefit) . . . . . . . . . . . . . . . . . . . . . . . . . . 1,557 (28,750) (53,015)
Loss from continuing operations . . . . . . . . . . . . . . . . . . . . . . . . (112,042) (95,790) (166,348)(Loss) earnings from discontinued
operations, net of taxes . . . . . . . . . . . . . . . . . . . . . . . . . . . . . (264) 2,118 (23,155)
Net loss . . . . . . . . . . . . . . . . . . . . . . . . . . . . . . . . . . . . . . $ (112,306) $ (93,672) $ (189,503)
Basic and diluted net loss per common share:Loss from continuing operations . . . . . . . . . . . . . . . . . . . . . . $ (3.49) $ (2.99) $ (5.21)(Loss) earnings from discontinued operations . . . . . . . . . . . . . (0.01) 0.07 (0.73)
Net loss per share . . . . . . . . . . . . . . . . . . . . . . . . . . . . . . . . $ (3.50) $ (2.92) $ (5.94)
Weighted-average number of common shares outstanding:Basic . . . . . . . . . . . . . . . . . . . . . . . . . . . . . . . . . . . . . . . . . . 32,129 32,062 31,899Diluted . . . . . . . . . . . . . . . . . . . . . . . . . . . . . . . . . . . . . . . . 32,129 32,062 31,899
See notes to consolidated financial statements.
F-4

ZALE CORPORATION AND SUBSIDIARIES
CONSOLIDATED BALANCE SHEETS
(in thousands, except per share amounts)
July 31,
2011 2010
ASSETSCurrent Assets:
Cash and cash equivalents . . . . . . . . . . . . . . . . . . . . . . . . . . . . . . . . . . . . $ 35,125 $ 26,235Merchandise inventories . . . . . . . . . . . . . . . . . . . . . . . . . . . . . . . . . . . . . 720,782 703,115Other current assets . . . . . . . . . . . . . . . . . . . . . . . . . . . . . . . . . . . . . . . . 49,811 41,964
Total current assets . . . . . . . . . . . . . . . . . . . . . . . . . . . . . . . . . . . . . . . 805,718 771,314
Property and equipment, net . . . . . . . . . . . . . . . . . . . . . . . . . . . . . . . . . . . . 141,751 173,359Goodwill . . . . . . . . . . . . . . . . . . . . . . . . . . . . . . . . . . . . . . . . . . . . . . . . . . 104,620 98,388Other assets . . . . . . . . . . . . . . . . . . . . . . . . . . . . . . . . . . . . . . . . . . . . . . . . 44,843 52,668Deferred tax asset . . . . . . . . . . . . . . . . . . . . . . . . . . . . . . . . . . . . . . . . . . . . 92,967 75,549
Total assets . . . . . . . . . . . . . . . . . . . . . . . . . . . . . . . . . . . . . . . . . . . . $1,189,899 $1,171,278
LIABILITIES AND STOCKHOLDERS’ INVESTMENTCurrent Liabilities:
Accounts payable and accrued liabilities . . . . . . . . . . . . . . . . . . . . . . . . . . $ 313,444 $ 317,922Deferred tax liability . . . . . . . . . . . . . . . . . . . . . . . . . . . . . . . . . . . . . . . . 92,721 70,033Current portion of long-term debt . . . . . . . . . . . . . . . . . . . . . . . . . . . . . . — 11,250
Total current liabilities . . . . . . . . . . . . . . . . . . . . . . . . . . . . . . . . . . . . . 406,165 399,205
Long-term debt, less current portion . . . . . . . . . . . . . . . . . . . . . . . . . . . . . . 395,454 284,684Other liabilities . . . . . . . . . . . . . . . . . . . . . . . . . . . . . . . . . . . . . . . . . . . . . 175,453 179,369
Commitments and contingencies
Stockholders’ Investment:Common stock, par value $0.01, 150,000 shares authorized; 54,732 shares
issued; 32,159 and 32,107 shares outstanding at July 31, 2011 and 2010,respectively . . . . . . . . . . . . . . . . . . . . . . . . . . . . . . . . . . . . . . . . . . . . . 488 488
Additional paid-in capital . . . . . . . . . . . . . . . . . . . . . . . . . . . . . . . . . . . . . 161,575 160,645Accumulated other comprehensive income . . . . . . . . . . . . . . . . . . . . . . . . 63,385 48,440Accumulated earnings . . . . . . . . . . . . . . . . . . . . . . . . . . . . . . . . . . . . . . . 451,704 564,010
677,152 773,583Treasury stock, at cost, 22,573 and 22,625 shares at July 31, 2011 and 2010,
respectively . . . . . . . . . . . . . . . . . . . . . . . . . . . . . . . . . . . . . . . . . . . . . . . (464,325) (465,563)
Total stockholders’ investment . . . . . . . . . . . . . . . . . . . . . . . . . . . . . . 212,827 308,020
Total liabilities and stockholders’ investment . . . . . . . . . . . . . . . . . . . . $1,189,899 $1,171,278
See notes to consolidated financial statements.
F-5

ZALE CORPORATION AND SUBSIDIARIES
CONSOLIDATED STATEMENTS OF CASH FLOWS
(in thousands)
Year Ended July 31,
2011 2010 2009
Cash Flows From Operating Activities:Net loss . . . . . . . . . . . . . . . . . . . . . . . . . . . . . . . . . . . . . . . . . . . $ (112,306) $ (93,672) $ (189,503)Adjustments to reconcile net loss to net cash (used in) provided by
operating activities:Non-cash interest . . . . . . . . . . . . . . . . . . . . . . . . . . . . . . . . . . . 34,580 3,380 684Depreciation and amortization . . . . . . . . . . . . . . . . . . . . . . . . . . 41,326 50,005 58,947Deferred taxes . . . . . . . . . . . . . . . . . . . . . . . . . . . . . . . . . . . . . 5,280 39 (61,014)Loss on disposition of property and equipment . . . . . . . . . . . . . . 1,431 1,005 2,663Impairment of property and equipment . . . . . . . . . . . . . . . . . . . 6,762 29,944 23,786Gain on warrants . . . . . . . . . . . . . . . . . . . . . . . . . . . . . . . . . . . — (8,315) —Goodwill impairment . . . . . . . . . . . . . . . . . . . . . . . . . . . . . . . . — — 5,020Stock-based compensation . . . . . . . . . . . . . . . . . . . . . . . . . . . . . 2,150 3,865 5,713Loss (earnings) from discontinued operations . . . . . . . . . . . . . . . 264 (2,118) 23,155Conversion of paid in kind interest to Senior Secured Term Loan . — 1,703 —
Changes in assets and liabilities:Merchandise inventories . . . . . . . . . . . . . . . . . . . . . . . . . . . . . . (8,071) 42,374 53,184Other current assets . . . . . . . . . . . . . . . . . . . . . . . . . . . . . . . . . (6,913) 10,103 53,759Other assets . . . . . . . . . . . . . . . . . . . . . . . . . . . . . . . . . . . . . . (1,982) 2,071 2,807Accounts payable and accrued liabilities . . . . . . . . . . . . . . . . . . . (3,462) 24,226 1,583Other liabilities . . . . . . . . . . . . . . . . . . . . . . . . . . . . . . . . . . . . (6,005) (12,288) 21,911
Net cash (used in) provided by operating activities . . . . . . . . . . . . . (46,946) 52,322 2,695
Cash Flows From Investing Activities:Payments for property and equipment . . . . . . . . . . . . . . . . . . . . (15,315) (14,650) (28,357)Purchase of available-for-sale investments . . . . . . . . . . . . . . . . . . (9,388) (2,959) (22,721)Proceeds from sales of available-for-sale investments . . . . . . . . . . 6,140 2,409 25,779
Net cash used in investing activities . . . . . . . . . . . . . . . . . . . . . . . . (18,563) (15,200) (25,299)
Cash Flows From Financing Activities:Borrowings under revolving credit agreement . . . . . . . . . . . . . . . 3,604,800 4,465,100 5,107,150Payments on revolving credit agreement . . . . . . . . . . . . . . . . . . . (3,514,800) (4,610,600) (5,122,955)Proceeds from Senior Secured Term Loan . . . . . . . . . . . . . . . . . . — 150,000 —Debt issuance costs . . . . . . . . . . . . . . . . . . . . . . . . . . . . . . . . . — (25,523) —Payments on Senior Secured Term Loan . . . . . . . . . . . . . . . . . . . (11,250) — —Proceeds from exercise of stock options . . . . . . . . . . . . . . . . . . . 67 — 6,211Excess tax benefit on stock options exercised . . . . . . . . . . . . . . . . — — 158
Net cash provided by (used in) financing activities . . . . . . . . . . . . . . 78,817 (21,023) (9,436)
Cash Flows Used in Discontinued Operations:Net cash used in operating activities of discontinued operations . . . (5,391) (15,395) —
Effect of exchange rate changes on cash . . . . . . . . . . . . . . . . . . . . 973 544 (4,315)
Net change in cash and cash equivalents . . . . . . . . . . . . . . . . . . . . 8,890 1,248 (36,355)Cash and cash equivalents at beginning of period . . . . . . . . . . . . . . 26,235 24,987 61,342
Cash and cash equivalents at end of period . . . . . . . . . . . . . . . . . . $ 35,125 $ 26,235 $ 24,987
See notes to consolidated financial statements.
F-6
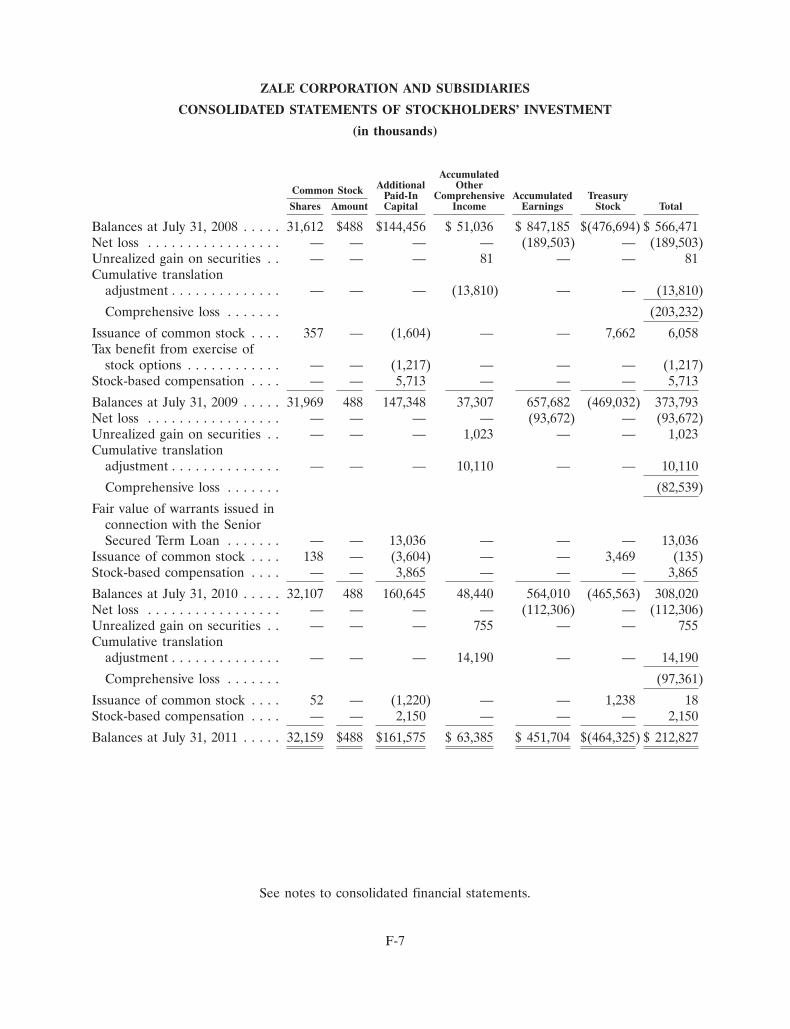
ZALE CORPORATION AND SUBSIDIARIES
CONSOLIDATED STATEMENTS OF STOCKHOLDERS’ INVESTMENT
(in thousands)
AccumulatedAdditional OtherCommon Stock Paid-In Comprehensive Accumulated Treasury
Shares Amount Capital Income Earnings Stock Total
Balances at July 31, 2008 . . . . . 31,612 $488 $144,456 $ 51,036 $ 847,185 $(476,694) $ 566,471Net loss . . . . . . . . . . . . . . . . . — — — — (189,503) — (189,503)Unrealized gain on securities . . — — — 81 — — 81Cumulative translation
adjustment . . . . . . . . . . . . . . — — — (13,810) — — (13,810)
Comprehensive loss . . . . . . . (203,232)
Issuance of common stock . . . . 357 — (1,604) — — 7,662 6,058Tax benefit from exercise of
stock options . . . . . . . . . . . . — — (1,217) — — — (1,217)Stock-based compensation . . . . — — 5,713 — — — 5,713
Balances at July 31, 2009 . . . . . 31,969 488 147,348 37,307 657,682 (469,032) 373,793Net loss . . . . . . . . . . . . . . . . . — — — — (93,672) — (93,672)Unrealized gain on securities . . — — — 1,023 — — 1,023Cumulative translation
adjustment . . . . . . . . . . . . . . — — — 10,110 — — 10,110
Comprehensive loss . . . . . . . (82,539)
Fair value of warrants issued inconnection with the SeniorSecured Term Loan . . . . . . . — — 13,036 — — — 13,036
Issuance of common stock . . . . 138 — (3,604) — — 3,469 (135)Stock-based compensation . . . . — — 3,865 — — — 3,865
Balances at July 31, 2010 . . . . . 32,107 488 160,645 48,440 564,010 (465,563) 308,020Net loss . . . . . . . . . . . . . . . . . — — — — (112,306) — (112,306)Unrealized gain on securities . . — — — 755 — — 755Cumulative translation
adjustment . . . . . . . . . . . . . . — — — 14,190 — — 14,190
Comprehensive loss . . . . . . . (97,361)
Issuance of common stock . . . . 52 — (1,220) — — 1,238 18Stock-based compensation . . . . — — 2,150 — — — 2,150
Balances at July 31, 2011 . . . . . 32,159 $488 $161,575 $ 63,385 $ 451,704 $(464,325) $ 212,827
See notes to consolidated financial statements.
F-7

ZALE CORPORATION AND SUBSIDIARIES
NOTES TO CONSOLIDATED FINANCIAL STATEMENTS
1. SUMMARY OF SIGNIFICANT ACCOUNTING POLICIES
Basis of Presentation. References to the ‘‘Company,’’ ‘‘we,’’ ‘‘us,’’ and ‘‘our’’ in this Form 10-K arereferences to Zale Corporation and its subsidiaries. We are, through our wholly owned subsidiaries, aleading specialty retailer of fine jewelry in North America. At July 31, 2011, we operated 1,163 specialtyretail jewelry stores and 666 kiosks located mainly in shopping malls throughout the United States ofAmerica, Canada and Puerto Rico.
We report our operations under three segments: Fine Jewelry, Kiosk Jewelry and All Other. FineJewelry is comprised of five brands, predominantly focused on the value-oriented consumer as our corecustomer target. Each brand specializes in fine jewelry and watches, with merchandise and marketingemphasis focused on diamond products. Zales Jewelers� is our national brand in the U.S. providingmoderately priced jewelry to a broad range of customers. Zales Outlet� operates in outlet malls andneighborhood power centers and capitalizes on Zale Jewelers’� national advertising and brand recognition.Gordon’s Jewelers� is a value-oriented regional jeweler. Peoples Jewellers�, Canada’s largest fine jewelryretailer, provides customers with an affordable assortment and an accessible shopping experience. MappinsJewellers� offers Canadian customers a broad selection of merchandise from engagement rings tofashionable and contemporary fine jewelry. Certain brands in Fine Jewelry have expanded their presencein the retail market through their e-commerce sites, www.zales.com, www.zalesoutlet.com,www.gordonsjewelers.com and www.peoplesjewellers.com.
Kiosk Jewelry operates under the brand names Piercing Pagoda�, Plumb Gold�, and Silver and GoldConnection� through mall-based kiosks and is focused on the opening price point customer. Kiosk Jewelryspecializes in gold, silver and non-precious metal products that capitalize on the latest fashion trends. InMay 2010, we expanded our presence in Kiosk Jewelry through our e-commerce site, www.pagoda.com.
All Other includes our insurance and reinsurance operations, which offer insurance coverageprimarily to our private label credit card customers.
The accompanying consolidated financial statements and related notes are for the twelve month fiscalperiods ended July 31, 2011 and 2010. We consolidate substantially all of our U.S. operations into ZaleDelaware, Inc. (‘‘ZDel’’), a wholly owned subsidiary of Zale Corporation. ZDel is the parent company forseveral subsidiaries, including four that are engaged primarily in providing credit insurance to our creditcustomers. We consolidate our Canadian retail operations into Zale International, Inc., which is a whollyowned subsidiary of Zale Corporation. All significant intercompany transactions have been eliminated.
Cash and Cash Equivalents. Cash and cash equivalents include cash on hand, deposits in banks andshort-term marketable securities at varying interest rates with original maturities of three months or less.Also included in cash equivalents are proceeds due from credit card transactions with settlement terms ofless than five days. The carrying amount approximates fair value due to the short-term maturity of thoseinstruments.
Merchandise Inventories. Merchandise inventories are stated at the lower of cost or market.Substantially all U.S. inventories represent finished goods which are valued using the last-in, first-out(‘‘LIFO’’) retail inventory method. Merchandise inventory of Peoples Jewellers and Mappins Jewellers ofCanada is valued using the retail inventory method. Under the retail method, inventory is segregated intocategories of merchandise with similar characteristics at its current average retail selling value. Thedetermination of inventory at cost and the resulting gross margins are calculated by applying an averagecost-to-retail ratio to the retail value of inventory. At the end of fiscal year 2011, approximately fourpercent and 15 percent of our total inventory represented raw materials and finished goods related to ourmanufacturing program and distribution center, respectively. These inventories are valued at the
F-8
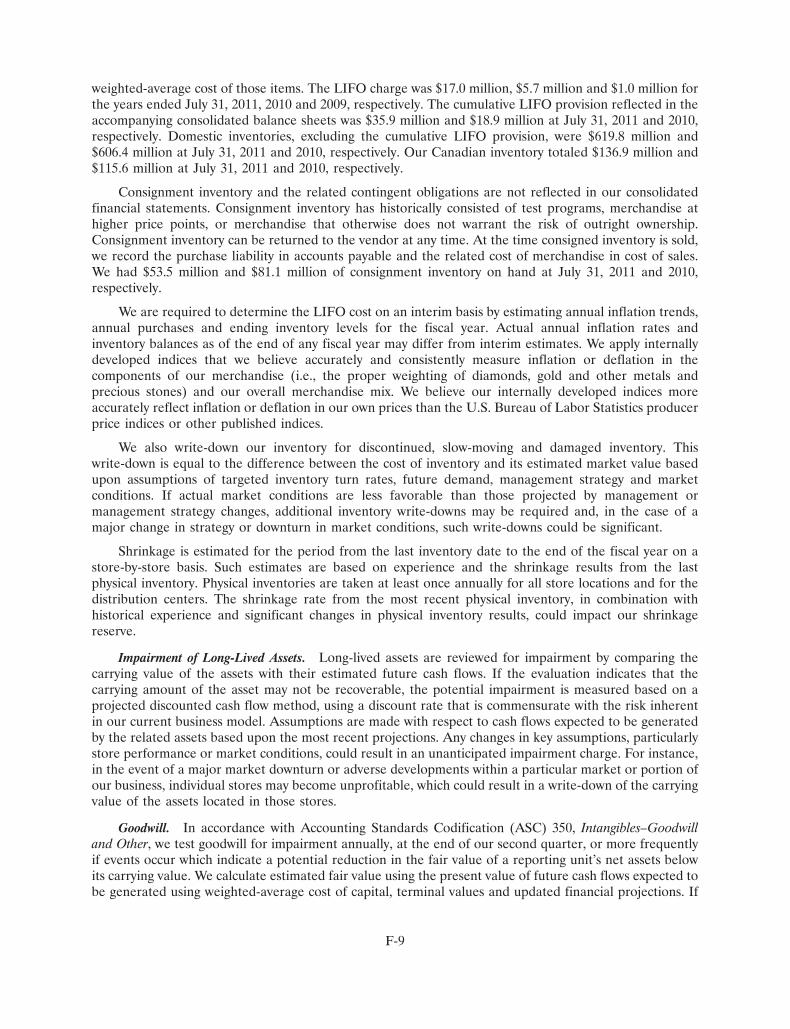
weighted-average cost of those items. The LIFO charge was $17.0 million, $5.7 million and $1.0 million forthe years ended July 31, 2011, 2010 and 2009, respectively. The cumulative LIFO provision reflected in theaccompanying consolidated balance sheets was $35.9 million and $18.9 million at July 31, 2011 and 2010,respectively. Domestic inventories, excluding the cumulative LIFO provision, were $619.8 million and$606.4 million at July 31, 2011 and 2010, respectively. Our Canadian inventory totaled $136.9 million and$115.6 million at July 31, 2011 and 2010, respectively.
Consignment inventory and the related contingent obligations are not reflected in our consolidatedfinancial statements. Consignment inventory has historically consisted of test programs, merchandise athigher price points, or merchandise that otherwise does not warrant the risk of outright ownership.Consignment inventory can be returned to the vendor at any time. At the time consigned inventory is sold,we record the purchase liability in accounts payable and the related cost of merchandise in cost of sales.We had $53.5 million and $81.1 million of consignment inventory on hand at July 31, 2011 and 2010,respectively.
We are required to determine the LIFO cost on an interim basis by estimating annual inflation trends,annual purchases and ending inventory levels for the fiscal year. Actual annual inflation rates andinventory balances as of the end of any fiscal year may differ from interim estimates. We apply internallydeveloped indices that we believe accurately and consistently measure inflation or deflation in thecomponents of our merchandise (i.e., the proper weighting of diamonds, gold and other metals andprecious stones) and our overall merchandise mix. We believe our internally developed indices moreaccurately reflect inflation or deflation in our own prices than the U.S. Bureau of Labor Statistics producerprice indices or other published indices.
We also write-down our inventory for discontinued, slow-moving and damaged inventory. Thiswrite-down is equal to the difference between the cost of inventory and its estimated market value basedupon assumptions of targeted inventory turn rates, future demand, management strategy and marketconditions. If actual market conditions are less favorable than those projected by management ormanagement strategy changes, additional inventory write-downs may be required and, in the case of amajor change in strategy or downturn in market conditions, such write-downs could be significant.
Shrinkage is estimated for the period from the last inventory date to the end of the fiscal year on astore-by-store basis. Such estimates are based on experience and the shrinkage results from the lastphysical inventory. Physical inventories are taken at least once annually for all store locations and for thedistribution centers. The shrinkage rate from the most recent physical inventory, in combination withhistorical experience and significant changes in physical inventory results, could impact our shrinkagereserve.
Impairment of Long-Lived Assets. Long-lived assets are reviewed for impairment by comparing thecarrying value of the assets with their estimated future cash flows. If the evaluation indicates that thecarrying amount of the asset may not be recoverable, the potential impairment is measured based on aprojected discounted cash flow method, using a discount rate that is commensurate with the risk inherentin our current business model. Assumptions are made with respect to cash flows expected to be generatedby the related assets based upon the most recent projections. Any changes in key assumptions, particularlystore performance or market conditions, could result in an unanticipated impairment charge. For instance,in the event of a major market downturn or adverse developments within a particular market or portion ofour business, individual stores may become unprofitable, which could result in a write-down of the carryingvalue of the assets located in those stores.
Goodwill. In accordance with Accounting Standards Codification (ASC) 350, Intangibles–Goodwilland Other, we test goodwill for impairment annually, at the end of our second quarter, or more frequentlyif events occur which indicate a potential reduction in the fair value of a reporting unit’s net assets belowits carrying value. We calculate estimated fair value using the present value of future cash flows expected tobe generated using weighted-average cost of capital, terminal values and updated financial projections. If
F-9

our actual results are not consistent with estimates and assumptions used to calculate fair value, we may berequired to recognize additional goodwill impairments. See Note 5 for additional disclosures related togoodwill.
Revenue Recognition. We recognize revenue in accordance with ASC 605, Revenue Recognition.Revenue related to merchandise sales, which is approximately 92 percent of total revenues, is recognized atthe time of the sale, reduced by a provision for sales returns. The provision for sales returns is based onhistorical evidence of our return rate. Repair revenues are recognized when the service is complete and themerchandise is delivered to the customers. Premium revenues from our insurance businesses relate tocredit insurance policies sold to customers who purchase our merchandise under the proprietary creditprogram. Insurance premiums are recognized over the coverage period.
Revenues related to lifetime warranties are recognized on a straight-line basis over an estimated lifeof five years, while revenues related to the optional theft protection are recognized over the two-yearcontract period. In addition, we offer one-year warranties to our Kiosk Jewelry customers that arerecognized over the 12-month contract period. ASC 605-20 requires recognition of revenue related toextended warranty products in proportion to the costs expected to be incurred if sufficient historicalevidence exists to demonstrate the pattern of expected costs. We are recognizing revenues related towarranties on a straight-line basis as a result of our determination that we currently have insufficienthistorical evidence to recognize revenue in proportion to the costs. Once the appropriate level of historicalevidence is obtained, we believe revenue will be recognized on an accelerated basis which could have amaterial impact on our results of operations.
In connection with the sale of our customer receivables in fiscal year 2000, we entered into a 10-yearmerchant services agreement whereby Citibank, N.A. issued private label credit cards branded withappropriate Company trademarks. We received a $41.8 million incentive for entering into the agreementthat was recognized ratably over 10 years. The remaining $4.2 million incentive balance was recognized asrevenue during fiscal year 2010.
Cost of Sales. Cost of sales includes cost related to merchandise sold, receiving and distribution,customer repairs and repairs associated with warranties.
Selling, General and Administrative. Included in selling, general and administrative (‘‘SG&A’’) are storeoperating, advertising, buying, costs of insurance operations and general corporate overhead expenses.
Operating Leases. Rent expense is recognized on a straight-line basis, including consideration of rentholidays, tenant improvement allowances received from the landlords and applicable rent escalations overthe term of the lease. The commencement date of the rent expense is the earlier of the date when webecome legally obligated for the rent payments or the date when we take possession of the building forconstruction purposes.
Depreciation and Amortization. Buildings and leasehold improvements are stated at cost and areamortized using the straight-line method over the estimated useful lives of the assets or remaining leaselife, whichever is shorter, which generally range from 5 to 10 years. Fixtures and equipment are amortizedusing the straight-line method over the estimated useful lives of the assets, which range from 3 to 15 years.Original cost and related accumulated depreciation or amortization is removed from the accounts in theyear assets are retired. Gains or losses on dispositions of property and equipment are recorded in the yearof disposal and are included in SG&A in the accompanying consolidated statements of operations. Repairsand maintenance costs are expensed as incurred.
Stock-Based Compensation. Stock-based compensation is accounted for under ASC 718,Compensation–Stock Compensation, which requires the use of the fair value method of accounting for allstock-based compensation, including stock options. Share-based awards are recognized as compensationexpense over the requisite service period.
F-10

Stock Repurchase Program. During fiscal year 2008, the Board of Directors authorized sharerepurchases of $350 million. As of July 31, 2011, $23.3 million was remaining under our stock repurchaseprogram. Our Term Loan contains a $1.0 million limit for repurchase of our common stock in any fiscalyear.
Preferred Stock. At July 31, 2011 and 2010, 5.0 million shares of preferred stock, par value of $0.01,were authorized. None were issued or outstanding.
Credit Insurance Operations. Insurance premium revenue from credit insurance subsidiaries was$12.7 million, $11.6 million and $11.3 million for the fiscal years ended July 31, 2011, 2010 and 2009,respectively. These insurance premiums are included in revenues in the accompanying consolidatedstatements of operations.
Self-Insurance. We are self-insured for certain losses related to general liability, workers’compensation and medical claims. Our liability represents an estimate of the ultimate cost of claimsincurred as of the balance sheet dates. The estimated liability is not discounted and is established basedupon analysis of historical data and actuarial estimates. While we believe these estimates are reasonablebased on the information currently available, if actual trends, including the severity or frequency of claims,medical cost inflation, or fluctuations in premiums differ from our estimates, our results of operationscould be impacted.
Advertising Expenses. Advertising is generally expensed when the advertisement is utilized and is acomponent of SG&A. All related production costs are expensed upon the first occurrence of theadvertisement. Advertising expenses were $76.5 million, $75.8 million and $87.9 million for the fiscal yearsended July 31, 2011, 2010 and 2009, respectively, net of amounts contributed by vendors. The amounts ofprepaid advertising at July 31, 2011 and 2010 were $3.6 million and $0.8 million, respectively, and areclassified as components of other current assets in the accompanying consolidated balance sheets.
Vendor Allowances. We receive cash or allowances from merchandise vendors primarily in connectionwith cooperative advertising programs and reimbursements for markdowns taken to sell the vendor’sproducts. We have agreements in place with each vendor setting forth the specific conditions for eachallowance or payment. The majority of these agreements are entered into or renewed annually at thebeginning of each fiscal year. Qualifying vendor reimbursements of costs incurred to specifically advertisevendors’ products are recorded as a reduction of advertising expense. All other allowances or cashpayments received are recorded as a reduction to the cost of merchandise. Vendor allowances included inadvertising expense totaled $1.0 million, $0.5 million and $5.9 million for the fiscal years ended July 31,2011, 2010 and 2009, respectively. Vendor allowances included in cost of sales totaled $3.7 million,$3.6 million and $1.3 million for the years ended July 31, 2011, 2010 and 2009, respectively.
Income Taxes. Income taxes are accounted for under the asset and liability method prescribed byASC 740, Income Taxes. Deferred tax assets and liabilities are recognized for the future tax consequencesattributable to differences between the financial statement carrying amounts of existing assets andliabilities and their respective tax bases and operating loss and tax credit carryforwards. Deferred tax assetsand liabilities are measured using enacted tax rates expected to apply to taxable income in the years inwhich those temporary differences are expected to be recovered or settled. The effect on deferred taxassets and liabilities of a change in tax rates is recognized in income in the period that includes theenactment date. A valuation allowance is recorded to reduce the carrying amounts of deferred tax assetsunless it is more likely than not such assets will be realized.
We file income tax returns in the U.S. federal jurisdiction, in various states and in certain foreignjurisdictions. We are no longer subject to U.S. federal examinations by tax authorities for fiscal yearsbefore July 31, 2007. We are subject to audit by taxing authorities of most states and certain foreign
F-11
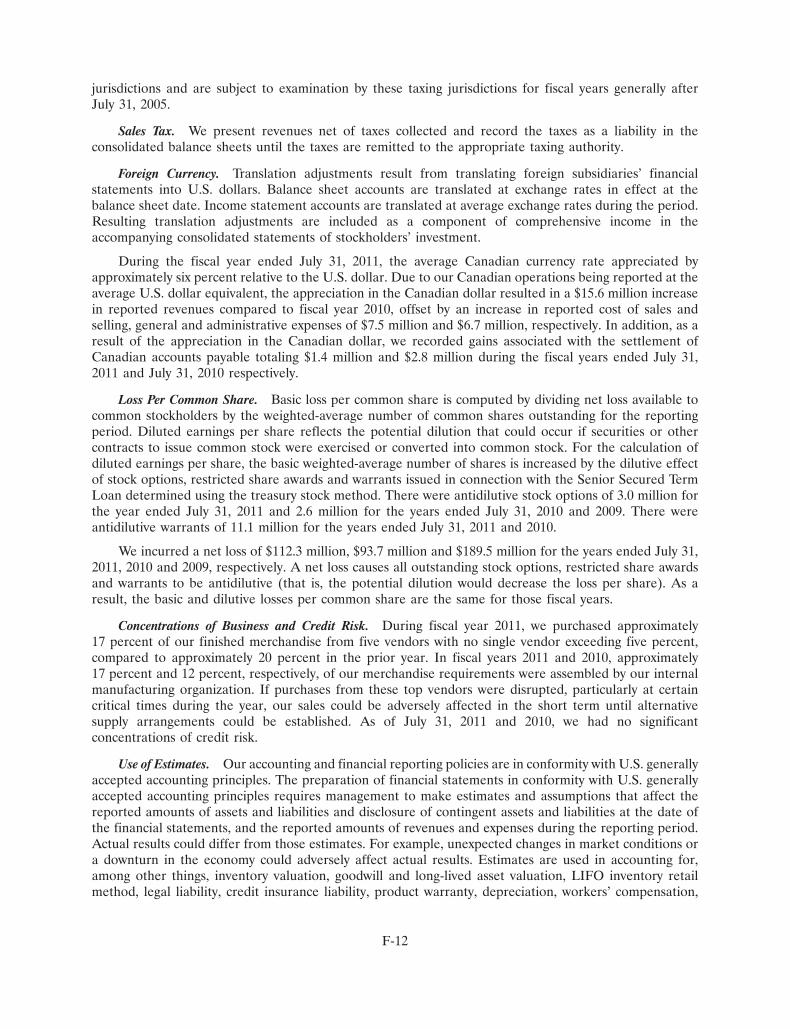
jurisdictions and are subject to examination by these taxing jurisdictions for fiscal years generally afterJuly 31, 2005.
Sales Tax. We present revenues net of taxes collected and record the taxes as a liability in theconsolidated balance sheets until the taxes are remitted to the appropriate taxing authority.
Foreign Currency. Translation adjustments result from translating foreign subsidiaries’ financialstatements into U.S. dollars. Balance sheet accounts are translated at exchange rates in effect at thebalance sheet date. Income statement accounts are translated at average exchange rates during the period.Resulting translation adjustments are included as a component of comprehensive income in theaccompanying consolidated statements of stockholders’ investment.
During the fiscal year ended July 31, 2011, the average Canadian currency rate appreciated byapproximately six percent relative to the U.S. dollar. Due to our Canadian operations being reported at theaverage U.S. dollar equivalent, the appreciation in the Canadian dollar resulted in a $15.6 million increasein reported revenues compared to fiscal year 2010, offset by an increase in reported cost of sales andselling, general and administrative expenses of $7.5 million and $6.7 million, respectively. In addition, as aresult of the appreciation in the Canadian dollar, we recorded gains associated with the settlement ofCanadian accounts payable totaling $1.4 million and $2.8 million during the fiscal years ended July 31,2011 and July 31, 2010 respectively.
Loss Per Common Share. Basic loss per common share is computed by dividing net loss available tocommon stockholders by the weighted-average number of common shares outstanding for the reportingperiod. Diluted earnings per share reflects the potential dilution that could occur if securities or othercontracts to issue common stock were exercised or converted into common stock. For the calculation ofdiluted earnings per share, the basic weighted-average number of shares is increased by the dilutive effectof stock options, restricted share awards and warrants issued in connection with the Senior Secured TermLoan determined using the treasury stock method. There were antidilutive stock options of 3.0 million forthe year ended July 31, 2011 and 2.6 million for the years ended July 31, 2010 and 2009. There wereantidilutive warrants of 11.1 million for the years ended July 31, 2011 and 2010.
We incurred a net loss of $112.3 million, $93.7 million and $189.5 million for the years ended July 31,2011, 2010 and 2009, respectively. A net loss causes all outstanding stock options, restricted share awardsand warrants to be antidilutive (that is, the potential dilution would decrease the loss per share). As aresult, the basic and dilutive losses per common share are the same for those fiscal years.
Concentrations of Business and Credit Risk. During fiscal year 2011, we purchased approximately17 percent of our finished merchandise from five vendors with no single vendor exceeding five percent,compared to approximately 20 percent in the prior year. In fiscal years 2011 and 2010, approximately17 percent and 12 percent, respectively, of our merchandise requirements were assembled by our internalmanufacturing organization. If purchases from these top vendors were disrupted, particularly at certaincritical times during the year, our sales could be adversely affected in the short term until alternativesupply arrangements could be established. As of July 31, 2011 and 2010, we had no significantconcentrations of credit risk.
Use of Estimates. Our accounting and financial reporting policies are in conformity with U.S. generallyaccepted accounting principles. The preparation of financial statements in conformity with U.S. generallyaccepted accounting principles requires management to make estimates and assumptions that affect thereported amounts of assets and liabilities and disclosure of contingent assets and liabilities at the date ofthe financial statements, and the reported amounts of revenues and expenses during the reporting period.Actual results could differ from those estimates. For example, unexpected changes in market conditions ora downturn in the economy could adversely affect actual results. Estimates are used in accounting for,among other things, inventory valuation, goodwill and long-lived asset valuation, LIFO inventory retailmethod, legal liability, credit insurance liability, product warranty, depreciation, workers’ compensation,
F-12
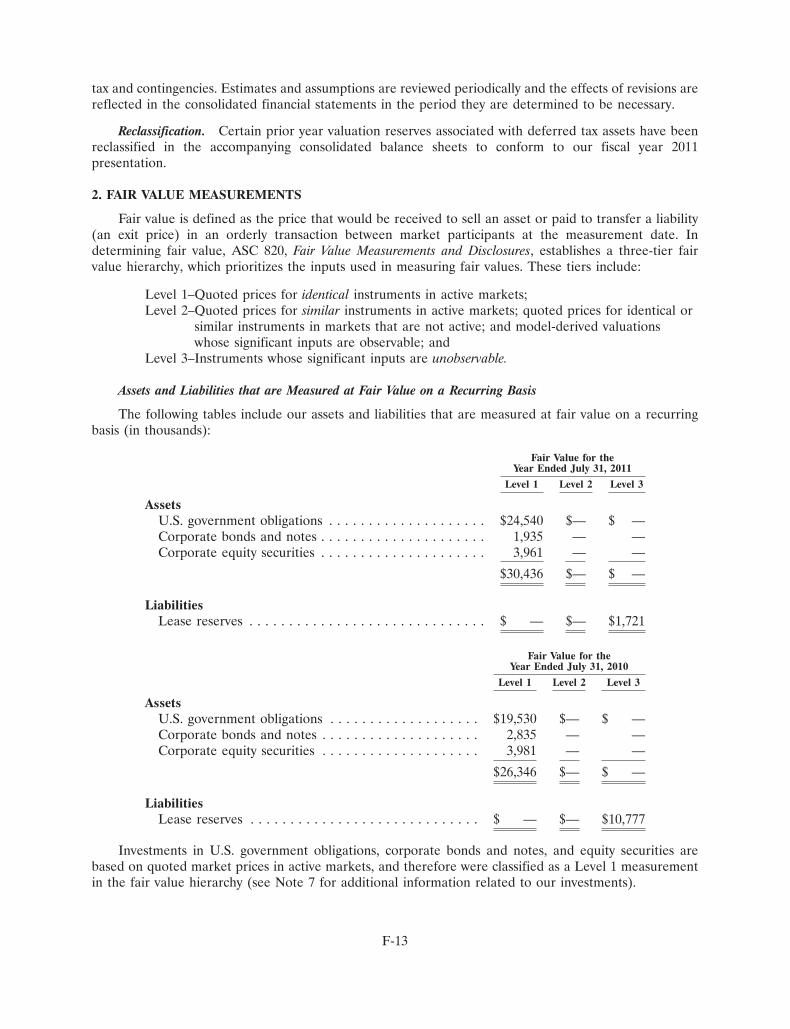
tax and contingencies. Estimates and assumptions are reviewed periodically and the effects of revisions arereflected in the consolidated financial statements in the period they are determined to be necessary.
Reclassification. Certain prior year valuation reserves associated with deferred tax assets have beenreclassified in the accompanying consolidated balance sheets to conform to our fiscal year 2011presentation.
2. FAIR VALUE MEASUREMENTS
Fair value is defined as the price that would be received to sell an asset or paid to transfer a liability(an exit price) in an orderly transaction between market participants at the measurement date. Indetermining fair value, ASC 820, Fair Value Measurements and Disclosures, establishes a three-tier fairvalue hierarchy, which prioritizes the inputs used in measuring fair values. These tiers include:
Level 1–Quoted prices for identical instruments in active markets;Level 2–Quoted prices for similar instruments in active markets; quoted prices for identical or
similar instruments in markets that are not active; and model-derived valuationswhose significant inputs are observable; and
Level 3–Instruments whose significant inputs are unobservable.
Assets and Liabilities that are Measured at Fair Value on a Recurring Basis
The following tables include our assets and liabilities that are measured at fair value on a recurringbasis (in thousands):
Fair Value for theYear Ended July 31, 2011
Level 1 Level 2 Level 3
AssetsU.S. government obligations . . . . . . . . . . . . . . . . . . . . $24,540 $— $ —Corporate bonds and notes . . . . . . . . . . . . . . . . . . . . . 1,935 — —Corporate equity securities . . . . . . . . . . . . . . . . . . . . . 3,961 — —
$30,436 $— $ —
LiabilitiesLease reserves . . . . . . . . . . . . . . . . . . . . . . . . . . . . . . $ — $— $1,721
Fair Value for theYear Ended July 31, 2010
Level 1 Level 2 Level 3
AssetsU.S. government obligations . . . . . . . . . . . . . . . . . . . $19,530 $— $ —Corporate bonds and notes . . . . . . . . . . . . . . . . . . . . 2,835 — —Corporate equity securities . . . . . . . . . . . . . . . . . . . . 3,981 — —
$26,346 $— $ —
LiabilitiesLease reserves . . . . . . . . . . . . . . . . . . . . . . . . . . . . . $ — $— $10,777
Investments in U.S. government obligations, corporate bonds and notes, and equity securities arebased on quoted market prices in active markets, and therefore were classified as a Level 1 measurementin the fair value hierarchy (see Note 7 for additional information related to our investments).
F-13
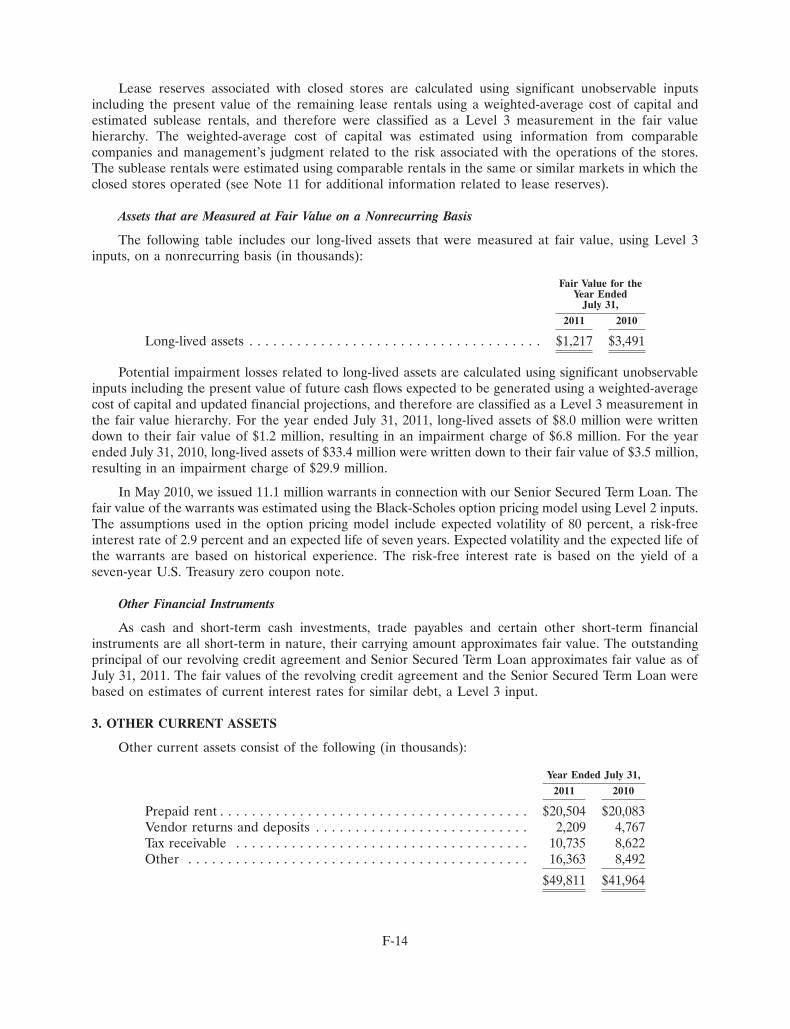
Lease reserves associated with closed stores are calculated using significant unobservable inputsincluding the present value of the remaining lease rentals using a weighted-average cost of capital andestimated sublease rentals, and therefore were classified as a Level 3 measurement in the fair valuehierarchy. The weighted-average cost of capital was estimated using information from comparablecompanies and management’s judgment related to the risk associated with the operations of the stores.The sublease rentals were estimated using comparable rentals in the same or similar markets in which theclosed stores operated (see Note 11 for additional information related to lease reserves).
Assets that are Measured at Fair Value on a Nonrecurring Basis
The following table includes our long-lived assets that were measured at fair value, using Level 3inputs, on a nonrecurring basis (in thousands):
Fair Value for theYear Ended
July 31,
2011 2010
Long-lived assets . . . . . . . . . . . . . . . . . . . . . . . . . . . . . . . . . . . . . $1,217 $3,491
Potential impairment losses related to long-lived assets are calculated using significant unobservableinputs including the present value of future cash flows expected to be generated using a weighted-averagecost of capital and updated financial projections, and therefore are classified as a Level 3 measurement inthe fair value hierarchy. For the year ended July 31, 2011, long-lived assets of $8.0 million were writtendown to their fair value of $1.2 million, resulting in an impairment charge of $6.8 million. For the yearended July 31, 2010, long-lived assets of $33.4 million were written down to their fair value of $3.5 million,resulting in an impairment charge of $29.9 million.
In May 2010, we issued 11.1 million warrants in connection with our Senior Secured Term Loan. Thefair value of the warrants was estimated using the Black-Scholes option pricing model using Level 2 inputs.The assumptions used in the option pricing model include expected volatility of 80 percent, a risk-freeinterest rate of 2.9 percent and an expected life of seven years. Expected volatility and the expected life ofthe warrants are based on historical experience. The risk-free interest rate is based on the yield of aseven-year U.S. Treasury zero coupon note.
Other Financial Instruments
As cash and short-term cash investments, trade payables and certain other short-term financialinstruments are all short-term in nature, their carrying amount approximates fair value. The outstandingprincipal of our revolving credit agreement and Senior Secured Term Loan approximates fair value as ofJuly 31, 2011. The fair values of the revolving credit agreement and the Senior Secured Term Loan werebased on estimates of current interest rates for similar debt, a Level 3 input.
3. OTHER CURRENT ASSETS
Other current assets consist of the following (in thousands):
Year Ended July 31,
2011 2010
Prepaid rent . . . . . . . . . . . . . . . . . . . . . . . . . . . . . . . . . . . . . . . $20,504 $20,083Vendor returns and deposits . . . . . . . . . . . . . . . . . . . . . . . . . . . 2,209 4,767Tax receivable . . . . . . . . . . . . . . . . . . . . . . . . . . . . . . . . . . . . . 10,735 8,622Other . . . . . . . . . . . . . . . . . . . . . . . . . . . . . . . . . . . . . . . . . . . 16,363 8,492
$49,811 $41,964
F-14

4. PROPERTY AND EQUIPMENT, NET
Property and equipment consists of the following (in thousands):
Year Ended July 31,
2011 2010
Building and leasehold improvements . . . . . . . . . . . . . . . . . $ 236,295 $ 232,079Furniture and fixtures . . . . . . . . . . . . . . . . . . . . . . . . . . . . . 464,707 448,440Construction in progress . . . . . . . . . . . . . . . . . . . . . . . . . . . 3,811 13,256
704,813 693,775Less accumulated depreciation and amortization . . . . . . . . . (563,062) (520,416)
$ 141,751 $ 173,359
5. GOODWILL
In accordance with ASC 350, Intangibles–Goodwill and Other, we test goodwill for impairmentannually, at the end of our second quarter, or more frequently if events occur which indicate a potentialreduction in the fair value of a reporting unit’s net assets below its carrying value. We calculate estimatedfair value using the present value of future cash flows expected to be generated using a weighted averagecost of capital, terminal values and updated financial projections. At the end of the second quarter of fiscalyear 2011, we completed our annual impairment testing of goodwill. Based on the test results, weconcluded that no impairment was necessary for the $85.2 million of goodwill related to the PeoplesJewellers acquisition and the $19.4 million of goodwill related to the Piercing Pagoda acquisition. As of thedate of the test, the fair value of the Peoples Jewellers and Piercing Pagoda reporting units would have todecline by more than 18 percent and 60 percent, respectively, to be considered for potential impairment.The key assumptions used to determine the fair value of our reporting units include: (1) cash flowprojections for five years assuming positive comparable store sales growth; (2) terminal year growth ratesof two percent based on estimates of long-term inflation expectations; and (3) discount rates of16.5 percent to 19 percent based on our weighted-average cost of capital. The weighted-average cost ofcapital was estimated using information from comparable companies and management’s judgment relatedto risks associated with the operations of each reporting unit. While we believe we have made reasonableestimates and assumptions to calculate the fair value of the reporting units, it is possible a material changecould occur. If our actual results are not consistent with estimates and assumptions used to calculate fairvalue, we may be required to recognize goodwill impairments.
Based on the test results performed in fiscal year 2009, we fully impaired goodwill totaling $5.0 millionrelated to a reporting unit in Fine Jewelry. The charge is included in other charges in the consolidatedstatements of operations.
The changes in the carrying amount of goodwill are as follows (in thousands):
Year Ended July 31,
2011 2010
Goodwill, beginning of period . . . . . . . . . . . . . . . . . . . . . . . . . $ 98,388 $94,605Foreign currency adjustments . . . . . . . . . . . . . . . . . . . . . . . . 6,232 3,783
Goodwill, end of period . . . . . . . . . . . . . . . . . . . . . . . . . . . . . $104,620 $98,388
F-15

6. OTHER ASSETS
Other assets consist of the following (in thousands):
Year Ended July 31,
2011 2010
Debt issuance costs . . . . . . . . . . . . . . . . . . . . . . . . . . . . . . . . . $10,048 $22,773Investments in debt and equity securities . . . . . . . . . . . . . . . . . . 30,436 26,346Other . . . . . . . . . . . . . . . . . . . . . . . . . . . . . . . . . . . . . . . . . . . 4,359 3,549
$44,843 $52,668
7. INVESTMENTS
Investments in debt and equity securities held by our insurance subsidiaries are reported as otherassets in the accompanying consolidated balance sheets. Investments are recorded at fair value based onquoted market prices. All investments are classified as available-for-sale. All long-term debt securitiesoutstanding at July 31, 2011 will contractually mature within 1 to 21 years. Our investments consist of thefollowing (in thousands):
Year Ended Year EndedJuly 31, 2011 July 31, 2010
Cost Fair Value Cost Fair Value
U.S. government obligations . . . . . . . . . . . $22,972 $24,540 $18,212 $19,530Corporate bonds and notes . . . . . . . . . . . . 1,802 1,935 2,641 2,835Corporate equity securities . . . . . . . . . . . . 3,501 3,961 4,086 3,981
$28,275 $30,436 $24,939 $26,346
At July 31, 2011 and 2010, the carrying value of investments included a net unrealized gain of$2.2 million and $1.4 million, respectively, which are included in accumulated other comprehensiveincome. Realized gains and losses on investments are determined on the specific identification basis. Thenet realized gains totaled $0.2 million and $0.4 million in fiscal year 2011 and 2009, respectively. Therewere no material net realized gains or losses during fiscal year 2010. Investments with a carrying value of$7.5 million and $7.6 million were on deposit with various state insurance departments at July 31, 2011 and2010, respectively, as required by law.
8. ACCOUNTS PAYABLE AND ACCRUED LIABILITIES
Accounts payable and accrued liabilities consist of the following (in thousands):
Year Ended July 31,
2011 2010
Accounts payable . . . . . . . . . . . . . . . . . . . . . . . . . . . . . . . . . $143,938 $157,189Accrued payroll . . . . . . . . . . . . . . . . . . . . . . . . . . . . . . . . . . 12,431 7,668Accrued taxes . . . . . . . . . . . . . . . . . . . . . . . . . . . . . . . . . . . . 16,681 15,003Warranty deferred revenue . . . . . . . . . . . . . . . . . . . . . . . . . . 94,188 78,141Accrued rent . . . . . . . . . . . . . . . . . . . . . . . . . . . . . . . . . . . . 9,962 8,786Lease reserves . . . . . . . . . . . . . . . . . . . . . . . . . . . . . . . . . . . 1,721 10,777Other . . . . . . . . . . . . . . . . . . . . . . . . . . . . . . . . . . . . . . . . . . 34,523 40,358
$313,444 $317,922
F-16

9. LONG-TERM DEBT
Long-term debt consists of the following (in thousands):
Year Ended July 31,
2011 2010
Revolving credit agreement . . . . . . . . . . . . . . . . . . . . . . . . . . $255,000 $165,000Senior Secured Term Loan . . . . . . . . . . . . . . . . . . . . . . . . . . 140,454 151,703
395,454 316,703Less current portion of long-term debt . . . . . . . . . . . . . . . . . . — (11,250)Less unamortized discount on Senior Secured Term Loan . . . . — (20,769)
$395,454 $284,684
Amended and Restated Revolving Credit Agreement
On May 10, 2010, we entered into an agreement to amend and restate various terms of the revolvingcredit agreement with Bank of America, N.A. and certain other lenders. The Amended and RestatedRevolving Credit Agreement (the ‘‘Revolving Credit Agreement’’) consisted of two tranches: (a) anextended tranche totaling $530 million, including seasonal borrowings of $88 million, maturing on April 30,2014 and (b) a non-extending tranche totaling $120 million, including seasonal borrowings of $20 million,maturing on August 11, 2011. The commitments under the agreement from both tranches total$650 million, including seasonal borrowings of $108 million. On April 21, 2011, the $120 millionnon-extending tranche was assigned to other lenders and the maturity date was extended to April 30, 2014,the maturity date for the remainder of the credit facility. Borrowings under the Revolving CreditAgreement are capped at the lesser of: (1) 73 percent of the cost of eligible inventory during Octoberthrough December and 69 percent for the remainder of the year (less certain reserves that may beestablished under the agreement), plus 85 percent of eligible credit card receivables or (2) 87.5 percent ofthe appraised liquidation value of eligible inventory (less certain reserves that may be established underthe agreement), plus 85 percent of eligible credit card receivables. The rate applied to the appraisedliquidation value was 90 percent prior to January 1, 2011. The Revolving Credit Agreement also containsan accordion feature that allows us to permanently increase commitments up to an additional $100 million,subject to approval by our lenders and certain other requirements. The Revolving Credit Agreement issecured by a first priority security interest and lien on merchandise inventory, credit card receivables andcertain other assets and a second priority security interest and lien on all other assets. At July 31, 2011, wehad borrowing availability under the Revolving Credit Agreement of $161.3 million.
Based on the most recent inventory appraisal performed as of June 2011, available borrowings underthe Revolving Credit Agreement will be determined under item (2) described in the preceding paragraph.The monthly borrowing rates calculated from the cost of eligible inventory are as follows: 61 and64 percent for August and September 2011, respectively; ranging from 72 to 74 percent for the period ofOctober through December 2011 and ranging from 60 to 64 percent for the period of January through July2012.
Borrowings under the Revolving Credit Agreement bear interest based on average excess availabilityat either: (i) LIBOR plus the applicable margin (ranging from 350 to 400 basis points) or (ii) the base rate(as defined in the Revolving Credit Agreement) plus the applicable margin (ranging from 250 to 300 basispoints). We are required to pay a quarterly unused commitment fee of 50 basis points based on thepreceding quarter’s unused commitment.
Excess availability (as defined in the Revolving Credit Agreement) cannot be less than $40 millionduring the term of the agreement and less than $50 million on one occasion for three consecutive businessdays in each four month period, except for the period from September 1 through November 30, when
F-17

excess availability can be less than $50 million on two occasions, but in no event can excess availability beless than $50 million more than four times during any 12 consecutive months. Excess availability wasapproximately $111.3 million as of July 31, 2011. The Revolving Credit Agreement contains various othercovenants including restrictions on the incurrence of certain indebtedness, liens, investments, acquisitionsand asset sales. As of July 31, 2011, we were in compliance with all covenants under the Revolving CreditAgreement.
We incurred debt issuance costs associated with the Revolving Credit Agreement totaling$14.1 million, including $1.1 million associated with the April 21, 2011 extension of the $120 millionportion of the credit facility. The debt issuance costs are included in other assets in the accompanyingconsolidated balance sheets and are amortized to interest expense on a straight-line basis over thefour-year life of the Revolving Credit Agreement.
On September 24, 2010, we received a waiver and consent from the lenders under the Amended andRestated Revolving Credit Agreement permitting the amendments to our Senior Secured Term Loan andthe related payments to Z Investment Holdings, LLC (see below for additional details).
Senior Secured Term Loan
On May 10, 2010, we entered into a $150 million Senior Secured Term Loan (the ‘‘Term Loan’’) and aWarrant and Registration Rights Agreement (as discussed below) with Z Investment Holdings, LLC, anaffiliate of Golden Gate Capital. The Term Loan matures on May 10, 2015 and is secured by a first prioritysecurity interest in substantially all current and future intangible assets not secured under the RevolvingCredit Agreement and a second priority security interest on merchandise inventory, credit card receivablesand certain other assets. The proceeds received were used to pay down amounts outstanding under theRevolving Credit Agreement after payment of debt issuance costs incurred pursuant to the RevolvingCredit Agreement and the Term Loan. Debt issuance costs associated with the Term Loan totaledapproximately $13.0 million, $1.7 million of which was attributable to the warrants issued in connectionwith the Term Loan (see more details below under Warrant and Registration Rights Agreement) andexpensed on the date of issuance.
On September 24, 2010, we amended the Term Loan with Z Investment Holdings, LLC. Theamendment eliminated the Minimum Consolidated EBITDA covenant and our option to pay a portion offuture interest payments in kind subsequent to July 31, 2010. As a result, all future interest payments willbe made in cash. In consideration for the amendment, we paid Z Investment Holdings, LLC an aggregateof $25.0 million, of which $11.3 million was used to pay down the outstanding principal balance of the TermLoan, $1.2 million was a prepayment premium and $12.5 million was an amendment fee. The outstandingbalance of the Term Loan after the amendment totaled $140.5 million. In accordance with ASC 470-50,Debt–Modifications and Extinguishments, the amendment was considered a significant modification, whichrequired us to account for the Term Loan and related unamortized costs as an extinguishment and recordthe amended Term Loan at fair value. As a result, we recorded a charge to interest expense totaling$45.8 million in the first quarter of fiscal year 2011. The charge consists of $20.3 million related to theunamortized discount associated with the warrants issued in connection with the Term Loan, the$12.5 million amendment fee, $10.3 million related to the unamortized debt issuance costs associated withthe Term Loan and $2.7 million related to the prepayment premium and other costs associated with theamendment.
The Term Loan bears interest at 15 percent payable on a quarterly basis. We may repay all or anyportion of the Term Loan with the following penalty prior to maturity: (i) 10 percent during the first year;(ii) 7.5 percent during the second year; (iii) 5.0 percent during the third year; (iv) 2.5 percent during thefourth year and (v) no penalty in the fifth year. Our ability to repay the Term Loan prior to maturity isrestricted by certain conditions under the Revolving Credit Agreement, including a fixed charge coverageratio that we currently do not meet.
F-18

The Term Loan contains various covenants, as defined in the agreement, including maintainingminimum store contribution thresholds for Piercing Pagoda and Zale Canada, as defined, and restrictionson the incurrence of certain indebtedness, liens, investments, acquisitions and asset sales. The PiercingPagoda and Zale Canada minimum store contribution threshold for the twelve-month period endingJuly 31, 2011 is $20 million and CAD $30 million, respectively. As of July 31, 2011, store contribution forPiercing Pagoda and Zale Canada would have to decline by more than 39 percent and 31 percent,respectively, to breach these covenants. The Piercing Pagoda minimum store contribution thresholds forfiscal year 2012 range from $21 million to $26 million. The Zale Canada minimum store contributionthresholds for fiscal year 2012 range from CAD $31 million to CAD $36 million. Liquidity (as defined inthe Term Loan) was $238.9 million as of July 31, 2011, which exceeded the $135 million minimum liquidityrequirement under the Term Loan by $103.9 million. As of July 31, 2011, we were in compliance with allcovenants under the Term Loan.
On May 10, 2010, we acknowledged the terms of an intercreditor agreement (the ‘‘IntercreditorAgreement’’) between Bank of America N.A, as agent under the Revolving Credit Agreement, and ZInvestment Holdings, LLC, as agent under the Term Loan. Under the Intercreditor Agreement, ZInvestment Holdings, LLC, may request Bank of America N.A. to establish a reserve equal to two andone-half percent of the borrowing base, as defined in the Revolving Credit Agreement, if the excessavailability is less than $75 million at any time, thereby reducing the amount we can borrow under theRevolving Credit Agreement. In addition, the Intercreditor Agreement restricts changes that can be madeto certain terms and covenants under the Term Loan.
Warrant and Registration Rights Agreement
In connection with the execution of the Term Loan in May 2010, we entered into a Warrant andRegistration Rights Agreement (the ‘‘Warrant Agreement’’) with Z Investment Holdings, LLC. Under theterms of the Warrant Agreement, we issued 6.4 million A-Warrants and 4.7 million B-Warrants(collectively, the ‘‘Warrants’’) to purchase shares of our common stock, on a one-for-one basis, for anexercise price of $2.00 per share. The Warrants, which are currently exercisable and expire seven yearsafter issuance, represented 25 percent of our common stock on a fully diluted basis (including the sharesissuable upon exercise of the Warrants and excluding certain out-of-the-money stock options) as of thedate of the issuance. The A-Warrants were exercisable immediately; however, the B-Warrants were notexercisable until the shares of common stock to be issued upon exercise of the B-Warrants were approvedby our stockholders, which occurred on July 23, 2010. The number of shares and exercise price are subjectto customary antidilution protection. The Warrant Agreement also entitles the holder to designate two,and in certain circumstances three, directors to our board. The holders of the Warrants may, at theiroption, request that we register for resale all or part of the common stock issuable under the WarrantAgreement.
The fair value of the Warrants totaled $21.3 million as of the date of issuance and was recorded as along-term liability, with a corresponding discount to the carrying value of the Term Loan. On July 23, 2010,the stockholders approved the shares of common stock to be issued upon exercise of the B-Warrants. Thelong-term liability associated with the Warrants was marked-to-market as of the date of the stockholderapproval resulting in an $8.3 million gain during the fourth quarter of fiscal year 2010. The remainingamount of $13.0 million was reclassified to stockholders’ investment and is included in additional paid-incapital in the accompanying consolidated balance sheet. Issuance costs attributable to the Warrantstotaling $1.7 million were expensed on the date of issuance. As indicated above, the remainingunamortized discount as of September 24, 2010 totaling $20.3 million associated with the Warrants wascharged to interest expense during the first quarter of fiscal year 2011.
F-19

Future maturities of long-term debt for each of the following five years and thereafter are as follows(in thousands):
Year Ended:
2012 . . . . . . . . . . . . . . . . . . . . . . . . . . . . . . . . . . . . . . . . . . . . . . . . . $ —2013 . . . . . . . . . . . . . . . . . . . . . . . . . . . . . . . . . . . . . . . . . . . . . . . . . —2014 . . . . . . . . . . . . . . . . . . . . . . . . . . . . . . . . . . . . . . . . . . . . . . . . . 255,0002015 . . . . . . . . . . . . . . . . . . . . . . . . . . . . . . . . . . . . . . . . . . . . . . . . . 140,4542016 . . . . . . . . . . . . . . . . . . . . . . . . . . . . . . . . . . . . . . . . . . . . . . . . . —
Thereafter . . . . . . . . . . . . . . . . . . . . . . . . . . . . . . . . . . . . . . . . . . . . . . . —
$395,454
Interest paid under the Revolving Credit Agreement during fiscal years 2011 and 2010 was$10.4 million and $7.4 million, respectively. Interest paid under the Term Loan during fiscal years 2011 and2010 was $21.7 million and $3.4 million, respectively.
10. OTHER LIABILITIES
Other liabilities consist of the following (in thousands):
Year Ended July 31,
2011 2010
Long-term straight-line rent . . . . . . . . . . . . . . . . . . . . . . . . . . $ 31,299 $ 33,181Long-term warranty deferred revenue . . . . . . . . . . . . . . . . . . 137,992 140,741Insurance reserves . . . . . . . . . . . . . . . . . . . . . . . . . . . . . . . . . 6,162 5,447
$175,453 $179,369
11. LEASE TERMINATIONS
We have recorded lease termination charges related to certain store closures, primarily in FineJewelry, and lease obligations associated with the Bailey Banks & Biddle brand that was sold in November2007 (see Note 17 for additional information). The lease termination charges for leases where theCompany has finalized settlement negotiations with the landlords are based on the amounts agreed uponin the termination agreement. If a settlement has not been reached for a lease, the charges are based onthe present value of the remaining lease rentals, including common area maintenance and other charges,reduced by estimated sublease rentals that could reasonably be obtained. We were not able to finalizeagreements with all of the landlords, and certain landlords have made demands, or initiated legalproceedings to collect the remaining base rent payments associated with the terminated leases. While webelieve we have made reasonable estimates and assumptions to record these charges, it is possible amaterial change could occur and we may be required to record additional charges.
The activity related to lease reserves associated with the store closures and the Bailey Banks & Biddlelease obligations for the year ended July 31, 2011, is as follows (in thousands):
Bailey Banks &Store Closures Biddle Total
Beginning of period . . . . . . . . . . . . . . . . . . $ 5,135 $ 5,642 $ 10,777Charges and adjustments . . . . . . . . . . . . . 285 906 1,191Payments . . . . . . . . . . . . . . . . . . . . . . . . (4,856) (5,391) (10,247)
End of period . . . . . . . . . . . . . . . . . . . . . . $ 564 $ 1,157 $ 1,721
F-20

12. OTHER CHARGES
Other charges consist of the following (in thousands):
Year Ended July 31,
2011 2010 2009
Store impairments . . . . . . . . . . . . . . . . . . . . . . . . . . . . $6,762 $29,944 $14,873Store closure charges . . . . . . . . . . . . . . . . . . . . . . . . . . 285 3,426 27,047Goodwill impairment . . . . . . . . . . . . . . . . . . . . . . . . . . — — 5,020
$7,047 $33,370 $46,940
In fiscal year 2011, we recorded a $6.8 million charge related to the impairment of long-lived assetsassociated with underperforming stores and a $0.3 million charge related to store closures (see Note 11 foradditional information related to lease terminations). The impairment charges and store closures wereprimarily in Fine Jewelry. The impairment of long-lived assets is based on the amount that the carryingvalue exceeds the estimated fair value of the assets. The fair value is based on future cash flow projectionsover the remaining lease term using a discount rate that we believe is commensurate with the risk inherentin our current business model. If actual results are not consistent with our cash flow projections, we may berequired to record additional impairments. If operating earnings over the remaining lease term for eachstore included in our impairment test as of July 31, 2011 were to decline by 20 percent, we would berequired to record additional impairments of $0.2 million. If operating earnings were to decline by30 percent, the additional impairments required would increase to $1.0 million.
We recorded charges related to the impairment of long-lived assets associated with underperformingstores of $29.9 million and $14.9 million in fiscal years 2010 and 2009, respectively. We also recorded storeclosure charges of $3.4 million and $27.0 million in fiscal years 2010 and 2009, respectively. In fiscal year2009, the store closure charge related to 119 closures and consisted primarily of estimated leasetermination costs of $16.1 million, impairments related to long-lived assets of $8.9 million and severancecosts of $1.1 million. The impairment charges and store closures were primarily in Fine Jewelry. Inaddition, we recorded a $5.0 million goodwill impairment charge in fiscal year 2009. See Note 11 foradditional information related to the store closures and Note 5 for additional information related to thegoodwill impairment charge.
13. LEASES
We rent most of our retail space under operating leases that generally range from 5 to 10 years andmay contain minimum rent escalations, while kiosk leases generally range from three to five years. Ourstore support center lease extends to 2018. We recognize the minimum rent payments on a straight-linebasis over the term of the lease, including the construction period. Contingent rentals paid to lessors ofcertain store facilities are determined principally on the basis of a percentage of sales in excess ofcontractual limits. All existing real estate leases are operating leases. Rent expense from continuingoperations is included in SG&A and is as follows (in thousands):
Year Ended July 31,
2011 2010 2009
Retail space:Minimum rentals . . . . . . . . . . . . . . . . . . . . . . . . $188,766 $189,655 $202,656Rentals based on sales . . . . . . . . . . . . . . . . . . . . 2,796 2,154 3,297
191,562 191,809 205,953Equipment and corporate headquarters . . . . . . . 3,837 3,729 2,166
$195,399 $195,538 $208,119
F-21

Future minimum lease payments as of July 31, 2011, for all non-cancelable leases were as follows (inthousands):
Minimum RentYear Ended Commitments
2012 . . . . . . . . . . . . . . . . . . . . . . . . . . . . . . . . . . . . . . . . . . . . . . . $169,5922013 . . . . . . . . . . . . . . . . . . . . . . . . . . . . . . . . . . . . . . . . . . . . . . . 139,6342014 . . . . . . . . . . . . . . . . . . . . . . . . . . . . . . . . . . . . . . . . . . . . . . . 113,1012015 . . . . . . . . . . . . . . . . . . . . . . . . . . . . . . . . . . . . . . . . . . . . . . . 89,7692016 . . . . . . . . . . . . . . . . . . . . . . . . . . . . . . . . . . . . . . . . . . . . . . . 70,172
Thereafter . . . . . . . . . . . . . . . . . . . . . . . . . . . . . . . . . . . . . . . . . . . . 104,157
$686,425
14. INCOME TAXES
Currently, we file a consolidated income tax return. The effective income tax rate from continuingoperations varies from the federal statutory rate of 35 percent as follows (in thousands):
Year Ended July 31,
2011 2010 2009
Federal income tax benefit at statutory rate . . . . . . . $(38,750) $(43,589) $(76,763)State income taxes, net of federal benefit . . . . . . . . (4,250) (11,581) (9,015)Tax on repatriation of foreign earnings . . . . . . . . . . 14,099 12,677 13,912Canadian rate changes(a) . . . . . . . . . . . . . . . . . . . . (4,040) (3,206) (2,878)Foreign & U.S. tax credits . . . . . . . . . . . . . . . . . . . — — 8,159Goodwill impairment . . . . . . . . . . . . . . . . . . . . . . . — — 1,750Expiration of net operating loss carryforwards . . . . . — (2,675) —Change in valuation allowance . . . . . . . . . . . . . . . . 44,406 24,288 12,501Depreciation and amortization adjustment(b) . . . . . (8,512) — —Other . . . . . . . . . . . . . . . . . . . . . . . . . . . . . . . . . . (1,396) (4,664) (681)
Income tax expense (benefit) . . . . . . . . . . . . . . . . . $ 1,557 $(28,750) $(53,015)
Effective income tax rate . . . . . . . . . . . . . . . . . . . . (1.4)% 23.1% 24.2%
(a) For the last three years, Canada has reduced both its federal and provincial tax rates.
(b) The $8.5 million adjustment was offset with a valuation allowance, resulting in no impact to the consolidatedstatement of operations.
F-22

The provision for income taxes from continuing operations consists of the following (in thousands):
Year Ended July 31,
2011 2010 2009
Current income tax (benefit) expense:Federal . . . . . . . . . . . . . . . . . . . . . . . . . . . . . . . . $(9,628) $(32,826) $ 520Foreign . . . . . . . . . . . . . . . . . . . . . . . . . . . . . . . . 5,003 4,145 6,830State . . . . . . . . . . . . . . . . . . . . . . . . . . . . . . . . . . 910 296 869
Total current income tax (benefit) expense . . . . . (3,715) (28,385) 8,219
Deferred income tax expense (benefit):Federal . . . . . . . . . . . . . . . . . . . . . . . . . . . . . . . . 5,114 1,104 (60,107)Foreign . . . . . . . . . . . . . . . . . . . . . . . . . . . . . . . . 159 (1,504) 1,296State . . . . . . . . . . . . . . . . . . . . . . . . . . . . . . . . . . (1) 35 (2,423)
Total deferred income tax expense (benefit) . . . . 5,272 (365) (61,234)$ 1,557 $(28,750) $(53,015)
Deferred tax assets and liabilities are determined based on estimated future tax effects of thedifference between the financial statement and tax basis of asset and liability balances using statutory taxrates. Tax effects of temporary differences that give rise to significant components of the deferred tax assetsand deferred tax liabilities at July 31, 2011 and 2010, respectively, are as follows (in thousands):
Year Ended July 31,
2011 2010
Current deferred taxes:Assets
Accrued liabilities . . . . . . . . . . . . . . . . . . . . . . . . . . . . . . . $ 35,867 $ 38,117Inventory reserves . . . . . . . . . . . . . . . . . . . . . . . . . . . . . . . 6,539 12,320Net operating loss carryforward . . . . . . . . . . . . . . . . . . . . . — 4,894Other . . . . . . . . . . . . . . . . . . . . . . . . . . . . . . . . . . . . . . . . 31 62
Current deferred tax assets . . . . . . . . . . . . . . . . . . . . . . . 42,437 55,393Valuation allowances . . . . . . . . . . . . . . . . . . . . . . . . . . . . . (16,792) (10,897)
Current deferred tax assets . . . . . . . . . . . . . . . . . . . . . . . 25,645 44,496Liabilities
Merchandise inventories, principally due to LIFO reserve . . . (114,066) (110,787)Accrued liabilities . . . . . . . . . . . . . . . . . . . . . . . . . . . . . . . (4,300) (3,742)
Current deferred tax liabilities, net . . . . . . . . . . . . . . . . . . $ (92,721) $ (70,033)
Non-current deferred taxes:Assets
Net operating loss carryforward . . . . . . . . . . . . . . . . . . . . . $ 119,563 $ 68,232Property and equipment . . . . . . . . . . . . . . . . . . . . . . . . . . . 4,130 3,178Stock-based compensation . . . . . . . . . . . . . . . . . . . . . . . . . 5,360 5,456Accrued liabilities . . . . . . . . . . . . . . . . . . . . . . . . . . . . . . . 53,699 52,214Investments in subsidiaries . . . . . . . . . . . . . . . . . . . . . . . . . 11,365 6,467Other . . . . . . . . . . . . . . . . . . . . . . . . . . . . . . . . . . . . . . . . 6,451 3,469
200,568 139,016Valuation allowances . . . . . . . . . . . . . . . . . . . . . . . . . . . . . (79,756) (41,141)
Non-current deferred tax assets . . . . . . . . . . . . . . . . . . . . 120,812 97,875Liabilities
State and local taxes . . . . . . . . . . . . . . . . . . . . . . . . . . . . . (1,523) (862)Undistributed earnings . . . . . . . . . . . . . . . . . . . . . . . . . . . . (11,609) (8,310)Goodwill . . . . . . . . . . . . . . . . . . . . . . . . . . . . . . . . . . . . . (14,070) (12,593)Other . . . . . . . . . . . . . . . . . . . . . . . . . . . . . . . . . . . . . . . . (643) (561)
Non-current deferred tax assets, net . . . . . . . . . . . . . . . . . $ 92,967 $ 75,549
F-23

Deferred tax assets, net of valuation allowances, were $146.5 million and $142.4 million at July 31,2011 and 2010, respectively. Deferred tax liabilities were $146.2 million and $136.9 million at July 31, 2011and 2010, respectively.
A valuation allowance must be provided when it is more likely than not that the deferred income taxasset will not be realized. Our valuation allowances totaled $96.5 million and $52.0 million as of July 31,2011 and 2010, respectively, and relate to deferred tax assets associated with certain federal, state andforeign net operating loss carryforwards. The valuation allowances were established due to the uncertaintyof our ability to utilize the net operating loss carryforwards in the future.
Deferred tax assets associated with net operating loss carryforwards totaled $119.6 million and$73.1 million as of July 31, 2011 and 2010, respectively. Deferred tax assets associated with foreign taxcredits totaled $10.2 million and $5.1 million as of July 31, 2011 and 2010, respectively. The net operatingloss carryforwards expire from fiscal year 2012 to fiscal year 2031.
In fiscal year 2011 and 2010, we recorded income tax benefits totaling $4.6 million and $33.4 million,respectively, related to tax refunds associated with net operating loss carrybacks pursuant to the Worker,Homeownership and Business Assistance Act of 2009 (the ‘‘WHBA’’). The WHBA, which was enacted inNovember 2009, includes provisions that extend the time period in which net operating loss carrybacks canbe utilized from two to five years, with certain limitations.
The total amount of unrecognized tax benefits as of July 31, 2011 was $4.9 million, of which$3.2 million would favorably impact the effective tax rate if resolved in our favor. Over the next twelvemonths, management does not anticipate that the amount of unrecognized tax benefits will be materiallyreduced due to our tax position being sustained upon audit or as a result of the expiration of the statute oflimitations for specific jurisdictions.
A reconciliation of the fiscal year 2011 beginning and ending balance of unrecognized tax benefits isas follows (in thousands):
UnrecognizedTax Benefits
Balance at July 31, 2010 . . . . . . . . . . . . . . . . . . . . . . . . . . . . . . . . . . . $3,937Additions based on tax positions related to fiscal 2011 . . . . . . . . . . . . . 275Additions based on tax positions related to prior years . . . . . . . . . . . . . 804Expiration of statute of limitations . . . . . . . . . . . . . . . . . . . . . . . . . . . (158)
Balance at July 31, 2011 . . . . . . . . . . . . . . . . . . . . . . . . . . . . . . . . . . . $4,858
We recognize accrued interest and penalties related to unrecognized tax benefits in our income taxexpense. We had $2.6 million of interest and penalties accrued at July 31, 2011 and 2010 and $2.7 million ofinterest and penalties accrued at July 31, 2009. There was no material interest expense in fiscal years 2011,2010 and 2009.
Income tax refunds, net of taxes paid, during fiscal years 2011, 2010 and 2009 totaled $1.0 million,$30.0 million and $6.4 million, respectively.
15. STOCK-BASED COMPENSATION
We are authorized to provide grants of options to purchase our common stock, restricted stock,restricted stock units and performance-based restricted stock units under the Zale Corporation 2003 StockIncentive Plan and the Non-Employee Director Equity Compensation Plan (collectively, the ‘‘Plans’’). Weare authorized to issue up to 6.3 million shares of our common stock for stock options and restricted stockto employees and non-employee directors under the Plans. Stock options and restricted share awards areissued from treasury stock. Stock-based compensation expense is included in SG&A in the consolidated
F-24

statements of operations and totaled $2.2 million, $3.9 million and $5.7 million for the fiscal years endedJuly 31, 2011, 2010 and 2009, respectively. The income tax benefit recognized in the consolidatedstatements of operations related to stock-based compensation totaled $0.1 million, $1.4 million and$1.0 million during fiscal years 2011, 2010 and 2009, respectively.
Stock Options. Stock options are granted at an exercise price equal to or greater than the marketvalue of the shares of our common stock at the date of grant, generally vest ratably over a four-year vestingperiod and generally expire ten years from the date of grant. Expense related to stock options is recognizedusing a graded-vesting schedule over the vesting period. As of July 31, 2011, there was $2.4 million ofunrecognized compensation cost related to stock option awards that is expected to be recognized over aweighted-average period of 2.2 years.
Stock option transactions during fiscal year 2011 are summarized as follows:
Weighted-AverageRemaining Aggregate
Number of Weighted-Average Contractual Life IntrinsicOptions Exercise Price (Years) Value
Outstanding, beginning ofyear . . . . . . . . . . . . . . . 2,602,217 $17.08
Granted . . . . . . . . . . . . . . 982,200 2.24Exercised . . . . . . . . . . . . . (25,500) 2.64Forfeited . . . . . . . . . . . . . (372,480) 7.16Expired . . . . . . . . . . . . . . (206,305) 24.01
Outstanding, end of year . . 2,980,132 $13.07 6.82 $4,560,484
Options exercisable, end ofyear . . . . . . . . . . . . . . . 1,441,186 $22.02 4.80 $ 566,175
For the years ended July 31, 2011 and 2009, the total intrinsic value of stock options exercised was$0.1 million and $1.2 million, respectively. No stock options were exercised in fiscal year 2010. Theweighted-average fair values of option grants were $1.38, $2.51 and $7.38 during fiscal years 2011, 2010 and2009, respectively. The fair value of stock options that vested during fiscal years 2011, 2010 and 2009 was$2.0 million, $1.0 million and $1.9 million, respectively.
The fair value of each stock option grant is estimated on the date of grant using the Black-Scholesoption pricing model. The following table presents the weighted-average assumptions used in the optionpricing model for stock option grants in fiscal years 2011, 2010 and 2009:
2011 2010 2009
Expected volatility . . . . . . . . . . . . . . . . . . . . . . . . . . . . . . . 93.5% 84.5% 41.4%Risk-free interest rate . . . . . . . . . . . . . . . . . . . . . . . . . . . . . 1.0% 2.3% 2.7%Expected lives in years . . . . . . . . . . . . . . . . . . . . . . . . . . . . 4.0 5.0 5.0Dividend yield . . . . . . . . . . . . . . . . . . . . . . . . . . . . . . . . . . 0.0% 0.0% 0.0%
Expected volatility and the expected life of the stock options are based on historical experience. Therisk-free rate is based on a U.S. Treasury yield that has a life which approximates the expected life of theoption.
Restricted Share Awards. Restricted share awards consist of restricted stock, restricted stock unitsand performance-based restricted stock units. Restricted stock and restricted stock units granted toemployees through fiscal year 2007 generally vest on the third anniversary of the grant date and are subjectto restrictions on sale or transfer. Restricted stock and restricted stock units granted to employees afterfiscal year 2007 generally vest twenty-five percent on the second and third anniversary of the date of the
F-25

grant and the remaining fifty percent vest on the fourth anniversary of the date of the grant, subject torestrictions on sale or transfer. Restricted stock granted to non-employee directors vest on the firstanniversary of the grant date and are subject to restrictions on sale or transfer. The fair value of restrictedstock and restricted stock units is based on our closing stock price on the date of grant. Performance-basedrestricted stock units entitle the holder to receive a specified number of shares of our common stock basedon our achievement of performance targets established by the Compensation Committee. There were noperformance-based restricted stock units outstanding as of July 31, 2011. At the sole discretion of theCompensation Committee, the holder of a restricted stock unit or performance-based restricted stock unitmay receive a cash payment in lieu of a payout of shares of common stock equal to the fair market value ofthe number of shares of common stock the holder otherwise would have received. As of July 31, 2011,there was $0.6 million of unrecognized compensation cost related to restricted stock awards that isexpected to be recognized over a weighted-average period of 1.5 years.
Restricted share award transactions during fiscal year 2011 are summarized as follows:
Weighted-Number of AverageRestricted Fair Value
Share Awards Per Award
Restricted share awards, beginning of year . . . . . . . . . . . . . 137,175 $15.93Granted . . . . . . . . . . . . . . . . . . . . . . . . . . . . . . . . . . . . . . 115,000 2.33Vested . . . . . . . . . . . . . . . . . . . . . . . . . . . . . . . . . . . . . . . (36,925) 17.60Forfeited . . . . . . . . . . . . . . . . . . . . . . . . . . . . . . . . . . . . . . (10,400) 21.29
Restricted share awards, end of year . . . . . . . . . . . . . . . . . . 204,850 $ 7.72
16. COMPREHENSIVE LOSS
Comprehensive loss represents the change in equity during a period from transactions and otherevents, except those resulting from investments by and distributions to stockholders. The following tablegives further detail regarding changes in the composition of accumulated other comprehensive income (inthousands):
Total AccumulatedCumulative OtherTranslation Unrealized Gain ComprehensiveAdjustment on Securities Income
Balance at July 31, 2008 . . . . . . . . . . . . $ 50,734 $ 302 $ 51,036Cumulative translation adjustment . . . . (13,810) — (13,810)Unrealized gain on securities . . . . . . . . — 521 521Reclassification to earnings . . . . . . . . . . — (440) (440)
Balance at July 31, 2009 . . . . . . . . . . . . 36,924 383 37,307Cumulative translation adjustment . . . . 10,110 — 10,110Unrealized gain on securities . . . . . . . . — 1,026 1,026Reclassification to earnings . . . . . . . . . . — (3) (3)
Balance at July 31, 2010 . . . . . . . . . . . . 47,034 1,406 48,440Cumulative translation adjustment . . . . 14,190 — 14,190Unrealized gain on securities . . . . . . . . — 924 924Reclassification to earnings . . . . . . . . . . — (169) (169)
Balance at July 31, 2011 . . . . . . . . . . . . $ 61,224 $2,161 $ 63,385
F-26

17. DISPOSITION OF BAILEY BANKS & BIDDLE
In connection with the sale of the Bailey, Banks & Biddle brand in November 2007, we assigned theapplicable store operating leases to the buyer, Finlay Fine Jewelry Corporation (‘‘Finlay’’). As a conditionof this assignment, we remained contingently liable for the leases for the remainder of the respectivecurrent lease terms, which generally ranged from fiscal year 2009 through fiscal year 2017. On August 5,2009, Finlay filed for Chapter 11 bankruptcy protection and subsequently decided to liquidate. As a result,we recorded lease termination charges totaling $23.2 million during the fourth quarter of fiscal year 2009associated with all 45 Bailey, Banks & Biddle locations. The decision to sell was a result of our strategy tofocus on our moderately priced business and our continued focus on maximizing return on investments.We recorded charges related to the leases totaling $0.9 million and $23.2 million in discontinuedoperations for the years ended July 31, 2011 and 2009, respectively. In fiscal year 2011, we also received a$0.6 million distribution from the Finlay bankruptcy. In fiscal year 2010, we recorded a gain related to theleases totaling $2.1 million in discontinued operations. There is no tax impact associated with discontinuedoperations due to the uncertainty of our ability to utilize net operating loss carryforwards in the future.
18. SEGMENTS
We report our operations under three business segments: Fine Jewelry, Kiosk Jewelry, and All Other.All corresponding items of segment information in prior periods have been presented consistently.
Fine Jewelry consists of five principal brands, Zales Jewelers�, Zales Outlet�, Gordon’s Jewelers�,Peoples Jewllers� and Mappins Jewellers�, and is predominantly focused on the value-oriented customeras our core customer target. Each brand specializes in fine jewelry and watches, with merchandise andmarketing emphasis focused on diamond products. These five brands have been aggregated into onereportable segment. Kiosk Jewelry operates under the brand names Piercing Pagoda�, Plumb Gold�, andSilver and Gold Connection� through mall-based kiosks and is focused on the opening price pointcustomer. Kiosk Jewelry specializes in gold, silver and non-precious metal products that capitalize on thelatest fashion trends. All Other includes our insurance and reinsurance operations, which offer insurancecoverage primarily to our private label credit card customers. Management’s expectation is that overalleconomics of each of our major brands within each reportable segment will be similar over time.
We use earnings before unallocated corporate overhead, interest and taxes but include an internalcharge for inventory carrying cost to evaluate segment profitability. Unallocated costs before income taxesinclude corporate employee-related costs, administrative costs, information technology costs, corporatefacilities costs and depreciation and amortization.
Income tax information by segment is not included as taxes are calculated at a company-wide level andnot allocated to each segment.
F-27
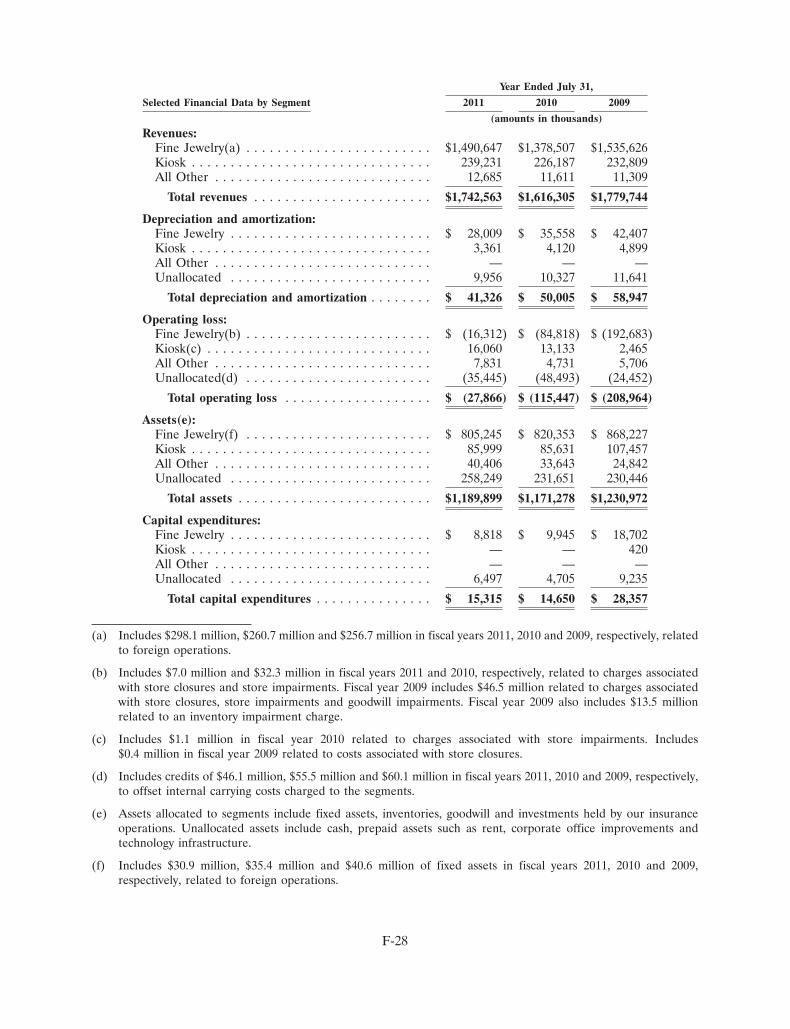
Year Ended July 31,
Selected Financial Data by Segment 2011 2010 2009
(amounts in thousands)Revenues:
Fine Jewelry(a) . . . . . . . . . . . . . . . . . . . . . . . . $1,490,647 $1,378,507 $1,535,626Kiosk . . . . . . . . . . . . . . . . . . . . . . . . . . . . . . . 239,231 226,187 232,809All Other . . . . . . . . . . . . . . . . . . . . . . . . . . . . 12,685 11,611 11,309
Total revenues . . . . . . . . . . . . . . . . . . . . . . . $1,742,563 $1,616,305 $1,779,744
Depreciation and amortization:Fine Jewelry . . . . . . . . . . . . . . . . . . . . . . . . . . $ 28,009 $ 35,558 $ 42,407Kiosk . . . . . . . . . . . . . . . . . . . . . . . . . . . . . . . 3,361 4,120 4,899All Other . . . . . . . . . . . . . . . . . . . . . . . . . . . . — — —Unallocated . . . . . . . . . . . . . . . . . . . . . . . . . . 9,956 10,327 11,641
Total depreciation and amortization . . . . . . . . $ 41,326 $ 50,005 $ 58,947
Operating loss:Fine Jewelry(b) . . . . . . . . . . . . . . . . . . . . . . . . $ (16,312) $ (84,818) $ (192,683)Kiosk(c) . . . . . . . . . . . . . . . . . . . . . . . . . . . . . 16,060 13,133 2,465All Other . . . . . . . . . . . . . . . . . . . . . . . . . . . . 7,831 4,731 5,706Unallocated(d) . . . . . . . . . . . . . . . . . . . . . . . . (35,445) (48,493) (24,452)
Total operating loss . . . . . . . . . . . . . . . . . . . $ (27,866) $ (115,447) $ (208,964)
Assets(e):Fine Jewelry(f) . . . . . . . . . . . . . . . . . . . . . . . . $ 805,245 $ 820,353 $ 868,227Kiosk . . . . . . . . . . . . . . . . . . . . . . . . . . . . . . . 85,999 85,631 107,457All Other . . . . . . . . . . . . . . . . . . . . . . . . . . . . 40,406 33,643 24,842Unallocated . . . . . . . . . . . . . . . . . . . . . . . . . . 258,249 231,651 230,446
Total assets . . . . . . . . . . . . . . . . . . . . . . . . . $1,189,899 $1,171,278 $1,230,972
Capital expenditures:Fine Jewelry . . . . . . . . . . . . . . . . . . . . . . . . . . $ 8,818 $ 9,945 $ 18,702Kiosk . . . . . . . . . . . . . . . . . . . . . . . . . . . . . . . — — 420All Other . . . . . . . . . . . . . . . . . . . . . . . . . . . . — — —Unallocated . . . . . . . . . . . . . . . . . . . . . . . . . . 6,497 4,705 9,235
Total capital expenditures . . . . . . . . . . . . . . . $ 15,315 $ 14,650 $ 28,357
(a) Includes $298.1 million, $260.7 million and $256.7 million in fiscal years 2011, 2010 and 2009, respectively, relatedto foreign operations.
(b) Includes $7.0 million and $32.3 million in fiscal years 2011 and 2010, respectively, related to charges associatedwith store closures and store impairments. Fiscal year 2009 includes $46.5 million related to charges associatedwith store closures, store impairments and goodwill impairments. Fiscal year 2009 also includes $13.5 millionrelated to an inventory impairment charge.
(c) Includes $1.1 million in fiscal year 2010 related to charges associated with store impairments. Includes$0.4 million in fiscal year 2009 related to costs associated with store closures.
(d) Includes credits of $46.1 million, $55.5 million and $60.1 million in fiscal years 2011, 2010 and 2009, respectively,to offset internal carrying costs charged to the segments.
(e) Assets allocated to segments include fixed assets, inventories, goodwill and investments held by our insuranceoperations. Unallocated assets include cash, prepaid assets such as rent, corporate office improvements andtechnology infrastructure.
(f) Includes $30.9 million, $35.4 million and $40.6 million of fixed assets in fiscal years 2011, 2010 and 2009,respectively, related to foreign operations.
F-28
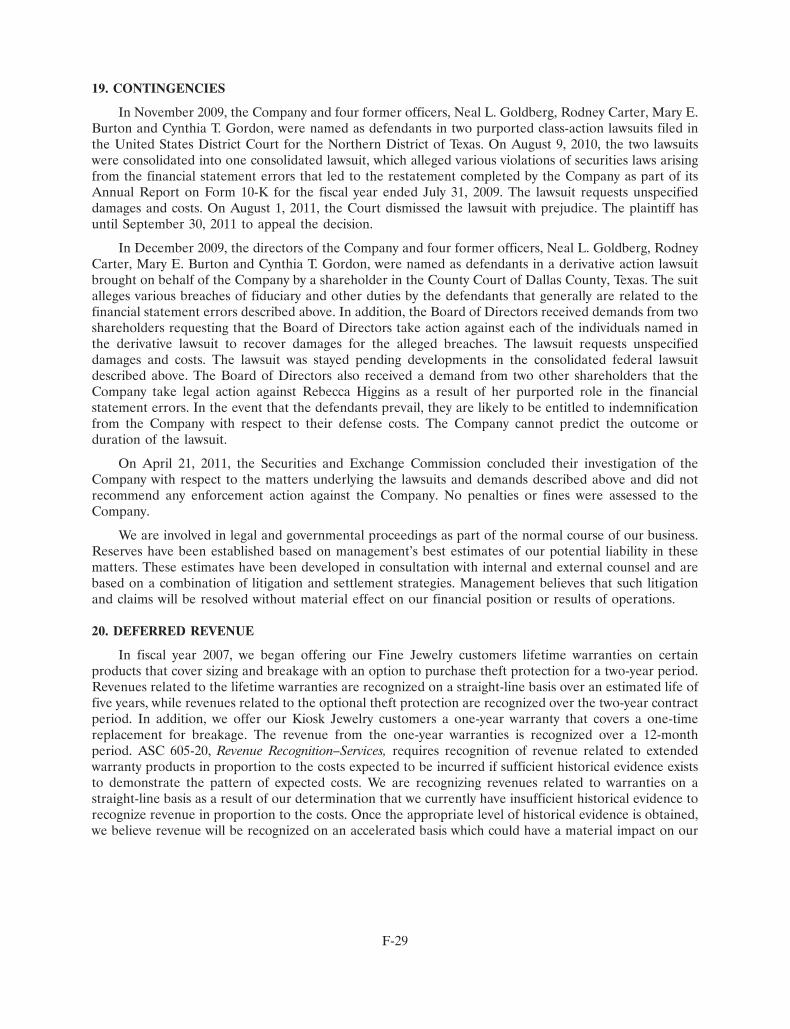
19. CONTINGENCIES
In November 2009, the Company and four former officers, Neal L. Goldberg, Rodney Carter, Mary E.Burton and Cynthia T. Gordon, were named as defendants in two purported class-action lawsuits filed inthe United States District Court for the Northern District of Texas. On August 9, 2010, the two lawsuitswere consolidated into one consolidated lawsuit, which alleged various violations of securities laws arisingfrom the financial statement errors that led to the restatement completed by the Company as part of itsAnnual Report on Form 10-K for the fiscal year ended July 31, 2009. The lawsuit requests unspecifieddamages and costs. On August 1, 2011, the Court dismissed the lawsuit with prejudice. The plaintiff hasuntil September 30, 2011 to appeal the decision.
In December 2009, the directors of the Company and four former officers, Neal L. Goldberg, RodneyCarter, Mary E. Burton and Cynthia T. Gordon, were named as defendants in a derivative action lawsuitbrought on behalf of the Company by a shareholder in the County Court of Dallas County, Texas. The suitalleges various breaches of fiduciary and other duties by the defendants that generally are related to thefinancial statement errors described above. In addition, the Board of Directors received demands from twoshareholders requesting that the Board of Directors take action against each of the individuals named inthe derivative lawsuit to recover damages for the alleged breaches. The lawsuit requests unspecifieddamages and costs. The lawsuit was stayed pending developments in the consolidated federal lawsuitdescribed above. The Board of Directors also received a demand from two other shareholders that theCompany take legal action against Rebecca Higgins as a result of her purported role in the financialstatement errors. In the event that the defendants prevail, they are likely to be entitled to indemnificationfrom the Company with respect to their defense costs. The Company cannot predict the outcome orduration of the lawsuit.
On April 21, 2011, the Securities and Exchange Commission concluded their investigation of theCompany with respect to the matters underlying the lawsuits and demands described above and did notrecommend any enforcement action against the Company. No penalties or fines were assessed to theCompany.
We are involved in legal and governmental proceedings as part of the normal course of our business.Reserves have been established based on management’s best estimates of our potential liability in thesematters. These estimates have been developed in consultation with internal and external counsel and arebased on a combination of litigation and settlement strategies. Management believes that such litigationand claims will be resolved without material effect on our financial position or results of operations.
20. DEFERRED REVENUE
In fiscal year 2007, we began offering our Fine Jewelry customers lifetime warranties on certainproducts that cover sizing and breakage with an option to purchase theft protection for a two-year period.Revenues related to the lifetime warranties are recognized on a straight-line basis over an estimated life offive years, while revenues related to the optional theft protection are recognized over the two-year contractperiod. In addition, we offer our Kiosk Jewelry customers a one-year warranty that covers a one-timereplacement for breakage. The revenue from the one-year warranties is recognized over a 12-monthperiod. ASC 605-20, Revenue Recognition–Services, requires recognition of revenue related to extendedwarranty products in proportion to the costs expected to be incurred if sufficient historical evidence existsto demonstrate the pattern of expected costs. We are recognizing revenues related to warranties on astraight-line basis as a result of our determination that we currently have insufficient historical evidence torecognize revenue in proportion to the costs. Once the appropriate level of historical evidence is obtained,we believe revenue will be recognized on an accelerated basis which could have a material impact on our
F-29
results of operations. The change in deferred revenue associated with the sale of warranties is as follows(in thousands):
Year Ended July 31,
2011 2010
Deferred revenue, beginning of period . . . . . . . . . . . . . . . . . . $218,882 $210,180Warranties sold(a) . . . . . . . . . . . . . . . . . . . . . . . . . . . . . . . 108,431 79,039Revenue recognized(b) . . . . . . . . . . . . . . . . . . . . . . . . . . . . (95,133) (70,337)
Deferred revenue, end of period . . . . . . . . . . . . . . . . . . . . . . $232,180 $218,882
(a) Warranty sales for the years ended July 31, 2011 and 2010 include approximately $2.9 million and $1.8 million,respectively, related primarily to the appreciation in the Canadian currency rate on the beginning of the perioddeferred revenue balance.
(b) In fiscal year 2007, we replaced our two-year warranties with lifetime warranties. The revenues related to lifetimewarranties are recognized on a straight-line basis over a five-year period.
21. BENEFIT AND RETIREMENT PLANS
We maintain the Zale Corporation Savings & Investment Plan (the ‘‘U.S. Plan’’) and the ZaleCorporation Puerto Rico Employees Savings and Investment Plan (the ‘‘PR Plan’’, collectively the‘‘Plans’’). The Plans are defined contribution plans covering substantially all employees of the Companywho have completed one year of service (at least 1,000 hours) and are aged 21 or older. Participants in thePlans can contribute from one percent to 60 percent (30 percent for highly-compensated employees) of hisor her annual salary subject to Internal Revenue Service (‘‘IRS’’) and Puerto Rico Internal Revenue Code(‘‘PR Code’’) limitations. Upon satisfying all eligibility requirements, employees who have not otherwiseelected will be automatically enrolled in their respective plan at a contribution rate of three percent forparticipants in the U.S. Plan (two percent prior to October 1, 2010) or two percent for participants in thePR Plan. We generally match $0.50 in cash for every dollar an employee of either plan contributes to theplan up to four percent of annual compensation subject to IRS and PR Code limitations. Matchingcontributions are generally made on an annual basis, and employees must be employed with us on the lastday of the plan year to receive our matching contributions. Employees who began contributing to the plansprior to calendar year 2009 vest in our matched contributions immediately. Employees who begancontributing to the plans after calendar year 2008 must complete two years of service prior to vesting inmatched contributions. Effective February 27, 2009, we temporarily suspended matching contributionsuntil business conditions permit the reinstatement of the matching contributions. The matchingcontribution expense totaled $1.8 million for fiscal year 2009.
F-30

22. QUARTERLY RESULTS OF CONTINUING OPERATIONS (UNAUDITED)
Unaudited quarterly results of continuing operations for the fiscal years ended July 31, 2011 and 2010were as follows (in thousands, except per share data):
Fiscal Year 2011For the Three Months Ended
July 31, 2011 April 30, 2011 January 31, 2011 October 31, 2010
Revenues . . . . . . . . . . . . . . . . . . . . . . . . . $377,267 $411,843 $626,416 $327,037Cost of sales . . . . . . . . . . . . . . . . . . . . . . . 183,792 205,424 311,308 161,944(Loss) earnings from continuing
operations(a) . . . . . . . . . . . . . . . . . . . . . (32,703) (9,928) 27,742 (97,153)(Loss) earnings per diluted share from
continuing operations . . . . . . . . . . . . . . . (1.02) (0.31) 0.86 (3.03)
Fiscal Year 2010For the Three Months Ended
July 31, 2010 April 30, 2010 January 31, 2010 October 31, 2009
Revenues . . . . . . . . . . . . . . . . . . . . . . . . . $345,000 $359,843 $582,252 $329,210Cost of sales . . . . . . . . . . . . . . . . . . . . . . . 163,154 177,103 292,539 169,377(Loss) earnings from continuing
operations(b) . . . . . . . . . . . . . . . . . . . . . (28,618) (14,631) 7,171 (59,712)(Loss) earnings per diluted share from
continuing operations . . . . . . . . . . . . . . . (0.89) (0.46) 0.22 (1.87)
(a) The loss from continuing operations for the fourth quarter includes a $3.1 million charge related to costassociated with store impairments and a $0.2 million charge related to costs associated with store closures. Theloss from continuing operations for the third quarter includes a gain totaling $0.3 million related to the reductionof the store closure obligation. The earnings from continuing operations for the second quarter includes costassociated with store impairments of $3.7 million and a gain totaling $0.8 million related to the reduction of thestore closure obligation. The loss from continuing operations for the first quarter includes a $1.1 million chargerelated to costs associated with store closures and a $45.8 million charge associated with the first amendment toour Senior Secured Term Loan.
(b) The loss from continuing operations for the fourth quarter includes a gain of $8.3 million related to the decreasein the fair value of the Warrants issued in connection with the Term Loan, a $6.7 million charge related to costassociated with store impairments, a gain totaling $2.1 million related to the reduction of the store closureobligation and a $1.7 million charge related to the debt issuance costs attributable to the Warrants. The loss fromcontinuing operations for the third quarter includes a $1.8 million charge related to costs associated with storeclosures. The earnings from continuing operations for the second quarter includes cost associated with storeimpairments of $23.3 million and lease termination costs associated with store closures of $3.7 million.
F-31

SIGNATURES
Pursuant to the requirements of Section 13 or 15(d) of the Securities Exchange Act of 1934, theregistrant has duly caused this report to be signed on its behalf by the undersigned, thereunto dulyauthorized, as of the 20th day of September, 2011.
ZALE CORPORATION
/S/ MATTHEW W. APPEL
Matthew W. AppelChief Administrative Officerand Chief Financial Officer
KNOW ALL MEN BY THESE PRESENTS, that each person whose signature appears belowconstitutes and appoints Theo Killion and Matthew W. Appel, and each of them, as his true and lawfulattorneys-in-fact and agents, with full powers and substitution and resubstitution for him, in his name placeand stead, in any and all capacities, to sign any and all amendments to this Annual Report on Form 10-K,and to file the same, with all exhibits thereto, and other documents in connection therewith, with theSecurities and Exchange Commission, granting unto said attorneys-in-fact and agents full power andauthority to do perform each and every act and thing requisite and necessary to be done in and about thepremises as fully and to all intents and purposes as he might or could do in person, hereby ratifying andconfirming all that said attorneys-in-fact and agents may lawfully do or cause to be done by virtue hereof.
Pursuant to the requirements of the Securities Exchange Act of 1934, this report has been signedbelow by the following persons on behalf of the registrant and in the capacities and on the dates indicated.
Signature Title Date
Chief Executive Officer (principal/s/ THEO KILLIONexecutive officer of the registrant), September 20, 2011
Theo Killion Director
Chief Administrative Officer and/s/ MATTHEW W. APPELChief Financial Officer (principal September 20, 2011
Matthew W. Appel financial officer of the registrant)
Vice President, Controller and Chief/s/ JAMES E. SULLIVANAccounting Officer (principal September 20, 2011
James E. Sullivan accounting officer of the registrant)
/s/ JOHN B. LOWE, JR.Chairman of the Board September 20, 2011
John B. Lowe, Jr.
/s/ YUVAL BRAVERMANDirector September 20, 2011
Yuval Braverman

Signature Title Date
/s/ KENNETH B. GILMANDirector September 20, 2011
Kenneth B. Gilman
/s/ STEFAN L. KALUZNYDirector September 20, 2011
Stefan L. Kaluzny
/s/ PETER MORROWDirector September 20, 2011
Peter Morrow
/s/ DAVID F. DYERDirector September 20, 2011
David F. Dyer

ExhibitNumber Description of Exhibit
10.10 Amended and Restated Employment Security Agreement for Theo Killion
10.16 Base Salaries and Target Bonus for the Named Executive Officers
23.1 Consent of Ernst & Young LLP
31.1 Rule 13a-14(a) Certification of Chief Executive Officer
31.2 Rule 13a-14(a) Certification of Chief Financial Officer
32.1 Section 1350 Certification of Chief Executive Officer
32.2 Section 1350 Certification of Chief Financial Officer
The above list reflects all exhibits filed herewith. See Item 15 for a complete list of our exhibits,including exhibits incorporated by reference from previous filings.

2011 ANNUAL REPORT
35512 Merrill.indd 2 10/11/11 1:45 PM
ZALE CORPORATION 2011 ANNUAL REPORT
35512 Merrill.indd 1 10/7/11 9:00 PM
2011 ANNUAL REPORT
35512 Merrill.indd 2 10/11/11 1:45 PM
ZALE CORPORATION 2011 ANNUAL REPORT
35512 Merrill.indd 1 10/7/11 9:00 PM
Corporate Information
Board of Directors
John B. Lowe, Jr. Yuval Braverman David F. Dyer Kenneth B. GilmanChairman of the Board Director Director DirectorAudit Committee Member Compensation Committee Member Audit Committee Member Audit Committee ChairmanNominating and Corporate Nominating and Corporate Compensation Committee Chairman Compensation Committee MemberGovernance Committee Member Governance Committee Chairman President and Chief Executive Retired Chief Executive Officer—Chairman—TDIndustries, Inc. President—J & J Zaidman, Inc. Officer—Chico’s FAS, Inc. Asbury Automotive Group, Inc.
Theo Killion Stefan L. Kaluzny Peter MorrowDirector Director DirectorChief Executive Officer Managing Director— Managing Director—
Sycamore Partners Sycamore Partners
Officers of the Company
Theo Killion Matthew W. Appel Gilbert P. Hollander Richard A. LennoxChief Executive Officer Chief Administrative Officer and Executive Vice President, Executive Vice President,
Chief Financial Officer Chief Merchant and Sourcing Officer Chief Marketing Officer
Jeannie Barsam Brad Furry John A. Legg Becky MickSenior Vice President, Senior Vice President, Senior Vice President, Senior Vice President,Merchandise Planning and Chief Information Officer Supply Chain Chief Stores OfficerAllocation
Toyin OgunSenior Vice President,Human Resources andCustomer Service
Shareholder Information
Executive Offices Independent Public Notice of Annual Meeting901 West Walnut Hill Lane Accountants Zale Corporation’s Annual Meeting of Shareholders will be held at 10 a.m.Irving, Texas 75038-1003 Ernst & Young LLP Friday, December 2, 2011 at the Company’s principal executive office at972-580-4000 901 West Walnut Hill Lane, Irving, Texas 75038.
Stock ListingTransfer Agent & Registrar New York Stock Exchange Common Stock InformationWells Fargo Bank, NA Common Stock—Symbol: ZLC The Common Stock is listed on the NYSE under the symbol ZLC. TheShareowner Services following table sets forth the high and low sale prices for the Common Stock161 North Concord Exchange Form 10-K Requests for each fiscal quarter during the two most recent fiscal years.South Saint Paul, MN 55075 Investors may obtain, without800-468-9716 charge, a copy of the Company’s 2011 2010http://www.wellsfargo.com/ Form 10-K and Annual Report as Quarter High Low High Lowshareownerservices filed with the Securities and
First $2.70 $1.53 $8.20 $4.73Exchange Commission for the yearInvestor Information/ ended July 31, 2011. The Company’s Second $5.76 $2.72 $5.51 $2.08Investor Relations Form 10-K and Annual Report are Third $4.92 $3.40 $3.80 $1.83901 West Walnut Hill Lane available online at www.zalecorp.com.
Fourth $6.81 $3.25 $3.27 $1.39Mail Station 7A-5Irving, Texas 75038-1003 Internet Access
As of October 10, 2011, the outstanding shares of Common Stock [email protected] www.zalecorp.comheld by approximately 550 holders of record.
CertificationsZale Corporation has filed the required certifications of its Chief Executive Officer and Chief Financial Officer under Section 302 of the Sarbanes-Oxley Act of 2002 asExhibits 31.1 and 31.2 to the Company’s Annual Report on Form 10-K for the year ended July 31, 2011. The certification of the Company’s Chief Executive Officerregarding compliance with the New York Stock Exchange corporate governance listing standards required by NYSE Rule 303A.12 will be filed with the NYSE followingthe 2011 Annual Meeting of Stockholders. Last year, the Company filed this certification with the NYSE in December 2010 following the 2010 Annual Meeting ofStockholders.
Cautionary Notice Regarding Forward-Looking StatementsThis annual report contains certain forward-looking statements, including statements regarding the Company’s objectives and expectations with respect to its financialplan, sales and earnings, merchandising and marketing strategies, acquisitions and dispositions, share repurchases, store openings, renovations, remodeling andexpansion, inventory management and performance, liquidity and cash flows, capital structure, capital expenditures, development of its information technology andtelecommunications plans and related management information systems, e-commerce initiatives, human resources initiatives, and other statements regarding theCompany’s plans and objectives. Forward-looking statements are not guarantees of future performance and a variety of factors could cause the Company’s actual resultsto differ materially from the results expressed in the forward-looking statements. For a discussion of these factors, see Item 1A of the Form 10-K of the Company for thefiscal year ended July 31, 2011 which is part of this Annual Report. The Company disclaims any obligation to update or revise publicly or otherwise any forward-lookingstatements to reflect subsequent events, new information or future circumstances.

2011 ANNUAL REPORT
35512 Merrill.indd 2 10/11/11 1:45 PM
ZALE CORPORATION 2011 ANNUAL REPORT
35512 Merrill.indd 1 10/7/11 9:00 PM
2011 ANNUAL REPORT
35512 Merrill.indd 2 10/11/11 1:45 PM
ZALE CORPORATION 2011 ANNUAL REPORT
35512 Merrill.indd 1 10/7/11 9:00 PM
Corporate Information
Board of Directors
John B. Lowe, Jr. Yuval Braverman David F. Dyer Kenneth B. GilmanChairman of the Board Director Director DirectorAudit Committee Member Compensation Committee Member Audit Committee Member Audit Committee ChairmanNominating and Corporate Nominating and Corporate Compensation Committee Chairman Compensation Committee MemberGovernance Committee Member Governance Committee Chairman President and Chief Executive Retired Chief Executive Officer—Chairman—TDIndustries, Inc. President—J & J Zaidman, Inc. Officer—Chico’s FAS, Inc. Asbury Automotive Group, Inc.
Theo Killion Stefan L. Kaluzny Peter MorrowDirector Director DirectorChief Executive Officer Managing Director— Managing Director—
Sycamore Partners Sycamore Partners
Officers of the Company
Theo Killion Matthew W. Appel Gilbert P. Hollander Richard A. LennoxChief Executive Officer Chief Administrative Officer and Executive Vice President, Executive Vice President,
Chief Financial Officer Chief Merchant and Sourcing Officer Chief Marketing Officer
Jeannie Barsam Brad Furry John A. Legg Becky MickSenior Vice President, Senior Vice President, Senior Vice President, Senior Vice President,Merchandise Planning and Chief Information Officer Supply Chain Chief Stores OfficerAllocation
Toyin OgunSenior Vice President,Human Resources andCustomer Service
Shareholder Information
Executive Offices Independent Public Notice of Annual Meeting901 West Walnut Hill Lane Accountants Zale Corporation’s Annual Meeting of Shareholders will be held at 10 a.m.Irving, Texas 75038-1003 Ernst & Young LLP Friday, December 2, 2011 at the Company’s principal executive office at972-580-4000 901 West Walnut Hill Lane, Irving, Texas 75038.
Stock ListingTransfer Agent & Registrar New York Stock Exchange Common Stock InformationWells Fargo Bank, NA Common Stock—Symbol: ZLC The Common Stock is listed on the NYSE under the symbol ZLC. TheShareowner Services following table sets forth the high and low sale prices for the Common Stock161 North Concord Exchange Form 10-K Requests for each fiscal quarter during the two most recent fiscal years.South Saint Paul, MN 55075 Investors may obtain, without800-468-9716 charge, a copy of the Company’s 2011 2010http://www.wellsfargo.com/ Form 10-K and Annual Report as Quarter High Low High Lowshareownerservices filed with the Securities and
First $2.70 $1.53 $8.20 $4.73Exchange Commission for the yearInvestor Information/ ended July 31, 2011. The Company’s Second $5.76 $2.72 $5.51 $2.08Investor Relations Form 10-K and Annual Report are Third $4.92 $3.40 $3.80 $1.83901 West Walnut Hill Lane available online at www.zalecorp.com.
Fourth $6.81 $3.25 $3.27 $1.39Mail Station 7A-5Irving, Texas 75038-1003 Internet Access
As of October 10, 2011, the outstanding shares of Common Stock [email protected] www.zalecorp.comheld by approximately 550 holders of record.
CertificationsZale Corporation has filed the required certifications of its Chief Executive Officer and Chief Financial Officer under Section 302 of the Sarbanes-Oxley Act of 2002 asExhibits 31.1 and 31.2 to the Company’s Annual Report on Form 10-K for the year ended July 31, 2011. The certification of the Company’s Chief Executive Officerregarding compliance with the New York Stock Exchange corporate governance listing standards required by NYSE Rule 303A.12 will be filed with the NYSE followingthe 2011 Annual Meeting of Stockholders. Last year, the Company filed this certification with the NYSE in December 2010 following the 2010 Annual Meeting ofStockholders.
Cautionary Notice Regarding Forward-Looking StatementsThis annual report contains certain forward-looking statements, including statements regarding the Company’s objectives and expectations with respect to its financialplan, sales and earnings, merchandising and marketing strategies, acquisitions and dispositions, share repurchases, store openings, renovations, remodeling andexpansion, inventory management and performance, liquidity and cash flows, capital structure, capital expenditures, development of its information technology andtelecommunications plans and related management information systems, e-commerce initiatives, human resources initiatives, and other statements regarding theCompany’s plans and objectives. Forward-looking statements are not guarantees of future performance and a variety of factors could cause the Company’s actual resultsto differ materially from the results expressed in the forward-looking statements. For a discussion of these factors, see Item 1A of the Form 10-K of the Company for thefiscal year ended July 31, 2011 which is part of this Annual Report. The Company disclaims any obligation to update or revise publicly or otherwise any forward-lookingstatements to reflect subsequent events, new information or future circumstances.