zdroj: sasi group (university of sheffield) a mark newman ... · pdf fileelectronics exports ...
TRANSCRIPT

Příloha 1a
Ran
kTe
rrit
ory
Val
ue
69To
go2.
7770
Kaz
akhs
tan
2.20
71N
epal
0.88
72C
ape
Verd
e0.
8473
Hai
ti0.
6874
Col
ombi
a0.
5975
Cen
tral
Afr
ican
Rep
ublic
0.48
76U
krai
ne0.
4377
Bhut
an0.
1178
Mal
awi
0.10
MO
ST A
ND
LEA
ST U
S$ O
F N
ET C
LOTH
ING
EX
POR
TS
Tech
nic
al n
ote
s
© C
opyr
ight
200
6 SA
SI G
roup
(Uni
vers
ity o
f She
ffiel
d) a
nd M
ark
New
man
(Uni
vers
ity o
f Mich
igan
)
US$
wor
th o
f ne
t cl
othi
ng e
xpor
ts p
er p
erso
n liv
ing
in t
hat
terr
itory
*
Ran
kTe
rrit
ory
Val
ue
1H
ong
Kon
g (C
hina
)13
772
Mau
ritiu
s52
53
Brun
ei D
arus
sala
m49
24
Taiw
an47
65
Italy
299
6Ba
hrai
n28
77
Port
ugal
280
8Re
publ
ic o
f K
orea
198
9M
aced
onia
FY
R17
510
Belg
ium
131
Land
are
a
0102030405060708090100
Japan
Western Europe
North America
Eastern Europe
South America
Eastern Asia
Middle East
Asia Pacific
Southern Asia
Northern Africa
Southeastern Africa
Central Africa
Clot
hing
Exp
orts
ww
w.w
orld
map
per.o
rg
Prod
uced
by
the
SASI
gro
up (S
heffi
eld)
and
Mar
k N
ewm
an (M
ichi
gan)
“… B
angl
ades
h …
rel
ies
on g
arm
ents
for
mor
e th
an th
ree-
quar
ters
of i
ts e
xpor
ts.”C
hin
a ex
po
rts
mo
re c
loth
es t
hat
an
yo
ther
ter
rito
ry in
th
e w
orl
d. E
ast
Asi
a,th
e re
gio
n in
wh
ich
Ch
ina
is lo
cate
d,
exp
ort
s o
ver
five
tim
es a
s m
any
clo
thes
(US$
net
) as
an
y o
ther
reg
ion
.
Of
all e
arn
ing
s fr
om
inte
rnat
ion
altr
ade,
7%
is e
arn
ed f
rom
clo
thin
gex
po
rts.
Th
is c
ateg
ory
incl
ud
es c
loth
as w
ell a
s cl
oth
es, f
oo
twea
r an
d b
ags.
It is
po
ssib
le t
hat
clo
th is
imp
ort
edfr
om
on
e te
rrit
ory
, sew
n in
to a
gar
men
t in
a s
eco
nd
ter
rito
ry, a
nd
then
exp
ort
ed f
or
sale
in a
th
ird
terr
ito
ry. T
hro
ug
ho
ut
this
pro
cess
th
em
ater
ials
will
usu
ally
gai
n v
alu
e.
•D
ata
sour
ce: U
nite
d N
atio
ns C
onfe
renc
e on
Tra
dean
d D
evel
opm
ent,
200
2.•
*The
re w
ere
no n
et e
xpor
ts o
f cl
othi
ng r
ecor
ded
for
122
terr
itorie
s.
•Se
e w
ebsi
te f
or f
urth
er in
form
atio
n.
Terri
tory
siz
e sh
ows
the
prop
ortio
n of
wor
ldw
ide
net e
xpor
tsof
clo
thes
(in
US$
) tha
t com
e fro
m th
ere.
Net
exp
orts
are
expo
rts m
inus
impo
rts.
Whe
n im
ports
are
larg
er th
an e
xpor
tsth
e te
rrito
ry is
not
sho
wn.
Map
083
Ro
lan
d B
uer
k, 2
005
REG
ION
AL
NET
CLO
THIN
G E
XPO
RTS
annual earnings from regional netclothing exports in billions of US$
Zdro
j: SA
SI G
roup
(Uni
vers
ity o
f She
ffiel
d) a
Mar
k N
ewm
an (U
nive
rsity
of M
ichi
gan)

Příloha 1b
Ran
kTe
rrit
ory
Val
ue
113
Para
guay
1.35
114
Uni
ted
Repu
blic
of
Tanz
ania
1.22
115
Aze
rbai
jan
1.17
116
Buru
ndi
0.98
117
Nig
eria
0.87
118
Zam
bia
0.68
119
Libe
ria0.
6012
0C
omor
os0.
5912
1Is
lam
ic R
epub
lic o
f Ira
n0.
5612
2M
ozam
biqu
e0.
41
MO
ST A
ND
LEA
ST U
S$ O
F N
ET C
LOTH
ING
IMPO
RTS
Tech
nic
al n
ote
s
© C
opyr
ight
200
6 SA
SI G
roup
(Uni
vers
ity o
f She
ffiel
d) a
nd M
ark
New
man
(Uni
vers
ity o
f Mich
igan
)
US$
wor
th o
f cl
othi
ng im
port
s pe
r pe
rson
livi
ng in
tha
t te
rrito
ry*
Ran
kTe
rrit
ory
Val
ue
1N
iue
3102
2A
ndor
ra20
713
Uni
ted
Ara
b Em
irate
s52
34
Switz
erla
nd43
55
Nor
way
410
6Ic
elan
d36
57
Gre
enla
nd35
98
Cyp
rus
346
9Ire
land
318
10U
nite
d K
ingd
om27
9
Land
are
a
0102030405060708090100
Japan
Western Europe
North America
Eastern Europe
South America
Eastern Asia
Middle East
Asia Pacific
Southern Asia
Northern Africa
Southeastern Africa
Central Africa
Clot
hing
Impo
rts
ww
w.w
orld
map
per.o
rg
Prod
uced
by
the
SASI
gro
up (S
heffi
eld)
and
Mar
k N
ewm
an (M
ichi
gan)
“...
we
are
tryi
ng to
bal
ance
a n
umbe
r of
inte
rest
s he
re b
ecau
se o
bvio
usly
peo
ple
wan
t les
s ex
pens
ive
good
s ...
”
Des
pit
e th
e va
st r
ang
e o
f cl
oth
ing
styl
es t
hro
ug
ho
ut
the
wo
rld
, th
ere
isa
larg
e in
tern
atio
nal
tra
de
in c
loth
es.
Thes
e cl
oth
es a
rriv
e, m
ore
oft
en t
han
no
t, in
th
e U
nit
ed S
tate
s, W
este
rnEu
rop
e an
d J
apan
.
Mo
st c
loth
es a
re m
ade
in t
erri
tori
esw
her
e em
plo
yers
can
pay
low
lab
ou
rco
sts,
wh
ich
par
tial
ly m
ain
tain
s lo
wp
rice
s fo
r th
e p
op
ula
tio
ns
of
imp
ort
ing
ter
rito
ries
.
Spen
din
g p
er p
erso
n o
n im
po
rts
(net
US$
) sh
ow
s th
at s
om
e W
este
rnEu
rop
ean
ter
rito
ries
hav
e h
igh
imp
ort
rate
s. T
her
e ar
e p
arti
cula
rly
low
net
imp
ort
s p
er p
erso
n t
o s
om
e te
rrit
ori
esin
No
rth
ern
an
d S
ou
thea
ster
n A
fric
a.
•D
ata
sour
ce: U
nite
d N
atio
ns C
onfe
renc
e on
Tra
dean
d D
evel
opm
ent,
200
2.•
*The
re w
ere
no n
et c
loth
ing
impo
rts
reco
rded
for
78 t
errit
orie
s.•
See
web
site
for
fur
ther
info
rmat
ion.
Terri
tory
siz
e sh
ows
the
prop
ortio
n of
wor
ldw
ide
net i
mpo
rtsof
clo
thes
(in
US$
) tha
t are
rece
ived
ther
e. N
et im
port
s ar
eim
ports
min
us e
xpor
ts.
Whe
n ex
ports
are
larg
er th
an im
ports
the
terr
itory
is n
ot s
how
n.
Map
084
Ton
y B
lair
, 20
05
REG
ION
AL
NET
CLO
THIN
G IM
POR
TS
annual spending on regional netclothing imports in billions of US$
Zdro
j: SA
SI G
roup
(Uni
vers
ity o
f She
ffiel
d) a
Mar
k N
ewm
an (U
nive
rsity
of M
ichi
gan)

Příloha 1b Příloha 2a
Ran
kTe
rrit
ory
Val
ue
17Ph
ilipp
ines
1.20
18Sr
i Lan
ka1.
1419
Bela
rus
0.63
20Br
azil
0.61
21V
iet
Nam
0.59
22In
done
sia
0.57
23Tu
nisi
a0.
3524
Ukr
aine
0.14
25Bu
lgar
ia0.
1133
Indi
a0.
03
MO
ST A
ND
LEA
ST U
S$ O
F N
ET T
OY
EX
POR
TS
Tech
nic
al n
ote
s
© C
opyr
ight
200
6 SA
SI G
roup
(Uni
vers
ity o
f She
ffiel
d) a
nd M
ark
New
man
(Uni
vers
ity o
f Mich
igan
)
US$
wor
th o
f to
ys e
xpor
ted
annu
ally
per
per
son
livin
g in
tha
t te
rrito
ry*
Ran
kTe
rrit
ory
Val
ue
1H
ong
Kon
g (C
hina
)80
02
Mal
ta91
3Ta
iwan
754
Hun
gary
625
Aus
tria
386
Slov
enia
157
DPR
Kor
ea14
8C
zech
Rep
ublic
119
Chi
na9
10Ita
ly8
Land
are
a
02468101214161820
Japan
Western Europe
North America
Eastern Europe
South America
Eastern Asia
Middle East
Asia Pacific
Southern Asia
Northern Africa
Southeastern Africa
Central Africa
Toy
Expo
rts
ww
w.w
orld
map
per.o
rg
Prod
uced
by
the
SASI
gro
up (S
heffi
eld)
and
Mar
k N
ewm
an (M
ichi
gan)
“At C
ity
Toys
Ltd
., …
She
nzhe
n, y
oung
ster
s w
orke
d 16
-hou
r da
ys, s
even
day
s a
wee
k”
Mo
re t
oys
are
exp
ort
ed (U
S$ n
et) f
rom
East
ern
Asi
a th
an f
rom
an
y o
ther
reg
ion
. Th
e va
lue
of
net
exp
ort
sd
epen
ds
on
a c
om
bin
atio
n o
f h
ow
mu
ch is
exp
ort
ed, h
ow
mu
ch is
imp
ort
ed, a
nd
th
e p
rice
s p
aid
.
In t
erm
s o
f ea
rnin
gs
fro
m t
oy
exp
ort
s,th
ere
is c
on
sid
erab
le v
aria
tio
nb
etw
een
Eas
tern
Asi
an t
erri
tori
es. N
etex
po
rts
earn
ing
s p
er p
erso
n f
rom
Ho
ng
Ko
ng
are
mo
re t
han
10
tim
esg
reat
er t
han
th
ose
fro
m T
aiw
an, a
nd
alm
ost
100
tim
es g
reat
er t
han
th
ose
fro
m C
hin
a.
Toys
, in
clu
din
g s
po
rts
equ
ipm
ent,
mak
e u
p 1
% o
f w
orl
dw
ide
exp
ort
sw
hen
mea
sure
d in
US
do
llars
.
•D
ata
sour
ce: U
nite
d N
atio
ns C
onfe
renc
e on
Tra
dean
d D
evel
opm
ent,
200
2.•
*The
re w
ere
no n
et t
oy e
xpor
ts r
ecor
ded
for
167
terr
itorie
s. R
anks
26
to 3
1 w
ere
excl
uded
fro
mth
e ta
ble
beca
use
the
estim
ates
per
per
son
for
thes
e po
sitio
ns w
ere
iden
tical
.•
See
web
site
for
fur
ther
info
rmat
ion.
Terr
itory
siz
e sh
ows
the
prop
ortio
n of
wor
ldw
ide
net
expo
rts
of to
ys (i
n U
S$) t
hat c
ome
from
ther
e. N
etex
port
s ar
e ex
port
s m
inus
impo
rts.
Whe
n im
port
s ar
ela
rger
than
exp
orts
the
terr
itory
is n
ot s
how
n. Map
057
Ag
ence
Fra
nce
-Pre
sse,
200
0
REG
ION
AL
NET
TO
YS
EXPO
RTS
annual earnings from regional net toyexports in billions of US$
Zdro
j: SA
SI G
roup
(Uni
vers
ity o
f She
ffiel
d) a
Mar
k N
ewm
an (U
nive
rsity
of M
ichi
gan)

Příloha 2b
Ran
kTe
rrit
ory
Val
ue
158
Nig
er0.
0315
9M
ali
0.03
160
Ethi
opia
0.02
161
Cha
d0.
0216
2Rw
anda
0.02
163
Togo
0.01
164
Buru
ndi
0.01
165
Libe
ria0.
0116
6So
mal
ia0.
0116
7Ta
jikis
tan
<0.
01
MO
ST A
ND
LEA
ST U
S$ O
F N
ET T
OY
IMPO
RTS
Tech
nic
al n
ote
s
© C
opyr
ight
200
6 SA
SI G
roup
(Uni
vers
ity o
f She
ffiel
d) a
nd M
ark
New
man
(Uni
vers
ity o
f Mich
igan
)
US$
wor
th o
f to
ys im
port
ed a
nnua
lly p
er p
erso
n liv
ing
in t
hat
terr
itory
*
Ran
kTe
rrit
ory
Val
ue
1A
ndor
ra34
02
Gre
enla
nd57
3U
nite
d St
ates
514
Icel
and
485
Nor
way
486
Niu
e39
7Lu
xem
bour
g36
8N
ew Z
eala
nd36
9C
ypru
s35
10C
anad
a33
Land
are
a
02468101214161820
Japan
Western Europe
North America
Eastern Europe
South America
Eastern Asia
Middle East
Asia Pacific
Southern Asia
Northern Africa
Southeastern Africa
Central Africa
Toy
Impo
rts
ww
w.w
orld
map
per.o
rg
Prod
uced
by
the
SASI
gro
up (S
heffi
eld)
and
Mar
k N
ewm
an (M
ichi
gan)
“Is
ther
e a
pres
ent t
hat a
chi
ld o
r fa
mily
mem
ber
just
has
to h
ave
and
you
can’
t fin
d it
in a
ny s
tore
?”
Mo
st im
po
rts
of
toys
(U
S$ n
et)
are
toth
e U
nit
ed S
tate
s, f
ollo
wed
by
the
Un
ited
Kin
gd
om
. To
ys a
re f
un
bu
t n
ot
nec
essi
ties
. Th
us
toy
imp
ort
s g
ive
anin
dic
atio
n o
f d
isp
osa
ble
inco
mes
.
The
low
est
imp
ort
s o
f to
ys (
US$
net
)p
er p
erso
n a
re t
o t
erri
tori
es in
Afr
ica
and
als
o T
ajik
ista
n (i
n t
he
Mid
dle
Eas
t).
Cen
tral
Afr
ica,
So
uth
east
ern
Afr
ica,
Sou
ther
n A
sia
and
No
rth
ern
Afr
ica
con
tain
th
e p
oo
rest
ter
rito
ries
in t
he
wo
rld
.
The
hig
hes
t im
po
rts
of
toys
(U
S$ n
et)
per
per
son
are
to
ter
rito
ries
in W
este
rnEu
rop
e, N
ort
h A
mer
ica,
Asi
a Pa
cifi
can
d E
aste
rn E
uro
pe.
•D
ata
sour
ce: U
nite
d N
atio
ns C
onfe
renc
e on
Tra
dean
d D
evel
opm
ent,
200
2.•
*The
re w
ere
no n
et t
oy im
port
s re
cord
ed f
or 3
3te
rrito
ries.
•Th
e to
ys c
ateg
ory
incl
udes
spo
rtin
g go
ods.
•Se
e w
ebsi
te f
or f
urth
er in
form
atio
n.
Terri
tory
siz
e sh
ows
the
prop
ortio
n of
wor
ldw
ide
net i
mpo
rtsof
toys
(in
US$)
that
are
rece
ived
ther
e. N
et im
ports
are
impo
rtsm
inus
exp
orts
. W
hen
expo
rts
are
larg
er th
an im
port
s th
ete
rrito
ry is
not
sho
wn.
Map
058
Kid
sou
rce,
200
0
REG
ION
AL
NET
TO
YS
EXPO
RTS
annual spending on regional net toyimports in billions of US$
Zdro
j: SA
SI G
roup
(Uni
vers
ity o
f She
ffiel
d) a
Mar
k N
ewm
an (U
nive
rsity
of M
ichi
gan)

Příloha 2b Příloha 3a
Ran
kTe
rrit
ory
Val
ue
16D
PR K
orea
27.0
217
Hun
gary
26.2
7…
Asi
a Pa
cific
Ave
rage
22.6
425
Indo
nesi
a18
.24
26C
hina
13.8
827
Port
ugal
12.4
728
Bela
rus
6.48
29Tu
rkey
5.34
30Tu
nisi
a5.
0131
Belg
ium
2.60
MO
ST A
ND
LEA
ST U
S$ O
F N
ET E
LEC
TRO
NIC
S EX
POR
TS
Tech
nic
al n
ote
s
© C
opyr
ight
200
6 SA
SI G
roup
(Uni
vers
ity o
f She
ffiel
d) a
nd M
ark
New
man
(Uni
vers
ity o
f Mich
igan
)
US$
wor
th o
f el
ectr
onic
s ex
port
s pe
r pe
rson
livi
ng in
tha
t te
rrito
ry*
Ran
kTe
rrit
ory
Val
ue
1Ire
land
716
2Ta
iwan
535
3M
alay
sia
404
4H
ong
Kon
g (C
hina
)34
25
Japa
n32
66
Sing
apor
e27
97
Slov
enia
270
8Sw
itzer
land
219
9Sa
int
Kitt
s &
Nev
is20
310
Sam
oa18
7
Land
are
a
0102030405060
Japan
Western Europe
North America
Eastern Europe
South America
Eastern Asia
Middle East
Asia Pacific
Southern Asia
Northern Africa
Southeastern Africa
Central Africa
Elec
tron
ics
Expo
rts
ww
w.w
orld
map
per.o
rg
Prod
uced
by
the
SASI
gro
up (S
heffi
eld)
and
Mar
k N
ewm
an (M
ichi
gan)
“The
abi
lity
of n
atio
ns to
com
pete
glo
bally
is n
ot a
func
tion
of s
ize,
as K
orea
, Tai
wan
, Sin
gapo
re, H
ong
Kon
g,an
d M
alay
sia
dem
onst
rate
.”
Asi
an t
erri
tori
es a
re t
he
maj
or
wo
rld
-su
pp
lier
of
elec
tro
nic
s. In
par
ticu
lar
Jap
an, C
hin
a, T
aiw
an a
nd
Mal
aysi
a.A
s 85
% o
f te
rrit
ori
es im
po
rt (
net
)el
ectr
on
ic it
ems,
th
ese
exp
ort
ing
terr
ito
ries
are
fro
m w
her
e th
ese
dem
and
s ar
e m
et. T
hes
e te
rrit
ori
es,
wit
h o
ther
s, a
re s
om
etim
es r
efer
red
to a
s A
sian
Tig
ers,
or
Tig
er e
con
om
ies.
This
is c
laim
ed t
o b
e d
ue
to t
hei
r h
igh
gro
wth
, rap
id-i
nd
ust
rial
isat
ion
an
dex
po
rt-d
rive
n t
rad
e st
rate
gie
s.
Wo
rld
wid
e, e
lect
ron
ics
exp
ort
sg
ener
ate
10.2
% o
f al
l mo
ney
ear
nt
fro
m t
rad
e in
go
od
s. E
lect
ron
ics
incl
ud
e te
levi
sio
n a
nd
rad
io r
ecei
vers
,p
ho
tog
rap
hy
equ
ipm
ent,
an
d e
lect
ro-
med
ical
eq
uip
men
t.
•D
ata
sour
ce: U
nite
d N
atio
ns C
onfe
renc
e on
Tra
dean
d D
evel
opm
ent,
200
2.•
*The
re w
ere
no n
et e
xpor
ts o
f ele
ctro
nics
reco
rded
for
169
terr
itorie
s. F
or 7
ter
ritor
ies
in A
sia
Paci
ficth
e re
gion
al a
vera
ge w
as u
sed.
•Se
e w
ebsi
te f
or f
urth
er in
form
atio
n.
Terri
tory
siz
e sh
ows
the
prop
ortio
n of
wor
ldw
ide
net e
xpor
tsof
ele
ctro
nics
(in
US$
) tha
t com
e fro
m th
ere.
Net
exp
orts
are
expo
rts m
inus
impo
rts.
Whe
n im
ports
are
larg
er th
an e
xpor
tsth
e te
rrito
ry is
not
sho
wn.
Map
089
Mic
hae
l J. K
elly
, 199
7
REG
ION
AL
NET
ELE
CTR
ON
ICS
EXPO
RTS
annual earnings from regional netelectronics exports in billions of US$
Zdro
j: SA
SI G
roup
(Uni
vers
ity o
f She
ffiel
d) a
Mar
k N
ewm
an (U
nive
rsity
of M
ichi
gan)
Příloha 3b
Ran
kTe
rrit
ory
Val
ue
160
Com
oros
1.35
161
Ukr
aine
1.08
162
Kyr
gyzs
tan
1.07
163
Sier
ra L
eone
1.06
164
Nig
er1.
0216
5So
mal
ia0.
9716
6Bu
rund
i0.
8516
7C
entr
al A
fric
an R
epub
lic0.
7016
8M
ali
0.50
169
Libe
ria0.
37
MO
ST A
ND
LEA
ST U
S$ O
F N
ET E
LEC
TRO
NIC
S IM
POR
TS
Tech
nic
al n
ote
s
© C
opyr
ight
200
6 SA
SI G
roup
(Uni
vers
ity o
f She
ffiel
d) a
nd M
ark
New
man
(Uni
vers
ity o
f Mich
igan
)
US$
wor
th o
f el
ectr
onic
s im
port
ed p
er p
erso
n liv
ing
in t
hat
terr
itory
*
Ran
kTe
rrit
ory
Val
ue
1A
ndor
ra16
802
Qat
ar65
83
Icel
and
649
4U
nite
d A
rab
Emira
tes
611
5G
reen
land
410
6Ba
hrai
n40
37
Nor
way
400
8C
anad
a39
99
Brun
ei D
arus
sala
m39
610
Esto
nia
306
Land
are
a
0102030405060
Japan
Western Europe
North America
Eastern Europe
South America
Eastern Asia
Middle East
Asia Pacific
Southern Asia
Northern Africa
Southeastern Africa
Central Africa
Elec
tron
ics
Impo
rts
ww
w.w
orld
map
per.o
rg
Prod
uced
by
the
SASI
gro
up (S
heffi
eld)
and
Mar
k N
ewm
an (M
ichi
gan)
“And
orra
was
bor
n of
com
mer
ce a
nd li
ves
by c
omm
erce
. It i
s a
nati
on o
f mer
chan
ts …
peo
ple
don’
t jus
t com
eto
ski
, the
y co
me
shop
ping
.”
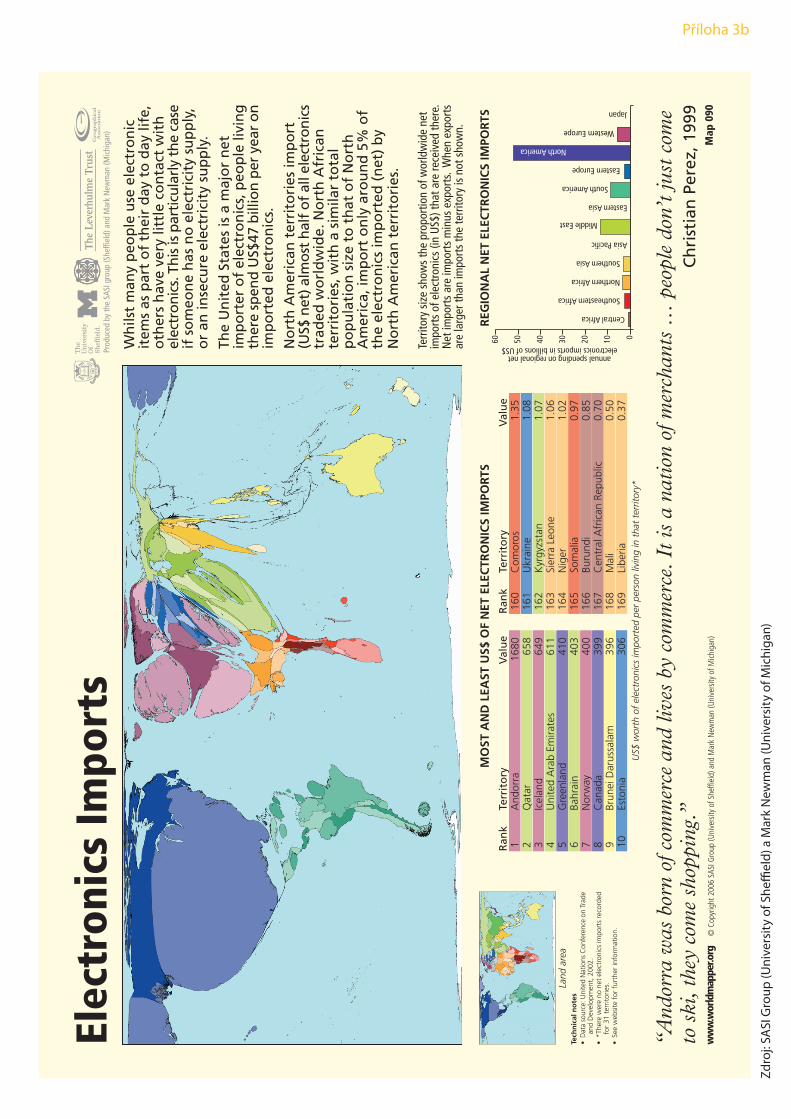
Wh
ilst
man
y p
eop
le u
se e
lect
ron
icit
ems
as p
art
of
thei
r d
ay t
o d
ay li
fe,
oth
ers
hav
e ve
ry li
ttle
co
nta
ct w
ith
elec
tro
nic
s. T
his
is p
arti
cula
rly
the
case
if s
om
eon
e h
as n
o e
lect
rici
ty s
up
ply
,o
r an
inse
cure
ele
ctri
city
su
pp
ly.
The
Un
ited
Sta
tes
is a
maj
or
net
imp
ort
er o
f el
ectr
on
ics,
peo
ple
livi
ng
ther
e sp
end
US$
47 b
illio
n p
er y
ear
on
imp
ort
ed e
lect
ron
ics.
No
rth
Am
eric
an t
erri
tori
es im
po
rt(U
S$ n
et) a
lmo
st h
alf
of
all e
lect
ron
ics
trad
ed w
orl
dw
ide.
No
rth
Afr
ican
terr
ito
ries
, wit
h a
sim
ilar
tota
lp
op
ula
tio
n s
ize
to t
hat
of
No
rth
Am
eric
a, im
po
rt o
nly
aro
un
d 5
% o
fth
e el
ectr
on
ics
imp
ort
ed (
net
) b
yN
ort
h A
mer
ican
ter
rito
ries
.
•D
ata
sour
ce: U
nite
d N
atio
ns C
onfe
renc
e on
Tra
dean
d D
evel
opm
ent,
200
2.•
*The
re w
ere
no n
et e
lect
roni
cs im
port
s re
cord
edfo
r 31
ter
ritor
ies.
•Se
e w
ebsi
te f
or f
urth
er in
form
atio
n.
Terr
itory
siz
e sh
ows
the
prop
ortio
n of
wor
ldw
ide
net
impo
rts
of e
lect
roni
cs (i
n U
S$) t
hat a
re re
ceiv
ed th
ere.
Net
impo
rts
are
impo
rts
min
us e
xpor
ts.
Whe
n ex
port
sar
e la
rger
than
impo
rts
the
terr
itory
is n
ot s
how
n.
Map
090
Ch
rist
ian
Per
ez, 1
999
REG
ION
AL
NET
ELE
CTR
ON
ICS
IMPO
RTS
annual spending on regional netelectronics imports in billions of US$
Zdro
j: SA
SI G
roup
(Uni
vers
ity o
f She
ffiel
d) a
Mar
k N
ewm
an (U
nive
rsity
of M
ichi
gan)