zeel company presentationakamai.vidz.zeecdn.com/zeetele/pdfs/presentationdec2010... ·...
TRANSCRIPT
1
COMPANY OVERVIEW
DECEMBER 2010

2
DISCLAIMER
Some of the statements made in this presentation are forward-looking statements andare based on the current beliefs, assumptions, expectations, estimates, objectives andprojections of the directors and management of Zee Entertainment EnterprisesLimited (ZEEL) about its business and the industry and markets in which it operates.
These forward-looking statements include, without limitation, statements relating torevenues and earnings. The words“believe”, “anticipate”, “expect”, “estimate”, “intend”, “project” and similar expressionsare also intended to identify forward looking statements.
These statements are not guarantees of future performance and are subject torisks, uncertainties and other factors, some of which are beyond the control of theCompany and are difficult to predict. Consequently, actual results could differmaterially from those expressed or forecast in the forward-looking statements as aresult of, among other factors, changes in economic and market conditions, changes inthe regulatory environment and other business and operational risks. ZEEL does notundertake to update these forward-looking statements to reflect events orcircumstances that may arise after publication.

ZEE ENTERTAINMENT
Hindi
Entertainment
Sports Channels
Regional
Entertainment
English
Entertainment
Music & Lifestyle
Largest Indian TV Network in the World
3

Leading Hindi Entertainment Network
4

Leading Sports Network
5

Leading Regional Entertainment Network
6

English Entertainment
7

8
Indian Music and Lifestyle Network
9
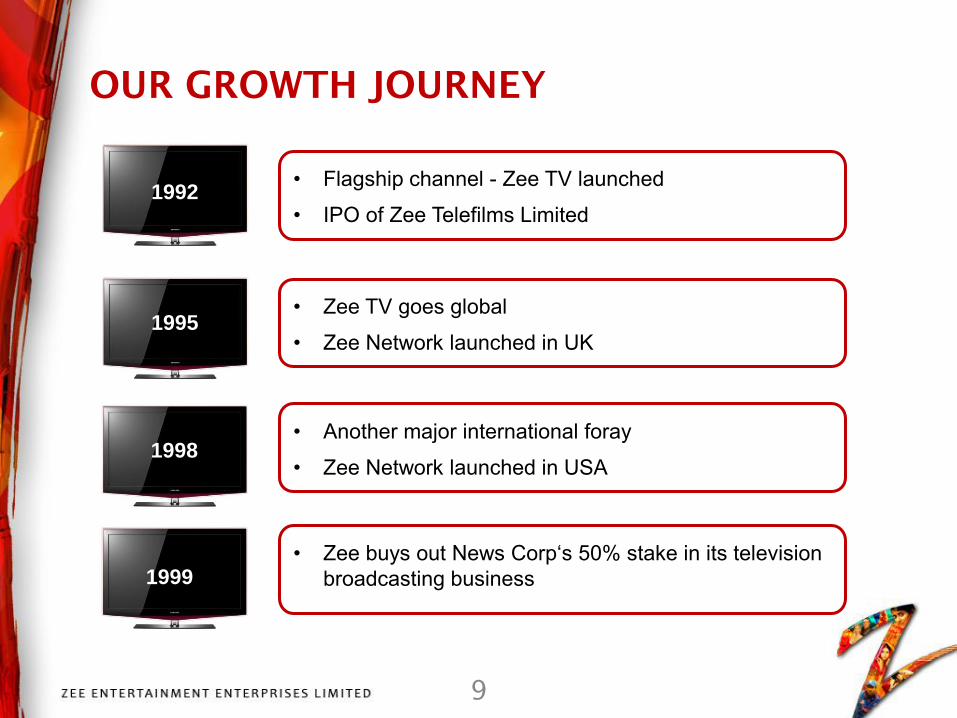
OUR GROWTH JOURNEY
1992
1995
1998
1999
• Flagship channel - Zee TV launched
• IPO of Zee Telefilms Limited
• Zee TV goes global
• Zee Network launched in UK
• Another major international foray
• Zee Network launched in USA
• Zee buys out News Corp‘s 50% stake in its television broadcasting business
10
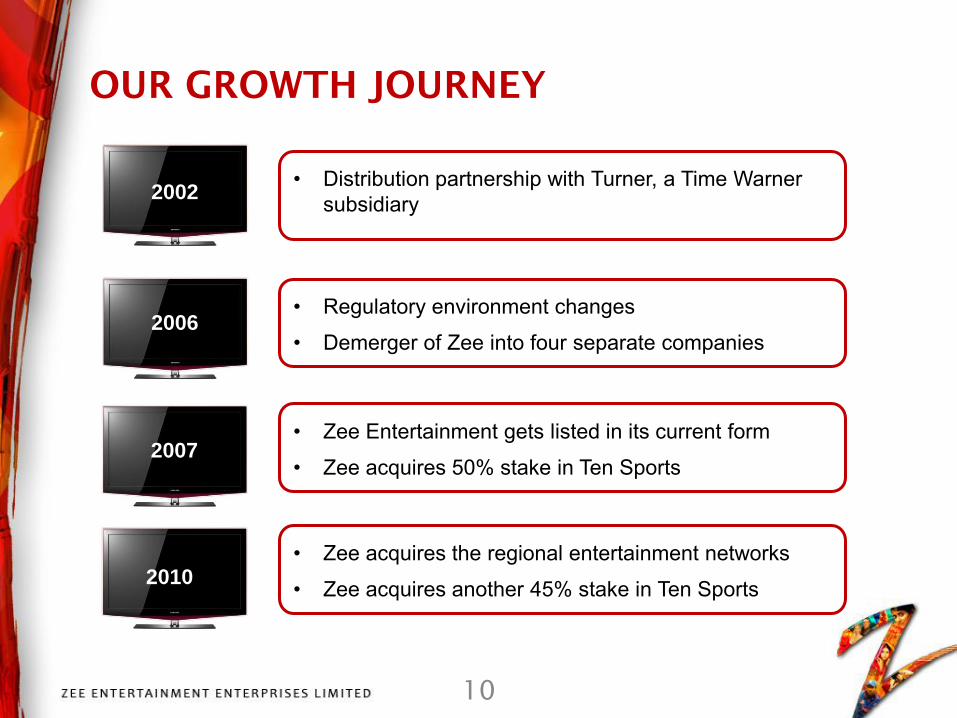
OUR GROWTH JOURNEY
2002
2006
2007
2010
• Distribution partnership with Turner, a Time Warner subsidiary
• Regulatory environment changes
• Demerger of Zee into four separate companies
• Zee Entertainment gets listed in its current form
• Zee acquires 50% stake in Ten Sports
• Zee acquires the regional entertainment networks
• Zee acquires another 45% stake in Ten Sports

BACKDROP: BUOYANT INDIAN ECONOMY
Source: Central Statistical Organization (CSO), National Council of Applied Economic Research (NCAER)
India less impacted by meltdown; Recovery faster than rest of the world
GDP is expected to grow at 8.4% this fiscal year
Infrastructure spending expected to double in the 12th Five-Year Plan to $1
trillion from $500 billion in the 11th Five-Year Plan ending 2011-12
4.4%5.8%
3.8%
8.5%7.5%
9.5% 9.7% 9.2%
6.7%7.4%
8.4%
2001 2002 2003 2004 2005 2006 2007 2008 2009 2010 2011E
YoY Growth in India's real GDP, March fiscal-year ends, 2001-2011E
-0.2%
6.3%
-7.2%
10.0%
0.0%
5.2%3.7%
4.7%
1.6% 0.2%
6.6%6.4%
2.4%
6.8% 6.0%
8.5% 8.1%
13.6%
9.3%
3.1%
10.4%8.8%
5.7%
6.9% 7.5% 8.8%
9.9%11.3%
10.2%10.4%
9.3%
8.3%8.7%
2001 2002 2003 2004 2005 2006 2007 2008 2009 2010 2011E
India's Real GDP Growth by Sectors, 2001-2010
Agriculture & Allied Activities Industry Services Sector
11
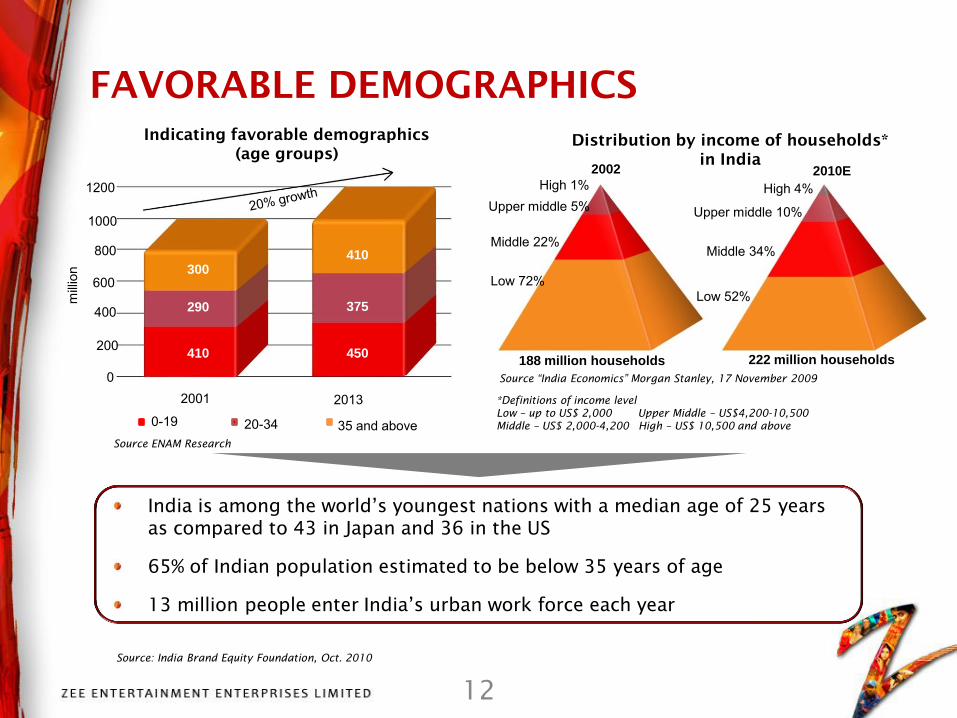
FAVORABLE DEMOGRAPHICS
India is among the world’s youngest nations with a median age of 25 years
as compared to 43 in Japan and 36 in the US
65% of Indian population estimated to be below 35 years of age
13 million people enter India’s urban work force each year
Source ENAM Research
Distribution by income of households*
in India
2002 2010EHigh 1%Upper middle 5%
Middle 22%
Low 72%
High 4%
Upper middle 10%
Middle 34%
Low 52%
188 million households 222 million households
Source “India Economics” Morgan Stanley, 17 November 2009
*Definitions of income level
Low – up to US$ 2,000 Upper Middle – US$4,200-10,500
Middle – US$ 2,000-4,200 High – US$ 10,500 and above
400
600
800
1000
1200
0
Indicating favorable demographics
(age groups)
milli
on
20132001
410
290
300410
375
450200
Source: India Brand Equity Foundation, Oct. 2010
2002 2010E
12
0-19 20-34 35 and above
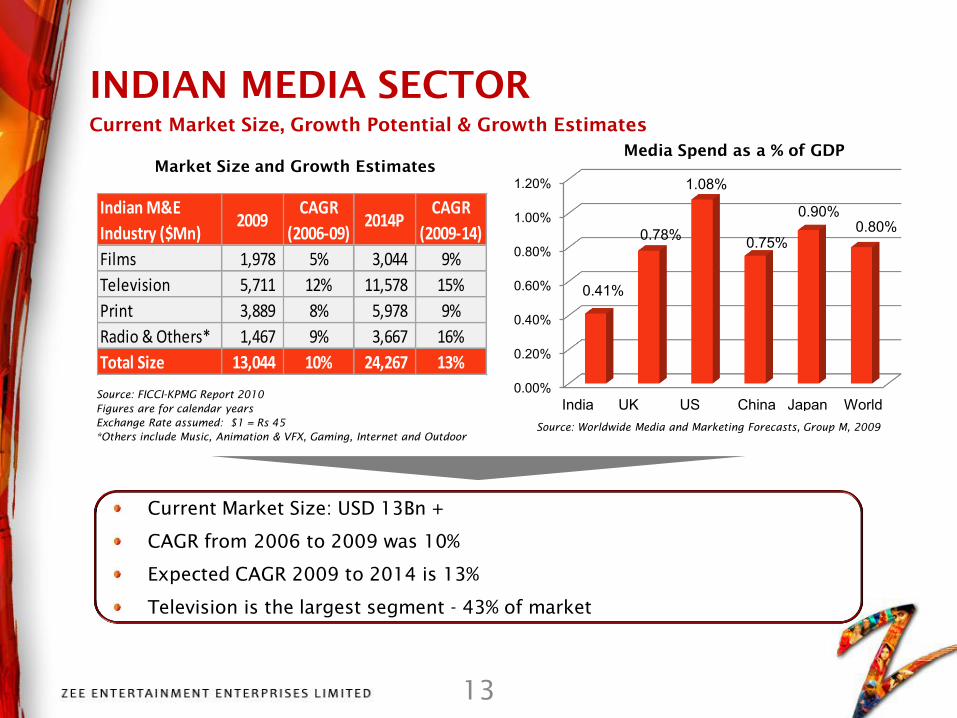
INDIAN MEDIA SECTOR
Source: FICCI-KPMG Report 2010
Figures are for calendar years
Exchange Rate assumed: $1 = Rs 45
*Others include Music, Animation & VFX, Gaming, Internet and Outdoor
Source: Worldwide Media and Marketing Forecasts, Group M, 2009
Current Market Size, Growth Potential & Growth Estimates
Indian M&E
Industry ($Mn)2009
CAGR
(2006-09)2014P
CAGR
(2009-14)
Films 1,978 5% 3,044 9%
Television 5,711 12% 11,578 15%
Print 3,889 8% 5,978 9%
Radio & Others* 1,467 9% 3,667 16%
Total Size 13,044 10% 24,267 13%0.00%
0.20%
0.40%
0.60%
0.80%
1.00%
1.20%
India UK US China Japan World
0.41%
0.78%
1.08%
0.75%
0.90%0.80%
Media Spend as a % of GDP
Market Size and Growth Estimates
Current Market Size: USD 13Bn +
CAGR from 2006 to 2009 was 10%
Expected CAGR 2009 to 2014 is 13%
Television is the largest segment - 43% of market
13

14
Reach of almost 500 million TV viewers
Number of channels: 450+
Average time spent on watching television: Approx 2.5 hrs per day
Intensive Competition in the Distribution space:
Six private DTH players
More than 5,000 MSOs
More than 60,000 LCOs
INDIA - TELEVISION LANDSCAPE
Source: FICCI-KPMG Report 2010; Figures as on end of calendar year 2009
69, 77%
4 5%
16 .
18%
0 , 0%
Pay TV Subscriber Base
(Mn Subs)
Analog Cable Digital Cable
DTH IPTV
95 , 74%
34, 26%
No. of Cable and Satellite (C&S)
HHs (Mn Subs)
C&S HHs Non-C&S HHs
129, 58%
93, 42%
No. of TV Households
(HHs) (in Mn Subs)
TV HHs Non-TV HHs
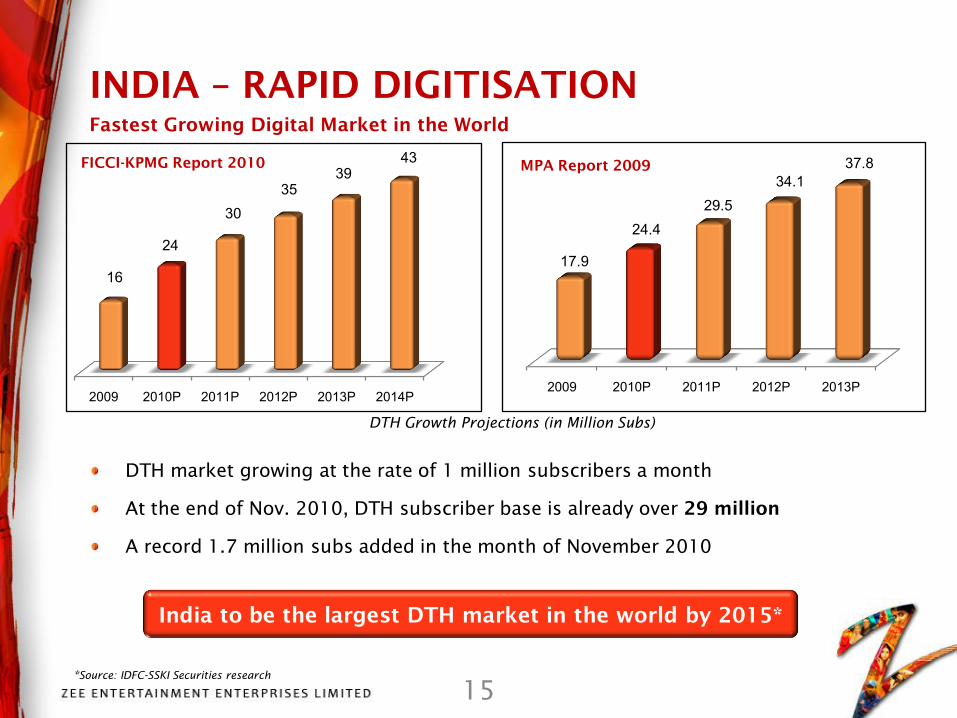
INDIA – RAPID DIGITISATION
Fastest Growing Digital Market in the World
DTH market growing at the rate of 1 million subscribers a month
At the end of Nov. 2010, DTH subscriber base is already over 29 million
A record 1.7 million subs added in the month of November 2010
India to be the largest DTH market in the world by 2015*
*Source: IDFC-SSKI Securities research
DTH Growth Projections (in Million Subs)
2009 2010P 2011P 2012P 2013P 2014P
FICCI-KPMG Report 2010
16
24
3035
3943
2009 2010P 2011P 2012P 2013P
MPA Report 2009
17.9
24.429.5
34.137.8
15

16

17
HINDI ENTERTAINMENT
HINDI MOVIES
ENGLISH ENTERTAINMENT & MOVIES
* 9X – Acquisition subject to Court approvals
PRODUCT OFFERING

18
REGIONAL LANGUAGE ENTERTAINMENT (R-GEC)
SPORTS
INTERNATIONAL
MUSIC/ LIFESTYLE/ NICHE
PRODUCT OFFERING

19
NETWORK VIEWERSHIP TRENDS%
V
iew
ership Share
Source: TAM Media Research, All Universe, All Markets of India, Total Network Cumulative Average Weekly Channel Shares, Calendar year
numbers
Zee
Star
Sun
Sony
Sony
Sun
Zee
Star

20
Advertising Subscription Other Sales
FY2010 Revenues: Rs 21,966 million
REVENUE CONTRIBUTION

21
BUSINESS PERFORMANCE
22
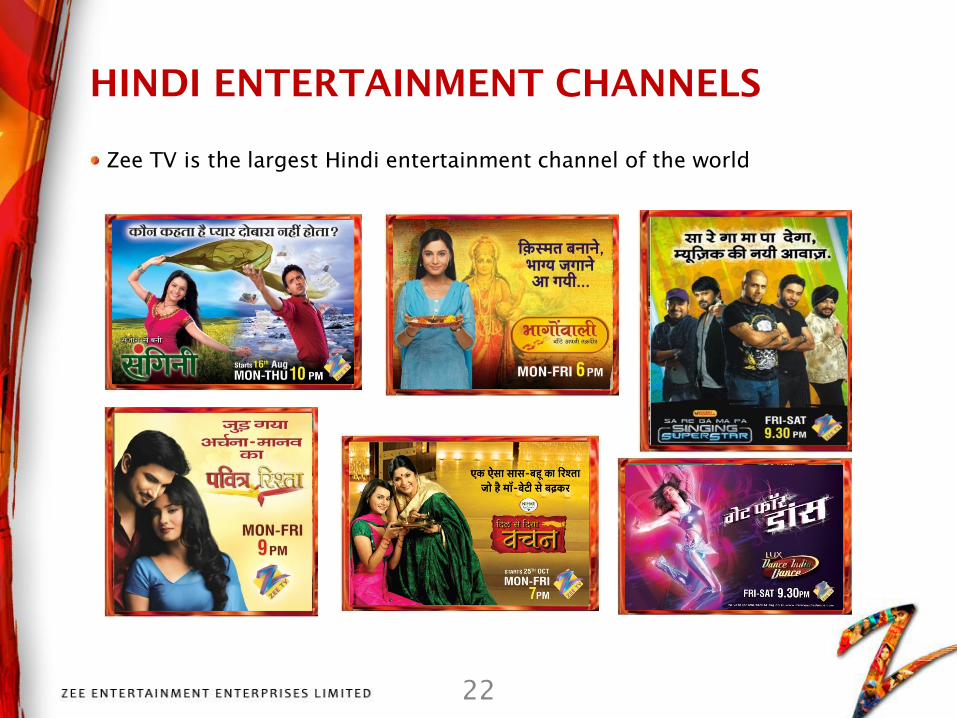
HINDI ENTERTAINMENT CHANNELS
Zee TV is the largest Hindi entertainment channel of the world
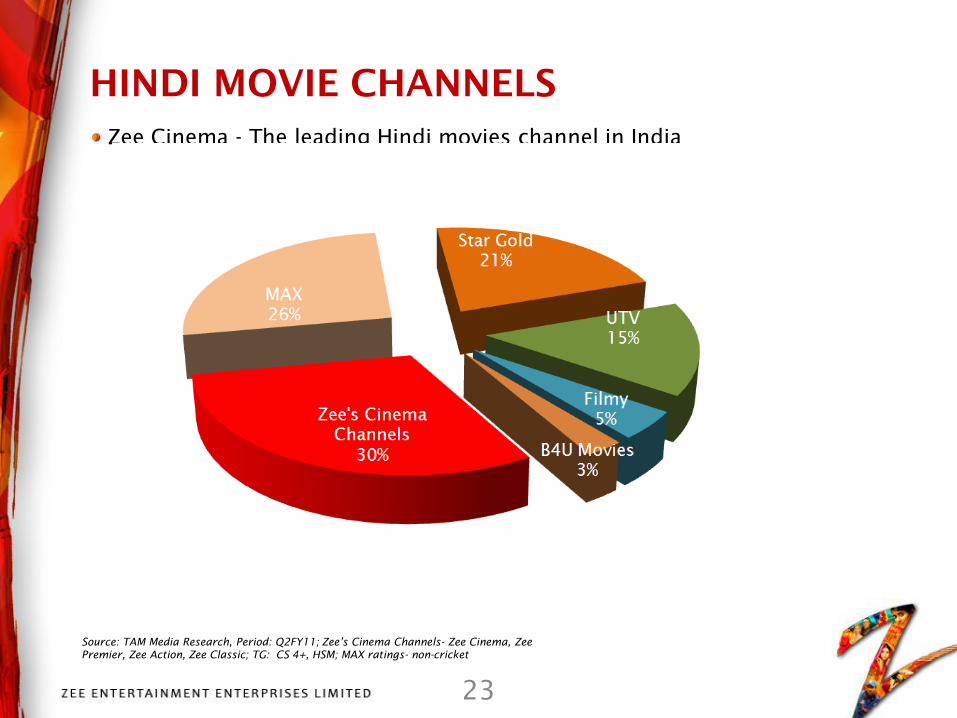
Source: TAM Media Research, Period: Q2FY11; Zee’s Cinema Channels- Zee Cinema, Zee
Premier, Zee Action, Zee Classic; TG: CS 4+, HSM; MAX ratings- non-cricket
Zee Cinema - The leading Hindi movies channel in India
Star Gold 21%
Filmy 5%
Zee Cinema 30%UTV 15%
Max 26%
HINDI MOVIE CHANNELS
23
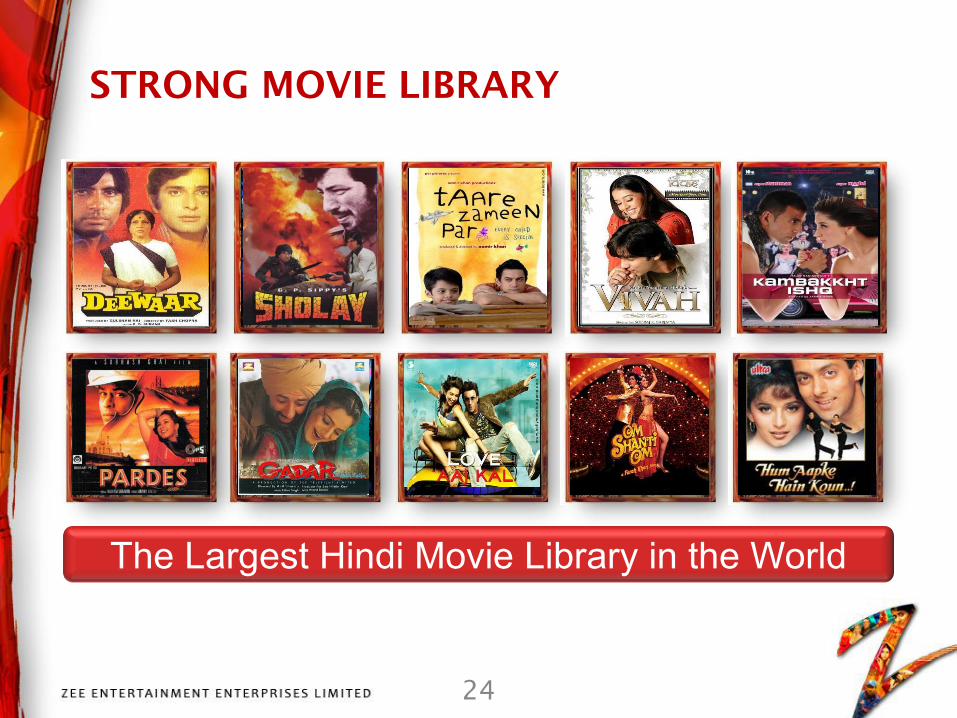
STRONG MOVIE LIBRARY
The Largest Hindi Movie Library in the World
24

SPORTS CHANNELS
25

26
SPORTS CHANNELS - KEY PROPERTIES

27
Source: TAM Media Research, Period: Q2 FY2011; Zee’s Sports Channels- Ten Sports & Zee Sports: CS Male 15+, All India
Ten Sports, Zee Sports & Ten Cricket- The leading
sports network of the country
Key properties in FY2011- West Indies vs South
Africa Series, Zimbabwe - India - Sri Lanka
Triangular Series, UEFA Champions League, Europa
League, WWE, India South Africa series, Asian
Games, Ryder Cup in Golf
CRICKET, SOCCER, TENNIS & MORE
Zee sports 50%

28
Tie-ups with leading studios from across the world
ENGLISH LANGUAGE CHANNELS

29
Zee Marathi – No. 1 channel in the
marathi language
Other regional offerrings - Zee Bangla,
Zee Telegu, Zee Kannada
Zee’s regional networks have a library
of over 32,000 hours of content and
rights to over 1,750 movie titles.
REGIONAL CONTENT - HIGHLIGHTS
Source: TAM Media Research, Period: Q2FY11, CS 4+, All
Maharashtra

30
INTERNATIONAL OPERATIONS
Presence across 5 continents through
over 15 channels
Catering to both South Asian as well
as non South Asian communities
Recent local language launches in
Russia, South East Asia, Saudi Arabia
International subscription contributed
19% of company top line in FY10
Renewed focus on advertising as a
source of revenues

31
1H FY 2011 RESULTS
APRIL 2010 – SEPTEMBER 2010
32
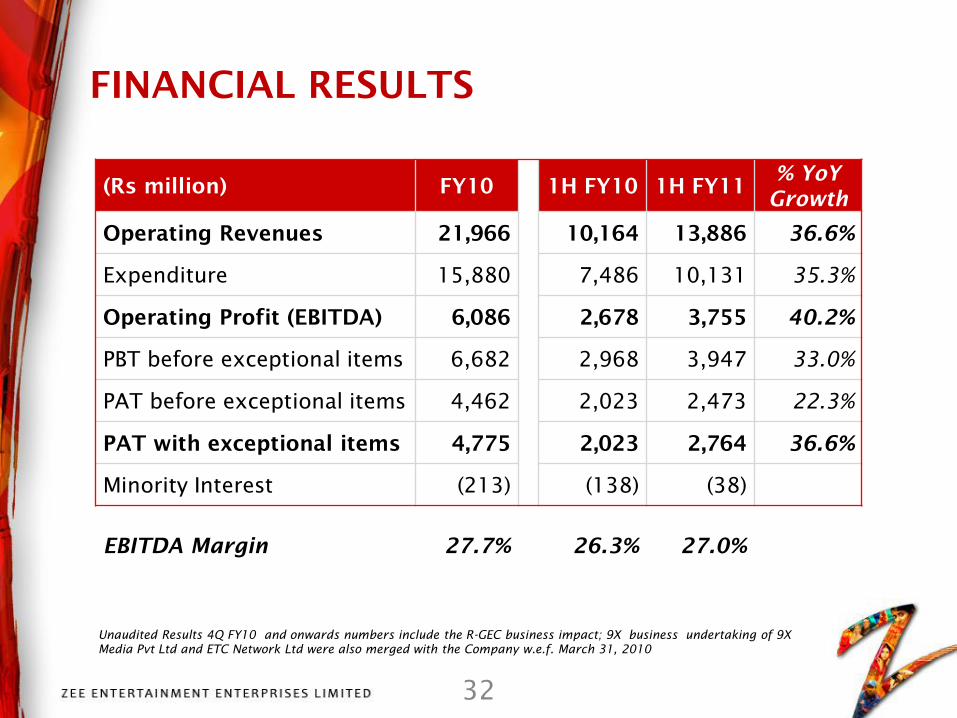
FINANCIAL RESULTS
Unaudited Results 4Q FY10 and onwards numbers include the R-GEC business impact; 9X business undertaking of 9X
Media Pvt Ltd and ETC Network Ltd were also merged with the Company w.e.f. March 31, 2010
(Rs million) FY10 1H FY10 1H FY11% YoY
Growth
Operating Revenues 21,966 10,164 13,886 36.6%
Expenditure 15,880 7,486 10,131 35.3%
Operating Profit (EBITDA) 6,086 2,678 3,755 40.2%
PBT before exceptional items 6,682 2,968 3,947 33.0%
PAT before exceptional items 4,462 2,023 2,473 22.3%
PAT with exceptional items 4,775 2,023 2,764 36.6%
Minority Interest (213) (138) (38)
EBITDA Margin 27.7% 26.3% 27.0%

33
DTH
rev. as a %
of C
able rev.
Domestic Cable Domestic DTH
Subscription Revenue (Rs. m
illion)
GROWING DIGITAL REVENUES
Y1 Axis Figures: INR million; Y2 Axis Figures: DTH as % of Cable; Domestic DTH Q3FY10 and Q4FY10 include a non recurring
amount of Rs 49.8 million and Rs 30 million respectively; 4Q FY 10 and onwards, numbers include R-GEC business revenues;
9X business undertaking of 9X Media Pvt Ltd and ETC Network Ltd were also merged with the Company w.e.f. March
31, 2010
DTH as a % of Cable
804840 845 849 851 864
821 822
894
961
249271 283
381
467514
632683
710
787
31% 32%
33%
45%
55%
59%
77% 83%79%
82%
0%
20%
40%
60%
80%
100%
0
200
400
600
800
1000
1200
Q1 FY09 Q2 FY09 Q3 FY09 Q4 FY09 Q1 FY10 Q2 FY10 Q3 FY10 Q4 FY10 Q1 FY11 Q2 FY11

34
BALANCE SHEET
Lower debt
Higher cash &
cash-equivalents
Significant level
of net cash in
balance sheet
FY2010 numbers include the R-GEC business impact w.e.f Jan 1, 2010; 9X business undertaking of 9X Media Pvt Ltd
and ETC Network Ltd were also merged with the Company w.e.f. March 31, 2010

2007 2008 2009 2010
15,159
18,354
21,773 21,998
3,204
5,423 5,480 6,135
Y-o-Y Growth in Revenues and Operating Profit (Rs Mn)
Revenue Operating profit
CONSISTENT PROFITABLE GROWTH
35
Consistent dividend payout since 1994

36
Revenues
Digitization: Big
pay opportunity
Advertising:
Continued growth
New streams:
Digital
media, syndication
OUTLOOK AND STRATEGY
Content
Innovation &
quality
Regional
revolution
Niche content
Broadcast to
narrowcast
Our Strategy
Enhance our leadership position in the genres we compete
Continue to run our business as best in class
Deploy strong cash flows to improve returns to shareholders
Returns
Consolidation
Collaboration
Disciplined
investments

37
QUESTIONS & ANSWERS
Consistent performer since inception; Shareholder value CAGR of >30% between 1992 to 2010