zen 2011 (blue edition) service pack 1 · 6.13 time series tool 100 6.13.1 duration section 101...
TRANSCRIPT
Manual
ZEN 2011 (blue edition) Service Pack 1
Printed 06/2012


Content
1 Legal notes 14
2 Introduction 16
2.1 Whats new? 16
2.1.1 Design dark/light 16
2.1.2 Show all mode 17
2.1.3 Multi columns layout 17
2.1.4 Interactive light path configuration 18
2.1.5 Workspace zoom 19
2.1.6 Workspace configuration 19
2.1.7 Automatic scaling 20
2.1.8 Digital Movie Recorder 20
2.2 Concept 21
2.2.1 Image Acquisition 21
2.2.2 Image Processing 21
2.2.3 Image Analysis 21
2.2.4 Documentation 22
3 First steps with ZEN blue software 23
3.1 Start ZEN blue software 23
3.2 Program interface 23
3.2.1 Title bar 24
3.2.2 Menu bar 25
3.2.3 Workspace configuration 25
3.2.4 Tool bar 25
3.2.5 Left Tool Area 26
3.2.6 Center Screen Area 26
3.2.7 Document bar 27
3.2.8 Right Tool Area 28
3.2.9 Status Bar 28
- List of System Messages 30
3.3 Set user language 30
3.4 Adjust workspace appearance 31
Content Manual
Carl Zeiss Microscopy GmbH 3

3.4.1 Select design 31
3.4.2 Show/hide areas 31
3.4.3 Undock/dock tool window 31
3.4.4 Show all mode of tool windows 32
3.5 Acquire a first image with ZEN blue 32
3.6 Close ZEN blue software 33
4 Menus 34
4.1 File menu 34
4.2 Edit menu 35
4.3 View menu 35
4.4 Acquisition menu 36
4.5 Graphic menu 37
4.6 Tools menu 38
4.6.1 Modules Manager dialog 38
4.6.2 Customize Toolbar dialog 39
4.6.3 Scaling dialog 40
- Scaling Wizard 41
4.6.4 Options dialog 41
- General 41
- Startup 42
- Naming 42
- Saving 43
- Documents 43
- Acquisition 44
- User 45
- Data Tables 46
4.7 Window menu 46
4.8 Help menu 47
5 Main tabs 48
5.1 Locate tab 48
5.1.1 Configure Favorites 49
Manual Content
4 Printed 06/2012

5.2 Camera tab (ZEN lite) 50
5.3 Acquisition tab 50
5.3.1 Experiment Manager 52
- Options 52
5.3.2 Smart Setup 53
5.3.3 Action buttons 53
5.3.4 Acquisition Dimensions 54
- Acquisition Sequence 54
5.3.5 Experiment Preview 56
5.3.6 Acquisition dialog window 58
- Add Dye or Contrast Technique dialog window 58
- Smart Setup Dialog 60
5.4 Processing tab 62
5.5 Analysis tab 63
5.6 Reporting tab 63
6 Tools (blue tools) 65
6.1 Microscope Components tool (ZEN lite) 65
6.2 Light Path tool 65
6.2.1 Reflected/Transmitted Light Path 66
6.2.2 Microscope Manager 68
6.2.3 Stage Control 68
6.2.4 Focus Control 70
6.3 Camera tool 71
6.3.1 Settings section 72
- Options 72
6.3.2 Exposure section 73
6.3.3 White Balance section 73
6.3.4 Mode section 74
6.3.5 Acquisition ROI section 74
6.3.6 Post-Processing section 75
6.3.7 Trigger Control section 76
6.3.8 Model Specific section 77
6.4 Software Autofocus tool 77
Content Manual
Carl Zeiss Microscopy GmbH 5
6.5 Movie Recorder tool 78
6.6 Light Path Settings tool 79
6.6.1 Before Experiment/After Experiment section 79
- Options 80
6.6.2 Acquisition Light Path section 80
6.6.3 Hardware Setting section 81
6.7 Acquisition Mode tool 81
6.7.1 Selected Camera section 82
6.7.2 Settings From Locate Tab section 82
6.7.3 White Balance section 82
6.7.4 Mode section 83
6.7.5 Acquisition ROI section 83
6.7.6 Post-Processing section 84
6.7.7 Trigger Control section 85
6.7.8 Model Specific section 86
6.7.9 Other Devices section 86
6.7.10 Fast Acquisition section 86
6.8 Channels tool 87
6.8.1 Channels list 87
- Options 88
6.8.2 Channel-specific settings 89
- Light Source section 89
- Camera Settings section 89
6.9 Experiment Designer tool 90
6.9.1 Enable Experiment Designer section 91
6.9.2 Acquisition Block section 91
6.9.3 Add Special Block section 91
- Options 92
6.9.4 One Image File Per Acquisition Block section 92
6.9.5 Loops and Repetitions section 92
6.10 Z-Stack tool 93
6.10.1 Automatic Configuration 93
6.10.2 Manual Configuration 94
- First/Last acquisition mode 95
Manual Content
6 Printed 06/2012

- Center acquisition mode 95
6.11 Tiles tool 96
6.11.1 Advanced Setup section 96
6.11.2 Add Tile Region section 96
6.11.3 Add Position section 97
6.11.4 Tile Regions and Positions section 97
- Tile Regions tab 97
- Positions tab 98
6.11.5 Options section 99
6.11.6 Sample Carrier section 99
6.11.7 Focus Surface section 100
6.12 Panorama tool 100
6.13 Time Series tool 100
6.13.1 Duration section 101
6.13.2 Interval section 101
6.13.3 Start/Stop/Pause section 102
6.13.4 Buttons section 102
6.14 Information on Experiment tool 103
6.15 Interactive Measurement tool 104
6.15.1 Features section 104
6.15.2 Feature Subset section 104
6.15.3 Measurement Procedure section 105
6.15.4 Create Measurement Data Table button 105
6.15.5 Interactive Measurement dialog windows 105
- Feature Selection dialog window 105
- Define Feature Subset dialog window 107
- Define Interactive Measurement Procedure dialog window 108
- Interactive Measurement Procedure dialog 109
6.16 Image Analysis tool 110
6.16.1 Image Analysis Wizard section 110
6.16.2 Programs section 111
6.16.3 The Image Analysis Wizard 111
- Step 1 - Program 111
- Step 2 - Classes 112
Content Manual
Carl Zeiss Microscopy GmbH 7

- Step 3 - Measurement Frames 112
- Step 4 - Threshold Values 114
- Step 5 - Condition 120
- Step 6 - Interactive Segmentation 122
- Step 7 - Measurement Features 124
- Step 8 - Measure 125
6.17 Report tool 126
6.17.1 Report Management section 126
6.17.2 Options 127
7 Image views 128
7.1 2D View 128
7.1.1 Navigator window 128
- Enlarging the image area 128
- Moving the region of interest 129
- Enlarging the Navigator window 129
- Moving the Navigator window 129
7.1.2 2D View context menu 130
7.2 Gallery View 131
7.2.1 View specific controls 131
- Gallery Tools tab 131
- Gallery Appearance tab 133
7.3 2,5D View 133
7.3.1 2.5D View tool bars 133
- Left tool bar 133
- Bottom tool bar 134
7.3.2 View specific controls 134
- 2.5D Display tab 134
- Series tab 135
- 2.5D Display Options tab 136
7.4 Histo View 136
7.4.1 View specific controls 136
- Histo Definition tab 136
- Histo View tab 138
Manual Content
8 Printed 06/2012

7.5 Profile View 139
7.5.1 View specific controls 140
- Profile Definition tab 140
- Profile View tab 141
7.6 Measure View 141
7.6.1 View specific controls 142
- Measure tab 142
7.7 Info View 143
7.7.1 General section 144
7.7.2 File section 144
7.7.3 Image Dimensions section 145
7.7.4 Acquisition section 146
7.7.5 Info View dialog window 148
- Edit Scaling dialog window 148
7.8 Split View 149
7.9 Ortho View 149
7.9.1 View specific controls 150
- Ortho Display tab 150
7.10 Cut View 151
7.10.1 View specific controls 151
- Cut Display tab 151
7.11 3D View 151
7.11.1 Tool bars 152
- Left tool bar 153
- Tool bar bottom 153
- Right tool bar 154
7.11.2 View specific controls 155
- 3D tab 155
- Appearance tab 157
- Clipping Planes tab 160
- Series tab 161
- Measure tab 164
- 3D Graphics tab 166
Content Manual
Carl Zeiss Microscopy GmbH 9

- Renderer tab 166
7.12 Colocalization View 167
7.12.1 X/Y Scatter Plot 168
7.12.2 Colocalization table 168
- Region 168
- Quadrant 168
- Pixel Number 168
- Area (µm²) 169
- Relative Area (%) 169
- Pearson's Correlation Coefficient 169
- Manders' Correlation Coefficient 169
- Coloc. Coefficient 1 169
- Coloc. Coefficient 2 170
- CC (weighted) 1 170
- CC (weighted) 2 170
- Average Intensity 1 170
- Average Intensity 2 170
- Standard Deviation 1 171
- Standard Deviation 2 171
- Z Index 171
- T Index 171
- Relative Time 171
- Relative Focus 171
7.12.3 View specific controls 171
- Colocalization tab 171
7.13 Analysis View 174
7.13.1 View specific controls 175
- Analysis tab 175
7.14 Panorama View 175
7.14.1 Stage View 176
7.14.2 Tools window 176
7.15 General view controls 176
7.15.1 Dimensions tab 176
- Slider section 176
Manual Content
10 Printed 06/2012

- Zoom section 177
- Tools section 178
- Channels section 179
- Reuse button 180
7.15.2 Display tab 181
- Display Histogram section 182
7.15.3 Player tab 183
7.15.4 Graphics tab 184
- Tool Bar section 184
- Planes section 185
- Graphic Elements list 186
- Dimensions section 187
- Graphics dialog window 188
7.16 Tiles Advanced Setup View 193
7.16.1 Stage View 193
7.16.2 Tools window 194
7.16.3 View specific controls 194
- Carrier tab 194
- Tile Region Setup tab 194
- Tile Region Properties tab 196
- Position Setup tab 197
- Position Properties tab 198
8 View mode 200
8.1 Full Screen mode 200
8.2 Exposé mode 200
8.3 Splitter mode 200
8.3.1 Split Display tab 201
9 Reporting views 203
9.1 Report preview 203
9.2 Report view 203
10 File Browser 205
10.1 Tools tab 205
Content Manual
Carl Zeiss Microscopy GmbH 11

11 Image processing functions 206
11.1 Deconvolution group 206
11.1.1 Deconvolution (defaults) 206
11.1.2 Deconvolution (adjustable) 206
11.1.3 Deconvolution (adjustable) parameters 206
- Deconvolution tab 206
- PSF Settings tab 210
11.2 Adjust group 214
11.2.1 Color Balance 214
11.2.2 Hue/Saturation/Brightness 215
11.2.3 White Balance 215
11.2.4 Color Temperature 216
11.2.5 Brightness/Contrast/Gamma 216
11.2.6 Z-Stack Correction 217
11.2.7 Shading Correction 217
11.3 Geometric group 218
11.3.1 Channel Alignment 218
11.3.2 Z-Stack Alignment 219
11.3.3 Stitching 220
11.3.4 Rotate 221
11.3.5 Mirror 223
11.3.6 Resample 223
11.3.7 Shift 225
11.4 Sharpen group 225
11.4.1 Extended Depth of Focus 225
11.4.2 Delineate 226
11.4.3 Enhance Contour 226
11.4.4 Unsharp Mask 227
11.5 Smooth group 228
11.5.1 Median 228
11.5.2 Sigma 229
11.5.3 Lowpass 230
11.5.4 Binomial Filter 230
Manual Content
12 Printed 06/2012

11.5.5 Gauss 231
11.5.6 Single Pixel Filter 232
11.6 Utilities group 232
11.6.1 Copy Annotations 232
11.6.2 Copy Image 232
11.6.3 Change Pixel Type 232
11.6.4 Create Image Subset 233
- Create Image Subset parameters 233
11.6.5 Fuse Image Subset 238
11.6.6 Create Gray Scale image 238
11.6.7 Image Calculator 238
11.6.8 Add Channels 238
11.6.9 Generate Pyramid 239
11.6.10 Calculate Histogram 239
- Column Selection dialog window 239
11.6.11 Split Scenes 240
11.7 Export/Import group 240
11.7.1 Image Export 240
- Image Export parameters 240
11.7.2 Movie Export 247
- Movie Export parameters 247
11.7.3 OME TIFF Export 253
- OME TIFF Export parameters 253
11.7.4 ZVI Export 258
- ZVI Export parameters 258
11.7.5 Image Import 259
- Image Import Parameters 259
Glossary 266
Content Manual
Carl Zeiss Microscopy GmbH 13

Legal notesCarl Zeiss draws the User's attention to the fact that the information and references contained inthese documents may be subject to technical modifications, in particular due to the continuousfurther development of Carl Zeiss's products. The documents enclosed do not contain any war‐ranty by Carl Zeiss with regard to the technical processes described in the documentation or tocertain reproduced product characteristics. Furthermore, Carl Zeiss shall not be held liable forany possible printing errors or other inaccuracies in this documentation, unless proof can be fur‐nished that any such errors or inaccuracies are already known by Carl Zeiss or that these arenot known to Carl Zeiss due to gross negligence and that furthermore Carl Zeiss has for thesereasons refrained from eliminating these errors or inaccuracies appropriately. Carl Zeiss herebyexplicitly draws the User's attention to the fact that this manual only contains a general descrip‐tion of the technical processes and information, the implementation of which in any individualcase may not be appropriate in the form described here. In cases of doubt, we recommend theUser to consult Carl Zeiss.
This manual is protected by copyright. Carl Zeiss has reserved all rights to this documentation.It is prohibited to make copies, partial copies, or to translate this manual into any other lan‐guage, except for personal use.
Carl Zeiss explicitly draws attention to the fact that the information contained in this manual willbe updated regularly in compliance with the technical modifications and supplements carried outin the products and furthermore that this manual only reflects the technical status of Carl Zeiss'sproducts at the time of printing.
Safety
Refer to the safety notes and instructions in the manuals of all necessary devices (e.g. micro‐scope peripherals, cameras, computers, computer additionals, etc.) before installing and usingthe software.
Disclaimer
The author is not responsible for any contents linked or referred to from his pages - unless hehas full knowledge of illegal contents and would be able to prevent the visitors of his site from‐viewing those pages. If any damage occurs by the use of information presented there, only theauthor of the respective pages might be liable, not the one who has linked to these pages. Fur‐thermore the author is not liable for any postings or messages published by users of discussionboards, guestbooks or mailinglists provided on his page.
Notice of the Producer
This Software product ZEN (blue edition) was designed, realized, verificated, validated and re‐leased in a certificated process environment. The quality management system is certified follow‐ing the rule of DIN EN ISO 9001.
The fields of application of the Software are common tasks and applications in microscopy re‐spectively imaging (so called “Off-The-Shelf Software”). Though the user acknowledges that inany kind of use the end user of the Software is responsible for the validation of the Software forthe end user’s dedicated intend of use considering all requirements of law and standards (e. g.FDA/21 CFR part 11, IvDD, etc.). If necessary the end user has to establish, to document, toimplement and to maintain a special process to fulfill all the requirements to be conform with thevalidate rules of law and standards.
1
Manual Legal notes
14 Printed 06/2012

CARL ZEISS DOES NOT WARRANT THAT THIS SOFTWARE IS USABLE FOR SPECIALPURPOSES OTHER THAN IN THE FIELDS OF APPLICATION DEFINED ABOVE.
Published by
Carl Zeiss Microscopy GmbH
Carl-Zeiss-Promenade 10
07740 Jena, Germany
www.zeiss.com/zen
Carl Zeiss Microscopy GmbH
Königsallee 9-21
37081 Göttingen, Germany
© Carl Zeiss Microscopy GmbH, 2011
Legal notes Manual
Carl Zeiss Microscopy GmbH 15

Introduction
Whats new?
Design dark/light
ZEN (blue edition) allows the user to switch between two GUI colour schemes: Design Dark/Light. The dark design has been carefully optimized to match the light conditions found in mostmicroscopy rooms and facilities during image acquisition. In this way two positive effects areachieved. Firstly, it reduces unwanted stray light from the monitor that might interfere with sensi‐tive fluorescence measurements. Secondly, it reduces eye strain and fatigue while minimizingthe problems associated with working in low light levels - for the microscopist this is of practicalimportance when locating a weakly fluorescent specimen by eye through the oculars then shift‐ing ones view to the monitor and back again and so on and so forth. A bright monitor is counter‐productive to this exercise once the human eye has adjusted to the low light levels and effec‐tively dazzles the user for a short period.
The light design on the other hand will optimally support those imaging brightfield specimens orperforming post acquisition examination and analysis of image date under normal office/ labora‐tory light conditions.
Fig. 1: Design dark
Fig. 2: Design light
See also
2 Select design [➙ p.31]
2
2.1
2.1.1
ManualIntroductionWhats new?
16 Printed 06/2012
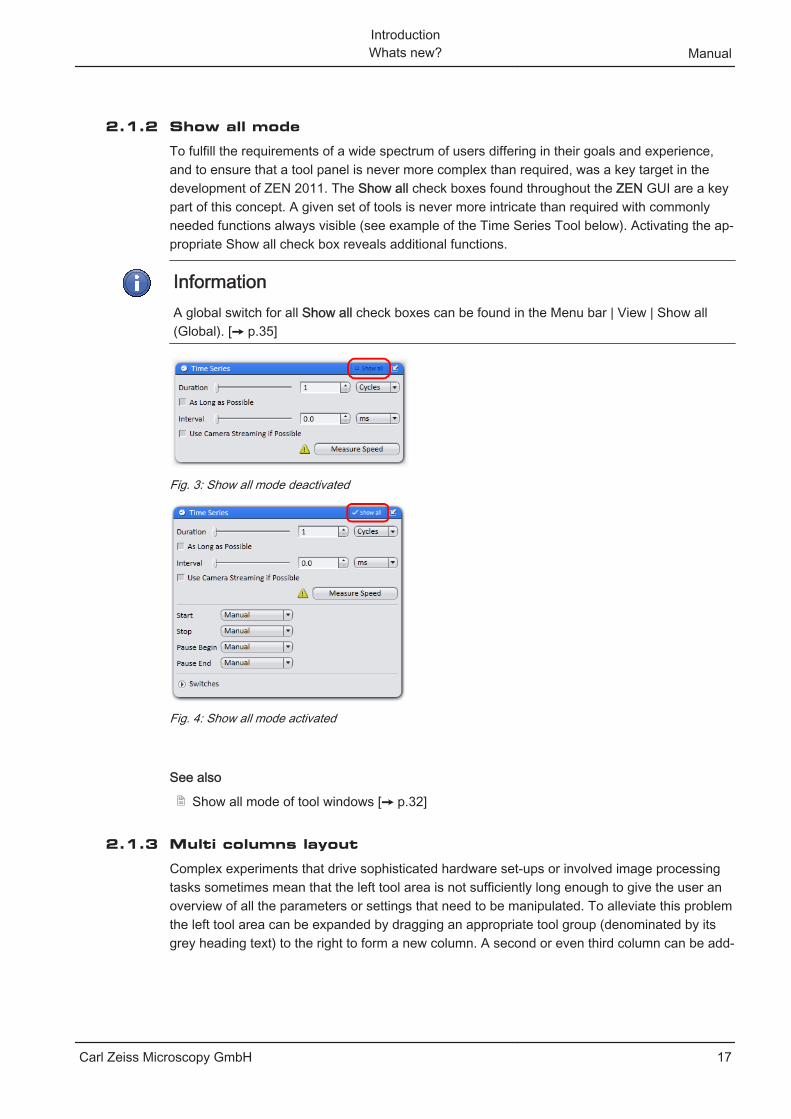
Show all mode
To fulfill the requirements of a wide spectrum of users differing in their goals and experience,and to ensure that a tool panel is never more complex than required, was a key target in thedevelopment of ZEN 2011. The Show all check boxes found throughout the ZEN GUI are a keypart of this concept. A given set of tools is never more intricate than required with commonlyneeded functions always visible (see example of the Time Series Tool below). Activating the ap‐propriate Show all check box reveals additional functions.
InformationA global switch for all Show all check boxes can be found in the Menu bar | View | Show all(Global). [➙ p.35]
Fig. 3: Show all mode deactivated
Fig. 4: Show all mode activated
See also
2 Show all mode of tool windows [➙ p.32]
Multi columns layout
Complex experiments that drive sophisticated hardware set-ups or involved image processingtasks sometimes mean that the left tool area is not sufficiently long enough to give the user anoverview of all the parameters or settings that need to be manipulated. To alleviate this problemthe left tool area can be expanded by dragging an appropriate tool group (denominated by itsgrey heading text) to the right to form a new column. A second or even third column can be add‐
2.1.2
2.1.3
IntroductionWhats new? Manual
Carl Zeiss Microscopy GmbH 17

ed in this manner. Please note that in the Locate tab that there are no tool groups and no addi‐tional columns are available. Muilti column layout settings are independent for each tab of theleft tool area.
Fig. 5: Single column
Fig. 6: Second column
Interactive light path configuration
In ZEN (blue edition) , microscope control is accessed from the Locate tab via the Light Pathtool. This uses an interactive diagram of the microscope light path and its components as con‐figured in the Micro Tool Box (MTB). Typically the modifications made are immediately appliedto the system e.g. a filter change or shutter status in an interactive manor.
2.1.4
ManualIntroductionWhats new?
18 Printed 06/2012

Fig. 7: Lightpath tool
See also
2 Light Path tool [➙ p.65]
Workspace zoom
The unique ZEN 2011 Workspace zoom function allows the user to match the size of the GUIelements, fonts, buttons and tool areas to a particular situation or individual requirements suchas screen size/resolution or for ease of viewing. The zoom level can be varied between 70-150%. Pressing the Reset button returns the Workspace Zoom to the default setting (100%).Note that ZEN 2011 was designed for optimal use with a 30” flat panel with a minimum verticalscreen resolution of 1200 pixels.
Fig. 8: Workspace Zoom
Workspace configuration
The workspace configuration tool stores all user settings associated with workspace layout andzoom level. These settings can be recalled from the drop down list Options. Alternatively a newgroup of settings can be created or the Workspace can be reset to factory default – note that thelogin splash screen will appear and the user can choose “Start system” (detect and read hard‐ware settings) or “Image processing” mode (image analysis and viewing only). The followingsettings can be modified and stored as part of a workspace configuration:
2.1.5
2.1.6
IntroductionWhats new? Manual
Carl Zeiss Microscopy GmbH 19

To save a workspace configuration select “new” from the options drop down list and select themenu item new. A name is given to the settings. To store press enter or click on the save icon.
To restore a set of user defined settings only two clicks are required: click the drop down listand select the appropriate entry.
Fig. 9: Workspace configuration
Automatic scaling
Fig. 10: Automatic scaling
See also
2 Status Bar [➙ p.28]
Digital Movie Recorder
This allows the recording of image sequences with high speed and outstanding image quality.The raw data will be saved immediately on the hard drive. Finally the movie may be saved inthe CZI-image format or exported as an AVI-movie.
2.1.7
2.1.8
ManualIntroductionWhats new?
20 Printed 06/2012

Fig. 11: Movie recorder
See also
2 Movie Recorder tool [➙ p.78]
2 Locate tab [➙ p.48]
ConceptZEN is a modular image-processing and analysis software for modern microscopy from CarlZeiss. In addition to basic functionality for image acquisition and microscope definitions, ele‐mentary image processing and annotations, image analysis and documentation optional mod‐ules for specific tasks are available.
Image Acquisition
A range of different camera types can be used with ZEN, from simple TV cameras through tohigh-resolution and high-sensitivity cameras. The cameras of the Carl Zeiss AxioCam familyguarantee optimum integration.
Image Processing
The acquired image is immediately displayed on the monitor. It can then be optimized using awide range of techniques:
▪ Contrast, brightness and color adjustment
▪ Noise suppression, smoothing and contour enhancement
▪ Sharpness enhancement/emphasizing of details
▪ Correction of illumination influences and white balance
ZEN can also be used to add any annotations that you may require to the images. All elements,from scale bars and colored markings through to text and graphics, have been integrated intothe program.
Image Analysis
You are able to perform simple interactive measurements in the basic program. The measuredvalues (e.g. lengths, areas and perimeters) are made available in a data table, and can be pro‐cessed further using spreadsheet programs. The interactive measurement can be executed viathe Graphics menu from the menu bar, or via the Graphics tab in the view controls of the Meas‐urement View.
2.2
2.2.1
2.2.2
2.2.3
Introduction
Concept Manual
Carl Zeiss Microscopy GmbH 21

Documentation
Besides the image itself, the ZEN image format CZI also saves additional data, such as the im‐age number, date of acquisition, microscope settings, exposure values, size and scale details,contrast procedures used etc. Annotations and measured values are also saved with the image.
2.2.4
ManualIntroduction
Concept
22 Printed 06/2012

First steps with ZEN blue software
Start ZEN blue software➢ Your Microsoft operating system is ready for operation.
➢ You have successfully installed ZEN blue on your computer.
1. Double click on ZEN blue program icon on your desktop.
2. Alternatively click on Start | All Programs | Carl Zeiss | ZEN 2011 | ZEN 2011 (blue edition)entry (blue icon).
⇨ The software starts. After a while you see the ZEN blue login screen.
3. Activate checkbox Don´t show this dialog next time if you don’t want to see the login dialogwith the next start of the software. If you want to see the dialog again, got to menu bar andclick on File | Login.
4. Click on Start System button to start ZEN blue with full software functionality.
5. Click on Image Processing button to start ZEN blue with image processing functions only.
⇨ You successfully started ZEN blue software.
Program interfaceThe ZEN (blue edition) program interface is divided into three main areas. Via the tabs in theLeft Tool Area (5) you can access all the main tools for microscope control (Locate tab), acquisi‐tion (Acquisition tab), image processing (Processing tab), image analysis (Analysis tab) and re‐port generation (Reporting tab). The Center Screen Area (6) is used to display your images,while the Right Tool Area (7) provides you with an overview of all open documents and is usedfor advanced file management.
3
3.1
3.2
First steps with ZEN blue software
Start ZEN blue software Manual
Carl Zeiss Microscopy GmbH 23

12
34
5
6
7
8
Fig. 12: Program interface (ZEN lite)
1 Title bar 5 Left Tool Area
2 Workspace Configuration 6 Center Screen Area
3 Menu bar 7 Right Tool Area
4 Tool bar 8 Status bar
Title bar
Fig. 13: Title bar
Symbol Beschreibung
Activates the "drag & drop“ help function. A question mark appears beside themouse pointer. Move the mouse pointer to a place in the software where youneed help. Left-click on the desired location. The online help opens.
Minimizes the program window.
Maximizes the program window across 2 screens. This option is only possible ifyou are working with 2 screens with the same resolution.
Maximizes the program window to the main screen.
Reduces the program window to any selected size.
Closes the program window.
3.2.1
ManualFirst steps with ZEN blue software
Program interface
24 Printed 06/2012

Menu bar
Fig. 14: Menu bar
The menu bar contains all the menus you need to manage, edit and view your projects.
See also
2 Menus [➙ p.34]
Workspace configuration
Fig. 15: Workspace Configuration
Here you find settings to adjust your workspace. Select light/dark Design of the user interface orenlarge the screen with Worspace Zoom. Save and reload all your personal settings as a Work‐space configuration. With the Dock all tool windows button in the top right corner you candock all undocked tools to left tool area with one click.
See also
2 Adjust workspace appearance [➙ p.31]
Tool bar
1 2 5 87643
Fig. 16: Tool bar
1 New document 4 Print Preview 7 Paste
2 Open file 5 Cut 8 Scale bar
3 Save file 6 Copy
Here you gain quick access to important functions, e.g. saving or opening files. Further right youfind settings for Workspace Configuration, i.e. Design settings.
InformationYou can adapt the tool bar to your personal requirements in the Extras menu | CustomizeToolBar.
3.2.2
3.2.3
3.2.4
First steps with ZEN blue software
Program interface Manual
Carl Zeiss Microscopy GmbH 25

Left Tool Area
In the Left Tool Area you find the Main Tabs for microscope and camera settings (Locate tab),image acquisition (Acquisition tab), image processing (Processing tab), image analysis (Analy‐sis tab) and reporting (Reporting tab).The Main Tabs are organized in an order which followsthe typical workflow of experiments in bioscience or material science.
Fig. 17: Left Tool Area (ZEN pro, desk, system)
See also
2 Locate tab [➙ p.48]
2 Camera tab (ZEN lite) [➙ p.50]
2 Acquisition tab [➙ p.50]
2 Processing tab [➙ p.62]
2 Analysis tab [➙ p.63]
2 Reporting tab [➙ p.63]
Center Screen Area
The Center Screen Area is structured in 4 areas. The Document bar (1) is on top. On the leftside you find the tabs for the general and specific Image Views (2). In the middle of CenterScreen Area is the Image Area (3), images, reports and tables were shown here. Under the im‐age area you find the General- and View Specific Controls (4) organized in tabs. View specificcontrol tabs are flagged blue.
3.2.5
3.2.6
ManualFirst steps with ZEN blue software
Program interface
26 Printed 06/2012

Fig. 18: Overview Center Screen Area
1 Document bar 3 Image area
2 Image view tabs 4 View specific and general controls organized in tabs
See also
2 Image views [➙ p.128]
2 General view controls [➙ p.176]
2 Document bar [➙ p.27]
Document bar
Fig. 19: Document bar
3.2.7
First steps with ZEN blue software
Program interface Manual
Carl Zeiss Microscopy GmbH 27

Here you see tabs of all opend documents. Click on a tab to view the image/document. On theright end of document bar you find buttons to switch view mode (Expose and Splitter mode) andfurther view options (View menu).
See also
2 Exposé mode [➙ p.200]
2 Splitter mode [➙ p.200]
2 View menu [➙ p.35]
Right Tool Area
Here you find a list of all opened documents in Center Screen Area.
Fig. 20: Right Tool Area
1 List of opened documents
2 View buttons (i.e. text view, thumbnail)
3 Close/Save buttons
Status Bar
Here you will see important information on the system status:
Scaling options
Displays which lateral scaling is currently being used. The automatic checkbox is activated bydefault. The scaling will be calculated automatically based on your hardware settings (i.e. objec‐tive, adapters, etc.). If the automatic checkbox is deactivated, you can also load/import scalingsor start the scaling wizard in the Options menu.
System Information
3.2.8
3.2.9
ManualFirst steps with ZEN blue software
Program interface
28 Printed 06/2012

Always shows the latest, currently active process that the system is performing.
Progress Bar
Displays the progress of the currently active process. Each new process added supersedes old‐
er still active processes. If you click on the icon, a window opens all currently runningchronologically listed processes. You can stop a process that is running using the Stop button.
Performance Indicators
In this group you will see an overview of the performance of individual computer components:
▪ Free RAM indicates how much physical memory is still available;
▪ Free HD indicates how much space is still available on the hard drive onto which the nextimage is to be acquired (see Extras/Options/Save);
▪ CPU indicates the usage of the Central Processing Unit.
▪ The status bar provides an overall assessment of the system usage.
Frame Rate
Indicates the current frame rate in frames per second (fps) used by the active camera for pro‐ducing new images. Please note that above in most cases a speed of > 100 frames per secondthis value can not always be accurately determined.
Pixel Value and Position
Pixel value displays the gray value in the image at the current position of the mouse pointer. Inthe case of multichannel images the gray value/channel is displayed for up to 4 channels.
Position displays the X/Y position (in pixel coordinates) of the mouse pointer in the image.
Information (i)
If you click on the icon, a window opens with a List of System Messages [➙ p.30].
Storage Folder
Displays the location where new images are automatically saved. This path can be changed inthe menu Tools | Options | Saving.
User
Shows the Windows user name of the logged in user.
Time
Shows the current Windows system time.
First steps with ZEN blue software
Program interface Manual
Carl Zeiss Microscopy GmbH 29

List of System Messages
Important system messages are collected here. There are three categories:
Information
System information that arises during normal operation. This system information does not leadto an interruption of the workflow. The information window is not displayed automatically.
Warnings
Information that requires input from the user, e.g. a prompt to change a mechanical microscopecomponent. This information leads to the information window being shown briefly. However. Itcloses again after a few seconds.
Errors
Error messages indicate a malfunction by the system. In this case the information windowopens and remains open. The system requires input from the user in order to continue.
InformationHundreds of messages can accumulate in the course of a session. A maximum of 300 mes‐sages are displayed. To display messages for a certain category, activate or deactivate thecorresponding checkboxes.
Set user language➢ You have successfully started ZEN (blue edition)
1. Click on menu Tools | Options.
⇨ The Options dialog opens. The entry General in the Software group is selected.
2. Select user language from the Fixed Language dropdown list.
InformationIf the Select Automatically checkbox is activated the software uses the language which is setin the system settings of your computer.
⇨ The message appears to restart the application. Confirm message by clicking on OK.
3. Click on OK.
⇨ The Options dialog closes.
4. Exit and restart software.
3.2.9.1
3.3
ManualFirst steps with ZEN blue software
Program interface
30 Printed 06/2012

⇨ You have successfully set user language.
Adjust workspace appearance
Select design
1. Select light/dark design from design dropdown list in workspace configuration area.
Show/hide areas
1. Click on show/hide buttons to show or hide areas.
Undock/dock tool window
This function allows you to undock/dock a tool window. An undocked tool window can be posi‐tioned anywhere on the screen.
1. Click undock button to undock a tool window.
3.4
3.4.1
3.4.2
3.4.3
First steps with ZEN blue software
Adjust workspace appearance Manual
Carl Zeiss Microscopy GmbH 31

2. Click dock button to dock a tool window back to its place in left tool area.
InformationWith dock all tools function in Workspace Configuration [➙ p.25] you can globally attach all un‐docked tool windows back to the left tool area.
Show all mode of tool windows
1. Click Show all button (deactivated) to show advanced settings or function of a tool window.
2. Click Show all button (activated) to show only the basic functions of a tool window.
Acquire a first image with ZEN blueThis section guides you to your first image with ZEN blue software.
➢ You have connected and configured a microscope camera (i.e. AxioCam MR) to your sys‐tem.
➢ You have started the ZEN blue software and selected Camera tab (ZEN light only) or Lo‐cate tab.
1. Click on Live button.
⇨ The Live mode starts. In the Center Screen Area you see the live image from the cam‐era.
2. Click on Set Exposure button.
3.4.4
3.5
ManualFirst steps with ZEN blue software
Adjust workspace appearance
32 Printed 06/2012

⇨ The Exposure time will be set automatically.
InformationManually focus the specimen if you don’t see a sharp image. For correct focusing you can ad‐ditionally use the focus bar function. Right click on Center Screen Area will open a contextmenu. Select Focus Bar entry from context menu.
3. Click Snap button.
⇨ You successfully acquired your first image with ZEN blue. Save image in File | Save as onyour computer.
Close ZEN blue software➢ You have acquired or processed an image, created a table or a report with ZEN blue.
1. Click on File | Exit to end ZEN blue software. Alternatively you can press ALT+F4 on yourkeyboard or click on Close icon in program bar.
InformationIf you haven’t saved your files the save/keep documents dialog will open before the programcloses. Select files you want to save or unselect files you don’t want to save.
3.6
First steps with ZEN blue software
Close ZEN blue software Manual
Carl Zeiss Microscopy GmbH 33

Menus
File menu
New menu item (Ctrl+N)
Opens the New Document dialog window.
Open menu item (Ctrl+O)
Opens the Open Document dialog window. Here you can select the file you want to open.
Save menu item (Ctrl+S)
Saves the selected file.
Save As menu item
Saves the selected file under a new name.
Rename menu item
Opens the Rename dialog window. Enter a new name for the file. Confirm the entry with Yes.
Delete menu item
Deletes the selected file.
Export/Import menu item
Opens the relevant parameters on the Processing tab | Method Selection | Method | Extras | Ex‐port/Import.
Close menu item (Ctrl+F4)
Closes the selected file.
Save All menu item
Saves all open files.
New File Browser menu item
Opens the Browser window in the center screen area.
Open Containing Folder menu item
Opens the folder in which the selected file is located.
Recent Files menu item (Ctrl+R)
Opens the Recent Files dialog window.
Print Preview (Ctrl+F2)
Opens the Print Preview dialog window for the selected file.
4
4.1
ManualMenus
File menu
34 Printed 06/2012

Login menu item
Opens the Login dialog window.
Exit menu item (Alt+F4)
Exits the program.
See also
2 File Browser [➙ p.205]
Edit menu
Undo (Ctrl+Z)
Undoes the last action.
Redo (Ctrl+Y)
Redoes the last action.
Cut (Ctrl+X)
Cuts the selected graphic element out of the image.
Copy (Ctrl+C)
Copies the selected graphic element.
Paste (Ctrl+V)
Inserts the copied graphic element into the image.
Delete (Del)
Deletes the selected graphic element.
Select All (Ctrl+A)
Selects all graphic elements drawn into the image.
Display
Here you can manage image display settings. Functions include copy, paste, export or import ofthe display settings.
ROI (Region of Interest) (Ctrl+U)
Here you can draw a new rectangular selection region (ROI) into the image. It is subsequentlypossible to create a subset image from the selection.
View menu
Zoom
Here you can configure various zoom settings.
4.2
4.3
Menus
Edit menu Manual
Carl Zeiss Microscopy GmbH 35

Player
Here you can navigate through a Z-stack or a time series image.
Document Bar Display Options section
Displays the text name of a file in the document bar.
Displays a small preview image and name of a file in the document bar.
Displays a large preview image and name of a file in the document bar.
Image Area Display Options section
Displays one image container in the image area.
Displays two image containers in the image area.
Displays three image containers in the image area.
Automatic Container Layout
Uses the predefined container layout.
Shared View Controls
General and specific view controls are shared for all containers and are active for the currentlyselected image container.
Separate View Controls
Each container has its own separate general and specific view controls that become activewhen the associated image container is selected.
Show All (Global)
Activates Show All mode globally.
Acquisition menu
Live (Shift+F2)
On the Locate tab this opens an image window and starts a live image with the active camera.On the Acquisition tab this command will execute only if a channel has been defined. The cur‐rently selected channel will be used for the live image.
Snap (F2)
On the Locatetab executes a snap image command and acquires a single image from the activecamera. On the Acquisition tab this command will execute only if at least one channel has beendefined. All the defined channels will be imaged and displayed as an overlay.
Set Exposure
On the Locate tab this executes an exposure time calculation for the active camera. On the Ac‐quisition tab this command will execute only if at least one channel has been defined.
Text View
Small Thumb‐nail View
LargeThumbnail
View1 Container
2 Containers
3 Containers
4.4
ManualMenus
Acquisition menu
36 Printed 06/2012

Set White Balance (Alt+W)
Performs an automatic white balance measurement.
Find Focus
Starts an autofocus search.
Graphic menu
Menu item Function Short cut
Select Starts selection mode. Alt+F1
Draw Region of Interest (ROI) Draws in ROI. Crtl+U
Text Adds text field to the image.
Scale bar Adds a scale bar to the image.
Line Adds a line to the image.
Arrow Adds an arrow to the image.
Rectangle (aligned) Adds an aligned rectangle to the image.
Circle (Diameter) Adds a circle to the image.
Contour (Spline) Adds a contour (Spline) to the image.
Profile Adds an intensity profile along the drawed inarrow region.
Rectangle Profile Adds an intensity profile within the drawed inrectangle region.
Grid Adds a grid to the image.
Frequent Annotations Adds frequent annotations to the image.
Points Adds points of interest to the image such asevents or markers.
Burn-in annotations Creates a new image with all annotationsburned-in to the image.
Show Bounding Box Shows bounding boxes around graphics/an‐notations.
Hide Bounding Box Hides bounding boxes around graphics/anno‐tations.
Bring to Front Brings selected graphic/annotation to the frontof the image.
Send to Back Sends selected graphic/annotation to the backof the image.
4.5
Menus
Graphic menu Manual
Carl Zeiss Microscopy GmbH 37

Menu item Function Short cut
Bring Forward Brings selected graphic/annotation one layerforwards.
Send Backwards Sends selected graphic/annotation one layerbackwards.
Tools menu
Menu item Description
Diagnostics menu item (Ctrl+Shift+D) Opens the Diagnostics dialog window...
Kitchen Timer… Opens the Kitchen Timer tool window...
Dosimeter… Opens the Dosimeter tool window...
Dye Editor… Opens the Dye Editor dialog window...
Extension Manager… Opens the Extension Manager dialog window.
Modules Manager… Opens the Module Manager dialog window.
Calibration Manager… Opens the Calibration Manager dialog win‐dow...
Customize Toolbar… Opens the Customize Toolbar [➙ p.39] dia‐log window.
Scaling… Opens the Scaling [➙ p.40] dialog window.
Sample Carrier Templates… Opens the Sample Carrier Templates dialogwindow...
Options… Opens the Options [➙ p.41] dialog window.
Modules Manager dialog
Here you can activate or deactivate the modules for which you currently own a license. Notethat all the changes made here are implemented immediately and the corresponding module(s)are activated/ deactivated.
Available Products section
Here you can see the ZEN products available for your license. Click on the relevant button toselect a ZEN product.
Module list
In this list you can activate/ deactivate the modules that are included with you ZEN product. Todo this, activate the checkbox in front of the module in question.
Optional Module list
In this list you can activate the modules that you have licensed as an option for your ZEN prod‐uct. To do this, activate the checkbox in front of the module in question.
4.6
4.6.1
ManualMenus
Tools menu
38 Printed 06/2012

Optional Hardware list
In this list you can activate the control software for the devices that you have licensed for yourZEN product.
Select All button
Activates all licensed modules.
Deselect All button
Deactivates all licensed modules.
Save Information button
Allows you to saves the current selection of modules in a ModuleInformation.txt file.
Customize Toolbar dialog
Here you can add menu commands to the tool bar as buttons.
Available Toolbar items list
Here you will find the individual menu commands that you can add to the tool bar.
button
Adds a selected menu command to the tool bar. It then appears in the Selected Toolbar itemslist.
Selected Toolbar items list
The menu commands that you have added to the tool bar are listed here. You can select com‐mands here in order to sort them, for example.
button
Deletes a selected menu command from the Selected Toolbar items list.
button
Moves a selected menu command up a position in the Selected Toolbar items list..
button
Moves a selected menu command down a position in the Selected Toolbar items list..
Separator button
Inserts a vertical separator bar into the tool bar after the currently selected item of the SelectedToolbar items list.
Close button
Closes the dialog window.
4.6.2
Menus
Tools menu Manual
Carl Zeiss Microscopy GmbH 39

Scaling dialog
Here you can specify how your images are scaled.
Active Scaling section
The scaling that is currently active is displayed in the Active Scaling section.
Automatic Scaling checkbox
Activated: Determines the scaling from the configuration set for the microscope and camera fornewly acquired images. Data acquired in another session or from imported from another systemhas associated Metadata that contains information about the scaling per pixel.
Unit dropdown list
Select the desired unit of measurement for the scaling from the dropdown list.
The following units are available for selection:
▪ Meter
▪ Centimeter
▪ Millimeter
▪ Micrometer
▪ Nanometer
▪ Inch
▪ Mil
Available Scalings section
Here you can choose a different scaling approach.
Available Scalings dropdown list
Here you can select an existing scaling.
button
Clicking on the Options button opens a shortcut menu with the following entries:
Activates the scaling selected in the Available Scalings dropdown list so that it is applied to allimages acquired from this time point onward.
The scaling selected in the Available Scalings dropdown list is assigned to the current image.
Opens the Import Scaling dialog window. Here you can select the scaling file that you want toimport.
Opens the Export Scaling dialog window to export the scaling selected in the Available Scalingsdropdown list. Here you can select the folder in which you want the exported scaling file to besaved and specify a file name.
The scaling selected in the Available Scalings dropdown list is deleted.
4.6.3
Activate Scal‐ing
Assign Scal‐ing to Image
Import
Export
Delete
ManualMenus
Tools menu
40 Printed 06/2012

Create new scaling section
Interactive calibration button
Starts the Scaling Wizard [➙ p.41].
Scaling Wizard
Here you can create a new scaling. To do this, draw a reference line with a predefined length inthe current image. An image of a calibration slide is best suited for this purpose.
You can draw in two types of reference line:
Draw a line along a distance with a known length.
Draw two parallel lines along a distance with a known length. The two parallel lines allow errorsin the parallel axis resulting from the drawing of the lines to be corrected. A third, corrected lineis drawn in automatically from which the scaling is determined.
Automatic Line Detection checkbox
Activated: Automatically detects individual lines of the scale bar in the image close to the inter‐actively defined distance. Using this method the centers of the lines are determined exactly, in‐creasing the precision of the scaling.
Length input field
Enter the length of the line you have drawn in the spin box/input field.
Unit dropdown list
Select the scaling unit from the dropdown list.
Name input field
Here you can enter the name for the scaling file that will be created.
Save button
Saves the scaling file that has been created under the specified name.
Options dialog
Here you can configure the settings for general software options.
General
Language section
Select Automatically checkbox
Activated: Automatically selects the user language of the operating system as the user lan‐guage for the ZEN software.
Language Selection dropdown list
Select the language from the dropdown list in which ZEN (blue edition) will be run next time it isstarted.
4.6.3.1
Simple Refer‐ence Line
Parallel Ref‐erence Lines
4.6.4
4.6.4.1
Menus
Tools menu Manual
Carl Zeiss Microscopy GmbH 41

Startup
Splash Screen section
Activate Show Splash Screen checkbox
Activated: Displays the Splash screen when program starts.
Configuration section
Reload Last Used Documents checkbox
Activated: When the software is started, all files that were open when you last exited the systemwill be reloaded.
Naming
Here you can specify how images are named and indexed.
Category dropdown list
Select the category of image from the dropdown list for which you want to define the naming.The following categories are available:
Images that are created using File menu | New.
Images that are created by clicking on the Snap button.
Images that are created using the Extended Focus (Interactive) tool.
Images that are created by clicking on the Continuous button.
Images that are created by clicking on the Start Experiment button.
Images that are created by the Movie Recorder tool.
Images that are created by means of an image processing function.
Images that are created by means of the Multiimage function.
Images that are created by means of a batch processing function.
Files that are created by means of the Report tool.
Prefix input field
Here you can enter a name prefix of your choice.
Digits dropdown list
Here you can select how many digits you want the counter used to have. Changes will be stor‐ed after the session is ended.
Format input field
Here you can specify what information is appended to the prefix.
To adopt an entry directly into the input field, double-click on the entry in the Format IDs list.Alternatively you can edit the entry directly. Changes will be stored after the session is ended.
Initial Counter Value input field
Displays the current status of the counter. The counter value is saved during a session.
4.6.4.2
4.6.4.3
Image
Snap
Extended Fo‐cus (Interac‐
tive)Continuous
Experiment
Movie
Processedimage
Multiimage
Batch Result
Report
ManualMenus
Tools menu
42 Printed 06/2012

If you exit the software, the counter value will be reset to 1.
Preview display field
Displays a preview of the naming format that will be allocated next for the current category.
Save/Load Counter Value checkbox
Activated: Saves the counter values for the individual categories. If the software is restarted, thevalues are restored.
Format IDs list
Here you see a list containing all the formatting options.
Saving
Locate/Camera section
Auto Save checkbox
Activated: Automatically saves images that are acquired on the Locate (Camera) tab using theSnap button.
Don´t Open a Document Window checkbox
Only active if the Auto Save checkbox is activated.
Activated: The automatically saved images are closed immediately after acquisition.
File Type dropdown list
Select the image format from the dropdown list that will be used when an image is saved auto‐matically.
Auto Save Path
Here you can specify the folder into which the images are saved automatically.
Browse button
Opens the Browse For Folder dialog window. Here you can select the folder in which the im‐ages are to be saved automatically.
Documents
Default Settings for New Images section
Show Ruler checkbox
Activated: Displays the ruler at the top and left-hand edge of the image – the units used are ac‐cording to the Scaling settings.
Auto Fit checkbox
Activated: Automatically adjusts the zoom factor of the image so that the entire image is visibleand the view area is filled.
Use Interpolation for Image Display checkbox
Activated: Displays pixels in interpolated form.
Set Logarithmic Scale in Histogram checkbox
4.6.4.4
4.6.4.5
Menus
Tools menu Manual
Carl Zeiss Microscopy GmbH 43

Activated: In the Display tab the frequency distribution (y-axis) of the histogram is plotted usinga logarithmic scale.
Acquisition
Live Window section
Close Live After Snap checkbox
Activated: Closes the live window after an acquisition with the Snap button
User Defined Action After Snap dropdown list
Select an action from the dropdown list to be performed after an image is acquired using theSnap button. The following options are available:
▪ Always Create a New DocumentCreates a new document each time.
▪ Automatic ModeA newly acquired image is always written into the currently active image document. Previ‐ous images are therefore lost. Note that Snaps made in the Acquistion tab are always savedas a new image and selecting this option has no effect. The same is true in Locate tab whenthe Option Saving | Auto save is selected.
Tiles section
Show information Title in the Advanced Setup View checkbox
Activated: Displays Tiles Advanced Setup information bar
Show Snap Animation checkbox
Activated: Displays animation when an image is acquired by pressing F2 or clicking Snap buttonwhen the Advanced setup view is open.
Automatic Snap when Clicking the Live Navigator Buttons checkbox
Activated: When pressing one of the blue arrow icons of the Navigator frame a Snap is made ofthe current position before the stage moves one camera frame in the desired direction.
Panorama section
Show information Title in the Panorama View checkbox
Activated: Displays Panorama information bar
Show Acquisition Animation checkbox
Activated: Displays animation when image is acquired by pressing F2 or clicking Acquire the im‐age button when panorama view is open. Note that this will acquire a Z-stack or Time series, ifselected in the experiment, at this position.
Enable Transparency Effect on Selected Tile Image check box
Activated: The selected tile image is displayed with a transparency effect that enables the usedto see it relation to the tiles underneath (lower layer = earlier acquisition) and those above (up‐per layer = more recent acquisition) it at the same time.
Acquisition Tab section
Acquisition Tab without Channel Support check box
4.6.4.6
ManualMenus
Tools menu
44 Printed 06/2012

Activated: enables the use and set-up of experiments without any channel support in the Ac‐quisition tab.
Prevent execution of after Channel Setting Automatism while Live is Active checkbox
Activated: Prevents execution of After Channel setting automatism while Live button is active.
Automatically start Live when Set Exposure Measure was started checkbox
Activated: Starts a Live image when the Set Exposure button has been pressed such that thelive image begins immediately after the Set Exposure measurement is complete. The normalfunction when the check box is unselected is to take a Snap subsequent to SetExposure.
Z-Stack section
Adjust Auto-Z-Stack Focus Match on First Slice
This value determines the degree of match between the image focus of the first image and thatdetermined as the true focus (centre plane of the resulting Z-stack)
Adjust Auto-Z-Stack Focus Match on Last Slice
This value determines the degree of match between the image focus of the last image and thatdetermined as the true focus (centre plane of the resulting Z-stack)
Player section
Follow Acquisition check box
Activated: The image and slider of the Dimensions and Graphics tab follow (are updated) theacquisition so that image last collected is displayed as the Experiment progresses.
Camera section
Show Expert Options
Activated: The expert settings/ options belonging to a particular camera model are accessible inthe appropriate tool areas.
User
Here you can enter your own details. These are then written into the image during acquisition.They are also used in reports.
User Information section
Here you can enter your first name.
Here you can enter your last name.
Here you can enter your e-mail address.
Here you can enter your telephone number.
Here you can enter your fax number.
Company Information section
Here you can enter the company name.
Here you can enter the company address.
4.6.4.7
First Name
Last Name
Telephone
Fax
Name
Address
Menus
Tools menu Manual
Carl Zeiss Microscopy GmbH 45

Here you can enter the zip code and town/city of the company.
Here you can enter the country.
Here you can add a company logo to your user profile. This can then be displayed in a report,for example. To add a logo, click on the Add button.
Data Tables
Data Table Import Options section
Start import in Row No. radio box
Defines the starting row into which the data will be imported.
Column Separators
▪ Tab check boxActivated: Recognizes Tab key stroke as column separator
▪ Semicolon check boxActivated: Recognizes a semicolon as column separator
▪ Space check boxActivated: Recognizes Space key stroke as column separator
▪ Comma check boxActivated: Recognizes a comma as column separator
Decimal Separator dropdown menu
Select between decimal separator as full stop or comma
Thousands Separator dropdown menu
Select between thousand separator as full stop or comma
Data Table section
Number of Decimal Places radio box
Sets the maximum number of decimal places for the numbers imported into the data table.
Window menu
Menu item Description Shortcut
Full Screen Sets the Full screen mode tomaximize the image view areasize
F11
Next Window Displays the next open imagein the Center Screen Area (di‐rection of movement is to theright)
F6
Previous Window Displays the previous openimage in the Center ScreenArea (direction of movementis to the left)
Ctrl+F6
Zip Code,Town/City
Country
Logo
4.6.4.8
4.7
ManualMenus
Tools menu
46 Printed 06/2012

Menu item Description Shortcut
Close Closes the currently selectedimage.
Ctrl+F4
Close All Closes all the open images. Ctrl+Alt+W
Help menu
Menu item Description Shortcut
Contents… Opens the Online help con‐tents page.
Ctrl+F1
Index… Opens the Online help indexpage.
Ctrl+F2
About Zen… Shows notices of the pro‐ducer of the ZEN software
4.8
Menus
Help menu Manual
Carl Zeiss Microscopy GmbH 47

Main tabs
Locate tab
Transmitted Light / Reflected Light section
Only visible if you have configured a motorized TL/RL shutter in MTB (MicroToolBox).
Transmitted / Reflected Light button Function
Off Closes the shutter of the transmitted / reflec‐ted light source on a motorized microscope.
On Opens the shutter of the transmitted / reflec‐ted light source on a motorized microscope.
Favorites section
Here you add further buttons with your favorite software functions. Click on Configure button toopen Configure favorites [➙ p.49] dialog windwow.
Action buttons
With these buttons you control microscope and camera and acquire your images.
Fig. 21: Action buttons
Icon Button Function
Find Focus Only visible if you have configured a motorized focus (Micro‐ToolBox).
Starts an autofocus search using the current settings fromthe Software Autofocus tool.
Set Exposure Starts an automatical exposure time measurement with thesettings defined in the Light Path and Camera tool.
Live Opens Live View and shows the live image from the cam‐era.
Continuous Starts a series of Snaps using the settings defined in theLight Path and Camera tool. In contrast to a live image, theexact same camera setting that has been set in the Cameratool is used. The result at the end of this mode is a single,acquired image that can be saved.
Snap Acquires a single image.
Stop Only active if one of the acquisition buttons has beenclicked.
Stops the function of the relevant acquisition button.
5
5.1
ManualMain tabsLocate tab
48 Printed 06/2012

Active camera section
Link Cameras checkbox
Only active if you have connected two structurally identical cameras to your system.
Activated: Acquires images using two cameras in parallel. This is often the case with 2-channelimages for ratio measurements or FRET measurements.
Active Camera dropdown list
Shows the active camera. If you have several cameras connected, you can select the detectorto use here.
See also
2 Light Path tool [➙ p.65]
2 Camera tool [➙ p.71]
2 Software Autofocus tool [➙ p.77]
2 Movie Recorder tool [➙ p.78]
Configure Favorites
Here you configure up to 20 new buttons to get quick access to your preferred camera andhardware settings.
Favorite Settings section
If you have not yet defined any buttons, you will see an empty list here. To create a new button,click on the button.
Name input field
Here you can enter a name for the button.
Hardware Setting Ref.
Shows the selected hardware settings.
Camera Setting Ref.
Shows the selected camera settings.
Color dropdown list
To change the color of the button, click on the colored rectangle. Select a color of your choicefrom the list.
Text Color checkbox
Activated: Uses the selected color as the button text color.
Available Hardware Settings section
Here you see all the hardware settings that are saved on your hard drive. Select the hardwaresetting that you want to use with the configured button.
Available Camera Settings section
Here you see all the camera settings that are saved on your hard drive. Select the camera set‐ting that you want to use with the configured button.
5.1.1
Main tabsLocate tab Manual
Carl Zeiss Microscopy GmbH 49

See also
2 Locate tab [➙ p.48]
Camera tab (ZEN lite)
Acquisition buttons
With these buttons you control microscope and camera and acquire your images.
Icon Button Function
Set Exposure Starts an automatical exposure time measurement with thesettings defined in the Light Path and Camera tool.
Live Opens Live View and shows the live image from the cam‐era.
Continuous Starts a series of Snaps using the settings defined in theLight Path and Camera tool. In contrast to a live image, theexact same camera setting that has been set in the Cameratool is used. The result at the end of this mode is a single,acquired image that can be saved.
Snap Acquires a single image.
Stop Only active if one of the acquisition buttons has beenclicked.
Stops the function of the relevant acquisition button.
Active camera section
Link Cameras checkbox
Only active if you have connected two structurally identical cameras to your system.
Activated: Acquires images using two cameras in parallel. This is often the case with 2-channelimages for ratio measurements or FRET measurements.
Active Camera dropdown list
Shows the active camera. If you have several cameras connected, you can select the camera touse here.
See also
2 Microscope Components tool (ZEN lite) [➙ p.65]
2 Camera tool [➙ p.71]
2 Movie Recorder tool [➙ p.78]
Acquisition tabOn the Acquisition tab you configure and control your acquisition experiments.
Information!
▪ The content of the Acquisition tab changes depending on the technical possibilities offeredby your imaging system and the options that you activate or deactivate.
5.2
5.3
ManualMain tabs
Camera tab (ZEN lite)
50 Printed 06/2012

▪ Settings that you configure in the top part of the tab have an effect on settings in the bottompart of the tab. I.e. Settings that you configure in the Acquisition Parameters tool group inthe Channels toolalso apply to the acquisition of all images that you configure in the Multidi‐mensional Acquisition tool group in the Z-Stack, Tiles or Time Series tools.
Fig. 22: Acquisition tab
1 Experiment Manager 4 Acquisition Dimensions
2 Smart Setup 5 Experiment Preview
3 Action buttons
See also
2 Light Path Settings tool [➙ p.79]
2 Acquisition Mode tool [➙ p.81]
2 Channels tool [➙ p.87]
2 Experiment Designer tool [➙ p.90]
2 Z-Stack tool [➙ p.93]
2 Tiles tool [➙ p.96]
2 Panorama tool [➙ p.100]
2 Time Series tool [➙ p.100]
2 Information on Experiment tool [➙ p.103]
Main tabs
Acquisition tab Manual
Carl Zeiss Microscopy GmbH 51

Experiment Manager
In the Experiment Manager you can load and save your experiments, control acquisition anddecide which tools will appear in the tool groups.
Experiment Selection dropdown list
Here you can select saved experiments. If you make changes to an experiment, the name ofthe experiment is marked with an asterisk (*). If you close the application without saving achanged ("asterisked") experiment, you will be asked whether you want to save the changes.
Options button
Opens the Options [➙ p.52] shortcut menu.
Show All Tools checkbox
If the checkbox is activated,
▪ the System Settings tool group is shown with the Light Path Settings tool.
▪ the Experiment Designer tool is also shown in the Multidimensional Acquisition tool group.
▪ the Acquisition Sequence [➙ p.54] dropdown list is also shown under the acquisition di‐mensions. From the list you can select various sequences for Time, Regions, Tiles, Chan‐nels or Z-stacks.
Options
In the Options shortcut menu you can create new experiments and rename, save, import, exportor delete existing experiments.
New menu item
Creates a new, empty experiment. Enter a name for the experiment.
Rename menu item
Enter a new name for the experiment.
Save menu item
Saves a changed ("asterisked") experiment under the current name.
Save As menu item
Saves the current experiment under a new name. Enter a new name for the experiment.
Import menu item
Imports an existing experiment. The experiment is shown in the Experiment Selection dropdownlist.
Export menu item
Exports the current experiment.
Delete menu item
Deletes the current experiment.
New From menu item
The New From menu item only appears if there is a valid acquisition experiment in .czexp for‐mat in the \ZEN\Templates\Experiment Setups folder.
5.3.1
5.3.1.1
ManualMain tabs
Acquisition tab
52 Printed 06/2012

Creates a copy of the selected experiment with a new name. You can use the experiment im‐mediately or change it. The default experiment cannot be deleted or changed.
Smart Setup
Smart Setup offers you support when configuring multichannel acquisition experiments. Selectthe fluorescent dyes and contrast techniques that you want to include in your experiment from alarge dye database. Smart Setup takes the configuration of your microscope hardware and theproperties of the selected dyes into account. Based on this information it makes one or moresuggestions for acquisition. You can adopt these into your experiment as required and makefurther changes to them there.Smart Setup also configures the motorized components of yoursystem for the acquisition of multichannel images. It does not, however, influence any cameraparameters (e.g. exposure time or resolution) and also does not change any parameters of oth‐er acquisition dimensions (e.g. Z-stack, time series or multiposition acquisitions).
Smart Setup button
To start Smart Setup dialog click on Smart Setup button
See also
2 Smart Setup Dialog [➙ p.60]
Action buttons
With these buttons you control microscope and camera and acquire your images.
Fig. 23: Action buttons
Information- The Acquisition buttons on the Acquisition tab differ from the Acquisition buttons on the Lo‐cate tab. The buttons on the Locate tab relate to an individual image. The buttons on the Ac‐quisition tab relate to a multidimensional image with at least one channel. - An image is only acquired automatically after the search if the Live button is deactivated.
Icon Button Function
Find Focus Only visible if you have configured a motorized focus (Micro‐ToolBox).
Starts an autofocus search using the settings from the Fo‐cus Devices tool.The autofocus search is performed for theselected reference channel in the Channels tool.
Set Exposure Starts an automatical exposure time measurement with thesettings defined in the Light Path and Camera tool.
Live Opens Live View and shows the live image from the cam‐era.
5.3.2
5.3.3
Main tabs
Acquisition tab Manual
Carl Zeiss Microscopy GmbH 53

Icon Button Function
Continuous Starts a series of Snaps using the settings defined in theLight Path and Camera tool. In contrast to a live image, theexact same camera setting that has been set in the Cameratool is used. The result at the end of this mode is a single,acquired image that can be saved.
Snap Acquires a single image.
Stop Only active if one of the acquisition buttons has beenclicked.
Stops the function of the relevant acquisition button.
Start experiment button
Only active when additional acquisition dimensions were added to the experiment.
Starts the experiment.
Acquisition Dimensions
In the Acquisition Dimensions section you can activate the acquisition dimensions (Z-stack,tiles, panorama, time series) required in your experiment. The corresponding tool only appearsin the Multidimensional Acquisition tool group once an acquisition dimension has been activa‐ted. The field to the right of the acquisition dimension shows how extensive the acquisition willbe (e.g. number of sections or number of tile images).
Acquisition Sequence
Acquisition Sequence dropdown list
Only active if the Show All Tools checkbox is activated.
The available selection options (*default settings) in the list depend on the acquisition dimen‐sions selected.
Acquisition dimensions Selection option Function
Channels "All Channels" Acquires all configured chan‐nels one after the other.
Channels
Z-stacks
"All planes per channel" (*) Acquires the complete Z-stackfor a channel and then pro‐cesses the next channel.
"All channels per plane" Acquires all channels for eachZ-plane and then locates thenext plane of the Z-stack.
5.3.4
5.3.4.1
ManualMain tabs
Acquisition tab
54 Printed 06/2012

Acquisition dimensions Selection option Function
Channels
Z-stacks
Tiles/Positions
"All planes per channel" (*) Acquires the complete Z-stackat a tile/position for eachchannel and then processesthe next channel. Once all Z-stacks at a tile/position havebeen acquired, the next one islocated.
"All channels per plane" Acquires all channels at a tile/position for each Z-plane be‐fore locating the next plane ofthe Z-stack. Once all Z-planesand channels at a tile/positionhave been acquired, the nextone is located.
- Channels
- Z-stacks
- Time series
"All planes per channel" (*) Acquires the complete Z-stackfor each channel for a timepoint and then processes theZ-stack of the next channel.
"All channels per plane" Acquires all channels for eachZ-plane for a time point beforelocating the next plane of theZ-stack.
- Channels
- Tiles/Positions
- Time series
"All tiles per time point" Acquires images for all chan‐nels as well as images at allpositions of the experiment foreach time point and then waitsfor the next time point.
"Time series per tile" Acquires the complete timeseries at a position with allchannels, before doing thesame at the next position.Connected tile images are,however, acquired in full foreach time point.
- Channels
- Z-stacks
- Tiles/Positions
- Time series
"Time-Regions-Tiles-Chan‐nels-Z" (*)
Acquires images for all chan‐nels as well as images at allpositions of the experiment foreach time point and then waitsfor the next time point. Thecomplete Z-stack is acquiredat every position for eachchannel and the next channelis then processed.
Main tabs
Acquisition tab Manual
Carl Zeiss Microscopy GmbH 55

Acquisition dimensions Selection option Function
"Time-Regions-Tiles-Z-Chan‐nels"
Acquires images for all chan‐nels as well as images at allpositions of the experiment foreach time point and then waitsfor the next time point. Ac‐quires all channels for each Z-plane and then locates thenext plane of the Z-stack.
"Regions-Time-Tiles-Chan‐nels-Z"
Acquires the complete timeseries at a position with allchannels, before doing thesame at the next position. Ac‐quires the complete Z-stackfor each channel and thenprocesses the next channel.
"Regions-Time-Tiles-Z-Chan‐nels"
Acquires the complete timeseries at a position with allchannels, before doing thesame at the next position.Connected tile images are,however, acquired in full foreach time point. Acquires allchannels for each Z-plane andthen locates the next plane ofthe Z-stack.
Experiment Preview
The Experiment Preview shows you the acquisition dimensions of your current experiment.
Example 1
No channel is active or no fluorescence channels have been configured. No other experimentdimensions have been activated.
Example 2
5.3.5
ManualMain tabs
Acquisition tab
56 Printed 06/2012

A fluorescence channel has been configured in the current experiment. No other experiment di‐mensions have been activated. The value in the bottom right corner shows the calculated sizeof the image file on the hard drive.
Example 3
At least one fluorescence channel has been configured in the current experiment, as well as aZ-stack. The number of visible planes does not reflect the actual number of planes in the experi‐ment. The value in the bottom right corner shows the calculated size of the Z-stack on the harddrive.
Example 4
Main tabs
Acquisition tab Manual
Carl Zeiss Microscopy GmbH 57

At least one fluorescence channel has been configured in the current experiment, as well as atile acquisition or a multiposition experiment. The number of positions displayed does not reflectthe actual number of tile images in the experiment. The value in the bottom right corner showsthe calculated size of the complete acquisition on the hard drive.
Acquisition dialog window
Add Dye or Contrast Technique dialog window
In the Add Dye or Contrast Technique dialog window you can add dyes and contrast techniquesto your experiment. The dyes in the database contain important information that is saved in theimage document (e.g. spectral characteristics). This information can be used later during imageprocessing (e.g. deconvolution).
InformationYou can add additional dyes to the database via the Extras menu | Dye Editor.
Most Recently Selected list
Shows the six most recently selected dyes and contrast techniques in a list. This ensures thatyou have quick access to the dyes or contrast techniques that you frequently use.
Search input field
Enter the name or initial letters of the dye or contrast technique that you want to search for. Thesearch results are displayed immediately in the Dye Database list or the Contrast Techniqueslist. If no search filter is active, the lists of dyes or contrast techniques are arranged in alphabeti‐cal order.
InformationIf you cannot find a certain dye, try using a related dye name or a general name.
5.3.6
5.3.6.1
ManualMain tabs
Acquisition tab
58 Printed 06/2012

Dye Database list
The available fluorescent dyes are displayed here. In the left column you will see the name ofthe dye. The right column contains its color and main emission wavelength. Add a channel with‐out any spectral or other information by selecting the "Custom" entry.
InformationThe "Custom" entry adds a channel to your experiment without any additional information. Thismeans that the resulting image cannot be used for certain processing operations. To create anentry with self-defined characteristics, use the Dye Editor.
Contrast Techniques list
The available contrast techniques are displayed here.
Main tabs
Acquisition tab Manual
Carl Zeiss Microscopy GmbH 59

Smart Setup Dialog
Fig. 24: Smart Setup dialog
1 Configure experiment section (add dyes, contrast method)
2 Select Camera section (if more than one camera is configured)
3 Proposals section
1 Configure experiment section (add dyes, contrast method)
2 Select Camera section (if more than one camera is configured)
3 Proposals section
5.3.6.2
ManualMain tabs
Acquisition tab
60 Printed 06/2012

1 Configure experiment section (add dyes, contrast method)
2 Select Camera section (if more than one camera is configured)
3 Proposals section
Configure your experiment (1)
Add up to four reflected light fluorescence channels and one transmitted light contrast techniqueto your experiment. The added dyes or the contrast technique are shown in the Contrast /Probelist below.
add button
Opens the Add Dye or Contrast Technique [➙ p.58] dialog window.
Select camera (2)
Only visible, if two or more cameras are configured for the system.
First select the camera which Smart Setups gives a proposal for from dropdown list.
Proposals (3)
InformationIf Smart Setup is unable to make a suggestion, acquisition using the selected dyes or contrasttechnique and the current microscope hardware is not possible. Select other dyes or anothercontrast technique or configure your acquisition experiment using the Acquisition Mode tooland the Channels tool.
Here you see the suggestions made by Smart Setup displayed graphically. The number of sug‐gestions (max. 3) depends on the microscope hardware being used, the selected dyes and thecontrast technique:
Proposal Description
Best Signal This proposal results in the best signal strength.
Fastest This proposal results in the fastest acquisition..
Best Compromise This proposal results in the best compromise of signal strengthand fastest acquisition.
Emission Signal, Speed and Crosstalk
Fig. 25: Emission Signal, Speed, Crosstalk and Tracks
Main tabs
Acquisition tab Manual
Carl Zeiss Microscopy GmbH 61

Nummer Name Beschreibung
1 Emission Signal A filled, colored bar in the Emission Signal display field showsthe relative emission signal to be expected for the corre‐sponding channel. The channel color corresponds to the colorof the selected dye in the Configure Experiment section.
2 Speed
A gray bar in the Speed display field represents the approxi‐mate acquisition speed that can be expected. This is the timerequired for the movement of microscope hardware duringmultichannel acquisition. Camera exposure times or parame‐ters of other acquisition dimensions are not taken into accounthere.
3 Crosstalk
A hatched bar in the Crosstalk display field shows the relativecrosstalk originating from one or more dyes of other channelsthat can be expected.
4 Tracks Only visible if the Show Excitation and Show Emission check‐boxes are activated.
The various tracks are labeled with T1, T2, etc. and the vari‐ous channels with C1, C2, etc. The white lines show the exci‐tation and emission spectra of the dyes schematically. Thespectra are filled in color in the places that will be acquired bythe acquisition configuration suggested by Smart Setup.Transmitted light channels are displayed as a filled white field.
InformationThe bars in the graphs only show relative values. The actual strength of the emission signaland the crosstalk in the image can deviate substantially from this estimate, as Smart Setuphas no knowledge of the strength with which the sample has been dyed with the individual dyecomponents.
Show Excitation checkbox
Shows the excitation spectrum of the selected dyes in the Tracks display field.
Show Emission checkbox
Shows the emission spectrum of the selected dyes in the Tracks display field.
OK button
Adopts the suggestion displayed as the current acquisition experiment. The suggestion over‐writes existing experiments on the Acquisition tab.
Cancel button
Ends Smart Setup. The suggestions are not adopted into the experiment.
Processing tabOn the Processing tab you will find all the functions you need for image processing using ZEN(blue edition).
5.4
ManualMain tabs
Processing tab
62 Printed 06/2012

Single button
Activates Single Processing mode.
In Single Processing mode you apply a selected processing method, with the relevant methodand image parameters, to a single image.
Batch button
Activates Batch Processing mode.
In Batch Processing mode you apply a selected processing method, with the relevant methodand image parameters, to the list of images.
InformationIn this mode only a limited selection of processing methods is available.
Apply button
Only visible in Single Processing mode.
Applies the selected method to the input image.
Run Batch button
Only visible in Batch Processing mode.
Applies the selected method to the list of images.
See also
2 Image processing functions [➙ p.206]
Analysis tabOn the Analysis tab you will find all the functions you need for image analysis using ZEN (blueedition).
See also
2 Interactive Measurement tool [➙ p.104]
2 Image Analysis tool [➙ p.110]
Reporting tabOn the Reporting tab you can create reports. If you have an image open and click on the Re‐porting tab, a Report Preview is automatically generated. You can create the report directly,change the template in the Report tool or link other images/tables.
InformationAll reports in ZEN are based on templates which are then filled with data. The appearance andcontent of the report are defined in the template. The creation of templates is not included as afeature in ZEN.
5.5
5.6
Main tabs
Analysis tab Manual
Carl Zeiss Microscopy GmbH 63

Reporting buttons
Only visible if the Report Preview is not active.
Opens the Report Preview. The appearance of the report is determined by the template, whichyou can select in the Report [➙ p.126] tool.
InformationIf you have an image open and click on the Reporting tab, the Report Preview opens automati‐cally. If the Report Preview is active, the New Report button changes into the Close button.
Only visible if the Report Preview is active.
Closes the Report Preview without creating a report.
Only active if a report has been created.
Opens the Print Preview dialog window. Here you can configure the print settings.
Only active if a report has been created, but not yet saved.
Saves the report. If the report has not yet been saved, the Save As dialog window opens. Thereport is saved in *.czr (Carl Zeiss Report) format.
Only active if a report has been created.
Exports the current report into your file system. The *.pdf or *.xps formats are available for theexport.
InformationAll reports in ZEN are based on templates which are then filled with data. The appearance andcontent of the report are defined in the templates.
See also
2 Report tool [➙ p.126]
New Reportbutton
Close button
Print button
Save button
Export button
ManualMain tabs
Reporting tab
64 Printed 06/2012

Tools (blue tools)
Microscope Components tool (ZEN lite)Select all the components that you have configured on your microscope i.e. objective or cameraadapter.
InformationAdditionally from the information’s the scaling will be calculated automatically if you have acti‐vated automatic scaling checkbox in Status Area.
Objective
Here you select objective that you are using currently. You will find all common objectives in theobjective dropdown list. Click on to add a new objective. Click button to delete anobjective from the list.
The following functions are only visible if the Show All mode is activated:
Optovar
Here you select secondary magnification. You will find all common secondary magnifications inthe optovar dropdown list.
Reflector
Here you select the reflector (i.e. BF brigthfield) or the dye (i.e. Alexa 430, fluorescence imagesonly). You will find all common reflectors or dyes in the reflector dropdown list.
Camera Adapter
Here you select the camera adapter.
Total Magnification
Total magnification of your system based on the selected microscope components will be calcu‐lated and shown here.
See also
2 Camera tab (ZEN lite) [➙ p.50]
Light Path toolIn the Light Path tool you can configure the light path of components and the microscope foryour experiment. The configuration of your system (see MicroToolBox) is shown here in theform of a graphical display. The graphical display of the light path shows all the components inthe path from the light source to the specimen and from there to the camera or eyepiece. Theicons correspond to the components that are installed on your system.
Keep the following points in mind when working with the Light Path tool:
▪ To activate/deactivate a setting, left-click on the relevant icon.
▪ Icons with an arrow in the bottom right corner contain dialog windows that allow you to con‐figure additional settings. To open the dialog windows, left-click on the corresponding icon.
▪ Icons with a hand in the bottom left corner indicate components that have to be operatedmanually.
6
6.1
6.2
Tools (blue tools)Microscope Components tool (ZEN
lite) Manual
Carl Zeiss Microscopy GmbH 65

The following functions are only visible if the Show All mode is activated:
Interactive Control button
Activated: The Light Path tool is operated interactively via the icons.
Settings Editor button
Activated: The Settings Editor is visible. The icons of the components used in the Reflected/Transmitted Light Path section are grayed out. To use the desired component in the light path,activate the relevant checkbox above the icon.
Settings Editor
Here you can select from existing hardware settings or adopt the settings from the hardware be‐ing used into the software. You can also transfer settings from the software to the hardware thatyou are using.
See also
2 Locate tab [➙ p.48]
Reflected/Transmitted Light Path
In the graphical display of the reflected/transmitted light path you will see various optical compo‐nents, such as the shutter, diaphragms, filters and beam splitters, depending on the microscopeyou are using. All the available components must be configured in advance in the MTB (Micro‐ToolBox). The settings for the components can be configured via the icons.
InformationIf you are not using any motorized components, you will have to make the relevant adjust‐ments manually.
Microscope Manager
To open the Microscope Manager [➙ p.68] dialog window, left-click on the Microscope Man‐ager icon.
Reflected Light/Transmitted Light Changer
If your microscope has a halogen lamp for both reflected and transmitted light illumination, hereyou can select whether you want to control the halogen lamp for reflected light illumination orthe halogen lamp for transmitted light illumination.
Shutter
To set the shutter to Open or Closed, left-click on the shutter icon. The status is displayed intext form above the icon.
Aperture Diaphragm
To open the Aperture Diaphragm dialog window, left-click on the aperture diaphragm icon.
Enter the diaphragm opening (0% to 100%) using the slider or spin box/input field.
Filter Wheel 1
To open the Filter Wheel dialog window, left-click on the filter wheel icon.
Here you can enter the first neutral density filter (e.g. 0.4%, 6%, 100%, 100%) that you require.
6.2.1
ManualTools (blue tools)
Light Path tool
66 Printed 06/2012

Filter Wheel 2
To open the Filter Wheel dialog window, left-click on the filter wheel icon.
Here you can enter the second neutral density filter (e.g. 12%, 25%, 50%, 100%) that you re‐quire.
Condenser
The condenser is only available in the Transmitted Light path.
To open the Condenser dialog window, left-click on the icon.
Select the contrast method from the dropdown list (e.g. brightfield, darkfield, phase contrast ring1, 2, 3, DIC I, II, III).
Lens checkbox
Activated: Swings in the auxiliary lens.
Enter the condenser aperture using the N.A. slider or the spin box/input field.
Only visible if the Show All mode is activated.
Various condenser settings can be saved in the list to allow you to restore them quickly.
Luminous Field Diaphragm
To open the Luminous Field Diaphragm dialog window, left-click on the icon.
Enter the diaphragm opening (0% to 100%) using the slider or spin box/input field.
Reflector Turret
To open the Reflector Turret dialog window, left-click on the reflector turret icon.
The filter cubes for reflected light techniques can be found in the list. Enter the desired filtercube here (e.g. brightfield or fluorescence filter cube). The filter cube's beam splitter directs thelight through the objective and onto the sample.
Only visible if the Show All mode is activated.
The wavelength ranges of the fluorescence filters and beam splitters are also shown in the list.
Nosepiece
To open the Nosepiece dialog window, left-click on the nosepiece icon.
Select the desired Objective from the list.
Only visible if the Show All mode is activated.
In addition to the primary magnification, all the other details for each objective are also dis‐played in the list.
Specimen Stage
In the Specimen Stage section you will find the options for Stage Control [➙ p.68] and FocusControl [➙ p.70]. This section is highlighted in dark gray in the graphical display.
TV/Eyepiece Switch
To open the TV/Eyepiece Switch dialog window, left-click on the TV/Eyepiece Switch icon.
Select from the list whether you want to direct the light to the camera only (100% Camera), tothe camera and the eyepiece (30% Eyepiece/70% Camera) or to the eyepiece only (100% Eye‐piece).
Tools (blue tools)
Light Path tool Manual
Carl Zeiss Microscopy GmbH 67

Eyepiece
Above the Eyepiece icon the total magnification of the selected beam path with all activated in‐termediate magnifications is displayed. To direct the light path fully to the eyepiece, left-click onthe eyepiece icon.
Camera
The selected camera is shown above the Camera icon.
Microscope Manager
Contrast Manager
Select the setting for the contrast mode from the Mode dropdown list.
The Contrast Manager is not used. All settings must be made manually or via a settings file.
The function of the Contrast Manager is activated via the touch screen on the microscope.
If core components (e.g. condenser, reflector, shutter) for a certain contrast technique arechanged, dependent components are also changed accordingly.
Select one of the available methods for the contrast mode from the Method dropdown list.
Light Manager
Enabled checkbox
Activated: Activates the Light Manager. The Mode dropdown list in the Light Manager is active.
Select a setting for adjusting the brightness of the light from the Mode dropdown list.
Adjusts the brightness of the light via the lamp voltage. The color temperature changes accord‐ingly.
Adjusts the brightness on the basis of the available filter wheels. The color temperature is re‐tained. Only if the brightness adjustment cannot be achieved via the filter wheels does adjust‐ment take place via the lamp voltage.
Dazzle Protection checkbox
Activated: Activates dazzle protection. Dazzle protection prevents light from passing through theeyepiece and dazzling the user, for example when reflector positions are changed. This is main‐ly achieved by closing the reflected or transmitted light shutter. If no shutters are installed, thelamp voltage is adjusted.
Parafocal Correction checkbox
Activated: Activates parafocal correction.
Stage Control
To open the Stage Control dialog window, left-click on the Stage button.
In the Stage Control dialog window you can use the software to move stages equipped with amotorized X/Y-drive.
6.2.2
Off
On Demand
Contrast Re‐taining
Objective
Classic
6.2.3
ManualTools (blue tools)
Light Path tool
68 Printed 06/2012

Stage control using navigation circle
CAUTIONDanger of crushing by stage!
1. Remove your fingers or any objects from the danger area before using the navigation circleto move the stage.
In the dialog window you will see a navigation circle with a number of segments.
1. Move the mouse pointer over a segment of the circle.
⇨ The corresponding segment is highlighted.
2. To move the stage, hold down the left mouse button.
⇨ The corresponding segment is highlighted in blue. The stage keeps moving while the leftmouse button is held down. It stops when you release the left mouse button again.
Alternatively, you can control the stage using the navigation button at the center of the naviga‐tion circle.
1. Move the mouse pointer over the navigation button.
⇨ The navigation button is highlighted.
2. Hold down the left mouse button and move the mouse in the desired direction.
⇨ The stage moves in the direction you have specified. When you release the left mouse but‐ton the stage stops.
InformationIf you control the stage using the inner segments of the circle, the travel speed is slow. If youcontrol it using the outer segments of the circle, it travels at a faster speed. To double the trav‐el speed, right-click on the navigation button. All segments of the circle and the navigation but‐ton are highlighted in red.
Stage control through entry of absolute coordinates
CAUTION! Danger of crushing by stage! If you enter absolute coordinates, the stage automati‐cally moves to the entered position. Remove your fingers or any objects from the danger areabefore entering absolute coordinates. To stop the stage movement, click on the Stop button.
Enter the absolute position in the X/Y-Position spin boxes/input fields under the navigation cir‐cle. Confirm each entry you make with the Enter key. The stage then moves automatically to thecoordinates you have entered. The position of the stage is shown in the display fields to theright of the spin boxes/input fields.
Stop button
Stops the stage movement.
X/Y-Position section
Set Zero Point button
Sets the current position as the new zero point for the X/Y-coordinates.
Calibrate button
Tools (blue tools)
Light Path tool Manual
Carl Zeiss Microscopy GmbH 69

CAUTION! Danger of crushing by stage! If you perform an automatic stage calibration, thestage moves automatically to the end positions in the X/Y-direction. Remove your fingers or anyobjects from the danger area before performing automatic calibration. To stop calibration, clickon the Stop button.
Performs an automatic stage calibration. For this the stage moves to the limit switches to deter‐mine the zero points in the X and Y-direction and then returns to its starting position, which isnow defined with its absolute coordinates.
Focus Control
To open the Focus Control dialog window, left-click on the Focus button.
In the Focus Control dialog window you can use the software to control stages equipped with amotorized Z-drive.
Stage control using navigation bar
CAUTION! Danger of crushing by stage! Remove your fingers or any objects from the dangerarea before using the navigation bar to move the stage.
In the dialog window you will see a navigation bar with a number of segments.
1. Move the mouse pointer over a segment.
⇨ The corresponding segment is highlighted.
2. To move the stage in the Z-direction, hold down the left mouse button.
⇨ The corresponding segment is highlighted in blue. The stage keeps moving while the leftmouse button is held down. It stops when you release the left mouse button again.
Alternatively, you can control the stage using the navigation button at the center of thenavigation bar.
1. Move the mouse pointer over the navigation button.
⇨ The navigation button is highlighted.
2. Hold down the left mouse button and move the mouse up or down.
⇨ The stage moves in the direction you have specified. When you release the left mouse but‐ton the stage stops.
InformationIf you control the stage using the inner segments, the stage moves slowly. If you control it us‐ing the outer segments, it travels at a faster speed. To double the travel speed, right-click onthe navigation button. All segments and the navigation button are highlighted in red.
Stage control through entry of absolute coordinates
CAUTION! Danger of crushing by stage! If you enter absolute coordinates, the stage automati‐cally moves to the entered position. Remove your fingers or any objects from the danger areabefore entering absolute coordinates. To stop the stage movement, click on the Stop button.
6.2.4
ManualTools (blue tools)
Light Path tool
70 Printed 06/2012

Enter the absolute position in the X/Y-Position spin boxes/input fields under the navigation bar.Confirm each entry you make with the Enter key. The stage then moves automatically to the co‐ordinate you have entered. The position of the stage is shown in the display fields to the right ofthe spin boxes/input fields.
Stop button
Stops the stage movement.
The following functions are only visible if the Show All mode is activated:
Positioning Increment spin box/input field
Here you can enter the increment for the individual travel steps.
Home button
Moves the stage to the defined start position.
Work button
Moves the stage to the last focus range set.
Load button
Lowers the stage by a predefined fixed amount, depending on the microscope. This makes iteasier to change the sample, especially in the case of immersion objectives with a short workingdistance.
Measure section
Distance display field
Shows the Z-distance between the starting position and the current stage position.
Z-Position section
Set Zero Point button
Sets the current position as the new zero point for the Z-coordinates.
Calibrate button
CAUTION! Danger of crushing by stage! If you perform an automatic stage calibration, thestage moves automatically to the end positions in the Z-direction. Remove your fingers or anyobjects from the danger area before performing automatic calibration. To stop calibration, clickon the Stop button.
Performs an automatic stage calibration. For this the stage moves to the lower limit switch todetermine the absolute zero point in the Z-direction and then returns to its starting position,which is now defined with its absolute coordinate. It is recommended that you remove the speci‐men from the stage to do this.
Camera toolIn the Camera tool you can configure all the settings for the selected camera.
6.3
Tools (blue tools)
Camera tool Manual
Carl Zeiss Microscopy GmbH 71

See also
2 Locate tab [➙ p.48]
Settings section
In the Settings section you can manage your camera settings.
Default button
Resets all camera settings in the Camera tool to the factory default settings. These settings canalso be selected from the dropdown list of available camera settings to the right of the Defaultbutton. To do this, select the Original Settings entry.
button
Opens the Options shortcut menu.
Reload button
Undoes the changes you have made to a loaded setting and restores the original status of theloaded setting.
Options
New menu item
Creates a new camera setting. Enter a name for the camera setting in the input field. To savethe camera setting, click on the Diskette icon to the right of the input field.
Rename menu item
Renames the current camera setting. Enter another name for the camera setting in the inputfield. To save the camera setting, click on the Diskette icon to the right of the input field.
Save menu item
Saves the current camera setting.
Save As menu item
Saves the current camera setting under a new name. Enter a new name in the input field. Tosave the camera setting, click on the Diskette icon to the right of the input field.
Import menu item
Imports an existing camera setting.
Export menu item
Exports the selected camera setting.
Delete menu item
Deletes the selected camera setting.
6.3.1
6.3.1.1
ManualTools (blue tools)
Camera tool
72 Printed 06/2012

Exposure section
In the Exposure Time section you can set the desired exposure time for your image. You canhave the exposure time calculated automatically using the Measurement button or set it man‐ually using the Time slider or the spin box/input field.
Time slider
Set the exposure time here or enter the desired value in the spin box/input field. Select the unitsof time (ms, s) from the dropdown list to the right of the spin box/input field.
Auto Exposure checkbox
Activated: Calculates the exposure time automatically before each image is acquired.
Set Exposure button
Starts a one-off system measurement of the exposure time, which is used for all subsequent im‐ages.
The following functions are only visible if the Show All mode is activated:
Auto Exposure Intensity spin box/input field
Here you can set the actual exposure time to between 5% and 200% of the measured value.This is helpful in the case of fluorescence images to prevent overexposure or to make signalsstand out more clearly. You can change the value by increments using the arrow buttons or youcan enter the desired value directly using the keyboard. To do this, you must activate the num‐ber already present using the cursor. Complete the entry by using the Tab or Enter key.
Spot Meter / Focus ROI checkbox
Here you can use the cursor to set a region in the live image to which the exposure time meas‐urement will be restricted. The same region is also used as the region for the autofocus setting.
White Balance section
Only active if a color camera has been selected.
Auto button
Sets the white balance automatically.
Pick button
Select a point in the image as a reference point for the white balance.
3200K button
Sets the color temperature to 3200K.
5500K button
Sets the color temperature to 5500K.
Show Channels checkbox
Only visible if the Show All mode is activated.
Activated: Displays 3 sliders to allow each color channel to be set precisely.
Color Offset slider
Here you can set the color temperature.
Saturation slider
6.3.2
6.3.3
Tools (blue tools)
Camera tool Manual
Carl Zeiss Microscopy GmbH 73

Only visible if the Show All mode is activated.
Here you can set the saturation.
Reset button
Resets all settings to the default values.
Mode section
Only visible if the Show All mode is activated.
Color Mode button
Sets the color mode to RGB.
Sets the color mode to B/W.
Live Speed dropdown list
Here you can select the speed of the live mode. You can choose between Slow, Medium andFast.
Resolution dropdown list
Here you can select the camera resolution.
Binning dropdown list
Here you can select the binning mode for the camera.
NIR Mode checkbox
When the checkbox is active you can use the camera in the near infrared range.
Acquisition ROI section
In this section you can define a particular area that you want to be acquired.
After clicking on the Update Overview button, in the window on the left you will see a Preview ofyour sample under the camera. The Pixel Size below the preview window indicates the size of apixel depending on the scaling set. The blue frame indicates the selected area. The entire pre‐view window is highlighted by default. To change the area, move the mouse pointer over theblue frame. The mouse pointer will appear as a double-headed arrow. If you hold down themouse button and move the mouse, you can change the size of the frame and in this way high‐light a certain area on the sample. To move the area, position the mouse pointer inside theframe. The mouse pointer will appear as a four-headed arrow. If you hold down the mouse but‐ton and move the mouse, the frame can be moved.
Maximize button
Maximizes the frame to the maximum size in the preview window.
Center button
Positions a frame that has been changed precisely at the center of the image.
Size input field
Here you can enter the size of the frame that you want. Depending on the camera type availa‐ble, select from the predefined sizes in the dropdown list (1388x1040, 1024x1024, 512x512,256x256, 128x128). Alternatively you also have the option of entering the Size in X and Y, andthe top left Start position. You can change the values by increments using the arrow buttons
6.3.4
RGB
B/W
6.3.5
ManualTools (blue tools)
Camera tool
74 Printed 06/2012

next to the input windows or you can enter the desired values directly using the keyboard. To dothis, you must activate the number already present using the cursor. Complete the entry by us‐ing the Tab or Enter key.
Offset input field
Here you can enter the start position for the frame, measured from the top left corner.
Refresh Overview button
Adopts the image from the camera into the preview window.
Post-Processing section
Depending on which camera you are using, some functions are not visible. The most importantfunctions are explained in the section below.
Black Reference checkbox
Only visible if the Show All mode is activated.
Only active if you have defined a black reference via the Define button.
Activated: Applies the measured black reference to the image.
Deactivated: The measured black reference is not used. The reference image is retained.
Define button
Automatically defines the black reference. To do this a reference image is acquired, from whichthe black reference is measured. The light path to the camera must be closed and the lampmust be switched on for the measurement. The measurement lasts for several seconds. TheBlack Reference checkbox is then activated automatically.
Shading Correction checkbox
Only active if you have defined a shading correction via the Define button.
Activated: Applies the measured shading correction to the image.
Deactivated: The measured shading correction is not used. The reference image is retained.
Define button
Automatically defines the shading correction. To do this you will acquire a reference image forthe shading correction. An empty image without structures is required to measure the shadingimage. Move the slide to an empty position on the sample with no artifacts in the image. TheShading Correction checkbox is activated automatically after the definition.
Enable Noise Filter checkbox
Activated: The Limit slider and the spin box/input field are active.
Enter the limit for the noise filter using the slider or spin box/input field.
Enable Unsharp Mask checkbox
Activated: Emphasizes edges in the image more clearly.
Strength slider
Enter the strength of the filtering using the slider or spin box/input field.
The following functions are only visible if the Show All mode is activated:
Radius slider
Enter the radius of the filtering using the slider or spin box/input field.
6.3.6
Tools (blue tools)
Camera tool Manual
Carl Zeiss Microscopy GmbH 75

Color Mode dropdown list
Here you can select the desired color mode. You can choose between RGB or Luminance.
Auto Contrast checkbox
Activated: The Contrast Tolerance slider and spin box/input field are active.
Enter the contrast tolerance (0-20) using the slider or spin box/input field.
Clip to Valid Bit Number checkbox
Activated: Limits the setting option for the Contrast Tolerance function to a valid bit number.Diese
Trigger Control section
Only visible if the Show All mode is activated.
To show the section in full, click on the button.
Trigger Out
As soon as this output is activated, you can select the polarity with which you want this signal tobe generated.
Enable for Snap checkbox
When this checkbox is activated, the shutter pulse is only generated during acquisition. If youwant a trigger signal to be generated both during the live image and during acquisition, bothcheckboxes must be activated simultaneously.
Enable for Live checkbox
When this checkbox is activated, the shutter pulse is only generated during the live image. Ifyou want a trigger signal to be generated both during the live image and during acquisition, bothcheckboxes must be activated simultaneously.
Control Signal dropdown list
Active High means that the Control Signal jumps from 0V to 5V when the camera's exposurebegins and returns to 0V following exposure.
Active Low means that the Control Signal jumps from 5V to 0V when the camera's exposurebegins and returns to 5V following exposure.
Configure this behavior in accordance with the requirements of the device that you have con‐nected.
Shutter Open Delay input field
Due to the inertia of the masses being moved, a mechanical shutter needs a certain amount oftime to change from the closed to the open position after the control signal has been generated.To ensure the sensor does not record this transitional state when it is exposed, which wouldlead to uneven exposure, it is possible to delay the start of actual acquisition. Enter a value inaccordance with the data for the device that you have connected. The delay time can be setfrom 0 to 819 ms.
Trigger In
If the camera that you are using has a control input, you can also trigger acquisition by meansof an external control pulse.
Enable for Snap checkbox
6.3.7
ManualTools (blue tools)
Camera tool
76 Printed 06/2012
When this checkbox is activated, acquisition after a snap command is only triggered followingthe input of the control signal.
Control Signal dropdown list
Active High means that the Control Signal jumps from 0V to 5V when the camera's exposurebegins and returns to 0V following exposure.
Active Low means that the Control Signal jumps from 5V to 0V when the camera's exposurebegins and returns to 5V following exposure.
Configure this behavior in accordance with the requirements of the device that you have con‐nected.
Model Specific section
Only visible if the Show All mode is activated.
To show the section in full, click on the button.
Orientation dropdown list
Here you can select the orientation of the camera image. This allows you to adjust the cameraimage to the properties of the different camera ports. The following selection options are availa‐ble:
▪ Original
▪ Horizontal Flip
▪ Vertical Flip
▪ -90° Rotation
▪ +90° Rotation
▪ 180° Rotation
▪ -45° Flip
▪ +45° Flip
Default button
Resets all settings to the default values.
Software Autofocus toolQuality section
Selects the simple and fast algorithm to calculate the software autofocus.
Selects a more complex, optimized algorithm to calculate the software autofocus.
Range Coverage section
Sets a part of the travel range as the region for determining the autofocus.
Sets the full travel range as the region for determining the autofocus.
Sampling section
Uses a large Z-distance between the individual focus images that are used to calculate the bestfocus position.
6.3.8
6.4
Basic
Best
Smart
Full
Coarse
Tools (blue tools)
Camera tool Manual
Carl Zeiss Microscopy GmbH 77
Uses a medium Z-distance between the individual focus images that are used to calculate thebest focus position.
Uses a small Z-distance between the individual focus images that are used to calculate the bestfocus position.
Autofocus Search Range section
Only visible if the Show All mode is activated.
Relative Range button
Activated: The software autofocus is calculated over a relative range.
Automatic Range checkbox
Activated: Calculates the range for the autofocus search automatically depending on the objec‐tive set.
Range spin box/input field
Only active if the Automatic Range checkbox is not activated.
Enter a range here that you want to be used for the autofocus search.
Step Size display field
Shows the distance between the individual focus images set in the Range section.
Fixed Range button
Activated: The software autofocus is calculated over a fixed range.
Set Last button
Defines the current Z-position as the end point for the software autofocus. Alternatively, you canenter the desired value in the spin box/input field to the left of the button.
Set First button
Defines the current Z-position as the start point for the software autofocus. Alternatively, youcan enter the desired value in the spin box/input field to the left of the button.
Autofocus ROI section
To show the section in full, click on the button.
Spot Meter / Focus ROI checkbox
Activated: Spot measurement is used to calculate the software autofocus.
See also
2 Locate tab [➙ p.48]
Movie Recorder toolIn the Movie Recorder tool you can acquire image sequences in the form of videos using thecamera's fastest burst mode.
Start Movie button
Starts acquisition. The button changes into the Pause button.The animated Stop button appearsin the window above the button.
Pause Movie button
Pauses acquisition. The button changes into the Continue button.
Optimal
Fine
6.5
ManualTools (blue tools)
Movie Recorder tool
78 Printed 06/2012

Continue Movie button
Continues acquisition if it has been paused. The button changes into the Pause button.
Stop button
Stops acquisition. Save the acquired movies either in the internal CZI format or as a series ofindividual images via File menu | Export or as an AVI file via File | Export Film.
See also
2 Locate tab [➙ p.48]
Light Path Settings toolIn the Light Path Settings tool you can view and change the hardware settings used in the ex‐periment. You will see a graphical display of the acquisition light path with various icons. Thearrangement of the icons represents the typical set-up of the various microscope componentson your system.
InformationPlease note that the Light Path tool can be found on the Locate tab. In some cases this has asimilar appearance and similar control elements. Its function differs, however, from the LightPath Settings tool described here.
See also
2 Acquisition tab [➙ p.50]
Before Experiment/After Experiment section
Here you can edit the hardware settings that should be applied before and after the experiment.
Before Experiment list item
Shows the name of the hardware setting that will be applied immediately before the experiment.
After Experiment list item
Shows the name of the hardware setting that will be applied immediately after the experiment.
Option buttons
Open the Options shortcut menus for the relevant hardware settings.
Go! buttons
Apply the selected hardware settings.
Previous/Next buttons
The Previous/Next buttons allow you to navigate through the various hardware settings.
6.6
6.6.1
Tools (blue tools)
Light Path Settings tool Manual
Carl Zeiss Microscopy GmbH 79

Options
Edit Setting/ Light Path
Opens a light path dialog in which you can change the relevant hardware setting.
Set to none
Removes the existing hardware setting.
Get Current Hardware
Adopts the current device status.
Experiment Settings Pool
The shortcut menu shows a list of the existing hardware settings.
Harddrive Folder Settings
The shortcut menu shows a list of the saved hardware settings.
From File
Opens the Import Hardware Settings dialog window. Select a ZIS hardware settings file(*.czhws).
Export to User Folder Settings
Exports the current hardware setting.
Acquisition Light Path section
In the graphical display of the acquisition light path you can see the typical set-up of all the mi‐croscope components on your system. The associated hardware settings are shown above theicons and can be changed here. To change the relevant hardware settings, left-click on theicons. In the shortcut menus you will see numerous selection and setting options for adjustingyour settings.
InformationAny change you make is automatically adopted and written to the corresponding hardware set‐ting of the experiment. If you want to undo these changes, do not save the experiment. In‐stead, reload the experiment in the Experiment Manager.
If you change the hardware settings in the Acquisition Light Path section, please bear the fol‐lowing points in mind:
▪ Components with an activated checkbox are adopted into the hardware settings of the ex‐periment and subsequently applied in the experiment. These components are displayed witha colored icon.
▪ Components with a deactivated checkbox are not adopted into the hardware settings of theexperiment and are not subsequently applied in the experiment. These components are dis‐played with a grayed-out icon.
6.6.1.1
6.6.2
ManualTools (blue tools)
Light Path Settings tool
80 Printed 06/2012

▪ Components with a filled-in checkbox and a triangle underneath are only partially adoptedinto the hardware settings of the experiment and subsequently applied in the experiment. Toshow the sub-components, click on the triangle under the checkbox. To adopt the sub-com‐ponents into the hardware settings of the experiment and subsequently apply them in theexperiment, activate the relevant checkboxes for the sub-components.
Hardware Setting section
Only visible if the Show All mode is activated.
Remove button
Removes hardware settings that are not being used from your experiment.
InformationIf you frequently change an experiment, e.g. delete channels and add them again, unusedhardware settings build up. Only remove settings if you will no longer need them in the future.
List of Settings Available in Experiment
Shows all the hardware settings available in the experiment. You can add further hardware set‐tings to your experiment using the button. Use the button to delete the selectedhardware setting.
Acquisition Mode toolIn the Acquisition Mode tool you can set the various microscope camera parameters that youwant to apply for the entire experiment. Microscope camera settings that are configured in theAcquisition Mode tool apply to all channels or tracks acquired using this camera.
InformationIf you have created an experiment using the Experiment Designer tool, the settings in the Ac‐quisition Mode tool only apply to the relevant experiment block and may differ in the nextblock.
In terms of its content and appearance, the Acquisition Mode tool is largely dependent on whichcamera(s) or devices are available on your system.
Example 1
If only one microscope camera is configured on your system, the Acquisition Mode tool on theAcquisition tab scarcely differs from the Camera tool on the Locate tab. In this case the expo‐sure time settings are not available in the Acquisition Mode tool.
Example 2
If additional devices are configured on your system, e.g. a VivaTome or ApoTome, correspond‐ing sections are available in the Acquisition Mode tool.
See also
2 Acquisition tab [➙ p.50]
6.6.3
6.7
Tools (blue tools)
Light Path Settings tool Manual
Carl Zeiss Microscopy GmbH 81

Selected Camera section
Only visible if at least two cameras are connected to the system and these are both being usedin the current experiment.
Here you can select the camera that you want to configure in the Acquisition Mode tool. All set‐tings then apply to this camera only.
InformationDual camera experiments, which use two identical camera types, form an exception here. Iftwo cameras of the same type are used within a track, the camera settings can no longer bechanged independently of one another in the Acquisition Mode tool; instead they are synchron‐ized.
Settings From Locate Tab section
Get button
Transfers the settings from the Camera tool on the Locate tab to the Acquisition Mode tool.
Default button
Resets all settings to the default settings.
White Balance section
Only active if a color camera has been selected.
Auto button
Sets the white balance automatically.
Pick button
Select a point in the image as a reference point for the white balance.
3200K button
Sets the color temperature to 3200K.
5500K button
Sets the color temperature to 5500K.
Show Channels checkbox
Only visible if the Show All mode is activated.
Activated: Displays 3 sliders to allow each color channel to be set precisely.
Color Offset slider
Here you can set the color temperature.
Saturation slider
Only visible if the Show All mode is activated.
Here you can set the saturation.
Reset button
6.7.1
6.7.2
6.7.3
ManualTools (blue tools)
Acquisition Mode tool
82 Printed 06/2012

Resets all settings to the default values.
Mode section
Only visible if the Show All mode is activated.
Color Mode button
Sets the color mode to RGB.
Sets the color mode to B/W.
Live Speed dropdown list
Here you can select the speed of the live mode. You can choose between Slow, Medium andFast.
Resolution dropdown list
Here you can select the camera resolution.
Binning dropdown list
Here you can select the binning mode for the camera.
NIR Mode checkbox
When the checkbox is active you can use the camera in the near infrared range.
Acquisition ROI section
In this section you can define a particular area that you want to be acquired.
After clicking on the Update Overview button, in the window on the left you will see a Preview ofyour sample under the camera. The Pixel Size below the preview window indicates the size of apixel depending on the scaling set. The blue frame indicates the selected area. The entire pre‐view window is highlighted by default. To change the area, move the mouse pointer over theblue frame. The mouse pointer will appear as a double-headed arrow. If you hold down themouse button and move the mouse, you can change the size of the frame and in this way high‐light a certain area on the sample. To move the area, position the mouse pointer inside theframe. The mouse pointer will appear as a four-headed arrow. If you hold down the mouse but‐ton and move the mouse, the frame can be moved.
Maximize button
Maximizes the frame to the maximum size in the preview window.
Center button
Positions a frame that has been changed precisely at the center of the image.
Size input field
Here you can enter the size of the frame that you want. Depending on the camera type availa‐ble, select from the predefined sizes in the dropdown list (1388x1040, 1024x1024, 512x512,256x256, 128x128). Alternatively you also have the option of entering the Size in X and Y, andthe top left Start position. You can change the values by increments using the arrow buttonsnext to the input windows or you can enter the desired values directly using the keyboard. To dothis, you must activate the number already present using the cursor. Complete the entry by us‐ing the Tab or Enter key.
Offset input field
6.7.4
RGB
B/W
6.7.5
Tools (blue tools)
Acquisition Mode tool Manual
Carl Zeiss Microscopy GmbH 83
Here you can enter the start position for the frame, measured from the top left corner.
Refresh Overview button
Adopts the image from the camera into the preview window.
Post-Processing section
Depending on which camera you are using, some functions are not visible. The most importantfunctions are explained in the section below.
Black Reference checkbox
Only visible if the Show All mode is activated.
Only active if you have defined a black reference via the Define button.
Activated: Applies the measured black reference to the image.
Deactivated: The measured black reference is not used. The reference image is retained.
Define button
Automatically defines the black reference. To do this a reference image is acquired, from whichthe black reference is measured. The light path to the camera must be closed and the lampmust be switched on for the measurement. The measurement lasts for several seconds. TheBlack Reference checkbox is then activated automatically.
Shading Correction checkbox
Only active if you have defined a shading correction via the Define button.
Activated: Applies the measured shading correction to the image.
Deactivated: The measured shading correction is not used. The reference image is retained.
Define button
Automatically defines the shading correction. To do this you will acquire a reference image forthe shading correction. An empty image without structures is required to measure the shadingimage. Move the slide to an empty position on the sample with no artifacts in the image. TheShading Correction checkbox is activated automatically after the definition.
Enable Noise Filter checkbox
Activated: The Limit slider and the spin box/input field are active.
Enter the limit for the noise filter using the slider or spin box/input field.
Enable Unsharp Mask checkbox
Activated: Emphasizes edges in the image more clearly.
Strength slider
Enter the strength of the filtering using the slider or spin box/input field.
The following functions are only visible if the Show All mode is activated:
Radius slider
Enter the radius of the filtering using the slider or spin box/input field.
Color Mode dropdown list
Here you can select the desired color mode. You can choose between RGB or Luminance.
Auto Contrast checkbox
6.7.6
ManualTools (blue tools)
Acquisition Mode tool
84 Printed 06/2012

Activated: The Contrast Tolerance slider and spin box/input field are active.
Enter the contrast tolerance (0-20) using the slider or spin box/input field.
Clip to Valid Bit Number checkbox
Activated: Limits the setting option for the Contrast Tolerance function to a valid bit number.Diese
Trigger Control section
Only visible if the Show All mode is activated.
To show the section in full, click on the button.
Trigger Out
As soon as this output is activated, you can select the polarity with which you want this signal tobe generated.
Enable for Snap checkbox
When this checkbox is activated, the shutter pulse is only generated during acquisition. If youwant a trigger signal to be generated both during the live image and during acquisition, bothcheckboxes must be activated simultaneously.
Enable for Live checkbox
When this checkbox is activated, the shutter pulse is only generated during the live image. Ifyou want a trigger signal to be generated both during the live image and during acquisition, bothcheckboxes must be activated simultaneously.
Control Signal dropdown list
Active High means that the Control Signal jumps from 0V to 5V when the camera's exposurebegins and returns to 0V following exposure.
Active Low means that the Control Signal jumps from 5V to 0V when the camera's exposurebegins and returns to 5V following exposure.
Configure this behavior in accordance with the requirements of the device that you have con‐nected.
Shutter Open Delay input field
Due to the inertia of the masses being moved, a mechanical shutter needs a certain amount oftime to change from the closed to the open position after the control signal has been generated.To ensure the sensor does not record this transitional state when it is exposed, which wouldlead to uneven exposure, it is possible to delay the start of actual acquisition. Enter a value inaccordance with the data for the device that you have connected. The delay time can be setfrom 0 to 819 ms.
Trigger In
If the camera that you are using has a control input, you can also trigger acquisition by meansof an external control pulse.
Enable for Snap checkbox
When this checkbox is activated, acquisition after a snap command is only triggered followingthe input of the control signal.
Control Signal dropdown list
6.7.7
Tools (blue tools)
Acquisition Mode tool Manual
Carl Zeiss Microscopy GmbH 85

Active High means that the Control Signal jumps from 0V to 5V when the camera's exposurebegins and returns to 0V following exposure.
Active Low means that the Control Signal jumps from 5V to 0V when the camera's exposurebegins and returns to 5V following exposure.
Configure this behavior in accordance with the requirements of the device that you have con‐nected.
Model Specific section
Only visible if the Show All mode is activated.
To show the section in full, click on the button.
Orientation dropdown list
Here you can select the orientation of the camera image. This allows you to adjust the cameraimage to the properties of the different camera ports. The following selection options are availa‐ble:
▪ Original
▪ Horizontal Flip
▪ Vertical Flip
▪ -90° Rotation
▪ +90° Rotation
▪ 180° Rotation
▪ -45° Flip
▪ +45° Flip
Default button
Resets all settings to the default values.
Other Devices section
VivaTome section
Only visible if you have connected a VivaTome to your system.
Functions...
ApoTome section
Only visible if you have connected an ApoTome to your system.
Functions...
Fast Acquisition section
In this section, 3 modes are available for defining how acquisition is performed.
6.7.8
6.7.9
6.7.10
ManualTools (blue tools)
Acquisition Mode tool
86 Printed 06/2012

Interactive mode
Acquisition is comparatively slow. You can intervene manually at certain points during acquisi‐tion.
Triggered mode
Fast acquisition via the hardware.
Compromise mode
The Compromise mode is activated automatically if only individual hardware components, butnot the whole system, are compatible with the Triggered mode for acquiring an experiment.
Validate button
To establish whether the system is able to perform an experiment in Triggered mode, click onthe Validate button.
Channels toolIn the Channels tool you can configure channels for acquisition. The tool offers you the option ofentering the hardware settings for acquisition manually or performing the configuration automat‐ically.
See also
2 Acquisition tab [➙ p.50]
Channels list
If you have not yet defined a channel or all channels have been deleted, you will only see anempty list here. To add a channel, click on the button. The other sections will only be visibleonce you have added one or more channels.
Please bear the following points in mind for the Channels list:
▪ The selected channel is highlighted by a light gray bar.
▪ The reference channel is highlighted by a blue font color.
▪ The preview color for the channel is shown on the right in the list. To change the previewcolor for the channel, click on the colored rectangle with the arrow icon and select an alter‐native color from the shortcut menu. The preview color is also shown in the sections forchannel-specific hardware settings as a thin line on the left-hand side.
add button
Opens the Add Dye or Contrast Technique [➙ p.58] dialog window.
InformationIf you select a dye or contrast technique in the Add Dye or Contrast Technique dialog, a sug‐gestion for the hardware settings for the acquisition of this channel is made automatically. If nosuggestion can be made, a channel without hardware settings is added. You will then see acorresponding indication in the status area of the program interface.
6.8
6.8.1
Tools (blue tools)
Channels tool Manual
Carl Zeiss Microscopy GmbH 87

button
Only active if you have added a channel to the list.
Selects the channel below the selected channel.
button
Only active if you have added a channel to the list.
Selects the channel above the selected channel.
button
Only active if you have added a channel to the list.
Deletes the selected channel.
button
Opens the Options [➙ p.88] shortcut menu.
Options
New menu item
Opens the Add Dye or Contrast Technique [➙ p.58] dialog window.
Copy menu item
Creates a copy of the selected channels.
Rename menu item
Opens a dialog that allows you to change the name of the dye or contrast technique for the se‐lected channel.
Reset Color menu item
Resets the setting for the channel's preview color to the original color.
Select All menu item
Selects all channels in the list.
Delete menu item
Deletes the selected channel.
Delete All menu item
Deletes all existing channels.
Compare menu item
Opens the Compare Channels dialog window. In this dialog window all selected channels aredisplayed in a horizontal arrangement. This view allows you to compare the selected channelsmore easily.
6.8.1.1
ManualTools (blue tools)
Channels tool
88 Printed 06/2012

Channel-specific settings
The settings always relate to the channel you have selected in the Channels list.
To show the settings for all channels, click on the button | Select All in the Channels list.
Light Source section
In the Light Source section you can select the available light sources and enter the correspond‐ing settings. Here you can adjust the parameters of the light sources without having to savethese in the hardware settings. You can therefore adjust the intensity of the laser lines or LEDs,for example, immediately before starting acquisition.
If your system is equipped with a TIRF slider, the TIRF angle and type of illumination can alsobe set here.
Light Source dropdown list
Select the light source here.
If you select the Use Hardware Setting entry, the settings for the light sources disappear. Thelight source parameters from the hardware settings are used instead for the acquisition of thechannel.
Camera Settings section
Dye Name input field
In the input field after the selected dye you can enter an additional name.
Camera dropdown list
Select the desired camera for the channel from the dropdown list.
Time slider
Enter the exposure time for the camera using the Time slider or spin box/input field. Select theunit of time from the dropdown list to the right of the spin box/input field.
Range spin box/input field
Only visible if the Show All mode is activated.
Here you can enter the range of the camera's dynamic range that is utilized.
Auto checkbox
Activated: Automatically determines the camera's exposure time for the channel. The value setmanually is ignored.
Measure button
Starts an exposure time measurement for the channel. After the measurement the value isadopted as the exposure time setting.
The following functions are only visible if the Show All mode is activated:
6.8.2
6.8.2.1
6.8.2.2
Tools (blue tools)
Channels tool Manual
Carl Zeiss Microscopy GmbH 89

Focus Offset spin box/input field
Here you can enter the focus offset from the channel to the Z-position of the reference channelor to the current position.
Display dropdown list
Here you can select an existing predefined display setting. You must have previously saved apredefined display setting in *.CZDSP format.
Set button
Adopts the selected predefined display setting. The values are shown in the display fields.
Remove button
Deletes the selected predefined display setting.
Z-Stack Mode dropdown list
Only visible if the Z-Stack checkbox is activated in the Experiment Manager.
Selection option Function
Yes Acquires a Z-stack as defined in the Z-Stacktool.
No Does not acquire a Z-stack, only the centralfocal plane.
No, fill with central plane Does not acquire a Z-stack, only the centralfocal plane, and copies this to all Z-planes ofthe image in this channel.
No, fill with black Does not acquire a Z-stack, only the centralfocal plane. All the other Z-planes of the im‐age are filled with black images.
Experiment Designer tool
InformationThe Experiment Designer tool is only available if the Show All Tools checkbox is activated inthe Experiment Manager.
In the Experiment Designer tool you can create experiments for multidimensional acquisition.The experiments can consist of any number of components. A component is referred to as anexperiment block. Each experiment block has a distinct number, which is shown above theblock. Special actions that influence the course of an experiment are performed by means of aspecial block. In the Show All mode you can define repetitions and specify the number of imagefiles.
See also
2 Acquisition tab [➙ p.50]
6.9
ManualTools (blue tools)
Experiment Designer tool
90 Printed 06/2012
Enable Experiment Designer section
Activate Experiment Designer Mode checkbox
Activated: The Experiment Designer Mode is active. The entire experiment is saved in the Ex‐periment Manager. If you now click on the Start Experiment button in the Experiment Manager,all active blocks are run.
Deactivated: The Experiment Designer Mode is deactivated. Only the most recently selectedexperiment block is saved.
Acquisition Block section
Add New button
Creates a new, empty experiment block.
Duplicate button
Creates an exact copy of the selected block.
Delete button
Deletes the selected block from your experiment.
Add Special Block section
Delay button
Adds the Delay special block. This block pauses the experiment for a predefined period. Set thelength of the pause using the slider or selection field to the right of the button. Change the unitof time using the dropdown menu to the right of the selection field.
Wait button
Adds the Wait special block. This block displays a user-defined message and interrupts the ex‐periment until the message is confirmed with OK. Enter the desired message into the input fieldto the right of the button.
Execute button
Adds the Apply special block. This block applies a change to the hardware.
Sequential checkbox
Activated: Runs the next experiment block immediately and irrespective of the duration of thehardware change.
Deactivated: Only runs the next experiment block once the hardware setting has been applied.
button
Opens the Options shortcut menu.
Go! button
Applies the selected hardware setting immediately.
6.9.1
6.9.2
6.9.3
Tools (blue tools)
Experiment Designer tool Manual
Carl Zeiss Microscopy GmbH 91
Options
Edit Setting/ Light Path
Opens a light path dialog in which you can change the relevant hardware setting.
Set to none
Removes the existing hardware setting.
Get Current Hardware
Adopts the current device status.
Experiment Settings Pool
The shortcut menu shows a list of the existing hardware settings.
Harddrive Folder Settings
The shortcut menu shows a list of the saved hardware settings.
From File
Opens the Import Hardware Settings dialog window. Select a ZIS hardware settings file(*.czhws).
Export to User Folder Settings
Exports the current hardware setting.
One Image File Per Acquisition Block section
1 separate image document / acquisition block checkbox
Only visible if the Show All mode is activated.
Activated: One separate image file is created per acquisition block.
Deactivated: A single image file is created for all images of the active experiment.
Loops and Repetitions section
Only visible if the Show All mode is activated.
To show the section in full, click on the button.
In the Loops and Repetitions section you can specify which experiment blocks should be repea‐ted during the course of the experiment. You can define as many repetitions as you like for eachexperiment. An experiment block may only appear once within the repetitions defined.
6.9.3.1
6.9.4
6.9.5
ManualTools (blue tools)
Experiment Designer tool
92 Printed 06/2012

InformationIf you define several repetitions, the following conditions must be met:
- Repetitions must form a complete unit
- One repetition may not be placed within another
If these conditions are not met, the repetition cannot be performed. In this case a yellow warn‐ing symbol appears under the Active field.
Loops field
Enter the number of loops that you want to be performed in the spin box/input field.
Start field
Enter the number of the starting block in the spin box/input field.
End field
Enter the number of the end block in the spin box/input field.
Active field
If the checkbox after the repetition in question is activated, this repetition is performed in the ex‐periment.
button
Adds a new repetition to the experiment.
button
Deletes the selected repetition.
Z-Stack toolIn the Z-Stack tool you can configure acquisitions that comprise several Z-planes of your sam‐ple. You can set all the parameters manually or have configuration performed automatically.
InformationThe Z-Stack tool is only available if you have activated the Z-Stack checkbox in the Experi‐ment Manager | Acquisition Dimensions.
See also
2 Acquisition tab [➙ p.50]
Automatic Configuration
Automatic configuration is performed in the Z-Stack Autoconfiguration section at the bottom ofthe tool. The following parameters are set automatically:
▪ Z-position of the central plane
▪ Distance between the individual planes
6.10
6.10.1
Tools (blue tools)
Z-Stack tool Manual
Carl Zeiss Microscopy GmbH 93

▪ Number of section planes
InformationBefore you perform automatic configuration, the current focus position must be at the center ofthe sample. The camera's current field of view must always be at a position on the sample thatshows a signal in the selected channel.
InformationAutomatic Z-stack configuration only works with microscopes and systems that do not use anoptical sectioning technique. If you use an ApoTome, VivaTome, Spinning Disc (CSU) or an‐other technique for generating optical sections, the Z-stack must be configured manually.
Configure Z-Stack button
Automatically configures the Z-stack using the current sample.
Manual Configuration
InformationZ-stack images are always acquired from bottom to top automatically, irrespective of whetheryou have defined the top or bottom Z-plane of your stack as the first Z-plane. This acquisitionsequence increases the accuracy of the Z-positioning.
First/Last button
Only visible if the Show All mode is activated.
Activates the First/Last acquisition mode.
Activate the First/Last button if you want to specify manually which Z-plane is acquired first andwhich is acquired last.
Center button
Activates the Center acquisition mode.
Activate the Center button if you want to specify the central Z-plane manually.
Only visible if the Show All mode is activated.
Z-Stack Preview
The graphic in the left tool area represents the configured Z-stack. In the case of inverse micro‐scopes the objective appears in stylized form at the bottom of the Z-stack. In the case of uprightsystems it appears at the top.
The blue plane indicates the current section plane. The round L, C and F buttons refer to thecorresponding planes (L = Last, C = Center, F = First). To change the current Z-position, clickon the relevant buttons. The blue plane then jumps to the desired position.
The values at the top and bottom of the measurement scale on the right-hand side of the graph‐ic indicate the distance to the center of the Z-stack.
6.10.2
ManualTools (blue tools)
Z-Stack tool
94 Printed 06/2012

The Position display field below the graphic indicates the Z-position at which the section planeis located. Here you can navigate precisely to the relevant Z-positions.
The Section display field below the graphic indicates the number of the section in question.
First/Last acquisition mode
Last button
Sets the position for the last Z-plane. You can also enter the value in the input field to the rightof the button.
Range display field
Displays the range of the configured Z-stack from the last to the first section plane.
Sections input field
Here you can enter the number of section planes that you want.
Interval input field
Here you can enter the desired distance between the section planes.
Optimal button
This button shows the distance calculated for the channels set and the current microscope ac‐cording to the Nyquist criterion. If you click on this button, this value is automatically adoptedinto the Interval input field.
Keep radio button
Keeps the set interval between the section planes constant if you change configuration parame‐ters in the Z-Stack tool.
Keeps the set number of section planes constant.
First button
Sets the position for the first Z-plane. You can also enter the value in the input field to the rightof the button.
Center acquisition mode
Range display field
Displays the range of the configured Z-stack from the last to the first section plane.
Sections input field
Here you can enter the number of section planes that you want.
Interval input field
Here you can enter the desired distance between the section planes.
6.10.2.1
Interval
Section
6.10.2.2
Tools (blue tools)
Z-Stack tool Manual
Carl Zeiss Microscopy GmbH 95

Optimal button
This button shows the distance calculated for the channels set and the current microscope ac‐cording to the Nyquist criterion. If you click on this button, this value is automatically adoptedinto the Interval input field.
Keep radio button
Keeps the set interval between the section planes constant if you change configuration parame‐ters in the Z-Stack tool.
Keeps the set number of section planes constant.
Center button
Sets the position for the central Z-plane. You can also enter the value in the input field to theright of the button.
Offset input field
Here you can enter an offset value if you want to shift the acquisition of the Z-stack relative tothe focus position.
Tiles toolIn the Tiles tool you can configure the acquisition of images that consist of several image fields(tile regions) and positions. If an image is made up of several tile regions, we also talk of a mo‐saic image. Here you can enter the positions, the number of tiles and other specifications relat‐ing to the size, area and distribution of the images on the sample carrier.
InformationThe Tiles tool is only available if you have activated the Tiles checkbox in the Experiment Man‐ager | Acquisition Dimensions. This checkbox is only visible if you have a corresponding li‐cense and a motorized microscope stage has been detected.
See also
2 Acquisition Dimensions [➙ p.54]
2 Acquisition tab [➙ p.50]
Advanced Setup section
Advanced Setup button
Opens the Tiles Advanced Setup View [➙ p.193] in the Center Screen Area for the Tiles tool.
Add Tile Region section
Contour section
Only visible if the Show All mode is activated.
Defines the outline of the tile region that you are adding. To add a rectangular tile region, clickon the Rectangle button. To add a circular tile region, click on the Circle button.
Interval
Section
6.11
6.11.1
6.11.2
ManualTools (blue tools)
Tiles tool
96 Printed 06/2012

Tiles button
Selects the number of tile regions as a reference for the size of the tile region. Enter the numberof tile regions in the X/Y spin boxes/input fields. If you are adding a circular tile region, enter thenumber of tile regions in the Diameter spin box/input field.
Size button
Selects the size as a reference for the size of the tile region. Enter the size of the tiles in the X/Yspin boxes/input fields. If you are adding a circular tile region, enter the diameter of the tile re‐gions in the Diameter spin box/input field.
button
Adds the tile region to the Tile Regions list and activates it for acquisition.
Added tiles are displayed in the form of red grids in the stage view. Sie können die Gitter belie‐big
Add Position section
X-Position display field
Displays the X coordinate of the current position.
Y-Position display field
Displays the Y coordinate of the current position.
button
Adds the current position to the Positions list and activates it for acquisition.
Tile Regions and Positions section
Tile Regions tab
Tile Regions list
Displays the added tile regions. The list contains the following columns:
Activates the relevant list entry for acquisition.
Displays the name of the tile region.
Displays the contour of the tile region.
Indicates whether the tile region can be changed.
Displays the category of the tile region.
Displays the number of tile regions.
Displays the size of the tile region.
Displays the Z-position of the tile region.
button
Deletes the selected list entry.
6.11.3
6.11.4
6.11.4.1
Checkbox
Name
Contour
Lock
Category
Tiles
Size
Z
Tools (blue tools)
Tiles tool Manual
Carl Zeiss Microscopy GmbH 97

Unlock button
Unlocks the selected list entry to prevent editing.
Positions tab
Individual Positions button
Displays the individual positions you have added in the Individual Positions list.
Position Array button
Displays the position arrays you have added in the list.
Individual Positions list
Activates the relevant list entry for acquisition.
Displays the name of the individual position.
Displays the contour of the individual position.
Displays the category of the position.
Displays the X-position of the position.
Displays the Y-position of the position.
Displays the Z-position of the position.
button
Deletes the selected list entry.
Lock button
Locks the selected list entry to prevent editing.
Position Arrays list
Activates the relevant list entry for acquisition.
Displays the name of the individual position.
Displays the contour of the individual position.
Displays the category of the position.
Displays the number of positions in a position array.
Displays the size of a position array.
button
Deletes the selected list entry.
Lock button
Locks the selected list entry to prevent editing.
Positions of Selected Array list
The individual positions of the selected array are displayed here. The description of the tablecolumns corresponds to that of the Individual Positions list.
6.11.4.2
Checkbox
Name
Contour
Category
X
Y
Z
Checkbox
Name
Contour
Category
Positions
Size
ManualTools (blue tools)
Tiles tool
98 Printed 06/2012

Options section
Only visible if the Show All mode is activated.
Here you can determine the acquisition and travel behavior during the experiment. Changes inthis section of the tool affect all elements, mosaic acquisitions, positions and position arrays.
Tile Overlap spin box/input field
Enter the overlap of individual image tiles of a mosaic image here. The settings are applied ex‐clusively to mosaic images.
Scan Movement
Acquires the mosaic image from one travel direction following a comb pattern. This scan move‐ment is more precise.
Acquires the mosaic image from both travel directions following a meander pattern. This scanmovement is faster.
Optimize Stage Movement checkbox
Activated: Optimizes the movement of the stage. Short paths are used between tile regions andpositions.
InformationIf you activate the checkbox, individual positions and mosaic images are not located in the se‐quence in which they were originally defined. The path is automatically adapted to the locationof the individual mosaic images and positions. If you add or remove tile regions or positions,the sequence of acquisition therefore also changes.
Keep Tile Number Constant With New Scaling checkbox
Activated: Keeps the tile number constant if a new scaling is applied.
Split Scenes into Individual Files checkbox
Activated: Splits the scenes into individual files.
Sample Carrier section
To show the section in full, click on the button.
Sample Carrier field
Displays the selected or calibrated sample carrier.
Select button
Opens the Select Sample Carrier Template dialog window. Here you can select the sample car‐rier template.
Calibrate button
Opens the Sample Carrier Calibration Wizard. Here you can calibrate the sample carrier.
6.11.5
Comb button
Meander but‐ton
6.11.6
Tools (blue tools)
Tiles tool Manual
Carl Zeiss Microscopy GmbH 99

Move Focus Drive to Load Position Between Containers checkbox
Activated: Moves the focus drive to the loading position during the movement to another con‐tainer of the sample carrier (e.g. a well or slide). This prevents possible damage.
Focus Surface section
To show the section in full, click on the button.
Support Points of Selected Tile Region list
Displays the X coordinate of the focus reference point.
Displays the Y coordinate of the focus reference point.
Displays the Z coordinate of the focus reference point.
button
Deletes the selected list entry.
Interpolation Degree dropdown list
Here you can select a method for the interpolation of the focus reference area.
Panorama toolIn the Panorama tool you will see information on the microscope stage and the status of panor‐ama images. Panorama images are controlled directly in the Panorama View [➙ p.175].
InformationThe Panorama tool is only available if you have activated the Panorama checkbox in the Ex‐periment Manager | Acquisition Dimensions.
See also
2 Acquisition Dimensions [➙ p.54]
2 Acquisition tab [➙ p.50]
Time Series toolIn the Time Series tool you can configure acquisitions that allow you to acquire an image seriesconsisting of a number of time points. Here you can enter, for example, the acquisition interval,the length of the experiment and other specifications to control the experiment.
InformationThe Time Series tool is only available if the Time Series checkbox has been activated in theExperiment Manager | Acquisition Dimensions. This checkbox is only available if you have thecorresponding license.
See also
2 Acquisition tab [➙ p.50]
6.11.7
X column
Y column
Z column
6.12
6.13
ManualTools (blue tools)
Tiles tool
100 Printed 06/2012

Duration section
Here you can define the duration of your experiment. You can either specify the number of timepoints (in cycles) or the duration (in milliseconds, seconds, minutes, hours or days).
Slider
Enter the number of time points or the duration using the slider or spin box/input field.
Dropdown list
Select the desired unit for the duration from the dropdown list. If you select the Cycles entry,specify the number of time points using the slider or spin box/input field.
As Long As Possible checkbox
Activated: Uses the entire memory space on your hard drive. The duration of acquisition is onlylimited by the maximum amount of memory space available.
InformationIf the As Long As Possible checkbox is activated, the acquisition of the time series continuesuntil only 10% of the memory space remains. This can impair other programs. To guaranteeoptimum system performance, make sufficient memory space available before acquisition.
Interval section
Here you can define the interval from individual image to individual image in an image series.You can specify the interval to set the gap between individual time points (in milliseconds, mi‐nutes, hours or days).
Slider
Enter the value for the interval using the slider or spin box/input field.
Dropdown list
Select the desired unit for the interval from the dropdown list.
As Quick As Possible checkbox
Activated: Defines the shortest possible value for the interval.
Measure Speed button
Checks whether the experiment can be performed using the interval set. If the interval is toosmall, the shortest possible value is defined automatically for the interval.
6.13.1
6.13.2
Tools (blue tools)Time Series tool Manual
Carl Zeiss Microscopy GmbH 101
InformationThe shortest possible interval is calculated by performing a blind experiment. The camera ex‐posure time, number of steps of a Z-stack and the number of acquisition channels are takeninto consideration in the calculation. Depending on the number of Z-stacks and channels andwhether long exposure times have been set, it may take some time to calculate the shortesttime interval!
Start/Stop/Pause section
Here you can define the Start, Stop and Pause conditions for your experiment. Select the re‐quirements for the relevant conditions from the corresponding dropdown lists.
Conditions
Starts the experiment if the requirements are met.
Stops the experiment if the requirements are met.
Pauses the experiment if the requirements are met.
Ends the pause if the requirements are met.
Requirements
The experiment is started immediately using the Start Experiment button in the ExperimentManager.
The experiment is started, stopped or paused at the entered time. Die Vorgabe wird erst nachder Experimentausführung berücksichtigt. Enter the desired time in the spin box/input field tothe right of the dropdown list.
The experiment is only started, stopped or paused once the length of time entered has passed.
The experiment is started, stopped or paused once a TTL signal has been received.
InformationIf you define times as start, stop and pause conditions, these apply once for the entire experi‐ment. This also applies to experiments that use the Experiment Designer.
Buttons section
To show the section in full, click on the button.
Here you can add and configure buttons that can be used to execute certain actions during yourexperiment.
To add a new button, click on the button.
To configure a button, left-click on the button of an existing button. A dialog window will open inwhich you can configure various settings.
Name input field
Here you can enter a name for the button.
6.13.3
Start
Stop
Start Pause
End Pause
Manual
Time
Delay
On Trigger
6.13.4
ManualTools (blue tools)Time Series tool
102 Printed 06/2012

Description input field
Here you can enter a description for the button.
Color checkbox
Activated: Shows a colored line at the left edge of the button.
Color Selection
Opens the Color Selection dialog window. Here you can select a color for the line at the leftedge of the button.
Action dropdown list
Here you can select one of the following actions. This action will be executed when you click onthe button.
▪ None
▪ Set Interval
▪ As Quick As Possible
▪ Trigger
▪ Hardware Setting
Delete Button button
Deletes the selected button.
Information on Experiment toolIn the Experiment Information tool you can find out various details about your experiment, e.g.the memory requirement of the experiment or its duration.
Display field Function
Required Disk Space Indicates the calculated memory space that the experimentwill take up on your hard drive. All the activated blocks of anexperiment created using the Experiment Designer are tak‐en into account.
Duration (Theoretical) The system adds together all the exposure times arisingduring acquisition in the experiment and indicates this value.In the case of time series the intervals set are also taken in‐to account. The actual acquisition duration will always turnout longer, however, as switching times for components (di‐aphragms, reflectors) and positioning times (Z-plane, stageposition) also come into play.
6.14
Tools (blue tools)
Information on Experiment tool Manual
Carl Zeiss Microscopy GmbH 103

Display field Function
Maximum Acquisition Rate If the Time Series acquisition dimension is activated in theExperiment Manager, you can measure the maximum pos‐sible frame rate of the system in the Time Series tool. In thatcase the frame rate is shown here. Otherwise "not available"is displayed. After any change is made to the experimentthe frame rate must be determined again in the Time Seriestool.
Elapsed Time (Last Experiment) If you have already run the current experiment before on thesystem, the duration actually required for it is displayedhere. This information disappears again if you change theexperiment.
Next Time Point in Shows duration to next time point.
Tile Size Shows the X/Y dimensions of your experiment. In the caseof a single position this value is identical to the size of thecamera field.
See also
2 Acquisition tab [➙ p.50]
Interactive Measurement tool
See also
2 Analysis tab [➙ p.63]
Features section
Feature Selection dropdown list
In the Feature Selection dropdown list you can select and load previously saved feature defini‐tions. If you have made changes to a feature definition, the name of the feature selection ismarked with an asterisk (*). If you close the application without saving a changed ("asterisked")feature selection, you will be asked whether you want to save the changes.
button
Opens the Options [➙ p.52] shortcut menu.
Define button
Opens the Feature Selection [➙ p.105] dialog.
Feature Subset section
Only visible if the Show All mode is activated.
6.15
6.15.1
6.15.2
ManualTools (blue tools)
Interactive Measurement tool
104 Printed 06/2012

Feature Subset dropdown list
Here you can select and load previously saved definitions of subsets. If you have madechanges to a subset definition, the name of the feature subset is marked with an asterisk (*). Ifyou close the application without saving a changed ("asterisked") feature subset, you will beasked whether you want to save the changes.
button
Opens the Options [➙ p.52] shortcut menu.
Define button
Opens the Define Feature Subset [➙ p.107] dialog.
Measurement Procedure section
Only visible if the Show All mode is activated.
Measurement Procedure dropdown list
Here you can select and load previously saved measurement procedures. If you have madechanges to a measurement procedure, the name of the measurement procedure is marked withan asterisk (*). If you close the application without saving a changed ("asterisked") measure‐ment procedure, you will be asked whether you want to save the changes.
button
Opens the Options [➙ p.52] shortcut menu.
Define button
Opens the Define Interactive Measurement Procedure [➙ p.108] dialog.
Start button
Starts the selected interactive measurement procedure [➙ p.109].
Create Measurement Data Table button
Creates a measurement data table. This contains the measurement data from the Measureview of the current image.
Interactive Measurement dialog windows
Feature Selection dialog window
Here you can specify which features are measured with the available graphic elements. This se‐lection is adopted into the current feature definition. The feature definition is then marked ("as‐terisked") as having been changed.
6.15.3
6.15.4
6.15.5
6.15.5.1
Tools (blue tools)
Interactive Measurement tool Manual
Carl Zeiss Microscopy GmbH 105

Available Elements section
In this section you can specify for each available graphic element which features you want to bemeasured. The graphic elements are ordered by type. The following types are available for se‐lection:
Here you will find all the graphic elements that define a closed region.
Here you will find all the graphic elements with which you can measure a single distance.
Here you will find all the graphic elements with which you can measure several distances atonce.
Here you will find the graphic elements with which you can measure an angle.
Here you will find the graphic elements with which you can perform measurements at a pixel.
Here you will find the graphic elements with which you can count various events in an image.
Selected Features section
The features that you have selected for each individual graphic element are listed in this sec‐tion.
Display checkbox
Activate the Display checkbox for each feature to display the value of the measured feature inthe graphics plane of the image.
Features section
All the features that you can measure with the graphic element activated in the Available Ele‐ments section are listed in this section.
Search for Feature input field
Here you can enter parts of the name of the feature that you are looking for. The features inwhich the entered character string occurs are listed.
Features dropdown list
From the dropdown list, select a type of feature according to which you want the features to befiltered:
Feature Description
All If this is selected all features are listed.
Geometric Features If this is selected all geometric features are lis‐ted.
Intensity Features If this is selected all features that analyze in‐tensity values are listed.
Image Features If this is selected all features that contain metainformation about the measured image are lis‐ted.
Position Features / Unscaled Position Fea‐tures
If this is selected all features that describe theposition are listed.
Regions (2D)
Single Distan‐ces
Multiple Dis‐tances
Angle
Point
Events
ManualTools (blue tools)
Interactive Measurement tool
106 Printed 06/2012

+ button
Click on the button to select a feature for the measurement.
Wastepaper Bin button
Click on the button to delete the selected feature.
Upwards button
Click on the button to move the selected feature a position higher.
Downwards button
Click on the button to move the selected feature a position lower.
OK button
Click on the OK button to end the feature selection.
Cancel button
Click on the Cancel button to cancel the feature selection.
Define Feature Subset dialog window
Here you can specify which features are available in the Feature Selection dialog window.These features are adopted into the current subset definition. The subset definition is thenmarked ("asterisked") as having been changed.
Features section
All the features that you can measure with the graphic element activated in the Available Ele‐ments section are listed in this section.
Search for Feature input field
Here you can enter parts of the name of the feature that you are looking for. The features inwhich the entered character string occurs are listed.
Features dropdown list
From the dropdown list, select a type of feature according to which you want the features to befiltered:
Feature Description
All If this is selected all features are listed.
Geometric Features If this is selected all geometric features are lis‐ted.
Intensity Features If this is selected all features that analyze in‐tensity values are listed.
6.15.5.2
Tools (blue tools)
Interactive Measurement tool Manual
Carl Zeiss Microscopy GmbH 107

Feature Description
Image Features If this is selected all features that contain metainformation about the measured image are lis‐ted.
Position Features / Unscaled Position Fea‐tures
If this is selected all features that describe theposition are listed.
Checkbox
There is a checkbox in front of the name of each of the listed features. Activate the checkbox infront of the features that you want to be offered in the Feature Selection dialog.
Shortcut menu
Right-click in the Features section. Select Select All Features to activate all checkboxes. SelectDeselect All Features to deactivate all checkboxes.
OK button
Click on the OK button to end the subset definition.
Cancel button
Click on the Cancel button to cancel the subset definition.
Define Interactive Measurement Procedure dialog window
Here you can define an interactive measurement procedure. You can specify the order in whichyou want the individual graphic elements to be drawn in and which measurement parametersyou want to have calculated for them. The definition is adopted into the measurement procedurecurrently selected. The measurement procedure is then marked ("asterisked") as having beenchanged.
Available Elements section
In this section you can specify for each available graphic element which features you want to bemeasured. The graphic elements are ordered by type. The following types are available for se‐lection:
Here you will find all the graphic elements that define a closed region.
Here you will find all the graphic elements with which you can measure a single distance.
Here you will find all the graphic elements with which you can measure several distances atonce.
Here you will find the graphic elements with which you can measure an angle.
Here you will find the graphic elements with which you can perform measurements at a pixel.
Here you will find the graphic elements with which you can count various events in an image.
Double-click on a graphic element to select it and adopt it into the Order of the Elements sec‐tion.
6.15.5.3
Regions (2D)
Single Distan‐ces
Multiple Dis‐tances
Angle
Point
Events
ManualTools (blue tools)
Interactive Measurement tool
108 Printed 06/2012

Order of the Elements list
This list displays the selected graphic elements in the order in which they will be drawn in duringthe measurement, from top to bottom. To display the value of the measured feature in the im‐age's graphics plane, activate the corresponding checkbox of the graphic elements.
Wastepaper Bin button
Click on the button to delete the selected feature.
Upwards button
Click on the button to move the selected feature a position higher.
Downwards button
Click on the button to move the selected feature a position lower.
Features section
All the features that you can measure with the graphic element activated in the Available Ele‐ments section are listed in this section.
Search for Feature input field
Here you can enter parts of the name of the feature that you are looking for. The features inwhich the entered character string occurs are listed.
Features dropdown list
From the dropdown list, select a type of feature according to which you want the features to befiltered:
Feature Description
All If this is selected all features are listed.
Geometric Features If this is selected all geometric features are lis‐ted.
Intensity Features If this is selected all features that analyze in‐tensity values are listed.
Image Features If this is selected all features that contain metainformation about the measured image are lis‐ted.
Position Features / Unscaled Position Fea‐tures
If this is selected all features that describe theposition are listed.
+ button
Click on the button to select a feature for the measurement.
Interactive Measurement Procedure dialog
In this dialog you can run a predefined interactive measurement procedure.
6.15.5.4
Tools (blue tools)
Interactive Measurement tool Manual
Carl Zeiss Microscopy GmbH 109

Start button
Click on the Start button to begin drawing in the graphic elements in the image.
Pause button
Click on the Pause button to interrupt the measurement procedure. This allows you to modifygraphic elements that have already been drawn in, for example.
Continue button
If you have interrupted the measurement procedure using the Pause button, click on the Contin‐ue button to continue measuring.
End button
Click on the End button to end the current measurement procedure at a position of your choice.To restart the measurement procedure at the first graphic element, click on the Start buttonagain.
Graphic Elements section
In this section you will see the graphic elements of the current measurement procedure in theorder that you have defined.
Measurement Data section
In this section you will see the graphic elements of the current measurement procedure in theorder that you have defined.
OK button
Click on the OK button to end the interactive measurement procedure.
Cancel button
Click on the Cancel button to cancel the interactive measurement procedure. In this case thegraphic elements that have been drawn in are not adopted into the image.
Image Analysis tool
See also
2 Analysis tab [➙ p.63]
Image Analysis Wizard section
Start Image Analysis Wizard button
To define a new analysis program or to change an existing program, click on the Start ImageAnalysis Wizard button.
See also
2 The Image Analysis Wizard [➙ p.111]
6.16
6.16.1
ManualTools (blue tools)
Image Analysis tool
110 Printed 06/2012
Programs section
Program dropdown list
In the Program dropdown list you can select and load previously saved analysis programs.
Run Interactively button
Runs the selected analysis program with all the interactive steps.
Run Without Interruption button
Runs the selected analysis program without interruption.
Steps that you have marked as interactive in the Image Analysis Wizard are run with the valuesset in the analysis program. The program does not stop to allow you to change these interac‐tively.
The Image Analysis Wizard
Step 1 - Program
In this step you can create new analysis programs. You can also rename, copy and delete exist‐ing analysis programs here.
Program dropdown list
Here you can select and load saved analysis programs. If you make changes to an analysisprogram, the name of the analysis program is marked with an asterisk (*). If you close the wiz‐ard without saving a changed ("asterisked") analysis program, you will be asked whether youwant to save the changes.
Options button
Opens the Options shortcut menu.
Next button
Moves on to the next step of the wizard.
Cancel button
Cancels the analysis program.
Options shortcut menu
Here you can create new analysis programs and rename, save or delete existing analysis pro‐grams.
New menu item
Creates a new analysis program. Enter a name for the analysis program.
Rename menu item
Enter a new name for the analysis program.
Save menu item
6.16.2
6.16.3
6.16.3.1
Tools (blue tools)
Image Analysis tool Manual
Carl Zeiss Microscopy GmbH 111

Saves a changed ("asterisked") analysis program under the current name.
Save As menu item
Saves the current analysis program under a new name. Enter a new name for the analysis pro‐gram.
Delete menu item
Deletes the current analysis program.
Step 2 - Classes
In this step you can define the classes into which the measured objects in the image are divi‐ded.
Back button
Moves back to the previous step of the wizard.
Classes list
The defined classes are listed here. If you create a new measurement program, a class is cre‐ated automatically. Each class consists of two entries. The first entry concerns all the objectsbelonging to the class. The second entry represents an individual object.
Add Class button
Adds a new class to the list.
Delete Class button
Deletes the selected class from the list.
Name input field
Here you can enter a name for the selected class in the Classes list.
Channel selection field
If you create a measurement program for a multichannel image, in this selection field you canselect a channel for the selected class in the Classes list.
Color button
Opens the Color Selection dialog window.Here you can select a color that you want to assign tothe selected class.
Next button
Moves on to the next step of the wizard.
Cancel button
Cancels the analysis program.
Step 3 - Measurement Frames
In this step you can define one or more measurement frames. These allow you to specify howobjects are dealt with at the edge of the image.
6.16.3.2
6.16.3.3
ManualTools (blue tools)
Image Analysis tool
112 Printed 06/2012

Back button
Moves back to the previous step of the wizard.
Interactive checkbox
Activated: The measurement frame definition can be changed interactively while the measure‐ment program is running.
Tool bar
Use this to select measurement frames that have already been drawn in. To select a measure‐ment frame, click inside it. To select several measurement frames, hold down the Ctrl key andclick inside the desired measurement frames. Once you have selected a measurement frame,you can change its size.
Use this to create a rectangle as a measurement frame in the current image.
Use this to create a circle as a measurement frame in the current image.
Use this to create a contour as a measurement frame in the current image.
button
Deletes all drawn-in measurement frames in the current image.
Mode dropdown list
Here you can select how you want the measurement frame to be applied. The following modesare available:
All objects are measured that are lying completely within the measurement frame, are touchingit or are intersected by it.
Only those objects are measured that are lying completely within the measurement frame. Ob‐jects that are touching the frame or are intersected by it are not measured.
All objects are measured that are lying completely within the measurement frame. Objects thatare intersected by the measurement frame are measured precisely up to the measurementframe.
Maximize Circle checkbox
Only active if you have defined precisely one circle.
Activated: Maximizes the drawn-in circle to the full image size and centers it. In the case of rec‐tangular images the circle is adjusted to the shorter side.
The following fields are only active if you have selected a drawn-in graphic element:
Left spin box/input field
Here you can enter the start point for the frame on the X axis in pixels.
Top spin box/input field
Here you can enter the start point for the frame on the Y axis in pixels.
Width spin box/input field
Here you can enter the width of the measurement frame in pixels.
Selection
Rectangle
Circle
Contour
In and On theFrame
Inside theFrame
Cut at Frame
Tools (blue tools)
Image Analysis tool Manual
Carl Zeiss Microscopy GmbH 113

Height spin box/input field
Here you can enter the height of the measurement frame in pixels.
Next button
Moves on to the next step of the wizard.
Cancel button
Cancels the analysis program.
Step 4 - Threshold Values
In this step you can enter the threshold values for the segmentation of the objects that you wantto measure.
Back button
Moves back to the previous step of the wizard.
Run checkbox
Activated: Sets the defined threshold values when the measurement program is run.
Interactive checkbox
Activated: The defined threshold values can be changed while the measurement program isrunning.
Classes list
Here you can select the class for which you want to define the threshold values.
Next button
Moves on to the next step of the wizard.
Cancel button
Cancels the analysis program.
Smooth section
Smoothing dropdown list
Here you can select how you want to smooth the image before the threshold values are set.The following methods are available:
The image is not smoothed.
Applies the Low Pass Method.
Applies the Gaussian Method.
Applies the Median Method.
6.16.3.4
None
Low Pass
Gaussian
Median
ManualTools (blue tools)
Image Analysis tool
114 Printed 06/2012

Size/Sigma slider
Enter the size of the filter matrix in the X and Y direction or the sigma value using the slider orspin box/input field.
Sharpen section
Image Sharpness dropdown list
Here you can select how you want to improve the sharpness of the image before the thresholdvalues are set. The following methods are available:
The sharpness of the image is not changed.
Applies the Edge Enhancement Method.
Applies the Unsharp Masking Method.
Threshold Value slider
Enter the threshold value for edge detection using the slider or spin box/input field. The thresh‐old value should correspond roughly to the gray value difference between objects and the back‐ground.
Size slider
Enter the size of the edge detection filter using the slider or spin box/input field. The valueshould correspond to the size of the transition area between objects and the background.
Strength slider
Enter the strength of the Unsharp Masking using the slider or spin box/input field. The higherthe value selected, the greater the extent to which small structures are enhanced.
Minimum Area section
Minimum Area slider
Using the slider or spin box/input field, enter the minimum area in pixels that an object musthave in order to be segmented.
Threshold section
Here you can define the threshold values for the selected class in the Classes list.
Reset button
Resets all threshold value settings.
Undo button
Undoes the last change made to the threshold values.
Redo button
Restores the last undone change to the threshold values.
None
Edge En‐hancement
UnsharpMasking
Tools (blue tools)
Image Analysis tool Manual
Carl Zeiss Microscopy GmbH 115

Color Model buttons
Only visible if the image is a color image.
In RGB Mode [➙ p.117] you can define the threshold values for the red, green and blue colorchannels.
In HLS Mode [➙ p.118] you can define the threshold values for hue, saturation and lightness.
Histogram
In the histogram you can change the lower and upper threshold value for the activated value.Drag the lower or upper adjustment handle or shift the entire highlighted area between the lowerand upper threshold value.
Threshold Value Definition button
Click in the image on the regions that you want to define as objects.
The threshold values are determined automatically.
The following parameters are only visible if Click has been selected for threshold value defini‐tion:
Click Behavior buttons
Click on this button to expand the currently segmented regions by the gray values/colors of theobjects subsequently clicked on.
Click on this button to reduce the currently segmented regions by the gray values/colors of theobjects subsequently clicked on.
Tolerance slider
Using the slider or spin box/input field, enter the tolerance range by which the gray/color valueread out when you click is expanded to define the threshold value.
Neighborhood slider
Using the slider or spin box/input field, enter a neighborhood range around the pixel clicked on.The threshold value is calculated from the average of the gray/color values in this neighborhoodrange.
The following parameter is only visible if Automatic has been selected for threshold value defini‐tion:
Method dropdown list
Select the method from the dropdown list that you want to use for the automatic calculation ofthe threshold values.
InformationAfter the automatic calculation of the threshold values you can further modify the threshold val‐ues found interactively by selecting Click for threshold value definition.
The following methods are available:
The threshold value is calculated according to the Otsu method.
RGB
HLS
Click
Automatic
+ button
- button
Otsu
ManualTools (blue tools)
Image Analysis tool
116 Printed 06/2012
The threshold value is the gray/color value that occurs most frequently in the image.
The threshold value lies in the middle between two maximums in the histogram.
The threshold value is calculated from the sum of the average and three times the sigma valueof the histogram distribution.
RGB mode
Red Color Channel threshold values
Red button
Click on the red button to activate the red channel in the Expander histogram.
Lower (Red Channel) input field
Enter the lower threshold value for the red channel using the spin box/input field.
Upper (Red Channel) input field
Enter the upper threshold value for the red channel using the spin box/input field.
Invert (Red Channel) button
Click on the Invert button to swap the Lower and Upper values for the red channel.
All (Red Channel) button
Click on the All button to set the Lower value to 0 and the Upper value to the maximum possiblegray value for the red channel.
Green Color Channel threshold values
Green button
Click on the green button to activate the green channel in the Expander histogram.
Lower (Green Channel) input field
Enter the lower threshold value for the green channel using the spin box/input field.
Upper (Green Channel) input field
Enter the upper threshold value for the green channel using the spin box/input field.
Invert (Green Channel) button
Click on the Invert button to swap the Lower and Upper values for the green channel.
Most Fre‐quent Gray
ValueIso Data
TriangularThreshold
Value3 Sigma
ThresholdValue
Tools (blue tools)
Image Analysis tool Manual
Carl Zeiss Microscopy GmbH 117

All (Green Channel) button
Click on the All button to set the Lower value to 0 and the Upper value to the maximum possiblegray value for the green channel.
Blue Color Channel threshold values
Blue button
Click on the blue button to activate the blue channel in the Expander histogram.
Lower (Blue Channel) input field
Enter the lower threshold value for the blue channel using the spin box/input field.
Upper (Blue Channel) input field
Enter the upper threshold value for the blue channel using the spin box/input field.
Invert (Blue Channel) button
Click on the Invert button to swap the Lower and Upper values for the blue channel.
All (Blue Channel) button
Click on the All button to set the Lower value to 0 and the Upper value to the maximum possiblegray value for the blue channel.
HLS mode
Hue threshold values
H button
Click on the button to activate the hue in the Expander histogram.
Lower (Hue) input field
Enter the lower threshold value for the hue using the spin box/input field.
Upper (Hue) input field
Enter the upper threshold value for the hue using the spin box/input field.
Invert (Hue) button
Click on the Invert button to swap the Lower and Upper values for the hue.
All (Hue) button
Click on the All button to set the Lower value to 0 and the Upper value to the maximum possiblevalue for the hue.
ManualTools (blue tools)
Image Analysis tool
118 Printed 06/2012

Lightness threshold values
L button
Click on the button to activate the lightness in the Expander histogram.
Lower (Lightness) input field
Enter the lower threshold value for the lightness using the spin box/input field.
Upper (Lightness) input field
Enter the upper threshold value for the lightness using the spin box/input field.
Invert (Lightness) button
Click on the Invert button to swap the Lower and Upper values for the lightness.
All (Lightness) button
Click on the All button to set the Lower value to 0 and the Upper value to the maximum possiblevalue for the lightness.
Saturation threshold values
S button
Click on the button to activate the saturation in the Expander histogram.
Lower (Saturation) input field
Enter the lower threshold value for the saturation using the spin box/input field.
Upper (Saturation) input field
Enter the upper threshold value for the saturation using the spin box/input field.
Invert (Saturation) button
Click on the Invert button to swap the Lower and Upper values for the saturation.
All (Saturation) button
Click on the All button to set the Lower value to 0 and the Upper value to the maximum possiblevalue for the saturation.
Fill section
Fill Holes checkbox
Activated: Fills holes in segmented objects.
Tools (blue tools)
Image Analysis tool Manual
Carl Zeiss Microscopy GmbH 119
Separate section
Separate dropdown list
Here you can select whether you want to process the image further after segmentation. Objectsthat are touching one another can be separated using different methods.
Objects are not separated.
Using this method you can separate objects that are roughly the same shape. This method mayhowever result in the splitting of elongated objects.
This method separates objects by first reducing and then enlarging them, making sure that onceobjects have been separated they do not merge together again.
Number slider
Using the slider or spin box/input field, enter how often the method is applied successively tothe result at the location of the separation.
Step 5 - Condition
In this step you can define the conditions under which you want an object to be measured.
Back button
Moves back to the previous step of the wizard.
Run checkbox
Activated: Uses the measurement conditions when the measurement program is run.
Interactive checkbox
Activated: The measurement conditions can be changed while the measurement program isrunning.
Classes list
Here you can select the class for which you want to define the conditions.
Select button
Opens the Conditions Editor [➙ p.121] dialog window.
Conditions list
If you have defined one or more blocks with conditions in the Conditions Editor dialog window,here you can select the block for which you want to set the condition. To do this, click on therelevant block and then on the objects in the image that you want to measure.
Undo button
Undoes the last change made to the condition.
Redo button
Restores the last undone change to the condition.
None
Watersheds
Morphology
6.16.3.5
ManualTools (blue tools)
Image Analysis tool
120 Printed 06/2012

Reset button
Resets all settings for the conditions.
Next button
Moves on to the next step of the wizard.
Cancel button
Cancels the analysis program.
Conditions Editor dialog window
Here you can add features to a block with measurement conditions.
Search for Feature input field
Here you can enter parts of the name of the feature that you are looking for. The features inwhich the entered character string occurs are listed.
Features dropdown list
From the dropdown list, select a type of feature according to which you want the features to befiltered.
The following feature types are available for selection:
If this is selected all features are listed.
If this is selected all geometric features are listed.
If this is selected all features that analyze intensity values are listed.
If this is selected all features that contain meta information about the measured image are lis‐ted.
If this is selected all features that describe the position are listed.
+ button
Click on the button to select a feature for the measurement.
Selected Features for the Condition list
In this list, the features that you have selected for the condition are displayed block by block. Allfeatures in a block are "And"-linked for the condition, i.e. an object is only measured if the val‐ues of each individual feature fall within the defined range.
Add button
Adds an "Or" block. If several "Or" blocks have been defined, an object is measured if it meetsthe condition in at least one block.
Empty button
Deletes all features in an "Or" block.
All
GeometricFeatures
Intensity Fea‐tures
Image Fea‐tures
Position Fea‐tures/Un‐
scaled Posi‐tion Features
Tools (blue tools)
Image Analysis tool Manual
Carl Zeiss Microscopy GmbH 121

Remove button
Deletes the selected "Or" block.
Remove All button
Deletes all "Or" blocks.
Step 6 - Interactive Segmentation
In this step you can postprocess the segmented objects interactively.
Back button
Moves back to the previous step of the wizard.
Interactive checkbox
Activated: The segmented objects can be postprocessed interactively while the measurementprogram is running.
Classes list
Here you can select the class whose objects you want to process.
Remove button
Using this button you can remove parts of an object. Holding down the left mouse button, out‐line the parts of the object that you want to remove. Right-click to remove these parts of the ob‐ject.
Separate button
Use this button to separate connected objects. Holding down the left mouse button, draw in theseparation line between the objects. Right-click to separate the objects.
Connect button
Use this button to connect objects. Holding down the left mouse button, outline the parts of theobject that you want to connect. Right-click to connect the objects.
Delete button
Click on the Delete button to delete an object by subsequently clicking on it.
Tool bar
Switches the mouse pointer to Selection mode.
Rectangle
Use this button to add a rectangular object or cut a rectangular region from an object.
Circle
Use this button to add a circular object or cut a circular region from an object.
6.16.3.6
Selection
ManualTools (blue tools)
Image Analysis tool
122 Printed 06/2012

Draw Contour
Use this button to add an object or cut a region from an object.
Contour (Spline)
Use this button to add an object or cut a region from an object.
Active Contour
Use this button to add an object or cut a region from an object.
Delete
Deletes all objects.
Keep checkbox
Activated: The selected graphic element remains selected until you deselect it.
Fill Hole button
Fills a hole. To fill a hole, left-click on the hole.
Region Growth button
Activates the Region Growth mode. Then click on objects in the image that you want to seg‐ment. The object "grows" around the point that has been clicked on.
Intensity slider
Enter a tolerance value for the intensity using the slider or spin box/input field. The tolerancevalue specifies how much the intensity of a pixel may deviate from the average intensity of theobject in order to still "grow" to become part of the object.
Color slider
Only active if your input image is a color image.
Enter a tolerance value for the color using the slider or spin box/input field. The tolerance valuespecifies how much the color value of a pixel may deviate from the average color value of theobject in order to still "grow" to become part of the object.
Undo button
Undoes the last action.
Redo button
Restores the last undone action.
Next button
Moves on to the next step of the wizard.
Cancel button
Cancels the analysis program.
Tools (blue tools)
Image Analysis tool Manual
Carl Zeiss Microscopy GmbH 123

Step 7 - Measurement Features
In this step you can select the measurement features that you want to measure.
Back button
Moves back to the previous step of the wizard.
Classes list
Here you can select the class for which you want to define measurement features. For eachclass there are two entries for which you can define features. The first entry concerns all theobjects belonging to the class. The second entry represents an individual object.
Field Features section
Only visible if a "parent" class is active.
The list shows all Field Features that are measured for the current class.
Object Features section
Only visible if a "child" class is active.
The list shows all Object Features that are measured for the current class.
Annotations section
Only visible if a "child" class is active.
The list shows all annotations that are drawn in for the current class.
Select button
Opens the Feature Selection [➙ p.124] dialog window for the current class.
Copy button
Copies the selected features of the current class to all other classes.
Next button
Moves on to the next step of the wizard.
Cancel button
Cancels the analysis program.
Feature Selection dialog window
Here you can specify which features you want to measure.
Selected Features section
The features that you have selected are listed in this section.
Wastepaper Bin button
Click on the button to delete the selected feature.
6.16.3.7
ManualTools (blue tools)
Image Analysis tool
124 Printed 06/2012

Upwards button
Click on the button to move the selected feature a position higher.
Downwards button
Click on the button to move the selected feature a position lower.
Search for Feature input field
Here you can enter parts of the name of the feature that you are looking for. The features inwhich the entered character string occurs are listed.
Features dropdown list
From the dropdown list, select a type of feature according to which you want the features to befiltered.
The following feature types are available for selection:
If this is selected all features are listed.
If this is selected all geometric features are listed.
If this is selected all features that analyze intensity values are listed.
If this is selected all features that contain meta information about the measured image are lis‐ted.
If this is selected all features that describe the position are listed.
+ button
Click on the button to select a feature for the measurement.
OK button
Click on the OK button to end the feature selection.
Cancel button
Click on the Cancel button to cancel the feature selection.
Step 8 - Measure
In this step you will see the result of the measurement. The measured image is displayed in theAnalysis View [➙ p.174].
Back button
Moves back to the previous step of the wizard.
Classes list
Here you can select the class for which you want to see the measured features. For each classthere are two entries: The "parent" class, which shows the features for all objects together, andthe "child" class, which shows the features for each individual object.
All
GeometricFeatures
Intensity Fea‐tures
Image Fea‐tures
Position Fea‐tures/Un‐
scaled Posi‐tion Features
6.16.3.8
Tools (blue tools)
Image Analysis tool Manual
Carl Zeiss Microscopy GmbH 125

End button
Saves the analysis program created and ends the wizard.
Cancel button
Cancels the analysis program.
Report toolIn the Report tool you can select various templates for your report. In addition you can see im‐portant information about your report.
Select Template dropdown list
Here you can select the desired template for the report that is to be created.
InformationIf the Report Preview is active, you can change the template for the report here. You will seethe change directly in the Report Preview.
Description
Displays a description of the report template.
Created By
Displays who created the report template.
Created On
Displays when the report template was created.
button
Opens the Options [➙ p.127] shortcut menu.
See also
2 Reporting tab [➙ p.63]
2 Report preview [➙ p.203]
Report Management section
To show the section in full, click on the button.
Name input field
Only active in the Report Preview.
Here you can enter a name for the report. This is no longer possible for a report that has al‐ready been created.
If you have already created a report, here you will see a display field showing the name of thereport.
6.17
6.17.1
ManualTools (blue tools)
Report tool
126 Printed 06/2012

InformationIf you do not give the report its own name in the Report Management section, it will be alloca‐ted a name by default. You can change this default setting in the Extras menu | Options |Name.
Description input field
Only active in the Report Preview.
Here you can enter a description for the report. This is no longer possible for a report that hasalready been created.
Created By display field
Displays who created the report.
InformationThe user data are automatically adopted from the Extras menu | Options | User.
Created On display field
Displays the date on which the report was created.
Options
In the Options shortcut menu you can open or save reports and import or export report tem‐plates.
Open menu item
Opens an existing report.
Save menu item
Saves the current report. The name is adopted from the Report Management section | Name.
Save As menu item
Saves the report under a new name. Enter a new name for the report.
Import Template menu item
Imports an existing report template to ZEN. The template is then shown in the Select Templatedropdown list.
Export Template menu item
Exports the current report template to back it up or share it with other users.
See also
2 Report Management section [➙ p.126]
6.17.2
Tools (blue tools)
Report tool Manual
Carl Zeiss Microscopy GmbH 127

Image views
2D ViewThis view is the default view for images in ZEN (blue edition). For this view the General ViewControls [➙ p.176] are available to you. To open the view's context menu [➙ p.130], right-clickin the Center Screen Area [➙ p.26].
InformationFor a better overview and to navigate through enlarged images open the 2D Navigator window[➙ p.128]. Therefore simply click on Navigator entry in the 2D view context menu.
See also
2 General view controls [➙ p.176]
Navigator window
Fig. 26: Navigator window 2D View
Here you see a preview of the current image and the enlarged image area (blue frame). Withthe blue frame you’re able to navigate through your enlarged image.
InformationIf you are viewing a multidimensional image, you can use the Navigator to navigate throughthe available dimensions. These are represented by thin lines before or after the preview im‐age. To navigate through the dimensions, left-click on the thin lines or use the mouse wheel.
In the case of time lapse images the time points present are displayed to the left and right ofthe preview image. To navigate through the time lapse images, click on the areas to the left orright of the preview image.
Enlarging the image area
➢ You have activated the Navigator button on the Dimensions tab. The button is highlightedin blue.
➢ You can see the Navigator window in the image area.
1. Move the mouse pointer over the blue frame in the Navigator window.
7
7.1
7.1.1
7.1.1.1
ManualImage views
2D View
128 Printed 06/2012

⇨ The mouse pointer will appear as a double-headed arrow.
2. Hold down the left mouse button and move the mouse.
⇨ The size of the frame changes and the image area is enlarged.
Moving the region of interest
➢ You have enlarged the image area.
➢ You have activated the Navigator button on the Dimensions tab. The button is highlightedin blue.
➢ In the Navigator window you can see the full image and the region of interest. The region ofinterest is indicated by a blue frame.
1. To move the region of interest, move the mouse pointer inside the blue frame.
⇨ The mouse pointer will appear as a four-headed arrow.
2. Hold down the left mouse button and move the mouse.
⇨ The region of interest moves.
3. Release the left mouse button again.
⇨ You have moved the region of interest with the help of the Navigator. Alternatively, it is alsopossible to move the region of interest using the Move tool on the Dimensions tab.
Enlarging the Navigator window
➢ The Navigator window is open in the image area.
1. Move the mouse pointer to the adjustment handle in the bottom right corner of the Naviga‐tor window.
⇨ The mouse pointer will appear as a double-headed arrow.
2. Hold down the left mouse button and move the mouse.
⇨ The size of the Navigator window changes.
Moving the Navigator window
➢ The Navigator window is open.
➢ The image area has been enlarged.
1. Move the mouse pointer inside the blue frame.
⇨ The mouse pointer will appear as a four-headed arrow.
2. Hold down the left mouse button and move the mouse.
⇨ You can position the Navigator window freely within the image.
7.1.1.2
7.1.1.3
7.1.1.4
Image views
2D View Manual
Carl Zeiss Microscopy GmbH 129

2D View context menu
Menu entry Function
Full Screen (F11) Switches to full screen mode. To exit full-screen mode, press F11 again or ESC.
Zoom Group Here you have access to the main zoom func‐tions (Dimensions tab | Zoom section [➙ p.177]).
Rulers Shows rulers at the top and left edge of theimage.
Navigator Shows the 2D view Navigator window.
Spot Measurement / Focus ROI This function is only active in the live image orduring Continuous mode.
Shows a region in which the exposure time ismeasured and the software autofocus is fo‐cused.
Graphics This function is activated by default.
Shows graphic elements that have beendrawn into the image, e.g. annotations orscale bars.
Show Bleach ROI This function is only visible with FRAP im‐ages.
Shows graphic elements that were used dur‐ing acquisition for bleaching (FRAP).
Copy Display Settings Copies the display settings from an image(Display tab [➙ p.181]).
Paste Display Settings Inserts copied display settings into an image(Display tab [➙ p.181]).
ROI | Draw ROI Draw a certain region that particularly inter‐ests you into the image. You can draw severalregions into an image.
ROI | Create Subset Images From ROI Creates new image documents from the se‐lection regions you have drawn in. All dimen‐sions of the image are taken into accounthere.
Paste Inserts a graphic element into the current im‐age from the clipboard.
7.1.2
ManualImage views
2D View
130 Printed 06/2012

Gallery ViewIn the Gallery View you see an overview of your multidimensional images. The individual im‐ages of the images concerned are presented in a gallery. It is possible to show any combinationof dimensions, e.g. channels against time. When you view images for the first time in the Gal‐lery View, they are displayed as follows:
Image type Dispalyed as
Multichannel image All the channels present in an image are shown,including the mixed color image.
Time lapse image All the time points present in an image areshown.
Z-stack image All Z-planes are shown.
Multichannel & time lapse image All the time points present in an image areshown. All channels are shown as a mixed colorimage.
Multichannel & Z-stack image All Z-planes are shown. All channels are shownas a mixed color image.
Time lapse & Z-stack image All Z-planes are shown.
Time lapse, Z-stack & multichannel image All Z-planes are shown. All channels are shownas a mixed color image.
See also
2 General view controls [➙ p.176]
View specific controls
Gallery Tools tab
Here you can specify which dimension you want to be displayed on which axis of the Galleryview. To do this, click on the corresponding button on the tool bar.
Display Image Dimensions section
Each of the buttons is only visible if the current image contains the corresponding dimension.
Shows the channels present as individual images.
Shows the Z-planes present as individual images.
Shows the time points present as individual images.
Shows the channels present in relation to the Z-stack images present.
7.2
7.2.1
7.2.1.1
Channels
Z-Stack
Time Series
Chann.&Z(Channels
and Z-Stack)button
Image viewsGallery View Manual
Carl Zeiss Microscopy GmbH 131

Shows the channels present in relation to the time lapse images present.
Shows the Z-stack images present in relation to the time lapse images present.
Only visible if the Show All mode is activated.
Use the buttons to select which dimension is shown on the X axis.
Only visible if the Show All mode is activated.
Use the buttons to select which dimension is shown on the Y axis.
Show Dimension Labels checkbox
Activated: Inserts annotations into each individual image that provide information on the timepoint or Z-plane.
Invert X / Y Axis checkbox
This checkbox is only available if the Show All mode is not activated.
Only active if two dimensions are shown in relation to each other (Chann.&Z, Chann.&Time,Z&Time).
Activated: Inverts the X and Y axis of the Gallery view.
Show Merged checkbox
Only visible for multichannel images. Only active if the channels present are shown.
Activated: Shows the mixed image of all channels in addition to the individual images.
The following functions are only visible if the Show All mode is activated:
Create image from section
Here you can create images from the Gallery view. Select the type of image that you want tocreate from the dropdown list.
Creates an image of the current Gallery view.
Creates an image from the images that have been selected in the current view.
The resulting image contains all the information of the input image; the pixel data are notchanged.
Creates an image from a defined selection range.
If this entry is selected, sliders for the selected dimensions appear (Start, End and Interval). Usethe sliders to set the selection range you want.
Create button
Creates an image from the Gallery view.
Gallery image from section
Select a dimension that is not currently displayed from the dropdown list. This dimension is tak‐en into account when the image is created.
The resulting image is always a 24 bit RGB color image. The pixel data of the original image arechanged.
Chann.&Time(Channelsand Time
Series) buttonZ&Time (Z-
Stack andTime Series)
buttonX Axis sec‐
tion
Y Axis sec‐tion
Gallery View
SelectionSubset
Range Sub‐set
ManualImage viewsGallery View
132 Printed 06/2012

Burn in graphics checkbox
Burns the annotations present into the image that is created.
Gallery Appearance tab
Only visible if the Show All mode is activated.
Dimension Labels section
Here you can define the font and the style, color, position and size of the text for the dimensiondetails that are shown.
Layout section
Here you can set the background color of the Gallery view and the distance between the individ‐ual images (from 1-10 pixels).
2,5D ViewIn the 2.5D view intensity values in a two-dimensional image are converted into a height map.Here the highest intensity values are represented by the greatest extension in the Z-direction.Overall this results in a so-called 2.5D or pseudo-3D image.
InformationIf you are viewing a multichannel image, you can have the intensity values of the individualchannels displayed. To do this, activate or deactivate the desired channels on the Dimensionstab.
See also
2 General view controls [➙ p.176]
2.5D View tool bars
The tool bars are arranged to the left of and underneath the image area. You can use the toolsto control the display of the 2.5D volumes in the image area.
Left tool bar
Top thumb wheel
Enlarges or reduces the image area.
Tool bar
Use this to rotate the 2.5D volume in any way you wish within the space. This is the defaultmode when you switch to 2.5D view for the first time.
Use this to increase the zoom factor of the image area.
Use this to move the 2.5D volume laterally.
Bottom thumb wheel
Rotates the 2.5D volume around the horizontal (X) axis.
7.2.1.2
7.3
7.3.1
7.3.1.1
Rotate
Zoom
Move
Image viewsGallery View Manual
Carl Zeiss Microscopy GmbH 133

Bottom tool bar
Left thumb wheel
Use this to rotate the 2.5D volume around the vertical (Y) axis.
Tool bar
Use this to show or hide a bounding box around the 2.5D volume.
Use this to show or hide the X/Y axis.
Show Z Axis
Use this to show or hide the Z axis.
Use this to switch back to the start view. A top view of the 2.5D volume is displayed. Lateralmovements and the zoom factor are adjusted so that the 2.5D volume can be seen at the centerof the image area.
Right thumb wheel
Use this to compress the 2.5D volume on the (Z) axis perpendicular to the screen plane.
View specific controls
2.5D Display tab
On the 2.5D Display tab you have 4 options for displaying your 2.5D image.
Profiles display
Displays the relief divided into a number of profiles with an equal distance.
Set the number of profiles using the Fineness slider.
Grid display
Displays the relief overlaid with a grid. This view supports gray levels only.
Make the grid more closely or more coarsely meshed using the Fineness slider.
Blocks display
Displays the relief by means of discrete, upwardly protruding columns of differing heights.
Surface display
Displays the relief as a continuous, flowing landscape.
Make the surface coarser or finer using the Fineness slider.
Invert Z checkbox
Activated: Displays the lowest intensity values by means of the greatest extension in the Z di‐rection.
7.3.1.2
Bounding Box
Show X/Y Ax‐is
Start View
7.3.2
7.3.2.1
ManualImage views2,5D View
134 Printed 06/2012
Use this function for images that contain many large, bright regions.
Apply Palette checkbox
Activated: Overlays the relief with the pseudo colors that have been set on the Dimensions tab.
Show Sides checkbox
Only available in the Surface display.
Activated: Closes the sides of the relief.
Show Planes checkbox
Activated: Shows two blue, transparent planes in the 2.5D volume.
Set the position of the planes using the X/Y sliders.
Extract Image section
To save an individual image in the current view, click on the Save As button.
Series tab
On the Series tab you can create a series of images in the 2.5D view. These series can beplayed back later as a video clip, for example.
Render Series dropdown list
Here you can select the desired series mode:
Here you can define the start/stop angle and the rotation direction around the X axis.
Here you can define the start/stop angle and the rotation direction around the Z axis.
Here you can define the angle and zoom settings for the start and end position of your series.The intermediate positions are interpolated evenly.
Here you can define any number of positions. The positions can each have completely differentrotation, zoom and illumination settings.
Here you can define the start time point and end time point for a series. All other settings (rota‐tion, zoom, etc.) remain unchanged.
Apply button
Creates a series image with the current settings.
Preview section
To obtain a preview of the series, click on the Play button. To end the preview, click on the Stopbutton.
Number of Images section
Select the number of individual images in the series from the dropdown list.
7.3.2.2
RotateAround X
RotateAround Z
Start/Stop
Position List
Over Time
Image views2,5D View Manual
Carl Zeiss Microscopy GmbH 135

2.5D Display Options tab
Only visible if the Show All mode is activated.
Shape and Position section
Enter the rotation angle in the X direction with a precision of 1 degree using the slider or spinbox/input field.
Enter the rotation angle in the Y direction with a precision of 1 degree using the slider or spinbox/input field.
Enter the Z scaling using the slider or spin box/input field.
Lighting Parameters section
Reduces or increases the intensity of the ambient lighting in the 2.5D view.
Reduces or increases the proportion of the ambient light reflected on the relief.
Reduces or increases the effect of the ambient light shining on the relief.
Reduces or increases the intensity of the lighting in the 2.5D view. A small distance means acircular light source at the center, while a large distance illuminates the scene evenly.
Reset button
Resets all settings to the default values.
Histo View The Histo (Histogram) view shows you the gray value histogram of your image. In the right im‐age area you can see your current image and in the left image area you can see the Histogramwindow. At the side you will also find four data tables:
▪ In the first table from the left you will find all the raw data for each channel.
▪ In the second table from the left you will find all the limits for each channel of the image nextto the image name.
▪ In the third table from the left you will find the statistical values for the gray value distribution,e.g. average, standard deviation, minimum and maximum value.
▪ The fourth table shows the measured values of measurements in the histogram.
See also
2 General view controls [➙ p.176]
View specific controls
Histo Definition tab
Tool bar
Using the tools you can add certain measurement regions to your image. The histogram windowshows you the gray value histogram for the relevant region.
7.3.2.3
Angle X
Angle Y
Z Scaling
Ambient
Reflection
Shine
Light Intensity
7.4
7.4.1
7.4.1.1
ManualImage views2,5D View
136 Printed 06/2012

Changes the mouse pointer to Selection mode. You can use this to select graphic elements inthe image.
Use this to copy the last selected element and insert it at another position in the image.
Use this to insert a rectangular measurement region.
Use this to insert a circular measurement region.
Use this to insert a measurement region with a shape of your choice. The line is closed auto‐matically.
Use this to insert a polygonal measurement region in the original image.
Keep checkbox
Activated: Keeps the last selected tool active.
Color checkbox
Only visible if the Show All mode is activated.
Activated: Highlights each drawn-in measurement region with a random color.
Histogram Measurements section
Switches the Profile window back to the view display.
Use this to perform a measurement of a region in the X direction in the relevant histogram. Toadopt the value into the measurement data table, click on the Insert Values button.
Reset button
Empties the measurement data table below the original image.
Insert Values button
Adds the current measurement in the histogram window to the measurement data table belowthe original image.
Histo. Table section
Only visible if the Show All mode is activated.
Select the type of gray value distribution from the dropdown list. The following types are availa‐ble:
▪ Frequency distribution
▪ Sum above
▪ Sum below
Relative Frequency checkbox
Only visible if the Show All mode is activated.
Activated: Displays the histogram according to the relative frequency of the gray values in per‐cent.
Using the relevant sliders, you can enter the precise number of classes, class size and upper/lower threshold value.
Selection
Copy
Rectangle
Circle
Freehand
Polygon
Normal but‐ton
X Measure‐ment button
Image viewsHisto View Manual
Carl Zeiss Microscopy GmbH 137

Class Number slider
Enter the number of classes using the slider or spin box/input field.
Class Size slider
Only visible if the Show All mode is activated.
Enter the class size using the slider or spin box/input field.
Log. Scale checkbox
Only visible if the Show All mode is activated.
Activated: Switches from the linear to a logarithmic class width. The class size is calculated au‐tomatically.
Lower Threshold Value slider
Enter the lower threshold value for the gray value distribution using the slider or spin box/inputfield. All regions in the image with gray values below the lower threshold value are overlaid inblue and all those with gray values above the upper threshold value are overlaid in red.
Without Black checkbox
Activated: Automatically subtracts the lowest value of the gray distribution. The settings for thelower threshold value are deactivated.
Upper Threshold Value slider
Enter the upper threshold value for the gray value distribution using the slider or spin box/inputfield. All regions in the image with gray values below the lower threshold value are overlaid inblue and all those with gray values above the upper threshold value are overlaid in red.
Without Black checkbox
Activated: Automatically subtracts the highest value of the gray distribution. The settings for theupper threshold value are deactivated.
Show Threshold Values checkbox
Only visible if the Show All mode is activated.
Activated: Shows the threshold values as colored overlays in the original image.
Histo View tab
Here you can configure the display for the Histo view.
Show section
Statistical Values checkbox
Activated: Shows the table containing the statistical values in the image area.
Measurement Data Table checkbox
Activated: Shows the measurement data table below the original image.
Frequency Distribution checkbox
Only visible if the Show All mode is activated.
7.4.1.2
ManualImage viewsHisto View
138 Printed 06/2012

Activated: Shows the table containing the raw data for each channel.
Image checkbox
Only visible if the Show All mode is activated.
Activated: Shows the original image in the image area.
Channel section
Here you can activate or deactivate the histograms for each channel.
X/Y Axis section
Only visible if the Show All mode is activated.
Here you can determine the limits for the X axis and Y axis.
Sets the limits for the axes automatically.
Normalizes the histogram display to the maximum values of the distribution.
Enter the min/max values for the histogram display in the Min/Max spin boxes/input fields.
Data Table section
Click on the Create button to create a data table from all the measured values displayed. Tosave the table, click on the Save As button.
New Image From section
Here you can create a new image document. Select the type of image from the dropdown list.To save the image, click on the Save As button.
Profile ViewIn the Profile view you can create intensity profiles of certain regions in your image. In the rightimage area you can see your image. In the left image area you can see the Profile window. Theraw data for each channel are displayed in the Profile table below the Profile window. Themeasured values of measurements in the profile are shown in the measurement data table be‐low the original image.
InformationTo create an intensity profile of a certain region, select a tool on the Profile Definition tab. Usethis to highlight a region in your image. An intensity profile of the region is generated automati‐cally and displayed in the Profile window. To enlarge the view in the Profile window, drag out arectangular frame using the left mouse button in the Profile window. The selected region is dis‐played in enlarged form. Right-click to return to the original view.
See also
2 General view controls [➙ p.176]
Auto button
Norm button
Fixed button
7.5
Image viewsProfile View Manual
Carl Zeiss Microscopy GmbH 139

View specific controls
Profile Definition tab
Tool bar
Using the tools you can add certain measurement lines to your image. The intensity profile ofeach line is shown in the Profile window.
Changes the mouse pointer to Selection mode. You can use this to select graphic elements inthe image.
Use this to copy the last selected element and insert it at another position in the image.
Use this to insert a measurement line in the original image. The measurement is shown in theProfile window in the direction of the arrow.
Use this to insert a polygonal measurement line in the original image.
Use this to insert a measurement line with a shape of your choice.
Use this to insert a rectangular measurement region.
Keep checkbox
Activated: Keeps the last selected tool active.
Color checkbox
Only visible if the Show All mode is activated.
Activated: Highlights each drawn-in measurement line with a random color.
Line Width spin box/input field
Only visible if the Show All mode is activated.
Here you can enter the line width of the measurement line.
Display Profile in Image checkbox
Activated: Also displays the profile of a measurement line in the original image.
Profile Measurements section
Switches the Profile window back to the view display.
Use this to perform a point measurement in the profile. To adopt the value into the measure‐ment data table, click on the Insert Values button.
Use this to perform a measurement of a region in the X direction in the profile. . To adopt thevalue into the measurement data table, click on the Insert Values button.
Use this to perform a measurement of a region in the Y direction in the relevant profile. To adoptthe value into the measurement data table, click on the Insert Values button.
Empty Table button
Empties the measurement data table below the original image.
7.5.1
7.5.1.1
Selection
Copy
Arrow
Polygon
Freehand
Rectangle
Normal but‐ton
Measurementbutton
X Measure‐ment button
Y Measure‐ment button
ManualImage viewsProfile View
140 Printed 06/2012

Insert Values button
Adds the current measurement in the Profile window to the measurement data table below theoriginal image.
Grid Distance section
Only visible if the Show All mode is activated.
Enter the grid distance of the measurement line using the slider or spin box/input field.
Profile View tab
Here you can configure the display for the Profile view.
Show section
Profile Table checkbox
Activated: Shows the profile table.
Measurement Data Table checkbox
Activated: Shows the measurement data table below the original image.
Image checkbox
Only visible if the Show All mode is activated.
Activated: Shows the original image in the image area.
Channel section
Here you can activate or deactivate the profiles for each channel.
X/Y Axis section
Only visible if the Show All mode is activated.
Here you can determine the limits for the X axis and Y axis.
Sets the limits for the axes automatically.
Normalizes the profile display to the maximum values of the distribution.
Enter the min/max values for the profile display in the Min/Max spin boxes/input fields.
Data Table section
Click on the Create button to create a data table from all the measured values displayed. Tosave the table, click on the Save As button.
New Image From section
Here you can create a new image document. Select the type of image from the dropdown list.To save the image, click on the Save As button.
Measure ViewIn this view measured values from images are displayed in a table. The table is only visible ifthere are annotations/measured values in the image. To highlight the row of the table containingthe measured values of a graphic element, click on a graphic element in the image. To highlighta graphic element in the image, click on the measured value in the row of the table.
7.5.1.2
Auto button
Norm button
Fixed button
7.6
Image viewsProfile View Manual
Carl Zeiss Microscopy GmbH 141

See also
2 General view controls [➙ p.176]
View specific controls
Measure tab
Here you can specify how to draw the graphic elements for measurements into an image andhow the measurement data are displayed. You can also add user-specific features to individualgraphic elements.
Graphic Elements section
Only visible if the current image is a multidimensional image.
Here you can decide, for multidimensional images, whether to draw a graphic element "globally"into all channels, Z-positions, time points, etc., or whether to draw in separate elements for theview currently displayed.
Channel checkbox
Activated: Activates the Single Channel mode. Only draws graphic elements into the channelcurrently displayed.
Time checkbox
Activated: Only draws graphic elements into the time point currently displayed.
Z-Position checkbox
Activated: Only draws graphic elements into the Z-position currently displayed.
Copy in All Following checkbox
Activated: Draws a new graphic element into the view currently displayed and into all subse‐quent time points or Z-positions.
New Feature section
Here you can add a defined feature to the selected graphic element.
Name input field
Here you can enter the name you want to give the feature.
Value input field
Here you can enter the value that you want the feature to have for the current graphic element.
Unit input field
Here you can enter the unit you want for the feature.
Add button
Adds the feature. The measurement data table is expanded to include this feature.
7.6.1
7.6.1.1
ManualImage views
Measure View
142 Printed 06/2012

Remove button
Removes the selected feature.
Measurement Data section
Here you can specify how you want the measured values for the drawn-in graphic elements tobe displayed.
Table button
Displays the measured values in a row of a table. As you can specify the features individuallyfor each graphic element, the number of columns containing measured values may differ fromgraphic element to graphic element (i.e. from row to row).
List button
Displays each measured value in a separate row. The measurement data table then has the fol‐lowing defined columns:
Name of the graphic element (e.g. line)
Name of the feature (e.g. distance)
Value of the feature
Unit of the feature (e.g. µm)
Current View button
Only displays the measured values of the current view.
All Views button
Displays all measured values contained in the image.
Create Measurement Data Table button
Creates a measurement data table from the measured values displayed. The table may besaved as a separate document.
Info ViewThe Info View allows you to display extensive information about your image. Using the buttons in each of the sections you can show additional fields in the sections or hide fields thatare currently showing. To show or hide individual sections, click on the button to the left of theheadings for each of the sections.
InformationThe Info View only shows the fields that actually contain data. Using the buttons in each ofthe sections you can show additional fields. To do this, activate the corresponding checkboxesin the shortcut menu.
Name
Feature
Value
Unit
7.7
Image views
Measure View Manual
Carl Zeiss Microscopy GmbH 143

General section
Title input field
Here you can enter a title for your image.
Description input field
Here you can enter a description for your image.
Comment input field
Here you can enter a comment.
Keywords input field
Here you can enter keywords for your image.
Rating input field
Here you can enter a rating for your image. To enter a rating, click on the star icons.
File section
Name display field
Displays the file name of the image without file extension.
File Type display field
Displays the file type of the image.
File Path display field
Displays the location where the image is saved in your file system.
File Size display field
Displays the file size of the image.
Created display field
Displays when the image was created.
Last Modified display field
Displays when the image was last changed.
User display field
Displays the name of the user. You can enter the user name in the Extras menu | Options | UserManagement [➙ p.45].
7.7.1
7.7.2
ManualImage views
Info View
144 Printed 06/2012

Image Dimensions section
Time Series
Displays how many time points the image contains. The value in brackets shows the full dura‐tion of acquisition.
Z-Stack
Displays how many Z-planes the image contains. The value in brackets shows the full size ofthe Z-stack.
Channels
Displays how many channels the image contains.
Tiles
Displays how many individual images (tiles) the image is composed of.
Scaling (per Pixel)
Displays the scaling per pixel.
Edit button
Opens the Edit Scaling [➙ p.148] dialog window.
Image Size (Pixels)
Displays the image size in pixels. The first number indicates the horizontal dimension and thesecond the vertical dimension.
Image Size (Scaled)
Displays the scaled image size. The first number indicates the horizontal dimension and thesecond the vertical dimension.
Image Format
Displays the bit depth. This depends on the camera settings.
Stage Position
Displays the stage position. Within the image this is the center point. In the case of tile imagesthis is the center point of the first tile.
Scanning Mode
Displays the scanning mode. This can either be the image field, an image line or a pixel.
Scanner Zoom
Displays the zoom factor. The value 1 corresponds to the standardized image field of all confo‐cal systems.
7.7.3
Image views
Info View Manual
Carl Zeiss Microscopy GmbH 145

Rotation
Displays the rotation of the image field around the optical axis.
Crop Offset
Displays the shift of the scanned region from the center of the image.
Pixel Time
Displays for how long the emission signal is collected per pixel. This is the so-called integrationtime.
Line Time
Displays how long the system needs to scan an image line.
Frame Time
Displays how long the system needs to scan the image field displayed in X and Y in full.
Averaging
Displays the number of individual measurements per image or line. The average of the individu‐al measurements produces the pixel intensity values for the image.
Acquisition section
Microscope
Displays which microscope was used to acquire the image.
Objective
Displays which objective was used to acquire the image.
Optovar
Displays which Optovar was used to acquire the image.
Reflector
Displays which reflector cube was used to acquire the image.
Beam Splitter
Displays which beam splitter was used to acquire the channel.
Emission Wavelength
Displays the main emission wavelength of the channel or dye used.
Excitation Wavelength
Displays the main excitation wavelength of the channel or dye used.
7.7.4
ManualImage views
Info View
146 Printed 06/2012

Contrast Method
Displays the contrast technique. In transmitted light this is the condenser setting, while in reflec‐ted light it corresponds to the selected reflector cube.
Ligth Source Intensity
Displays the lamp intensity with which the image was acquired.
Pinhole
Displays the diameter of the pinhole.
Laser Power Percent
Displays the percentage of laser power used for acquisition.
Laser Blanking
Blanking of the laser during scanner movement without acquisition.
Laser Atten. Bleach.
Displays the laser power used for bleaching.
Channel Name
Displays the name of the channel.
Channel Description
Here you can enter a description of the channel. Describe the exact use of the channel or whatcan be seen in this channel.
Dye Name
Displays the name of the dye.
Channel Color
Displays the pseudo color allocated to the channel.
Camera
Displays which camera was used to acquire the image.
Camera Adapter
Displays which camera adapter was used to acquire the image.
EM Gain
Displays the factor by which the camera signal was increased.
Exposure Time
Displays the exposure time with which the image was acquired.
Depth of Focus
Displays the depth of focus. This is calculated according to the following formula:
Image views
Info View Manual
Carl Zeiss Microscopy GmbH 147

Depth of field = (2 * n * λ) / (NA)² = (2 * refractive index * emission wavelength) / (numericalaperture)²
Section Thickness
Displays the thickness of the optical section.
Binning Mode
Displays whether binning was applied during acquisition and how much.
Detector
Displays which detector was used for acquisition.
Detector Gain
Displays the gain setting of the detector for acquisition.
Detector Digital Gain
Displays the digital gain of the detector during acquisition.
Detector Offset
Displays the offset settings of the detector during acquisition.
InformationIn the case of multichannel images the channel-dependent information is saved in a table.Here the sorting of the individual information fields may differ.
Info View dialog window
Edit Scaling dialog window
The Edit Scaling dialog window is divided up into table form. The columns contain the ScalingFactor and Scaling Unit and the rows the dimensions.
Scaling Factor column
Enter the desired scaling factor in the spin boxes/input fields.
Scaling Unit column
Select the desired scaling unit from the dropdown list. The metric units Meter, Centimeter, Milli‐meter, Micrometer and Nanometer are available as options, as well as the imperial units Inchand Mil.
Row X
Shows the scaling in the horizontal direction.
Row Y
Shows the scaling in the vertical direction.
7.7.5
7.7.5.1
ManualImage views
Info View
148 Printed 06/2012

Row Z
Shows the scaling in the 3rd dimension. This is usually the focus direction.
InformationRow Z for the third dimension is only displayed if the image has a third dimension.
OK button
Adopts the settings into the current image.
Cancel button
Closes the dialog window without adopting the settings.
Split ViewOnly visible for multichannel images.
In this view you see all channels of a multichannel image. The channels are displayed side byside, in the channel colors that have been assigned to them. You also see the mixed imageview in which all the channels are overlaid.
InformationBy double-clicking on a channel image, you can switch quickly to the 2D view.
Double-clicking on the image in the 2D view switches you back to the Split view. If you double-click on one of the displayed channels, only this channel will be shown in 2D View. If you dou‐ble-click on the merge view, it will be shown in 2D View.
See also
2 2D View [➙ p.128]
2 General view controls [➙ p.176]
Ortho ViewOnly visible for Z-stack images.
In the Ortho (orthogonal section) view you can analyze your Z-stack images. Here, in addition tothe top view (X/Y axis), you will also see the section views of the X/Z axes (top) and Y/Z axes(right).
See also
2 General view controls [➙ p.176]
7.8
7.9
Image views
Split View Manual
Carl Zeiss Microscopy GmbH 149

View specific controls
Ortho Display tab
Section Lines section
Enter the positions (pixel values) for the section lines using the X/Y/Z sliders or spin boxes/inputfields.
InformationAlternatively you can also adjust the positions directly in the image area. To adjust the posi‐tions, move the mouse over a section line in the image. Hold down the left mouse button andmove the mouse.
To position the relevant slider at the center of the view, click on the Center button.
Line Thickness section
Only visible if the Show All mode is activated.
Enter the thickness of the section lines in pixels using the sliders or spin boxes/input fields. Thisresults in a maximum intensity projection being displayed over the selected pixel width.
Line Opacity slider
Only visible if the Show All mode is activated.
Here you can enter the degree of opacity of the section lines from 0% (invisible) to 100% (com‐pletely opaque).
Maximum Intensity Projection checkbox
Activated: Displays a maximum intensity projection (MIP) across all planes for all 3 views. Thesection lines are hidden and the control elements that are not relevant in this view are deactiva‐ted.
3D Distance Measurement checkbox
Only visible if the Show All mode is activated.
Activated: Activates the 3D distance measurement. The Set Start and Set End buttons, the co‐ordinate displays and the Distance display window are visible. To set a starting point for themeasurement, navigate the cutlines to the desired starting point and click on the Set Start but‐ton. The Set End button will become active. To set an end point for the measurement, navigatethe cutlines to the desired end point and click on the Set End button. The pixel coordinates ofthe measurement points are displayed next to the buttons. The measured distance is displayedin the Distance display field.
New Image section
Here you can create a new image document. Select the desired view from the dropdown list(only in Show All mode). To save the image, click on the Save As button.
7.9.1
7.9.1.1
ManualImage viewsOrtho View
150 Printed 06/2012
InformationThe resulting image contains the image data in the same dynamics (bit depth) as the originalimage and consists of the same number of channels (in the case of multichannel images) ortime points (in the case of time lapse images) as the original image, but only contains the Z-plane currently displayed.
Cut ViewOnly visible for Z-Stack images.
This view allows looking from a different x/y/z-position/pitch/yaw to the slices of your Z-Stack im‐age.
See also
2 General view controls [➙ p.176]
View specific controls
Cut Display tab
X/Y/Z slider
Moves view in X/Y/Z-direction.
Pitch slider
Adjusts view pitch.
Yaw slider
Adjusts view yaw.
Navigator button
Shows Navigator-Window in Center Screen Area. Adjust settings directly in graphical illustra‐tion.
Reset button
Resets each setting to default.
Reset all button
Resets all settings to default.
3D ViewOnly visible for Z-stack images.
This view displays your Z-stack fluorescence images three-dimensionally.
7.10
7.10.1
7.10.1.1
7.11
Image views
Cut View Manual
Carl Zeiss Microscopy GmbH 151
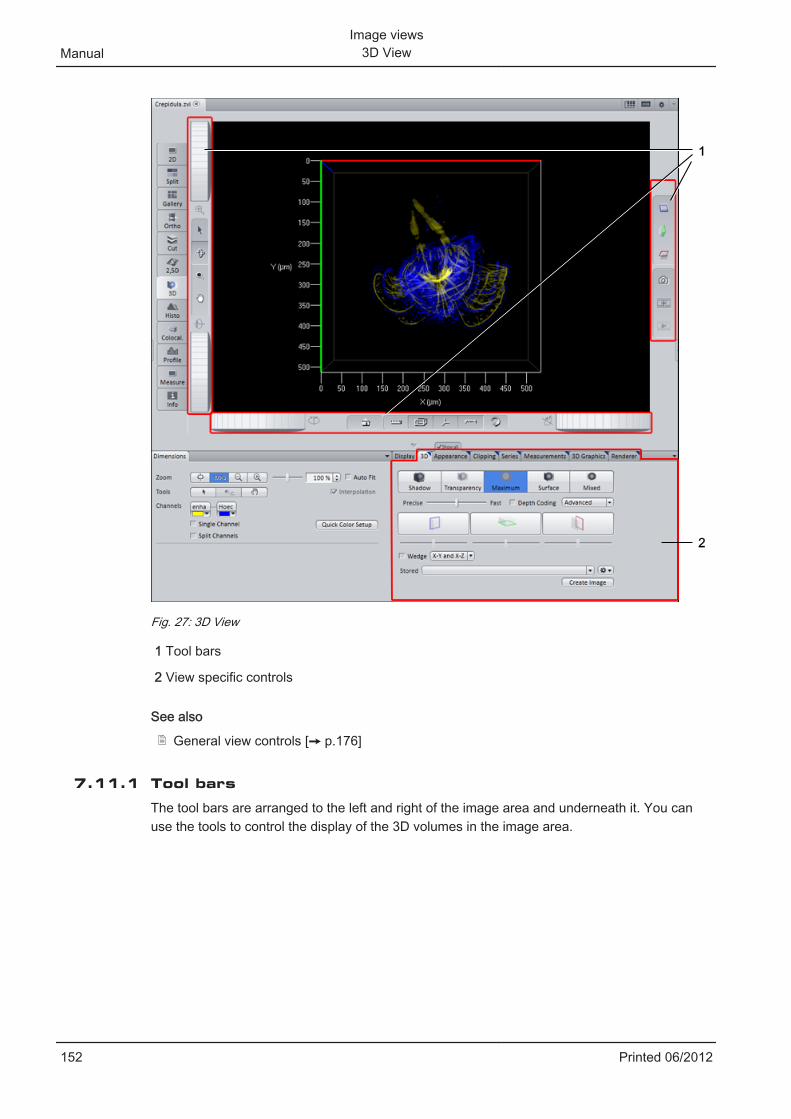
1
2
Fig. 27: 3D View
1 Tool bars
2 View specific controls
See also
2 General view controls [➙ p.176]
Tool bars
The tool bars are arranged to the left and right of the image area and underneath it. You canuse the tools to control the display of the 3D volumes in the image area.
7.11.1
ManualImage views
3D View
152 Printed 06/2012

Left tool bar
Top thumb wheel
Enlarges or reduces the image area.
Bottom thumb wheel
Rotates the 3D volume around the horizontal (X) axis.
Arrow button
Use this to select end points of measurement tools that have been drawn into the 3D volume(Measure tab). You can then edit the position of the end points.
Rotate button
Use this to rotate the 3D volume in any way you wish within the space. This is the default modewhen you switch to 3D view for the first time.
Zoom button
Use this to increase or reduce the zoom factor of the image area.
Move button
Use this to move the 3D volume laterally.
Fly button
Use this to fly through the 3D volume.
Flying through the 3D volume
➢ The Fly tool has been selected.
1. Move the mouse pointer inside the image area.
2. Hold down the left mouse button.
⇨ The view flies through the 3D volume. If you move the mouse during this process, you caninfluence the trajectory. Try it out and see.
Tool bar bottom
Left thumb wheel
Use this to rotate the 3D volume around the vertical (Y) axis.
Right thumb wheel
Use this to rotate the 3D volume around the (Z) axis perpendicular to the screen plane.
Home view button
Use this to switch back to the start view from any view. A top view of the 3D volume is dis‐played. Lateral movements and the zoom factor are adjusted so that the 3D volume can beseen at the center of the image area.
Show measurements button
Use this to show or hide drawn-in measurements. If measurements are being shown, a table ofthe measurements present in the image appears at the right edge.
7.11.1.1
7.11.1.2
Image views
3D View Manual
Carl Zeiss Microscopy GmbH 153

Show bounding box button
Use this to show or hide a bounding box around the 3D volume.
Show coordinate axes in color button
Use this to highlight the coordinate axes.
▪ X axis = red
▪ Y axis = blue
▪ Z axis = green
Show scaling button
Use this to show the scaling on each axis.
Animation mode button
Use this to set the 3D volume in continuous motion.
Animating the 3D volume
➢ The Animation Mode tool has been selected.
1. Move the mouse inside the image area.
2. Hold down the left mouse button and move the mouse.
3. Release the left mouse button again.
⇨ The 3D volume rotates continuously in the direction in which you moved the mouse. If youmove the mouse quickly, the 3D volume rotates quickly. If you move the mouse slowly, the3D volume rotates slowly.
⇨ To stop the animation, left-click again in the image area.
Right tool bar
Toggle X/Y clipping plane (blue) button
Use this to show or hide the X/Y clipping plane.
Toggle X/Z clipping plane (green) button
Use this to show or hide the X/Z clipping plane.
Toggle Y/Z clipping plane (red) button
Use this to show or hide the Y/Z clipping plane.
Snap button
Creates a 2D image of the current view. The image is a 24 bit color image. All annotations areburnt in automatically.
Add button
Adds the current view to a position list as a new position. With the help of position lists you canhave your view calculated as a series of individual images. This series can then be exported asa film, for example.
Play button
Only active if a position list containing at least two saved positions exists. Plays back a previewof the series that is calculated. To stop the preview, click on the button again.
7.11.1.3
ManualImage views
3D View
154 Printed 06/2012
View specific controls
3D tab
Here you can specify which projection/rendering mode you want to use to display the 3D vol‐ume. There are 5 view modes available. To activate the desired view mode, click on the rele‐vant button.
Projection mode buttons
Button Description
Shadow button Activates Shadow projection mode.
Transparency button Activates Transparency rendering mode.
Maximum button Activates Maximum intensity projection mode.
Surface button Activates Surface reconstruction mode
Mixed button Activates combination of transparency rendering and surface re‐construction mode
Precise/Fast slider
Enter the level of detail with which you want the view to be calculated here.
InformationIf you select the Fine setting, all the information present in the image is used to achieve thebest possible display. The calculation time can increase accordingly.
If you select the Fast setting, the image data are significantly reduced before the calculation.The calculation is fast, but only a very coarse 3D display of the volume is achieved.
Depth coding checkbox
Only active if Transparency, Maximum or Mixed mode is activated.
Activated: Replaces the channel colors of the volume with a rainbow color table. This is alsoshown as a palette with an indication of the depth (in scaled units).
Calculation Method dropdown list
Only visible if the Show All mode is activated.
This dropdown list is not available in Mixed mode.
This list entry is only available in Transparency, Maximum and Surface modes.
Performs the calculation using the graphics card. The display is faster and you have more set‐ting options.
This list entry is only available in Transparency, Maximum and Surface modes.
Performs the calculation using the computer's CPU only. The setting options are restricted here.
This list entry is only available in Surface mode.
Die Beschreibung dieses Listeneintrags wird nachgereicht.
This list entry is only available in Shadow mode.
7.11.2
7.11.2.1
Accelerated
Restricted
Detailed
Free View
Image views
3D View Manual
Carl Zeiss Microscopy GmbH 155

Allows you to position the 3D volume freely.
This list entry is only available in Shadow mode.
Shows the 3D volume from the front.
This list entry is only available in Shadow mode.
Shows the 3D volume from the back.
Clipping Planes buttons
Only visible if the Show All mode is activated.
Only visible if Transparency, Maximum, Surface or Mixed view mode is activated.
Using the three buttons you can activate or deactivate clipping planes in the 3D volume.
If you right-click on one of the buttons, a shortcut menu opens. Here you can choose whetheryou want the front, back or both sides of the 3D volume to be clipped. You can also specify howthe clipping plane is displayed.
Under each button is a slider. You can use this to move the relevant clipping plane within thevolume.
Wedge checkbox
Only visible if the Show All mode is activated.
Not visible in Shadow mode.
Activated: Activates two texture planes. Only the sector between the planes is cut out. You canselect which planes you want to be used for the wedge function from the dropdown list. The se‐lection is also visible in the relevant buttons.
Stored dropdown list
Only visible if the Show All mode is activated.
Here you can select saved 3D settings.
button
Only visible if the Show All mode is activated.
Opens a shortcut menu with the following options:
Creates a new settings file that is given a name automatically and has the file extension *.cz3dr.The settings file can be found in the user path under \My Documents\Carl Zeiss\ZEN\Docu‐ments\3D render settings
Deletes the selected settings file from the hard drive.
Renames the selected settings file. Enter a new name in the input field and confirm with OK.
Saves the selected settings file under a different name.
Imports a *.cz3dr file and applies it to the current image.
Exports a *.cz3dr file to a different location.
Create Image button
Creates a new image from the current view. This image is a 24 bit RGB color image. All graphicelements, such as annotations, are burnt in.
Front
Back
New
Delete
Rename
Save As
Import
Export
ManualImage views
3D View
156 Printed 06/2012

Appearance tab
Here you can define the appearance of the 3D volume. On the tabs available on this tab, selectthe setting that you want to change (e.g. Transparency). Depending on which view mode youhave activated, different control elements are available on the tabs.
Surface tab
Only visible if Shadow, Surface or Mixed view mode is activated.
Roughness slider
Only visible if Shadow view mode is activated.
Enter the roughness of the surface of the 3D volume using the slider or spin box/input field. Thischanges the plasticity of the display.
InformationIf pixels enter the saturation range, artifacts may occur. In this case enter a lower roughnessvalue.
The following sliders are only visible if Surface or Mixed view mode is activated:
Threshold Value slider
Here you can set the lower threshold value in percent of the gray levels displayed. With this set‐ting you specify the gray value range for the relevant channel that you want to be included in therendered image.
Diffuse Light slider
Here you can set the basic brightness on a scale from 0 to 100%.
Directional Light slider
Here you can set the directional brightness from 0 to 100%. This value influences the differen‐ces between bright and dark structures.
Shine slider
Here you can set the surface shine.
Reset button
Resets all entries to the original values.
Transparency tab
Channel Selection
Here you can select the channel of a multichannel image for which you want to set the transpar‐ency.
7.11.2.2
Image views
3D View Manual
Carl Zeiss Microscopy GmbH 157

Threshold Value slider
Here you can set the lower threshold value in percent of the gray levels displayed. With this set‐ting you specify the gray value range for the relevant channel that you want to be included in therendered image.
Ramp Width slider
Here you can set the extent of the transition from completely transparent to completely opaque(0-100 percent).
Maximum slider
Here you can enter the level of opacity (0-100 percent).
Histogram Display
Here the settings that you enter using the sliders are displayed schematically. The X axis repre‐sents the gray level values and the Y axis the opacity. You can also change the position of thecurve using the mouse.
Reset button
Resets all entries to the original values.
Channels tab
Only visible if Mixed view mode is activated.
Here you can specify how Transparency and Surface are mixed. In the case of multichannel im‐ages you can also configure these settings differently for each channel.
Activate the corresponding checkboxes for Transparency and Surface in the list.
Background tab
Background Color section
Here you can set the background color for the 3D view. To do this, click on the color field andselect the desired color.
Background Distance section
Only visible if Shadow view mode is activated.
Enter the distance of the background from the 3D volume using the slider or spin box/input field.
Shadow checkbox
Only visible if Shadow view mode is activated.
Activated: Displays the shadow cast by the 3D volume.
Light tab
Brightness slider
Here you can enter the brightness of the light source.
ManualImage views
3D View
158 Printed 06/2012

Distance slider
Only visible if Surface or Mixed view mode is activated.
Here you can enter the distance of the light source from the 3D volume.
Azimuth slider
Here you can enter the angle of the light source above the virtual horizon.
Elongation slider
Here you can enter the light source's horizontal angle of incidence.
Light Source Display
As an alternative to the slider or input field, you can set the Azimuth and Extension together byusing the mouse to move the point within the light source display.
Illuminated Interiors checkbox
Activated: Illuminates the interior of a surface-rendered volume.
Colored Interiors checkbox
Activated: Illuminates the interior of a surface-rendered volume in color. It is easier to differenti‐ate the inside from the outside if this option is activated. In this case the illumination is coloredblue.
Reset button
Resets all entries to the original values.
Projection tab
Projection Angle slider
Here you can set the projection angle at which you want to view the scene freely between 0°and 80°. The effect of this on the perspective display is as if you are viewing the 3D imagethrough a telephoto or wide-angle lens.
Z Extension slider
Here you can set the extension of the volume in the Z direction (value range 10% - 600%).
Stereo Image checkbox
Activated: Displays the 3D volume as anaglyphs. You can choose between the Red/Green orRed/Cyan radio button.
Camera Distance slider
Here you can enter the distance between the two virtual cameras (0-20%).
Parallax slider
Here you can enter the degree of movement that is necessary to bring the two camera imagesback into line (-100 to +100%).
Image views
3D View Manual
Carl Zeiss Microscopy GmbH 159

Reset button
Resets all entries to the original values.
Clipping Planes tab
Only visible if the Show All mode is activated.
Here you can edit clipping planes. To select a clipping plane, click on the relevant button. Theediting functions which you can use to modify the selected clipping plane become visible belowthe buttons.
X/Y button
Activates the editing functions for the X/Y clipping plane.
X/Z button
Activates the editing functions for the X/Z clipping plane.
Y/Z button
Activates the editing functions for the Y/Z clipping plane.
Activate Clipping Planes checkbox
Activated: Automatically inserts all 3 clipping planes into the 3D volume. Activates the editingfunctions for each clipping plane.
InformationOn the Clipping Planes tab you can edit the clipping planes. On the 3D tab you can activate ordeactivate the relevant clipping planes in the 3D volume.
Reset button
Resets all entries to the original values.
The following functions are only visible if the Activate Clipping Plane checkbox is activated anda clipping plane has been selected:
Activate checkbox
Activated: Activates the selected clipping plane in the 3D volume. Each plane is positioned atthe center of the 3D volume and aligned orthogonally (in the X/Y, X/Z, Y/Z direction).
Change the display of the selected clipping plane using the dropdown list to the right of thecheckbox. The following settings are available:
The plane is invisible.
The plane is displayed in color. The frame color is used with 50% transparency here.
The data above the threshold value that are touched by the clipping plane are displayed in bina‐ry form as a white area. Black pixels are non-transparent.
The data that are touched by the clipping plane are displayed as they are in Transparent viewmode, but in 2 dimensions. The ramp for the transparency is linear here. Black pixels are trans‐parent.
The data that are touched by the clipping plane are displayed in textured form. Black pixels aretransparent.
7.11.2.3
Invisible
Colored
Black/White
Transparent
Textured
ManualImage views
3D View
160 Printed 06/2012

The display appears as it does with the Textured setting, but with full resolution. Black pixels aretransparent.
The display appears as it does with the Transparent setting. Black pixels do not let any lightthrough, however, meaning that the render data behind them are not displayed.
Frame checkbox
Activated: Displays the frame of the selected clipping plane. Enter the frame color via the colorfield.
Clip Front checkbox
Activated: Clips the front of the 3D volume.
Clip Back checkbox
Activated: Clips the back of the 3D volume.
Clip Transparency checkbox
Only active if Mixed view mode is activated.
Activated: In addition to the surface data, also clips the transparency data.
Clip Surfaces section
Only visible if Surface or Mixed view mode is activated.
Here you can enter which channel you want to be clipped using the channel buttons.
Orientation Sliders section
Here you can enter the position of the selected clipping plane.
Here you can enter the X angle for the selected clipping plane.
Here you can enter the Y angle for the selected clipping plane.
Reset Orientation button
Resets the selected clipping plane to the original position.
Series tab
Here you can create render series of individual views, which you can later view and export as afilm.
The tab contains different control elements depending on the series type. The following ele‐ments are the same, however, for all types: Saving of Settings, Selection of Settings, Apply but‐ton, Number of Individual Images input field and Fixed Resolution checkbox.
Settings according to series type
It is possible to create 5 different types of series:
▪ Rotation around a fixed X, Y or Z axis, indicating the start and end point
▪ Definition of a start and end point
▪ Definition of a list of positions
Finely Tex‐tured
Opaque
Position
<X (X Angle)
<Y (Y Angle)
7.11.2.4
Image views
3D View Manual
Carl Zeiss Microscopy GmbH 161

Select the type of series that you want to create from the Series Type dropdown list.
Rotation control elements
The X rotation, Y rotation and Z rotation series types all have the same control elements anddiffer only in the axis around which the rotation is calculated.
The preview function is not available for these types of series.
Panorama/Partial Panorama selection field
Select the 360° panorama if you want to generate a complete rotation.
If you select a partial panorama, you can specify the starting angle and stopping angle that youwant to be used to create the series. To do this, enter the desired values in the input fields.
The direction of rotation with which you want the series to be created can be specified using thetwo buttons showing the rotation icons.
Angle Definition control element
When you are configuring a partial panorama, the desired angles can also be indicated easilyusing the circular control element: Grab the white start/stop points with the mouse and positionthese accordingly on the circle. The number of individual images is also displayed here.
Use the Apply button to create the series.
Start/Stop control elements
If you have selected Start/Stop as the series type, 4 sliders will appear with input fields for theindividual parameters to define the starting and stopping position.
Starting Position
Select the Starting Position option.
You can position the volume as required using the mouse. The geometric parameters are dis‐played in the input fields. You can also indicate the angle for X, Y or Z and the zoom factor di‐rectly using the slider or value field. All changes are displayed immediately in the image area.
Stopping Position
Select the Stopping Position option.
You can position the volume as required using the mouse. The geometric parameters are dis‐played in the input fields. You can also indicate the angle for X, Y or Z and the zoom factor di‐rectly using the slider or value field. All changes are displayed immediately in the image area.
Use the Apply button to create the series.
Position List control elements
With the Position List series type you can save any number of views of the volume within thespace as positions in a position list and in this way generate an animation around changing ro‐tation axes or with changing zoom factors.
The positions are displayed in a list view.
ManualImage views
3D View
162 Printed 06/2012

Append/Insert buttons
You can add a current position by clicking on the Append button. If you want to insert a newposition between two existing positions, click on the Insert button.
Position List
Each position is displayed in the list with its X, Y, Z angle and zoom level. Using the control ele‐ments at the bottom of the list you can change the order of the positions (arrow buttons), cutpositions (scissors icon) and insert them again at another position (insert icon) or delete posi‐tions (wastepaper bin icon).
If you want to delete all positions, click on the Empty List button.
Parameters checkbox
You can determine which of the following parameters you want to be taken into considerationwhen the series is calculated. To do this, select the corresponding option in the checkbox:
▪ Light: Illumination parameters are considered
▪ Transparency: Various transparency settings (not in Surface mode)
▪ Background: Color and distance of the background
▪ Time Series (only for time lapse images)
▪ Viewing Angle
▪ Planes (not in Shadow mode)
▪ Surfaces (only in Surface and Mixed mode)
Saving of Settings
Saving of Settings
Clicking on the Options dropdown button opens a shortcut menu with the following options:
▪ New: Creates a new settings file. This file can be found in the user's local document path(e.g. \My Documents\Carl Zeiss\ZEN\Documents, in a corresponding subfolder).
▪ Delete: Deletes the settings file currently selected in the Saved dropdown list from the harddrive.
▪ Rename: Opens a dialog to rename the currently selected settings file.
▪ Save As ... : Saves a copy of the currently selected settings file under a different name.
▪ Save: Saves changes to a currently selected settings file.
▪ Import: Opens settings files that have been saved at a location other than the default loca‐tion using an Open File dialog.
▪ Export: Saves settings files at a location of your choice using a Save File dialog.
Image views
3D View Manual
Carl Zeiss Microscopy GmbH 163

Settings Selection
Select Saved Settings
Via a dropdown list you can select a settings file. This is then used when you click on the Applybutton.
Preview
To obtain a preview of the series to be created, click on the Play button. To stop the preview,click on the Stop button.
Apply button
Apply button
The series is calculated when you click on the Apply button.
Number of Individual Images input field
Number of Individual Images input field
Here you can indicate the number of individual images that you want the series to consist ofafter the calculation. The more individual images that you specify here, the more fluidly thescene transitions will be displayed later. Click on the dropdown button to select predefined val‐ues from a list.
Fixed Resolution checkbox
As a rule, the image series is calculated using the current screen resolution. If you want to set adifferent format for the series, select the Fixed Resolution checkbox. In the input fields that arenow visible you can enter the width x height in pixels with which you want the series to be cre‐ated.
Measure tab
Only visible if the Show All mode is activated.
Here you can perform interactive measurements in the 3D volume. No measurements are pos‐sible in Shadow view mode. The measurement tools and measured values are displayed in the3D volume and can be changed there. The measured values can also be displayed in the formof a table and processed further in other programs.
Tool bar
Using the tools you can perform interactive measurements in the 3D volume. The following toolsare available:
Changes the mouse pointer to Selection mode. Use this to select measurements in the 3D vol‐ume in order to change them.
7.11.2.5
Selection
ManualImage views
3D View
164 Printed 06/2012

Use this to measure the length of a line in µm. Click once on the starting point and hold downthe mouse button. Then drag the mouse to the end point and release the mouse button again.The measurement is complete. The result of the measurement is displayed in the list to the rightof the image area.
Use this to measure the angle between two connected legs. First define the starting point. Thenuse the mouse to drag the first leg to the desired first end point. Define the second leg by click‐ing on the second end point. The angle measurement ends with a display of the angle meas‐ured (in degrees). The result of the measurement is displayed in the list to the right of the imagearea.
Use this to measure along a line with any number of segments. Click from corner point to cornerpoint. Complete the measurement by right-clicking. The result of the measurement is displayedin the list to the right of the image area.
InformationAll measurement tools are also displayed on the 3D Graphics tab. You can make changes tothe format and name there.
Keep Tool checkbox
Activated: Keeps the selected tool active.
Change Color checkbox
Activated: Automatically changes the color of the drawn-in tool.
Display Measurements checkbox
Activated: Shows the list of measured values to the right of the image area. The following set‐tings are also activated:
In Foreground checkbox
Activated: Brings all drawn-in measurement tools into the foreground, even if these are in factobscured by image structures.In Image checkbox
Activated: Displays the measured values in the 3D volume.
As List checkbox
Activated: Displays the measured values in the measurement data table.
Delete Selected button
Only active if a measurement tool has been selected in the 3D volume.
Deletes selected measurement tools from the 3D volume.
Delete All button
Deletes all measurement tools from the 3D volume.
Line
Angle
Curve (Poly‐gon)
Display Val‐ues section
Image views
3D View Manual
Carl Zeiss Microscopy GmbH 165

3D Graphics tab
Only visible if the Show All mode is activated.
Tool bar
Using the tools you can perform interactive measurements in the 3D volume. The following toolsare available:
Changes the mouse pointer to Selection mode. Use this to select measurements in the 3D vol‐ume in order to change them.
Use this to measure the length of a line in µm. Click once on the starting point and hold downthe mouse button. Then drag the mouse to the end point and release the mouse button again.The measurement is complete. The result of the measurement is displayed in the list to the rightof the image area.
Use this to measure the angle between two connected legs. First define the starting point. Thenuse the mouse to drag the first leg to the desired first end point. Define the second leg by click‐ing on the second end point. The angle measurement ends with a display of the angle meas‐ured (in degrees). The result of the measurement is displayed in the list to the right of the imagearea.
Use this to measure along a line with any number of segments. Click from corner point to cornerpoint. Complete the measurement by right-clicking. The result of the measurement is displayedin the list to the right of the image area.
InformationAll measurement tools are also displayed on the 3D Graphics tab. You can make changes tothe format and name there.
Measurement Tools list
All the measurement tools contained in the 3D volume are displayed here. The list contains thefollowing columns:
Here you can select whether or not a measurement tool is displayed in the image. If you click inthe title field of the column, the setting is made simultaneously for all entries.
No function!
Displays the tool type. If you click on the icon, you can change the color of the tool.
Displays the unique identification number of the measurement tool.
No function
Activated: Displays the measurement data in the image. If you click in the title field of the col‐umn, the setting is made simultaneously for all entries.
Displays the name of the tool. To change the name, double-click on the entry. Then enter a newname. Confirm the entry with the Enter key.
Renderer tab
Only visible if the Show All mode is activated.
Here you will find special settings that do not normally have to be changed.
7.11.2.6
Selection
Line
Angle
Curve (Poly‐gon)
Eye icon
Lock
Type
ID
A
M checkbox
Name
7.11.2.7
ManualImage views
3D View
166 Printed 06/2012

In the Flight Speed input field you can enter the speed (value range 1-1000%) that you want tobe used for Fly mode.Draw Edge Triangles checkbox
Using this option you can specify whether smooth areas are displayed in Surface mode. If thisoption is not activated, these areas have the appearance of openings through which you canlook into the rendered volume.
2D Textures checkbox
Activated: Uses 2D contours instead of 3D textures.
Texture Opacity input field:
Changes the opacity of all textures.
Texture Change Angle input field
Here you can enter the angle at which the next collection of 2D textures is loaded (value range0-90°).OpenGL Mode dropdown list
In the event of problems with the graphics card, the OpenGL calculations can be performed bythe CPU. Select the Software entry from the dropdown list to use this option.
Use Palette Textures checkbox
Activated: Uses palette textures. This is only possible with older graphics cards.
Use Intensity Alpha Textures checkbox
Activated: Uses a particularly memory-efficient texture type for single-channel images.
Use Display Lists checkbox
Activated: Uses display lists for precalculation. This can speed up the display.
Hardware-Accelerated Series checkbox
Activated: Speeds up the calculation of render series. Deactivate this function in the event ofproblems with the creation of series.
Limit Memory checkbox
Activated: Limits the maximum graphics card memory used.
Reset button
Resets all entries to the original values.
Colocalization ViewOnly visible for multichannel fluorescence images.
In the Colocal. (colocalization) view, you can analyze the extent of colocalization quantitativelyin two fluorescence channels. The view consists of two main areas: the X/Y scatter plot on theleft and the actual image (2 channels are displayed) in the right image area. Using the Colocali‐zation tab, you can also display the Colocalization table in the lower image area.
Fly Modesection
Appearancesection
Renderersection
7.12
Image views
Colocalization View Manual
Carl Zeiss Microscopy GmbH 167

InformationThe channels that you are comparing with one another are displayed in the image area in theform of a color overlay. The channel color of the image is used here. If the images have morethan 2 channels, you can add additional channels on the Dimensions tab. This temporary se‐lection is deactivated, however, when you select the channels to be compared on the Colocali‐zation tab.
See also
2 General view controls [➙ p.176]
X/Y Scatter Plot
The pixel intensities of two channels are plotted against one another in the diagram and eachpixel pair with the same X/Y image coordinates is displayed as a point. The frequency withwhich pixels of a certain brightness occur is visualized by means of a color palette that is dis‐played at the bottom of the diagram. The relative value range lies between 0-255.
The vertical and horizontal axes show the gray value range that applies for the relevant chan‐nel.
The diagram is overlaid with two lines that subdivide it into 4 quadrants, numbered from 1-4. Us‐ing the mouse you can position the lines freely and therefore adjust the threshold values to thedata.
The quadrants have the following meanings:
▪ 1: Non-colocalizing pixels from channel 1
▪ 2: Non-colocalizing pixels from channel 2
▪ 3: Colocalizing pixels
▪ 4: Background
Colocalization table
Only visible if the Table checkbox is activated on the Colocalization tab.
For each quadrant of the scatter plot there is a correspondingly labeled row in the table. TheGlobal row contains the values for the entire image. The table contains columns for the follow‐ing measured values:
Region
Once a region has been selected it has a number assigned to it. This number appears in theimage and in the table.
Quadrant
Indicates the measured values for the four quadrants of the scatter plot.
Pixel Number
Shows the total number of pixels of each quadrant. The sum of all pixels in this column for all 4quadrants corresponds to the product of the height x width of the original image.
7.12.1
7.12.2
7.12.2.1
7.12.2.2
7.12.2.3
ManualImage views
Colocalization View
168 Printed 06/2012

Area (µm²)
Area = number of pixels x scaling factor for X/Y If there is no scaling for the original image, the following applies: 1 pixel = 1 µm.
Relative Area (%)
Relative area = area of quadrant/total area
Pearson's Correlation Coefficient
Provides information on the intensity distribution within the colocalization region.Value range: -1 to 1.
1: All pixels are on a straight line in the scatter plot from bottom left to top right (if, for example,you have used the same channel twice for the colocalization, you will find the value 1 in thiscolumn).
0: The pixels in the scatter plot are distributed in a cloud without a preferred direction.
-1: The pixels do not overlap. The scatter plot stretches from top left to bottom right. This situa‐tion can be described as negative colocalization and means "exclusion".
The calculation formula is as follows:
GV: Gray Value; AV: Average Gray Value; C: Channel
Manders' Correlation Coefficient
Insensitive to differences in the signal intensity between the two channels and bleaching.
Value range: 0 to 1
The calculation formula is as follows:
Fig. 28: C: Channel
Coloc. Coefficient 1
This coefficient indicates the relative number of colocalized pixels in channel 1 in relation to thetotal number of pixels above the threshold value:
The values range between 0 and 1, with 0 indicating no colocalization and 1 indicating full co‐localization.
Numerator = Number of pixels in quadrant 3
Denominator = Number of pixels in quadrant 3 + number of pixels in quadrant 1
7.12.2.4
7.12.2.5
7.12.2.6
7.12.2.7
7.12.2.8
Image views
Colocalization View Manual
Carl Zeiss Microscopy GmbH 169

Coloc. Coefficient 2
This coefficient indicates the relative number of colocalized pixels in channel 2 in relation to thetotal number of pixels above the threshold value:
The values range between 0 and 1, with 0 indicating no colocalization and 1 indicating full co‐localization.
Numerator = Number of pixels in quadrant 3
Denominator = Number of pixels in quadrant 3 + number of pixels in quadrant 2
CC (weighted) 1
Weighted correlation coefficient channel 1. Calculated like the simple colocalization coefficient,but using the sum of the gray value intensity rather than the number of pixels.
The values range between 0 and 1, with 0 indicating no colocalization and 1 indicating full co‐localization.
Numerator = Sum of intensity of all pixels in quadrant 3
Denominator = Sum of intensity of all pixels above the threshold value
CC (weighted) 2
Weighted correlation coefficient channel 2. Calculated like the simple colocalization coefficient,but using the sum of the gray value intensity rather than the number of pixels.
The values range between 0 and 1, with 0 indicating no colocalization and 1 indicating full co‐localization.
Numerator = Sum of intensity of all pixels in quadrant 3
Denominator = Sum of intensity of all pixels above the threshold value
Average Intensity 1
The sum of all gray values from channel 1, divided by the total number of pixels in this channel:
Average Intensity 2
The sum of all gray values from channel 2, divided by the total number of pixels in this channel:
7.12.2.9
7.12.2.10
7.12.2.11
7.12.2.12
7.12.2.13
ManualImage views
Colocalization View
170 Printed 06/2012

Standard Deviation 1
Displays the standard deviation of the gray values in channel 1:
Standard Deviation 2
Displays the standard deviation of the gray values in channel 2:
Z Index
Displays the Z index for Z-stack images.
T Index
Displays the time index for time lapse images.
Relative Time
Displays the time of acquisition for all dimensions of a multidimensional image, beginning at 0h:00min:00sec:00msec.
Relative Focus
Displays the relative focus position at which an image has been acquired.
View specific controls
Colocalization tab
Here you will find all the control elements that you need to perform a colocalization analysis.
Tool Bar section
Use the tools to draw regions into the image in which you want the analysis to be performed. Adescription of the tools can be found on the Graphics tab [➙ p.184].
Once a region has been drawn in, it is automatically treated as an active region. The scatter plotshows the pixel value frequencies for this region.
The Colocalization table displays the data for the entire image and for the selected region. Toselect several regions, hold down the Ctrl key and click on the desired regions.
7.12.2.14
7.12.2.15
7.12.2.16
7.12.2.17
7.12.2.18
7.12.2.19
7.12.3
7.12.3.1
Image views
Colocalization View Manual
Carl Zeiss Microscopy GmbH 171

Apart from drawing regions into the image, you can also draw them into the X/Y scatter plot. Ifyou have used the function in the Masking section [➙ p.174], only those pixels that are framedby a region in the scatter plot are taken into consideration. This means that you can correlateinteresting point clouds quickly with the corresponding pixels in the image.
If you have drawn regions into the scatter plot, the ROI (region of interest) button will also ap‐pear in the tool bar. As long as this button is activated (highlighted in blue), you can select,move and change the regions in the scatter plot using the Selection tool. If you want to changethe quadrant lines again, you will need to deselect the ROI button beforehand.
Channels and Scatter Plot Control section
Channels dropdown lists
Here you can select which channels of a multichannel image are compared with one another.Select a channel for both the horizontal and vertical diagram axis from the Channels dropdownlist. The first and second channel are always selected by default. As soon as you have made aselection, all other channels are automatically removed from the image display. You can, how‐ever, add other channels temporarily on the Dimensions tab.
Threshold sliders
Using the two Threshold sliders and the two spin boxes/input fields, you can set the thresholdvalue (in gray levels) for both channels.
ManualImage views
Colocalization View
172 Printed 06/2012
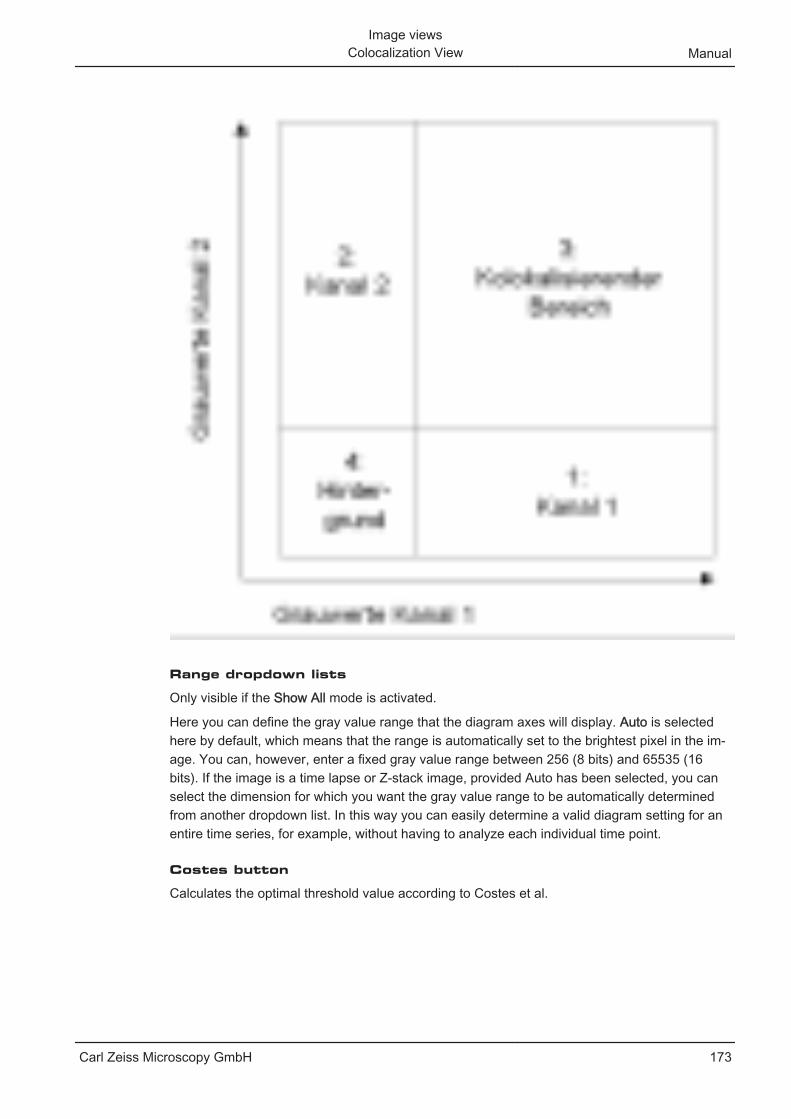
Range dropdown lists
Only visible if the Show All mode is activated.
Here you can define the gray value range that the diagram axes will display. Auto is selectedhere by default, which means that the range is automatically set to the brightest pixel in the im‐age. You can, however, enter a fixed gray value range between 256 (8 bits) and 65535 (16bits). If the image is a time lapse or Z-stack image, provided Auto has been selected, you canselect the dimension for which you want the gray value range to be automatically determinedfrom another dropdown list. In this way you can easily determine a valid diagram setting for anentire time series, for example, without having to analyze each individual time point.
Costes button
Calculates the optimal threshold value according to Costes et al.
Image views
Colocalization View Manual
Carl Zeiss Microscopy GmbH 173

Masking section
Channels buttons
Here you can mask pixels in the image according to which one of the four quadrants they be‐long to. The numbers on the buttons correspond to the numbering of the quadrants in the X/Yscatter plot. The color selection window is accessed by clicking on the color field. Using theOpacity slider you can determine the degree of transparency of the masking.
Cut button
Only active if a quadrant has been masked.
Creates a new image exclusively containing the masked pixels.
Create section
Diagram button
Creates a new image document from the X/Y scatter plot. In the case of time series or Z-stacksthe dimensions are also created automatically.
The following functions are only visible if the Show All mode is activated:
Table button
Creates a new table document. The document contains all measurement data from the colocali‐zation analysis. All dimensions, such as T and Z, are also taken into account. This table can besaved as a *.csv document for further processing in other programs.
Table checkbox
Activated: Displays the colocalization table in the image area.
Analysis ViewOnly visible if an interactive measurement has been performed.
In the Analysis view the image from the interactive measurement and the table containing themeasurement results are displayed.
InformationTo highlight the row of the table containing the measured values of an object, click on a meas‐ured object in the image.
To highlight the corresponding measured object in the image, click on a row in the table.
See also
2 General view controls [➙ p.176]
7.13
ManualImage views
Colocalization View
174 Printed 06/2012

View specific controls
Analysis tab
On the Analysis tab you can define how the measured objects are displayed in an image.
Show Objects checkbox
Activated: Displays the measured objects in the graphics plane.
Fill checkbox
Activated: Displays the objects in filled form.
Deactivated: Displays only the contours of the objects.
Opacity slider
Here you can set the opacity with which the measured objects are displayed in the graphicsplane.
Delete Measurement Data button
Deletes all objects and measurement data from the image.
Show All Classes checkbox
Activated: Displays the objects of all classes.
Deactivated: Displays the objects of the selected class.
Create Measurement Data Tables button
Creates two measurement data tables. One measurement data table contains the field featuresfor all classes and the other the object features for all classes.
Classes section
In the Classes section select the class whose measurement features you want to be displayedin the measurement data table. For each class there are two entries: the first entry concerns allthe objects belonging to the class (field features) and the second represents an individual object(object features).
Panorama ViewIn the Panorama view you can see the complete overview of the microscope stage. The toolsthat allow you to control acquisition are arranged in the tools window in the bottom right cornerof the image. There you can control the exposure time, determine the focus position and ac‐quire an individual or Z-stack image.
See also
2 General view controls [➙ p.176]
7.13.1
7.13.1.1
7.14
Image views
Analysis View Manual
Carl Zeiss Microscopy GmbH 175

Stage View
In the image area the full travel range of the microscope stage is displayed. You can control thestage view using the arrow icons at the edges of the image area. The view can be enlarged,reduced or moved using the general control elements.
Navigator frame
The current stage position is shown as a tile outlined in blue, the Navigator frame. In the Navi‐gator frame you can see the camera's live image.
To move the frame, double-click on the position on the microscope stage to which you want tomove it.
To acquire images, use the Acquisition buttons in the Tools window.
Tools window
Center at Live Navigator button
Centers the stage view at the current position of the Navigator frame.
Acquisition button
Acquisition buttons
Acquire Tile Image button
Acquires a tile image. This comprises all activated channels as well as Z-stacks. Following ac‐quisition a tile image is placed in the corresponding location in the stage view.
General view controls
Dimensions tab
On the Dimensions tab you can configure the settings for how the image will be displayed onthe screen. You can select the size of the display and call up information about the content ofthe image. In the case of multidimensional images you can select here which dimension is dis‐played.
Slider section
Depending on how many dimensions your image contains, up to 4 sliders are available in thissection. Using the sliders you can set the position that you want for each dimension available inthe image. You will see the current position number in the input field to the right of the relevantslider. You can also enter the position number directly here.
The buttons to the right of the input fields enable you to play back the dimension inquestion automatically. This takes place at a rate of 5 images per second by default. You canchange the speed on the Player [➙ p.183] tab.
Depending on the available dimensions, the following sliders may be visible:
Only visible in the case of Z-stack images.
7.14.1
7.14.2
7.15
7.15.1
7.15.1.1
Z-Position
ManualImage views
Panorama View
176 Printed 06/2012

Here you can enter the desired Z-position.
Only visible in the case of time lapse images.
Here you can enter the desired time point.
Only visible in the case of images of different positions.
Here you can enter the desired scene. If you deactivate the Scene checkbox, all scenes are dis‐played as an overview.
Only visible if you have used the Experiment Designer.
Here you can enter the desired experiment block.
Only visible if you have used the Experiment Designer.
Here you can enter the duration across all blocks.
InformationFor images with more than 3 dimensions a scrollbar is displayed which you can use to accessthe other sliders.
See also
2 Experiment Designer tool [➙ p.90]
Zoom section
Fig. 29: Zoom section
This section contains tools that you can use to adjust the size of the image region displayed.
Symbol Name Function
Fit to Window Automatically sets a zoomfactor at which the entire im‐age can be displayed visiblyon the screen.
Normal View (100%) Shows the image without in‐creasing or decreasing thezoom factor. One pixel of theimage corresponds to one pix‐el on your screen.
Decrease Zoom (F8) Decreases the zoom factor.
Increase Zoom (F7) Increases the zoom factor.
Time
Scene
Block
Total Time
7.15.1.2
Image views
General view controls Manual
Carl Zeiss Microscopy GmbH 177

Symbol Name Function
Zoom slider & spin/input box Here you can set the displaysize steplessly. The desiredzoom factor can be entered inthe spin/input box in percent.
Auto-Fit checkbox Activated: Adjusts the displaysize automatically and contin‐uously to the size of the win‐dow.
InformationIf you hold down the Ctrl-key, you can zoom in and out of the image using the mouse wheel.
Tools section
The bar in the Tools section contains other tools that you can use to interact with the image. Aselected tool appears in blue.
Changes the mouse pointer to Selection mode. The mouse pointer appears in the form of thedefault icon.
Changes the mouse pointer to Zoom Rectangle mode. The mouse pointer appears in the formof cross hairs. Hold down the left mouse button and drag out a selection rectangle. When yourelease the left mouse button, the region within the rectangle is displayed in enlarged form.
Changes the mouse pointer to Move mode. The mouse pointer appears in the form of a hand.Click inside the enlarged image region and hold down the left mouse button. You can now movethe image region.
InformationIf you have a mouse with a mouse wheel, you can also use this to move enlarged image re‐gions. Position the mouse pointer in Selection mode inside the enlarged image region. Holddown the mouse wheel. The mouse pointer will then appear as a hand icon. You can nowmove the image region. When you release the mouse wheel, the mouse pointer changes backto the default icon.
Only visible in Gallery view.
This function allows you to set a new zoom level for all images simultaneously using the mousewheel. The size of the Gallery View does not change here. This allows you to limit the view toone interesting image region. Use the Move tool to move the view.
Changes the mouse pointer to Show Pixel Values mode. If you move the mouse pointer into theimage region, a vertical arrow and a display field will appear. The pixel values of the position towhich the arrow is pointing are displayed in the display field. In the first line of the display fieldthe X/Y coordinates are shown. The second line shows the X/Y coordinates in scaled units. Inthe other lines the gray values for each channel are shown.
Opens the Navigator dialog window in the image region. There you will see an overview of yourimage and you can navigate to different positions using a rectangular window.
7.15.1.3
Selectionmode
Zoom Rec‐tangle
Move
Inner Zoom
Show PixelValues
Navigatorbutton
ManualImage views
General view controls
178 Printed 06/2012

Activated: The pixel elements of the image are shown in an interpolated display. This makes itpossible to avoid the pixelated display of small or greatly enlarged images.
Deactivated: The pixel elements of the image are displayed on the screen as they are. Thisfunction is activated by default, but can be deactivated under Options [➙ p.43] if required.
See also
2 Navigator window [➙ p.128]
Channels section
The bar in the Channels section contains all the channels that you are using in your image.Here you can switch the display of channels in images on or off and change the channel colors(pseudo color assignment).
Channel buttons
A button is displayed for each channel. Each button has two functions:
1. The channel name is displayed in the top section. To switch a channel off/on again, left-clickon this section of the button.
2. The bottom section of the button shows the channel color. The display changes dependingon the status of the button:
▪ When switched off, you will see a colored line below the button.
▪ When switched on, you will see a color field with a dropdown list below the button. Clickingon the dropdown list opens the Color Selection dialog window.
InformationFor images with 8 or more channels, the Channel buttons are reduced in size. In this case it isno longer possible to change the color channel by channel.
Single-Channel Mode checkbox
Activated: Only a single channel is displayed.
Show Colors checkbox
Only visible in the Channels view.
Activated: Displays the individual channels of multichannel images without the assignment ofpseudo colors.
Saturation Display checkbox
Activated: Changes the display to the Single-Channel Mode. The channel is displayed in mono‐chrome. At the same time you will see regions in which the camera sensor is saturated (dis‐played in red) and regions in which the pixel values = 0 (displayed in blue). This function helpsyou to set your camera's exposure time so that saturation of the detector is avoided.
Interpolationcheckbox
7.15.1.4
Image views
General view controls Manual
Carl Zeiss Microscopy GmbH 179

InformationWith camera systems it is not normally possible to achieve pixel values of 0. The blue indicatoris therefore not normally displayed.
Fast Color Selection button
Opens a dialog that allows you to select a color quickly for all channels of a multichannel image.The following options can be set:
▪ No Color: All channels are displayed without a pseudo color
▪ Gray: All channels are displayed in monochrome (this applies in particular to multichannelimages that have been acquired using color cameras)
▪ BGR: Channel 1: blue, channel 2: green, channel 3: red, no color assigned to any otherchannels
▪ GRB: Channel 1: green, channel 2: red, channel 3: blue, no color assigned to any otherchannels
▪ RGB: Channel 1: red, channel 2: green, channel 3: blue, no color assigned to any otherchannels
▪ From LUT: Colors for all channels are selected using a reference look-up table. The LUT isdivided up into as many sections as there are channels, with the channel color being usedat the separation point. You can select the reference LUT using the Reference LUT... button
▪ User-defined: The colors defined by the user are restored
▪ Dye: The color of the dye used during the experiment is restored
Reuse button
Only visible if you have loaded an image in *.CZI image format. This is the only image formatthat is compatible with the Reuse function.
Reproduces the acquisition conditions for the image.
The function only works correctly if the system configuration at the time of acquisition is identicalto the system configuration at the time when you execute the function.
Removing components (e.g. filter cubes, LEDs, cameras, etc.) can result in an experiment be‐ing created incorrectly. It is therefore essential that you check after executing the Reuse func‐tion whether the configuration of the experiment is in line with your expectations.
InformationClicking on the Reuse button overwrites the current experiment without a prompt and marks itas having been modified. This can be seen from the appearance of an asterisk after the filename. If you want to keep the experiment in its previous form, you must save the modified ex‐periment with a new file name under Experiment Manager | Options | Save As.
If you acquire images and save them in *.CZI image format, the following acquisition conditionsare saved together with the image:
▪ Information on the type and status of your imaging system
▪ Time of acquisition
7.15.1.5
ManualImage views
General view controls
180 Printed 06/2012

▪ Parameters set in the software.
Display tab
On the Display tab you can adjust your image display to your screen. This function is particular‐ly important if you want to display images with a very high dynamic range on the screen.
Channel Selection
Here you can determine the channel of a multichannel image for which you want to adjust thedisplay on the screen. To select all channels, click on the All button.To select a certain channel,click on the corresponding color field. Hovering the mouse pointer over a color field displays therelevant channel name.
If the image consists of more than 29 channels, a scrollbar will be displayed which you can useto switch to the desired channel.
Please note: In the case of images containing only one channel the selection fields are hidden.
Spline Mode button
Clicking on this button allows you to add up to 8 points to the display characteristic curve. Youcan then bend the curve around these points. To do this, click on the desired section of the dis‐play curve and move it as required. Clicking on the display curve again adds another point. Youcan delete points by moving them along the display curve until they lie on top of another point.In this way, even in difficult situations you can adjust the display curve so that all important im‐age regions can be displayed well.
Auto checkbox
The image display is adjusted automatically for each image. This is particularly useful in thecase of a live image, in Continuous mode or if you play back a time lapse image that containschanging brightnesses. Certain settings are no longer available in this mode.
Min/Max button
Adjusts the display characteristic curve so that the darkest pixel is black and the brightest pixelis white in the display.
BestFit button
Adjusts the display characteristic curve so that 0.1% of the darkest pixels contained in the im‐age are black and 0.1% of the brightest pixels are white in the display.
Spin boxes/input fields
Only visible if the Show All mode is activated.
In the two spin boxes/input fields to the right of the BestFit button you can adjust the black/whitevalues from 0.1% to values from 0 to 90% according to your requirements.
Select Dimension dropdown list
Only visible if the Show All mode is activated.
If your images contain time series, Z-stacks or both, here you can select the aspect of an imagefor which the display settings should be applied. The following options are available:
7.15.2
Image views
General view controls Manual
Carl Zeiss Microscopy GmbH 181

Adjusts the display for the current image and keeps this setting for all other time points or Z-planes.
Collects the intensity values from all time points and adjusts the display according to the bright‐est and darkest pixels within the entire time series.
Collects the intensity values from all Z-planes and adjusts the display according to the brightestand darkest pixels within the entire Z-stack.
Collects the intensity values from all Z-planes and time points and adjusts the display accordingto the brightest and darkest pixels within the entire Z+T series.
Please note: With all settings other than Current there may be several seconds of calculationtime until the setting is applied, depending on the number of time points/Z-planes.
button
Here you can copy display settings to the clipboard, insert them into other images from there orsave and reload settings. This allows you to apply identical display settings to several images inorder to produce comparable display conditions.
Reset button
Restores the default settings.
Display Histogram section
The display histogram shows the brightness distribution of the pixels that are present from allchannels simultaneously. The Y axis represents the relative frequency and the X axis indicatesthe brightness. A curve showing the corresponding distribution, the so-called display character‐istic curve, is displayed for each channel.
If you want to adjust an individual channel, activate this via the relevant color field under Chan‐nel Selection. Alternatively you can also click on the corresponding distribution curve directly inthe histogram.
Each channel has a display characteristic curve. Using the display characteristic curve you canset the limit for the black value (left) and the limit for the white value (right). This allows you toinfluence the contrast in the image. Move the mouse pointer over the corresponding adjustmenthandles at the bottom edge of the display histogram or to the small rectangles on the displaycharacteristic curve. Hold down the left mouse button and move the adjustment handles or rec‐tangles as required.
The curvature of the display characteristic curve influences the gamma value. To change thecurvature, move the mouse pointer to the second or fourth small rectangle on the display char‐acteristic curve. Hold down the left mouse button and move the rectangles up or down. The set‐ting is used immediately for the display. Using the middle rectangle you can move the wholedisplay curve. This changes the brightness of the image.
The following functions are only visible if the Show All mode is activated:
Black spin box/input field
Displays the gray value currently set up to which all pixels are shown as black. You can alsoenter the value that you want directly here.
Current
All T
All Z
All T+Z
7.15.2.1
Display char‐acteristic
curve
ManualImage views
General view controls
182 Printed 06/2012

Gamma spin box/input field
Displays the gamma value currently set. You can also enter the value that you want here.
0.45 button
Sets a gamma value of 0.45. This is the recommended setting for most color images.
1.0 button
Sets a linear display characteristic curve with a gamma value of 1.0.
White spin box/input field
Displays the gray value currently set from which all pixels are shown as white. You can also en‐ter the value that you want directly here.
Player tab
Only visible if the Show All mode is activated.
Using the functions on this tab you can play back multidimensional images. The functions large‐ly correspond to the functions for playing back films.
Player buttons
The following control elements are available:
Plays back the image series forwards. The dimensions are played back one after the other inthe sequence specified.
Stops the play-back of the image series.
Plays back the image series backwards.
Plays back the image series forwards and backwards alternately.
Jumps to the start of the image series.
Jumps to the end of the image series.
7.15.3
Image views
General view controls Manual
Carl Zeiss Microscopy GmbH 183

Speed slider
Here you can enter the speed at which an image series is played back. The set speed is dis‐played in images/second in the spin box/input field. You can also enter the desired speed direct‐ly in the spin box/input field. The maximum play-back speed is 25 images/second.
Follow Acquisition checkbox
Activated: Always displays the last acquired image during an ongoing acquisition procedure, aswell as the slider for the corresponding dimension.
Dimensions slider
A slider is displayed here for each of the dimensions available in a multidimensional image. Thefollowing sliders are possible:
▪ Z-Position
▪ Time
▪ Scene
▪ Block
Dimensions are only shown if they are also available in the image. If there are several dimen‐sions, you can determine by means of the associated checkboxes whether you want these to betaken into account during the play-back or whether the current position should be retained.Each slider offers as many steps as there are individual positions in the specified dimension.
The sliders each have two adjustment handles, which can be used to define the start and endpoint. The image series is played back within these points. You can define here which rangeyou want to play back from a longer time series. When you move the adjustment handle, thecorresponding image is also displayed.
A third adjustment handle indicates the current position and cannot be controlled directly.
Graphics tab
On the Graphics tab you can select various tools and use these to draw graphic elements intoyour images. You can also obtain an overview here of the graphic elements that you are usingin your image.
See also
2 Modify Tools dialog window [➙ p.188]
Tool Bar section
A selection of standard tools which you work with on a regular basis are available to you here.You can adapt this tool bar to your requirements. Other tools can be found in the Graphicsmenu | Tool Group.
Selection
Use this to select the graphic elements in the image area. If you are currently in another mode,you can switch back to the Selection mode using this button.
7.15.4
7.15.4.1
ManualImage views
General view controls
184 Printed 06/2012

Stamp
Use this to create an identical copy of the last graphic element drawn in. To exit this mode, ei‐ther switch back to the Selection mode or press the ESC key.
Selection Region
Use this to draw a rectangular selection region into the image.
Text
Use this to enter text into the image.
Scale Bar
Inserts a scale bar into the bottom right corner of the image.
Arrow
Use this to draw in an arrow.
Rectangle
Use this to draw in a rectangle that is always parallel to the edges of the image.
Circle
Use this to draw in a circle.
Contour (Spline)
Use this to draw in a freely selectable contour. Close this contour by right-clicking. Corners arealways rounded with this tool.
Keep checkbox
Activated: Keeps the current tool active. This allows you to draw in a number of the samegraphic elements one after the other.
Color checkbox
Only visible if the Show All mode is activated.
Activated: Uses a new color for each graphic element drawn in.
Pixel-Precise checkbox
Only visible if the Show All mode is activated.
Activated: Draws in the graphic elements with pixel precision. If this option is not active, thegraphic elements are drawn into the graphics plane independently of the actual pixel resolution.
Modify button
Opens the Modify Tools [➙ p.188] dialog window.
Planes section
Only visible if the Show All mode is activated.
Here you can specify which planes are active and visible in the image. To open the shortcutmenu, click on the Planes button.
7.15.4.2
Image views
General view controls Manual
Carl Zeiss Microscopy GmbH 185

Active Plane menu item
Here you can specify which graphics plane is active in the image. The other planes are visiblebut blocked.
Activated: Sets the active plane automatically. This is the default setting.
Activated: Sets the Selection plane as the active plane. This plane contains graphic elementssuch as Selection Area, Grid, etc.
Activated: Sets the Annotation/Measurement plane as the active plane. This plane containsgraphic elements such as Annotations, Measurement Tools, etc.
Show/Hide Plane menu item
Here you can specify which plane is visible in the image. The other planes are not visible.
Activated: Displays the Selection plane in the image.
Activated: Displays the Annotation/Measurement plane in the image.
Graphic Elements list
Here you will see the graphic elements that you are using in your image. You can also controlthe behavior of the graphic elements here, e.g. block or hide them. You can format each graphicelement as you wish.
To format graphic elements, double-click on the list entry for the graphic element in question orcall up the corresponding shortcut menu directly at the graphic element in the image. Select theFormat entry. The Format Graphic Element [➙ p.189] dialog window opens. There you can for‐mat the graphic element in question according to your requirements.
InformationIn the list you will only see the graphic elements relating to the active graphics plane. Tochange the active graphics plane, click on the Planes button. This button is only visible inShow All mode. Select the graphics plane that you want to display via the Active Plane short‐cut menu.
The columns of the list contain the following entries:
Shows or hides a graphic element.
Locks a graphic element to prevent changes being made.
Displays the icon for the tool type. To format a graphic element, double-click on the icon. TheFormat Graphic Elements dialog then opens.
Only visible if the Show All mode is activated.
Displays the ID for the graphic element. To do this, activate the checkbox at the correspondinglist entry.
Only visible if the Show All mode is activated.
Displays annotations for a graphic element. To do this, activate the checkbox at the correspond‐ing list entry.
Only visible if the Show All mode is activated.
Displays measurement data for a graphic element. To do this, activate the checkbox at the cor‐responding list entry.
Automatic
Selection
Annotation/Measurement
Selection
Annotation/Measurement7.15.4.3
Eye icon
Lock
Type
ID
A
M
ManualImage views
General view controls
186 Printed 06/2012

Displays the name of the graphic element. To change the name, double-click in the Name field.Then enter the text of your choice.
InformationIf you want to change a setting for all the graphic elements in the list, click in the title bar of therelevant column.
Diskette button
Saves the selected graphic element.
Folder button
Loads an existing graphic element.
Delete button
Deletes the selected graphic element.
Dimensions section
Only visible if the Show All mode is activated.
The coordinates and dimensions of the selected graphic element (standard unit = pixels) aredisplayed in the spin boxes/input fields:
X spin box/input field
Displays the X coordinate of the center point of a graphic element.
Y spin box/input field
Displays the Y coordinate of the center point of a graphic element.
W spin box/input field
Displays the width of a graphic element.
H spin box/input field
Displays the height of a graphic element.
Angle
Displays the rotation angle of a graphic element. In the case of the Angle graphic element themeasured angle is displayed here.
Unit checkbox
Activated: The unit of the coordinates changes to µm.
Name
7.15.4.4
Image views
General view controls Manual
Carl Zeiss Microscopy GmbH 187
Graphics dialog window
Modify Tools dialog window
Here you can select up to 7 tools or frequently used annotations that you want to appear in thetool bar. You can therefore add the tools that you use frequently.
User Tool Bar list
The tools or annotations that you select from the Tools list or the Frequently Used Annotationslist appear here. These tools or annotations will then also appear below the tool bar on theGraphics tab.
Search input field
Here you can search for certain tools or annotations. Enter the name or initial letters of the toolor annotation that you are looking for. The search results will appear in the Tools list or the An‐notations list.
Tools list
Here you can select the tools that you use frequently and want to add to the tool bar.
Frequently Used Annotations list
Here you can select the annotations that you use frequently and want to add to the tool bar.
Last Used
This list contains the tools that you have added to the tool bar. Only the first seven tools appearin the tool bar. You can change the order of the tools using the arrow buttons at the bottom ofthe list. To delete a selected tool, click on the Wastepaper Bin button.
Search
To find a certain tool, enter a search text into the input field. Only those tools that contain thistext are then displayed in the Tools list.
Tools
This list contains all the tools that are available in ZEN. Use the scroll bar if the tool you want isnot displayed, or use the text search.
InformationTo ensure that you see all tools, the text search must be empty.
To add a tool to the Last Used list, click on the button. If you want to reset the defaultformatting of a tool back to its original setting, click on the Reset Selected button. You can alsoreset the formats of all tools using the Restore All button.
7.15.4.5
ManualImage views
General view controls
188 Printed 06/2012

Frequently Used Annotations
Here you can make a selection from 6 preconfigured, frequently used annotations. If you wantto reset the default formatting of the frequently used annotations back to the original setting,click on the Reset Annotations button.
Planes
Graphic elements are organized in planes. Depending on the plane type, graphic elements mayhave different properties. The following plane types are possible:
▪ Annotation/Measurement: most graphic elements belong to this plane type.
▪ Selection: special planes that contain only selection regions and other short-term selectionelements. Changes to the selection plane are not saved when the image is closed.
▪ Acquisition/Bleaching: graphic elements in this plane were used during acquisition, e.g. inbleaching experiments. These graphic elements cannot be changed.
In the Planes dropdown list, under Active Plane, you can select which plane is active in the im‐age. Other planes are accordingly displayed as inactive. The Automatic command ensures thatplanes are activated automatically as soon as a corresponding graphic element is selected. Thisis the default setting.
Using the Show/Hide Planes setting, you can specify which planes you want to be displayed. Ifyou deselect a plane, the corresponding graphic elements are not displayed.
Format Graphic Element dialog window
Here you can format the relevant graphic element. You can adjust the line thickness, text oropacity.
Zoom with the Image checkbox
Activated: Relates the line thickness and font size to the pixels in the image.
Line section
Color field
Here you can change the line color. To change the line color, click on the color field. The ColorSelection [➙ p.193] dialog window opens.
Line Thickness
Here you can change the line thickness. Enter the desired value for the line thickness (in pixels)in the spin box/input field to the right of the color field.
Line Style dropdown list
Here you can change the style of the line.
The line is not displayed.
The line is an unbroken line.
The line is made up of dashes.
None
Continuous
Dashed
Image views
General view controls Manual
Carl Zeiss Microscopy GmbH 189

The line is made up of dots.
Line Start/Line End dropdown list
Here you can change the style of the start/end of the line. The following styles are available:
▪ Flat
▪ Small bar
▪ Large bar
▪ Open arrow
▪ Closed arrow
Text section
Font button
Opens the Font Selection dialog window. Here you can change the font, font size, font color andcharacter style used for text.
To change the font, click on the Font dropdown list. Select the desired font from the list.
To change the font size, enter the desired font size (in points) using the slider or spin box/inputfield.
To change the font color, click on the color field to the right of the Font dropdown list. The ColorSelection [➙ p.193] dialog window opens.
To change the character style, click on the corresponding buttons. The following characterstyles are available:
▪ Bold
▪ Italic
▪ Underline
▪ Strikethrough
▪ Normal
▪ Uppercase
▪ Small Caps
Align Horizontally dropdown list
Here you can select the horizontal alignment of the text (Left, Center, Right).
Align Vertically dropdown list
Here you can select the vertical alignment of the text (Top, Center, Bottom).
Fill section
Here you can change the way in which closed graphic elements (including text) are filled.
Color field
Here you can change the fill color. To change the fill color, click on the color field. The ColorSelection [➙ p.193] dialog window opens.
Dotted
ManualImage views
General view controls
190 Printed 06/2012

Fill Style dropdown list
Here you can change the fill style.
Opacity section
Opacity slider
Enter the fill opacity using the slider or spin box/input field (values range from 0-100%).
Annotations section
Annotations dropdown list
Here you can select annotations that you want to assign to the graphic element. Annotationsare meta data such as the acquisition time or acquisition duration. For certain annotations youcan select additional settings, e.g. the unit of time, from the dropdown list to the right of theAnnotations dropdown list.
The most frequently used annotations are available here by default.
Adding additional annotations
1. Click on the last entry in the list (...).
⇨ The Select Meta Data dialog window opens.
2. Select an annotation that you want to add to the list from the Available Meta Data list.
3. Click on the Apply button.
⇨ The entry is adopted into the Annotations dropdown list.
Format Grid dialog window
Here you can define how you want the grid to be displayed in the graphics plane.
Mode radio button
Here you can select whether you want the grid to be anchored at the center or top left of theimage.
button
Loads a saved grid setting.
button
Saves the current grid setting.
Horizontal Lines checkbox
Activated: Displays horizontal lines in the grid.
Vertical Lines checkbox
Activated: Displays vertical lines in the grid.
Image views
General view controls Manual
Carl Zeiss Microscopy GmbH 191

Circles checkbox
Activated: Displays concentric circles in the grid.
Cross checkbox
Activated: Displays a cross in the grid.
Unit dropdown list
Here you can select the unit in which the distances of the lines and circles are indicated.
Synchronize checkbox
Activated: Automatically keeps the distances for horizontal and vertical lines the same.
Width slider
Enter the desired width for the grid distance using the slider or spin box/input field.
Height slider
Enter the desired height for the grid distance using the slider or spin box/input field.
Columns slider
Enter the desired number of grid columns using the slider or spin box/input field.
Rows slider
Enter the desired number of grid rows using the slider or spin box/input field.
Circles slider
Enter the desired number of circles using the slider or spin box/input field.
Grid, Cross, Circle Color Selection
Opens the Color Selection dialog window [➙ p.193].
Line Thickness input field
Enter the line thickness for Grid, Cross or Circle using the spin box/input field.
Line Style dropdown list
Here you can select the style of the line for Grid, Cross or Circle. You can select from the follow‐ing line styles:
▪ None
▪ Continuous
▪ Dashed
▪ Dotted
Set As Default button
Sets the current settings for the grid as the default settings.
ManualImage views
General view controls
192 Printed 06/2012

Reset button
Resets the default settings to their status on delivery.
Color Selection dialog window
Color Selection dialog window
Here you can select the desired color for the graphic element. In the bottom section of the dia‐log window you will see 2 buttons that offer you different methods for selecting colors. The se‐lected button is highlighted in blue. To change the method, click on the corresponding button.
Color button
Here you can select the desired color from 18 standard colors. The selected color is displayedin a color field above the Color button.
Custom button
Here you can define up to 16 RGB colors of your choice.
Tiles Advanced Setup ViewHere you can configure advanced settings for the acquisition of mosaic images. In the imagearea you can see the stage view [➙ p.193]. Additional settings and tools relating to tile regionsor positions can be found under specific control elements [➙ p.194].
See also
2 General view controls [➙ p.176]
Stage View
The image area shows the full travel range of the microscope stage, along with the currentstage position, the graphical display of sample carriers and your acquired mosaic images. Youcan control the stage view using the arrow icons at the edges of the image area. The view canbe enlarged, reduced or moved using the general control elements.
Navigator frame
The current stage position is shown as a tile outlined in blue, the Navigator frame. To move theframe, double-click on the position to which you want to move it.
The Navigator frame can also be used to control acquisition. If you click on one of the frame'sblue arrow icons, an image is acquired. The Navigator frame is moved one frame width in therelevant direction. You can create mosaic images of your sample easily in this way.
Positions
Positions are represented in the stage view by a plus symbol.
Tiles
Tiles are represented in the stage view by a red grid.
7.16
7.16.1
Image views
General view controls Manual
Carl Zeiss Microscopy GmbH 193

Tools window
Here you can obtain an overview of the position of your sample as well as of your mosaic defini‐tions, positions and position arrays.
Center at Stage Position button
Centers the view at the current stage position.
Preview Scan
To show the section in full, click on the button.
Delete Existing Preview Images checkbox
Activated: Deletes all existing preview images when the next preview is acquired.
Objective dropdown list
Here you can select an objective. To acquire an overview of all active mosaic images and posi‐tions, switch to an objective with a low magnification. Set the channel exposure time and startthe acquisition of the overview image.
Start Preview Scan button
Starts the preview scan to acquire the overview images.
View specific controls
Carrier tab
Here you can see a graphical preview of the sample carrier being used. Please note the follow‐ing features of the display:
▪ sample carriers that are filled with tile regions only are displayed in orange.
▪ sample carriers that are filled with positions only are displayed in yellow.
▪ sample carriers that are filled with tile regions and positions are displayed in a mixture oforange and yellow.
Tile Region Setup tab
Here you can select which setup you want to be used for the settings of the tile regions. Threesetups with different setting options are available:
Contour Setup
Here you can define the tile regions by means of the contour.
Contour section
The following tools are available:
Use this to select an element in the stage view.
Use this to draw in a rectangular tile region.
7.16.2
7.16.3
7.16.3.1
7.16.3.2
Selection
Rectangle
ManualImage views
Tiles Advanced Setup View
194 Printed 06/2012
Use this to draw in an elliptical tile region.
Use this to draw in a polygonal tile region.
Keep Tool checkbox
Activated: Keeps the selected tool active.
Anchor section
Only visible if the Show All mode is activated.
The anchor of the defined shape is at the top left.
The anchor of the defined shape is centered.
The anchor of the defined shape is at the bottom right.
Predefined Setup
Here you can define the tile regions by means of the number or size.
Tools section
Use this to select an element in the stage view.
Adds the current tile definition in the image area.
Keep Tool checkbox
Activated: Keeps the selected tool active.
Contour section
Only visible if the Show All mode is activated.
Defines the outline of the tile region that you are adding. To add a rectangular tile region, clickon the Rectangle button. To add a circular tile region, click on the Circle button.
Tiles button
Selects the number of tile regions as a reference for the size of the tile region. Enter the numberof tile regions in the X/Y spin boxes/input fields. If you are adding a circular tile region, enter thenumber of tile regions in the Diameter spin box/input field.
Size button
Selects the size as a reference for the size of the tile region. Enter the size of the tiles in the X/Yspin boxes/input fields. If you are adding a circular tile region, enter the diameter of the tile re‐gions in the Diameter spin box/input field.
button
Adds the tile region to the Tile Regions list and activates it for acquisition.
Anchor section
Only visible if the Show All mode is activated.
Ellipse
Polygon
Anchor TopLeft
Anchor Cen‐tered
Anchor Bot‐tom Right
Selection
Add Tile Re‐gion
Image views
Tiles Advanced Setup View Manual
Carl Zeiss Microscopy GmbH 195

The anchor of the defined shape is at the top left.
The anchor of the defined shape is centered.
The anchor of the defined shape is at the bottom right.
Carrier Setup
Here you can define the tile regions automatically by means of the fill factor of the sample carri‐er.
Create button
Only active if you have selected a container on the Carrier tab or in the stage view.
Automatically creates the tile regions with the set fill factor in the selected container of the sam‐ple carrier.
Remove button
Removes all tile regions in the selected container.
Fill Factor spin box/input field
Here you can enter the fill factor used to fill the selected container.
Tile Region Properties tab
Here you can adjust the properties of the selected tile region. The settings are only active if youhave selected a tile region.
Use For Acquisition checkbox
Activated: Uses the selected tile region for acquisition.
Name input field
Here you can enter a name for the selected tile region.
The following functions are only visible if the Show All mode is activated:
Size spin boxes/input fields
Here you can enter the size of the tile region in the X/Y/Z dimension.
Tiles spin box/input field
Here you can enter the number of tiles in the X/Y dimension.
Anchor Position spin box/input field
Here you can enter the anchor position of the selected tile region.
Set Current Z button
Sets the Z dimension at the current Z position of the stage.
Anchor TopLeft
Anchor Cen‐tered
Anchor Bot‐tom Right
7.16.3.3
ManualImage views
Tiles Advanced Setup View
196 Printed 06/2012

Category dropdown list
Here you can select various categories of tile regions. You can create, edit, load or delete yourown categories here.
Position Setup tab
Here you can select which setup you want to be used for the settings of the positions. Threesetups with different setting options are available:
Location Setup
Here you can define the positions by means of the location. You can add various positions inthe stage view using the mouse.
Tools section
Use this to select an element in the stage view.
Use this to add positions in the stage view.
Keep Tool checkbox
Activated: Keeps the selected tool active.
X/Y Position display fields
Display the current stage position.
button
Adds a new position at the current stage position.
Array Setup
Here you can define the positions by means of position arrays. You can add various contoursfor position arrays in the stage view.
InformationPosition arrays are groups made up of a number of individual positions. Typically, position ar‐rays contain several hundred individual positions. They make your work easier if you work withregular or evenly distributed samples.
Array Contour section
The following tools are available:
Use this to select an element in the stage view.
Use this to draw in a rectangular position array.
Use this to draw in an elliptical position array.
Keep Tool checkbox
Activated: Keeps the selected tool active.
7.16.3.4
Selection
Cross Hairs
Selection
Rectangle
Ellipse
Image views
Tiles Advanced Setup View Manual
Carl Zeiss Microscopy GmbH 197

Distribution Bias section
Only visible if the Show All mode is activated.
Enter the distribution of the positions within the position array using the slider.
Random checkbox
Activated: Distributes the positions randomly within the position array.
Distribute By section
Enter the number of positions within a position array in the spin box/input field under the Num‐ber button.
Enter the percentage share of positions within a position array in the spin box/input field underthe Percent button.
Carrier Setup
Here you can define the positions automatically by means of the relevant sample carrier. To dothis, select a sample carrier via the shortcut menu or on the Carrier tab.
Create button
Only active if you have selected a container on the Carrier tab or in the stage view.
Automatically creates the positions in the selected container of the sample carrier. Enter the dis‐tribution and number of positions in the Distribution Bias and Distribute By sections.
Remove button
Removes all positions in the selected container.
Distribution Bias section
Only visible if the Show All mode is activated.
Enter the distribution of the positions within the container using the slider.
Random checkbox
Activated: Distributes the positions randomly within the container.
Distribute By section
Enter the number of positions within a container in the spin box/input field under the Numberbutton.
Enter the percentage share of positions within a container in the spin box/input field under thePercent button.
Position Properties tab
Here you can adjust the properties of the selected positions. The settings are only active if youhave selected a position.
Use For Acquisition checkbox
Activated: Uses the selected position for acquisition.
Number but‐ton
Percent but‐ton
Number but‐ton
Percent but‐ton
7.16.3.5
ManualImage views
Tiles Advanced Setup View
198 Printed 06/2012

Deactivated: Deletes the selected position from the experiment
Name input field
Here you can enter a name for the selected position.
The following functions are only visible if the Show All mode is activated:
X/Y/Z spin boxes/input fields
Here you can enter the position of the selected position in the X/Y/Z dimension.
Set Current Z button
Sets the Z dimension at the current Z position of the stage.
Category dropdown list
Here you can select various categories of positions. You can create, edit, load or delete yourown categories here.
Image views
Tiles Advanced Setup View Manual
Carl Zeiss Microscopy GmbH 199

View mode
Full Screen modeIn this mode the image will be displayed in the full monitor size.
To start the full screen mode, position the cursor on the image area and open the context menuvia right mouse click. Click on Full Screen. You can also press F11 or click on menu Window |Full screen as an alternative.
Toolbar
In the toolbar at the bottom you find several buttons for general and image specific functions,like zoom function (Zoom button) or image informations (Info button). When you open a multidi‐mensional image, you find buttons for specific functions, etc. Z-Stack, Channels. To open thefunctions, click on the button.
Previous button
Displays the previous document in full screen mode. You can page step by step backwardsthrough all open documents.
Next button
Displays the next document in full screen mode. You can page step by step forwards through allopen documents.
Exit Fullscr. button
Closes the full screen mode.
Exposé modeIn this mode all open documents will be display in an overview.
When you click on an image in the overview the Exposé mode will be closed and the image willbe displayed in standard view.
Back button
Jumps back to the standard image view.
Close button
Closes the den Exposé mode.
Splitter modeIn this mode you can generate a multi image of one or several images in order to comparethem. Drag an image of the Images and Documents gallery in Right Tool Area and drop it in asplitter position. The standard setting for the splitter are 2 columns and 1 row. You can modifythese setting in the Split-View.
Proceed similarly with further images to be displayed in the multi image. The same image canbe dropped several times in the splitter view, i.e. to compare different image scenes.
The multi image can be saved as CZSPL (Zeiss Multi Image Files) image type in the menu File |Save As. The stored multi image is no image document, but rather a reference of the imagesdisplayed in the splitter mode.
8
8.1
8.2
8.3
ManualView mode
Full Screen mode
200 Printed 06/2012

Use the Split Display tab for further adjustments (i.e. arrangement) of the splitter mode. Hereyou can create a single image of the multi image to be saved as CZI image type.
Split Display tab
Arrangement section
Columns Spinbox-Inputfield
Use this to adjust the number of columns displayed in splitter mode.
Rows Spinbox-Inputfield
Use this to adjust the number of rows displayed in splitter mode.
Synchronize Dimensions checkbox
Activated: The settings of the Dimensions tab (i.e. Zoom) will be applied synchronously to allimages in splitter mode.
Synchronize Display checkbox
Activated: The settings of the Display tab (i.e. Gamma) will be applied synchronously to all im‐ages in splitter mode.
Show Position Data checkbox
Activated: The cursor changes to an arrow symbol and a cross marker in the image. The X/Ycoordinates with scaling unit and gray value of the current cursor position are displayed belowthe image. Furthermore additional information is displayed for multidimensional images: i.e. the gray valuefor each channel of a multichannel image, the time of each time point of a time lapse image, thefocus position of each Z position of a Z-Stack.
New Image From dropdown list
Select the type of splitter image to be generated.
Selection Description
Current View A 2-dimensional splitter image of the currentdisplay will be generated by the Create button.
Time Series A time series of all time lapse images in thesplitter will be generated by the Create button.
Z-Stack A Z-stack of all Z-stack images in the splitterwill be generated by the Create button.
Create button
Generates an single image of the multi image displayed in splitter mode with the correspondingsettings. The image can be saved in the CZI format in File | Save as menu.
Interpolation for zoomed images dropdown list
Here you can select how you want interpolation to be performed if a pixel is calculated from sev‐eral individual pixels.
8.3.1
View mode
Splitter mode Manual
Carl Zeiss Microscopy GmbH 201

Selection Description
Nearest Neighbor The output pixel is given the gray value of theinput pixel that is closest to it.
Linear The output pixel is given the gray value result‐ing from the linear combination of the inputpixels closest to it.
Cubic The output pixel is given the gray value result‐ing from a polynomial function of the input pix‐els closest to it.
Spacing Spinbox/ Inputfield
Here you can adapt the distance between the single images to values 0 up to 20. The distancewill be displayed in black color and appears, if the splitter image is generated by the Create but‐ton.
ManualView mode
Splitter mode
202 Printed 06/2012

Reporting views
Report previewHere you will see a preview of your report. You can select other templates here or insert imagesor tables into the report using drag & drop. To insert images or tables, the report template mustcontain corresponding placeholders to accommodate them.
InformationTo display several images in one image placeholder, select the desired images in the list ofopen images and documents (right tool area). Hold down the Ctrl or Shift key and the leftmouse button and drag the images over the placeholder with the mouse. As soon as you re‐lease the left mouse button, the images will appear in the placeholder.
It is not possible to display several tables in a single table placeholder.
Finalize button
Creates the report and closes the report preview.
Discard button
Closes the report preview.
Navigation area
The Navigation area to the left of the preview window displays all pages of the report as thumb‐nails. This allows you to move easily between the pages.
button
Displays the next page.
button
Displays the previous page.
InformationYou can make changes to the report while the report preview is open. Once the report hasbeen created this is no longer possible.
See also
2 Report tool [➙ p.126]
Report viewThe report that has been created is displayed here.
Navigation area
The Navigation area displays all pages of the report as thumbnails. This allows you to moveeasily between the pages.
button
Displays the previous page.
9
9.1
9.2
Reporting viewsReport preview Manual
Carl Zeiss Microscopy GmbH 203

button
Displays the next page.
InformationYou can no longer make changes to the report in the report view. This is only possible in thereport preview.
See also
2 Report tool [➙ p.126]
ManualReporting views
Report view
204 Printed 06/2012
File BrowserHere you see an overview of all image or data files stored on your computer. In the left columnyou see a file structure which is associated with the common image or data containing folders inyour file system (Images and documents). In the right area you see the preview to the selectedfolder.
InformationThe ZEN folders contain automatically the Auto Save folder. Here you see all auto-saved im‐ages from ZEN. Set Auto Save path in Tools | Options | Saving.
Gallery View
Here you see all files of a folder as small preview images (thumbnails). Use Tool tab to adjustpreview images size, sorting, etc..
Info View
Here you see a detailed list with all data the selected image contains. Find a detailed descrip‐tion of all possible data under Info View [➙ p.143].
Table View
Here you see all files of a folder well-arranged in a table. This view is perfect for folders whichcontain many files.
Tools tabIcon size
Set size of thumbnail images here.
Text Rows
Select entries which you want to have displayed as additional text row under the thumbnail im‐age.
Record
Switch from file to file in the selected folder by using the slider.
Sorting
Arrange your files to certain properties (i.e. file name, type, etc.)
Folders
Manage selected file folders here (i.e. new folder, rename folder, etc.).
Selection
Manage selected files here (i.e. copy file, or delete file).
10
10.1
File Browser
Tools tab Manual
Carl Zeiss Microscopy GmbH 205

Image processing functions
Deconvolution group
Deconvolution (defaults)
This method allows you to use 4 different algorithms for deconvolution.
Parameters
Simple, very fast (Nearest Neighbor) button
Executes the fast Nearest Neighbor method using default parameters. To use it, click on thisbutton and then on Apply.
Better, fast (Regularized Inverse Filter) button
Executes the Regularized Inverse Filter algorithm for image enhancement. To use it, click onthis button and then on Apply.
Good, medium speed (Fast Iterative) button
Executes the Fast Iterative restoration method. To use it, click on this button and then on Apply.
Excellent, slow (Constrained Iterative) button
Executes the Constrained Iterative quantitative restoration method. To use it, click on this buttonand then on Apply.
Deconvolution (adjustable)
This method allows you to use and individually configure 4 different algorithms for deconvolu‐tion.
See also
2 Deconvolution (adjustable) parameters [➙ p.206]
Deconvolution (adjustable) parameters
Two tabs are available for detailed configuration:
On the Deconvolution tab you can select the desired algorithm and define the precise settingsfor it.
On the PSF Settings tab you can see and change all key parameters for generating a theoreti‐cally calculated Point Spread Function ("PSF").
Deconvolution tab
Algorithm dropdown list
Here you can select the algorithm that you want to use. The following algorithms are available:
▪ Nearest Neighbor
▪ Regularized Inverse Filter
▪ Fast Iterative
11
11.1
11.1.1
11.1.2
11.1.3
11.1.3.1
ManualImage processing functions
Deconvolution group
206 Printed 06/2012

▪ Constrained Iterative
InformationExpert knowledge is required for some of the settings. If you are in doubt, leave the settingsunchanged.
Channel-Specific Settings checkbox
Activated: Applies the settings on a channel-specific basis. This allows you to set parameters ina targeted way for each channel. You will see a separate, colored tab for each of the channels.
Deactivated: Applies the settings to all channels of a multichannel image.
Normalization section
Normalization dropdown list
Here you can specify how the data of the resulting image are handled:
Sets negative values to 0 (black).
If the values exceed the maximum possible gray value of 65636 when the calculation is per‐formed, they are limited to 65636 (pixel is 100% white).
Normalizes the output image automatically.
In this case the lowest value is 0 and the highest value is the maximum possible gray value inthe image (gray value of 65636). The maximum available gray value range is always utilizedfully in the resulting image.
Adjust Strength section
Adjust Strength checkbox
If you have selected the Nearest Neighbor algorithm, the checkbox is always activated.
InformationIf you have selected the Fast Iterative algorithm, the checkbox is also always activated. Usingthe slider you can then enter the number of iterations used directly, as, in contrast to the othermethods, no regularization is performed.
Activated: Enter the degree of restoration using the slider.
To achieve strong contrast enhancement, move the slider towards Strong.
To achieve less contrast enhancement, move the slider towards Weak.
If the setting is too strong, image noise may be intensified and other artifacts, such as "ringing",may appear.
Deactivated: Determines the restoration strength for optimum image quality automatically.
The restoration strength is inversely proportional to the strength of so-called regularization. Thisis determined automatically with the help of Generalized Cross Validation (GCV).
Clip
Automatic
Image processing functions
Deconvolution group Manual
Carl Zeiss Microscopy GmbH 207

Z-Stack Correction section
To show the section in full, click on the button.
Lamp Flicker checkbox
Activated: Analyzes the total brightness of each Z-plane. In the event of non-constant deviationsin the total brightness between neighboring planes, a compensation factor is taken into account.
Activate this function if you have acquired your images using an old fluorescent lamp that exhib‐its strong fluctuations in brightness.
Bleaching Correction checkbox
Activated: Corrects bleaching of the sample during acquisition of the Z-stack.
This function should only be activated for widefield images. Use it if your sample undergoesstrong bleaching during acquisition.
Background Correction checkbox
Activated: Analyzes the background component in the image and removes it before the DCVcalculation.
This can prevent background noise being intensified during DCV.
Advanced Settings section
Only visible if the Show All mode is activated.
This section is only visible if you have selected the Inverse Filter, Iterative (Fast) or Iterativealgorithm.
To show the section in full, click on the button.
Depending on which algorithm you have selected, different advanced setting options are availa‐ble. The relevant settings are described in the following sections for each algorithm:
Advanced settings for Inverse Filter algorithm
Regularization
Here you can select which frequencies in the image are taken into account during regulariza‐tion:
Regularization based on G-difference, modeled on Tikhonov, but accelerated.
Regularization based on Good's roughness. Under certain circumstances, more details are ex‐tracted from noisy data. May be better suited to the processing of confocal data sets.
Advanced settings for Fast Iterative algorithm
Likelihood
Here you can decide which likelihood calculation you want to work with:
The calculation according to Meinel works with one fold per iteration and converges significantlyfaster, normally in 4-5 iterations. This method can also produce artifacts, however.
Zero Order
First Order
Poisson (Mei‐nel)
ManualImage processing functions
Deconvolution group
208 Printed 06/2012

The calculation according to Richardson-Lucy, on the other hand, normally requires hundreds ofiterations and therefore takes considerably longer. This method is, however, somewhat more ro‐bust.
Regularization
For the Poisson (Meinel) calculation it is also possible to perform zero order (G-difference) regu‐larization here as an option. This means, however, that the calculation will take considerablylonger and the main advantage of the greater speed of Meinel is lost.
Optimization
If you select this option, an attempt is made to determine the trend of the iterations in advanceand extrapolate this to the entire calculation. This can significantly speed up the calculation.
First Estimate
The input image is used for the first estimate of the target structure (default).
The result of the last calculation is used to estimate the next calculation. This can speed up acalculation that is repeated using slightly different parameters.
No estimate is made. This is the most rigid application of deconvolution, but can take a longtime.
Maximum Number of Iterations
Here you can indicate the maximum permitted number of iterations that you want. In the case ofRichardson-Lucy, you should allow significantly more iterations here.
Quality Threshold
Defines the quality level at which you want the calculation to be stopped. The percentage de‐scribes the difference in enhancement between the last and next-to-last iteration compared withthe greatest difference since the start of the calculation. 1% is the default value. Lowering thiscan bring about small improvements in quality.
Advanced settings for Iterative algorithm
Likelihood
Here you can decide which likelihood calculation you want to work with:
▪ Calculation according to Poisson
▪ Calculation according to Gauss
Regularization
Here you can enter which frequencies in the image are taken into account during regularization:
Regularization based on G-difference, modeled on Tikhonov, but accelerated;
Regularization based on Good's roughness. Under certain circumstances, more details are ex‐tracted from noisy data. This regularization can sometimes produce better results for the pro‐cessing of confocal data sets;
Regularization according to Tikhonov-Miller. Here higher frequencies are penalized more thanin the case of Good's roughness.
Poisson (Ri‐chardson-Lu‐
cy)
NumericalGradient
Input Image
Last OutputImage
Average ofInput Image
Zero Order
First Order
Second Order
Image processing functions
Deconvolution group Manual
Carl Zeiss Microscopy GmbH 209

Optimization
Here an attempt is made to optimize the iterations analytically. This option is usually faster butmay also be somewhat less precise.
Searches rigorously and comprehensively for the minimum. It is therefore more robust, but thecalculation takes longer.
First Estimate
The input image is used for the first estimate of the target structure (default).
The result of the last calculation is used to estimate the next calculation. This can speed up acalculation that is repeated using slightly different parameters.
No estimate is made for the next iteration. This is the most rigid application of deconvolution,but can take a long time.
Maximum Number of Iterations
Here you can indicate the maximum permitted number of iterations that you want.
Quality Threshold
Defines the quality level at which you want the calculation to be stopped. The percentage de‐scribes the difference in enhancement between the last and next-to-last iteration compared withthe greatest difference since the start of the calculation. 1% is the default value. Lowering thiscan bring about small improvements in quality.
Diagnosis section
Only visible if the Show All mode is activated.
This section is only visible if you have selected the Fast Iterative or Iterative algorithm.
To show the section in full, click on the button.
The course of the calculation is displayed here in a graphical display. Various parameters areshown and the aim of the calculation is to minimize these. This display allows you to observedirectly how the iterative method affects the available data.
PSF Settings tab
All key parameters for generating a theoretically calculated Point Spread Function ("PSF") aredisplayed here.
InformationOrdinarily, images that have been acquired using ZEN (of the *.czi type) automatically containall microscope parameters, meaning that you do not have to configure any settings on thispage. Most parameters are therefore grayed out in the display. It is possible, however, that asa result of an incorrect microscope configuration values may not be present or may be incor‐rect. You can change these here. The correction of spherical aberration can also be set here.
Analytical(Newton
Raphson)Line Search
Input Image
Last OutputImage
Average ofInput Image
11.1.3.2
ManualImage processing functions
Deconvolution group
210 Printed 06/2012
Microscope Parameters section
The most important microscope parameters for PSF generation that are not channel-specificare displayed in this section.
Microscope dropdown list
Displays which type of microscope has been used. There are two options: conventional micro‐scope (also known as a widefield microscope) and confocal microscope, for which the additionalpinhole diameter parameter applies.
NA Obj. input field
Displays the numerical aperture of the objective.
Immersion input field
Displays the refractive index of the immersion medium. Please note that this can never besmaller than the numerical aperture of the objective. You can make a selection from typical im‐mersion media in the dropdown list next to the input field.
Lateral Scaling input field
Displays the geometric scaling in the X/Y direction.
Axial Scaling input field
Displays the geometric scaling in the Z direction.
Change button
To change the input fields that are normally grayed out, click on the Change button. The inputfields and dropdown lists are now active.
The text on the button changes to Reset. To restore the original values saved in the image, clickon the Reset button.
InformationIf you enter incorrect values, this can lead to incorrect calculations. If the values here are obvi‐ously wrong or values are missing, check the configuration of your microscope system.
Advanced Settings section
Only visible if the Show All mode is activated.
To show the section in full, click on the button.
Phase Ring dropdown list
If you have acquired a fluorescence image using a phase contrast objective, the phase ringpresent in the objective is entered here. This setting has significant effects on the theoreticalPoint Spread Function ("PSF").
Image processing functions
Deconvolution group Manual
Carl Zeiss Microscopy GmbH 211
Origin dropdown list
There are two models for calculating the PSF:
The wave vectors of the light are interpreted as electrical field = intensity and simply added.This method is fast and is sufficient in most cases (default setting).
The wave vectors are added geometrically. However, the calculation takes considerably longer.
Z-Stack text field
This field can only be changed if it was not possible to define this parameter during acquisition,e.g. because the microscope type was unknown. It describes the direction in which the Z-stackwas acquired:
The Z-stack "grows" away from the front lens of the objective.
The Z-stack "grows" towards the objective. This setting only applies if you are working with acorrection of the spherical aberration.
Aberration Correction section
Only visible if the Show All mode is activated.
Here you can select whether you want spherical aberration to be taken into account and correc‐ted during the calculation of the PSF. As with the other PSF parameters, most values are ex‐tracted automatically from the information about the microscope that is saved with the imageduring acquisition. The input option is therefore inactive. To make changes manually, click onthe Change button.
Use Correction checkbox
Activated: Uses the correction function. All options are active and can be edited.
Embedding Medium dropdown list
Here you can select the embedding medium used from the list.
Refractive Index input field
Displays the refractive index of the selected embedding medium. Enter the appropriate refrac‐tive index if you are using a different embedding medium.
Manufacturer
Displays the manufacturer, if known.
Distance to Cover Slip
Displays the distance of the acquired structure from the side of the cover slip facing the embed‐ding medium. Half the height of the Z-stack is assumed as the initial value for the distance fromthe cover slip. The value can be corrected if this distance is known. If possible, this distanceshould be measured.
Cover Slip Thickness input field and dropdown list
Commercially available cover slips are divided into different groups depending on their thick‐ness (0, 1, 1.5 and 2), which you can select from the dropdown list. Cover slips of the 1.5 typehave an average thickness of 170 µm. In some cases, however, the actual values can vary
Scalar Theory
VectorialTheory
Downwards
Upwards
ManualImage processing functions
Deconvolution group
212 Printed 06/2012

greatly depending on the manufacturer. For best results the use of cover slips with a guaran‐teed thickness of 170 µm is recommended. Values that deviate from this can be entered directlyin the input field.
Cover Slip Index input field and dropdown list
Select the material that the cover slip is made of from the dropdown list. The corresponding re‐fractive index is displayed in the input field next to it.
Working Distance input field
Displays the working distance of the objective (i.e. the distance between the front lens and theside of the cover slip facing the objective). The working distance of the objective is determinedautomatically from the objective information, provided that the objective was selected correctlyin the MTB 2004 Configuration program. You can, however, also enter the value manually.
Change/Reset button
Only active if the Use Correction checkbox is activated.
To reset the values, click on the Reset button.
Channel-Specific section
In this section you will find all settings that are channel-specific. This means that they may beconfigured differently for each channel.
Illumination
Displays the excitation wavelength for the channel dye [in nm]. The maximum is assumed. Thecolor field corresponds to the wavelength (as far as possible).
Detection
Displays the maximum of the emission wavelength for the channel dye. The color field corre‐sponds to the wavelength (as far as possible).
Lateral Sampling Rate
Depends on the geometric pixel scaling in the X/Y direction and displays the extent of the over‐sampling according to the Nyquist criterion. The value should be close to 2 or greater in order toachieve good results during DCV. As, in the case of widefield microscopes, this value is gener‐ally determined by the objective, the camera adapter used and the camera itself, it can only beinfluenced by the use of an Optovar.
Axial Sampling Rate
Depends on the geometric pixel scaling in the Z direction and displays the extent of the over‐sampling according to the Nyquist criterion. The value should be at least 2 or greater in order toachieve good results during DCV. This value is determined by the increment of the focus driveduring acquisition of Z-stacks and can therefore be changed easily.
Pinhole input field
Only available if a confocal microscope has been entered under the microscope parameters.
Displays the size of the confocal pinhole in Airy units (AU).
Image processing functions
Deconvolution group Manual
Carl Zeiss Microscopy GmbH 213

NA Cond. input field
Only visible if the microscope is a Conventional Microscope and Transmitted Light has been se‐lected as the illumination type.
Displays the numerical aperture of the condenser with which transmitted-light acquisition wasperformed.
Microscope Info section
Displays advanced microscope information that influences the form of the PSF in a channel-de‐pendent way:
Illumination dropdown list
Here you can select the illumination method with which the data set has been acquired. In theevent that a Conventional Microscope has been entered under the microscope parameters, thefollowing options are available here: Epifluorescence, Multiphoton Excitation and TransmittedLight. In the case of confocal microscopes, Epifluorescence is the only option.
Imaging
Displays whether the imaging was incoherent (Conventional Microscope) or coherent (LaserScanning Microscope).
Lateral Resolution
Displays the lateral resolution of the calculated PSF.
Axial Resolution
Displays the full width half maximum as a measure of the axial resolution of the PSF.
PSF View section
This tool shows you the PSF that is calculated for a channel based on the current settings. Ifyou select the Update Automatically checkbox, all changes made to the PSF parameters areapplied immediately to the PSF view. This makes it possible to check quickly whether the set‐tings made meet your expectations.
Adjust group
Color Balance
This method allows you to adjust the weighting of the individual color channels of a true colorimage.
Parameters
Adjust per Channel checkbox
Only visible if your input image is a multichannel image.
Activated: You can adjust the parameters for each channel individually.
Range to Adjust dropdown list
Here you can select the adjustment range for the color balance. There are 3 ranges available:
11.2
11.2.1
ManualImage processing functions
Deconvolution group
214 Printed 06/2012

The settings relate to tones in the dark color range.
The settings relate to tones in the mid color range.
The settings relate to tones in the light color range.
Cyan/Red slider
Enter the desired balance between cyan and red tones using the Cyan/Red slider or spin box/input field.
Yellow/Blue slider
Enter the desired balance between yellow and blue tones using the Yellow/Blue slider or spinbox/input field.
Magenta/Green slider
Enter the desired balance between magenta and green tones using the Magenta/Green slideror spin box/input field.
Defaults button
Resets all settings to the default values.
Hue/Saturation/Brightness
This method allows you to adjust the hue, saturation and brightness of a true color image.
Parameters
Adjust per Channel checkbox
Only visible if your input image is a multichannel image.
Activated: You can adjust the parameters for each channel individually.
Hue slider
Enter the desired shift in the color tone using the Color Tone slider or spin box/input field.
The value of the shift represents an angle on the color wheel. The values -180 and +180 there‐fore have an identical effect. Negative angles shift the color tone towards blue and positive onesshift it towards red.
Saturation slider
Enter the desired saturation using the Saturation slider or spin box/input field.
Saturation describes how intense the color of a pixel is. "Chromatic" is the maximum saturation,while "achromatic" describes colors that do not leave a color impression.
Lightness slider
Enter the desired brightness using the Brightness slider or spin box/input field.
Brightness describes how light or dark a pixel appears. The greatest difference is between blackand white or between violet and yellow.
Defaults button
Resets all settings to the default values.
White Balance
This method allows you to adjust the white balance of an image.
Shadows
Midtones
Lights
11.2.2
11.2.3
Image processing functions
Adjust group Manual
Carl Zeiss Microscopy GmbH 215

Parameters
Adjust per Channel checkbox
Only visible if your input image is a multichannel image.
Activated: You can adjust the parameters for each channel individually.
Automatic checkbox
If the checkbox is activated, the white point is calculated automatically from the image data.
Pick button
Only visible if the Automatic checkbox is deactivated.
To define the white point, click on the Select button. The mouse pointer then changes to a se‐lection arrow. Use the selection arrow to click on a white region of your input image. The coordi‐nates and color values of the selected white point are displayed under the button.
Temperature Delta slider
Enter the difference that will be added on to the newly calculated color values using the Tem‐perature Delta slider or spin box/input field. Negative values reduce the color temperature, whilepositive values increase it. A value of 1 corresponds to 10 kelvin.
Defaults button
Resets all settings to the default values.
Color Temperature
This method allows you to adjust the color temperature of a true color image.
Parameters
Temperature Delta slider
Enter the difference that will be added on to the newly calculated color values using the Tem‐perature Delta slider or spin box/input field. Negative values reduce the color temperature, whilepositive values increase it. A value of 1 corresponds to 10 kelvin.
Defaults button
Resets all settings to the default values.
Brightness/Contrast/Gamma
This method allows you to adjust the brightness, contrast and gamma value of an image.
InformationUnlike the adjustments that can be made on the Display tab, here the pixel values of the imageare changed.
Parameters
Adjust per Channel checkbox
Only visible if your input image is a multichannel image.
Activated: You can adjust the parameters for each channel individually.
Brightness slider
11.2.4
11.2.5
ManualImage processing functions
Adjust group
216 Printed 06/2012

Enter the desired brightness using the Brightness slider or spin box/input field.
Changing the brightness means that each gray or color value is increased or decreased by thesame value. The difference between the biggest and smallest gray or color value in the imageremains the same, however.
Contrast slider
Enter the desired contrast using the Contrast slider or spin box/input field.
Changing the contrast means that the gray or color values are multiplied by a factor. The differ‐ence between the biggest and smallest gray or color value changes.
Gamma slider
Enter the desired gamma value using the Gamma slider or spin box/input field.
Changing the gamma value means that the gray or color values are multiplied by individual fac‐tors.
Defaults button
Resets all settings to the default values.
Z-Stack Correction
This method allows you to improve the quality of Z-stack images that have been affected bybleaching effects during acquisition.
Parameters
Third Dimension dropdown list
Only visible, if there is a third dimension in the input image and/or Show all mode is activated.
Here you can select how you want the function to work in the case of multidimensional images.
Each slice of a Z-stack image/each time point of a time lapse image is processed as an individ‐ual 2D image.
Special parameters are available to you for the selected dimension.
Adjust per Channel checkbox
Only visible if your input image is a multichannel image.
Activated: You can adjust the parameters for each channel individually.
Correction Mode dropdown list
Here you can select the desired correction mode.
The Bleaching correction mode compensates for the bleaching effect.
The Flicker correction mode compensates for the flicker of the lamp voltage.
The Background correction mode reduces background noise.
Defaults button
Resets all settings to the default values.
Shading Correction
This method allows you to improve images in which the quality has been impaired by unevenillumination or vignetting.
11.2.6
2D Slices
Z, T or C
Bleaching
Flicker
Background
11.2.7
Image processing functions
Adjust group Manual
Carl Zeiss Microscopy GmbH 217

Parameters
Automatic checkbox
If the checkbox is activated, the function automatically calculates the reference image for shad‐ing correction from the input image.
Adjust per Channel checkbox
Only visible if your input image is a multichannel image.
Activated: You can adjust the parameters for each channel individually.
Mode dropdown list
Here you can select the desired correction mode.
Influences the brightness of the image.
Influences the contrast of the image.
Offset slider
Enter the gray value that will be added on to the newly calculated gray values using the Offsetslider or spin box/input field. If this results in negative values, these are set to 0. Values thatexceed the maximum gray value are set to the maximum gray value.
Defaults button
Resets all settings to the default values.
Geometric group
Channel Alignment
Using this method it is possible to automatically align the individual channels of a multi-channelimage correctly to one another.
Parameter
Third Dimension dropdown list
Only visible, if there is a third dimension in the input image and/or Show all mode is activated.
Here you can select how you want the function to work in the case of multidimensional images.
Each slice of a Z-stack image/each time point of a time lapse image is processed as an individ‐ual 2D image.
Special parameters are available to you for the selected dimension.
Quality dropdown list
Here you can select the quality level that you want the function to work with.
The quality values have the following meanings:
Highest speed with low image quality.
High speed with medium image quality.
Low speed with high image quality.
Lowest speed with best image quality.
Interpolation dropdown list
Additive
Multiplicative
11.3
11.3.1
2D Slices
Z, T or C
Low
Medium
High
Very high
ManualImage processing functions
Geometric group
218 Printed 06/2012

Here you can select how you want interpolation to be performed if a pixel is calculated from sev‐eral individual pixels.
The output pixel is given the gray value of the input pixel that is closest to it.
The output pixel is given the gray value resulting from the linear combination of the input pixelsclosest to it.
The output pixel is given the gray value resulting from a polynomial function of the input pixelsclosest to it.
Defaults button
Resets all settings to the default values.
Z-Stack Alignment
This method allows you to bring the individual planes of a Z-stack image into line if these arenot positioned precisely one above the other. This is the case, for example, when you acquireZ-stacks at an oblique angle using a stereomicroscope.
Parameters
Third Dimension dropdown list
Only visible, if there is a third dimension in the input image and/or Show all mode is activated.
Here you can select how you want the function to work in the case of multidimensional images.
Each slice of a Z-stack image/each time point of a time lapse image is processed as an individ‐ual 2D image.
Special parameters are available to you for the selected dimension.
Quality dropdown list
Here you can select the quality level that you want the function to work with.
The quality values have the following meanings:
Highest speed with low image quality.
High speed with medium image quality.
Low speed with high image quality.
Lowest speed with best image quality.
Method dropdown list
Here you can select the method to be used to align the Z-stack image.
The following methods are available and are also offered as a combination:
The neighboring sections of the Z-stack image are shifted in relation to each other in the X andY direction.
The neighboring sections of the Z-stack image are rotated in relation to each other.
The magnification is adjusted from section to section.
The magnification is adjusted from section to section.
The neighboring sections of the Z-stack image are shifted in the X and Y direction, rotated andthe magnification is adjusted from section to section.
NearestNeighbor
Linear
Cubic
11.3.2
2D Slices
Z, T or C
Low
Medium
High
Very high
Shift
Rotation
Iso Scaling
Skew Scaling
Affin
Image processing functions
Geometric group Manual
Carl Zeiss Microscopy GmbH 219

Interpolation dropdown list
Here you can select how you want interpolation to be performed if a pixel is calculated from sev‐eral individual pixels.
The output pixel is given the gray value of the input pixel that is closest to it.
The output pixel is given the gray value resulting from the linear combination of the input pixelsclosest to it.
The output pixel is given the gray value resulting from a polynomial function of the input pixelsclosest to it.
Defaults button
Resets all settings to the default values.
Stitching
This method allows you to align the individual tiles of a tile image with one another automaticallyand correctly.
Parameters
In place button
The stitching is applied to the original image.
New Output button
A new image is generated as a result of the stitching process. The original image is not modi‐fied.
Fuse tiles checkbox
This option is only visible when the check box New Image is selected.
Activated: All individual tile images will be fused together on stitching
Correct shading checkbox
This is only visible when the button New Image is selected.
Activated: Applies a shading correction to each image of prior to stitching.
Select 2d image for stitching
Entry Function
Get all dimensions from 2d view Reads the current dimensions from the 2Dview
Channels Select a reference channel that should beused for the stitch.
Stitch multiple dimensions
Select here which dimensions should be considered for the stitch.
NearestNeighbor
Linear
Cubic
11.3.3
ManualImage processing functions
Geometric group
220 Printed 06/2012

Button Function
Yes This dimension will be taken into considera‐tion for the stitch.
Reference Only the reference channel will be taken intoconsideration for the stitch.
No This dimension will not be taken into consider‐ation for the stitch.
Parameters
Entry Function
Minimal Overlap Sets the extent of the area of minimal overlap(in %) of the individual tiles
Max Shift Sets the maximal extent of the shift (in %) ofthe individual tiles to one another.
Comparer
Global Optimizer
Defaults button
Resets all settings to the default values.
Reset Button
Allows the user after applying the stitch to return the output image back to its original form (in‐put).
Repeat button
Schaltfläche Wiederholen
Allows the user to return to the output form by reapplying the desired stitch settings.
Rotate
This method allows you to rotate an image around a freely positionable rotation axis and by adefined angle.
Parameters
Third Dimension dropdown list
Only visible, if there is a third dimension in the input image and/or Show all mode is activated.
Here you can select how you want the function to work in the case of multidimensional images.
Each slice of a Z-stack image/each time point of a time lapse image is processed as an individ‐ual 2D image.
Special parameters are available to you for the selected dimension.
Adapt sizes checkbox
Only visible if the Show All mode is activated.
11.3.4
2D Slices
Z, T or C
Image processing functions
Geometric group Manual
Carl Zeiss Microscopy GmbH 221

Activated: The size of the output image is adjusted in such a way that the entire input image isalso visible after the rotation.
Deactivated: The output image is the same size as the input image. Depending on the imagesize and rotation angle, parts of the input image may not be visible in the output image.
Adjust per Channel checkbox
Only visible if your input image is a multichannel image.
Activated: You can adjust the parameters for each channel individually.
Interpolation dropdown list
Here you can select how you want interpolation to be performed if a pixel is calculated from sev‐eral individual pixels.
The output pixel is given the gray value of the input pixel that is closest to it.
The output pixel is given the gray value resulting from the linear combination of the input pixelsclosest to it.
The output pixel is given the gray value resulting from a polynomial function of the input pixelsclosest to it.
Angle slider
Enter the angle by which you want the input image to be rotated using the slider or spin box/input field. Positive angles rotate the image clockwise.
The following parameters are only visible if the 2D Sections value is selected in the Third Di‐mension dropdown list:
Angle X slider
Enter the angle by which you want the input image to be rotated on the X axis using the slider orspin box/input field.
Angle Y slider
Enter the angle by which you want the input image to be rotated on the Y axis using the slider orspin box/input field.
Angle Z slider
Enter the angle by which you want the input image to be rotated on the Z axis using the slider orspin box/input field.
The following parameters are only visible if the Adjust Size checkbox is deactivated:
Center X slider
Enter the X coordinate of the center of the rotation using the slider or spin box/input field.
The value 0 means that the image is rotated around its center point. Negative values mean thatthe center of the rotation in the image is shifted to the left in relation to the image's center point.Positive values shift the center to the right.
Center Y slider
Enter the Y coordinate of the center of the rotation using the slider or spin box/input field.
The value 0 means that the image is rotated around its center point. Negative values mean thatthe center of the rotation in the image is shifted downwards in relation to the image's centerpoint. Positive values shift the center upwards.
NearestNeighbor
Linear
Cubic
ManualImage processing functions
Geometric group
222 Printed 06/2012

Center Z slider
Enter the Z coordinate of the center of the rotation using the slider or spin box/input field.
The value 0 means that the image is rotated around its center point. Negative values mean thatthe center of the rotation in the image is shifted forwards in relation to the image's center point.Positive values shift the center backwards.
Defaults button
Resets all settings to the default values.
Mirror
This method allows you to flip an image horizontally or vertically. In the case of multidimensionalimages, such as Z-stack or time lapse images, you can also use the mirror method to reversethe sequence of the relevant dimension.
Parameters
Third Dimension dropdown list
Only visible, if there is a third dimension in the input image and/or Show all mode is activated.
Here you can select how you want the function to work in the case of multidimensional images.
Each slice of a Z-stack image/each time point of a time lapse image is processed as an individ‐ual 2D image.
Special parameters are available to you for the selected dimension.
Adjust per Channel checkbox
Only visible if your input image is a multichannel image.
Activated: You can adjust the parameters for each channel individually.
Mode dropdown list
Choice Function
Horizontal Flips image horizontal
Vertical Flips image vertical
T/ Z Only visible if input image is a multichannel image.Reverses sequence of the sections (Z) or time points(T)
Defaults button
Resets all settings to the default values.
Resample
This method allows you to change the size of an image in every dimension. You can either en‐large or reduce the image size.
Parameters
Third Dimension dropdown list
11.3.5
2D Slices
Z, T or C
11.3.6
Image processing functions
Geometric group Manual
Carl Zeiss Microscopy GmbH 223

Only visible, if there is a third dimension in the input image and/or Show all mode is activated.
Here you can select how you want the function to work in the case of multidimensional images.
Each slice of a Z-stack image/each time point of a time lapse image is processed as an individ‐ual 2D image.
Special parameters are available to you for the selected dimension.
Adapt sizes checkbox
Only visible if the Show All mode is activated.
Activated: The size of the output image is adjusted in such a way that the entire input image isalso visible after the rotation.
Deactivated: The output image is the same size as the input image. Depending on the imagesize and rotation angle, parts of the input image may not be visible in the output image.
Adjust per Channel checkbox
Only visible if your input image is a multichannel image.
Activated: You can adjust the parameters for each channel individually.
Interpolation dropdown list
Here you can select how you want interpolation to be performed if a pixel is calculated from sev‐eral individual pixels.
The output pixel is given the gray value of the input pixel that is closest to it.
The output pixel is given the gray value resulting from the linear combination of the input pixelsclosest to it.
The output pixel is given the gray value resulting from a polynomial function of the input pixelsclosest to it.
Scaling in X slider
Enter the desired scaling for X using the slider or spin box/input field.
Scaling in Y slider
Enter the desired scaling for Y using the slider or spin box/input field.
Scaling in Z slider
Enter the desired scaling for Z using the slider or spin box/input field.
The following parameters are only visible if the Adjust Size checkbox is deactivated:
Shift in X slider
Enter the shift in the X direction using the slider or spin box/input field.
Shift in Y slider
Enter the shift in the Y direction using the slider or spin box/input field.
Shift in Z slider
Enter the shift in the Z direction using the slider or spin box/input field.
Defaults button
Resets all settings to the default values.
2D Slices
Z, T or C
NearestNeighbor
Linear
Cubic
ManualImage processing functions
Geometric group
224 Printed 06/2012

Shift
This method allows you to shift the content of an image in the direction of the 3 axes X, Y and Z.
Parameters
Third Dimension dropdown list
Only visible, if there is a third dimension in the input image and/or Show all mode is activated.
Here you can select how you want the function to work in the case of multidimensional images.
Each slice of a Z-stack image/each time point of a time lapse image is processed as an individ‐ual 2D image.
Special parameters are available to you for the selected dimension.
Adjust per Channel checkbox
Only visible if your input image is a multichannel image.
Activated: You can adjust the parameters for each channel individually.
Shift in X slider
Enter the shift in the X direction using the slider or spin box/input field.
Shift in Y slider
Enter the shift in the Y direction using the slider or spin box/input field.
Shift in Z slider
Enter the shift in the Z direction using the slider or spin box/input field.
Shift in T slider
Enter the shift in the time points using the slider or spin box/input field.
Defaults button
Resets all settings to the default values.
Sharpen group
Extended Depth of Focus
Using this method you can combine the sharp regions from the individual sections of a Z-stackimage to form a single image. This enables you to display a considerably larger depth of fieldthan is possible on a microscope.
Parameters
Z-Stack Alignment dropdown list
Here you can select whether you want the Z-stack image to be aligned before the calculationand with what quality level.
The Z-stack image is not aligned before the calculation. You should select this setting if the Z-stack image has not been acquired using a stereomicroscope.
High speed with normal image quality.
Low speed with high image quality.
11.3.7
2D Slices
Z, T or C
11.4
11.4.1
No Alignment
Normal
High
Image processing functions
Geometric group Manual
Carl Zeiss Microscopy GmbH 225

Lowest speed with best image quality.
Defaults button
Resets all settings to the default values.
Delineate
This method enhances the edges of individual regions in an image. It corrects the halo effectand only affects edges.
Parameters
Adjust per Channel checkbox
Only visible if your input image is a multichannel image.
Activated: You can adjust the parameters for each channel individually.
Threshold slider
Enter the threshold value for edge detection using the slider or spin box/input field. The thresh‐old value should correspond roughly to the gray value difference between objects and the back‐ground.
Size slider
Enter the size of the edge detection filter using the slider or spin box/input field. The valueshould correspond to the size of the transition area between objects and the background.
Defaults button
Resets all settings to the default values.
Enhance Contour
This method allows you to enhance contours in an image and emphasize regions in which grayvalues change. The function is suitable for visually emphasizing fine structures in an image.
Parameters
Third Dimension dropdown list
Only visible, if there is a third dimension in the input image and/or Show all mode is activated.
Here you can select how you want the function to work in the case of multidimensional images.
Each slice of a Z-stack image/each time point of a time lapse image is processed as an individ‐ual 2D image.
Special parameters are available to you for the selected dimension.
Adjust per Channel checkbox
Only visible if your input image is a multichannel image.
Activated: You can adjust the parameters for each channel individually.
Strength slider
Enter the factor for increasing edge enhancement using the slider or spin box/input field.
Normalization dropdown list
Here you can select how the gray/color values that exceed or fall short of the value rangeshould be dealt with.
Highest
11.4.2
11.4.3
2D Slices
Z, T or C
ManualImage processing functions
Sharpen group
226 Printed 06/2012

Automatically sets the gray levels that exceed or fall short of the predefined gray value range tothe lowest or highest gray value (black or white). The effect corresponds to underexposure oroverexposure. In certain circumstances some information may therefore be lost.
Normalizes the gray values automatically to the available gray value range.
If the result is larger than the maximum gray value of the image, the maximum gray value + 1 isdeducted from this value.
Normalizes the output to the value "gray value + maximum gray value/2".
Converts negative gray levels into positive values.
Defaults button
Resets all settings to the default values.
Unsharp Mask
Using this method you can increase the impression of sharpness in an image and consequentlyobtain an image display that is richer in detail. The function allows contrasts at small structuresand edges to be enhanced in a targeted way.
Parameters
Adjust per Channel checkbox
Only visible if your input image is a multichannel image.
Activated: You can adjust the parameters for each channel individually.
Strength slider
Enter the strength of the Unsharp Masking using the slider or spin box/input field. The higherthe value selected, the greater the extent to which small structures are enhanced.
The following parameters are only visible if the Show All mode is activated:
Radius slider
Enter the radius using the slider or spin box/input field. Radius defines the width of structuresthat you want to appear sharper. A small radius enhances smaller details. If the radius is toobig, halo effects can occur at edges.
Color Mode dropdown list
Select the desired color mode from the dropdown list.
Calculates the sharpness for each color channel individually. The color saturation and the colorof structures may be changed and color noise may occur.
Only calculates the sharpness on the basis of the brightness signal detected. This mode doesnot show any color noise and changes the color saturation accordingly.
Threshold Mode dropdown list
Here you can select a setting from the dropdown list for calculating the boundary between thesharpened image regions.
It is only effective if the value for the Lower Threshold Value parameter is not equal to 0 or thevalue for the Upper Threshold Value parameter is not equal to 100.
No adjustment takes place.
The transition follows the threshold values.
Clip
Automatic
Wrap
Shift and Clip
Absolute
11.4.4
RGB
Luminance
None
Binary
Image processing functions
Sharpen group Manual
Carl Zeiss Microscopy GmbH 227

Calculates a linear course.
Threshold Low slider
Enter the lower threshold value using the slider or spin box/input field. This determines the low‐er limit from which existing contrast structures are changed.
Threshold High slider
Enter the upper threshold value using the slider or spin box/input field. This prevents the exist‐ing strong contrasts in the image from being increased further unnecessarily.
Clip To Valid Bits checkbox
Activated: Thevalue range of the gray/color values of the output image is adjusted to the valuerange of the input image.
Defaults button
Resets all settings to the default values.
Smooth group
Median
This method allows you to reduce noise in an image. Each pixel is replaced by the median of itsneighbors. The size of the area of the neighboring pixels considered is defined by a quadraticfilter matrix. The modified pixel is the central pixel of the filter matrix. The median is the middlevalue of the gray values of the pixel and its neighbors sorted in ascending order.
Parameter
Third Dimension dropdown list
Only visible, if there is a third dimension in the input image and/or Show all mode is activated.
Here you can select how you want the function to work in the case of multidimensional images.
Each slice of a Z-stack image/each time point of a time lapse image is processed as an individ‐ual 2D image.
Special parameters are available to you for the selected dimension.
Adjust per Channel checkbox
Only visible if your input image is a multichannel image.
Activated: You can adjust the parameters for each channel individually.
Filter Size slider
Enter the size of the filter matrix in the X and Y direction using the slider or spin box/input field.
The following parameters are only visible if the Show All mode is activated:
Filter Size in X slider
Enter the size of the filter matrix in the X direction using the slider or spin box/input field.
Filter Size in Y slider
Enter the size of the filter matrix in the Y direction using the slider or spin box/input field.
Linear
11.5
11.5.1
2D Slices
Z, T or C
ManualImage processing functions
Smooth group
228 Printed 06/2012

Filter Size in Z slider
Enter the size of the filter matrix in the Z direction using the slider or spin box/input field.
Defaults button
Resets all settings to the default values.
Sigma
This method allows you to reduce noise in an image. Each pixel is replaced by the average ofits neighbors. The size of the area of the neighboring pixels considered is defined by a quadraticfilter matrix. The modified pixel is the central pixel of the filter matrix. To calculate the average,only the gray values that lie within a defined range (+/- sigma) around the gray value of the cen‐tral pixel are taken into consideration. As a result, fine object structures are not blurred; only thegray levels in image regions that belong together are adjusted.
Parameter
Third Dimension dropdown list
Only visible, if there is a third dimension in the input image and/or Show all mode is activated.
Here you can select how you want the function to work in the case of multidimensional images.
Each slice of a Z-stack image/each time point of a time lapse image is processed as an individ‐ual 2D image.
Special parameters are available to you for the selected dimension.
Adjust per Channel checkbox
Only visible if your input image is a multichannel image.
Activated: You can adjust the parameters for each channel individually.
Sigma slider
Enter the sigma value using the slider or spin box/input field.
Filter Size slider
Enter the size of the filter matrix in the X and Y direction using the slider or spin box/input field.
The following parameters are only visible if the Show All mode is activated:
Filter Size in X slider
Enter the size of the filter matrix in the X direction using the slider or spin box/input field.
Filter Size in Y slider
Enter the size of the filter matrix in the Y direction using the slider or spin box/input field.
Filter Size in Z slider
Enter the size of the filter matrix in the Z direction using the slider or spin box/input field.
Defaults button
Resets all settings to the default values.
11.5.2
2D Slices
Z, T or C
Image processing functions
Smooth group Manual
Carl Zeiss Microscopy GmbH 229

Lowpass
This method allows you to reduce noise in an image. Each pixel is replaced by the average ofits neighbors. The size of the area of the neighboring pixels considered is defined by a quadraticfilter matrix. The modified pixel is the central pixel of the filter matrix.
Parameter
Third Dimension dropdown list
Only visible, if there is a third dimension in the input image and/or Show all mode is activated.
Here you can select how you want the function to work in the case of multidimensional images.
Each slice of a Z-stack image/each time point of a time lapse image is processed as an individ‐ual 2D image.
Special parameters are available to you for the selected dimension.
Adjust per Channel checkbox
Only visible if your input image is a multichannel image.
Activated: You can adjust the parameters for each channel individually.
Repetitions slider
Enter the number of repetitions using the slider or spin box/input field. The function can be ap‐plied several times in succession to the result of the filtering. This intensifies the effect accord‐ingly.
Filter Size slider
Enter the size of the filter matrix in the X and Y direction using the slider or spin box/input field.
The following parameters are only visible if the Show All mode is activated:
Filter Size in X slider
Enter the size of the filter matrix in the X direction using the slider or spin box/input field.
Filter Size in Y slider
Enter the size of the filter matrix in the Y direction using the slider or spin box/input field.
Filter Size in Z slider
Enter the size of the filter matrix in the Z direction using the slider or spin box/input field.
Defaults button
Resets all settings to the default values.
Binomial Filter
This method allows you to reduce noise in an image. Each pixel is replaced by a weighted aver‐age of its neighbors. The weighting factors are calculated from the binomial coefficients in ac‐cordance with the filter size. The binomial filter is very similar to a Gaussian filter in its effect.
11.5.3
2D Slices
Z, T or C
11.5.4
ManualImage processing functions
Smooth group
230 Printed 06/2012

Parameter
Third Dimension dropdown list
Only visible, if there is a third dimension in the input image and/or Show all mode is activated.
Here you can select how you want the function to work in the case of multidimensional images.
Each slice of a Z-stack image/each time point of a time lapse image is processed as an individ‐ual 2D image.
Special parameters are available to you for the selected dimension.
Filter Size slider
Enter the size of the filter matrix using the slider or spin box/input field.
Defaults button
Resets all settings to the default values.
Gauss
This method allows you to reduce noise in an image. Each pixel is replaced by a weighted aver‐age of its neighbors. The neighboring pixels are weighted in accordance with a two-dimensionalGauss bell curve.
Parameter
Third Dimension dropdown list
Only visible, if there is a third dimension in the input image and/or Show all mode is activated.
Here you can select how you want the function to work in the case of multidimensional images.
Each slice of a Z-stack image/each time point of a time lapse image is processed as an individ‐ual 2D image.
Special parameters are available to you for the selected dimension.
Adjust per Channel checkbox
Only visible if your input image is a multichannel image.
Activated: You can adjust the parameters for each channel individually.
Sigma slider
Enter the sigma value using the slider or spin box/input field.
Sigma in X slider
Enter the sigma value in the X direction using the slider or spin box/input field.
Sigma in Y slider
Enter the sigma value in the Y direction using the slider or spin box/input field.
Sigma in Z slider
Enter the sigma value in the Z direction using the slider or spin box/input field.
Defaults button
Resets all settings to the default values.
2D Slices
Z, T or C
11.5.5
2D Slices
Z, T or C
Image processing functions
Smooth group Manual
Carl Zeiss Microscopy GmbH 231

Single Pixel Filter
This method allows you to remove single pixel phenomena, such as those that occur in the caseof clocking induced charge with EMCCDs and as radio telegraph signal noise with CMOS sen‐sors. It can also be used to remove hot pixels.
Parameter
Adjust per Channel checkbox
Only visible if your input image is a multichannel image.
Activated: You can adjust the parameters for each channel individually.
Threshold Value slider
Enter the threshold value using the slider or spin box/input field.
Defaults button
Resets all settings to the default values.
Utilities group
Copy Annotations
This method copies the annotations of one image into another image.
Copy Image
This method creates a copy of an image.
Change Pixel Type
This method allows you to change the pixel type of an image. This can be useful if you want tocompare or combine images that have different pixel types.
Parameters
Pixel Format dropdown list
Select the desired pixel format from the dropdown list.
Choice Function
8 Bit B/W
The output image is a monochrome image,the whole-number gray values of which can liein the range from 0 to 255.
16 Bit B/W
The output image is a monochrome image,the whole-number gray values of which can liein the range from 0 to 65535.
32 Bit B/W Float
The output image is a monochrome imagewith real numbers as pixel values.
11.5.6
11.6
11.6.1
11.6.2
11.6.3
ManualImage processing functions
Smooth group
232 Printed 06/2012

Choice Function
2x32 Bit Complex
The output image is a monochrome imagewith complex numbers (real part and imagina‐ry part) as pixel values. Such images are gen‐erally created by means of transformation intothe Fourier space.
24 Bit RGB
The output image is a color image, the whole-number color values of which in the red, greenand blue channels can lie in the range from 0to 255.
48 Bit RGB
The output image is a color image, the whole-number color values of which in the red, greenand blue channels can lie in the range from 0to 65535.
2x32 Bit RGB Float
The output image is a color image with realnumbers as color values in the red, green andblue channels.
3x64Bit RGB Complex
The output image is a color image with com‐plex numbers (real part and imaginary part) inthe red, green and blue channels. Such im‐ages are generally created by means of trans‐formation into the Fourier space.
Defaults button
Resets all settings to the default values.
Create Image Subset
This method allows you to extract parts from one image and use these to create a new image.You can select these parts freely from the individual dimensions of the image.
Create Image Subset parameters
Defaults button
Resets all settings to the default values.
InformationEach of the sections described below is only visible if the corresponding dimension is presentin the input image.
Channels section
To show the section in full, click on the button.
11.6.4
11.6.4.1
Image processing functions
Utilities group Manual
Carl Zeiss Microscopy GmbH 233

In the Channels section you can select which channels of the input image you want to be used.All channels are selected by default. To deselect a channel, click on the relevant channel but‐ton.
button
Adopts the values from the current display. These values can also be found on the Dimensionstab.
Z-Position section
To show the section in full, click on the button.
Z-Stack dropdown list
You can select which sections of the input image you want to be used from the dropdown list.
Selects all sections of the input image.
Selects an individual section.
Selects a continuous range of sections.
Selects several continuous ranges and individual sections.
Select Individual slider
Enter the section that you want to select using the slider or spin box/input field.
button
Adopts the values from the current display. These values can also be found on the Dimensionstab.
Select Range slider
Enter the first and last section that you want to select using the sliders or spin boxes/input fields.
Interval checkbox
Activated: Interval mode is active. The Interval spin box/input field appears.
Interval spin box/input field
Enter the desired interval here. If you enter the value 2, for example, only every 2nd value fromthe range is considered.
Select Several input field
Enter one or more sections that you want to select in the input field. To do this, enter the firstsection, followed by a minus sign, and then the last section. If you want to define an interval,after the last section enter a colon and then the interval. The entry "2-10:2" means that everysecond section is selected from section 2 to section 10.
All
Select Indi‐vidual
Select Range
Select Sever‐al
ManualImage processing functions
Utilities group
234 Printed 06/2012

Enter a comma after the first section if you want to define another section. You can also selectindividual sections separated by commas. By entering "2-10:2,14-18,20,23", you select everysecond section from section 2 to section 10, followed by sections 14 to 18, as well as sections20 and 23.
Time section
To show the section in full, click on the button.
Time Points dropdown list
You can select which time points of the input image you want to be used from the Time Pointsdropdown list. The following selection options are available:
Selects all time points of the input image.
Selects an individual time point.
Selects a continuous range of time points.
Selects several continuous ranges and individual time points.
Select Individual slider
Enter the time point that you want to select using the slider or spin box/input field.
button
Adopts the values from the current display. These values can also be found on the Dimensionstab.
Select Range slider
Enter the first and last time point that you want to select using the sliders or spin boxes/inputfields.
Interval checkbox
Activated: Interval mode is active. The Interval spin box/input field appears.
Interval spin box/input field
Enter the desired interval here. If you enter the value 2, for example, only every 2nd value fromthe range is considered.
Select Several input field
Enter one or more time points that you want to select in the input field. To do this, enter the firsttime point, followed by a minus sign, and then the last time point. If you want to define an inter‐val, after the last time point enter a colon and then the interval. The entry "2-10:2" means thatevery second time point is selected from time point 2 to time point 10.
All
Select Indi‐vidual
Select Range
Select Sever‐al
Image processing functions
Utilities group Manual
Carl Zeiss Microscopy GmbH 235

Enter a comma after the first time point if you want to define another time point. You can alsoselect individual time points separated by commas. By entering "2-10:2,14-18, 20, 23", you se‐lect every second time point from time point 2 to time point 10, followed by time points 14 to 18,as well as time points 20 and 23.
Scene section
To show the section in full, click on the button.
Scene dropdown list
You can select which scenes of the input image you want to be used from the Scene dropdownlist.
Selects all scenes of the input image.
Selects an individual scene.
Selects a continuous range of scenes.
Selects several continuous scenes and individual scenes.
Select Individual slider
Enter the scene that you want to select using the slider or spin box/input field.
button
Adopts the values from the current display. These values can also be found on the Dimensionstab.
Select Range slider
Enter the first and last scene that you want to select using the sliders or spin boxes/input fields.
Interval checkbox
Activated: Interval mode is active. The Interval spin box/input field appears.
Interval spin box/input field
Enter the desired interval here. If you enter the value 2, for example, only every 2nd value fromthe range is considered.
Select Several input field
Enter one or more scenes that you want to select in the input field. To do this, enter the firstscene, followed by a minus sign, and then the last scene. If you want to define an interval, afterthe last scene enter a colon and then the interval. The entry "2-10:2" means that every secondscene is selected from scene 2 to scene 10.
Enter a comma after the first scene if you want to define another scene. You can also selectindividual scenes separated by commas. By entering "2-10:2,14-18, 20, 23", you select everysecond scene from scene 2 to scene 10, followed by scenes 14 to 18, as well as scenes 20 and23.
All
Select Indi‐vidual
Select Range
Select Sever‐al
ManualImage processing functions
Utilities group
236 Printed 06/2012

Block section
To show the section in full, click on the button.
Block dropdown list
You can select which blocks of the input image you want to be used from the Block dropdownlist. The following selection options are available:
Selects all blocks of the input image.
Selects an individual block.
Selects a continuous block of time points.
Selects several continuous blocks and individual blocks.
Select Individual slider
Enter the block that you want to select using the slider or spin box/input field.
button
Adopts the values from the current display. These values can also be found on the Dimensionstab.
Select Range slider
Enter the first and last block that you want to select using the sliders or spin boxes/input fields.
Interval checkbox
Activated: Interval mode is active. The Interval spin box/input field appears.
Interval spin box/input field
Enter the desired interval here. If you enter the value 2, for example, only every 2nd value fromthe range is considered.
Select Several input field
Enter one or more blocks that you want to select in the input field. To do this, enter the firstblock, followed by a minus sign, and then the last block. If you want to define an interval, afterthe last block enter a colon and then the interval. The entry "2-10:2" means that every secondblock is selected from block 2 to block 10.
Enter a comma after the first block if you want to define another block. You can also select indi‐vidual blocks separated by commas. By entering "2-10:2,14-18,20,23", you select every secondblock from block 2 to block 10, followed by blocks 14 to 18, as well as blocks 20 and 23.
Region section
To show the section in full, click on the button.
All
Select Indi‐vidual
Select Range
Select Sever‐al
Image processing functions
Utilities group Manual
Carl Zeiss Microscopy GmbH 237

Region dropdown list
You can select which sections of the input image you want to be used from the Region drop‐down list.
The entire image is selected.
In the current image, drag out the rectangular region that you want to be used using the mouse.
X spin box/input field
Enter the X coordinate of the starting point of the region in the spin box/input field.
Y spin box/input field
Enter the Y coordinate of the starting point of the region in the spin box/input field.
W spin box/input field
Enter the width of the region in the spin box/input field.
H spin box/input field
Enter the height of the region in the spin box/input field.
Fuse Image Subset
This method allows you to insert an image subset back into the original image. Its contents arereplaced by the contents of the image subset. Using this method you can process a previouslycreated image subset using image processing functions and copy the result back into the origi‐nal image.
Create Gray Scale image
This method allows you to create a gray scale image.
Image Calculator
This method allows you to apply arithmetic operations to images in the form of a calculator.
You can process a single image or combine two images.
All operations are performed pixel by pixel.
Add Channels
This method allows you to combine two input images that have different channels but otherwisehave the same dimension (Z-stack, time series, tile, scene). An image is produced that containsall the channels of the input images.
If the two input images differ from one another in the dimensions Z-stack, time series, tiles orscene, input image 1 and input image 2 are copied into the output image as two separateblocks.
All
Region
11.6.5
11.6.6
11.6.7
11.6.8
ManualImage processing functions
Utilities group
238 Printed 06/2012

Generate Pyramid
This method allows you to calculate a resolution pyramid for a tile image. Using the resolutionpyramid you can navigate extremely efficiently even in very large tile images and display individ‐ual regions in the image window.
Calculate Histogram
This method calculates a histogram distribution for selected measurement parameters of ameasurement data table.
Column Selection dialog window
Here you can select the columns of the table for which you want the histogram to be calculated.
Direct Selection
Activate the checkboxes of the columns that you want to select.
Search For Text input field
In the input field you can enter one or more character strings that should appear in the columnheading.
All radio button
Select this option if each character string has to appear in the column heading in order for it tobe selected.
Any radio button
Select this option if only one of the character strings has to appear in the column heading inorder for it to be selected.
Without the Words input field
Here you can enter one or more character strings that must not appear in the column heading.
Run button
Selects the column headings in accordance with the conditions for the text search.
Deselect All button
Resets all activated checkboxes.
Select All button
Activates all checkboxes.
OK button
Adopts the selection.
Cancel button
Exits the dialog window without making a selection.
11.6.9
11.6.10
11.6.10.1
Image processing functions
Utilities group Manual
Carl Zeiss Microscopy GmbH 239

Split Scenes
This method saves the single scenes (tiles or positions) of a multiscene image (i.e. image of amultiwell plate) as single images in a folder in CZI format.
Parameter
Save in display field
To open the Browse for folder dialog window, click on the button to the right of the display field.Here you can select the folder to which you want to save the single scene images. The path ofthe destination folder is displayed automatically in the display field.
InformationMultiscene images to be analyzed as ZVI images with AssayBuilder must be separated intosingle images using the method Split scenes before ZVI-Export.
Export/Import group
Image Export
Using the SingleFile Export method you can export single images into various file types so thatyou can continue to use them in other programs. Multidimensional images (multichannel, Z-stack, time lapse, tile images) are exported as individual images.
Image Export parameters
Defaults button
Resets all settings to the default values.
See also
2 Image Export [➙ p.240]
File Type section
File Type dropdown list
Select the desired file type from the dropdown list.
Various setting options are available to you depending on the file type selected (*.jpg, *.bmp,*.tiff, *.png, *.hdp).
Quality slider
Only available for the file types *.jpg, *.hdp.
Enter the image quality using the slider or spin box/input field to influence the size of the file.Although low values result in very small files, image quality may be considerably reduced.
Size slider
Enter the image size in percent using the slider or spin box/input field.
11.6.11
11.7
11.7.1
11.7.1.1
ManualImage processing functions
Utilities group
240 Printed 06/2012

Convert to 8 Bit checkbox
Only available for the file types *.tiff, *.png, *.hdp.
Activated: Converts a 16 bit gray level image into an 8 bit gray level image, or a 48 bit colorimage into a 24 bit color image.
Compression dropdown list
Only available for the file type *.tiff.
Select the compression method for reducing the data volume from the dropdown list.
Performs lossless compression in accordance with the Lempel-Ziv-Welch algorithm (LZW).
Retains the data volume of the original image. No compression is performed.
Performs lossless compression in accordance with the ZIP method.
Image Data section
The following functions are only visible if the Show All mode is activated:
Original Data checkbox
Activated: Exports the image with the original channel colors and the original display character‐istic curve.
Apply Display Characteristic Curve and Channel Color checkbox
Activated: Exports the image with the changed channel color and display characteristic curvesettings. These settings are applied to the pixel values of the exported images. They are partic‐ularly important if you want to use dark images with a dynamic range of more than 8 bits in oth‐er programs.
InformationAt least one of the two checkboxes must be activated. If both checkboxes are activated, youcan export the original images and the images with the changed settings in a single step.
Burn In Graphic checkbox
Activated: Burns the graphic elements into the image. The pixels under the graphic element(e.g. scale bars) are overwritten. The burnt-in graphic elements cannot be subsequently modi‐fied.
Multichannel Image checkbox
Only visible for multichannel images.
Activated: Exports the pseudo color image of all selected channels.
Individual Channels checkbox
Only visible for multichannel images.
Activated: Exports the individual colored images of all selected channels.
LZW
None
ZIP
Image processing functions
Export/Import group Manual
Carl Zeiss Microscopy GmbH 241

InformationAt least one of the three checkboxes must be activated. If the Multichannel Image and Individ‐ual Channels checkboxes are activated, you can export the individual colored images and thepseudo color image in a single step.
Dimensions section
The following functions are only visible if the Show All mode is activated:
Use All Dimensions radio button
Select this option if you want to export all dimensions without changing them.
Define Subset radio button
Select this option if you only want to export individual dimensions or subsets of individual di‐mensions.
InformationEach of the sections described below is only visible if the corresponding dimension is presentin the input image.
Channels section
To show the section in full, click on the button.
In the Channels section you can select which channels of the input image you want to be used.All channels are selected by default. To deselect a channel, click on the relevant channel but‐ton.
button
Adopts the values from the current display. These values can also be found on the Dimensionstab.
Z-Position section
To show the section in full, click on the button.
Z-Stack dropdown list
You can select which sections of the input image you want to be used from the dropdown list.
Selects all sections of the input image.
Selects an individual section.
Selects a continuous range of sections.
Selects several continuous ranges and individual sections.
All
Select Indi‐vidual
Select Range
Select Sever‐al
ManualImage processing functions
Export/Import group
242 Printed 06/2012

Select Individual slider
Enter the section that you want to select using the slider or spin box/input field.
button
Adopts the values from the current display. These values can also be found on the Dimensionstab.
Select Range slider
Enter the first and last section that you want to select using the sliders or spin boxes/input fields.
Interval checkbox
Activated: Interval mode is active. The Interval spin box/input field appears.
Interval spin box/input field
Enter the desired interval here. If you enter the value 2, for example, only every 2nd value fromthe range is considered.
Select Several input field
Enter one or more sections that you want to select in the input field. To do this, enter the firstsection, followed by a minus sign, and then the last section. If you want to define an interval,after the last section enter a colon and then the interval. The entry "2-10:2" means that everysecond section is selected from section 2 to section 10.
Enter a comma after the first section if you want to define another section. You can also selectindividual sections separated by commas. By entering "2-10:2,14-18,20,23", you select everysecond section from section 2 to section 10, followed by sections 14 to 18, as well as sections20 and 23.
Time section
To show the section in full, click on the button.
Time Points dropdown list
You can select which time points of the input image you want to be used from the Time Pointsdropdown list. The following selection options are available:
Selects all time points of the input image.
Selects an individual time point.
Selects a continuous range of time points.
Selects several continuous ranges and individual time points.
Select Individual slider
Enter the time point that you want to select using the slider or spin box/input field.
All
Select Indi‐vidual
Select Range
Select Sever‐al
Image processing functions
Export/Import group Manual
Carl Zeiss Microscopy GmbH 243

button
Adopts the values from the current display. These values can also be found on the Dimensionstab.
Select Range slider
Enter the first and last time point that you want to select using the sliders or spin boxes/inputfields.
Interval checkbox
Activated: Interval mode is active. The Interval spin box/input field appears.
Interval spin box/input field
Enter the desired interval here. If you enter the value 2, for example, only every 2nd value fromthe range is considered.
Select Several input field
Enter one or more time points that you want to select in the input field. To do this, enter the firsttime point, followed by a minus sign, and then the last time point. If you want to define an inter‐val, after the last time point enter a colon and then the interval. The entry "2-10:2" means thatevery second time point is selected from time point 2 to time point 10.
Enter a comma after the first time point if you want to define another time point. You can alsoselect individual time points separated by commas. By entering "2-10:2,14-18, 20, 23", you se‐lect every second time point from time point 2 to time point 10, followed by time points 14 to 18,as well as time points 20 and 23.
Scene section
To show the section in full, click on the button.
Scene dropdown list
You can select which scenes of the input image you want to be used from the Scene dropdownlist.
Selects all scenes of the input image.
Selects an individual scene.
Selects a continuous range of scenes.
Selects several continuous scenes and individual scenes.
Select Individual slider
Enter the scene that you want to select using the slider or spin box/input field.
button
Adopts the values from the current display. These values can also be found on the Dimensionstab.
All
Select Indi‐vidual
Select Range
Select Sever‐al
ManualImage processing functions
Export/Import group
244 Printed 06/2012

Select Range slider
Enter the first and last scene that you want to select using the sliders or spin boxes/input fields.
Interval checkbox
Activated: Interval mode is active. The Interval spin box/input field appears.
Interval spin box/input field
Enter the desired interval here. If you enter the value 2, for example, only every 2nd value fromthe range is considered.
Select Several input field
Enter one or more scenes that you want to select in the input field. To do this, enter the firstscene, followed by a minus sign, and then the last scene. If you want to define an interval, afterthe last scene enter a colon and then the interval. The entry "2-10:2" means that every secondscene is selected from scene 2 to scene 10.
Enter a comma after the first scene if you want to define another scene. You can also selectindividual scenes separated by commas. By entering "2-10:2,14-18, 20, 23", you select everysecond scene from scene 2 to scene 10, followed by scenes 14 to 18, as well as scenes 20 and23.
Region section
To show the section in full, click on the button.
Region dropdown list
You can select which sections of the input image you want to be used from the Region drop‐down list.
The entire image is selected.
In the current image, drag out the rectangular region that you want to be used using the mouse.
X spin box/input field
Enter the X coordinate of the starting point of the region in the spin box/input field.
Y spin box/input field
Enter the Y coordinate of the starting point of the region in the spin box/input field.
W spin box/input field
Enter the width of the region in the spin box/input field.
H spin box/input field
Enter the height of the region in the spin box/input field.
Tiles section
To show the section in full, click on the button.
All
Region
Image processing functions
Export/Import group Manual
Carl Zeiss Microscopy GmbH 245

Use Existing Tiles radio button
Activated: Exports the image with an unchanged number of tiles and unchanged overlap.
New Tiles radio button
Configure the column, row and overlap settings using the spin boxes/input fields if you want tochange the number of tiles and the overlap.
Columns spin box/input field
Only active if the New Tiles radio button is activated.
Enter the number of columns using the spin box/input field.
Rows spin box/input field
Only active if the New Tiles radio button is activated.
Enter the number of rows using the spin box/input field.
Overlap spin box/input field
Only active if the New Tiles radio button is activated.
Enter the percentage for the overlap using the spin box/input field.
Export To section
Export To display field
To open the Browse For Folder dialog window, click on the button to the right of the displayfield. Here you can select the folder to which you want to save the image that is being exported.The path of the export folder is displayed automatically in the display field.
The following functions are only visible if the Show All mode is activated:
Create Subfolder checkbox
Activated: Creates a separate folder with the name of the input image.
Create XML Files checkbox
Activated: Creates two XML files containing the meta information relating to the input image.
▪ Meta.xml contains all additional information relating to the input image (e.g. hardware set‐tings, dimensions).
▪ Info.xml only contains additional information relating to the exported individual images (e.g.names, dimensions, sizes).
Create ZIP Archive checkbox
Activated: Creates a ZIP file in which all exported individual images, including the XML files, aresaved.
Prefix input field
Here you can edit the prefix specified or enter a new name. The name of the original image isspecified by default.
ManualImage processing functions
Export/Import group
246 Printed 06/2012

Movie Export
Using the Movie Export function you can export multidimensional images (time lapse, Z-stack,multichannel images) into various file types in the form of film sequences so that you can contin‐ue to use them in other programs.
Movie Export parameters
Defaults button
Resets all settings to the default values.
File Type section
Mode dropdown list
Select the desired file type from the dropdown list.
Various setting options are available to you depending on the file type selected (*.avi,*.wmf).
InformationAVI (MS-Video1) mode is available for 32-bit Windows operating systems only.
Format dropdown list
Select the desired format from the dropdown list.
Not available for the file type AVI (DV).
Uses the height and width of the input image and sets the frame rate to 5 frames per second.
Not available for the file type AVI (DV).
Enter the values in the Width, Height and Frame Rate input fields.
Uses the PAL (Phase Alternating Line) video resolution with 25 frames per second.
Uses the NTSC (National Television Systems Committee) video resolution with 29.97 framesper second.
Not available for the file types AVI (DV) and AVI (MS-Video 1).
Uses the HD (High Definition 720) video resolution with 50 frames per second.
Not available for the file types AVI (DV) and AVI (MS-Video 1).
Uses the HD (High Definition 1080) video resolution with 25 frames per second.
Not available for the file types AVI (DV) and AVI (MS-Video 1).
Uses the HD (High Definition 1080) video resolution with 29.97 frames per second.
Width input field
Only active if you have selected the User-Defined entry in the Format dropdown list.
Here you can indicate the width of the image in pixels (px).
11.7.2
11.7.2.1
Original Size
User-Defined
720x576/25fps (PAL 576p/
25)720x480/29.97fps (NTSC)
1280x720/50fps (HD 720p/
50)1920x1080/2
5fps (HD1080p/25)
1920x1080/29.97fps (HD
1080p/29.97)
Image processing functions
Export/Import group Manual
Carl Zeiss Microscopy GmbH 247

Height input field
Only active if you have selected the User-Defined entry in the Format dropdown list.
Here you can indicate the height of the image in pixels (px).
Frame Rate input field
Only active if you have selected the User-Defined entry in the Format dropdown list.
Here you can enter the frame rate in frames per second (fps).
Quality slider
Only visible if you have selected the AVI (M-JPEG compression) entry in the File Type drop‐down list.
Enter the image quality using the slider or spin box/input field to influence the size of the file.Although low values result in very small files, image quality may be considerably reduced.
Image Data section
The following functions are only visible if the Show All mode is activated:
Burn In Graphic checkbox
Activated: Burns the graphic elements into the image. The pixels under the graphic element(e.g. scale bars) are overwritten. The burnt-in graphic elements cannot be subsequently modi‐fied.
Multichannel Image checkbox
Only visible for multichannel images.
Activated: Exports the pseudo color image of all selected channels.
Individual Channels checkbox
Only visible for multichannel images.
Activated: Exports the individual colored images of all selected channels.
InformationAt least one of the three checkboxes must be activated. If the Multichannel Image and Individ‐ual Channels checkboxes are activated, you can export the individual colored images and thepseudo color image in a single step.
Adjust section
The following functions are only visible if the Show All mode is activated:
Adjust dropdown list
Select the desired type of adjustment from the dropdown list.
Adjusts the image to the selected resolution. The original aspect ratio is retained.
Adjusts the image to the selected resolution and clips it. The original aspect ratio is not retained.
Adjust
Adjust andClip
ManualImage processing functions
Export/Import group
248 Printed 06/2012

Stretches the image to the selected resolution. The original aspect ratio is not retained.
Clips the image to the selected resolution. The original aspect ratio is retained.
Sequence section
The following functions are only visible if the Show All mode is activated:
In the list enter the sequence of the dimensions in which you want the films to be created.
button
Shifts the selected dimension up a line.
button
Shifts the selected dimension down a line.
Image Sequence section
Image Sequence dropdown list
From the dropdown list, select how you want the images to be assigned.
Enter the time per image in seconds using the spin box/input field. The total length is displayedin the Total Film Length text field.
Assigns one image to one time point of the film.
Number of Images display field
Indicates the number of images in the input image.
Total Film Length display field
Indicates the total length of the resulting film, depending on the selected image sequence andthe time.
Dimensions section
The following functions are only visible if the Show All mode is activated:
Use All Dimensions radio button
Select this option if you want to export all dimensions without changing them.
Define Subset radio button
Select this option if you only want to export individual dimensions or subsets of individual di‐mensions.
InformationEach of the sections described below is only visible if the corresponding dimension is presentin the input image.
Adjust andStretch
Clip
Fixed Dura‐tion
1 Image perTime Point
Image processing functions
Export/Import group Manual
Carl Zeiss Microscopy GmbH 249

Channels section
To show the section in full, click on the button.
In the Channels section you can select which channels of the input image you want to be used.All channels are selected by default. To deselect a channel, click on the relevant channel but‐ton.
button
Adopts the values from the current display. These values can also be found on the Dimensionstab.
Z-Position section
To show the section in full, click on the button.
Z-Stack dropdown list
You can select which sections of the input image you want to be used from the dropdown list.
Selects all sections of the input image.
Selects an individual section.
Selects a continuous range of sections.
Selects several continuous ranges and individual sections.
Select Individual slider
Enter the section that you want to select using the slider or spin box/input field.
button
Adopts the values from the current display. These values can also be found on the Dimensionstab.
Select Range slider
Enter the first and last section that you want to select using the sliders or spin boxes/input fields.
Interval checkbox
Activated: Interval mode is active. The Interval spin box/input field appears.
Interval spin box/input field
Enter the desired interval here. If you enter the value 2, for example, only every 2nd value fromthe range is considered.
All
Select Indi‐vidual
Select Range
Select Sever‐al
ManualImage processing functions
Export/Import group
250 Printed 06/2012

Select Several input field
Enter one or more sections that you want to select in the input field. To do this, enter the firstsection, followed by a minus sign, and then the last section. If you want to define an interval,after the last section enter a colon and then the interval. The entry "2-10:2" means that everysecond section is selected from section 2 to section 10.
Enter a comma after the first section if you want to define another section. You can also selectindividual sections separated by commas. By entering "2-10:2,14-18,20,23", you select everysecond section from section 2 to section 10, followed by sections 14 to 18, as well as sections20 and 23.
Time section
To show the section in full, click on the button.
Time Points dropdown list
You can select which time points of the input image you want to be used from the Time Pointsdropdown list. The following selection options are available:
Selects all time points of the input image.
Selects an individual time point.
Selects a continuous range of time points.
Selects several continuous ranges and individual time points.
Select Individual slider
Enter the time point that you want to select using the slider or spin box/input field.
button
Adopts the values from the current display. These values can also be found on the Dimensionstab.
Select Range slider
Enter the first and last time point that you want to select using the sliders or spin boxes/inputfields.
Interval checkbox
Activated: Interval mode is active. The Interval spin box/input field appears.
Interval spin box/input field
Enter the desired interval here. If you enter the value 2, for example, only every 2nd value fromthe range is considered.
All
Select Indi‐vidual
Select Range
Select Sever‐al
Image processing functions
Export/Import group Manual
Carl Zeiss Microscopy GmbH 251
Select Several input field
Enter one or more time points that you want to select in the input field. To do this, enter the firsttime point, followed by a minus sign, and then the last time point. If you want to define an inter‐val, after the last time point enter a colon and then the interval. The entry "2-10:2" means thatevery second time point is selected from time point 2 to time point 10.
Enter a comma after the first time point if you want to define another time point. You can alsoselect individual time points separated by commas. By entering "2-10:2,14-18, 20, 23", you se‐lect every second time point from time point 2 to time point 10, followed by time points 14 to 18,as well as time points 20 and 23.
Scene section
To show the section in full, click on the button.
Scene dropdown list
You can select which scenes of the input image you want to be used from the Scene dropdownlist.
Selects all scenes of the input image.
Selects an individual scene.
Selects a continuous range of scenes.
Selects several continuous scenes and individual scenes.
Select Individual slider
Enter the scene that you want to select using the slider or spin box/input field.
button
Adopts the values from the current display. These values can also be found on the Dimensionstab.
Select Range slider
Enter the first and last scene that you want to select using the sliders or spin boxes/input fields.
Interval checkbox
Activated: Interval mode is active. The Interval spin box/input field appears.
Interval spin box/input field
Enter the desired interval here. If you enter the value 2, for example, only every 2nd value fromthe range is considered.
Select Several input field
Enter one or more scenes that you want to select in the input field. To do this, enter the firstscene, followed by a minus sign, and then the last scene. If you want to define an interval, afterthe last scene enter a colon and then the interval. The entry "2-10:2" means that every secondscene is selected from scene 2 to scene 10.
All
Select Indi‐vidual
Select Range
Select Sever‐al
ManualImage processing functions
Export/Import group
252 Printed 06/2012
Enter a comma after the first scene if you want to define another scene. You can also selectindividual scenes separated by commas. By entering "2-10:2,14-18, 20, 23", you select everysecond scene from scene 2 to scene 10, followed by scenes 14 to 18, as well as scenes 20 and23.
Region section
To show the section in full, click on the button.
Region dropdown list
You can select which sections of the input image you want to be used from the Region drop‐down list.
The entire image is selected.
In the current image, drag out the rectangular region that you want to be used using the mouse.
X spin box/input field
Enter the X coordinate of the starting point of the region in the spin box/input field.
Y spin box/input field
Enter the Y coordinate of the starting point of the region in the spin box/input field.
W spin box/input field
Enter the width of the region in the spin box/input field.
H spin box/input field
Enter the height of the region in the spin box/input field.
Export To section
Export To display field
To open the Browse For Folder dialog window, click on the button to the right of the displayfield. Here you can select the folder to which you want to save the image that is being exported.The path of the export folder is displayed automatically in the display field.
Prefix input field
Here you can edit the prefix specified or enter a new name. The name of the original image isspecified by default.
OME TIFF Export
Using the OME TIFF Export function you can export your images into OME (Open MicroscopyEnvironment) TIFF format so that you can continue to use them in other programs. The imagesare then available as a multipage TIFF file.
OME TIFF Export parameters
Defaults button
All
Region
11.7.3
11.7.3.1
Image processing functions
Export/Import group Manual
Carl Zeiss Microscopy GmbH 253
Resets all settings to the default values.
See also
2 OME TIFF Export [➙ p.253]
Image Format section
Size slider
Enter the image size in percent using the slider or spin box/input field.
BigTIFF checkbox
Only visible if the Show All mode is activated.
Activated: Creates a BigTIFF image that can be bigger than 4 gigabytes and uses 64-bit offsetformat.
Image Data section
The following functions are only visible if the Show All mode is activated:
Original Data radio button
Activated: Exports the image with the original channel colors and the original display character‐istic curve.
Apply Display Characteristic Curve and Channel Color radio button
Activated: Exports the image with the changed channel color and display characteristic curvesettings. These settings are applied to the pixel values of the exported images. They are partic‐ularly important if you want to use dark images with a dynamic range of more than 8 bits in oth‐er programs.
Burn In Graphic checkbox
Activated: Burns the graphic elements into the image. The pixels under the graphic element(e.g. scale bars) are overwritten. The burnt-in graphic elements cannot be subsequently modi‐fied.
Dimensions section
The following functions are only visible if the Show All mode is activated:
Use All Dimensions radio button
Select this option if you want to export all dimensions without changing them.
Define Subset radio button
Select this option if you only want to export individual dimensions or subsets of individual di‐mensions.
ManualImage processing functions
Export/Import group
254 Printed 06/2012

InformationEach of the sections described below is only visible if the corresponding dimension is presentin the input image.
Channels section
To show the section in full, click on the button.
In the Channels section you can select which channels of the input image you want to be used.All channels are selected by default. To deselect a channel, click on the relevant channel but‐ton.
button
Adopts the values from the current display. These values can also be found on the Dimensionstab.
Z-Position section
To show the section in full, click on the button.
Z-Stack dropdown list
You can select which sections of the input image you want to be used from the dropdown list.
Selects all sections of the input image.
Selects an individual section.
Selects a continuous range of sections.
Selects several continuous ranges and individual sections.
Select Individual slider
Enter the section that you want to select using the slider or spin box/input field.
button
Adopts the values from the current display. These values can also be found on the Dimensionstab.
Select Range slider
Enter the first and last section that you want to select using the sliders or spin boxes/input fields.
Interval checkbox
Activated: Interval mode is active. The Interval spin box/input field appears.
Interval spin box/input field
Enter the desired interval here. If you enter the value 2, for example, only every 2nd value fromthe range is considered.
All
Select Indi‐vidual
Select Range
Select Sever‐al
Image processing functions
Export/Import group Manual
Carl Zeiss Microscopy GmbH 255

Select Several input field
Enter one or more sections that you want to select in the input field. To do this, enter the firstsection, followed by a minus sign, and then the last section. If you want to define an interval,after the last section enter a colon and then the interval. The entry "2-10:2" means that everysecond section is selected from section 2 to section 10.
Enter a comma after the first section if you want to define another section. You can also selectindividual sections separated by commas. By entering "2-10:2,14-18,20,23", you select everysecond section from section 2 to section 10, followed by sections 14 to 18, as well as sections20 and 23.
Time section
To show the section in full, click on the button.
Time Points dropdown list
You can select which time points of the input image you want to be used from the Time Pointsdropdown list. The following selection options are available:
Selects all time points of the input image.
Selects an individual time point.
Selects a continuous range of time points.
Selects several continuous ranges and individual time points.
Select Individual slider
Enter the time point that you want to select using the slider or spin box/input field.
button
Adopts the values from the current display. These values can also be found on the Dimensionstab.
Select Range slider
Enter the first and last time point that you want to select using the sliders or spin boxes/inputfields.
Interval checkbox
Activated: Interval mode is active. The Interval spin box/input field appears.
Interval spin box/input field
Enter the desired interval here. If you enter the value 2, for example, only every 2nd value fromthe range is considered.
All
Select Indi‐vidual
Select Range
Select Sever‐al
ManualImage processing functions
Export/Import group
256 Printed 06/2012

Select Several input field
Enter one or more time points that you want to select in the input field. To do this, enter the firsttime point, followed by a minus sign, and then the last time point. If you want to define an inter‐val, after the last time point enter a colon and then the interval. The entry "2-10:2" means thatevery second time point is selected from time point 2 to time point 10.
Enter a comma after the first time point if you want to define another time point. You can alsoselect individual time points separated by commas. By entering "2-10:2,14-18, 20, 23", you se‐lect every second time point from time point 2 to time point 10, followed by time points 14 to 18,as well as time points 20 and 23.
Scene section
To show the section in full, click on the button.
Scene dropdown list
You can select which scenes of the input image you want to be used from the Scene dropdownlist.
Selects all scenes of the input image.
Selects an individual scene.
Selects a continuous range of scenes.
Selects several continuous scenes and individual scenes.
Select Individual slider
Enter the scene that you want to select using the slider or spin box/input field.
button
Adopts the values from the current display. These values can also be found on the Dimensionstab.
Select Range slider
Enter the first and last scene that you want to select using the sliders or spin boxes/input fields.
Interval checkbox
Activated: Interval mode is active. The Interval spin box/input field appears.
Interval spin box/input field
Enter the desired interval here. If you enter the value 2, for example, only every 2nd value fromthe range is considered.
Select Several input field
Enter one or more scenes that you want to select in the input field. To do this, enter the firstscene, followed by a minus sign, and then the last scene. If you want to define an interval, afterthe last scene enter a colon and then the interval. The entry "2-10:2" means that every secondscene is selected from scene 2 to scene 10.
All
Select Indi‐vidual
Select Range
Select Sever‐al
Image processing functions
Export/Import group Manual
Carl Zeiss Microscopy GmbH 257

Enter a comma after the first scene if you want to define another scene. You can also selectindividual scenes separated by commas. By entering "2-10:2,14-18, 20, 23", you select everysecond scene from scene 2 to scene 10, followed by scenes 14 to 18, as well as scenes 20 and23.
Region section
To show the section in full, click on the button.
Region dropdown list
You can select which sections of the input image you want to be used from the Region drop‐down list.
The entire image is selected.
In the current image, drag out the rectangular region that you want to be used using the mouse.
X spin box/input field
Enter the X coordinate of the starting point of the region in the spin box/input field.
Y spin box/input field
Enter the Y coordinate of the starting point of the region in the spin box/input field.
W spin box/input field
Enter the width of the region in the spin box/input field.
H spin box/input field
Enter the height of the region in the spin box/input field.
Export To section
Export To display field
To open the Browse For Folder dialog window, click on the button to the right of the displayfield. Here you can select the folder to which you want to save the image that is being exported.The path of the export folder is displayed automatically in the display field.
ZVI Export
Using the ZVI Export function you can export your images into ZVI format so that you can con‐tinue to use them in AxioVision.
ZVI Export parameters
Export To display field
To open the Browse For Folder dialog window, click on the button to the right of the displayfield. Here you can select the folder to which you want to save the image that is being exported.The path of the export folder is displayed automatically in the display field.
All
Region
11.7.4
11.7.4.1
ManualImage processing functions
Export/Import group
258 Printed 06/2012
Prefix input field
Here you can edit the prefix specified or enter a new name. The name of the original image isspecified by default.
Defaults button
Resets all settings to the default values.
See also
2 ZVI Export [➙ p.258]
Image Import
Using the Image Import function you can create a multidimensional image (multichannel, Z-stack, time lapse, tile, position image) from individual images. The individual images may be inany of the external formats supported by ZEN (e.g. .bmp, .jpg, .tiff). The resulting image canthen be saved in CZI format and processed further using the functions available in ZEN.
Image Import Parameters
In the Image Import Parameters tool you can enter all the settings you need to import multidi‐mensional images. To select the desired dimension, activate the checkbox in front of the rele‐vant Section. At least one dimension must be selected. You can enter the settings for each di‐mension in the individual Sections.
You will find the settings for the import mode, import folder and for identifying your import im‐ages at the bottom of the tool.
Defaults button
Resets all settings to the default values.
Automatic button
Allows you to import all the images that are available in an import folder automatically.
Sequential button
Allows you to import an image sequence in a certain order (e.g. image dimensions that are en‐coded by means of numbers in the image name).
Import From display field
Displays the path of the import folder. To select a folder, click on the button to the right ofthe display field. The names of the images are displayed in the File Name list below the displayfield.
Folder radio button
Only visible if the Sequential button is activated.
To select a folder, click on the button to the right of the display field. The names of theimages are displayed in the File Name list below the display field.
11.7.5
11.7.5.1
Image processing functions
Export/Import group Manual
Carl Zeiss Microscopy GmbH 259

Multipage TIFF Image radio button
Only visible if the Sequential button is activated.
To select a multipage TIFF image, click on the button to the right of the display field. Thenames of the images are displayed in the File Name list below the display field.
See also
2 Image Import [➙ p.259]
Multichannel Image section
In the Multichannel Image section you can enter all the settings you need to import multichannelimages.
Multichannel Image checkbox
Activates the settings to import multichannel images. The C dimension (for multichannel im‐ages) is displayed automatically in the list in the Specify Name section.
No. column
Displays the channel number.
Dye column
Click on the dropdown list to select a dye. If the desired dye is not available, select the Emptyentry.
Color column
Displays the pseudo color for the dye. To change the color, click on the color field. Select thedesired color from the list.
Name column
Here you can enter a name for the dye. If you have selected a dye from the dropdown list, thename of the dye will appear automatically in the input field.
button
Shifts the selected channel down a line.
button
Shifts the selected channel up a line.
button
Adds a new channel.
button
Deletes the selected channel.
ManualImage processing functions
Export/Import group
260 Printed 06/2012

button
Opens the Options shortcut menu.
▪ AddAdds a new channel at the end of the list.
▪ CopyCopies the selected channel.
▪ Reset ColorResets the changed color of the selected channel to the default setting.
▪ DeleteDeletes the selected channel.
▪ Delete AllDeletes all channels and resets the first channel to the default settings.
Use Channel Name as Name checkbox
Only visible if the Show All mode is activated.
Uses the name specified in the Name column to identify the channel. The channel name will ap‐pear in the Preview display field in the Specify Name section.This deactivates the Name, StartIndex and Increment columns in the list.
Z-Stack section
In the Z-Stack section you can enter all the settings you need to import Z-stack images.
Z-Stack checkbox
Activates the settings to import Z-stack images. The Z dimension (for Z-stacks) is displayed au‐tomatically in the list in the Specify Name section.
Interval spin box/input field
Here you can enter the value in µm for the distance between the individual Z-sections. The totalheight of the Z-stack is calculated automatically from this value and the number of sections.
Sections spin box/input field
Here you can enter the number of sections.
The following functions are only visible if the Show All mode is activated:
Interval radio button
Activated: The Interval spin box/input field and the Range display field are visible.
Here you can enter the value in µm for the distance between the individual Z-sections. The totalheight of the Z-stack is calculated automatically from this value and the number of sections anddisplayed in the Range display field.
Range radio button
Activated: The Range spin box/input field and the Interval display field are visible.
Image processing functions
Export/Import group Manual
Carl Zeiss Microscopy GmbH 261

Here you can enter the total height of the Z-stack in µm. The distance between the individual Z-stacks is calculated automatically from this value and the number of sections and displayed inthe Interval display field.
Advanced Parameters checkbox
Activates additional parameters that are necessary for further processing of the imported image(e.g. for deconvolution).
Magnification dropdown list
Select the objective magnification that was used for acquisition from the dropdown list.
Immersion dropdown list
Select the immersion medium that was used for acquisition from the dropdown list.
Aperture spin box/input field
Here you can enter the value of the numerical aperture of the objective that was used for ac‐quisition.
Time Series section
In the Time Series section you can enter all the settings you need to import time lapse images.
Time Series checkbox
Activates the settings to import time lapse images. The T dimension (for time series) is dis‐played automatically in the list in the Specify Name section.
Interval spin box/input field
Here you can enter the value for the Interval between the individual time points. Select the unitof time from the dropdown list to the right of the spin box/input field.
Time Points spin box/input field
Here you can enter the number of time points.
The duration of the entire time series is calculated automatically from the interval and timepoints values.
The following functions are only visible if the Show All mode is activated:
Interval radio button
Activated: The Interval and Time Points spin boxes/input fields and the Duration display field arevisible.
Here you can enter the value for the interval between the individual time points. Select the unitof time from the dropdown list to the right of the spin box/input field. Enter the number of timepoints in the Time Points spin box/input field.
The duration of the entire time series is calculated automatically from the interval and timepoints values and displayed in the Duration display field.
ManualImage processing functions
Export/Import group
262 Printed 06/2012

Duration radio button
Activated: The Duration and Time Points spin boxes/input fields and the Interval display field arevisible.
Here you can enter the value for the duration of the entire time series. Select the unit of timefrom the dropdown list to the right of the spin box/input field. Enter the number of time points inthe Time Points spin box/input field.
The interval between the individual time points is calculated automatically from the duration andtime points values and displayed in the Interval display field.
Tiles section
Tiles checkbox
Activates the settings to import tile images. The M dimension (for MosaiX/tiles) is displayed au‐tomatically in the list in the Specify Name section.
Columns spin box/input field
Here you can enter the number of columns of the tile image.
Overlap spin box/input field
Here you can enter the percentage by which the tiles overlap.
Rows spin box/input field
Here you can enter the number of rows of the tile image.
Meander radio button
Select this option if the images to be imported were acquired in the Meander acquisition/travelmode.
Comb radio button
Select this option if the images to be imported were acquired in the Comb acquisition/travelmode.
Positions section
In the Positions section you can enter all the settings you need to import scenes.
Positions checkbox
Activates the settings to import images of individual scenes/motorized stage positions. The Sdimension (for Scene) is displayed automatically in the Specify Name field.
No. column
Displays the position number.
Image processing functions
Export/Import group Manual
Carl Zeiss Microscopy GmbH 263

X column
Enter the X coordinate of the position in the spin box/input field.
Y column
Enter the Y coordinate of the position in the spin box/input field.
button
Shifts the selected position down a line.
button
Shifts the selected position up a line.
button
Adds a new position.
button
Deletes the selected position.
button
Opens the Options shortcut menu.
▪ AddAdds a new position.
▪ DeleteDeletes the selected position.
▪ Delete AllDeletes all positions with the exception of the first position.
Scaling section
To show the section in full, click on the button.
Lateral Scaling (X) spin box/input field
Here you can enter the geometric scaling value for the X dimension of the image to be impor‐ted. Select the unit for the scaling value from the dropdown list to the right of the spin box/inputfield.
The following functions are only visible if the Show All mode is activated:
Define button
Enter the desired values in the Lateral Scaling (X) spin box/input field and in the Lateral Scaling(Y) spin box/input field. Select the unit for the scaling value from the dropdown list to the right ofeach spin box/input field.
Use Current button
Uses the geometric scaling currently selected and displays the values for Lateral Scaling (X)and Lateral Scaling (Y) with the corresponding unit in the relevant display field.
ManualImage processing functions
Export/Import group
264 Printed 06/2012

Specify Name section
In the Specify Name section you can enter all the settings you need to identify your images.
Prefix input field
Not available if the Sequential button is activated and the Multipage TIFF Image radio buttonhas been selected.
Here you can edit the prefix specified or enter a new name. The name of the original image isspecified by default.
Suffix input field
Not available if the Sequential button is activated and the Multipage TIFF Image radio buttonhas been selected.
Here you have the option of entering a suffix.
Name column
In the input field you can enter the name of the relevant dimension from the original imagename. A capital letter is displayed by default for the image dimension selected in each case(e.g. C for Channel, T for Time).
Start Index column
Enter the number of the first image in the spin box/input field.
End Index column
Only available if the Sequential button is activated.
Enter the number of the last image in the spin box/input field.
Increment column
Enter the increment in the spin box/input field. This allows you to specify whether you want ev‐ery image or every xth image to be imported.
Preview display field
Shows the full name of the image (prefix, dimensions, suffix).
Check Consistency button
Not available if the Sequential button is activated and the Multipage TIFF Image radio buttonhas been selected.
Checks the consistency of the selected settings and marks these in the File Name list.
Image processing functions
Export/Import group Manual
Carl Zeiss Microscopy GmbH 265

GlossaryBleaching Correction
The characteristics of a widefield fluorescencemicroscope are based on the assumption that allZ-planes have the same total brightness, irre‐spective of the focus position. Use is made ofbleaching correction by applying a correctionfactor to each Z-plane. However, this assump‐tion does not apply to techniques that result inthe generation of optical sections, such as confo‐cal images.
Clipping planes
The purpose of clipping planes is to cut open thecalculated 3D image so that elements on the in‐side can be visualized. Clipping planes can cutthe volume in such a way that either the front,back or both sides of the volume data are no lon‐ger visible. In addition, the clipping plane itselfcan be given various textures. This is a very im‐portant modeling option for analyzing 3D data.
Colocalization
Acquiring fluorescence images in several chan‐nels makes it possible to visualize the relation‐ship between biological structures. A combineddisplay of two channels in color overlay modemakes it easier to assert whether the compo‐nents are "colocalized", i.e. whether they are lo‐cated at the same position. Conventionally, twofluorescence channels are displayed in the formof a color-coded overlay. The most commonform is the red/green overlay. Regions in whichboth fluorescent dyes are present at the sameplace are displayed in yellow. It is not possible,however, to make quantitative statements con‐cerning the extent of colocalization on the basisof this display. At best, a qualitative statement ispossible with regard to whether or not two dyesare colocalizing. The Colocalization module isable to fill this gap and presents the user with atool that enables colocalization to be determinedquantitatively. Principle: It is always the colocali‐zation of two channels that is analyzed. Colocali‐zation results from the pixel-by-pixel comparisonof intensities for each channel.
Constrained Iterative
The best image quality is achieved using the iter‐ative maximum likelihood algorithm (see Schae‐fer et al.: "Generalized approach for acceleratedmaximum likelihood based image restoration ap‐plied to three-dimensional fluorescence micro‐scopy", J. of Microscopy, Vol. 204, Pt 2, Novem‐ber 2001, pp. 99ff.). This algorithm is able to cal‐culate light from various focal planes back to itsplace of origin. Consequently, with this method itis possible to derive the 3D structure from fluo‐rescence images with the correct brightness dis‐tribution and to visualize optical sections. It is al‐so possible for missing information to be partiallyrestored from neighboring voxels. The spatialresolution can be increased without artifacts upto a theoretical limit (one voxel). It is essential forZ-stacks to have been acquired in accordancewith Nyquist. Acquiring sufficient planes aboveand below the structure of interest is also imper‐ative for achieving good results. As this is a com‐plex mathematical method, the calculation cantake longer, depending on the image size andthe PC being used.
Costes
Costes et al. (Biophysical Journal, 2004, vol. 86,pp 3993-4003) have published a statistical meth‐od with the help of which an attempt is made todetermine an optimal colocalization thresholdautomatically. This takes place by initially maxi‐mizing the threshold for both channels and thengradually reducing it. With each step Pearson'sCorrelation Coefficient is determined for all pix‐els below the set value. These steps are repea‐ted until the Pearson value is minimized (ideallya value of 0 for perfectly colocalizing channels).See the publication for further details. This meth‐od has been implemented in Colocalization.Clicking on Auto initiates the above iterativeprocess, which, depending on the sample, cantake several seconds. The threshold now setcorresponds to the confidence criterion calcula‐ted. This method works very well with large, dif‐fusely stained structures such as nucleoplasm ordiffuse cytoplasmic structures. Under certain cir‐
Manual Glossary
266 Printed 06/2012
cumstances it does not function so well for smallstructures (e.g. nuclear speckles or vesicularstructures), particularly in the case of widefieldimages, where the signal to background ratio isnot as good as it is with methods that involve thegeneration of optical sections (e.g. LSM, TIRF orApoTome). The Regions button becomes activeas soon as a region is inserted into the scatterplot. It remains active as long as regions are se‐lected or moved there. Activating and deactivat‐ing the button makes it possible to switch be‐tween threshold selection using the mouse andthe selection/moving of selected regions in thescatter plot image. If regions are defined in thescatter plot, the corresponding data appear inthe table in addition to the overall image.
Display characteristic curve
The display characteristic curve allows you todefine the range of the gray value histogram ofan image that you want to display on the screen.The limit on the left defines the gray value up towhich all pixels are displayed as pure black(black value), while the limit on the right definesthe gray value from which all pixels are dis‐played as pure white (white value). The curva‐ture of the curve defines the so-called gammavalue.
Dynamic range
The dynamic range describes the number ofbrightness gradations that a camera or anotherdetector is able to distinguish. Modern, scientificdigital CCD cameras, for example, have a dy‐namic range of up to 2^16 gray levels. In thiscase we talk of 16 bit cameras.
Fast Iterative
The "Fast Iterative" method is an iterative resto‐ration method that uses only one iteration perconvolution step (see Meinel, E. S.: Origins oflinear and nonlinear recursive restoration algo‐rithms. J.Opt.Soc.Am, 3 (6), 1986, 787-799). Noregularization is used in this case. Due to thefast processing and convergence after just a fewiterations, this method is suitable in particular forthe processing of larger time lapse images. Theresults of the method can quickly lead to good
results and remove most of the out-of-focus light.They do not, however, create quantitative bright‐ness conditions in the image. If undersampledimages are present, artifact formation may alsoresult.
Field Feature
A field feature is calculated for all segmented ob‐jects of a class. The geometric or intensity pa‐rameters of all objects of the class, e.g. the areaor the average intensity, are added together. Inaddition, all objects can be counted, for example,or the area of the objects in relation to the totalimage area can be calculated as a percentage.
Gamma value
The gamma value makes it possible to correctthe display of images on computer screenswhich do not allow the linear display of gray val‐ue curves. By changing the gamma value youcan emphasize certain intensity ranges withinyour image when it is displayed on the screen. Avalue <1 emphasizes the ranges of medium pix‐el intensity (medium gray values), while a value>1 emphasizes the dark and bright pixel intensi‐ties and therefore increases the contrast. Therecommended settings are 0.8 for fluorescenceimages, 1.2 for phase contrast or DIC imagesand 0.45 for true color images. Please bear inmind that a "correct" gamma value setting de‐pends on numerous parameters, such as screensettings, ambient brightness, etc., and a univer‐sal setting cannot therefore be given.
Gaussian Distribution
The emission of fluorescent light in fact follows aPoisson distribution. If, however, detector noisepredominates during imaging, or the image dataare only just above the camera noise and there‐fore very dark, a normal distribution according toGauss tends to apply to such images.
Generalized Cross Validation (GCV)
Regularization, which lessens the influence ofnoise during restoration, is normally controlledby a parameter that in most cases is determinedheuristically via trial and error. The "generalizedcross validation" (GCV) method makes it possi‐
Glossary Manual
Carl Zeiss Microscopy GmbH 267

ble to estimate this parameter even under thecomplex conditions of Poisson maximum likeli‐hood minimization.
Halo effect
Image display
A maximum range of 256 gray levels (black andwhite image) or 16 million colors can normally bedisplayed on a screen. Modern digital camerascapture a much larger range: black and whitecameras up to 65536 values and color camerastheoretically up to (65536)3 colors (281 billion).The display of these gray values/colors thereforeneeds to be adjusted for the monitor by the user.For this adjustment an upper and a lower gray/color value are defined. All gray/color values be‐tween these limits are displayed on the monitorwithin the 256 gray values/16 million colors thatcan be represented.
Lamp Flicker
This phenomenon mainly occurs if fluorescentarc lamps are operated for a long period of time.Under certain circumstances alternating darkerand brighter layers can then appear in the Z di‐rection in Z-stacks. This effect may prevent 3Ddeconvolution from being usefully applied, forexample.
Maximum mode
In the case of a maximum intensity projection,only the pixels with the highest intensity are dis‐played along the observation axis. This view iswell suited to the two-dimensional display ofthree-dimensional images, e.g. in publications,one reason being that a maximum transparencyeffect is only visible in this mode.
Mixed mode
In Mixed mode, a volume can be displayed inboth Surface mode and Transparency mode. Inthe case of multichannel images, for example,structures inside a cell, such as FISH signals ornucleoli, can be displayed in Surface mode andthe cytoplasm around these structures can be
displayed transparently in another channel. Thismeans that even highly complex spatial relation‐ships can be shown convincingly.
Nearest Neighbor
The Nearest Neighbor method uses the simplestand fastest algorithm (Castleman, K.R., DigitalImage Processing, Prentice-Hall, 1979). Its func‐tion is based on subtraction of the out-of-focusinformation in each plane of a stack, taking theneighboring sections above and below the cor‐rected Z-plane into account. This method is ap‐plied sequentially to each plane of the entire 3Dstack. It allows you to enhance contrast quickly,even if image stacks have not been put togetheroptimally.
Nyquist Criterion
The Nyquist criterion states that a signal must bedetected with at least double precision in orderto reliably acquire all the frequencies in the sig‐nal. In the case of images acquired with coarserresolution, undesired effects such as aliasingmay otherwise result. For the deconvolution ofmicroscope images, this means, in practicalterms, that images should be acquired with apixel resolution that is at least double the opticalresolution, both in the lateral and axial direction.
Object Feature
An object feature is calculated for an individualsegmented object. It describes a geometric or in‐tensity property of the object, e.g. its area or itsaverage intensity.
Point Spread Function ("PSF")
All optoelectronic effects that influence the crea‐tion of a microscope image can be describedmathematically in the form of the point spreadfunction (PSF). If the PSF is known, deconvolu‐tion can be used to largely remove the negativeeffects from microscope images. There are threepossible ways to determine the PSF: theoretical‐ly through knowledge of the key optical parame‐ters, experimentally through measurement usingfluorescent beads of a known diameter, or blind‐ly using a method that works with less priorknowledge. In ZEN the theoretical model accord‐
Manual Glossary
268 Printed 06/2012

ing to Lanni and Gibson has been implemented,which also models asymmetries like those thatcan arise due to spherical aberrations (see S. F.Gibson, F. Lanni, "Experimental test of an ana‐lytical model of aberration in an oil-immersionobjective lens used in three-dimensional light mi‐croscopy", J. Opt. Soc. Am. A, vol. 8, no. 10, pp.1601-1613, October 1991).
Poisson Distribution
The emission of photons by fluorochromes fol‐lows a statistical distribution, known as a Pois‐son distribution. This is the preferred model tak‐en as the basis for the deconvolution calculation.It applies if the predominant proportion of imagenoise is caused by shot noise ("salt and peppernoise"). This assumption applies to images thathave been acquired using good, low-noise de‐tectors, the dynamic range of which has beenutilized to a certain extent.
Pseudo color assignment
In fluorescence microscopy, pseudo color as‐signment describes the assignment of any artifi‐cially selected color to the channel of a multi‐channel fluorescence image. As it is mostly mon‐ochrome cameras (which produce black andwhite images rather than "true colors") that areused in this area of application, we talk of pseu‐do coloring.
Regularization
Working with real microscope images that are af‐fected by noise leads to considerable difficultieswith the practical application of deconvolutionmethods, which is why regularization (e.g. ac‐cording to Tikhonov-Miller-Phillips) is essential.Regularization is a method that lessens the influ‐ence of noise by means of various penaltyterms. Stronger regularization leads to weakerrestoration and weaker regularization to strongerrestoration, although in this case noise is also in‐tensified.
Regularized Inverse Filter
The inverse filter is a genuine 3D method andgenerally achieves better results than the Near‐est Neighbor algorithm. It essentially involves di‐
viding the Fourier transformation ("FT") of thevolume by the FT of the PSF, which can be per‐formed very quickly. In the real space this corre‐sponds to deconvolution. In addition, a statisticalmethod ("General Cross Validation – GCV") isapplied, which determines the noise componentof the image and automatically sets the restora‐tion strength to the optimum level in line withthis. This process is also known as regulariza‐tion. The method is very well suited to the pro‐cessing of several image stacks in order to pre‐select images for the application of the iterative"high-end" method. Z-stacks must, however,have been acquired at the correct (Nyquist) dis‐tance. The additional acquisition of Z-planesabove and below the structure of interest is rec‐ommended.
Render Series
To display a 3D volume on the screen, each im‐age must be recalculated. This takes time and,in the case of large images, cannot be done in‐teractively. You can, however, have a series ofindividual images calculated which represent theanimation that you want. Such an image seriescan be displayed considerably faster and morefluidly than is possible interactively on the screenas, in this case, the views no longer have to bererendered. Furthermore, an image series likethis lends itself extremely well to being exportedas a film.
Shadow mode
In Shadow mode the structures in the image areilluminated by means of a virtual light source.The image stack is viewed from above, as ifthrough the microscope's eyepiece, and a shad‐ow is projected onto a virtual base (in the imagebackground). This gives the data a reference inrelation to the space, which makes visualizationeasier. The impression of a three-dimensionalstructure is created from the combination of lightbeing reflected and opacity (degree of impene‐trability to light) and the casting of a shadow.
Glossary Manual
Carl Zeiss Microscopy GmbH 269

SmartSetup
Smart Setup offers you support when configuringmultichannel acquisition experiments. Select thefluorescent dyes and contrast techniques thatyou want to include in your experiment from alarge dye database. Smart Setup takes the con‐figuration of your microscope hardware and theproperties of the selected dyes into account.Based on this information it makes one or moresuggestions for acquisition. You can adopt theseinto your experiment as required and make fur‐ther changes to them there.Smart Setup alsoconfigures the motorized components of yoursystem for the acquisition of multichannel im‐ages. It does not, however, influence any cam‐era parameters (e.g. exposure time or resolu‐tion) and also does not change any parametersof other acquisition dimensions (e.g. Z-stack,time series or multiposition acquisitions).
Spherical Aberration
Every objective requires the use of a defined im‐mersion medium to deliver the best optical reso‐lution. In microscopy practice, particularly in thearea of biosciences, it is not always possible,however, to embed the sample in a medium withthe correct refractive index. When light entersthe embedding medium with the wrong refractiveindex this results in "spherical aberration". ThePSF becomes more asymmetrical the furtheraway from the cover slip it is measured. In prac‐tical terms this becomes noticeable in the form ofan increasing loss of brightness as the distancefrom the cover slip increases. It is possible tocompensate for spherical aberration either byusing objectives with correction rings or objec‐tives that have been calculated for certain em‐bedding media (e.g. aqueous solutions). Withincertain limits, however, spherical aberration canalso be compensated for during deconvolution,by taking the parameters responsible for this ef‐fect into consideration when calculating the theo‐retical PSF. For further details see S. F. Gibson,F. Lanni, "Experimental test of an analyticalmodel of aberration in an oil-immersion objective
lens used in three-dimensional light microscopy",J. Opt. Soc. Am. A, vol. 8, no. 10, pp.1601-1613, October 1991.
Surface mode
The two modes previously described display thedata with soft transitions or with a transparentcharacter, depending on the setting. In Surfacemode, the program calculates solid surfaces("isosurfaces") from the gray values, which em‐phasizes particularly flat structures (e.g. cellwalls of plant cells). This display can be used ifyou want to draw attention to certain structures,while other, internal structures are hidden.
Threshold
Which threshold is the correct one is a questionthat is frequently asked. Unfortunately it is notpossible to give a definitive answer to this ques‐tion, particularly because this often depends onthe problem and the properties of the sample.Generally speaking it can only be said that thebest approach is to determine the thresholds us‐ing appropriate control samples, e.g. sampleswithout colocalization as a negative control andsamples with biologically relevant colocalizationas a positive control. Thresholds determined inthis way can, under certain circumstances, betransferred to the sample of interest.
Transparency mode
In Transparency mode a three-dimensional im‐age is calculated with a transparency effect. Atleast two 2D texture stacks are calculated forthis from different views, which are used de‐pending on the position angle. In contrast toShadow mode, in this case the scene is illumina‐ted from behind by diffuse, white light. Using thesetting options, in this mode you can "mix" sev‐eral channels with one another and also makeinformation visible inside a structure. This view istherefore particularly well suited to visualizingthe spatial relationship between structures withinthe image.
Manual Glossary
270 Printed 06/2012