zero brine preliminary lca and lcc report fnial 29th may …
TRANSCRIPT

0
D7.3 Preliminary LCA and LCC of the Demonstration Projects An initial analysis

ZERO BRINE – Industrial Wastewater – Resource Recovery – Circular Economy 1
Revision no Date Description Author(s)
0.1 31 May. 19 Final draft As above
1 R=Document, report; DEM=Demonstrator, pilot, prototype; DEC=website, patent fillings, videos, etc.; OTHER=other
2 PU=Public, CO=Confidential, only for members of the consortium (including the Commission Services), CI=Classified
Deliverable x.y Name of deliverable
Related Work Package WP7 - Evaluation of Zero Brine Systems sustainability performance
Deliverable lead IVL Swedish Environmental Research Institute
Author(s) Steve Harris (IVL) Georgios Archimidis Tsalidis (TU Delft) Gijsbert Korevaar (TU Delft) Despina Bakogianni (NTUA) Christina Papadaskalopoulous (NTUA) Joan Berzosa Corbera (EURECAT) José Jorge Espi (EURECAT)
Contact [email protected]
Reviewer
Grant Agreement Number 730390
Instrument Horizon 2020 Framework Programme
Start date 1.6.2017
Duration 48 months
Type of Delivery (R, DEM, DEC, Other)1 R
Dissemination Level (PU, CO, Cl)2 PU
Date last update 29th May 2019
Website www.zerobrine.eu
Name of researcher(s) with roles
The ZERO BRINE project has received funding from the European Commission under the Horizon 2020 programme, Grant Agreement no. 730390. The opinions expressed in this document reflect only the author’s view and do not reflect the European Commission’s opinions. The European Commission is not responsible for any use that may be made of the information it contains.
ZERO BRINE – Industrial Wastewater – Resource Recovery – Circular Economy 2
Table of Contents
1. Introduction ............................................................................................................ 5
2. Case Study Introductions ......................................................................................... 6
2.1 Water Plant in The Netherlands ....................................................................................... 6
2.2 Coal Mine in Poland ........................................................................................................ 6
2.3 Textile Industry in Turkey ................................................................................................ 7
2.4 Silica Industry in Spain .................................................................................................... 7
3. Approach and Methodology .................................................................................... 8
3.1 Introduction.................................................................................................................... 8
3.2 Life Cycle Assessment...................................................................................................... 8
3.3 Life Cycle Costing ............................................................................................................ 9
4. Case Study 1: Demineralised water, The Netherlands ............................................. 12
4.1 Intro ............................................................................................................................. 12
4.2 Goal and Scope ............................................................................................................. 13
4.2.1 Goal and functional unit .................................................................................................. 13
4.2.2 Allocation ......................................................................................................................... 13
4.2.3 System boundaries .......................................................................................................... 14
4.2.4 Study assumptions ........................................................................................................... 15
4.3 LCI ................................................................................................................................ 15
4.3.1 Demineralized water plant .............................................................................................. 15
4.3.2 Zero Brine system ............................................................................................................ 16
4.4 LCIA .............................................................................................................................. 19
4.4.1 Results.............................................................................................................................. 19
4.5 Life Cycle Interpretation ................................................................................................ 20
4.5.1 Contribution analysis ....................................................................................................... 20
4.5.2 Design recommendations ................................................................................................ 23
4.6 LCC ............................................................................................................................... 23
4.7 Conclusions ................................................................................................................... 26
4.8 Further work ................................................................................................................. 26
5. Case Study 2: Coal mine, Poland ............................................................................ 28
5.1 Intro ............................................................................................................................. 28
5.2 Goal and Scope ............................................................................................................. 29
5.3 LCI ................................................................................................................................ 31
5.4 LCIA .............................................................................................................................. 34

ZERO BRINE – Industrial Wastewater – Resource Recovery – Circular Economy 3
5.5 LCC ............................................................................................................................... 35
5.6 Discussion ..................................................................................................................... 38
5.6.1 LCA Results....................................................................................................................... 38
5.6.2 LCC Results ....................................................................................................................... 38
5.6.3 Design recommendations ................................................................................................ 38
5.6.4 Further work .................................................................................................................... 39
6. Case Study 3: Textile Industry, Turkey .................................................................... 40
6.1 Intro ............................................................................................................................. 40
6.2 Goal and Scope ............................................................................................................. 41
6.3 LCI ................................................................................................................................ 43
6.4 LCIA .............................................................................................................................. 44
6.5 LCC ............................................................................................................................... 46
6.6 Discussion ..................................................................................................................... 49
6.6.1 Results.............................................................................................................................. 49
6.6.2 Design recommendations ................................................................................................ 49
6.6.3 Further work .................................................................................................................... 49
7. Case Study 4: Silica Industry, Spain ........................................................................ 51
7.1 Intro ............................................................................................................................. 51
7.2 Goal and Scope ............................................................................................................. 52
7.2.1 Function and functional unit ........................................................................................... 52
7.2.2 Allocation ......................................................................................................................... 53
7.2.3 System boundaries .......................................................................................................... 53
7.2.4 Scenarios /process configurations ................................................................................... 57
7.2.5 Data quality ...................................................................................................................... 57
7.3 LCI ................................................................................................................................ 57
7.4 LCIA .............................................................................................................................. 62
7.5 LCC ............................................................................................................................... 65
7.6 Discussion ..................................................................................................................... 69
7.6.1 Results.............................................................................................................................. 69
7.6.2 Design recommendations ................................................................................................ 70
7.6.3 Further work .................................................................................................................... 71
7.6.4 Conclusions ...................................................................................................................... 71
8. Discussion and conclusion ..................................................................................... 72
8.1 Discussion ..................................................................................................................... 72
8.2 Conclusion and next steps ............................................................................................. 74
9. References ............................................................................................................ 76
10. Appendix 1: Demineralised Water Plant, The Netherlands ..................................... 79
11. Appendix 2: Polish Coal Mine ................................................................................. 81
ZERO BRINE – Industrial Wastewater – Resource Recovery – Circular Economy 4
List of Abbreviations
CrIEM Crystallization with Ion Exchange Membranes ED Electrodialysis EFC Eutectic Freeze Crystallization GHG Greenhouse Gas Emissions LCA Life Cycle Assessment LCC Life Cycle Costing LCI Life Cycle Inventiry IEX Ion Exchange MF Membrane Filtration NF Nanofiltration RO Reverse Osmosis SLCA Life Cycle Social Assessment TOC Total Organic Carbon ZB Zero Brine

ZERO BRINE – Industrial Wastewater – Resource Recovery – Circular Economy 5
1. Introduction
The Zero Brine (ZB) project is focused on developing innovative recovery solutions to close the loop
of saline impaired effluents (brines) generated by the process industry. It aims to eliminate
wastewater discharge and minimise environmental impact of industrial operations through the
integration of several existing and innovative technologies. These technologies are targeted to
recovery high quality end products with high purity to provide optimum market value.
The largest source of chloride effluent releases in Europe is the process industry, with the chemical
industry’s being the predominant source with 11.5 million tonnes/year, followed by the steel
industry 323,000, power sector 213,000, pulp &paper 58,000 and food & beverage for 37,000
tonnes/year (Xevgenos et al. 2018). Economic treatment of the brine effluents is a major challenge
due the various composition and complexity of the treatment solutions. Industry is also the second
largest water consumer accounting for 22% of global demand and can therefore play a significant
role in tackling water stress. In many countries the chemical industry is the most water intensive
industry accounting for over 30% of industrial water consumption.
Zero Brine therefore aims to close the loop of these problematic effluents through the recovery of
water and valuable components of the effluents that include minerals (e.g. sodium chloride, sodium
sulphate), regenerated acids, caustics and magnesium. Zero Brine consists of four case study projects
which aim to develop and demonstrate the Zero Brine approach under different industrial
circumstances:
Demineralised water effluent in The Netherlands.
Coal mine effluent in Poland.
Textile industry effluent in Turkey.
Silica industry effluent in Spain.
The different case studies utilise different configurations of water treatment technologies to treat
and recover the various constituents of the water. The Zero Brine approach is to combine existing
technologies such as reverse osmosis and nanofiltration with newly developed innovative
technologies: eutectic freeze evaporation, crystallisation with ion exchange membranes and a
forward-feed multiple effect distillation (MED) evaporator. Each case study requires different
configurations of these technologies.
Work package 7 of the ZB project involves a comprehensive sustainability assessment of the ZB
systems to verify the sustainability performance of the industrial applications. The assessment will
combine life cycle assessment (LCA), life cycle costing LCC) and a Social LCA (SLCA). The ultimate aim
is to compare the ZB system against the existing treatment process.

ZERO BRINE – Industrial Wastewater – Resource Recovery – Circular Economy 6
This report details the preliminary LCA and LCC of the case studies utilising bench scale and pilot
scale data, as well as data from literature and other sources. The objectives are to:
Provide a preliminary assessment of the environmental hotspots of the ZB system.
Provide a preliminary LCC that gives an initial indication of the life cycle costs of the ZB
processes.
Utilise the results of the LCA and LCC to inform the design process of the ZB systems to
improve the environmental performance where possible (in terms of aspects such as
optimisation, choice of chemicals and materials etc.).
At this stage in the development process the data (bench scale and pilot plant scale) is not fully
representative of how the full-scale plants will perform. This is considered as much as is currently
possible in the analysis. In addition, at this stage of the project, adequate data was not available on
the existing treatment processes that would allow a comparison with the ZB systems. Therefore, in
this report the most of analysis is only of the ZB systems. Some cursory comparisons were possible
however for the LCC which are described in the individual case studies.
2. Case Study Introductions
2.1 Water Plant in The Netherlands The Demineralized Water Plant (DWP) in the Botlek area owned by EVIDES is a large-scale
demonstration of the ZB project using a combination of ion exchange and membrane technology:
Dissolved Air Flotation (DAF), Cationic Exchange Resin, Reverse Osmosis and Mixed Bed Ion Exchange.
There are two sites at the DWP that both generate a brine stream. The first brine is generated at Site
1 from a water softening process, whilst the second brine stream is generated at Site 2 by the reverse
osmosis process.
The aim is to demonstrate the Nanofiltration – Evaporation concept for the treatment of ion
exchange (IX) regenerate and RO concentrate at large industry scale as well as to demonstrate the
Anionic Ion Exchange (IX) – Nanofiltration (NF) – Evaporation – Eutectic Freeze Crystallization (EFC)
concept at demonstration scale. Part of the energy for the brine treatment is derived from waste
heat. Waste heat and wastewater streams will be combined in a multi-company site environment
eliminating brine effluent (target: zero liquid discharge) of the industrial water supplier, recovering
high purity magnesium products (target: magnesium purity >90%), NaCl solution and sulphate salts
and recycling streams within the site (target: >70% internal recycling of materials recovered).
2.2 Coal Mine in Poland The pilot plant for the Polish case study will be located at the ZG Bolesław Śmiały Coal Mine operated
by PGG. The aim is to demonstrate the benefits of the ZB system to effectively treat the mine water
salinity, whilst recovering several valuable constituents from the water. The aim is to decrease the

ZERO BRINE – Industrial Wastewater – Resource Recovery – Circular Economy 7
energy consumption by 50% compared to the energy consumption of a reverse osmosis-vapour
compression system, which represents current best practice. The coal mine water, with a salinity of
ca. 23 g/L and rich in calcium sulphate, will be treated using integrated system consisting of
nanofiltration, reverse osmosis and electrodialysis with the aim to recuperate valuable raw materials,
such as concentrated brine, magnesium hydroxide, and high-quality RO permeate.
2.3 Textile Industry in Turkey The Turkish case study examines the potential of a ZB system to be integrated into a textile
manufacturing plant to treat the brine whilst recovering valuable components for reuse. The pilot
plant will be located at the ZORLU Textile and Energy Groups at Büyükkarıştıran- Lüleburgaz,
Kırklareli, Turkey. The methodology involves physical and chemical characterization studies, followed
by bench scale treatability studies. Technology options that are tested include nanofiltration,
oxidation and ion exchange.
Initial analysis suggested that the ZB system together with waste heat recovery from the textile
operation, will reduce the water consumption by 50 kt/year through water reuse, recover 400 tonnes
of NaCl per year for use in production processes and lead to a reduction of 200 t/year of CO2
emissions.
2.4 Silica Industry in Spain The pilot plant will be located at IQE in Zaragoza, Spain, a producer of chemicals and silica. The aim is
to demonstrate the technical and economic feasibility of a ZB system to recover water, sodium
sulphate, waste heat and alkalis from silica industry brine. The case study includes the technologies
nanofiltration, eutectic freeze crystallization, forward feed evaporation and electro dialysis with
bipolar membranes. The case study will also examine the benefits of using regenerated membranes
derived from a desalination plant.

ZERO BRINE – Industrial Wastewater – Resource Recovery – Circular Economy 8
3. Approach and Methodology
3.1 Introduction This report presents the preliminary LCA and LCC analysis using the best available data to date.
Although the aim of WP7 is to compare the ZB systems with the existing treatment solutions this has
not been possible at this stage in the project due to data limitations, partly due to the development
stage of the project. The following sections provide a brief introduction of LCA and LCC and the
approach used in this report.
Concurrent to this preliminary analysis has been the development of a Unified Approach for the
sustainability assessment. The aim of the unified approach is to provide a framework to ensure
consistency across the LCA and LCC research on the case studies. This will help to ensure that the
analysis is done to the highest standard and that the results can be compared across the case studies.
The Unified Approach also aims to compare the ZB systems with the reference system so that the
advantages of installing such a system in other similar industrial situations can more easily be
assessed.
However, part of the development of the Unified Approach is to first understand the systems,
challenges, data limitations and other LCA relevant aspects, of the case studies. Unfortunately, due
to the timing of the preliminary analysis and many challenges getting the initial data, it has not been
possible at this stage to fully develop the Unified Approach. Therefore, each case study in the present
analysis has been required to utilise the available data and information and therefore there are some
differences across the case studies.
In the next phase of the ZB project, the focus will be on developing the Unified Approach so that
consistency is applied across the next stages of the LCA, LCC and Social LCA analysis.
3.2 Life Cycle Assessment Life cycle assessments (LCA) investigate the environmental impacts related to a product or a system
throughout its complete life cycle. This includes evaluating energy and resource consumption as well
as emissions, from all life cycle stages including; material production, manufacturing, use and
maintenance, and end-of-life.
LCA is a widely used and accepted method for studies of environmental performance of various
products and systems, for more details on how a LCA is performed we refer the reader to the
literature such as Rebitzer et al. (2004) and the draft guidelines for Product Environmental Footprint
(PEF, 2012). The LCA in this report is performed in accordance with ISO 14040:2006 (European
Committee for Standardization, 2006) and ISO 14044:2006 standards (European Committee for
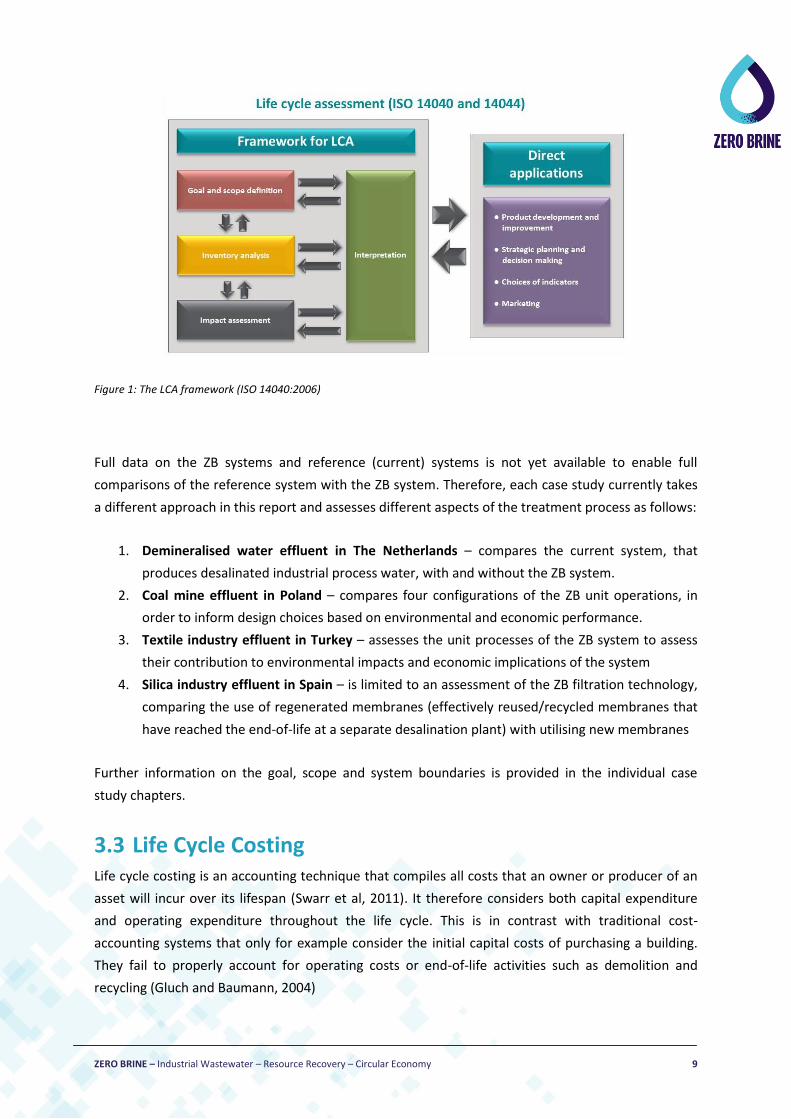
Standardization, 2006). A schematic overview of a life cycle is shown in Figure 1.
ZERO BRINE – Industrial Wastewater – Resource Recovery – Circular Economy 9
Figure 1: The LCA framework (ISO 14040:2006)
Full data on the ZB systems and reference (current) systems is not yet available to enable full
comparisons of the reference system with the ZB system. Therefore, each case study currently takes
a different approach in this report and assesses different aspects of the treatment process as follows:
1. Demineralised water effluent in The Netherlands – compares the current system, that
produces desalinated industrial process water, with and without the ZB system.
2. Coal mine effluent in Poland – compares four configurations of the ZB unit operations, in
order to inform design choices based on environmental and economic performance.
3. Textile industry effluent in Turkey – assesses the unit processes of the ZB system to assess
their contribution to environmental impacts and economic implications of the system
4. Silica industry effluent in Spain – is limited to an assessment of the ZB filtration technology,
comparing the use of regenerated membranes (effectively reused/recycled membranes that
have reached the end-of-life at a separate desalination plant) with utilising new membranes
Further information on the goal, scope and system boundaries is provided in the individual case
study chapters.
3.3 Life Cycle Costing Life cycle costing is an accounting technique that compiles all costs that an owner or producer of an
asset will incur over its lifespan (Swarr et al, 2011). It therefore considers both capital expenditure
and operating expenditure throughout the life cycle. This is in contrast with traditional cost-
accounting systems that only for example consider the initial capital costs of purchasing a building.
They fail to properly account for operating costs or end-of-life activities such as demolition and
recycling (Gluch and Baumann, 2004)
ZERO BRINE – Industrial Wastewater – Resource Recovery – Circular Economy 10
LCC has a considerable history that predates LCA and exists in different forms with different
approaches (Swarr et al, 2011)). Gluch and Baumann (2004) identified at least ten different
techniques that fall under the remit of life cycle costing and which address environmental concerns
at varying degrees. However, it is only within the last 20 years that it has begun to be aligned with
and associated with LCA. LCC has not been standardised as has LCA, but the Society of Environmental
Toxicology and Chemistry (SETAC) developed a code of practice (Swarr et al. 2011b).
LCC is defined in the International Organization for Standardization standard, Buildings and
Constructed Assets, Service-life Planning, Part 5: Life-cycle Costing (ISO 15686-5) as an “economic
assessment considering all agreed projected significant and relevant cost flows over a period of
analysis expressed in monetary value. The projected costs are those needed to achieve defined levels
of performance, including reliability, safety and availability.”
Typical LCC analyses are therefore are based on (IISD, no date):
purchasing costs and all associated costs such as delivery, installation, commissioning and
insurance;
operating costs, including utility costs such as energy and water use and maintenance costs;
end-of-life costs such as removal, recycling or refurbishment and decommissioning;
longevity and warranty time frames of the asset.
IISD (no date) identify several inconsistencies in the application of LCC. Furthermore, they note that
there is too much emphasis on financial returns and wider socio-economic benefits need to be more
fully included (IISD, no date). This can include both social benefits and avoided social costs enabled
by a project or tender. They note however, that this can be extremely challenging to forecast with an
acceptable degree of certainty. For example, avoided unemployment benefits or health care costs
are especially difficult to forecast.
The approach adopted in ZB is to include two components in line with Swarr et al. (2011b):
1) Costs linked to its development or use, such as:
a. Costs relating to acquisition.
b. Operational costs, such as consumption of energy and other resources.
c. Maintenance and repair costs.
d. End of life costs, such as collection and recycling costs.
2) Costs imputed to environmental externalities linked to the product, service or works during
its life cycle (e.g. cost of emissions of greenhouse gases and other climate change mitigation
costs)
However, as in the LCA approach, at this stage in the project there are several limitations in the data
availability and the development stage of the project that limit the current analysis. Therefore, in the
current report the LCC is limited to the first component.
ZERO BRINE – Industrial Wastewater – Resource Recovery – Circular Economy 11
For the inclusion of costs in the LCC we make the following definitions:
CAPEX represent costs which are included at the beginning of the project, generally just a
single time (price of the plant, taxes, fees, permits). These costs tend to represent low
contributions to the functional unit, due to the investment is repaid during the whole
lifespan of the system. Therefore, CAPEX costs are directly dependant on the lifespan, and its
final value may vary through time.
OPEX costs rely on continuos cashflows that the plant needs to operate. These costs have a
fixed ratio per functional unit (kWh/m3, ml/kg, etc). These values only depend on system
performance, and time or lifespan do not influence on them. Generally, these costs consider
energy and chemical consumption, staff, transport, waste management from operation, and
products. The main exception is “spare parts” category, which is considered as OPEX: they
are not introduced continuously in the system, but periodically.
However, at this stage the individual case studies have taken different approaches based on data
availability. For the Turkey and Polish case studies, the analysis only includes the operating costs, as
data on capital expenditure was not currently available.
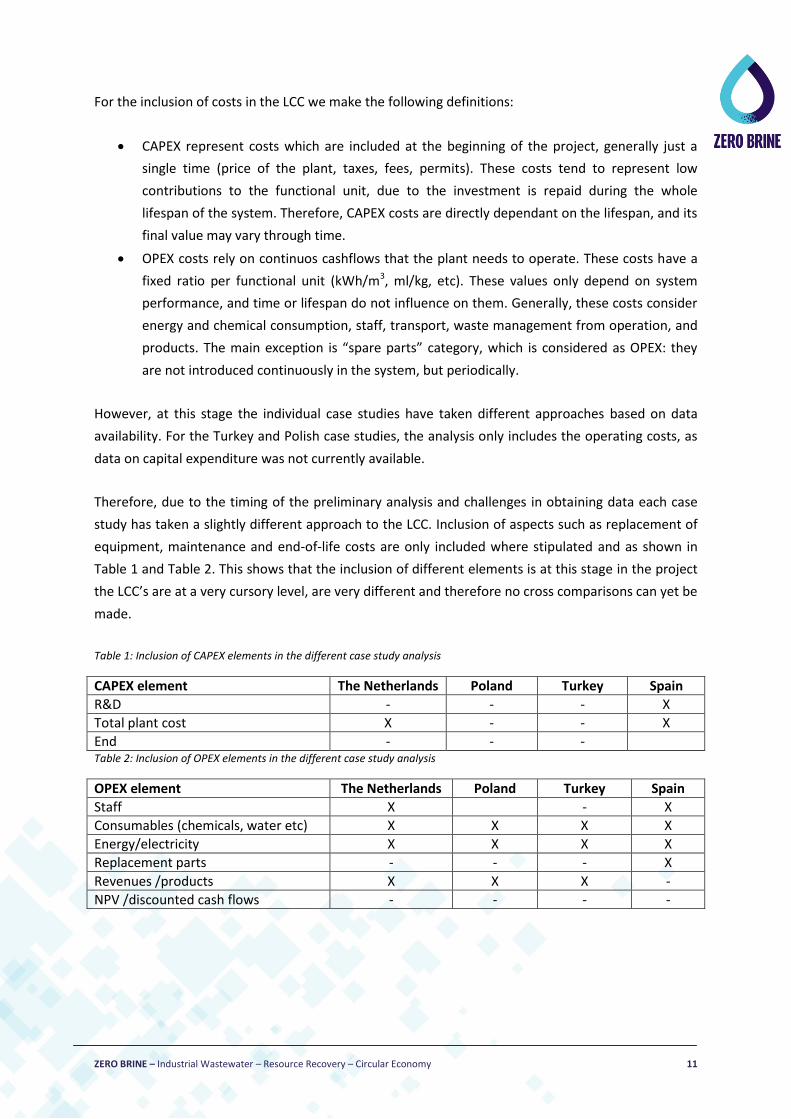
Therefore, due to the timing of the preliminary analysis and challenges in obtaining data each case
study has taken a slightly different approach to the LCC. Inclusion of aspects such as replacement of
equipment, maintenance and end-of-life costs are only included where stipulated and as shown in
Table 1 and Table 2. This shows that the inclusion of different elements is at this stage in the project
the LCC’s are at a very cursory level, are very different and therefore no cross comparisons can yet be
made.
Table 1: Inclusion of CAPEX elements in the different case study analysis
CAPEX element The Netherlands Poland Turkey Spain
R&D - - - X
Total plant cost X - - X
End - - - Table 2: Inclusion of OPEX elements in the different case study analysis
OPEX element The Netherlands Poland Turkey Spain
Staff X - X
Consumables (chemicals, water etc) X X X X
Energy/electricity X X X X
Replacement parts - - - X
Revenues /products X X X -
NPV /discounted cash flows - - - -

ZERO BRINE – Industrial Wastewater – Resource Recovery – Circular Economy 12
4. Case Study 1: Demineralised water, The Netherlands
4.1 Intro Environmental pollution, resource scarcity, and freshwater shortage are critical world challenges
facing humanity in this century. The process industry is the major source of brine production in
Europe. Brine is a high-concentration solution of salt in water, and Its disposal is problematic due to
environmental pollution and brine’s share in critical raw materials (European Commission, 2014).
Therefore, processing industrial brine may result in decreasing environmental pollution and
recovering scarce resources and clean water.
Brine consists of water with high salt concentration. Brine can be a waste product of various
industrial processes, but it is also a product in salt solution mining. Solution mining involves drilling
one or several wells down to a salt layer. Hot water is pumped down the well, resulting in dissolving
the salt in the salt layer, and producing saturated brine. The brine is transported to a salt production
plant, where it is purified in a brine purification facility to produce specialty salt, vacuum salt and
low-purity salt (Sediyi, 2006; Warren, 2016). The vacuum salt consists of high purity salt and is
manufactured for industrial use. This industrial use covers chemical production, such as chlorine and
caustic soda, sodium carbonate, sodium chlorate etc., and water treatment facilities (Roskill, 2018).
As a result, the salt consumed in these processes ends-up as brine effluent. European regulation
prohibits organizations from disposing industrial brine to surface water (US EPA, 2014). Additionally,
brine contains substances that European Union has identified as critical raw materials (European
Commission, 2014) and is a priority in the Circular Economy Package (Bourguignon, 2016), such as
magnesium.
One of the industries that participates in the project is Evides Industriewater (Rotterdam, the
Netherlands). Evides Industriewater produces ultra-pure demineralized water (demi water), which is
purchased by the chlor-alkali industry in the port of Rotterdam area, and brine as a waste product.
Brine derives from two sources in the demineralized water plant (DWP), the ion exchange softening
units and reverse osmosis units. The ion exchange softening units regard the use of high purity salt
during the regeneration process. The high purity salt that is employed is the vacuum salt that is
described above. In reality, brine is generated in a salt plant, then it is dried to acquire high purity salt
and the high purity salt is transported and put into water for resins regeneration purposes. Evides
Industriewater currently discharges the brine affluent to the sea water nearby, but it considers
improving its environmental performance by recovering and reusing the sodium salt in the
regeneration process. The ZB project aims at treating brine from Evides Industriewater to recover
distilled water, sodium salt and other salts. For this purpose, a demo plant will be built. The demo
plant will consist of Site 1 and Site 2, with each site processing brine from one of the two brine
sources in the DWP.
Site 1: The main objective of Site 1 (treating brine from IX Softeners) is to achieve Zero Liquid
Discharge, to recover high purity magnesium compounds with potential commercial value, as well as
ZERO BRINE – Industrial Wastewater – Resource Recovery – Circular Economy 13
to recover a sodium chloride solution that will be recycled for the regeneration of the ion exchange
resins. The total flow per regeneration is 80 m3, while the resins are regenerated every 18 hours,
which results in an equivalent flow of 106 m3/day (per unit, total 8 units). The demo plant that will be
developed will be able to treat 5.3 m3/day, thus accounting for 0,6% of the total brine volumes
generated. This system comprises a large scale (industrial) demonstration. The system is optimized in
a way to be able to make use of waste heat, thus the optimal combination of membrane and thermal
evaporation steps will be determined. The membrane crystallizer has already been demonstrated at
pilot scale, resulting in high purity of recovered products.
Site 2: The main objective of Site 2 is to achieve Zero Liquid Discharge, to produce sulphate salts
(while dealing with organic contamination), as well as to recover a sodium chloride solution that can
be recycled for the regeneration of the anionic ion exchange resins. The system will be able to treat
approximately 1 m3/h of the brine generated by the reverse osmosis unit. The existing reverse
osmosis unit of the DWP runs continuously producing approximately 250 m3/h, which means that the
demo plant will treat 0.4% of the total brine flow. The evaporator unit that will be demonstrated in
Site 1 will be used also in Site 2.
4.2 Goal and Scope
4.2.1 Goal and functional unit
The goal of the study is to investigate the effect on the environmental performance of the DWP with
and without the ZB pilot system. The aim of the ZB system is sodium salt recovery in order to replace
75% of the high purity (HP) salt purchased by AkzoNobel in the norther part of the Netherlands. Due
to the goal of this report, the functional unit is the “generation of 1 m3 of total brine”, that
corresponds to 0.5 m3 brine deriving from the IEX softener unit and 0.5 m3 brine deriving from the
reverse osmosis unit. The LCA modelling was performed with the Simapro software (Consultants,
n.d.) and Ecoinvent database 3.5 (Wernet et al., 2016) was used. The environmental impacts
indicators under investigation were calculated with the CML 2001 Impact Assessment Method:
abiotic depletion, global warming, human toxicity, fresh water aquatic ecotoxicity, terrestrial
ecotoxicity, acidification, eutrophication and photochemical oxidation potentials.
4.2.2 Allocation
Allocation was avoided when possible, and substitution was applied as suggested by the ILCD
handbook (Wolf et al., 2010). Substitution was applied in membrane crystallization 1 and 2 processes
of Site 1 and nanofiltration and evaporation in Site 2 of the ZB system. On the other hand, applying
substitution was not possible for the AkzoNobel plant which produces the high purity salt that the
DWP uses for resins regeneration, therefore economic allocation was used based on the current
prices of the Dutch market (Brinkmann et al., 2014).
ZERO BRINE – Industrial Wastewater – Resource Recovery – Circular Economy 14
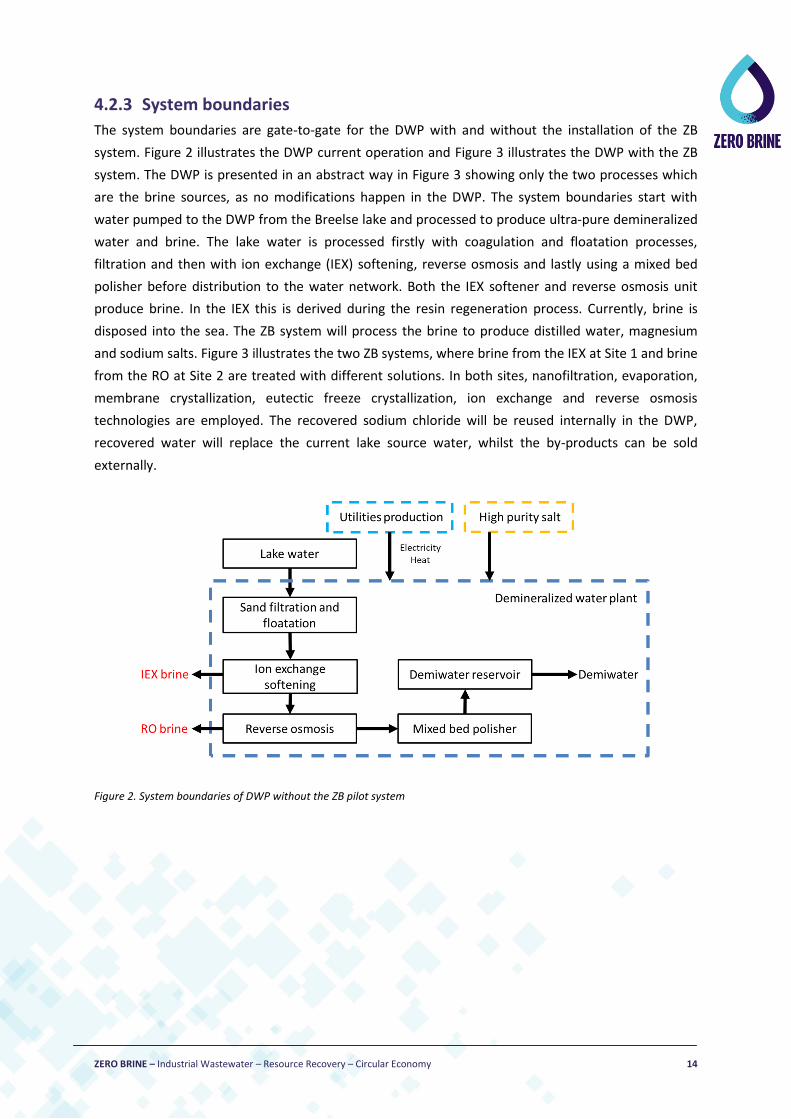
4.2.3 System boundaries
The system boundaries are gate-to-gate for the DWP with and without the installation of the ZB
system. Figure 2 illustrates the DWP current operation and Figure 3 illustrates the DWP with the ZB
system. The DWP is presented in an abstract way in Figure 3 showing only the two processes which
are the brine sources, as no modifications happen in the DWP. The system boundaries start with
water pumped to the DWP from the Breelse lake and processed to produce ultra-pure demineralized
water and brine. The lake water is processed firstly with coagulation and floatation processes,
filtration and then with ion exchange (IEX) softening, reverse osmosis and lastly using a mixed bed
polisher before distribution to the water network. Both the IEX softener and reverse osmosis unit
produce brine. In the IEX this is derived during the resin regeneration process. Currently, brine is
disposed into the sea. The ZB system will process the brine to produce distilled water, magnesium
and sodium salts. Figure 3 illustrates the two ZB systems, where brine from the IEX at Site 1 and brine
from the RO at Site 2 are treated with different solutions. In both sites, nanofiltration, evaporation,
membrane crystallization, eutectic freeze crystallization, ion exchange and reverse osmosis
technologies are employed. The recovered sodium chloride will be reused internally in the DWP,
recovered water will replace the current lake source water, whilst the by-products can be sold
externally.
Figure 2. System boundaries of DWP without the ZB pilot system

ZERO BRINE – Industrial Wastewater – Resource Recovery – Circular Economy 15
Figure 3. System boundaries of DWP with the ZB pilot system
4.2.4 Study assumptions
In this work we assumed that no regeneration is taking place in the IEX softening unit of Site 2. For
regeneration a sodium chloride solution would be needed, the same product that is recovered in
both Sites 1 and 2. Furthermore, we assumed that the evaporator in Site 1 will use waste heat, as it is
indicated in the Grant Agreement document. However, until the finish of this report, it was not
confirmed the source of the waste heat. Therefore, a scenario is presented in the “Design
recommendations” subsection, where needed heat is generated via natural gas combustion. Last,
one limit of the Life Cycle Impact Assessment models is their limit to assess the effect of brine, and
even saline, effluents to the environment. It is expected that brine disposal results in environmental
burdens when disposed in surface water, but when this was modelled in Simapro software, no
effects were identified in toxicity impact indicators. Therefore, it is expected that the aquatic toxicity
indicator will be underestimated in the DWP (without the ZB plant) system.
4.3 LCI
4.3.1 Demineralized water plant
Data for the current operation of the DWP is presented in Table 3. The data concern the whole plant
operation, they are not per unit process and they are per 1000 m3 of demi water production. Data for
the DWP were collected from Evides Industriewater.

ZERO BRINE – Industrial Wastewater – Resource Recovery – Circular Economy 16
Table 3. Life Cycle Inventory of DWP operation
Inflow
Lake Breelse Water 1261 m3/1000 m3 demi water HP Salt 467 kg/1000 m3 demi water Sodium hydroxide (NaOH) 43 kg/1000 m3 demi water Hydrochloric acid (HCL) 36 kg/1000 m3 demi water Iron(III) chloride (FeCl3) 13 kg/1000 m3 demi water Polyacrylamide 0,23 kg/1000 m3 demi water Steam (200°C, ca.18 bar) 2375 kg/1000 m3 demi water Electricity 1269 kWh/1000 m3 demi water Outflow Demineralized water 1000 m3 Waste 1057 Kg/1000 m3 demi water
4.3.2 Zero Brine system
The life cycle inventory of the ZB system with all the inputs and outputs of the life cycle stages is
presented in Table 5 and Table 6. The data regarding inflows and outflows of Site 1 and Site 2 are
based on results from bench scale tests and PhreeqC simulations, respectively. Bench scale tests
were performed regarding nanofiltration and membrane crystallization technologies for Site 1
processes. PhreeqC is a computer program designed to model a wide variety of aqueous chemical
reactions. The simulation results will be used to fine-tune the process flow diagrams. Data from
PhreeqC simulations exist on the Grant Agreement document. Furthermore, data regarding
capacities of equipment used in Site 1 and Site 2, were collected based on internal communication
with the consortium partners that are providing the technologies. Table 3 shows the technology
providers.
Table 4.Technology providers in ZB project
Technology Provider
Ion exchange softening unit Lenntech
Reverse osmosis unit UNIPA
Nanofiltration unit a Lenntech
Membrane crystallisation units UNIPA
Evaporator unit a NTUA
Total organic carbon (TOC) removal unit Arvia
Eutectic freeze crystallisation unit TU Delft a in Figure 3, two of these units are shown, however, it is one unit that will run on two different time periods

17
Table 5. Site 1 process inflows and outflows for LCA modelling
SITE 1 Inflow
Outflow Nanofiltration IEX brine 1000 L/h 36000 g/h NF Permeate 700 L/h 7700 g/h
Electricity for pump
10.57 kWh NF Concentrate 300 L/h 28200 g/h
Antiscalant (Vitec 3000)
0.5 kg/h
Membrane Crystallization 1 NF Concentrate 300 L/h 28200 g/h Magnesium
L/h 666.4 g/h
Electricity for pumps and control 1.5 kWh MC1 effluent 300 L/h 29400 g/h
Membrane Crystallization 2 MC1 effluent 300 L/h 29400 g/h Calcium hydroxide
L/h 8.42 kg/h
Hydrochloric acid (HCL)
0.8 kg/h MC2 effluent 300 L/h 29700 g/h
Electricity
3.7 kWh
Sodium hydroxide (NaOH)
6.6 kg/h Evaporator MC2 effluent 300 L/h 29700 g/h Evaporator effluent 582 L/h 37830 g/h
NF Permeate 700 L/h 7700 g/h Condensate 418 L/h 0 g/h
Waste heat
3,9 kWh

ZERO BRINE – Industrial Wastewater – Resource Recovery – Circular Economy 18
Table 6. Site 2 process inflows and outflows for LCA modelling
SITE 2 Inflow
Outflow Ion exchange RO brine 1000 L/h 3000 g/h An. IEX effluent 950 L/h 2850 g/h
Evaporator effluent 13.84 L/h 2823 g/h An. IEX brine 50 L/h 4950 g/h
Antiscalant (Vitec 4000)
625 g/h
NF permeate 40 L/h 3560 g/h
Electricity for pump
5 kWh
Reverse osmosis An. IEX effluent 950 L/h 2850 g/h RO concentrate 95 L/h 2850 g/h
Electricity for pump
5 kWh RO permeate 855 L/h 25.65 g/h
TOC removal An. IEX brine 50 L/h 4950 g/h TOC removal effluent 50 L/h 4950 g/h
Electricity for pump
7.37 kWh Waste
40.5 kg/h
Sulfuric acid (H2SO4)
36.1 kg/h
Sodium hydroxide (NaOH)
24.4 kg/h
Evaporator RO concentrate 95 L/h 2850 g/h Condensate 81.17 L/h 0 g/h
Electricity
5 kWh Evaporator effluent 13.84 L/h 2823 g/h
Waste heat 0.38 kWh Sodium bicarbonate (NaHCO3)
16600 g/h
Nanofiltration TOC removal effluent 50 L/h 4950 g/h NF concentrate 10 L/h 1370 g/h
Electricity
5 kWh NF permeate 40 L/h 3560 g/h
Eutectic Freeze Crystallization NF concentrate 10 L/h 1370 g/h
Sodium sulfate (Na2SO4)
240 g/h
Electricity
4 kWh Water (ice) 10 L/h

19
4.4 LCIA
4.4.1 Results
Figure 4 and Figure 5 show the performance of the DWP with and without the ZB system. It is
obvious that the environmental performance becomes worse when the ZB system is implemented.
The current analysis suggests some environmental impacts are higher in the DWP (with the ZB plant)
case but the impact of brine effluent from the current system has not been considered at this stage,
as it was assumed that the “freshwater aquatic ecotoxicity” indicators is not affected by brine
disposal. The difference between the LCA systems Figure 4 and Figure 5, is mainly due to the
operation of the ZB system, as the improved efficiency of the DWP due to the recovery of distilled
water and the environmental benefits due to sodium chloride and magnesium recovery are negligible
when compared with the chemicals needed for the ZB system operation. In the discussion section, an
analysis of environmental hotspots of the ZB system will be presented.
Figure 4. LCIA results for 1 m3 of brine
1.664
130 18 20
3.439
262 53 69
0
500
1000
1500
2000
2500
3000
3500
4000
Abiotic depletion (MJ) Global warming (kg CO2eq)
Human toxicity (kg 1,4-DBeq)
Fresh water aquaticecotoxicity (kg 1,4-DB eq)
DWP (without ZB plant)
DWP (with ZB plant)

ZERO BRINE – Industrial Wastewater – Resource Recovery – Circular Economy 20
Figure 5. LCIA results for 1 m3 of brine
4.5 Life Cycle Interpretation
4.5.1 Contribution analysis
The contribution of processes in the ZB system performance is presented in Figure 6 and the process
tree of ZB system for Global Warming Potential (for 100 years) is presented in Figure 7. The cut-off
was performed at 1% for the process tree. This was selected to have a good visual result of the
contributions. Figure 6 shows that electricity generation is the main contributor to the GWP score.
However, when complemented with Figure 7, electricity consumption does not occur in the ZB
system itself. Electricity is consumed to produce chemicals needed for the ZB system, especially the
neutralising agent (sodium hydroxide) for the TOC removal process. Furthermore, the mined coal to
produce electricity is also contributing to the GWP result. In Figure 7, the red arrows refer to
contributing in increasing the GWP score, whereas the green arrows refer to contributing in
mitigating the GWP score. Site 1 contributes to environmental benefits due to the recovered
products, magnesium and calcium hydroxide, and the avoided production of the same products in
the global market. Nevertheless, the recovered amounts are very low in order to have a significant
impact when compared with the chemicals needed for the TOC removal process.
0,11 0,01
0,26
0,13
0,64
0,06
1,57
0,35
0
0,2
0,4
0,6
0,8
1
1,2
1,4
1,6
1,8
Terrestrial ecotoxicity (kg1,4-DB eq)
Photochemical oxidation(kg C2H4 eq)
Acidification (kg SO2 eq) Eutrophication (kg PO4---eq)
DWP (without ZB plant)
DWP (with ZB plant)

ZERO BRINE – Industrial Wastewater – Resource Recovery – Circular Economy 21
Figure 6. Contribution analysis of environmental impacts of ZB system (cut-off processes<1%)
-10%
10%
30%
50%
70%
90%
110%
Global warming Acidification Fresh wateraquatic
ecotoxicity
Abioticdepletion
Remaining processes
Petroleum
Natural gas
Sulfidic tailing
Lignite
Sulfuric acid
Transport, freight, sea
Magnesium
Calcium hydroxide
Heat production
Hard coal
Electricity

22
Figure 7. Process tree of Global warming (GWP100a) for Zero Brine system (cut-off at 8%)
23
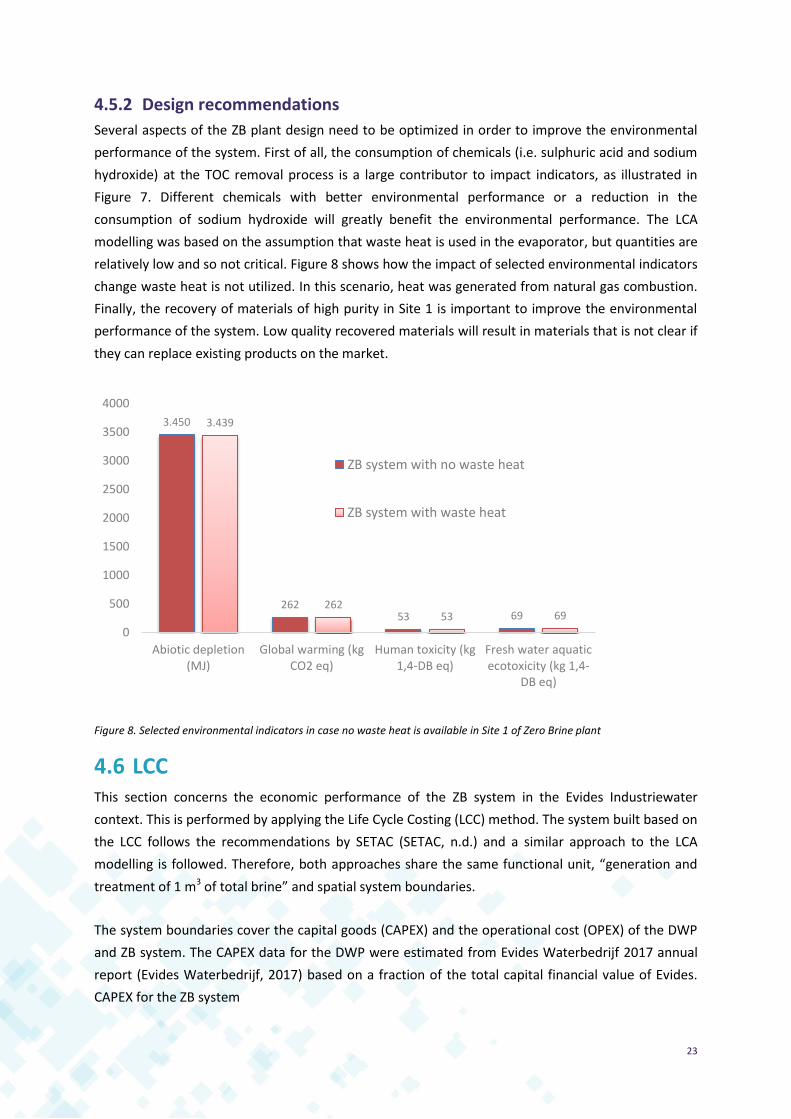
4.5.2 Design recommendations
Several aspects of the ZB plant design need to be optimized in order to improve the environmental
performance of the system. First of all, the consumption of chemicals (i.e. sulphuric acid and sodium
hydroxide) at the TOC removal process is a large contributor to impact indicators, as illustrated in
Figure 7. Different chemicals with better environmental performance or a reduction in the
consumption of sodium hydroxide will greatly benefit the environmental performance. The LCA
modelling was based on the assumption that waste heat is used in the evaporator, but quantities are
relatively low and so not critical. Figure 8 shows how the impact of selected environmental indicators
change waste heat is not utilized. In this scenario, heat was generated from natural gas combustion.
Finally, the recovery of materials of high purity in Site 1 is important to improve the environmental
performance of the system. Low quality recovered materials will result in materials that is not clear if
they can replace existing products on the market.
Figure 8. Selected environmental indicators in case no waste heat is available in Site 1 of Zero Brine plant
4.6 LCC This section concerns the economic performance of the ZB system in the Evides Industriewater
context. This is performed by applying the Life Cycle Costing (LCC) method. The system built based on
the LCC follows the recommendations by SETAC (SETAC, n.d.) and a similar approach to the LCA
modelling is followed. Therefore, both approaches share the same functional unit, “generation and
treatment of 1 m3 of total brine” and spatial system boundaries.
The system boundaries cover the capital goods (CAPEX) and the operational cost (OPEX) of the DWP
and ZB system. The CAPEX data for the DWP were estimated from Evides Waterbedrijf 2017 annual
report (Evides Waterbedrijf, 2017) based on a fraction of the total capital financial value of Evides.
CAPEX for the ZB system
3.450
262 53 69
3.439
262 53 69
0
500
1000
1500
2000
2500
3000
3500
4000
Abiotic depletion(MJ)
Global warming (kgCO2 eq)
Human toxicity (kg1,4-DB eq)
Fresh water aquaticecotoxicity (kg 1,4-
DB eq)
ZB system with no waste heat
ZB system with waste heat

ZERO BRINE – Industrial Wastewater – Resource Recovery – Circular Economy 24
and internal communication with the ZB technology providers (see Table 7) for the DWP and
technologies used in the ZB system, respectively. The OPEX data for the DWP and ZB plant concerned
the conversion of the operational mass inflows and outflows of the LCA models into monetary flows.
Operational inflows and outflows regarded mainly the chemicals and electricity consumption, and
the demi water production and recovery of magnesium oxide, calcium hydroxide and sodium
chloride, respectively. The quantities of used chemicals were collected via internal communication
with the technology providers, and prices were collected from literature and online specialized
chemical wholesalers. Last, data regarding the personnel cost was collected from the Evides
Waterbedrijf annual report and via internal communication with Evides Industriewater confirmed
that the ZB plant will result in increasing employment. Table 29 presents, CAPEX and OPEX results,
the expected quantities for chemicals consumption and their prices and, prices for recovered
products. Additional information for the LCC modelling of the ZB system is presented in Appendix 1.
Table 7. LC Inventory of LCC modelling
Cost Unit cost Unit Price
CAPEX (DWP) 12648000 Euros
CAPEX (Zero Brine) 730000 Euros
OPEX (personnel) 256.5 Euros/m3 brine
OPEX (materials) 76.6 Euros/m3 brine
Euros/m3 brine
DWP consumables 8.26 Euros/m3 brine
NaCl 0.10 Euros/m3 brine 0.057 Euros/kg
NaOH 0.03 Euros/m3 brine 2.36 Euros/kg
HCl 5.34 Euros/m3 brine 2.8 Euros/liter
FeCl3 2.39 Euros/m3 brine 4.2 Euros/kg
Polyacrylamide 0.00 Euros/m3 brine
Steam (200°C, ca.18 bar)
0.00 Euros/m3 brine
Electricity 0.40 Euros/m3 brine 0.082 Euros/kWh
Euros/m3 brine
Zero brine consumables 68.3 Euros/m3 brine
Antiscalant (Vitec 3000) 34 Euros/m3 brine 13.5 Euros/kg
HCL 15.12 Euros/m3 brine 37.8 Euros/liter
NaOH 6.4 Euros/m3 brine 0.165 Euros/kg
Antiscalant (Vitec 4000) 1.9 Euros/m3 brine 144.4 Euros/kg
H2SO4 9.03 Euros/m3 brine 0.5 Euros/kg
Electricity 1.9 Euros/m3 brine 0.082 Euros/kWh
Zero Brine products 2463
Magnesium Oxide 1477 Euros/m3 brine 924 Euros/kg
Calcium hydroxide 377 Euros/m3 brine 89.6 Euros/kg
NaHCO3 (soda ash) 608 Euros/m3 brine 73.3 Euros/kg

ZERO BRINE – Industrial Wastewater – Resource Recovery – Circular Economy 25
Based on the CAPEX and OPEX estimations, it is shown that the CAPEX of the ZB plant is negligible
when compared to the DWP, see Figure 9. The OPEX estimations for the DWP with the ZB plant is
shown in Figure 10. Furthermore, the quantity of the recovered materials can influence the LCC
results, as their prices are high when compared to the consumed chemicals (Figure 11). Most of the
expected profit derives from the magnesium oxide recovery since its market price is 924 Euros/kg,
considerably higher than any other material consumed or recovered.
Figure 9. CAPEX estimations
Figure 10. OPEX estimations
95%
5%
CAPEX (DWP)
CAPEX (Zero Brine)
77%
23%
OPEX (personnel)
OPEX (materials)

ZERO BRINE – Industrial Wastewater – Resource Recovery – Circular Economy 26
Figure 11. Contributions of consumables and recovered materials
4.7 Conclusions Based on the current design for the ZB system and data from bench scale tests and computer
simulations, the addition of the recovery of products with the ZB system will result in environmental
burdens for the DWP. However, the calculated environmental burdens for the “fresh water
ecotoxicity” indicator should be taken with a pinch of salt, as brine disposal does not result in any
environmental burdens in Life Cycle Impact Assessment models. Environmental burdens derive
mainly from the chemicals consumed in the TOC removal process. Therefore, in order to improve the
environmental performance of the ZB system the first issue to be tackled in the sodium hydroxide
consumption in the TOC removal process. Based on the LCC, the CAPEX of the ZB system is negligible
when compared to the CAPEX of the DWP, so there should not be any issue for Evides Industriewater
acquiring and employing the ZB system. Last, the purity of the recovered products is crucial,
especially for magnesium, as high purity recovered products result in commodities with a high
financial value.
4.8 Further work The future work of the LCA and LCC modelling of the ZB system in the Netherlands should comprise
of confirming the purity of the recovered materials via pilot scale tests. In addition, data collection
from the pilot plant, and update, will provide LCA and LCC results of larger scales, comparable to
Antiscalant (Vitec 3000)
1%
NaOH 3%
H2SO4 0%
Magnesium Oxide -55%
Calcium hydroxide
-13%
NaHCO3 (soda ash) -23%
HCl 1%

ZERO BRINE – Industrial Wastewater – Resource Recovery – Circular Economy 27
industrial standards. In this case, the consumption of electricity and heat of the ZB technologies is
expected to decrease due to upscaling. Last, part of the tasks of WP9 is the “Assessment of
environmental impacts associated with brine discharge”. Therefore, these activities will be coupled
with the development of a Life Cycle Impact Assessment model explicitly for the brine composition
produced by Evides Industriewater. This model will be implemented in future LCA calculations.

ZERO BRINE – Industrial Wastewater – Resource Recovery – Circular Economy 28
5. Case Study 2: Coal mine, Poland
5.1 Intro The purpose of the Polish pilot plant is to investigate the benefits and ability of the ZB system to
process wastewater from a coal mine. The process uses an integrated membrane system, to treat the
wastewater to acceptable discharge standards whilst recovering valuable products including sodium
chloride, magnesium hydroxide, calcium chloride, clean water and gypsum.
The successful treatment of coal mine wastewater represents a significant challenge as coal mining
activities generate large amounts of saline wastewaters. Their direct drainage to water bodies would
result in salination, that could cause significant harm to the ecosystems and river life, impair its use
for society downstream (Gzyl et al.,2017). Poland is the largest coal producer in the EU (EURACOAL,
2017). Currently, the drainage from the Polish coal mine undergoes a basic two stage treatment
process. First it is fed into settlement ponds that removes the suspended solids. The remaining
effluent is then diluted so that the thresholds of its remaining constituents conform to discharge
standards in surface water bodies.
The pilot plant will be located at ZG “Bolesław Śmiały” in Poland, a coal mine owned by PGG (Polska
Grupa Gornicza S.A.), the EU’s largest black coal mining company, producing approximately 30
million tons of black coal annually (total EU production: ~100 milliontons) (PGG,2019). The “Bolesław
Śmiały” coal mine currently generates over 730,000 m3 of saline wastewater annually. To conform to
the discharge limits, the largest particles are removed in a settling pond and the wastewater is then
diluted with wastewater from the co-located energy plant There, is currently no further treatment
before wastewater discharge in a near river. However, due to the tightening environmental
regulations, the company is seeking new methods for decreasing the salt load in their wastewaters.3
After its startup, the pilot system will be evaluated against the following objectives:
- To demonstrate circular economy solutions in coal mining sectors at a pilot scale through
innovative brine treatment.
- To decrease energy consumption by 50% compared to the energy consumption of reverse
osmosis-vapour compression system which represents current base practice.
- Increase the recovery of resources and lost products through advanced selective separation
technologies.
3 Deliverable 3.5: Report on the operation and optimization of the pilot system for
the treatment of coal mine.

ZERO BRINE – Industrial Wastewater – Resource Recovery – Circular Economy 29
A LCA and LCC study has been carried out for the ZB coal mine case study and is presented in the
following sections.
5.2 Goal and Scope The goal of the preliminary LCA study is to assess the performance of the ZB pilot coal mine system
by comparing four possible configurations of the unit operations. The four different configurations all
contain the same process stages and are presented in the LCI section. The LCA results will primarily
be used to help the design procedure by providing initial environmental and sustainability input to
the plant design and operation. It will be examined which stages of the wastewater treatment life
cycle contribute most to the total impact of the process and how the process performance can be
improved. The results of this study will be used by the technology providers and practitioners of the
ZB project as input to the design and operation procedure.
The functional unit of the study is “the treatment of 1 m3 of coal mine wastewater”.
Specifically, this wastewater refers to a typical composition of the wastewater stream of
“Bolesław Śmiały” coal mine. The functional unit is described by the composition presented
in Table 8.
Table 8: Coal mine wastewater composition (data retrieved from D3.14)
Ion Mean concentration
(g/m3)
Li+ < 2.5
Na+ 8,191.67
NH4+ < 2.5
K+ 120.42
Mg2+ 284.92
Ca2+ 342,67
Cl- 13,450
NO3- < 2.5
SO42- 809.83
B 2.32
HCO3 301.08
Allocation
In line with the recommendations of ISO 14044, allocation was avoided in the present study by
expanding the product system to include the recovery of by-products. The treatment of the coal
mine wastewater with the ZB pilot plant is a multifunctional process resulting in the recovery of
4
Deliverable 3.1: Characterization of waters from three coal mines owned by TAURON

ZERO BRINE – Industrial Wastewater – Resource Recovery – Circular Economy 30
valuable products. The pilot plant is evaluated with a focus on the treatment of the wastewater. In
the LCA analysis, a systems expansion has been performed to include the production of the avoided
products: Sodium Chloride, Gypsum, Magnesium Hydroxide and clean water (RO permeate).
The system boundaries are presented in Figure 12. The system boundaries include the input of the
brine wastewater to the treatment train and the technologies involved in the treatment of the
wastewater. The steps included in the system boundaries are the operation units (namely:
nanofiltration, reverse osmosis, electrodialysis and crystallization), the needed electricity and
auxiliary materials as well as the produced products (Sodium Chloride, Gypsum, Magnesium
Hydroxide and clean water) and the emissions to the environment.
Figure 12: Coal mine case study: System boundaries
Data quality
The pilot plant is designed by Silesian University of Technology (SUT). Foreground data are collected
with the purpose to address the goal of the study. Foreground data are mainly results of laboratory
and bench scale experiments (derived from the ZB project deliverables D3.2 5and D3.36), combined
with simulation data Primary data providers were SUT partners and published data from WP3. Data
gaps and uncertainty of information were overcome with the use of literature data (mainly Ecoinvent
database). Literature data were used for the input of dolime in the treatment train as explained in
the LCI section (5.3). The background data used were selected in order to be recent and
representative for Poland. Specifically, data for energy consumption were retrieved from Ecoinvent
v.3 database for Poland.
5 Deliverable 3.2: Database of data collected during WP3 demonstration activity 6 Deliverable 3.3: Report on the preliminary design and the simulation model results

ZERO BRINE – Industrial Wastewater – Resource Recovery – Circular Economy 31
Assumptions and limitations
The present study is conducted with the use of experimental (bench scale) and simulation
data resulting to some limitations that will affect the results of the study.
The pretreatment of wastewater before the ZB pilot plant is not included as sufficient data
was not available.
Construction of the individual units is not taken into account.
The LCA study is conducted with the use of SimaPro v.9 software and Ecoinvent v.3 database.
5.3 LCI The LCI of the coal case study has been built for the pilot scale treatment of 1m3 of coal mine
wastewater. Four different configurations for the treatment of 1 m3 of wastewater were evaluated
and compared (illustrated in Figure 13 to Figure 16).
1. Two stage nanofiltration (NF), dilute from electrodialysis is recycled before the NF.
2. Single-stage NF, ED diluate is recycled back to the NF.
3. Two-stage nanofiltration, 75% of NF retentate is recycled, ED dilute is recycled back before
the RO.
4. Single stage nanofiltration, 75% of NF retentate is recycled, ED diluate is recycled back before
the RO.
The data in the LCI includes: the energy consumption of the pilot unit, chemical reagents for
operational and cleaning purposes and recovered products. However, the use of spare parts is not
included in the present study as projections of energy consumption of individual units is not yet
available.
Dolime is not included in the Ecoinvent v.3 database. For this reason, the use of dolime suspension in
the magnesium recovery unit it was assumed the following. Dolime (CaO.MgO) is the result of the
chemical transformation of dolomite (CaCO3.MgCO3) by heating it above 900°C (equation 1) and
requires energy.7
(CaCO3.MgCO3)(s) + heat (>900°C) (CaO.MgO)(s) + 2CO2 (g) (1)
7 https://www.lhoist.com/want-know-more-about%E2%80%A6#dolime

ZERO BRINE – Industrial Wastewater – Resource Recovery – Circular Economy 32
Figure 13: Configuration 1: two stage nanofiltration (NF), dilute from electrodialysis is recycled before the NF.
Figure 14: Configuration 2: :single-stage nanofiltration, ED diluate is recycled back to the nanofiltration

ZERO BRINE – Industrial Wastewater – Resource Recovery – Circular Economy 33
Figure 15: Configuration 3: two-stage nanofiltration, 75% of NF retentate is recycled, ED dilute is recycled back before the RO.
Figure 16: Configuration 4: single stage nanofiltration, 75% of NF retentate is recycled, ED diluate is recycled back before the RO.

ZERO BRINE – Industrial Wastewater – Resource Recovery – Circular Economy 34
5.4 LCIA Life cycle impacts have been assessed with the use of the ILCD8 method as recommended by EU 2013.
Common and important impact categories for LCIA on wastewater include the toxicity related ones,
eutrophication (marine and freshwater), global warming, acidification, ionizing radiation and in some
cases water use, land use and stratospheric ozone depletion (Larsen,2018). IMPACT 2002+ has been
also used as an additional impact assessment method, in order to obtain as robust results as possible
(Larsen,2018).
Individual contributions of the different processes to the total environmental impact was assessed.
However, the contribution of each process is not representative as reliable data is only for the energy
consumption of the whole process. The avoided products are included in the LCIA. The results have
been obtained with the use of SimaPro v9 Software and Ecoinvent v3.5 database and are presented
in Figure 17 and Figure 18 (impact categories with zero values are not displayed in the figures). Figure
18 illustrates the contribution of each process stage (based on the inputs and outputs of each stage),
including the electricity (which was currently only available for the whole system) and the positive
impacts of the avoided products (deionised water, magnesium hydroxide, gypsum and sodium
chloride).
Figure 17: ZB coal mine pilot, LCA results. Comparison of the 4 configurations
8 ILCD 2011 Midpoint+ V1.10 / EC-JRC Global, equal weighting
-0,01
-0,005
0
0,005
0,01
0,015
0,02
0,025
0,03
No
rmal
isat
ion
un
its
Normalisation ILCD
Configuration 1 Configuration 2 Configuration 3 Configuration 4
ZERO BRINE – Industrial Wastewater – Resource Recovery – Circular Economy 35
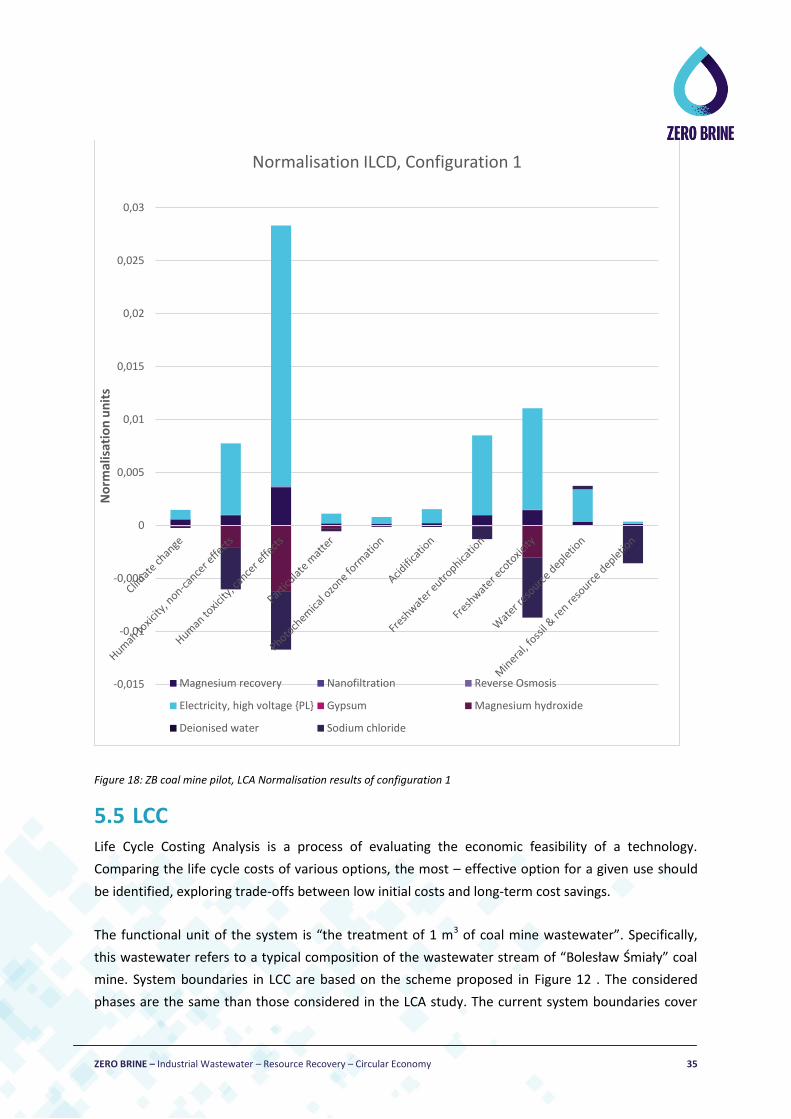
Figure 18: ZB coal mine pilot, LCA Normalisation results of configuration 1
5.5 LCC Life Cycle Costing Analysis is a process of evaluating the economic feasibility of a technology.
Comparing the life cycle costs of various options, the most – effective option for a given use should
be identified, exploring trade-offs between low initial costs and long-term cost savings.
The functional unit of the system is “the treatment of 1 m3 of coal mine wastewater”. Specifically,
this wastewater refers to a typical composition of the wastewater stream of “Bolesław Śmiały” coal
mine. System boundaries in LCC are based on the scheme proposed in Figure 12 . The considered
phases are the same than those considered in the LCA study. The current system boundaries cover
-0,015
-0,01
-0,005
0
0,005
0,01
0,015
0,02
0,025
0,03
No
rmal
isat
ion
un
its
Normalisation ILCD, Configuration 1
Magnesium recovery Nanofiltration Reverse Osmosis
Electricity, high voltage {PL} Gypsum Magnesium hydroxide
Deionised water Sodium chloride
ZERO BRINE – Industrial Wastewater – Resource Recovery – Circular Economy 36
the operation units of the examined system (nanofiltration, reverse osmosis, electrodialysis and
crystallization), the needed electricity, the auxiliary materials and the produced products. The
emissions to the environment will be implemented during the next steps of the project. Moreover,
the pretreatment process of wastewater and the construction of the individual units are not included
as no sufficient data was available.
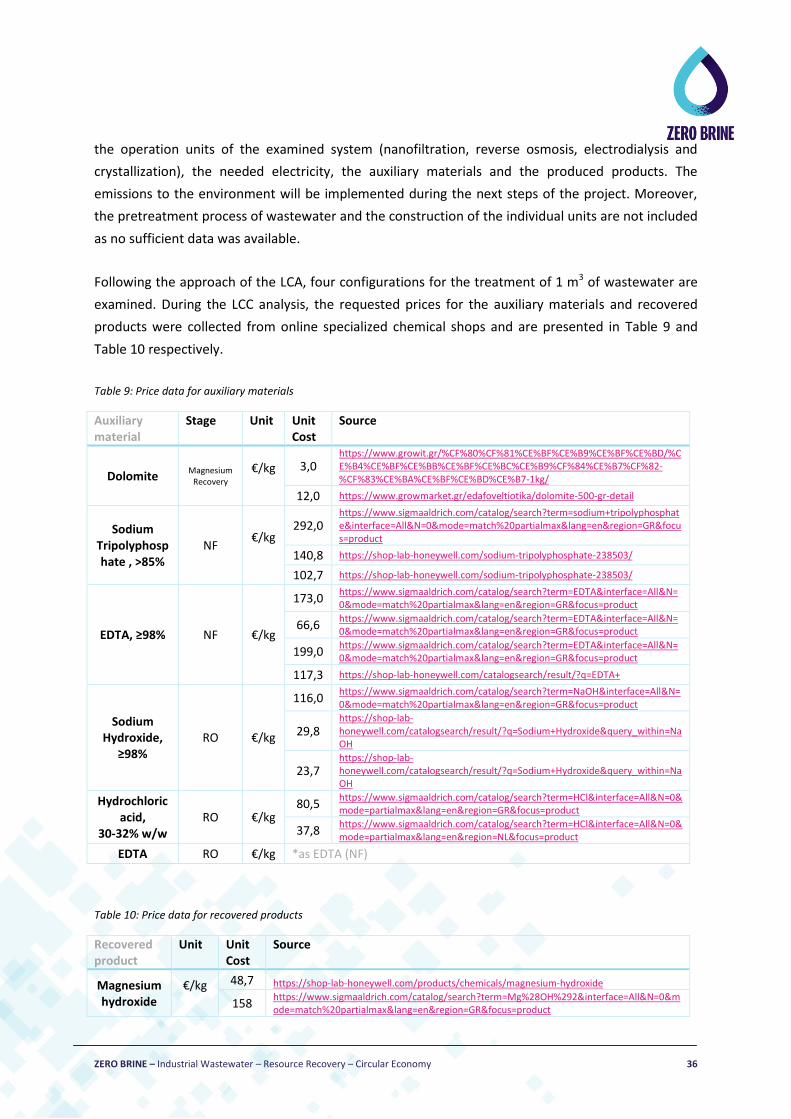
Following the approach of the LCA, four configurations for the treatment of 1 m3 of wastewater are
examined. During the LCC analysis, the requested prices for the auxiliary materials and recovered
products were collected from online specialized chemical shops and are presented in Table 9 and
Table 10 respectively.
Table 9: Price data for auxiliary materials
Auxiliary material
Stage Unit Unit Cost
Source
Dolomite Magnesium
Recovery €/kg
3,0 https://www.growit.gr/%CF%80%CF%81%CE%BF%CE%B9%CE%BF%CE%BD/%CE%B4%CE%BF%CE%BB%CE%BF%CE%BC%CE%B9%CF%84%CE%B7%CF%82-%CF%83%CE%BA%CE%BF%CE%BD%CE%B7-1kg/
12,0 https://www.growmarket.gr/edafoveltiotika/dolomite-500-gr-detail
Sodium Tripolyphosphate , >85%
NF €/kg
292,0 https://www.sigmaaldrich.com/catalog/search?term=sodium+tripolyphosphate&interface=All&N=0&mode=match%20partialmax&lang=en®ion=GR&focus=product
140,8 https://shop-lab-honeywell.com/sodium-tripolyphosphate-238503/
102,7 https://shop-lab-honeywell.com/sodium-tripolyphosphate-238503/
EDTA, ≥98% NF €/kg
173,0 https://www.sigmaaldrich.com/catalog/search?term=EDTA&interface=All&N=0&mode=match%20partialmax&lang=en®ion=GR&focus=product
66,6 https://www.sigmaaldrich.com/catalog/search?term=EDTA&interface=All&N=0&mode=match%20partialmax&lang=en®ion=GR&focus=product
199,0 https://www.sigmaaldrich.com/catalog/search?term=EDTA&interface=All&N=0&mode=match%20partialmax&lang=en®ion=GR&focus=product
117,3 https://shop-lab-honeywell.com/catalogsearch/result/?q=EDTA+
Sodium Hydroxide,
≥98% RO €/kg
116,0 https://www.sigmaaldrich.com/catalog/search?term=NaOH&interface=All&N=0&mode=match%20partialmax&lang=en®ion=GR&focus=product
29,8 https://shop-lab-honeywell.com/catalogsearch/result/?q=Sodium+Hydroxide&query_within=NaOH
23,7 https://shop-lab-honeywell.com/catalogsearch/result/?q=Sodium+Hydroxide&query_within=NaOH
Hydrochloric acid,
30-32% w/w RO €/kg
80,5 https://www.sigmaaldrich.com/catalog/search?term=HCl&interface=All&N=0&mode=partialmax&lang=en®ion=GR&focus=product
37,8 https://www.sigmaaldrich.com/catalog/search?term=HCl&interface=All&N=0&mode=partialmax&lang=en®ion=NL&focus=product
EDTA RO €/kg *as EDTA (NF)
Table 10: Price data for recovered products
Recovered product
Unit Unit Cost
Source
Magnesium hydroxide
€/kg
48,7 https://shop-lab-honeywell.com/products/chemicals/magnesium-hydroxide
158 https://www.sigmaaldrich.com/catalog/search?term=Mg%28OH%292&interface=All&N=0&mode=match%20partialmax&lang=en®ion=GR&focus=product

ZERO BRINE – Industrial Wastewater – Resource Recovery – Circular Economy 37
Sodium chloride
€/kg
29,04 https://shop-lab-honeywell.com/products/chemicals/sodium-chloride
54,4 https://www.sigmaaldrich.com/catalog/search?term=Sodium+chloride&interface=Product%20Name&N=0+&mode=mode%20matchpartialmax&lang=en®ion=GR&focus=productN=0%20220003048%20219853286%20219853132
Gypsum €/kg
0,40 https://www.bricoman.se/en/building-materials/cement-mortars-gypsums-plasters/gypsum-and-gypsum-mortars
2, https://sklep.jasam.eu/product-pol-10370-Dolina-Nidy-Gips-Szpachlowy-2kg.html
0,498 https://www.leroymerlin.gr/gr/domika-ulika/gupsosanides/axesouar-gupsosanidas/gupsos-kallitehnias-5kg-62055980/
0,17
https://www.baufox.com/%CE%B3%CF%8D%CF%88%CE%BF%CF%82-%CE%BA%CE%B1%CE%BB%CE%BB%CE%B9%CF%84%CE%B5%CF%87%CE%BD%CE%AF%CE%B1%CF%82-%CE%B6%CE%B1%CE%BA%CF%8D%CE%BD%CE%B8%CE%BF%CF%85-40kg%CF%83%CE%B1%CE%BA%CE%AF
0,44 https://www.leroymerlin.gr/gr/search-results/?q=%CE%B3%CF%8D%CF%88%CE%BF%CF%82&type=products
Deionised water
€/L
13,0 https://shop-lab-honeywell.com/catalogsearch/result/?q=water
0,75 https://www.stelpet.gr/Proion/19475/146/Apionismeno-nero-4Lt-Wurth/
2,56 https://www.chemicals.co.uk/cart
As observed in Table 9 and Table 10, there are price divergences in many cases based on the quality
characteristics of the product. To ensure a representative LCC analysis, an average market price for
each material and product was selected. It is worth mentioning that in the case of deionised water,
there are various market prices depending on its quality and usage. Assuming a medium quality of
deionised water, an average market price equal to 0,75 €/L was selected.
The electricity price in Poland is 0,141 €/kWh including the taxes (Eurostat, 2018).
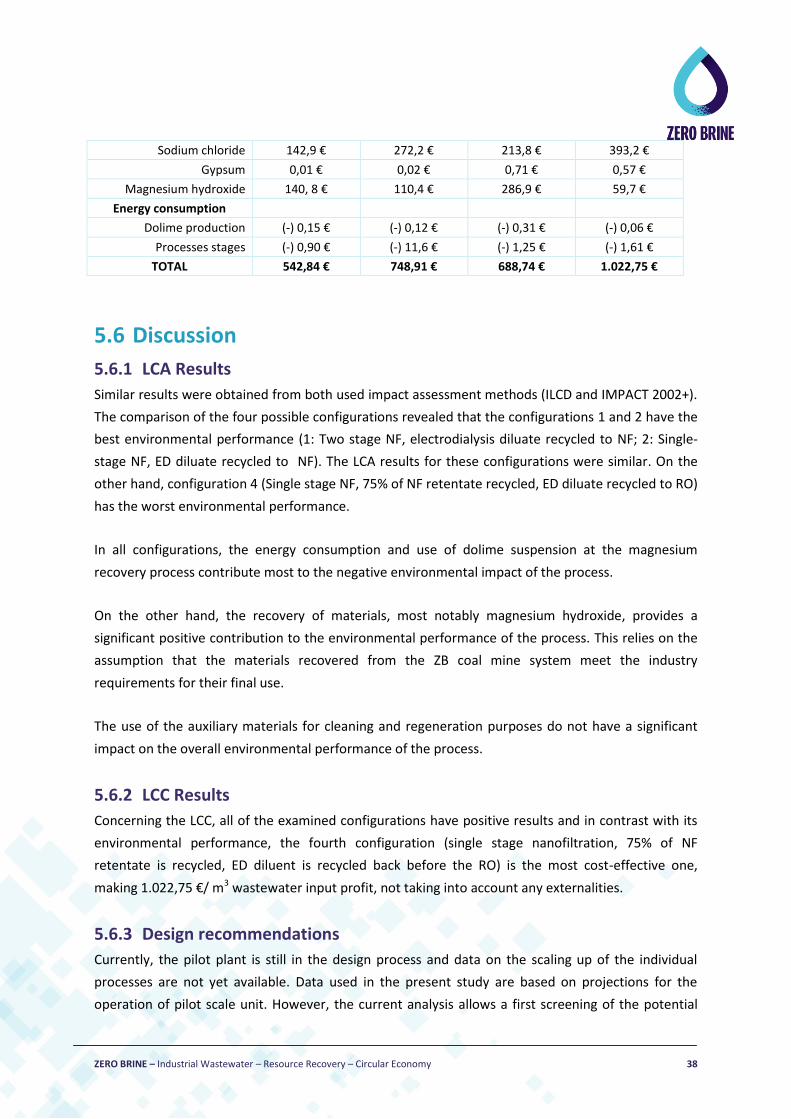
In Table 11 the LCC results for each possible configuration are presented according to the
aforementioned assumptions. The total cost per function unit is estimated by deducting the
expenditures by the revenues.
Table 11: Life Cycle Costing results
Cost / functional unit (treatment of 1m3 of coal mine wastewater)
Conf. 1 Conf. 2 Conf. 3 Conf. 4
Auxiliary materials
Dolomite (-) 162 € (-) 126 € (-) 330€ (-) 69 €
Sodium chloride (-) 0,14 € (-) 0,07 € (-) 0,14 € (-) 0,07 €
EDTA (-) 1,39 € (-) 0,69 € (-) 1,39 € (-) 0,69 €
Sodium Hydroxide (-) 0,03 € (-) 0,03 € (-) 0,03 € (-) 0,03 €
Hydrochloric acid (-) 0,004 € (-) 0,004 € (-) 0,004 € (-) 0,004 €
EDTA (-) 0,83 € (-) 0,83 € (-) 0,83 € (-) 0,83 €
Wastewater emissions
Wastewater (Mr) - - - -
Wastewater (Cr) - - - -
Recovered products
Deionised water 424,69 € 506,44 € 521,81 € 641,25 €
ZERO BRINE – Industrial Wastewater – Resource Recovery – Circular Economy 38
Sodium chloride 142,9 € 272,2 € 213,8 € 393,2 €
Gypsum 0,01 € 0,02 € 0,71 € 0,57 €
Magnesium hydroxide 140, 8 € 110,4 € 286,9 € 59,7 €
Energy consumption
Dolime production (-) 0,15 € (-) 0,12 € (-) 0,31 € (-) 0,06 €
Processes stages (-) 0,90 € (-) 11,6 € (-) 1,25 € (-) 1,61 €
TOTAL 542,84 € 748,91 € 688,74 € 1.022,75 €
5.6 Discussion
5.6.1 LCA Results
Similar results were obtained from both used impact assessment methods (ILCD and IMPACT 2002+).
The comparison of the four possible configurations revealed that the configurations 1 and 2 have the
best environmental performance (1: Two stage NF, electrodialysis diluate recycled to NF; 2: Single-
stage NF, ED diluate recycled to NF). The LCA results for these configurations were similar. On the
other hand, configuration 4 (Single stage NF, 75% of NF retentate recycled, ED diluate recycled to RO)
has the worst environmental performance.
In all configurations, the energy consumption and use of dolime suspension at the magnesium
recovery process contribute most to the negative environmental impact of the process.
On the other hand, the recovery of materials, most notably magnesium hydroxide, provides a
significant positive contribution to the environmental performance of the process. This relies on the
assumption that the materials recovered from the ZB coal mine system meet the industry
requirements for their final use.
The use of the auxiliary materials for cleaning and regeneration purposes do not have a significant
impact on the overall environmental performance of the process.
5.6.2 LCC Results
Concerning the LCC, all of the examined configurations have positive results and in contrast with its
environmental performance, the fourth configuration (single stage nanofiltration, 75% of NF
retentate is recycled, ED diluent is recycled back before the RO) is the most cost-effective one,
making 1.022,75 €/ m3 wastewater input profit, not taking into account any externalities.
5.6.3 Design recommendations
Currently, the pilot plant is still in the design process and data on the scaling up of the individual
processes are not yet available. Data used in the present study are based on projections for the
operation of pilot scale unit. However, the current analysis allows a first screening of the potential

ZERO BRINE – Industrial Wastewater – Resource Recovery – Circular Economy 39
environmental impacts and design recommendations based on environmental impact considerations.
The analysis suggests that the main aspect to be optimized is the energy consumption of the system,
as well as the corresponding energy source (i.e. renewable energy could replace the current energy
mix). The optimisation of magnesium hydroxide recovery stage in all configurations will contribute to
a better environmental performance of the pilot unit.
Concerning the recovered materials, it is of high importance to perform various tests in order to
achieve a high quality that will meet the end-users’ requirements. The reuse of these materials
contributes a lot to the positive environmental impact of the process.
5.6.4 Further work
The pilot plant will be constructed during the next phase of the ZB project. Consistent and accurate
data collection will take place from the start-up of the pilot plant in accordance with the database for
data collection framework of Work Package 3. It is important to collect a representative set of data
under various operation conditions. Data concerning the inputs and outputs of each stage, together
with the energy consumption, the cleaning and regeneration cycles, the spare parts and the quality
of the recovered materials will be collected. The implementation in the LCA study of the new data set
will provide a more accurate picture of the brine wastewater treatment. This will enable a more
robust evaluation of the ZB system. Moreover, externalities and CAPEX will be included in the LCC
study. Finally, the collection of data from the pilot plant and the update of the LCA and LCC models
could provide useful input for a possible industrial application.

ZERO BRINE – Industrial Wastewater – Resource Recovery – Circular Economy 40
6. Case Study 3: Textile Industry, Turkey
6.1 Intro The main environmental concern in the textile industry is the discharge of untreated process
effluents mainly due to their high organic content, colour, toxicity and salinity. Salts are used in the
dyeing processes and water softening, whereas, the use of acids for the caustic neutralization in the
mercerization process as well as the regeneration of water softening discharges also cause salt
generation. Salts are estimated to be in the most intense pollutants in textile wastewater in terms of
weight.
The ZB pilot plant in Turkey aims at recovering the brine solution from the reverse osmosis
concentrate originating from existing advanced treatment system of textile wastewater. The system
will be tested in ZORLU textile industry.
In Figure 19, the current design of the process outline of the pilot plant is presented. The ZB pilot
plant in Turkey will consist of three stages: (i) Ion Exchange, (ii) Ozonation and (iii) Reverse Osmosis.
Figure 19: Texttile case study: laboratory brine treatment process
After its startup, the pilot system will be evaluated against the following objectives:
- Demonstration of circular economy solutions in textile sector at a pilot scale through innovative
brine treatment.
- Utilization of the recovered concentrated salt solution for the dyeing process baths.
- Utilization of recovered materials and water (internal or external valorization).
- Minimization of solid by-product and subsequent needs of landfilling.
- Increase recovery of resources and lost products through advanced selective separation
technologies.

ZERO BRINE – Industrial Wastewater – Resource Recovery – Circular Economy 41
A LCA and LCC study has been carried out for the ZB textile case study and is presented in the
following sections.
6.2 Goal and Scope The goal of the preliminary LCA study is to assess the performance of the ZB pilot textile system by
comparing possible configurations of the unit operations. The results will be primarily used to help
the design procedure by providing initial environmental and sustainability input to the plant design
and operation. It will be examined which stages in the life cycle of the wastewater treatment
contribute most to the total impact of the process and what can be done to improve the process
performance. The results will be used by the technology providers and practitioners involved in the
textile case study of the ZB project as input to the design and operation procedure.
The scope of the present LCA study is described by the following:
The functional unit of the study will be 1 m3 of RO textile wastewater (see also Figure 19).
The functional unit is described by the composition presented in Table 12.
Allocation
Based on the recommendations of ISO 14044, allocation was avoided in the present study by
expanding the product system to include the additional functions.
The treatment of the ZORLU textile RO wastewater with the ZB pilot plant is a
multifunctional process resulting in the recovery of valuable products. The pilot plant is
evaluated with a focus on the treatment of the wastewater. In the LCA analysis, a system
expansion has been performed to include the production the avoided products: water for
processes and brine solution
The system boundaries are presented in Figure 20. The system boundaries start with the input of
the RO brine wastewater to the treatment train and will entail all the technologies involved in
the treatment of the RO wastewater. The steps included in the system boundaries are the
operation units (namely: ion exchange, ozonation and reverse osmosis), the needed electricity
and auxiliary materials, the cleaning and regeneration cycles as well as the produced products
and the emissions to the environment. The recovered products of the process are: (i) the brine
solution that will be used in the dyeing process and (ii) process water. For the analysis, these
products are considered to be avoided products.

ZERO BRINE – Industrial Wastewater – Resource Recovery – Circular Economy 42
Table 12: Textile RO wastewater composition
Parameter Unit Value
Salinity, NaCl % 6,22
pH - 8,2
Total Phosphorus
mg/L 18,5
CO3 mg/L 34,9
Zn (ppb) 40,15
NH4-N mg/L 48,8
SiO2 mg/L 49,9
Total Nitrogen mg/L 59,8
Color Pt-Co Pt-Co 71,8
Li (ppb) 173,6
Total Hardness mg CaCO3/L 202,2
Al (ppb) 282,9
COD mg/L 290,9
B (ppb) 371,5
Sr (ppb) 461,15
Fe (ppb) 731,6
Cl mg/L 1598,7
SO4 mg/L 1987,8
HCO3 mg/L 2298,5
Conductivity µs/cm 10629,2
Mg (ppb) 11832,3
Ca (ppb) 61477
K (ppb) 127759
Na (ppb) 2392000
Figure 20: Textile case study: system boundaries
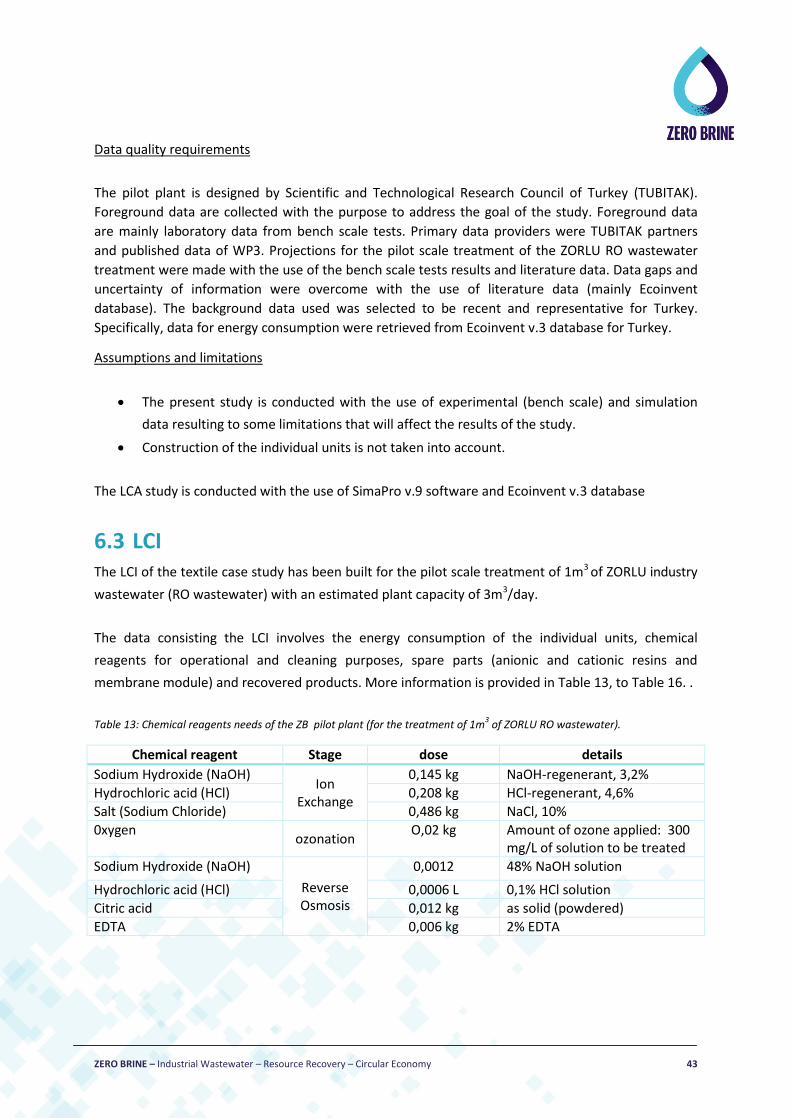
ZERO BRINE – Industrial Wastewater – Resource Recovery – Circular Economy 43
Data quality requirements
The pilot plant is designed by Scientific and Technological Research Council of Turkey (TUBITAK).
Foreground data are collected with the purpose to address the goal of the study. Foreground data
are mainly laboratory data from bench scale tests. Primary data providers were TUBITAK partners
and published data of WP3. Projections for the pilot scale treatment of the ZORLU RO wastewater
treatment were made with the use of the bench scale tests results and literature data. Data gaps and
uncertainty of information were overcome with the use of literature data (mainly Ecoinvent
database). The background data used was selected to be recent and representative for Turkey.
Specifically, data for energy consumption were retrieved from Ecoinvent v.3 database for Turkey.
Assumptions and limitations
The present study is conducted with the use of experimental (bench scale) and simulation
data resulting to some limitations that will affect the results of the study.
Construction of the individual units is not taken into account.
The LCA study is conducted with the use of SimaPro v.9 software and Ecoinvent v.3 database
6.3 LCI The LCI of the textile case study has been built for the pilot scale treatment of 1m3 of ZORLU industry
wastewater (RO wastewater) with an estimated plant capacity of 3m3/day.
The data consisting the LCI involves the energy consumption of the individual units, chemical
reagents for operational and cleaning purposes, spare parts (anionic and cationic resins and
membrane module) and recovered products. More information is provided in Table 13, to Table 16. .
Table 13: Chemical reagents needs of the ZB pilot plant (for the treatment of 1m3 of ZORLU RO wastewater).
Chemical reagent Stage dose details
Sodium Hydroxide (NaOH) Ion
Exchange
0,145 kg NaOH-regenerant, 3,2%
Hydrochloric acid (HCl) 0,208 kg HCl-regenerant, 4,6%
Salt (Sodium Chloride) 0,486 kg NaCl, 10%
0xygen ozonation
O,02 kg Amount of ozone applied: 300 mg/L of solution to be treated
Sodium Hydroxide (NaOH)
Reverse Osmosis
0,0012 48% NaOH solution
Hydrochloric acid (HCl) 0,0006 L 0,1% HCl solution
Citric acid 0,012 kg as solid (powdered)
EDTA 0,006 kg 2% EDTA
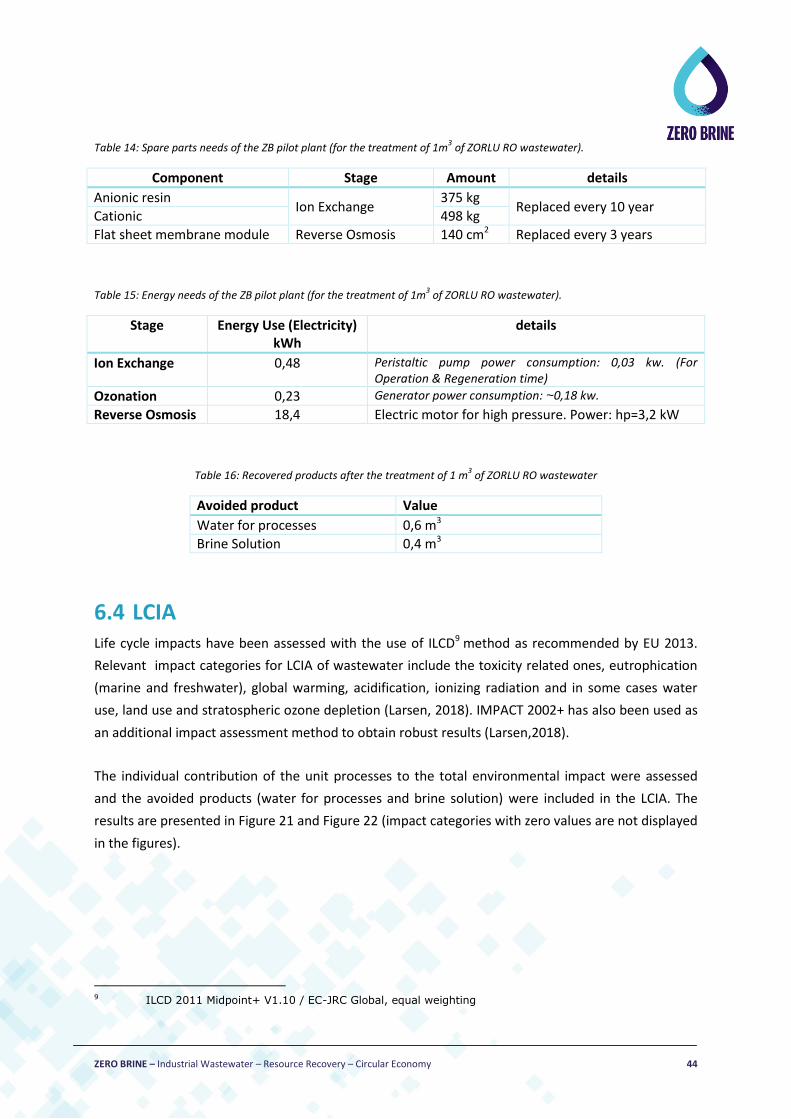
ZERO BRINE – Industrial Wastewater – Resource Recovery – Circular Economy 44
Table 14: Spare parts needs of the ZB pilot plant (for the treatment of 1m3 of ZORLU RO wastewater).
Component Stage Amount details
Anionic resin Ion Exchange
375 kg Replaced every 10 year
Cationic 498 kg
Flat sheet membrane module Reverse Osmosis 140 cm2 Replaced every 3 years
Table 15: Energy needs of the ZB pilot plant (for the treatment of 1m3 of ZORLU RO wastewater).
Stage Energy Use (Electricity) kWh
details
Ion Exchange 0,48 Peristaltic pump power consumption: 0,03 kw. (For Operation & Regeneration time)
Ozonation 0,23 Generator power consumption: ~0,18 kw.
Reverse Osmosis 18,4 Electric motor for high pressure. Power: hp=3,2 kW
Table 16: Recovered products after the treatment of 1 m3 of ZORLU RO wastewater
Avoided product Value
Water for processes 0,6 m3
Brine Solution 0,4 m3
6.4 LCIA Life cycle impacts have been assessed with the use of ILCD9 method as recommended by EU 2013.
Relevant impact categories for LCIA of wastewater include the toxicity related ones, eutrophication
(marine and freshwater), global warming, acidification, ionizing radiation and in some cases water
use, land use and stratospheric ozone depletion (Larsen, 2018). IMPACT 2002+ has also been used as
an additional impact assessment method to obtain robust results (Larsen,2018).
The individual contribution of the unit processes to the total environmental impact were assessed
and the avoided products (water for processes and brine solution) were included in the LCIA. The
results are presented in Figure 21 and Figure 22 (impact categories with zero values are not displayed
in the figures).
9 ILCD 2011 Midpoint+ V1.10 / EC-JRC Global, equal weighting
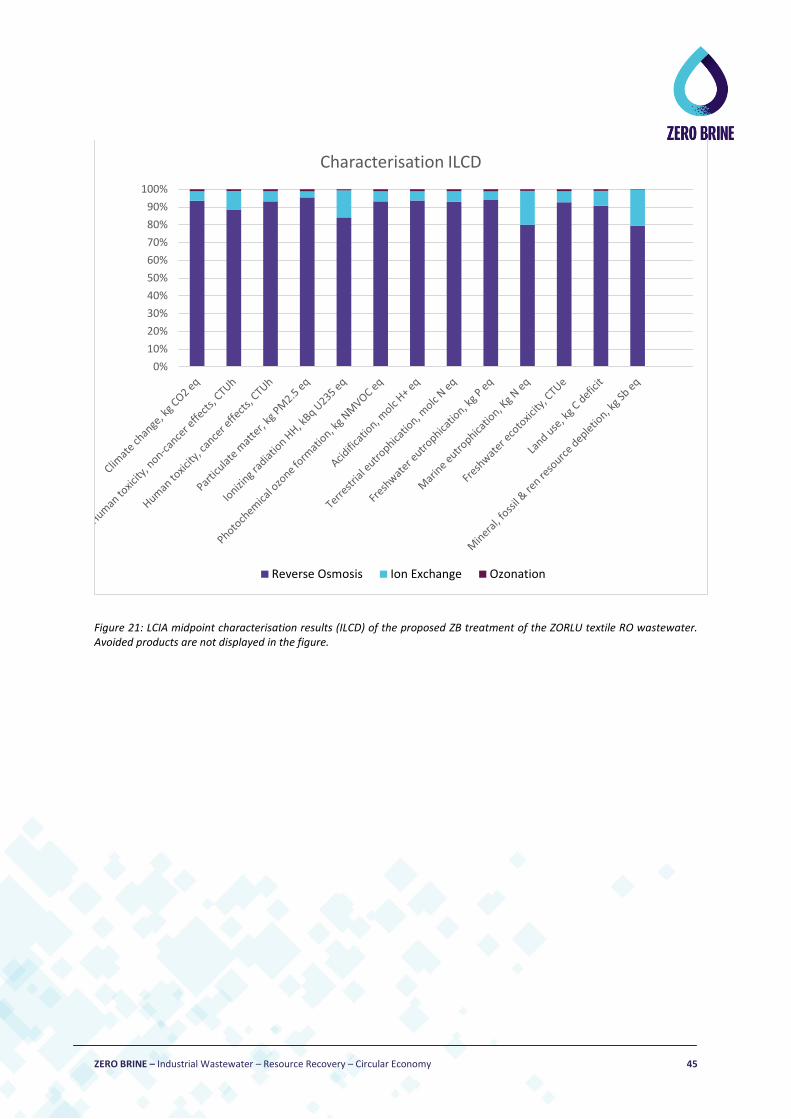
ZERO BRINE – Industrial Wastewater – Resource Recovery – Circular Economy 45
Figure 21: LCIA midpoint characterisation results (ILCD) of the proposed ZB treatment of the ZORLU textile RO wastewater. Avoided products are not displayed in the figure.
0%
10%
20%
30%
40%
50%
60%
70%
80%
90%
100%
Characterisation ILCD
Reverse Osmosis Ion Exchange Ozonation

ZERO BRINE – Industrial Wastewater – Resource Recovery – Circular Economy 46
Figure 22: LCIA mid point normalisation results (ILCD) of the proposed ZB treatment of the ZORLU textile RO wastewater. (avoided products included)
6.5 LCC The functional unit of the system is “the treatment of 1 m3 of textile industry wastewater”.
Specifically, this wastewater refers to a typical composition of the wastewater stream of “ZORLU”
textile industry. The system boundaries used in LCC are based on the scheme proposed in Figure 20.
The considered phases are the same than those considered in the LCA study. The current system
boundaries cover the operation units of the examined system (ion exchange, ozonation and reverse
osmosis), the needed electricity, the auxiliary materials and the produced products. The emissions to
the environment will be implemented during the next steps of the project. Moreover, the
construction of the individual units is not included as adequate data was not available.
-0,80
-0,70
-0,60
-0,50
-0,40
-0,30
-0,20
-0,10
0,00
0,10
No
rmal
isat
ion
un
its
Normalisation ILCD
Ozonation Ion Exchange Reverse Osmosis Recovered water Recovered brine solution
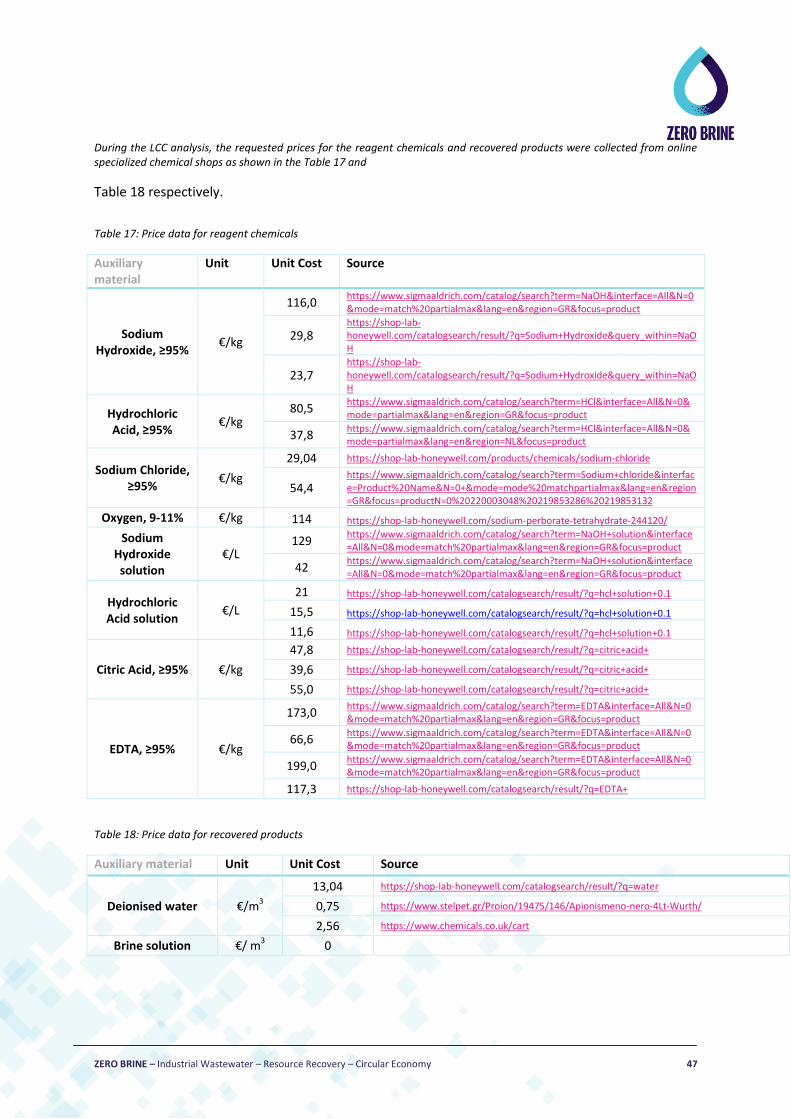
ZERO BRINE – Industrial Wastewater – Resource Recovery – Circular Economy 47
During the LCC analysis, the requested prices for the reagent chemicals and recovered products were collected from online specialized chemical shops as shown in the Table 17 and
Table 18 respectively.
Table 17: Price data for reagent chemicals
Auxiliary material
Unit Unit Cost Source
Sodium Hydroxide, ≥95%
€/kg
116,0 https://www.sigmaaldrich.com/catalog/search?term=NaOH&interface=All&N=0&mode=match%20partialmax&lang=en®ion=GR&focus=product
29,8 https://shop-lab-honeywell.com/catalogsearch/result/?q=Sodium+Hydroxide&query_within=NaOH
23,7 https://shop-lab-honeywell.com/catalogsearch/result/?q=Sodium+Hydroxide&query_within=NaOH
Hydrochloric Acid, ≥95%
€/kg 80,5
https://www.sigmaaldrich.com/catalog/search?term=HCl&interface=All&N=0&mode=partialmax&lang=en®ion=GR&focus=product
37,8 https://www.sigmaaldrich.com/catalog/search?term=HCl&interface=All&N=0&mode=partialmax&lang=en®ion=NL&focus=product
Sodium Chloride, ≥95%
€/kg
29,04 https://shop-lab-honeywell.com/products/chemicals/sodium-chloride
54,4 https://www.sigmaaldrich.com/catalog/search?term=Sodium+chloride&interface=Product%20Name&N=0+&mode=mode%20matchpartialmax&lang=en®ion=GR&focus=productN=0%20220003048%20219853286%20219853132
Oxygen, 9-11% €/kg 114 https://shop-lab-honeywell.com/sodium-perborate-tetrahydrate-244120/
Sodium Hydroxide solution
€/L 129
https://www.sigmaaldrich.com/catalog/search?term=NaOH+solution&interface=All&N=0&mode=match%20partialmax&lang=en®ion=GR&focus=product
42 https://www.sigmaaldrich.com/catalog/search?term=NaOH+solution&interface=All&N=0&mode=match%20partialmax&lang=en®ion=GR&focus=product
Hydrochloric Acid solution
€/L
21 https://shop-lab-honeywell.com/catalogsearch/result/?q=hcl+solution+0.1
15,5 https://shop-lab-honeywell.com/catalogsearch/result/?q=hcl+solution+0.1
11,6 https://shop-lab-honeywell.com/catalogsearch/result/?q=hcl+solution+0.1
Citric Acid, ≥95% €/kg
47,8 https://shop-lab-honeywell.com/catalogsearch/result/?q=citric+acid+
39,6 https://shop-lab-honeywell.com/catalogsearch/result/?q=citric+acid+
55,0 https://shop-lab-honeywell.com/catalogsearch/result/?q=citric+acid+
EDTA, ≥95% €/kg
173,0 https://www.sigmaaldrich.com/catalog/search?term=EDTA&interface=All&N=0&mode=match%20partialmax&lang=en®ion=GR&focus=product
66,6 https://www.sigmaaldrich.com/catalog/search?term=EDTA&interface=All&N=0&mode=match%20partialmax&lang=en®ion=GR&focus=product
199,0 https://www.sigmaaldrich.com/catalog/search?term=EDTA&interface=All&N=0&mode=match%20partialmax&lang=en®ion=GR&focus=product
117,3 https://shop-lab-honeywell.com/catalogsearch/result/?q=EDTA+
Table 18: Price data for recovered products
Auxiliary material Unit Unit Cost Source
Deionised water €/m3
13,04 https://shop-lab-honeywell.com/catalogsearch/result/?q=water
0,75 https://www.stelpet.gr/Proion/19475/146/Apionismeno-nero-4Lt-Wurth/
2,56 https://www.chemicals.co.uk/cart
Brine solution €/ m3 0

ZERO BRINE – Industrial Wastewater – Resource Recovery – Circular Economy 48
From the above presented data, an average market price was estimated for each reagent chemical
and recovered product. It is worth to mention that in the case of deionised water, there are various
market prices depending on its quality and usage. Assuming a medium quality of deionised water, an
average market price equal to 0,75 €/L was selected.
As for the electricity price, according to World Energy Council (2018), is estimated 0,09 €/kWh (0,59
Turkish cents/KWh).
Table 19 presents the LCC results based on the LCI data about energy consumption of the individual
units, chemical reagents for operational and cleaning purposes and, recovered products and the
average market prices as presented above.
Table 19: Life Cycle Costing Results
Dose / Amount Unit Cost / Functional Unit
Chemical Reagent
Sodium Hydroxide 0,145 kg (-) 8,19 €
Hydrochloric acid 0,208 kg (-) 12,30 €
Salt (Sodium Chloride) 0,486 kg (-) 20,28 €
Oxygen 0,02 kg (-) 2,29 €
Sodium Hydroxide solution
0,0012 L (-) 0,10 €
Hydrochloric acid solution 0,0006 L (-) 0,01 €
Citric acid 0,012 kg (-) 0,57 €
EDTA 0,006 kg (-) 0,83 €
Energy Consumption
Ion Exchange 0,48 kWh (-) 0,05 €
Ozonation 0,23 kWh (-) 0,02 €
RO 18,4 kWh (-) 1,74 €
Avoided product
Deionised water 0,6 m3 450,00 €
Brine Solution 0,4 m3 0,00 €
TOTAL 403,62 €
Based on Table 19, the LCC result is positive at 403,62 €/m3 wastewater input, not taking into
account any externalities.

ZERO BRINE – Industrial Wastewater – Resource Recovery – Circular Economy 49
6.6 Discussion
6.6.1 Results
Similar results were obtained from both used impact assessment methods (ILCD and IMPACT 2002+).
Specifically, the results revealed that Reverse Osmosis contributes more at the negative
environmental impact of the process. Further analysis of the Reverse Osmosis process showed that
this is due to the energy consumption requirements of the plant. As it is shown in Figure 21 and
Figure 22 Reverse Osmosis stage contributes most at all the impact categories, with a factor of higher
than 80%, except ozone layer depletion.
On the other hand, the recovery of materials, most notably the brine solution, provides a significant
positive contribution to the environmental performance of the process.
Moreover, it was assumed that the materials recovered from the ZB textile system meet the industry
requirements for their final use. The Reverse Osmosis concentrate is aimed to be used for the dyeing
process of the ZORLU textile industry, where a brine solution (mainly NaCl) is currently used.
Recovered water is aimed to be used also at ZORLU industry for process water. It is worth
mentioning that transport of the recovered materials is not included in the present study.
The use of auxiliary materials (mainly cleaning and operational chemicals) do not have a significant
impact on the overall environmental performance of the process.
6.6.2 Design recommendations
The design of the pilot plant as well as the bench scale tests are still at an early stage and data for the
scaling up of different stages are currently not available. Data used in the present study is based on
projections for the pilot scale unit. However, this kind of data only allows a first screening of the
possible environmental impacts to provide initial design recommendations. To this end, the main
aspect of the ZB pilot plant design that needs to be optimized is the energy consumption of the
Reverse Osmosis unit.
With regard to the recovered materials, it is important to perform tests to ensure that the recovered
water and brine solution will meet the quality required for use in the company’s processes. The reuse
of these materials will contribute significantly to the positive environmental impact of the process.
6.6.3 Further work
ZERO BRINE – Industrial Wastewater – Resource Recovery – Circular Economy 50
During the next phase of the ZB project the pilot plant will be constructed. Consistent and accurate
data collection will take place, from the start-up of the pilot plant in accordance to the database for
data collection built in the framework of Work Package 3.
As the characteristics of the ZORLU textile Reverse Osmosis wastewater that is going to be treated
are variable due to textile operations, it is important to collect a representative set of data from
various operation conditions. Data concerning the inputs and outputs of each stage, together with
the energy consumption, the cleaning and regeneration cycles, the spare parts and the quality of the
recovered materials will be collected. Moreover, it is foreseen to collect accurate data for the
existing wastewater treatment plant at ZORLU textile industry where is currently discharged the
brine wastewater.
The implementation in the LCA study of the new data set will allow to obtain a more complete
picture of the brine wastewater treatment and evaluate the ZB pilot system against the objectives of
the project. Moreover, the externalised will also be included in the LCC analysis at a later stage.
Finally, the collection of data from the pilot plant and the update of the LCA and LCC models could
provide useful input for a possible industrial application.

ZERO BRINE – Industrial Wastewater – Resource Recovery – Circular Economy 51
7. Case Study 4: Silica Industry, Spain
7.1 Intro This section assesses the demonstration site located at Industrias Químicas del Ebro S.A. (IQE) in
Spain. IQE is a chemical manufacturing company focused primarily on silicate products. Its operation
is an important economic activity in the Zaragoza area. It generates job opportunities and has high
influence in the economy of the region. However, due to IQE productive activity, high amounts of
waste streams with high salinity are produced. Figure 23 presents the water cycle at IQE.
Figure 23 Water cycle in the production process at IQE.
Firstly, groundwater is extracted and pre-treated to be brought into a reverse osmosis (RO) system.
Osmotic water produced is then used into the production process where saline wastewater streams
are generated. Unfortunately, the management of these streams has a high environmental impact
and an elevated cost is associated to it. This cost is related to the discharge of these streams that
must be treated in a wastewater treatment plant.
The implementation of the new treatment process should enable a reduction of costs derived from
water consumption and wastewater management. These strategies must demonstrate new
configurations to recover sodium sulphate, ultrapure water and heat could bring tangible benefits
from both an environmental and economic perspectives. As a whole, technology development is
required to tackle the associated problems caused by streams from silica production.
In this preliminary report, a simplified version of the solution is assessed. Hence, the system entails
part of the treatment of wastewater from silica production in IQE facilities. This simplification is
carried out because of the early stage of the project and the current lack of relevant data for the
complete system. Some of the technical actions of the project are still ongoing or still at bench scale.
Hence, the present report is focused on the ZB proposed solution. For that, an industrial plant based
on membrane technology has been designed in order to have solid data for the preliminary study.
Data from this design has been entered into SimaPro LCA software in order to show results more
according to a real environment under industrial conditions.
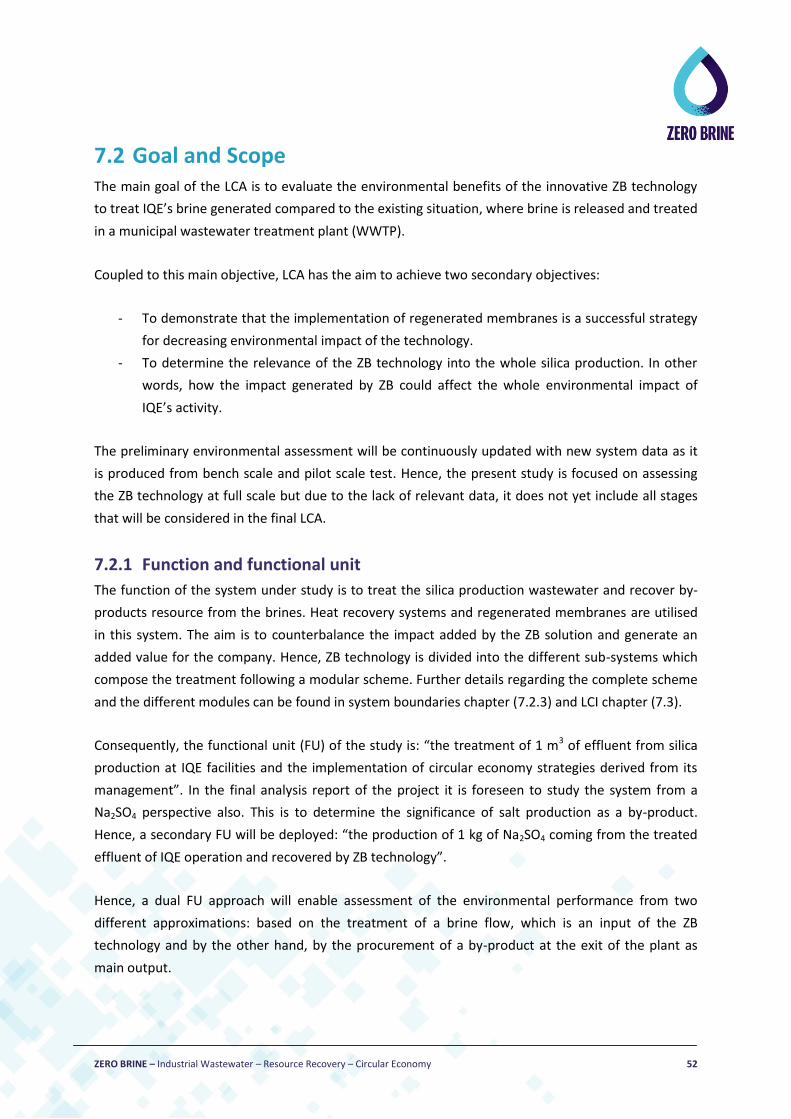
ZERO BRINE – Industrial Wastewater – Resource Recovery – Circular Economy 52
7.2 Goal and Scope The main goal of the LCA is to evaluate the environmental benefits of the innovative ZB technology
to treat IQE’s brine generated compared to the existing situation, where brine is released and treated
in a municipal wastewater treatment plant (WWTP).
Coupled to this main objective, LCA has the aim to achieve two secondary objectives:
- To demonstrate that the implementation of regenerated membranes is a successful strategy
for decreasing environmental impact of the technology.
- To determine the relevance of the ZB technology into the whole silica production. In other
words, how the impact generated by ZB could affect the whole environmental impact of
IQE’s activity.
The preliminary environmental assessment will be continuously updated with new system data as it
is produced from bench scale and pilot scale test. Hence, the present study is focused on assessing
the ZB technology at full scale but due to the lack of relevant data, it does not yet include all stages
that will be considered in the final LCA.
7.2.1 Function and functional unit
The function of the system under study is to treat the silica production wastewater and recover by-
products resource from the brines. Heat recovery systems and regenerated membranes are utilised
in this system. The aim is to counterbalance the impact added by the ZB solution and generate an
added value for the company. Hence, ZB technology is divided into the different sub-systems which
compose the treatment following a modular scheme. Further details regarding the complete scheme
and the different modules can be found in system boundaries chapter (7.2.3) and LCI chapter (7.3).
Consequently, the functional unit (FU) of the study is: “the treatment of 1 m3 of effluent from silica
production at IQE facilities and the implementation of circular economy strategies derived from its
management”. In the final analysis report of the project it is foreseen to study the system from a
Na2SO4 perspective also. This is to determine the significance of salt production as a by-product.
Hence, a secondary FU will be deployed: “the production of 1 kg of Na2SO4 coming from the treated
effluent of IQE operation and recovered by ZB technology”.
Hence, a dual FU approach will enable assessment of the environmental performance from two
different approximations: based on the treatment of a brine flow, which is an input of the ZB
technology and by the other hand, by the procurement of a by-product at the exit of the plant as
main output.

ZERO BRINE – Industrial Wastewater – Resource Recovery – Circular Economy 53
7.2.2 Allocation
Following the recommendations of ISO 14040 (2006) and 14044 (2006), allocation is avoided in this
study through system expansion. In this regard, all by-products will be included in the system
boundaries, considering its further destination and usage. Nevertheless, this approach is fully
dependant on the evolution of the project. Consequently, future decisions could modify the
approach currently adopted.
7.2.3 System boundaries
This report is focused on the stages which currently have full scale data. Hence, the considered steps
are brine treatment and silica production (represented in Error! Reference source not found. with
he green dotted line).
Membrane regeneration is also considered within the system boundaries of this study. However,
different laboratory tests are currently running to find the optimum operation parameters. Therefore,
this preliminary assessment focuses on a comparison of the environmental impacts of the using a
conventional R.O. membrane with a regenerated membrane. This aspect mainly entails a comparison
of capital goods production, setting the basis for future comparisons. When further test data on the
membrane characteristics is available, the operation phase of the membranes will be included. The
current assessment of the regenerated membranes utilises conventional R.O. operational data,
therefore adopting a conservative approach.
The system boundaries of the final study will include the whole ZB scheme listed below when
upscaling will be ready, as well is represented in Figure 24.
- Silica production: The IQE scheme will be included in the system to provide a complete
picture of the process. Its inclusion is aimed at finding out what the importance of the ZB is in
reference to the silica productive scheme.
- Brine treatment: This module receives the effluents from IQE and obtains ultrapure water
and concentrated brines. It is based on physico-chemical and membranes technologies.
- Membrane regeneration: The inclusion of this stage is aimed at providing RO membranes
that have been given a second life and are a critical component of the ZB process.
- Brine concentration: Current strategies for brine concentration rely on brine crystallization
and EFC (Eutectic Freeze crystallization). At the end, the goal of this step is to concentrate
the brines and recover water and salts.
- Heat recovery: Different processes during silica production in IQE have heat surplus which
are not recovered. In this way, the heat recovery stage aims to utilise the waste heat for use
mainly in crystallization step.
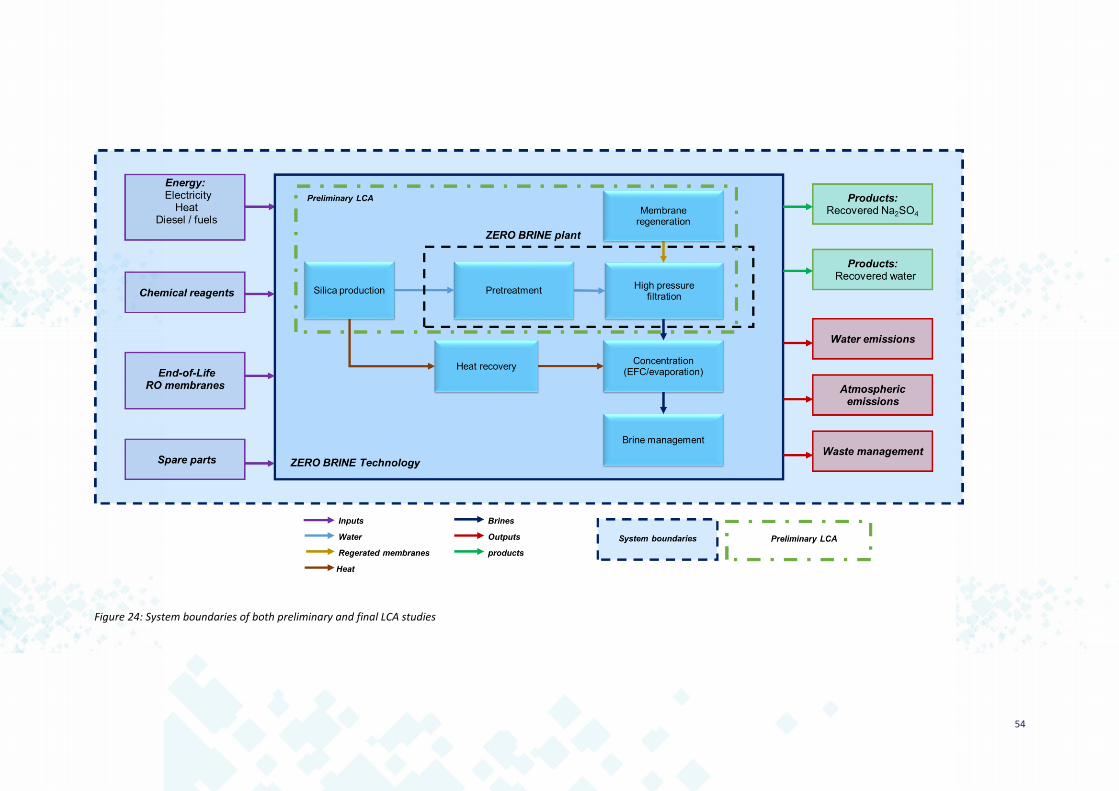
54
Figure 24: System boundaries of both preliminary and final LCA studies

55
The ZB brine treatment plant can be subdivided into 5 sections, as listed below and shown in Figure
25:
- Physico-chemical treatment: brines coming from IQE’s production process enter the plant.
Different chemical reagents are added (limestone, coagulants and flocculants). After settling,
sludge and clarified water are separated.
- Physico-chemical sludge treatment: Sludge from pre-treatment is thickened and flocculants
are added. After that, a centrifugal screw for reducing its water content mashes the sludge.
- Sand filtering: clarified water from the pre-treatment gets into the sand filters at high
pressure. The aim of this step is to remove solids before membrane filtration.
- Ultrafiltration step: Sodium hypochlorite, sodium hydroxide and hydrochloric acid are added
to the water in the filtration stage. The next step is ultrafiltration.
- Reverse osmosis: Permeate from the UF stage is fed into the RO filtration step. Hydrochloric
acid, sodium hydroxide and antifouling reagent are added to the stream. Permeate after this
step is ready to be reintroduced in IQE’s silica production scheme.
For each part of the process, for both capital goods and operation all factors are considered. The
operation phase consists of inputs and outputs, energy consumption, chemicals involved, wastes and
products. For stages to be included in the next steps of the project, both capital goods and operation
will be implemented.
Regenerated membranes are considered as “zero environmental burdens” regarding its production.
The impact of these devices is allocated to the regeneration process and its transportation from the
place where have been used. In this case, end-of-life membranes are conveyed from “El Prat”
desalination plant, located 300 km away from IQE facilities. At this time, this stage is limited to
operational data. Nevertheless, the final study will include data for the capital goods.
Silica production is considered within the system boundaries in all assessed scenarios (further
information can be found on chapter 7.2.4).
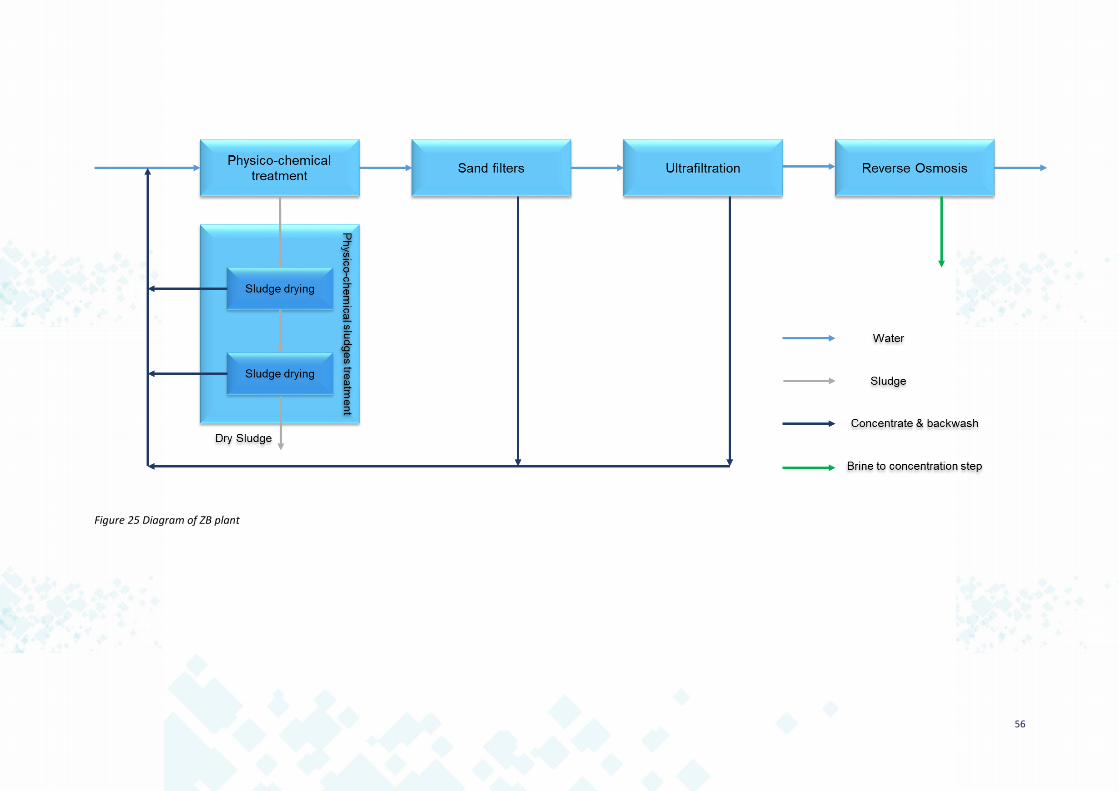
56
Figure 25 Diagram of ZB plant

57
7.2.4 Scenarios /process configurations
As a preliminary assessment this LCA covers a single situation based on the technology assessment of
ZB brine filtration technology. In the updated versions of the LCA, the complete environmental
assessment of the ZB strategy will assess the following scenarios:
- Standard scenario (reference system): Based on the current situation: Treatment of IQE’s
brine in the municipal WWTP “La Cartuja”. No recovery of salts nor energy and water is
performed in this scenario.
- ZB basis scenario. ZB technology implementation for the treatment of wastewater from silica
production. This scenario will also include the membrane regeneration step to account their
environmental gains derived.
o Sub-Scenario 1: ZB + Recovery of Na2SO4 is included.
o Sub-Scenario 2: ZB + EFC technology in the concentration step.
o Sub-Scenario 3: ZB + Evaporation technology included in the concentration step.
Each scenario will show their results within and without silica production and will be compared
against the reference system. This approach is aimed at finding out the relevance of ZB system in
relation to silica production scheme as stated in the goal and scope of the study.
7.2.5 Data quality
The inventory for the current report has been built mainly from primary data. It has been
implemented from a technical report of the industrial scale up of membrane step provided by TYPSA.
It entails both operation (energy and chemicals consumption) and capital goods. Primary data from
membrane regeneration has been gathered from TYPSA and operation tests. Despite the very good
data quality, it is anticipated that this will be updated and be refined during the data collection of the
pilot stage of the project.
IQE provided silica and wastewaters production amount (primary data). Secondary data for building
up the inventory has been taken from IQE’s Environmental Operation License (publicly available)
(PRTR, 2019). Furthermore, “Large Volume Inorganic Chemicals - Solids and Others industry” BREF
document (EC, 2007) has been also considered.
The main limitations of this study are strongly related to its preliminary concept. Concentration
technology is still under development (EFC and evaporation), as well as heat recovery. Therefore, no
representative inventory can be built for these stages.
7.3 LCI The LCI has been built from an industrial plant design for treating IQE wastewater, with a capacity of
20 m3/h (480 m3/day). This scheme entails both pre-treatment and high-pressure stages.
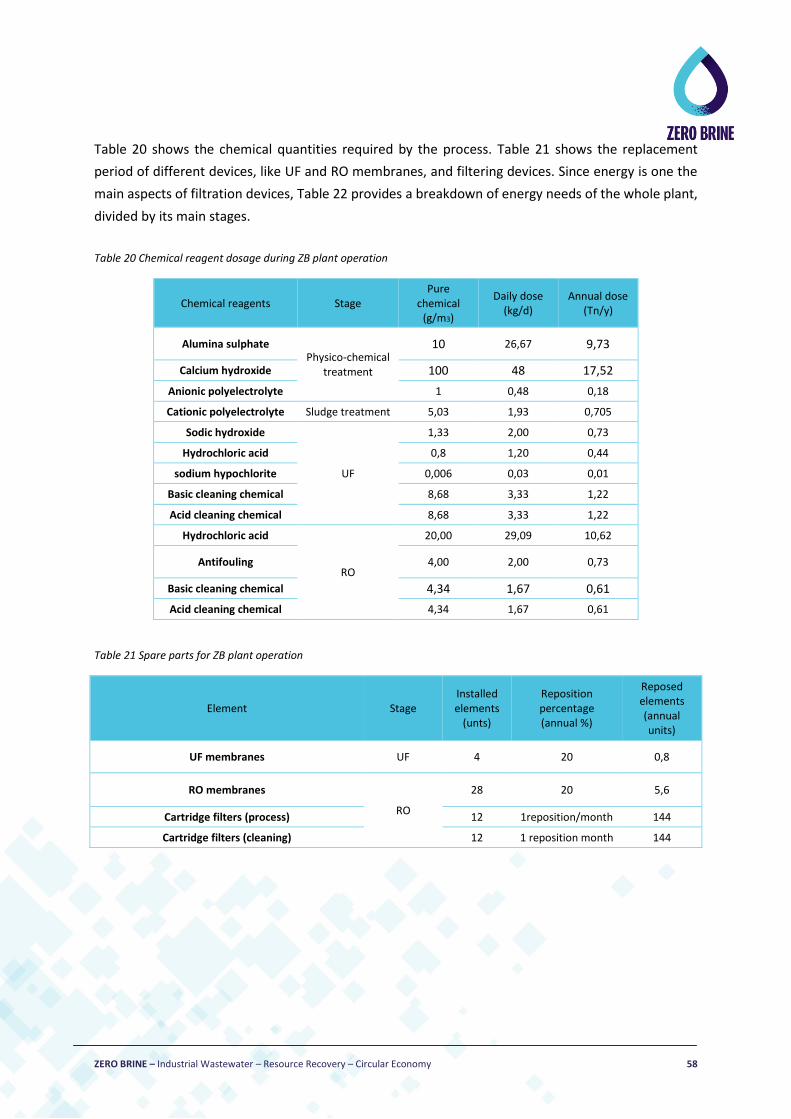
ZERO BRINE – Industrial Wastewater – Resource Recovery – Circular Economy 58
Table 20 shows the chemical quantities required by the process. Table 21 shows the replacement
period of different devices, like UF and RO membranes, and filtering devices. Since energy is one the
main aspects of filtration devices, Table 22 provides a breakdown of energy needs of the whole plant,
divided by its main stages.
Table 20 Chemical reagent dosage during ZB plant operation
Chemical reagents Stage Pure
chemical (g/m3)
Daily dose (kg/d)
Annual dose (Tn/y)
Alumina sulphate Physico-chemical
treatment
10 26,67 9,73
Calcium hydroxide 100 48 17,52
Anionic polyelectrolyte 1 0,48 0,18
Cationic polyelectrolyte Sludge treatment 5,03 1,93 0,705
Sodic hydroxide
UF
1,33 2,00 0,73
Hydrochloric acid 0,8 1,20 0,44
sodium hypochlorite 0,006 0,03 0,01
Basic cleaning chemical 8,68 3,33 1,22
Acid cleaning chemical 8,68 3,33 1,22
Hydrochloric acid
RO
20,00 29,09 10,62
Antifouling 4,00 2,00 0,73
Basic cleaning chemical 4,34 1,67 0,61
Acid cleaning chemical 4,34 1,67 0,61
Table 21 Spare parts for ZB plant operation
Element Stage Installed elements
(unts)
Reposition percentage (annual %)
Reposed elements (annual units)
UF membranes UF 4 20 0,8
RO membranes
RO
28 20 5,6
Cartridge filters (process) 12 1reposition/month 144
Cartridge filters (cleaning) 12 1 reposition month 144
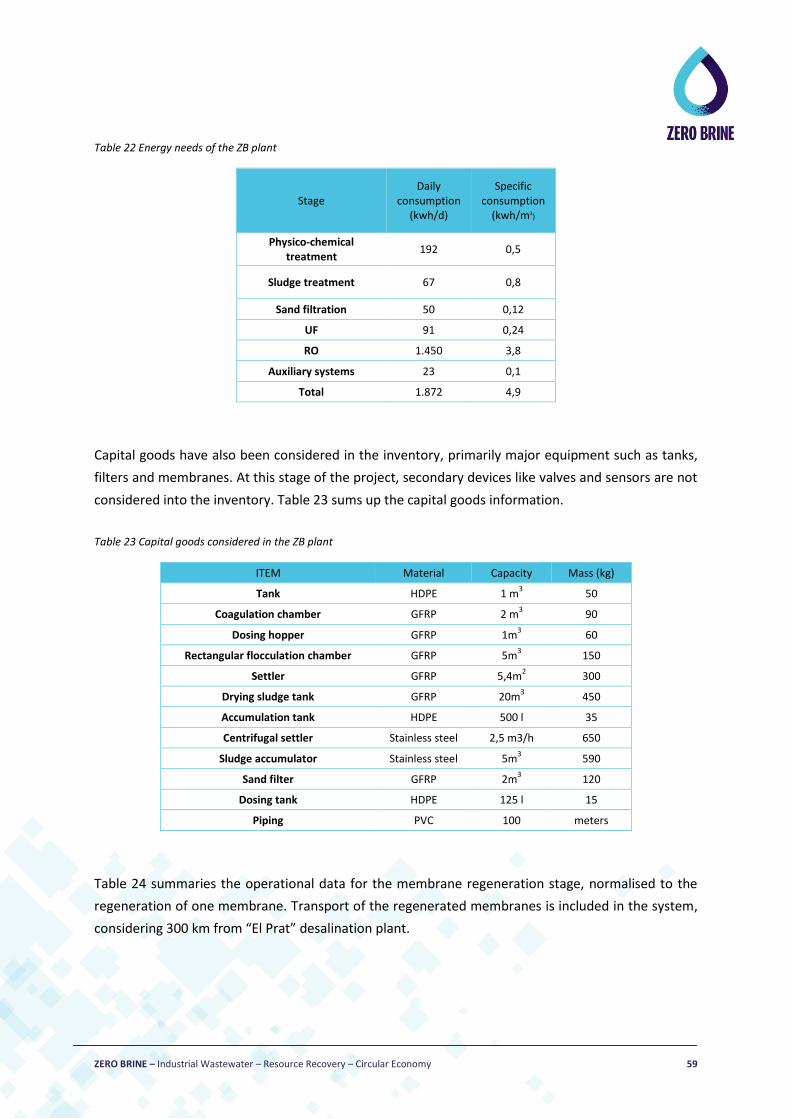
ZERO BRINE – Industrial Wastewater – Resource Recovery – Circular Economy 59
Table 22 Energy needs of the ZB plant
Stage Daily
consumption (kwh/d)
Specific consumption
(kwh/m3)
Physico-chemical treatment
192 0,5
Sludge treatment 67 0,8
Sand filtration 50 0,12
UF 91 0,24
RO 1.450 3,8
Auxiliary systems 23 0,1
Total 1.872 4,9
Capital goods have also been considered in the inventory, primarily major equipment such as tanks,
filters and membranes. At this stage of the project, secondary devices like valves and sensors are not
considered into the inventory. Table 23 sums up the capital goods information.
Table 23 Capital goods considered in the ZB plant
ITEM Material Capacity Mass (kg)
Tank HDPE 1 m3 50
Coagulation chamber GFRP 2 m3 90
Dosing hopper GFRP 1m3 60
Rectangular flocculation chamber GFRP 5m3 150
Settler GFRP 5,4m2 300
Drying sludge tank GFRP 20m3 450
Accumulation tank HDPE 500 l 35
Centrifugal settler Stainless steel 2,5 m3/h 650
Sludge accumulator Stainless steel 5m3 590
Sand filter GFRP 2m3 120
Dosing tank HDPE 125 l 15
Piping PVC 100 meters
Table 24 summaries the operational data for the membrane regeneration stage, normalised to the
regeneration of one membrane. Transport of the regenerated membranes is included in the system,
considering 300 km from “El Prat” desalination plant.
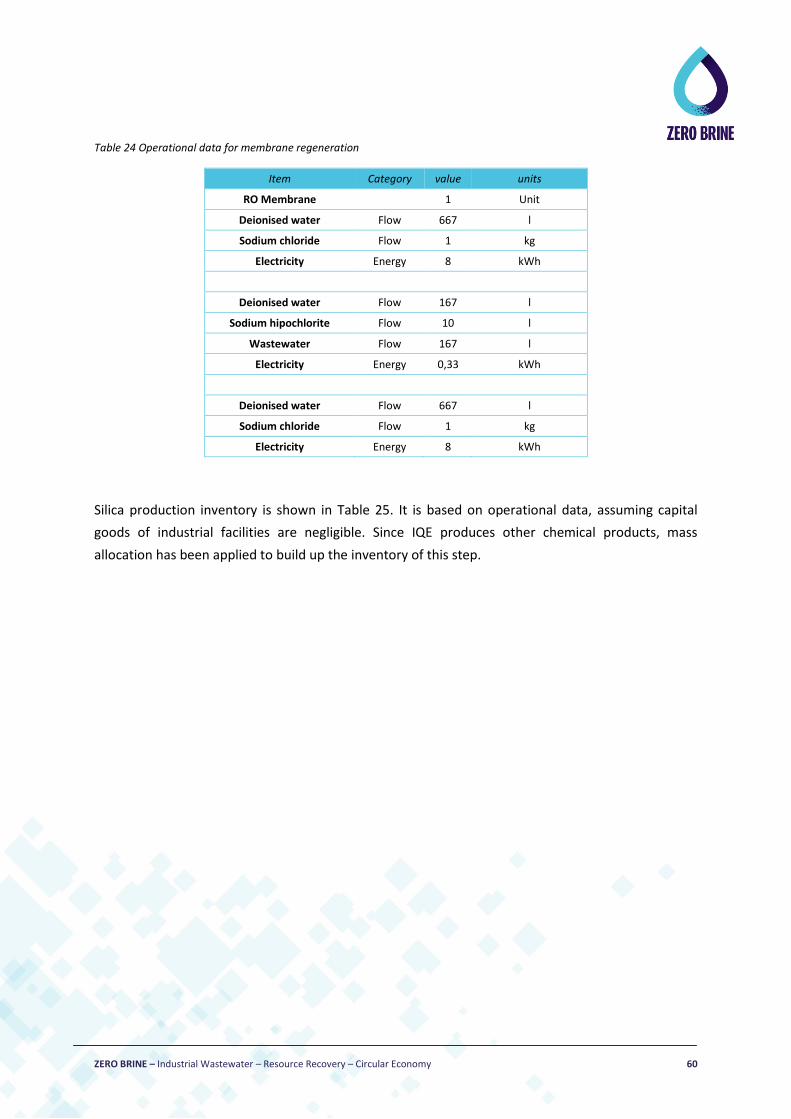
ZERO BRINE – Industrial Wastewater – Resource Recovery – Circular Economy 60
Table 24 Operational data for membrane regeneration
Item Category value units
RO Membrane
1 Unit
Deionised water Flow 667 l
Sodium chloride Flow 1 kg
Electricity Energy 8 kWh
Deionised water Flow 167 l
Sodium hipochlorite Flow 10 l
Wastewater Flow 167 l
Electricity Energy 0,33 kWh
Deionised water Flow 667 l
Sodium chloride Flow 1 kg
Electricity Energy 8 kWh
Silica production inventory is shown in Table 25. It is based on operational data, assuming capital
goods of industrial facilities are negligible. Since IQE produces other chemical products, mass
allocation has been applied to build up the inventory of this step.
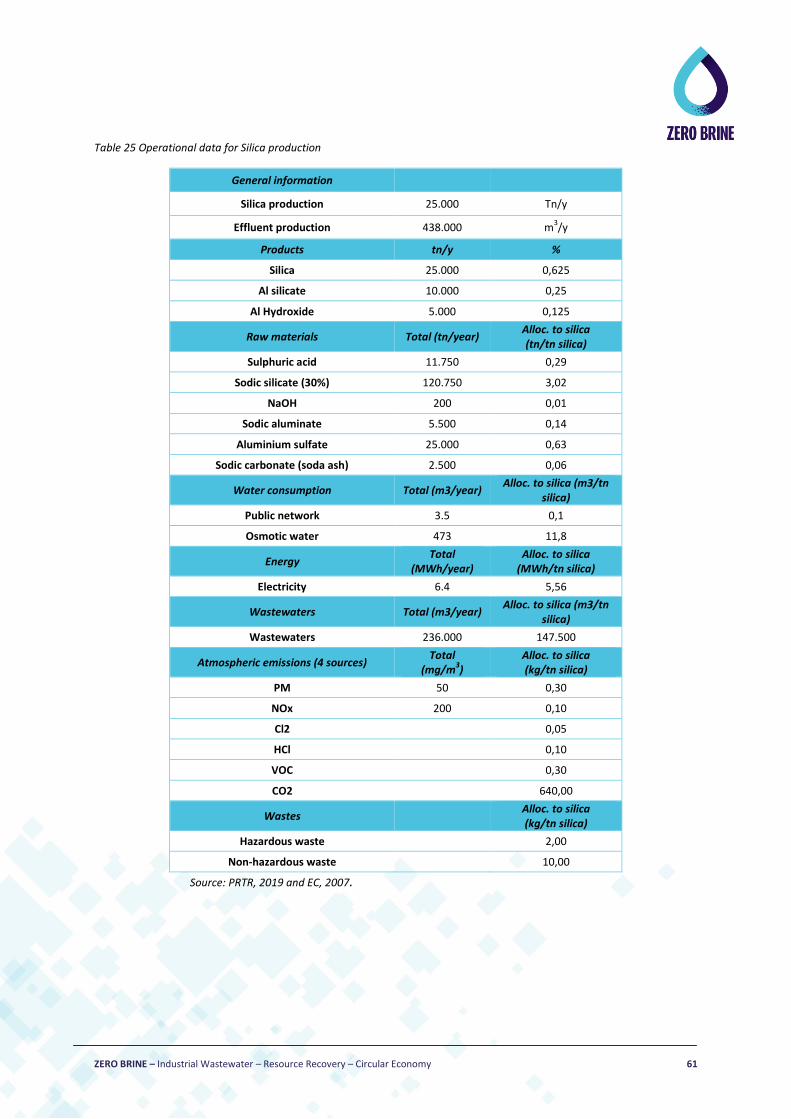
ZERO BRINE – Industrial Wastewater – Resource Recovery – Circular Economy 61
Table 25 Operational data for Silica production
General information
Silica production 25.000 Tn/y
Effluent production 438.000 m3/y
Products tn/y %
Silica 25.000 0,625
Al silicate 10.000 0,25
Al Hydroxide 5.000 0,125
Raw materials Total (tn/year) Alloc. to silica (tn/tn silica)
Sulphuric acid 11.750 0,29
Sodic silicate (30%) 120.750 3,02
NaOH 200 0,01
Sodic aluminate 5.500 0,14
Aluminium sulfate 25.000 0,63
Sodic carbonate (soda ash) 2.500 0,06
Water consumption Total (m3/year) Alloc. to silica (m3/tn
silica)
Public network 3.5 0,1
Osmotic water 473 11,8
Energy Total
(MWh/year) Alloc. to silica
(MWh/tn silica)
Electricity 6.4 5,56
Wastewaters Total (m3/year) Alloc. to silica (m3/tn
silica)
Wastewaters 236.000 147.500
Atmospheric emissions (4 sources) Total
(mg/m3)
Alloc. to silica (kg/tn silica)
PM 50 0,30
NOx 200 0,10
Cl2
0,05
HCl
0,10
VOC
0,30
CO2
640,00
Wastes
Alloc. to silica (kg/tn silica)
Hazardous waste
2,00
Non-hazardous waste
10,00
Source: PRTR, 2019 and EC, 2007.
ZERO BRINE – Industrial Wastewater – Resource Recovery – Circular Economy 62
7.4 LCIA Environmental impacts have been assessed with a set of seven impact categories, representing
different areas of environmental concern. After an overview of all indicators, selected impact
categories are discussed in more detail to reveal individual contributions of different processes and
aggregates to the total environmental impact.
The selection of these environmental categories followed the recommendation set on Waste water
collection and treatment services PCR rule: System boundaries, impact categories and general
guidelines (UN CPC 9411 & 9423). The obtained results have been obtained using SimaPro Developer
v8.5.2.0 Software and Ecoinvent database.
Different results have been obtained according to the objectives of the study:
- Environmental assessment of the ZB technology. Shown in Figure 26 and Table 26
- Assessment of regenerated membranes against conventional RO membranes. Shown in
Figure 27
- Environmental significance of ZB technology integrated into silica production scheme. Shown
in Figure 28
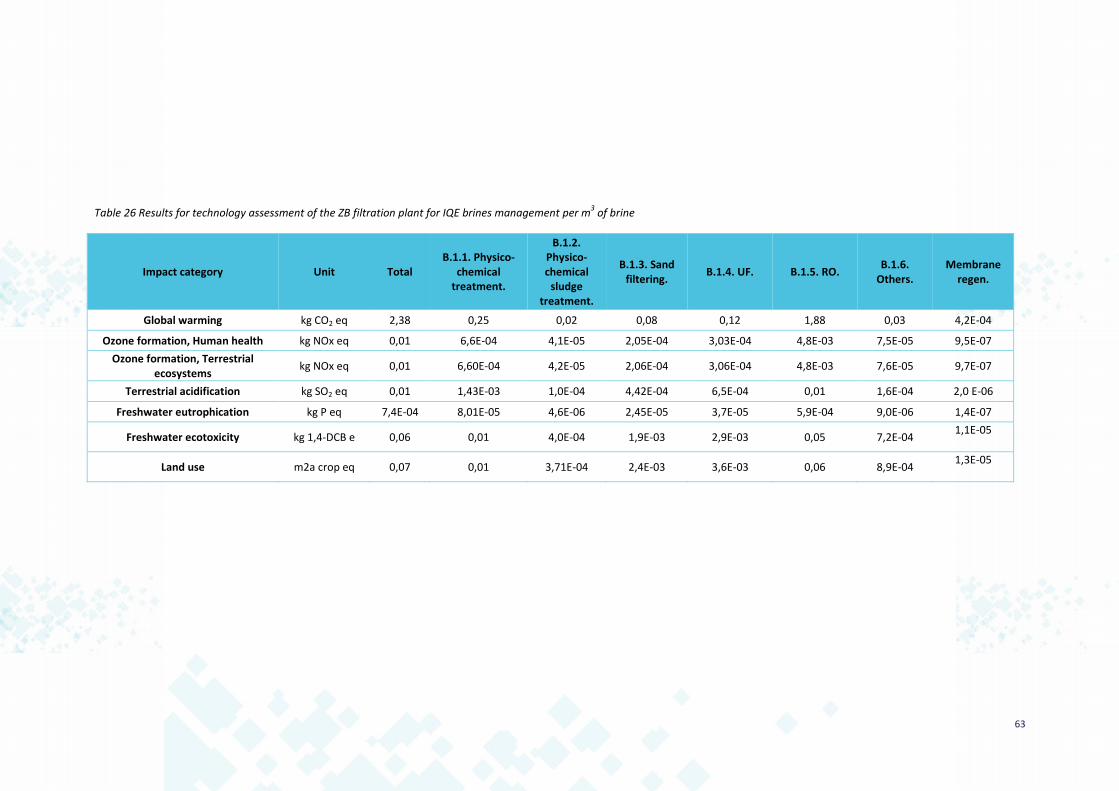
63
Table 26 Results for technology assessment of the ZB filtration plant for IQE brines management per m3 of brine
Impact category Unit Total B.1.1. Physico-
chemical treatment.
B.1.2. Physico-chemical
sludge treatment.
B.1.3. Sand filtering.
B.1.4. UF. B.1.5. RO. B.1.6.
Others. Membrane
regen.
Global warming kg CO2 eq 2,38 0,25 0,02 0,08 0,12 1,88 0,03 4,2E-04
Ozone formation, Human health kg NOx eq 0,01 6,6E-04 4,1E-05 2,05E-04 3,03E-04 4,8E-03 7,5E-05 9,5E-07
Ozone formation, Terrestrial ecosystems
kg NOx eq 0,01 6,60E-04 4,2E-05 2,06E-04 3,06E-04 4,8E-03 7,6E-05 9,7E-07
Terrestrial acidification kg SO2 eq 0,01 1,43E-03 1,0E-04 4,42E-04 6,5E-04 0,01 1,6E-04 2,0 E-06
Freshwater eutrophication kg P eq 7,4E-04 8,01E-05 4,6E-06 2,45E-05 3,7E-05 5,9E-04 9,0E-06 1,4E-07
Freshwater ecotoxicity kg 1,4-DCB e 0,06 0,01 4,0E-04 1,9E-03 2,9E-03 0,05 7,2E-04 1,1E-05
Land use m2a crop eq 0,07 0,01 3,71E-04 2,4E-03 3,6E-03 0,06 8,9E-04 1,3E-05
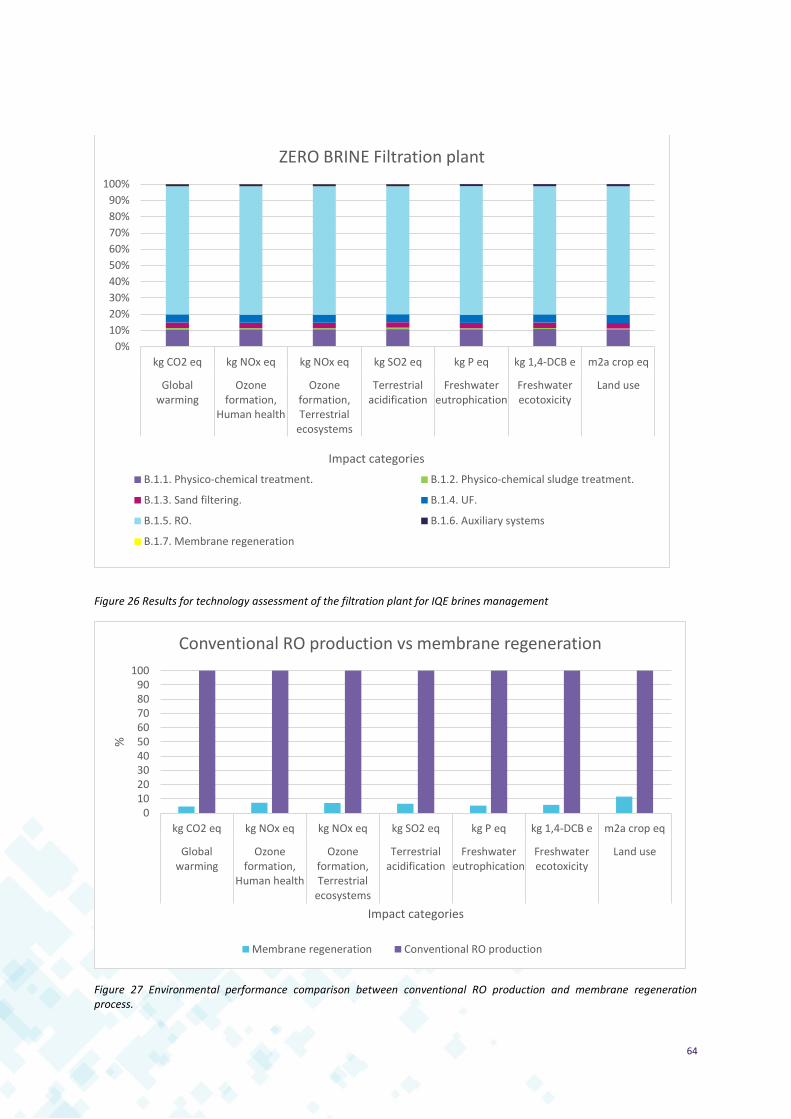
64
Figure 26 Results for technology assessment of the filtration plant for IQE brines management
Figure 27 Environmental performance comparison between conventional RO production and membrane regeneration process.
0%
10%
20%
30%
40%
50%
60%
70%
80%
90%
100%
kg CO2 eq kg NOx eq kg NOx eq kg SO2 eq kg P eq kg 1,4-DCB e m2a crop eq
Globalwarming
Ozoneformation,
Human health
Ozoneformation,Terrestrial
ecosystems
Terrestrialacidification
Freshwatereutrophication
Freshwaterecotoxicity
Land use
Impact categories
ZERO BRINE Filtration plant
B.1.1. Physico-chemical treatment. B.1.2. Physico-chemical sludge treatment.
B.1.3. Sand filtering. B.1.4. UF.
B.1.5. RO. B.1.6. Auxiliary systems
B.1.7. Membrane regeneration
0102030405060708090
100
kg CO2 eq kg NOx eq kg NOx eq kg SO2 eq kg P eq kg 1,4-DCB e m2a crop eq
Globalwarming
Ozoneformation,
Human health
Ozoneformation,Terrestrial
ecosystems
Terrestrialacidification
Freshwatereutrophication
Freshwaterecotoxicity
Land use
%
Impact categories
Conventional RO production vs membrane regeneration
Membrane regeneration Conventional RO production

ZERO BRINE – Industrial Wastewater – Resource Recovery – Circular Economy 65
Figure 28 Contribution of ZB technology to overall system, considering silica production
7.5 LCC This chapter aims to determine the techno-economic feasibility of ZB technology. For that, the Life
Cycle Costing (LCC) assessment methodology has been applied. The system has been developed
according to the recommendations of SETAC (Swarr et al. 2011b) and ISO 15663-1, 15663-2 and
15663-3. To ensure consistency of the results, the LCA standards ISO 14040 and 14044 have also
been followed. Consequently, a consistent and common approach is followed across the LCA and LCC
analysis. The same functional unit is therefore used in both studies: “the treatment of 1 m3 of
effluent from silica production at IQE facilities, and the implementation of circular economy
principles derived from its management”. This procedure is applied also to the allocation procedures.
System boundaries in LCC are based on the scheme proposed in Figure 25. The considered phases are
the same than those considered in the LCA study. The current system boundaries cover both capital
goods and operation of membrane plant of the project. Furthermore, operation stage from
membrane regeneration is also implemented. Hence, the other stages of the system will be
implemented during next steps of the project. For the LCC study, the same lifespan of 25 years is
considered.
The foreseen scenarios for the definitive LCC study match those proposed in section 7.2.4. At this
point, the present study is based on the current technology development level. Hence, the report
establishes a single scenario in which the technology is assessed.
0%
10%
20%
30%
40%
50%
60%
70%
80%
90%
100%
kg CO2 eq kg NOx eq kg NOx eq kg SO2 eq kg P eq kg 1,4-DCB e m2a crop eq
Globalwarming
Ozoneformation,
Human health
Ozoneformation,Terrestrial
ecosystems
Terrestrialacidification
Freshwatereutrophication
Freshwaterecotoxicity
Land use
Co
ntr
ibu
tio
n (
%)
Impact categories
ZB contribution to Silica production
ZB technology Silica production IQE
ZERO BRINE – Industrial Wastewater – Resource Recovery – Circular Economy 66
The implemented data in this study entails monetarisation of the LCA inventory (for further details of
the LCI, see section 7.3). Data regarding capital goods (plant cost) and device replacement (spare
parts) has been provided by TYPSA. Therefore, it is primary data. Costs from chemical reagents, staff
and electricity are secondary data. Regarding staff cost and work time, different assumptions has
been taken based on technician’s expertise.
The inventory is divided into different categories. The main division entails CAPEX and OPEX. The first
category includes costs from initial investments: infrastructures (capital goods), research activities
(technology development) and other expenses. OPEX category considers operational costs: staff,
consumables (chemical reagents), energy, spare parts, and revenues from products.
At this point, the inventory is under development because of the early stage of the project. Table 27
shows a detailed inventory of the status of the system. Monetary units are kept from the
bibliographic sources.
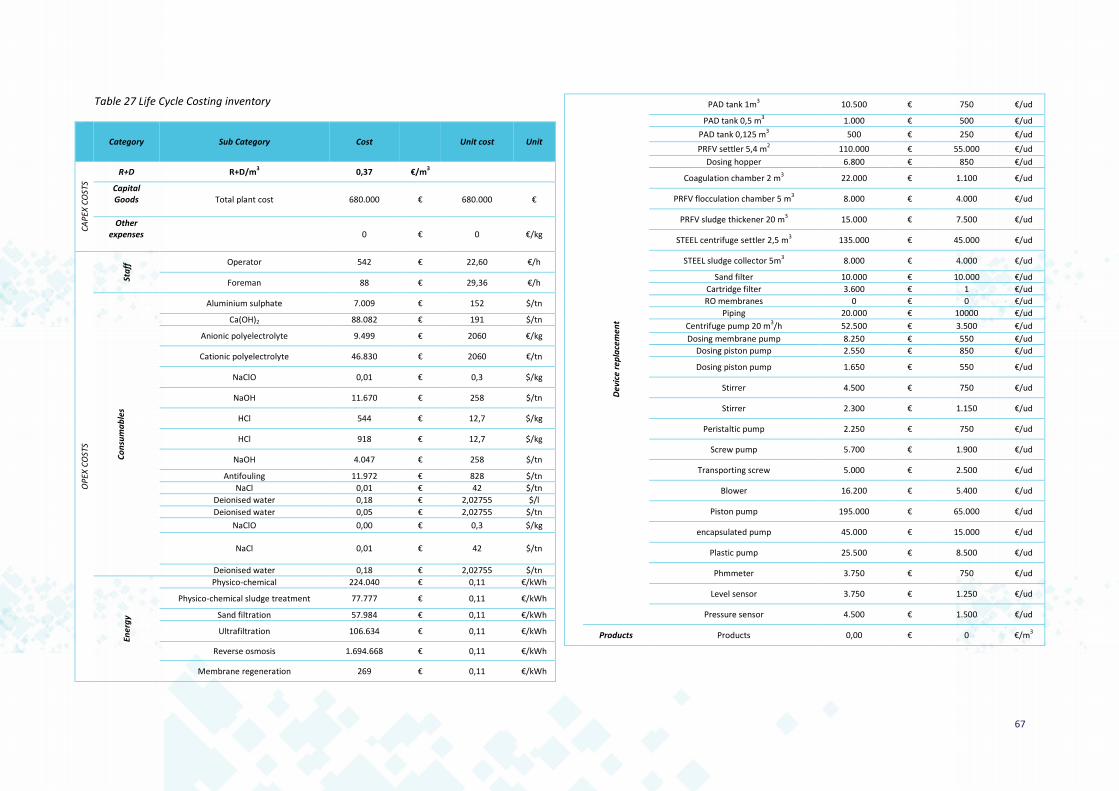
67
Table 27 Life Cycle Costing inventory Category Sub Category Cost
Unit cost Unit
CA
PEX
CO
STS
R+D R+D/m3 0,37 €/m
3
Capital Goods
Total plant cost 680.000 € 680.000 €
Other expenses
0 € 0 €/kg
OP
EX C
OST
S
Sta
ff Operator 542 € 22,60 €/h
Foreman 88 € 29,36 €/h
Co
nsu
ma
ble
s
Aluminium sulphate 7.009 € 152 $/tn
Ca(OH)2 88.082 € 191 $/tn
Anionic polyelectrolyte 9.499 € 2060 €/kg
Cationic polyelectrolyte 46.830 € 2060 €/tn
NaClO 0,01 € 0,3 $/kg
NaOH 11.670 € 258 $/tn
HCl 544 € 12,7 $/kg
HCl 918 € 12,7 $/kg
NaOH 4.047 € 258 $/tn
Antifouling 11.972 € 828 $/tn
NaCl 0,01 € 42 $/tn
Deionised water 0,18 € 2,02755 $/l
Deionised water 0,05 € 2,02755 $/tn
NaClO 0,00 € 0,3 $/kg
NaCl 0,01 € 42 $/tn
Deionised water 0,18 € 2,02755 $/tn
Ener
gy
Physico-chemical 224.040 € 0,11 €/kWh
Physico-chemical sludge treatment 77.777 € 0,11 €/kWh
Sand filtration 57.984 € 0,11 €/kWh
Ultrafiltration 106.634 € 0,11 €/kWh
Reverse osmosis 1.694.668 € 0,11 €/kWh
Membrane regeneration 269 € 0,11 €/kWh
Dev
ice
rep
lace
men
t
PAD tank 1m3 10.500 € 750 €/ud
PAD tank 0,5 m3 1.000 € 500 €/ud
PAD tank 0,125 m3 500 € 250 €/ud
PRFV settler 5,4 m2 110.000 € 55.000 €/ud
Dosing hopper 6.800 € 850 €/ud
Coagulation chamber 2 m3 22.000 € 1.100 €/ud
PRFV flocculation chamber 5 m3 8.000 € 4.000 €/ud
PRFV sludge thickener 20 m3 15.000 € 7.500 €/ud
STEEL centrifuge settler 2,5 m3 135.000 € 45.000 €/ud
STEEL sludge collector 5m3 8.000 € 4.000 €/ud
Sand filter 10.000 € 10.000 €/ud
Cartridge filter 3.600 € 1 €/ud
RO membranes 0 € 0 €/ud
Piping 20.000 € 10000 €/ud
Centrifuge pump 20 m3/h 52.500 € 3.500 €/ud
Dosing membrane pump 8.250 € 550 €/ud
Dosing piston pump 2.550 € 850 €/ud
Dosing piston pump 1.650 € 550 €/ud
Stirrer 4.500 € 750 €/ud
Stirrer 2.300 € 1.150 €/ud
Peristaltic pump 2.250 € 750 €/ud
Screw pump 5.700 € 1.900 €/ud
Transporting screw 5.000 € 2.500 €/ud
Blower 16.200 € 5.400 €/ud
Piston pump 195.000 € 65.000 €/ud
encapsulated pump 45.000 € 15.000 €/ud
Plastic pump 25.500 € 8.500 €/ud
Phmmeter 3.750 € 750 €/ud
Level sensor 3.750 € 1.250 €/ud
Pressure sensor 4.500 € 1.500 €/ud
Products Products 0,00 € 0 €/m3

68
Table 28 breakdowns the overall cost and contributions to costs. The results are divided into Overall
costs (€) and Contribution to costs (%). “Total costs” depicts all costs during the whole lifespan of the
project. “Cost/m3” shows the cost per treated cubic meter by ZB technology. “% by category”
determines the contribution of each category to CAPEX or OPEX, depending on which one belongs.
“% of total” shows the contribution of each item to total costs. Figure 29 and Figure 30 represent he
graphical depict of the obtained results.
Table 28 Life Cycle Costing results
OVERALL COSTS CONTRIBUTION TO COSTS
Total cost Cost/m
3 % by
category % of total
CAPEX
Technology development 1.491.000 0,37 0,69 0,14
Capital goods 680.000 0,17 0,31 0,06
Overheads 0,00 0,00 0,00 0,00
2.171.000 0,53 1,00 0,20
OPEX
Staff 5.359.080 1,31 0,63 0,51
Consumables 180.600 0,04 0,02 0,02
Energy 2.161.400 0,53 0,26 0,20
Devices replacement 728.800 0,18 0,09 0,07
Products 0,00 0,00 0,00 0,00
8.429.800 2,07 1,00 0,80
TOTAL 10.600.800 2,60
Figure 29 Costs distribution between CAPEX and OPEX
CAPEX vs OPEX
CAPEX OPEX
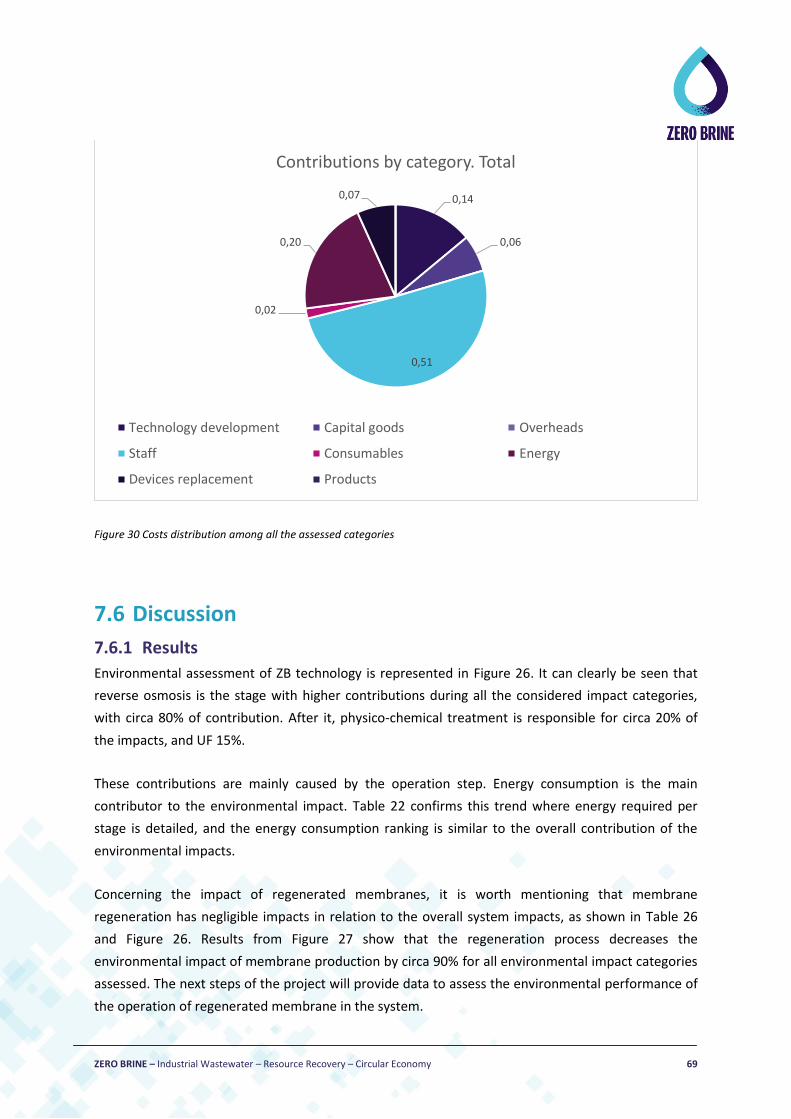
ZERO BRINE – Industrial Wastewater – Resource Recovery – Circular Economy 69
Figure 30 Costs distribution among all the assessed categories
7.6 Discussion
7.6.1 Results
Environmental assessment of ZB technology is represented in Figure 26. It can clearly be seen that
reverse osmosis is the stage with higher contributions during all the considered impact categories,
with circa 80% of contribution. After it, physico-chemical treatment is responsible for circa 20% of
the impacts, and UF 15%.
These contributions are mainly caused by the operation step. Energy consumption is the main
contributor to the environmental impact. Table 22 confirms this trend where energy required per
stage is detailed, and the energy consumption ranking is similar to the overall contribution of the
environmental impacts.
Concerning the impact of regenerated membranes, it is worth mentioning that membrane
regeneration has negligible impacts in relation to the overall system impacts, as shown in Table 26
and Figure 26. Results from Figure 27 show that the regeneration process decreases the
environmental impact of membrane production by circa 90% for all environmental impact categories
assessed. The next steps of the project will provide data to assess the environmental performance of
the operation of regenerated membrane in the system.
0,14
0,06
0,51
0,02
0,20
0,07
Contributions by category. Total
Technology development Capital goods Overheads
Staff Consumables Energy
Devices replacement Products
ZERO BRINE – Industrial Wastewater – Resource Recovery – Circular Economy 70
Finally, when considering ZB impact in the whole production system, Figure 28 includes silica
production before IQE’s brine treatment. Results show that less than 1% of the impacts are related to
ZB plant. The rest of the impacts are allocated to Silica production. Hence, it suggests that the ZB
system will have a negligible impact when implemented in the whole system. In addition, the current
wastewater treatment has not yet been included for a comparison. It is worth mentioning that the
inclusion of recovered products in the next assessment stage should further decrease the overall
contribution of ZB technology.
The LCC showed that the main costs are derived from the OPEX (80%) and 20% from CAPEX (Table
28). Regarding the CAPEX stage, the highest contribution comes from technology development stage
(R+D costs associated to the project) (70% of the CAPEX, 14% of the total costs). Capital goods
normally tend to have a discrete contribution in both environmental and economic assessments. In
this case, this category causes 30% of the CAPEX costs, which means 6% of the total costs.
As previously stated, OPEX accounts for 80% of the costs of the plant. The main category is “staff”,
which accounts for over 60% of the OPEX, and more than 50% of the total cost. Energy is the second
highest contribution to the costs of the system, with 20% of the plant costs. Consumables and device
replacement have residual contribution to OPEX, and consequently to total costs.
7.6.2 Design recommendations
Different aspects of the ZB scheme will be implemented and improved during the project. The scaling
up of different stages that are currently under development will help to give inputs to LCA and LCC.
It has been shown that energy consumption is one of the main contributions to environmental
impacts. Consequently, a more efficient operation is the major way for improving environmental
performance of the system. To counterbalance that effect, steps such as heat recovery will help to
improve the environmental profile. Furthermore, the implementation of regenerated membranes
operation is expected decrease the energy consumption of the plant, due to their technical
characteristics.
Crystallization, EFC and heat recovery will be the most important process steps relevant to the
environmental and economic viability of the ZB system. The inclusion of further test data into the
LCA will allow the identification of the main hotspots of the complete system. These findings will
enable further environmental based recommendations that will be communicated to the ZB design
team to improve system performance.
ZERO BRINE – Industrial Wastewater – Resource Recovery – Circular Economy 71
7.6.3 Further work
Further work regarding the LCA and LCC of the ZB project includes:
- Inclusion of steps which are currently under technical development. Coupled to that, its
subsequent inputs, outputs and products will be included. Implementation of EFC,
crystallization and heat recovery will allow also to find out the environmental benefits of the
recovered products.
- Implementation of regenerated membrane operation. Technical information from tests will
provide operational data mainly on the electricity consumption.
- Inclusion of conventional wastewater treatment plant for comparative analysis. When this
WWTP is included in the system of analysis, a comparative assessment will be developed.
This aspect also includes the impacts on local water bodies through the implementation of
water treatment performance.
- Data refinement of the implemented systems. Technical development of the already
included steps will lead to a high-quality inventory. Hence, more solid results will be obtained.
- In terms of LCC, the inclusion of revenues from by-products will help to develop a stronger
system. In this sense, refining data will also help to improve the system. Especially data
referred to staff, which is the main contribution to economic impact.
7.6.4 Conclusions
Different conclusions can be extracted from this preliminary ZB LCA:
- ZB technology has a negligible impact when implemented in the silica production scheme.
- Membrane regeneration is a successful circular economy strategy, due to it allows
dramatically reducing environmental impacts of membranes.
- Energy consumption is the main contribution to ZB environmental impacts. For improving its
environmental performance, this aspect should be tackled. Useful strategies for that are
increasing efficiency of the system and/or utilisation of low carbon/renewable energy
sources.

ZERO BRINE – Industrial Wastewater – Resource Recovery – Circular Economy 72
8. Discussion and conclusion
8.1 Discussion This section provides a summary of the LCA and LCC’s for the case studies based on the preliminary
analysis. It should be noted that these are primarily based on experimental data at the bench scale
and are therefore currently assessing sub-optimal systems. It is expected that the full scale ZB
systems will operate with greater efficiency and lower overall environmental impact.
Demineralised Water Plant in the Netherlands
For the DWP the current analysis suggests that the ZB system has a greater environmental impact
than the current system for the impact categories covered. In particular, the GHG emissions of the ZB
system are double those of the current plant with 262 and 130 kgCO2eq per 1m3 of generated brine,
respectively. Abiotic depletion is also double in the ZB system.
The increase in environmental impacts is mainly due to the use of chemicals sulphuric acid and
sodium hydroxide used in the TOC removal process. These impacts were not compensated by the
recovery of the salt, calcium hydroxide and magnesium. In addition, if waste heat is not utilised in the
evaporation phase, there will be a slight decrease in the environmental performance…
This suggest several potential considerations in the next phase of the design and implementation
process. Reducing the use of the chemicals in the TOC removal or utilising lower impact chemicals
should therefore be considered.
The LCC illustrated that the recovery of the products from the brine will produce a strong positive
economic outcome if a market is identified and a high product quality is attained.
Coal Mine Effluent in Poland
The comparison of four different configurations showed that the best environmental performance is
obtained from two of the configurations: 1) Two stage NF, with electrodialysis diluate recycled to NF;
and 2) Single-stage NF, with ED diluate recycled to NF.
Most of the environmental impact of the system configurations resulted from the system energy
consumption and the use of dolime in the magnesium recovery process. However, the recovery of
magnesium hydroxide and sodium chloride would counteract a large proportion of the impact for
five of the impact categories (human toxicity, freshwater toxicity and resource depletion, the latter
of which results in an overall positive environmental impact).
ZERO BRINE – Industrial Wastewater – Resource Recovery – Circular Economy 73
The LCC considered only the operating costs but suggests a large positive economic outcome for each
of the system configurations. In fact, the recovered products could generate between 500-1000
Euros per m3 (based only on market price and not a packaged and distributed product) if markets
were found for the products and high quality was attained.
The main design recommendations relate to the energy consumption from electricity. Due to the
energy mix in Poland, which is largely produced from coal the electricity has a high carbon intensity.
Therefore, to lower GHG emissions, consideration should be given to the installation or switching to
renewable sources. Since the use of dolime in the magnesium recovery process is another cause of
environmental impact (for toxicity impact categories), the optimisation of this process (and reduction
of the quantity of dolime used) should reduce these impacts.
For the present analysis energy consumption was only available for the whole system and not for the
individual processes. When more disaggregated data becomes available this will allow identification
of the main energy intensive processes and possible process improvements.
Turkey Textile Plant
For the Turkey textile case study, the main impacts were shown to derive from the RO and its energy
use. The recovery of materials has large benefits, particularly brine, which has potential to be used in
the dyeing process. Transport of recovered materials was currently not included in the assessment
however.
Therefore, the main design recommendation at this stage is to focus on reducing the energy
consumption of the RO process and investigating options for using renewable energy.
The LCC showed positive results from the recovery of deionised water with a potential value of €450
per m3 of treated wastewater. This relies on the assumption that a market can be identified and at
this stage piping costs are not included. In addition, the generated brine solution can be reused in the
dyeing process, but the value has not yet been calculated.
Spain Silica Plant
In the Spanish case study, the RO stage was the cause of the main environmental impact (80%) of the
treatment system for all considered impact categories. Next is the physico-chemical treatment with
20% and UF with 15% of impacts. These are primarily caused during the operation, as opposed to the
raw material or production stage. This is closely related to the energy consumption.
ZERO BRINE – Industrial Wastewater – Resource Recovery – Circular Economy 74
The production and use of regenerated membranes clearly has lower environmental impacts than
using new RO membranes. When including the silica production into the system boundaries, the
results suggest that the ZB system would contribute only 1% to the overall impact.
The LCC included both CAPEX and OPEX, with operating costs representing 80% of the costs. The R&D
costs associated with the project contributed 70% of the CAPEX. The cost of staff is the main
operating expenditure representing 60%, with energy being responsible for 20%.
As energy use is the main concern, design improvements include consideration of potential heat
recovery for the crystallisation step and the use of renewable energy sources.
8.2 Conclusion and next steps The initial LCA and LCC results have been mainly positive for the ZB system. In addition, since the
assessments are currently made using bench scale data, the full-scale plant would be expected to
have lower environmental impacts.
The Netherlands DWP case study suggests that the ZB system has higher environmental impacts, but
this has to be considered cautiously as the impact of the current discharge of brine into the sea. This
impact will be integrated into the next stages of assessments.
The Turkey textile and Spanish silica case studies both identified the RO process as the main concern,
due to its energy consumption. However, we expect the energy consumption of the full-scale plant to
be significantly less. Nonetheless, this should be considered in the on-going design of the pilot and
eventual full-scale plants. The environmental performance would benefit from a closer examination
of the energy supply, and consideration of the potential to utilise renewable energy sources such as
wind and solar. This should also be a consideration to include in the subsequent LCC analysis of ZB
WP7. Hence the next phase of LCC should assess the economic implications of installing renewable
energy sources for the operation.
In the next stage the major improvements in the analysis include:
A better comparison to the reference systems
Improved representation and robustness of analysis through a combination of increased data
points from the pilot plants and subsequent use of this data to model the full-scale plants.
Standardised way to handle data uncertainties.
ZERO BRINE – Industrial Wastewater – Resource Recovery – Circular Economy 75
8.2.1 Next steps
The primary goal during the next phase of the LCA and LCC work is to bolster the analysis with
improved operational datasets that will be supplied through the operation of the pilot plants. Where
possible, the pilot plant operational data will be input into modelling software to model the
performance of a full-scale plant. The modelled parameters from this will then be used in the final
LCA and LCC analysis to provide a robust and representative assessment.
The Unified Approach will be fully developed and implemented across the case study analysis.
Importantly, this will include a standard way to handle lack of data. We intend to communicate this
challenge and necessity to the relevant stakeholders so that they have sufficient time to supply the
data and confirmed deadlines to do so. Where data cannot be obtained a standard way to model and
obtain proxy data, e.g. from literature will be applied. In addition, a full sensitivity analysis will be
performed for each case study to account for any data uncertainties.
The aim of the final LCA and LCC’s is also to provide a comparison of the ZB systems with the
existing/reference systems. A cross comparison can then also be made between the different case
studies which will allow further insight to why some systems may or may not be performing in
certain areas.
The LCA and LCC will be combined with a Social LCA to provide a full sustainability assessment.
Furthermore, the LCC will include a consideration of the environmental externalities that will add a
further dimension.
ZERO BRINE – Industrial Wastewater – Resource Recovery – Circular Economy 76
9. References
Bourguignon, D., 2016. Circular economy package. Four legislative proposals on waste (No. PE 573 .
936). EPRS | European Parliamentary Research Service.
Brinkmann, T.B., Santoja, G.G., Schorcht, F., Roudier, R., Sancho, L.D., 2014. Best Available
Techniques (BAT) Reference Document for the Production of Chlor-alkali. Industrial Emissions
Directive 2010/75/EU (Integrated Pollution Prevention and Control) [WWW Document]. EU Science
Hub - European Commission. URL https://ec.europa.eu/jrc/en/publication/eur-scientific-and-
technical-research-reports/best-available-techniques-bat-reference-document-production-chlor-
alkali-industrial (accessed 2.11.19).
Consultants, P., n.d. SimaPro Life Cycle Analysis version 7.2 (software).
European Commission, 2007. Reference Document on Best Available Techniques for the manufacture
of Large Volume Inorganics Chemicals – Solids and others industry. Integrated Pollution Prevention
and Control. European Commission, August 2007.
E.N. “ISO 14040” Environmental Management – Life Cycle Assessment – Principles and Framework.
International Organisation for standardization, Brussels, 2006.
E.N. “ISO 14044” Environmental Management – Life Cycle Assessment – Principles, framework and
guidelines. International Organisation for standardization, Brussels, 2006.
Environmental Life Cycle Costing: A code of practice. Thomas E. Swarr, David Hunkeler, Walter
Klöpffer, Hann-Leena Pesonen, Andreas Ciroth, Alan C. and Robert Pagan. Published by the Society of
Environmental Toxicology and Chemistry, 2011.
European Commission, 2014. REPORT ON CRITICAL RAW MATERIALS FOR THE EU. Report of the Ad
hoc Working Group on defining critical raw materials (No. Ref. Ares(2015)1819503). Ref.
Ares(2015)1819503.
EU (2013): Commission recommendation of 9 April 2013 on the use of common methods to measure
and communicate the life cycle environmental performance of products and organisations. Official J
Eur Union. L 124 (2013/179/EU)
EURACOAL (2017). Annual Report. Available at (accessed on 20/3/2019) :
http://euracoal.eu/library/annual-reports/.

ZERO BRINE – Industrial Wastewater – Resource Recovery – Circular Economy 77
EUROSTAT (2018). Electricity price statistics. Available: ec.europa.eu/eurostat/statistics-
explained/index.php/Electricity_price_statistics. Accessed on : 3/4/2019
Evides Waterbedrijf, 2017. Evides Waterbedrijf – Annual report 2017 – Summary.
Gluch P and Baumann H, 2004. The life cycle costing (LCC) approach: a conceptual discussion of its
usefulness for environmental decision-making, Building and Environment, Volume 39, Issue 5, 2004,
Pages 571-580, https://doi.org/10.1016/j.buildenv.2003.10.008
Gzyl, G., Janson, E., & Łabaj, P. (2017). Mine Water Discharges in Upper Silesian Coal Basin (Poland).
In Assessment, Restoration and Reclamation of Mining Influenced Soils (pp. 463-486). Academic
Press.
ISO 15663-1. Petroleum and natural gas industries – Life Cycle Costing - Part 1: Methodology. 2007.
ISO 15663-2. Petroleum and natural gas industries – Life Cycle Costing - Part 2: Guidance on
application of methodology and calculation methods. 2007.
ISO 15663-3. Petroleum and natural gas industries – Life Cycle Costing - Part 3: Implementation
guidelines. 2007.
Larsen, H. F. (2018). LCA of wastewater treatment. In Life Cycle Assessment (pp. 861-886). Springer,
Cham.
IISD, no date. Life Cycle Costing A Question of Value. A white paper from IISD.
http://ec.europa.eu/environment/gpp/pdf/WP-LifeCycleCosting.qx.pdf
PEF, 2012. Product Environmental Footprint (PEF) Guide. http://ec.europa.eu/environment/
eussd/pdf/footprint/PEF%20methodology%20final%20draft.pdf
PGG (2019). Polska Grupa Górnicza. Website : www.pgg.pl/en, Accessed on 28/3/2019.
PRTR (Resgistro Nacional de Emisiones Contaminantes), Industrias Químicas del Ebro, S.A.
(http://www.prtr-es.es/Informes/fichacomplejo.aspx?Id_Complejo=2492). Enquired on March 2019.
Rebitzer G, Ekvall T. Frischknecht R, Hunkeler D, Norris G, Rydberg, Schmidt WP, Suh S, Weidema B.P,
and Pennington DW. Life cycle assessment: Part 1: Framework, goal and scope definition, inventory
analysis, and applications. Environment International, Volume 30, Issue 5, 2004. Pages 701-720,
https://doi.org/10.1016/j.envint.2003.11.005.

ZERO BRINE – Industrial Wastewater – Resource Recovery – Circular Economy 78
Roskill, 2018. Salt - Market Report.
Sediyi, V.M., 2006. Environmental balance of salt production speaks in favour of solar saltworks.
Presented at the 1st International Conference on Ecological Importance of Solar Saltworks, Santorini,
p. 9.
SETAC, n.d. Environmental Life Cycle Costing: A Code of Practice.
Swarr TE, Hunkeler D, Klöpffer, W. et al. 2011. Environmental life cycle costing: a code of practice. Int
J Life Cycle Assess (2011) 16: 389. https://doi.org/10.1007/s11367-011-0287-5
Swarr, T., Hunkeler, D., Klöpffer, W., Pesonen, H.-L., Ciroth, A., Brent, A. C., Pagan, R. (2011b),
Environmental Life Cycle Costing: A code of practice. Published by the Society of Environmental
Toxicology and Chemistry, 2011. ISBN 978-1- 880611-87-6. SETAC press
Xevgenos D, Bakogianni D, Haralambous KJ and Loizidou M, 2018. Chapter 8, Integrated Brine
Management: A Circular Economy Approach. In: A Cyber-Physical Systems Approach. Eds. Tsakalides
P, Panousopoulou A, Tsagkatakis G, and Montestruque L. Ebook publisjed by Taylor and Francis
Group. https://doi.org/10.1201/b21948
US EPA, 2014. National Pollutant Discharge Elimination System (NPDES) [WWW Document]. US EPA.
URL https://www.epa.gov/npdes (accessed 11.25.18).
Warren, J.K., 2016. Evaporites: A Geological Compendium, 2nd ed. Springer International Publishing.
Wernet, G., Bauer, C., Steubing, B., Reinhard, J., Moreno-Ruiz, E., Weidema, B., 2016. The ecoinvent
database version 3 (part I): overview and methodology. Int J Life Cycle Assess 21, 1218–1230.
https://doi.org/10.1007/s11367-016-1087-8
Wolf, M.-A., Chomkhamsri, K., Brandao, M., Pant, R., Ardente, F., Pennington, D., Manfredi, S., de
Camillis, C., Goralczyk, M., 2010. ILCD Handbook - General Guide for Life Cycle Assessment - Detailed
Guidance (No. 978-92-79-19092–6).
WORL ENERGY COUNCIL (2018). Turkish National Comitee. Electricity And Gas Prices Based On
Purchasing Power Parity. Available : www.worldenergy.org.tr/electricity-and-gas-prices-based-on-
purchasing-power-parity/. Accessed on : 2/4/2019
ZERO BRINE – Industrial Wastewater – Resource Recovery – Circular Economy 79
10. Appendix 1: Demineralised Water Plant, The
Netherlands
Table 29 and Table 30 present the expected quantities of consumables needed per hour of operation
in the pilot plant, the price and source of the price that was used for the LCC modelling.

80
Table 29. Consumption and price data of chemicals in the ZB system for the DWP Netherlands plant
Technology provider
Chemical product
Quantity within pilot (kg/h)a
Price (€/kg)
Source
Site 01
Lenntech Antiscalant (Vitec 3000)
0.5 136 https://www.sigmaaldrich.com/catalog/product/sial/398101?lang=en®ion=NL
UNIPA NaOH 6.6 0.16 Brinkmann et al., 2014
UNIPA HCL 30-32% w/w
0.8 37.8 https://www.sigmaaldrich.com/catalog/search?term=HCl&interface=All&N=0&mode=partialmax&lang=en®ion=NL&focus=product
Site 02
Lenntech Antiscalant (Vitec 4000)
0.62 136 https://www.sigmaaldrich.com/catalog/product/sial/398101?lang=en®ion=NL
ARVIA 35% H2SO4 36.1 0.5 https://www.alibaba.com/product-detail/Sulfamic-acid-is-produced-industrially-by_60263809067.html?spm=a2700.7724838.2017115.26.162669e026I5ce
ARVIA 25% NaOH 24.37 0.16 Brinkmann et al., 2014
TU Delft HCL 30-32% w/w
0.5 37.8 https://www.sigmaaldrich.com/catalog/search?term=HCl&interface=All&N=0&mode=partialmax&lang=en®ion=NL&focus=product
a it was assumed that the pilot system will operate for 8 hours per day
Table 30. Prices for recovered products in the ZB system for the DWP Netherlands plant
Recovered product
Magnesium Oxide >97% 924 https://www.sigmaaldrich.com/catalog/search?term=Magnesium+Oxide&interface= All&N=0&mode=match%20partialmax&lang=en®ion=NL&focus=product
Soda ash 73.3 https://www.sigmaaldrich.com/catalog/search?term=soda+sh &interface=All&N=0&mode=match%20partialmax&lang=en®ion=NL&focus=product
Calcium hydroxide 86.9 https://www.sigmaaldrich.com/catalog/product/sigald/239232?lang=en®ion=NL

81
11. Appendix 2: Polish Coal Mine
Table 31: Coal mine LCI, functional unit: 1m3 of wastewater
Unit Conf. 1 Conf.2 Conf. 3 Conf. 4
Energy consumption
dolime production kWh 1.1 0.8 2.2 0.4
Processes stages kWh 6.4 8.2 8.9 11.4
Auxiliary materials
material stage
Dolomite Magnesium recovery kg 21.6 16.9 44.1 9.2
Sodium Tripolyphosphate NF
kg 0.0008 0.0004 0.0008 0.0004
EDTA kg 0.01 0.005 0.01 0.005
Sodium Hydroxide
RO
kg 0.00058 0.00058 0.00058 0.00058
Hydrochloric acid kg 0.00006 0.00006 0.00006 0.00006
EDTA kg 0.006 0.006 0.006 0.006
Wastewater emissions
Wastewater (Mr) m3 0.4 0.3 0.3 0.1
Wastewater (Cr) m3 0.0004 0.005 0.002 0.01
Recover Products
Deionised water m3 0.6 0.7 0.7 0.9
Sodium Chloride (NaCl) kg 3.4 6.525 5.125 9.4
Gypsum kg <0.03 0.03 1.03 0.8
Magnesium Hydroxide (Mg(OH)2 ) kg 1.4 1.1 2.8 0.6
Table 32: Wastewater (Mr) composition of different configurations
Ions conc. (g/m3) Conf. 1 Conf. 2 Conf. 3 Conf.4
Cl- 23370 19900 15470 16600
SO42- 1912 2736 1370 3990
Mg2+ 0 0 0 0
Ca2+ 1897 2102 5404 1850
Ca2+ 23370 19900 15470 16600
Table 33: Wastewater (Cr) composition of different configurations
Ions conc. (g/m3) Conf. 1 Conf. 2 Conf. 3 Conf.4
Cl- 200000 200000 200000 200000
SO42- 376 455 291 1608
Mg2+ 7545 11700 4477 12890
Ca2+ 22210 17390 27700 15490
Ca2+ 200000 200000 200000 200000

ZERO BRINE – Industrial Wastewater – Resource Recovery – Circular Economy 82