zero waste and economic recovery
TRANSCRIPT

The Job Creation Potential of Zero Waste Solutions | 1
ZERO WASTE AND ECONOMIC RECOVERYTHE JOB CREATION POTENTIAL OF ZERO WASTE SOLUTIONS

2 | Zero Waste and Economic Recovery The Job Creation Potential of Zero Waste Solutions | 3
Executive SummaryEmployment opportunities are important in any economy, and especially in times of economic downturn. As governments and the private sector invest in economic recovery strategies, particularly “green” or climate-neutral approaches, it is important to evaluate their employment potential. C40 estimates that the waste management sector has the potential to create 2.9 million jobs in its 97 member cities alone. Zero waste—a comprehensive approach to waste management that prioritizes waste prevention, re-use, composting, and recycling—is a widely-adopted strategy proven to minimize environmental impacts and contribute to a just society. In this study, we evaluate its job generation potential.
The data for this study came from a wide range of sources spanning 16 countries. Despite the diversity in geographic and economic conditions, the results are clear: zero waste approaches create orders of magnitude more jobs than disposal-based systems that primarily burn or bury waste. Indeed, waste interventions can be ranked according to their job generation potential, and this ranking exactly matches the traditional waste hierarchy based on environmental impacts (Figure 1). These results demonstrate the compatibility of environmental and economic goals and position zero waste as an opportune social infrastructure in which investments can strengthen local and global economic resilience.
This study also finds evidence for good job quality in zero waste systems. Multiple studies of zero waste systems cite higher wages and better working conditions than in comparable fields, and opportunities to develop and use varied skills, from equipment repair to public outreach.
Figure 1: Waste Hierarchy with mean job generation figures per ten thousand tonnes of waste processed per year.
The data show that waste management approaches that have the best environmental outcomes also generate the most jobs.
LANDFILL OR INCINERATE
COMPOST
7 jobs
2jobs
REMANUFACTURE
55 jobs
RECYCLE
115 jobs
REPAIR
404 jobs
REDESIGN, REDUCE, REUSE*
*The limited data available on the job creation potential of the strategies in the top tier of the hierarchy suggest that the magnitude of job growth potential
from this sector could be significant.

4 | Zero Waste and Economic Recovery The Job Creation Potential of Zero Waste Solutions | 5
Repair creates over 200 times as many jobs as landfills and incinerators.
Economic goals align with environmental goals; the waste management strategies that create the most jobs also deliver the best environmental outcomes.
Recycling creates over 50 times as many jobs as landfills and incinerators.
Zero waste systems offer more desirable employment opportunities as they can utilize skills beyond basic manual labor, provide higher wages, offer more permanent positions, and improve quality of life.
Remanufacturing creates almost 30 times as many jobs as landfills and incinerators.
As the job creation potential of zero waste processes is comparable across geographies, governments across the globe have an opportunity to benefit from the implementation of zero waste solutions as part of their COVID-19 economic recovery strategy.
IntroductionThe economic crisis ushered by the COVID-19 pandemic caused millions of people around the world to lose their jobs. In an effort to bolster their economies, local, provincial, and national governments are deploying considerable recovery funds. The initiatives that will benefit from recovery funds will not only play a critical role in economic resilience, but also in the development of more just societies.
The waste management sector is of particular interest due to its large pollution impacts and the projected substantial increase in waste generation.3 C40 estimates that the waste management industry has the potential to create 2.9 million jobs across the 97 cities in the C40 network.4 However, conventional waste management approaches are often expensive propositions, which are generally directly or indirectly funded by the public. The result is that waste management is the single greatest line item in many municipal budgets,5 despite much of the world’s municipal waste remaining uncollected.
Zero waste provides a proven solution to these environmental and economic challenges. Following the waste hierarchy —a long-established ranking of waste management methods according to environmental impact—zero waste practices prioritize waste reduction, reuse, repair, recycling, and composting, in that order; and minimize disposal (incineration and landfilling). This approach not only minimizes environmental harms, but it is also significantly less expensive than systems that primarily burn or bury waste. Unlike incinerators and engineered landfills that require large investments for the build and upkeep of a centralized facility, zero waste systems, particularly in the Global South, tend to be decentralized and rely on local community-led collection, sorting, recycling, and composting infrastructure, coupled with strong waste reduction policies. These zero waste systems result in both the creation of local jobs and a decrease in environmental pollution.
Key takeaways from the study:
Zero waste vs. disposal Zero waste is a comprehensive waste management approach that prioritizes waste reduction and material recovery. Strategies include policy interventions to drive the redesign of products and delivery systems; and increasing access to reuse, repair, recycling, and composting. The ultimate aim is to create a circular economy, shrinking waste disposal to zero. Disposal-based systems rely on incineration (“waste to energy”) and landfills to handle the majority of the waste stream, resulting in higher economic costs and environmental consequences.
The Numbers The Insights
We used our generated global average job creation factors to estimate the number of jobs that could be created in a handful of major cities around the world by simply achieving higher recycling and composting rates—two zero waste processes with the most widely available data. The results are listed in Figure 2 (see page 7) and show that recycling, remanufacturing, and composting alone could create thousands of new jobs across the model cities; the potential of full zero
waste systems that integrate repair, reuse, and waste reduction is even greater.
We conclude that implementing zero waste strategies to meet current and future waste management needs not only reduce greenhouse gas emissions and air pollution1,2 but also provide significantly more jobs than disposal-based systems.
Materials Recovery Facility in Buenos Aires (Argentina) operated by the worker cooperative El Amanecer de los Cartoneros with assistance from the government and equipment company. 260 people work in the facility, processing materials collected by 1,800 recyclers. ©Santiago Vivacqua/GAIA
Green City Growers is a landscaping company that turns unused urban spaces in Boston (USA) into edible gardens using compost sourced from local restaurants. ©Anto Astudillo/GAIA
Here we offer an analysis of the employment benefits of zero waste, drawing upon a wide range of existing studies. No published work has examined the employment impact of a complete zero waste system, but many have analyzed the employment impacts of the various components of zero waste, recycling in particular. We compared these findings with data on the employment impacts of disposal at landfills and incinerators. We then used these findings and waste composition data from a number of major cities around the world to estimate the job creation potential of zero waste in each city.

6 | Zero Waste and Economic Recovery The Job Creation Potential of Zero Waste Solutions | 7
Data collection and definitions of waste management processesWe collected job production data from 36 peer-reviewed academic papers, news articles, government reports, company websites, and publications from non-governmental organizations including GAIA representing 16 countries.6 In some cases, tonnage and job figures for the same location and year from separate publications are combined to calculate job estimates. We categorized the data based on the waste management or processing
method described in each publication: repair, recycling, remanufacturing, composting, landfill, and incineration. Reduction and reuse are not included due to a lack of data. Sources vary greatly in their use of terms, and in which activities contribute to their employment statistics. In particular, there are inconsistencies regarding the inclusion of waste collection activities in the job estimates.
Overview of activities generally included in each categoryRepair: Activities that fall under this category typically consist of collection, refurbishment, and resale of durable goods like furniture or electronics.
Recycling: Employment activities that fall under recycling generally include material collection, sorting, cleaning, and other processing steps (e.g. baling of plastics), and, less frequently, additional
processing to transform recyclables into raw material for remanufacturing (e.g. pelletizing of plastics or de-tinning of steel scraps). In three cases, jobs related to education and outreach on source separation or waste stream analysis services are also included.
Remanufacturing: This category is generally limited to activities that use recycled material as feedstock for manufacturing marketable consumer products (e.g. newspapers made from recycled paper).
Composting: Job figures for composting generally include only direct work in producing compost at a facility. In three cases, organic waste collection is included, in another three the authors do not
specify, and in one case, indirect education and outreach jobs are included as well. One study includes an estimate for the number of jobs supported by industries that utilize finished compost. Anaerobic digestion is not included in this category and is not included in the analysis overall due to data constraints.
Landfill and Incineration: Job production numbers in these two categories are based on jobs that deal directly with managing landfill sites and incinerators and, in some cases, waste collection. Of the
seven data points for landfill job creation potential, two include collection jobs, two exclude collection jobs, and the remaining three do not specify. Of the eight incineration figures, one includes collection jobs, three exclude collection jobs, and the rest do not specify.
Figure 2: An idealized waste flow diagram. Jobs in recycling generally include secondary sorting and processing.
See Figure 1 for more comprehensive waste hierarchy.
Compost
SourceSeparation
Repair
Sale/Returned to Economy
ASH
Secondary Sort
Incineration
Landfill
Remanufacturing
Processing
DISPOSAL
DISCARDS
DURABLEGOODSORGANICS RECYCLABLES TRASH
8 | Zero Waste and Economic Recovery The Job Creation Potential of Zero Waste Solutions | 9
Findings by waste management processThe following sections provide further insights on the data around each waste management process. The complete data set can be found in the appendix.
RepairThis part of the zero waste ecosystem is particularly crucial as it removes difficult-to-
recycle, multi-material, and bulky items such as bicycles, furniture, clothing, large household appliances, and computers from the waste stream by redirecting them from landfills or incinerators to repair shops and thrift stores. While there is less data for the repair sector, the figures are consistently high, with an average of 404 jobs/10,000 tonnes per year (TPY) reflecting the high labor intensity required for refurbishment and repair.
Beyond the number of jobs produced, the repair sector provides important opportunities for skill development. A number of studies cite numerous social benefits, including volunteer and job training opportunities created by the many charitable organizations involved in the sector, low economic and technical barriers to entry, autonomy for small businesses, and the availability of lower-cost, refurbished goods for lower-income consumers.7,8,9
While job creation metrics are important for comparing waste management processes, occupational health and safety and environmental health safeguards in the waste sector remain an important concern, particularly in the electronics repair sector. Multiple studies document instances of hazardous working conditions in waste electronics repair and recycling operations.10,11 Moreover, one study of the waste electronics industry in the UK notes that few of the workers gained higher level technical skills or went on to find employment after participating in waste electronics training programs.10
The research outlined here might even understate the importance of the repair sector as part of a healthy economy. A 2017 analysis of the repair and reuse sector in Maine, USA, shows that the sector grew during the 2008/2009 economic recession, and continued to grow after the economy recovered, with a 6.5% employment growth rate in the sector compared to the state’s average of 1.1%. The literature strongly suggests that a repair sector that prevents waste from needing to be recycled, landfilled, or incinerated in the first place is rich in opportunities for jobs and, perhaps more importantly, a source of economic resilience.
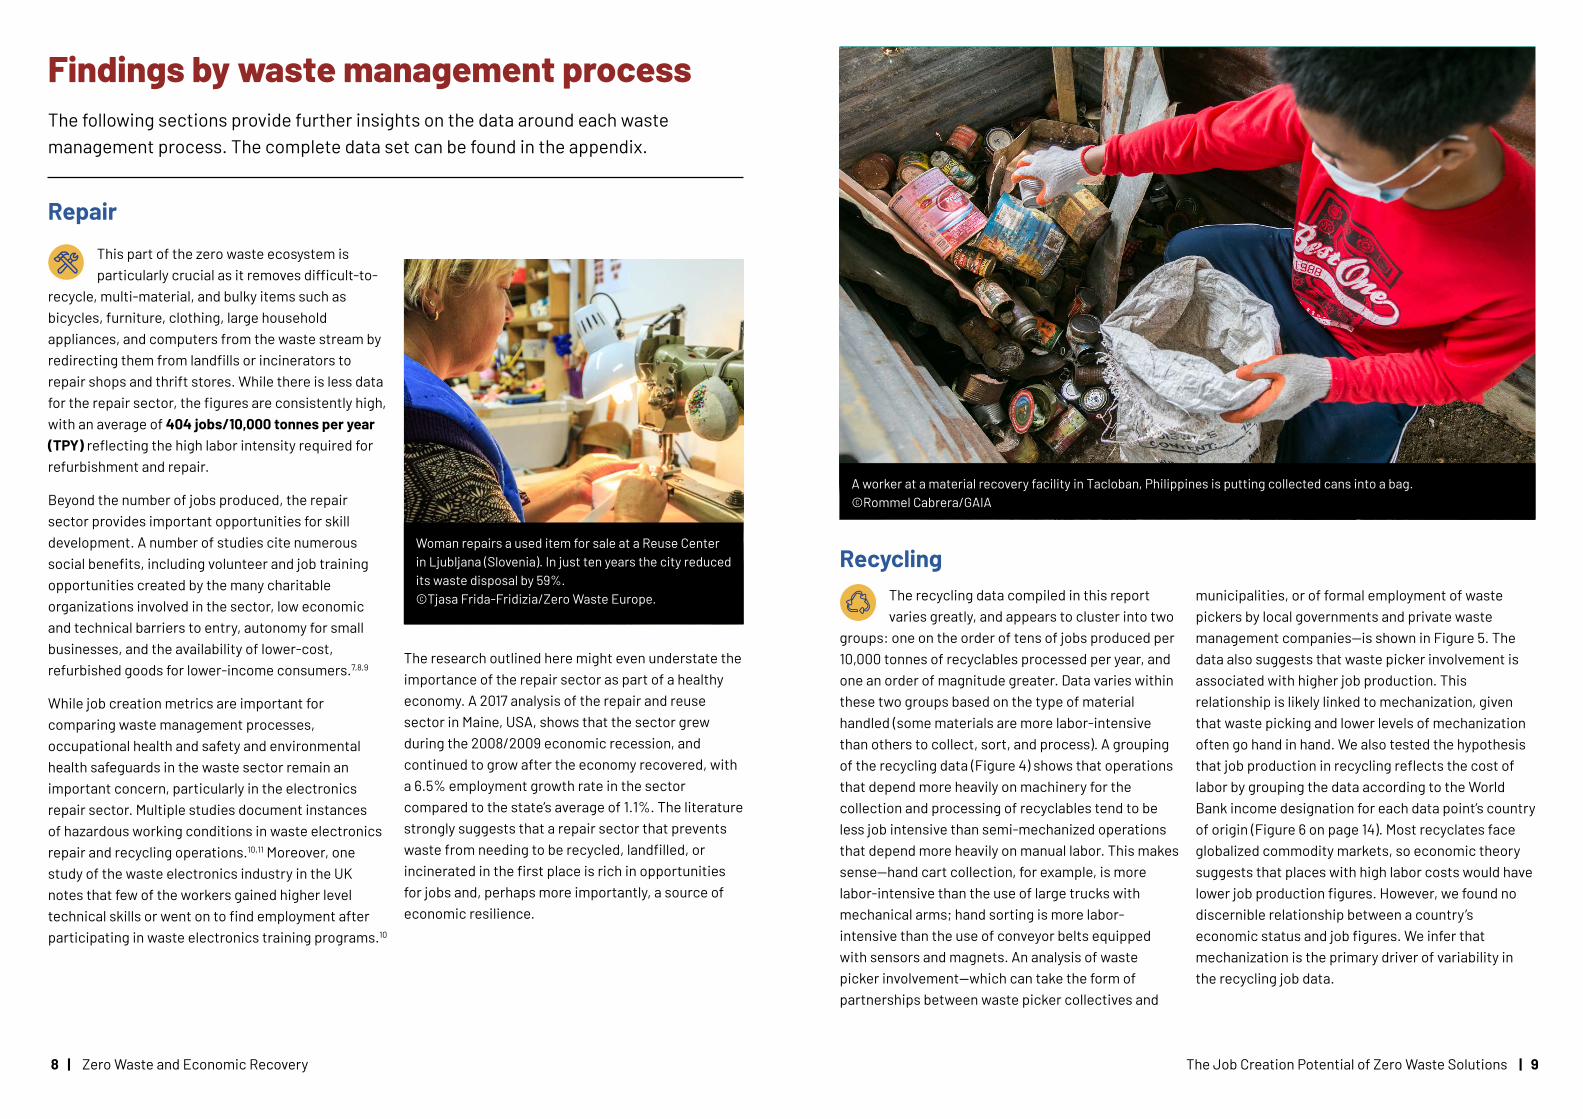
RecyclingThe recycling data compiled in this report varies greatly, and appears to cluster into two
groups: one on the order of tens of jobs produced per 10,000 tonnes of recyclables processed per year, and one an order of magnitude greater. Data varies within these two groups based on the type of material handled (some materials are more labor-intensive than others to collect, sort, and process). A grouping of the recycling data (Figure 4) shows that operations that depend more heavily on machinery for the collection and processing of recyclables tend to be less job intensive than semi-mechanized operations that depend more heavily on manual labor. This makes sense—hand cart collection, for example, is more labor-intensive than the use of large trucks with mechanical arms; hand sorting is more labor-intensive than the use of conveyor belts equipped with sensors and magnets. An analysis of waste picker involvement—which can take the form of partnerships between waste picker collectives and
municipalities, or of formal employment of waste pickers by local governments and private waste management companies—is shown in Figure 5. The data also suggests that waste picker involvement is associated with higher job production. This relationship is likely linked to mechanization, given that waste picking and lower levels of mechanization often go hand in hand. We also tested the hypothesis that job production in recycling reflects the cost of labor by grouping the data according to the World Bank income designation for each data point’s country of origin (Figure 6 on page 14). Most recyclates face globalized commodity markets, so economic theory suggests that places with high labor costs would have lower job production figures. However, we found no discernible relationship between a country’s economic status and job figures. We infer that mechanization is the primary driver of variability in the recycling job data.
Woman repairs a used item for sale at a Reuse Center in Ljubljana (Slovenia). In just ten years the city reduced its waste disposal by 59%. ©Tjasa Frida-Fridizia/Zero Waste Europe.
A worker at a material recovery facility in Tacloban, Philippines is putting collected cans into a bag. ©Rommel Cabrera/GAIA

10 | Zero Waste and Economic Recovery The Job Creation Potential of Zero Waste Solutions | 11
Figure 3. Recycling jobs grouped by mechanization. Semi-mechanized recycling
The job figures for semi-mechanized recycling are still quite high, with an average of 321 jobs/10,000 TPY. This figure is derived from case studies that often described the work of waste picker collectives, or of local companies employing former waste pickers that collect, transport, sort, package, and sometimes process recyclables in preparation for their use in remanufacturing. It is clear that a huge number of livelihoods are supported by waste in places where waste management is not highly mechanized. This is consistent with previous estimates of the informal waste management sector (individuals who collect, sort, and process recyclables without formal recognition, wages or worker protections from a business or municipality) which range from 12.5 million to 56 million people globally.12
In many of these cases, the quality of life for informal waste workers dramatically improves through integration into the formal economy. Integration takes various forms: some cities formally recognize and even contract with waste picker cooperatives; elsewhere, businesses hire former waste pickers, recognizing their expertise. In both cases, the recognition brings quality of life benefits, including
personal protective equipment, higher wages, improved prospects for the children of waste workers, and official identity cards that provide a measure of legitimacy and safety.13,14,15 In Buenos Aires (Argentina); Santiago (Chile); Bengaluru (India); and Dois Irmãos (Brazil), waste pickers contracting with local governments or hired by local waste companies are paid up to 2.5 times the local minimum wage, often in addition to being able to sell the recyclables they collect.16,17 Former waste pickers employed at facilities in Baku, Azerbaijan and Rabat, Morocco receive guaranteed salaries and health insurance,18,19 and the workers in Rabat additionally receive access to a bank account and a special low mortgage rate. Many studies document what happens in the absence of the income security that integration can provide: long hours for waste picking parents, and the involvement of more family members, i.e. children, in waste picking.17,20,21 By the same token, higher and guaranteed income for informal waste workers cannot only alleviate poverty but also improve the children’s economic and educational prospects by reducing the economic pressure for children to contribute to family income.
Mechanized recycling
This category is characterized by an average of 17 jobs/10,000 TPY, well below the figures for semi-mechanized recycling but an order of magnitude greater than for disposal (incineration and landfilling). Job quality can also be better in the recycling industry compared to jobs in disposal. A 2009 literature review on the U.S. recycling industry by the CASCADIA consulting group found that the average reported income in the recycling sector was higher than that of the disposal sector and the statewide average income in seven different states.22 In San Francisco, the worker-owned waste management company
Recology, which has achieved an 80% diversion rate, offers a starting wage to waste collection drivers of $40 per hour, compared to the average waste collection driver’s income of $16 per hour , and employs over 160 workers at San Francisco’s Recycle Central and another 45 in construction recycling.23 Contrary to a general impression of recycling as low-skill, undesirable work, a number of case studies cite diverse skills used by employees in education, outreach, and waste stream analysis, among other activities.24,25,26
Figure 4. Recycling jobs grouped by waste picker presence
Figure 5. Recycling jobs grouped by country income level
200
0
400
600
Highly-mechanized Semi-mechanized Mechanization uknown
200
0
400
600
No waste pickers Yes—waste pickers hired by companies or municipalities
Yes—no waste picker collective
200
0
400
600
Lower-middle Upper-middle High
Lower levels of recycling mechanization mean more jobs.
Each dot represents a different data source. The red triangle represents the median. Numbers indicate the number of full-time equivalent jobs per 10,000 tonnes per year of material handled.
Job figures are higher in places with active waste picker involvement in waste management.
Each dot represents a different data source. The red triangle represents the median. Numbers indicate the number of full-time equivalent jobs per 10,000 tonnes per year of material handled.
National income levels show no correlation with recycling jobs.
Each dot represents a different data source. The red triangle represents the median. Numbers indicate the number of full-time equivalent jobs per 10,000 tonnes per year of material handled.

12 | Zero Waste and Economic Recovery The Job Creation Potential of Zero Waste Solutions | 13
RemanufacturingThe remanufacturing sector, where recycled materials like baled paper and aluminum are
used as feedstock for the manufacture of consumer goods, represents additional job opportunities with an average of 51 jobs/10,000 TPY. Here, the data varies depending on the material in question and how individual facilities operate. One estimate for the use of newspaper waste in paper mills in the UK is as low as 8 jobs/10,000 TPY, while another for textile remanufacturing is as high as 160 jobs/10,000 TPY.27 Some remanufacturing plants accept feedstock such as plastic pellets that can be fed right into production operations, while others take in unprocessed materials such as asphalt or baled newspapers, and do some breakdown, cleaning, preprocessing themselves.28
CompostingThe use of composting to manage organic waste generates an average of
6.6 jobs/10,000 TPY. While the data does not differ greatly with variation in the level of mechanization at
different composting sites, it does suggest that more mechanization leads to fewer jobs. A site in Lahore (Pakistan) that utilizes highly-mechanized windrow composting to dispose of organic waste has the lowest job figure found, 2.7 jobs/10,000 TPY.29 On the high end, the inclusion of jobs for waste collection, compost sales, and other products, in addition to standard compost processing contributes to the highest job figure at a composting facility of 14 jobs/10,000 TPY in Bali (Indonesia).30,31
Composting is another highly cost-effective waste management practice. The composting operation in La Pintana (Chile) processes 20.5% of this local government’s waste, but only represents 2.4% of its solid waste budget, and generates the equivalent of 3-7 jobs/10,000 TPY.32 Although composting produces relatively few jobs, separate collection and treatment of organics is a critical component of zero waste because it avoids cross-contaminating recycling streams and has some of the largest direct climate benefits through avoided landfill methane generation.33,34
Landfill and incineration
With an average job creation potential of 1.8 jobs/10,000 TPY of waste handled,
landfilling is one of the poorest job producers, tonne for tonne, of all of the waste management processes found in the literature. Three studies estimate that landfilling by itself provides only 1 job/10,000 TPY, while the highest figure of 2.8 jobs/10,000 TPY includes jobs in collecting and transporting waste to landfill sites.35,36,37
Waste incineration facilities are similarly poor sources of permanent jobs.38 Despite the geographic range captured in the literature, the job creation potential of waste incineration is consistently low, supporting an average of 1.7 jobs/10,000 TPY. One proposed incinerator in South Africa would have reportedly created as few as 0.7 jobs/10,000 TPY.39
Aluminum cans sorted in a recycling facility in Buenos Aires. ©Santiago Vivacqua/GAIA
Community garden using compost from household waste in Tacloban (Philippines). ©Rommel Cabrera/GAIA
A waste-to-energy incinerator located in Munich, Germany ©Anselm Baumgart
14 | Zero Waste and Economic Recovery The Job Creation Potential of Zero Waste Solutions | 15
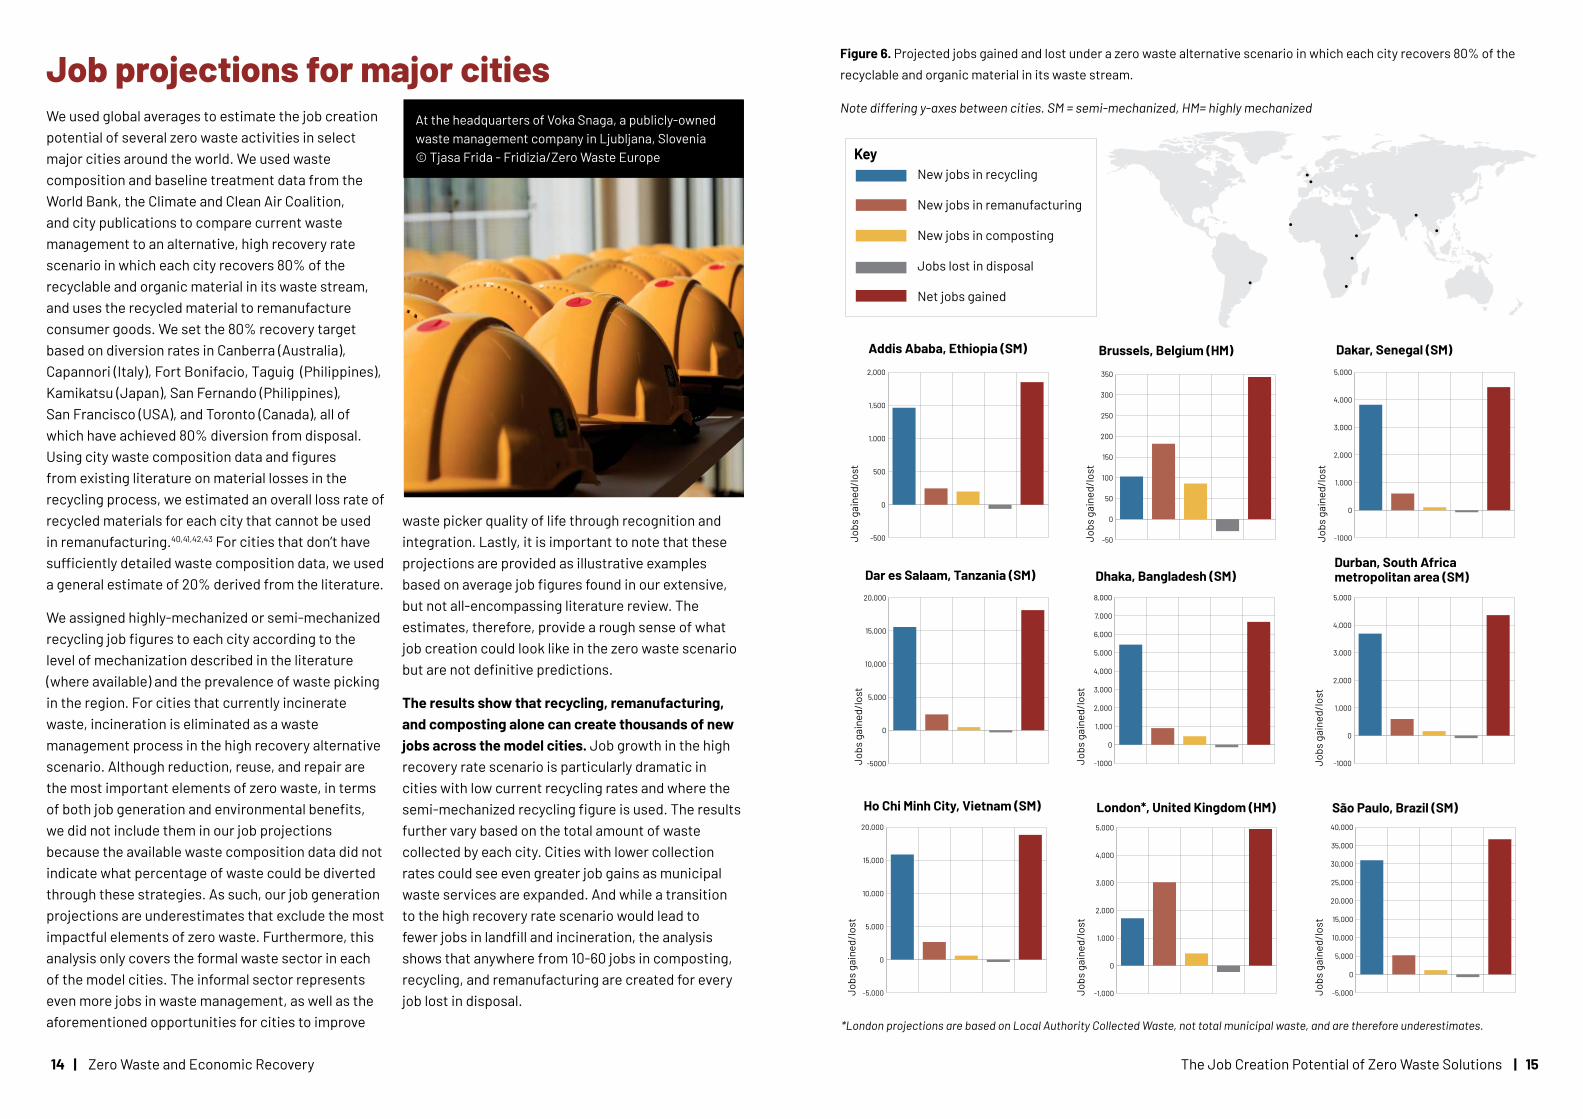
Job projections for major citiesWe used global averages to estimate the job creation potential of several zero waste activities in select major cities around the world. We used waste composition and baseline treatment data from the World Bank, the Climate and Clean Air Coalition, and city publications to compare current waste management to an alternative, high recovery rate scenario in which each city recovers 80% of the recyclable and organic material in its waste stream, and uses the recycled material to remanufacture consumer goods. We set the 80% recovery target based on diversion rates in Canberra (Australia), Capannori (Italy), Fort Bonifacio, Taguig (Philippines), Kamikatsu (Japan), San Fernando (Philippines), San Francisco (USA), and Toronto (Canada), all of which have achieved 80% diversion from disposal. Using city waste composition data and figures from existing literature on material losses in the recycling process, we estimated an overall loss rate of recycled materials for each city that cannot be used in remanufacturing.40,41,42,43 For cities that don’t have sufficiently detailed waste composition data, we used a general estimate of 20% derived from the literature.
We assigned highly-mechanized or semi-mechanized recycling job figures to each city according to the level of mechanization described in the literature (where available) and the prevalence of waste picking in the region. For cities that currently incinerate waste, incineration is eliminated as a waste management process in the high recovery alternative scenario. Although reduction, reuse, and repair are the most important elements of zero waste, in terms of both job generation and environmental benefits, we did not include them in our job projections because the available waste composition data did not indicate what percentage of waste could be diverted through these strategies. As such, our job generation projections are underestimates that exclude the most impactful elements of zero waste. Furthermore, this analysis only covers the formal waste sector in each of the model cities. The informal sector represents even more jobs in waste management, as well as the aforementioned opportunities for cities to improve
waste picker quality of life through recognition and integration. Lastly, it is important to note that these projections are provided as illustrative examples based on average job figures found in our extensive, but not all-encompassing literature review. The estimates, therefore, provide a rough sense of what job creation could look like in the zero waste scenario but are not definitive predictions.
The results show that recycling, remanufacturing, and composting alone can create thousands of new jobs across the model cities. Job growth in the high recovery rate scenario is particularly dramatic in cities with low current recycling rates and where the semi-mechanized recycling figure is used. The results further vary based on the total amount of waste collected by each city. Cities with lower collection rates could see even greater job gains as municipal waste services are expanded. And while a transition to the high recovery rate scenario would lead to fewer jobs in landfill and incineration, the analysis shows that anywhere from 10-60 jobs in composting, recycling, and remanufacturing are created for every job lost in disposal.
Figure 6. Projected jobs gained and lost under a zero waste alternative scenario in which each city recovers 80% of the recyclable and organic material in its waste stream.
Note differing y-axes between cities. SM = semi-mechanized, HM= highly mechanizedAt the headquarters of Voka Snaga, a publicly-owned waste management company in Ljubljana, Slovenia © Tjasa Frida - Fridizia/Zero Waste Europe
-50
0
50
100
150
200
250
300
350
Brussels, Belgium (HM)
-1000
0
1,000
2,000
3,000
4,000
5,000
6,000
7,000
8,000
Dhaka, Bangladesh (SM)
-1,000
0
1,000
2,000
3,000
4,000
5,000
London*, United Kingdom (HM)
-500
0
500
1,000
1,500
2,000
Addis Ababa, Ethiopia (SM)
-5000
0
5,000
10,000
15,000
20,000
Dar es Salaam, Tanzania (SM)
-5,000
0
5,000
10,000
15,000
20,000
Ho Chi Minh City, Vietnam (SM)
-1000
0
1,000
2,000
3,000
4,000
5,000
Dakar, Senegal (SM)
-1000
0
1,000
2,000
3,000
4,000
5,000
Durban, South Africa metropolitan area (SM)
-5,000
0
5,000
10,000
15,000
20,000
25,000
30,000
35,000
40,000
São Paulo, Brazil (SM)
New jobs in recycling
New jobs in remanufacturing
New jobs in composting
Jobs lost in disposal
Net jobs gained
Key
Jobs
gai
ned/
lost
Jobs
gai
ned/
lost
Jobs
gai
ned/
lost
Jobs
gai
ned/
lost
Jobs
gai
ned/
lost
Jobs
gai
ned/
lost
Jobs
gai
ned/
lost
Jobs
gai
ned/
lost
Jobs
gai
ned/
lost
*London projections are based on Local Authority Collected Waste, not total municipal waste, and are therefore underestimates.

16 | Zero Waste and Economic Recovery The Job Creation Potential of Zero Waste Solutions | 17
ConclusionsThe figures for the job creation potential of zero waste systems and the insights on their impacts were obtained by analyzing data from 16 countries, representing a wide range of economic and geographic conditions. This diversity in underlying conditions, definitions, and methodologies is the likely source of the significant range of employment generation potential data within each activity. Nevertheless, findings are consistent in their rankings, and the differences between activities are striking: repair generates on average three times as many jobs as recycling; recycling creates an order of magnitude more jobs than composting; and composting creates three times more jobs than disposal.
The labor-based hierarchy revealed by the findings (with the processes that employ the most people at the top and the fewest at the bottom) mirrors the traditional waste hierarchy based on environmental outcomes: the best strategies for job creation
are precisely the ones that deliver the best environmental outcomes, while the most polluting interventions create the fewest jobs. This remarkable correspondence demonstrates the compatibility of environmental and economic goals and positions the waste management sector as an opportune social infrastructure in which investments can strengthen local and global resilience.
Our findings also undermine the common impression that waste management offers only low wages and undesirable jobs. We found robust job creation across economic conditions and job numbers were independent of prevailing wage rates. This finding was reinforced by case studies that found that zero waste creates large numbers of better-than-living wage jobs. We also observed strong qualitative evidence of diverse, high-skill job creation through zero waste program elements. The labor intensity of the collecting, sorting, cleaning, analyzing, repairing, repackaging, and reselling involved in zero waste
Waste picker cooperative, SAWPA (South African Waste Pickers Association) ©Focalize Media/GAIA
Community garden using compost from household waste in Tacloban (Philippines). ©Rommel Cabrera/GAIA
processes offers opportunities for more highly-skilled work in data analysis, electronics repair, community outreach, remanufacturing, the operation of sophisticated machinery, and other roles required for material recovery.
In our city-level job projections, we see that thousands of jobs could be created in select cities around the world through increased recycling, remanufacturing, and composting. In particular, cities with low recycling rates, and lower levels of recycling mechanization have the highest potential for job growth, given that recycling and remanufacturing dominate the job projections. In cities that already have strong recycling rates, however, we still see significant job gains in composting. All cities, and especially cities with low collection rates that aim to expand their municipal waste systems, have an important opportunity to create jobs through zero
waste. Moreover, while recycling plays a large role in this analysis, and much of the available data on jobs in waste management covers recycling, zero waste systems comprise far more than just recycling. Repair, for example, the most labor-intensive of all the zero waste activities analyzed in this report, is not included in our city-level projections due to data constraints. The projections, which cover only recycling, remanufacturing, composting, and disposal, thus understate the job growth potential of implementing zero waste.
By directing recovery funds towards the creation of zero waste cities, governments across the globe will reduce pollution, create long-term desirable employment, and build fairer economies. Zero waste solutions present a path for just recovery that is viable financially, socially, and environmentally.

18 | Zero Waste and Economic Recovery The Job Creation Potential of Zero Waste Solutions | 19
21 Medina, M. (2008). The informal recycling sector in developing countries. Public-Private Infrastructure Advisory Facility.
22 Cascadia Consulting Group. (2009). Recycling and Economic Development: A Review of Existing Literature on Job Creation, Capital Investment, and Tax Revenues. King County Solid Waste Division.
23 Ahkiam, L. (2015). Cleaning Up Waste and Recycling Management and Securing the Benefits. Los Angeles Alliance for a New Economy.
24 Danielson, J. (2020). Leave No Trace: Vital lessons from pioneering organisations on the frontline of waste and ocean plastic. Vital Oceans/SYSTEMIQ, TriCiclos, Hasiru Dala.
25 Allen, C. (2012). Prioritizing the Recovery of Vegetable Waste. Global Alliance for Incinerator Alternatives.
26 Access Economics. (2009). Employment in waste management and recycling. The Australian Department of the Environment, Water, Heritage and the Arts.
27 Murray, R. (1999). Creating wealth from waste. Demos.
28 Institute for Local Self-Reliance (ILSR). (1995). Manufacturing from Recyclables - 24 case studies of successful enterprises.
29 Clean Development Mechanism. (2013). Project Design Document - Composting of Organic Content of Municipal Solid Waste in Lahore. UNFCCC/CCNUCC. Retrieved 2020, from https://cdm.unfccc.int/Projects/DB/SGS-UKL1248265320.71/view.
30 Danielson, J. (2020). Leave No Trace: Vital lessons from pioneering organisations on the frontline of waste and ocean plastic. Vital Oceans/SYSTEMIQ, TriCiclos, Hasiru Dala.
31 Temesi Recycling. (2020). The Process. Retrieved 2020, from http://temesirecycling.com/the-process/
32 Allen, C. (2012). Prioritizing the Recovery of Vegetable Waste. Global Alliance for Incinerator Alternatives.
33 Hoornweg, D., & Bhada-Tata, P. (2012). What a Waste: A Global Review of Solid Waste Management. World Bank Group.
34 Wilson, D. C., Rodic, L., Modak, P., Soos, R., Carpintero Rogero, A., Velis, C., et al. (2015). Global waste management outlook. United Nations Environment Programme.
35 Tellus Institute. (2011). More Jobs, Less Pollution: Growing the Recycling Economy in the U.S.. Global Alliance for Incinerator Alternatives.
36 Pridmore, A., Smith, A., Baker, K., Ahlgren, C., & Williamson, T. (2017). Climate change: Evidence review of mitigation options in the Built Environment sector. Scottish Government.
37 Access Economics. (2009). Employment in waste management and recycling. The Department of the Environment, Water, Heritage and the Arts.
38 Employment figures for incinerators often include shorter term construction jobs, but long term operations employ few people.
39 GroundWork South Africa. (2013). Nov. 8 march against incineration: Waste incineration is wasting jobs in South Africa! Retrieved 2020, from https://globalrec.org/2013/11/07/march-against-incineration/
40 Morawski, C. (2009). Understanding economic and environmental impacts of single-stream collection systems. Container Recycling Institute.
41 Collins, S. (2012). A Common Theme. Resource Recycling.
42 Kondor, G. (1993). Newspaper recycling: The measurement of yield loss. Applied Mathematics Letters, 6(3), 43-46. doi:10.1016/0893-9659(93)90031-h
43 Méndez, L. (2019, November 06). Here’s What Really Happens to Recycled Plastic. Reader’s Digest. Retrieved 2020, from https://www.rd.com/list/heres-what-happens-to-recycled-plastic/
Endnotes1 Hogg, D., & Ballinger, A. (2015, October). The Potential Contribution of Waste Management to a Low Carbon Economy. Zero Waste Europe, Zero Waste France, ACR+.
2 Platt, B., Ciplet, D., Bailey, K., & Lombardi, E. (2008). Stop Trashing the Climate. Institute for Local Self-Reliance, Eco-Cycle, and the Global Alliance for Incinerator Alternatives.
3 The World Bank. (2018). Trends in Solid Waste Management. Retrieved 2020, from https://datatopics.worldbank.org/what-a-waste/trends_in_solid_waste_management.html
4 Huxley, R., Berensson, M., Van den Broek d’Obrenan, H., & Roderick, W. (2020). Technical Report: The case for a green and just recovery. C40 Cities Climate Leadership Group.
5 Kaza, S., Yao, L., Bhada-Tata, P., & Von Woerden, F. (2018). What a Waste 2.0: A Global Snapshot of Solid Waste Management to 2050. World Bank Group. doi:10.1596/978-1-4648
6 More details on data collection methodology and sources can be found in the appendix
7 Isenhour, C. (2017). Maine’s Culture of Reuse and Its Potential to Advance Environmental and Economic Policy Objectives. Maine Policy Review, 26(1), 36-46.
8 O’connell, M., Fitzpatrick, C., & Hickey, S. (2010). Investigating reuse of B2C WEEE in Ireland. Proceedings of the 2010 IEEE International Symposium on Sustainable Systems and Technology. doi:10.1109/issst.2010.5507697
9 Alexander, C., & Smaje, C. (2008). Evaluating third sector reuse organisations in the UK: Case-studies and analysis of furniture reuse schemes. Resources, Conservation and Recycling, 52(5), 719-730. doi:10.1016/j.resconrec.2007.09.005
10 Bozkurt, Ö, & Stowell, A. (2016). Skills in the green economy: Recycling promises in the UK e‐waste management sector. New Technology, Work and Employment, 31(2), 146-160. doi:10.1111/ntwe.12066
11 Tsydenova, O., & Bengtsson, M. (2011). Chemical hazards associated with treatment of waste electrical and electronic equipment. Waste Management, 31(1), 45-58. doi:10.1016/j.wasman.2010.08.014
12 Linzner, R., & Lange, U. (2013). Role and size of informal sector in waste management – a review. Proceedings of the Institution of Civil Engineers - Waste and Resource Management, 166(2), 69-83. doi:10.1680/warm.12.00012
13 Danielson, J. (2020). Leave No Trace: Vital lessons from pioneering organisations on the frontline of waste and ocean plastic. Vital Oceans/SYSTEMIQ, TriCiclos, Hasiru Dala.
14 Chikarmane, P. (2012). Integrating Waste Pickers into Municipal Solid Waste Management in Pune, India. Women in Informal Employment Globalizing and Organizing (WIEGO).
15 Marello, M., & Helwege, A. (2017). Solid Waste Management and Social Inclusion of Wastepickers: Opportunities and Challenges. Latin American Perspectives, 45(1), 108-129. doi:10.1177/0094582x17726083
16 Global Alliance for Incinerator Alternatives (GAIA). (2019). Inclusion of Waste Pickers in Zero Waste Programs.
17 Danielson, J. (2020). Leave No Trace: Vital lessons from pioneering organisations on the frontline of waste and ocean plastic. Vital Oceans/SYSTEMIQ, TriCiclos, Hasiru Dala.
18 The World Bank. (2016). Morocco Lets Nothing Go To Waste. Retrieved 2020, from https://www.worldbank.org/en/news/feature/2016/02/16/morocco-lets-nothing-go-to-waste
19 Makhfi, J. (2015, October 21). Morocco trash pickers help fight climate change. Retrieved 2020, from https://phys.org/news/2015-10-morocco-trash-pickers-climate.html
20 Chintan Environmental Research and Action Group. (2011). Waste-to-Energy or Waste-of-Energy?

20 | Zero Waste and Economic Recovery The Job Creation Potential of Zero Waste Solutions | 21
ReferencesAccess Economics. (2009). Employment in waste management and recycling. The Australian Department of the Environment, Water, Heritage and the Arts.
Ahkiam, L. (2015). Cleaning Up Waste and Recycling Management and Securing the Benefits. Los Angeles Alliance for a New Economy.
Alexander, C., & Smaje, C. (2008). Evaluating third sector reuse organisations in the UK: Case-studies and analysis of furniture reuse schemes. Resources, Conservation and Recycling, 52(5), 719-730. doi:10.1016/j.resconrec.2007.09.005
Allen, C. (2012). Prioritizing the Recovery of Vegetable Waste. Global Alliance for Incinerator Alternatives.
APWC (Asia Pacific Waste Consultants). (2020). South Africa – Waste classification report. The Commonwealth Litter Programme.
Bosch Munitech. (2016). EThekwini Municipality Draft Integrated Waste Management Plan 2016 – 2021. EThekwini Municipality.
Bozkurt, Ö, & Stowell, A. (2016). Skills in the green economy: Recycling promises in the UK e‐waste management sector. New Technology, Work and Employment, 31(2), 146-160. doi:10.1111/ntwe.12066
Campos, L. (Director), & TV Câmara Araraquara (Producer). (2019, November 13). Minha Profissão - Catador de Material Reciclável [Video file]. Retrieved 2020, from https://www.youtube.com/watch?v=Jm-ce_4LLgI
Cascadia Consulting Group. (2009). Recycling and Economic Development: A Review of Existing Literature on Job Creation, Capital Investment, and Tax Revenues. King County Solid Waste Division.
Chikarmane, P. (2012). Integrating Waste Pickers into Municipal Solid Waste Management in Pune, India. Women in Informal Employment Globalizing and Organizing (WIEGO).
Chintan Environmental Research and Action Group. (2011). Waste-to-Energy or Waste-of-Energy?
Clean Development Mechanism. (2013). Project Design Document - Composting of Organic Content of Municipal Solid Waste in Lahore. UNFCCC/CCNUCC. Retrieved 2020, from https://cdm.unfccc.int/Projects/DB/SGS-UKL1248265320.71/view.
Climate and Clean Air Coalition. (2015). Draft Work Plan for Addis Ababa. United States Environmental Protection Agency.
Climate and Clean Air Coalition. (2016). Solid Waste Management City Profile - Dakar, Senegal. United States Environmental Protection Agency.
Collins, S. (2012). A Common Theme. Resource Recycling.
Comitê Intersecretarial para a Política Municipal de Resíduos Sólidos. (2020). Plano de Gestão Integrada de Resíduos Sólidos da Cidade de São Paulo. Prefeitura do Município de São Paulo.
Cools, P., & Oosterlynck, S. (2015). De Kringwinkel: A symbiosis between jobs for the long term unemployed and waste reduction? Poverty Reduction in Europe: Social Policy and Innovation (ImPRovE).
Corbin, M., Ballinger, A., Elliott, L., Vergunst, T., Hogg, D., & Elliott, T. (2015). Further development of the European reference model on waste generation and management. Directorate-General for Environment (European Commission). doi:10.2779/871316
Danielson, J. (2020). Leave No Trace: Vital lessons from pioneering organisations on the frontline of waste and ocean plastic. Vital Oceans/SYSTEMIQ, TriCiclos, Hasiru Dala.
Dayrit, F. (2019). Picking Up the Baton - Political Will Key to Zero Waste. Global Alliance for Incinerator Alternatives.
Department for Environment, Food, and Rural Affairs. (2019). Statistics on waste managed by local authorities in England in 2018/19.
European Commission. (2015). Capital factsheet on separate collection – Brussels/Belgium.
Friends of the Earth. (2010). More Jobs, Less Waste: Potential for job creation through higher rates of recycling in the UK and in the EU.
Global Alliance for Incinerator Alternatives (GAIA). (2019). Inclusion of Waste Pickers in Zero Waste Programs.
Global Alliance for Incinerator Alternatives (GAIA). (2019). Three zero waste strategies toward carbon neutrality.
Global Alliance for Incinerator Alternatives (GAIA). (2018). Waste-to-Energy Has No Place in Africa.
The Greater London Authority. (2018). London Environment Strategy.
GroundWork South Africa. Making Waste Work: The South African Waste Pickers’ Association’s Success Stories.
GroundWork South Africa. (2013). Nov. 8 march against incineration: Waste incineration is wasting jobs in South Africa! Retrieved 2020, from https://globalrec.org/2013/11/07/march-against-incineration/
Hogg, D., & Ballinger, A. (2015). The Potential Contribution of Waste Management to a Low Carbon Economy. Zero Waste Europe, Zero Waste France, ACR+.
Hoornweg, D., & Bhada-Tata, P. (2012). What a Waste: A Global Review of Solid Waste Management. World Bank Group.
Huxley, R., Berensson, M., Van den Broek d’Obrenan, H., & Roderick, W. (2020). Technical Report: The case for a green and just recovery. C40 Cities Climate Leadership Group.
Institute for Local Self-Reliance (ILSR). (1995). Manufacturing from Recyclables - 24 case studies of successful enterprises.
Institute for Local Self-Reliance (ILSR). (2002, February 1). Recycling Means Business. Retrieved
2020, from https://ilsr.org/recycling-means-business/
Isenhour, C. (2017). Maine’s Culture of Reuse and Its Potential to Advance Environmental and Economic Policy Objectives. Maine Policy Review, 26(1), 36-46.
Jumeau, Vincent. (2017). Rapport annuel. Bruxelles-Propreté.
Kaza, S., Yao, L., Bhada-Tata, P., & Von Woerden, F. (2018). What a Waste 2.0: A Global Snapshot of Solid Waste Management to 2050. World Bank Group. doi:10.1596/978-1-4648
Kondor, G. (1993). Newspaper recycling: The measurement of yield loss. Applied Mathematics Letters, 6(3), 43-46. doi:10.1016/0893-9659(93)90031-h
Linzner, R., & Lange, U. (2013). Role and size of informal sector in waste management – a review. Proceedings of the Institution of Civil Engineers - Waste and Resource Management, 166(2), 69-83. doi:10.1680/warm.12.00012
Makhfi, J. (2015, October 21). Morocco trash pickers help fight climate change. Retrieved 2020, from https://phys.org/news/2015-10-morocco-trash-pickers-climate.html
Marello, M., & Helwege, A. (2017). Solid Waste Management and Social Inclusion of Wastepickers: Opportunities and Challenges. Latin American Perspectives, 45(1), 108-129. doi:10.1177/0094582x17726083
Medina, M. (2008). The informal recycling sector in developing countries. Public-Private Infrastructure Advisory Facility.
Morawski, C. (2009). Understanding economic and environmental impacts of single-stream collection systems. Container Recycling Institute.
Murray, R. (1999). Creating wealth from waste. Demos.
Méndez, L. (2019, November 06). Here’s What Really Happens to Recycled Plastic. Reader’s Digest. Retrieved 2020, from https://www.rd.com/list/heres-what-happens-to-recycled-plastic/

22 | Zero Waste and Economic Recovery The Job Creation Potential of Zero Waste Solutions | 23
O’connell, M., Fitzpatrick, C., & Hickey, S. (2010). Investigating reuse of B2C WEEE in Ireland. Proceedings of the 2010 IEEE International Symposium on Sustainable Systems and Technology. doi:10.1109/issst.2010.5507697
Platt, B. (2013). Pay Dirt: Composting in Maryland to Reduce Waste, Create Jobs, & Protect the Bay. Institute for Local Self-Reliance.
Platt, B., Ciplet, D., Bailey, K., & Lombardi, E. (2008). Stop Trashing the Climate. Institute for Local Self-Reliance, Eco-Cycle, and the Global Alliance for Incinerator Alternatives.
Pridmore, A., Smith, A., Baker, K., Ahlgren, C., & Williamson, T. (2017). Climate change: Evidence review of mitigation options in the Built Environment sector. Scottish Government.
Quang Khôi, Lê. (2019). Báo Cáo Hiện Trạng Môi Trường Quốc Gia. Vietnam Ministry of Natural Resources and the Environment.
Recology. (2020). Recycle Central/Pier. Retrieved 2020, from https://www.recology.com/recology-san-francisco/recycle-centralpier-96/
The Reuse and Recycling EU Social Enterprises Network (RREUSE). (2015). Briefing on job creation potential in the re-use sector.
Seldman, N. (2015, March 2). Reuse Based Enterprises. Retrieved 2020, from https://ilsr.org/reuse-based-enterprises/
Tellus Institute. (2011). More Jobs, Less Pollution: Growing the Recycling Economy in the U.S.. Global Alliance for Incinerator Alternatives.
Temesi Recycling. (2020). The Process. Retrieved 2020, from http://temesirecycling.com/the-process/
Tsydenova, O., & Bengtsson, M. (2011). Chemical hazards associated with treatment of waste electrical and electronic equipment. Waste Management, 31(1), 45-58. doi:10.1016/j.wasman.2010.08.014
United States Environmental Protection Agency (USEPA). (2020). Advancing Sustainable Materials Management: 2020 Recycling Economic Information (REI) Report.
United States Environmental Protection Agency (USEPA). (2002). Campaigning Against Waste.
Ventosa, D., Forn, M., & Montserrat, M. (2010). La incineración de residuos en cifras: Análisis socio-económico de la incineración de residuos municipales en España. Greenpeace.
The Waste Group. (n.d.). Recycling Services. Retrieved 2020, from http://www.wastegroup.co.za/recycling-services/
Wilson, D. C., Rodic, L., Modak, P., Soos, R., Carpintero Rogero, A., Velis, C., et al. (2015). Global waste management outlook. United Nations Environment Programme.
The World Bank Group. (2013, August 21). In Azerbaijan: Managing Waste Safely. Retrieved 2020, from https://www.worldbank.org/en/results/2013/08/21/in-azerbaijan-managing-waste-safely
The World Bank. (2016). Morocco Lets Nothing Go To Waste. Retrieved 2020, from https://www.worldbank.org/en/news/feature/2016/02/16/morocco-lets-nothing-go-to-waste
The World Bank. (2018). Trends in Solid Waste Management. Retrieved 2020, from https://datatopics.worldbank.org/what-a-waste/trends_in_solid_waste_management.html
Zacho, K. O., Mosgaard, M., & Riisgaard, H. (2018). Capturing uncaptured values — A Danish case study on municipal preparation for reuse and recycling of waste. Resources, Conservation and Recycling, 136, 297-305. doi:10.1016/j.resconrec.2018.04.031
Appendix: Expanded notes on methodology and data collectionA summary of the data collected for this report can be found in Table 1, a graph of all collected data points can be seen in Figure 1, and a full list of data can be found in Table 2. In many cases, these data points were calculated by the authors based on raw tonnage and job data provided in the literature. Where possible, figures for full-time-equivalents (FTEs), rather than the total number of people employed, were used in the calculations. Part-time workers were assumed to be equivalent to half of an FTE, unless otherwise specified, and volunteers were excluded when calculating job figures to better capture the number of livelihoods supported by the waste stream. Classification of some of these figures was sometimes complicated by the fact that the definitions of the waste management processes covered in this publication varied from study to study.
Two studies, for example, included composting in their estimates for “recycling.” Where possible, estimates from the literature were disaggregated to best match the categories as defined in this report. Where disaggregation was not possible, figures were assigned only to the management process category that best fit the activities included in the figure. A figure that included jobs due to the processing of metals, plastics, paper and cardboard, and organic waste, for example, would have been classified as a “recycling” figure, given that the activities described better represented typical recycling activities than composting activities. Collection jobs included in recycling and composting job estimates were specific to the collection of recyclable and organic material.
Table A1: Number of Jobs in Zero Waste vs. Disposal-based Waste Management
Waste management process (from most beneficial for the environment to most harmful)
Mean Jobs/10,000 TPY Interquartile range* Number of data points
Repair 404 201-593 6
Recycling (all) 115 12-166 28
Recycling (semi-mechanized)
261 152-304 10
Recycling (highly-mechanized)
25 9-30 11
Remanufacturing 55 22-74 6
Compost 6.6 4.1-8.5 11
Disposal - Landfill 2.4 1-2.7 7
Disposal - Incineration 1.7 1-2.5 8
*A measure of the range of data collected

24 | Zero Waste and Economic Recovery The Job Creation Potential of Zero Waste Solutions | 25
Figure 1. Job production by waste management process. Each dot represents one study.
Table A2: Complete list of data points by location, with sources
Jobs/10,000 TPY Location ; SourceReuse 118 United States Institute for Local Self-Reliance, 2017Reuse 185 United Kingdomc; Friends of the Earth, 2010Reuse 250 Denmark Personal communications with Kristina Overgaard
Zacho at AVV Waste Management CompanyReuse 496 Sweden Personal communications with Sebastian Holstrom at
InregoReuse 625 Belgium Cools & Oosterlynck, 2015Reuse 750 Europe RREUSE, 2015Recycling (HM = Highly-mechanized; SM = semi-mechanized; DNS = Source did not specify or provide enough information to categorize)Recycling (SM) 4 Rabat, Morocco The World Bank, 2016Recycling (HM) 6 Denmark Zacho et al., 2018Recycling (HM) 8 San Francisco, United
StatesRecology, 2020
Recycling (HM) 9 United Kingdom Murray, 1999Recycling (HM) 9.2 Australia Access Economics, 2009Recycling (SM) 10 Baku, Azerbaijan The World Bank Group, 2013Recycling (DNS) 12 United Kingdom Pridmore et al., 2017Recycling (DNS) 12 European Union Pridmore et al., 2017
Jobs/10,000 TPY Location ; SourceRecycling (HM) 15.7 United States US EPA, 2020Recycling (HM) 20 Pretoria, South Africa The Waste GroupRecycling (HM) 20 United States Tellus Institute, 2011Recycling (DNS) 25 United Kingdom Pridmore et al., 2017Recycling (DNS) 25 United States Pridmore et al., 2017Recycling (HM) 27.3 United States Tellus Institute, 2011Recycling (HM) 32 San Fernando, Philippines Dayrit, 2019Recycling (DNS) 36 United States US EPA, 2002Recycling (HM) 36 European Union Corbin et al., 2015Recycling (DNS) 61 United Kingdom Pridmore et al., 2017Recycling (HM) 96 South Africa GroundWork South Africa. Making Waste Work.Recycling (SM) 141 Goa, India Danielson, 2020Recycling (DNS) 160 United Kingdom Murray, 1999Recycling (SM) 184 Buenos Aires, Argentina GAIA, 2019Recycling (SM) 288 Dois Irmãos, Brazil Danielson, 2020Recycling (SM) 292 São Paulo, Brazil Danielson, 2020Recycling (SM) 302 Londrina, Brazil Danielson, 2020Recycling (SM) 304 Bengaluru, India Danielson, 2020Recycling (SM) 527 Araraquara, Brazil Campos, 2019Recycling (SM) 555 Santiago, Chile Danielson, 2020Remanufacturing 8 United Kingdom Murray, 1999Remanufacturing 21 New York City, United
StatesMurray, 1999
Remanufacturing 25 United States ILSR, 2002Remanufacturing 72 United States Tellus Institute, 2011Remanufacturing 75 United States Seldman, 2015Remanufacturing 131 United States Tellus Institute, 2011Composting 3 Lahore, Pakistan Clean Development Mechanism, 2013Composting 4 European Union Pridmore et al., 2017Composting 4 United States Pridmore et al., 2017Composting 4.1 Maryland, United States Platt, 2013Composting 5 La Pintana, Chile Allen, 2012Composting 5 United States Tellus Institute, 2011Composting 6.2 Maryland, United States Platt, 2013
Composting 8 United States US EPA, 2020Composting 9 United Kingdom Murray, 1999Composting 10 United States US EPA, 2020Composting 14 Temesi, Indonesia Danielson, 2020Incineration 1 Pretoria, South Africa GroundWork, 2013Incineration 1 United States Murray, 1999Incineration 1 United States Tellus Institute, 2011Incineration 1 United States USEPA, 2002Incineration 1.2 Maryland, United States Platt, 2013Incineration 2.5 European Union Corbin et al., 2015Incineration 2.5 Spain Ventosa et al., 2010Incineration 3 United Kingdom Pridmore et al., 2017Landfill 1 Europe Pridmore et al., 2017Landfill 1 United Kingdom Pridmore et al., 2017Landfill 1 United States Tellus Institute, 2011Landfill 2.2 Maryland, United States Platt, 2013Landfill 2.5 European Union Corbin et al., 2015Landfill 2.8 Australia Access Economics, 2009Landfill 6 United States US EPA, 2002
Jobs per 10,000 tonnes per year
0 200 400 600 800
Incineration
Compost
Recycling - highly mechanized
Remanufacturing
Reuse
Recycling - mechanization uknown
Recycling - semi-mechanized
Landfill
26 | Zero Waste and Economic Recovery The Job Creation Potential of Zero Waste Solutions | 27
AcknowledgementsThis report is authored by John Ribeiro-Broomhead and Neil Tangri. It was edited by Natasha Naayem and Alexandra Rollings and designed by Shanthony Art & Design. Other contributors and reviewers include Cecilia Allen, Miko Aliño, Claire Arkin, Doun Moon, Niven Reddy, and Monica Wilson at GAIA; as well as Shlomo Dowen at the United Kingdom Without Incineration Network, Kira Erwin at the Durban University of Technology, Jack McQuibban at Zero Waste Europe, Xuan Quach at the Vietnam Zero Waste Alliance, Robert Reed at Recology, Ana Rocha at Nipe Fagio, and Siddika Sultana at the Environment and Social Development Organization.
This report has been made possible in part through funding from Plastic Solutions Fund. The views expressed in this publication do not necessarily reflect those of Plastic Solutions Fund.
DOI: www.doi.org/10.46556/GFWE6885
Also available at: http://zerowasteworld.org/zerowastejobs
Cite this report as:
Ribeiro-Broomhead, J. & Tangri, N. (2021). ZeroWaste and Economic Recovery: The Job CreationPotential of Zero Waste Solutions. Global Alliance for Incinerator Alternatives. www.doi.org/10.46556/GFWE6885
© 2021 Global Alliance for Incinerator Alternatives
1958 University Avenue, Berkeley, CA 94704, USA
www.no-burn.org
GAIA is a global network of more than 800 grassroots groups, NGOs, and individuals. We envision a just, zero waste world built on respect for ecological limits and community rights, where people are free from the burden of toxic pollution, and
resources are sustainably conserved, not burned or dumped. We work to catalyze a global shift towards environmental justice by strengthening grassroots social movements that advance solutions to waste and pollution.
Repair creates over 200 times as many
jobs as landfills and incinerators.
©Santiago Vivacqua/GAIA
©Rommel Cabrera/GAIA
©Santiago Vivacqua/GAIA
©Anto Astudillo/GAIA ©Focalize Media/GAIA

28 | Zero Waste and Economic Recovery