zilog, inc. - iis windows...
TRANSCRIPT

UNITED STATES SECURITIES AND EXCHANGE COMMISSION
Washington, D.C. 20549
FORM 10-K ⌧ ANNUAL REPORT PURSUANT TO SECTION 13 OR 15(d) OF THE SECURITIES EXCHANGE ACT OF 1934
For the fiscal year ended March 31, 2007 Commission File Number: 001-13748
ZiLOG, INC. (Exact name of Registrant as specified in its charter)
Delaware 13-3092996 (State or other jurisdiction of incorporation or organization) (I.R.S. Employer Identification Number)
532 Race Street, San Jose, CA 95126 (Address of principal executive offices) (Zip Code)
Registrant’s telephone number, in luding area code: (408) 558-8500 c
Securities registered pursuant to Section 12(b) of the Act:
Title of Each Class Name of Each Exchange on Which Required d Common Stock, $0.01 per share par value The NASDAQ Stock Market LLC (NASDAQ Global Market)
Securities registered pursuant to Section 12(g) of the Act: NONE
Indicate by check mark if the registrant is a well-known seasoned issuer, as defined in Rule 405 of the Securities Act. Yes No⌧ Indicate by check mark if the registrant is not required to file reports pursuant to Section 13 or Section 15(d) of the Exchange Act. Yes No ⌧ Indicate by check mark whether the Registrant (1) has filed all reports required to be filed by Section 13 or 15(d) of the Securities Exchange Act of
1934 during the preceding 12 months (or for such shorter period that the registrant was required to file such reports) and (2) has been subject to such filing requirements for the past 90 days. Yes ⌧ No
Indicate by check mark if disclosure of delinquent filers pursuant to Item 405 of Regulation S-K is not contained herein, and will not be contained, to the best of Registrant’s knowledge, in definitive proxy or information statements incorporated by reference in Part III of this Form 10-K or any amendment to this Form 10-K.
Indicate by check mark whether the registrant is a large accelerated filer, an accelerated filer, or a non-accelerated filer. See definition of “accelerated filer and large accelerated filer” in Rule 12b-2 of the Exchange Act.
Large accelerated filer Accelerated filer Non-accelerated filer ⌧
Indicate by check mark whether the registrant is a shell company (as defined in Rule 12b-2 of the Exchange Act) Yes No ⌧ As of September 30, 2006, the aggregate market value of the Registrant’s Common Stock held by non-affiliates of the Registrant was approximately $60,497,133 based on the closing sale price for shares of the Registrant’s Common Stock as reported on the NASDAQ Global Market. Shares of Common Stock held by each officer and director and by each person who owns 5% or more of the outstanding Common Stock have been excluded in that such persons may deemed to be affiliates. This determination of affiliate status is not necessarily a conclusive determination for other purposes.
Indicate by check mark whether the Registrant has filed all documents and reports required to be filed by section 12, 13 or 15(d) of the Securities Exchange Act of 1934 subsequent to the distribution of securities under a plan confirmed by a court. Yes ⌧ No At June 18, 2007, 16,887,904 shares of the Registrant’s Common Stock were outstanding.
DOCUMENTS INCORPORATED BY REFERENCE The Registrant’s definitive Proxy Statement for the Annual Meeting of Stockholders to be held on September 6, 2007 is incorporated by reference in Part III of this Form 10-K to the extent stated herein.
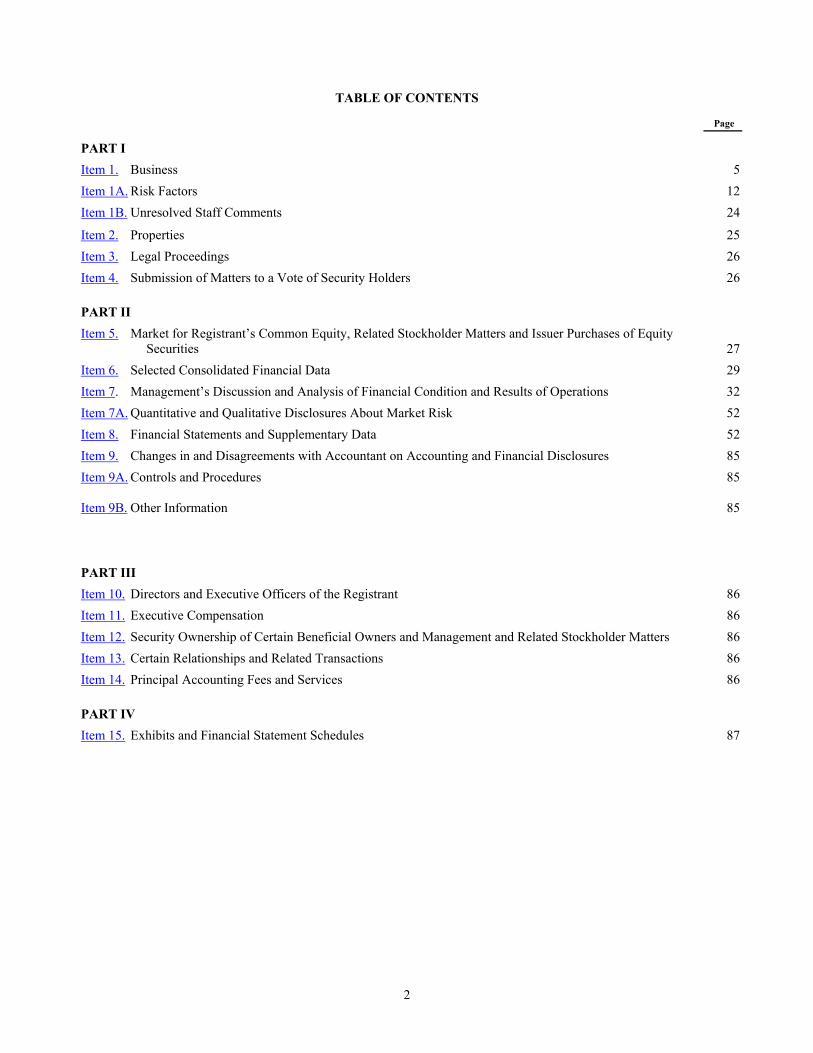
TABLE OF CONTENTS
Page
PART I
Item 1. Business 5
Item 1A. Risk Factors 12
Item 1B. Unresolved Staff Comments 24
Item 2. Properties 25
Item 3. Legal Proceedings 26
Item 4. Submission of Matters to a Vote of Security Holders 26
PART II
Item 5. Market for Registrant’s Common Equity, Related Stockholder Matters and Issuer Purchases of Equity Securities 27
Item 6. Selected Consolidated Financial Data 29
Item 7. Management’s Discussion and Analysis of Financial Condition and Results of Operations 32
Item 7A. Quantitative and Qualitative Disclosures About Market Risk 52
Item 8. Financial Statements and Supplementary Data 52
Item 9. Changes in and Disagreements with Accountant on Accounting and Financial Disclosures 85
Item 9A. Controls and Procedures 85 Item 9B. Other Information 85
PART III
Item 10. Directors and Executive Officers of the Registrant 86
Item 11. Executive Compensation 86
Item 12. Security Ownership of Certain Beneficial Owners and Management and Related Stockholder Matters 86
Item 13. Certain Relationships and Related Transactions 86
Item 14. Principal Accounting Fees and Services 86
PART IV
Item 15. Exhibits and Financial Statement Schedules 87
2

FORWARD-LOOKING STATEMENTS
Some of the statements under the sections entitled "Risk Factors" and "Management's Discussion and Analysis of Financial Condition and Results of Operations," and elsewhere in this Form 10-K, constitute forward-looking statements within the meaning of the Private Securities Litigation Reform Act of 1995, Section 27A of the Securities Act of 1933 and Section 21E of the Securities Exchange Act of 1934. In some cases, you can identify forward-looking statements by terminology such as “may”, “will”, “should”, “expects”, “anticipates”, “believes”, “estimates”, “potential”, “continue”, or the negative terms or other comparable terminology. These statements include:
• estimates of market growth; • capital expenditures;
• the adequacy of available cash;
• the cost or outcome of any litigation pending or threatened;
• the impact on recent accounting pronouncements; • any gross margin improvement resulting from our research and development effort; and
• the cost of compliance with environmental laws. These statements relate to future events or our future financial performance and involve known and may involve
unknown risks, uncertainties and other factors that may cause our actual results, levels of activity, performance or achievements to be materially different from any future results, levels of activity, performance or achievements expressed or implied by forward-looking statements including, but not limited to, prospects for future market growth. Other factors that may cause or contribute to differences include, but are not limited to, continued availability of third-party foundry and assembly services with commercially-reasonable quality and prices; under-absorption of manufacturing costs in our test and manufacturing support facilities from under-utilization of capacity; our distributors and customers significantly reducing their existing inventories before ordering new products and the costs associated with the Microchip lawsuit. In evaluating these statements, you should specifically consider various factors, including the risks outlined under "Risk Factors.”
Although we believe that the expectations in the forward-looking statements contained in this Form 10-K are reasonable, we cannot guarantee future results, levels of activity, and performance achievements. These forward-looking statements are based on our current expectations, and we disclaim any obligation to update these forward-looking statements for subsequent events or to explain why actual results differ unless otherwise required by law. You should not place undue reliance on these forward-looking statements.
Unless otherwise specified as a forward-looking statement, the information contained in this report is historical in nature and speaks as of the date of this report unless otherwise clearly indicated. We disclaim any obligation to update this information for subsequent events.
eriod Comparisons P
Our results of operations from May 1, 2002 are not comparable to our results of operations prior to May 1, 2002, due to our adoption of “fresh-start” reporting upon our emergence from bankruptcy as prescribed by the American Institute of Certified Public Accountant’s Statement of Position 90-7, “Financial Reporting by Entities in Reorganization Under the Bankruptcy Code.” Differences in our results of operations relate to depreciation of property, plant and equipment, amortization of intangible assets, interest expense and restructuring and reorganization expenses. Additionally, the differences in our consolidated balance sheets relate to inventory, in-process research and development, property, plant and equipment, intangible assets, conversion of senior notes to common stock and minority interest. Certain figures, such as net sales and certain expenses, were not affected by our adoption of fresh-start reporting and, accordingly, we believe them to be comparable.
Effective December 29, 2005, we changed our fiscal year end from December 31 to March 31. Our interim results are
based on fiscal quarters of thirteen weeks in duration ending on the last Saturday of each calendar quarter, with the exception
3

of the last quarter, which ends on March 31 beginning in fiscal 2006. The operating results for any interim period are not ecessarily indicative of results for any subsequent period or the full fiscal year. n
Based in San Jose, California, we were incorporated in California in December 1981 and reincorporated in Delaware in
April 1997. In this report, “ZiLOG,” “the Company,” “our,” “us,” “we,” and similar expressions refer to ZiLOG, Inc. and its subsidiaries. However, when these expressions are used throughout this report in connection with ZiLOG, Inc.’s reorganization under Chapter 11 of the U.S. bankruptcy code, they are referring only to the parent company, ZiLOG, Inc., and not to any of its subsidiaries. ZiLOG, eZ80, Z8Encore!, Z8Encore!XP, Z8Encore!MC, ZNEO and eZ80™ are registered trademarks of ZiLOG, Inc. and eZ80Acclaim! is a trademark of ZiLOG, Inc.
4

PART I ITEM 1. BUSINESS
BUSINESS
ur Business O
We are a fabless semiconductor supplier of microprocessor and microcontroller semiconductor devices that we refer to as micrologic products. A microcontroller is a computer-on-a-chip that is optimized to control electronic devices, such as motors, remote controllers and user interfaces on appliances. A microcontroller typically includes a central processing unit, non-volatile program memory, random access memory for data storage and various peripheral capabilities. The microcontroller is offered as a complete solution because it incorporates application-specific software provided by the customer and may include specialized peripheral device controllers and internal or external non-volatile memory components to enable the storage and access of additional program software.
ZiLOG was founded in 1974 by Federico Faggin who co-invented the microprocessor. We design, develop, test and
market a portfolio of these devices for a variety of applications used in consumer electronics, home appliances, security systems, point-of-sale terminals, personal computer peripherals, personal health and medical products.
We introduced our first products in the mid-1970’s and have since established a globally recognized brand. We sell our
devices directly to a diverse customer base of Original Equipment Manufacturers (“OEMs”) for general purpose use or for use in application specific end markets. Additionally, we sell our devices to distributors who generally provide logistical and post sales support to these customers.
We continue to invest in the development of our 8 and 16-bit portfolio of products, including derivatives of our Z8
Encore!, Z8Encore!XP, Motor control and eZ80 Acclaim! product families. These devices are designed to incorporate reprogrammable flash memory and enhanced peripherals with features that may allow such functionality as power management, sensing secure transactions and connectivity.
Additionally, we now offer an integrated 32-bit ARM based microprocessor with secured transaction technology
currently servicing the point-of-sale market. Our Industry
Microcontroller devices have been incorporated into a wide variety of products in markets including consumer electronics, home appliances, security systems, point-of-sale terminals and personal computer peripherals, as well as industrial and automotive applications. Microcontrollers are generally segmented by word length, which is measured in bits ranging from 4-bit through 32-bit architectures. Although 4-bit microcontrollers are relatively inexpensive, they generally lack the minimum performance and features required for product differentiation and are typically used only to produce basic functionality in products. While traditional 16 and 32-bit architectures are typically higher performance, they can be too expensive for many high-volume embedded control applications, typically costing two to four times the cost of an 8-bit microcontroller. Manufacturers will choose the appropriate microcontroller based on cost, performance and functionality. Microcontrollers are used broadly in over 100 different market categories for specific and general purpose applications.
Analysts estimate the 8-bit market to be in excess of $4 billion per year with the fastest growing element of that market
being embedded flash. We believe that 8-bit microcontrollers are generally perceived as the most cost-effective embedded control solution for high volume requirements. High-volume microcontrollers available today are Read Only Memory (“ROM”) or One-Time Programmable (“OTP”), which typically require longer delays and greater costs in order to implement customer application code changes as compared to embedded flash with reprogrammable capabilities. ROM and OTP products generally result in longer lead times for delivery of such microcontrollers. In addition to delayed product introduction, these longer lead times can result in potential inventory obsolescence and disruptions to customers’ factory production when changes in the application code are required by the customer. To address some of these issues, suppliers may offer OTP-based microcontrollers that can be configured by the customer in the customer’s manufacturing line, thus minimizing lead-time and inventory risks if the customer’s application code requires changes. Furthermore, flash memory offers the flexibility of in-product re-programmability. While these flash-based microcontrollers were initially expensive relative to ROM and OTP-based microcontrollers, manufacturing technology has evolved over the past years to the point where the premium for flash microcontrollers over ROM and OTP-based microcontrollers can be minimal.
5
Our Strategy The key elements of our strategy are: Deliver Complete Solutions to Our Customers We are focused on providing advanced semiconductor solutions that assist our customers in adding functionality and
enhancing the performance of their products. Partner with Third Party Manufacturers to Leverage Scale Our manufacturing strategy is to utilize third-party wafer foundries to manufacture our devices. We believe outsourcing
the manufacturing process enables us to access advanced technologies and reduce our manufacturing costs. This strategy allows us to focus greater resources on product design, systems and software development and customer support. In line with this strategy, during 2002 and 2004 we closed our wafer manufacturing facilities in Nampa, Idaho, and migrated production of these products to our wafer foundry suppliers. Our new products are sourced from TSMC and UMC in Taiwan and our legacy products are sourced from X-FAB in Lubbock, Texas.
Products and Applications
We design, develop, and market a broad portfolio of micrologic semiconductor devices for embedded control and communication applications used in consumer electronics, home appliances, security systems, point-of-sale terminals, personal computer peripherals and industrial and automotive applications.
Our products offer our customers the ability to integrate peripheral functions (such as network connectivity, timers,
serial communication, analog to digital conversion, infrared data transmission and display drivers) on our micrologic devices. These additional functions enhance the capabilities of the customer’s end product, which can lower their overall systems costs. These peripherals incorporate functionality, which may otherwise be found in a separate chip, on the printed circuit board to which the micrologic device is attached.
We combine different microprocessors, memories and peripheral functions to create devices specifically tailored to
meet the requirements of targeted vertical markets.
Customers, Sales and Marketing
Introduction
To market our products, we utilize a well-trained, direct and distribution sales force, a customer-centric website, technical documentation that includes product specifications and application notes, development tools and reference designs, sales promotional materials, targeted advertising and public relations activities, and involvement in key trade shows and technical conferences in North America, Europe and Asia. Our direct sales force and our sales representatives cover various geographic locations in the Americas, Europe and Asia.
Sales Process
Through direct sales and distributors we have developed relationships with customers, including large OEMs and end users. By collaborating with customers in an interactive product design and development process, we have been able to establish long-standing relationships, which help us solidify our customer base and define our next generation products.
We work closely with our customers in identifying opportunities for the customer to pursue end product designs using
our devices. The customer’s decision to design an end product using our devices is based upon technical and financial factors, including microprocessor performance, memory, peripheral options, pre-existing customer relationships, financial stability and pricing. Typically, a customer’s product architects and design engineers will use our proprietary development tools over a period of many months, or longer, to design an end product and test the design using our devices before making a decision.
6
We classify a design win as the point at which the customer has placed orders to purchase a minimum of $1,000 of product. Once we have achieved a design win, we deliver a limited production of the device to our customer. Product prototypes are then created and tested. If the decision is made to produce the product for sale, we will receive a full production order. The entire cycle from design win to full production typically takes between 12 and 18 months, although it may take much longer. After a design win is achieved, our sales are generally made pursuant to short-term cancelable purchase orders that can be cancelled upon 30 to 60 days notice. As a result, design wins are not necessarily an accurate or reliable indication of future net sales.
Direct Sales Force
Our direct sales force focuses on the Americas, Europe and Asia. We have offices located in the metropolitan areas of
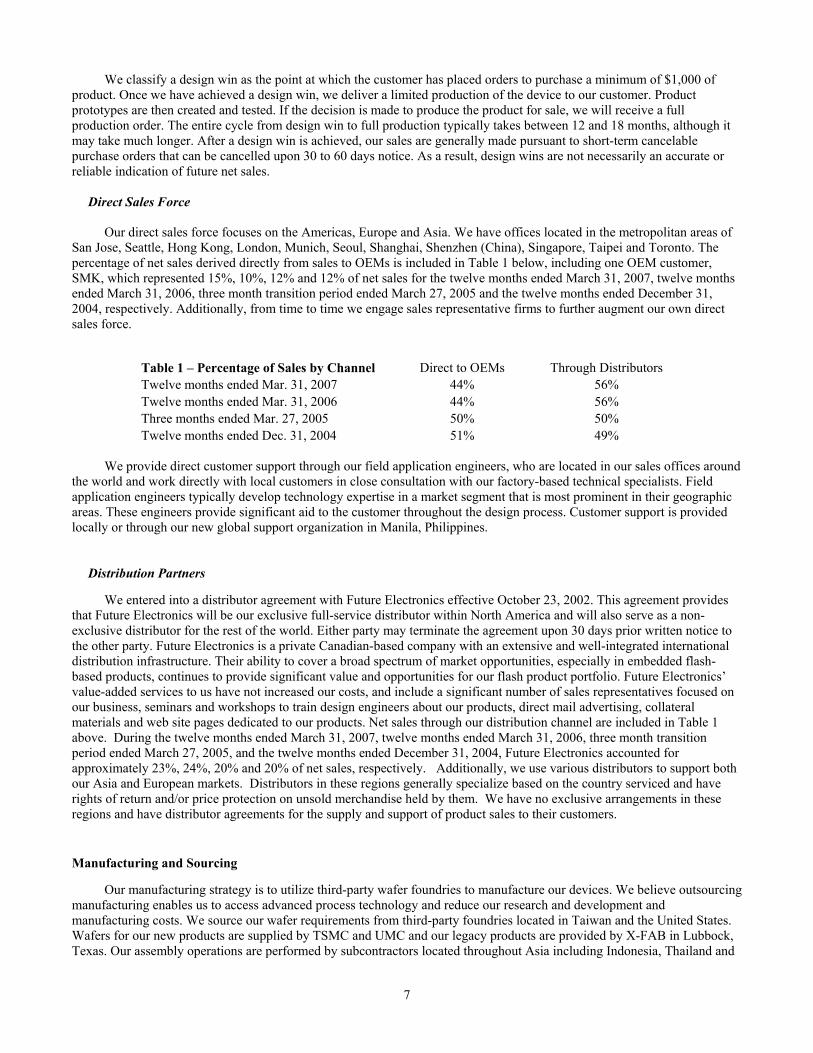
San Jose, Seattle, Hong Kong, London, Munich, Seoul, Shanghai, Shenzhen (China), Singapore, Taipei and Toronto. The percentage of net sales derived directly from sales to OEMs is included in Table 1 below, including one OEM customer, SMK, which represented 15%, 10%, 12% and 12% of net sales for the twelve months ended March 31, 2007, twelve months ended March 31, 2006, three month transition period ended March 27, 2005 and the twelve months ended December 31, 2004, respectively. Additionally, from time to time we engage sales representative firms to further augment our own direct sales force.
Table 1 – Percentage of Sales by Channel Direct to OEMs Through Distributors Twelve months ended Mar. 31, 2007 44% 56% Twelve months ended Mar. 31, 2006 44% 56% Three months ended Mar. 27, 2005 50% 50% Twelve months ended Dec. 31, 2004 51% 49%
We provide direct customer support through our field application engineers, who are located in our sales offices around
the world and work directly with local customers in close consultation with our factory-based technical specialists. Field application engineers typically develop technology expertise in a market segment that is most prominent in their geographic areas. These engineers provide significant aid to the customer throughout the design process. Customer support is provided locally or through our new global support organization in Manila, Philippines.
Distribution Partners
We entered into a distributor agreement with Future Electronics effective October 23, 2002. This agreement provides
that Future Electronics will be our exclusive full-service distributor within North America and will also serve as a non-exclusive distributor for the rest of the world. Either party may terminate the agreement upon 30 days prior written notice to the other party. Future Electronics is a private Canadian-based company with an extensive and well-integrated international distribution infrastructure. Their ability to cover a broad spectrum of market opportunities, especially in embedded flash-based products, continues to provide significant value and opportunities for our flash product portfolio. Future Electronics’ value-added services to us have not increased our costs, and include a significant number of sales representatives focused on our business, seminars and workshops to train design engineers about our products, direct mail advertising, collateral materials and web site pages dedicated to our products. Net sales through our distribution channel are included in Table 1 above. During the twelve months ended March 31, 2007, twelve months ended March 31, 2006, three month transition period ended March 27, 2005, and the twelve months ended December 31, 2004, Future Electronics accounted for approximately 23%, 24%, 20% and 20% of net sales, respectively. Additionally, we use various distributors to support both our Asia and European markets. Distributors in these regions generally specialize based on the country serviced and have rights of return and/or price protection on unsold merchandise held by them. We have no exclusive arrangements in these regions and have distributor agreements for the supply and support of product sales to their customers.
Manufacturing and Sourcing
Our manufacturing strategy is to utilize third-party wafer foundries to manufacture our devices. We believe outsourcing manufacturing enables us to access advanced process technology and reduce our research and development and manufacturing costs. We source our wafer requirements from third-party foundries located in Taiwan and the United States. Wafers for our new products are supplied by TSMC and UMC and our legacy products are provided by X-FAB in Lubbock, Texas. Our assembly operations are performed by subcontractors located throughout Asia including Indonesia, Thailand and
7

the Philippines, while a significant amount of our wafer probe and final product testing is conducted at our test and global support facility located in Manila, Philippines.
The SGS International Certification Services AG of Zurich, Switzerland granted an ISO 9001 certification to our
Philippines test facility. ISO certifications reflect the stringent quality standards to which all of our products are manufactured. We believe that these certifications enhance the reputation and quality of our products.
esearch and Development R
Our research and development expenditures have been focused on the design and development of 8 and 16-bit
embedded flash-based microcontrollers, including our Z8 Encore! Z8 Encore XP, Z8 Encore MC, ZNEO and eZ80 Acclaim! families of products. Additionally, we have focused our development resources on our Crimzon family of devices for the universal remote control market and our portfolio of 32-bit ARM based products.
Research and development expenditures were $20.5 million, $21.0 million, $5.2 million and $20.9 million for the
twelve months ended March 31, 2007, twelve months ended March 31, 2006, the three month transition period ended March 27, 2005, and the twelve months ended December 31, 2004, representing 25%, 27%, 26% and 22% of net sales, respectively. During the twelve months ended March 31, 2007, twelve months ended March 31, 2006, the three month transition period ended March 27, 2005, and the twelve months ended December 31, 2004, our research and development expenditures were focused largely on our embedded flash products, including our family of flash-based microcontrollers, new devices and software features for our Crimzon line of consumer solution products concentrated in the infrared remote control market segment and our 32-bit ARM based family of products, which are initially focused on the secured transactions point-of-sale market. Competition
The semiconductor industry is highly competitive and is characterized by price erosion and the rapid technological changes in many markets. The industry consists of major domestic and international semiconductor companies, many of which have substantially greater resources than we do with which to pursue engineering, manufacturing, marketing and distribution of their products. Emerging companies are also expected to increase their participation in the semiconductor market.
We compete on a global basis with other micrologic device manufacturers who target the same specific market
segment. We believe the primary bases for competition include: price, technological sophistication, customer relationships, support tools, familiarity with micrologic architecture and existing customer investment in system software based on a particular architecture. In many instances, our competitors have similar competitive strengths to us and have significantly more resources than we do. Many of our competitors are much larger than we are, with broad product offerings in many sectors.
Our current and future products compete with, or may compete with, products offered by Atmel, Cypress
Semiconductor, Freescale, Microchip, Renasas, Samsung, STMicroelectronics and Universal Electronics, Inc., among others.
Backlog
Our total backlog of cancelable customer orders was $10.0 million at March 31, 2007, $17.3 million at March 31, 2006, $13.0 million at March 27, 2005 and $13.6 million at December 31, 2004. Our sales are generally made pursuant to short-term cancelable purchase orders that are cancelable upon 30 to 60 days notice rather than long-term contracts. As a result, our backlog may not be an accurate measure of net sales or operating results for any period. Additionally, during times of economic downturn there tends to be excess capacity in the marketplace, driving shorter lead time expectations which often results in a higher percentage of book-ship (or turns) business in the period.
Patents and Licenses We currently have 191 U.S. and non-U.S. patents as of March 31, 2007, which expire between fiscal years 2008 and 2026.
We employ a combination of patents, copyrights, mask-work rights, trademarks and trade secrets, as well as contractual restrictions, to protect the proprietary aspects of our business and devices. In addition to our own intellectual property, we license technologies and products from others, as necessary, to provide second sources for standard products or
8
to obtain rights to cores, cells or other technology. We often enter into agreements to incorporate into our designs the intellectual property of third parties. Such agreements may impose certain obligations or limitations on our use or disclosure of, such intellectual property or the enforcement of our own intellectual property. We hold numerous U.S. and foreign patents and have additional U.S. and foreign patent applications pending. We also hold numerous mask works, copyrights to protect proprietary software employed in our devices and trademarks. We intend to continue investing in the protection of our intellectual property through the filing of patent applications and, if appropriate, the registration of copyrights, mask-works and trademarks. Nevertheless, we believe that our continued success depends primarily on the technological skills and innovative abilities of our personnel and our ability to rapidly commercialize product developments. Thus, we believe that the loss of any one of our patents or trade secrets would not materially affect our core business.
The extent and value of our intellectual property is necessarily uncertain. While we intend to protect our intellectual property rights vigorously, our efforts may not be successful. Despite our precautions, a third party may copy, or otherwise obtain, our devices or technology without authorization, requiring patent litigation to enforce our rights. Patent litigation is, by its nature, expensive and unpredictable. If litigated, one or more of our patents may be found invalid or unenforceable or to have claims of such narrow scope as to be of little economic value. Third parties may design around our patents. Third parties may independently develop technology similar to our trade secrets. In addition, the laws of some foreign countries where we have patent and trademark rights may not protect our intellectual property rights to the same extent as the laws of the United States. Additionally, our pending and future patent applications should not be relied upon as they may not issue as patents, and even if they do issue, such future patents may not be of sufficient scope or strength to provide meaningful economic or competitive value.
The semiconductor industry is characterized by frequent litigation regarding patent and other intellectual property rights, both defensive and offensive. From time to time we have received, and may in the future receive, communications from third parties asserting that a product offered by us, or an aspect of our business, infringes a patent held by the third party and/or require a license thereto. With respect to those third party communications that are currently pending but which have not yet been filed as a lawsuit, we believe, after having consulted with counsel, that either (i) we have meritorious defenses, (ii) based on license terms previously offered to us or typically available in the industry, we can obtain any necessary licenses on commercially reasonable terms, or (iii) we can modify our products to avoid such rights, but in any case, we may be sued and assessed damages for past infringement. Indeed, licenses may not be available on commercially reasonable terms, or at all. In addition, we have certain indemnification obligations to customers with respect to such claims of infringement of third party intellectual property rights by our devices. Should it become necessary to engage in litigation to defend against such assertions, such litigation could be expensive and time consuming. There can be no assurance that the ultimate resolution of these matters would not have a material adverse affect on our business. On August 11, 2005, Microchip Technology, Inc. (“Microchip”) filed a patent infringement claim against the Company in the U.S. District Court of Arizona (case number CV05-2406-PHX-MHM). Microchip alleges that the Company has infringed, and currently infringes, its patents numbered 5,847,450, 6,696,316 and 6,483,183. Microchip claims that unspecified products of the company, including the Z8 Encore! XP 4K Series of products, infringe these patents and is seeking preliminary and permanent injunctive relief, unspecified damages and costs, including attorneys’ fees. We filed a response to the claims on September 15, 2005 generally denying the claims and challenging the validity of the patents. A hearing was scheduled for November 17, 2005. On January 10, 2006, the Company filed a request for patent re-examination with the U.S. PTO, which was granted in February and March 2006 for all 3 patents. On March 13, 2006, the Company was informed that its motion to stay with the Federal Court of Arizona was granted until such time as Microchip is informed of the outcome of the re-examinations. We do not believe it is feasible to predict or determine the outcome or resolution of this litigation at this time. We believe we have meritorious defenses and will defend ourselves against these claims vigorously. We may incur substantial expenses in our defense against these claims. In the event of a determination adverse to us, we may incur substantial monetary liabilities and be required to change our business practices. Either of these could have a material adverse effect on our financial position, results of operations and/or cash flows.
Intellectual property lawsuits are subject to inherent uncertainties due to the complexity of the technical issues involved, and we may not be successful in defending ourselves against intellectual property claims. The cost of defending against patent infringement or other intellectual property litigation, in terms of management time and attention, legal fees and product delays, could be substantial, whatever the outcome. If any patent or other intellectual property claims against us are successful, we may be prohibited from using the technologies subject to these claims, and if we are unable to obtain a license on acceptable terms, license a substitute technology, or design new technology to avoid infringement, we could be prohibited from using or selling the infringing products or technologies and be required to pay substantial damages. Such a result could have a material adverse effect on our business. Conversely, we also enforce our intellectual property rights where appropriate, consistent with business considerations.
9

E
mployees
As of March 31, 2007, we had 568 full time employees, comprised of approximately 256 in manufacturing-related activities, 178 in engineering, 65 in sales and marketing and 69 in general and administrative functions, including Finance,
R, IT and facilities, of which a total of 45 are located in our global support facility in Manila, Philippines. H
Our employees are not represented by any collective bargaining organization. E
nvironmental
Any failure by us to control the use of, or adequately restrict the discharge of, hazardous substances could subject us to future liabilities that could materially harm our business, including under laws and regulations that impose liability and clean-up responsibility for releases of hazardous substances into the environment. Until 2005, we operated a wafer fabrication facility, until February 2006, we owned and operated an 8-inch wafer manufacturing facility and until April 2007, we owned and operated a 5-inch wafer manufacturing facility in Nampa, Idaho. Our manufacturing processes at these facilities required us to use various hazardous substances, and, as a result, we were subject to a variety of environmental laws and regulations governing the storage, use, emission, discharge and disposal of, and human exposure to, such substances. In particular, the process of manufacturing silicon wafers used large amounts of corrosive and other hazardous chemicals and huge quantities of distilled, de-ionized water.
Recently, laws and regulations have been enacted in several European Union member countries, including several
jurisdictions in which we operate, restricting the presence of certain substances in electronic products and holding producers of those products financially responsible for the collection, treatment, recycling and disposal of certain products. Specifically, the European Union has enacted the Restriction of the Use of Certain Hazardous Substances in Electrical and Electronic Equipment, or RoHS, and the Waste Electrical and Electronic Equipment, or WEEE, directives. The RoHS directive prohibits the use of certain substances, including lead, mercury, cadmium and chromium, in covered products placed on the market after July 1, 2006. The WEEE directive obligates parties that place electrical and electronic equipment onto the market in the European Union to clearly mark the equipment, register with and report to European Union regulators regarding distribution of the equipment, and provide a mechanism to recall and properly dispose of the equipment. Each European Union member country has enacted, or is expected to soon enact, legislation clarifying what is and what is not covered by the WEEE directive in that country. However, there is still some uncertainty in certain European Union countries as to which party involved in the manufacture, distribution and sale of electronic equipment will be ultimately held responsible. If we are deemed to be a manufacturer of covered products, we may be required to register as a producer in certain European Union countries, and incur financial responsibility with respect to products sold within the European Union, including products of other manufacturers that have been replaced by our products. We may also incur substantial costs to change our contract partners manufacturing processes, redesign or reformulate, and obtain substitute components for, our products that are deemed covered products under the ROHS directive. If we fail to timely provide RoHS-compliant products, we will not be able to offer our products within European Union, and we may be subject to civil or criminal liabilities. Similar laws have been proposed and may be enacted in other locations where we sell our products, including various jurisdictions within the United States and China. We will need to ensure that we comply with such laws and regulations as they are enacted, and ensure, as appropriate or required, that our component suppliers also timely comply with such laws and regulations. If we fail to timely comply with such laws, we could face sanctions for such noncompliance and our customers further may refuse to purchase our products, which would have a material adverse effect on our business, financial condition and results of operations.
With respect to environmental remediation, we could incur substantial costs for the clean up of contaminated
properties, either those we own or operate or to which we have sent wastes in the past. Under certain of these laws and regulations, current or previous owners or operators of property may be liable for cleanup costs and other damages without regard to whether they knew of, or caused, the contamination. The presence of, or failure to remediate, contamination could materially adversely affect the value of, and the ability to transfer or encumber, our property. In addition, we may be required to incur significant expense in connection with governmental investigation of environmental or employee health and safety matters.
10

Available Information
The Company’s annual reports on Form 10-K, quarterly reports on Form 10-Q, current reports on form 8-K and all
amendments to those reports are available free of charge on the Company’s website through www.zilog.com, as soon as reasonably practicable after such material is electronically filed with, or furnished to, the Securities and Exchange Commission “SEC”. Information contained on our web site is not part of this annual report on Form 10-K.
Alternatively, you may read and copy any materials filed with the SEC at the SEC’s Public Reference Room at 450 Fifth Street, NW. Washington, DC 20549 or access the information on the SEC’s website at www.sec.gov. Additional information regarding operation for the Public Reference Room can be obtained by calling the SEC at 1-800-SEC-0330.
In addition, you may request a copy of these filings (including exhibits) at no cost by writing us at our principal offices at 532 Race Street, San Jose, CA 95126, attention: Investor Relations, or by calling (408)558-8500 prior to July 9, 2007 or at 6800 Santa Teresa Blvd., San Jose, CA 95119 or by calling (408)513-1500 on or after July 9, 2007.
11

ITEM 1A. RISK FACTORS
RISK FACTORS
Risks Related to Our Business and Industry
The following risk factors should be considered carefully in addition to the other information in the Form 10-K. The risks described below are the ones we deem to be material to our business, but are not the only ones we face. Additional risks we are not presently aware of or that we currently believe are immaterial may also impair our business operations. If any of these risks actually occur, our business could be harmed materially.
We have experienced declines in net sales, and, if we fail to implement our new product strategy, we may continue to experience declines in sales and gross margins.
In each of the past four years, our net sales have fluctuated significantly and our future financial results are anticipated to be subject to substantial fluctuations. Our total net sales were $82.0 million for the twelve months ended March 31, 2007, $78.8 million for the twelve months ended March 31, 2006 and $95.6 million for the twelve months ended December 31, 2004. We anticipate that sales of our legacy products will continue to decline over time. Our future financial performance and success are largely dependent on our ability to implement our new product strategy, which consists partly of refocusing our business on micrologic products built around our core 8-bit micrologic architecture, beginning with the Z8 Encore! and eZ80 Acclaim! flash products. In November 2002 we launched our new 8-bit Z8 Encore! micrologic product, in February 2003 we launched our eZ80 Acclaim! micrologic product and in March 2004, we launched our enhanced Z8 Encore! XP flash product family. These products typically have a long lead time from design to production, which can range from twelve months to thirty-six months. These flash products represented approximately 16% of our net sales for the twelve months ended March 31, 2007, and we currently expect the contribution of these products to continue to grow. If we are unable to develop new products in a manner that timely meets changing market requirements, or if we are not able to achieve significant sales of our 8-bit micrologic products for any reason, our product strategy may fail and our net sales and operating results may continue to decline or not grow as currently expected. In addition, as we introduce new products, including our flash and IR products, we experience additional start up costs and unfavorable manufacturing prices due to low volume. In addition, we do not expect margins on our flash products to be as strong as those on our legacy products for the foreseeable future. Consequently, the introduction of new products could have a negative impact on our gross margin even if sales from such new products offset declining revenues from our legacy products.
If we are unable to obtain adequate production capacity or quality, our business will be harmed.
We rely on independent third-party foundry manufacturers, including X-FAB, TSMC and UMC, to fabricate wafers for all of our product needs. Industry-wide shortages in foundry capacity could harm our financial results. We have recently begun experiencing delays in lead times of our wafer starts at TSMC. If we are unable to obtain the requisite foundry capacity to manufacture our products, or if we have to pay higher than anticipated prices to foundries in periods of tight capacity, we may not be able to meet our customers’ demand for our products. Any delay in initiating production at third-party foundries, any inability to have new products manufactured at such foundries, or any failure to meet our customers’ demands, could damage our relationships with our customers and may decrease our sales.
Other significant risks associated with relying on these third-party foundries include:
• reduced control over the cost of our products, delivery schedules, capacity constraints and product quality;
• limited warranties on wafers or products supplied to us;
• increased exposure to potential misappropriation of our technology;
• yield or quality issues with the supplier which could result in us being unable to supply product to customers or providing product that does not meet their quality or performance standards;
• vulnerability to third-party foundries’ financial, operations or production difficulties; and
• the time and cost associated with switching or sourcing alternate foundries.
12

We may require additional capital in the future and additional funds may not be available on terms acceptable to us.
Based on our existing financial plans and forecasts, we believe that our existing cash and cash equivalents will be sufficient to meet our planned capital needs for the next twelve months. However, it is possible that we may need to raise additional capital to fund our future activities. We may be able to raise these funds by selling securities to the public or selected investors, or by borrowing money. We may not be able to obtain additional funds on favorable terms, or at all. If adequate funds are not available on acceptable terms, we may be required to curtail our operations significantly, reduce planned capital expenditures and research and development, make selective dispositions of our assets or obtain funds through arrangements with strategic partners or others that may require us to relinquish rights to certain technologies or potential markets, or otherwise impair our ability to remain competitive.
We could be required to incur significant capital expenditures for test and information technology and equipment to remain competitive, the failure, inadequacy or delayed implementation of which, could harm our ability to effectively operate our business.
Our capital expenditures were $2.1 million for the twelve months ended March 31, 2007, $4.2 million for the twelve months ended March 31, 2006 and $4.4 million for the twelve months ended December 31, 2004. We may be required to increase our future capital expenditures to meet increased demand.
Semiconductor manufacturing has historically required, and in the future is likely to continue to require, a constant upgrading of process technology to remain competitive, as new and enhanced semiconductor processes are developed which permit smaller, more efficient and more powerful semiconductor devices. Even though we outsource our manufacturing, we are required to spend funds on mask designs and process technology improvements to remain competitive. We maintain certain of our own test facilities which have required, and will continue to require, investments in test technology and equipment.
We also may incur significant costs to implement new test equipment and information technologies to increase our productivity and efficiency. Any such implementation, however, can be negatively impacted by failures or inadequacies of the new test or information technology and unforeseen delays in its implementation, any of which may require us to spend additional resources to correct these problems or, in some instances, to conclude that the new technology implementation should be abandoned. In the case of abandonment, we may have to recognize losses for amounts previously expended in connection with such implementation that have been capitalized on our consolidated balance sheets.
There can be no assurances that we will have sufficient capital resources to make necessary investments in test equipment or information technology and equipment.
Interruptions in information technology systems could affect our business.
We rely on the efficient and uninterrupted operation of complex information technology systems and networks to operate our business, especially between the Philippines and our San Jose, California headquarters. Any significant system or network disruption, including but not limited to computer viruses, security breach and energy blackouts, could have a material adverse impact on our operations, sales and operating results. We have implemented measures to manage our risks related to such disruptions, but such disruptions could negatively impact our operations and financial results. In addition, we may incur additional costs to remedy the damages caused by these disruptions or security breaches. If we are unable to prevail in a patent litigation lawsuit we may incur substantial monetary liability and may be required to change our business practices. On August 11, 2005, Microchip Technology, Inc. (“Microchip”) filed a patent infringement claim against the Company in the U.S. District Court of Arizona (case number CV05-2406-PHX-MHM). Microchip alleges that the Company has infringed, and currently infringes, its patents numbered 5,847,450, 6,696,316 and 6,483,183. Microchip claims that unspecified products of the company, including the Z8 Encore! XP 4K Series of products, infringe these patents and is seeking preliminary and permanent injunctive relief, unspecified damages and costs, including attorneys’ fees. We filed a response to the claims on September 15, 2005 generally denying the claims and challenging the validity of the patents. A hearing was scheduled for November 17, 2005. On January 10, 2006, the Company filed a request for patent re-examination with the U.S. PTO, which was granted in February and March 2006 for all 3 patents. On March 13, 2006, the Company was informed that its motion to stay with the Federal Court of Arizona was granted until such time as Microchip is informed of the outcome of the re-examinations. We do not believe it is feasible to predict or determine the outcome or resolution of this litigation at this
13

time. We believe we have meritorious defenses and will defend ourselves against these claims vigorously. We may incur substantial expenses in our defense against these claims. In the event of a determination adverse to us, we may incur substantial monetary liabilities and be required to change our business practices. Either of these could have a material adverse effect on our financial position, results of operations and/or cash flows. We do not believe it is feasible to predict or determine the outcome or resolution of this litigation at this time. We believe we have meritorious defenses and will defend ourselves against these claims vigorously. We may incur substantial expenses in our defense against these claims. In the event of a determination adverse to us, we may incur substantial monetary liabilities and be required to change our business practices. Either of these could have a material adverse effect on our financial position, results of operations and/or cash flows. We depend on third-party assemblers throughout Asia, including Indonesia, Thailand and the Philippines, and the failure of these third parties to continue to provide services to us on sufficiently favorable terms could harm our business. We use outside contract assemblers in Indonesia, Thailand and the Philippines for packaging our products. These countries have been subject to political instability and terrorist activities. The packaging of semiconductors is a complex process requiring, among other things, a high degree of technical skill and advanced equipment. If we are unable to obtain additional assembly capacity on sufficiently favorable terms, our ability to maintain or grow our net sales could be impaired. Shortages in contract assembly capacity could cause shortages in our products and could also result in the loss of customers as a result of delays. Because we rely on these third parties, we also have less control over our costs, delivery schedules and quality of our products and our technology is at greater risk of misappropriation.
Our success depends on our ability to introduce new products on a timely basis.
Our operating results depend on our ability to introduce and sell new products on a timely basis that can compete effectively based on price and performance and that address customer requirements. Rapidly changing technologies and industry standards, along with frequent new product introductions, characterize the industries that are currently the primary end-users of semiconductors. As these industries evolve and our customers and potential customers introduce new products, our success will depend on our ability to adapt to such changes in a timely and cost-effective manner by designing, developing, manufacturing, marketing and providing customer support for new products and technologies. In the past, we have brought products to market on an untimely basis or canceled the introduction of previously planned products, such as our Cartezian line of 32-bit microprocessors. Our ability to introduce and sell new products successfully depends on several factors, including:
• development of support tools and technical documentation that make complex products easy for engineers to understand and use;
• proper new product selection;
• timely completion and introduction of new product designs;
• support from our foundry service providers;
• complexity of the new products to be designed and manufactured; and
• market acceptance of our products and our customers’ products.
The emphasis of our new product development is on products built on our 8, 16 and 32-bit micrologic architectures. If market demand for these products does not develop as we anticipate, our product development strategy could fail. Because our products are complex, we may not meet the design and introduction schedules for any new products or any additions or modifications to our existing products, and these products may not achieve market acceptance. In addition, we may not be able to sell these products at prices that are favorable to us.
We may be unable to make the substantial research and development investments required to remain competitive in our business. The semiconductor industry requires substantial investment in research and development in order to develop and bring to market new and enhanced technologies and products. We intend to maintain spending on new product development in order to stay competitive in our markets. There can be no assurances that we will have sufficient resources to maintain the level of investment in research and development that is required to remain competitive.
14

Our industry is highly competitive, and we may not be able to compete effectively.
The semiconductor industry is intensely competitive and is characterized by price erosion, rapid technological change and heightened competition in many markets. The industry consists of major domestic and international semiconductor companies, many of which have substantially greater financial and other resources than we do with which to pursue engineering, manufacturing, marketing and distribution of their products. Emerging companies are also increasing their participation in the semiconductor industry. Our current and future products compete with, or may compete with, products offered by Atmel, Cypress Semiconductor, Microchip, Freescale, Renasas, Samsung, ST Microelectronics and Universal Electronics, Inc., among others. Some of our principal products, such as the Z80 microprocessor, are licensed by our competitors, or are in the public domain, and can be manufactured and sold to our customers by our competitors, possibly with added features or at lower prices than we charge. Our ability to compete successfully in our markets depends on factors both within and outside of our control, including:
• our ability to design and manufacture new products that implement new technologies, including our 8-bit eZ80 Acclaim!, Z8 Encore! and 32-bit ARM based product families;
• our ability to protect our products by effectively utilizing intellectual property laws;
• our product quality, reliability, ease of use and price;
• the diversity of our product line and feature sets within our products;
• our efficiency of production;
• our ability to obtain adequate supplies of raw materials and other supplies at acceptable prices;
• the pace at which customers incorporate our devices into their products; and
• the success of our competitors’ products and general economic conditions.
Our quarterly operating results are likely to fluctuate and may fail to meet expectations, which may cause the price of our securities to decline. Our quarterly operating results have fluctuated in the past and will likely continue to fluctuate in the future. If our quarterly operating results fail to meet expectations, the price of our securities could fluctuate or decline significantly. In addition, significant proportions of our costs are fixed, due in part to our significant sales, research and development costs and manufacturing costs. Therefore, small declines in revenue could disproportionately affect our operating results in a quarter. A variety of factors could cause our quarterly operating results to fluctuate, including:
• our ability to introduce and sell new products and technologies on a timely basis, such as our Z8 Encore!, eZ80 Acclaim! and ARM based device families and extensions of these product families;
• any shortage of wafer or assembly manufacturing capacity at our third-party vendors;
• competitive developments, including pricing pressures;
• technological change and product obsolescence;
• changes in product mix or fluctuations in manufacturing yields;
• variability of our customers’ product life cycles;
• the level of orders that we receive and can ship in a quarter and customer order patterns;
• seasonality;
• inventory write-downs or asset impairments;
• restructuring charges;
• increases in the cost or scarcity of raw materials; and
• gain or loss of significant customers.
15
We depend on orders that are received and shipped in the same quarter, and therefore our results of operations may be subject to significant variability from quarter to quarter. Our net sales in any given quarter depend upon a combination of orders received in that quarter for shipment in that quarter and shipments from backlog. Our backlog at the beginning of each quarter does not include all sales needed to achieve expected revenues for that quarter. Consequently, we are dependent on obtaining orders to be shipped in the same quarter that the order is received for a significant portion of net sales in that quarter. Moreover, customers may reschedule shipments and production difficulties could delay shipments. Accordingly, we have limited visibility into future product shipments and our results of operations may be subject to significant variability from quarter to quarter. We operate in the highly cyclical semiconductor industry and have experienced a downturn in the business cycle, which has materially adversely affected our revenues and cash generation. The semiconductor industry is highly cyclical and has experienced significant economic downturns, often in connection with, or in anticipation of, maturing product cycles (for semiconductors and for the end-user products in which they are used) and declines in general economic conditions. These downturns have been characterized by diminished product demand, erosion of average selling prices, production over-capacity and high inventory levels. For example, beginning in the quarter ended December 31, 2000, we experienced a three-year downturn in our business cycle. We believe that, in light of these events, some of our customers curtailed and may in the future delay or further curtail spending on technology, which could negatively affect our quarterly results or financial condition in the future. Similar economic downturn in the semiconductor industry could increase pressure on us to reduce our prices, which could impair our revenues, gross margins and operating cash flow. From time to time, the semiconductor industry also has experienced periods of increased demand and production capacity constraints. We have in the past experienced substantial period-to-period declines in operating results, and will likely in the future experience substantial period-to-period fluctuations in operating results that are attributable to semiconductor industry conditions or events occurring in the general economy. Average selling prices in the semiconductor industry typically decline over time, which directly affects our revenue and margins. Historically, average selling prices in the semiconductor industry have decreased over the life of any particular product. To the extent that our products achieve market acceptance, competitors typically seek to offer competitive products or embark on discount pricing strategies. We have in the past and may in the future be required to reduce selling prices in response to competition. From time to time, technology and manufacturing changes have the impact of lower average selling prices, such as the conversion of hardware to software modems and packaged to die only sales. If we are unable to offset any reductions in the selling prices of our products by introducing new products at higher prices or by reducing our costs, our revenues, gross margins and operating results could be impaired. In addition, if the price at which we can sell products in our inventory declines below the cost of such products, we may be required to write down the value of such inventory. A significant amount of our revenues comes from relatively few of our customers and distributors, and any decrease of revenues from these customers and distributors, or the loss of their business, could significantly harm our financial results. Historically we have been, and we expect to continue to be, dependent on a relatively small number of distributors for a significant portion of our revenues. We depend on third-party distributors to market and sell our products, and these third-party distributors accounted for approximately 56% of our net sales for the twelve months ended March 31, 2007, 56% for the twelve months ended March 31, 2006 and 49% of our net sales for the twelve months ended December 31, 2004. In addition, our five largest distributors accounted for approximately 46% of our net sales for the twelve months ended March 31, 2007, 44% for the twelve months ended March 31, 2006 and 37% of net sales for 2004. One distribution customer accounted for approximately 23% of our net sales for the twelve months ended March 31, 2007, 24% for the twelve months ended March 31, 2006 and 20% for the twelve months ended December 31, 2004. Our distributors decide whether to include our products among those that they sell, and they may carry and sell product lines that are competitive with ours. Because our distributors are not required to make a specified minimum level of purchases from us, we cannot be sure that they will prioritize selling our products. We also rely on our distributors to accurately report to us on a timely basis their sales of our products and provide certain support services to our customers. Our inability to obtain accurate and timely reports and to successfully manage these relationships could materially adversely affect our business and financial reports. Our distributors may not continue to effectively market, sell or support our products.
16

We depend on relatively few major customers for a substantial portion of our sales.
Our ten largest customers, excluding our distributors, accounted for approximately 36% of our net sales for the twelve months ended March 31, 2007, 33% for the twelve months ended March 31, 2006 and 37% for the twelve months ended December 31, 2004. For the twelve months ended March 31, 2007, twelve months ended March 31, 2006 and the twelve months ended December 31, 2004, we had one distribution customer that accounted for 23%, 24% and 20% of our net sales, respectively. For the twelve months ended March 31, 2007, twelve months ended March 31, 2006 and the twelve months ended December 31, 2004, we had one OEM customer that accounted for 15%, 10% and 12% of our net sales, respectively.
Concentration of net sales to particular customers may change from period to period, but we expect that sales to a limited number of customers will continue to account for a significant percentage of our revenues in any particular period for the foreseeable future. We have very few long-term contracts with our customers, and, like us, our customers typically compete in cyclical industries. We routinely purchase inventory based on customers’ estimates of demand for their products, which is difficult to predict. Thus, our customers may decide not to purchase our products at all, to purchase fewer products than they did in the past, or to alter their purchasing patterns on short notice, particularly because substantially all of our sales are made on a purchase order or sales order acknowledgment basis, which permits our customers to cancel, change or delay product purchase commitments.
Any of our large customers may choose to exit the business we supply, or partner with, or acquire product from our competitors. Should this occur, our results of operations would likely be harmed. The loss of one or more major customers or any reduction, delay or cancellation of orders by any of these customers or our failure to market successfully to new customers, could result in a significant reduction in net sales during one or more periods, excess inventory or write-downs of inventory.
Our revenue may decline if customers for whom we are sole source providers seek alternative sources of supply.
We serve as the sole (or primary) source provider for some of our OEM customers. Those customers may choose to reduce their dependence on us by seeking second sources of supply, which could reduce our revenue. To remain a sole (or primary) source provider, we must continue to demonstrate to our customers that we have adequate alternate sources for components, that we maintain adequate alternatives for production and that we can deliver value added products on a timely basis.
Our international operations subject us to risks inherent in doing business in foreign countries that could impair our results of operations.
Approximately 60% of our net sales for the twelve months ended March 31, 2007, approximately 60% of our net sales for the twelve months ended March 31, 2006 and approximately 66% of our net sales for the twelve months ended December 31, 2004, calculated consistent with revenue recognition of distribution revenue on a deferred (re-sale) basis, were made to foreign countries. These sales to foreign customers will continue to represent a significant portion of our net sales in the future. We maintain significant operations, or rely on a number of contract manufacturers, in the Philippines, Indonesia, Taiwan, Thailand, India and other locations in Asia. There can be no assurances that we will be successful in overcoming the risks that relate to, or arise from, operating in international markets. Risks inherent in doing business on an international level include:
• economic and political instability;
• changes in regulatory requirements, tariffs, customs, duties and other trade barriers;
• transportation delays;
• power supply shortages and shutdowns;
• difficulties in staffing and managing foreign operations and other labor problems;
• existence of language barriers and cultural distinctions;
• acts of God, including floods, typhoons and earthquakes;
• taxation of our earnings and the earnings of our personnel; and
17
• other uncertainties relating to the administration of, or changes in, or new interpretation of, the laws, regulations and policies of the jurisdictions in which we conduct our business.
In addition, our activities outside the United States are subject to risks associated with fluctuating currency values and exchanges rates, hard currency shortages and controls on currency exchange. While our sales are primarily denominated in U.S. dollars, worldwide semiconductor pricing is influenced by currency rate fluctuations, and such fluctuations could harm our operating results materially. The risks inherent in our international operations have been increased by the threat of terrorist attacks. These attacks, coupled with an international military response, have created an uncertain economic environment, and we cannot predict the impact of these political threats or any related military action, on our customers or our business. We have had a history of losses, and we may not be profitable in the future. We have had a history of losses since the one-time gain on extinguishment of debt and fresh-start adjustments in 2002. We may not be profitable in the future. We depend on key personnel, and the loss of our current personnel or our failure to hire and retain additional personnel could harm our business. We depend on our ability to attract and retain highly skilled technical and managerial personnel. We believe that our future success in developing marketable products and achieving a competitive position will depend in large part on our ability to identify, recruit, hire, train, retain and motivate highly skilled technical, executive, managerial, marketing and customer service personnel. Competition for these personnel is intense, especially in Northern California, where our headquarters are located, and we may not be able to successfully recruit, assimilate or retain sufficiently qualified personnel. Our failure to recruit and retain necessary technical, executive, managerial, marketing and customer service personnel could harm our business and our ability to obtain new customers and develop new products. In addition, our history of losses and our 2002 bankruptcy reorganization could impair our ability to recruit and retain employees. We do not have employment contracts with any of our executive officers. As employee incentives, we issue common stock options that generally have exercise prices at the market value at time of the grant and that are subject to vesting. At times, our stock price has declined substantially, reducing the effectiveness of these incentives. We may fail to protect our proprietary rights, and the cost of protecting those rights, whether we are successful or not, may harm our ability to compete. The extent and value of our intellectual property is necessarily uncertain, and our efforts to protect our intellectual property rights may not be successful. Despite our precautions, a third party may copy or otherwise obtain our devices or technology without authorization, requiring patent litigation to enforce our rights. Patent litigation is, by its nature, expensive and unpredictable. If litigated, one or more of our patents may be found invalid or unenforceable or to have claims of such narrow scope as to be of little economic value. Third parties may design around our patents. Third parties may independently develop technology similar to our trade secrets. In addition, the laws of some foreign countries where we have patent and trademark rights may not protect our intellectual property rights to the same extent as the laws of the United States. Additionally, our pending and future patent applications should not be relied upon as they may not issue as patents, and even if they do issue, such future patents may not be of sufficient scope or strength to provide meaningful economic or competitive value. Litigation may be necessary to enforce our intellectual property rights, to protect our trade secrets or to determine the validity and scope of our proprietary rights or the proprietary rights of others. Any such litigation may be unsuccessful and could require us to incur substantial costs and divert significant valuable resources, including the efforts of our technical and management personnel, which may harm our business materially.
18

The semiconductor industry is characterized by frequent litigation regarding patent and other intellectual property rights, both defensive and offensive. In addition to the Microchip lawsuit described elsewhere, from time to time we have received, and may in the future receive, communications from other third parties asserting that a product offered by us, or an aspect of our business, infringes a patent held by the other third party and/or requires a license thereto. With respect to those other third party communications that are currently pending, we believe, after having consulted with counsel, that either (i) we have meritorious defenses, (ii) based on license terms previously offered to us or typically available in the industry, we can obtain any necessary licenses on commercially reasonable terms, or (iii) we can modify our products to avoid such rights, but if this is not the case, we may be sued and assessed damages for past infringement. Indeed, licenses may not be available on commercially reasonable terms, or at all. In addition, we have certain indemnification obligations to customers with respect to the infringement of third party intellectual property rights by our devices. We have received in the past a letter from an electronic equipment manufacturer that makes products that are competitive to certain of our key products, asserting that the sale of certain of our key products may be infringing certain patents owned by them. After having consulted with counsel, we believe that we have meritorious defenses to the assertions set forth in the letter. However, should it become necessary to engage in litigation to defend against such assertions, such litigation could be expensive and time consuming. There can be no assurance that the ultimate resolution of this matter would not have a material adverse affect on our business. Intellectual property lawsuits are subject to inherent uncertainties due to the complexity of the technical issues involved, and we may not be successful in defending ourselves against intellectual property claims. The cost of defending against patent infringement or other intellectual property litigation, in terms of management time and attention, legal fees and product delays, could be substantial, whatever the outcome. If any patent or other intellectual property claims against us are successful, we may be prohibited from using the technologies subject to these claims, and if we are unable to obtain a license on acceptable terms, license a substitute technology, or design new technology to avoid infringement, we could be prohibited from using or selling the infringing products or technologies and be required to pay substantial damages. Such a result could have a material adverse effect on our business. We could be forced to spend significant time and money on products that contain, or are rumored to contain, design defects or errors. Because the design and production process for semiconductors is highly complex, we may produce products whose design deviates from published specifications. In addition, one or more of our products may be found to contain production defects after we have already shipped such products. These production defects could be caused by either raw materials or errors in the production process. If errors or production defects are discovered after we have already shipped one or more of our products in volume, we could be materially adversely affected in one or more of the following ways:
• replacements or recalls could impose substantial costs on us;
• rumors, false or otherwise, may be circulated by the press and other media, which could cause a decrease in sales of our products; and
• customers or end users may file suits, or assert other legal claims against us, alleging damages caused by defective products or errors in products. If we do not successfully defend such suits, we could be required to pay substantial damages. Even if we prevail in suits filed by customers or end users, we may be required to expend significant funds in defense.
Changes in technologies or consumption patterns could reduce the demand for our products. As a result of technological changes, from time to time our customers change the design of their products so as not to include our products, which may have a negative impact on our net sales. For example, in 1999 and 2000, a number of our customers changed the designs of computer mouse pointing devices that they manufactured, and as a result, these devices no longer contain our products. Because we do not have long-term supply contracts with most of our customers, changes in the designs of their products can have sudden and significant impacts on our sales. For example, net sales of our computer mouse pointing devices and other computer peripheral products decreased substantially from approximately $15.4 million in the twelve months ended December 31, 2000, to approximately $4.9 million in the twelve months ended December 31, 2001, approximately $2.4 million in the twelve months ended December 31, 2002, approximately $0.7 million in twelve months ended December 31, 2003, approximately $0.1 million in twelve months ended December 31, 2004 and less than $0.1 million
19

in twelve months ended March 31,2006 and the twelve months ended March 31, 2007, respectively. These reduced sales due to design changes have harmed us in the past, and additional design changes could result in lower revenues in the future. We may forecast the future demand for our products incorrectly and produce excess or insufficient inventories of particular products, which may adversely affect our results of operations. Since we must order products and build inventory substantially in advance of product shipments, we may forecast incorrectly and produce excess or insufficient inventories of particular products. The ability of our customers to reschedule or cancel orders without significant penalty could adversely affect our liquidity, as we may be unable to adjust our purchases from our wafer suppliers to match any customer changes and cancellations. As part of our business strategy, we maintain a substantial inventory of sorted wafers in a die bank but limit our investment in finished goods. We may have adequate wafer inventory to meet customer needs but may be unable to finish the manufacturing process prior to the delivery date specified by the customer. Demand for our products is volatile and customers often place orders with short lead times. Our inventory may not be reduced by sufficient demand of customer orders and in the future we may produce excess quantities of our products. It is our policy to fully write down all inventories that we do not expect to be sold in a reasonable period of time. During recent fiscal years, as a result of changes in estimated demand for our various products, we have taken charges for write down of inventories. For example, we recorded inventory write-down charges of $1.9 million in December 2004, for excess inventories associated with the closure of our MOD II wafer fabrication facility in July 2004. We may suffer reductions in values of our inventories in the future and we may be unable to liquidate our inventory at acceptable prices. To the extent we have excess inventories of particular products, our operating results could be adversely affected by charges to cost of revenues that we would be required to recognize due to significant reductions in demand for our products or rapid declines in the market value of our inventory, resulting in inventory write downs or other adverse consequences. We have implemented measures to significantly reduce our costs, and we may be required to implement additional measures to reduce our costs depending upon our future revenues and operating results. In the past, we have implemented measures designed to reduce our costs, including during the three years ended March 31, 2007. These cost cutting efforts have included:
• consolidation of our research and development activities including the closure of design and development sites in Shanghai, China and Seattle, Washington;
• restructuring our manufacturing operations, which has included closing and subsequently outsourcing all of our wafer fabrication and assembly operations and consolidating probe and final test operations, as well as certain customer service and accounting functions at our Philippines site;
• refocusing our strategic priorities;
• reallocating personnel and responsibilities to better utilize human resources;
• reducing our workforce; and
• instituting temporary office and facility shutdowns.
Cost cutting measures may not increase our efficiency or lead to profitability. In the past, we have reduced our spending on research and development. Reducing research and development spending could harm our ability to introduce new products in the future. If our revenue or operating results significantly decline in the future, we may be required to institute further cost reduction measures. From time to time, we evaluate our strategic alternatives with respect to our facilities and we may take actions which may result in the occurrence of accounting charges. Some or all of these charges may be non-cash. Such charges would have a negative impact on our GAAP profitability and may have a negative impact on our cash balance.
We are subject to various environmental laws and regulations that could have a material adverse effect on us.
Until 2005, we operated a wafer fabrication facility, until February 2006, we owned and operated an 8-inch wafer manufacturing facility and until April 2007, we owned and operated a 5-inch wafer manufacturing facility in Nampa, Idaho. Our manufacturing processes required us to use various hazardous substances, and, as a result, we are subject to a variety of environmental laws and regulations governing the storage, use, emission, discharge and disposal of, and human exposure to, such substances. In particular, the process of manufacturing silicon wafers used large amounts of corrosive and other hazardous chemicals and huge quantities of distilled, de-ionized water. Any failure by us to control the use of, or adequately restrict the discharge of, hazardous substances could subject us to future liabilities that could materially harm our business,
20

have a materially adverse affect on our financial condition and results of operations, including under laws and regulations that impose liability and clean-up responsibility for releases of hazardous substances into the environment. Recently, laws and regulations have been enacted in several European Union member countries, including several jurisdictions in which we operate, restricting the presence of certain substances in electronic products and holding producers of those products financially responsible for the collection, treatment, recycling and disposal of certain products. Specifically, the European Union has enacted the Restriction of the Use of Certain Hazardous Substances in Electrical and Electronic Equipment, or RoHS, and the Waste Electrical and Electronic Equipment, or WEEE, directives. The RoHS directive prohibits the use of certain substances, including lead, mercury, cadmium and chromium, in covered products placed on the market after July 1, 2006. The WEEE directive obligates parties that place electrical and electronic equipment onto the market in the European Union to clearly mark the equipment, register with and report to European Union regulators regarding distribution of the equipment, and provide a mechanism to recall and properly dispose of the equipment. Each European Union member country has enacted, or is expected to soon enact, legislation clarifying what is and what is not covered by the WEEE directive in that country. However, there is still some uncertainty in certain European Union countries as to which party involved in the manufacture, distribution and sale of electronic equipment will be ultimately held responsible. If we are deemed to be a manufacturer of covered products, we may be required to register as a producer in certain European Union countries, and incur financial responsibility with respect to products sold within the European Union, including products of other manufacturers that have been replaced by our products. We may also incur substantial costs to change our contract partners manufacturing processes, redesign or reformulate, and obtain substitute components for, our products that are deemed covered products under the ROHS directive. If we fail to timely provide RoHS-compliant products, we will not be able to offer our products within European Union, and we may be subject to civil or criminal liabilities. Similar laws have been proposed and may be enacted in other locations where we sell our products, including various jurisdictions within the United States and China. We will need to ensure that we comply with such laws and regulations as they are enacted, and ensure, as appropriate or required, that our component suppliers also timely comply with such laws and regulations. If we fail to timely comply with such laws, we could face sanctions for such noncompliance and our customers further may refuse to purchase our products, which would have a materially adverse effect on our business, financial condition and results of operations. With respect to environmental remediation, we could incur substantial costs for the clean up of contaminated properties, either those we own or operate or to which we have sent wastes in the past. Under certain of these laws and regulations, current or previous owners or operators of property may be liable for cleanup costs and other damages without regard to whether they knew of, or caused, the contamination. The presence of, or failure to remediate, contamination could materially adversely affect the value of, and the ability to transfer or encumber, our property. In addition, we may be required to incur significant expense in connection with governmental investigation of environmental or employee health and safety matters. We may engage in acquisitions and other forms of business combinations or partnerships that could materially adversely affect our operating results, dilute our stockholders’ equity, or cause us to incur additional debt or assume contingent liabilities. To increase our business and maintain our competitive position, we have made acquisitions in the past and may do so in the future. Acquisitions and other forms of business combinations or partnerships involve a number of risks that could harm our business and result in the acquired business not performing as expected, including:
• insufficient experience with technologies and markets in which the acquired or combined business is involved, which may be necessary to successfully operate and integrate the business;
• problems integrating the acquired or combined operations, personnel, technologies or products with the existing business and products;
• diversion of management time and attention from our core business to the acquired or combined business;
• potential failure to retain key technical, management, sales and other personnel of the acquired or combined business;
• difficulties in retaining relationships with suppliers and customers of the acquired or combined business; and
• subsequent impairment of the acquired or combined assets, including intangible assets.
21

In addition, acquisitions and other forms of business combinations or partnerships could require investment of significant financial resources and may require us to obtain additional equity financing, which may dilute our stockholders’ equity, or to incur additional indebtedness.
Acts of war or terrorism could harm our business.
The long-term effects of potential terrorist attacks on the world economy and our business are unknown, but could be material to our business. Terrorist acts or acts of war, whether in the United States or abroad, also could cause damage or disruption to our business, our suppliers, our freight carriers, or our customers, or could create political or economic instability, any of which could have a material adverse effect on our business.
Failure to achieve and maintain effective internal control over financial reporting could have a material adverse effect on our business and stock price. Failure to achieve and maintain effective internal control over financial reporting in accordance with rules of the Securities and Exchange Commission promulgated under Section 404 of the Sarbanes-Oxley Act, or failure to maintain adequate disclosure controls and procedures, could harm our business and operating results and/or result in a loss of investor confidence in our financial reports, which could in turn have a material adverse effect on our business and stock price. Change in fiscal calendar and Sarbanes-Oxley Section 404 report. On December 29, 2005, our Board of Directors unanimously adopted resolutions to change our fiscal year end from December 31 to March 31. We revised our fiscal year so that our audit work could be performed during non-peak periods with our independent registered public accountants, which we believe will result in cost savings over the long-term. During the on-going reviews of our control environment and our internal controls, as part of our review for the three month period ended December 31, 2005, we identified deficiencies in our information technology controls, including the need to better segregate duties as it relates to the use of our Oracle Information Systems modules and to improve our General Computing Controls compliance and documentation. We have completed a thorough review of our control environment and have made improvements to our information technology controls in the areas where these deficiencies were identified. Although we believe we have adequately remediated our information technology environment and controls and results of our testing have not uncovered any errors, misstatements or acts of fraud that would lead us to conclude that we have any material weaknesses as of March 31, 2007, our auditors have not performed a formal review of our control environment and it is possible that material weaknesses or deficiencies exist.
Changes in securities laws and regulations may increase our costs.
The Sarbanes-Oxley Act of 2002 (the “Act”) has previously required us to make changes to some of our corporate governance practices. For the fiscal year ended March 31, 2007, the Company was a non-accelerated filer for the purposes of compliance with Sarbanes-Oxley Section 404. The measurement criteria for determining filing status was based on the Company’s market capitalization as of September 30, 2006, at which time, the Company’s market capitalization was below the defined threshold for accelerated filers. As such, the Company is not required to comply with Section 404 of the Sarbanes-Oxley Act for the fiscal year ended March 31, 2007. The Act requires annual management assessments of the effectiveness of our internal controls over financial reporting and also a report by our independent registered public accounting firm assessing the effectiveness of our internal controls over financial reporting. The Commission recently adopted rules extending the initial compliance with Section 404 for non-accelerated filers from fiscal years ending on or after July 15, 2007, until fiscal years ending on or after December 15, 2007. The Commission also adopted rules extending the date in which non-accelerated filers must provide an auditor’s attestation report on internal controls over financial reporting until fiscal years ending on or after December 15, 2008. Thus, under these newly adopted rules, beginning with our fiscal year 2009, we will be required to provide an auditor’s attestation report on internal controls over financial reporting, which will substantially increase our general and administrative expenses. This attestation could be required earlier if on September 30, 2007, the Company’s market capitalization exceeds $75 million.
Changes in accounting principles generally accepted in the United States may materially adversely affect our reported financial results or otherwise harm our business. We prepare our financial statements in conformity with accounting principles generally accepted in the United States. These accounting principles are subject to interpretation by the Financial Accounting Standards Board, the American Institute of Certified Public Accountants, the Securities and Exchange Commission and various bodies formed to interpret and create
22

appropriate accounting policies. A change in these policies or interpretations could have a significant effect on our reported financial results, and could affect the reporting of transactions completed before the announcement of a change.
Changes in our business conditions could result in impairment of our goodwill.
In accordance with Statement of Financial Accounting Standards No.142, “Accounting for Goodwill and Other Intangible Assets” (SFAS 142), the Company must perform at least an annual testing of the Company’s stated value of its net assets including goodwill and other intangible assets in relation to the implied fair market value of the Company. If the Company’s market capitalization or fair market value declines, we may be required to record financial adjustments to the stated values of our goodwill and other intangible assets, resulting in a material adverse effect on our financial condition and results of operations. Goodwill and other intangible assets had an aggregated net book value of $5.7 million at March 31, 2007.
Our North American distributor could emphasize competing products, and we may lose some of our customers as a result.
In October 2002, we engaged Future Electronics (“Future”) as our exclusive full-service distributor in North America. Additionally, Future provides distributor support to us in Europe and Asia on a non-exclusive basis. For the twelve months ended March 31, 2007, Future purchases were approximately $19.1 million, or 23% of net sales. For the twelve months ended March 31, 2006, Future purchases were approximately $18.6 million, or 24% of net sales. For the twelve months ended December 31, 2004, Future purchases were approximately $19.3 million, or 20% of net sales. Future distributes products of our competition that may directly compete with our product offerings. If Future chooses to promote those products over our products, our operating results could be harmed significantly. In addition, if Future were to terminate our distribution agreement, we could experience a period of significant interruption of our business while we obtained other distribution channels.
Provisions in our organizational documents and Delaware law could discourage acquisition proposals or delay a change in control that would be beneficial to our stockholders.
Our amended and restated certificate of incorporation and bylaws contain anti-takeover provisions that could make it more difficult for a third party to acquire control of us, even if that change in control would be beneficial to our stockholders. These provisions include:
• providing for a classified board of directors with staggered terms;
• limiting the persons who may call special meetings of stockholders; and
• prohibiting stockholders from taking action by written consent. In addition, provisions of Delaware law may discourage, delay or prevent someone from acquiring or merging with us. Our directors, named executive officers and our two largest stockholders, who beneficially own approximately 33% of our common stock in the aggregate, may have interests that conflict with the interests of our other stockholders. Our directors and named executive officers, together with two large stockholders, UBS Willow Management, L.L.C., and funds managed by Capital Research and Management Company, beneficially owned approximately 33% of our outstanding common stock, in the aggregate, as of March 31, 2007. As a result of their ownership and positions, our directors and named executive officers, together with UBS Willow Management and Capital Research and Management Company, collectively are able to significantly influence all matters requiring stockholder approval, including the election of directors and approval of significant corporate transactions. Such concentration of ownership may also have the effect of delaying or preventing a change in control. If the ownership of our common stock continues to be highly concentrated, it may prevent you and other stockholders from influencing significant corporate decisions. The investment objectives of our largest institutional stockholders may differ from those of our other stockholders, including our future public stockholders.
23

ITEM 1B. UNRESOLVED STAFF COMMENTS
None.
24

ITEM 2. PROPERTIES San Jose, California Currently, our corporate headquarters are located in a 41,000 square foot facility in San Jose, California, which we occupy under a lease through January 31, 2008. There is no option to extend the lease beyond this date and we plan to exit the building early with no penalties to the Company from the landlord. In April 2007, we negotiated a lease for a 40,000 square foot facility in San Jose with a lease term of five years and an option to renew for two, 3-year periods. The lease includes an expansion opportunity for an additional 7,000 square feet, upon which we have right of first refusal. We will relocate our corporate headquarters to this new facility in July 2007. Meridian, Idaho In May of 2004, we entered into a 5-year lease for a 15,500 square foot facility in Meridian, Idaho, which can be extended at our option for an additional 3 years. This facility is used as our Idaho Technology Center and supports our foundry supplier partnerships, product and design engineering, failure analysis and customer manufacturing support activities. Bangalore, India We currently lease a 17,710 square foot facility in Bangalore, India, under three separate leases expiring in December 2007, November 2008 and April 2010, respectively. This facility is used as our India Design Center and supports our software engineering and tools development activities. Manila, Philippines A majority of our product testing and global support activities resides in a 140,000 square foot facility located in the Philippines. In October 2003, we executed a lease agreement for the Philippines facility through March 2009. Global support activities include inventory warehousing and management, logistics, customer service and support, manufacturing planning, Finance and IT. Short-Term Leases We have short-term leases for sales offices located in the U.S., Canada, England, Germany, Korea, Malaysia, the People’s Republic of China (including Hong Kong), Singapore and Taiwan. Currently, we believe that all of our properties are adequate to meet our needs. MOD III Sale of Assets and Liquidation of ZiLOG MOD III, Inc. In January 2002, we closed our MOD III facility, an approximately 158,000 square foot building residing on 15 acres of developed land and 4 acres of undeveloped land. In connection with our plan of reorganization, we transferred the assets of the MOD III facility to ZiLOG MOD III, Inc. In July 2004, ZiLOG MOD III, Inc. sold its production equipment to STMicroelectronics, Inc. for $26 million. At the completion of the sale in September 2004, ZiLOG, Inc. received approximately $4.9 million for reimbursement of sustaining costs incurred, which was recorded as an offset to special charges. The holders of our former senior notes received $20.2 million in net proceeds from this sale in October of 2004.
In February 2006, ZiLOG MOD III, Inc. completed the sale of its remaining assets to Micron Technology, Inc. for a total consideration net of closing costs of $4.6 million. These assets included the dormant 8” wafer fabrication facility and associated land owned by ZiLOG MOD III, Inc. and 19.9 acres of vacant land owned by ZiLOG, Inc. ZiLOG MOD III, Inc. shareholders voted to liquidate the special purpose entity and distribute the remaining net proceeds to its Series A Preferred shareholders at the conclusion of that process. The distribution of the net proceeds to ZiLOG, Inc. includes $1.1 million for the vacant property and $0.7 million for reimbursement of sustaining and maintenance costs incurred. The remaining $2.8 million was distributed to holders of ZiLOG MOD III, Inc. Series A Preferred Stock upon the liquidation of ZiLOG MOD III, Inc. MOD II Facility Closure and Sale of Assets In July 2004, our manufacturing operations within MOD II ceased. In October 2004 we sold substantially all of our manufacturing assets, which were located within the MOD II facility for $5.9 million. As mentioned previously, in February 2006, we sold 19.9 acres of undeveloped land to Micron Technologies, Inc. In December 2006 in preparation for the final sale of the facility, we completed decommissioning activities in the MOD II facility for a cost of $1.4 million. In May 2007, we completed the sale of MOD II including a 108,000 square foot building and 13.03 total acres of developed land located in Nampa, Idaho, for a net sales price of $3.1 million.
25
ITEM 3. LEGAL PROCEEDINGS
On August 11, 2005, Microchip Technology, Inc. (“Microchip”) filed a patent infringement claim against the Company in the U.S. District Court of Arizona (case number CV05-2406-PHX-MHM). Microchip alleges that the Company has infringed, and currently infringes, its patents numbered 5,847,450, 6,696,316 and 6,483,183. Microchip claims that unspecified products of the company, including the Z8 Encore! XP 4K Series of products, infringe these patents and is seeking preliminary and permanent injunctive relief, unspecified damages and costs, including attorneys’ fees. We filed a response to the claims on September 15, 2005 generally denying the claims and challenging the validity of the patents. A hearing was scheduled for November 17, 2005. On January 10, 2006, the Company filed a request for patent re-examination with the U.S. PTO, which was granted in February and March 2006 for all 3 patents. On March 13, 2006, the Company was informed that its motion to stay with the Federal Court of Arizona was granted until such time as Microchip is informed of the outcome of the re-examinations. We do not believe it is feasible to predict or determine the outcome or resolution of this litigation at this time. We believe we have meritorious defenses and will defend ourselves against these claims vigorously. We may incur substantial expenses in our defense against these claims. In the event of a determination adverse to us, we may incur substantial monetary liabilities and be required to change our business practices. Either of these could have a material adverse effect on our financial position, results of operations and/or cash flows.
We do not believe it is feasible to predict or determine the outcome or resolution of this litigation at this time. We believe we have meritorious defenses and will defend ourselves against these claims vigorously. We may incur substantial expenses in our defense against these claims. In the event of a determination adverse to us, we may incur substantial monetary liability, and be required to change our business practices. Either of these consequences could have a material adverse effect on our financial position, results of operations and/or cash flows.
The Company is participating in other litigation and responding to claims arising in the ordinary course of business. The Company intends to defend itself vigorously in these other matters. The Company’s management believes that it is unlikely that the outcome of these other matters will have a material adverse effect on the Company’s consolidated financial statements, although there can be no assurance in this regard. I EM 4. SUBMISSION OF MATTERS TO A VOTE OF SECURITY HOLDERS T
None
26

PART II ITEM 5. MARKET FOR REGISTRANT’S COMMON EQUITY, RELATED STOCKHOLDER MATTERS
AND ISSUER PURCHASES OF EQUITY SECURITIES
PRICE RANGE OF COMMON STOCK Our Common Stock Our common stock is traded on the NASDAQ Global Market under the symbol “ZILG.” The following table sets forth the high and low per share trading prices by quarter on the NASDAQ Global Market.
High L ow
2006 Fiscal Year
First Quarter March 28 – June 30, 2005 $ 5.58 $ 3.58Second Quarter July 1 – September 30, 2005 $ 4.49 $ 2.40Third Quarter October 1 – December 31, 2005 $ 3.25 $ 2.35Fourth Quarter January 1 – March 31, 2006 $ 3.23 $ 1.99
2007 Fiscal Year
First Quarter April 1 – July 1, 2006 $ 3.88 $ 2.95Second Quarter July 2 – September 30, 2006 $ 3.80 $ 3.04Third Quarter October 1 – December 30, 2006 $ 4.49 $ 3.25Fourth Quarter December 31, 2006 – March 31, 2007 $ 4.56 $ 3.80
EQUITY COMPENSATION PLAN INFORMATION
The following is a summary of the shares reserved for issuance pursuant to outstanding options, rights or warrants
granted under our equity compensation plans as of March 31, 2007:
Plan Category
Number of securities to be
issued upon exercise of
outstanding options, warrants
and rights Column A
Weighted-average exercise
price of outstanding
options, warrants and rights Column B
Number of securities remaining available for future issuance
under equity compensation plans (excluding securities reflected in Column
A)
Equity compensation plans approved by security holders (1&2) 1,786,057 $ 5.55 975,680
Equity compensation plans not approved by security holders - - - Total 1,786,057 $ 5.55 975,680
(1) The ZiLOG 2002 Omnibus Stock Incentive Plan was originally approved under the terms of our plan of reorganization on May 13, 2002.
(2) The ZiLOG 2004 Omnibus Stock Incentive Plan was approved by stockholders on February 12, 2004.
See Note 12 of the notes to the consolidated financial statements for a discussion of related party transactions. As of March 31, 2007, we had approximately 9 holders of record of our common stock. We have not paid any dividends and currently intend to retain any future earnings for investment in our business.
27
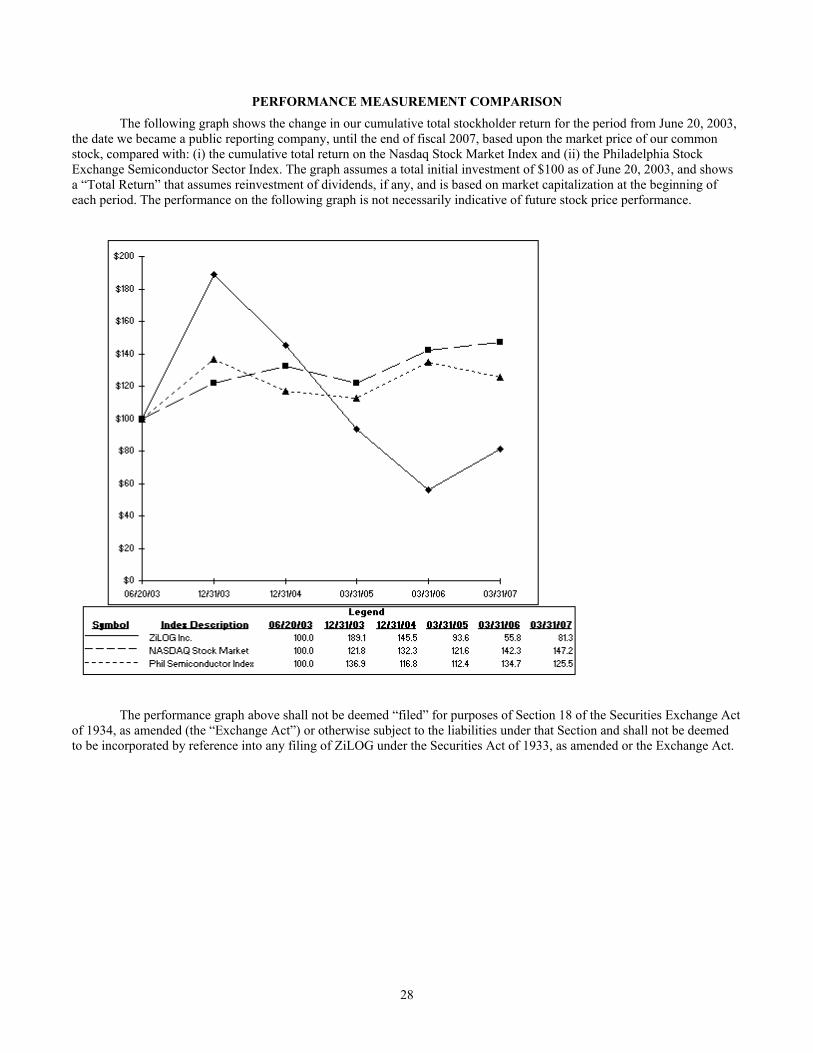
PERFORMANCE MEASUREMENT COMPARISON The following graph shows the change in our cumulative total stockholder return for the period from June 20, 2003, the date we became a public reporting company, until the end of fiscal 2007, based upon the market price of our common stock, compared with: (i) the cumulative total return on the Nasdaq Stock Market Index and (ii) the Philadelphia Stock Exchange Semiconductor Sector Index. The graph assumes a total initial investment of $100 as of June 20, 2003, and shows a “Total Return” that assumes reinvestment of dividends, if any, and is based on market capitalization at the beginning of each period. The performance on the following graph is not necessarily indicative of future stock price performance.
The performance graph above shall not be deemed “filed” for purposes of Section 18 of the Securities Exchange Act of 1934, as amended (the “Exchange Act”) or otherwise subject to the liabilities under that Section and shall not be deemed to be incorporated by reference into any filing of ZiLOG under the Securities Act of 1933, as amended or the Exchange Act.
28
ITEM 6. SELECTED CONSOLIDATED FINANCIAL DATA
The following selected consolidated financial data set forth below should be read in conjunction with the section entitled “Management’s Discussion and Analysis of Financial Condition and Results of Operations,” our consolidated financial statements and the notes to those statements appearing elsewhere in this Form 10-K. The consolidated statement of operations data for the twelve months ended March 31, 2007, the twelve months ended March 31, 2006 and the three month transition period ended March 27, 2005, and the consolidated balance sheets data as of March 31, 2007, March 31, 2006 and March 27, 2005 are derived from our respective consolidated financial statements included elsewhere in this Form 10-K, which have been audited by Armanino McKenna LLP, an independent registered public accounting firm. Consolidated financial statements and data related to the three month period ended March 28, 2004 are unaudited. The consolidated statement of operations data for the twelve months ended December 31, 2004 are derived from our respective consolidated financial statements included elsewhere in this Form 10-K, which have been audited by KPMG LLP, an independent registered public accounting firm.
Upon emergence from Chapter 11 proceedings in May 2002, we adopted fresh-start reporting in accordance with the American Institute of Certified Public Accountants Statement of Position 90-7, “Financial Reporting By Entities in Reorganization Under the Bankruptcy Code,” or SOP 90-7. In connection with the adoption of fresh-start reporting, our reorganization value has been allocated to our assets and liabilities on a basis which is substantially consistent with the purchase method of accounting. Our financial statements for periods subsequent to adoption of fresh-start reporting are not comparable with those prepared before our plan was confirmed because they are, in effect, those of a new entity. Consequently, the consolidated statements of operations data at March 31, 2007, March 31, 2006, March 27, 2005, December 31, 2004, and December 31, 2003 are labeled “Successor Company,” and reflect the effect of our reorganization plan and the associated fresh-start adjustments. Periods presented prior to May 1, 2002 have been designated “Predecessor Company.”
Although our plan of reorganization became effective on May 13, 2002, for financial reporting purposes, the effective ate of our plan of reorganization is considered to be April 30, 2002. d
A black line has been drawn between the accompanying financial statements to distinguish, for financial reporting
purposes, between the Successor Company and the Predecessor Company.
We have included in-process research and development and goodwill amortization within “research and development” and “special charges and reorganization items,” respectively, of the Predecessor Company consolidated statements of operations, whereas these items are each disclosed separately in the Successor Company’s consolidated statements of operations data. The 2002 consolidated statements of operations has been combined as a matter of convenience. The combined results are not meant to be a presentation in accordance with generally accepted accounting principles due to the change in basis resulting from the completion of the reorganization plan and the application of fresh-start accounting during the period.
Effective December 29, 2005, we changed our fiscal year end from December 31 to March 31. Our interim results are based on fiscal quarters of approximately thirteen weeks in duration ending on the closest Saturday to each calendar quarter end, with the exception of the last quarter, which ends on March 31 beginning in fiscal 2006. The operating results for any interim period are not necessarily indicative of results for any subsequent period or the full fiscal year.
29

Successor Predecessor
Combined Company Company
Eight Four Months Months
Ended Ended
Mar. 31, Mar. 31, Dec. 31, Dec. 31, Dec. 31, Dec. 31, Apr. 30, Mar. 27, Mar. 28,
(In millions, except per share data) 2007 2006 2004 2003 2002 2002 2002 2005 2004Consolidated Statements of Operations Data: Transition
Period UnauditedNet sales $82.0 $78.8 $95.6 $103.6 $139.6 $93.6 $46.0 $20.2 $26.0Cost of sales 43.0 45.4 52.2 55.2 77.3 51.2 26.1 12.5 12.6 Cost of sales – fresh-start inventory adjustment - - - - 3.9 3.9 - - -
Gross margin 39.0 33.4 43.4 48.4 58.4 38.5 19.9 7.7 13.4
Gross margin percent of sales 48% 42% 45% 47% 42% 41% 43% 38% 52%
Operating expenses:
Research and development 20.5 21.0 20.9 18.0 17.9 11.1 6.8 5.2 5.1
Selling, general and administrative 22.7 23.7 29.6 27.6 33.4 22.6 10.8 7.4 6.8
Special charges, credits and reorganization items(1) , net 2.4 2.4 5.9 3.8 9.7 2.8 6.9 0.4 0.5
Amortization of intangible assets 1.3 1.9 4.2 6.8 7.9 7.9 - 0.6 1.1
In-process research and development - - - - 18.7 18.7 - - -
Total operating expenses 46.9 49.0 60.6 56.2 87.6 63.1 24.5 13.6 13.5
Operating loss (7.9) (15.6) (17.2) (7.8) (29.2) (24.6) (4.6) (5.9) (0.1)
Other income (expense):
Fresh-start adjustments - - - - 83.7 - 83.7 - -
Net gain on discharge of debt - - - - 205.7 - 205.7 - -
Interest income 1.1 0.8 0.3 0.3 0.3 0.2 0.1 0.2 0.1
Interest expense(2)- - (0.2) (0.4) (5.5) (0.5) (5.0) - (0.1)
Other, net - (0.1) - 0.5 0.6 0.5 0.1 (0.1) (0.1)
Total other income (expense) 1.1 0.7 0.1 0.4 284.8 0.2 284.6 0.1 (0.1)
Income (loss) before reorganization items and provision (benefit) for income taxes (6.8) (14.9) (17.1) (7.4) 255.6 (24.4) 280.0 (5.8) (0.2)
Reorganization items - - - - 4.0 - 4.0 - -
Provision (benefit) for income taxes 2.2 1.9 1.4 (1.5) 1.7 1.6 0.1 0.8 (0.2)
Net income (loss) (9.0) (16.8) (18.5) (5.9) 249.9 (26.0) 275.9 (6.6) -
Less: preferred stock dividends accrued - - - - 1.9 - 1.9 - - Net income (loss) attributable to common stockholders ($9.0) ($16.8) ($18.5) ($5.9) $248.0 ($26.0) $274.0 ($6.6) $0.0
Basic and diluted net loss per share(3) ($0.54) ($1.02) ($1.16) ($0.41) ($1.82) ($0.41) $0.00
Weighted-average shares used in computing basic and diluted net loss per share(4) 16.7 16.4 16.0 14.3 14.3 16.2 14.7
Twelve Months Ended
Successor Company
Successor
Company
Three
Months Ended
(1) Special charges, credits and reorganization items consist of asset impairments, restructuring charges, net reimbursement of MOD III sustaining and maintenance costs and debt restructuring fees in all periods presented.
(2) Excludes contractual interest of $4.2 million in the four months ended April 30, 2002, which was not recorded during the reorganization in accordance with GAAP.
(3) Loss per share for the Predecessor Company is not presented because the common stock was not traded on an established trading market.
(4) Share data has been restated for a 1 for 2 reverse split effected in 2004.
30

Mar. 31, Mar. 31, Mar. 27,
(In millions) 2007 2006 2005 2004 2003 2002
Consolidated Balance Sheets Data:Cash and cash equivalents $19.4 $27.0 $33.6 $37.7 $22.0 $29.4Working capital 21.8 24.7 40.3 41.6 21.0 19.1 Total assets 55.8 71.6 92.4 98.1 133.9 168.8 Current liabilities 19.5 23.9 25.3 24.9 27.4 35.1 Total liabilities 21.1 29.8 34.6 34.2 43.2 72.0 Stockholders’ equity $34.7 $41.8 $57.8 $63.9 $60.7 $66.8
As of December 31,
31

ITEM 7. MANAGEMENT’S DISCUSSION AND ANALYSIS OF FINANCIAL CONDITION AND RESULTS OF OPERATIONS
Some of the statements under this heading may constitute forward-looking statements within the meaning of the Private
Securities Litigation Reform Act of 1995, Section 27A of the Securities Act of 1933 and Section 21E of the Securities Exchange Act of 1934. Our actual results may differ materially from those anticipated in these forward-looking statements as a result of various factors including those set forth in the section entitled “Risk Factors” and in other sections of this Form
0-K. 1
The following is management’s discussion and analysis of financial condition and results of operations of the Company and its subsidiaries for the twelve months ended March 31, 2007, March 31, 2006 and December 31, 2004 and the three month transition period ended March 27, 2005 and the three months ended March 28, 2004. Consolidated financial statements and data related to the three month period ended March 28, 2004 are unaudited. This discussion and analysis should be read in conjunction with the section entitled “Selected Consolidated Financial Data” and the consolidated financial statements and notes thereto included elsewhere herein. Management’s discussion and analysis provides
formation concerning our business environment, consolidated results of operations and liquidity and capital resources. in
We prepare and release quarterly unaudited financial statements prepared in accordance with generally accepted accounting principles or GAAP. We present EBITDA amounts to reflect non-GAAP measure of liquidity. EBITDA reflects our Earnings Before Interest, Taxes, Depreciation and Amortization. We believe the disclosure of such information helps investors more meaningfully evaluate our liquidity position by the elimination of non-cash related items, such as depreciation and amortization. We believe our investor base regularly uses EBITDA as a measure of the liquidity of our business. Our management uses EBITDA as a supplement to cash flow from operations as a way to assess the cash generated from our business available for capital expenditures and debt service. However, we recommend that investors carefully review the GAAP financial information included as part of our Quarterly Reports on Form 10-Q, our annual reports on Form 10-K and our quarterly earnings release, compare GAAP financial information with the non-GAAP financial results disclosed in our quarterly earnings releases and investor calls, and read the associated reconciliation.
Effective December 29, 2005, we changed our fiscal year end from December 31 to March 31. Our interim results are based on fiscal quarters of thirteen weeks in duration ending on the last Saturday of each calendar quarter with the exception of the last quarter, which ends on March 31 beginning in fiscal 2006. The operating results for any interim period are not necessarily indicative of results for any subsequent period or the full fiscal year. Overview
Founded in 1974, we are a global supplier of 8-bit micrologic semiconductor devices. We design, develop and market various families of devices in this market segment. Using proprietary technology that we have developed over our 30-year operating history, we provide semiconductor integrated circuit devices that our customers design into their end products. Our devices often include related application software and typically combine a microprocessor with memory and various peripheral functions on a single device. Our products enable a broad range of consumer and industrial electronics manufacturers to control the functions and performance of their products. For example, some typical applications include devices that control the speed of a motor, infrared remote controls, security systems and battery chargers. In addition to our micrologic devices, we sell other integrated circuit devices that have a wide variety of uses, including the processing and transmission of information for communications and consumer electronics products. These devices include serial communication controllers, modems, IrDA transceivers, TV display controllers and personal computer peripheral controllers. Historically, we have also performed wafer fabrication foundry services for third parties, which were terminated in 2004.
During the December quarter of 2000, we began to experience declining sales. During the first half of calendar year 2001, James M. Thorburn joined the Company as Chief Executive Officer (“CEO”) and Chairman of the Board of Directors to restructure our operations, financials and product portfolio with the goal of eliminating the debt that we had at that time, positioning the Company for growth and returning the Company to profitability. In 2002, we completed our recapitalization whereby we eliminated the debt and established the MOD III special purpose subsidiary as a result of our voluntary pre-packaged plan of reorganization under Chapter 11 of the United States Bankruptcy Code. Our fiscal 2007 financial results show progress towards profitability as we reduced our net loss by approximately $8 million as compared to fiscal 2006 on approximately $3 million of additional net sales. In August 2006, Mr. Thorburn resigned his position as CEO and Chairman of the Board of Directors.
32

In January 2007, under the leadership of our new CEO, Darin Billerbeck, we completed a comprehensive strategic plan
update. One of the key actions resulting from this plan update was the decision to consolidate our engineering activities in order to better concentrate our core competencies and improve our product development cycle time while reducing our overall research and development spending. Our business model is structured around our fabless manufacturing approach and our market focus will be on those opportunities were we can best leverage our technology. We will continue to service the 8 and 16-bit markets where more complexity and greater value can be obtained by the customer. Our design and development resources are also focused on our universal remote control solutions and our broad based family of CRIMZON microcontrollers. Additionally, we are expanding our 32-bit ARM based portfolio of products to support secured transaction opportunities in the point of sale market and adjacent markets where these solutions have the greatest value and can be best leveraged. Stock Repurchase Programs
2003 Stock Repurchases
On April 17, 2003, our Board of Directors approved a stock repurchase program under which we could repurchase up 500,000 shares of our outstanding common stock at market value. to
We generally had the right of first refusal to repurchase shares of common stock issued under our stock plan to certain
employees, former employees and contractors, which expired on March 12, 2004. This right of first refusal became exercisable when the shares were offered for sale or upon termination of employment.
A summary of the activity under this program is as follows ($ in millions): 2003 Repurchase Plan Activity Net Loan
Shares Cost RepaymentRepurchases from open market 125,000 $ 0.5 $ - Repurchases from former executive officer 50,000 0.2 0.1 Repurchases from other and former employees 230,164 0.7 0.6 Total repurchases - 2003 Plan 405,164 $ 1.4 $ 0.7
As of March 31, 2007, the Company had repurchased 405,164 shares under this program at a net aggregate cost of $2.1 million.
2004 Stock Repurchase Program
On July 29, 2004, our Board of Directors approved the 2004 stock repurchase program pursuant to which we could
repurchase up to $5.0 million in market value of our outstanding shares of common stock. Pursuant to this program, during 2004 we purchased 572,100 shares of our common stock at a net aggregate cost of $4.4 million. No other purchases have occurred under this program.
Other Stock Repurchases
On November 17, 2004, our Board of Directors, in conjunction with the resignation of a former officer, Michael Burger, approved the repurchase of 92,735 shares of common stock from Mr. Burger at a fair market purchase price of $6.20 per share in consideration for the repayment of his loans payable to us totaling $0.6 million.
During fiscal 2006, the company repurchased 17,389 shares from former employees in consideration for the repayment
of loans payable to us totaling less than $0.1 million. During fiscal 2007 and during the three month transition period ended March 27, 2005, there were no stock
repurchases.
33
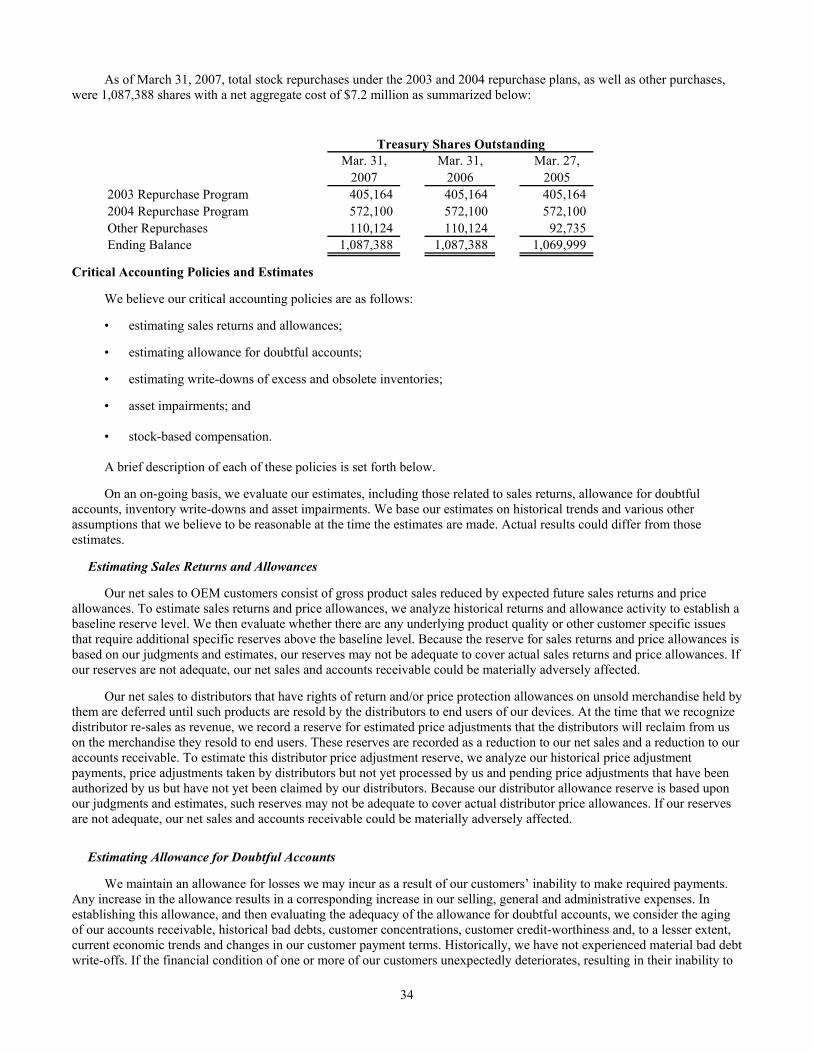
As of March 31, 2007, total stock repurchases under the 2003 and 2004 repurchase plans, as well as other purchases, were 1,087,388 shares with a net aggregate cost of $7.2 million as summarized below:
Mar. 31, Mar. 31, Mar. 27, 2007 2006 20052003 Repurchase Program 405,164 405,164 405,164 2004 Repurchase Program 572,100 572,100 572,100 Other Repurchases 110,124 110,124 92,735 Ending Balance 1,087,388 1,087,388 1,069,999
Treasury Shares Outstanding
Critical Accounting Policies and Estimates
We believe our critical accounting policies are as follows:
• estimating sales returns and allowances;
• estimating allowance for doubtful accounts;
• estimating write-downs of excess and obsolete inventories;
• asset impairments; and • stock-based compensation. A brief description of each of these policies is set forth below.
On an on-going basis, we evaluate our estimates, including those related to sales returns, allowance for doubtful
accounts, inventory write-downs and asset impairments. We base our estimates on historical trends and various other assumptions that we believe to be reasonable at the time the estimates are made. Actual results could differ from those estimates.
Estimating Sales Returns and Allowances
Our net sales to OEM customers consist of gross product sales reduced by expected future sales returns and price allowances. To estimate sales returns and price allowances, we analyze historical returns and allowance activity to establish a baseline reserve level. We then evaluate whether there are any underlying product quality or other customer specific issues that require additional specific reserves above the baseline level. Because the reserve for sales returns and price allowances is based on our judgments and estimates, our reserves may not be adequate to cover actual sales returns and price allowances. If our reserves are not adequate, our net sales and accounts receivable could be materially adversely affected.
Our net sales to distributors that have rights of return and/or price protection allowances on unsold merchandise held by them are deferred until such products are resold by the distributors to end users of our devices. At the time that we recognize distributor re-sales as revenue, we record a reserve for estimated price adjustments that the distributors will reclaim from us on the merchandise they resold to end users. These reserves are recorded as a reduction to our net sales and a reduction to our accounts receivable. To estimate this distributor price adjustment reserve, we analyze our historical price adjustment payments, price adjustments taken by distributors but not yet processed by us and pending price adjustments that have been authorized by us but have not yet been claimed by our distributors. Because our distributor allowance reserve is based upon our judgments and estimates, such reserves may not be adequate to cover actual distributor price allowances. If our reserves are not adequate, our net sales and accounts receivable could be materially adversely affected. Estimating Allowance for Doubtful Accounts
We maintain an allowance for losses we may incur as a result of our customers’ inability to make required payments. Any increase in the allowance results in a corresponding increase in our selling, general and administrative expenses. In establishing this allowance, and then evaluating the adequacy of the allowance for doubtful accounts, we consider the aging of our accounts receivable, historical bad debts, customer concentrations, customer credit-worthiness and, to a lesser extent, current economic trends and changes in our customer payment terms. Historically, we have not experienced material bad debt write-offs. If the financial condition of one or more of our customers unexpectedly deteriorates, resulting in their inability to
34

make payments, or if we otherwise underestimate the losses we will incur as a result of our customers’ inability to pay us, we could be required to increase our allowance for doubtful accounts which, could materially adversely affect our operating results.
Estimating Write-Downs of Excess and Obsolete Inventories
Each inventory component, excluding raw materials, is assessed for excess or obsolescence by using an algorithm that we have established. This algorithm is based on historical trends, demand forecasts and inventory age. We review the result of this algorithm and generally reserve work-in-process inventories based upon aging and finished goods inventory quantities in excess of our current backlog or historical demand. In addition to analyzing the results of our reserve algorithm calculations, we also review known exposures, market conditions and other relevant factors to determine whether our inventory reserves are appropriate based on our best estimates. Reserves for excess and obsolete inventories are reflected as a reduction to inventory values in the accompanying consolidated balance sheets, and an increase in cost of sales in the accompanying consolidated statements of operations. If actual market conditions or customer demand patterns are less favorable than, or inconsistent with our assumptions, we may be required to take further write-downs of our inventory value,
hich could materially adversely impact our cost of sales and operating results. w
Asset Impairments
We apply the provisions of SFAS 144, “Accounting for the Impairment or Disposal of Long-Lived Assets” and SFAS 142, “Goodwill and Other Intangible Assets.” We evaluate long-lived assets for possible impairment whenever events or changes in circumstances indicate that the carrying value may not be recoverable. Factors we consider important which could
igger an impairment review include the following: tr
• significant changes in the manner of our use of the acquired assets; • decrease in our market value below our stockholder’s equity book value;
• significant changes in the strategy for our overall business;
• significant negative industry or economic trends; and • periods of operating or cash flow losses. When we determine that the carrying value of long-lived assets may not be recoverable based upon the existence of one
or more of the above indicators of impairment, and the undiscounted cash flows estimated to be generated by those assets are less than the assets’ carrying value, the carrying value of the assets are reduced to their estimated fair value. The estimated fair value is usually determined based on an estimate of discounted future cash flows. Asset impairments are recorded as a reduction in the asset value in our consolidated balance sheets and as special charges in our consolidated statements of operations.
The intangible assets created by the adoption of fresh-start accounting on our emergence from bankruptcy in 2002, consist of existing technology and brand name, as well as excess enterprise value, or goodwill. The existing technology and brand name are being amortized based on a pattern-of-use method in proportion to the forecast discounted cash flows from such assets. The goodwill is not subject to amortization.
We evaluate existing technology and brand name whenever events and circumstances indicate that their fair value may be less than their carrying value. Additionally, goodwill is tested for impairment at least annually and more often if events and circumstances indicate that its fair value may be less than its carrying value. We performed the annual impairment test for goodwill in the fourth quarter of fiscal 2007, and we perform this test in the third quarter of each fiscal year unless the existence of triggering events indicates that an earlier review should be performed.
Adjustments to record impairment of long-lived assets or intangible assets could have a material adverse impact on our financial condition and results of operations in the period or periods in which such impairment is identified.
Stock-Based Compensation
Effective April 1, 2006, the Company adopted Statement of Financial Standard No. 123, “Share-Based Payment”
(“SFAS 123R”) which requires the measurement and recognition of compensation expense for all share-based payment awards made to employees and directors including employee stock options, restricted stock awards and employee stock purchases related to the 2004 Employee Stock Purchase Plan based on estimated fair values. SFAS 123R supersedes the Company’s previous accounting under Accounting Principles Board Opinion No. 25, “Accounting for Stock Issued to
35
Employees” (“APB 25”) and Statement of Financial Accounting Standard No. 123, “Accounting for Stock-Based Compensation” (“ SFAS 123”) for periods beginning in fiscal 2007. In March 2005, the SEC issued Staff Accounting Bulletin No. 107, “Share-Based Payment,” (“SAB 107”) relating to SFAS 123R. The Company has applied the provisions of SAB 107 in its adoption of SFAS 123R. The Company elected to adopt SFAS 123R using the modified prospective transition method utilizing the single option attribution approach, which requires the application of the accounting standards as of April 1, 2006, the first day of the Company’s fiscal year 2007. In accordance with the modified prospective transition method, the Company’s prior periods have not been restated to reflect, and do not include, the impact of SFAS 123R. The Company’s consolidated financial statements as of and for the twelve months ended March 31, 2007 reflect the impact of SFAS 123R. Reporting Segments
Beginning in May 2002, we have consolidated our business segments into one reportable segment to reflect the manner in which our chief operating decision-maker allocates resources and assesses the performance of our business. For convenience and ease of reference, we disclose net sales by region, by channel and by product category.
Period Comparisons
Our results of operations from May 1, 2002 through March 31, 2007 and our consolidated balance sheets at December 31, 2002 through March 31, 2007 are not comparable to our results of operations prior to May 1, 2002 and our consolidated balance sheet at December 31, 2001, due to our adoption of fresh-start reporting upon our emergence from bankruptcy. Differences in our results of operations relate to depreciation of property, plant and equipment, amortization of intangible assets, interest expense and restructuring and reorganization expenses. Additionally, these differences in our consolidated balance sheets relate to inventory, in-process research and development, property, plant and equipment, intangible assets, conversion of senior notes to common stock and minority interest. Certain figures, such as net sales and certain expenses, were not affected by our adoption of fresh-start accounting and, accordingly, we believe them to be comparable.
Effective December 29, 2005, we changed our fiscal year end from December 31 to March 31. Our interim results are based on fiscal quarters of approximately thirteen weeks in duration ending on the closest Saturday to each calendar quarter end, with the exception of the last quarter, which ends on March 31 beginning in fiscal 2006.
36

Results of Operations
Our net sales by region, by channel and by product category are summarized in dollars for each period indicated, as follows (in millions):
Mar. 31, Mar. 31, Dec. 31, Mar. 27, Mar. 28,
2007 2006 2004 2005 2004Net sales by region: Americas $ 33.7 $ 31.9 $ 49.4 $ 9.4 $ 14.0 Asia (including Japan) 37.7 36.4 33.5 8.2 8.0 Europe 10.6 10.5 12.7 2.6 4.0 Net sales $ 82.0 $ 78.8 $ 95.6 $ 20.2 $ 26.0
Net sales by channel: OEM $ 36.0 $ 34.8 $ 44.7 $ 10.1 $ 13.5 Distribution 46.0 44.0 47.3 10.1 12.3 Foundry services - - 3.6 - 0.2 Net sales $ 82.0 $ 78.8 $ 95.6 $ 20.2 $ 26.0
Net sales by product category: Micrologic Embedded Flash $ 12.8 $ 6.8 $ 3.2 $ 1.1 $ 0.4 Remote Controls 24.0 20.2 21.6 5.3 7.3 Micrologic - new products $ 36.8 $ 27.0 $ 24.8 $ 6.4 $ 7.7 Other Non - Flash 30.7 33.2 43.5 8.4 11.8 Total Micrologic $ 67.5 $ 60.2 $ 68.3 $ 14.8 $ 19.5 Other Devices Serial Communications Controllers $ 12.0 $ 12.8 $ 14.4 $ 2.8 $ 4.0 IrDA Transceivers 1.0 1.1 2.1 0.3 1.0 Modems 0.7 1.0 2.8 1.6 0.6 Television, PC Peripherals and Other 0.8 3.7 4.4 0.7 0.7 Other Devices $ 14.5 $ 18.6 $ 23.7 $ 5.4 $ 6.3 Subtotal - Base business 82.0 78.8 92.0 20.2 25.8 Foundry services - - 3.6 - 0.2 Net sales $ 82.0 $ 78.8 $ 95.6 $ 20.2 $ 26.0
Three Months EndedTwelve Months Ended
Other Key Indices Other key indices relevant in understanding our business and financial performance include the following metrics:
As of Mar. 31, As of Mar. 31, As of Mar. 27, As of Dec. 31, 2007 2006 2005 2004Days sales outstanding 37 44 56 38 Net sales to inventory ratio 9 9 8 8 Weeks of inventory at distributors 12 10 13 13 Current ratio 2.1 2.0 2.5 2.7
We calculate each of these key metrics based on annual results of operations data and balance sheets data as of the end of the period indicated. Each of these key metrics is described below.
Days sales outstanding (“DSOs”), is a common metric used to analyze how quickly our customers pay us. This metric is influenced largely by the timing of our customer billings and collections. DSOs were 37 days at March 31, 2007, 44 days at March 31, 2006, 56 days at March 27, 2005 and 38 days at December 31, 2004. The March 31, 2007 DSOs reflects greater
37

linearity of shipment and a higher mix of distribution customers that generally tend to pay faster than the average of our EM customers. O
Net sales to inventory ratio is a metric we use to analyze how quickly our investment in inventories is recovered by our
sales. This metric may not be comparable to those other companies use to analyze inventory and is not the same as a typical inventory turns ratio. Our net sales to inventory ratio remained flat from March 31, 2006 to March 31, 2007, on higher sales, at 9 times annual sales, reflecting better alignment of supply and demand and improved lead times from our wafer foundry
ppliers. su
Weeks of inventory at distributors measures the level of inventories on hand at our distributors available for sale to their end customers, and as such, is relative to the level of sales we record for distribution sales. We do not recognize revenue on shipments to distributors who have rights of return and/or price protection on unsold merchandise held by them until our distributors resell our products to their end customers. We generally target 10 to 13 weeks of inventory in the distribution channel to allow these distributors to react to market demand and buffer the cycle time of reordering new product from us and awaiting delivery. As of March 31, 2007, our distributor inventory levels were at 12 weeks and were within our target range.
Current ratio represents current assets divided by current liabilities and is commonly used to assess a company’s liquidity. The Company uses this ratio to make spending determinations on discretionary items. Comparison of Financial Results Fiscal Year Ended March 31, 2007 and March 31, 2006
Net Sales
Revenue from product sales to OEM customers is recognized upon title transfer, which generally occurs upon
shipment, net of appropriate allowances for returns and warranty costs that are recorded at the time revenue is recognized. The Company recognizes revenue on sales to distributors who have rights of return and price protection on unsold merchandise held by them when products are resold by the distributors to end-users, or as we refer to it, on the sell through method of revenue recognition.
Net sales were $82.0 million in fiscal year 2007, as compared to net sales of $78.8 million in fiscal year 2006. Our net sales increase of $3.2 million or 4% includes an increase in overall Micrologic net sales of $7.3 million or 12%, partially offset by a decrease in net sales of our other devices. The increase in Micrologic net sales is driven by an increase of $6.0 million or 88% in embedded flash net sales, an increase of $3.8 million or 19% in our remote control business, partially offset by a decrease of $2.5 million or 8% in our non-flash net sales. The 88% increase in our embedded flash products reflects higher levels of sales in Z8Encore!, Z8Encore!XP and EZ80 Acclaim devices.
Net sales of our other devices decreased by $4.1 million or 22% reflecting a $2.9 million decrease in TV product net
sales, a decrease of $0.8 million in serial communications controllers net sales and a decrease of $0.3 million in net sales of modem products, driven by a technology migration by our largest modem OEM customer from a hardware-driven solution to an internally developed software-operated modem. The TV and peripheral products have continued to decline as customers have migrated away from 8-bit analog devices to alternative solutions for digital TV.
Gross Margin
Our cost of sales primarily represents the cost of producing our products, including wafer fabrication, assembly and test expenditures. Cost of sales fluctuates depending on materials and services prices from our vendors, manufacturing efficiency and productivity of our test operation, product mix, and product yield performance.
Gross margin as a percent of net sales was 48% in fiscal year 2007 as compared to 42% in fiscal year 2006. Our gross
margin improvement in fiscal 2007 reflects higher volumes on new products and lower associated supplier costs, as well as design and manufacturing improvements, resulting in lower unit costs. Gross margins on our flash products continue to improve as sales demand and volumes grow, allowing us to obtain lower wafer pricing from our suppliers.
We have focused on manufacturing cost controls, yield enhancements and price management and have continued to
consolidate and streamline our manufacturing activities by closing our 8-inch MOD III wafer facility in January 2002 and our 5-inch MOD II wafer facility in July 2004. We operate with a fully fabless model and outsource all of our wafer manufacturing needs from foundries in the United States and Taiwan. We have the flexibility to use lower geometry fab
38

processes from our suppliers for design, allowing us to reduce the physical size of our flash products, which has allowed us to prove our gross margins on these products. im
We have continued to multi-source our product assembly activities with several Asian suppliers to enhance our supply
source flexibility and obtain continued competitive vendor pricing.
Research and Development Expenses
Research and development expenses were $20.5 million in fiscal 2007, as compared to $21.0 million in fiscal 2006. Research and development expenses for 2007 included approximately $0.3 million in stock based compensation expense as a result of our adoption of SFAS 123R at the beginning of the fiscal year. The overall reduction in our research and development expenses in fiscal 2007 was the result of lower variable program costs as product platform development activity was completed.
In March 2007, we initiated actions to consolidate our research and development activities from 4 sites to 2 sites by
closing our Seattle, Washington and Shanghai, China design centers. Although we have taken these actions to consolidate our research and development activities which are designed to reduce our overall spending, our research and development efforts were, and continue to be, primarily directed towards the development of core micrologic devices and the associated design tools. Our design resources are focused on servicing the segments of the 8 and 16-bit markets where more complexity and greater value can be obtained from our solutions by the customer.
We continue to focus our resources on our CRIMZON consumer solutions family of products targeted at the Universal
remote control market. Additionally, we are focused on our new 32-bit ARM based portfolio of products initially targeted to support secured transaction opportunities in the point of sale markets.
Selling, General and Administrative Expenses
Selling, general and administrative (“SG&A”) expenses were $22.7 million in fiscal 2007, as compared to $23.7 million in fiscal 2006. SG&A costs were lower in fiscal 2007 even after including a $1.0 million increase in stock-based compensation expense as a result of our adoption of SFAS 123R at the beginning of the fiscal year. The decrease in SG&A expenses is primarily due to savings from cost reduction programs to reduce headcount in our sales and marketing support functions, as well as savings from the consolidation of certain administrative functions in our Philippines operations. These savings were partially offset by higher marketing costs associated with new products and their market introductions and costs to support intellectual property activity.
Special Charges
Special charges in fiscal 2007, fiscal 2006, the three month transition period ended March 27, 2005 and the twelve
months ended December 31, 2004 were as follows (in millions):
Mar. 31, Mar. 31, Dec. 31, Mar. 27, Mar. 28,
2007 2006 2004 2005 2004Asset impairments: MOD II asset impairment (a) $ - $ 0.5 $ 5.4 $ - $ - MOD II assets, gain on sale of equipment - - (1.7) - -
Restructuring of operations: Engineering consolidation severance and termination benefits 1.0 - - - - Other employee severance and termination benefits 0.8 1.7 0.3 - 0.1 MOD II employee severance and termination benefits - - 1.8 - - MOD II sustaining costs and other costs to close facility 0.6 0.7 3.2 0.3 - MOD III sustaining costs for post-closure maintenance - 0.4 1.7 0.1 0.3 MOD III reimbursement of maintenance costs (a) - (0.8) (4.9) - - Other - - - - 0.1 Professional fees (reimbursement) for debt restructuring - (0.1) 0.1 - - Total Special Charges $ 2.4 $ 2.4 $ 5.9 $ 0.4 $ 0.5
Three Months EndedTwelve Months Ended
(a
) Asset impairment items and reimbursements were not included in the provision accruals in the following table
39

The following table details the beginning accrual balance as of December 31, 2004 and the accrued special charges for the twelve months ended March 31, 2007, March 31, 2006 and the three month transition period ended March 27, 2005 (in millions):
Severance
and MOD III MOD IITermination Debt Closure Closure
Benefits Restructuring Costs Costs TotalBalance at December 31, 2004 $ 0.3 $ - $ - $ 0.7 $ 1.0 Cash payments (0.2) - - (0.4) (0.6) Balance at March 27, 2005 0.1 - - 0.3 0.4 Provisions to special charges 1.7 (0.1) 0.4 0.7 2.7 Cash payments (1.8) 0.1 (0.4) (0.9) (3.0) Balance at March 31, 2006 - - - 0.1 0.1 Provisions to special charges 1.8 - - 0.6 2.4 Cash payments (0.6) - - (0.7) (1.3) Balance at March 31, 2007 $ 1.2 $ - $ - $ - $ 1.2
Fiscal 2007 Activities As part of the our ongoing efforts to reduce costs and streamline activities, in March 2007, a plan of action was initiated to
consolidate certain research and development activities and transfer certain of these activities from our Shanghai, China and Seattle, Washington facilities to our San Jose, California and Meridian, Idaho facilities. During fiscal 2007, we incurred $1.0 million of severance and benefits costs related to this restructuring activity, which has been recorded as special charges. Other severance and benefit related costs of $0.8 million were incurred as a result of the resignation of our former CEO, James M. Thorburn and the hiring of our current CEO, Darin G. Billerbeck. In addition, we continued to incur period expenses to sustain the dormant MOD II facility included in assets held for sale on the consolidated balance sheet as of March 31, 2007. In May 2007, the MOD II facility was sold for a net sales price of $3.1 million.
Fiscal 2006 Activities In April 2005, we initiated a plan of action to consolidate certain support activities and transfer certain of these activities
to our Philippines operations. Total severance and benefits costs of $1.7 million related to a reduction-in-force and support activity consolidation were recorded as special charges during fiscal 2006, and the remaining amount was recorded over the terminated employee’s required service periods completed during the quarter ended June 30, 2006. During fiscal 2006, we incurred $2.4 million of special charges, including the net reimbursement of $0.8 million of MOD III sustaining and maintenance costs and period expenses of $0.7 million to sustain the dormant MOD II facility which is included in assets held for sale of $1.8 million on the consolidated balance sheet as of March 31, 2006.
Stock-Based Compensation
During fiscal 2007, we recognized $1.4 million of stock-based compensation expense, as compared to $0.7 million during fiscal 2006, primarily in connection with the award of restricted stock and stock options to certain executives and employees. This non-cash stock-based compensation expense is included in our research and development and selling, general and administrative expenses. Stock-based compensation expense for employee stock awards was measured on the award date and is being recognized over the vesting period of these awards.
Amortization of Intangible Assets
Effective January 1, 2002, we adopted the provisions of SFAS 142, “Goodwill and Other Intangible Assets.” Under SFAS 142, goodwill and intangible assets with indefinite lives are not amortized, but are reviewed annually or more frequently if impairment indicators arise. Separable intangible assets that are deemed to have defined lives will continue to be amortized over their useful lives. In connection with our fresh-start reporting, separable intangible assets based on independent valuations were created with deemed defined lives. These intangible assets are being amortized utilizing the pattern-of-use method over their estimated useful lives of 3 to 7 years for current technology and ten years for brand name. We evaluate existing technology and brand name whenever events and circumstances indicate that their fair value may be less than their carrying value and, if appropriate, record an impairment charge. Additionally, goodwill is tested for
40
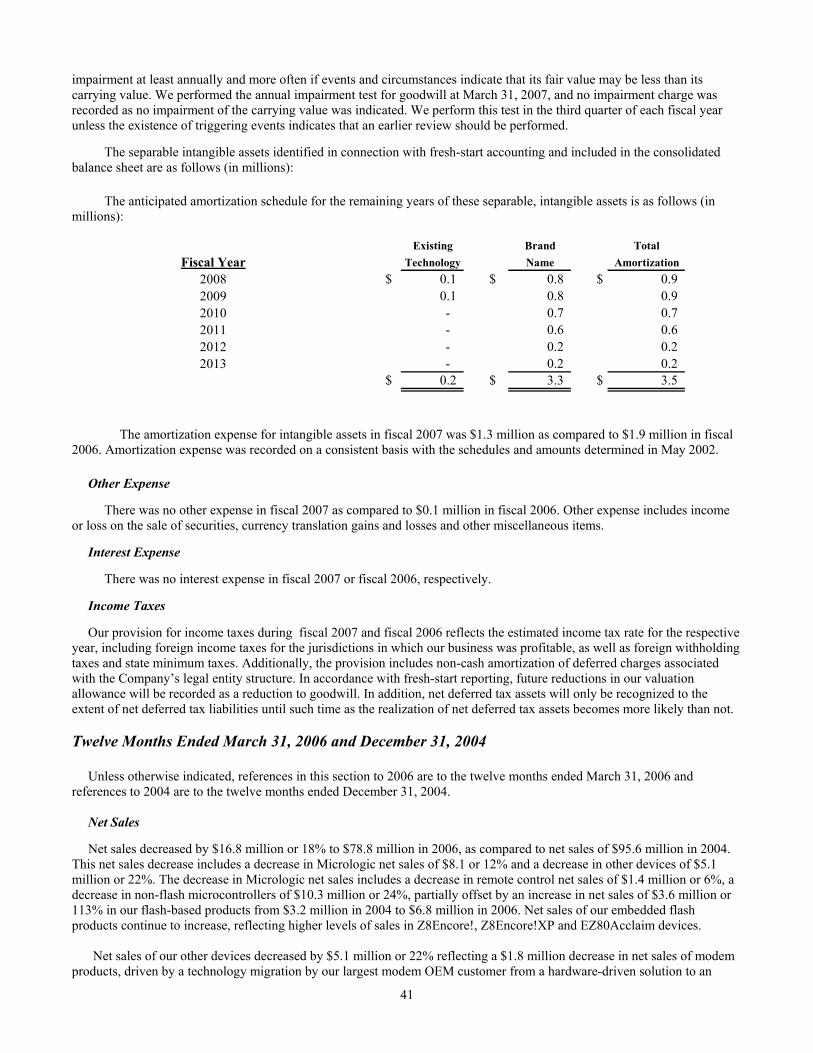
impairment at least annually and more often if events and circumstances indicate that its fair value may be less than its carrying value. We performed the annual impairment test for goodwill at March 31, 2007, and no impairment charge was recorded as no impairment of the carrying value was indicated. We perform this test in the third quarter of each fiscal year unless the existence of triggering events indicates that an earlier review should be performed.
The separable intangible assets identified in connection with fresh-start accounting and included in the consolidated balance sheet are as follows (in millions):
The anticipated amortization schedule for the remaining years of these separable, intangible assets is as follows (in millions):
Existing Brand TotalFiscal Year Technology Name Amortization
2008 $ 0.1 $ 0.8 $ 0.9 2009 0.1 0.8 0.9 2010 - 0.7 0.7 2011 - 0.6 0.6 2012 - 0.2 0.2 2013 - 0.2 0.2
$ 0.2 $ 3.3 $ 3.5
The amortization expense for intangible assets in fiscal 2007 was $1.3 million as compared to $1.9 million in fiscal 2006. Amortization expense was recorded on a consistent basis with the schedules and amounts determined in May 2002.
Other Expense
There was no other expense in fiscal 2007 as compared to $0.1 million in fiscal 2006. Other expense includes income or loss on the sale of securities, currency translation gains and losses and other miscellaneous items.
Interest Expense
There was no interest expense in fiscal 2007 or fiscal 2006, respectively.
Income Taxes
Our provision for income taxes during fiscal 2007 and fiscal 2006 reflects the estimated income tax rate for the respective year, including foreign income taxes for the jurisdictions in which our business was profitable, as well as foreign withholding taxes and state minimum taxes. Additionally, the provision includes non-cash amortization of deferred charges associated with the Company’s legal entity structure. In accordance with fresh-start reporting, future reductions in our valuation allowance will be recorded as a reduction to goodwill. In addition, net deferred tax assets will only be recognized to the extent of net deferred tax liabilities until such time as the realization of net deferred tax assets becomes more likely than not. Twelve Months Ended March 31, 2006 and December 31, 2004
Unless otherwise indicated, references in this section to 2006 are to the twelve months ended March 31, 2006 and
references to 2004 are to the twelve months ended December 31, 2004. Net Sales
Net sales decreased by $16.8 million or 18% to $78.8 million in 2006, as compared to net sales of $95.6 million in 2004.
This net sales decrease includes a decrease in Micrologic net sales of $8.1 or 12% and a decrease in other devices of $5.1 million or 22%. The decrease in Micrologic net sales includes a decrease in remote control net sales of $1.4 million or 6%, a decrease in non-flash microcontrollers of $10.3 million or 24%, partially offset by an increase in net sales of $3.6 million or 113% in our flash-based products from $3.2 million in 2004 to $6.8 million in 2006. Net sales of our embedded flash products continue to increase, reflecting higher levels of sales in Z8Encore!, Z8Encore!XP and EZ80Acclaim devices.
Net sales of our other devices decreased by $5.1 million or 22% reflecting a $1.8 million decrease in net sales of modem
products, driven by a technology migration by our largest modem OEM customer from a hardware-driven solution to an
41

internally developed software-operated modem, a $1.6 million decrease in serial communications controllers net sales, a $1.0 million decrease in IrDA transceiver net sales and a $0.7 million decrease in net sales of our TV and peripheral products.
There were no net sales from our foundry services in 2006 as compared to $3.6 million in 2004. As stated previously,
subsequent to the closure of our MOD II manufacturing facility in Nampa, Idaho in July 2004, foundry sales have been insignificant.
Gross Margin
Gross margin as a percent of net sales was 42% in 2006 as compared to 45% in 2004. Our gross margin decline from 2004 to 2006 reflects the reduction in sales of higher margin legacy products, coupled with the increase in sales of flash-based microcontroller products, which currently generate lower gross margins than some of our more mature product offerings. Gross margins on these flash products continue to improve as sales demand and volumes grow, allowing us to obtain lower wafer pricing from our suppliers.
Research and Development Expenses
Research and development expenses were $21.0 million in 2006, as compared to $20.9 million in 2004.
During 2004, we announced the opening of our China design center in Shanghai, which has subsequently been closed, and expanded our software development group in Bangalore, India to support our growing product portfolio, especially for our remote control products. Additionally, we transferred our engineering groups from Nampa, Idaho to a new technology center in Meridian, Idaho. The group supports our design and software development as well as foundry technology development.
Selling, General and Administrative Expenses
Selling, general and administrative expenses were $23.7 million in 2006 as compared to $29.6 million in 2004. The lower SG&A expenses in 2006 as compared to 2004 is primarily due to savings from cost reduction programs to reduce headcount in our sales and marketing support functions, as well as savings from the consolidation of certain administrative functions in our Philippines operations. These savings were partially offset by higher marketing costs associated with new products and their market introductions, increased costs to support Sarbanes-Oxley activities, and incremental legal costs, including costs related to the Microchip lawsuit.
Special Charges 2006 Activities In April 2005, we initiated a plan of action to consolidate certain support activities and transfer certain of these activities
to our Philippines operations. Severance and benefits costs of $1.7 million related to special charges were recorded related to a reduction-in-force and support activity consolidation implemented and effectively completed as of March 31, 2006. In addition, we incurred annual period expenses to sustain the dormant MOD II facility, which is included in assets held for sale on the balance sheet as of March 31, 2006. During 2006, we incurred $2.4 million of special charges, including the net reimbursement of $0.8 million of MOD III sustaining and maintenance costs. In February 2006, ZiLOG MOD III, Inc. completed the sale of its remaining assets to Micron Technology, Inc. and the shareholders voted to liquidate the special purpose entity.
Special Charges 2004 Activities
On April 16, 2004, we announced the closure of our MOD II five-inch wafer manufacturing facility in Nampa, Idaho and the related transfer of MOD II production activities to our foundry partner, X-Fab, in Lubbock, Texas. MOD II ceased production operations on July 9, 2004. As a result, in 2004, we incurred $1.8 million of employee termination benefits related to the termination of 144 employees, and $3.2 million in sustaining costs for post-closure maintenance of the MOD II facility and preparation to sell the equipment. Additionally, MOD III sustaining costs for post-closure maintenance incurred by us in 2004 totaled $1.7 million, which was offset in the consolidated statements of operations by approximately $4.9 million reimbursement for sustaining costs incurred since 2002 from the sale of the MOD III equipment to STMicroelectronics in
ly 2004. Ju
As a result of the closure of MOD II, in 2004 we incurred the following special charges:
• employee severance and termination benefits of $1.8 million;
42

• an asset impairment charge of $5.4 million related to the write-down of the MOD II long-lived assets;
• a net gain on sale of assets of $1.7 million related to the subsequent sale of the MOD II wafer manufacturing
equipment (and related assets) to STMicroelectronics in the fourth quarter of 2004; and
• MOD II sustaining costs of $3.2 million related to the closure and maintenance of the facility.
The sustaining costs for MOD II and MOD III consist of utilities, taxes, insurance, and other maintenance costs required to maintain the facilities in a condition required for the sale of the respective properties.
Approximately $0.1 million of special charges during 2004 relate to third-party professional legal service fees associated with our debt and equity restructuring in May 2002, and $0.3 million of special charges related to severance and termination benefits related to our continued efforts to align infrastructure costs to business-level requirements.
Stock-Based Compensation
During 2006, we recognized $0.7 million of stock-based compensation expense as compared to $2.0 million during 2004, primarily in connection with the award of restricted stock and stock options to certain executives, employees and consultants at exercise prices below their deemed fair value on the dates of award. This non-cash stock-based compensation expense is primarily included in our selling, general and administrative expenses. Stock-based compensation expense for employee stock awards was measured on the award date and is being recognized over the vesting period of these awards. During 2004, we issued stock options below the then fair value to Mr. Thorburn and in conjunction, cancelled restricted stock which was awarded during May 2002 in accordance with our stockholder approved plan of reorganization. The value of the stock options issued to Mr. Thorburn was equivalent to the value of the restricted shares cancelled.
Amortization of Intangible Assets
Effective January 1, 2002, we adopted the provisions of SFAS 142. Under SFAS 142, goodwill and intangible assets
with indefinite lives are not amortized, but are reviewed annually or more frequently if impairment indicators arise. Separable intangible assets that are deemed to have defined lives will continue to be amortized over their useful lives. In connection with our fresh-start reporting, separable intangible assets based on independent valuations were created with deemed defined lives. These intangible assets are being amortized utilizing the pattern-of-use method over their estimated useful lives of 3 to 7 years for current technology and ten years for brand name. We evaluate existing technology and brand name whenever events and circumstances indicate that their fair value may be less than their carrying value and, if appropriate, record an impairment charge. Additionally, goodwill is tested for impairment at least annually and more often if events and circumstances indicate that its fair value may be less than its carrying value. We performed the annual impairment test for goodwill at September 30, 2004 and at March 31, 2006, and no impairment charge was recorded as no impairment of the carrying value was indicated. We perform this test in the fourth quarter of each fiscal year unless the existence of triggering events indicates that an earlier review should be performed.
Other Expense
Other expense was $0.1 million in 2006 as compared to none in 2004. Other expense includes income or loss on the le of securities, currency translation gains and losses, and other miscellaneous items. sa
Interest Expense
There was no interest expense in 2006 as compared to $0.2 million in 2004. During 2004, our interest expense was
associated with debt outstanding on our revolving line of credit. The outstanding debt was repaid in 2004 and the facility xpired on May 13, 2005. e
Income Taxes
Our provision for income taxes during 2006 and 2004 reflects the estimated income tax rate for the respective year,
including foreign income taxes for the jurisdictions in which our business was profitable as well as foreign withholding taxes and state minimum taxes. Additionally, the provision includes non-cash amortization of deferred charges associated with the Company’s legal entity structure. In accordance with fresh-start reporting, future reductions in our valuation allowance will be recorded as a reduction to fresh-start goodwill. In addition, net deferred tax assets will only be recognized to the extent of net deferred tax liabilities until such time as the realization of net deferred tax assets becomes more likely than not.
43

Three Month Transition Period Ended March 27, 2005 and Three Months Ended March 28, 2004
Net Sales
Net sales were $20.2 million for the three months ended March 27, 2005, as compared to $26.0 million for the same period of 2004.
Net sales of our Micrologic devices decreased to $14.8 million for the three months ended March 27, 2005 as
compared to $19.5 million for the three months ended March 28, 2004. Our new embedded flash sales increased to $1.1 million for the three months ended March 27, 2005 as compared to $0.4 million for the three months ended March 28, 2004. The increases in our flash sales were offset by a decrease in our non-flash micrologic business of 28%. The decrease in sales of our non-flash micrologic products reflects lower sales in our IR remote-control business, reflecting lower demand in the Satellite TV market, and reduced sales of our Z8 products, reflecting slower sales in the consumer and security markets and generally slower economic conditions.
Net sales of our other devices for the three months ended March 27, 2005, declined $0.9 million or 14% to $5.4 million as compared to $6.3 million for the same period of 2004. The decrease in net sales of other devices during the three months ended March 27, 2005 as compared to the three months ended March 28, 2004 reflects a decrease in sales of our Serial Communications Controllers and IRDA devices primarily to the communications market, offset by an increase in sales of our modem devices.
We had no sales related to foundry services for the three months ended March 27, 2005, as compared to $0.2 million for the same period of 2004, as we effectively exited this business when we closed our MOD II 5-inch wafer manufacturing facility in July 2004 and transferred production to our foundry supplier X-fab. This was the final stage of our migration to a fully fabless manufacturing model.
Gross Margin
Gross margin as a percent of net sales was 38% for the three months ended March 27, 2005, down from a gross margin of 52% for the same period of 2004. During the three months ended March 27, 2005, our gross margin was materially adversely impacted by increased sales of lower margin modem devices, $0.3 million of product transfer costs associated with the closure of our MOD II wafer fab and under utilization of our test operations as we lowered our production volumes and reduced our inventory levels.
Research and Development Expenses
Research and development expenses were $5.2 million for the three months ended March 27, 2005, reflecting a 2% increase from the $5.1 million in research and development expenses reported for the three months ended March 28, 2004. Research and development spending reflected continued investments in new products, including our latest line of Flash-based Microcontrollers, the Z8Encore!XP™, IR remote control, general purpose Microcontrollers, adding peripheral features to our Z8Encore! and eZ80Acclaim! product lines as well as new devices and software features for our Crimzon line of consumer solution products.
Selling, General and Administrative Expenses
Selling, general and administrative expenses increased to $7.4 million for the three months ended March 27, 2005 from $6.8 million for the three months ended March 28, 2004. The increase in our selling, general and administrative spending reflects the impact of additional expenses of approximately $1.0 million associated with Sarbanes-Oxley compliance activities, offset by reductions in spending including lower commissions on lower sales, lower payroll costs reflecting lower headcount, and lower program costs.
44

Special Charges and Credits
Special charges and credits for each period indicated were as follows (in millions):
he following table summarizes activity in accrued special charges (in millions):
During the three months ended March 27, 2005, special charges totaled $0.4 million, comprised of $0.3 million and
$0.1 mil espectively, associated with sustaining costs of our MOD II and MOD III wafer fabs. During the three months ended M
Based Compensation
March 27, 2005 and March 28, 2004, we recognized $0.3 million and $0.4 million of ock-based compensation, respectively, in connection with the award of restricted stock and stock options to certain
executivwards
oodwill and Intangible Assets
e assets recorded in the three months ended March 27, 2005 was $0.6 million as compared to $1.1 million in the three months ended March 28, 2004. The amortization was recorded on a consistent basis with the
ovision for the three months ended March 27, 2005 reflects amortization of deferred tax charges and tax expense in its profitable foreign jurisdictions. Our income tax benefit for the quarter ended March 28, 2004 reflected our antic h
March 27, March 28,2005 2004
Restructuring of operations: Employee severance and termination benefits $ - $ 0.1 MOD II sustaining costs for post closure maintenance 0.3 - MOD III sustaining costs for post closure maintenance, net of recovery 0.1 0.3 Other - 0.1
$ 0.4 $ 0.5
T
Severanceand MOD II
Termination ClosureTotal Benefits Costs
Balance at December 31, 2004 $ 1.0 $ 0.3 $ 0.7 Cash paid before MOD III reimbursement (0.6) (0.2) (0.4) Balance at March 27, 2005 $ 0.4 $ 0.1 $ 0.3
lion, rarch 28, 2004, we sold certain assets of MOD II totaling $0.1 million, which were recorded through special charges,
and certain assets of MOD III totaling $0.1 million, the recovery of which was recorded as an offset to the maintenance costs of the facility.
Stock-
During the three months endedst
es, employees, and consultants. Stock-based compensation expense for employee stock awards are measured on the award date and are recognized as the restrictions lapse. Charges for stock awards to consultants are measured as the avest and are recognized over the periods that the restrictions lapse.
G
Amortization expense for intangibl
schedules and amounts determined in May 2002.
Income Taxes
Our income tax pr
ipated effective tax rate for the entire year of 2004. Additionally, our tax provision for the three months ended Marc28, 2004 included taxable income in the U.S. resulting from items that were expensed for book purposes but were nondeductible for tax, including amortization of intangible assets.
45

Quarterly Results (Unaudited)
The following table presents unaudited quarterly financial information for each of the quarters in the eight-quarter period
ding
Our net sales generally decline in the December quarter reflecting the seasonality of our consumer based product sales and th
Overall, our gross margin as a percentage of net sales enerally improved on a sequential quarterly basis from the quarte
Our research and development expenses have remained relatively consistent since the September quarter of 2005 reflect ices
Our selling, general and administrative expenses were generally lower during the quarterly periods of 2007 as comp s and
l
For the Quarters Ended
ended March 31, 2007. The Company’s fiscal year-end is March 31 effective with the reporting dates after our transition period ending on March 27, 2005. Interim results are based on fiscal quarters of thirteen weeks of duration enon the last Saturday of each quarter.
Mar. 31, Dec. 30, Sep. 30, Jul. 01, Mar. 31, Dec. 31, Sep. 30, Jun. 30,2007 2006 2006 2006 2006 2005 2005 2005
Net sales $ 19.1 $ 20.7 $ 21.2 $ 21.0 $ 20.1 $ 17.6 $ 20.5 $ 20.6 Cost of sales 10.1 11.0 11.4 10.5 11.3 9.7 12.4 12.0 Gross margin 9.0 9.7 9.8 10.5 8.8 7.9 8.1 8.6 Gross margin as a percentage of
net sales 47% 47% 46% 50% 44% 45% 40% 42%Operating Expenses: Research and development 5.1 5.2 5.0 5.2 5.0 5.2 5.6 5.2 Selling, general and administrative 5.6 5.3 5.8 6.0 6.0 5.0 5.6 7.1 Special charges and credits 1.3 0.1 0.9 0.1 (0.1) 0.3 0.7 1.5 Amortization of intangible assets 0.3 0.3 0.3 0.4 0.3 0.6 0.5 0.5 Operating loss (3.3) (1.2) (2.2) (1.2) (2.4) (3.2) (4.3) (5.7) Other income (expense): Interest income 0.3 0.2 0.3 0.3 0.2 0.2 0.2 0.2 Other, net - - - - - (0.1) - - Loss before provision for
income taxes (3.0) (1.0) (1.9) (0.9) (2.2) (3.1) (4.1) (5.5) Provision for income taxes 0.6 0.6 0.4 0.6 0.6 - 0.7 0.6 Net loss $ (3.6) $ (1.6) $ (2.3) $ (1.5) $ (2.8) $ (3.1) $ (4.8) $ (6.1)
Net loss per share - basic & diluted $ (0.21) $ (0.10) $ (0.14) $ (0.09) $ (0.16) $ (0.19) $ (0.29) $ (0.38)
(in millions, except per share data)
e timing of distributor inventory management cycles.
gr ended June 30, 2005 through the quarter ended March 31, 2007. Gross margins on our embedded flash products
continue to improve as sales demand and volumes increase allowing us to obtain lower wafer pricing from our suppliers.
ing our product development efforts on our embedded flash-based microcontroller devices, our remote control devand our new 32-bit ARM based products. We have expanded our Bangalore, India software development center for the increased needs of our growing remote control product portfolio and opened a new technology development center in Meridian, Idaho to support our design capabilities and our wafer fabrication sourcing strategies.
ared with 2006 and 2005 primarily due to savings from cost reduction programs to reduce headcount in our salemarketing support functions, as well as savings from the transition and consolidation of certain administrative functions in our Philippines operations. These savings were partially offset by costs to support Sarbanes-Oxley activities and incrementacosts associated with the Microchip lawsuit.
46

Our special charges and credits for the eight quarterly periods ended March 31, 2007 are summarized below:
bless model for manufacturing. The special charges over these periods have generally been aligned around this strategy. dditionally, we have continued to resize our support organizations to a lower sales base in an effort to scale down these
organ
ebt or bank borrowings outstanding. We had cash and cash equivalents of $19.4
i t March 31, 2006, $33.6 million at March 27, 2005 and $37.7 million at December 31, 04. Cash and cash equivalents consist primarily of cash in bank accounts and money market accounts.
During fiscal 2007, net cash used in operating activities was $1.7 million as compared to net cash used of $6.4 million
du e in net cash used is primarily the result of higher net sales of $3.2 million, higher ross margins of $5.6 million, lower operating expenses of $2.1 million primarily driven by lower headcount costs, all of wh
illion. Non-cash charges include amortization of fresh-start intangibles of $1.9 million, $2.6 million of depreciation and other amort
sets of ion and
and liability changes totaling $6.5 million. Non-cash
For the Quarters Ended
As previously discussed, we have focused our business around our core microcontrollers solutions and moving to a
Mar. 31, Dec. 30, Sep. 30, Ju1. 1, Mar. 31, Dec. 31, Sep. 30, Jun. 30,2007 2006 2006 2006 2006 2005 2005 2005
Asset impairments: MOD II assets write-down, net $ - $ - $ - $ - $ 0.5 $ - $ - $ - Restructuring of operations:
Engineering consolidation severance and termination benefits 1.0 - - - - - - - Other employee severance and termination benefits 0.1 - 0.7 - 0.1 0.1 0.5 1.0 MOD II sustaining costs for post-closure maintenance 0.2 0.1 0.2 0.1 0.1 0.1 0.1 0.4 MOD III sustaining costs for post-closure maintenance - - - - - 0.1 0.1 0.2 MOD III reimbursement of maintenance costs - - - - (0.7) - - (0.1) Professional fees for debt
restructuring - - - - (0.1) - - - $ 1.3 $ 0.1 $ 0.9 $ 0.1 $ (0.1) $ 0.3 $ 0.7 $ 1.5
(in millions)
faA
izations and focus the activities around these strategies.
Liquidity and Capital Resources
At March 31, 2007, we had no dllion as compared to $27.0 million am
20
Cash Flows from Operating Activities
ring fiscal 2006. The $4.7 million decreas gich contributed to our lower net loss of $9.0 million as compared to a net loss of $16.8 million in fiscal 2006, an
increase in non-cash charges of $2.7 million including an adjustment to decrease goodwill for tax reserves on which the statute of limitations expired during fiscal 2007, partially offset by certain net asset and liability changes of $5.8 million including an increase in inventory changes of $3.9 million to support the increase in sales of embedded flash products and an increase in accounts payable changes of $2.1 million primarily associated with our lower operating expenses.
During fiscal 2006, net cash used in operating activities of $6.4 million primarily reflected our net loss of $16.8
million, partially offset by non-cash charges of $7.6 million and certain net asset and liability changes of $2.8 m
ization, goodwill adjustments of $1.9 million, stock-based compensation expense of $0.7 million and an asset impairment charge on our remaining assets held for sale of $0.5 million. Reduction of inventories of $3.0 million, reduction of net accounts receivable of $2.9 million, and a reduction of prepaid expenses and other current and non-current as$2.1 million all provided cash from operating activities and were offset by decreases in accounts payable of $1.7 millaccrued and other current and non-current liabilities of $3.6 million.
During 2004, net cash used in operating activities of $0.5 million primarily reflected our net loss of $18.5 million,
offset by net non-cash charges of $11.5 million and certain net asset
47

charg ncluded $8.3 million in goodwill adjustments, $4.2 million for amortization of fresh-start intangible assets, $3.0 millio ets,
ion.
d
$1.0 m llion. Non-cash charges included amortization of fresh-start intangible assets of $0.6 million, depreciation and other amort
es in of depreciation and other amortization charges, $5.6 million of asset impairments and loss on disposal of fixed ass
and stock-based compensation expense of $2.0 million, offset by a reduction of deferred income tax assets and liabilities of$9.9 million and a net gain on the sales of MOD II assets of $1.7 million. Reductions in net accounts receivable of $3.0 million, prepaid expenses and other current and non-current assets of $2.8 million, an increase in accounts payable of $3.7 million and accrued and other liabilities of $0.9 million, all provided cash from operating activities in 2004 and were offset by an increase in inventories of $2.5 million and a reduction in deferred income on shipments to distributors of $1.4 mill
During the three months ended March 27, 2005, net cash used in operating activities of $ 4.1 million primarily reflecte
the net loss of $6.6 million, partially offset by non-cash charges of $1.5 million and certain net asset and liability changes of i
ization of $0.6 million and $0.3 million of stock-based compensation expense. The reduction in inventories of $1.5 million, reduction of prepaid expenses and other current and non-current assets of $1.6 million and an increase of $1.2 million in accrued and other current and non-current liabilities all provided cash from operations and were offset by an increase in net accounts receivable of $2.5 million and a reduction of accounts payable of $0.8 million.
During fiscal 2007, net cash used in investing activities was $6.4 million, an increase of $6.1 million as compared to $0 vesting activities in fiscal 2007, primarily reflects the $2.9 million payment to
iLOG MOD III, Inc. Series A Preferred shareholders for the remaining net proceeds upon liquidation of the special purpose entity
31,
and the OD III assets and
assets held for sale of $4.6 million. The capital expenditures primarily reflect the addition of test capacity driven by increa
II ed software purchases
for ou expanding research and development group and included design circuit software support.
reflected capital expen itures for building improvements, software and equipment. Cash used in investing activities during the three months ended
llion in fiscal 2006, $14.7 million in 20 nded March 27, 2005.
ans of $0.2 million, offset by cash used for the purchase of common stock of $0.1 million.
offset y the repayment of short-term debt related to the revolving credit facility of $5.0 million and purchases of common stock
nce of common stock under employee stock plans.
Cash Flows from Investing Activities
.3 million in fiscal 2006. Cash used in inZ
, capital expenditures of $2.1 million and costs of $1.4 million incurred for the decommissioning of primarily land and buildings of our MOD II facility, which is classified as assets held for sale on the consolidated balance sheets as of March 2007. The capital expenditures primarily reflect the addition of test equipment to support increased demand for our embedded flash products and system and software upgrades to support Oracle systems and applications.
Net cash used in investing activities in fiscal 2006 of $0.3 million reflected capital expenditures of $4.2 million
reimbursement of MOD III sustaining costs of $0.7 million, offset by the proceeds from the disposal of M
sed demand of our new embedded flash products and software purchases related to the upgrade of manufacturing software and hardware and software related to continued research and development investments.
Net cash provided by investing activities in 2004 of $1.5 million, reflected the proceeds from the disposal of MOD
assets of $5.9 million, offset by capital expenditures of $4.4 million. The capital expenditures reflectr Net cash used in investing activities was $0.2 million and $0.7 million for the three month periods ended March 27,
2005 and March 28, 2004, respectively. Cash used for investing activities in both of these periods d March 27, 2005 also included the cash received from the sale of MOD II assets.
Cash Flows from Financing Activities
Net cash provided by financing activities was $0.5 million in fiscal 2007, $0.1 mi
04 and $0.2 million for the three months e
Net cash provided by financing activities of $0.5 million in 2007 reflects proceeds from the issuance of common stock under employee stock plans.
Net cash provided by financing activities of $0.1 million in 2006 reflected the proceeds from the issuance of common
stock under employee stock pl Net cash provided by financing activities of $14.7 million in 2004 reflected the net proceeds from public stock
offerings of $24.4 million and proceeds from the issuance of common stock under employee stock plans of $0.5 million, b
of $5.2 million. Net cash provided by financing activities of $0.2 million in the three months ended March 27, 2005 reflected the
proceeds from the issua
48

Off-B
As of March 31, 2007, we were not involved in any off-balance sheet arrangements, as defined in Item 303(a)(4)(ii) of
Measure
he EBITDA figures presented below reflect a non-GAAP measure of our liquidity. EBITDA reflects our net income , interest and income taxes.
uidity under generally accepted accounting principles) for each unaudited period presented, is as follows (in millions):
d improvements, internal use software and other items. Decisions related to how much cash is used for investing are influe
We lease certain of our facilities and equipment under non-cancelable operating leases, which expire in fiscal 2008 thr lease agreements generally provide for base rental rates, which increase at various times
ring the terms of the leases and also provide for renewal options at fair market rental value. We are also responsible for comm
ly 1,
Sep. 30, Jul. 1, Mar. 31, Dec. 31, Sep. 30, Jun. 30,
alance Sheet Arrangements
SEC Regulation S-K.
Non-GAAP EBITDA
Tadjusted for certain non-cash items
Our reconciliation of net loss to EBITDA and our reconciliation of EBITDA to net cash provided by (used in) operating activities (the most directly comparable measure of liq
Mar. 31, Dec. 30,For the Quarters Ended
As of March 31, 2007, we had $0.2 million of outstanding firm commitments for capital expenditures. We currently stimate fiscal 2008 capital expenditures will range from 2% - 4% of net sales, and may include purchases of test equipment,
2007 2006 2006 2006 2006 2005 2005 2005
Reconciliation of net lossto EBITDA:Net loss $ (3.6) $ (1.6) $ (2.3) $ (1.5) $ (2.8) $ (3.1) $ (4.8) $ (6.1) Depreciation and amortization 1.1 1.1 1.1 1.1 1.0 1.3 1.2 1.0 Interest income (0.3) (0.2) (0.3) (0.3) (0.2) (0.2) (0.2) (0.1) Provision for income taxes 0.6 0.6 0.4 0.6 0.6 - 0.7 0.6 EBITDA $ (2.2) $ (0.1) $ (1.1) $ (0.1) $ (1.4) $ (2.0) $ (3.1) $ (4.6) Reconciliation of EBITDA to net cash provided by (used in) operating activities:
EBITDA $ (2.2) $ (0.1) $ (1.1) $ (0.1) $ (1.4) $ (2.0) $ (3.1) $ (4.6) Interest income 0.3 0.2 0.3 0.3 0.2 0.2 0.2 0.1 Provision for income taxes (0.6) (0.6) (0.4) (0.6) (0.6) - (0.7) (0.6) Goodwill adjustment 4.5 - - - 1.5 0.4 - - Asset impairments - - - - 0.5 - - - Stock-based compensation 0.4 0.4 0.3 0.3 0.1 0.1 0.1 0.4 Changes in operating assets and liabilities (3.7) (1.8) 2.6 (0.1) (0.9) (0.6) 1.2 3.1
Net cash provided by (used in) operating activities $ (1.3) $ (1.9) $ 1.7 $ (0.2) $ (0.6) $ (1.9) $ (2.3) $ (1.6)
(in millions)
eleasehol
nced by the expected amount of cash to be provided by operations. We currently anticipate that available cash will beadequate to satisfy our cash requirements for at least the next twelve months.
Contractual Obligations
ough fiscal 2014. The facilitydu
on area maintenance charges on certain office leases, which are not included in the table below. These charges are generally less than 10% of base rents. Total operating lease expense, including month-to-month rentals, were approximate$2.1 million, $2.4 million and $2.6 million, for the twelve months ended March 31, 2007, March 31, 2006 and December 3
49

2004, respectively, and $0.6 million and $0.7 million for the three months ended March 27, 2005 and March 28, 2004, respectively.
We generally make purchases under cancelable purchase orders and do not enter into long-term supply agreements. ertain of our wafer foundry, assembly, materials suppliers, software vendors and support tool manufacturers require non-
cancel
of fringement of intellectual property rights and patents arising from the use of our products. During the ordinary course of
busin rred
accrual of
At
ation had a minimal impact on our overall operations during the periods
esented in this report.
easonality
typically increase in the quarter ended June 30 and peak in the quarter ended September 30 driven by creased ho day demand from our customers in the home entertainment and consumer products markets, while sales are
generally though
ccounting Standards
ompany adopted the provisions of SFAS 123R, requiring the recording of expenses lated to the fair value of its stock-based compensation awards. The Company elected to adopt the modified prospective nsition ,
l
n expense
WithinPa
Cable purchase orders since they often provide products and services tailored to our specifications. Summarized in the
table below are minimum future commitments under operating leases and non-cancelable purchase obligations as of March31, 2007 (in millions):
yment due by period
From time to time, we have agreed to indemnify and hold harmless certain customers for potential allegations
Total 1 year 1-3 years 3-5 yearsOperating lease obligations $ 3.9 $ 2.0 $ 1.5 $ 0.4 Purchase obligations 5.3 5.2 0.1 - Total $ 9.2 $ 7.2 $ 1.6 $ 0.4
iness, in certain limited circumstances, we have agreed to reimburse the indemnified party for losses suffered or incu
by the indemnified party, generally parties with which we have commercial relations, in connection with certain intellectual property infringement claims by any third party with respect to its products and services. We have indemnification arrangements that limit our net contingent obligation to pay for defense costs, if any, up to a maximum of $500,000. To date, there have not been any costs incurred in connection with such indemnification arrangements; therefore, there is no such amounts at March 31, 2007. We disclose indemnification liabilities according to FASB Staff Position FIN45-1, "Accounting for Intellectual Property Infringement Indemnifications under SFAS Interpretation No. 45." Under SFAS No. 5, "Loss Contingencies," a claim would be accrued when a loss is probable and the amount can be reasonably estimated.March 31, 2007, no such amounts are accrued.
Effect ation and Changing Prices s of Infl
We believe that inflation and/or defl pr
S
Salesliin
lower in the quarters ended March 31 and December 31 as compared to the June and September quarters, alour trends have fluctuated considerably in the most recent periods. Our sales have been impacted by non-seasonal trends including sales reductions by our major OEM customers and declines in our legacy business, which we expect to continue. Additionally, general world-wide economic, political and regional instabilities may impact our results of operations in any given period.
Adoption of A
Effective April 1, 2006, the Cretra method utilizing the single option attribution approach as permitted by SFAS 123R. Under this transition methodstock-based compensation expense for the twelve month period ended March 31, 2007 includes compensation expense for alstock-based compensation awards granted prior to, but not vested as of, April 1, 2006, based on the grant date fair value estimated in accordance with the original provisions of SFAS 123 and compensation expense for all stock-based compensation awards granted subsequent to April 1, 2006, based on the grant-date fair value estimated using the Black-Scholes option pricing model in accordance with the provisions of SFAS 123R. The total stock-based compensatiorecorded for the twelve month period ended March 31, 2007 was $1.4 million. See Note 6 to the Company’s condensed consolidated financial statements.
50

Stock-based compensation for options or restricted stock awards (“RSAs”) recorded in periods prior to April 1, 2reflects: 1) the difference between th
006 e stock price and the purchase price for options granted or RSAs issued where the grant
price approved by the Board of Directors was lower than the fair market value of the award at the time of grant or 2) the then fair mark
In September 2006, the FASB issued Statement No. 158, “Employers’ Accounting for Defined Benefit Pension and . SFAS 158 requires employers to recognize on their balance sheets the funded
nt benefit plans, as of the end of the fiscal year ending after June 15, 2007. Employers ill reco
N 48 prescribes a recognition threshold and measurement attribute for the financial statement recognition and easure n
f a
et value of stock issued to members of the Board of Directors for services provided in lieu of cash in accordance with their stockholder approved compensation plans. Since the Company's bankruptcy reorganization in 2002, the Company's policy has been to issue options at fair market value. The only exception to that policy was the value-for-value conversion of in-the-money restricted stock held by our former chief executive officer for in-the-money options as previously disclosed. From time to time, the Company has issued shares of restricted stock to employees below fair market value.
Recent Accounting Pronouncements
Other Postretirement Plans” (“SFAS 158”)atus of pension and other postretiremest
w gnize actuarial gains and losses, prior service cost, and any remaining transition amounts from the initial application of Statement of Financial Accounting Standards No. 87 (“SFAS 87”), “Employers’ Accounting for Pensions,” and Statement of Financial Accounting Standards No.106 (“SFAS 106”), “Employers’ Accounting for Postretirement Benefits Other Than Pensions,” when recognizing a plan’s funded status, with the offset to accumulated other comprehensive income. The Company has a defined benefit plan in the Philippines and will adopt the provisions of SFAS 158 for the fiscal year ended March 31, 2008. The Company expects there will be no material impact of this adoption on the Company’s financial statements.
In June 2006, the FASB issued FASB Interpretation No. 48, "Accounting for Uncertainty in Income Taxes - an interpretation of FASB Statement No. 109" ("FIN 48"), which clarifies the accounting for uncertainty in income tax
ositions. FIpm ment of a tax position taken, or expected to be taken, on a tax return. This Interpretation also provides guidance oderecognition, classification, interest, penalties, accounting in interim periods, disclosure and transition. The evaluation otax position in accordance with this Interpretation is a two-step process. The first step will determine if it is more likely thannot that a tax position will be sustained upon examination and should therefore be recognized. The second step will measurea tax position that meets the more likely than not recognition threshold to determine the amount of benefit to recognize in thefinancial statements. FIN 48 is effective for fiscal years beginning after December 15, 2006. The Company will adopt the provisions of FIN 48 in the fiscal year ended March 31, 2008. The Company expects there will be no material impact of this adoption on the Company’s financial statements.
51

ITEM 7A. QUANTITATIVE AND QUALITATIVE DISCLOSURES ABOUT MARKET RISK Interest Rate Risk
Our exposure to market risk for changes in interest rates relates primarily to our short-term investment portfolio. We do not use derivative financial investments in our investment portfolio. Our primary investment objectives are to preserve capital and maintain liquidity. These objectives are met by investing in high-quality credit issuances and limiting the amount of credit exposure to any one company. Our policy is to mitigate default risk by investing in only the highest quality securities and monitoring the credit ratings of such investments. As of March 31, 2007, our cash and cash equivalents of $19.4 million were invested in bank time deposits and money market funds. We have no significant cash flow exposure due to rate changes for our cash equivalents as these instruments have very short maturities.
The table below presents principal amounts and related interest rates for our cash equivalents as of March 31, 2007 (dollars in millions):
Carrying FairValue Value
Cash Equivalents:Fixed rate $ 19.4 $ 19.4 Average interest rate 5.0% -
Foreign Currency Exchange Risk
We transact business in various foreign countries, but the vast majority of our consolidated net sales and purchases are denominated in U.S. dollars. Currently, we do not employ a foreign currency hedging program to mitigate our foreign currency exchange risk related to foreign currency transactions and we believe the risks to date have not been significant. We maintain local currency bank accounts in our international offices to facilitate payment of local operating costs.
ITEM 8. FINANCIAL STATEMENTS AND SUPPLEMENTARY DATA
The following financial statements and supplementary data are provided herein:
Page
Report of Armanino McKenna LLP, Independent Registered Public Accounting Firm 53
Report of KPMG LLP, Independent Registered Public Accounting Firm 54
Consolidated Balance Sheets as of March 31, 2007, March 31, 2006 and March 27, 2005 54
Consolidated Statements of Operations for the twelve months ended March 31, 2007, March 31, 2006, and December 31, 2004, and the three month transition period ended March 27, 2005 56
Consolidated Statements of Cash Flows for the twelve months ended March 31, 2007, March 31, 2006, and December 31, 2004, and the three month transition period ended March 27, 2005 57
Consolidated Statements of Stockholders’ Equity for the twelve months ended March 31, 2007, March 31, 2006, and December 31, 2004, and the three month transition period ended March 27, 2005 58
Notes to Consolidated Financial Statements 59
52

REPORT OF INDEPENDENT REGISTERED PUBLIC ACCOUNTING FIRM The Board of Directors and Stockholders of ZiLOG, Inc.
We have audited the accompanying consolidated balance sheets of ZiLOG, Inc. and subsidiaries (the “Company”) as of March 31, 2007, March 31, 2006 and March 27, 2005, and the related consolidated statements of operations, stockholders' equity, and cash flows for the twelve months ended March 31, 2007 and March 31, 2006, and the three month transition period ended March 27, 2005. In connection with our audits of the consolidated financial statements, we have also audited the financial statement schedule listed in Item 15a (2). These consolidated financial statements and related financial statement schedule are the responsibility of the Company's management. Our responsibility is to express an opinion on these consolidated financial statements based on our audits.
We conducted our audits in accordance with the standards of the Public Company Accounting Oversight Board (United States). Those standards require that we plan and perform the audit to obtain reasonable assurance about whether the financial statements are free of material misstatement. We were not engaged to perform an audit of the Company’s internal controls over financial reporting. An audit includes consideration of internal control over financial reporting as a basis for designing audit procedures that are appropriate in the circumstances, but not for the purpose of expressing an opinion on the effectiveness of the Company's internal control over financial reporting. Accordingly, we express no such opinion. An audit includes examining, on a test basis, evidence supporting the amounts and disclosures in the financial statements. An audit also includes assessing the accounting principles used and significant estimates made by management, as well as evaluating
e overall financial statement presentation. We believe that our audits provide a reasonable basis for our opinion. th
In our opinion, the consolidated financial statements referred to above present fairly, in all material respects, the financial position of ZiLOG, Inc. and subsidiaries as of March 31, 2007, March 31, 2006 and March 27, 2005, and the results of their operations and their cash flows for the twelve months ended March 31, 2007 and March 31, 2006 and the three month transition period ended March 27, 2005, in conformity with U.S. generally accepted accounting principles. Also, in our opinion, the related financial statement schedule, when considered in relation to the consolidated financial statements taken as a whole, presents fairly, in all material aspects, the information set forth therein. /s
/ Armanino McKenna LLP
San Ramon, California June 22, 2007
53

REPORT OF INDEPENDENT REGISTERED PUBLIC ACCOUNTING FIRM The Board of Directors and Stockholders ZiLOG, Inc.:
We have audited the consolidated statement of operations, stockholders’ equity and cash flows of ZiLOG, Inc. and subsidiaries (the Company) for the twelve months ended December 31, 2004. In connection with our audit of the consolidated financial statements, we have also audited the financial statement schedule listed in Item 15a(2). These consolidated financial statements and related financial statement schedule are the responsibility of the Company’s management. Our responsibility is to express an opinion on these consolidated financial statements based on our audit. We conducted our audit in accordance with the standards of the Public Company Accounting Oversight Board (United States). Those standards require that we plan and perform the audit to obtain reasonable assurance about whether the financial statements are free of material misstatement. An audit includes examining, on a test basis, evidence supporting the amounts and disclosures in the financial statements. An audit also includes assessing the accounting principles used and significant estimates made by management, as well as evaluating the overall financial statement presentation. We believe that our audit provides a reasonable basis for our opinion. In our opinion, the consolidated financial statements referred to above present fairly, in all material respects, the stockholders’ equity, and the results of operations and cash flows of ZiLOG, Inc. and subsidiaries for the twelve months ended December 31, 2004, in conformity with U.S. generally accepted accounting principles. Also, in our opinion, the related financial statement schedule, when considered in relation to the consolidated financial statements taken as a whole presents fairly, in all material aspects, the information set forth therein.
/s/ KPMG LLP Mountain View, California March 29, 2005
54

ZiLOG, INC.
CONSOLIDATED BALANCE SHEETS (In millions)
See accompanying notes to the consolidated financial statements.
Mar. 31, Mar. 31, Mar. 27,2007 2006 2005
ASSETSCurrent assets: Cash and cash equivalents $ 19.4 $ 27.0 $ 33.6 Accounts receivable, less allowance for doubtful accounts of $0.1 million at March 31, 2007 and $0.2 million at March 31, 2006 and March 27, 2005, respectively 8.0 9.6 12.5 Inventories, net 8.5 7.6 10.6 Assets held for sale 3.2 1.8 3.4 Deferred tax assets 0.4 0.4 2.7 Prepaid expenses and other current assets 1.8 2.2 2.8 Total current assets 41.3 48.6 65.6
Property, plant and equipment, net 6.5 7.5 5.9 Goodwill 2.2 6.7 8.6 Intangible assets, net 3.5 4.8 6.7 Other assets 2.3 4.0 5.6 Total assets $ 55.8 $ 71.6 $ 92.4
LIABILITIES AND STOCKHOLDERS' EQUITY Current liabilities: Accounts payable $ 6.1 $ 9.9 $ 11.5 Income taxes payable 0.6 0.5 0.5 Accrued compensation and employee benefits 2.8 2.5 3.0 Payable to ZiLOG Mod III, Inc. Series A Preferred shareholders on liquidation of subsidiary - 2.5 - Other accrued liabilities 2.9 2.4 4.3 Deferred income on shipments to distributors 7.1 6.1 6.0 Total current liabilities 19.5 23.9 25.3
Deferred tax liabilities 0.4 0.4 2.7 Other non-current tax liabilities 1.2 5.5 6.6 Total liabilities 21.1 29.8 34.6
Stockholders' equity: Common stock, $0.01 par value; 60.0 million shares authorized: 16.8 million, 16.6 million and 16.3 million shares issued and outstanding at March 31, 2007, March 31, 2006 and March 27, 2005, respectively 0.2 0.2 0.2 Deferred stock compensation - (0.6) (0.4) Additional paid-in capital 124.5 123.2 122.1 Treasury stock (7.2) (7.2) (7.1) Accumulated deficit (82.8) (73.8) (57.0) Total stockholders' equity 34.7 41.8 57.8 Total liabilities and stockholders' equity $ 55.8 $ 71.6 $ 92.4
55
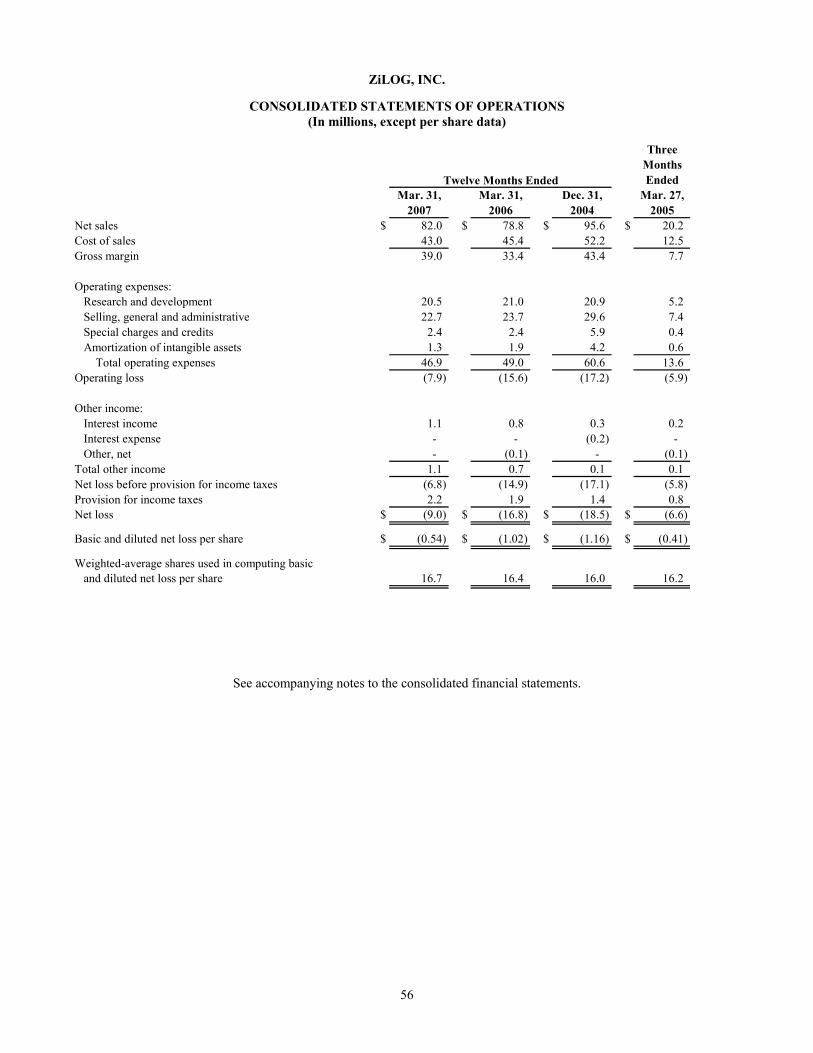
ZiLOG, INC.
CONSOLIDATED STATEMENTS OF OPERATIONS (In millions, except per share data)
ThreeMonthsEnded
Mar. 31, Mar. 31, Dec. 31, Mar. 27,2007 2006 2004 2005
Net sales $ 82.0 $ 78.8 $ 95.6 $ 20.2 Cost of sales 43.0 45.4 52.2 12.5 Gross margin 39.0 33.4 43.4 7.7
Operating expenses: Research and development 20.5 21.0 20.9 5.2 Selling, general and administrative 22.7 23.7 29.6 7.4 Special charges and credits 2.4 2.4 5.9 0.4 Amortization of intangible assets 1.3 1.9 4.2 0.6 Total operating expenses 46.9 49.0 60.6 13.6 Operating loss (7.9) (15.6) (17.2) (5.9)
Other income: Interest income 1.1 0.8 0.3 0.2 Interest expense - - (0.2) - Other, net - (0.1) - (0.1) Total other income 1.1 0.7 0.1 0.1 Net loss before provision for income taxes (6.8) (14.9) (17.1) (5.8) Provision for income taxes 2.2 1.9 1.4 0.8 Net loss $ (9.0) $ (16.8) $ (18.5) $ (6.6)
Basic and diluted net loss per share $ (0.54) $ (1.02) $ (1.16) $ (0.41)
Weighted-average shares used in computing basic and diluted net loss per share 16.7 16.4 16.0 16.2
Twelve Months Ended
See accompanying notes to the consolidated financial statements.
56

ZiLOG, INC.
CONSOLIDATED STATEMENTS OF CASH FLOWS (In millions)
ThreeMonthsEnded
Mar. 31, Mar. 31, Dec. 31, Mar. 27,2007 2006 2004 2005
Cash Flows from Operating Activities: Net loss $ (9.0) $ (16.8) $ (18.5) $ (6.6) Adjustments to reconcile net loss to net cash used in operating activities: Amortization of fresh-start intangible assets 1.3 1.9 4.2 0.6 Depreciation and other amortization 3.1 2.6 3.0 0.6 Deferred income tax assets and liabilities - - (9.9) - Goodwill adjustment 4.5 1.9 8.3 - Loss on disposal of fixed assets - - 0.2 - Asset impairments - 0.5 5.4 - Net gain on sale of MOD II assets held for sale - - (1.7) - Stock-based compensation 1.4 0.7 2.0 0.3 Changes in operating assets and liabilities: Accounts receivable, net 1.6 2.9 3.0 (2.5) Inventories (0.9) 3.0 (2.5) 1.5 Prepaid expenses and other current and non-current assets 2.2 2.1 2.8 1.6 Accounts payable (3.8) (1.7) 3.7 (0.8) Deferred income on shipments to distributors 1.0 0.1 (1.4) - Accrued and other current and non-current liabilities (3.1) (3.6) 0.9 1.2 Net cash used in operating activities (1.7) (6.4) (0.5) (4.1)
Cash Flows from Investing Activities: Assets held for sale - vacant property (1.4) - - - Payable to ZiLOG Mod III, Inc. Series A Preferred shareholders (2.9) - - - Proceeds from disposal of assets held for sale & MOD III assets - 4.6 5.9 0.2 Net reimbursement of MOD III sustaining costs - (0.7) - - Capital expenditures (2.1) (4.2) (4.4) (0.4) Net cash (used in) provided by investing activities (6.4) (0.3) 1.5 (0.2)
Cash Flows From Financing Activities: Repayment of short-term debt - - (5.0) - Purchase of common stock - (0.1) (5.2) - Proceeds from public stock offering, net of offering costs - - 24.4 - Proceeds from issuance of common stock under employee stock plans 0.5 0.2 0.5 0.2 Net cash provided by financing activities 0.5 0.1 14.7 0.2
Net increase (decrease) in cash and cash equivalents (7.6) (6.6) 15.7 (4.1) Cash and cash equivalents at beginning of period 27.0 33.6 22.0 37.7 Cash and cash equivalents at end of period $ 19.4 $ 27.0 $ 37.7 $ 33.6
Supplemental Disclosure of Cash Flow Information: Interest paid during the period $ - $ - $ 0.3 $ - Income taxes paid during the period $ 0.3 $ 0.2 $ 1.5 $ 0.1 Supplemental Disclosure of Non-Cash Investing and Financing Activities: Value of shares repurchased through employee loan cancellations $ - $ - $ 0.6 $ 0.1
Twelve Months Ended
See accompanying notes to the consolidated financial statements.
57

ZiLOG, INC.
CONSOLIDATED STATEMENTS OF STOCKHOLDERS’ EQUITY (In millions)
Deferred Total
Stock Additional Accumu- Stock-
Compen- Paid-in Treasury lated holders’
Shares Amount sation Capital Stock Deficit Equity
Balance at December 31, 2003 14.5 $ 0.1 $ (2.0) $ 96.4 $ (1.9) $ (31.9) $ 60.7
Common stock issued in public offering, net of
offering costs 2.3 - - 24.4 - - 24.4
Issuance of common stock under stock option plans - - - 0.1 - - 0.1
Issuance of common stock under employee stock
purchase plan 0.1 0.1 - 0.3 - - 0.4
Deferred stock compensation - - (0.5) 0.5 - - -
Deferred stock compensation cancellations - - 0.2 (0.2) - - -
Amortization of deferred stock compensation - - 1.6 - - - 1.6
Purchase of treasury shares (0.7) - - - (5.2) - (5.2)
Stock-based compensation expense - - - 0.4 - - 0.4
Net loss and comprehensive loss - - - - - (18.5) (18.5)
Balance at December 31, 2004 16.2 0.2 (0.7) 121.9 (7.1) (50.4) 63.9
Issuance of common stock under stock option plans 0.0 - - 0.1 - - 0.1
Issuance of common stock under employee stock
purchase plan 0.0 - - 0.1 - - 0.1
Amortization of deferred stock compensation - - 0.3 - - - 0.3
Net loss and comprehensive loss - - - - - (6.6) (6.6)
Balance at March 27, 2005 (Transition Period) 16.3 0.2 (0.4) 122.1 (7.1) (57.0) 57.8
Issuance of restricted shares 0.2 - (0.6) 0.6 - - -
Issuance of common stock under employee stock
purchase plan 0.1 - - 0.2 - - 0.2
Deferred stock compensation cancellations - - 0.1 (0.1) - - -
Amortization of deferred stock compensation - - 0.2 - - - 0.2
Amortization of restricted shares - - 0.1 - - - 0.1
Purchase of treasury shares - - - - (0.1) - (0.1)
Stock-based compensation expense - - - 0.4 - - 0.4
Net loss and comprehensive loss - - - - - (16.8) (16.8)
Balance at March 31, 2006 16.6 0.2 (0.6) 123.2 (7.2) (73.8) 41.8
Adoption of SFAS 123R - - 0.6 (0.6) - - -
Issuance of common stock under stock option plans 0.1 - - 0.3 - - 0.3
Issuance of common stock under employee stock -
purchase plan 0.1 - - 0.2 - - 0.2
Stock-based compensation expense - - - 1.4 - - 1.4
Net loss and comprehensive loss - - - - - (9.0) (9.0)
Balance at March 31, 2007 16.8 $ 0.2 $ 0.0 $ 124.5 $ (7.2) $ (82.8) $ 34.7
Common Stock
See accompanying notes to the consolidated financial statements.
58

ZiLOG, INC.
NOTES TO CONSOLIDATED FINANCIAL STATEMENTS N
OTE 1. DESCRIPTION OF BUSINESS AND SUMMARY OF SIGNIFICANT ACCOUNTING POLICIES
Nature of Business
ZiLOG, Inc. (“ZiLOG” or the “Company”) is a worldwide supplier of semiconductor products. The Company designs, develops and markets various families of products in support of the micrologic semiconductor market segment. Using proprietary technology, ZiLOG provides semiconductor devices that its customers design into their end products. These devices typically combine a microprocessor memory, and input and output functions on a single device. ZiLOG’s micrologic devices enable a broad range of consumer and industrial electronics manufacturers to control the functions and performance of their products. ZiLOG’s other devices have a wide variety of uses including the processing and transmission of
formation for data communications, telecommunications and consumer electronics companies. in
Basis of Presentation
The consolidated financial statements include the accounts of ZiLOG, Inc. and its subsidiaries. All significant transactions and accounts between the Company and these subsidiaries have been eliminated in consolidation. Certain reclassifications have been made to prior-period balances to present the consolidated financial statements on a consistent basis with the current year presentation.
Change in Fiscal Year End Effective December 29, 2005, the Company changed its fiscal year end from December 31 to March 31 with interim
results based on fiscal quarters of approximately thirteen weeks in duration ending on the closest Saturday to each calendar quarter end, with the exception of the last quarter, which ends on March 31 beginning in fiscal 2006. The operating results for any period are not necessarily indicative of results for any subsequent period or the full fiscal year.
Revenue Recognition
Revenue from product sales to Original Equipment Manufacturers (“OEM”) customers is recognized when evidence of an agreement exists, customers or their agents receive the product and title transfers, and collection of amounts due is reasonably assured. Appropriate allowances for returns, discounts and warranty costs are recorded concurrent with revenue
ition. recogn
The Company also licenses technology for certain of its products and receives payment in the form of royalties. Typically, licensees provide shipment and royalty information when the payment is remitted, usually 60 days subsequent to the end of the quarter in which shipments are made. The Company records royalty revenues as micrologic net sales when the cash is received from the licensees.
Revenue on shipments to distributors who have rights of return and/or price protection on unsold merchandise held by them is deferred until products are resold by the distributors to end users. Although revenue is deferred until resale, title of products sold to distributors transfers upon shipment. Accordingly, shipments to distributors are reflected in the consolidated balance sheets as accounts receivable and a reduction of inventories at the time of shipment. Deferred revenue and the corresponding cost of sales on shipments to distributors are reflected in the consolidated balance sheets on a net basis as “Deferred income on shipments to distributors.”
Cash and Cash Equivalents
Cash and cash equivalents consist of bank deposits and money market funds, which are readily convertible to cash and
have maturities of three months or less at the time of acquisition.
59

Accounts Receivable and Allowances
The Company maintains an allowance for losses it may incur as a result of its customers’ inability to make required payments. Any increase in the allowance results in a corresponding increase in selling, general and administrative expenses. In establishing this allowance and evaluating the adequacy of the allowance for doubtful accounts, the Company considers the aging of accounts receivable, historical bad debts, customer concentrations, customer credit-worthiness and, to a lesser extent, current economic trends and changes in customer payment terms.
The Company’s sales to OEM customers consist of gross product sales reduced by expected future sales returns and price allowances. To estimate sales returns and price allowances, the Company analyzes historical returns and allowance activity to establish a baseline reserve level. The Company then evaluates whether there are any underlying product quality or other customer specific issues that require additional specific reserves above the baseline level.
The Company’s sales to distributors that have rights of return and/or price protection allowances on unsold merchandise held by them are deferred until such products are resold by the distributors to end users. At the time that the Company recognizes distributor re-sales as revenue, it records a reserve for estimated price adjustments that the distributors may reclaim from the Company on the merchandise they resold to end users. These reserves are recorded as a reduction to sales and a reduction to accounts receivable. To estimate this distributor price adjustment reserve, the Company analyzes its historical price adjustment payments, price adjustments taken by distributors but not processed by the Company and pending price adjustments that have been authorized by the Company but have not yet been claimed by its distributors.
Fair Value of Financial Instruments, Concentration of Credit Risk
Cash and cash equivalents consist primarily of cash in bank accounts and money market accounts. The carrying value of the Company’s financial instruments, including cash and cash equivalents, accounts receivable, accounts payable and current liabilities, approximates fair value due to their relatively short maturities. Financial instruments that subject the Company to concentrations of credit risk consist primarily of cash and cash equivalents and accounts receivable. The Company maintains its cash and cash equivalents and investments with high quality financial institutions. The Company’s customer base is located primarily in North America, Europe and Asia. The Company performs ongoing credit evaluations of its customers’ financial condition and limits its exposure to financial losses by limiting the amount of credit extended whenever deemed necessary and generally does not require collateral. As of March 31, 2007 and March 31, 2006, respectively, there were two customers with net accounts receivable comprising more than 10% of total net accounts receivable.
Inventories
Inventories are stated at the lower of cost (which approximates actual cost on a first-in, first-out basis) or market. Provisions, when required, are made to reduce inventory values from cost to their estimated net realizable values. It is possible that estimates of net realizable value can change in the short-term. Inventory reserves for excess or obsolete inventory are released only upon sale, scrap or other disposition of reserved inventory. Inventories, net of provisions, consist of the following (in millions):
Mar. 31, Mar. 31, Mar. 27,2007 2006 2005
Raw materials $ 0.6 $ 0.8 $ 0.6 Work-in-process 8.4 7.3 11.3 Finished goods 3.9 5.0 6.0 Gross Inventory 12.9 13.1 17.9 Reserves (4.4) (5.5) (7.3) Net Inventory $ 8.5 $ 7.6 $ 10.6
Property, Plant and Equipment and Intangibles
Depreciation is computed using the straight-line method over the estimated economic lives of the assets, which are
generally between three and seven years for machinery and equipment.
Amortization of leasehold improvements is computed using the shorter of the remaining terms of the leases or the estimated economic lives of the improvements. Depreciation expense for property, plant and equipment was $3.1 million,
60

$2.6 million, $0.6 million and $3.0 million for the twelve months ended March 31, 2007, twelve months ended March 31, 2006, the three month transition period ended March 27, 2005, and the twelve months ended December 31, 2004, respectively. The Company did not have any assets leased under capital leases during the periods indicated.
Property, plant and equipment consist of the following (in millions):
Mar. 31, Mar. 31, Mar. 27,
2007 2006 2005Property, plant and equipment at cost: Land, buildings and leasehold improvements $ 2.8 $ 2.6 $ 2.5 Machinery and equipment 12.0 11.0 10.2
14.8 13.6 12.7 Less accumulated depreciation and amortization (8.3) (6.1) (6.8) Net property, plant and equipment $ 6.5 $ 7.5 $ 5.9
We apply the provisions of SFAS 144, “Accounting for the Impairment or Disposal of Long-Lived Assets” and SFAS
142, “Goodwill and Other Intangible Assets.” We evaluate long-lived assets for possible impairment whenever events or changes in circumstances indicate that the carrying value may not be recoverable. Factors we consider important which could
igger an impairment review include the following: tr
• significant changes in the manner of our use of the acquired assets;
• significant changes in the strategy for our overall business; and
• significant negative industry or economic trends.
When we determine that the carrying value of long-lived assets may not be recoverable based upon the existence of one or more of the above indicators of impairment, and the undiscounted cash flows estimated to be generated by those assets are less than the asset’s carrying value, the carrying value of the assets are reduced to their estimated fair value. The estimated fair value is usually determined based on an estimate of discounted future cash flows. Asset impairments are recorded as a reduction in the asset value in our consolidated balance sheets and as special charges in our consolidated statements of operations.
The intangible assets created by the adoption of fresh-start accounting on our emergence from bankruptcy in 2002 consist of existing technology and brand name, as well as excess enterprise value, or goodwill. The existing technology and brand name are being amortized based on a pattern-of-use method in proportion to the forecast discounted cash flows from such assets. The goodwill is not subject to amortization.
We evaluate existing technology and brand name whenever events and circumstances indicate that their fair value may be less than their carrying value. Additionally, goodwill is tested for impairment at least annually and more often if events and circumstances indicate that its fair value may be less than its carrying value. We performed the annual impairment test for goodwill in the third quarter of 2007, and we perform this test in the fourth quarter of each fiscal year unless the existence of triggering events indicates that an earlier review should be performed.
Adjustments to record impairment of long-lived assets or intangible assets could have a material adverse impact on our financial condition and results of operations in the period or periods in which such impairment is identified.
Significant impairments of property, plant and equipment were recorded in 2004 due to the write-down of the
Company’s MOD II five-inch wafer fabrication facility in Nampa, Idaho to its expected realizable value (see Note 3) and subsequent transfer to assets held for sale.
61

Other Accrued Liabilities
The following table further details “other accrued liabilities” (in millions):
Mar. 31, Mar. 31, Mar. 27,2007 2006 2005
Accrued audit fees $ 0.2 $ 0.2 $ 0.7 Accrued legal costs 0.9 1.0 1.0 Accrued special charges 1.2 0.1 0.4 Other 0.6 1.1 2.2 Other accrued liabilities $ 2.9 $ 2.4 $ 4.3
Use of Estimates
The preparation of consolidated financial statements in conformity with accounting principles generally accepted in the
United States requires management to make estimates and assumptions that affect the reported amounts of assets and liabilities and disclosure of contingent assets and liabilities at the date of the consolidated financial statements and the reported amounts of net sales and expenses during the reporting periods. Significant estimates made in preparing these financial statements include, but are not limited to, excess and obsolete inventories, tax valuation allowance, allowance for doubtful accounts and sales returns and allowances. Actual results could differ from those estimates.
Advertising Expenses
The Company accounts for advertising costs as an expense in the period in which they are incurred. Advertising
expenses were approximately $0.5 million, $1.4 million, $0.2 million and $1.5 million for the twelve months ended March 31, 2007, twelve months ended March 31, 2006, three month transition period ended March 27, 2005 and the twelve months ended December 31, 2004, respectively. Advertising costs are included in selling, general and administrative expenses in the accompanying consolidated statements of operations.
Shipping Costs
Shipping costs are included in cost of sales.
Research and Development Expenses
The Company’s policy is to record all research and development expenditures with no future alternative use, as period expenses, when incurred. Research and development expenditures incurred and expensed were $20.5 million for the twelve months ended March 31, 2007, $21.0 million for the twelve months ended March 31, 2006, $5.2 million for the three months ended March 27, 2005 and $20.9 million for the twelve months ended December 31, 2004.
Stock Awards Effective April 1, 2006, the Company adopted SFAS 123R, which requires the measurement and recognition of compensation expense for all share-based payment awards made to employees and directors including employee stock options, restricted stock awards and employee stock purchases related to the 2004 Employee Stock Purchase Plan based on estimated fair values. SFAS 123R supersedes the Company’s previous accounting under APB 25 and SFAS 123 for periods beginning in fiscal 2007. In March 2005, the SEC issued Staff Accounting Bulletin No. 107 (“SAB 107”) relating to SFAS 123R. The Company has applied the provisions of SAB 107 in its adoption of SFAS 123R. The Company elected to adopt SFAS 123R using the modified prospective transition method utilizing the single option attribution approach, which requires the application of the accounting standards as of April 1, 2006, the first day of the Company’s fiscal year 2007. In accordance with the modified prospective transition method, the Company’s prior periods have not been restated to reflect, and do not include, the impact of SFAS 123R. The Company’s consolidated financial statements as of and for the twelve months ended March 31, 2007 reflect the impact of SFAS 123R.
62

On November 10, 2005, a total of 220,000 restricted shares were granted to the CEO and certain executive officers in conjunction with changes in the control agreements. These grants were priced at par value of $0.01 per share and vest at the earlier of 3 years from grant date or change in ownership of the company.
Pro Forma Stock-Based Compensation
The table below illustrates the effect on net loss if the fair-value based method had been applied to all outstanding and unvested awards in each period (in millions, except per share data):
ThreeMonthsEnded
Mar. 31, Dec. 31, Mar. 27,2006 2004 2005
Net loss, as reported $ (16.8) $ (18.5) $ (6.6) Add: stock-based employee compensation expense included in reported net loss 0.7 2.0 0.3 Deduct: total stock-based employee compensation expense determined under fair-value-based method for all awards (2.0) (4.3) (0.7) Net loss, pro forma $ (18.1) $ (20.8) $ (7.0)
Net loss Per ShareBasic and diluted - as reported $ (1.02) $ (1.16) $ (0.41) Basic and diluted - pro forma $ (1.10) $ (1.30) $ (0.43)
Number of shares used in computing net loss per shareBasic and diluted - as reported 16.4 16.0 16.2 Basic and diluted - pro forma 16.4 16.0 16.2
Twelve Months Ended
The fair value of options granted was estimated at the date of grant using the Black-Scholes option pricing model. The
following weighted-average assumptions were used:
The weighted-average exercise price of options granted and the weighted-average fair value of employee stock purch
ThreeStock Options Months
EndedMar. 31, Mar. 31, Dec. 31, Mar. 27,
2007 2006 2004 2005Annual average risk-free interest rate 4.7% 4.9% 3.4% 3.4%Estimated life in years 5 5 5 5 Dividend yield 0.0% 0.0% 0.0% 0.0%Volatility 45.9% 54.2% 51.8% 52.2%
Twelve Months Ended
ases are as follows:
Three
MonthsEnded
Mar. 31, Mar. 31, Dec. 31, Mar. 27,2007 2006 2004 2005
Weighted-average exercise price of options granted during the period $ 4.07 $ 2.80 $ 9.77 $ 5.06 Weighted-average fair value of employee stock purchases under employee stock purchase plan during the period $ 2.66 $ 3.05 $ 6.09 $ 4.70
Twelve Months Ended
63

The fair value of shares purchased under the 2004 Employee Stock Purchase Plan was estimated at the date of each offering period using the Black-Scholes pricing model. The following assumptions were used:
ThreeEmployee Stock Purchase Plan Months
EndedMar. 31, Mar. 31, Dec. 31, Mar. 27,
2007 2006 2004 2005Risk-free interest rate 4.8% 3.9% 1.81 to 2.75% 3.4%Estimated life in years 0.6 0.5 0.5 0.5 Dividend yield 0.0% 0.0% 0.0% 0.0%Volatility 50.6% 54.2% 50.7% 52.2%
Twelve Months Ended
doption of Accounting Standards
ompany adopted the provisions of SFAS 123R, requiring the recording of expenses related to the fair value of its stock-based compensation awards. The Company elected to adopt the modified prospective transition ,
l
ted
tock awards (“RSAs”) recorded in periods prior to April 1, 2006 reflects: 1) the difference between the stock price and the purchase price for options granted or RSAs issued, where the grant price app
he-
ssued Statement No. 158, “Employers’ Accounting for Defined Benefit Pension and Other Postretirement Plans” (“SFAS 158”). SFAS 158 requires employers to recognize on their balance sheets the funded status of
n
ed
, the Financial Accounting Standards Board ("FASB") issued FASB Interpretation No. 48, "Accounting r Uncertainty in Income Taxes - an interpretation of FASB Statement No. 109" ("FIN 48"), which clarifies the accounting
for unce
A
Effective April 1, 2006, the C
method utilizing the single option attribution approach as permitted by SFAS 123R. Under this transition methodstock-based compensation expense for the twelve month period ended March 31, 2007 includes compensation expense for alstock-based compensation awards granted prior to, but not vested as of, April 1, 2006, based on the grant-date fair value estimated in accordance with the original provisions of Statement of Financial Accounting Standard No. 123, “Accounting for Stock-Based Compensation” (“ SFAS 123”) and compensation expense for all stock-based compensation awards gransubsequent to April 1, 2006, based on the grant-date fair value estimated using the Black-Scholes option pricing model in accordance with the provisions of SFAS 123R. SFAS 123R supersedes our previous accounting under APB 25 and SFAS 123. The total compensation expense recorded for the twelve month period ended March 31, 2007 was $1.4 million. See Note 6 to the Company’s consolidated financial statements.
Stock-based compensation for options or restricted s
roved by the Board of Directors was lower than the fair value of the award at the time of grant, or 2) the then fair value of stock issued to members of the Board of Directors for services provided in lieu of cash in accordance with their stockholder approved compensation plans. Since the Company's bankruptcy reorganization in 2002, the Company's policy has been to issue options at fair market value. The only exception to that policy was the value-for-value conversion of in-tmoney restricted stock held by the Company’s former chief executive officer for in-the-money options as previously disclosed in the proxy statement for the twelve months ended December 31, 2003 and December 31, 2004. From time to time, the Company has issued shares of restricted stock to employees below fair market value.
Recent Accounting Pronouncements
In September 2006, the FASB i
pension and other postretirement benefit plans, as of the end of the fiscal year ending after June 15, 2007. Employerswill recognize actuarial gains and losses, prior service cost, and any remaining transition amounts from the initial applicatioof Statement of Financial Accounting Standards No. 87 (“SFAS 87”) “Employers’ Accounting for Pensions,” and Statement of Financial Accounting Standards No. 106 (“SFAS 106”), “Employers’ Accounting for Postretirement Benefits Other Than Pensions” when recognizing a plan’s funded status, with the offset to accumulated other comprehensive income. The Company has a defined benefit plan in the Philippines and will adopt the provisions of SFAS 158 for the fiscal year ending March 31, 2008. The Company expects there will be no material impact of this adoption on the Company’s consolidatfinancial statements.
In June 2006fo
rtainty in income tax positions. FIN 48 prescribes a recognition threshold and measurement attribute for the financial statement recognition and measurement of a tax position taken, or expected to be taken, on a tax return. This Interpretation also provides guidance on derecognition, classification, interest, penalties, accounting in interim periods, disclosure and transition. The evaluation of a tax position in accordance with this Interpretation is a two-step process. The first step will
64

determine if it is more likely than not that a tax position will be sustained upon examination and should therefore be recognized. The second step will measure a tax position that meets the more likely than not recognition threshold to determine the amount of benefit to recognize in the financial statements. FIN 48 is effective for fiscal years beginningDecember 15, 2006. The Company will adopt the provisions of FIN 48 in the fiscal year ending March 31, 2008. ThCompany expects there will be no material impact of this adoption on the Company’s consolidated financial statements. NOTE 2. GOODWILL AND INTANGIBLE ASSETS
after e
he provisions of SFAS 142. At the time of adoption, the Company d no amounts of goodwill recorded in the consolidated balance sheets. Therefore, the initial adoption had no material effect
to the Co
AS 142, goodwill and intangible assets with indefinite lives are not amortized, but are reviewed annually more frequently if impairment indicators arise. In connection with its reorganization in 2002, the Company recorded a
valuatio
reduced
Effective January 1, 2002, the Company adopted t
hampany.
Under SF
orn allowance against deferred tax assets and recorded deferred income tax liabilities and income tax contingencies in
accordance with Statement of Financial Accounting Standards No. 5, “Accounting for Contingencies.” These tax contingencies were primarily attributable to the Company’s reorganization of MOD III. During the periods presented, the Company reassessed and updated its deferred income tax liabilities and income tax contingencies requirements andthe associated liabilities as an adjustment to goodwill as presented in the table below. In addition, reductions in the valuationallowance that were established as liabilities on the consolidated balance sheets under fresh-start reporting in 2002 have beenrecorded as a reduction in the carrying value of goodwill as shown in the table as follows (in millions):
Goodwill
Balance at December 31, 2004 $ 8 Goodwill adjustments during 2005 - Balance at March 27, 2005 8.6 Goodwill adjustments during 2006 (1.9) Balance at March 31, 2006 6.7 Goodwill adjustments during 2007 (4.5) Balance at March 31, 2007 $ 2.2
.6
Intangible assets established in connection with the Company’s fresh-start reporting, separable intangible assets that are eemed to have defined lives (primarily related to existing technology and brand name), are being amortized utilizing the
patterd
n-of-use method over estimated useful lives ranging from 3 to 10 years. Changes in the carrying value of separable intangible assets for the twelve months ended March 31, 2007, the twelve months ended March 31, 2006, the three month transition period ended March 27, 2005 and the twelve months ended December 31, 2004 are as follows (in millions):
Existing Brand Total
Technology Name IntangiblesBalance at December 31, 2004 $ 1.8 $ 5.5 $ 7.3 Amortization during fiscal 2005 (0.4) (0.2) (0.6) Balance at March 27, 2005 1.4 5.3 6.7 Amortization during fiscal 2006 (0.9) (1.0) (1.9) Balance at March 31, 2006 0.5 4.3 4.8 Amortization during fiscal 2007 (0.3) (1.0) (1.3) Balance at March 31, 2007 $ 0.2 $ 3.3 $ 3.5
65

The anticipated amortization schedule for the remaining years of these separable intangible assets is as follows (in millions):
Existing Brand TotalFiscal Year Technology Name Amortization
2008 $ 0.1 $ 0.8 $ 0.9 2009 0.1 0.8 0.9 2010 - 0.7 0.7 2011 - 0.6 0.6 2012 - 0.2 0.2 2013 - 0.2 0.2
$ 0.2 $ 3.3 $ 3.5
N
OTE 3. MOD III LAND, BUILDING, AND EQUIPMENT AND MOD II EQUIPMENT
We adopted FASB Interpretation No. 46R, “Consolidation of Variable Interest Entities” (“FIN 46R”) on January 1, 2004, which resulted in the de-consolidation of our subsidiary, ZiLOG MOD III, Inc. (“MOD III”). Subsequently, a significant portion of the assets were sold and management received authorization from the shareholders of MOD III to sell the remaining assets without further shareholder approval, and consequently, the final results of MOD III were included in our financial results.
On April 16, 2004, the Company announced the closure of its MOD II 5-inch wafer manufacturing facility in Nampa,
Idaho. In association with this decision, the Company recorded net special charges of $6.9 million reflecting the impairment of long-lived assets and costs to cease operations, and $1.8 million for employee severance costs. MOD II production ceased on July 9, 2004, whereby the majority of the products previously manufactured in MOD II were transferred to X-FAB in Lubbock, Texas. The Company is now operating under our stated strategy as a fabless semiconductor company.
In July 2004, MOD III sold its production equipment to STMicroelectronics, Inc. At the completion of the sale in September 2004, ZiLOG, Inc. received approximately $4.9 million for reimbursement of sustaining costs incurred, which was recorded as an offset to special charges and credits.
In September 2004, the Company sold all of its wafer manufacturing equipment and certain other manufacturing
support-related assets of our MOD II facility in Nampa, Idaho to STMicroelectronics, Inc. for an aggregate cash consideration of $5.9 million, net of selling costs and expenses. The Company recorded a net gain of $1.7 million in connection with the sale. The remaining assets of MOD II primarily consist of land and buildings, which have been classified as assets held for sale on the Company’s consolidated balance sheets. In May 2007, the Company sold the MOD II facility for a net sales price of $3.1 million.
In February 2006, MOD III completed the sale of its remaining assets to Micron Technology, Inc. for a total consideration, net of closing costs, of $4.6 million. These assets included the dormant 8-inch wafer fabrication facility and associated land owned by MOD III and vacant property owned by ZiLOG, Inc. MOD III shareholders voted to liquidate the special purpose entity and distribute the remaining net proceeds to its Series A Preferred shareholders at the conclusion of that process. The distribution of the net proceeds included $1.1 million to ZiLOG, Inc. for the vacant property and $0.7 million to ZiLOG, Inc. for reimbursement of sustaining and maintenance costs, respectively. The remaining $2.8 million was distributed in October 2006 to holders of MOD III Series A Preferred stock upon the liquidation of MOD III. NOTE 4. SPECIAL CHARGES AND CREDITS
Fiscal 2007 Special Charges and Credits Analysis As part of the Company’s ongoing efforts to reduce costs and streamline activities, in March 2007, a plan of action was
initiated to consolidate certain research and development activities and transfer certain of these activities from its Shanghai, China and Seattle, Washington facilities to its San Jose, California and Meridian, Idaho facilities. During fiscal 2007, the Company incurred $1.0 million of severance and benefits costs related to this restructuring activity, which have been recorded as special charges. Other severance and benefit related costs of $0.8 million were incurred as a result of the resignation of the Company’s former CEO, James M. Thorburn and the hiring of the Company’s current CEO, Darin G. Billerbeck. In addition, the Company continued to incur period expenses of $0.6 million to sustain the dormant MOD II
66

facility included in assets held for sale on the consolidated balance sheets as of March 31, 2007. In May 2007, the MOD II facility was sold for a net sales price of $3.1 million.
Fiscal 2006 Special Charges and Credits Analysis
In April 2005, the Company initiated a plan of action to consolidate certain of its support activities and transfer certain
of these activities to its Philippines operations. These activities have resulted in lower overall support costs. Total severance and benefits costs of $1.7 million related to a reduction-in-force and support activity consolidation were recorded as special charges during fiscal 2006; the remaining amount was recorded over the terminated employees’ required service periods, which was ultimately completed during the quarter ended June 30, 2006. During fiscal 2006, the Company incurred $2.4 million of special charges, including the net reimbursement of $0.8 million of MOD III sustaining and maintenance costs and period expenses of $0.7 million to sustain the dormant MOD II facility, which is included in assets held for sale of $1.8 million on the consolidated balance sheets as of March 31, 2006.
2004 Special Charges and Credits Analysis
On April 16, 2004, the Company announced the closure of its MOD II five-inch wafer manufacturing facility in
Nampa, Idaho and the related transfer of MOD II production activities to its foundry partner, X-Fab, in Lubbock, Texas. MOD II ceased production operations on July 9, 2004. As a result, in 2004, the Company incurred $3.2 million of sustaining costs for post-closure maintenance of the MOD II facility. Additionally, MOD III sustaining costs for post-closure maintenance incurred by the Company totaled $1.7 million, which was offset by approximately $4.9 million of
imbursement for these costs from the sale of the MOD III equipment to STMicroelectronics, Inc. in July 2004. re
As a result of the closure of MOD II in 2004, the Company incurred the following additional special charges: (1) employee severance and termination benefits of approximately $1.8 million related to the termination of 144 employees, and (2) an asset impairment charge of $5.4 million related to the write-down of the MOD II long-lived assets and the subsequent gain on sale of assets of $1.7 million related to the sale of the wafer manufacturing equipment and related assets to STMicroelectronics, Inc. in the fourth quarter of 2004.
The sustaining and maintenance costs for MOD II and MOD III consist of utilities, taxes, insurance, and other maintenance costs required to maintain the facilities in a condition required for the sale of the respective properties.
Approximately $0.1 million of special charges during 2004 related to third-party professional legal service fees associated with the Company’s debt and equity restructuring in May 2002, and $0.3 million of special charges related to severance and termination benefits related to the Company’s continued efforts to align infrastructure costs to business-level requirements.
The following table details the beginning balance as of December 31, 2004 and the accrued special charges for the twelve months ended March 31, 2007, March 31, 2006 and the three month transition period ended March 27, 2005 (in millions):
Severanceand MOD III MOD II
Termination Debt Closure Closure Benefits Restructuring Costs Costs Total
Balance at December 31, 2004 $ 0.3 $ - $ - $ 0.7 $ 1.0 Cash payments (0.2) - - (0.4) (0.6) Balance at March 27, 2005 0.1 - - 0.3 0.4 Provisions to special charges 1.7 (0.1) 0.4 0.7 2.7 Cash payments (1.8) 0.1 (0.4) (0.9) (3.0) Balance at March 31, 2006 - - - 0.1 0.1 Provisions to special charges 1.8 - - 0.6 2.4 Cash payments (0.6) - - (0.7) (1.3) Balance at March 31, 2007 $ 1.2 $ - $ - $ - $ 1.2
67

Special charges in fiscal 2007, fiscal 2006, the three month transition period ended March 27, 2005 and the twelve months ended December 31, 2004 were as follows (in millions):
Mar. 31, Mar. 31, Dec. 31, Mar. 27, Mar. 28,
2007 2006 2004 2005 2004Asset impairments: MOD II asset impairment (a) $ - $ 0.5 $ 5.4 $ - $ - MOD II assets, gain on sale of equipment - - (1.7) - -
Restructuring of operations: Engineering consolidation severance and termination benefits 1.0 - - - - Other employee severance and termination benefits 0.8 1.7 0.3 - 0.1 MOD II employee severance and termination benefits - - 1.8 - - MOD II sustaining costs and other costs to close facility 0.6 0.7 3.2 0.3 - MOD III sustaining costs for post-closure maintenance - 0.4 1.7 0.1 0.3 MOD III reimbursement of maintenance costs (a) - (0.8) (4.9) - - Other - - - - 0.1 Professional fees (reimbursement) for debt restructuring - (0.1) 0.1 - - Total Special Charges $ 2.4 $ 2.4 $ 5.9 $ 0.4 $ 0.5
Three Months EndedTwelve Months Ended
a) Asset impairment items and reimbursements were not included in the provisions to special charges in the first table
NOTE 5. RETIREMENT AND PENSION PLANS
The Company has an employee savings plan that qualifies as a deferred salary arrangement under Section 401(k) of the Internal Revenue Code (the “401(k) Plan”). Under the 401(k) Plan, participating U.S. employees may defer a portion of their pretax earnings, up to the Internal Revenue Service annual contribution limit. The Company may make matching contributions on behalf of each participating employee in an amount equal to 100% of the participant’s deferral contribution, up to 1.5% of the participant’s compensation on a quarterly basis. The Company may also make additional discretionary contributions to the 401(k) Plan. Matching contributions to the 401(k) Plan were less than $0.1 million for the twelve months ended March 31, 2007, approximately $0.2 million for the twelve months ended March 31, 2006, approximately $0.1 million for the three month transition period ended March 27, 2005 and approximately $0.3 million for the twelve months ended December 31, 2004. There were no discretionary contributions made in the twelve months ended March 31, 2007, twelve months ended March 31, 2006, the three month transition period ended March 27, 2005 and the twelve months ended December 31, 2004, respectively.
The Company’s Philippines subsidiary maintains a defined benefit pension plan for local employees, which is
consistent with local statutes and practices. As of March 31, 2007, the pension plan was over-funded by approximately $0.8 million. The over-funded position generally reflects a decline in the number of employees who are eligible for entitlements under the plan, coupled with increased returns on the plan assets that are greater than the increase in the employees’ entitlement liabilities. In April 2007, the Company requested, and was granted, certain contribution refunds and in May 2007, the Company received $0.7 million. The cash refund will be recorded as a credit in the consolidated statements of operations in the quarter ending June 30, 2007.
The Company will adopt SFAS 158, which supersedes the current accounting under SFAS 87 and its associated
literature, for the fiscal year ending March 31, 2008. The Company expects there will be no material impact of this adoption on the Company’s consolidated financial statements. NOTE 6. STOCK-BASED COMPENSATION AND STOCKHOLDERS’ EQUITY Common Stock
The following description summarizes information regarding the Company’s capital stock after confirmation of the plan of reorganization. This information is subject in all respects to applicable provisions of ZiLOG’s amended and restated certificate of incorporation and its amended and restated bylaws.
68

General
The Company’s authorized capital stock consists of 60,000,000 shares of common stock, par value $0.01 per share.
The holders of outstanding shares of common stock are entitled to receive dividends or distributions as may be lawfully declared by the Board of Directors. In the event that the corporation is dissolved, the holders of common stock would be entitled to share ratably in all assets that may be available for distribution after the satisfaction of all liabilities. The common stock has no preemptive or conversion rights and is not subject to redemption. All outstanding shares of common stock are
lly paid and non-assessable. fu
Voting
The holders of common stock are entitled to one vote per share on all matters submitted to a vote of stockholders. The holders of a majority of the outstanding shares of common stock must approve all matters brought before the stockholders, xcept as otherwise required by the Delaware General Corporation Law and except as otherwise set forth below. e
2004 Public Stock Offering
On March 12, 2004, the Company’s common stock was listed for trading on the NASDAQ National Market with a ticker symbol of “ZILG”. On March 18, 2004, and subsequently on April 6, 2004 through exercise of an over allotment option, the Company raised approximately $24.4 million through the sale of 2,252,100 shares of its common stock at a price of $12.50 per share in a registered public offering of its stock. Employee Stock Purchase Plan
The 2004 Employee Stock Purchase Plan (“2004 ESPP”) was adopted by the Compensation Committee of the
Company’s Board of Directors on December 17, 2003 and was approved by the Company’s stockholders on February 12, 2004. The 2004 ESPP became effective on May 15, 2004. A total of 1,250,000 shares of common stock have been reserved for issuance under the 2004 ESPP to eligible employees. These shares will be either authorized as un-issued shares, or shares that have been reacquired by the Company. The 2004 ESPP is implemented by 12-month offering periods, each of which is composed of four 3-month purchase periods. Four overlapping offering periods generally commence during each fiscal year, with an offering period commencing on the first day of each fiscal quarter. Four purchase periods also commence during each fiscal year, with a purchase period commencing on the first day of each fiscal quarter. An eligible employee is granted an option at the start of the offering period to purchase shares of the Company’s common stock with payroll deductions ranging from 1% to 15% of their eligible compensation during the offering period. The payroll deductions are accumulated and, at the end of each purchase period, applied to purchase shares of common stock, unless the employee withdraws from the 2004 ESPP prior to such date. The purchase price is the lower of 85% of the fair market value of the common stock either on the
rst business day of the applicable offering period or the last business day of the purchase period within such offering period. fi
At March 31, 2007, a total of 227,019 shares of the Company’s common stock have been purchased under the 2004 ESPP, leaving a total of 1,022,981 shares available to be purchased. Stock Repurchase Programs
2004 Stock Repurchase Program
The Company’s Board of Directors approved the 2004 stock repurchase program on July 29, 2004, pursuant to which the Company may repurchase up to $5.0 million in market value of its outstanding shares of common stock.
In August 2004, the Company repurchased 415,300 shares of its common stock in the market for $3.2 million. In September 2004, the Company repurchased 136,400 shares of its common stock in the market for $1.1 million. And, in October 2004, the Company repurchased 20,400 shares of its common stock in the market for $0.1 million.
As of March 31, 2007, the Company had repurchased 572,100 shares under this program at an aggregate cost of $4.4 million.
69

2003 Stock Repurchase Program
The Company’s Board of Directors approved the 2003 stock repurchase program on April 17, 2003, under which the
Company may repurchase up to 500,000 shares of its outstanding common stock. A summary of the activity under the plan is as follows (in millions, except shares):
2003 Repurchase Plan Activity Net Loan
Shares Cost RepaymentRepurchases from open market 125,000 $ 0.5 $ - Repurchases from former executive officer 50,000 0.2 0.1 Repurchases from other and former employees 230,164 0.7 0.6 Total repurchases - 2003 Plan 405,164 $ 1.4 $ 0.7
As of March 31, 2007, the Company had repurchased 405,164 shares of its common stock under this program from employees, former employees and others, pursuant to repurchase rights, at an aggregate cost of $2.1 million.
Other Stock Repurchases
On November 17, 2004, the Board of Directors, in conjunction with the resignation of a former executive, Michael
Burger, approved the repurchase of 92,735 shares of its common stock for the fair market purchase price of $6.20 per share in consideration for the repayment of his loans totaling $0.6 million.
During fiscal 2006, the Company repurchased 17,386 shares of its common stock from former employees in
consideration for the repayment of loans payable to the Company totaling $0.1 million. As of March 31, 2007, stock repurchases for the 2003 and 2004 stock repurchase programs and other stock repurchases
totaled 1,087,388 shares with a net aggregate cost of $7.2 million, which are comprised of the following:
004 Omnibus Stock Incentive Plan
The 2004 Omnibus Stock Incentive Plan (the “2004 Plan”) was adopted by the Compensation Committee of the Comp
In general, the options and shares granted pursuant to the 2004 Plan are exercisable at such time or times, and subject to suc
pon the
In general, restricted stock awards granted pursuant to the 2004 Plan are subject to the restricted stock award agreement that re
Mar. 31, Mar. 31, Mar. 27, 2007 2006 20052003 Repurchase Program 405,164 405,164 405,164 2004 Repurchase Program 572,100 572,100 572,100 Other Repurchases 110,124 110,124 92,735 Ending Balance 1,087,388 1,087,388 1,069,999
Treasury Shares Outstanding
2
any’s Board of Directors on December 17, 2003 and was approved by the Company’s stockholders on February 12, 2004. The 2004 Plan became effective on March 10, 2004. Under the 2004 Plan, the committee may grant incentive stock options (“ISO”), non-statutory stock options (“NSO”) or restricted shares to certain employees, officers, directors, advisorsand consultants of the Company who may purchase up to 1,500,000 shares of the Company’s common stock, par value $0.01 per share.
h terms and conditions (including the vesting schedule, period of exercisability and expiration date) as the Compensation Committee determines, in the applicable option agreement. The exercise price per share, payable uexercise of an option, is established by the committee at the time of the grant and is not less than the par value per share ofcommon stock on the date of the grant and in the case of an ISO generally is not less than 100% of the fair market value per share on the date of grant.
flects the terms, conditions and restrictions related to the restricted stock award. The agreement includes, among other
70

things, the period during which the restricted stock is subject to forfeiture, the imposition of any performance-based onditions or other restrictions on the award, if any. c
2002 Omnibus Stock Incentive Plan
Common Stock
The 2002 Omnibus Stock Incentive Plan (the “Omnibus Plan”) was adopted by the Board of Directors in May 2002. Subject to adjustment pursuant to the terms of the Omnibus Plan, the Compensation Committee of the Board of Directors may grant options to purchase up to an aggregate of 1,058,140 shares of the Company’s common stock. Stock options granted under the Omnibus Plan were permitted to be: (1) incentive stock options or non-qualified stock options, or (2) EBITDA-linked options and/or non-EBITDA linked options. The term of a non-EBITDA-linked option is determined by the Compensation Committee at the time of grant, but will not exceed ten years.
Each EBITDA-linked option will be immediately exercisable on the date of grant and cliff-vest on the sixth anniversary from the date of grant. Vesting can be accelerated for EBITDA-linked options based on the “adjusted EBITDA,” as defined, reported for the immediately preceding 12-month period as follows: (1) one-third if the Company reports adjusted EBITDA for the previous 12 months in excess of $17.2 million, (2) two-thirds if the Company reports adjusted EBITDA for the previous 12 months in excess of $25.7 million, and (3) 100% if the Company reports adjusted EBITDA for the previous
2 months in excess of $30.0 million. 1
In accordance with Securities and Exchange Commission guidelines, EBITDA figures presented in this Form 10-K represent a non-GAAP measure of liquidity. EBITDA reflects net income (loss) adjusted for non-cash items, interest and income taxes. Management uses a separate “adjusted EBITDA” calculation for purposes of determining certain employees’ incentive compensation and, subject to meeting specified adjusted EBITDA amounts, for accelerating the vesting of EBITDA-linked options. This measure of adjusted EBITDA was approved as part of the plan of reorganization. Adjusted EBITDA excludes interest, income taxes, effects of changes in accounting principles and equity adjustments and non-cash charges such as depreciation, amortization, in-process research and development, and stock-based compensation expense. It also excludes cash and non-cash charges associated with special charges and credits, which represent operational restructuring charges, including asset write-offs, employee termination costs, and lease termination costs. The differences between EBITDA and ZiLOG’s adjusted EBITDA relate to the following cash-settled reorganization and special items that are added-back in adjusted EBITDA computations:
• Employee retention bonuses, severance pay and termination benefits;
• Professional fees for debt restructuring;
• Lease termination costs;
• Termination and exit charges; and
• MOD III closure costs.
At March 31, 2007, 139,610 shares of common stock out of a total of 247,335 EBITDA-linked options outstanding (granted, net of cancellations and exercises) have vested. In no event will any EBITDA-linked options vest later than May 15, 2008, even if the adjusted EBITDA thresholds have not been satisfied. The per share exercise price of shares purchasable under an EBITDA-linked option is $5.52 and each such option will be exercisable for ten years after the date such option is granted, unless earlier terminated. In general, non-EBITDA-linked options granted pursuant to the Omnibus Plan will be exercisable at such time or times and subject to such terms and conditions (including the vesting schedule, period of exercisability and expiration date) as the Compensation Committee determines, in the applicable award agreements or thereafter. The exercise price per share payable upon the exercise of an option will be established by the committee, in its s le discretion, at the time of grant. o
Restricted Stock
The Company is permitted to grant up to 1,220,930 restricted shares of common stock under the Omnibus Plan. The restricted shares generally vest 25% of the shares on the date of grant and an additional 25% on each of the first, second and third anniversaries of such grant date.
The Omnibus Plan was amended by the Company’s Board of Directors on October 18, 2002, subsequent to the passing of the Sarbanes-Oxley Act of 2002, and no longer allows the Compensation Committee to make loans available to
71

participants with respect to certain restricted stock awards for the payment of any federal or state income tax attributable to the restricted stock award. As a result of this amendment to the Omnibus Plan, the restricted stock award of May 13, 2003 issued to the Company’s former Chairman and Chief Executive Officer, James M. Thorburn, was cancelled and replaced with options to purchase 114,709 shares of common stock at an exercise price of $2.00 per share. The restricted stock awards of May 13, 2004 and 2005 were cancelled and replaced with options to purchase 229,420 shares of common stock at an exercise price of $5.20 per share. The original vesting dates were retained. The Company recorded additional compensation expense of approximately $0.3 million for these modifications to the restricted stock awards during the twelve months ended March 31, 2006.
When a holder of restricted shares exercises their right of ownership before the restricted share is vested, the holder
will receive shares of restricted stock equal to the number of shares exercised. If the holder terminates employment or service before the restrictions on the restricted stock have lapsed, then the Company has the right to repurchase these shares.
At March 31, 2007, March 31, 2006 and March 27, 2005, aggregate employee loans outstanding were $0.3 million, $0.4 million and $0.5 million, respectively, and these amounts are classified as other assets in the accompanying consolidated balance sheets.
Deferred Stock Compensation
For the twelve months ended March 31, 2007, the twelve months ended March 31, 2006, the three month transition period ended March 27, 2005, and for the twelve months ended December 31, 2004, ZiLOG recognized $1.4 million, $0.7 million, $0.3 million and $2.0 million, respectively, of stock-based compensation expense primarily in connection with the award of restricted stock during May 2002 to certain employees, executives and consultants at purchase prices below their deemed fair market value at the date of grant. The restrictions on the shares of restricted stock lapsed 25% on the award date, which was May 15, 2002, and 25% on each of the first three anniversaries following the award date. Compensation expense for employee stock awards was measured on the award date and was recognized over three years as these restrictions lapsed. Compensation expense for stock awards to consultants was re-measured at each balance sheet date until the awards were fully vested and the expense recognized over the vesting periods.
Stock Plan Activity
A summary of the Company’s stock plan activity for the twelve months ended March 31, 2007, twelve months
ended March 31, 2006, and the three months ended March 27, 2005 is as follows:
Weighted-Shares Weighted- Average ($000's)
Available Options Average Remaining Aggregatefor Grant Outstanding Exercise Price Contractual Term Intrinsic Value
Balance as of December 31, 2003 249,700 1,222,485 $ 5.48 Options and shares reserved 1,500,000 - - Restricted shares granted (37,730) - - Options granted (1,243,004) 1,243,004 9.77 Options exercised - (25,854) 8.18 Options cancelled 240,580 (240,580) 8.46 Restricted shares cancelled 176,465 - 0.02 Restricted shares repurchased 115,235 - 6.45 Balance as of December 31, 2004 1,001,246 2,199,055 $ 7.58 8.80Restricted shares granted (3,252) - - Options granted (25,250) 25,250 5.06 Options exercised - (22,572) 5.45 Options cancelled 59,123 (59,123) 7.51 Balance as of March 27, 2005 1,031,867 2,142,610 $ 7.57 8.62 $451Restricted shares granted (267,176) - 0.01 Options granted (401,615) 401,615 2.80 Options cancelled 740,916 (740,916) 7.71 Restricted shares repurchased 17,389 - 4.60 Balance as of March 31, 2006 1,121,381 1,803,309 $ 6.45 8.02 $247Restricted shares granted (116,386) - 0.01 Options granted (777,050) 777,050 4.07 Options exercised - (122,067) 2.04 Options cancelled 672,235 (672,235) 6.88 Restricted shares cancelled 75,500 - 0.01 Balance as of March 31, 2007 975,680 1,786,057 $ 5.55 7.99 $782
72

The aggregate intrinsic value in the table above represents the total pretax intrinsic value (i.e., the difference between the Company’s closing stock price on the last trading day of its fourth quarter of fiscal 2007 and the exercise price, times the number of shares) that would have been received from the option holders had all option holders exercised their options on March 31, 2007. This amount is expected to change as the fair market value of the Company’s stock fluctuates. There were 122,067 options exercised during the twelve months ended March 31, 2007. Total intrinsic value of options vested and expected to vest is approximately $0.8 million as of March 31, 2007.
The following table summarizes information about stock options outstanding as of March 31, 2007:
Weighted-Average Weighted- Weighted-
Remaining Average AverageNumber Contractual Exercise Number Exercise
Range of Exercise Prices Outstanding Life Price Exercisable Price$2.16-$2.28 12,900 8.94 $ 2.19 3,327 $ 2.19 $2.70-$2.70 277,963 8.44 2.70 103,802 2.70 $3.22-$4.02 252,650 9.42 3.81 26,146 3.51 $4.04-$4.29 69,225 7.20 4.11 42,808 4.08 $4.31-$4.31 400,000 9.83 4.31 - - $4.41-$5.19 84,250 9.37 4.56 10,594 5.04 $5.52-$5.52 321,854 5.12 5.52 156,711 5.52 $5.80-$9.30 111,800 6.74 7.17 93,487 7.15 $12.44-$12.44 237,015 7.08 12.44 173,876 12.44 $13.58-$14.30 18,400 6.96 13.84 15,171 13.85 $2.16-$14.30 1,786,057 7.99 $ 5.55 625,922 $ 7.21
Options Outstanding Options Exercisable
Options that were exercisable as of March 31, 2007, March 31, 2006 and March 27, 2005 were 625,922, 874,230 and 739,981, respectively. Stock-Based Compensation
The Company has a stock-based compensation program that includes non-statutory stock option awards and restricted stock awards (“RSAs”). Stock options are generally time-based, vesting 25% on the first anniversary of the grant-date and monthly thereafter over four years and expire ten years from the grant-date.
Effective April 1, 2006, the Company adopted SFAS 123R, which requires the measurement and recognition of compensation expense for all share-based payment awards made to employees and directors including employee stock options, restricted stock awards and employee stock purchases related to the 2004 Employee Stock Purchase Plan based on estimated fair values. SFAS 123R supersedes the Company’s previous accounting under APB 25 and SFAS 123 for periods beginning in fiscal 2007. In March 2005, the SEC issued Staff Accounting Bulletin No. 107 (“SAB 107”) relating to SFAS 123R. The Company has applied the provisions of SAB 107 in its adoption of SFAS 123R. The Company elected to adopt SFAS 123R using the modified prospective transition method utilizing the single option attribution approach, which requires the application of the accounting standards as of April 1, 2006, the first day of the Company’s fiscal year 2007. In accordance with the modified prospective transition method, the Company’s prior periods have not been restated to reflect, and do not include, the impact of SFAS 123R. The Company’s consolidated financial statements as of and for the twelve months ended March 31, 2007 reflect the impact of SFAS 123R.
73
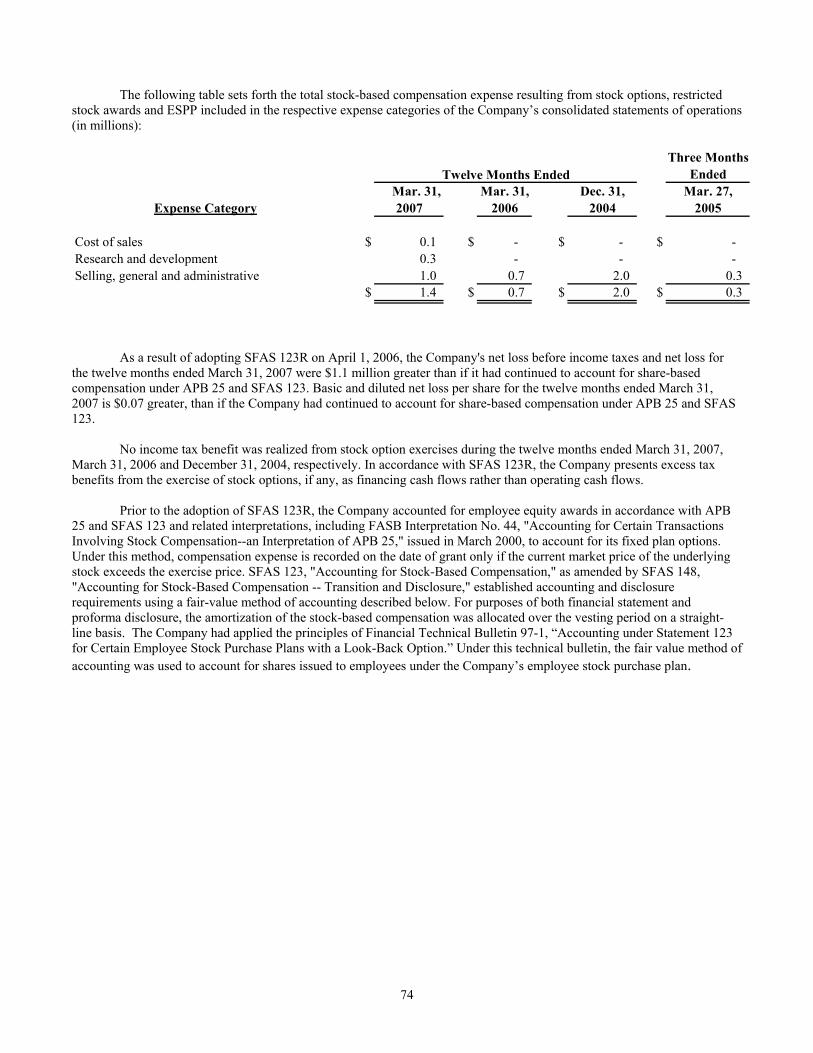
The following table sets forth the total stock-based compensation expense resulting from stock options, restricted
stock awards and ESPP included in the respective expense categories of the Company’s consolidated statements of operations (in millions):
Three MonthsEnded
Mar. 31, Mar. 31, Dec. 31, Mar. 27,Expense Category 2007 2006 2004 2005
Cost of sales $ 0.1 $ - $ - $ - Research and development 0.3 - - - Selling, general and administrative 1.0 0.7 2.0 0.3
$ 1.4 $ 0.7 $ 2.0 $ 0.3
Twelve Months Ended
As a result of adopting SFAS 123R on April 1, 2006, the Company's net loss before income taxes and net loss for
the twelve months ended March 31, 2007 were $1.1 million greater than if it had continued to account for share-based compensation under APB 25 and SFAS 123. Basic and diluted net loss per share for the twelve months ended March 31, 2007 is $0.07 greater, than if the Company had continued to account for share-based compensation under APB 25 and SFAS 123.
No income tax benefit was realized from stock option exercises during the twelve months ended March 31, 2007, March 31, 2006 and December 31, 2004, respectively. In accordance with SFAS 123R, the Company presents excess tax benefits from the exercise of stock options, if any, as financing cash flows rather than operating cash flows.
Prior to the adoption of SFAS 123R, the Company accounted for employee equity awards in accordance with APB 25 and SFAS 123 and related interpretations, including FASB Interpretation No. 44, "Accounting for Certain Transactions Involving Stock Compensation--an Interpretation of APB 25," issued in March 2000, to account for its fixed plan options. Under this method, compensation expense is recorded on the date of grant only if the current market price of the underlying stock exceeds the exercise price. SFAS 123, "Accounting for Stock-Based Compensation," as amended by SFAS 148, "Accounting for Stock-Based Compensation -- Transition and Disclosure," established accounting and disclosure requirements using a fair-value method of accounting described below. For purposes of both financial statement and proforma disclosure, the amortization of the stock-based compensation was allocated over the vesting period on a straight-line basis. The Company had applied the principles of Financial Technical Bulletin 97-1, “Accounting under Statement 123 for Certain Employee Stock Purchase Plans with a Look-Back Option.” Under this technical bulletin, the fair value method of accounting was used to account for shares issued to employees under the Company’s employee stock purchase plan.
74

The following table illustrates the effect on net loss and net loss per common share as if we had applied the fair value
recognition provisions of SFAS 123R to stock-based compensation during the twelve months ended March 31, 2006, twelve months ended December 31, 2004 and the three months ended March 27, 2005 (in millions, except per share data):
ThreeMonthsEnded
Mar. 31, Dec. 31, Mar. 27,2006 2004 2005
Net loss, as reported $ (16.8) $ (18.5) $ (6.6) Add: stock-based employee compensation expense included in reported net loss 0.7 2.0 0.3 Deduct: total stock-based employee compensation expense determined under fair-value-based method for all awards (2.0) (4.3) (0.7) Net loss, pro forma $ (18.1) $ (20.8) $ (7.0)
Net loss Per ShareBasic and diluted - as reported $ (1.02) $ (1.16) $ (0.41) Basic and diluted - pro forma $ (1.10) $ (1.30) $ (0.43)
Number of shares used in computing net loss per shareBasic and diluted - as reported 16.4 16.0 16.2 Basic and diluted - pro forma 16.4 16.0 16.2
Twelve Months Ended
The weighted-average exercise price of options granted for the twelve months ended March 31, 2007, the twelve
months ended March 31, 2006, the twelve months ended December 31, 2004, and the three month transition period ended March 27, 2005, were $4.07, $2.80, $9.77 and $5.06 per share, respectively.
The fair value of stock-based awards was estimated on the date of grant using the Black-Scholes valuation pricing
model based on the following weighted-average assumptions:
The weighted-average exercise price of options granted and the weighted-average fair value of employee stock purch
ThreeMonths
Stock Options EndedMar. 31, Mar. 31, Dec. 31, Mar. 27,
2007 2006 2004 2005Risk-free interest rate 4.7% 4.9% 3.4% 3.4%Estimated life in years 5 5 5 5 Dividend yield 0.0% 0.0% 0.0% 0.0%Volatility 45.9% 54.2% 51.8% 52.2%
Twelve Months Ended
ases are as follows:
ThreeMonthsEnded
Mar. 31, Mar. 31, Dec. 31, Mar. 27,2007 2006 2004 2005
Weighted-average exercise price of options granted during the period $ 4.07 $ 2.80 $ 9.77 $ 5.06 Weighted-average fair value of employee stock purchases under employee stock purchase plan during the period $ 2.66 $ 3.05 $ 6.09 $ 4.70
Twelve Months Ended
75

The fair value of employee stock purchases was estimated using the Black-Scholes valuation pricing model based on the following weighted-average assumptions:
ThreeEmployee Stock Purchase Plan Months
EndedMar. 31, Mar. 31, Dec. 31, Mar. 27,
2007 2006 2004 2005Risk-free interest rate 4.8% 3.9% 1.81 to 2.75% 3.4%Estimated life in years 0.6 0.5 0.5 0.5
Twelve Months Ended
The computation of expected volatility for the twelve months ended March 31, 2007 is based on a blended calculation
o
Effective January 1, 2004, the Company adopted the provisions of FIN 46R. Under the provisions of FIN 46R, the ompany’s investment in ZiLOG MOD III, Inc. (“MOD III”), a special purpose subsidiary created largely for the economic
benef
• Was recorded as a cumulative effect of a change in accounting principle and not as a restatement to any previous
n minority interest in MOD III on the consolidated balance sheets; and
e results of operations.
Subsequent to the adoption of FIN 46R, which resulted in the de-consolidation of MOD III, ZiLOG, Inc. management receiv nd
nd a building. Under the terms of the MOD III Series A Preferred stock liquidation preference, proximately $4.9 million of historical costs incurred by the Company on behalf of MOD III to maintain its assets in
saleab cch reim d credits in the Company’s consolidated statements of operations for the elv o
On o Micron Technology, Inc. for a total
consi nt 8” wafer fabrication facility and associated land owned by OD III. The cost of the transaction was $0.4 million and has been apportioned on a prorated basis to the related assets sold.
the conclusion of that p s. The remaining net proceeds of $2.8 million were distributed to holders of MOD III Series A Preferred stock
DiVolat
vidend yield 0.0% 0.0% 0.0% 0.0%ity 50.6% 54.2% 50.7% 52.2%il
of historical and market-based implied volatility. The computation of expected life is based on a combination of historical and expected exercise patterns. The interest rate for periods within the contractual life of the award is based on the U.S. Treasury yield curve in effect at the time of grant.
As of March 31, 2007, $2.0 million of total unrecognized compensation costs related to stock options are expected tobe recognized over a weighted-average remaining period of 1.6 years. The total unrecognized compensation costs related tRSAs as of March 31, 2007 of $0.4 million are expected to be recognized over a weighted-average remaining period of 2.1years.
NOTE 7. MINORITY INTEREST
Cit of the Company’s former bondholders, was determined to be a variable interest entity; however, the Company was
not determined to be the primary beneficiary. Accordingly, as prescribed by FIN 46R, the Company’s adoption of this pronouncement:
period consolidated financial statements;
• Effected elimination of both the $30.0 million of MOD III assets held for sale and the corresponding $30.0 millio
• Resulted in no impact to th
ed authorization from the shareholders MOD III to sell the remaining assets without further shareholder approval, aconsequently, the final results of MOD III were included in the Company’s consolidated financial results.
Substantially all of the equipment of MOD III was sold on July 16, 2004. The remaining assets of MOD III consisted
rimarily of land apap
le ondition was reimbursed to the Company from the net proceeds received from the sale of MOD III’s equipment. bursement is included in special charges anSu
tw e m nths ended December 31, 2004.
February 16, 2006, MOD III completed the sale of its remaining assets tderation of $3.8 million. These assets included the dorma
M
This transaction represents the sale of the remaining assets of MOD III and, as such, the shareholders voted to liquidatethe special purpose entity and distribute the remaining net proceeds to its Series A Preferred shareholders at
roces
76

upon t
reorganization, the Company entered into a senior secured financing facility (the “Facility”) with a commercial lender (the “Lender”), dated May 13, 2002, for a three-year $15.0 million senior secured revolv e
ero, and $0.1 million of standby letters of credit, respectively, issued to vendors under the Facility.
he liquidation of the subsidiary in October 2006. The distribution to the MOD III shareholders was net of reimbursement to ZiLOG, Inc. for costs incurred to maintain the facility. NOTE 8. CREDIT FACILITY
Upon consummation of the plan of
ing credit facility. Borrowings on the Facility bear interest at a rate per annum equal, at the Company’s option, to thLender’s stated prime rate or LIBOR, plus 2.5%. At March 31, 2007, the Company had no borrowings outstanding under theFacility as it expired on May 13, 2005. As of March 31, 2007, March 31, 2006, and March 27, 2005, the Company had zero, z
periods
United States $ (2.1) $ (9.7) $ (7.0) $ (2.2) Forei (3.6)
8)
NOTE 9. NET LOSS PER SHARE
The following table presents the calculation of basic and diluted net loss per share of common stock for theindicated (in millions, except per share data):
At March 31, 2007, March 31, 2006, March 27, 2005, and December 31, 2004, options to purchase 1.8 million, 1.8
million, 2.1 million and 2.2 million shares of common stock, respectively, are excluded from the determination of diluted net
16.1 16.3 ess: Weighted-average shares subject to repurchase - - (0.1) (0.1)
ing basic and .2
$ (0.54) $ (1.02) $ (1.16) $ (0.41)
loss per share, as the effect of such shares is anti-dilutive.
NOTE 10. INCOME TAXES The components of loss before provision for income taxes are as follows (in millions):
ThreeMonthsEnded
Mar. 31, Mar. 31, Dec. 31, Mar. 27,2007 2006 2004 2005
Twelve Months Ended
gn (4.7) (5.2) (10.1) Total loss before provision for income taxes $ (6.8) $ (14.9) $ (17.1) $ (5.
ThreeMonths
. 27,Ended
Mar. 31, Mar. 31, Dec. 31, Mar2007 2006 2004 2005
Net loss, as reported $ (9.0) $ (16.8) $ (18.5) $ (6.6)
Weighted-average shares outstanding 16.7 16.4
Twelve Months Ended
LW
eighted-average shares used in comput diluted net loss per share 16.7 16.4 16.0 16
Basic and diluted net loss per share
77

78
The provision for income taxes consists of the following (in millions):
ThreeMonthsEnded
Mar. 31, Mar. 31, Dec. 31, Mar. 27,2007 2006 2004 2005
Federalurrent $ (0.2) $ (0.6) $ 0.3 $ 0.2
Deferred 1.8 1.9 0.3 0.4 1.6 1.3 0.6 0.6
Foreign Current 0.6 0.6 0.8 0.2
0.6 0.6 0.8 0.2
Total provision for income taxes $ 2.2 $ 1.9 $ 1.4 $ 0.8
Twelve Months Ended
C
The provision for income taxes differs from the amount computed by applying the statutory income tax rate of 34% to income (loss) before taxes. The provision and tax effects of the differences are as follows (in millions):
ThreeMonthsEnded
Mar. 31, Mar. 31, Dec. 31, Mar. 27,2007 2006 2004 2005
Computed expected benefit $ (2.3) $ (5.1) $ (5.8) $ (2.0) Foreign taxes 0.6 0.6 0.8 0.1 Foreign losses (benefited) not benefited (0.1) 0.2 5.0 - Deferred tax assets (benefited) not benefited 1.9 4.6 (1.4) 1.2 Amortization of deferred income tax charge 1.8 1.7 1.7 0.4 Stock-based compensation not deductible 0.5 0.2 0.8 0.1 Non-deductible items 0.1 0.1 0.2 - Other (0.3) (0.4) 0.1 1.0 Total provision for income taxes $ 2.2 $ 1.9 $ 1.4 $ 0.8
Twelve Months Ended

erences between the carrying amounts of assets and
liabilities for financial reporting purposes and the amounts used for income tax purposes. Significant components of the Company’s deferred tax liabilities and assets are as follows (in millions):
Balance Sheet Presentation - Deferred Tax Assets & Liabilities:
Realization of the net deferred tax assets is dependent on future earnings, which are uncertain. Accordingly, a valuation
llowance, in an amount equal to the net deferred tax assets as of March 31, 2007, has been established to reflect this uncertainty. The valuation allowance increased by approximately $4.0 million for the twelve months ended March 31, 2007 as compared to the twelve months ended March 31, 2006. This net increase was primarily attributable to increases in net operating loss carryforwards and increases in the tax credit carryforwards. The valuation allowance increased by approximately $12.6 million for the twelve months ended March 31, 2006 as compared to the fifteen months ended March 27, 2005. The fifteen month period includes the twelve months ended December 31, 2004 and the three month transition period ended March 27, 2005. This net increase was primarily attributable to increases in net operating loss carryforwards, increases in the tax credit carryforwards and an increase in the property, plant and equipment.
The Company has federal and state net operating loss carryforwards (“NOLs”) of $42.9 million and $49.7 million,
respectively. The federal NOLs will expire in 2024, if not utilized, and the state NOLs will begin to expire in 2013, if not utilized.
The Company has federal and state research and development tax credit carryforwards of approximately $2.1 million
and $1.7 million, respectively. If not utilized, the federal tax credit carryforward will begin to expire in 2024. The California tax credit can be carried forward indefinitely.
Deferred income taxes reflect the net tax effects of temporary diff
Mar. 31, Mar. 31, Mar. 27,2007 2006 2005
Deferred tax liabilities: Intangible assets $ (2.2) $ (3.2) $ (4.1) Total deferred tax liabilities (2.2) (3.2) (4.1)
Deferred tax assets: Net operating loss carryforwards 13.5 12.1 5.2 Accruals and allowances not currently deductible 2.1 1.6 2.8 Deferred revenue 1.7 1.4 1.2 Tax credit carryforwards 4.4 3.4 1.2 Property, plant and equipment 4.2 4.4 0.7 Other - - 0.1 Total deferred tax assets 25.9 22.9 11.2 Net deferred tax assets 23.7 19.7 7.1 Valuat
$ - ion allowance (23.7) (19.7) (7.1)
Deferred income taxes $ - $ -
Mar. 31, Mar. 31, Mar. 27,2007 2006 2005
Total deferred tax assets: $ 2.2 $ 3.2 $ 5.0 Less: non-current portion - deferred tax asset (1.8) (2.8) (2.3) Net current deferred tax assets $ 0.4 $ 0.4 $ 2.7
Total deferred tax liabilities: $ (2.2) $ (3.2) $ (5.0) Less: non-current portion - deferred tax liability 1.8 2.8 2.3 Net non-current deferred tax liability $ (0.4) $ (0.4) $ (2.7)
a
79

le to the Company’s reorganization and included contingent liabilities related to the establishment of the MOD III special purpose subsidiary. The Company reverses the contingent liabilities previously recorded as the statute of limitations expires. For the twelve months ended March 31, 2007 and the twelve months ended March 31, 2006, the Company recorded a reversal of $4.5 million and $1.9 million, respectively, of these contingencies from long-term liabilities, with a resulting reduction in goodwill from $8.6 million as of March 27, 2005, to $6.7 million as of March 31, 2006, to $2.2 million as of March 31, 2007. The remaining income tax contingencies are $0.4 million as of March 31, 2007, which are included in the other non-current tax liabilities totaling $1.2 million.
The Company provides for U.S. income taxes on the earnings of foreign subsidiaries unless they are considered
permanently reinvested outside of the U.S. At March 31, 2007, the cumulative amount of earnings upon which U.S. income tax has not been provided is approximately $5.2 million as such earnings are considered permanently reinvested. It is not practicable to determine the U.S. income tax liability that would be payable if such earnings are not reinvested indefinitely. NOTE 11. COMMITMENTS AND CONTINGENCIES
Some of the Company’s leases for facilities and equipment are under non-cancelable operating leases, which expire in fiscal year (“FY”) 2008 through FY 2014. The facility lease agreements generally provide for base rental rates, which increase at various times during the terms of the leases, and also provide for renewal options at fair market rental value.
Minimum future lease payments under these non-cancelable operating leases at March 31, 2007 are as follows (in
Commitments
In connection with its reorganization in 2002, the Company recorded income tax contingencies in accordance with Statement of Financial Accounting Standards No. 5, “Accounting for Contingencies.” These contingencies were attributab
millions):
OperatingLeases
Y 2008 $ 2.0 FY 2 1.0 FY 2010 0.5 FY 2011 0.2 FY 2012 0.2 Thereafter 0.3 Total minimum lease payments $ 4.2
F
009
The Company is responsible for common area maintenance charges on certain office leases, which are not included in e above table. These charges are generally less than 10% of base rents. Total operating lease expense, including month-to-
monthMarch
supply
th rentals, were approximately $2.1 million, $2.4 million and $2.6 million, respectively, for the twelve months ended
March 31, 2007, March 31 2006 and December 31, 2004 and $0.6 million for the three month transition period ended 27, 2005.
The Company generally makes purchases under cancelable purchase orders and does not enter into long-termagreements. Certain of its wafer foundry, assembly, materials suppliers, software vendors and support tool manufacturers require non-cancelable purchase orders since they often provide products and services tailored to the Company’s specifications. Summarized in the table below are minimum future commitments under operating leases and non-cancelablepurchase obligations as of March 31, 2007 (in millions):
$ 9.2 $ 7.2 $ 1.6 $
WithinTotal 1 year 1-3 years 3-5 ye
Operatingars
lease obligations $ 3.9 $ 2.0 $ 1.5 $ 0.4 Purch se obligations 5.3 5.2 0.1 - Total 0.4
a
80

Contingencies
of Arizona was granted until such time as Microchip is informed of the ou f this
r determine the outcome or resolution of this litigation at this ill defend ourselves against these claims vigorously. The
Comp could
tends to defend itself vigorously in these matters. The Company’s management believes that it is unlikely that
the outcome of these matters will have a material adverse effect on the Company’s consolidated financial statements, although there can be no assurance in this regard.
From time to time, the Company has agreed to indemnify and hold harmless certain customers for potential allegations of infringement of intellectual property rights and patents arising from the use of its products. During the ordinary course of business, in certain limited circumstances, the Company has agreed to reimburse the indemnified party for losses suffered or incurred by the indemnified party, generally parties with which the Company has commercial relations, in connection with certain intellectual property infringement claims by any third-party with respect to its products and services. The Company has indemnification arrangements that limit its net contingent obligation to pay for defense costs, if any, up to a maximum of $500,000. To date, there have not been any costs incurred in connection with such indemnification arrangements; therefore, there is no accrual of such amounts at March 31, 2007. The Company discloses indemnification liabilities according to FASB
taff Position FIN45-1, "Accounting for Intellectual Property Infringement Indemnifications under SFAS Interpretation o. 45." Under SFAS No. 5, "Loss Contingencies," a claim would be accrued when a loss is probable and the amount can be
rea March 31, 2007, no such amounts are accrued.
and consultants to pay the income taxes due on the restricted shares of common stock that were granted to them. t March 31, 2007, March 31, 2006 and March 27, 2005, total loans outstanding were $0.3 million, $0.4 million, and $0.5
milliove
er, Michael Burger, in 2004 the Company repurchased 92,735 ares for a fair market purchase price of $6.20 per share in consideration for the repayment of his loans totaling $574,956.
In June 2004, the Company’s CEO, James M. Thorburn, paid $247,582 in cash to satisfy all of his outstanding loans
and interest. In March 2007, the Company’s Executive Vice President of Engineering and Operations, Norman G. Sheridan, paid
$72,590 in cash to satisfy all of his outstanding loans and interest.
On August 11, 2005, Microchip Technology, Inc. (“Microchip”) filed a patent infringement claim against the
Company in the U.S. District Court of Arizona (case number CV05-2406-PHX-MHM). Microchip alleges that the Company has infringed, and currently infringes, its patents numbered 5,847,450, 6,696,316 and 6,483,183. Microchip claims that unspecified products of the company, including the Z8 Encore! XP 4K Series of products, infringe these patents and is seeking preliminary and permanent injunctive relief, unspecified damages and costs, including attorneys’ fees. We filed aresponse to the claims on September 15, 2005 generally denying the claims and challenging the validity of the patents. A hearing was scheduled for November 17, 2005. On January 10, 2006, the Company filed a request for patent re-examinationwith the U.S. PTO, which was granted in February and March 2006 for all 3 patents. On March 13, 2006, the Company wasinformed that its motion to stay with the Federal Court
tcome of the re-examinations. We do not believe it is feasible to predict or determine the outcome or resolution olitigation at this time. We believe we have meritorious defenses and will defend ourselves against these claims vigorously. We may incur substantial expenses in our defense against these claims. In the event of a determination adverse to us, we may incur substantial monetary liabilities and be required to change our business practices. Either of these could have a material dverse effect on our financial position, results of operations and/or cash flows. a
The Company does not believe it is feasible to predict o
me. The Company believes it has meritorious defenses and wtiany may incur substantial expenses in its defense against these claims. In the event of a determination adverse to the
Company, it may incur substantial monetary liabilities, and be required to change its business practices. Either of thesehave a material adverse effect on its financial position, results of operations or cash flow.
The Company is participating in litigation and responding to claims arising in the ordinary course of business. TheCompany in
SN
sonably estimated. At
NOTE 12. RELATED PARTY TRANSACTIONS
In 2002, the Company entered into employment agreements with each of its then named executive officers. In June 2002, prior to the issuance of the Sarbanes-Oxley Act, loans were made to certain executive officers and certain other employeesA
n, respectively, and are included in other assets on the consolidated balance sheets. Each loan recipient pledged the shares of restricted stock as collateral for these loans pursuant to their stock pledge agreements. All such loans come due fiyears from the date of issuance and bear interest at 5.5% per annum.
In conjunction with the resignation of a former officsh
81

NOTE 13. SUBSEQUENT EVENTS
In April 2007, the Company entered into an agreement to sell its MOD II facility and in May 2007, the transaction was completed, whereby the Company received net proceeds of $3.1 million. The MOD II facility was classified as assets held for sale on the Company’s consolidated balance sheets at March 31, 2007 and the net proceeds received approximated the arrying value of these assets.
As of March 31, 2007, the Company’s Philippines employee defined benefit pension plan was over-funded by ap re
nds
f
orldwide customer commitments. The hilippine test facility is reimbursed in relation to value added with respect to test operations and other functions performed,
and cons.
e Company’s one reportable gment and can be summarized as follows:
c
proximately $0.8 million. The over-funded position generally reflects a decline in the number of employees who aeligible for entitlements under the plan, coupled with increased returns on the plan assets that are greater than the increase in the employees’ entitlement liabilities. In April 2007, the Company requested, and was granted, certain contribution refuand in May 2007, the Company received $0.7 million. NOTE 14. GEOGRAPHIC AND SEGMENT INFORMATION
Beginning in May 2002, ZiLOG consolidated its business segments into one reportable segment to reflect the change inthe manner in which its chief operating decision maker allocates resources and assesses the performance of the Company’s business. The Company engages primarily in the design, development, manufacture and marketing of semiconductor products. The Company sells its products to distributors and original equipment manufacturers (“OEMs”) in a broad range omarket segments. The Company’s operations outside the United States consist of a final test facility in the Philippines and sales and support and design centers in certain foreign countries. Domestic operations are responsible for the design, development and the coordination of production planning and shipping to meet wP
ertain foreign sales offices receive a commission on export sales within their territory. Accordingly, for financial statement purposes, it is not meaningful to segregate sales or operating profits for the test and foreign sales office operati
The Company has two broad current product categories based on product technologies, referred to as Micrologic
devices and other devices. These two product categories and foundry services are within thse
Products
Sample Uses
Micrologic Devices include: Core 8-bit Microcontrollers and Microproce
ssors Security systems, battery chargers, Universal Infrared remote controls, industrial controllers, POS terminal, motor control, communications products, treadmills
Other Devices include:
Serial Communications Controllers Telephone switches/PBX Modems Satellite TV set-top box, POS card validation IrDA transceivers PDAs, cell phones TV, PC peripheral and other products TV, keyboard, pointing device
Foundry Services Broadband access products
82

The following table summarizes the Company’s net sales by region, by channel, and by product category (in millions)
:
Mar. 31,
Three Months EnTwelve Months EndedMar. 31, Dec. 31, Mar. 27, Mar. 28,
2007 2006 2004 2005 2004
Am ricas $ 33.7 $ 31.9 $ 49.4 $ 9.4 $ 14.0 8.0 4.0
26.0
Net s s by channel: OE 13.5
12.3 0.2
26.0
t sales by product category:
Embedded Flash $ 12.8 $ 6.8 $ 3.2 $ 1.1 $ 0.4 7.3
7.7 11.8 19.5
4.0 1.0 0.6 0.7
Other Devices $ 14.5 $ 18.6 $ 23.7 $ 5.4 $ 6.3 Sub 25.8
0.2 $ 82.0 $ 78.8 $ 95.6 $ 20.2 $ 26.0
ded
Net sales by region:e
Asia (including Japan) 37.7 36.4 33.5 8.2 Europe 10.6 10.5 12.7 2.6 Net sales $ 82.0 $ 78.8 $ 95.6 $ 20.2 $
aleM $ 36.0 $ 34.8 $ 44.7 $ 10.1 $
Distribution 46.0 44.0 47.3 10.1 Foundry services - - 3.6 - Net sales $ 82.0 $ 78.8 $ 95.6 $ 20.2 $
Ne Micrologic
Remote Controls 24.0 20.2 21.6 5.3 Micrologic - new products $ 36.8 $ 27.0 $ 24.8 $ 6.4 $ Other Non - Flash 30.7 33.2 43.5 8.4 Total Micrologic $ 67.5 $ 60.2 $ 68.3 $ 14.8 $ Other Devices Serial Communications Controllers $ 12.0 $ 12.8 $ 14.4 $ 2.8 $ IrDA Transceivers 1.0 1.1 2.1 0.3 Modems 0.7 1.0 2.8 1.6 Television, PC Peripherals and Other 0.8 3.7 4.4 0.7
total - Base business 82.0 78.8 92.0 20.2
Foundry services - - 3.6 - Net sales
83

Net sales are attributable to the ship-to location of the Company’s customers as presented in the following table (in
millions):
The following table shows the location of long-lived assets (in millions):
ThreeMonthsEnded
Mar. 31, Mar. 31, Dec. 31, Mar. 27,2007 2006 2004 2005
United States $ 29.9 $ 27.5 $ 41.7 $ 7.3 Canada & Mexico 3.2 4.3 5.0 2.1 Total North America $ 33.1 $ 31.8 $ 46.7 $ 9.4 Hong Kong (including PRC) 15.2 15.9 13.9 3.2 Singapore 7.7 6.9 8.2 0.7 Germany 5.2 5.1 5.5 1.7 Taiwan 4.6 4.0 4.3 0.7 Korea 1.1 2.4 4.0 0.4 Other Foreign Countries 15.1 12.7 13.0 4.1 Total International $ 48.9 $ 47.0 $ 48.9 $ 10.8
Total Net Sales $ 82.0 $ 78.8 $ 95.6 $ 20.2
Twelve Months Ended
Mar. 31, Mar. 31, Mar. 27,2007 2006 2005
United States $ 9.7 $ 18.7 $ 24.5 Philippines 1.0 1.0 1.3 Other 3.8 3.3 1.0 Total long-lived assets $ 14.5 $ 23.0 $ 26.8
Major Customers
Fo he twelve months ended March 31, 2007, two customers, including one distributor and one OEM customer,
accounted for approximately 23% and 15% of net sales, respectively. For the twelve months ended March 31, 2006, two customers, including one distribution customer and one OEM customer, accounted for approximately 24% and 10% of net sales, respectively. For the twelve months ended December 31, 2004, two customers, including one distribution customer and one OEM customer, accounted for approximately 20% and 12% of net sales, respectively. For the three month transition period ended March 27, 2005 two customers, including one distribution customer and one OEM customer, accounted for approximately 20% and 12% of net sales, respectively.
r t
84

ITEM
FINANCIAL DISCLOSURES
There have been no disagreements with our current and predecessor independent registered public accounting firms.
ITEM 9A. CONTROLS AND PROCEDURES
(a) Disclosure Controls and Procedures. The Company’s management, with the participation of the Company’s Chief Executive Officer and Chief Financial Officer, has evaluated the effectiveness of the Company’s disclosure controls and procedures (as such term is defined in Rules 13a-15(e) and 15d-15(e) under the Securities Exchange Act of 1934, as amended (the “Exchange Act”)) as of March 31, 2007. Based on such evaluation, the Company’s Chief Executive Officer and Chief Financial Officer have concluded that, as of March 31, 2007, the Company’s disclosure controls and procedures are effective in recording, processing, summarizing and reporting, on a timely basis, information required to be disclosed by the Company in the reports that it files or submits under the Exchange Act and are effective in ensuring that information required to be disclosed by the Company in the reports that it files or submits under the Exchange Act is accumulated and communicated to the Company’s management, including the Company’s Chief Executive Officer and Chief Financial Officer, as appropriate to allow timely decisions regarding required disclosure.
(b) Internal Control Over Financial Reporting. There have not been any changes in the Company’s internal control over financial reporting (as such term is defined in Rules 13a-15(f) and 15d-15(f) under the Exchange Act) during the quarter ended March 31, 2007 that have materially affected, or are reasonably likely to materially affect, the Company’s internal control over financial reporting.
EM 9B. OTHER INFORMATION
one
9. CHANGES IN AND DISAGREEMENTS WITH ACCOUNTANT ON ACCOUNTING AND
IT N .
85

PART III
MANAGEMENT
ITEM 1
xecu ive Officers and Directors
forma ompany’s directors and nominees, and compliance with Section 16(a) of t ber
0. DIRECTORS AND EXECUTIVE OFFICERS OF THE REGISTRANT
E t
The in tion required by this item relating to the Che Securities Exchange Act of 1934, is incorporated by reference from ZiLOG’s Proxy Statement for its Septem
6, 2007 Annual Meeting of Stockholders to be filed with the SEC within 120 days after the end of the fiscal year ended March 31, 2007.
ebsite
Code of Ethics
We have adopted a Code of Business Conduct and Ethics that applies to our Chief Executive Officer, Chief Financial Officer and Controller and a Code of Ethics for Chief Executive and Senior Financial Officers. The Code of Business Conduct and Ethics and the Code of Ethics for the Chief Executive and Senior Financial Officers are available on our wat www.zilog.com under the heading “Corporate Governance” on the Investor Relations page of the website. You may also
quest a copy of these documents by sending a written request, on or before July 9, 2007, to ZiLOG, Inc. c/o Investor Relation
o either the code of Business Conduct and Ethics or the Code of Ethics for the Chief xecutive and Senior Financial Officers are made or any waivers are granted, including any implicit waiver, from a provision
t to i ief Financial Officer or Controller, the Company will disclose the nature of ch amendment or waiver on the Company’s website at www.zilog.com
res at 532 Race Street, San Jose, California 95126 and after July 9, 2007 to ZiLOG, Inc. c/o Investor Relations at 6800
Santa Teresa Blvd., San Jose, California 95119. If any substantive amendments t
Eof either draf ts Chief Executive Officer, Chsu or in a report on Form 8-K.
ITEM 1. EXECUTIVE COMPENSATION
Incorporated by reference from ZiLOG’s Proxy Statement for its September 6, 2007 Annual Meeting of Stockholders to be filed with the SEC within 120 days after the end of the fiscal year ended March 31, 2007. ITEM 12. SECURITY OWNERSHIP OF CERTAIN BENEFICIAL OWNERS AND MANAGEMENT
Incorporated by reference from ZiLOG’s Proxy Statement for its September 6, 2007 Annual Meeting of Stockholders to be filed with the SEC within 120 days after the end of the fiscal year ended March 31, 2007. ITEM 13. CERTAIN RELATIONSHIPS AND RELATED TRANSACTIONS
Incorporated by reference from ZiLOG’s Proxy Statement for its September 6, 2007 Annual Meeting of Stockholders to be filed with the SEC within 120 days after the end of the fiscal year ended March 31, 2007. ITEM 14. PRINCIPAL ACCOUNTING FEES AND SERVICES
Incorporated by reference from ZiLOG’s Proxy Statement for its September 6, 2007 Annual Meeting of Stockholders to be filed with the SEC within 120 days after the end of the fiscal year ended March 31, 2007.
1
86

PART IV ITEM 15. EXHIBITS, FINANCIAL STATEM AND REPORTS ON FORM 8-K
Th
ancial Statements and Supplementary Data:
ENT SCHEDULES
(a) e following documents are filed as part of this report:
1. Consolidated Fin
Page
Report of Armanino McKenna LLP, Independent Registered Public Accounting Firm. 55
Report
of KPMG LLP, Independent Registered Public Accounting Firm. 56
Consolidated Balance Sheets as of March 31, 2007 and 2006 and March 27, 2005. 57
olidated Statements of Operations for the Twelve Months Ended March 31, 2007,
ements. 61
ll other schedules are omitted because the information required to be set forth therein is not applicable or is contained in the fi olidated financial statements.
(c) Exhibits:
The exhibits listed in the accompanying exhibit index are filed or incorporated by reference (as stated therein) as
(d) Financial Statements Schedule:
See Item 15 (a)(2) above.
ConsMarch 31, 2006, December 31, 2004, and the Three Months Ended March 27, 2005. 58
Consolidated Statements of Cash Flows for the Twelve Months Ended March 31, 2007, March 31, 2006, December 31, 2004, and the Three Months Ended March 27, 2005. 59
Consolidated Statements of Stockholders’ Equity as of March 31, 2007, March 31, 2006, December 31, 2004, and March 27, 2005. 60
Notes to Consolidated Financial Stat
2. Financial Statement Schedule:
Schedule II—Valuation and Qualifying Accounts 91 Ac onsolidated nancial statements or notes to the cons
(b) Not Required.
part of this annual report.
87

SC
HEDULE II
ING ACCOUNTS
Description
ZiLOG, INC.
VALUATION AND QUALIFY(In millions)
Beginning
Charged to
c
ths ended March 31, 2007: or doubtful accounts $ 0.2 $ __ 1) $
ths ended March 31, 2006:
doubtful accounts $ 0.2 $ 0.1 $
1) $
s ended March 27, 2005:
doubtful accounts $ 0.3 $ (0.1) $
$
ended December 31, 2004: $ —
Balance at
of Period
Additions (Reductions)
Costs and Expenses Dedu tions
Balance at Ending
of Period
Twelve mon
Allowance f $ (0. 0.1
Twelve monAllowance for (0. 0.2
Three monthAllowance for — 0.2 Twelve months Allowance for doubtful accounts 0.3 $ — $ $ 0.3
88

Signatures
Pursuant to the requirements of Section 13 or 15(d) of the Securities Exchange Act of 1934, the Registrcaused the report to be signed on its behalf by the unde duly authorized, on the 22nd day of June 2007.
ZiLOG, INC. By: /s/ Darin Billerbeck
ant has duly
rsigned, thereunto
PresidDarin Billerbeck
ent an tive Of
KNOW ALL PERSONS BY THESE PRESENTS, that each person whose signature appears below constitutes and race, his/her attorneys-in-fact, each with the power of substitution, for him/her in any
ndments to this Report 0 , same, wi there eocuments in connection therewith with the Securities and Exchange Commission, hereby ratifying and confirming all that
tute or substitutes may do or cause to be done by virtue hereof.
Pursuant to the requirements of the Securities Exch ge Act of 19 this report has been signed below by e t and in the capacities and o he dates indicated:
d Chief Execu ficer
Power of Attorney
appoints Darin Billerbeck and Perry J. Gand all capacities, to sign any ame on Form 1 -K and to file the th Exhibits to and oth r deach of said attorneys-in-fact, or substi
an 34, thfollowing persons on behalf of the Registran n t
Signature
Title ate
D
/s/ DARIN BILLERBECK
Darin Billerbeck President, Chief Executive Officer and Director
June 22, 2007
/s/ PERRY J. GRACE
Perry J. Grace Executive Vice President, Chief Financial Officer and Principal Accounting Officer
June 22, 2007
/s/ FEDERICO FAGGIN
Federico Faggin Director June 22, 2007
Richard L. Sanquini Director June 22, 2007
/s/ ROBIN A. ABRAMS
Robin A. Abrams Director June 22, 2007
David G. Elkins Director June 22, 2007
89

EX X
Number
HIBIT INDE
Exhibit
Description 2.1(a) Joint Reorganization Plan, as confirmed by order of the U.S. Bankr tc t for the Northern District of California,
dated April 30, 2002.
3.1(h) Amended and Restated Certificate of Incorporation of ZiLOG, Inc., as amended a
d and Restated Bylaws of ZiLOG, Inc.
ctronics
10.2(e) Lease, da ecember 21, 2001, between ZiLOG, Inc. and the Sobrato Group.
10.3(f) Distributor Agreement, dated October 23, 2002, between ZiLOG, Inc. and Future Electronic Inc.
10.4(f) Form of Full-Recourse Promissory Note.
10.5(f) f St edge Ag ment.
10.6(g) Summ LOG, Inc. Incentive
10.7(b) , Inc. 2 2 Omnibus Stock Incenti
10.8(g) ZiLO nibus Stock Incentive Plan.
10.9(g) ZiLOG, In 4 Employee Stock Purch
10.10(k) Amendment No. 1 to the ZiLOG, Inc. 2004 Employee Stock Purchase Plan.
10.11(k) eement betw , Inc. and its Directors and Officers.
10.12(l) Employment Offer Letter dated as of April 4, 2006 between ZiLOG, Inc. and Nick Antonopolous.
10.13(m) Empl tter dated January 3, 2007 between ZiLOG, Inc. and Darin Billerbeck.
10.14(j) Form of Change of Control Agreement.
21.1 Subsidiaries of ZiLOG, Inc.
23.1 Consent of Armanino McKenna LLP, independent registered public accounting firm.
23.2 Consent of KPMG LLP, independent registered public accounting firm.
24.1 Power of Attorney (see the signature pages of this Annual Report).
31.1 Certification of Chief Executive Officer pursuant to Securities Exchange Act Rules 13a-14 and 15d-14 as Adopted Pursuant to Section 302 of the Sarbanes-Oxley Act of 2002, dated June 22, 2007.
31.2 Certification of Chief Financial Officer pursuant to Securities Exchange Act Rules13a-14 and 15d-14 as Adopted Pursuant
to Section 302 of the Sarbanes-Oxley Act of 2002, dated June 22, 2007.
32.1 Certifications of Chief Executive Officer and Chief Financial Officer pursuant to Section 18 U.S.C Section 1350, as Adopted Pursuant to Section 906 of the Sarbanes-Oxley act of 2002, dated June 22, 2007.
up y Cour
nd corrected.
3.2(i) Amende
4.1(f) Form of common stock certificate.
4. 2(c) Form of Restricted Stock Purchase Agreement.
4.3(c) Form of Non-Qualified EBITDA-Linked Option Grant Agreement.
10.1(d) Contract of Lease, dated October 15, 2003, by and between ZiLOG Electronics Philippines, Inc. and Fruehauf ElePhils. Corporation.
ted as of D
s,
Form o ock Pl ree
ary of 2004 Zi Plan.
ZiLOG 00
ve Plan.
G, Inc. 2004 Om
c. 200 ase Plan.
Form of Indemnification Agr een ZiLOG
oyment Offer Le
90

(a) Incorporated herein by reference to Exhibit 99. rrent report on Form 8-K filed with the Commission on May 15, 2002.
) Incorpo ted herein by reference to the item of the same name filed as an exhibit to the Company’s registration t on Form S-8 (File No. 333-88416) filed with the Commission on May 15, 2002.
(c) rated herein by reference to the item of the same name filed as an exhibit to the Company’s quarterly report on F m 10-Q e Commission on August 16, 2002.
( on Form 10 mmission on November 12, 2003.
) Incorpo ted herein by reference to the item of the same name filed as an exhibit to the Company’s annual report on
ame name filed as an exhibit to the Company’s registration statemen on Form S-1/A (File No. 333-98529) filed with the Commission on November 5, 2002.
( em of the same name filed as an exhibit to the Company’s registration statemen n Form S-1/A (File No. 333-111471) filed with the with the Commission on February 24, 2004 .
( me name filed as an exhibit to the Company’s annual report on Form 10-K for the fiscal year ended December 31, 2003.
( nt report on Form 8-K filed with the
(Commission on December 20, 2005.
( Company’s annual report on Form 10-K for the fiscal year ended December 31, 2004.
( annual report on Form 10 for the fiscal year ended March 31, 2006.
( .1 to the Company’s Current report on Form 8-K filed with the Commission on January 8, 2007.
1 to the Company’s cu
(b rastatemenIncorpo
or filed with thd) Incorporated herein by reference to the item of the same name filed as an exhibit to the Company’s quarterly report
-Q filed with the Co(e ra
Form 10-K for the fiscal year ended December 31, 2001. (f) Incorporated herein by reference to the item of the s
tg) Incorporated herein by reference to the it
t oh) Incorporated herein by reference to the item of the sa
i) Incorporated herein by reference to Exhibit 99.1 to the Company’s curreCommis
j) Incorporsion on November 17, 2005. ated herein by reference to Exhibit 99.1 to the Company’s current report on Form 8-K filed with the
k) Incorporated herein by reference to the item of the same name filed as an exhibit to the
l) Incorporated herein by reference to the item of the same name filed as an exhibit to the Company’s-K
m) Incorporated herein by reference to Exhibit 10
91