zimbabwe country assistance evaluation - world...
TRANSCRIPT
Report No. 29058 Zimbabwe Country Assistance Evaluation May 21, 2004 Operations Evaluation Department
Document of the World Bank

Abbreviations and Acronyms
AAA Analytical and Advisory Activities BEAM Basic Education Assistance Module CAS Country Assistance Strategy CAE Country Assistance Evaluation CEM Country Economic Memorandum ESAP Economic and Structural Adjustment Program ESW Economic and Sector Work GDP Gross Domestic Product GNP Gross National Product HIV/AIDS Human Immunodeficiency Virus/Acquired Immune Deficiency
Syndrome IDA International Development Association IMF International Monetary Fund LSCS Large Scale Commercial Sector MPSLSW Ministry of Public Service, Labor and Social Welfare OED Operations Evaluation Department PER Public Expenditure Review PPP Purchasing Power Parity SAC Structural Adjustment Credit SDF Social Development Fund STI Sexually Transmitted Infections
Director General, Operations Evaluation : Mr. Gregory K. Ingram Director, Operations Evaluation Department : Mr. Ajay Chhibber Senior Manager, OEDCR : Mr. R. Kyle Peters Task Manager : Ms. Poonam Gupta

i
Contents Preface .............................................................................................................................. iii
Summary ........................................................................................................................... v 1. Background ................................................................................................................ 1 Description ............................................................................................................. 1
Economic and Social Conditions ........................................................................... 1
2. Products and Services ................................................................................................ 7 Bank Strategy and Its Relevance ........................................................................... 7 Implementation of Strategies: Lending ................................................................. 9 Implementation of Strategy: Analytical and Advisory Activities (AAA) ........... 15 Resource Mobilization and Aid Coordination ..................................................... 18
3. Development Impact of Country Assistance ......................................................... 21 Growth and Macroeconomic Stabilization .......................................................... 21 Private Sector Development ................................................................................ 22 Poverty Alleviation .............................................................................................. 23 Overall Assessment .............................................................................................. 24 Counterfactual ...................................................................................................... 26
4. Contributors’ Performance ..................................................................................... 27 World Bank Performance .................................................................................... 27 Government Performance .................................................................................... 29 Partner Performance ............................................................................................. 29 Exogenous Factors ............................................................................................... 30
5. Lessons and Recommendations .............................................................................. 31
References .........................................................................................................................33
Text Boxes Box 2.1: Good Practice: Technical Collaboration and Trust in the Midst of Decline ...................................................................................... 18 Box 4.1: Role of IFC and MIGA in Zimbabwe ...................................................... 30
Text Tables Table 1.1: Social Indicators ......................................................................................... 3 Table 1.2: Selected Economic Indicators .................................................................... 3 Table 2.1: Planned and Actual Lending, FY91–01 ................................................... 10 Table 2.2: World Bank Commitments by CAS Period ............................................. 10 Table 2.3: OED Ratings (as percent of rated net commitments) .............................. 14 Table 3.1: Zimbabwe: Distribution of Poverty Indexes, 1990–91 and 1995–96 ..... 23
Annexes Annex A: Statistical Annex ...................................................................................... 35 Annex B: Recommendations on Land Reform in Bank Reports ............................. 49 Annex C: Brazil: Land-based Poverty Alleviation................................................... 51 Annex D: User Charges in Health and the Bank’s Role............................................ 53 Annex E: Guide to OED’s Country Evaluation Rating Methodology.......................55

ii
Contents (cont’d.)
Figure Figure 3.1: Zimbabwe Central Government Operations 1990-2001...................21 Attachments Attachment A: Management Action Record .............................................................59 Attachment B: Chairman’s Summary ...................................................................... 61

iii
Preface
This Country Assistance Evaluation (CAE) provides an independent assessment of the role of World Bank assistance to the Republic of Zimbabwe during 1990–2000 with reference where relevant to the 1980s.
The CAE is a countrywide evaluation that concentrates on the relevance, efficacy,
efficiency, sustainability, and institutional development impact of the Bank's program of assistance. Section 1 describes Zimbabwe’s economic and social developments as well as the major challenges to development. Section 2 evaluates Bank assistance from the bottom up by assessing the Bank’s products and services: strategy, lending, analytical and advisory activities, resource mobilization, and aid coordination. Section 3 evaluates the development impact of country assistance. Section 4 discusses the contributors’ performance, the Bank, the country and other partners, as well as exogenous influences. Section 5 presents the lessons and recommendations.
The CAE is based on Bank strategy and lending documents, economic and sector
reports (both formal and informal), Operations Evaluation Department (OED) project assessments, International Monetary Fund (IMF) reports, and interviews with staff of the Bank, government officials and other donors and experts. Non-Bank literature on Zimbabwe was also reviewed. An OED mission visited Zimbabwe from March 24, 2001, to April 10, 2001.
A draft of the report was sent to the Zimbabwean Government in January 2003,
however comments have not been received.
This evaluation was prepared by Ms. Poonam Gupta (Task Manager), with inputs from Mr. J. W. Van Holst Pellekaan (consultant, OEDCR). Mr. Gene Tidrick (OEDCR) and Mr. Roger Robinson (external) were peer reviewers for the report. Ms. Laurie Effron (OEDCR) also provided comments. Ms. Betty Casely-Hayford and Agnes Santos provided administrative assistance and Ms. Anar Omarova provided research assistance.


v
Summary
In the first decade after Independence in April 1980, Zimbabwe sought to promote development and reduce inequities through intensified economic controls and increased social expenditures. This resulted in social progress but at the expense of unsustainable fiscal deficits and low growth. Land distribution remained highly unequal. In 1991 the Government launched an Economic and Structural Adjustment Program (ESAP) to accelerate growth through better fiscal management and market liberalization. This largely failed because of external shocks and unsound policies. Social progress slowed, per capita incomes declined, and the number of people living in extreme poverty increased. AIDS now affects one-third of the adult population and life expectancy has fallen from 56 in 1990 to 40 in 2000.
The Bank’s strategy in the 1980s responded appropriately to poor economic management but did not provide clear direction to land reform. Lending was concentrated on investment loans for infrastructure. While analytical work appropriately focused on improving economic management, all five major Bank reports made no recommendations on land reform.
The Bank provided two structural adjustment credits (SACs) during 1991-96. While a number of important reforms were accomplished through these credits, Zimbabwe was never able to establish macroeconomic stability. Fiscal deficits averaged 8.5 percent per annum in 1991-99. One reason was the unwillingness of the highest political leadership to make critical adjustments. A second important reason was that financial liberalization and tax reduction were sequenced to come before rather than after reductions in expenditures. Financial liberalization and tax reductions turned out to be fiscally costly and led to a domestic debt trap. Rising interest payments squeezed public spending on social services; high real interest rates stifled private sector growth and employment generation, counteracting the positive effects of the SACs on economic liberalization and deregulation of investment.
While many analytical and advisory activities (AAAs) were completed in the 1990s, substantive analytical work on some key issues either was not undertaken or was not timely. The public expenditure review (PER) in end-1995 came too late to highlight sequencing issues in the Government’s fiscal program or to inform the design of the SACs. Also no substantive analytical work on poverty has been completed. Furthermore, land reform was addressed only sporadically and not treated as a priority area until late in 1998. While the Bank’s inability to finance land acquisition was a constraint to an effective dialogue and experimentation on approaches, the Bank could have undertaken AAA on alternative approaches, disseminated findings from elsewhere that only in exceptional cases are large farms more efficient than small farms, and pushed for the relaxation of rules for subdivision of land.
There were shortcomings in investment lending also. The Bank was unable to launch a lending program for agriculture, and gave insufficient attention to social safety nets. During 1998–2000, when there were clear warning signs that the Bank’s strategy

vi
was not working because of a lack of ownership from the political leadership, it continued to appraise projects and approve new projects, as well as negotiate a SAC III.
The outcomes of Bank assistance during 1980–2001 evaluated against country assistance strategies (CASs) and other relevant objectives are rated unsatisfactory, and institutional development impact as negligible. While the Bank’s program did help liberalize trade, reform agricultural marketing arrangements, deregulate domestic investment, and establish a fund to mitigate the social impact of adjustment, the assistance did not support macroeconomic stability, expenditure reform, and a reduction in poverty and inequality. Also, civil service reform did not improve efficiency nor contribute to fiscal sustainability, parastatal reform was disappointing, and structural reforms were poorly sequenced. In December 1997, the Bank disbursed the second tranche of SAC II based on assurances which were not met.
Bank actions, which largely determine Bank performance, are one contributor to the outcome and institutional development impact of the Bank’s assistance strategy. Outcomes are also determined by the Borrower’s performance and other factors. The Borrower showed little commitment to macroeconomic stability and poverty alleviation. It did not take steps on land policy that its own Land Reform Commission recommended. Instead the Government abandoned the rule of law and respect for property rights by forcibly acquiring land. Controversial and unexpected policy decisions by the Government in 1998-2000 (e.g., on civil service wage increases and land redistribution) make sustainability of outcomes unlikely.
The Zimbabwe experience provides four lessons. First, given the necessity of macroeconomic stability, especially achieving fiscal sustainability, the Bank should have undertaken a PER prior to 1995, should have been more forceful in ensuring that credible steps to achieve fiscal sustainability were incorporated in adjustment lending, and should have formed a judgment not only about the macroeconomic/fiscal targets, but also about the likelihood of their implementation. Second, the Bank should have given greater attention to reducing glaring inequalities and poverty by undertaking in-depth analytical work on poverty and more proactively addressing land reform before 1998. Third, the Bank should not have relied on commitments with technocrats in the absence of political consensus for reforms. Fourth, in the absence of ownership from the political leadership, the Bank should have insisted that conditions be fulfilled and not proceed to lend on the basis of promises. The Bank’s willingness to lend sent the wrong message to the client and to the partners.
Given the current situation, the Bank can do little to move forward the economic and social agenda. It cannot lend even for a narrowly defined social agenda; the Government has been in arrears to the Bank since May 2000. At the present juncture, the Bank should focus AAA on building a knowledge base in four critical areas: (i) an assessment of poverty and inequality, and the impact of economic policies on these issues; (ii) an analysis of the political economy factors which have impeded reforms (e.g., parastatal reform) in the past; (iii) learning from pilots on land reform launched in other countries; and (iv) a public expenditure review focused on fiscal sustainability and the required rationalization and reallocation of public expenditures. A resumption of normal Bank

vii
lending should be conditional on: credible and upfront measures to achieve macroeconomic stability; fundamental governance reforms; a pro-poor reallocation of expenditures; parastatal reforms; and the formulation and credible initial steps in the implementation of an action plan on land issues.
Gregory K. Ingram Director-General Operations Evaluation


1
1. Background
Description
1.1 Zimbabwe is a land-locked country. It borders Zambia to the north, Botswana to the west, South Africa to the south, and Mozambique to the east. Its population in 2000 was 12.6 million, about 0.6 percent of which were whites. In 1999, industry accounted for 25 percent of GDP, agriculture 20 percent, and the service sector the remaining 55 percent. Despite the extensive diversification of the economy and agriculture’s relatively small contribution to GDP, the sector’s contribution to growth and employment has been and continues to be significant. In 1999, tobacco and horticulture alone accounted for 36 percent of exports and the sector as a whole accounted for 44 percent of total merchandise exports, the same since 1981. Further, half the manufacturing sector relies on agriculture for inputs. In addition, out of those employed in 1999, 60 percent were working in agriculture, forestry, and fishing.
Economic and Social Conditions
1.2 Prior to the 1965 Unilateral Declaration of Independence (UDI), Southern Rhodesia operated as an open economy. During those years, the economy experienced high overall growth, massive government investment in electric power, rail and road transport, and a large infusion of foreign capital. The ownership of land was, however, skewed; the Land Apportionment Act of 1930 reserved 30 percent of agricultural land for 1.1 million Africans living in mostly low fertility Native Reserves and 51 percent (including most high fertility land) for 50,000 white settlers (roughly 5 percent of the population at that time). The remaining 19 percent was unassigned land and forest areas.
1.3 The UDI in 1965 provoked international sanctions which prompted the Government to switch towards greater reliance on import-substituting industrialization policies. After a period of relative prosperity between 1965 and 1974, sanctions, shortcomings of these policies, and civil war between 1973-80 caused growth to slump. The war was fought over two fundamental issues; one was the enfranchisement of Africans and the other was land distribution. In the words of Eddison Zvobgo, Zimbabwe's first Minister of Local Government, "Land was the concretization of all the other grievances . . . The most obvious and visible deprivation was land."
1.4 The war culminated in the Lancaster House Agreement and the creation of Zimbabwe on April 18, 1980. Under the Agreement, the British Government would grant funds for land acquisition and re-distribution for ten years for land acquired on a willing-seller-willing-buyer basis. This provision was meant to protect white landowners against confiscation of their lands.
1.5 Between 1980 and 1989 the pace of resettlement was slower than anticipated. About 52,000 families were resettled on 3.1 million hectares of acquired land against a target of 162,000 families on 10 million hectares set in 1982. The slow resettlement is explained by: restrictions placed by the Lancaster Agreement; the lack of financial

2
resources (British assistance had to be matched dollar for dollar by the Government’s own resources); overly centralized, bureaucratic, and uncoordinated implementation by the Government and the lack of availability of high quality land for sale. More than 40 percent of the acquired land for resettlement was in regions where land was of poor quality and the Government was unwilling to buy more land in these regions.
1.6 Thus, even after a decade of resettlement efforts, land distribution remained highly skewed. As of 1988, the large-scale commercial sector (LSCS), numbering about 4,660 farms, controlled 29 percent of the total land area, located mainly in the areas of highest agricultural potential. While more than 1,000,000 families remained in the overcrowded communal areas on 42 percent of the land area, located mainly in areas of poor agricultural potential. These families were facing declining soil fertility, and growing incidence of soil erosion from increased population pressures and intensive agricultural production together with limited use of fertilizers. Land pressure and tremendous political pressure because of expectations created during the war of Independence made land redistribution a continuing critical issue at the end of the 1980s.
1.7 There were also economic considerations for redistributing land. The policy of redistributing land would have improved the productivity of unused, or underutilized, land. Such land was estimated to be about 3.5 million hectares according to an internal Bank memorandum in the early 1990s. The argument that small farms resulting from redistribution policy are relatively inefficient compared to LSCS was not supported by studies.1 In any case, redistribution policy was important for supporting broad-based growth and poverty alleviation because smallholder agriculture was the principal provider of the rural poor’s employment and income.2 Impact analysis on a set of land reform beneficiaries suggests that resettled households performed well based on income, agricultural productivity, accumulated wealth, and household expenditure when compared with their position at the start of the land reform program, or when compared with their communal counterparts.3
1.8 The other issues at the end of the 1980s were excessive controls and high government deficits. In order to redress inequities, the Government had intensified the direct controls inherited at independence and increased government expenditures. The
1 The 1995 Country Economic Memorandum (CEM) noted that the dominance of LSCS in many high-value industrial and horticultural crops stemmed less from economies of scale than from the LSCSs favored land resources and access to irrigation facilities, favored access to technology, agricultural credit and other factors. Zimbabwe is divided into five natural regions based on soil types, rainfall, and other physical characteristics. Within natural regions I and II, the domestic resource cost ratio (DRC) for smallholder maize approximates that for LSCS maize production, while the DRC for smallholder cotton is lower than that for large farm tobacco, wheat and soyabean production. The case for a resource efficient smallholder subsector is even greater in regions III and IV. Smallholders are far more efficient producers of maize, cotton, and vegetables than the LSCS in these areas. 2 A country’s poverty reduction potential depends on growth elasticity, i.e., changes in poverty in relation to growth. A report by the Statistical Office in Zimbabwe in July 1998 estimated that the growth elasticity between 1990/91 and 1995/96 for rural Zimbabwe was only -0.477. With this elasticity, agricultural growth rates of higher than 6 percent per annum would be required before the incidence of poverty in rural areas could decline 3 Deininger, Hoogeveen, and Kinsey. 2002.

3
highly regulated agricultural marketing network was expanded as were the range of crops that were controlled. Controls on the allocation of foreign exchange and price determination were extended to cover the labor market. In 1980, minimum wages were introduced, and increased sharply in the early 1980s. To prevent lay offs, regulations were introduced with severe restrictions on firing. A massive redistribution of social expenditures particularly on health and education led to significant improvements in social indicators (table 1.1), but the central government deficit rose to 10 percent of GDP (table 1.2). This was financed partly through high tax revenues (36 percent of GDP), with the remaining financed by domestic borrowing at negative real interest rates. By the end of the 1980s, per capita income growth was 1 percent per annum and unemployment was more than 20 percent.
1.9 As a result, the Government came to regard economic policy change as necessary and launched the Economic and Structural Adjustment Program (ESAP) covering 1991 through 1995. The program, unlike in many African countries, was initiated not by a crisis but by a recognition that conditions for more rapid growth were needed.
Table 1.1: Social Indicators Zimbabwe Sub-Saharan Africa 1980 1990 2000 1990 2000 Infant mortality (per thousand live births) 80 51.8 69.0 101 92.4 Illiteracy (% of population age 15+) 30 19.3 11.3 50 39.4 Life expectancy at birth 54.9 56.2 40.4 49.9 46.8 Safe water (% of population with access) .. 77 85 48.7 55.4 Sanitation (% of population with access) .. 64 68 55.2 54.8 Primary school enrollment % gross 85.1 115.7 112.4 75.7 74.6 Source: Bank Database.
1.10 Under the ESAP, substantial progress was made in liberalizing the trade and foreign exchange regime, in deregulating agricultural marketing, the labor market, and the financial sector. The average annual growth in GDP in 1991-97 was 2.9 percent, but excluding the 1992 drought year, average growth was 4.9 percent, above the rate of population growth which had slowed to about 2.6 percent during 1991-97.
Table 1.2: Selected Economic Indicators (per annum)
Indicator 1965-74 1975-80 1981-90 1991-97 1998-99 2000 2001 Proj.
Real GDP Growth 7.8 1.1 4.5 2.9 1.1 -4.9 -8.4 Agricultural Growth 6.3 -0.7 4.5 3.8 4.2 2.5 Central Govt. Budget Balance, excl. grants (% of GDP) -2.9 -8.7 -10.7 -8.8 -7.6 -22.9 -12.6 Gross Fixed Capital (% GDP) 19.4 16.0 17.3 21.3 13.8 …. … Source: Bank Database. Budget deficit is from an internal Bank economic memorandum in 1981 and IMF
reports.
1.11 But inadequate progress was made in macroeconomic stabilization due to several factors. The main factor was the flaw in sequencing of reforms in the ESAP macro program. 4 The fiscal aspect of the program had three elements: (i) a reduction in the
4 IMF. 1998.

4
fiscal deficit; (ii) a reduction in explicit tax rates; and (iii) a deregulation of interest rates. A reduction in tax rates and the deregulation of interest rates sequenced to come before rather than after expenditure reductions from parastatal reform and public employment reductions turned out to be fiscally very costly. Even with a constant domestic debt, the cost of financial liberalization alone was 5 percent of GDP. The failure to meet fiscal targets necessitated further borrowing and led to the domestic debt trap. In 1990–91, the central government domestic debt was 30 percent of GDP, the Government was paying 9.8 percent nominal interest when inflation was 23 percent; interest payments were only 4.5 percent of GDP. By 1995–96, domestic debt had increased to 47 percent of GDP, the real interest rate was 8 percent on domestic debt and the interest bill had risen to 9 percent of GDP. Other factors that exacerbated the fiscal deficit were, government reluctance to follow through with civil service and public enterprise reform, and the 1992 drought which necessitated increased spending at the same time that tax revenues were declining.
1.12 The ESAP also entailed a massive redistribution of income from formal sector wage earners to commercial agriculture. The deregulation of the labor market, reduced protection of manufacturing, and a reduction in public expenditures led to a decline in employment in manufacturing and in public administration. Agriculture benefited from exchange rate adjustment and marketing deregulation but agricultural growth was not broad based enough to reduce rural poverty (para 3.10). The overall prevalence of extreme poverty increased from 26 percent to 35 percent between 1991 and 1995. Inequality remained high with a Gini coefficient of 0.63 in 1995–96 compared to 0.39 for Ghana, 0.38 for Uganda, and 0.53 for Zambia.5 Rising poverty and high inequality undermined support for the program in a country that was trying to overcome its legacy of a highly dualistic economic structure and segregated past.
1.13 Poverty has most likely increased since 1995 for several reasons. First, both GDP per capita and GNI per capita have on average declined since 1996 by 2.2 and 3.4 percent respectively (annex A, table 2).6 The decline has been particularly marked since 1999. Second, there have been considerable increases in the prices of food and other consumer goods such that inflation was 58.5 and 55.9 percent in 1999 and 2000 respectively. Third, the misery of the poor has been reinforced by a substantial shortfall in maize production in 2002. Finally, the fiscal crisis has led to a devastating reduction in access and the quality of social services at a time when they are badly needed.
1.14 Key millennium development goals (MDGs) are worsening as a result of the human immunodeficiency virus/acquired immune deficiency syndrome (HIV/AIDS) pandemic. The adult HIV/AIDs prevalence rate for Zimbabwe is now estimated at a third of the population. Between 1990 and 2000, life expectancy has decreased from 56 to 40 years and infant mortality has risen from 52 to 69 per thousand live births. In 1999, the
5 See Christiaensen, Demery, and Paternostro. 2002. 6 The trends in GDP per capita in 1995 prices and GNI per capita in 1993 purchasing power parity (PPP) track each other closely, particularly from 1996. The Atlas method for calculating the trend in GNI per capita shows a substantially greater decline compared with the PPP method because inflation has been high, and exchange rates have not been market-determined but administratively adjusted from time to time.
5
number of AIDS-related orphans increased by 130,000 (about 1 percent of the population). The pandemic has also sharply increased infections such as tuberculosis.
1.15 Starting in 1997, there was a fundamental change in governance. The Government back tracked on price and trade liberalization, and granted war veterans unbudgeted payments of more than 2 percent of GDP in August 1997. Parastatals incurred losses of more than 7 percent of GDP in 1997–98. Budgetary discipline was further undermined in 1998 by increasing defense expenditures with military operations in Congo.7 By 1998–99, the central government budget deficit had risen to 11.5 percent. The Government also progressively became more strident in its claims that white farmers should move off their land and be replaced by blacks. It targeted 1,471 commercial farms for compulsory acquisition in November 1997, and in June 1998 prepared a second land reform program aimed at acquiring 5 million hectares.
1.16 Expectations for a meaningful land reform increased in September 1998 as a result of agreements reached in a donor conference. But divergent views between the Government and the donors on what each side had committed to do led to an impasse. In April 2000, frustrated with a lack of financial support from donors, the Parliament adopted an amendment to the Constitution which stipulated that if donors did not provide funds for land purchases, the Government could acquire farms compulsorily without paying compensation. A wave of invasions hit the country, organized by war veterans and condoned by the Government. In July 2000, a newly-elected government proceeded to take over large-scale commercial farms under the Fast Track land reform program involving the compulsory acquisition of 5 million hectares of commercial farm land. In July 2001, the Government increased the amount to be resettled from 5 million hectares to 8.3 million hectares, or almost 77 percent of the land area with large-scale commercial farming. And in November 2001, the fast-track program was accelerated to allow the Government to assume immediate ownership of land targeted for acquisition; current owners were instructed to vacate farms within three months.
1.17 By 2000, the country was in a serious economic crisis. GDP per capita growth was –6.7 percent in 2000 and –9.8 percent in 2001. The central government fiscal deficit (excluding grants) had risen from 10 percent of GDP in 1999 to 22.5 percent in 2000 led by large, unbudgeted increases in civil service wages, defense spending and a surge in domestic interest payments following a rapid increase in domestic borrowing. The deficit was projected to decline in 2001 due to a sharp reduction in domestic interest payments as a result of forced restructuring of government debt.
7 In every sector, ministries could not implement reforms because they were overruled by the ruling party. For instance, a financial sector policy note in 1997 singled out a bank for corruption and financial risk; the bank was inspected by the Central Bank but not stopped from operating because of political connections. The power ministry was receptive to sectoral reforms but the party leadership negotiated an unfavorable power deal with another country. In 1998, senior officials of the Agricultural Ministry were arrested.

6
7
2. Products and Services
Bank Strategy and Its Relevance
2.1 The twin objectives of reducing fiscal deficits and fostering equitable growth have remained unchanged for almost two decades. These objectives were first set out in the 1980 country economic memorandum (CEM) and repeated with a few modifications in the FY92, FY94 and the FY97 country strategies. Private sector development, poverty alleviation, human capital, and rural development were added to the country strategies in the 1990s.
2.2 The FY92 Bank strategy objectives embedded in the first Structural Adjustment Credit (SAC I) report of the Bank’s President aimed to maintain macroeconomic stability, promote growth, and reduce poverty and inequality. Reforms were to be directed at the parastatal sector, the civil service, trade, and exchange rates. Price controls would be removed and the procedures for hiring and firing would be streamlined. To mitigate the potential negative effects of structural adjustment on the poor, a Social Development Fund (SDF) was proposed to provide financial assistance to the poor in the payment of education and health fees, in the maintenance of nutritional standards, in the training of retrenchees, and in establishing small businesses. Continued emphasis would be given to agriculture and to protect government resources going to health and education.
2.3 Lending was projected at US$265 million in FY91–92 and US$267 million in FY92–93. The bulk of lending was to be through two adjustment credits (US$300 million) and the remainder was to be for investment loans for economic infrastructure, health care, education, wildlife conservation and an agricultural services project. No new analytical and advisory activities (AAA) were envisaged as considerable work had been completed.
2.4 The objectives of the FY94 Bank strategy were similar to those in the FY92 strategy: recovery of growth, private sector development, greater equity, and poverty alleviation. The Bank strategy proposed US$50–$150 million per year for FY93–97. In the base case, nine investment loans would support small and medium enterprises, infrastructure, communal farming, and health to arrest the spread of AIDS. A third adjustment credit in FY95 would focus on initiatives to expand exports. Major economic and sector work (ESW) was foreseen in the Bank strategy ( e.g., a CEM, Trade Expansion Study, and Public Expenditure Review).
2.5 The FY97 Bank strategy also targeted macroeconomic reforms, rural development, natural resource management, private sector development, and the development of human capital. The base case lending scenario was US$90 million per year with investment projects for public sector capacity building, rural development and natural resource management, private sector development through support for infrastructure, and the development of human capital. Increased emphasis would be placed on workshops, seminars, and shorter focused studies rather than broad-based ESW.
8
2.6 Evaluation of the strategies: The strategies were relevant in many respects. Relevance was high with respect to stimulating private sector development and growth. Relevance was also high with respect to maintaining macroeconomic stability by focusing on reducing unsustainable levels of public sector deficits and parastatal losses, and mitigating the negative social impact of adjustment on the poor and the vulnerable through the SDF. The emphasis on Sexually Transmitted Infections (STI) for reducing AIDs in the FY94 Bank strategy was relevant at that time, although recent research suggests that it likely would have had only a modest impact on HIV transmission. While population issues were not mentioned in the bank strategies, a Bank report in 1989 highlighted the need to develop a national population policy and program, and to put together a comprehensive and cost effective budget and financing plan. The Bank strategy in FY97 for private sector development correctly focused on the provision of efficient and cost effective infrastructure, and continuing the process of tariff reduction. It also recognized that promoting indigenous participation was a key Government objective.
2.7 The mix of instruments of support was also appropriate. Adjustment lending would target policy reforms and investment lending would support small and medium enterprises, infrastructure, communal farming, and health. The focus of AAA was good, as was the shift in emphasis from broad-based ESW in the FY94 strategy to workshops, seminars, and shorter, more focused pieces of work in the FY97 strategy.
2.8 The relevance of the strategy throughout the 1990s was modest with respect to the Bank’s mandate to reduce poverty and the country’s objective to reduce inequality, mainly because there was no strategy for land reform, despite glaring inequalities (para 1.6). The FY92 Bank strategy did not mention land reform. The FY94 Bank strategy gave conflicting messages: it noted the passage of the 1992 Land Acquisition Act and expressed considerable concern that the new land acquisition policy, if implemented indiscriminately, will adversely affect agricultural development in the country but that the Bank is supportive of the Government’s land reform program. The FY97 Bank strategy acknowledged the skewed ownership of land in favor of the white minority but gave no signal that the Bank was ready to work with the Government on meaningful land reform.
2.9 Relevance was modest for other reasons. The FY92 and FY94 Bank strategies placed little emphasis on infrastructure in communal lands where rural poverty was concentrated. Further, no plan was put in place to monitor the impact of economic policies on poverty and income distribution, and the FY94 country strategy did not propose a strategy to strengthen safety nets although it noted that the SDF had not been effective in protecting the poor.
2.10 Although the ESAP was initiated by the Minister of Finance and supported by technocrats in the economic ministries and Reserve Bank, the Bank underestimated concerns of the top political leadership about the impact of parastatal and civil service reforms, privatization, and changes to investment policies on the unequal distribution of income and assets and on the racial divide inherited at independence. The FY94 Bank strategy characterized differences between the Bank and the Government’s views of

9
reforms as “differences of emphasis,” when in fact they reflected fundamentally different approaches to the issues. The Bank paid too little attention to the likely impact of the proposed reforms, policies, and programs on the aspects that were uppermost in the minds of the country’s leadership. As it turned out, weak ownership at the highest level of government for the Bank’s strategy eventually undermined outcomes.
2.11 The 1997 Bank strategy was overly optimistic which stated that the Bank’s relationship with the Government was somewhat strained. But the Bank has had an important influence on macro and sector policy development. While the Bank reached agreement with technocrats in the ministries, the political party remained unconvinced of the need for macro and sectoral reforms. As a result, the macro situation remained unstable throughout the 1990s and at the time of the Bank strategy in 1997, the estimated budget deficit was 10.8 percent of GDP for 1996–97. In addition, the Bank strategy optimistically proposed nine investment projects over three years, FY98–00, when only six had been approved over the previous seven years in FY91–97.
Implementation of Strategies: Lending 2.12 Between FY52 and FY02, the Bank has lent US$1,564 million. While only US$3.9 million were committed from FY52 to FY80, after independence in April 1980, lending commitments increased from US$672 million in FY81–90, to US$888 million in FY91–00. Zimbabwe became IDA eligible in August 1991; lending on IDA terms increased from 5 percent in 1952–89 to 62 percent in 1990–2000. There has been no new lending since September 1999 and disbursements to Zimbabwe were suspended on May 15, 2000 due to overdue service payments.
2.13 During FY81–90, the Bank appropriately refrained from pushing adjustment lending, but investment lending was not oriented towards reducing inequality and was not effective in reducing fiscal deficits. The Government was fiercely independent and deeply suspicious about accepting Bank policy advice. Since it was investing in education and health and social indicators were improving, Bank investment loans were directed to multisector, power, transport, and urban development, areas where the Government was willing to borrow from the Bank. But these loans, comprising 85 percent of lending in this period, benefited the population living in exceptionally well-served cities, large scale commercial farms, and the industrial sector where ownership was concentrated among a few foreign and domestic corporations and banks. Two investment loans in the power sector did not improve the financial position of the power parastatal, and two agricultural projects exacerbated the fiscal situation.8 The large investment projects on IBRD terms in the 1980s exacerbated the net transfer problem from the Bank to Zimbabwe in the 1990s (para 2.41). The Bank’s lending strategy in the 1980s should have been to curtail investment lending until the resolution of major policy differences with the Government over the management of the economy. 8 The Small Farm Credit Project (FY83) led to lending to unsuitable borrowers by the Agricultural Finance Corporation (AFC) and to rising arrears. The AFC avoided the impact on its finances by activating government guarantee on losses, guarantees which the Bank reinforced through a covenant in direct contradiction of its stance to phase them out. Another credit in FY89 failed to make AFC sustainable; its portfolio quality deteriorated and arrears mounted, requiring government financing.

10
2.14 Planned lending volumes did not materialize in FY93–00 (table 2.1). In FY93-97, four of the nine planned investment projects were approved. In FY98–00 also, four of nine planned investment projects were approved before lending was suspended in May 2000. One significant positive aspect of lending in FY91–93 was the Bank’s rapid response to the 1992 drought through a drought management project in FY92. Despite implementation problems, the main objective of providing financing for essential imports was achieved and there was not a single death attributable to the drought in Zimbabwe. Rapid assistance for drought relief had an important demonstration effect on other donors who provided additional food aid.
Table 2.1: Planned and Actual Lending, FY91-01 (US$ million) FY91-93 FY93-97 FY98-00 FY01-02
Planned Actual Planned Actual Planned Actual Planned Actual CAS91 532 554 CAS93 (range) 250-750 362 CAS97 (base) 270 137 0 0 Source: Various country strategies.
2.15 While sectoral allocations did not match some of the priorities established in the country strategies (table 2.2), after the FY97 Bank strategy, actual lending volumes declined appropriately in response to the deteriorating macroeconomic environment.
Table 2.2: World Bank Commitments by CAS Period FY91-93 FY94-97 FY98-00 FY91-00 %
Agriculture and Forestry 150 … 14 164 18.5 Economic Policy 300 … … 300 34.0 Electric Power & Energy, Oil & Gas … 90 … 90 10.0 Environment … … 63 63 7.0 Finance … … … … … Health Nutrition & Pop; Education 90 … … 90 10.0 Multisector … … … … … Private Sector Development … 70 … 70 7.9 Social Protection … … 60 60 6.8 Transportation 39 … … 39 4.4 Urban/Water Supply & Sanitation … 12 … … 1.4 Total 579 172 137 888 100 Memo items: Adjustment
300 … … 300 34.0
Commitments per year 193 43 45 89 Source: World Bank database. 2.16 But the Bank should have been even tougher, insisting on credible implementation of reform commitments, given the clear signs that the 1997 strategy for stabilizing the economy and promoting sectoral reform was not working. Clearly deteriorating sectoral and governance conditions (see para 1.15 and footnote 7) should have been a warning to the Bank that the macroeconomic conditions were likely to be unsustainable and the second tranche of SAC II should not have been released in December 1997. The Bank should also have refrained from approving the environment
11
and the agricultural sector management projects in FY98, negotiating a SAC III in August 1999, and appraising new projects.9
2.17 Lending program by CAS objectives: The following paragraphs assess lending by three country strategy objectives. First, macroeconomic stability and growth; second, private sector development; and third, poverty alleviation and reduction of inequities. The evaluation of policy based lending is followed by an evaluation of investment lending.
2.18 The Bank’s two SACs in the 1990s (34 percent of lending in 1991–2000) were appropriately focused on stimulating private sector development and growth. They supported the gradual dismantling of a restrictive system of foreign exchange allocation and exchange rate determination which undermined competitiveness and suppressed imports and private investment. At the same time, they supported the elimination of many non-tariff barriers and a reduction/simplification of trade tariff rates, as well as the deregulation of domestic price controls and a reduction of unsustainable levels of public sector expenditures and parastatal losses. The SAC I (FY92) also focused on reducing the civil service wage bill. The SAC II following a year-and-a-half later (FY93) addressed the elimination of the requirement that farmers sell their maize to the Grain Marketing Board, removal of all geographic restrictions on the transport of maize within Zimbabwe, and a change in the marketing arrangements for beef, dairy products, and cotton which were important for stimulating agricultural growth.
2.19 There were two significant positive aspects of policy based lending for Bank strategy objectives. First, for poverty alleviation, the Bank persuaded the Government to establish the SDF in conjunction with the SAC I to mitigate the impact on the poor and vulnerable of price liberalization (e.g., maize price increases), higher school tuition fees, intensified collection of charges for health care services, and reductions in civil service employment. Second, the import liberalization program was not only phased but the export retention scheme (ERS) under SAC II was designed to provide a strong transitional incentive for export expansion.10 This was an explicit recognition that export expansion was essential for success in terms of external balance, employment expansion, growth, and poverty reduction, and was necessary to minimize the initial negative consequence of a conventional simple liberalization.
2.20 However, for the implementation of country strategy objectives, the SACs were weak in important respects. A critical weakness was that the fiscal aspects of the macroeconomic program had a low probability of being implemented. The fiscal aspects comprised three elements: a reduction in fiscal deficits, a reduction in tax rates, and
9 The Bank appraised a local government project in October 1999, and a roads project in February 2000. It also appraised an Enhanced Social Protection Project Program in 2000 because it felt that the government was making serious attempts to repay the Bank, there was a good counterpart team for social protection side and poverty was increasing. A component of this project was used by the Government in targeting its school-fee waiver program (box 2.1). The SAC III was not submitted to the Board due to a severe deterioration in macroeconomic fundamentals. 10 Under the ERS, exporters were to be allowed to retain an increasing proportion of their foreign exchange earnings and trade their ERS entitlements in the open market.

12
liberalization of interest rates (para 1.11). In the absence of GDP growth, these elements involved a reduction in non-interest expenditures of 15 percent over 1992–95 (from 37 percent of GDP in 1991 to 22 percent in 1995).11 Such a reduction in non-interest spending was not feasible without a broad based social and political consensus for reforms, especially in a country whose strategy in the 1980s was based on increasing social expenditures; this consensus was not generated. Further, SAC I tranche condition required a reduction in civil service positions when civil service employment was not large by African standards; the major issue was high civil service wages and public wage indexation. Parastatal reform conditionality was not focused on requiring commercialization and privatization but on requiring studies, performance contracts and action plans for enhancing parastatal efficiency. The SAC II report of the President in June 1993 also did not mention the risk to stabilization and to private sector confidence posed by the 1992 Land Acquisition Act that had increased the risk of expropriation.
2.21 For economic efficiency, poverty alleviation, and equity, the SACs could have included easing the regulations on land subdivision as a condition on tranche release.12 An upstream analysis could also have been undertaken of the scope of coverage of the SDF and its resource requirements. There was no explicit provision in SAC II or in the Bank’s strategy for adequate funding and monitoring of the implementation of the SDF.
2.22 The SACs and the ESAP did not achieve their major objectives. Macroeconomic stabilization was not achieved, parastatal losses were not reduced, and growth was not sustained (section 3). The SDF remained underfunded, narrow in scope, overly bureaucratic in its implementation, and allegedly highly politicized in its resource allocation. The expectation in SAC II that real per capita recurrent expenditures by the Government on health and education in the 1993–94 budget would be restored to the levels that prevailed in 1991–92 was not met. During the SAC II period, real expenditures on health and education declined (even though the non-interest budget share of these two sectors increased). By 1996–97 they were still 10 percent and 3 percent lower in real terms, respectively, than those in 1990–91. The reduction was mainly brought about by a decline in real staff wages and non-wage expenditures; the overall number of teachers and health workers changed little.13
2.23 The Bank was unable to launch an effective program in agriculture where progress was critical for poverty alleviation. If the Emergency Drought Recovery Loan (FY92) is excluded, then agriculture, the source of livelihood for most of the poor, comprised only two projects and only 1.6 percent of commitments in FY91–00. An Agricultural Services Project was appraised in 1992 but the Ministry of Finance (MOF) objected to the magnitude of the proposed investments in civil works and vehicles in the
11 IMF. 1998. 12 An internal Bank memorandum on agriculture in 1991 recommended both agricultural marketing reforms and a relaxation of subdivision rules. It found that the persistence of land concentration owes a good deal to the limitations which have been placed upon its marketability through restrictions on subdivision. The same applies to underutilization. The Government was unwilling to permit subdivision on the ground that the land would sell more easily and for higher per hectare prices in smaller units; thus, parcels of land would be fragmented just for speculative purposes. 13 Internal Bank report on the completion of the Second Structural Adjustment Credit.

13
project and were of the view that the Ministry of Agriculture (MOA) was being pushed to accept it by the Bank on the strength of the massive investments proposed under the project. This project did not materialize. A Land Use Management project foreseen for FY95 also failed to materialize. In 1996–97, the Government did an analysis of the core functions of the MOA. It also analyzed staff and stakeholder perceptions about agricultural services. The Bank redesigned the 1992 Agricultural Services Project as an Agricultural Services and Management Project (FY98) for US$9 million to build capacity in the MOA for policy formulation and for the efficient delivery and financing of agricultural services. This project had an unsatisfactory outcome: the policy framework for agricultural services was not strengthened, services were not delivered more cost effectively, and private-sector service provision was not improved.
2.24 The second agricultural project, a Land Reform Support Project (FY00) for US$5 million was approved following a donor conference in September 1998. The project was prepared in record time in support of pilots to test alternative approaches to land reform.14 The Bank was the only donor to prepare such a project. It was even ratified by the Parliament on April 2000, but failed to become effective because in May 2000 Zimbabwe fell into arrears. Until March 2002, when Bank management approved an exception to the prohibition on disbursement against land, the Bank could not finance land acquisition.15 By this time, however, forcible land acquisition had become the objective of the top political leadership.
2.25 Social protection projects were not in place during FY91–96 when the SACs were being implemented. Progress on a Community Action Project (FY98) that sought to improve the coverage and quality of social services by investing in small projects in these sectors, identified as priorities by the poorer communities, was stopped when disbursements were suspended in May 16, 2000. But the Bank helped redesign the education component of social protection which now relies on geographic and community-based targeting to identify the most needy students. The Government has continued to finance it despite budget constraints.
2.26 In the health sector, the Bank launched two important projects. Because the Government was deeply suspicious of the Bank addressing policy issues in the health sector, projects were almost wholly focused on civil works, procurement of drugs and contraceptives. The Second Health Project (FY91) (following a First Health Project in FY87), financed health facilities in the 16 poorest districts. The design and location of the facilities were best practice but health status improvements did not materialize because of AIDS and macroeconomic problems which led to declines in the health budget and real wages for health workers. The Sexually Transmitted Infections (STI) project (FY93) was the first stand-alone STI project in Africa. The expectation was that improved STI treatment would contribute to reduced transmission of HIV. The project 14 The project was designed to increase the emphasis on settlement approaches with direct community participation and continued consultation with stakeholders on the broader land-reform agenda. 15 The Legal Department interpreted the articles to mean that the Bank could not finance land acquisition, a position that was reaffirmed in a 1996 Operational Policy Committee Meeting. After March 2002, certain community-based land reform projects that address lack of access to land by the poor, will allow disbursements for land purchase on the market by local communities for their members.
14
successfully financed essential drugs and medical supplies. The prevalence of STI declined during the life of the project, but the prevalence of HIV infection continued to increase. The project design was based on the assumption that behavioral change would receive adequate government attention and funding, which turned out not to be the case; the Government was unwilling to openly discuss AIDs. Drug availability and medical supplies fell sharply after the end of the project due to the severe economic crisis.
2.27 The Third Power Project in FY94 (following two in the 1980s) partially improved the performance and reliability of a large power plant but the objective of improving the financial performance of the Zimbabwe Electric Supply Authority (ZESA) was not achieved. A national power tariff was introduced in 1998, but on political grounds the tariffs of the largest customers were not fully adjusted to cover the utility’s financial costs. The Government did not allow an immediate pass-through to consumer prices of the devaluations of 1997 and 1998. During preparations of the SAC III in 1999, ZESA implemented an automatic tariff adjustment mechanism for its commercial customers and in early 2000, applied the automatic tariff adjustment mechanism to all its customers. But adverse movements in key macro-variables in 2000–2002 have exacerbated the financial situation. Deferral of critical maintenance and overhauls have led to supply disruptions and deterioration of existing service which the projects had sought to address.
2.28 While three investment projects in FY96–98 focused on equity, the Third Power Project (FY94) and the Second Power Project (FY88) made no attempts at rural electrification where the heart of inequality was most obvious. The projects did not have a requirement in terms of a certain percentage of new customers connected that were poor.16 All projects encountered implementation problems, largely because of the deteriorating macroeconomic environment.
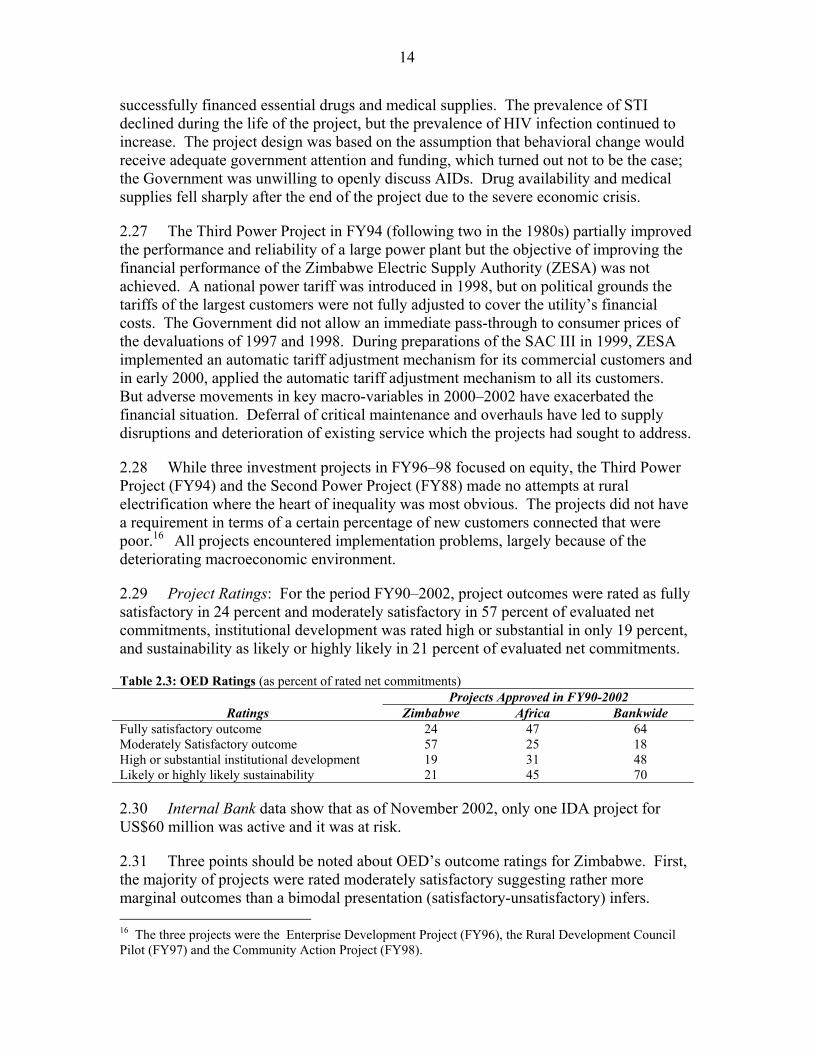
2.29 Project Ratings: For the period FY90–2002, project outcomes were rated as fully satisfactory in 24 percent and moderately satisfactory in 57 percent of evaluated net commitments, institutional development was rated high or substantial in only 19 percent, and sustainability as likely or highly likely in 21 percent of evaluated net commitments.
Table 2.3: OED Ratings (as percent of rated net commitments) Projects Approved in FY90-2002
Ratings Zimbabwe Africa Bankwide Fully satisfactory outcome 24 47 64 Moderately Satisfactory outcome 57 25 18 High or substantial institutional development 19 31 48 Likely or highly likely sustainability 21 45 70
2.30 Internal Bank data show that as of November 2002, only one IDA project for US$60 million was active and it was at risk.
2.31 Three points should be noted about OED’s outcome ratings for Zimbabwe. First, the majority of projects were rated moderately satisfactory suggesting rather more marginal outcomes than a bimodal presentation (satisfactory-unsatisfactory) infers. 16 The three projects were the Enterprise Development Project (FY96), the Rural Development Council Pilot (FY97) and the Community Action Project (FY98).

15
Second, some projects had relatively narrow objectives. Thus, the main objective of the Emergency Drought Recovery Loan (FY92) for US$150 million was to provide financing for essential imports. Third, OED’s moderately satisfactory rating in SAC I reflected the progress that was made on trade liberalization and domestic deregulation. But the failure to reduce the wage bill and to reform the parastatals, together with rising interest payments on the Government’s domestic debt meant that fiscal deficits were not reduced. Poor outcomes in this area had a negative impact on both private sector growth and poverty reduction. For private sector growth, financing of fiscal deficits continued to absorb substantial private savings and kept real interests rate high. Persistent fiscal deficits contributed to high inflation, with deleterious impacts on the poor. Equally importantly, government borrowing to finance high deficits in the context of financial sector liberalization led to a rapidly increasing debt burden that squeezed public spending for social services. These weaknesses in design and implementation are reflected in the rating of the country strategy (para 3.14).17
Implementation of Strategy: Analytical and Advisory Activities (AAA)
2.32 While substantial AAA was completed, with some positive impact, there were major gaps in the Bank’s work. AAA in 1987 and 1988 fostered an awareness of structural adjustment and helped the Government formulate its reform program. In 1989-90, the Bank persuaded the Government to include a strategy to protect the vulnerable and poor from the negative impact of adjustment in the Government’s 1991 “Framework for Economic Reform” that was the basis for the ESAP. A Bank internal memorandum on agriculture in 1991 was used by the Government in its 1993 agricultural price policy. It also formed a component in SAC II. A population sector report in 1989 was followed by considerable informal work on this issue in 1992 and 1995. The 1992 education sector report was a best practice report. In 1994 and 1995, the Bank supported the Government’s Land Tenure Commission and the implementation of agricultural marketing reforms.
2.33 A major shortcoming of the Bank’s AAA was that it did not provide effective leadership on land reform (annex B). The five major reports in the 1980s made no recommendations in this area. The AAA in 1991 and 1995 recommended an increase in extension service delivery to black farmers, a relaxation of sub-division rules and the implementation of a land tax. Two projects attempted to address the delivery of agricultural extension services without success (para 2.23); other issues were not addressed in Bank lending. In 1994, based on a paper prepared by the Bank’s Research Department, the Bank organized a seminar in the MOA which included government officials and others. At that time a community driven land reform program was advocated. However, the Government was not receptive to Bank advice, and there was no follow up. Even within the Bank there was no consensus on how to approach land reform; while some advocated market-based land reform (land taxes, subdivision), others were of the view that redistribution of land using market based approaches alone will be
17 OED’s review of the completion report of SAC II in December 1998 rated the loan marginally satisfactory. It noted that the outcome of the operation is borderline satisfactory/unsatisfactory. A project assessment in November 2002 has confirmed the unsatisfactory rating.

16
infeasible and community driven land reform approaches whereby the beneficiaries would be helped to buy land with grants, or partial grants should be adopted. 18
2.34 There were several reasons as to why the Bank neglected to address land reforms in the early 1990s.19 First, the perception was that the breakup of large farms could disrupt economic activity and reduce export earnings.20 Second, until 1990, the Government was bound by the Lancaster Agreement which established a willing-buyer-willing-seller condition, and donors were sympathetic to white farmers. Third, the Bank wanted to address policy issues where it could have an impact as opposed to land reform, which was unlikely to be resolved. Raising a politically charged issue could jeopardize lending. In addition, the Bank wanted commitment to fair price and compensation, an issue on which the Government stance was constantly shifting. Furthermore, there were no successful examples for the Bank to use for Zimbabwe, and despite the strong rhetoric by the Government on forcible land acquisition, there was little happening on the ground until 2000 when the invasions started. 21 Finally, the inability to lend until 2002 for land acquisition reduced the effectiveness of dialogue, the impact of analytical work, and the scope for Bank involvement.
2.35 Nevertheless, the Bank could have done a number of things. It could have taken the lead in testing alternative approaches to land reform in 1993–95 when the situation was not so politically charged; Bank involvement might possibly have led donors to finance land acquisition. It could have disseminated findings from elsewhere that only in exceptional cases large farms are more efficient than small farms, and done studies on the relative efficiency at different scales in Zimbabwean agriculture.22 It could have pushed for easier subdivision to increase the marketability of land.
2.36 The Bank engaged the Government intensively on land reforms for the first time since Independence in the run-up to the Donor conference in September 1998. The
18 Evidence shows that in the few developing countries that are able to meet the conditions of administering a tax on land effectively and equitably, land taxes are relatively unimportant. Imperfections in the land sales market prevent bringing ownership holdings in line with the optimal distribution of operational holdings. These imperfections are brought about by land-credit linkages and policy distortions. Land is the preferred store of wealth and its immobility makes it a preferred form of collateral. The number of buyers is constrained by the level of household savings since mortgaged land cannot be used as collateral. See Binswanger, Deininger, and Feder. 1993. 19 This paragraph is based on interviews with Bank staff. 20 Thus the political party sought to replace white-owned large scale commercial farms with black-owned large farms rather than reduce the size of farms in the large scale commercial sector. 21 However, a land reform pilot was started, without prior experience, by the Bank in Brazil in 1997. A project component in Colombia in 1998 piloted participatory planning and implementation of land titling. And a Land Administration and Management Project for the Philippines from 2000 included a component that implements a land administration prototype in six municipalities and focuses on accelerating the issuance of land titles. Land reform was always politically charged because the war of independence was fought over land and population pressure in communal areas was increasing. There was the threat of expropriation in 1992 when the Government broadened its power for compulsory land acquisition and in 1995, when it announced its decision to acquire 5 million hectares of land. 22 Binswanger, et al. op. cit. Also according to an internal Bank memorandum, it states that studies of this nature in the freehold sector are long overdue. Relaxation of subdivision would probably have resulted in smaller holdings, as had been the case in Kenya.

17
conference was, however, followed by an impasse because commitments were reached at the technical but not political level. Also, there were divergent views on how to put the agreements into practice because actions were not specified. Distrust between the donors and the Zimbabwean leadership led to disagreements on whether donor conditions for financing land acquisition had been met─such as transparency in the selection of beneficiaries and adherence to the rule of law.
2.37 On expenditure reform, the public expenditure review (PER) came at the end of 1995, one-and–a-half years after the approval of SAC II. The PER identified government expenditures that could be cut and measures to restructure expenditures, but it came too late to inform the design of the SACs. An earlier PER would have likely highlighted sequencing issues in the fiscal program and avoided actions to reduce taxes before rationalizing public expenditures.
2.38 On poverty reduction, through much of the 1990s, AAA understated its importance and sent the wrong message for the assistance strategy. A poverty assessment has never been completed and this has left a large gap in the Bank’s policy dialogue. The 1991 agricultural sector memorandum, apart from mentioning the need for a more equitable distribution of assets and food insecurity, made no reference to widespread and deep poverty in rural areas. This omission was noteworthy considering that it followed on the World Development Report in 1990 which was focused on poverty. The 1995 CEM was labeled as a poverty assessment but it was a slim poverty profile with no proposed action plan or strategy for reducing poverty. It estimated the incidence of poverty in 1990–91 at 25 percent but could not estimate the incidence in 1995–96 mainly because the Central Statistical Office (CSO) did not provide access to the 1995–96 survey. Based on the CEM, the 1997 Bank strategy, stated that poverty is not as prevalent as in many other Sub-Saharan countries, but is likely to have increased in 1990–95.
2.39 Studies and dialogue to assess the impact of the ESAP started in 1996. A poverty situation analysis was published in 1996 and work in 1997 on geographical targeting formed the basis of the Community Action Project in FY98. In 1998–99, studies on social protection were undertaken. The Bank also partly financed an analysis of CSO’s 1995–96 data.23 The impact of analytical work on one activity in social protection has been exceptional despite the adverse environment (box 2.1). While several factors facilitated the strong collaboration between the Government of Zimbabwe and the Bank in this activity, a key factor was that there was political support for it; it improved the Government’s reputation for service delivery which was important for its domestic political platform.
2.40 In sum, while the Bank’s AAA had some positive impacts, it did not provide analytical underpinnings to the Bank’s lending and policy dialogue in several key areas. On land reform, the analysis of land policy (prepared mainly in the 1980s) was not
23 Other AAA in the social sectors included a draft poverty assessment prepared in 1999, a note on the education sector in 2000, workshops on education and poverty, a study tour of education officials, and the financing of participation of a Bank staff in the President’s Health Commission.

18
strong, the Bank’s stance on land reform until 1998 was non-committal and our AAA work did not promote alternative, viable approaches to land reform issues. After mid-1998, the Bank took the lead in dialogue, technical assistance and in developing an operation in support of financing land reform, but in 2002, land reform remains unresolved with severe negative economic and social implications. Attention to poverty and social protection was weak in 1991–96, and a full poverty assessment has never been completed. The PER was not undertaken early enough to inform the design of SACs I and II.
Box 2.1 Good Practice: Technical Collaboration and Trust in the Midst of Decline
Despite the suspension of lending, the technical relationship remains strong in social protection. The Bank assisted in a major redesign of the Ministry of Public Service, Labor and Social Welfare (MPSLSW) targeted school-fee waiver program. The redesigned program, the Basic Education Assistance Module (BEAM), was to rely on geographic and community-based targeting to identify the most needy students. It was to also operate with a national target and community level hard budget constraints to introduce greater predictability in funding to schools and eliminating arrears. The program redesign was based on analytical work in 1997 and undertaken as part of another Bank project that could not be financed because of Zimbabwe’s IDA-default status. Nonetheless, the MPSLSW decided to adopt it using scarce domestic budget resources.
The BEAM began implementation in January 2001 and has financed approximately 600,000 children’s school fees/levies at primary and secondary levels across Zimbabwe. Given the ability of the BEAM to use community structures to identify vulnerable children, the National AIDS Council of Zimbabwe has decided to provide significant co-financing to the BEAM on an ongoing basis.
The MPSLSW has worked with the Bank in carrying out an initial evaluation of the BEAM (December 2001) and with the Bank’s technical assistance is about to commission a more detailed survey-based independent evaluation of BEAM. The Bank has drawn on BEAM implementers to assist with a similar program for a vulnerable children project in Swaziland.
What factors mattered? (i) The Minister of MPSLSW is a “champion” for improving the effectiveness of social assistance, and steered the reforms through Cabinet and Parliament to secure significant budget resources for its implementation. (ii) There was continuity in the core technical team membership both on the government and Bank sides which allowed mutual trust to develop. (iii) The BEAM development was participatory; international experience was discussed in government-NGO-donor technical groups and adapted to the local situation. (iv) There was a confluence of interests between the Government and the Bank. The MPSLSW improved its reputation in service delivery, which supported the domestic political platform; the Bank “achieved” better targeting, more effectiveness, and equity in the Government’s school-fee waiver program.
Source: Interviews with Bank Staff.
Resource Mobilization and Aid Coordination
2.41 The Bank mobilized considerable donor resources in support of Zimbabwe. In the December 1993 Consultative Group (CG) meeting, US$782 million were mobilized, two-thirds in commitments and one-third in pledges. This was an enormous achievement considering the Government’s fiercely independent and unwelcoming stance towards donors (in contrast to other countries in Africa). While the Bank’s lending to Zimbabwe in 1990–2001 was about US$900 million, net transfers were only US$53 million due to the high share of IBRD lending in total lending in 1952–89 and the slow growth in Bank lending in the 1990s. After March 1995 there were no CG meetings because of deteriorating dialogue on macroeconomic and structural policies.

19
2.42 The evaluation mission in 2001 found that while relations between the Bank and other donors had been cordial, in the first half of the 1990s, the Bank was perceived as not providing leadership or coordination on land, and on other economic and social issues. Bilateral donor assistance was directed to all major economic and social sectors. Within these sectors, the largest areas of assistance were transport and communications, followed by education and water supply and sanitation. The Bank was not seen as active in coordinating donors in these sectors. On land issues, the Bank was unwilling to reach out to donors, because of the various reasons mentioned earlier (para 2.34) and because the Government was suspicious of donors, and viewed coordination as collusion against the Government. In the second half of the 1990s, the Bank became more proactive and is well regarded for its open dialogue with donors and stakeholders. Regular informal meetings were held to exchange information and discuss development issues. The Bank also organized a poverty forum and provided substantive technical input for the donor conference in 1998.


21
3. Development Impact of Country Assistance
3.1 This section assesses the impact of the country assistance strategy program in achieving the objectives set out in country assistance strategy documents. These were: (a) supporting macroeconomic stabilization and promoting growth; (b) facilitating the expansion of private sector activity; and (c) addressing equity and poverty.
Growth and Macroeconomic Stabilization 3.2 Performance in the 1980s was mixed. In the first two years after Independence (1980 and 1981), real GDP grew rapidly (10.6 percent and 12.5 percent respectively), largely as a consequence of favorable weather, the end of the war, and the removal of sanctions. During the mid-1980s, however, growth slowed dramatically, largely because of droughts, emigration of skilled manpower, a lack of investment in productive sectors, and disincentives that hindered private sector activity. The central government fiscal deficit was in excess of 10 percent of GDP for much of the 1980s. Bank assistance was not effective in influencing the Government to reduce fiscal deficits.
3.3 Growth averaged 2.9 percent per annum in 1991–97, declining to 1.1 percent in 1998–99 and to –4.9 percent in 2000. The economic crisis in 2000 was fueled by mounting fiscal imbalances, farm invasions, and uncertainties in economic policy. One important positive aspect of the economic performance in the 1990s was that agriculture grew at an average rate of 3.9 percent per annum because of a substantial reduction in Government intervention in agricultural production and marketing that the Bank’s SAC II supported but most of this growth was in the large-scale commercial farm sector.
3.4 In the 1990s also overall fiscal deficits (central government plus major parastatals) were not reduced (see figure 3.1). Central government deficits (excluding grants) averaged 8.8 percent in 1991–97 and 7.6 percent in 1998–99. In 2000, the central government deficit was 22.9 percent, driven by a surge in domestic interest payments
Figure 3.1: Zimbabwe Central Government Operations, 1990-2001
0
10
20
30
40
50
60
1990/91 1991/92 1992/93 1993/94 1994/95 1995/96 1996/97 1997/98 1999 2000 2001
In P
erce
nt o
f GD
P
0
10
20
30
40
50
60
Total RevenueWages & Salaries Interest Payments Other

22
from 8 percent of GDP in 1999 to 15 percent of GDP in 2000. The wage bill and defense outlays also increased while revenues declined. The aggregate losses of nine major public enterprises were 3.5 percent of GDP in 2000 in addition to the central government deficit. The parastatals with large losses were also the ones running losses at the end of 1980.
3.5 Civil service reform (supported by the Bank in SAC I of FY92) was not guided by clearly defined priorities and brought few efficiency gains. During 1990/91–2001, the wage bill averaged 12 percent of GDP, double the Sub-Saharan Africa average. Average civil service pay increased in real terms by 20 percent between 1990 and 1998, at a time when real wages in the private sector contracted sharply. At the end of 1990, a definition of the core functions of ministries, subcontracting of government services, and decentralizing some services in education, health care, and agriculture to local governments remained in the planning stage.
Private Sector Development
3.6 The SACs stimulated important policy reforms for private sector development. By end-March 1993, the share of domestic production free from any price intervention rose to 85 percent. Administrative interventions in wage determination were reduced. On July 3, 1994 the exchange rates were unified, and allowed to float.24 By 1995, the private sector had full authority to maintain and use foreign currency accounts. Restrictions on licensing and repatriation of profits by foreign investors were eased. By 1996, the quantitative restrictions on imports that were in effect during the 1980s had been largely dismantled and replaced by tariffs. The labor market was deregulated, with free collective bargaining replacing centralized wage setting, and firing restrictions were removed. The financial sector was decontrolled; interest rates were market determined, and many new banks were established. But the positive effects of economic liberalization and deregulation of investment on private sector development in the SACs was counteracted by inappropriate sequencing of fiscal reforms in the macroeconomic program. Financial liberalization and tax reductions before reductions in expenditures led to an increase in government deficits and high real interest rates.
3.7 There was some initial progress in reform of a few parastatals with Bank support in SAC II and analytical and advisory work. The Grain Marketing Board’s monopoly over the procurement and domestic distribution of grain was removed in 1996 although it was still required to manage the Government’s Grain Reserve. As a result, thousands of new hammer milling enterprises were established that produced coarse maize meal at much lower prices than the government supplied millers using roller mills. In 1997 three parastatals were sold off—the Commercial Bank of Zimbabwe, the State Cotton Company, and the Dairy Board. The reform of the Cotton Board (first downsized and then privatized) has been the only successful reform of the cotton board in Africa. In
24 With a sharp depreciation of the Zimbabwean currency in end-1997 and 1998, the Government pegged the exchange rate in January 1999 to the US dollar. In August 2000, the Reserve Bank of Zimbabwe (RBZ) introduced a crawling peg with a band of 5 percent of each side of the central parity, as well as periodic devaluations based on inflation differentials with trading partners.

23
early 2000, the state electricity company moved to a formula-based pricing. Nevertheless, the quasi-fiscal deficit was not significantly reduced.
3.8 Private sector confidence has deteriorated steadily since 1997 because of compulsory land acquisition and reversals of policy reforms taken in the first half of the 1990s (paras 1.15–1.16). The reimposition of price controls on maize in June 1998 was followed by the discovery of serious fraud in a merchant bank in April 1998, military intervention in the Democratic Republic of Congo in August 1998, the raising of import tariffs in September 1998, and new restrictions on the access by the private sector to foreign exchange for imports or debt service payments. Continuing losses incurred by parastatals directed bank credit away from the private sector.25 Financing of fiscal deficits continued to absorb substantial private savings (around 8 percent of GDP per annum) and kept real interest rates high.
Poverty Alleviation
3.9 Extreme poverty rose during the 1990s (table 3.1). It remained more widespread, deeper and more severe in rural than in urban areas, but urban poverty rose dramatically between 1990–91 and 1995–96 and must be considered higher now. Inequality was high with a Gini in 1995–96 of 0.64.
Table 3.1: Zimbabwe: Distribution of Poverty Indexes, 1990–91 and 1995–96a (in percent) Poverty Measure 1990–91 1995–96
All Zimbabwe Prevalence 25.8 34.9 Depth 8.8 11.8 Severity 4.2 5.4 All rural areas Prevalence 35.8 48.0 Depth 12.4 16.6 Severity 5.9 7.7 All urban areas Prevalence 3.4 7.9 Depth 0.8 1.9 Severity 0.3 0.7 Source: Alwang, Mills, and Taruvinga. World Bank. 2002. a The estimate is based on a poverty line created by measuring the cost of a minimum-needs basket of food and is on adult equivalent basis which adjusts for family composition.
3.10 Why did rural poverty increase when average agricultural growth in the decade was 4 percent per annum and population growth rate in the 1990s had declined to 2.6 percent per annum? Because agricultural growth was not broad based. Rather it was skewed in favor of LSCS that typically produced about 75 percent of the value of crop production under relatively capital-intensive conditions and dominated the export market. Growth in the agricultural sector did not generate significant additional employment for rural households managing small-scale labor intensive farms in the communal areas.
25 Claims by public enterprises on banks increased in nominal terms from Z$879 million in 1994 to Z$7,360 million in 2000.

24
3.11 While rural households in the communal areas benefited from an increase in producer prices of maize and cotton, they were severely affected by the drought, and a lack of high quality land, rural infrastructure such as irrigation, and agricultural inputs. 26 The devastating drought of 1992 (as well as the less severe drought of 1995) destroyed rural assets such as livestock and dramatically reduced maize yields.27 Important public sector extension services, particularly credit facilities, fertilizer, and other agricultural inputs were reduced in the 1990s. Bank lending was not successful in addressing the main constraints to poverty reduction in rural areas. It was also unable to protect critical public expenditures in the agricultural sector.28
3.12 Increases in urban poverty were due to limited employment opportunities in the formal sector.29 Despite significant structural reforms (including labor market deregulation), high real interest rates, downsizing in the public sector, and political uncertainty all combined to slow investment and job creation. As a consequence, official data indicate that formal sector employment has been essentially flat since 1991 with formal unemployment estimated at 25 percent in 1998. A decline in remittances from urban areas (a major source of income for the poor in rural areas) also increased rural poverty. The plight of the poor was aggravated by problems in administering social safety nets; a large number of eligible households were unable to get the benefits intended for them as there was confusion about the definition of the targeted groups and the level of benefits due to them.
3.13 Gains in health in the 1980s were largely eroded in the 1990s by the economic crisis, the AIDS epidemic, and recourse to user fees with ineffective exemption systems. The large decline of real wages of health workers increased staff shortages in clinics, and a decline in non-wage spending in health reduced drug availability. These factors, together with the HIV epidemic which now affects almost a third of the adult population have reduced life expectancy from 56 years in 1990 to 40 years in 2000. Infant mortality increased from 52 to 69 per thousand live births between 1990 and 2000.
Overall Assessment
3.14 Outcomes: Outcome ratings measure the program’s progress toward all major relevant objectives of the strategy (macroeconomic stabilization and growth, private sector development, and poverty alleviation). Bank actions, which largely determine Bank performance, are one contributor to the outcome of the Bank’s assistance strategy (paras 4.1 to 4.8). Outcomes are also determined by the Borrower’s performance and other factors (paras 4.9 to 4.14). The Borrower showed little commitment to macroeconomic stability and poverty alleviation. In the 1980s, the Bank engaged in substantial investment lending which however, was largely not oriented to reducing inequality and was not effective in reducing the drain on the budget from the parastatals.
26 According to a 1999 draft on poverty assessment, even controlling for land quality, the poor in communal areas were distinguished by high dependency and small holdings per household member. 27 Alwang, Mills, and Taruvinga. 2002. 28 The allocation of central government budget for the MOA declined from 10 percent in 1991/92 to 3 percent in 1995/96. 29 Alwang, et al. op.cit.

25
During the 1990s, the Bank engaged in policy lending, but with mixed results: progress on liberalization was not matched by improvements in macroeconomic stability. One reason was the unwillingness of the highest political leadership to make critical adjustments. A second important reason was that financial liberalization and tax reduction were sequenced to come before, rather than after, reductions in expenditures. This proved to be fiscally costly and led to a domestic debt trap. With respect to efficiency of the strategy, the cost per US$1,000 of commitment in FY91–01 (US$21.6) was higher than the Bank wide average, but lower than the African region. Cost per US$1,000 of commitments for satisfactory and nonrisky projects in the same period was US$28.1, also higher than Bank wide (US$16.7) but lower than the Africa region (US$37.3). The summary rating for outcome of Bank assistance is unsatisfactory.
3.15 This assessment differs from OED project ratings presented in table 2.3. At the individual project level, objectives were relevant and mostly achieved but the assessment here takes into account the relevance of successive country strategies as presented in Bank documents; its implementation, its responsiveness to changing country conditions, and the extent to which the strategy’s major objectives were met. Taking all these factors into account, the assessment on outcome of Bank assistance at a country level in the 1990s is not as positive as OED’s outcome ratings on individual projects presented in table 2.3. The continuing lack of an overall satisfactory policy framework which could sustain project/sector achievements is reflected in unsatisfactory CAE outcome ratings and is consistent with the poor project ratings on the sustainability dimension.
3.16 Institutional Development Impact: There were some successes in improving Zimbabwe’s ability to make more efficient, equitable, and sustainable use of its human, financial, and natural resources. The Government developed a power sector reform program. In addition, the procurement capacity of the General Medical Stores and the institutional capacity of Zimbabwe’s National Railways were strengthened.
3.17 However, Zimbabwe’s abilities remained weak in key areas. The capacity for drought preparedness and mitigation management was not enhanced, and capacity for delivering agricultural services was not strengthened. The civil service was characterized by rivalry and distrust (for example four government ministries fighting over turf in the Land Reform Learning and Innovation Loan (LIL)) and a lack of accountability. The client did not show ownership for capacity building programs that may have enhanced public expenditure management and improved its privatization processes. Institutional development in the parastatal sector was disappointing; legal and regulatory frameworks were not established and the budgetary systems remained weak. The Government lacked the will to coordinate donors. In sum, the institutional development impact of Bank assistance was negligible.
3.18 Sustainability: The period since 1998 has been one of macroeconomic destabilization and slippages in structural reforms, reflected in aborted attempts to implement IMF Stand-by arrangements in 1998 and 1999, and an inability to move ahead with a third SAC. This unfavorable situation stems in part from a political response to social discontent over rising poverty, limited employment opportunities for a relatively well-educated workforce, and persistent dualism and high inequality in the distribution of

26
assets. Controversial and unexpected policy decisions (e.g., civil service wage increases, land redistribution) have increased fiscal deficits, fueled inflation, destroyed investor confidence, and disrupted official capital flows. The ensuing crisis has led to policy reversals in areas such as exchange rate management, foreign exchange convertibility restrictions, trade policy barriers, and interest rate caps. Initial restrictions have been eased, but not eliminated. The sustainability of net benefits from structural adjustment has been severely compromised and is rated as unlikely.
Counterfactual 3.19 What could the Bank have done differently? If the Bank had analyzed the extent of country ownership of reforms, based on the degree of consensus among decision makers, the locus of policy initiatives (whether local or external), the existence of up-front actions, and the participation of major stakeholders, it would have realized that ownership was weak, and it would not have relied so heavily on commitments with technocrats in the ministries. If it had been able to ensure in the 1990–96 period that the macroeconomic reforms in the ESAP were properly sequenced, and designed and monitored the implementation of the SDF, it might have been able to maintain the provision of services to the poor which had been the core of the Government’s strategy in the 1980s. If it had monitored the impact of its assistance on income distribution, it might have made a different choice of lending or design of specific projects (e.g., the power sector loan or rural infrastructure). Proper sequencing might also have brought the deficit under control, and reduced nominal and real interest rates. This could have accelerated the recovery of private investment, and alleviated the unemployment problem in the formal sector. A reduction in inflation would also have reduced the decline in real wages. If the Bank had engaged on land reforms through pilot programs, political and social outcomes might also have been different.
3.20 A Bank stance in the 1997–2000 period rooted in implementation of reforms rather than policy intentions would have sent a strong message to the Zimbabwe leadership. An assessment of the macroeconomic situation would have confirmed that while the 1997–98 central government deficit was reduced to 6.5 percent, parastatal losses amounting to more than 7 percent of GDP in that year implied that the overall public sector deficit was about 14 percent of GDP. Therefore, there was no basis for concluding that macroeconomic management was sound and for releasing the second tranche of SAC II in December 1997. With the central government budget deficit in 1998–99 of 11.5 percent, a parastatal deficit of 3.4 percent of GDP, the announcement of compulsory acquisition of almost 1,500 farms and regular breaches of the rule of law by the perpetrators of deadly farm invasions, the Bank should not have negotiated a SAC III, and continued to prepare new operations on the basis of Government promises.

27
4. Contributors’ Performance
World Bank Performance 4.1 In the 1980s, the Bank appropriately drew attention to poor economic management but massive sectoral investments on IBRD terms led to a net transfer problem in the 1990s. In the 1990s, the Bank focused on the right issues, stimulating private sector development and growth, and maintaining macroeconomic stability by reducing unsustainable levels of public sector deficits and parastatal losses (para 2.6). The Bank also appropriately sought to liberalize agricultural marketing and to mitigate the negative social impact of adjustment on the poor and the vulnerable through the SDF. But, when the Government failed to implement key aspects of the reform program, the Bank did not take appropriate steps to put the reform program back on track.
4.2 In one key area, land redistribution, the Bank did not focus on it until mid-1998. Land redistribution was fraught with risks because the Government strategy was based on compulsory acquisition, and its stance on fair price and compensation was constantly shifting. But land redistribution was critical for poverty alleviation, essential for political sustainability, and imperative for increasing economic efficiency. There was and remains considerable expertise within the Bank on land reform issues and there was an emerging consensus around how to deal with them.30 Even without being able to finance land acquisition, the Bank could have been more proactive.
4.3 While both the Bank and the Government favored user charges as a means of financing health services (annex D), the Bank could have anticipated the difficulties in having an administratively workable system that protects the poor and the vulnerable. It also could have paid more attention to the design of the SDF whose social safety net component was to protect the poor from cost recovery and should have monitored poverty and inequality during the crucial adjustment period in 1991–96. Until 1998, the Bank was under the impression that poverty was not high and was debating whether poverty had or had not increased during 1991–96.
4.4 In the early 1990s, the Bank correctly identified the need to liberalize the economy and to reduce fiscal deficits but it underestimated the risks to the adjustment program. The Government was strongly independent, wanting to reform at its own pace, but program success depended on macroeconomic stability being reestablished in tandem with the liberalizing effort. In the event, the Government liberalized but did not reduce the fiscal deficit and was caught in a domestic debt trap that kept real interest rates high and led to large budgeted interest payments that crowded out other essential expenditures. In hindsight, the Bank should have strongly opposed a reduction in the tax rates and
30 Annex B.

28
liberalization of the financial sector in the IMF-supported macro program before parastatal reform and public employment reductions.31
4.5 From the start of the adjustment program in 1991, the Bank did not factor in its strategy the divisions on major reform issues. 32 On the one side were a small circle of technocrats (e.g., officials of the economic ministries) committed to market based reforms and on the other, were the anti-reformers, the President and other members of the party. The important characteristic of the anti-reformers was that they did not believe in the market’s efficacy in redistributing wealth and viewed the Bank with deep suspicion, because of a perception that the Bank’s major shareholders dictated what the Bank could and could not do. Ultimately, reforms were not sustained because power lay, not with individual ministries and technocrats with whom the Bank dialogued but with the anti-reformers whose trust the Bank was unable to gain.33 As a result, Zimbabwe became an exceptionally difficult client for the Bank to work with, agreements reached were not followed through, and a large number of projects failed to materialize.
4.6 The SACs could have been more effectively leveraged. The relaxation of rules for land subdivision could have been included in the SACs, which might have had a positive impact on the land markets, thereby easing some pressure for land reform. Civil service reform in SAC I should have focused on institutional strengthening of ministries rather than on just cutting numbers. The SAC II condition on parastatal reform could have been action oriented. In the event, SACs achieved liberalization and deregulation but fiscal stability was compromised as the fiscal deficits remained high and public enterprise reform was too slow.
4.7 While many AAA were completed in the 1990s, substantive analytical work on some key issues either was not undertaken or was not timely. A PER was completed only in end-1995; an earlier review would have identified expenditure priorities for SAC I and II and highlighted non priority expenditures that could be eliminated when faced with unforeseen demands on the budget. An analysis of trends in poverty was not undertaken until 1998 and no poverty assessment has been completed.
4.8 After 1997, Bank influence and the sense of urgency in Zimbabwe might have been greater had the Bank taken a tougher stance. Actual lending volumes did decline in FY98–00, but the Bank negotiated a SAC III in August 1999.34 The Bank also held up
31 According to some Bank staff, interest rate liberalization was important to force the government to stop domestic borrowing. The assumption was that at highly negative interest rates, the Government would continue to borrow. In the event, the Government continued to borrow at high interest rates. 32 For the President and his party, privatization and land redistribution were means of promoting indigenous ownership of productive assets and reducing the racial divide. For technocrats, privatization was a means of raising resources for the budget, reducing bank financing and promoting private sector development, and land redistribution was a governance, rule of law issue. 33 Internal Bank reports say that sensible agreements had been reached but they were not followed through. Other indicators of lack of trust were the refusal to share with the Bank the results of the 1995/96 household survey until 1998, and keeping confidential a report of the Presidential Commission on health. 34 It was appropriate for the Bank to prepare SAC III, but not go so far as negotiations. Zimbabwe was in a severe internal debt crisis and without privatization and public enterprise reform and massive concessional inflows it would not be able to come out of its fiscal problems.
29
the second tranche of SAC II for two-and-a-half years but disbursed it in December 1997 based on government assurances which were not met and consultations with the IMF. The IMF did not explicitly address the issue of tranche release, nor the likelihood of the government implementing its macroeconomic framework, and its assurances were provided six months before the tranche was actually released.35 In Zimbabwe’s case, continued willingness to lend and prepare additional projects sent the wrong signal to the Government and the Bank’s development partners.
Government Performance
4.9 The problems in the late 1980s were a result of the intensification of controls on the economy and rising fiscal deficits. In the 1991–94 period, the Government implemented economic liberalization but showed little interest in maintaining macroeconomic stabilization. It did not follow through on commitments to rationalize the civil service and to restructure the parastatals. After 1997 it abandoned all efforts at reform, reversed many of the measures undertaken earlier in the decade, and adopted populist measures such as payments from the budget to war veterans.
4.10 The Government has also shown little commitment to poverty alleviation and respect for rule of law and property rights. It failed to act on its own Land Reform Commission’s 1994 report which concluded that there has been no coherent policy to support the small-scale farming sector. It did not take relatively simple steps on land policy which the Commission recommended and on which it was not constrained such as allowing subdivision of land or revising leasing regulations. Easier subdivision would have encouraged LSCS to bring more land onto the land market and allowed the Government to coordinate the acquisition of land with its ability to resettle and support effectively new farmers. Instead it used underutilization of land to support arguments for compulsory acquisition of white farmland for resettlement by war veterans. In July 2000, the Government announced a program of compulsory acquisition of 5 million hectares, and in July 2001, increased the amount to be resettled to 8.3 million hectares which it has since implemented, to the severe detriment of agricultural production.
Partner Performance
4.11 The macroeconomic reforms could have been sequenced differently.36 The financial sector liberalization and the reductions in tax rate should have been phased in gradually, after the implementation of deficit reduction measures. Financial liberalization and tax reductions before civil service and parastatal reforms, required a severe reduction in expenditures which would likely have been politically unsustainable. Over-optimistic growth forecasts also made the fiscal adjustment appear more feasible than was actually the case. Finally, much greater attention should have been paid to fiscal sustainability and the persistent failure to achieve fiscal targets.
35 According to an internal Bank report for the completion of SAC II, the tranche was released based on government assurances that payments to war veterans in August 1997 and increased military expenditures “would be handled in a manner that did not jeopardize achievement of the agreed 1997/98 fiscal targets nor the intention to further reduce the fiscal deficit in subsequent years” and assurances from the IMF. 36 IMF. 1998.

30
4.12 Other donors have been very active in Zimbabwe. Net flows from bilateral donors to Zimbabwe were about US$300 million a year in 1980-89, rising to US$409 million a year in 1990–2000. Net flows from IBRD/IDA in the same periods were only US$30 million and US$43 million per year respectively. Partners have been involved in all major Bank lending in the 1990s; from early projects in railways and the health sector and co-financing of adjustment loans, to support for the development of rural district councils in FY97. Bilateral donors have continued to support Zimbabwe with substantial resources in 1997-2000 although governance has deteriorated significantly; net flows to Zimbabwe in this period were US$1.1 billion.37
4.13 UNDP leadership was instrumental in the organization of the land conference in September 1998 but the unwillingness of donors to make financial commitments in 1999 reinforced the Government’s fears that donors were not serious about land reform. The Government did not have sufficient funds to acquire even the 118 farms that had been offered voluntarily by their owners for the inception phase. Although donor skepticism may have been justified given the Government’s persistent rhetoric on the subject, the persistence of the financial constraint was a factor that led the Government to include the provision that would empower it to seize commercial farmland without compensation in the Referendum on constitutional reforms in February 2000.
Box 4.1: Role of IFC and MIGA in Zimbabwe
Zimbabwe has been a member of IFC since 1980. IFC has an outstanding portfolio of US$48 million covering over 25 companies in a wide range of sectors. IFC’s activities have complemented the Bank’s strategy for private sector development and have sought to enhance export-generating activities, assist in privatization and modernization, strengthen the financial sector, and support small and medium enterprises. Activities have been on hold due to the deteriorating situation. While MIGA has no guarantees in Zimbabwe, it has provided support to Zimbabwe’s investment promotion agency, and convened investment promotion capacity building workshops.
Exogenous Factors 4.14 Zimbabwe was hit by two droughts. The first in 1992 was characterized as the worst of the century, the subsequent one in 1994/95 was more localized. The impact of the droughts was compounded by unfavorable global commodity price trends. Prices of flue-cured tobacco, sugar, and beef fell in real terms between 1991 and 1996.
37 OECD data.

31
5. Lessons and Recommendations
5.1 The Zimbabwe experience provides four lessons.
(i) Given the short-term necessity of macroeconomic stability, especially achieving fiscal sustainability, the Bank should have undertaken a public expenditure review prior to 1995, should have been more forceful in ensuring that credible steps to achieve fiscal sustainability were incorporated in our adjustment lending and should have formed a judgement not only about the macroeconomic/fiscal targets, but also about the likelihood of their implementation.
(ii) The Bank should have crafted its strategy with greater attention to the long-term objective of reducing glaring inequalities and reducing poverty. This should have required the Bank to have undertaken in-depth analytical work on poverty and to have been proactive in addressing land reform well before 1998. The Bank should have analyzed options and consequences of land reform, and should have strongly signaled to the Government earlier in the 1990s that it was willing to support a sensible land reform program with available instruments.
(iii) The Bank should not have relied so much on commitments with technocrats in absence of political dialogue and consensus for reforms.
(iv) In a relationship with a reluctant reformer, with distinct lack of ownership from top political leadership, the Bank should remain consistent on requiring that conditions be fulfilled and not proceed to lend on the basis of promises.
5.2 Given the current political situation, the Bank can do little to move forward the economic and social agenda. It cannot lend even for a narrowly defined social agenda; the Government has been in arrears to the Bank since May 2000. At the present juncture, the Bank should focus AAA on building knowledge base in four critical areas: (i) an assessment of poverty and inequality, and the impact of economic policies on these issues; (ii) an analysis of the political economy factors which have impeded reforms (e.g., parastatal reform) in the past; (iii) learning from pilots on land reform launched in other countries; and (iv) a public expenditure review focused on fiscal sustainability and the required rationalization and reallocation of public expenditures. A resumption of normal Bank lending should be conditional on: credible and upfront measures to achieve macroeconomic stability, fundamental governance reforms, a pro-poor reallocation of expenditures, parastatal reforms, and the formulation and credible initial steps in the implementation of an action plan on land issues.


33
References (in addition to Bank Lending, ESW, OED Project Assessment and IMF Reports on Selected
Economic Developments and Article IV Consultations)
Alwang, Jeffery, Bradford B. Mills, and Nelson Taruvinga. 2002. “Why Has Poverty Increased in
Zimbabwe?” Poverty Dynamics in Africa Series. Report No. 24052. Washington, D.C: The World Bank.
Binswanger, Hans P., Klaus Deininger, and Gershon Feder. 1993. “Power, Distortions, Revolt,
and Reform in Agricultural Land Relations.” In J. Behrman and T.N. Srinivasan (eds.), The Handbook of Development Economics Volume II.. Policy Research Working Papers No. WPS 1164. Washington, D.C.: The World Bank.
Christiaensen, Luc, Lionel Demery, and Stefano Paternostro. 2002. “Growth, Distribution, and
Poverty in Africa: Messages from the 1990s.” Poverty Dynamics in Africa Series Report No. 25244. Washington, D.C. The World Bank.
Deininger, Klaus, and Hans P. Binswanger. 1995. “Rent Seeking and the Development of Large-Scale Agriculture in Kenya, South Africa, and Zimbabwe”. Economic Development and Cultural Change. Chicago, IL.: University of Chicago Press.
Deininger, Klaus, Hans Hoogeveen, and Bill Kinsey. 2002. “Benefits and Costs of Land Reform
in Zimbabwe with Implications for Southern Africa.” Forthcoming in World Development.
International Monetary Fund (IMF). 1998. External Evaluation of Enhanced Structural
Adjustment Facility (Report of the Group of Independent Experts). Washington, D.C.: IMF.
Jayarajah, Carl, William Branson, and Binayak Sen. 1996. Social Dimensions of Adjustment:
World Bank Experience, 1980-93. Operations Evaluation Department. Washington D.C.: The World Bank.


Annex A
Statistical Annex

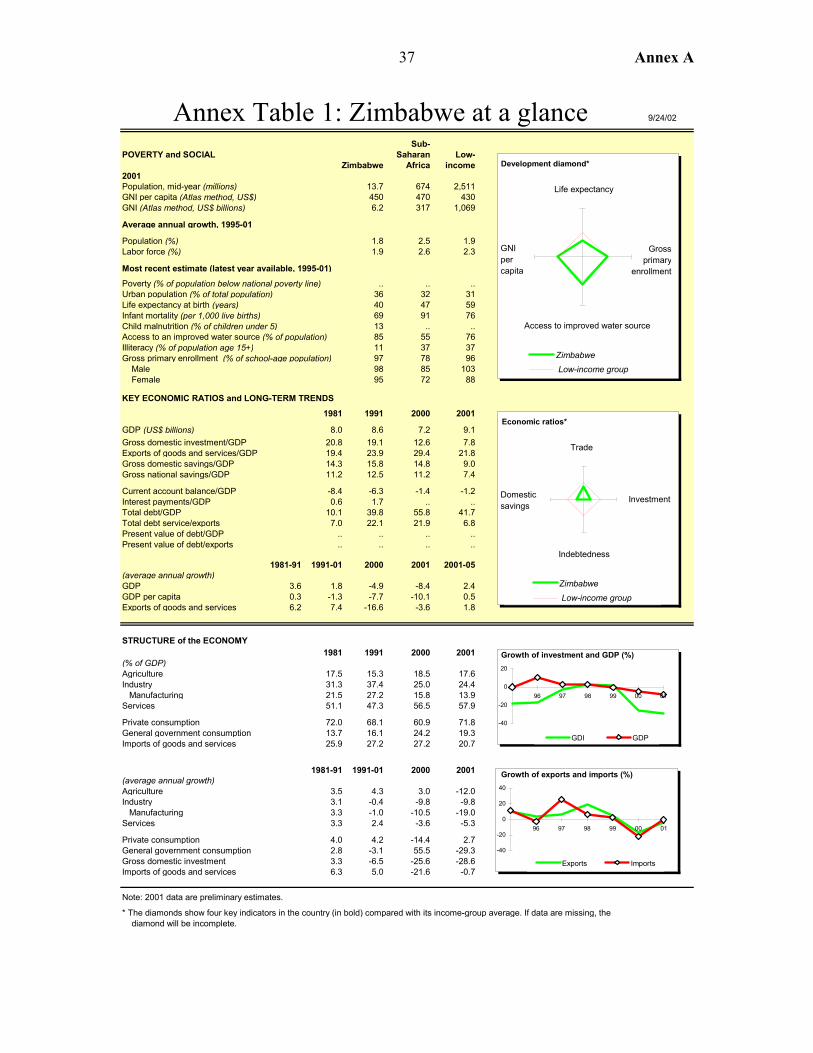
Annex A 37
Annex Table 1: Zimbabwe at a glance 9/24/02
Sub-POVERTY and SOCIAL Saharan Low-
Zimbabwe Africa income2001Population, mid-year (millions) 13.7 674 2,511GNI per capita (Atlas method, US$) 450 470 430GNI (Atlas method, US$ billions) 6.2 317 1,069
Average annual growth, 1995-01
Population (%) 1.8 2.5 1.9Labor force (%) 1.9 2.6 2.3
Most recent estimate (latest year available, 1995-01)Poverty (% of population below national poverty line) .. .. ..Urban population (% of total population) 36 32 31Life expectancy at birth (years) 40 47 59Infant mortality (per 1,000 live births) 69 91 76Child malnutrition (% of children under 5) 13 .. ..Access to an improved water source (% of population) 85 55 76Illiteracy (% of population age 15+) 11 37 37Gross primary enrollment (% of school-age population) 97 78 96 Male 98 85 103 Female 95 72 88
KEY ECONOMIC RATIOS and LONG-TERM TRENDS1981 1991 2000 2001
GDP (US$ billions) 8.0 8.6 7.2 9.1Gross domestic investment/GDP 20.8 19.1 12.6 7.8Exports of goods and services/GDP 19.4 23.9 29.4 21.8Gross domestic savings/GDP 14.3 15.8 14.8 9.0Gross national savings/GDP 11.2 12.5 11.2 7.4
Current account balance/GDP -8.4 -6.3 -1.4 -1.2Interest payments/GDP 0.6 1.7 .. ..Total debt/GDP 10.1 39.8 55.8 41.7Total debt service/exports 7.0 22.1 21.9 6.8Present value of debt/GDP .. .. .. ..Present value of debt/exports .. .. .. ..
1981-91 1991-01 2000 2001 2001-05(average annual growth)GDP 3.6 1.8 -4.9 -8.4 2.4GDP per capita 0.3 -1.3 -7.7 -10.1 0.5Exports of goods and services 6.2 7.4 -16.6 -3.6 1.8
STRUCTURE of the ECONOMY1981 1991 2000 2001
(% of GDP)Agriculture 17.5 15.3 18.5 17.6Industry 31.3 37.4 25.0 24.4 Manufacturing 21.5 27.2 15.8 13.9Services 51.1 47.3 56.5 57.9
Private consumption 72.0 68.1 60.9 71.8General government consumption 13.7 16.1 24.2 19.3Imports of goods and services 25.9 27.2 27.2 20.7
1981-91 1991-01 2000 2001(average annual growth)Agriculture 3.5 4.3 3.0 -12.0Industry 3.1 -0.4 -9.8 -9.8 Manufacturing 3.3 -1.0 -10.5 -19.0Services 3.3 2.4 -3.6 -5.3
Private consumption 4.0 4.2 -14.4 2.7General government consumption 2.8 -3.1 55.5 -29.3Gross domestic investment 3.3 -6.5 -25.6 -28.6Imports of goods and services 6.3 5.0 -21.6 -0.7
Note: 2001 data are preliminary estimates.
* The diamonds show four key indicators in the country (in bold) compared with its income-group average. If data are missing, the diamond will be incomplete.
-40
-20
0
20
96 97 98 99 00 01
GDI GDP
Growth of investment and GDP (%)
Zimbabwe Low-income group
Development diamond*
Life expectancy
Access to improved water source
GNIpercapita
Grossprimary
enrollment
-40
-20
0
20
40
96 97 98 99 00 01
Exports Imports
Growth of exports and imports (%)
Zimbabwe Low-income group
Economic ratios*
Trade
Domesticsavings
Investment
Indebtedness

Annex A (continued) 38
Zimbabwe
PRICES and GOVERNMENT FINANCE1981 1991 2000 2001
Domestic prices(% change)Consumer prices .. 23.3 55.7 75.1Implicit GDP deflator 14.5 30.6 59.9 70.1
Government finance(% of GDP, includes current grants)Current revenue 20.7 26.6 27.4 23.3Current budget balance 16.3 0.3 -19.9 -10.7Overall surplus/deficit -6.5 -6.3 -22.5 -11.6
TRADE1981 1991 2000 2001
(US$ millions)Total exports (fob) .. 1,785 1,791 1,715 Tobacco .. 532 549 566 Gold .. 225 216 172 Manufactures .. 587 567 552Total imports (cif) .. 1,700 1,520 1,455 Food .. 245 54 135 Fuel and energy .. 197 250 202 Capital goods .. 611 480 458
Export price index (1995=100) .. 98 89 86Import price index (1995=100) .. 95 91 86Terms of trade (1995=100) .. 104 98 100
BALANCE of PAYMENTS1981 1991 2000 2001
(US$ millions)Exports of goods and services 1,575 2,056 2,118 1,977Imports of goods and services 1,985 2,301 1,956 1,872Resource balance -410 -245 162 105
Net income -140 -304 -244 -246Net current transfers -124 2 -20 31
Current account balance -674 -547 -101 -110
Financing items (net) 356 421 264 190Changes in net reserves 318 126 -163 -80
Memo:Reserves including gold (US$ millions) 368 371 22 18Conversion rate (DEC, local/US$) 0.7 3.4 44.4 55.1
EXTERNAL DEBT and RESOURCE FLOWS1981 1991 2000 2001
(US$ millions)Total debt outstanding and disbursed 812 3,436 4,022 3,780 IBRD 52 410 416 392 IDA 151 68 437 418
Total debt service 114 461 471 136 IBRD 2 66 72 15 IDA 2 0 2 0
Composition of net resource flows Official grants 91 95 .. .. Official creditors 80 139 -15 -1 Private creditors 3 98 -50 -33 Foreign direct investment -26 3 .. .. Portfolio equity .. .. .. ..
World Bank program Commitments .. .. 0 0 Disbursements 48 52 26 -2 Principal repayments 1 33 46 11 Net flows 47 19 -20 -13 Interest payments 3 33 28 4 Net transfers 44 -14 -48 -17
Development Economics 9/24/02
-15
-10
-5
095 96 97 98 99 00 01
Current account balance to GDP (%)
0
1,000
2,000
3,000
95 96 97 98 99 00 01
Exports
Export and import levels (US$ mill.)
0
20
40
60
80
96 97 98 99 00 01
GDP deflator CPI
Inflation (%)
495 392
614
262
418
489
1110
Composition of 2001 debt (US$ mill.)
A - IBRDB - IDA C - IMF
D - Other multilateralE - BilateralF - PrivateG - Short-term
Imports

Ann
ex T
able
2: Z
imba
bwe
- Eco
nom
ic a
nd S
ocia
l Ind
icat
ors,
CY
1990
-200
1
Ave
rage
199
0-01
Seri
es N
ame
1980
19
90
1991
19
92
1993
19
94
1995
19
96
1997
19
98
1999
20
00
2001
Z
im-
babw
eC
ote
d'
Ivoi
reG
hana
Ken
yaM
alaw
i G
DP
grow
th (a
nnua
l %)
14.4
7.0
5.5
-9.0
1.1
9.2
0.2
10.4
2.
72.
9-0
.7-4
.9-8
.41.
92.
84.
22.
03.
7G
DP
per c
apita
gro
wth
(ann
ual %
) 10
.63.
72.
7-1
1.2
-1.2
7.0
-1.7
8.3
0.7
0.9
-2.6
-6.7
-9.8
-0.6
-0.1
1.8
-0.6
1.6
GN
I per
cap
ita, A
tlas m
etho
d (c
urre
nt U
S$)*
95
0.0
880.
087
0.0
710.
064
0.0
630.
061
0.0
680.
0 68
0.0
570.
047
0.0
440.
048
0.0
638.
361
8.2
597.
258
7.8
583.
5G
NI p
er c
apita
, PPP
(cur
rent
inte
rnat
iona
l $)
1460
.022
60.0
2380
.021
90.0
2200
.024
00.0
2430
.026
60.0
26
70.0
2680
.026
70.0
2550
.023
40.0
2452
.524
68.5
2475
.924
99.7
2524
.7A
gric
ultu
re, v
alue
add
ed (%
of G
DP)
15
.716
.515
.37.
415
.019
.015
.221
.8
18.9
21.8
19.4
18.5
17.6
17.2
17.3
17.4
18.3
18.5
Man
ufac
turin
g, v
alue
add
ed (%
of G
DP)
21
.622
.827
.229
.523
.021
.221
.818
.8
18.0
16.6
16.6
15.8
13.9
20.4
20.2
19.7
18.8
18.5
Serv
ices
, etc
., va
lue
adde
d (%
of G
DP)
55
.350
.447
.351
.751
.648
.655
.752
.3
55.5
54.2
56.6
56.5
57.9
53.2
53.4
54.0
54.1
54.3
Expo
rts o
f goo
ds a
nd se
rvic
es (%
of G
DP)
23
.422
.923
.927
.230
.734
.638
.236
.1
37.6
45.9
46.2
29.4
21.8
32.9
33.7
34.5
35.1
35.5
Impo
rts o
f goo
ds a
nd se
rvic
es (%
of G
DP)
26
.522
.827
.236
.532
.436
.540
.935
.9
44.6
47.8
46.6
27.2
20.7
34.9
35.9
36.7
36.7
37.0
Cur
rent
acc
ount
bal
ance
(% o
f GD
P)
-2.2
-1.6
-5.3
-8.9
-1.8
-6.2
....
....
....
..-4
.8-5
.4-5
.4-4
.7-5
.3To
tal d
ebt s
ervi
ce (%
of e
xpor
ts o
f goo
ds a
nd se
rvic
es)
3.8
23.1
23.1
32.0
30.9
25.4
23.6
21.2
22
.238
.227
.322
.1..
26.3
26.6
26.9
26.4
26.0
Exte
rnal
deb
t (%
of G
NI)
11
.938
.241
.162
.767
.968
.673
.860
.2
61.3
88.1
88.9
57.5
..64
.466
.869
.169
.769
.8G
ross
inte
rnat
iona
l res
erve
s in
mon
ths o
f im
ports
2.
71.
51.
41.
83.
22.
53.
22.
8 1.
11.
22.
11.
70.
71.
92.
02.
02.
01.
9G
ross
dom
estic
savi
ngs (
% o
f GD
P)
13.8
17.5
15.8
11.0
21.0
21.8
17.0
18.7
11
.115
.315
.714
.89.
015
.715
.615
.615
.915
.5O
ffic
ial e
xcha
nge
rate
(LC
U p
er U
S$, p
erio
d av
erag
e)
0.64
2.45
3.62
5.10
6.48
8.15
8.67
10.0
0 12
.11
23.6
838
.30
44.4
255
.05
18.2
491.
921
02.8
54.1
23.0
Rea
l eff
ectiv
e ex
chan
ge ra
te in
dex
(199
0 =
100)
**
..10
0.0
111.
313
7.1
147.
515
9.4
161.
615
2.3
159.
023
3.2
239.
117
3.5
125.
512
5.5
100.
082
.0..
117.
0In
flatio
n, c
onsu
mer
pric
es (a
nnua
l %)
5.4
17.4
23.3
42.1
27.6
22.3
22.6
21.4
18
.731
.858
.555
.976
.734
.936
.337
.437
.037
.8C
urre
nt re
venu
e, e
xclu
ding
gra
nts (
% o
f GD
P)
19.3
24.1
22.0
24.0
26.1
22.5
26.7
25.3
29
.4..
....
..25
.025
.125
.525
.725
.6Ex
pend
iture
, tot
al (%
of G
DP)
27
.927
.327
.532
.629
.225
.935
.734
.7
35.7
....
....
31.1
31.5
32.0
32.0
32.3
Ove
rall
budg
et d
efic
it, e
xclu
ding
cap
ital g
rant
s (%
of G
DP)
-8
.8..
....
....
....
....
....
....
....
....
Illite
racy
rate
, adu
lt to
tal (
% o
f peo
ple
ages
15
and
abov
e)
29.9
19.3
18.5
17.7
16.9
16.1
15.2
14.5
13
.712
.912
.111
.310
.614
.914
.614
.213
.913
.7Im
mun
izat
ion,
DPT
(% o
f chi
ldre
n un
der 1
2 m
onth
s)
..88
.087
.086
.085
.087
.088
.090
.0
86.0
81.0
81.0
....
85.9
85.7
85.6
85.5
85.6
Impr
oved
wat
er so
urce
(% o
f pop
ulat
ion
with
acc
ess)
..
77.0
....
....
....
....
..85
.0..
81.0
83.0
83.0
83.0
83.0
Life
exp
ecta
ncy
at b
irth,
tota
l (ye
ars)
54
.956
.2..
55.7
....
49.0
.. 44
.5..
40.4
39.9
..47
.646
.246
.244
.844
.8M
orta
lity
rate
, inf
ant (
per 1
,000
live
birt
hs)
80.0
51.8
..53
.0..
..60
.2..
65.0
....
69.0
..59
.861
.461
.462
.862
.8Sa
nita
tion
(% o
f pop
ulat
ion
with
acc
ess)
..
64.0
....
....
....
....
..68
.0..
66.0
67.0
67.0
67.0
67.0
Scho
ol e
nrol
lmen
t, pr
imar
y (%
gro
ss)
85.1
115.
712
1.5
118.
411
7.3
111.
311
4.3
113.
0 11
2.4
..96
.6..
..11
3.4
113.
111
2.2
111.
511
0.9
Scho
ol e
nrol
lmen
t, pr
imar
y (%
net
) ..
....
....
....
.. ..
..80
.2..
..80
.280
.280
.2..
80.2
Scho
ol e
nrol
lmen
t, se
cond
ary
(% g
ross
) 7.
749
.552
.347
.744
.645
.147
.348
.5
....
45.3
....
47.6
47.3
46.7
46.6
46.8
Scho
ol e
nrol
lmen
t, se
cond
ary
(% n
et)
....
....
....
....
....
42.3
....
42.3
..42
.3..
..Po
pula
tion,
tota
l (m
illio
n)
7.1
10.2
10.5
10.8
11.0
11.3
11.5
11.7
11
.912
.212
.412
.612
.811
.611
.711
.811
.911
.9Po
pula
tion
grow
th (a
nnua
l %)
3.4
3.1
2.7
2.5
2.2
2.1
1.9
1.9
1.9
1.9
1.9
1.9
1.5
2.1
3.1
2.4
2.6
2.0
Urb
an p
opul
atio
n (%
of t
otal
) 22
.328
.429
.029
.730
.431
.131
.832
.5
33.1
33.9
34.6
35.3
36.0
32.1
32.5
32.7
33.0
33.2
Sour
ce: W
orld
Ban
k da
taba
se a
s of 1
1/07
/200
2.
*Com
putin
g G
NI p
er c
apita
(cur
rent
$U
S), t
he B
ank
uses
the
Atla
s con
vers
ion
fact
or, a
thre
e-ye
ar a
vera
ge o
f off
icia
l exc
hang
e ra
tes a
djus
ted
for t
he in
flatio
n ra
tes i
n th
e co
untry
and
in th
e G
-5 c
ount
ries.
As a
resu
lt, G
NI p
er c
apita
(cur
rent
$U
S) o
f Zim
babw
e de
clin
ed b
y 45
% fr
om 1
990
to 2
001
due
to e
xcha
nge
rate
dep
reci
atio
n an
d hi
gh d
omes
tic in
flatio
n.
**
Dat
a fo
r com
paris
on a
mon
g co
untri
es re
fers
to C
Y20
01.
***
Gro
wth
rate
s are
leas
t-squ
ares
gro
wth
rate
s.
39 Annex A (continued)

Annex A (continued) 40
Annex Table 3a: External Assistance to Zimbabwe CY1970-2000, (US$ million) Donors 1970-79 1980-89 1990-2000 1997 1998 1999 2000
Average Net Receipts 32.2 293.2 408.7 305.7 177.0 420.5 208.2Average Net Official Flows 4.2 196.2 315.2 251.9 277.9 204.0 191.7
Bilateral
Average Net Private Flows 28.0 97.1 93.5 53.8 -100.9 216.5 16.5 Multilateral -3.8 75.3 141.7 85.2 32.5 -20.6 -46.3IBRD/IDA -4.0 30.1 42.7 85.8 25.0 -0.1 -20.2African Development Bank .. 5.7 20.1 -2.9 -18.3 -32.4 -7.1African Development Fund .. 1.3 3.6 4.4 5.3 16.7 3.6Other
Average Net Receipts
.. 4.9 -0.8 -2.6 -0.5 -0.1 -0.6
Average Net Receipts 28.4 373.5 549.7 388.3 209.0 399.8 161.3Total Donors Average Net Official Flows 0.4 276.4 456.2 334.5 309.9 183.3 144.8
Memo item: GDP at market prices (current US$ million) 3662 7204 7380 8584 6338 5492 7392Source: Geographical Distribution of Financial Flows to Aid Recipients. 2002. OECD. Annex Table 3b: Zimbabwe - WB Commitments by Sector FY80-00, (US$ million) Sector Group 1980-90 1991-2000
Agriculture 102 164 Economic Policy 300 Electric Power and Energy 149 90 Environment 63 Finance 10 Health, Nutrition and Population 10 90 Multisector 136 Oil and Gas 1 Private Sector Development 70 Social Protection 60 Transportation 141 39 Urban Development 123 12 Total 672 886 Source: World Bank data as of 04/09/2002.
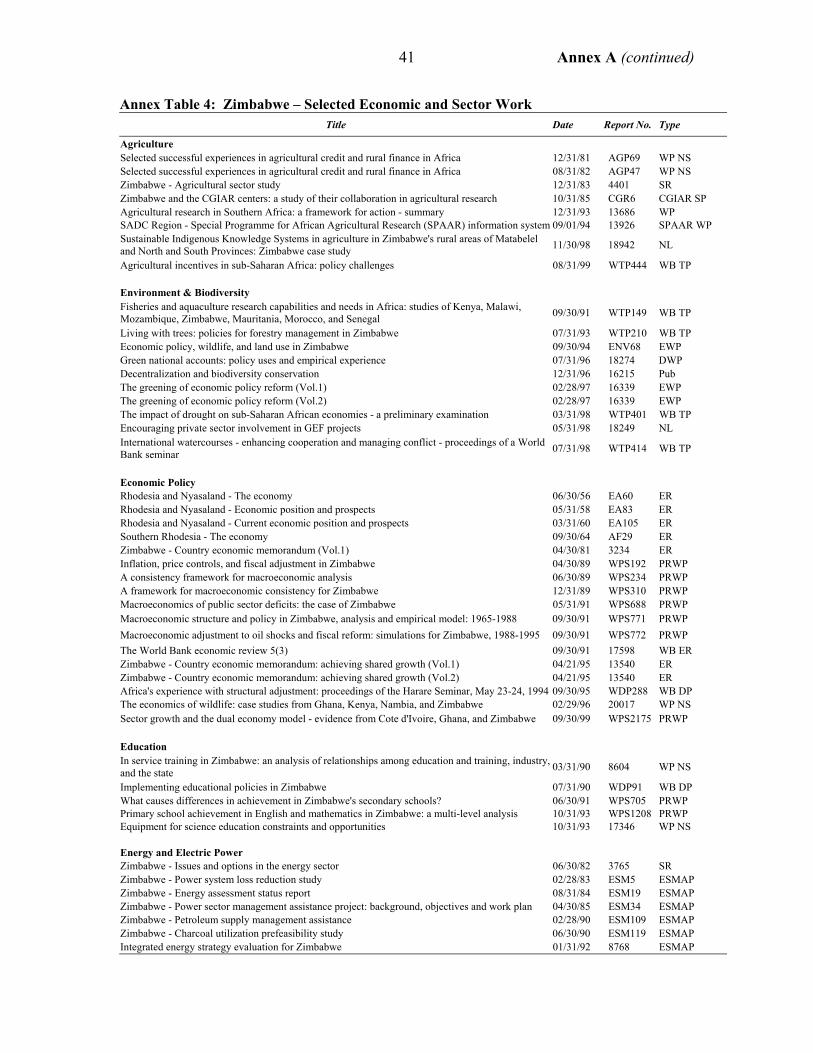
Annex A (continued) 41
Annex Table 4: Zimbabwe – Selected Economic and Sector Work Title Date Report No. Type
Agriculture Selected successful experiences in agricultural credit and rural finance in Africa 12/31/81 AGP69 WP NS Selected successful experiences in agricultural credit and rural finance in Africa 08/31/82 AGP47 WP NS Zimbabwe - Agricultural sector study 12/31/83 4401 SR Zimbabwe and the CGIAR centers: a study of their collaboration in agricultural research 10/31/85 CGR6 CGIAR SP Agricultural research in Southern Africa: a framework for action - summary 12/31/93 13686 WP SADC Region - Special Programme for African Agricultural Research (SPAAR) information system 09/01/94 13926 SPAAR WP Sustainable Indigenous Knowledge Systems in agriculture in Zimbabwe's rural areas of Matabelel and North and South Provinces: Zimbabwe case study 11/30/98 18942 NL
Agricultural incentives in sub-Saharan Africa: policy challenges 08/31/99 WTP444 WB TP Environment & Biodiversity Fisheries and aquaculture research capabilities and needs in Africa: studies of Kenya, Malawi, Mozambique, Zimbabwe, Mauritania, Morocco, and Senegal 09/30/91 WTP149 WB TP
Living with trees: policies for forestry management in Zimbabwe 07/31/93 WTP210 WB TP Economic policy, wildlife, and land use in Zimbabwe 09/30/94 ENV68 EWP Green national accounts: policy uses and empirical experience 07/31/96 18274 DWP Decentralization and biodiversity conservation 12/31/96 16215 Pub The greening of economic policy reform (Vol.1) 02/28/97 16339 EWP The greening of economic policy reform (Vol.2) 02/28/97 16339 EWP The impact of drought on sub-Saharan African economies - a preliminary examination 03/31/98 WTP401 WB TP Encouraging private sector involvement in GEF projects 05/31/98 18249 NL International watercourses - enhancing cooperation and managing conflict - proceedings of a World Bank seminar 07/31/98 WTP414 WB TP
Economic Policy Rhodesia and Nyasaland - The economy 06/30/56 EA60 ER Rhodesia and Nyasaland - Economic position and prospects 05/31/58 EA83 ER Rhodesia and Nyasaland - Current economic position and prospects 03/31/60 EA105 ER Southern Rhodesia - The economy 09/30/64 AF29 ER Zimbabwe - Country economic memorandum (Vol.1) 04/30/81 3234 ER Inflation, price controls, and fiscal adjustment in Zimbabwe 04/30/89 WPS192 PRWP A consistency framework for macroeconomic analysis 06/30/89 WPS234 PRWP A framework for macroeconomic consistency for Zimbabwe 12/31/89 WPS310 PRWP Macroeconomics of public sector deficits: the case of Zimbabwe 05/31/91 WPS688 PRWP Macroeconomic structure and policy in Zimbabwe, analysis and empirical model: 1965-1988 09/30/91 WPS771 PRWP Macroeconomic adjustment to oil shocks and fiscal reform: simulations for Zimbabwe, 1988-1995 09/30/91 WPS772 PRWP The World Bank economic review 5(3) 09/30/91 17598 WB ER Zimbabwe - Country economic memorandum: achieving shared growth (Vol.1) 04/21/95 13540 ER Zimbabwe - Country economic memorandum: achieving shared growth (Vol.2) 04/21/95 13540 ER Africa's experience with structural adjustment: proceedings of the Harare Seminar, May 23-24, 1994 09/30/95 WDP288 WB DP The economics of wildlife: case studies from Ghana, Kenya, Nambia, and Zimbabwe 02/29/96 20017 WP NS Sector growth and the dual economy model - evidence from Cote d'Ivoire, Ghana, and Zimbabwe 09/30/99 WPS2175 PRWP Education In service training in Zimbabwe: an analysis of relationships among education and training, industry, and the state 03/31/90 8604 WP NS
Implementing educational policies in Zimbabwe 07/31/90 WDP91 WB DP What causes differences in achievement in Zimbabwe's secondary schools? 06/30/91 WPS705 PRWP Primary school achievement in English and mathematics in Zimbabwe: a multi-level analysis 10/31/93 WPS1208 PRWP Equipment for science education constraints and opportunities 10/31/93 17346 WP NS Energy and Electric Power Zimbabwe - Issues and options in the energy sector 06/30/82 3765 SR Zimbabwe - Power system loss reduction study 02/28/83 ESM5 ESMAP Zimbabwe - Energy assessment status report 08/31/84 ESM19 ESMAP Zimbabwe - Power sector management assistance project: background, objectives and work plan 04/30/85 ESM34 ESMAP Zimbabwe - Petroleum supply management assistance 02/28/90 ESM109 ESMAP Zimbabwe - Charcoal utilization prefeasibility study 06/30/90 ESM119 ESMAP Integrated energy strategy evaluation for Zimbabwe 01/31/92 8768 ESMAP

Annex A (continued) 42
Title Date Report No. Type
Energy efficient technical assistance project: strategic framework for a National Energy Efficiency Improvement Program (NEEIP) - ESMAP activity completion report 04/30/94 17428 ESMAP
Capacity building for the National Energy Efficiency Improvement Programme (NEEIP): routes to an implementing agency for energy efficiency in Zimbabwe 12/31/94 17429 ESMAP
Energy price increases in developing countries: case studies of Colombia, Ghana, Indonesia, Malaysia, Turkey, and Zimbabwe 03/31/95 WPS1442 PRWP
Employment and Labor Issues The labor market in Zimbabwe: historical trends and an evaluation of recent policy 05/31/87 DRD296 DWP Lessons from tax reform: an overview 01/31/91 WPS576 PRWP Does financial reform increase or reduce savings? 02/28/99 WPS2062 PRWP Are wages and productivity in Zimbabwe affected by human capital investment and international trade? 04/30/99 WPS2101 PRWP
Health, Nutrition and Population Ventilated improved pit latrines: recent developments in Zimbabwe 12/01/82 WTP3 WB TP Pit latrine ventilation: field investigation methodology 01/01/83 TAG4 WP NS Ventilated improved pit latrines: vent pipe design guidelines 01/01/83 TAG6 WP NS Zimbabwe - Population, health and nutrition sector review (Vol.1) 06/17/83 4214 SR Zimbabwe - Population, health and nutrition sector review (Vol.2) 06/17/83 4214 SR The design of ventilated improved pit latrines 01/01/84 TAG13 WP NS Ventilated improved pit latrines: Zimbabwean brick designs 01/01/85 11434 WP NS Zimbabwe - Financing health services 01/31/92 10262 WB CS Development of the Zimbabwe family planning program 12/31/92 WPS1053 PRWP Nutrition in Zimbabwe: an update 06/30/94 13403 Pub Contraceptive choice, fertility, and public policy in Zimbabwe 02/28/95 LSM109 LSMS WP Swimming against the tide: strategies for improving equity in health 05/31/95 14567 HCWP Financing health services through user fees and insurance: case studies from sub-Saharan Africa 01/31/96 WDP294 WB DP Sustainable health care financing in Southern Africa: papers from an EDI Health Policy Seminar held in Johnannesburg, South Africa, June 1996 05/31/98 17908 EDI LRS
World Bank HIV/AIDS interventions - ex-ante and ex-post evaluation 06/30/98 WDP389 WB DP The impact of World Bank support to the HNP sector in Zimbabwe 06/30/98 18141 OED R Development effectiveness in health, nutrition, and population: lessons from World Bank experience 05/10/99 19266 OED R Manufacturing and the Industrial Sector Structural aspects of manufacturing in sub-Saharan Africa: findings from a seven country enterprise survey 10/31/96 WDP346 WB DP
Public Sector Management Public sector deficits and macroeconomic performance 11/30/94 13905 Pub Report on Round III (1995) of the Zimbabwe survey 12/31/95 15348 WP Evaluation capacity development in Africa: selected proceedings from a seminar in Abidjan 11/30/98 19814 Pr. Private Sector Development, Deregulation and Foreign Investment Private investment, government policy, and foreign capital in Zimbabwe 08/31/89 WPS248 PRWP Zimbabwe - A policy agenda for private sector development 06/30/93 11533 SR Technological capabilities and learning in African enterprises 12/31/95 WTP288 WB TP Implementing deregulation and promoting foreign direct investment in Africa: a report on six workshops 06/30/96 15949 PAS RP
Empowering small enterprises in Zimbabwe 12/31/97 WDP379 WB DP Poverty A review of the World Bank's efforts to assist African governments in reducing poverty 10/13/93 17670 WP NS Social Sector Social infrastructure and services in Zimbabwe 02/28/81 DPH8103 WP NS Social infrastructure and services in Zimbabwe 10/31/81 SWP495 SPAAR WP Urban Development The urban age - information and cities 3(1) 02/28/95 17446 NL Designing community based development 06/30/95 18187 NL
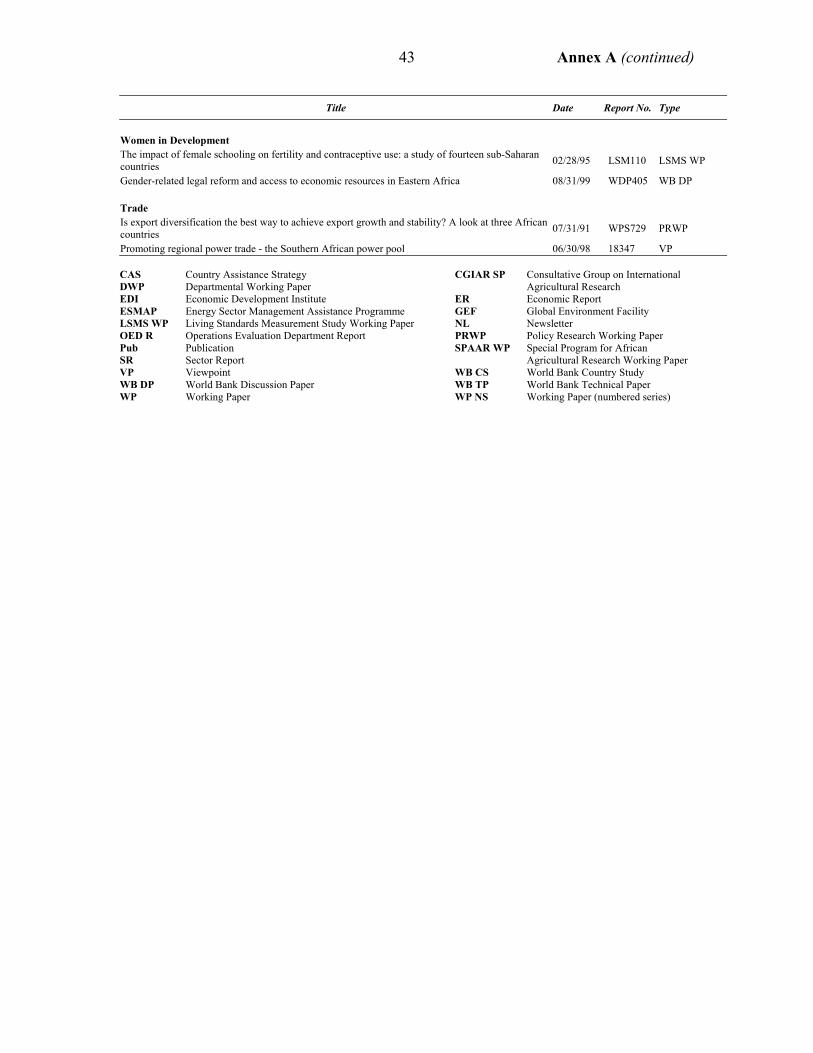
Annex A (continued) 43
Title Date Report No. Type
Women in Development The impact of female schooling on fertility and contraceptive use: a study of fourteen sub-Saharan countries 02/28/95 LSM110 LSMS WP
Gender-related legal reform and access to economic resources in Eastern Africa 08/31/99 WDP405 WB DP Trade Is export diversification the best way to achieve export growth and stability? A look at three African countries 07/31/91 WPS729 PRWP
Promoting regional power trade - the Southern African power pool 06/30/98 18347 VP CAS Country Assistance Strategy CGIAR SP Consultative Group on International DWP Departmental Working Paper Agricultural Research EDI Economic Development Institute ER Economic Report ESMAP Energy Sector Management Assistance Programme GEF Global Environment Facility LSMS WP Living Standards Measurement Study Working Paper NL Newsletter OED R Operations Evaluation Department Report PRWP Policy Research Working Paper Pub Publication SPAAR WP Special Program for African SR Sector Report Agricultural Research Working Paper VP Viewpoint WB CS World Bank Country Study WB DP World Bank Discussion Paper WB TP World Bank Technical Paper WP Working Paper WP NS Working Paper (numbered series)
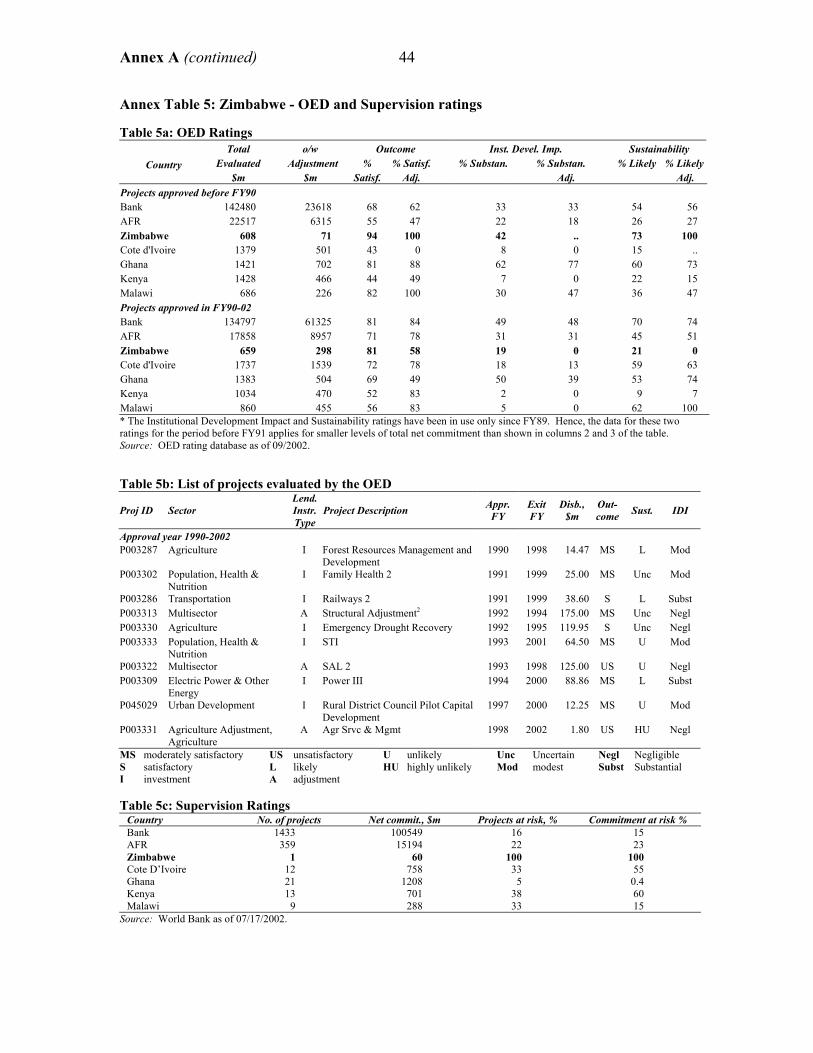
Annex A (continued) 44
Annex Table 5: Zimbabwe - OED and Supervision ratings Table 5a: OED Ratings
Total o/w Outcome Inst. Devel. Imp. Sustainability Evaluated Adjustment % % Satisf. % Substan. % Substan. % Likely % LikelyCountry
$m $m Satisf. Adj. Adj. Adj. Projects approved before FY90 Bank 142480 23618 68 62 33 33 54 56 AFR 22517 6315 55 47 22 18 26 27 Zimbabwe 608 71 94 100 42 .. 73 100 Cote d'Ivoire 1379 501 43 0 8 0 15 .. Ghana 1421 702 81 88 62 77 60 73 Kenya 1428 466 44 49 7 0 22 15 Malawi 686 226 82 100 30 47 36 47 Projects approved in FY90-02 Bank 134797 61325 81 84 49 48 70 74 AFR 17858 8957 71 78 31 31 45 51 Zimbabwe 659 298 81 58 19 0 21 0 Cote d'Ivoire 1737 1539 72 78 18 13 59 63 Ghana 1383 504 69 49 50 39 53 74 Kenya 1034 470 52 83 2 0 9 7 Malawi 860 455 56 83 5 0 62 100 * The Institutional Development Impact and Sustainability ratings have been in use only since FY89. Hence, the data for these two ratings for the period before FY91 applies for smaller levels of total net commitment than shown in columns 2 and 3 of the table. Source: OED rating database as of 09/2002. Table 5b: List of projects evaluated by the OED
Proj ID Sector Lend. Instr. Type
Project Description Appr. FY
Exit FY
Disb., $m
Out-come Sust. IDI
Approval year 1990-2002 P003287 Agriculture I Forest Resources Management and
Development 1990 1998 14.47 MS L Mod
P003302 Population, Health & Nutrition
I Family Health 2 1991 1999 25.00 MS Unc Mod
P003286 Transportation I Railways 2 1991 1999 38.60 S L Subst P003313 Multisector A Structural Adjustment2 1992 1994 175.00 MS Unc Negl P003330 Agriculture I Emergency Drought Recovery 1992 1995 119.95 S Unc Negl P003333 Population, Health &
Nutrition I STI 1993 2001 64.50 MS U Mod
P003322 Multisector A SAL 2 1993 1998 125.00 US U Negl P003309 Electric Power & Other
Energy I Power III 1994 2000 88.86 MS L Subst
P045029 Urban Development I Rural District Council Pilot Capital Development
1997 2000 12.25 MS U Mod
P003331 Agriculture Adjustment, Agriculture
A Agr Srvc & Mgmt 1998 2002 1.80 US HU Negl
MS moderately satisfactory US unsatisfactory U unlikely Unc Uncertain Negl Negligible S satisfactory L likely HU highly unlikely Mod modest Subst Substantial I investment A adjustment Table 5c: Supervision Ratings
Country No. of projects Net commit., $m Projects at risk, % Commitment at risk % Bank 1433 100549 16 15 AFR 359 15194 22 23 Zimbabwe 1 60 100 100 Cote D’Ivoire 12 758 33 55 Ghana 21 1208 5 0.4 Kenya 13 701 38 60 Malawi 9 288 33 15
Source: World Bank as of 07/17/2002.

Annex A (continued) 45
Annex Table 6: Costs of Bank Programs for Zimbabwe and Comparator Countries, FY91-01 Table 6a Regions/Countries Total costs, $m Lending completion
costs, $m Supervision costs, $m ESW completion costs, $m
Bank 3478 1243 1151 1084 AFR 921 314 360 247 Zimbabwe 19 9 7 3 Cote d’Ivoire 32 14 13 5 Ghana 49 17 23 8 Kenya 36 14 18 5 Malawi 29 10 15 4 Percentages Bank 100 36 33 31 AFR 100 34 39 27 Zimbabwe 100 46 38 17 Cote d’Ivoire 100 45 41 15 Ghana 100 36 48 17 Kenya 100 38 48 14 Malawi 100 35 51 14
Table 6b: Efficiency Table
Regions/ Countries
Total costs, $m
Number of projects
approved in 1991–2001
Commitment, $m
Commitment for satisfactory and nonrisky projects, $m
Average costs per approved project, $1000
Average cost $ per $1000 of commitment
Average costs $ per $1000 of
commitment for satisfactory and
nonrisky projects
Memo Average projects size, $m
Bank 3478 2671 242060 208551 1302 14.4 16.7 91 AFR 921 689 30191 24695 1337 30.5 37.3 44 Zimbabwe 19 13 887 680 1472 21.6 28.1 68 Cote d’Ivoire 32 27 2175 1608 1194 14.8 20.0 81 Ghana 49 48 2237 1839 1016 21.8 26.5 47 Kenya 36 29 1824 1246 1255 20.0 29.2 63 Malawi 29 24 1098 868 1195 26.1 33.1 46 Source: World Bank. Direct costs by service across fiscal years, as of August 2001. * The amount of total costs includes lending completion, supervision, and ESW costs. ** Lending, supervision, and ESW costs are actual costs for active, closed, dropped, and all other projects in Bank’s operations in FY91–01.

Annex A (continued) 46
Annex Table 7: Zimbabwe – Senior Management, CY1990–2002
Year VP Div. Chief / Country Director Resident Representative
1990 Edward V. K. Jaycox H. W. Messenger M. A. Burney 1991 Edward V. K. Jaycox Praful C. Patel C. J. Poortman 1992 Edward V. K. Jaycox Praful C. Patel C. J. Poortman 1993 Edward V. K. Jaycox Praful C. Patel C. J. Poortman 1994 Edward V. K. Jaycox Praful C. Patel C. J. Poortman 1995 Edward V. K. Jaycox Praful C. Patel D. A. Cook 1996 Callisto Madavo Barbara Kafka D. A. Cook 1997 Callisto Madavo Barbara Kafka D. A. Cook 1998 Callisto Madavo Barbara Kafka D. A. Cook 1999 Callisto Madavo Barbara Kafka T. W. Allen 2000 Callisto Madavo Yaw Ansu T. W. Allen 2001 Callisto Madavo Yaw Ansu T. W. Allen 2002 Callisto Madavo Yaw Ansu O. O. Nyanin Source: The World Bank Group Directory, 1990–2002.

Annex A (continued) 47
Annex Table 8: Zimbabwe - International Development Goals 1990 1995 1998 1999Poverty and malnutrition Population below $1 a day (%) 36 .. .. .. Poverty gap at $1 a day (%) 9.6 .. .. .. Percentage share of income or consumption held by poorest 20% 4 .. .. .. Prevalence of child malnutrition (% of children under 5) .. 15.5 .. .. Universal primary education Net primary enrollment ratio (% of relevant age group) .. .. .. .. Percentage of cohort reaching grade 5 (%) 94 79 .. .. Youth literacy rate (% ages 15-24) 94 96 96.7 97Gender equality Ratio of girls to boys in primary and secondary education (%) 96.2 94 94.3 .. Ratio of young literate females to males (% ages 15-24) 94.6 96.2 96.8 97Infant and child mortality Infant mortality rate (per 1,000 live births) 51.8 62.6 69 70.1Under 5 mortality rate (per 1,000) 77 .. 107.7 118Maternal mortality Maternal mortality ratio (per 100,000 live births) .. .. .. 400Births attended by skilled health staff (% of total) .. 69 .. 84Reproductive health Contraceptive prevalence rate (% or women ages 15-49) .. 48 .. .. Prevalence of HIV, female (% ages 15-24) .. .. .. 11.3Environment Access to an improved water source (% of population) 77 77 .. 85Forest area (% of total land area) 57.5 .. .. 49.2Nationally protected areas (% of total land area) .. .. 7.9 7.9GDP per unit of energy use (PPP $ per kg oil equivalent) 2.5 2.8 3.3 .. General indicators Population 9.7 million 11.0 million 11.7 million 11.9 million Gross national income ($) 9.0 billion 7.0 billion 7.5 billion 6.3 billion GNI per capita ($) 920 630 640 530Adult literacy rate (% of people ages 15 and over) 80.7 84.8 87.2 88Total fertility rate (births per woman) 4.8 4 3.8 3.6Life expectancy at birth (years) 56.2 49 44.5 40.4Aid (% of GNI) 4 7.2 4.4 4.7External debt (% of GNI) 38.2 73.7 74.2 87Investment (% of GDP) 17.4 23.6 19.8 11.5Trade (% of GDP) 45.7 79.1 87.7 90.9Source: World Bank Development Indicators database, April 2001.


Annex B 49
Recommendations on Land Reform in Bank Reports
Report Date Bank Recommendation Adoption CEM 1981 None
Agriculture Sector Study
1983 None
CEM 1985 None
Study on Land Subsector
1986 Lacked clear guidance. Suggested reviewing the restrictions on land transactions, including leasing, and assessing their impact on agricultural productivity and growth. “If a land tax is necessary to encourage a more efficient use of land, it should be relatively simple to administer and not impede efficiency.”
No
A Strategy for Sustained Growth
1987 None
Memorandum on Agriculture Sector
1991 An increase in the land tax; easier subdivision of freehold land; allow local authorities to collect and spend a portion of tax proceeds on local development as well as financing the acquisition of land for use in resettlement schemes; price paid for land that is offered for sale must be market-determined.
No
CEM 1995 Graduated land tax; charging farmers the full economic cost for utilities and removing other direct and indirect subsidies which increase the price of land; revising land subdivision, lease, and sale regulations; financial instruments to enable smallholder farmers to purchase or lease land; institutional arrangements to provide training and technical and marketing services; public investments in selected common use facilities and infrastructure in areas where significant land transfers are taking place. A grant component to be combined with market-based redistribution to facilitate the transfer of land to poor small-scale farmers.
No
Learning and Innovation Loan (LIL)
1998 Agreement between the Government, stakeholders, and donors on the principles of land reform (respect for law, the need for land reform to be consistent with macro-economic stability, focus on poverty reduction, transparency, accountability, and sustainability). An Inception Phase would be launched over two years, with the goal of resettling 1 million ha, with multiple pilots (based on a mix of compulsory acquisition and market-assisted models). Expansion phase would meet the Government’s objective of redistributing 5 million ha.
No. Inception Phase never got off the ground.
Source: World Bank documents.


Annex C 51
Brazil: Land-based Poverty Alleviation
1. With a land distribution among the most unequal in the world, the situation in Brazil is characterized by a large extent of landlessness and a politically very vocal demand for land reform. A land reform institute (INCRA) was established in 1969, distributing 10 million hectares to 200,000 families and colonizing about 14 million hectares for about 75,000 beneficiary families since then. However, a recent FAO study estimates the number of families who are potential candidates for land reform at 2.5 million, suggesting that only part of the effective demand has been addressed. Since 1995, the political importance of land reform has increased greatly; a federal Minister for Agrarian Reform was appointed in 1996 and the land reform budget tripled from US$0.4 billion in 1994 to $1.3 billion in 1995 with a further increase to $2.6 billion in 1997. 2. To help the Government accomplish the goal of poverty reduction, the Bank has been building on the highly successful experience of community-driven projects in the country’s Northeast, to develop a program of community-based land reform that is complementary to the existing approach which, from 1995 through the end of 1999, has resettled approximately 372,500 families. Under the community-based scheme, eligible beneficiary groups (community organizations) receive assistance to identify and acquire land and to make complementary productive investments in order to be able to make productive use of this land. The pilot has been implemented faster than originally expected, benefiting about 15,000 households thus far. While the approach continues to evolve, and a major evaluation study that continues to yield valuable insights is ongoing, a number of conclusions, both with respect to land reform in general, and in relation to the community-based program, have already emerged: 3. First, land reform can be a cost-effective way of reducing poverty and inequality. It compares favorably with the cost of alternative programs such as generation of industrial employment or urban housing and stimulates productive development, thus providing benefits that are higher than those that would be generated by a perpetual income support in the size of the grant that is provided to land reform beneficiaries. The macro-economic reforms undertaken by Brazil, including the cut of agricultural credit subsidies and an increase in the taxation of unproductive land, imply that land is available at relatively low prices from owners and banks who hold land as collateral on defaulted farm debt. Land ownership has been shown to enable beneficiaries to make investments in perennials which would have been unthinkable of before, by enabling them to gain ownership of land rather than having to subsist as share croppers or wage workers. From the point of view of productivity, farm models point towards the potential to increase beneficiary income by up to five-fold within a 5-year period through investment and intensification. In addition to increasing beneficiaries’ ability to generate sustainable economic revenues and self-insure in terms of crisis, the program has positive impacts that go beyond the sphere of economics, by improving beneficiaries’ sense of dignity, their social skills, and their participation in local government structures. 4. Second, by putting beneficiaries in the drivers seat, the community-based program has been able to increase land access at a total cost that is about two thirds of the

Annex C (continued) 52
traditional program. This means that, with any given amount of resources, it will be possible to attend to a higher number of beneficiaries than would have been possible otherwise. An independent evaluation of projects implemented in 1998 and early 1999 which is currently followed up by a more in-depth study, highlights a number of important factors. (a) The project has created an agile and effective mechanism of settling landless rural families as illustrated by the huge demand and the fact that the process of land acquisition, from identification to purchase takes normally less than 90 days. (b) Self-selection of beneficiaries is working well and thus an effective way of targeting the poor. About one third of beneficiaries were illiterate, the leakage to non-poor beneficiaries is minimal and practically all of them have previous farming experience. (c) The projects established under the pilot are significantly smaller than under the traditional program, with a size between 10 and 35 families having emerged as the optimal group size both in order to facilitate effective management of the community association and at the same time to be able to be of sufficient size to be able to undertake fixed investments, e.g. in rural electrification or purchases of a tractor. (d) Land quality is generally adequate and land prices under the pilot project compare very favorably to those under the traditional program, being about 22 percent lower in per hectare terms and 28 percent lower per family. Finally, regarding project implementation, state organizations still play an important role in helping beneficiaries in the identification of adequate land and the negotiation of purchase opportunities but this role is expected to be reduced gradually, to be replaced by transfer of information from projects that have already been completed and new entrants. Project implementation through community associations has been highly successful and highly participatory. The challenge of providing critical inputs to the associations in terms of training while at the same time supporting their autonomy has been addressed by developing specific training programs, and by working closely with civil society organizations. 5. Lessons learned: First, the project clearly illustrates that a decentralized and demand-driven approach to land reform is feasible and can have high economic as well as social benefits. It suggests that, this potential can be realized by empowering beneficiaries and helping them to draw in assistance from different sources. Second, the project is more likely to achieve its goals where it can draw on support from civil society at the local level. It is for this reason that support and participation by social movements and NGOs is critical to ensure the productive development of beneficiaries, and to help them gain the skills and experience needed to transform a one-time asset transfer into a sustainable improvement in living conditions. Finally, the project illustrates the need for continuing evaluation and discussion, together with civil society, to adapt the concept to conditions on the ground to learn from past mistakes, and to ensure that scarce resources are used in a way that maximizes the impact for the poor. To maximize this potential, the Government is engaged in an ongoing evaluation, and has created mechanisms to foster public debate on the issue. A recently approved land-based poverty alleviation program for Brazil includes full participation by one of the most important Brazilian NGOs dealing with rural development. In view of the importance of beneficiaries receiving support by NGOs and civil society at the local level, the project is actively encouraging participation by other NGOs as well. Source: Klaus Deininger, World Bank.

Annex D 53
User Charges in Health and the Bank’s Role
1. Zimbabwe has had user charges in health care since well before independence. Through out the 1980s, the Bank supported the ministry’s policy of free or subsidized services for family planning, and preventive care. For other conditions notably, basic curative services, the Bank argued in favor of a small user charge for everyone.
2. By the late 1980s, with budget deficits continuing to mount, Government became concerned that it would be unable to meet the recurrent cost obligations and under major new investments. Accordingly, it invited the Bank to collaborate in producing a sector report on options for financing the health sector. The report recommended an increase in revenue from user charges but stressed the importance of maintaining an administratively worktable system for protecting the poor. Following the sector work, the Government commissioned consultants in 1990 to work with the Bank on a more detailed review of cost recovery options. The report published in 1992 as a World Bank Working Paper suggested that the Ministry of Health (MOH) issue a concise, accessible and clear schedule to reduce administrative confusion. In view of inflation, it also advocated an increase in exemption system threshold to cover all poor and a 75 percent increase in fees. It also advocated that most preventive care be provided free and proposed a modest flat fee to be charged to everyone for routine curative outpatient care.
3. The Government’s Framework for Economic Reform in 1991 stated that cost recovery in health and education will be implemented. A development policy letter for SAL I (FY92), stated that in education, the Government will introduce fees at primary schools, but parents who could not afford to pay will be paid from the SDF. In the health sector, the threshold of Z$150 per month would be revised upwards and the MOH will continue to identify and exempt patients unable to pay charges. Increased cost recovery in education and health by a combined amount equivalent to 0.5 percent of GDP was a monitorable action to be supported by SAL I but not a condition for tranche release. In face of the serious health consequences of the drought in 1992 MOH decided in early 1993 that government rural health clinics would suspend fees. But later in 1993 it prepared for Cabinet consideration the first new fee schedule since independence. The Bank was advised that a new schedule was being prepared but was not consulted in its development. The Bank also did not formally present its views on cost recovery to the Government. The new schedule took effect in January 1994; fees at primary facilities rose considerably, and the burden of proof of income fell on the patient and required paper documentation.


Annex E 55
Guide to OED’s Country Evaluation Rating Methodology
1. This methodological note describes the key elements of OED’s country assistance evaluation (CAE) methodology.1 CAEs rate the outcomes of Bank assistance programs, not Clients’ overall development progress 2. An assistance program needs to be assessed on how well it met its particular objectives, which are typically a sub-set of the Client’s development objectives. If an assistance program is large in relation to the Client’s total development effort, the program outcome will be similar to the Client’s overall development progress. However, most Bank assistance programs provide only a fraction of the total resources devoted to a Client’s development by donors, stakeholders, and the government itself. In CAEs, OED rates only the outcome of the Bank’s program, not the Client’s overall development outcome, although the latter is clearly relevant for judging the program’s outcome. 3. The experience gained in CAEs confirms that program outcomes sometimes diverge significantly from the Client’s overall development progress. CAEs have identified assistance programs which had:
• satisfactory outcomes matched by good Client development; • unsatisfactory outcomes in Clients which achieved good overall development
results, notwithstanding the weak Bank program; and, • satisfactory outcomes in Clients which did not achieve satisfactory overall results
during the period of program implementation. Assessments of assistance program outcome and Bank performance are not the same 4. By the same token, an unsatisfactory assistance program outcome does not always mean that Bank performance was also unsatisfactory, and vice-versa. This becomes clearer once we consider that the Bank's contribution to the outcome of its assistance program is only part of the story. The assistance program’s outcome is determined by the joint impact of four agents: (a) the Client; (b) the Bank; (c) partners and other stakeholders; and (d) exogenous forces (e.g., events of nature, international economic shocks, etc.). Under the right circumstances, a negative contribution from any one agent might overwhelm the positive contributions from the other three, and lead to an unsatisfactory outcome. 5. OED measures Bank performance primarily on the basis of contributory actions the Bank directly controlled. Judgments regarding Bank performance typically consider the relevance and implementation of the strategy, the design and supervision of the Bank’s lending interventions, the scope, quality and follow-up of diagnostic work and 1 In this note, assistance program refers to products and services generated in support of the economic development of a Client country over a specified period of time, and client refers to the country that receives the benefits of that program.

Annex E (continued) 56
other AAA, the consistency of Bank’s lending with its non-lending work and with its safeguard policies, and the Bank’s partnership activities. Evaluation in Three Dimensions 6. As a check upon the inherent subjectivity of ratings, OED examines a number of elements that contribute to assistance program outcomes. The consistency of ratings is further tested by examining the country assistance program across three dimensions:
(a) a Products and Services Dimension, involving a “bottom-up” analysis of major program inputs—loans, AAA, and aid coordination;
(b) a Development Impact Dimension, involving a “top-down” analysis of the
principal program objectives for relevance, efficacy, outcome, sustainability, and institutional impact; and,
(c) an Attribution Dimension, in which the evaluator assigns responsibility for the
program outcome to the four categories of actors (see paragraph 4. above). Rating Assistance Program Outcome 7. In rating the outcome (expected development impact) of an assistance program, OED gauges the extent to which major strategic objectives were relevant and achieved, without any shortcomings. Programs typically express their goals in terms of higher-order objectives, such as poverty reduction. The country assistance strategy (CAS) may also establish intermediate goals, such as improved targeting of social services or promotion of integrated rural development, and specify how they are expected to contribute toward achieving the higher-order objective. OED’s task is then to validate whether the intermediate objectives produced satisfactory net benefits, and whether the results chain specified in the CAS was valid. Where causal linkages were not fully specified in the CAS, it is the evaluator’s task to reconstruct this causal chain from the available evidence, and assess relevance, efficacy, and outcome with reference to the intermediate and higher-order objectives. 8. Evaluators also assess the degree of Client ownership of international development priorities, such as the Millennium Development Goals, and Bank corporate advocacy priorities, such as safeguards. Ideally, any differences on dealing with these issues would be identified and resolved by the CAS, enabling the evaluator to focus on whether the trade-offs adopted were appropriate. However, in other instances, the strategy may be found to have glossed over certain conflicts, or avoided addressing key Client development constraints. In either case, the consequences could include a diminution of program relevance, a loss of Client ownership, and/or unwelcome side-effects, such as safeguard violations, all of which must be taken into account in judging program outcome.
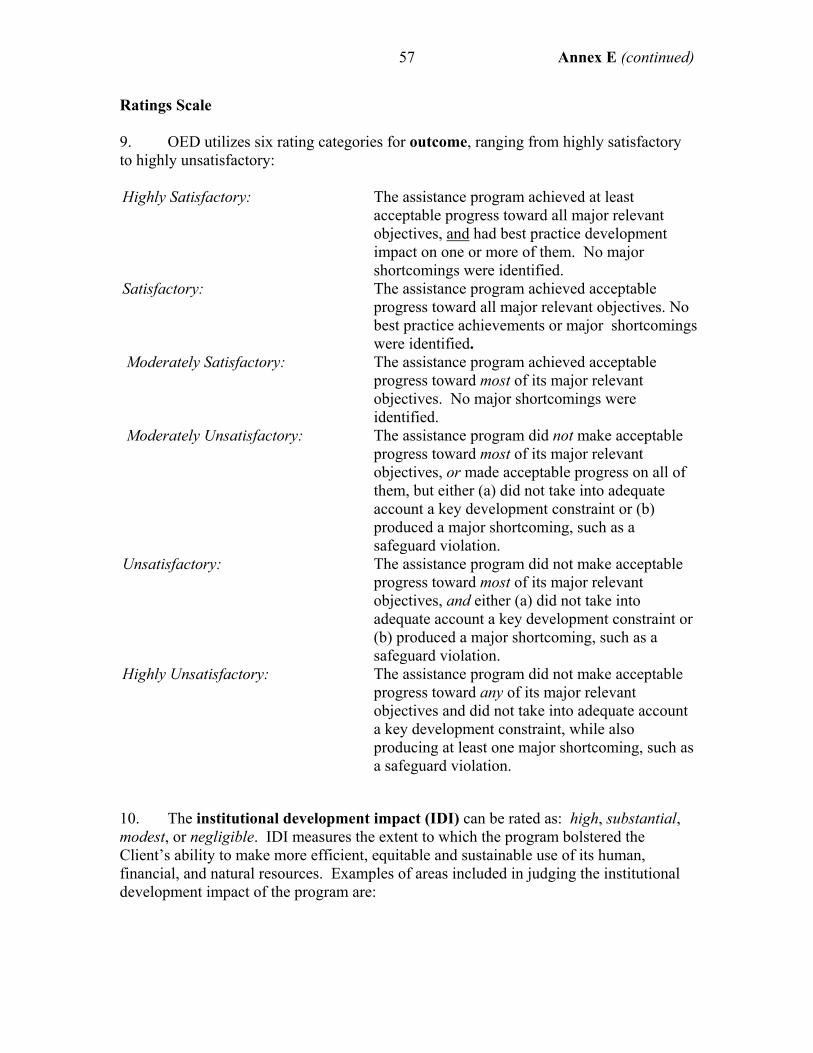
Annex E (continued) 57
Ratings Scale 9. OED utilizes six rating categories for outcome, ranging from highly satisfactory to highly unsatisfactory: Highly Satisfactory: The assistance program achieved at least
acceptable progress toward all major relevant objectives, and had best practice development impact on one or more of them. No major shortcomings were identified.
Satisfactory: The assistance program achieved acceptable progress toward all major relevant objectives. No best practice achievements or major shortcomings were identified.
Moderately Satisfactory: The assistance program achieved acceptable progress toward most of its major relevant objectives. No major shortcomings were identified.
Moderately Unsatisfactory: The assistance program did not make acceptable progress toward most of its major relevant objectives, or made acceptable progress on all of them, but either (a) did not take into adequate account a key development constraint or (b) produced a major shortcoming, such as a safeguard violation.
Unsatisfactory: The assistance program did not make acceptable progress toward most of its major relevant objectives, and either (a) did not take into adequate account a key development constraint or (b) produced a major shortcoming, such as a safeguard violation.
Highly Unsatisfactory: The assistance program did not make acceptable progress toward any of its major relevant objectives and did not take into adequate account a key development constraint, while also producing at least one major shortcoming, such as a safeguard violation.
10. The institutional development impact (IDI) can be rated as: high, substantial, modest, or negligible. IDI measures the extent to which the program bolstered the Client’s ability to make more efficient, equitable and sustainable use of its human, financial, and natural resources. Examples of areas included in judging the institutional development impact of the program are:
Annex E (continued) 58
• the soundness of economic management; • the structure of the public sector, and, in particular, the civil service; • the institutional soundness of the financial sector; • the soundness of legal, regulatory, and judicial systems; • the extent of monitoring and evaluation systems; • the effectiveness of aid coordination; • the degree of financial accountability; • the extent of building NGO capacity; and, • the level of social and environmental capital.
11. Sustainability can be rated as highly likely, likely, unlikely, highly unlikely, or, if available information is insufficient, non-evaluable. Sustainability measures the resilience to risk of the development benefits of the country assistance program over time, taking into account eight factors:
• technical resilience; • financial resilience (including policies on cost recovery); • economic resilience; • social support (including conditions subject to safeguard policies); • environmental resilience; • ownership by governments and other key stakeholders; • institutional support (including a supportive legal/regulatory framework, and
organizational and management effectiveness); and, • resilience to exogenous effects, such as international economic shocks or
changes in the political and security environments.

Attachment A 59
Zimbabwe Country Assistance Evaluation
MANAGEMENT ACTION RECORD
Recommendations Management Response
(i) The Bank should focus on AAA to build the Bank’s knowledge base in key reform areas: (i) an assessment of poverty and inequality, and the impact of economic policies on these issues; (ii) an analysis of the political economy factors which have impeded reforms (e.g., parastatal reform) in the past; (iii) learning from pilots on land reform launched in other countries; and (iv) a public expenditure review focused on fiscal sustainability and the required rationalization and reallocation of public expenditures.
(ii) A resumption of normal Bank lending should be conditional on: credible and upfront measures to achieve macroeconomic stability, fundamental governance reforms, a pro-poor reallocation of expenditures, parastatal reforms, and the formulation and credible initial steps in the implementation of an action plan on land issues.
Overall, the OED recommendations on focus of Bank’s activities and on conditions for resumption of lending are in line with the Interim Strategy for Zimbabwe that was reviewed by ROC on June 27,, 2002. Currently, the scope of the Bank’s activities in Zimbabwe is limited due to the country’s non-accrual status, poor macroeconomic and land policies, weak governance, and a marked deterioration of law and order. Zimbabwe is a LICUS country, in which, our overall strategy is to maintain dialogue with the Government on macroeconomic policies, generate and disseminate knowledge, suggest ways to improve provision of services in social sectors and for HIV/AIDS, catalyze change by informal dialogue in key policy areas, and to prepare for re-engagement when certain requirements are met. More specifically, our ongoing assistance includes: Knowledge generation and dissemination. We will prepare “Watching Briefs” to primarily inform ourselves, management, and share with others (out-reach) analysis of macroeconomic and structural policies, the socio/political situation including rule of law, agriculture, food security and land reform, poverty, and social services. We will also finalize and disseminate the analytical/TA work such as Public Enterprise Sector Report and the Social Sector Expenditure Review. Service delivery. We will continue to make contributions in three areas: (a) In social sectors, we will use the Social Sector Expenditure Review to assess alternative (public and non-governmental) service delivery mechanisms with a view to provide advice as well as to position ourselves for

Attachment A (continued) 60
Recommendations Management Response
possible future support (e.g. an emergency operation when the situation in the country begins to turn for the better); (b) Regarding HIV/AIDS, provide TA on financial management and M&E to National AIDS Council (NAC), explore possible areas of collaboration with non-governmental organizations, and try to mobilize non-IDA grant resources to support NAC and other players; and (c) In agriculture and food security, work with other partners for short-term response to food crisis and remain engaged on other agricultural policy issues. Catalyzing change proactively. We will continue: (a) informal dialogue on macroeconomic policies, (b) policy discussions on land issues within and outside government, and (c) coordinating government/donor relations to provide assistance towards a “meeting of the minds.”
Attachment B 61
CHAIRMAN’S SUMMARY: COMMITTEE ON DEVELOPMENT EFFECTIVENESS
Informal Subcommittee’s Report on Zimbabwe Country Assistance Evaluation
(Meeting of March 8, 2004)
1. The Informal Subcommittee (SC) of the Committee on Development Effectiveness (CODE) met on March 8, 2004 to discuss the Zimbabwe Country Assistance Evaluation prepared by the Operations Evaluation Department (OED).
2. OED Evaluation Findings. The evaluation finds that the outcome of Bank assistance during the past two decades has been unsatisfactory. Lessons from the Zimbabwe experience include: the Bank should have undertaken a public expenditure review (PER) prior to 1995; it should have been more forceful in ensuring that credible steps to ensure fiscal sustainability were incorporated in adjustment lending; it should have formed a judgment about the macro-economic fiscal targets and the likelihood of their implementation; it should have undertaken in-depth analytical work on poverty and more proactively addressed land reform before 1998; it should not have relied on commitments with technocrats in the absence of political consensus for reforms; and in the absence of ownership from the political leadership the Bank should have insisted that conditions be fulfilled before lending. The government has been in arrears to the Bank since May 2000. At the present juncture, the Bank should focus AAA in four areas: an assessment of poverty and inequality and the impact of economic policies on these issues; an analysis of the political economy factors that have impeded reforms in the past; learning from pilots on land reform launched in other countries; and a PER focused on fiscal sustainability and the required rationalization and reallocation of public expenditures. Resumption of normal Bank lending should be conditioned on credible measures to achieve macroeconomic stability, fundamental governance reforms, a pro-poor allocation of expenditures, parastatal reforms and the formulation of credible initial steps in the implementation of an action plan on land issues.
3. Comments from Management. Management agreed with the analysis in the CAE, and said it was fair and balanced. While it agreed that land reform and HIV/AIDS interventions could have started earlier, management said it was not factually true that no substantive analytical work on poverty had been completed and that the Bank had given insufficient attention to social safety nets. The Bank had supported a wide range of analytical work in these areas in 1995/96, mostly through trust funds. Management said that there had been no LICUS strategy at that time, and no markers for what to do in a country in rapid decline and political turmoil. The report did not adequately reflect the unusual relationship between the Government and aid partners, or identify what the Bank could have done differently to keep the dialogue alive while not lending to the country. Management added that some of the CAE’s recommendations were already being applied in the context of a LICUS strategy being prepared. There was a focus on HIV/AIDS and land reform issues, agrarian sector reform, and agricultural production. Analytical work was being done in the area of macroeconomics and debt sustainability, coping mechanisms and social safety nets. Regarding poverty work, OED responded that analytical work in this area was recognized in the evaluation but that attention to poverty and social protection was weak during the adjustment period, 1991-96, and no comprehensive poverty analysis had been completed.
4. Main Conclusions and Next Steps. Members welcomed the hard hitting OED evaluation and broadly endorsed its findings and recommendations. They noted that Zimbabwe had been a difficult country, with a complex environment. The Subcommittee supported the proposal for the Bank to stay engaged in the country and maintain a dialogue with the
Attachment B (continued) 62
Government, in preparation for stronger reengagement when conditions permitted. One member said the evaluation did not analyze all factors that had played a role in the decline in sufficient depth. For instance, the external shocks that Zimbabwe had endured during the 1990s should have been taken into consideration in analyzing the fiscal situation.
5. The Chair representing Zimbabwe agreed with the broad findings of the evaluation. He said the Bank could have been more cognizant of events on the ground in Zimbabwe. The strategy devised by the Bank was not well tailored to country conditions. The problem of land distribution had been known to the international community for many years before it exploded in 2000. The Bank had been somewhat inflexible in its approach and had not offered pragmatic solutions, given the political reality. The speaker said that proper sequencing of macroeconomic reforms was essential. It would have led to greater ownership of reforms and realism in the strategy. The recommendation that future Bank lending should be conditioned on credible and upfront measures, including in politically sensitive areas, was too strong. He said the cost of a stopgap approach, particularly after a long period of disengagement, would be too high, and he encouraged the Bank to remain engaged in the country.
The main points of the Subcommittee’s discussion are summarized below:
6. Political Ownership is Key. Subcommittee members noted that the recommendation in para 3 states the Bank should not have relied so much on the commitments of technocrats in the absence of political dialogue and consensus for reforms. While stressing the critical importance of political ownership, some members said there was nothing wrong in reaching informal decisions with technocrats, who could not in any case take major decisions without the approval of the political authorities. One of them said that political consensus could not be assured in all cases. He therefore suggested either deleting or modifying this recommendation. Another member said a broad ownership of the reform process was important. Other speakers said that political ownership was a prerequisite for successful Bank assistance, and even in failed states the Bank should act under a framework agreed upon with the authorities in power. While there was no harm in exchanging views with technocrats, taking commitments from officials with no decision-making power should be avoided. The DGO said the thrust of the recommendation was not that Bank staff should not negotiate agreements with technocrats but that both technocratic support and political ownership were necessary for a successful program.
7. The Importance of Land Reform. One member stressed the importance of land reform and said the Zimbabwe case should be an opportunity for the Bank to focus on the land issue as a powerful tool for enhancing pro-poor and equitable economic reform. The speaker said the Bank, as an international institution with a strong convening power, had a comparative advantage in promoting peaceful and well-planned land reforms. He urged it to focus its LICUS activities in Zimbabwe on building its own knowledge and capacity on land reform issues. Management said that the Bank was placing a lot more emphasis on land reform issues. It had expanded its technical capacity in this area, and was taking the lessons of the Zimbabwe experience very seriously.
8. Counterfactual. Some members said the report raised the issue of whether it would have made a difference in Zimbabwe if the Bank had changed its strategy, given the lack of political ownership in the country. They noted management’s view that it was unclear what it could have done differently in the absence of lending and a LICUS initiative. A member said the Bank could have been more involved in learning how the government operated, understanding the political context and gaining country knowledge. Lending under the circumstances that existed may have given the wrong signal. Another member asked for management’s assessment of whether a LICUS type of initiative, with a particular focus on staffing and motivational rewards for Bank teams to stay engaged in a very difficult environment, could have yielded better results.

Attachment B (continued) 63
A member said that management’s response to the evaluation’s statement that there was no basis for releasing the second tranche of SAC II in December 1997 should be recorded in the report. One speaker said that with the Bank’s experience and knowledge, it should not have taken it 10 years to know what to do in difficult environments. A credible track record of prior actions should have been a precondition for continued lending in the absence of genuine ownership and commitment to reform. Until there were fundamental policy reforms and a resolution of the political crisis, he said, it was difficult to see a useful role for the Bank in Zimbabwe. 9. OED responded that there were clear instances where a different Bank response would likely have had a positive impact on the program: had a PER been completed earlier, issues in the sequencing of reforms would have been clearer and the Bank would have recognized that financial sector and tax reform needed to be undertaken after a rationalization of expenditures to ensure fiscal stability (this finding is also consistent with an IMF evaluation of the ESAF program); and, work on land reform issues to inform the government about best practices elsewhere, as was done in South Africa and Brazil, may have been beneficial in initiating a sustainable process.
Jinkang Wu Acting Chairperson, CODE Subcommittee
