zimbabwe -...
TRANSCRIPT
Zimbabwe
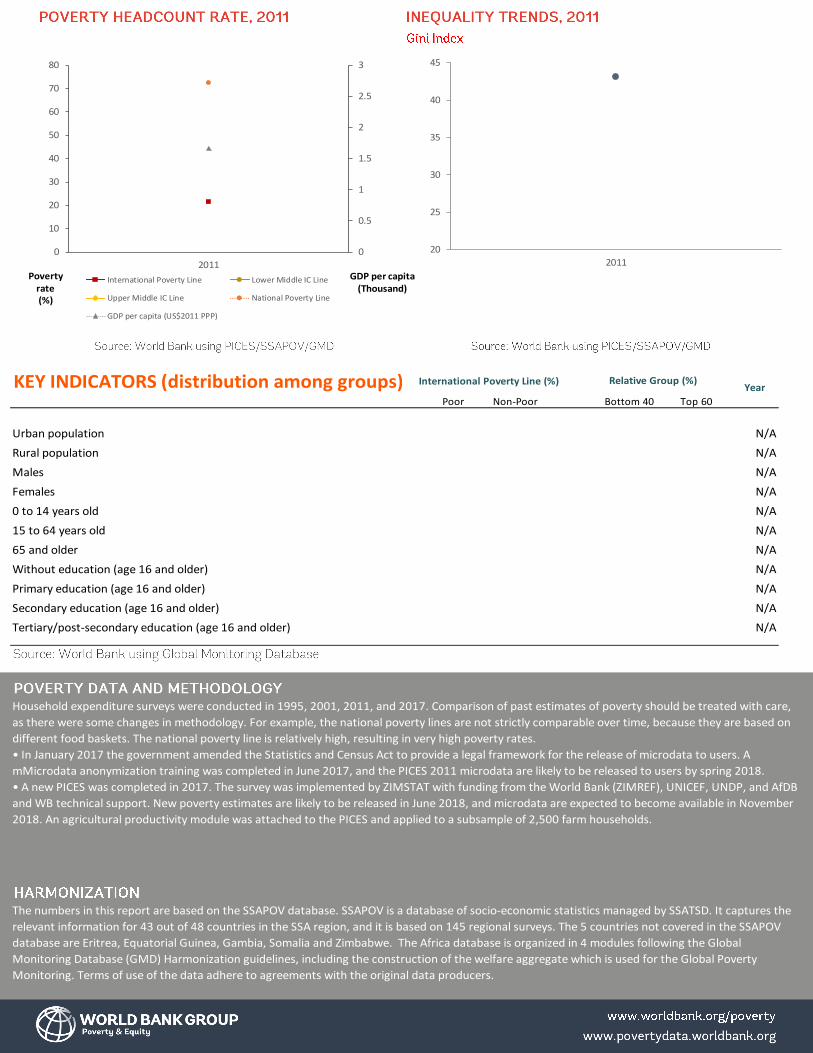
KEY INDICATORS (distribution among groups) International Poverty Line (%)Year
Poor Non-Poor Bottom 40 Top 60
Urban population N/A
Rural population N/A
Males N/A
Females N/A
0 to 14 years old N/A
15 to 64 years old N/A
65 and older N/A
Without education (age 16 and older) N/A
Primary education (age 16 and older) N/A
Secondary education (age 16 and older) N/A
Tertiary/post-secondary education (age 16 and older) N/A
The numbers in this report are based on the SSAPOV database. SSAPOV is a database of socio-economic statistics managed by SSATSD. It captures the
relevant information for 43 out of 48 countries in the SSA region, and it is based on 145 regional surveys. The 5 countries not covered in the SSAPOV
database are Eritrea, Equatorial Guinea, Gambia, Somalia and Zimbabwe. The Africa database is organized in 4 modules following the Global
Monitoring Database (GMD) Harmonization guidelines, including the construction of the welfare aggregate which is used for the Global Poverty
Monitoring. Terms of use of the data adhere to agreements with the original data producers.
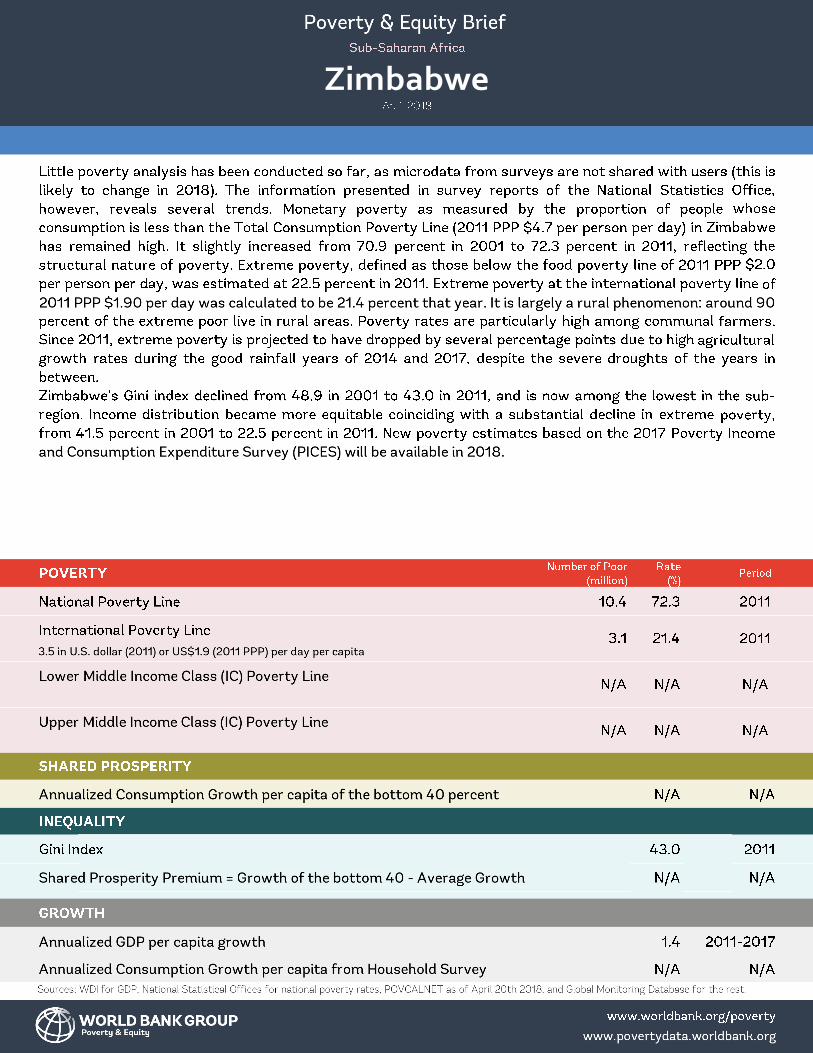
Household expenditure surveys were conducted in 1995, 2001, 2011, and 2017. Comparison of past estimates of poverty should be treated with care,
as there were some changes in methodology. For example, the national poverty lines are not strictly comparable over time, because they are based on
different food baskets. The national poverty line is relatively high, resulting in very high poverty rates.
• In January 2017 the government amended the Statistics and Census Act to provide a legal framework for the release of microdata to users. A
mMicrodata anonymization training was completed in June 2017, and the PICES 2011 microdata are likely to be released to users by spring 2018.
• A new PICES was completed in 2017. The survey was implemented by ZIMSTAT with funding from the World Bank (ZIMREF), UNICEF, UNDP, and AfDB
and WB technical support. New poverty estimates are likely to be released in June 2018, and microdata are expected to become available in November
2018. An agricultural productivity module was attached to the PICES and applied to a subsample of 2,500 farm households.
Relative Group (%)
Poverty rate (%)
GDP per capita (Thousand)
20
25
30
35
40
45
20110
0.5
1
1.5
2
2.5
3
0
10
20
30
40
50
60
70
80
2011
International Poverty Line Lower Middle IC Line
Upper Middle IC Line National Poverty Line
GDP per capita (US$2011 PPP)