zinc oxide nanoparticles-based reduced...
TRANSCRIPT

ZINC OXIDE NANOPARTICLES-BASED REDUCED GRAPHENE OXIDE COMPOSITES FOR
PHOTOCATALYTIC AND PHOTOVOLTAIC APPLICATIONS
MAJID AZARANG
FACULTY OF SCIENCE
UNIVERSITY OF MALAYA KUALA LUMPUR
2017

ZINC OXIDE NANOPARTICLES-BASED REDUCED
GRAPHENE OXIDE COMPOSITES FOR
PHOTOCATALYTIC AND PHOTOVOLTAIC
APPLICATIONS
MAJID AZARANG
THESIS SUBMITTED IN FULFILMENT OF THE
REQUIREMENTS FOR THE DEGREE OF DOCTOR OF
PHILOSOPHY
FACULTY OF SCIENCE
UNIVERSITY OF MALAYA
KUALA LUMPUR
2017

ii
UNIVERSITY OF MALAYA
ORIGINAL LITERARY WORK DECLARATION
Name of Candidate: MAJID AZARANG (I.C/Passport No: )
Registration/Matric No: SHC110064
Name of Degree: DOCTOR OF PHILOSOPHY
Title of Thesis: (“Zinc Oxide Nanoparticles Based-Reduced Graphene Oxide
Composites for Photocatalytic and Photovoltaic Applications”):
Field of Study: EXPERIMENTAL PHYSICS
I do solemnly and sincerely declare that:
(1) I am the sole author/writer of this Work;
(2) This Work is original;
(3) Any use of any work in which copyright exists was done by way of fair
dealing and for permitted purposes and any excerpt or extract from, or
reference to or reproduction of any copyright work has been disclosed
expressly and sufficiently and the title of the Work and its authorship have
been acknowledged in this Work;
(4) I do not have any actual knowledge nor do I ought reasonably to know that
the making of this work constitutes an infringement of any copyright work;
(5) I hereby assign all and every rights in the copyright to this Work to the
University of Malaya (“UM”), who henceforth shall be owner of the
copyright in this Work and that any reproduction or use in any form or by any
means whatsoever is prohibited without the written consent of UM having
been first had and obtained;
(6) I am fully aware that if in the course of making this Work I have infringed
any copyright whether intentionally or otherwise, I may be subject to legal
action or any other action as may be determined by UM.
Candidate’s Signature Date:
Subscribed and solemnly declared before,
Witness’s Signature Date:
Name:
Designation:

iii
ABSTRACT
Zinc oxide nanoparticles and reduced graphen oxide (rGO) composites were
synthesized using the sol-gel method in a starch environment. Different concentrations
effects of graphene oxide (GO) on the structure and optical properties of ZnO
nanoparticles (NPs) were investigated. X-ray diffraction patterns (XRD) and Fourier
transform infrared spectroscopy (FTIR) indicated that the GO sheets were reduced and
changed to reduced graphene oxide (rGO) during the calcination of the composites at
350 °C. In addition, the XRD patterns of the NPs indicated a hexagonal (wurtzite)
structure for all the products. Field emission scanning electron and transmission electron
microscope (FESEM and TEM) images showed that the NPs were decorated and
dispersed on the rGO sheets very well. In addition, high resolution TEM, HRTEM
images revealed that the rGO concentration had an effect on the crystal growth process
for the ZnO NPs. Furthermore, these studies showed that the NPs could be grown with a
single crystal quality in an optimum rGO concentration. According to the XRD results
that were obtained from pure ZnO NPs, the calcinations temperature was decreased by
the rGO. Optical studies showed that the optical properties of the ZnO+rGO composite
were affected by the rGO concentration. Finally, the obtained ZnONPs+rGO composite
was used as photocatalyst to remove methylene blue (MB). Observations showed that
the efficiency of the photocatalyst activity of the ZnONPs was significantly increased
by GO. In addition, the ZnO+rGO composite was used to generate a photocurrent
device. Observations showed that the photocurrent intensity of the composite was
dramatically increased by increasing the rGO concentration, with an optimum rGO
concentration.

iv
ABSTRAK
Komposit nanopartikel oksida zink dan oksida graphene yang rendah ( rGO ) telah
disintesis menggunakan kaedah sol-gel dalam persekitaran kanji. Kesan kepekatan yang
berbeza oksida graphene (GO) pada struktur dan sifat-sifat optik nanopartikel ZnO
(NPS) telah disiasat. Spektroskopi penguraian sinar x (XRD) dan jelmaan Fourier
spektroskopi inframerah (FTIR) menunjukkan bahawa helaian GO telah direndahkan
dan ditukar kepada graphene oksida yang rendah (rGO) semasa proses mengapur bagi
komposit tersebut pada 350 °C. Di samping itu, pola XRD daripada NPs menunjukkan
strucktur heksagon (wurtzite) untuk semua produk. Imej-imej dari mikroskopi bidang
pelepasan imbasan elektron dan mikroskopi penghantaran elektron (FESEM dan TEM)
menunjukkan bahawa NPs telah dibentuk dan tersebar dalam helaian rGO dengan baik.
Selain resolusi tinggi TEM, imej HRTEM mendedahkan bahawa kepekatan rGO itu
mempunyai kesan ke atas proses pertumbuhan kristal untuk NPs ZnO. Tambahan pula,
kajian ini menunjukkan bahawa NPs boleh ditumbuhkan dengan kualiti kristal tunggal
dalam rGO kepekatan optimum. Menurut keputusan XRD yang telah diperolehi dari
ZnO NPs yang tulen, suhu pengkalsinan telah diturunkan oleh rGO. Kajian optik
menunjukkan bahawa sifat-sifat optik komposit ZnO + rGO terjejas oleh kepekatan rGO
itu. Akhir sekali, ZnONPs + rGO komposit yang diperolehi telah digunakan sebagai
fotokatalis untuk membuang metilena biru (MB). Pemerhatian menunjukkan bahawa
kecekapan aktiviti fotokatalis daripada ZnONPs telah meningkat dengan ketara oleh
GO. Di samping itu, komposit ZnO + rGO telah digunakan untuk menghasilkan peranti
arusfoto. Pemerhatian menunjukkan bahawa keamatan arusfoto bagi komposit tersebut
telah meningkat secara mendadak dengan peningkatan kepekatan rGO itu, dengan rGO
kepekatan optimum.

v
ACKNOWLEDGEMENTS
This thesis would not have been possible without the opportunity given to me by the
University of Malaya and the inspiration and constant support bestowed to me by the
following people:
First of all, I would like to express my gratitude to my supervisor Dr. Ahmad
Shuhaimi for their supervision, advice and guidance. I appreciate all their contributions
of time, ideas, and funding to make my Ph.D. program productive and exciting. I would
also like to thank Department of Physics for providing me support and facilities,
University of Malaya for PPP Grant (PG058-2012B), and Ministry of Higher Education
of Malaysia for High Impact Research Grant (UM.C/625/1/HIR/MOHE/SC/06).
I want to thank Prof. Wan Jeffrey Basirun and Dr. Mehran Sookhakian for allowing
me to use their lab in Department of Chemistry and for their valuable discussions.
I would like to thank my best friend (Dr. Ramin Yousefi), who had suggested and
helped me to enroll my study in University of Malaya, and also my good friends Dr.
Amir Mordi Golsheikh, Dr. Siamak Pilban, Dr. Ahmad Kamalianfar, for their kind
supports.
Finally, I would like to thank all of my family for their support, especially my
parents. Words fail me to express my appreciation to my wife, whose love and
encouragement allowed me to finish this journey.

vi
TABLE OF CONTENTS
Abstract ............................................................................................................................ iii
Abstrak ............................................................................................................................. iv
Acknowledgements ........................................................................................................... v
Table of Contents ............................................................................................................. vi
List of Figures ................................................................................................................... x
List of Tables.................................................................................................................. xiv
List of Symbols and Abbreviations ................................................................................. xv
CHAPTER 1: INTRODUCTION .................................................................................. 1
1.1 Background of study ................................................................................................ 1
1.2 Aim and objectives .................................................................................................. 5
1.3 Thesis structure ........................................................................................................ 6
CHAPTER 2: REVIEW OF RELATED LITERATURE ........................................... 8
2.1 Introduction.............................................................................................................. 8
2.2 Synthesis of Graphene Oxide-based Material Nanocomposite ............................. 11
2.2.1 Hydrothermal Method .............................................................................. 11
2.2.2 Electrochemical Deposition ..................................................................... 13
2.2.3 In Situ Polymerization .............................................................................. 14
2.2.4 Sol-gel Technique ..................................................................................... 14
2.3 Application of Graphene Oxide-based Material Nanocomposite .......................... 15
2.3.1 Wastewater Treatment .............................................................................. 15
2.3.2 Photocatalysis ........................................................................................... 16
2.3.3 Adsorption ................................................................................................ 21
2.3.4 Electronic .................................................................................................. 25
vii
2.3.5 Supercapacitor .......................................................................................... 25
2.3.6 Lithium ion battery ................................................................................... 26
2.3.7 Self-cleaning ............................................................................................. 28
2.3.8 Sensor ....................................................................................................... 29
2.3.9 Catalyst ..................................................................................................... 32
2.3.10 Biomedical ................................................................................................ 33
2.4 Summary ................................................................................................................ 35
CHAPTER 3: DESIGN, METHODS AND PROCEDURE ...................................... 36
3.1 Chemical reagents .................................................................................................. 36
3.2 Materials ................................................................................................................ 36
3.3 Synthesis ................................................................................................................ 36
3.3.1 Preparation of exfoliated graphite GO ..................................................... 36
3.3.2 Preparation of ZnONPs+rGO composite by gelatin ................................. 37
3.3.3 Preparation of ZnONPs+rGO composite by starch .................................. 38
3.4 Applications ........................................................................................................... 41
3.4.1 Preparation of photocatalytic degradation samples .................................. 41
3.4.2 Device fabrication and photocurrent measurements ................................ 42
3.5 Characterization techniques and instrumentation .................................................. 43
3.5.1 X-ray diffraction (XRD) analysis ............................................................. 44
3.5.2 Fourier Transforms Infrared Spectroscopy (FTIR) .................................. 45
3.5.3 High resolution transmission electron microscope .................................. 47
3.5.4 Transmission Electron Microscopy (TEM) .............................................. 48
3.5.5 Field emission scanning electron microscopy (FESEM) ......................... 48
3.5.6 Ultraviolet-visible spectroscopy (UV-vis) ............................................... 49
3.5.7 Raman Spectroscopy ................................................................................ 50
3.5.8 Photoluminescence spectroscopy (PL) ..................................................... 50

viii
CHAPTER 4: CHAPTER IV: RESULTS AND DISCUSSIONS ............................. 52
4.1 Synthesis and characterization of ZnO NPs/reduced graphene oxide
nanocomposite prepared in gelatin medium as highly efficient photo-degradation
of MB… ................................................................................................................. 52
4.2 Effects of graphene oxide concentration on optical properties of ZnO/RGO
nanocomposites and their application to photocurrent generation ........................ 57
4.3 One-pot sol–gel synthesis of reduced graphene oxide uniformly decorated zinc
oxide nanoparticles in starch environment for highly efficient photodegradation of
Methylene Blue ...................................................................................................... 68
4.3.1 Crystalline structure ................................................................................. 68
4.3.2 Microstructure .......................................................................................... 69
4.3.3 Chemical Composition ............................................................................. 71
4.3.4 Optical properties ..................................................................................... 72
4.3.5 Photocatalytic measurements ................................................................... 75
4.3.5.1 MB Degradation ........................................................................ 75
4.3.5.2 Photodegradation Reaction Mechanisms .................................. 79
4.4 Crystalline quality assessment, photocurrent response and optical properties of
reduced graphene oxide uniformly decorated zinc oxide nanoparticles based on
graphene oxide concentration ................................................................................ 83
4.4.1 Microstructure .......................................................................................... 83
4.4.2 Crystalline structure ................................................................................. 88
4.4.3 Chemical Composition ............................................................................. 92
4.4.4 Optical properties ..................................................................................... 94
4.4.5 Studies of the photocurrent response ...................................................... 100
4.4.5.1 Transient photocurrent response of ZnONPs and ZnONPs+rGO
films… ..................................................................................... 100

ix
4.4.5.2 Mechanism .............................................................................. 102
CHAPTER 5: CONCLUSIONS................................................................................. 104
5.1 Synthesis and characterization of ZnO NPs/reduced graphene oxide
nanocomposite prepared in gelatin medium as highly efficient photo-degradation
of MB.. ................................................................................................................. 104
5.2 Effects of graphene oxide concentration on optical properties of ZnO/RGO
nanocomposites and their application to photocurrent generation ...................... 104
5.3 One-pot sol–gel synthesis of reduced graphene oxide uniformly decorated zinc
oxide nanoparticles in starch environment for highly efficient photodegradation of
Methylene Blue .................................................................................................... 105
5.4 Crystalline quality assessment, photocurrent response and optical properties of
reduced graphene oxide uniformly decorated zinc oxide nanoparticles based on
graphene oxide concentration .............................................................................. 105
References ..................................................................................................................... 107
List of Publications and Papers Presented .................................................................... 122

x
LIST OF FIGURES
Figure 1.1: Number of publications per year on graphene. The data was extracted on
December 29, 2015 through the Institute of Scientific Information (ISI) database using
graphene as a keyword that appeared in topic .................................................................. 1
Figure 3.1: Synthesis process of ZnO–NPs by gelatin .................................................... 37
Figure 3.2: Schematic illustration of the formation mechanism of a ZnONPs/rGO
composite via a sol-gel method with gelatin ................................................................... 38
Figure 3.3: Synthesis process of ZnO–NPs by starch ..................................................... 39
Figure 3.4 : Schematic illustration of the formation mechanism of a ZnONPs+rGO
composite via a sol-gel method with starch .................................................................... 41
Figure 3.5: Actual size, configuration and structure of the fabricate solar cell device of
ZnONPs and ZnONPs+rGO2 composites. (a, b) colloidal solution was dropped onto a
cleaned ITO surface (1×1 cm2) and then allowed to dry overnight at room temperature,
(c, d) Pt foil, Spacer and ITO@GLASS for both samples, (e, f) solar cell device of
ZnONPs and ZnONPs+rGO2 composites respectively .................................................. 43
Figure 3.6: Schematic of the diffraction of an X-ray beam by parallel atomic planes in
crystallite materials ......................................................................................................... 45
Figure 3.7: Schematic of the Fourier Transforms Infrared Spectroscopy (FTIR) .......... 46
Figure 3.8: Schematic of the high-resolution transmission electron microscope ........... 47
Figure 3.9: Schematic of the Field emission scanning electron microscopy (FESEM) . 49
Figure 4.1: (a) FESEM image of ZnO-NPs on the GO sheet. The inset shows ZnO
nanoparticles that were deposited on the GO. (b) TEM image of dispersed ZnO NPs on
the GO. The inset shows an HRTEM image of a single ZnO nanoparticle .................... 53
Figure 4.2: XRD patterns of the GO sheet and ZnO-NPs/GO composite ...................... 54
Figure 4.3: FTIR spectra of the GO sheet and ZnO-NPs/RGO composite ..................... 55
Figure 4.4: UV–vis absorption spectra of the GO sheet and ZnO-NPs/RGO composite 56
Figure 4.5: (a) The UV–vis absorbance of MB over time during photocatalytic
degradation under UV light irradiation using ZnO-NPs/RGO. (b) Photocatalytic
degradation of MB by ZnO NPs and ZnO-NPs/RGO under UV light irradiation .......... 57
Figure 4.6: XRD patterns of the GO, RGO sheets and ZnO/RGO nanocomposites with
different concentrations of the GO .................................................................................. 58

xi
Figure 4.7: FTIR spectra of the GO sheet, gelatin powder, and ZnO-NPs/RGO
composites ....................................................................................................................... 59
Figure 4.8: TEM image of the ZnO/RGO nanocomposites with (a) low RGO
concentration (ZnO-NPs/RGO1), (b) mid RGO concentration (ZnO-NPs/RGO2), and
(c) high RGO concentration (Zn ONPs/ RGO3). HRTEM image of the ZnO NPs that
were decorated on the RGO sheet with (a') low RGO concentration, (b') mid RGO
concentration, and (c') high RGO concentration ............................................................. 61
Figure 4.9: High magnification of TEM image of the ZnO/RGO2 nanocomposites...... 62
Figure 4.10: XRD patterns of the pure ZnO NPs that were grown by 400 and 500 ο C
temperature ...................................................................................................................... 63
Figure 4.11: TEM image of the pure ZnO NPs that were grown at (a) 400 ο C and (b)
500 ο C ............................................................................................................................. 63
Figure 4.12: (a) UV-vis spectra of the pure ZnO NPs, ZnO/RGO1, ZnO/RGO2, and
ZnO/RGO3 nanocomposites. (b) PL spectra of the pure ZnO NPs, ZnO/ RGO1,
ZnO/RGO2, and ZnO/RGO3 nanocomposites ............................................................... 65
Figure 4.13: Raman spectrum of the ZnO/RGO2 nanocomposites ................................ 66
Figure 4.14: Photocurrent response of the ZnO NPs and ZnO/RGO nanocomposites
with different concentrations of the RGO ....................................................................... 67
Figure 4.15: XRD patterns of the GO sheet, ZnO NPs, and ZnO NPs+rGO
nanocomposite................................................................................................................. 69
Figure 4.16: TEM images low-magnification; (a), (b) high-magnification; (c) - (e) and
(f) HRTEM images of ZnO NPs+rGO ............................................................................ 70
Figure 4.17: Size distribution diagrams of ZnO NPs+rGO by histogram curve ............. 71
Figure 4.18: FTIR spectra of the GO sheet, starch powder, ZnO NPs, and ZnO
NPs+rGO nanocomposites .............................................................................................. 72
Figure 4.19: Raman spectrum of the ZnO NPs+rGO nanocomposites ........................... 73
Figure 4.20: UV-vis spectra of the pure ZnO NPs and ZnO NPs+rGO nanocomposites
......................................................................................................................................... 74
Figure 4.21: The UV-vis absorbance of MB over time during photocatalytic degradation
under UV-vis light irradiation using ZnO NPs+rGO ...................................................... 75
Figure 4.22: Degradation rate of MB at different intervals with and without catalyst ... 77

xii
Figure 4.23: Kinetic study of photocatalytic MB degradation using ZnO NPs and ZnO
NPs + rGO ....................................................................................................................... 77
Figure 4.24: Photo-stability of ZnO NPs + rGO by investigating its photocatalytic
activity under UV light irradiation with five times of cycling uses ................................ 78
Figure 4.25: XRD pattern (a), FTIR spectra (b) of ZnO NPs + rGO after five cycles ... 79
Figure 4.26: The energy level diagram for ZnO NPs+rGO ............................................ 80
Figure 4.27: PL spectra of the pure ZnO NPs, ZnO NPs + rGO .................................... 82
Figure 4.28: TEM image of the ZnONPs+rGO composites with a (a) low rGO
concentration ZnONPs+rGO1, (b) mid rGO concentration ZnONPs+rGO2, and (c) high
rGO concentration ZnONPs+rGO3. The HRTEM image of the ZnONPs that were
decorated on the rGO sheet with a (d) low rGO concentration, (e) mid rGO
concentration, and (f) high rGO concentration ............................................................... 85
Figure 4.29: Size distribution diagrams of (a) ZnONPs+rGO1, (b) ZnONPs+rGO2, and
(c) ZnONPs+rGO3 composites by histogram curve ....................................................... 85
Figure 4.30: (a) FESEM image of pure ZnONPs in the absence of starch (sample M).
(b) FESEM image of pure ZnONPs in the presence of starch (sample K) ..................... 87
Figure 4.31: XRD patterns of graphite, GO and rGO sheets .......................................... 88
Figure 4.32: XRD patterns of the ZnONPs+rGO composites with low rGO
concentration (ZnONPs+rGO1), min rGO concentration (ZnONPs+rGO2), and high
rGO concentration (ZnONPs+rGO3) .............................................................................. 89
Figure 4.33: XRD patterns of the pure ZnONPs that were grown by 400 and 500 C
temperature sample N and sample P, respectively .......................................................... 91
Figure 4.34: TEM image of the pure ZnONPs that were grown at (a) 400 C and (b) 500
C .................................................................................................................................... 92
Figure 4.35: FTIR spectra of the GO sheet, starch powder, and ZnONPs+rGO1,
ZnONPs+rGO2, and ZnONPs+rGO3 composites .......................................................... 93
Figure 4.36: Raman spectrum of the GO and ZnONPs+rGO composites ...................... 95
Figure 4.37: UV-Vis spectra of the pure ZnONPs, ZnONPs+rGO1, ZnONPs+rGO2, and
ZnONPs+rGO3 composites ............................................................................................ 97
Figure 4.38: The band gap of the ZnONPs, ZnONPs+rGO1, ZnONPs+rGO2, and
ZnONPs+rGO3 composites estimated from first derivative ........................................... 98

xiii
Figure 4.39: PL spectra of the pure ZnONPs, ZnONPs+rGO1, ZnONPs+rGO2, and
ZnONPs+rGO3 composites ............................................................................................ 99
Figure 4.40: Schematic representation of the solar cell device ..................................... 100
Figure 4.41: Photocurrent versus time (i–t) curves of the solar cell device based on pure
ZnO and ZnONPs+rGO composite with different concentration ratios of GO (0.9, 1.7
and 3.3 wt.%/v) ............................................................................................................. 101
Figure 4.42: Schematic of the mechanism of the photocurrent generation ................... 103
Figure 5.1: The (a) NBE/DLE, (b) photocurrent, (c) crystallite size, and (d) FWHM
versus GO concentration as final conclusions .............................................................. 106

xiv
LIST OF TABLES
Table 2.1: The list of photocatalyst and material detection in previous study ................ 20
Table 2.2: List of adsorbent, material detection, and maximum adsorption capacity from
previous study ................................................................................................................. 24
Table 2.3: The specific capacitance and capacitance retention of different types of
nanocomposite in supercapacitor application ................................................................. 26
Table 2.4: The nanocomposite that assigned as supercapacitor in previous study ......... 28
Table 2.5: The type, material detection and detection limit of previous synthesized
sensor .............................................................................................................................. 31
Table 2.6: The previously synthesised catalyst and its catalytic activity ........................ 33
Table 3.1: Experimental conditions different for the preparation of ZnONPs and
ZnONPs+rGO ................................................................................................................. 40
Table 4.1: D and G peak positions and intensity ratios of I(D)/I(G) (obtained by Raman
analysis) of GO and ZnO NPs+rGO composites prepared Sol-gel method .................... 73
Table 4.2: Photocatalytic degradation percent of MB on samples ................................. 76
Table 4.3: Peak position and calculated the crystallite size of the pure ZnONPs and
ZnONPs+rGO composite with low rGO concentration ZnONPs+rGO1, mid rGO
concentration ZnONPs+rGO2, and high rGO concentration ZnONPs+rGO3 ............... 90
Table 4.4: D and G peak positions and intensity ratios of I(D)/I(G) (obtained by Raman
analysis) of GO and ZnONPs+rGO composites prepared sol-gel method by starch ...... 95
Table 4.5: Near band edge (NBE), deep level emission (DLE) ratio and photocurrent of
the pure ZnONPs and ZnONPs+rGO composite with low rGO concentration
ZnONPs+rGO1, mid rGO concentration ZnONPs+rGO2, and high rGO concentration
ZnONPs+rGO3 ............................................................................................................. 102

xv
LIST OF SYMBOLS AND ABBREVIATIONS
AFM : Atomic force microscopy
CVD : Chemical vapor deposition
CPE : Constance phase element
CE : Counter electrode
CV : Cyclic voltammetery
DSSCs : Dye-sensitized solar cells
DLE Deep Level Emission
EDLCs : Electrochemical double-layer capacitors
EIS : Electrochemical impedance spectroscopy
FESEM : Field emission scanning electron microscope
FTIR : Fourier transform infrared spectroscopy
GCE : Glassy carbon electrode
GO : Graphene oxide
HOPG : Highly oriented pyrolytic graphite
ITO : Indium tin oxide
MB : Methylene blue
NBE Near band edge
NPs : Nanoparticles
HOU Hydroxyuracil
PECVD plasma-enhanced chemical vapour deposition
PBS : Phosphate buffer solution
QDSSCs : Quantum dot-sensitized solar cells
rGO : Reduced graphene oxide
SCE : Saturated calomel electrode

xvi
SiC : Silicon carbide
SWNTs : Single-wall carbon nanotubes
STM : Scanning tunneling microscopy
SERS : Surface-enhanced Raman scattering
TAA : Thioacetamide
TEM : Transmission electron microscope
UV : Ultraviolet
WE : Working electrode
XRD : X-ray diffraction

1
CHAPTER 1: INTRODUCTION
1.1 Background of study
Graphene is a one-atom-thick planar sheet of sp2-bonded carbon atoms in form of a
honeycomb lattice. Graphene exhibits unique electrical (Usachov et al., 2011), thermal
(Shahil & Balandin, 2012), mechanical (Chang, Kim, Lee, & Song, 2010), and optical
properties (Zhou, Bao, Tang, Zhong, & Loh, 2009). These unique properties hold great
promise for potential applications in many advanced technologies such as
nanoelectronics (Freitag, 2008; Zhou et al., 2009), sensors (Cheng, Li, Li, Zhou, &
Fang, 2010; Fowler et al., 2009; Robinson, Perkins, Snow, Wei, & Sheehan, 2008),
capacitors (Wang et al., 2009; Yu et al., 2011; Zhu et al., 2011) and composites (Chang
& Chen, 2011; Ding et al., 2010). So, according to the published papers in web of
science, graphene has been extensively studied (Figure 1. 1).
Figure 1.1: Number of publications per year on graphene. The data was
extracted on December 29, 2015 through the Institute of Scientific Information
(ISI) database using graphene as a keyword that appeared in topic
Recently, carbon allotrope-based semiconductor composites have received great
attention in the field of solar cells, which is one of the prospective methods for

2
converting solar energy to electrical energy (Kongkanand, Dominguez, & Kamat,
2007). Reduced graphene oxide (rGO) is a new class of the carbon family, is tightly
packed into a two-dimensional honeycomb lattice, and possesses superior mobility of
charge carriers at room temperature (200,000 cm2 V
-1 S
-1), excellent transparency
(~97.7%) and a large surface area (~2600 m2/g) (Geim, 2009; Gómez-Navarro et al.,
2007). Although rGO possesses poor photoelectric properties, the formation of
semiconductor nanostructures can largely expand, improve, or alter the properties and
applications of the pristine rGO. However, rGO could prevent semiconductor
nanostructures from undergoing photo corrosion. A fast charge recombination rate in
semiconductor nanostructures and a fast charge transport rate between the
semiconductor and the conducting electrode are the major challenges in the
photoelectric devices, which could be solved by the incorporation of rGO (Bai & Shen,
2012). Modifying the conducting electrode by rGO leads to the improvement of the
conversion efficiency of solar cell devices because the high conductivity of rGO makes
it a great material to accept photoinduced charge carriers and to promote the electron
transfer rate of the semiconductor nanostructure conduction band to the conducting
electrode by trapping the photogenerated electrons. To date, a large number of inorganic
semiconductors, such as TiO2, ZnS, CdS, MnO2 and PbO, have been successfully
attached onto rGO surfaces to form unique hybrid materials for photoelectric devices
(Azarang, Shuhaimi, Yousefi, Moradi Golsheikh, & Sookhakian, 2014; Cao et al., 2012;
Cheng, Akhtar, Yang, & Stadler, 2013; Ji, Sun, & Han, 2014; Liu et al., 2011; Qu et al.,
2014).
ZnO is an important wide-band gap semiconductor that has a direct band gap (3.37
eV) with a high exciton binding energy (~60 meV), which is greater than the thermal
energy at room temperature. It is a promising material for ultraviolet Nano-

3
optoelectronic devices and lasers operating at room temperature (Park, Ma, & Kim,
1997; Yang et al., 2002). ZnO has also drawn great attention as a good electron acceptor
and conducting layer (Beek, Wienk, Kemerink, Yang, & Janssen, 2005). The graphene
and ZnO in a hybrid material can act in a cooperative way by increasing the migration
efficiency of photoinduced electrons and effectively reducing recombination (Li & Cao,
2011; Safa, Sarraf-Mamoory, & Azimirad, 2014). Therefore, various routes have been
used to synthesize ZnO@graphene composites such as plasma-enhanced chemical
vapour deposition (PECVD) (Zheng et al., 2009), metal–organic chemical vapour
deposition (MOCVD) (Lee, Pyun, Yi, Choung, & Park, 2009), solvothermal synthesis
(Wu, Shen, Jiang, Wang, & Chen, 2010), a sonication method (Vinodgopal et al., 2010),
and a microwave-assisted reaction method (Lv et al., 2011). In addition, several studies
have been reported about ZnO@graphene composites that have been used for
photovoltaic applications (Huang, Qi, Boey, & Zhang, 2012; Huang et al., 2011; Kamat,
2009). Most of these techniques are complex, expensive, and time consuming. Among
these different methods, the sol–gel method is simple, fast, and inexpensive. In addition,
it is very important to obtain a narrow size distribution for the final product and to be
able to control the morphology of the NPs. These objectives can be achieved by using a
suitable polymerization agent in the sol–gel process. Furthermore, zinc oxide is a
favourable candidate as a working electrode to substitute for other semiconductors in
solar cell devices due to the rapid generation of electron–hole pairs, highly negative
reduction potentials of the excited electrons and high electron mobility compared with
TiO2 and ZnS (Zhang, Yu, Jaroniec, & Gong, 2012). Modifying the chemical
composition of ZnO by loading organic conductive materials, particularly rGO, could
promote the advantages of ZnO in ZnONPs+rGO composites. However, the major
challenge is to synthesize ZnO nanostructures with high crystallinity and good
dispersity on the surface of rGO nanosheets. ZnO nanoparticles tend to aggregate onto

4
the surface of rGO during the formation process due to their high surface-to-volume
ratio, which results in a higher recombination rate of photoinduced charge carriers. To
overcome this challenge, many efforts have been focused on the utilization of
surfactants during the synthesis process. In most cases, high molecular weight polymers,
such as poly(acrylic acid) (PAA) or polyvinyl pyrrolidone (PVP), were added to avoid
ZnO agglomeration on the surface of the rGO (Li et al., 2010). However, these
surfactants induce the formation of toxic organic sulphur-containing compounds. To
date, various methods have been utilized for the synthesis of ZnONPs+rGO composites,
such as one-step and multi-step synthesis. The three main steps are the preparation of
ZnO nanostructures, the reduction process of graphene oxide (GO) to reduced graphene
oxide (rGO) and the decoration of the semiconductor nanostructure on to the rGO
surface with a narrower size distribution and good homogeneity and stability, which can
be described as ‘‘one-pot synthesis’’.
Building from these ideas, we report a facile synthesis method of a ZnONPs+rGO
composite via a sol-gel approach using zinc nitrate hexahydrate and GO as the starting
materials. In our strategy, using a suitable polymer agent, such as starch, can improve
the quality of the final product. Therefore, in this study, a simple sol–gel method was
used to synthesize ZnO nanoparticles with a narrow size distribution, which were
decorated on a reduced graphene oxide (rGO) sheet in a starch environment. Starch was
used as a polymerization agent and served as the terminator for the growth of the
ZnONPs because it expanded during the calcination process, which prevented the
particles from coming together easily. In addition, one of the merits of this method is
that the starch and the ZnO nanoparticle products are environmentally friendly. The
other merit is that starch reduces GO under mild conditions and simultaneously plays an
important role as a capping agent in stabilizing the as-prepared graphene. Most
importantly, starch alone can transform graphene oxide into the reduced graphene oxide

5
(Feng, Feng, & Du, 2013). Then, the photocurrent properties of the as-synthesized
ZnONPs+rGO composites under visible light irradiation were investigated to gain
insight into the effect of the concentration of rGO on the photocurrent properties of the
ZnO nanoparticles (ZnONPs). To the best of our knowledge, there have been no reports
on the one-pot sol-gel syntheses of reduced graphene oxide uniformly decorated with
zinc oxide nanoparticles in a starch environment, and this is the first demonstration of
the functionalization of a ZnONPs+rGO-modified indium tin oxide (ITO) electrode
surface with ZnO nanoparticles fabricated by starch, which is a suitable natural polymer
agent for solar cells. Here, we report for the first time a fast, one-step, cost-effective,
and environmentally friendly synthesis of rGO uniformly decorated with hierarchical
ZnONPs using a one-pot sol–gel method in gelatin and starch environment.
1.2 Aim and objectives
As mentioned, superior properties of graphene make it an attractive matrix for
composites. It is found that decoration of graphene sheets with nanoparticles not only
enhances the performance of graphene and nanoparticles, but also displays additional
novel properties resulting from the interaction between nanoparticles and graphene
sheets. Developing the method that is fast, low-cost, environmentally friendly and
nontoxic for preparing graphene-based composites is very important and challenging.
The morphology, size and distribution of nanoparticles on the surface of graphene affect
the performance of the composite, which are difficult to control. Compared to metal
oxides, few literatures have reported on the synthesis of metal oxide-graphene
nanocomposites such as ZnO and even there is no report on the synthesis in
environment gelatin and starch.
In order to achieve the mentioned objectives, we designed and carried out the
following researches:

6
1) To design and modify sol-gel techniques for preparing ZnO/rGO composite those
are suitable for industrial applications.
2) To identify suitable polymerization agent to control morphology and size of the
nanoparticles, this also can be used as industrial techniques to prepare these
nanostructures.
3) Optimization of the sol-gel conditions such as reaction temperature, reaction time, of
the solution and the amount of gelatin and starch for preparing ZnO nanoparticles.
4) Subsequently utilizing the optimum sol-gel conditions for preparation of
ZnO/graphene nanocomposites with different loading amount of graphene.
5) The resultant composites can be evaluated for potential application in energy
conversion by photocurrent measurement.
6) The resultant composite can be used for photocatalytic degradation of methylene blue
(MB) under ultraviolet (UV) light irradiation.
1.3 Thesis structure
The thesis was written in five chapters. Chapter one presents the history of study,
aim and objectives. Chapter Two includes a literature review on synthesis methods and
applications. Chapter Three deals with the experimental details of the four main
projects:
1. Synthesis and characterization of ZnO NPs/reduced graphene oxide
nanocomposite prepared in gelatin medium as highly efficient photo-degradation of MB
2. Effects of graphene oxide concentration on optical properties of ZnO/RGO
nanocomposites and their application to photocurrent generation

7
3. One-pot sol–gel synthesis of reduced graphene oxide uniformly decorated zinc oxide
nanoparticles in starch environment for highly efficient photodegradation of Methylene
Blue
4. Crystalline quality assessment, photocurrent response and optical properties of
reduced graphene oxide uniformly decorated zinc oxide nanoparticles based on
graphene oxide concentration
The techniques, which used in this thesis, were explained in the end of this chapter.
Chapter Four presents the results and discussion of each project. Chapter Five provides
the conclusion of the thesis.

8
CHAPTER 2: REVIEW OF RELATED LITERATURE
2.1 Introduction
In a past few years, more focus is given to graphene especially for its facile
synthesis, novel hybrids materials and applications. Recently, researchers' attention also
focused on graphene oxide (GO) and reduce graphene oxide (rGO) nanocomposites,
which lead to the development of various applications. Their superb and impressive
characteristic makes it a suitable candidate to be hybridized with polymer, metal oxide,
and biomaterials. In this brief review, we will run through the accomplishment of
effective approach for synthesizing graphene oxide–based material nanocomposite
together with their recently developed applications
Graphene oxide (GO) contains a grasp of reactive oxygen functional groups,
which make it a strong nominee for use in lots of applications through chemical
functionalization. GO is construct from graphite oxide and it has been a favorable
passage to produce a large-scale production of graphene (Bai & Shen, 2012; Dreyer,
Park, Bielawski, & Ruoff, 2010; Lübke et al., 2015; Safavi, Tohidi, Mahyari, &
Shahbaazi, 2012). Graphene, however, has a major drawback which is low dispersibility
in water, causing its surface area to decrease and therefore limits its application. This is
due to aggregation that causes by the strong van der Waals interactions and π–π
stacking of the graphene sheets (Xiao Huang et al., 2011).
Therefore, interest has been concentrate on assimilating GO with other materials
by hybridizing it with good water-dispersibility materials (Liu, Liu, & Liu, 2014). By
introducing functional groups on the graphene sheets via chemical oxidation,
aggregation can be cut down or eradicated which leads to fabrication of graphene oxide
(Chauke, Maity, & Chetty, 2015; Muhammad Ekramul Mahmud, Huq, & Yahya, 2016).
The dispersibility of GO is only increase in polar solvent due to the hydrophilic

9
functional groups (Romero Aburto et al., 2015; Zhu, Guo, Fang, & Dong, 2010). In
addition, controlled oxidation provides tunability of the electronic and mechanical
properties including the possibility of accessing zero-band gap graphene via complete
removal of the C-O bonds (Mkhoyan et al., 2009). Various functionalities on the surface
of GO make it an ideal platform for chemical modification, which may generate
materials with amazing properties.
Aside from the advance properties, the detail chemical structure of GO has been
the focus of fascinating debate over the years and yet still no confirmed model is
proposed. The only common information is the structural characteristics of GO which is
the present of many oxygen functional groups on GO’s surface such as epoxy, hydroxyl,
and carboxylic acid group (Zhang, Tong, Xia, & Xue, 2014). Due to the deficiency of
precise analytical technique for characterizing, the amorphous property of GO, and
nonstoichiometric berthollide character of GO, the searching for real model of GO
becomes problematic (Dreyer et al., 2010).
Structural model has already been proposed by many researchers such as
Hofmann and Holst, Ruess, Scholz-Boehm, and Nakajima-Matsuo model (Dreyer et al.,
2010). Based on all of these models, GO is generally constructed by regular lattice
consisting of discrete repeated unit. Meanwhile, the atomic and electronic structure of
GO is elucidated by Mkhoyan et al. (Mkhoyan et al., 2009) by measuring the structure
of C and O K-edges. It is reported that GO sheet showing surface roughness about 0.6
nm and the structure is mainly amorphous due to distortion from sp3 C-O bonds. The
result also reported that a ratio of 1:5 oxygen to carbon atoms is sufficient to transform
the measured 40% of the carbon bonds into sp3
bonds (Mkhoyan et al., 2009). Erickson
et al (Erickson et al., 2010) also shared almost the same opinion and adding up a few
more outlook of the structure of GO. They found that the graphitic region is up to eight

10
nm2 and a hole about five nm is present on the GO sheet. Besides that, the unstrained
sp2 bonds present between carbon which forms a continuous network across the GO
sheet and the oxidized region exhibit no order (Erickson et al., 2010).
Synthesizing method of graphene oxide has already been develop in 1859 (Dreyer
et al., 2010). At that time, B.C. Brodie performed a reaction between graphite and
KClO3 in fuming HNO3 which resulting a material with an increase in the mass of flake
graphite. Later, in year 1898 L. Staudenmaier further the previous method by raising the
acidity of the mixture using concentrated H2SO4 and adding the chlorate in several
aliquots over the course of reaction (Dreyer et al., 2010). After that, Hummer and
Offeman improve the method using alternate oxidation. The reaction is involving the
oxidation of graphite by using NaNO3, KMnO4 and concentrated H2SO4 (Chauke et al.,
2015; Dreyer et al., 2010; Erickson et al., 2010; Xiao Huang et al., 2011; J. Liu et al.,
2014; Mkhoyan et al., 2009; Muhammad Ekramul Mahmud et al., 2016; Romero
Aburto et al., 2015; Safavi et al., 2012; Zhang et al., 2014). This method is mostly used
until now with some modification and improvement.
Marcano et al. (Marcano et al., 2010) has developed synthesizing method that
improves the efficiency of the oxidation process by excluding the present of NaNO3,
raise the usage of KMnO4, and using the ratio 9:1 mixture of H2SO4/H3PO4. This
method was confirmed generate a larger amount of hydrophilic GO material compared
to conventional Hummer’s method besides it does not release toxic gas and easily
controlled temperature (Marcano et al., 2010). Yang, Li, Zhai, Sun, and Yu (Yang, Li,
Zhai, Sun, & Yu, 2014) also took some modification on Hummer’s method to develop a
facile synthesis method of GO by using expanded graphite oxide as a starting material.
This method intensely promote to the decrease for acid, extremely time saving,
minimum energy consuming, and high efficiency without releasing toxic gas (Yang et

11
al., 2014). Until now, a continuous rapid research is evolved to develop a simple and
environment of friendly methods to prepare GO.
2.2 Synthesis of Graphene Oxide-based Material Nanocomposite
There is a great attention in the preparation method of GO-based material
nanocomposite. GO-based material nanocomposite can be synthesized by different
methods and approaches which include hydrothermal method (Li, Wang, Li, & He,
2015; Xu, Shen, Li, & Ye, 2014), electrochemical code position (Yiming Li et al.,
2015), in situ polymerization (Gui, Liu, Chen, & Liu, 2014; Hualan Wang, Hao, Yang,
Lu, & Wang, 2009), microwave-assisted method (She et al., 2015; Xu, Jiang, Ren, &
Yang, 2015), vacuum impregnation (Mehrali, Latibari, Mehrali, Metselaar, & Silakhori,
2013), and sol gel technique (He, 2015). In GO-based nanocomposite, GO present either
as a functional component or as a substrate for immobilizing the other components (Luo
et al., 2015; Song, Qu, Zhao, Ren, & Qu, 2010). Therefore, this section will mainly
focus on effective synthesis method that has been practiced by some researchers.
2.2.1 Hydrothermal Method
Hydrothermal is an effective method and frequently favored method to synthesis
GO-based nanomaterial, which perform in high temperature and vapor pressure. This
method is a very low cost method with facile, environmental friendly, and applicable
route to synthesize soluble reduce graphene oxide (rGO) sheets in excessive amount
(Lorestani, Shahnavaz, Mn, Alias, & Manan, 2015). This method has been used by (Xu
et al., 2014) in one-pot approach to synthesize rGO/CoWO4 and resulting an enhanced
electrochemical performance for supercapacitor. Similarly, Dong et al. (Dong et al.,
2014) also use the same method to synthesize rGO/TiO2 nanocomposite as anode
material for lithium ion batteries. Hydrothermal or also known as solvothermal method

12
is usually carried out in Teflon-line autoclave and the temperature used is between 160-
180℃ (Sun, Wang, Hao, Han, & Cao, 2015; Xu et al., 2014).
Later, this method has been modified and microwave-assisted hydrothermal
method is developed. Gui, Zhao, Tian, and Zhao (Gui, Zhao, Wang, Tian, & Zhao,
2015) was successfully use microwave-assisted hydrothermal method to synthesize
graphene/WO3 by employing GO as a starting material. This method was upheld a
greener approach that involve lower temperature and minimize the duration of the
reaction compared to conventional hydrothermal method (Gui et al., 2015). This method
as well manipulate by Tang, Nguyen, Lee, Kim, and Shim (Tang, Nguyen, Lee, Kim, &
Shim, 2015) to prepare rGO/SnO2 nanocomposite which assisted by ionic liquid that act
as a reaction medium in order to enhance the microwave-assisted hydrothermal method.
The ionic liquid, 1-butyl-3-methylimidazolium tetra fluoroborate ([bmim]BF4) that use
in this reaction is a greener solvent compared to the established organic solvent besides
support by the excellent solvent power, lower vapor pressure, non-flammable, good
thermal stability, ionic conductivity, and high electrochemical stability (Tang et al.,
2015) .
Another option of hydrothermal method is by using continuous hydrothermal flow
synthesis (CHFS) reactor. It can manipulate over reaction variables like pressure and
temperature and also particle properties which involving mixing a flow of supercritical
water with a flow of aqueous metal salt, thus resulting a rapid precipitation and
controlled growth of nanoparticle (Saada, Kellici, Heil, Morgan, & Saha, 2015). This
method is simply conclude as one of the most economical approaches which can
controlled the size of product by enhancing the heating rate as well as saving time (Tang
et al., 2015).

13
2.2.2 Electrochemical Deposition
Electrochemical deposition is a process by which a material is deposited from a
solution of ion onto the surface of electrical conductor or electrode. Mostly, this method
is employed to fabricate the electrochemical sensor by deposited nanocomposite
material onto an electrode (Du et al., 2015; Song et al., 2010). Du et al (Reza, Ali,
Srivastava, Agrawal, & Biradar, 2015). (Du et al., 2015) has employed one-step
electrodeposition method to synthesis a novel glucose sensor based on rGO-based
nanocomposite. In this study, dendritic gold nanostructure is hybridized with rGO
functionalize with a globular protein, 𝛽-lactoglobulin and was electrodeposited on
glassy carbon electrode (GCE) by chronoamperometry technique (Du et al., 2015).
Similarly, Wu, Han, Gua, and Cheng (Wu, Han, Guo, & Cheng, 2015) modified Au
electrode by direct electrodeposition on rGO and followed by chronoamperometry
technique, then electrochemical polymerization takes place to modified the electrode
with poly (3-aminophenylboronic acid) film.
Reza et al. (Reza et al., 2015) also use this method to deposit rGO/Cn nanocomposite
on indium tin oxide (ITO) glass substrate. The preparation of electrodeposited electrode
involving two electrodes that immerse in colloidal rGO/Cn nanocomposite suspension
where platinum foil act as a cathode and ITO glass substrate act as an anode (Reza et
al., 2015). A part from electrochemical electrode and sensor, this method also can assist
the preparation of coated film. This study has been done by Li et al. (Yiming Li et al.,
2015) which has synthesize GO/ZnO nanocomposite films on Fluorine doped Tin Oxide
(FTO) coated glass and resulting an improve photoelectric conversion properties as a
photo absorber.

14
2.2.3 In Situ Polymerization
In situ polymerization is a prevalent route for the preparation GO-based polymer
nanocomposite in a larger scale and avoid the chain destruction (Yan et al., 2014). It has
been used to in situ prepare polyaniline, polypyrrole, and polymethyl-methacrylate on
GO and rGO layer (Gui et al., 2014; Qi, Sun, Duan, & Guo, 2015; Sun et al., 2015; H.
Wang et al., 2009; Yan et al., 2014; Yang et al., 2015). Taking polyaniline as an
instance, the distinctive precursor used is aniline, which is then immersed in HCl
solution with addition of ammonium persulfate that act as an oxidant (Gui et al.,
2014;Sun et al., 2015;Yang et al., 2015).
Similarly, Yan et al. (Yan et al., 2014) prepared polypyrrole/SDBS (sodium dodecyl
benzenesulfonate) intercalated reduced graphene oxide (rGO) nanocomposites by using
pyrrole as a monomer. In first step, SDBS was intercalated with GO and it is then
reduced by hydrazine at 95 ℃ and ammonium persulfate is added to initiate the
polymerization of pyrrole monomer. There are intermolecular forces which involving
𝜋 − 𝜋 stacking, hydrogen bond and van der Waals forces that promote the adsorption of
pyrrole monomer onto rGO surface. These intermolecular forces between aromatic rings
of polypyrrole chains and sp2-bonded carbon atoms of graphene basal planes also make
polypyrrole coat perfectly onto the sheets of graphene (Yan et al., 2014). The benefit of
in situ polymerization method lies in the fact that the whole procedure is facile,
controllable, and scalable which promotes the intercalation of monomer between the
GO and rGO sheets.
2.2.4 Sol-gel Technique
Recently, sol-gel technique has been used to synthesis GO-based material
nanocomposite especially in fabrication of self-cleaning film and glass coating. Being
the fact that sol–gel derived inorganic composites require low synthesis temperature, the

15
physical properties of doping component could be retained by controlled the mixture
between the guest molecule and the host matrices (Chan Zheng, Zheng, Chen, & Wei,
2015).
The sol-gel approach offers a distinctive means to prepare a three-dimensional
network capability for the encapsulation of numerous biomolecules. Peng, Huang, and
Zheng, (Li, Yin, Han, & Chang, 2016) has synthesis ferrocene-branched organically
modified silica material ormosil/chitosan/GO nanocomposite for glucose sensor.
Ormosil is contributed in modification of surface property of the matrices, enhance the
film flexibility and prevent leakage when the reagent is attached to the silica (Li et al.,
2016). Furthermore, sol–gel derived silica glasses also show an outstanding optical,
thermal, transparency in the UV region, and high thresholds for laser damage (Chan
Zheng et al., 2015).
2.3 Application of Graphene Oxide-based Material Nanocomposite
2.3.1 Wastewater Treatment
Rapid industrialization has led to an increase discharge wastewater containing
heavy metals (Hou Wang et al., 2015) and organic dyes (Xiao Huang et al., 2011). In
recent studies, there have been reported for the treatment of wastewater including
photocatalysis (Gupta et al., 2015) and adsorption (Boruah et al., 2015). Various GO-
based material nanocomposites have been studied that it could give a large contribution
in the wastewater treatment especially in heavy metal removal. In fact, GO and rGO are
well known as a conqueror in photocatalyst and adsorption application. The large
specific surface area and abundant functional groups make GO a strong candidate for
adsorption and photocatalyst application in wastewater treatment.

16
2.3.2 Photocatalysis
There is great interest in the synthesis of graphene oxide nanocomposite for
photocatalytic degradation of insecticides, organic dyes, heavy metals and other
carcinogenic chemicals. Photocatalyst such as TiO2, ZnO, ZnS, and WO3 are commonly
employed because of the reusable and self-regenerated properties (Gupta et al., 2015; Li
et al., 2016; Hou Wang et al., 2015). However, the practical purpose are narrow due to
the rapid recombination of photogenerated electrons and holes within photocatalyst (Hu,
Lu, Chen, & Zhang, 2013). Beingthe excellent mechanical strength, low density, high
catalytic activity, high surface area and the superior electron-transporting properties,
graphene oxide can be exploiting as a competent electron acceptor to boost the photo
induce charge transfer for amended photocatalytic activity (Gupta et al., 2015; Hu et al.,
2013).
Recently, there are a few researchers assessed the performance for
photodegradation of organic dye like Rhodamine B and methylene blue by using
graphene oxide-based material nanocomposite. Sun et al. (Sun et al., 2015) evaluated
the addition of GO in the semiconductor with low loading of GO (0-0.5 %) to enhance
their photocatalytic activity under visible light irradiation. The photocatalytic activity of
rGO/Cu2O (k = 7.85×10⁻³
) was reported exceeding that of pure Cu2O and Degussa P25
by a factor of 2.9 and 7.9 respectively (Sun et al., 2015). However, further increase of
graphene oxide content resulted in a gradual decrease in the photocatalytic activity due
to prevention of light from reaching the surface of the Cu2O by the excessive GO, which
would also shield the Cu2O from absorbing visible light. Besides that, the loading of
GO would inhibit the crystallization of Cu2O that resulted in low photocatalytic activity.
Similar with previous work by Li and Hai (Li & Hai, 2014) rGO/Ag
nanocomposite showed superior photocatalytic activity which analyses by Rhodamine B

17
as model contaminant. However, as the microwave cyclic increase the photodegradation
performance becomes weaker, which is attributed to serious oxidation of partially
reduced GO. The result supported by Choi et al. (Choi et al., 2015) which also observed
a dwindle of the activity of rGO/CuI nanocomposite that perhaps appointed to the slight
solubility of catalyst in aqueous solution. Hence, the microwave cyclic time has clearly
substantial to the outcome on photodegradation of GO-based nanocomposite for
Rhodamine B. The present of graphene oxide, also give benefit to a non-visible light
photocatalyst, CuI into a visible light photocatalyst. CuI has a high band gap that is not
allowed it to exhibit photocatalytic activity in the visible region. After the hybridization
excited electron from stimulated sunlight was injected from rGO nanosheets to the
conduction band of CuI, hence it will generate hydroxyl and superoxide radicals that
sustained and enhanced by the more stable carbon free radical derived from rGO
nanosheets, resulting a visible light activity (Choi et al., 2015).
In an attempt to optimize the parameter of photocatalyst for Rhodamine B
degradation, Maruthamani et al. (Maruthamani, Divakar, & Kumaravel, 2015) has
synthesized rGO/TiO2 nanocomposite and studied the influence of rGO content, initial
dye concentration, pH, and catalytic dose on decolourization. The result confirms that,
as rGO content in the composite was raised, more TiO2 particles were able to be
attached onto the rGO sheet therefore extra charge carriers form exceedingly reactive
species and boost the degradation of Rhodamine B. The percentage decolourization of
RhB dye increased with the adding of catalyst (up to 1.5 g L-1
) due to the upsurge
number of active sites that promotes hydroxyl radicals and enhances the dye adsorption
on the catalyst surface. Then again, percentage decolouration fall with further increase
in catalyst (1.5 to 2 g L-1
) that may be ascribe to the agglomeration of the catalyst
particles together with increase in the turbidity of the suspension which triggers light

18
scattering and results in decreased UV light penetration during the reaction
(Maruthamani et al., 2015).
Graphene oxide anchored to TiO2 is one of the most common nanocomposites to
be employed as photocatalyst as TiO2 is a paramount candidate for photocatalytic
decontamination. TiO2 is well known to its high photocatalytic efficiency, chemical
stability, antibacterial property, low toxicity, cost effectiveness, abundant and strong
oxidizing material (Gao, Li, Sun, & Ng, 2014; Gao, Hu, & Mi, 2014; Raghavan,
Thangavel, & Venugopal, 2015). Yet, its high band gap energy (3.2 eV) which
contributes to low photo response toward sunlight and recombination effect becomes a
drawback to its photocatalytic performance (Gao et al., 2014; Raghavan et al., 2015).
Thus, the remarkable electron capture-storage-transport properties of GO could enhance
the charge separation efficiency of TiO2 (Ghavami, Mohammadi, Koohi, & Kassaee,
2014).
Gao et al. (Gao et al., 2014) was modified surface of water filtration polysulfone
base membranes with GO/TiO2 nanocomposite in order to enable photoactivity under
both UV and sunlight. Four kinds of TiO2 nanostructures were prepared including 1D
TiO2 nanotube, 1D TiO2 nanowire, 3D TiO2 sphere assembled by nanoparticles (TiO2
sphere-P) and 3D TiO2 sphere constructed by nanosheets (TiO2 sphere-S). The
outcomes point out that GO-TiO2 sphere-S composites expressed superior
photodegradation and disinfection activity than TiO2 sphere-S under solar light
irradiation. For this reason, optimizing the nanostructures of photocatalyst and coupled
with carbon materials are two favourable attempts to improvise the photocatalyst (Gao
et al., 2014).
Some researcher also employed ternary photocatalyst system such as
rGO/TiO2/ZnO (Raghavan et al., 2015), rGO/CoFe2O4/TiO2 (Gupta et al., 2015),

19
rGO/Ag/TiO2/γ-Fe2O3 (Ghavami et al., 2014), rGO/CdS/ZnO (Wang, Yin, & Liu,
2014), and rGO/W/BiVO4 (Wang et al., 2014). The competency of the ternary system
was appraised and compared using binary system (coupled with GO) and single
photocatalyst material. The degradation competency of ternary system was the excellent
photocatalyst as confirmed by (Gao et al., 2014; Ghavami et al., 2014; Raghavan et al.,
2015). The surface area of ternary system nanocomposite also enhanced which resulted
in an increases absorptivity as reported by (Ghavami et al., 2014; Gupta et al., 2015).
In a photocatalytic system, a reaction takes place at the surface of the catalyst. The
generation of an electron–hole pair plays a significant role in a mechanism of a
photocatalytic reaction. When a photocatalyst is exposed by a light stronger than its
band gap energy, electron–hole pairs diffuse out to the surface of the photocatalyst and
participate in a chemical reaction with the electron donor and acceptor (Yousefi et al.,
2015). Here, the valance band (VB) electrons (e-) of photocatalyst are excited to the
conduction band (CB), creating holes (h+) in the VB (Sun et al., 2015). Those free
electrons and holes transform the surrounding oxygen or water molecules into
hydroxyuracil (HOU) free radicals with super strong oxidation (Yousefi et al., 2015).
These free radicals are then used to decomposed organic pollutant into carbon dioxide
and water (Gao et al., 2014). A highly efficient visible light photocatalysis should have
high quantum efficiency resulting from low recombination of the photogenerated
electron-hole pair and a wide light response range because of the narrow band gap (Sun
et al., 2015). With the present of excellent electron-mobility of GO anchored to
photocatalyst, the charge transport rate could be increased therefore, inhibiting the
charge recombination and promoting the photocatalytic activity consequently through
quick electron–hole transfer (Li & Hai, 2014). The present of GO also confirmed that it
could reduce the band gap that promotes to an excellent photocatalytic activity

20
(Maruthamani et al., 2015). The list of photocatalyst with the material detection is
summarized in (Table 2. 1).
Table 2.1: The list of photocatalyst and material detection in previous study
Photocatalyst Material detection Researcher
rGO/Cu2O Rhodamine B (Sun et al., 2015)
rGO/Ag Rhodamine B (Li & Hai, 2014)
rGO/CuI Rhodamine B (Choi et al., 2015)
rGO/TiO2 Rhodamine B (Maruthamani et al.,
2015)
rGO/TiO2 Bisphenol A (Luo et al., 2015)
rGO/Ag/TiO2 Methylene blue (Vasilaki, Georgaki,
Vernardou, Vamvakaki, &
Katsarakis, 2015)
rGO/Ag/TiO2/γ-Fe2O3 Crystal violet (Ghavami et al., 2014)
rGO/CoFe2O4/TiO2 chlorpyriphos (Gupta et al., 2015)
GO/TiO2 Escherichia coli (E.
coli)
(Gao et al., 2014)
GO/TiO2 Methylene blue (Gao et al., 2014)
rGO/TiO2/ZnO Methylene blue (Raghavan et al., 2015)
rGO/CdS/ZnO Methylene blue (Wang et al., 2014)
rGO/W/BiVO4 Methylene blue (Wang et al., 2014)
rGO/Pd/Ni 4-chlorophenol (Liu, Liu, Shan, &
Zhang, 2015)

21
2.3.3 Adsorption
Many GO-based composite for adsorption of contaminant from wastewater have
recently been developed. The magnetic composite like Fe3O4 is one of the promising
materials for the wastewater remediation. Boruah et al. (Boruah et al., 2015)
systematically synthesizes Fe3O4 with rGO for methylene blue adsorption with an
adsorption capacity of 75.15 mmol/g which is higher than Fe3O4. The result supported
by Hao, Wang, Gou, and Dong, (Hao, Wang, Gou, & Dong) which fabricate
GO/Fe3O4as an adsorbent for removal of Chrysoidine Y. GO is exfoliated by strong
oxidants, and it consists of a hexagonal network of covalently linked carbon atoms
attached with oxygen-containing functional groups, such as epoxy, carboxyl and
hydroxyl groups at various sites (Dreyer et al., 2010). Anchoring Fe3O4 nanoparticles
onto GO might conjoin the relatively high adsorption capacity of graphene oxide and
the separation convenience of magnetic materials which it can bind with cationic dyes
through the π-π stacking interaction and van der Waals forces. In similar work, Wang et
al. evaluated the adsorption performance of ternary magnetic composite consisting of
rGO, polypyrrole and Fe3O4 nanoparticle for the Cr(VI) removal with adsorption of
293.3 mg/g which is much higher compared to rGO/Fe3O4 nanocomposite. Magnetic
graphene based adsorbent that assist separation by magnetic field have set out to be used
since it is hard to separate small particle size of GO from aqueous solution through
conventional centrifugation and filtration method (Hao et al.).
Polypyrrole assist with GO is widely used as Cr(VI) removal as polypyrrole has
high chemical stability, ion exchange ability, ease of preparation, and low cost (Chauke
et al., 2015; Setshedi, Bhaumik, Onyango, & Maity, 2015). The existence of
polypyrrole enhances the adsorption ability due to positively charge nitrogen atoms that
easily bind heavy metal (Hou Wang et al., 2015). The hybridization between
polypyrrole, GO and𝛼-cyclodextrin make a perfect adsorbent with a strong acid

22
resistance and superior mechanical properties because it come up with a remarkably
larger surface area, the abundant hydroxyl groups and cavities (Chauke et al., 2015).
The Cr(VI) removal is mostly via electrostatic attraction besides some might be
involve ion exchange and chemical reduction process (Hou Wang et al., 2015). Previous
study done by Setshedi et al. (Setshedi et al., 2015) affirmed that a drop in Cr(VI)
removal efficiency is influenced by increasing the solution PH. At lower pH values,
greater Cr(VI) removal efficiency could be achieve as the surface of nanocomposite is
positively charged due to the detachment of doped Cl- ions with simultaneous
protonation of the nitrogen atom in the presence of sufficient H+ ions. This result was
strongly support by Wang et al. (Hou Wang et al., 2015) and Dong et al. (Dong, Dou,
Mohan, Pittman Jr, & Luo, 2015) which stressing on decreasing the adsorption capacity
was due to higher PH. Their result also supported by zeta potential values which was
decrease with increasing solution pH, receiving from nitrogen groups deprotonated
(Dong et al., 2015; Sheshmani, Akhundi Nematzadeh, Shokrollahzadeh, & Ashori,
2015; Hou Wang et al., 2015). However, Liu et al. (Liu et al., 2014) conveyed an
opposite opinion, which proved that as the solution pH increase, the adsorption capacity
would also increase. This is because the contaminant is in cationic form and lower PH
will provide insufficient electrostatic attraction between the cationic contaminant and
the nanocomposite (Liu et al., 2014). So, at lower pH, positively charged becomes
totally dominant at adsorbent surface that resulting an excellent electrostatic attraction
between anionic contaminant and vice versa.
Then again, Sheshmani et al. (Sheshmani et al., 2015) which also use cationic
contaminant (Pb(II) ion), yet the adsorption becomes weaker as the pH increase. The
interactions take place between the metal ion and the amino groups of the
nanocomposite. At low pH, H+ and Pb
2+ being competitively adsorbed on the surface of

23
adsorbent because the amino group of GO/chitosan/FeOOH nanocomposite can be
simply protonated to be −NH3 which reduce the adsorption capacity as the increase of
electrostatic repulsion between −NH3 and Pb2+
. At higher pH, the protonated −NH3
decreases which increase the recovery of −NH2 resulted an increase of the amount of
adsorbed Pb2+
. However, with further increase in pH, OH− can be adsorbed onto the
surface of −NH2 competing with Pb2+
, leading to a reduction in the amount of adsorbed
Pb2+
(Sheshmani et al., 2015).
Surface area is also one of significant factor in adsorption. Setshedi et al.
(Setshedi et al., 2015) affirm that the increased Cr(VI) sorption efficiency of the
GO/polypyrrole may be due to the increased surface area. Conversely, Wang et al, (Hou
Wang et al., 2015) evaluate that surface area is not a key factor for
rGO/polypyrrole/Fe3O4 nanocomposite to be a good adsorbent. Therefore, there are
three possibility opinion; first, after the hybridization, graphene oxide might help
increase the surface area of the adsorbent material and leading to an increase in
adsorption capacity (Dong et al., 2015; Setshedi et al., 2015) second, the adsorbent
material itself help increase the surface area of graphene oxide as GO poorly dispersed
in water and leading to decrease it is surface area (Liu et al., 2014) and lastly, the
hybridization of GO with adsorbent material did not influence the surface area at all but
the adsorbent still has an excellent adsorption performance (Hou Wang et al., 2015).
GO-based nanocomposite could be a first-class preference as an adsorbent for
adsorbing assorted organic molecules owing to its large specific surface and reactivity.
What’s more, GO capable to form strong π-stacking interaction with a benzene ring due
to its greater delocalized π-electron system fabricates it for adsorption of aromatic
compounds. For comparison, the material detection, maximum adsorption capacity, and
pH of these GO-based nanocomposites are summarized in (Table 2. 2).

24
Table 2.2: List of adsorbent, material detection, and maximum adsorption
capacity from previous study
Adsorbent Material
detection
Maximum
adsorption
capacity, mg/g
p
H
Researcher
GO/Fe3O4
Chrysoidine
Y
344.83 7 (Hao et al.)
GO/porphyrin/F
e3O4
sulfonamide
s
13.9-
sulfanilamide
10.9sulfadimidine
44.2-
sulfadimethoxine
28.3-sulfadiazine
10.5-
sulfaguanidine
36.3-
sulfamethoxazole
26.6-sulfapyridine
4 (Shi & Ye,
2015)
rGO/Fe3O4/poly
pyrrole
Cr(VI) 293.3 3 (Hou Wang
et al., 2015)
GO/polypyrrole Cr(VI) 625 2 (Setshedi et
al., 2015)
GO/𝜶-
cyclodextrin/polyp
yrrole
Cr(VI) 606.06-666.67 2 (Chauke et
al., 2015)
GO/𝜷-
cyclodextrin/poly
(acrylic acid)
Methylene
blue (MB) &
safranine T
(ST)
247.99-MB
175.49-ST
9
8
(Liu et al.,
2014)
GO/schwertman
nite
Sb(V) 158.6 7 (Dong et al.,
2015)
GO/chitosan/Fe
OOH
Pb(II) 111.11 5 (Sheshmani
et al., 2015)

25
2.3.4 Electronic
There are quite many electronic devices have been invented using GO as a starting
material such as supercapacitor and lithium ion battery. Supercapacitor and lithium ion
battery, is presume to be an excellent nominee for energy storage (Dong et al., 2014;
Gui et al., 2014; Ji, Shen, Zhou, & Chen, 2015; She et al., 2015; Xu et al., 2015).
Various metal oxides have been employed to develop those devices. However, these
metal oxides have certain drawbacks that interferes the chemical and technical process.
Therefore, GO and rGO are hybridized with these metal oxides in order to increase the
performance of the device.
2.3.5 Supercapacitor
Supercapacitor also known as electrochemical capacitor is an energy storing
device which attracted much attention in recent years. Due to its advantages such as
high power density, long cycle life and fast charging/discharging rates, supercapacitor
also use as an intermediate system between dielectric capacitors and batteries (Wang et
al., 2009) as well as conversion of electric devices (Gao et al., 2015). The main
challenges of the existence supercapacitor are the lower energy density and poor overall
performance (Xu et al., 2014). Therefore, GO-based nanocomposite is introducing as a
new supercapacitor with enhanced physicochemical properties, for instance as
outstanding electronic conductivity, superior mechanical strength, and greater surface
area.
The present of GO and rGO can increase the surface area of the nanocomposite.
Work done by Ji, Shen, Zhou, et al. (Ji, Shen, Zhou, et al., 2015) affirms that rGO can
inhibit agglomerate and manipulate the ceria’s structure. It is commonly admitted that
the smaller particles have a better propensity to aggregate and reduce the surface area,
specifically in nanoscale. That theory was support by surface morphology studies that

26
cascading structure of supercapacitor material and GO morphology, which would assist
an increase in the specific surface area of the composites and boost electrical
conductivity (Gui et al., 2014). The list of various nanocomposites, which is fabricated
as supercapacitor material, is shown in (Table 2. 3).
Table 2.3: The specific capacitance and capacitance retention of different types
of nanocomposite in supercapacitor application
Nanocomposite Specific
capacitance, F/g
Capacitance
retention
Researcher
GO/polyaniline 531.0 - (Wang et al., 2009)
GO/manganese dioxide 216.0 84.1 % after 1000
cycles
(Chen, Zhu, Wu,
Han, & Wang,
2010)
GO/polyaniline 355.2 80.46 % after 1000
cycles (Gui et al., 2014)
GO/cobalt tungstate 159.9 94.7 % after 1000
cycles
(Xu et al., 2014)
rGO/polypyrrole/sodium
dodecyl benzenesulfonate
277.0 50 % after 500
cycles
[(Yan et al., 2014)
rGO/boron nitride 140.0 105.5 % after 1000
cycles
(Gao et al., 2015)
rGO/polyaniline 701.0 92 % after 1000
cycles
(Yan et al., 2014)
rGO/cerium(IV)oxide 265.0 96.2 % after 1000
cycles
(Ji, Shen, Zhou, et
al., 2015)
rGO/manganese(II,III)oxide 160.0 91.5 % after 800
cycles
(She et al., 2015)
2.3.6 Lithium ion battery
Lithium ion battery has become one of the most widely used secondary battery for
portable electronics, hybrid electric vehicles and renewable energy storage (Peng et al.,
2015). Electrochemically active metals and metal oxides such as CuO (Hu & Liu,
2015), TiOF2 (Myung, Kikuchi, Yoon, Yashiro, & Sun, 2015), Fe3O4,CoF2 (Tan et al.,

27
2015), CdWO4 (Zhang et al., 2014), SnO2 (Liu et al., 2013), TiO2 (Rai et al., 2013), and
Mn2O3 (Hu, Sun, Zhang, & Chen, 2013) have long been considered as anode materials
for lithium ion batteries because of their remarkable high theoretical capacities. All of
these materials become attractive candidate for electrode material of lithium ion
batteries due to their environmental friendly, structural stability and minimum cost
production (Wang, Wang, Dong, Zhang, & Jin, 2013; Xu et al., 2015; Chuchun Zheng,
He, Zhang, Wang, & Lei, 2015).
Despise of these transcendence properties, there are a few drawbacks that a
researcher had to face. Taking TiO2 as an instance, it bears a low Li-ion diffusivity,
theoretic capacity, and low electronic conductivity in reversible Li insertion/extraction
process (Qiu et al., 2012; Chuchun Zheng et al., 2015). Similar with TiO2, one of the
most recognized semiconductors, could also have its own downsides. The electrical
conductivity CuO in the charge state is relatively poor and it is having a large
volumetric change of the electrode that can damage its crystal structure and affect its
capacity (Xu et al., 2015). So, GO and rGO is assigned to support the mechanical and
electrical properties of the existing material.
Peng et al. (Peng et al., 2015) has hybridized rGO with selenium nanoparticle in
order to maximize the capacity and energy density of the lithium-selenium battery
cathode. Furthermore, the rGO framework also helps to reduce the selenium loss and
prevent the polyselenides from leaving during cycling (Peng et al., 2015). The present
of these carbon-based materials also has been confirmed to contribute to the long-term
cycle stability, excellent energy capacity, enhanced electrochemical performance, and
large reversible capacity compared to the pristine materials (Dong et al., 2014; Wang et
al., 2013; Xu et al., 2015; Xu et al., 2015). The list of nanocomposite that already has
been fabricated as a supercapacitor material is as shown in (Table 2. 4).

28
Table 2.4: The nanocomposite that assigned as supercapacitor in previous study
Materials Initial
discharge
capacity
(mA h g-
1)
Reversible
capacity
(mA h g-1
)-
cycles
Current
density
(mA g-1
)
Researcher
rGO/seleni
um
533 265-500
675 (Peng et al.,
2015)
rGO/TiO2 368 136.1-100 1000 (Chuchun Zheng
et al., 2015)
rGO/titani
um dioxide
295.4 112.3-100 1000 (Dong et al.,
2014)
rGO/MnO 1017 988.6-120 100 (Xu et al., 2015)
rGO/TiO2 310 270-100 100 (Qiu et al., 2012)
GO/CuO 1369.3 590-50 100 (Xu et al., 2015)
2.3.7 Self-cleaning
Recently, self-cleaning technology has begun to grow rapidly since self-cleaning
coatings and windows have huge commercialization demand. A self-cleaning materials
should have good photocatalytic activity with high durability, optical transparency for
coating surface, and superhydrophilicity properties (He, 2015). Superhydrophilicity is a
state of material having strong affinity to water greater to non-polar air which is a very
important properties need as a self-cleaning coating (Drelich, Chibowski, Meng, &
Terpilowski, 2011).
Thakur and Karak, (Thakur & Karak, 2015), has fabricate rGO/TiO2
nanocomposite which shows an excellent self-cleaning properties. The report revealed
that the self-cleaning properties increase with increasing amount of TiO2. Whereas, the
increasing amount of rGO will assists in effective healing properties (Thakur & Karak,
2015). Substantially, He shared (He, 2015) the same viewpoint which the photocatalytic

29
activity improved with increase of rGO/ZnO ratio which is due to the 3 factor; first,
development of their charge separation due to electrons infusion from the conduction
band of ZnO to graphene; secondly, the reduce of average particle size; and third, the
increase of superhydrophilicity.
Meanwhile, Yun et al (Yun et al., 2012) reported that prepared GO/TiO2
nanocomposite had excellent self-cleaning properties toward methylene blue stained
films. Similar with work done by Thakur and Karak, the increasing content of GO led to
improvement in film transmittance and higher efficiency in methylene blue adsorptivity.
With superhydrophilicity of GO, it can be a suitable candidate for both an adsorbent and
a binder (Yun et al., 2012).
2.3.8 Sensor
Sensors based on graphene oxide-based nanocomposite material are getting an
endless attention due to their ultrafast response (Zhang et al., 2014), great sensitivity
(Lorestani et al., 2015), esteem long-term stability (Su & Peng, 2015), super
conductivity (Yang et al., 2015), reproducible (Ikhsan et al., 2015) and facile
fabrication. Recently, nanocarbon material has appeared to be a momentous outlook in
the topic of humidity and gas sensor. Its sensitivity towards water molecule is due to the
numerous oxygen functional groups that decorated on basal plane and the edge of
graphene oxide, such as carboxylic acid, hydroxyl, and epoxy group which can expand
the hydrophilicity (Zhang et al., 2014). Nanostructure material normally show certain
apparent benefit for sensor purpose for instance tremendous adsorption capacity, large
specific surface area, great mechanical stiffness, extraordinary high carrier mobility and
better stability (Yao & Xue, 2015; Zhang et al., 2014), So far, many researchers have
employed GO-based material to detect humidity (Yao & Xue, 2015; Zhang et al., 2014),

30
hydrogen peroxide (Lorestani et al., 2015), trimethylamine (Gui et al., 2015), ammonia
(Tiwari, Atri, & Sharma, 2015), and nitrogen dioxide (Su & Peng, 2015).
To date, many biosensors based on GO-based nanomaterial have catch
researchers’ attention. One of it is glucose biosensor which successfully synthesized by
one step electrodeposition (Du et al., 2015). In this study, rGO/β-lactoglobulin acts as
stabilizer and an excellent template for the growth of dendritic gold nanostructures (Au
NPs). Au NPs draws a particular consideration in electrochemical field since it has good
chemical stability, large surface area, exceptionally biocompatible, enhance the
electrode conductivity and capable to assist electron transfer between electrode and
biomolecule (Peng et al., 2015; Yola, Eren, & Atar, 2015). In the study done by Peng et
al. (Peng et al., 2015), Au NPs were employed to immobilize the probe DNA via Au-S
bond to detect multidrug resistance gene in cancer treatment. The hybridization of GO
with toluidine blue and Au NPs, GO was used to enlarge the loading capacity of the
toluidine blue and preclude the leakage of the toluidine blue from the electrode surface
(Peng et al., 2015). Yola et al. (Yola et al., 2015), also employed GO anchored to Au
involving 2-aminoethanethiol for detection of tyrosine in milk which fabricate a
superior sensor with low detection limit (Yola et al., 2015). The list of sensor, material
detection, and detection limit is summarizing in (Table 2. 5).

31
Table 2.5: The type, material detection and detection limit of previous
synthesized sensor
Type of
sensor
Sensor Material
detection
Detection
limit
Researcher
Gas sensor GO/poly
(diallyldimethylam
monium chloride)
Humidity - (Zhang et al.,
2014)
rGO/Ag Hydrogen
peroxide 0.9×10
-6M (Lorestani et
al., 2015)
GO/nanodiamond Humidity - (Yao & Xue,
2015)
GO/WO3 triethylamine - (Gui et al.,
2015)
rGO/polypyrrole ammonia - (Tiwari et al.,
2015)
rGO/WO3 NO2 - (Su & Peng,
2015)
Biosensor rGO/β-
lactoglobulin/Au
Glucose 2.29×10⁻⁵
M (Du et al.,
2015)
GO/Au/toluidine
blue
Multidrug
resistance 2.95×10
-12M (Peng et al.,
2015)
rGO/ZnS/ Ascorbic acid
(AA), dopamine
(DA) and uric
acid (UA)
3×10⁻⁵
M-AA
5×10⁻⁷
M-DA
4×10⁻⁷
M-UA
(Yang, 2015)
GO/Pt/CeO2/1-
naphthol
Influenza 4.3×10⁻¹³
g
mL-1
(Yang, Zhuo,
Yuan, & Chai,
2015)
GO/multi-walled
carbon nanotube
Sunset Yellow
(SY) and
Tartrazine (TT)
2.5×10⁻⁸
M-SY
1×10⁻⁸
M-TT
(Qiu et al.,
2016)
rGO/Fe3O4 Acetylcholine 3.9×10⁻⁸
M (Qian et al.,
2014)
rGO/CeO2 NO 9.6×10⁻⁹
M (Hu, Xie, Bao,
Yu, & Li,
2015)
rGO/chitosan/tyrosi
nase
Bisphenol A 7.4×10⁻¹⁰
M (Reza et al.,
2015)
rGO/SnO2 Dopamine 1×10⁻⁶
M (Nurzulaikha
et al., 2015)

32
GO/Au/2-
aminoethanethiol
Tyrosine in milk 1.5 × 10⁻¹⁰
M (Yola et al.,
2015)
Environment
al sensor
rGO/poly (3-
aminophenylboroni
c acid)
Fluorine 9 × 10-11
M (Wu et al.,
2015)
rGO/polyaniline Mercury ion 3.5×10⁻¹¹
M (Yang et al.,
2015)
GO/Ag Nitrite ion 2.1×10⁻⁶
M
and 3.7×10⁻⁵
M
(Ikhsan et al.,
2015)
GO/Ag Dye 1×10⁻⁶
M (Ding, Xie,
Liu, Wang, &
Xu, 2015)
2.3.9 Catalyst
Various catalyst based on GO nanocomposite have been studied recently. Despite
the fact that there has been a significant exertion committed to the utilization of
different metals as suitable catalyst, there is still a need in finding suitable backings for
the catalyst framework and this zone needs to be investigated more.
One of the latest researches is done by Zahed and Monfared (Zahed & Hosseini-
Monfared, 2015) which synthesis GO/Ag nanocomposite as a catalyst for aerobic
oxidation of benzyl alcohol. Silver is well known as a catalyst for many oxidation
reactions. The Ag particles that consist of very small particle can contribute to greater
specific surface area, but it is also might lead to agglomeration from corrosive surface
energy. Therefore, the present of GO can support and separate the nanoparticle,
avoiding it from agglomerate and make it recyclable (Zahed & Hosseini-Monfared,
2015). This catalyst also is confirmed to be reuse for several times. In different work,
GO/Ag nanocomposite is employed as a catalyst for reduction of 4-nitrophenol (Yizhao
Li et al., 2015). This nanocomposite was reported to be highly reactive and very stable
catalyst. The high activity of GO/Ag nanocomposite may be credited to present of GO

33
that also lead to exceptionally productive contact between 4-nitrophenol and Ag
nanoparticles on GO surface.
In previous work done by Song et al. (Song et al., 2010), GO-COOH has
inherent peroxidase-like action and its catalysis is emphatically subject to pH,
temperature, and H2O2 concentration, like horseradish peroxidase. Peroxidase has
extraordinary potential for handy application and can be utilized as a diagnostic kit for
hydrogen peroxide and glucose (Song et al., 2010). Horseradish peroxidase has been
generally used to manufacture sensors for product detection of the glucose oxidase. GO-
COOH is low cost, simple to acquire, steadier to biodegradation, and less defenseless
against denaturation compared to horseradish peroxidase. Hence, these focal points
show that GO-COOH can be valuable in ecological observing and medicinal diagnostic.
A few of recent fabricated catalyst shave been listed in (Table 2. 6).
Table 2.6: The previously synthesised catalyst and its catalytic activity
Catalyst Catalytic activity Researcher
rGO/Cu Reduction of 4-nitrophenol
(Yeh, Wu, & Chen,
2014)
GO/Ag Reduction of 4-nitrophenol
(Yizhao Li et al., 2015)
GO/magnetite/
Ag
Reduction of 4-nitrophenol
(Ji, Shen, Yue, et al.,
2015)
GO-COOH Reduction of H2O2
(Song et al., 2010)
GO/Ag Aerobic oxidation of benzyl
alcohol
(Ding et al., 2015)
2.3.10 Biomedical
Graphene oxide-based nanocomposite has expose fascinating purposes in the
biomedical field. GO is extensively use in biomedical application due to its two-

34
dimensional plane and one-atom thickness give it with superior specific surface area for
immobilization of numerous substance including a wide range of metals, biomolecules,
fluorescent molecules and drugs (Yang et al., 2009).
Yang et al. (Yang et al., 2009) has reported a hybrid of GO with
superparamagnetic Fe3O4 for controlled targeted drug carries. The
GO/Fe3O4/doxorubicin nanocomposite exhibits a hydrophilic surface and its
superparamagnetic properties make it easily congregate under acidic environment and
move in magnetic field besides it can simply be redispersed to make a stable suspension
under basic condition (Yang et al., 2009). Similarly, Zhang, Xia, Zhao, Liu and Zhang
(Zhang, Xia, Zhao, Liu, & Zhang, 2010) also has fabricated GO as a novel nanocarrier
for the loading and targeted deliveries of anticancer drug by functionalize it with
sulfonic acid and binding with folic acid. Compared to nanocomposite synthesized by
Yang et al. (Yang et al., 2009), this nanocomposite tends to load two anticancer drugs,
which are doxorubicin and camptothecin simultaneously. Since they have an efficient
loading property of multiple anticancer drugs, the therapeutic efficacy could be enhance
which lead to wide potential clinical practice (Zhang et al., 2010).
Titanium and its alloy is well known as electrochemical devices due to large surface
area, excellent mechanical properties, bioactivity and corrosion resistance (Yan et al.,
2015). With that, Yan et al. (Yan et al., 2015), has employed GO cross-linked gelatin as
reinforcement fillers in hydroxyapatite coating by electrochemical deposition process on
TiO2 nanotube arrays. The enlarged surface area of nanotubular surface of TiO2 offers a
huge active reaction sites for chemical reaction and develops the growth, adhesion, and
differentiation of the cell (Yan et al., 2015). Meanwhile, Wang et al. (Wang et al., 2010)
has exploring the sensing property of GO/aptamer-carboxyfluorescein in vitro and in
situ molecular probing in living cell. The effectual release to molecular targets in living

35
cells recommend that GO could be a decent vehicle to transport gene into cells,
shielding the loading genes from the enzymatic cleavage and empowering in situ
molecular probing in living cells (Wang et al., 2010).
2.4 Summary
In summary, recent studies on graphene oxide-based nanocomposites going
somewhat rapidly. Owing to their spectacular and unique properties, researchers have
been competing to develop novel nanocomposite with various synthesis methods. The
synthesis method plays avital role in order to produce a larger scale production and
control the quality of nanocomposite. At the same time, the methods should be efficient,
affordable, and safer for the environment. The present of GO also gives a great
contribution toward enhancing the performance of other material. Therefore, there a lot
more work need to be done in order to manipulate the two-dimensional GO sheets for
future advanced technology.

36
CHAPTER 3: DESIGN, METHODS AND PROCEDURE
3.1 Chemical reagents
All chemicals, which were purchased from Merck Co., were of analytical purity and
were used without further purification. Milli Q-Plus water (resistance, 18.3 MΩ) was
utilized for all experimental procedures. All experiments were carried out at
atmospheric air pressure.
3.2 Materials
Graphite flakes (code no. 3061) were purchased from Ashbury Inc. (NJ, USA).
Sulphuric acid (H2SO4, 98%), potassium permanganate (KMnO4, 99.9%), hydrogen
peroxide (H2O2, 30%), hydrochloric acid (HCl, 37%), and sodium hydroxide (NaOH,
99.99%) were purchased from Merck. Zinc nitrate hexahydrate (Zn (NO3)2.6H2O) was
purchased from Systerm, Malaysia. Gelatin and starch was obtained from Sigma-
Aldrich (St. Louis, MO). Distilled water was used throughout the sample preparation.
3.3 Synthesis
3.3.1 Preparation of exfoliated graphite GO
Exfoliated graphite oxide was prepared based on a modified Hummer’s method
(Hummers Jr & Offeman, 1958). Typically, graphite flakes were oxidized by mixing
H2SO4 and H3PO4 at a ratio of 4:1 (v/v) at room temperature. The graphite and
potassium permanganate were added slowly to the above mixture solution. Then, the
mixtures were stirred for three days to complete the oxidation of the graphite. After that,
hydrogen peroxide was added to stop the reaction. The mixture was sonicated and
washed with HCl and water several times until the pH became neutral. During the
washing and sonication process, the graphite oxide was exfoliated to graphene oxide
nanosheets (GONs). The product was dried in a vacuum oven overnight at 60°C. The
resulting product was a loose brown powder with a hydrophilic nature.

37
3.3.2 Preparation of ZnONPs+rGO composite by gelatin
First, GO was synthesized using Hummers’ method (Hummers Jr & Offeman, 1958).
Then, the ZnO NPs to be decorated on the sheets with different GO concentrations were
synthesized using a simple sol–gel method in a gelatin medium, which was used as a
polymerization agent. In this synthesis, analytical grade zinc nitrate hexahydrate
Zn(NO3)2.6H2O, gelatin (type B from bovine skin), and distilled water were used as the
starting materials. All the materials used were purchased from Sigma–Aldrich. First, a
gelatin solution was prepared by adding gelatin (1.25 g) to 50 ml of distilled water at 60
°C. The zinc nitrate (4.46 g) was dissolved separately in a minimal amount of distilled
water at room temperature, and solutions of GO with 0.9, 1.7, and 3.3 wt%/v
concentration were added to this zinc nitrate solution. Finally, the obtained solution was
added to the gelatin solution. After this, the compound solutions were stirred and heated
at 80 °C until a gel with a dark brown color was obtained. The gel was calcined at 300
°C for 1 h, at a heating rate of 2 °C/min. Finally, a post-annealing process was
performed for 2 h at 400 °C under an Ar gas atmosphere to remove the gelatin material
and obtain the final nanocomposite. The process is shown in Figure 3. 1 and Figure 3. 2.
Figure 3.1: Synthesis process of ZnO–NPs by gelatin

38
Figure 3.2: Schematic illustration of the formation mechanism of a
ZnONPs/rGO composite via a sol-gel method with gelatin
3.3.3 Preparation of ZnONPs+rGO composite by starch
ZnONPs were synthesized and decorated onto the resulting GO sheets via a sol–gel
method in a starch environment. In this synthesis, analytical grade zinc nitrate
hexahydrate (Zn (NO3)2.6H2O), starch and distilled water were used as the starting
materials. First, a starch solution was prepared by adding starch at 22 wt.%/v to 150 ml
of distilled water at 60°C. The zinc nitrate (4.46 g) was dissolved separately in 50 ml of
distilled water at room temperature, and a solution of GO with a 1.7 wt.%/v
concentration was added to this zinc nitrate solution. Finally, the resulting solution was
added to the starch solution. After this, the compound solutions were stirred and heated
at 80°C until a gel with a dark-brown colour was obtained (~12 h). The gel was calcined
at 350°C for 1 h at a heating rate of 2°C/min to obtain the composite. Eventually, the
product, ZnONPs+rGO, was obtained using centrifugation, washed with distilled water
and ethanol several times to remove the excess polymer and ions, and then dried at

39
60°C for 24 h in a vacuum oven. The as-synthesized ZnONPs+rGO composites with 0,
0.9, 1.7 and 3.3 wt.%/v GO were called ZnONPs, ZnONPs+rGO1, ZnONPs+rGO2 and
ZnONPs+rGO3, respectively. The process is shown in Figure 3. 3
Figure 3.3: Synthesis process of ZnO–NPs by starch
Furthermore, to optimize the experimental conditions for the preparation of pure
ZnONPs and ZnONPs+rGO, numerous samples with different parameters were
synthesized, as listed in Table 3. 1. The experimental mechanisms discussed above are
summarized in Figure 3. 4.

40
Table 3.1: Experimental conditions different for the preparation of ZnONPs
and ZnONPs+rGO
Sample
code
Temperatur
e(oC)
Time
(h)
Rate (
C/min)
GO
(wt.%/v)
Starch
(wt.%/v)
A
B
C
D
E
F
G
H
I
J
K
L
M
N
P
300
350
350
350
350
350
350
350
350
350
350
400
350
400
500
2
2
2
2
1
3
2
2
1
1
1
2
1
1
1
2
2
2
2
2
2
1
3
2
2
2
2
2
2
2
1.7
1.7
1.7
1.7
1.7
1.7
1.7
1.7
3.3
0.9
0
1.7
0
0
0
22
30
12
22
22
22
22
22
22
22
22
22
0
22
22
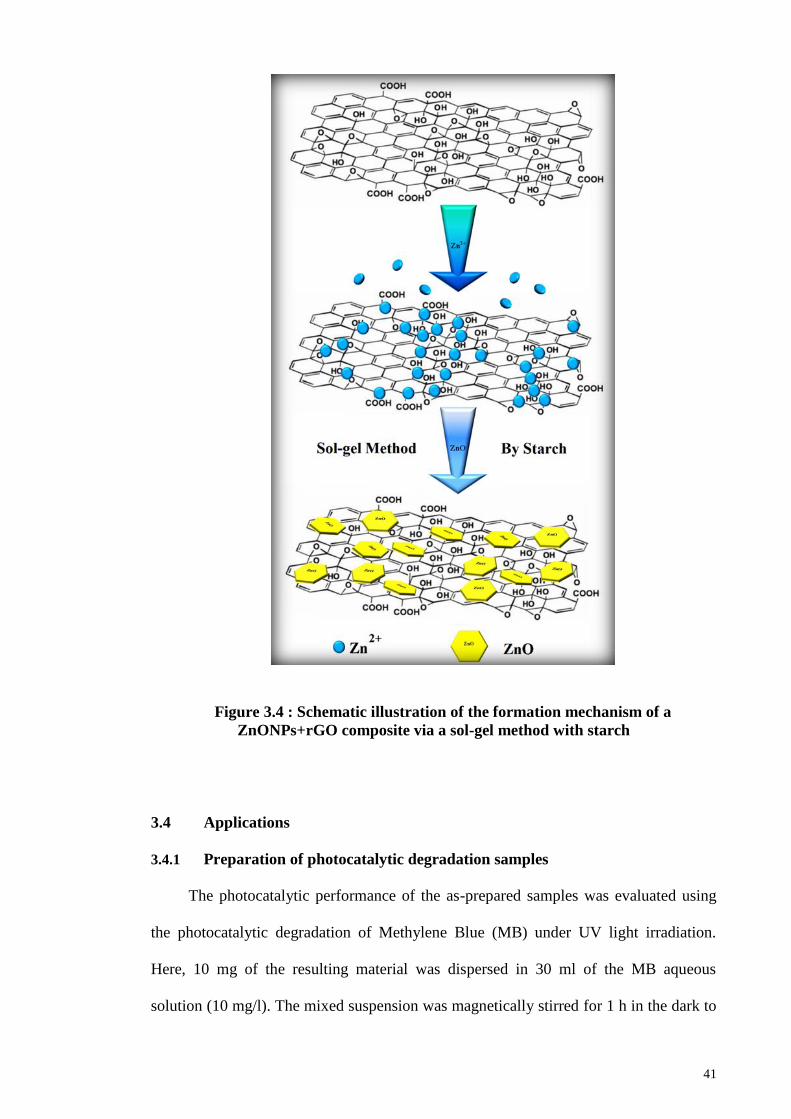
41
Figure 3.4 : Schematic illustration of the formation mechanism of a
ZnONPs+rGO composite via a sol-gel method with starch
3.4 Applications
3.4.1 Preparation of photocatalytic degradation samples
The photocatalytic performance of the as-prepared samples was evaluated using
the photocatalytic degradation of Methylene Blue (MB) under UV light irradiation.
Here, 10 mg of the resulting material was dispersed in 30 ml of the MB aqueous
solution (10 mg/l). The mixed suspension was magnetically stirred for 1 h in the dark to

42
reach an adsorption–desorption equilibrium. Under ambient conditions and stirring, the
mixed suspension was exposed to UV irradiation produced by a 500-W High-pressure
Hg lamp with the main wave crest at 365 nm for different times (1 to 6 h). At certain
time intervals, 2.5 ml of the mixed suspension was extracted and centrifuged to remove
the photocatalyst. The degradation process was monitored by measuring the absorption
of MB in the filtrate at 664 nm using a UV–vis absorption spectrometer.
3.4.2 Device fabrication and photocurrent measurements
All working electrodes were prepared using the doctor blade method (Barpuzary &
Qureshi, 2013; Kim et al., 2009; Ohsaki et al., 2005; Wengeler, Schmitt, Peters,
Scharfer, & Schabel, 2013). For the preparation of the working electrodes, all samples
were dispersed in a chitosan solution (0.5 wt.%/v) to form a 10 mg/ml solution and then
ultrasonicated for 5 min. Next, 0.1 ml of colloidal solution was dropped onto a cleaned
ITO surface (1×1 cm2) and then allowed to dry overnight at room temperature. The
solar cell devices were assembled using working electrodes that consist of ZnONPs,
ZnONPs+rGO1, ZnONPs+rGO2 and ZnONPs+rGO3 photoanode-modified ITO films
and Pt foil as a counter electrode, which were filled with the electrolyte in a 50-m-
thick spacer. The 3I / I liquid electrolyte consists of 0.5 M KI, 0.05 M I2, 0.6 M
tetrabutylammonium iodide and 0.5 M 4-tertbutylpyridine in acetonitrile. A PLS-
SXE150 halogen lamp (Beijing Perfectlight Technology Corp., China) was utilized as
an illumination source. The light intensity at the photoanodes was 20 mW/cm2, the area
illuminated by the photoanodes was 0.5 cm2, and the distance between the working
electrode and the lamp was approximately 40 cm. The photocurrent was recorded
continuously during the on and off period of the lamp. The transient photocurrent
measurements of the devices were performed using a potentiostat/galvanostat (Autolab
PGSTAT30) from Ecochemie (Netherlands). Finally, for a better understanding of the

43
actual size, configuration and structure of the device, the fabrication processes device is
shown in Figure 3. 5.
Figure 3.5: Actual size, configuration and structure of the fabricate solar cell
device of ZnONPs and ZnONPs+rGO2 composites. (a, b) colloidal solution was
dropped onto a cleaned ITO surface (1×1 cm2) and then allowed to dry overnight
at room temperature, (c, d) Pt foil, Spacer and ITO@GLASS for both samples, (e,
f) solar cell device of ZnONPs and ZnONPs+rGO2 composites respectively
3.5 Characterization techniques and instrumentation
In this section, the characterization methods and instruments that have been used in
this project are described. The prepared nanostructures were characterized by powder
X-ray diffraction (XRD), ultraviolet–visible (UV–vis) spectroscopy, Fourier-transform

44
infrared Spectroscopy (FTIR), Field emission scanning electron microscopy,
transmission electron microscopy (TEM) and high resolution transmission electron
microscope (HRTEM).
3.5.1 X-ray diffraction (XRD) analysis
X-ray diffraction is one of the primary techniques used by mineralogists and solid
state chemists to examine the physical-chemical make-up of unknown materials. Two
important characteristics can be obtained using the XRD pattern produced by this
technique. These include a fingerprint characterization of the crystallite materials and a
determination of their structure. The fundamental of XRD analysis are based on Bragg’s
law ( 2 sinhkln d ). According to this low, scattered waves originating from each
atom which are in the different planes, will be in phase with each other. Figure 3. 6
shows the requirements for this condition.
In our study, the phase evolutions and structure of the ZnO nanoparticles were
studied by Siemens D5000 XRD Diffractometer. The diffraction experiments were
applied at a fixed wavelength (λ, CuKα = 1.54056 Å) and different angles (2θ). The
ZnO (hexagonal) lattice parameters, e.g., the values of d, the distances between adjacent
crystal planes (hkl), were calculated from the Bragg equation, λ=2d sinθ; the lattice
constants a, b and c, inter planar angles, the angles φ between the planes (h1k1l1) of
spacing d1 and the plane (h2k2l2) of spacing d2 and the primary cell volumes, V, were
calculated from the Lattice Geometry equation (Cullity, 1956).
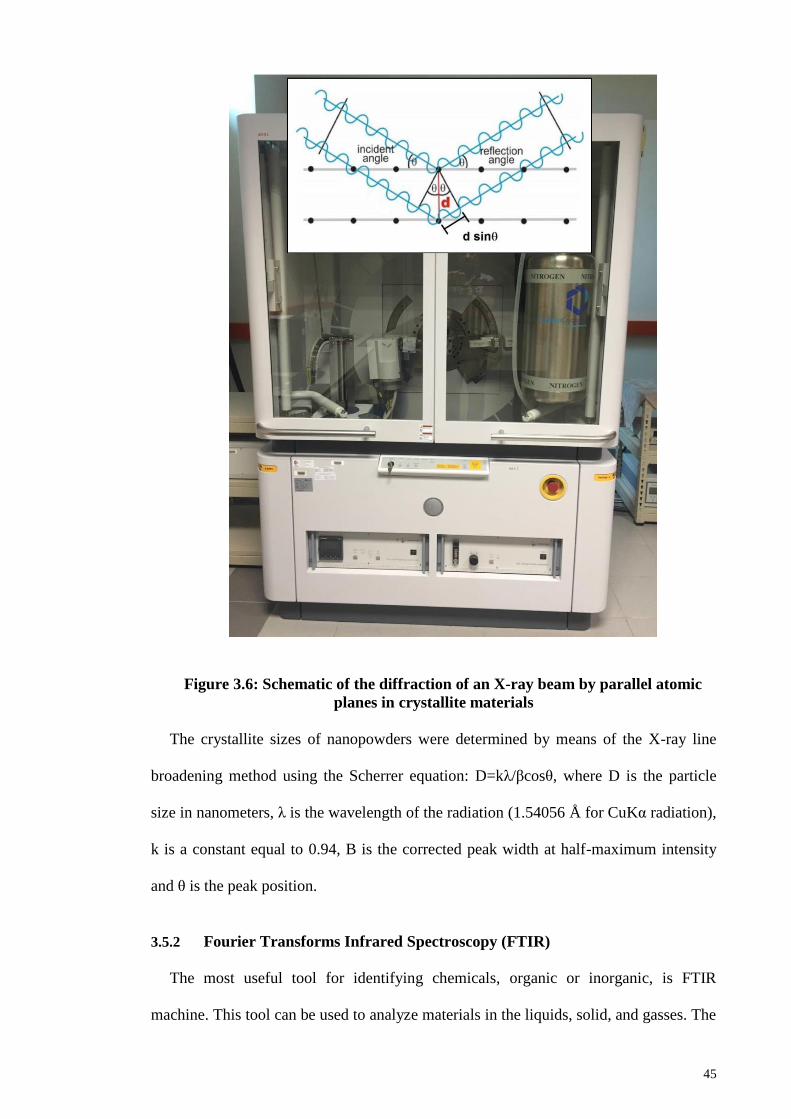
45
Figure 3.6: Schematic of the diffraction of an X-ray beam by parallel atomic
planes in crystallite materials
The crystallite sizes of nanopowders were determined by means of the X-ray line
broadening method using the Scherrer equation: D=kλ/βcosθ, where D is the particle
size in nanometers, λ is the wavelength of the radiation (1.54056 Å for CuKα radiation),
k is a constant equal to 0.94, B is the corrected peak width at half-maximum intensity
and θ is the peak position.
3.5.2 Fourier Transforms Infrared Spectroscopy (FTIR)
The most useful tool for identifying chemicals, organic or inorganic, is FTIR
machine. This tool can be used to analyze materials in the liquids, solid, and gasses. The

46
characteristic of the chemical bond can be detected from the wavelength of the absorbed
light as can be seen in the spectrum. The chemical bonds of the molecule can be
determined by studying the infrared absorption spectrum. Each pure compound has a
unique FTIR spectra that called fingerprint. Although the spectrum of an organic
material is very rich and detailed, inorganic compounds have a simple absorption
spectra. For example, ZnO has and absorption bond around 400 cm-1
. Therefore, the
unknown materials can be identified by comparison of their spectrum to a library of
known compounds. The FTIR machine that used was Fourier transform-infrared (FT-
IR) spectrometer (1650; Perkin Elmer,Waltham, MA). The absorption bonds between
280 to 4000 cm-1
can be detected by this machine which gives us this ability to detect
two of the absorption bonds of ZnO Figure 3. 7.
Figure 3.7: Schematic of the Fourier Transforms Infrared Spectroscopy (FTIR)

47
3.5.3 High resolution transmission electron microscope
HRTEM is a technique used to study the microstructure of the materials. This is a
tool that produce the two-dimensional image of the desired sample. In this technique, a
focused beam of electrons is projected and interact with the sample. This interaction
causes the scattering of electrons. So, by this way a final image is taken from the
incident and diffracted beam. The working principle of the HRTEM is similar to a
simple microscope. The projection lenses are used for the illumination of the sample,
and so the image of the sample is being projected on a screen. In HRTEM, the
electromagnetic lenses are used to give the pathway or to guide the beam of electrons
while in a simple microscope the glass lenses are used. In this thesis, Hitachi H-7100
and JEOL JEM-2100F TEM are used. In order to prepare sample for TEM, one or two
drops of the sample dispersed in water or ethanol followed by drop casting onto carbon
coated copper grid. The copper grid is placed in an oven to evaporate the excess solvent
Figure 3. 8.
Figure 3.8: Schematic of the high-resolution transmission electron microscope

48
3.5.4 Transmission Electron Microscopy (TEM)
Transmission electron microscopy (TEM) is a microscopy technique whereby a
beam of electrons is focused onto an ultra-thin specimen and transmitted through it,
interacting with the specimen as it passes through. As a result of this interaction, an
image is formed. The image is magnified and focused onto an imaging device, such as
layer of photographic film or fluorescent screen or is detected using a sensor (e.g., CCD
camera). In this work a Hitachi H-7100 electron microscopy is used in TEM studies. To
prepare sample to use for TEM, a little amount of powders was dispersed in ethanol.
The concentration of the suspension should be controlled and depends on the type of the
material. One or two drops of the solution are poured on top surface of copper grid. The
copper grid is placed in an oven at 40 °C for one day.
3.5.5 Field emission scanning electron microscopy (FESEM)
Scanning electron microscopy (SEM) is one of the most versatile and well known
analytical techniques. Compared to a conventional optical microscope, an electron
microscope offers advantages that include high magnification, large depth of focus, and
high resolution, as well as easy sample preparation and observation. In this technique,
electrons generated from an electron gun enter the surface of the sample and generate
many low energy secondary electrons. The intensity of these electrons is governed by
the surface topology of the sample. An image of the sample surface is therefore
constructed by measuring secondary electron intensity as a function of the position of
the scanning primary electron beam. In our microscopy lab, a state-of-the-art, high
resolution FEI Quanta 200F field emission scanning electron microscopy (FESEM)
from OXFORD is available. To prepare a sample from the powders, first, a little amount
of the powders was dispersed in acetone and then poured on top surface of a silicon
wafer, because silicon is conducting a clear picture can be obtained. Finally, the coated
silicon was dried at 50 °C for 1h Figure 3. 9.

49
Figure 3.9: Schematic of the Field emission scanning electron microscopy
(FESEM)
3.5.6 Ultraviolet-visible spectroscopy (UV-vis)
Ultraviolet and visible (UV-Vis) absorption spectroscopy can be described as the
measurement of the attenuation of a light beam after reflection from a sample surface or
after it passes through a sample. A single wavelength over an extended spectral range
can be used for absorption measurements. Infrared spectroscopy looks at vibrational
motions but ultraviolet-visible spectroscopy looks at transitions of electrons. Because,
ultraviolet and visible light are energetic enough to excite outer electrons to go to higher
energy levels. Although UV-Vis spectra have broad features that are of limited use for
sample identification, they are very helpful for quantitative measurements. UV-Vis
spectroscopy is used to characterize the absorption, transmission, and reflectivity of
several of technologically important materials, such as pigments, coatings, windows,
and filters. Also, it is used to calculate the optical properties of materials. For example,
the absorption spectrum can be used to calculate optical band gap. Several methods are

50
used for this, such as Kubelka–Munk model and first derivative methods as mentioned
in literature. For this work, the Thermal Scientific Evolution 300 UV-vis
spectrophotometer was used to get the absorption spectra of the materials in liquid
dispersed form in the range of 200 to 1000 nm, in powder form in the range of 300 to
750 nm.
3.5.7 Raman Spectroscopy
The Raman spectra of all ZnS-graphene composite were obtained using a CRM200
Confocal Raman Microscope (WITec GmbH, Ulm, Germany) employing a 532-nm
excitation wavelength to confirm the reduction of graphene. Excitation was provided by
a HeNe laser (Melles Griot). The exciting laser radiation was coupled into a Zeiss
microscope through a wavelength-specific single mode optical fiber. The incident laser
beam was collimated via an achromatic lens and passes a holographic band-pass filter
before it was focused onto the sample through the microscope objective. The sample is
located on a piezo-electrically driven microscope scanning stage with an x, y resolution
of ca. 3 nm and a repeatability of 5 nm, and z resolution of ca. 0.3 nm and 2 nm
repeatability. The Raman back-scattered radiation was detected by a back-illuminated
deep depletion, 1024×128 pixel charge-coupled device camera operating at -82ο .
3.5.8 Photoluminescence spectroscopy (PL)
The room temperature PL experimental set-up is the Renishaw System 2000. The PL
system is excited with a 20mW He-Cd laser working at 325nm (3.815eV) and is
detected in a back-scattering geometry through a photomultiplier and lock-in amplifier.
The low-temperature PL system is computer-based controlled. The sample is located in
a cryostat, which allows the measuring temperature to be adjusted from about 4 K to
room temperature. The resulting luminescence is collected through two lenses and is
coupled into a SPEX 750M monochromator by which the luminescence is then

51
spectrally dispersed. Then, a photomultiplier tube (PMT) that is suitable for detecting
light from near-UV to 1200 nm detects the dispersed luminescence. The DC signals
produced by the PMT are measured using a Stanford Research Systems SR830 lock-in
amplifier, and data are recorded and processed by computer system.

52
CHAPTER 4: CHAPTER IV: RESULTS AND DISCUSSIONS
4.1 Synthesis and characterization of ZnO NPs/reduced graphene oxide
nanocomposite prepared in gelatin medium as highly efficient photo-
degradation of MB
In this study, ZnO nanoparticles (NPs) were decorated on a graphene oxide (GO)
sheet via the sol–gel method in a gelatin medium. Long-chain gelatin compounds were
utilized to terminate the growth of the ZnO-NPs on GO and stabilize them. The
obtained products were post-annealed at 400 ο C to remove the gelatin and produce a
reduced graphene oxide (RGO) sheet. Microscopic studies showed that the NPs were
dispersed on the GO sheet. They had a spherical shape and a size of approximately 19
nm. In addition, these studies revealed that the NPs were single crystals. The X-ray
diffraction pattern of the NPs indicated a hexagonal (wurtzite) structure. The results of
Fourier transform infrared spectroscopy (FTIR) revealed that the GO sheet was
transformed into RGO by the post-annealing process. The obtained ZnO-NPs/RGO
nanocomposite was used as photocatalyst to remove methylene blue (MB).
Observations showed that the efficiency of the photocatalyst activity of the ZnO NPs
was significantly increased by RGO.
Figure 4. 1 shows FESEM and TEM images of the ZnO NPs that were decorated on
the GO sheet. It can be seen in the FESEM image (Figure 4.1 (a)) that the entire area of
the GO sheet is covered by the ZnO NPs. The inset of Figure 4. 1(a) shows that the ZnO
NPs have a spherical shape. The TEM image reveals that the ZnO NPs are dispersed on
the GO (Figure 4. 1(b)). In addition, the TEM image shows an average particle size of
approximately 192 nm for the NPs. The inset of Figure 1(b) shows an HRTEM image
of a single nanoparticle. As can be seen, the nanoparticle is a single crystal with a high
crystal quality, and there is no defect from a stacking fault. In addition, the HRTEM
image shows that the lattice distance is approximately 0.26 nm, which is consistent with

53
the distance along the c-axis of a bulk wurtzite ZnO crystal. Therefore, based on the
HRTEM image, the nanoparticles were grown along the [001] direction without any
defects.
Figure 4.1: (a) FESEM image of ZnO-NPs on the GO sheet. The inset shows
ZnO nanoparticles that were deposited on the GO. (b) TEM image of dispersed
ZnO NPs on the GO. The inset shows an HRTEM image of a single ZnO
nanoparticle
The XRD patterns of the obtained products are shown in Figure 4. 2 The XRD
pattern of GO indicates an intense and sharp diffraction peak at 2θ=10.6ο, attributed to
the (001) lattice plane corresponding to a d-spacing of 0.83 nm. This is consistent with
the lamellar structure of GO. In addition, Figure 4. 2 shows the XRD pattern of the

54
ZnO-NPs that are decorated on the GO sheet. All the detectable peaks can be indexed to
the ZnO wurtzite structure (Ref. code: 00-036- 1451). It can be seen that there are no
peaks from GO or other impurities in the XRD pattern of the ZnO NPs. This could be
due to the transformation of GO to RGO, with the RGO peaks not appearing because of
the strong peak of the ZnO NPs in the XRD pattern. However, additional
characterization is needed to explain this phenomenon.
Figure 4.2: XRD patterns of the GO sheet and ZnO-NPs/GO composite
Figure 4. 3 shows the FTIR spectra of the pristine GO and ZnO NPs/ GO
nanocomposite. In the FTIR spectrum for GO, the broad peak centered at 3190 cm-1
is
attributed to the O–H stretching vibrations, and the peaks at 1731, 1625, 1183, and 1040
cm-1
are assigned to the C=O stretching, sp2-hybridized C=C group, O–H deformation,
C–OH stretching, and C–O stretching, respectively (Shen et al., 2011). In contrast, the
peaks at 1731 and 1183 cm-1
are missing from the FTIR spectrum of the ZnO-NPs/GO
nanocomposite, which indicates the reduction of GO and its transformation into RGO
(Ren, Yan, Ji, Chen, & Li, 2011; Zou, Zhu,Sun, & Wang, 2011). In fact, the post-
annealing process at 400 οC not only removed the gelatin but also caused the
transformation of GO to RGO. Therefore, the obtained nanocomposite consisted of ZnO

55
NPs decorated on an RGO sheet. The broad peak at 3250 cm-1
in the FTIR spectrum of
the ZnO-NPs/GO nanocomposite might be attributed to the O–H stretching vibration of
absorbed water molecules. In addition, the FTIR spectrum of ZnO-NPs/RGO shows a
peak at 431 cm-1
. The band at 431 cm-1
corresponds to the E2 mode of hexagonal ZnO
(Raman active) (Zak, Abd Majid, Darroudi, & Yousefi, 2011).
Figure 4.3: FTIR spectra of the GO sheet and ZnO-NPs/RGO composite
UV–vis absorption spectra of ZnO NPs and ZnO-NPs/RGO at room temperature
are shown in Figure 4. 4 These spectra reveal a characteristic absorption peak for ZnO
at a wavelength of 360 for both samples, which can be assigned to the intrinsic bandgap
absorption of ZnO, owing to the electron transitions from the valence band to the
conduction band (O2p-Zn3d) (Sáaedi et al., 2013). As can be seen, the peak position of
the UV–vis spectrum of ZnO NPs has not been affected by the graphene. However, it is
observed that the absorbance of the ZnO-NPs/RGO composite increases in comparison
to the absorbance of the ZnO NPs. Such an increase in absorbance may be due to the
absorption contribution from RGO, the increase in the surface electric charge of the
oxides, and the modification of the fundamental process of electron–hole pair formation

56
during irradiation (Xu, Zhang, Cheng, & Zhu, 2011). Therefore, the presence of RGO in
ZnO can increase the light absorption intensity and range, which is beneficial to the
photocatalytic performance.
Figure 4.4: UV–vis absorption spectra of the GO sheet and ZnO-NPs/RGO
composite
Figure 4. 5 (a) illustrates the optical absorption spectra of the MB aqueous solution
with 10 mg of the as-prepared ZnO-NPs/ RGO composite after exposure to UV light
irradiation for different intervals of times. It can be seen that the intensity of the
absorption peak of MB at 663 nm decreases with an increase in the irradiation time,
which indicates that the MB molecules are degraded by the catalysis. Figure 4. 5 (b)
shows the relative concentration (Ct/C0) of MB as a function of time, where Ct is the
concentration of MB at the irradiation time t, and C0 is the concentration of the dye
before irradiation. The result is plotted against those of the as-prepared ZnO-NPs/ RGO
and ZnO NPs under same conditions. The MB solution was degraded by as much as
99.5% by the ZnO-NPs/RGO and by approximately 63% by the ZnO NPs. This
indicates the higher photocatalytic activity of the ZnO-NPs/RGO. In fact, the wide
surface of RGO causes the ZnO NPs to disperse. Therefore, the dispersed NPs absorb
more light and generate more electron–hole pairs to remove dye molecules.

57
Figure 4.5: (a) The UV–vis absorbance of MB over time during photocatalytic
degradation under UV light irradiation using ZnO-NPs/RGO. (b) Photocatalytic
degradation of MB by ZnO NPs and ZnO-NPs/RGO under UV light irradiation
4.2 Effects of graphene oxide concentration on optical properties of ZnO/RGO
nanocomposites and their application to photocurrent generation
In this study, the effects of different concentrations of graphene oxide (GO) on the
structure and optical properties of ZnO nanoparticles (NPs) were investigated. The
nanocomposites were synthesized via the sol-gel method in a gelatin medium. X-ray
diffraction patterns (XRD) and Fourier transform infrared spectroscopy indicated that
the GO sheets were reduced and changed to reduced GO (RGO) during the calcination
of the nanocomposites at 400 ο C. In addition, the XRD patterns of the NPs indicated a
hexagonal (wurtzite) structure for all the products. Microscopic studies showed that the
NPs were decorated and dispersed on the RGO sheets very well. However, these studies
revealed that the RGO concentration had an effect on the crystal growth process for the
ZnO NPs. Furthermore, these studies showed that the NPs could be grown with a single
crystal quality in an optimum RGO concentration. According to the XRD results that
were obtained from pure ZnO NPs, the calcinations temperature was decreased by the
RGO. UV–vis and room temperature photoluminescence studies showed that the optical
properties of the ZnO/RGO nanocomposite were affected by the RGO concentration.
Finally, the obtained ZnO/RGO nanocomposite was used to generate a photocurrent.

58
Observations showed that the photocurrent intensity of the nanocomposite was
significantly increased by increasing the RGO, with an optimum RGO concentration.
The XRD patterns of the obtained products are shown in Figure 4. 6. The XRD
pattern of GO indicates an intense and sharp diffraction peak at 2θ=10.6ο, which is
attributed to the (001) lattice plane corresponding to a d-spacing of 0.83 nm. This is
consistent with the lamellar structure of GO. In addition, Figure 4. 6 shows the XRD
patterns of the ZnO/GO composites with low (RGO1), mid (RGO2), and high (RGO3)
GO concentrations. All of the detectable peaks can be indexed to the ZnO wurtzite
structure (Ref. code: 00-036-1451). As can be seen, there are no peaks from GO or other
impurities in the XRD patterns of the ZnO/GO composites. This could be due to the
transformation of GO to RGO, with the RGO peaks, which are shown in Figure 4. 6, not
appearing here because of the strong peak for the ZnO in the XRD patterns. However,
the intensities of the XRD peaks decrease with an increase in the GO concentration.
This could be because the amount of ZnO decreased in the composite, which resulted in
a decrease in the XRD peak intensities.
Figure 4.6: XRD patterns of the GO, RGO sheets and ZnO/RGO
nanocomposites with different concentrations of the GO

59
Figure 4. 7 shows the FTIR spectra of the pristine GO, gelatin powder, and ZnO-
NPs/RGO nanocomposites. In the FTIR spectrum for GO, the broad peak centered at
3190 cm_1 is attributed to the O–H stretching vibrations, and the peaks at 1731, 1625,
1183, and 1040 cm-1
are assigned to the C=O stretching, sp2-hybridized C=C group, O–
H deformation, C–OH stretching, and C–O stretching, respectively(Hummers Jr &
Offeman, 1958). In contrast, the peaks at 1731, 1183, and 1040 cm-1
are missing from
the FTIR spectra of the ZnO-NPs/GO nanocomposites, which indicate the reduction of
GO and its transformation into RGO (Huang et al., 2014; Ren et al., 2011). In addition,
FTIR spectrum of gelatin powder is shown in Figure 4. 7. It can be seen that the
gelatin’s peaks are decreased dramatically in the FTIR spectra of the ZnO-NPs/RGO
nanocomposites. In fact, the post-annealing processes at 400 ο
C not only caused the
transformation of GO to RGO but also removed the gelatin, which is good agreement
with the XRD results. In addition, the FTIR spectra of ZnO-NPs/RGO show a peak at
437 cm-1
. The band at 437 cm-1
corresponds to the E2 mode of hexagonal ZnO (Raman
active) (Zak, Abd Majid, et al., 2011). Therefore, the obtained nanocomposite consisted
of ZnO NPs decorated on an RGO sheet.
Figure 4.7: FTIR spectra of the GO sheet, gelatin powder, and ZnO-NPs/RGO
composites

60
Figure 4. 8(a-c) show TEM images of the ZnO/RGO composites with different
concentrations for the RGO sheets. The TEM images reveal that the ZnO NPs are
decorated and dispersed on the RGO sheets. However, this dispersion is less for
ZnO/RGO1 than for the other samples. Figure 4. 8 (c) shows that the ZnO population in
ZnO/RGO3 is less than that in the other samples. This explains why the XRD peak
intensities decreased with an increase in the GO concentration. In addition, the TEM
images show an average particle size of approximately 19.6 nm for the NPs in all
samples. Figure 4. 8 (a'–c') show HRTEM images of single nanoparticles from sheets
with different RGO concentrations. These HRTEM images show that the concentration
of the RGO sheet affects the crystalline quality of the NPs. It can be observed that there
are several areas of damage and defects for the ZnO nanoparticles, which were grown
on the sheets with the low and high concentrations of RGO (Figures 4. 8(a') and 4.
8(c')). On the other hand, the crystalline space of the ZnO/RGO2 nanocomposite is clear
and shows a nondefective structure for the nanoparticle (Figure 4. 8(b')). In fact, the
HRTEM results are in good agreement with the XRD results. In addition, the HRTEM
image of the ZnO/RGO2 nanocomposite shows that the lattice distance is approximately
0.26 nm (Figure 4. 8(b')), which is consistent with the distance along the c-axis of a bulk
wurtzite ZnO crystal. Therefore, based on the HRTEM image, the nanoparticles were
grown along the [001] direction without any defects.

61
Figure 4.8: TEM image of the ZnO/RGO nanocomposites with (a) low RGO
concentration (ZnO-NPs/RGO1), (b) mid RGO concentration (ZnO-NPs/RGO2),
and (c) high RGO concentration (Zn ONPs/ RGO3). HRTEM image of the ZnO
NPs that were decorated on the RGO sheet with (a') low RGO concentration, (b')
mid RGO concentration, and (c') high RGO concentration

62
Figure 4. 9 shows TEM image of the ZnO/RGO2 nanocomposites with more
details. As can be seen, the NPs were dispersed on the RGO sheet very well. In addition,
it can be observed that most of the NPs have a hexagonal shape.
Figure 4.9: High magnification of TEM image of the ZnO/RGO2
nanocomposites
To better understand the effects of the RGO sheets on the growth process for the
ZnO NPs, ZnO NPs were synthesized without graphene at 400 and 500 ο C. The XRD
patterns of these conditions are shown in Figure 4. 10. It can be observed that the XRD
pattern of the NPs that were sintered at 400 ο C indicates a low crystalline quality. On
the other hand, the XRD pattern of the NPs that were sintered at 500 ο
C indicates a
good crystalline quality. In addition, the TEM images for NPs sintered under these
conditions confirm the XRD results (Figure 4. 11). Furthermore, these TEM images
show that the NPs were not very well dispersed without the RGO sheet. According to
the obtained results, it can be concluded that the RGO sheets not only play a role as a
dispersion site for the NPs but also play a role as a useful site to grow ZnO NPs. In fact,
the RGO sheets could decrease the calcination temperature. The widely-accepted
mechanism for the synthesis of graphene decorated with inorganic nanostructures is the
attraction of positively charged metal ions by the polarized bonds of the functional

63
groups on the GO. The attachment of these metal ions to the surface and edges of the
GO results in a redox reaction and the formation of nucleation sites, which eventually
lead to the growth of nanostructures on the 2-D graphene sheets (Xue et al., 2011).
Figure 4.10: XRD patterns of the pure ZnO NPs that were grown by 400 and
500 ο C temperature
Figure 4.11: TEM image of the pure ZnO NPs that were grown at (a) 400 ο C
and (b) 500 ο C
Optical studies were carried out using UV–vis and PL spectrometers. Figure 4.
12(a) shows the UV–vis spectra of the pure ZnO NPs that were sintered at 400 ο C and

64
the ZnO/ RGO nanocomposites with sheets having different RGO concentrations. The
UV–vis spectra reveal a characteristic absorption peak for ZnO at a wavelength of 360
nm for all the samples, which can be assigned to the intrinsic band-gap absorption of
ZnO, owing to the electron transitions from the valence band to the conduction band
(O2p Zn3d) (Sáaedi et al., 2013). As can be seen, the peak position of the UV–vis
spectrum of the ZnO NPs has not been affected by the graphene. However, it is
observed that the absorbance of the ZnO/RGO nanocomposites increases in comparison
to the absorbance of the ZnO NPs until an optimum concentration of graphene. Such an
increase in absorbance may be due to the absorption contribution from RGO, the
increase in the surface electric charge of the oxides, and the modification of the
fundamental process of electron–hole pair formation during irradiation (Xu et al., 2011).
Therefore, the presence of RGO in ZnO can increase the light-absorption intensity and
range, which is beneficial to the optoelectronic performance. However, increasing the
graphene concentration beyond an optimum content could affect the crystalline quality
of the ZnO NPs, which were decorated on the RGO, as a result of a decrease in the ZnO
NPs population on Zn/RGO3 nanocomposites.
Figure 4. 12(b) shows the PL spectra of the products. A significant difference can
be seen between the PL spectrum of the pure ZnO NPs, which were grown at 400 ο C,
and that of the ZnO/RGO nanocomposites. The PL spectrum of the pure ZnO NPs
shows no detectable UV peak and a strong and broad peak in the visible region. The UV
emission is also called the near-band-edge (NBE) emission because of the
recombination of free excitons through an exciton–exciton collision process. It has been
suggested that the green band emission (deep level emission (DLE)) corresponds to a
singly ionized oxygen vacancy in ZnO and results from the recombination of a photo-
generated hole with the singly ionized charge state of this defect. Therefore, Figure 4.
12(b) shows that the ZnO NPs have very high concentrations of oxygen vacancies.

65
However, the intensity of the UV peak is increased and that of the visible peak is
decreased by increasing the graphene concentration. However, the UV/DLE ratio of the
ZnO/ RGO2, which is one of the main factors that is usually used for comparing the
optical properties of samples, is bigger than the UV/DLE ratios of the other
nanocomposites. Therefore, the ZnO/RGO2 nanocomposites have a better relative
crystalline quality. According to these results, it can be understood that the graphene
concentration has an optimum value in relation to improving the optical quality of the
ZnO NPs. In fact, the optical study results are in good agreement with the XRD and
TEM results. Therefore, the ZnO/RGO2 nanocomposite is the best composite of ZnO
and RGO for improving the crystalline and optical quality of the ZnO NPs, which were
sintered at a lower temperature than is normally used to grow pure ZnO NPs by the sol–
gel method in a gelatin medium.
Figure 4.12: (a) UV-vis spectra of the pure ZnO NPs, ZnO/RGO1, ZnO/RGO2,
and ZnO/RGO3 nanocomposites. (b) PL spectra of the pure ZnO NPs, ZnO/
RGO1, ZnO/RGO2, and ZnO/RGO3 nanocomposites
Figure 4. 13 shows the Raman spectrum of the ZnO/RGO2 nanocomposite. It is
established that the graphene obtained by the chemical reduction of GO exhibits two
characteristic main peaks: the D band at 1361 cm-1
arising from a breathing mode of j-
point photons of A1g symmetry and the G band at 1604 cm-1
arising from the first order
scattering of the E2g phonons of sp2 C atoms (Gao et al., 2010). In comparison to the
pristine GO, the Raman spectra of the ZnO/RGO2 nanocomposite show that the D and

66
G bands shifted to lower wave numbers at 1346 and 1593 cm-1
, respectively. This is
because of the reduction process for the GO, which can be supported by gelatin as the
reducing, capping, and stabilizing agent (Liu et al., 2011). In addition to the peaks
associated with the D and G bands of graphene, the Raman spectrum of the ZnO/RGO2
nanocomposite has one sharp peak at 437 cm-1
corresponding to the E2 (high) mode of
the Raman active mode, a characteristic peak for the wurtzite hexagonal phase of ZnO,
which is in good agreement with the FTIR results. The Raman results confirmed that the
ZnO/RGO2 nanocomposite was composed of graphene nanosheets and pure ZnO.
Figure 4.13: Raman spectrum of the ZnO/RGO2 nanocomposites
Figure 4. 14 shows the photocurrent responses of ZnO NPs and ZnO/RGO
nanocomposites with different concentrations of GO. The photocurrent generation was
increased by the introduction of graphene nanosheets. A plausible reason is that the
photogenerated electrons on the conduction band of ZnO NPs are trapped by the
graphene nanosheets, which prevents the photogenerated electrons and holes from
recombining (Ferrari et al., 2014). In addition, the photocurrent generation of the ZnO/
RGO nanocomposite increases with an increase in the concentration of RGO. In fact,
the charge separation efficiency increases due to the electronic interaction between ZnO

67
and RGO in the composite. However, a further increase in the RGO concentration leads
to a decrease in the photocurrent generation. The reason is the same as that described in
the sections on the XRD and PL studies. In fact, the decrease in the ZnO NP population
due to an increase in the GO concentration causes a decrease in the photogenerated
electrons and holes. Hence, the optimum concentration of GO is a very important factor
that should be considered to generate a high current density. A comparison results
between the present work and previous report show that efficiency of the photocurrent
in the present work is 50% higher than the photocurrent efficiency of the ZnO/RGO
nanocomposites that were synthesized by a simple chemical bath deposition (Tian et al.,
2012). but it is around 60% and 80% lower than other complex, expensive, and time-
consuming techniques (Fu et al., 2012; Luo et al., 2012). However, the advantage of our
method to obtain these results is its simplicity. In addition, the sol-gel method that has
been used in this research is a cost-effective method that is most important to synthesize
this type of nanocomposites for different applications.
Figure 4.14: Photocurrent response of the ZnO NPs and ZnO/RGO
nanocomposites with different concentrations of the RGO

68
4.3 One-pot sol–gel synthesis of reduced graphene oxide uniformly decorated
zinc oxide nanoparticles in starch environment for highly efficient
photodegradation of Methylene Blue
In this study, ZnO NPs+reduced graphene oxide (rGO) nanocomposites were
synthesized using a sol–gel method with starch as the polymerisation agent. Long-chain
starch compounds were used to terminate the growth of the ZnO NPs on rGO and
stabilise them. The resulting products were annealed at 350°C to remove the starch and
produce a reduced graphene oxide (rGO) sheet in one-pot without any post-annealing
processes. Microscopic studies showed that the NPs were dispersed on the rGO sheet.
They had a spherical shape and a size of approximately 2510 nm. In addition, these
studies revealed that the NPs were single crystals. The X-ray diffraction pattern of the
NPs indicated a hexagonal (wurtzite) structure. The results of Fourier transform infrared
spectrum analysis (FTIR) revealed that the GO sheet was transformed into rGO via the
sol-gel method in the starch environment. The results of photoluminescence
spectroscopy demonstrated that the incorporation of reduced graphene oxide (rGO)
sheets with ZnO NPs suppressed the electron–hole recombination of the composite.
Therefore, a significant enhancement in the photocatalytic degradation of methylene
blue (MB) was observed with the ZnO NPs + rGO nanocomposite compared to the bare
ZnO nanoparticles.
4.3.1 Crystalline structure
The XRD patterns of the resulting products are shown in Figure 4. 14. The XRD
pattern of GO indicates an intense and sharp diffraction peak at 2θ = 10.6°, attributed to
the (001) lattice plane corresponding to a d-spacing of 0.83 nm, which is consistent with
the lamellar structure of GO. In addition, Figure 4. 15 shows the XRD pattern of the
ZnO NPs that were decorated on the rGO sheet. All of the detectable peaks can be

69
indexed to the ZnO wurtzite structure (JCPDS card no: 00-036-1451). There are no
peaks from GO or other impurities in the XRD pattern of the ZnO NPs. This result
could be because of the transformation of GO to rGO; the rGO peaks do not appear here
because of the strong peak for the ZnO NPs in the XRD pattern. Furthermore, this
pattern shows the XRD results for the ZnO NPs. The ZnO NPs, which were synthesized
under the same conditions in a starch environment, do not show crystalline behaviour.
Thus, the GO sheets can use a reduced calcination temperature to form ZnO crystals in
starch environments. Further characterisations will also confirm these results.
Figure 4.15: XRD patterns of the GO sheet, ZnO NPs, and ZnO NPs+rGO
nanocomposite
4.3.2 Microstructure
Figure 4. 15 shows TEM images of the ZnO NPs that were decorated on the rGO
sheet. The TEM images show that the ZnO NPs had spherical shapes. The TEM images
at different magnifications (1 m–2 nm) reveal that the ZnO NPs were dispersed on the
rGO (Figure 2(a–f)). In addition, these images show that the average particle size was
approximately 25 ± 10 nm. The inset of Figure 2(f) shows an HRTEM image of a single
nanoparticle. As observed, the nanoparticle is a single crystal with a high crystal quality,
and there are no defects from stacking faults. Furthermore, the HRTEM image shows

70
that the lattice distance is approximately 0.27 nm, which is consistent with the distance
along the c-axis of a bulk wurtzite ZnO crystal. Therefore, based on the HRTEM image,
the nanoparticles were grown in the [001] direction without any defects. Finally, figure
4. 16 (a, b) shows size histograms of the ZnO NPs below the relative TEM images.
These histograms indicate that the main particle sizes of the ZnO NPs calcined at a
temperature of 350°C were approximately 25 ± 10 nm. The TEM and size distribution
results confirm that a narrow size distribution can be obtained for ZnO NPs prepared in
a starch environment and calcined at a temperature of 350°C. Meanwhile, we used the
iSolution software to calculate the particle sizes.
Figure 4.16: TEM images low-magnification; (a), (b) high-magnification; (c) -
(e) and (f) HRTEM images of ZnO NPs+rGO

71
Figure 4.17: Size distribution diagrams of ZnO NPs+rGO by histogram curve
4.3.3 Chemical Composition
Figure 4. 18 shows the FTIR spectra of the pristine GO, starch powder, ZnO NPs,
and ZnO NPs + rGO nanocomposites. In the FTIR spectrum of GO, the broad peak
centred at 3190 cm-1
is attributed to the O–H stretching vibrations, and the peaks at
1731, 1625, 1183, and 1040 cm-1
are assigned to the C=O stretching, sp2-hybridised
C=C group, O–H deformation, C–OH stretching, and C–O stretching, respectively
(Hummers & Offeman, 1958). In contrast, the peaks at 1731, 1183, and 1040 cm-1
are
missing from the FTIR spectra of the ZnO NPs+rGO nanocomposites, which indicate
the reduction of GO and its transformation to rGO (Peng-Gang, Ding-Xiang, Xu, Tao,
Zhong-Ming, 2011; Zou, Zhu, Sun, & Wang, 2011). In addition, the FTIR spectrum of
starch powder is shown in Figure 4. 18. The peaks of the starch are dramatically smaller
in the FTIR spectra of the ZnO NPs+rGO nanocomposites. In fact, the annealing
process at 350°C caused the transformation of GO to rGO and removed the starch,

72
which is in good agreement with the XRD results. In addition, the FTIR spectrum of the
ZnO NPs+rGO shows a peak at 437 cm-1
. The band at 437 cm-1
corresponds to the E2
mode of hexagonal ZnO (Raman active) (Jan et al., 2014). Therefore, the resulting
nanocomposite consisted of ZnO NPs decorated on an rGO sheet. A weak peak appears
at 437 cm-1
for the pure ZnO NPs. Therefore, the FTIR results also show that pure ZnO
NPs cannot form at 350°C in a starch environment.
Figure 4.18: FTIR spectra of the GO sheet, starch powder, ZnO NPs, and ZnO
NPs+rGO nanocomposites
4.3.4 Optical properties
Figure 4. 19 shows the Raman spectrum of the ZnO NPs+rGO nanocomposite.
The graphene obtained from the chemical reduction of GO exhibits two characteristic
main peaks: the D band at ~1365 cm-1
, which arises from a breathing mode of -point
photons with A1 g symmetry, and the G band at ~1610 cm-1
, which arises from the first-
order scattering of the E2 g mode phonons of the sp2-bonded carbon atoms (Gao et al.,
2010). The D and G band positions and intensity ratios of I(D)/I(G) for the GO and ZnO
NPs+rGO composites, prepared using the sol–gel method, are summarised in Table 4. 1.

73
Table 4.1: D and G peak positions and intensity ratios of I(D)/I(G) (obtained by
Raman analysis) of GO and ZnO NPs+rGO composites prepared Sol-gel method
In comparison to the pristine GO, the Raman spectrum of the ZnO NPs+rGO
nanocomposite shows that the D and G bands shifted to lower wave numbers at ~1357
and ~1600 cm-1
, respectively, because of the reduction process for the GO, which can
be supported by starch as the reducing, capping, and stabilising agent (Liu et al., 2011).
In addition to the peaks associated with the D and G bands of graphene, the Raman
spectrum of the ZnO NPs+rGO nanocomposite shows a sharp and narrow peak at 437
cm-1
corresponding to the E2 (high) mode of the Raman active mode, a characteristic
peak for the wurtzite hexagonal phase of ZnO. The Raman results confirmed that the
ZnO NPs+rGO nanocomposite was composed of graphene nanosheets and pure ZnO.
Figure 4.19: Raman spectrum of the ZnO NPs+rGO nanocomposites
GO ZnONPs+rGO
D band (cm-1
)
G band (cm-1
)
I(D)/I(G)
1365
1610
0.81
1357
1600
1.13

74
The UV–vis absorption spectra of the ZnO NPs and ZnO NPs+rGO at room
temperature are shown in Figure 4. 19. These spectra reveal a characteristic absorption
peak for ZnO at a wavelength of ~360 nm for ZnO NPs and ~375 nm for the ZnO NPs
+ rGO samples due to the electron transitions from the valence band to the conduction
band (O2p→Zn3d), which can be assigned to the intrinsic band-gap absorption of ZnO
(Yu, Yu, Cheng, & Zhou, 2006). Furthermore, it is observed that the sharp characteristic
absorption peak at 365 nm indicates the existence of good crystalline and impurity
suppressed ZnO NPs (Lv et al., 2011; Lv, Pan, Liu, & Sun, 2012). As observed, the
small redshift (~15 nm) of the absorption edge compared to pure ZnO should be
attributed to the chemical bonding between ZnO and rGO, which is similar to the result
in the case of ZnO NPs + rGO composite materials (Liu et al., 2012; Lv et al., 2011).
However, it is observed that the absorbance of the ZnO NPs+rGO composite increases
in comparison to the absorbance of the ZnO NPs. This increase in absorbance may be
due to the absorption contribution from rGO, the increase in the surface electric charge
of the oxides, and the modification of the fundamental process of electron–hole pair
formation during irradiation (Xue et al., 2011). Therefore, the presence of rGO in the
ZnO can increase the light absorption, which is beneficial to the photocatalytic
performance.
Figure 4.20: UV-vis spectra of the pure ZnO NPs and ZnO NPs+rGO
nanocomposites

75
4.3.5 Photocatalytic measurements
4.3.5.1 MB Degradation
Figure 4. 21 illustrates the optical absorption spectra of the MB aqueous solution
with 10 mg of the as-prepared ZnO NPs+rGO composite after exposure to UV-vis light
irradiation for different intervals of times. The intensity of the absorption peak of the
MB at 663 nm decreases with an increase in the irradiation time, which indicates that
the MB molecules are degraded by the catalysis.
Figure 4.21: The UV-vis absorbance of MB over time during photocatalytic
degradation under UV-vis light irradiation using ZnO NPs+rGO
Further experiments were performed to compare the effect of graphene oxide on
the catalytic activity of the as-prepared ZnO NPs (sample L), and the results are shown
in Figure 4. 22. The samples K and J with concentrations of 0.9 and 3.3 GO (wt.%/v),
respectively, and F, which is the same ZnO NPs + rGO with a concentration of 1.7 GO
(wt.%/v) of the composite, show significant improvements and higher efficiencies in the
photodegradation of MB compared to the pure ZnO NPs. The efficiency for bare ZnO

76
NPs is 37%, and nearly 63% of the primary dye still remained in the solution for pure
ZnO NPs. For the K and J composites over the same time interval as the ZnO NPs, the
efficiency has increased to 86% and 88% for sample K and sample J, respectively, and
reached a maximum value of 92.5% for ZnO NPs + rGO (sample F) (Table 4. 2).
Table 4.2: Photocatalytic degradation percent of MB on samples
Sample GO (wt.%/v) Degradation efficiency
(%)
ZnO NPs (Sample L)
Sample K
Sample J
ZnO NPs+rGO
(Sample F)
0
0.9
3.3
1.7
37%
86%
88%
92.5%
In general, the degradation efficiency of MB dye was calculated using the
following expression:
𝐷(%) = [1 −𝐶𝑡
𝐶0] × 100 (1)
(Sookhakian, Amin, & Basirun, 2013)
Where 𝐶0 is the absorbance of MB in dark and 𝐶𝑡 is the absorbance of MB under
light irradiation conditions at time t minutes.

77
Figure 4.22: Degradation rate of MB at different intervals with and without
catalyst
The photocatalytic rate constant for the MB degradation (k) was determined from
the first-order plot using the following equation:
ln(C0
Ct) = kt (2) (Fu et al., 2013)
Here, C0 is the initial absorbance, Ct is the absorbance after time t, and k is the
first-order rate constant. Figure 4. 23 shows this plot for the ZnO NPs and ZnO
NPs+rGO nanocomposites. The calculated rate constants for the ZnO NPs and ZnO
NPs+rGO nanocomposites were 0.011 and 0.023 min-1
, respectively.
Figure 4.23: Kinetic study of photocatalytic MB degradation using ZnO NPs
and ZnO NPs + rGO

78
The stability test of photocatalytic degradation of MB by ZnO NPs + rGO under
UV-vis light irradiation was performed and illustrated in Figure 4. 24. The
photocatalytic measurement was performed with five consecutive cycles, each for 120
min. There was no significant decrease in the photodegradation efficiency, indicating
perfect reuse and performance of the ZnO NPs + rGO composite.
Figure 4.24: Photo-stability of ZnO NPs + rGO by investigating its
photocatalytic activity under UV light irradiation with five times of cycling uses
In addition, for stability of the nanocatalyst, the nanocomposites were characterised
using XRD and FTIR after five treatments (600 min). These results are shown in Figure
4. 25 (a, b). No difference between these results and the first characterisations that were
performed before treatment could be observed. Therefore, it can be understood that the
nanocomposites will be stable in crystal structure, phase and chemical composition after
photocatalyst treatment, which is beneficial to the photocatalytic performance.
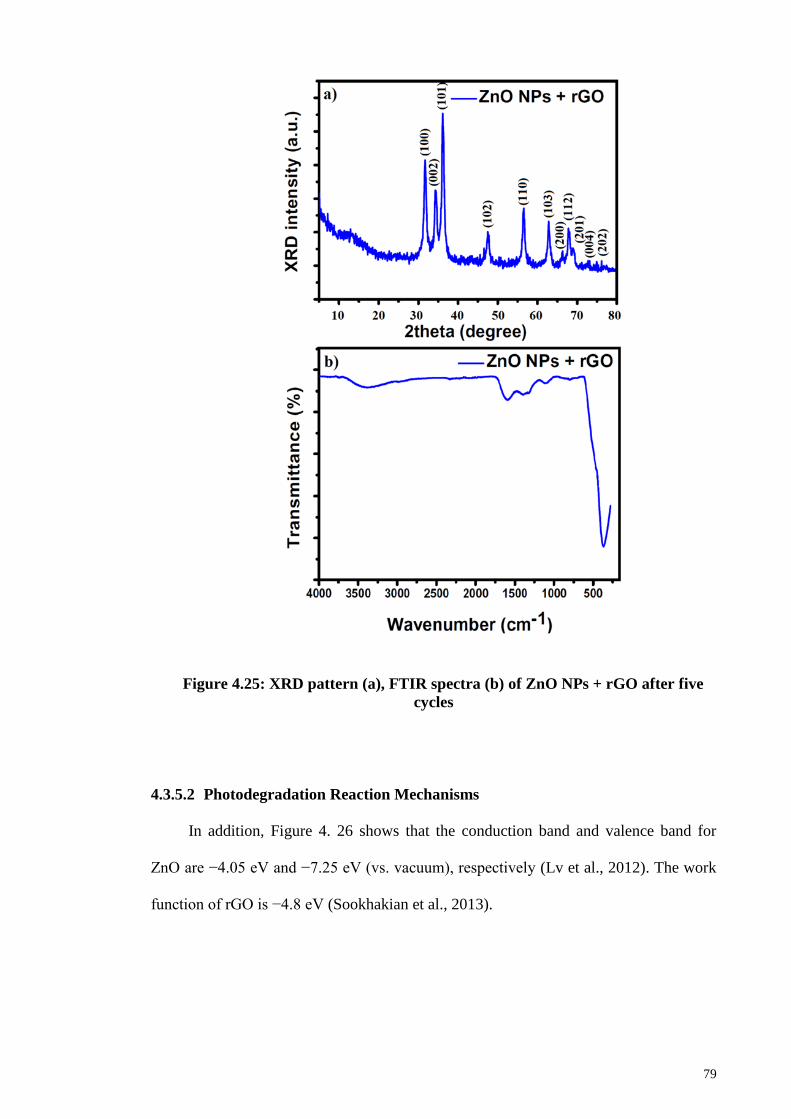
79
Figure 4.25: XRD pattern (a), FTIR spectra (b) of ZnO NPs + rGO after five
cycles
4.3.5.2 Photodegradation Reaction Mechanisms
In addition, Figure 4. 26 shows that the conduction band and valence band for
ZnO are −4.05 eV and −7.25 eV (vs. vacuum), respectively (Lv et al., 2012). The work
function of rGO is −4.8 eV (Sookhakian et al., 2013).

80
Figure 4.26: The energy level diagram for ZnO NPs+rGO
Therefore, under UV-light irradiation, electron–hole pairs are generated within
ZnO, and these photoinduced electrons are easily transferred from the ZnO conduction
band to rGO sheet via a percolation mechanism and then scavenged by dissolved
oxygen, which causes electron–hole separation. In contrast, the holes can react with
either adsorbed water or surface hydroxyls to form hydroxyl radicals. Consequently, the
adsorption equilibrium is destroyed, and more MB molecules could move from the
solution to the interface and, thus, decompose to CO2, H2O, and other minerals via a
redox reaction. In general, from the thermodynamic point of view, if the conduction
band was more negative than the 2O /2O-
couples, the photogenerated electrons could
reduce 2O to produce2O- . Meanwhile, if the position of the valence band was more
positive than the OH/ OH
couples, the photogenerated holes could oxidize OH or
H2O to form OH. Some semiconductors, including TiO2, ZnO, SnO2, SrTiO3, BaTiO3
and NiO, corresponded to the case considered above (Grätzel, 2001; Hoffmann, Martin,
Choi, & Bahnemann, 1995; Tachikawa, Fujitsuka, & Majima, 2007; Xiang, Yu, &
Wong, 2011; Xu et al., 2011; Yu, Yu, Ho, Jiang, & Zhang, 2002). Accordingly, when a

81
semiconductor is illuminated with photons, electrons in the valance band of the
semiconductor are excited into the conduction band, resulting in the generation of
electron–hole pairs. These electron–hole pairs either recombine or migrate to the surface
of the photocatalyst to initiate a series of photocatalytic reactions and produce hydroxyl
radicals, OH and superoxide radicals, 2O - in water, resulting in the degradation of
organic pollutants. It has been found that OH is a major contributor to the
photocatalytic degradation of the dye. Therefore, the photodegradation reaction
mechanisms of MB under UV- vis light irradiation is summarised by the following
equations:
ZnO + h ZnO(e- + h
+) (3)
e- + rGO rGO(e
-) (4)
rGO(e-) + O2 rGO +
2O - (5)
h+ + OH
OH (6)
OH + MB Degradation (CO2.H2O) (Behnajady, Modirshahla, & Hamzavi,
2006; Xiang et al., 2011; Xu et al., 2011) (7)
Therefore, rGO can effectively improve the charge separation and suppress the
recombination of excited carriers, indicating the higher photocatalytic activity of the
ZnO NPs+rGO. To further confirm the above assumption, photoluminescence (PL)
spectra of the as-prepared samples were investigated as shown in Figure 4. 26. The two
typically sharp and broad peaks of pure ZnO nanoparticles can be found at 364 and 538
nm (Weng, Yang, Zhang, & Xu, 2014), corresponding to the near band edge (NBE)
emission and deep level emission (DLE), respectively. The NBE emission originates
from the recombination of free excitons in the near band edge of the wide band gap ZnO

82
nanoparticles, and the DLE emission is assigned to various intraband defects in the
crystal, such as zinc vacancies, interstitial zinc, oxygen vacancies, interstitial oxygen,
and antisite oxygen (Mehran Sookhakian et al., 2014). The UV emission is also called
near-band-edge (NBE) emission because of the recombination of free excitons through
an exciton–exciton collision process. It has been suggested that the green band emission
(deep level emission (DLE)) corresponds to a singly ionised oxygen vacancy in ZnO
and results from the recombination of a photogenerated hole with the singly ionised
charge state of this defect (Azarang, Shuhaimi, Yousefi, & Sookhakian, 2014). In
addition, compared to the pure ZnO nanoparticles and ZnO NPs + rGO, the PL spectra
are approximately similar to the pure ZnO but are quenched in the ZnO NPs + rGO. A
significant fluorescence quenching of ZnO NPs can be observed after coupling ZnO
NPs with rGO due to the interactions of the ZnO NPs surfaces with rGO, which
illustrates that the electron-hole pairs in the excited ZnO NPs could be efficiently
separated, and efficient transfer of photoinduced electrons between ZnO NPs and rGO
could occur. In fact, the large surface area of the rGO causes the ZnO NPs to disperse.
Therefore, the dispersed NPs absorb light and generate more electron–hole pairs to
remove dye molecules.
Figure 4.27: PL spectra of the pure ZnO NPs, ZnO NPs + rGO

83
4.4 Crystalline quality assessment, photocurrent response and optical
properties of reduced graphene oxide uniformly decorated zinc oxide
nanoparticles based on graphene oxide concentration
In this study, Zinc oxide-nanoparticles (ZnONPs)-reduced graphene oxide (rGO)
composites with a high degree of crystallinity and a high dispersity were successfully
synthesized via a one-pot, facile sol-gel method in a starch environment, during which
the formation of zinc oxide nanoparticles, the reduction of graphene oxide and the
loading of ZnONPs onto the rGO surface occur simultaneously. Starch, as a natural
capping agent, plays a significant role in controlling the degree of dispersion and
coverage of ZnONPs. The effect of rGO on the crystalline structure and optical
properties of ZnONPs was determined via X-ray diffraction, UV–visible diffused
reflectance spectroscopy and photoluminescence spectroscopy. The ZnONPs+rGO
composites exhibit excellent potential for photocurrent generation compared with pure
ZnONPs under visible light irradiation, provided that efficient photo-induced charge
separation and transportation can be achieved at the interface. The maximum
photocurrent response, crystalline quality and factor optical properties (NBE/DLE ratio)
were obtained for the ZnONPs+rGO2 composite with a 1.7% mass fraction of rGO,
which is twice that achieved on pure ZnONPs.
4.4.1 Microstructure
Figure 4. 28(a–c) shows TEM images of the ZnONPs+rGO composites with
different concentrations (0.9, 1.7 and 3.3 wt.%/v GO) for the rGO sheets. The TEM
images reveal that the ZnONPs are decorated and dispersed on the rGO sheets.
However, this dispersion is less for ZnONPs+rGO1 than for the other samples. Figure 4.

84
28(c) shows that the ZnONP population in ZnONPs+rGO3 is less than that in the other
samples. This result explains why the XRD peak intensities decreased with an increase
in the GO concentration. In addition, the size histograms of the ZnONPs+rGO are
shown Figures 4. 28(a-c). The histograms show that the main particle sizes of the
ZnONPs+rGO1, ZnONPs+rGO2 and ZnONPs+rGO3 with different concentrations for
the rGO sheets (0.9, 1.7 and 3.3 wt.%/v) were 22±14, 20±6, and 25±10 nm,
respectively. Figures 4. 28(d-f) shows HRTEM images of single nanoparticles from
sheets with different GO concentrations. These HRTEM images show that the
concentration of the rGO sheet affects the crystalline quality of the NPs. It can be
observed that there are several areas of damage and defects for the zinc oxide
nanoparticles, which were grown on the sheets with the low and high concentrations of
GO Figures 4. 28(d) and 4. 28(f). On the other hand, the crystalline space of the
ZnONPs+rGO2 composite is clear and shows a non-defective structure for the
nanoparticle Figure 4. 28(e). In fact, the HRTEM results are in good agreement with the
XRD results. In addition, the HRTEM image of the ZnONPs+rGO2 composite shows
that the lattice distance is approximately 0.26 nm Figure 4. 28, which is consistent with
the distance along the c-axis of a bulk wurtzite ZnO crystal. Therefore, based on the
HRTEM image, the nanoparticles were grown along the [001] direction without any
defects.

85
Figure 4.28: TEM image of the ZnONPs+rGO composites with a (a) low rGO
concentration ZnONPs+rGO1, (b) mid rGO concentration ZnONPs+rGO2, and
(c) high rGO concentration ZnONPs+rGO3. The HRTEM image of the ZnONPs
that were decorated on the rGO sheet with a (d) low rGO concentration, (e) mid
rGO concentration, and (f) high rGO concentration
Figure 4.29: Size distribution diagrams of (a) ZnONPs+rGO1, (b)
ZnONPs+rGO2, and (c) ZnONPs+rGO3 composites by histogram curve
To further investigate the influence of starch and rGO on the nanoparticle
distribution on the samples, FESEM analyses of pure ZnONPs and ZnONPs+rGO(1, 2

86
and 3) composites with different concentrations for the rGO sheets (0.9, 1.7 and 3.3
wt.%/v) were performed (Figures 4. 30(a, b)). As observed in Figure 4. 30(a), zinc oxide
nanoparticles agglomerate in the absence of starch. The FESEM image of pure ZnONPs
(Figure 4. 30(a)) clearly shows that the particles agglomerate due to the large surface to
volume ratio of nanoparticles. Because of their strong surface reactivity, most
nanoparticles undergo agglomeration. To overcome this challenge, starch has been used
to obtain a narrower particle size distribution and also to control the particle size of the
final product. Therefore, to investigate the effect of starch as a natural surfactant, the
FESEM images of the as-synthesized ZnONPs are shown in Figure 4. 30(b). As
observed in Figure 4. 30(b), the presence of starch significantly affects the size
distribution of the nanoparticles, and starch as a natural capping agent is able to separate
the nanoparticles and prevent their agglomeration.
However, when the rGO is added to the system, the ZnONPs covered the surface of
the rGO uniformly, and a good loading of the ZnONPs on the rGO nanosheets occurred
(Figures 4. 28(a-c)). Moreover, as observed in Figures 4. 28(a-c), the surface of the rGO
thin film is clearly visible, while the typical wrinkle-like features are barely visible. A
more careful and close-up view reveals that the individual ZnONPs with sizes in the
range of 22–25 nm is well separated from each other and are well distributed on the
graphene sheets, i.e., no large areas of the graphene sheets without ZnO decoration are
found. Moreover, the partially enlarged image in Figure 4. 28(b) clearly illustrates that
there is no apparent aggregation of the ZnONPs on the graphene sheets; in addition, the
rGO nanosheets can function as conductive bands for the interconnection between the
various ZnONPs and the transfer of photogenerated charge carriers to enhance the
transient photocurrent. Based on these results, the possible mechanism of growth can be
predicted. The positively charged Zn2+
ions attached onto the surface of the graphene
oxide due to its negative charge. The initial nucleation of ZnONPs was formed during

87
the sol-gel process due to the reaction of the adsorbed Zn2+
onto GO via the 2O ions.
An in situ charge transfer process occurred between ZnO nuclei and graphene oxide to
produce rGO. However, starch, as a natural polymerization agent, acts as terminator for
the growth of ZnONPs. Starch was expended during the calcined process in 350 C to
prevent the nanoparticles from agglomerating.
Figure 4.30: (a) FESEM image of pure ZnONPs in the absence of starch (sample
M). (b) FESEM image of pure ZnONPs in the presence of starch (sample K)

88
4.4.2 Crystalline structure
Figure 4. 31 shows the X-ray diffractogram of graphite, GO and rGO. An intense
and sharp diffraction peak for GO appears at 2θ = 10.6, which is attributed to the (001)
lattice plane with the interlayer spacing of 0.83 nm, which is consistent with the
lamellar structure of GO. This spacing is much wider than that of the graphite narrow
peak located at 26.8, which has an interlayer spacing of 0.33 nm. This result indicates
that GO sheets have been effectively exfoliated from the raw graphite (Sookhakian et
al., 2015; Zhang, Zhang, Tang, & Xu, 2012). As a comparison, after the sol-gel process
of the pure GO without the presence of ZnONPs, the diffractogram illustrates the
disappearance of this strong peak along with the appearance of a very broad (002) peak
and a very weak (100) peak at 2θ of 24.32 and 42.55, respectively; the peaks at 24.32
and 42.55 correspond to interlayer spacing’s of 0.36 nm and 0.21 nm, respectively
(Sookhakian et al., 2015). This result indicates that the GO was reduced to rGO during
the sol-gel process due to the removal of the functional groups (Sookhakian et al.,
2015).
Figure 4.31: XRD patterns of graphite, GO and rGO sheets
The phase structures of the ZnONPs+rGO composites with the different mass
fractions of rGO in the presence of starch are illustrated in Figure 4. 32. It is evident that

89
all of the samples exhibit similar XRD patterns to blank ZnO, i.e., the existence of rGO
does not affect the growth of new crystal orientations of ZnO; thus, rGO only functions
as a platform where the ZnONPs can nucleate and grow. The peaks located at 2θ values
of 32.09, 34.53, 36.91, 48.43, 57.22, 63.13, and 68.47, which can be indexed to
the (100), (002), (101), (102), (110), (103), and (200) lattice planes, respectively, of the
ZnO wurtzite structure (JCPDS card no. 00-036-1451) with the lattice constant a = b =
0.3218 nm, c = 0.5330 nm. Furthermore, compared with the pure ZnONPs, the high
intensity diffraction peak of ZnONPs+rGO composites with different mass fraction of
rGO at 34.53 is broadened slightly, which is attributed to slight reduction of the
crystalline size of the ZnONPs in the composite in the presence of rGO.
Figure 4.32: XRD patterns of the ZnONPs+rGO composites with low rGO
concentration (ZnONPs+rGO1), min rGO concentration (ZnONPs+rGO2), and
high rGO concentration (ZnONPs+rGO3)
From the Scherrer equation (1), the estimated crystallite sizes of ZnONPs in the
absence of rGO and in the presence of rGO with different mass ratios were calculated

90
(Table 4. 3). Notably, no typical diffraction peaks of rGO are observed in the
ZnONPs+rGO composites, which might be due to the low diffraction intensity peak and
small amount of rGO (Azarang, Shuhaimi, Yousefi, & Sookhakian, 2014).
hkl
Dcos
(1)
where D is the crystallite size in nanometres, λ is the wavelength of the radiation
(1.54056 Aο for CuKα radiation), k is a constant equal to 0.94, βhkl is the peak width at
half-maximum intensity (FWHM) and θ is the peak position (Holzwarth & Gibson,
2011).
Table 4.3: Peak position and calculated the crystallite size of the pure ZnONPs
and ZnONPs+rGO composite with low rGO concentration ZnONPs+rGO1, mid
rGO concentration ZnONPs+rGO2, and high rGO concentration ZnONPs+rGO3
Sample code 2θ (ο) FWHM
(ο)
Crystallite
size (nm)
ZnONPs (Sample K)
ZnONPs+rGO1(Sample J)
ZnONPs+rGO2 (Sample E)
ZnONPs+rGO3(Sample I)
34.3282
34.3842
34.3894
34.3956
0.2528
0.3801
0.3936
0.3992
25.07656
22.03493
21.01845
20.03745
To better understand the effects of the rGO sheets on the growth process for the
ZnONPs, zinc oxide nanoparticles were synthesized without graphene at 400 and 500
C. The XRD patterns of these conditions are shown in Figure 4. 32. It can be observed

91
that the XRD pattern of the NPs that were sintered at 400 C indicates a low crystalline
quality. On the other hand, the XRD pattern of the NPs that were sintered at 500 C
indicates a good crystalline quality.
Figure 4.33: XRD patterns of the pure ZnONPs that were grown by 400 and 500
C temperature sample N and sample P, respectively
In addition, the TEM images for NPs sintered under these conditions confirm the
XRD results (Figures 4. 33(a, b)). Furthermore, these TEM images show that the NPs
were not very well dispersed without the rGO sheet. According to the obtained results, it
can be concluded that the rGO sheets not only play a role as a dispersion site for the
NPs but also play a role as a useful site to grow the ZnONPs. In fact, the rGO sheets
could decrease the calcination temperature. The widely accepted mechanism for the
synthesis of graphene decorated with inorganic nanostructures is the attraction of
positively charged metal ions by the polarized bonds of the functional groups on the

92
GO. The attachment of these metal ions to the surface and edges of the GO results in a
redox reaction and the formation of nucleation sites, which eventually leads to the
growth of nanostructures on the 2-D graphene sheets (Xue et al., 2011).
Figure 4.34: TEM image of the pure ZnONPs that were grown at (a) 400 C and
(b) 500 C
4.4.3 Chemical Composition
Figure 4. 35 shows the FTIR spectra of the pristine GO, starch powder,
ZnONPs+rGO1, ZnONPs+rGO2, and ZnONPs+rGO3 composites. In the FTIR
spectrum of GO, the broad peak centred at 3190 cm-1
is attributed to the O–H stretching
vibrations, and the peaks at 1731, 1625, 1183, and 1040 cm-1
are assigned to the C=O

93
stretching, sp2-hybridized C=C group, O–H deformation, C–OH stretching, and C–O
stretching, respectively (Hummers & Offeman, 1958). In contrast, the peaks at 1731,
1183, and 1040 cm-1
are missing from the FTIR spectra of the ZnONPs+rGO(1, 2 and 3)
composites, which indicate the reduction of GO and its transformation to rGO (Peng-
Gang et al., 2011; W. Zou et al., 2011). In addition, the FTIR spectrum of starch powder
is shown in Figure. 10. The peaks of the starch are dramatically smaller in the FTIR
spectra of the ZnONPs+rGO(1, 2 and 3) composites. In fact, the annealing process at 350°C
caused the transformation of GO to rGO and removed the starch, which is in good
agreement with the XRD results. In addition, the FTIR spectrum of the ZnONPs+rGO(1,
2 and 3) shows a peak at 437 cm-1
. The band at 437 cm-1
corresponds to the E2 mode of
hexagonal ZnO (Raman active) (Jan et al., 2014). Therefore, the resulting composite
consisted of ZnONPs decorated on an rGO sheet. A weak peak appears at 437 cm-1
for
the pure ZnONPs. Therefore, the FTIR results also show that pure ZnONPs cannot form
at 350°C in a starch environment.
Figure 4.35: FTIR spectra of the GO sheet, starch powder, and ZnONPs+rGO1,
ZnONPs+rGO2, and ZnONPs+rGO3 composites

94
4.4.4 Optical properties
Figure 4. 35 shows the Raman spectrum of the ZnONPs+rGO2 composite. The
graphene obtained from the chemical reduction of GO exhibits two characteristic main
peaks: the D band at ~1365 cm-1
, which arises from a breathing mode of -point
photons with A1 g symmetry, and the G band at ~1610 cm-1
, which arises from the first-
order scattering of the E2 g mode phonons of the sp2-bonded carbon atoms (Gao et al.,
2010; Stankovich et al., 2007). The D and G band positions and intensity ratios of
I(D)/I(G) for the GO and ZnONPs+rGO2 composites prepared using the sol–gel method
are summarized in Table 4. 4. In comparison to the pristine GO, the Raman spectrum of
the ZnONPs+rGO2 composite shows that the D and G bands shifted to lower wave
numbers at ~1357 and ~1600 cm-1
, respectively, because of the reduction process for
the GO, which can be supported by starch as the reducing, capping, and stabilizing
agent (Liu et al., 2011). In addition to the peaks associated with the D and G bands of
graphene, the Raman spectrum of the ZnONPs+rGO2 composite shows a sharp and
narrow peak at 437 cm-1
corresponding to the E2 (high) mode of the Raman active
mode, a characteristic peak for the wurtzite hexagonal phase of ZnO. The Raman results
confirmed that the ZnONPs+rGO2 composite was composed of graphene nanosheets
and pure ZnO.

95
Figure 4.36: Raman spectrum of the GO and ZnONPs+rGO composites
Table 4.4: D and G peak positions and intensity ratios of I(D)/I(G) (obtained by
Raman analysis) of GO and ZnONPs+rGO composites prepared sol-gel method by
starch
The room temperature UV-Vis absorption spectra of ZnONPs+(rGOX)X=0, 1, 2, 3
are shown in Figure 4. 37. The ZnONPs+(rGOX) X=0, 1, 2, 3 composites were dispersed in
ethanol with a concentration of 0.1% wt and then the solution was used to perform the
UV-Vis measurement. The UV–Vis absorption spectra of the ZnONPs and
ZnONPs+rGO at room temperature are shown in Figure 4. 36. These spectra reveal a
characteristic absorption peak for different composites at a wavelength of ~360, ~365,
~369, ~374 nm for ZnONPs, ZnONPs+rGO1, ZnONPs+rGO2 and ZnONPs+rGO3
GO ZnONPs+rGO
D band (cm-1
)
G band (cm-1
)
I(D)/I(G)
1365
1610
0.81
1357
1600
1.13

96
samples due to the electron transitions from the valence band to the conduction band
(O2p→Zn3d), which can be assigned to the intrinsic band-gap absorption of ZnO (Yu et
al., 2006). Furthermore, it is observed that the sharp characteristic absorption peak at
365 nm indicates the existence of good crystalline and impurity-suppressed ZnONPs
(Lv et al., 2011; Lv et al., 2012), and it was proposed that the Zn-O-C bond between
ZnO and rGO was formed, which is in good agreement with the FTIR and Raman
results. Similar phenomena were also observed for RGO/ZnO composites prepared by
Zhang et al (Zhang, Chen, Liu, & Xu, 2013), confirming what we proposed in this
paper. As observed, the small redshifts (~5, ~4, and ~5 nm) of the absorption edge
compared to pure ZnO should be attributed to the chemical bonding between ZnO and
rGO, which is similar to the result in the case of the ZnONPs+rGO composite materials
(Liu et al., 2012; Lv et al., 2011). However, it is observed that the absorbance of the
ZnONPs+rGO(1, 2 and 3) composites increases in comparison to the absorbance of the
ZnONPs. This increase in absorbance may be due to the absorption contribution from
rGO, the increase in the surface electric charge of the oxides, and the modification of
the fundamental process of electron–hole pair formation during irradiation (Xue et al.,
2011). Therefore, the presence of rGO in the ZnO can increase the light absorption,
which is beneficial to the optoelectronic performance. From the plot curvedA
dE, which is
the first derivative of energy absorption with respect to energy, the estimated band gap
energies of ZnONPs in the absence of rGO and in the presence of rGO with different
mass ratio were calculated Figure 4. 38 (Zak, Razali, Majid, & Darroudi, 2011). The
band gap value of ZnONPs was calculated using ultraviolet–visible (UV–Vis)
spectroscopy and decreased with increased rGO concenteration.

97
Figure 4.37: UV-Vis spectra of the pure ZnONPs, ZnONPs+rGO1,
ZnONPs+rGO2, and ZnONPs+rGO3 composites
Eventually, the optical absorption edge of the ZnONPs shifts to a slightly higher
wavelength with the increase in the ratio of rGO in the ZnONPs+rGO composites.
Therefore, these results indicate that although the band gap of ZnONPs very slightly
decreases in the presence of rGO, as shown in Figure 4. 37, the band gap narrowing of
all the ZnONPs+rGO hybrids was clearly observed. Furthermore, the hybrids containing
higher concentrations of rGO show a narrower band gap, indicating that the interaction
between the ZnO nanoparticles and the rGO sheets enhances with an increase the
concentration of rGO. These results support that the preparation of ZnONPs+rGO with
a sol-gel process with starch is successful (Cheng et al., 2013).

98
Figure 4.38: The band gap of the ZnONPs, ZnONPs+rGO1, ZnONPs+rGO2,
and ZnONPs+rGO3 composites estimated from first derivative
Figure 4. 39 shows the photoluminescence (PL) spectra of the products. A significant
difference can be seen between the PL spectrum of the pure ZnONPs, which were
grown at 350 C, and that of the ZnONPs+rGO composites. To further confirm the
above assumption, PL spectra of the as-prepared samples were investigated as shown in
Figure 4. 39. The two typically sharp and broad peaks of pure ZnO nanoparticles can be
found at ~364 and ~538 nm(Weng et al., 2014), corresponding to the near band edge
(NBE) emission and deep level emission (DLE), respectively. The NBE emission
originates from the recombination of free excitons in the near band edge of the wide
band gap ZnO nanoparticles, and the DLE emission is assigned to various intraband
defects in the crystal, such as zinc vacancies, interstitial zinc, oxygen vacancies,
interstitial oxygen, and antisite oxygen (Sadollahkhani et al., 2014). The UV emission is
also called near band edge (NBE) emission because of the recombination of free
excitons through an exciton–exciton collision process. It has been suggested that the
green band emission DLE corresponds to a singly ionized oxygen vacancy in ZnO and

99
results from the recombination of a photogenerated hole with the singly ionized charge
state of this defect. Therefore, Figure 4. 39 shows that the ZnONPs have very high
concentrations of oxygen vacancies. However, the intensity of the UV peak is increased
and that of the visible peak is decreasing with an increasing the graphene concentration.
However, the NBE/DLE ratio of the ZnONPs+rGO2, which is one of the main factors
that is usually used for comparing the optical properties of samples, is bigger than the
NBE/DLE ratios of the other composites. Therefore, the ZnONPs+rGO2 composites
have a better relative crystalline quality. According to these results, it can be understood
that the graphene concentration has an optimum value in relation to improving the
optical quality of the ZnONPs. In fact, the optical study results are in good agreement
with the XRD and TEM results. Therefore, the ZnONPs+rGO2 composite is the best
composite of ZnO and rGO for improving the crystalline and optical quality of the
ZnONPs, which were sintered at a lower temperature than is normally used to grow
pure ZnONPs by the sol–gel method in a starch environment.
Figure 4.39: PL spectra of the pure ZnONPs, ZnONPs+rGO1, ZnONPs+rGO2,
and ZnONPs+rGO3 composites

100
4.4.5 Studies of the photocurrent response
4.4.5.1 Transient photocurrent response of ZnONPs and ZnONPs+rGO films
A schematic of the solar cell device fabricated using the ZnONPs+rGO modified
ITO electrode is illustrated in Figure 4. 40. To investigate the influence of rGO on the
photoelectrochemical properties of the fabricated solar cell devices, the transient
photocurrent response was measured under visible light irradiation. The transient
photocurrents of pure ZnONPs-, ZnONPs+rGO1-, ZnONPs+rGO2-, and
ZnONPs+rGO3-modified ITO electrodes irradiated with visible light are illustrated in
Figure 4. 39. The applied bias was 0 V vs. an SCE reference electrode.
Figure 4.40: Schematic representation of the solar cell device
As observed in Figure 4. 41, a small anodic photocurrent density of 0.85 A/cm2
was obtained for pure ZnONPs when the light source was switched on. Moreover, the
dark current was ~0.1 nA/cm2 when the light source was switched off. However, the
presence of rGO leads to the enhancement of transient photocurrent response of pure

101
ZnO from 0.85 A/cm2 to 1.22 A/cm
2 for ZnONPs+rGO1. However, with the increase
in the rGO concentration up to 1.7 wt.%/v, the transient photocurrent initially increases
from 1.22 A/cm2
to 1.9 A/cm2
for both ZnONPs+rGO1 and ZnONPs+rGO2. A
further increase in the rGO concentration up to 3.3 wt.% leads to a decrease in transient
photocurrent from 1.9 A/cm2
to 1.17 A/cm2. The optimized value is obtained from
ZnONPs+rGO2 (based on ZnONPs+rGO (1.7 wt.%/v)), under visible light irradiation
(100 mWcm-2
), which is approximately 4-fold higher than that of the pure ZnONP
electrode. Moreover, the transient photocurrents were rapid, steady, prompt and
reproducible during several on–off cycles of the visible light irradiation for all samples
as well; no overshoots were observed at the beginning and the end of the flash. The
rectangular response indicates that no grain boundaries exist in the direction of electron
diffusion. The grain boundaries create deep traps to slow the electron transport and may
exist at the particulate electrode (Devika, Reddy, & Tu, 2015). This finding also
suggests that the excited electrons are collected efficiently in the external circuit
(Devika et al., 2015).
Figure 4.41: Photocurrent versus time (i–t) curves of the solar cell device based
on pure ZnO and ZnONPs+rGO composite with different concentration ratios of
GO (0.9, 1.7 and 3.3 wt.%/v)

102
To better understand the effects of the factors of crystalline quality and optical
properties (NBE/DLE ratio) on the photocurrent for the ZnONPs, zinc oxide
nanoparticles were synthesized without graphene oxide and in the presence of graphene
oxide as shown in Table 4. 5. It can be observed that they have direct contact with each
other.
Table 4.5: Near band edge (NBE), deep level emission (DLE) ratio and
photocurrent of the pure ZnONPs and ZnONPs+rGO composite with low rGO
concentration ZnONPs+rGO1, mid rGO concentration ZnONPs+rGO2, and high
rGO concentration ZnONPs+rGO3
Sample code NBE DLE NBE /DLE Photocurre
nt (A/cm2)
ZnONPs (Sample K)
ZnONPs+rGO1(Sample J)
ZnONPs+rGO3(Sample I)
ZnONPs+rGO2(Sample E)
147.95
1589.81
247.31
6790.51
6441.84
2596.86
1851.78
3307.86
0.0229
0.6122
0.1335
2.0528
0.85
1.22
1.17
1.9
4.4.5.2 Mechanism
Figure 4. 41 shows the possible mechanism of photocurrent generation on
ZnONPs+rGO composites under the visible light irradiation. As observed in the figure,
the main reason for the enhancement of the photocurrent response of the ZnONPs+rGO
composites is related to the stepwise structure of the energy levels constructed in the
composite, which causes enhanced charge separation. As observed in Figure 4. 41, the
conduction band and valence band for ZnONPs are −4.05 eV and −7.25 eV (vs.
vacuum), respectively, and the work function of rGO is −4.8 eV (Azarang, Shuhaimi,
Yousefi, & Jahromi, 2015). Therefore, ZnONPs absorb visible light to produce
electron–hole pairs. These photo-induced electrons are easily transferred from the ZnO
conduction band to the rGO sheets and then to the ITO substrate via a percolation

103
mechanism; the electrons are finally scavenged by the 𝐼−/𝐼3− pair in the electrolyte.
Therefore, based on the UV–Vis and PL results, it is clear that the enhanced
photocurrent in ZnONPs+rGO composites is related to rGO; these composites not only
extend the photoresponse range of solar spectrum to the visible light range but also
improve the interfacial electron transfer and constrain the electron–hole pair
recombination of ZnONPs in ZnONPs+rGO composites. Moreover, the effect of the
rGO content in the improvement of transient photocurrent plays an important role. The
transient photocurrent of the ZnONPs+rGO composites decreased when the rGO
content was increased beyond the optimum value. This phenomenon can be attributed to
the following: (i) rGO may absorb some visible light and thus cause a light harvesting
competition between ZnO and rGO with the increase in the rGO content, which leads to
the decrease in the transient photocurrent, and (ii) excessive rGO can act as a centre for
the recombination of electron–hole pairs instead of providing an electron pathway, as
observed in the PL results in Figure 14 (Azarang et al., 2015).
Figure 4.42: Schematic of the mechanism of the photocurrent generation
104
CHAPTER 5: CONCLUSIONS
5.1 Synthesis and characterization of ZnO NPs/reduced graphene oxide
nanocomposite prepared in gelatin medium as highly efficient photo-
degradation of MB
ZnO-NPs/RGO was synthesized by the sol–gel method in a gelatin medium. FESEM
and TEM images showed that the ZnO NPs were decorated and dispersed on the RGO.
An HRTEM image of the NPs revealed that the ZnO NPs were single crystals without
any defects. The XRD pattern of the ZnO-NPs/RGO indicated a hexagonal phase for the
obtained product. The FTIR results showed that the post-annealing process removed the
gelatin medium and formed the ZnO structure. In addition, the FTIR showed that the
GO was transformed into RGO by the post-annealing process. The photocatalyst
activity revealed the high MB removal efficienc of the ZnO-NPs/RGO in comparison to
the ZnO NPs. This method can be used for the large-scale removal of pollutants from
wastewater.
5.2 Effects of graphene oxide concentration on optical properties of ZnO/RGO
nanocomposites and their application to photocurrent generation
ZnO/RGO nanocomposites with different concentrations of RGO were successfully
grown using a sol–gel method. The XRD patterns and TEM images indicated that the
RGO could increase the crystalline quality of the ZnO NPs that were decorated on the
RGO sheets. In addition, a comparison between the growth processes for the ZnO NPs
that were decorated on the RGO and pure ZnO NPs showed that the RGO could
decrease the calcination temperature for the ZnO NP growth. In addition, the RGO
could be a good site to disperse the ZnO NPs. Furthermore, the optical properties of the
ZnO NPs were increased by the RGO. However, the results showed that there was an
optimum RGO concentration for increasing the optical properties of the ZnO NPs.
Finally, the photocurrent results for the obtained products showed that the RGO

105
increased the current density of the ZnO NPs. However, this study also revealed that
there was an optimum concentration for increasing the current density of the ZnO NPs.
5.3 One-pot sol–gel synthesis of reduced graphene oxide uniformly decorated
zinc oxide nanoparticles in starch environment for highly efficient
photodegradation of Methylene Blue
ZnO NPs+rGO were synthesized using the sol–gel method in a starch environment.
TEM images showed that the ZnO NPs were decorated and dispersed on the rGO. An
HRTEM image of the NPs revealed that the ZnO NPs were single crystals without any
defects. The XRD pattern of the ZnO NPs+rGO indicated a hexagonal phase of the
product obtained. The FTIR results showed that the annealing process removed the
starch environment and formed the ZnO structure. In addition, the FTIR showed that the
GO was transformed into rGO by the annealing process in a starch environment. The
photocatalyst activity showed the high MB removal efficiency of the ZnO NPs+rGO in
comparison to the ZnO NPs. This method can be used for the large-scale removal of
pollutants from wastewater. Generally, it was established that the reduced graphene
oxide sheets played important roles in enhancing the photocatalytic efficiency of the
ZnO NPs + rGO nanocomposite compared to the bare ZnO NPs: 1) the prevention of
ZnO NPs + rGO agglomeration, leading to the growth of small nanoparticles on the
surfaces, 2) the increasing adsorption of MB molecules, and 3) the suppression of
electron–hole recombination.
5.4 Crystalline quality assessment, photocurrent response and optical
properties of reduced graphene oxide uniformly decorated zinc oxide
nanoparticles based on graphene oxide concentration
A ZnONPs+rGO composite with a diameter of 206 nm was successfully
synthesized using a simple one-pot sol-gel method with the assistance of starch as a

106
capping agent. The FTIR and Raman results clearly show the reduction of graphene
oxide in the composite to reduced graphene oxide. The transient photocurrent results
show that (i) ZnONPs+rGO composites enable significant improvement in the transient
photocurrent under visible light irradiation compared to pure ZnO, due to the increase in
the light absorption in the visible region, the decrease in the charge recombination, and
the increase in charge transport; (ii) the transient photocurrent of ZnONPs+rGO
composite is dependent on the weight percentage of the reduced graphene oxide in the
composite and the ZnONPs+rGO composite, with 1.7 wt.%/v rGO corresponding to a
maximum transient photocurrent of 1.9 A/cm2
and a maximum crystalline quality for
ZnONPs+rGO2. Furthermore, for a better understanding of the conclusions on the effect
of the GO concentration on the crystalline quality and factor optical properties
(NBE/DLE ratio), the photocurrent, crystallite size and FWHM for the ZnONPs+rGO
composite are shown in Figures 51(a-d).
Figure 5.1: The (a) NBE/DLE, (b) photocurrent, (c) crystallite size, and (d)
FWHM versus GO concentration as final conclusions

107
REFERENCES
Azarang, M., Shuhaimi, A., Yousefi, R., & Jahromi, S. P. (2015). One-pot sol–gel
synthesis of reduced graphene oxide uniformly decorated zinc oxide
nanoparticles in starch environment for highly efficient photodegradation of
Methylene Blue. RSC Advances., 5(28), 21888-21896.
Azarang, M., Shuhaimi, A., Yousefi, R., Moradi Golsheikh, A., & Sookhakian, M.
(2014). Synthesis and characterization of ZnO NPs/reduced graphene oxide
nanocomposite prepared in gelatin medium as highly efficient photo-degradation
of MB. Ceramics International, 40(7), 10217-10221.
Azarang, M., Shuhaimi, A., Yousefi, R., & Sookhakian, M. (2014). Effects of graphene
oxide concentration on optical properties of ZnO/RGO nanocomposites and their
application to photocurrent generation. Journal of Applied Physics, 116(8),
084307.
Bai, S., & Shen, X. P. (2012). Graphene-inorganic nanocomposites. RSC Advances,
2(1), 64-98.
Barpuzary, D., & Qureshi, M. (2013). Enhanced photovoltaic performance of
semiconductor-sensitized zno-cds coupled with graphene oxide as a novel
photoactive material. ACS Applied Materials and Interfaces, 5(22), 11673-
11682.
Beek, W. J., Wienk, M. M., Kemerink, M., Yang, X., & Janssen, R. A. (2005). Hybrid
zinc oxide conjugated polymer bulk heterojunction solar cells. The Journal of
Physical Chemistry B, 109(19), 9505-9516.
Behnajady, M., Modirshahla, N., & Hamzavi, R. (2006). Kinetic study on photocatalytic
degradation of CI Acid Yellow 23 by ZnO photocatalyst. Journal of hazardous
materials, 133(1), 226-232.
Boruah, P. K., Borah, D. J., Handique, J., Sharma, P., Sengupta, P., & Das, M. R.
(2015). Facile synthesis and characterization of Fe3O4 nanopowder and
Fe3O4/reduced graphene oxide nanocomposite for methyl blue adsorption: A
comparative study. Journal of Environmental Chemical Engineering, 3(3), 1974-
1985.
Cao, H., Li, B., Zhang, J., Lian, F., Kong, X., & Qu, M. (2012). Synthesis and superior
anode performance of TiO 2@ reduced graphene oxide nanocomposites for
lithium ion batteries. Journal of Materials Chemistry, 22(19), 9759-9766.
Chang, K., & Chen, W. (2011). l-Cysteine-Assisted Synthesis of Layered
MoS2/Graphene Composites with Excellent Electrochemical Performances for
Lithium Ion Batteries. ACS Nano, 5(6), 4720-4728.
Chang, Y. M., Kim, H., Lee, J. H., & Song, Y.-W. (2010). Multilayered graphene
efficiently formed by mechanical exfoliation for nonlinear saturable absorbers in
fiber mode-locked lasers. Applied Physics Letters, 97(21), 211102.

108
Chauke, V. P., Maity, A., & Chetty, A. (2015). High-performance towards removal of
toxic hexavalent chromium from aqueous solution using graphene oxide-alpha
cyclodextrin-polypyrrole nanocomposites. Journal of Molecular Liquids, 211,
71-77.
Chen, S., Zhu, J., Wu, X., Han, Q., & Wang, X. (2010). Graphene Oxide−MnO2
Nanocomposites for Supercapacitors. ACS Nano, 4(5), 2822-2830.
Cheng, G., Akhtar, M. S., Yang, O.-B., & Stadler, F. J. (2013). Novel preparation of
anatase TiO2@ reduced graphene oxide hybrids for high-performance dye-
sensitized solar cells. ACS Applied Materials & Interfaces, 5(14), 6635-6642.
Cheng, Z., Li, Q., Li, Z., Zhou, Q., & Fang, Y. (2010). Suspended Graphene Sensors
with Improved Signal and Reduced Noise. Nano Letters, 10(5), 1864-1868.
Choi, J., Reddy, D. A., Islam, M. J., Seo, B., Joo, S. H., & Kim, T. K. (2015). Green
synthesis of the reduced graphene oxide–CuI quasi-shell–core nanocomposite: A
highly efficient and stable solar-light-induced catalyst for organic dye
degradation in water. Applied Surface Science, 358, Part A, 159-167.
Devika, M., Reddy, N. K., & Tu, C. W. (2015). ZnO/ITO core/shell nanostructure
electrodes for future prototype solar cell devices. RSC Advances, 5(4), 2891-
2899.
Ding, G., Xie, S., Liu, Y., Wang, L., & Xu, F. (2015). Graphene oxide-silver
nanocomposite as SERS substrate for dye detection: Effects of silver loading
amount and composite dosage. Applied Surface Science, 345, 310-318.
Ding, Y., Jiang, Y., Xu, F., Yin, J., Ren, H., Zhuo, Q., Zhang, P. (2010). Preparation of
nano-structured LiFePO4/graphene composites by co-precipitation method.
Electrochemistry Communications, 12(1), 10-13.
Dong, L., Li, M., Dong, L., Zhao, M., Feng, J., Han, Y., Sun, X. (2014). Hydrothermal
synthesis of mixed crystal phases TiO2–reduced graphene oxide nanocomposites
with small particle size for lithium ion batteries. International Journal of
Hydrogen Energy, 39(28), 16116-16122.
Dong, S., Dou, X., Mohan, D., Pittman Jr, C. U., & Luo, J. (2015). Synthesis of
graphene oxide/schwertmannite nanocomposites and their application in Sb(V)
adsorption from water. Chemical Engineering Journal, 270, 205-214.
Drelich, J., Chibowski, E., Meng, D. D., & Terpilowski, K. (2011). Hydrophilic and
superhydrophilic surfaces and materials. Soft Matter, 7(21), 9804-9828.
Dreyer, D. R., Park, S., Bielawski, C. W., & Ruoff, R. S. (2010). The chemistry of
graphene oxide. Chemical Society Reviews, 39(1), 228-240.
Du, X., Zhang, Z., Miao, Z., Ma, M., Zhang, Y., Zhang, C., Chen, Q. (2015). One step
electrodeposition of dendritic gold nanostructures on β-lactoglobulin-
functionalized reduced graphene oxide for glucose sensing. Talanta, 144, 823-
829

109
Erickson, K., Erni, R., Lee, Z., Alem, N., Gannett, W., & Zettl, A. (2010).
Determination of the Local Chemical Structure of Graphene Oxide and Reduced
Graphene Oxide. Advanced Materials, 22(40), 4467-4472.
Feng, Y., Feng, N., & Du, G. (2013). A green reduction of graphene oxide via starch-
based materials. RSC Advances, 3(44), 21466.
Ferrari, A. C., Bonaccorso, F., Falko, V., Novoselov, K. S., Roche, S., Boggild, P.,
Kinaret, J. (2014). Science and technology roadmap for graphene, related two-
dimensional crystals, and hybrid systems. Nanoscale.
Fowler, J. D., Allen, M. J., Tung, V. C., Yang, Y., Kaner, R. B., & Weiller, B. H.
(2009). Practical Chemical Sensors from Chemically Derived Graphene. ACS
Nano, 3(2), 301-306.
Freitag, M. (2008). Graphene: Nanoelectronics goes flat out. Nat Nano, 3(8), 455-457.
Fu, D., Han, G., Yang, F., Zhang, T., Chang, Y., & Liu, F. (2013). Seed-mediated
synthesis and the photo-degradation activity of ZnO–graphene hybrids excluding
the influence of dye adsorption. Applied Surface Science, 283(0), 654-659.
Fu, X. W., Liao, Z. M., Zhou, Y. B., Wu, H. C., Bie, Y. Q., Xu, J., & Yu, D. P. (2012).
Graphene/ZnO nanowire/graphene vertical structure based fast-response
ultraviolet photodetector. Applied Physics Letters, 100(22).
Gao, J., Liu, F., Liu, Y., Ma, N., Wang, Z., & Zhang, X. (2010). Environment-Friendly
Method To Produce Graphene That Employs Vitamin C and Amino Acid.
Chemistry of Materials, 22(7), 2213-2218.
Gao, P., Li, A., Sun, D. D., & Ng, W. J. (2014). Effects of various TiO2 nanostructures
and graphene oxide on photocatalytic activity of TiO2. Journal of hazardous
materials, 279, 96-104.
Gao, T., Gong, L.-j., Wang, Z., Yang, Z.-k., Pan, W., He, L., Xu, W. (2015). Boron
nitride/reduced graphene oxide nanocomposites as supercapacitors electrodes.
Materials Letters, 159, 54-57.
Gao, Y., Hu, M., & Mi, B. (2014). Membrane surface modification with TiO2–graphene
oxide for enhanced photocatalytic performance. Journal of Membrane Science,
455, 349-356.
Geim, A. K. (2009). Graphene: status and prospects. Science, 324(5934), 1530-1534.
Ghavami, M., Mohammadi, R., Koohi, M., & Kassaee, M. Z. (2014). Visible light
photocatalytic activity of reduced graphene oxide synergistically enhanced by
successive inclusion of γ-Fe2O3, TiO2, and Ag nanoparticles. Materials Science
in Semiconductor Processing, 26, 69-78.
Gómez-Navarro, C., Weitz, R. T., Bittner, A. M., Scolari, M., Mews, A., Burghard, M.,
& Kern, K. (2007). Electronic transport properties of individual chemically
reduced graphene oxide sheets. Nano Letters, 7(11), 3499-3503.

110
Grätzel, M. (2001). Photoelectrochemical cells. Nature, 414(6861), 338-344.
Gui, D., Liu, C., Chen, F., & Liu, J. (2014). Preparation of polyaniline/graphene oxide
nanocomposite for the application of supercapacitor. Applied Surface Science,
307, 172-177.
Gui, Y., Zhao, J., Wang, W., Tian, J., & Zhao, M. (2015). Synthesis of hemispherical
WO3/graphene nanocomposite by a microwave-assisted hydrothermal method
and the gas-sensing properties to triethylamine. Materials Letters, 155, 4-7.
Gupta, V. K., Eren, T., Atar, N., Yola, M. L., Parlak, C., & Karimi-Maleh, H. (2015).
CoFe2O4@TiO2 decorated reduced graphene oxide nanocomposite for
photocatalytic degradation of chlorpyrifos. Journal of Molecular Liquids, 208,
122-129.
Hao, Y., Wang, Z., Gou, J., & Dong, S. Highly efficient adsorption and removal of
Chrysoidine Y from aqueous solution by magnetic graphene oxide
nanocomposite. Arabian Journal of Chemistry.
He, H. Y. (2015). Photoinduced superhydrophilicity and high photocatalytic activity of
ZnO–reduced graphene oxide nanocomposite films for self-cleaning
applications. Materials Science in Semiconductor Processing, 31, 200-208.
Hoffmann, M. R., Martin, S. T., Choi, W., & Bahnemann, D. W. (1995).
Environmental applications of semiconductor photocatalysis. Chemical Reviews,
95(1), 69-96.
Holzwarth, U., & Gibson, N. (2011). The Scherrer equation versus the'Debye-Scherrer
equation'. Nature Nanotechnology, 6(9), 534-534.
Hu, C., Lu, T., Chen, F., & Zhang, R. (2013). A brief review of graphene–metal oxide
composites synthesis and applications in photocatalysis. Journal of the Chinese
Advanced Materials Society, 1(1), 21-39.
Hu, F. X., Xie, J. L., Bao, S. J., Yu, L., & Li, C. M. (2015). Shape-controlled ceria-
reduced graphene oxide nanocomposites toward high-sensitive in situ detection
of nitric oxide. Biosensors and Bioelectronics, 70, 310-317.
Hu, L., Sun, Y., Zhang, F., & Chen, Q. (2013). Facile synthesis of porous Mn2O3
hierarchical microspheres for lithium battery anode with improved lithium
storage properties. Journal of Alloys and Compounds, 576, 86-92.
Hu, Z., & Liu, H. (2015). Three-dimensional CuO microflowers as anode materials for
Li-ion batteries. Ceramics International, 41(6), 8257-8260.
Huang, K., Li, Y. H., Lin, S., Liang, C., Wang, H., Ye, C. X., Lei, M. (2014). A facile
route to reduced graphene oxide–zinc oxide nanorod composites with enhanced
photocatalytic activity. Powder Technology, 257, 113-119.
Huang, X., Qi, X., Boey, F., & Zhang, H. (2012). Graphene-based composites.
Chemical Society Reviews, 41(2), 666-686.

111
Huang, X., Yin, Z., Wu, S., Qi, X., He, Q., Zhang, Q., Zhang, H. (2011). Graphene-
based materials: synthesis, characterization, properties, and applications. Small,
7(14), 1876-1902.
Huang, X., Yin, Z., Wu, S., Qi, X., He, Q., Zhang, Q., Zhang, H. (2011). Graphene-
Based Materials: Synthesis, Characterization, Properties, and Applications.
Small, 7(14), 1876-1902.
Hummers Jr, W. S., & Offeman, R. E. (1958). Preparation of graphitic oxide. Journal of
the American Chemical Society, 80(6), 1339.
Hummers, W. S., & Offeman, R. E. (1958). Preparation of Graphitic Oxide. Journal of
the American Chemical Society, 80(6), 1339-1339.
Ikhsan, N. I., Rameshkumar, P., Pandikumar, A., Mehmood Shahid, M., Huang, N. M.,
Vijay Kumar, S., & Lim, H. N. (2015). Facile synthesis of graphene oxide–silver
nanocomposite and its modified electrode for enhanced electrochemical
detection of nitrite ions. Talanta, 144, 908-914.
Jan, T., Iqbal, J., Ismail, M., Mansoor, Q., Mahmood, A., & Ahmad, A. (2014).
Eradication of Multi-drug Resistant Bacteria by Ni Doped ZnO Nanorods:
Structural, Raman and optical characteristics. Applied Surface Science, 308(0),
75-81.
Ji, T.-h., Sun, M., & Han, P. (2014). A review of the preparation and applications of
graphene/semiconductor composites. Carbon, 70, 319.
Ji, Z., Shen, X., Yue, X., Zhou, H., Yang, J., Wang, Y., Chen, K. (2015). Facile
synthesis of magnetically separable reduced graphene oxide/magnetite/silver
nanocomposites with enhanced catalytic activity. Journal of Colloid and
Interface Science, 459, 79-85.
Ji, Z., Shen, X., Zhou, H., & Chen, K. (2015). Facile synthesis of reduced graphene
oxide/CeO2 nanocomposites and their application in supercapacitors. Ceramics
International, 41(7), 8710-8716.
Kamat, P. V. (2009). Graphene-based nanoarchitectures. Anchoring semiconductor and
metal nanoparticles on a two-dimensional carbon support. The Journal of
Physical Chemistry Letters, 1(2), 520-527.
Kim, Y. J., Lee, M. H., Kim, H. J., Lim, G., Choi, Y. S., Park, N. G., Lee, W. I. (2009).
Formation of Highly Efficient Dye Sensitized Solar Cells by Hierarchical Pore
Generation with Nanoporous TiO2 Spheres. Advanced Materials, 21(36), 3668-
3673.
Kongkanand, A., Dominguez, R. M., & Kamat, P. V. (2007). Single wall carbon
nanotube scaffolds for photoelectrochemical solar cells. Capture and transport of
photogenerated electrons. Nano Letters, 7(3), 676-680.
Lee, J. M., Pyun, Y. B., Yi, J., Choung, J. W., & Park, W. I. (2009). ZnO nanorod−
graphene hybrid architectures for multifunctional conductors. The Journal of
Physical Chemistry C, 113(44), 19134-19138.

112
Li, B., & Cao, H. (2011). ZnO@ graphene composite with enhanced performance for
the removal of dye from water. Journal of Materials Chemistry, 21(10), 3346-
3349.
Li, G. L., Liu, G., Li, M., Wan, D., Neoh, K., & Kang, E. (2010). Organo-and water-
dispersible graphene oxide− polymer nanosheets for organic electronic memory
and gold nanocomposites. The Journal of Physical Chemistry C, 114(29),
12742-12748.
Li, M., Yin, W., Han, X., & Chang, X. (2016). Hierarchical nanocomposites of
polyaniline scales coated on graphene oxide sheets for enhanced
supercapacitors. Journal of Solid State Electrochemistry, 20(7), 1941-1948.
Li, Q., & Hai, P. (2014). Rapid microwave-assisted synthesis of silver decorated-
reduced graphene oxide nanoparticles with enhanced photocatalytic activity
under visible light. Materials Science in Semiconductor Processing, 22, 16-20.
Li, Y., Cao, Y., Xie, J., Jia, D., Qin, H., & Liang, Z. (2015). Facile solid-state synthesis
of Ag/graphene oxide nanocomposites as highly active and stable catalyst for the
reduction of 4-nitrophenol. Catalysis Communications, 58, 21-25.
Li, Y., Wang, D., Li, W., & He, Y. (2015). Photoelectric conversion properties of
electrochemically codeposited graphene oxide–ZnO nanocomposite films.
Journal of Alloys and Compounds, 648, 942-950.
Liu, J., Liu, G., & Liu, W. (2014). Preparation of water-soluble β-
cyclodextrin/poly(acrylic acid)/graphene oxide nanocomposites as new
adsorbents to remove cationic dyes from aqueous solutions. Chemical
Engineering Journal, 257, 299-308.
Liu, K., Zhang, J.-J., Cheng, F.-F., Zheng, T.-T., Wang, C., & Zhu, J.-J. (2011). Green
and facile synthesis of highly biocompatible graphene nanosheets and its
application for cellular imaging and drug delivery. Journal of Materials
Chemistry, 21(32), 12034.
Liu, R., Li, N., Xia, G., Li, D., Wang, C., Xiao, N., Wu, G. (2013). Assembled hollow
and core-shell SnO2 microspheres as anode materials for Li-ion batteries.
Materials Letters, 93, 243-246.
Liu, X., Pan, L., Lv, T., Zhu, G., Sun, Z., & Sun, C. (2011). Microwave-assisted
synthesis of CdS-reduced graphene oxide composites for photocatalytic
reduction of Cr(VI). Chemical Communications (Camb), 47(43), 11984-11986.
Liu, X., Pan, L., Zhao, Q., Lv, T., Zhu, G., Chen, T., Sun, C. (2012). UV-assisted
photocatalytic synthesis of ZnO–reduced graphene oxide composites with
enhanced photocatalytic activity in reduction of Cr (VI). Chemical Engineering
Journal, 183, 238-243.
Liu, Y., Liu, L., Shan, J., & Zhang, J. (2015). Electrodeposition of palladium and
reduced graphene oxide nanocomposites on foam-nickel electrode for
electrocatalytic hydrodechlorination of 4-chlorophenol. Journal of hazardous
materials, 290, 1-8.

113
Lorestani, F., Shahnavaz, Z., Mn, P., Alias, Y., & Manan, N. S. A. (2015). One-step
hydrothermal green synthesis of silver nanoparticle-carbon nanotube reduced-
graphene oxide composite and its application as hydrogen peroxide sensor.
Sensors and Actuators B: Chemical, 208, 389-398.
Lübke, M., Makwana, N. M., Gruar, R., Tighe, C., Brett, D., Shearing, P., Darr, J. A.
(2015). High capacity nanocomposite Fe3O4/Fe anodes for Li-ion batteries.
Journal of Power Sources, 291, 102-107.
Luo, L., Yang, Y., Zhang, A., Wang, M., Liu, Y., Bian, L., Pan, X. (2015).
Hydrothermal synthesis of fluorinated anatase TiO2/reduced graphene oxide
nanocomposites and their photocatalytic degradation of bisphenol A. Applied
Surface Science, 353, 469-479.
Luo, Q.-P., Yu, X.-Y., Lei, B.-X., Chen, H.-Y., Kuang, D.-B., & Su, C.-Y. (2012).
Reduced graphene oxide-hierarchical ZnO hollow sphere composites with
enhanced photocurrent and photocatalytic activity. The Journal of Physical
Chemistry C, 116(14), 8111-8117.
Lv, T., Pan, L., Liu, X., Lu, T., Zhu, G., & Sun, Z. (2011). Enhanced photocatalytic
degradation of methylene blue by ZnO-reduced graphene oxide composite
synthesized via microwave-assisted reaction. Journal of Alloys and Compounds,
509(41), 10086-10091.
Lv, T., Pan, L., Liu, X., & Sun, Z. (2012). Enhanced photocatalytic degradation of
methylene blue by ZnO–reduced graphene oxide–carbon nanotube composites
synthesized via microwave-assisted reaction. Catalysis Science & Technology,
2(11), 2297. doi: 10.1039/c2cy20023f
Marcano, D. C., Kosynkin, D. V., Berlin, J. M., Sinitskii, A., Sun, Z., Slesarev, A.,
Tour, J. M. (2010). Improved synthesis of graphene oxide. ACS Nano, 4(8),
4806-4814.
Maruthamani, D., Divakar, D., & Kumaravel, M. (2015). Enhanced photocatalytic
activity of TiO2 by reduced graphene oxide in mineralization of Rhodamine B
dye. Journal of Industrial and Engineering Chemistry, 30, 33-43.
Mehrali, M., Latibari, S. T., Mehrali, M., Metselaar, H. S. C., & Silakhori, M. (2013).
Shape-stabilized phase change materials with high thermal conductivity based
on paraffin/graphene oxide composite. Energy Conversion and Management, 67,
275-282.
Mkhoyan, K. A., Contryman, A. W., Silcox, J., Stewart, D. A., Eda, G., Mattevi, C.,
Chhowalla, M. (2009). Atomic and Electronic Structure of Graphene-Oxide.
Nano Letters, 9(3), 1058-1063.
Muhammad Ekramul Mahmud, H. N., Huq, A. K. O., & Yahya, R. b. (2016). The
removal of heavy metal ions from wastewater/aqueous solution using
polypyrrole-based adsorbents: a review. RSC Advances, 6(18), 14778-14791.

114
Myung, S.-T., Kikuchi, M., Yoon, C. S., Yashiro, H., & Sun, Y.-K. (2015). A new
synthetic method of titanium oxyfluoride and its application as an anode material
for rechargeable lithium batteries. Journal of Power Sources, 288, 376-383.
Nurzulaikha, R., Lim, H. N., Harrison, I., Lim, S. S., Pandikumar, A., Huang, N. M.,
Ibrahim, I. (2015). Graphene/SnO2 nanocomposite-modified electrode for
electrochemical detection of dopamine. Sensing and Bio-Sensing Research, 5,
42-49.
Ohsaki, Y., Masaki, N., Kitamura, T., Wada, Y., Okamoto, T., Sekino, T., Yanagida, S.
(2005). Dye-sensitized TiO 2 nanotube solar cells: fabrication and electronic
characterization. Physical Chemistry Chemical Physics, 7(24), 4157-4163.
Park, K. C., Ma, D. Y., & Kim, K. H. (1997). The physical properties of Al-doped zinc
oxide films prepared by RF magnetron sputtering. Thin Solid Films, 305(1), 201-
209.
Peng-Gang, R., Ding-Xiang, Y., Xu, J., Tao, C., & Zhong-Ming, L. (2011).
Temperature dependence of graphene oxide reduced by hydrazine hydrate.
Nanotechnology, 22(5), 055705.
Peng, H.-P., Hu, Y., Liu, P., Deng, Y.-N., Wang, P., Chen, W., Lin, X.-H. (2015).
Label-free electrochemical DNA biosensor for rapid detection of mutidrug
resistance gene based on Au nanoparticles/toluidine blue–graphene oxide
nanocomposites. Sensors and Actuators B: Chemical, 207, Part A, 269-276.
Peng, X., Wang, L., Zhang, X., Gao, B., Fu, J., Xiao, S., Chu, P. K. (2015). Reduced
graphene oxide encapsulated selenium nanoparticles for high-power lithium–
selenium battery cathode. Journal of Power Sources, 288, 214-220.
Qi, K., Sun, Y., Duan, H., & Guo, X. (2015). A corrosion-protective coating based on a
solution-processable polymer-grafted graphene oxide nanocomposite. Corrosion
Science, 98, 500-506.
Qian, J., Yang, X., Jiang, L., Zhu, C., Mao, H., & Wang, K. (2014). Facile preparation
of Fe3O4 nanospheres/reduced graphene oxide nanocomposites with high
peroxidase-like activity for sensitive and selective colorimetric detection of
acetylcholine. Sensors and Actuators B: Chemical, 201, 160-166.
Qiu, J., Zhang, P., Ling, M., Li, S., Liu, P., Zhao, H., & Zhang, S. (2012).
Photocatalytic Synthesis of TiO2 and Reduced Graphene Oxide Nanocomposite
for Lithium Ion Battery. ACS Applied Materials & Interfaces, 4(7), 3636-3642.
Qiu, X., Lu, L., Leng, J., Yu, Y., Wang, W., Jiang, M., & Bai, L. (2016). An enhanced
electrochemical platform based on graphene oxide and multi-walled carbon
nanotubes nanocomposite for sensitive determination of Sunset Yellow and
Tartrazine. Food Chemistry, 190, 889-895.
Qu, J., Shi, L., He, C., Gao, F., Li, B., Zhou, Q., Qiu, J. (2014). Highly efficient
synthesis of graphene/MnO< sub> 2</sub> hybrids and their application for
ultrafast oxidative decomposition of methylene blue. Carbon, 66, 485-492.

115
Raghavan, N., Thangavel, S., & Venugopal, G. (2015). Enhanced photocatalytic
degradation of methylene blue by reduced graphene-oxide/titanium dioxide/zinc
oxide ternary nanocomposites. Materials Science in Semiconductor Processing,
30, 321-329.
Rai, A. K., Anh, L. T., Gim, J., Mathew, V., Kang, J., Paul, B. J., Kim, J. (2013).
Simple synthesis and particle size effects of TiO2 nanoparticle anodes for
rechargeable lithium ion batteries. Electrochimica Acta, 90, 112-118.
Ren, P. G., Yan, D. X., Ji, X., Chen, T., & Li, Z. M. (2011). Temperature dependence of
graphene oxide reduced by hydrazine hydrate. Nanotechnology, 22(5), 055705.
Reza, K. K., Ali, M. A., Srivastava, S., Agrawal, V. V., & Biradar, A. M. (2015).
Tyrosinase conjugated reduced graphene oxide based biointerface for bisphenol
A sensor. Biosensors and Bioelectronics, 74, 644-651.
Robinson, J. T., Perkins, F. K., Snow, E. S., Wei, Z., & Sheehan, P. E. (2008). Reduced
Graphene Oxide Molecular Sensors. Nano Letters, 8(10), 3137-3140.
Romero Aburto, R., Alemany, L. B., Weldeghiorghis, T. K., Ozden, S., Peng, Z.,
Lherbier, A., Ajayan, P. M. (2015). Chemical Makeup and Hydrophilic Behavior
of Graphene Oxide Nanoribbons after Low-Temperature Fluorination. ACS
Nano, 9(7), 7009-7018.
Saada, R., Kellici, S., Heil, T., Morgan, D., & Saha, B. (2015). Greener synthesis of
dimethyl carbonate using a novel ceria–zirconia oxide/graphene nanocomposite
catalyst. Applied Catalysis B: Environmental, 168–169, 353-362.
Sáaedi, A., Yousefi, R., Jamali-Sheini, F., Cheraghizade, M., Khorsand Zak, A., &
Huang, N. M. (2013). Optical and electrical properties of p-type Li-doped ZnO
nanowires. Superlattices and Microstructures, 61, 91-96.
Sadollahkhani, A., Kazeminezhad, I., Lu, J., Nur, O., Hultman, L., & Willander, M.
(2014). Synthesis, structural characterization and photocatalytic application of
ZnO@ZnS core-shell nanoparticles. RSC Advances, 4(70), 36940-36950.
Safa, S., Sarraf-Mamoory, R., & Azimirad, R. (2014). Investigation of reduced
graphene oxide effects on ultra-violet detection of ZnO thin film. Physica E:
Low-Dimensional Systems and Nanostructures, 57, 155-160.
Safavi, A., Tohidi, M., Mahyari, F. A., & Shahbaazi, H. (2012). One-pot synthesis of
large scale graphene nanosheets from graphite-liquid crystal composite via
thermal treatment. Journal of Materials Chemistry, 22(9), 3825-3831.
Setshedi, K. Z., Bhaumik, M., Onyango, M. S., & Maity, A. (2015). High-performance
towards Cr(VI) removal using multi-active sites of polypyrrole–graphene oxide
nanocomposites: Batch and column studies. Chemical Engineering Journal, 262,
921-931.
Shahil, K. M. F., & Balandin, A. A. (2012). Graphene–Multilayer Graphene
Nanocomposites as Highly Efficient Thermal Interface Materials. Nano Letters,
12(2), 861-867.

116
She, X., Zhang, X., Liu, J., Li, L., Yu, X., Huang, Z., & Shang, S. (2015). Microwave-
assisted synthesis of Mn3O4 nanoparticles@reduced graphene oxide
nanocomposites for high performance supercapacitors. Materials Research
Bulletin, 70, 945-950.
Shen, J. F., Yan, B., Shi, M., Ma, H. W., Li, N., & Ye, M. X. (2011). One step
hydrothermal synthesis of TiO2-reduced graphene oxide sheets. Journal of
Materials Chemistry, 21(10), 3415-3421.
Sheshmani, S., Akhundi Nematzadeh, M., Shokrollahzadeh, S., & Ashori, A. (2015).
Preparation of graphene oxide/chitosan/FeOOH nanocomposite for the removal
of Pb(II) from aqueous solution. International Journal of Biological
Macromolecules, 80, 475-480.
Shi, P., & Ye, N. (2015). Investigation of the adsorption mechanism and
preconcentration of sulfonamides using a porphyrin-functionalized Fe3O4-
graphene oxide nanocomposite. Talanta, 143, 219-225.
Song, Y., Qu, K., Zhao, C., Ren, J., & Qu, X. (2010). Graphene Oxide: Intrinsic
Peroxidase Catalytic Activity and Its Application to Glucose Detection.
Advanced Materials, 22(19), 2206-2210.
Sookhakian, M., Amin, Y. M., & Basirun, W. J. (2013). Hierarchically ordered macro-
mesoporous ZnS microsphere with reduced graphene oxide supporter for a
highly efficient photodegradation of methylene blue. Applied Surface Science,
283(0), 668-677.
Sookhakian, M., Amin, Y. M., Zakaria, R., Baradaran, S., Mahmoudian, M. R., Rezayi,
M., Basirun, W. J. (2014). Enhanced Photovoltaic Performance of Polymer
Hybrid Nanostructure Heterojunction Solar Cells Based on Poly(3-
hexylthiophene)/ZnS/ZnO/Reduced Graphene Oxide Shell–Core Nanorod
Arrays. Industrial & Engineering Chemistry Research, 53(37), 14301-14309.
Sookhakian, M., Amin, Y. M., Zakaria, R., Basirun, W. J., Mahmoudian, M. R., Nasiri-
Tabrizi, B., Azarang, M. (2015). Significantly improved photocurrent response
of ZnS-reduced graphene oxide composites. Journal of Alloys and Compounds,
632(0), 201-207.
Stankovich, S., Dikin, D. A., Piner, R. D., Kohlhaas, K. A., Kleinhammes, A., Jia, Y.
Ruoff, R. S. (2007). Synthesis of graphene-based nanosheets via chemical
reduction of exfoliated graphite oxide. Carbon, 45(7), 1558-1565.
Su, P.-G., & Peng, S.-L. (2015). Fabrication and NO2 gas-sensing properties of reduced
graphene oxide/WO3 nanocomposite films. Talanta, 132, 398-405.
Sun, H., She, P., Xu, K., Shang, Y., Yin, S., & Liu, Z. (2015). A self-standing
nanocomposite foam of polyaniline@reduced graphene oxide for flexible super-
capacitors. Synthetic Metals, 209, 68-73.
Sun, L., Wang, G., Hao, R., Han, D., & Cao, S. (2015). Solvothermal fabrication and
enhanced visible light photocatalytic activity of Cu2O-reduced graphene oxide
117
composite microspheres for photodegradation of Rhodamine B. Applied Surface
Science, 358, Part A, 91-99.
Tachikawa, T., Fujitsuka, M., & Majima, T. (2007). Mechanistic insight into the TiO2
photocatalytic reactions: design of new photocatalysts. The Journal of Physical
Chemistry C, 111(14), 5259-5275.
Tan, J., Liu, L., Guo, S., Hu, H., Yan, Z., Zhou, Q., Wang, X. (2015). The
electrochemical performance and mechanism of cobalt (II) fluoride as anode
material for lithium and sodium ion batteries. Electrochimica Acta, 168, 225-
233.
Tang, L., Nguyen, V. H., Lee, Y. R., Kim, J., & Shim, J.-J. (2015). Photocatalytic
activity of reduced graphene oxide/SnO2 nanocomposites prepared in ionic
liquid. Synthetic Metals, 201, 54-60.
Thakur, S., & Karak, N. (2015). Tuning of sunlight-induced self-cleaning and self-
healing attributes of an elastomeric nanocomposite by judicious compositional
variation of the TiO2-reduced graphene oxide nanohybrid. Journal of Materials
Chemistry A, 3(23), 12334-12342.
Tian, J. Q., Liu, S., Li, H. Y., Wang, L., Zhang, Y. W., Luo, Y. L., Sun, X. P. (2012).
One-step preparation of ZnO nanoparticle-decorated reduced graphene oxide
composites and their application to photocurrent generation. RSC Advances,
2(4), 1318-1321.
Tiwari, D. C., Atri, P., & Sharma, R. (2015). Sensitive detection of ammonia by reduced
graphene oxide/polypyrrole nanocomposites. Synthetic Metals, 203, 228-234.
Usachov, D., Vilkov, O., Grüneis, A., Haberer, D., Fedorov, A., Adamchuk, V. K., . . .
Vyalikh, D. V. (2011). Nitrogen-Doped Graphene: Efficient Growth, Structure,
and Electronic Properties. Nano Letters, 11(12), 5401-5407.
Vasilaki, E., Georgaki, I., Vernardou, D., Vamvakaki, M., & Katsarakis, N. (2015). Ag-
loaded TiO2/reduced graphene oxide nanocomposites for enhanced visible-light
photocatalytic activity. Applied Surface Science, 353, 865-872.
Vinodgopal, K., Neppolian, B., Lightcap, I. V., Grieser, F., Ashokkumar, M., & Kamat,
P. V. (2010). Sonolytic design of graphene− Au nanocomposites. simultaneous
and sequential reduction of graphene oxide and Au (III). The Journal of Physical
Chemistry Letters, 1(13), 1987-1993.
Wang, H., Hao, Q., Yang, X., Lu, L., & Wang, X. (2009). Graphene oxide doped
polyaniline for supercapacitors. Electrochemistry Communications, 11(6), 1158-
1161.
Wang, H., Yuan, X., Wu, Y., Chen, X., Leng, L., Wang, H., Zeng, G. (2015). Facile
synthesis of polypyrrole decorated reduced graphene oxide–Fe3O4 magnetic
composites and its application for the Cr(VI) removal. Chemical Engineering
Journal, 262, 597-606.

118
Wang, L., Wang, D., Dong, Z., Zhang, F., & Jin, J. (2013). Interface Chemistry
Engineering for Stable Cycling of Reduced GO/SnO2 Nanocomposites for
Lithium Ion Battery. Nano Letters, 13(4), 1711-1716.
Wang, T., Li, C., Ji, J., Wei, Y., Zhang, P., Wang, S., Gong, J. (2014). Reduced
Graphene Oxide (rGO)/BiVO4 Composites with Maximized Interfacial
Coupling for Visible Lght Photocatalysis. ACS Sustainable Chemistry &
Engineering, 2(10), 2253-2258.
Wang, X., Yin, L., & Liu, G. (2014). Light irradiation-assisted synthesis of ZnO-
CdS/reduced graphene oxide heterostructured sheets for efficient photocatalytic
H2 evolution. Chemical Communications, 50(26), 3460-3463.
Wang, Y., Li, Z., Hu, D., Lin, C.-T., Li, J., & Lin, Y. (2010). Aptamer/Graphene Oxide
Nanocomplex for in Situ Molecular Probing in Living Cells. Journal of the
American Chemical Society, 132(27), 9274-9276.
Wang, Y., Shi, Z., Huang, Y., Ma, Y., Wang, C., Chen, M., & Chen, Y. (2009).
Supercapacitor Devices Based on Graphene Materials. The Journal of Physical
Chemistry C, 113(30), 13103-13107.
Weng, B., Yang, M. Q., Zhang, N., & Xu, Y. J. (2014). Toward the enhanced
photoactivity and photostability of ZnO nanospheres via intimate surface coating
with reduced graphene oxide. Journal of Materials Chemistry A, 2(24), 9380-
9389.
Wengeler, L., Schmitt, M., Peters, K., Scharfer, P., & Schabel, W. (2013). Comparison
of large scale coating techniques for organic and hybrid films in polymer based
solar cells. Chemical Engineering and Processing: Process Intensification, 68,
38-44.
Wu, J., Shen, X., Jiang, L., Wang, K., & Chen, K. (2010). Solvothermal synthesis and
characterization of sandwich-like graphene/ZnO nanocomposites. Applied
Surface Science, 256(9), 2826-2830.
Wu, S., Han, T., Guo, J., & Cheng, Y. (2015). Poly(3-aminophenylboronic acid)-
reduced graphene oxide nanocomposite modified electrode for ultrasensitive
electrochemical detection of fluoride with a wide response range. Sensors and
Actuators B: Chemical, 220, 1305-1310.
Xiang, Q., Yu, J., & Wong, P. K. (2011). Quantitative characterization of hydroxyl
radicals produced by various photocatalysts. Journal of Colloid and Interface
Science, 357(1), 163-167.
Xu, G., Jiang, F., Ren, Z.-a., & Yang, L.-w. (2015). Polyhedral MnO nanocrystals
anchored on reduced graphene oxide as an anode material with superior lithium
storage capability. Ceramics International, 41(9, Part A), 10680-10688.
Xu, T. G., Zhang, L. W., Cheng, H. Y., & Zhu, Y. F. (2011). Significantly enhanced
photocatalytic performance of ZnO via graphene hybridization and the
mechanism study. Applied Catalysis B-Environmental, 101(3-4), 382-387.

119
Xu, X., Shen, J., Li, N., & Ye, M. (2014). Facile synthesis of reduced graphene
oxide/CoWO4 nanocomposites with enhanced electrochemical performances for
supercapacitors. Electrochimica Acta, 150, 23-34.
Xu, Y.-T., Guo, Y., Jiang, H., Xie, X.-B., Zhao, B., Zhu, P.-L., Wong, C.-P. (2015).
Enhanced Performance of Lithium-Ion Batteries with Copper Oxide
Microspheres @ Graphene Oxide Micro/Nanocomposite Electrodes. Energy
Technology, 3(5), 488-495.
Xue, Y., Chen, H., Yu, D., Wang, S., Yardeni, M., Dai, Q., Dai, L. (2011). Oxidizing
metal ions with graphene oxide: the in situ formation of magnetic nanoparticles
on self-reduced graphene sheets for multifunctional applications. Chemical
Communications (Camb), 47(42), 11689-11691.
Yan, X., Zhang, X., Liu, H., Liu, Y., Ding, J., Liu, Y., Zhang, J. (2014). Fabrication of
SDBS intercalated-reduced graphene oxide/polypyrrole nanocomposites for
supercapacitors. Synthetic Metals, 196, 1-7.
Yan, Y., Zhang, X., Mao, H., Huang, Y., Ding, Q., & Pang, X. (2015).
Hydroxyapatite/gelatin functionalized graphene oxide composite coatings
deposited on TiO2 nanotube by electrochemical deposition for biomedical
applications. Applied Surface Science, 329, 76-82.
Yang, H., Li, H., Zhai, J., Sun, L., & Yu, H. (2014). Simple Synthesis of Graphene
Oxide Using Ultrasonic Cleaner from Expanded Graphite. Industrial &
Engineering Chemistry Research, 53(46), 17878-17883.
Yang, P., Yan, H., Mao, S., Russo, R., Johnson, J., Saykally, R., Choi, H.-J. (2002).
Controlled growth of ZnO nanowires and their optical properties. Advanced
Functional Materials, 12(5), 323.
Yang, X., Zhang, X., Ma, Y., Huang, Y., Wang, Y., & Chen, Y. (2009).
Superparamagnetic graphene oxide-Fe3O4nanoparticles hybrid for controlled
targeted drug carriers. Journal of Materials Chemistry, 19(18), 2710-2714.
Yang, Y., Kang, M., Fang, S., Wang, M., He, L., Zhao, J., Zhang, Z. (2015).
Electrochemical biosensor based on three-dimensional reduced graphene oxide
and polyaniline nanocomposite for selective detection of mercury ions. Sensors
and Actuators B: Chemical, 214, 63-69.
Yang, Y. J. (2015). One-pot synthesis of reduced graphene oxide/zinc sulfide
nanocomposite at room temperature for simultaneous determination of ascorbic
acid, dopamine and uric acid. Sensors and Actuators B: Chemical, 221, 750-759.
Yang, Z.-H., Zhuo, Y., Yuan, R., & Chai, Y.-Q. (2015). An amplified electrochemical
immunosensor based on in situ-produced 1-naphthol as electroactive substance
and graphene oxide and Pt nanoparticles functionalized CeO2 nanocomposites
as signal enhancer. Biosensors and Bioelectronics, 69, 321-327.
Yao, Y., & Xue, Y. (2015). Impedance analysis of quartz crystal microbalance humidity
sensors based on nanodiamond/graphene oxide nanocomposite film. Sensors and
Actuators B: Chemical, 211, 52-58.

120
Yeh, C.-C., Wu, P.-R., & Chen, D.-H. (2014). Fabrication and near infrared
photothermally-enhanced catalytic activity of Cu nanoparticles/reduced
graphene oxide nanocomposite. Materials Letters, 136, 274-277.
Yola, M. L., Eren, T., & Atar, N. (2015). A sensitive molecular imprinted
electrochemical sensor based on gold nanoparticles decorated graphene oxide:
Application to selective determination of tyrosine in milk. Sensors and Actuators
B: Chemical, 210, 149-157.
Yousefi, R., Jamali-Sheini, F., Cheraghizade, M., Khosravi-Gandomani, S., Sáaedi, A.,
Huang, N. M., Azarang, M. (2015). Enhanced visible-light photocatalytic
activity of strontium-doped zinc oxide nanoparticles. Materials Science in
Semiconductor Processing, 32(0), 152-159.
Yu, G., Hu, L., Liu, N., Wang, H., Vosgueritchian, M., Yang, Y., Bao, Z. (2011).
Enhancing the Supercapacitor Performance of Graphene/MnO2 Nanostructured
Electrodes by Conductive Wrapping. Nano Letters, 11(10), 4438-4442.
Yu, H., Yu, J., Cheng, B., & Zhou, M. (2006). Effects of hydrothermal post-treatment
on microstructures and morphology of titanate nanoribbons. Journal of Solid
State Chemistry, 179(2), 349-354.
Yu, J. C., Yu, J., Ho, W., Jiang, Z., & Zhang, L. (2002). Effects of F-doping on the
photocatalytic activity and microstructures of nanocrystalline TiO2 powders.
Chemistry of Materials, 14(9), 3808-3816.
Yun, H., Nguyen-Phan, T.-D., Pham, V. H., Kweon, H., Chung, J. S., Lee, B., & Shin,
E. W. (2012). Influence of TiO2 dimension and graphene oxide content on the
self-cleaning activity of methylene blue-stained photocatalytic films. Materials
Research Bulletin, 47(10), 2988-2993.
Zahed, B., & Hosseini-Monfared, H. (2015). A comparative study of silver-graphene
oxide nanocomposites as a recyclable catalyst for the aerobic oxidation of benzyl
alcohol: Support effect. Applied Surface Science, 328, 536-547.
Zak, A. K., Abd Majid, W. H., Darroudi, M., & Yousefi, R. (2011). Synthesis and
characterization of ZnO nanoparticles prepared in gelatin media. Materials
Letters, 65(1), 70-73.
Zak, A. K., Razali, R., Majid, W. H., & Darroudi, M. (2011). Synthesis and
characterization of a narrow size distribution of zinc oxide nanoparticles.
International Journal of Nanomedicine, 6, 1399-1403.
Zhang, D., Tong, J., Xia, B., & Xue, Q. (2014). Ultrahigh performance humidity sensor
based on layer-by-layer self-assembly of graphene oxide/polyelectrolyte
nanocomposite film. Sensors and Actuators B: Chemical, 203, 263-270.
Zhang, J., Pan, J., Shao, L., Shu, J., Zhou, M., & Pan, J. (2014). Micro-sized cadmium
tungstate as a high-performance anode material for lithium-ion batteries. Journal
of Alloys and Compounds, 614, 249-252.

121
Zhang, J., Yu, J., Jaroniec, M., & Gong, J. R. (2012). Noble Metal-Free Reduced
Graphene Oxide-Zn x Cd1–x S Nanocomposite with Enhanced Solar
Photocatalytic H2-Production Performance. Nano Letters, 12(9), 4584-4589.
Zhang, L., Xia, J., Zhao, Q., Liu, L., & Zhang, Z. (2010). Functional Graphene Oxide as
a Nanocarrier for Controlled Loading and Targeted Delivery of Mixed
Anticancer Drugs. Small, 6(4), 537-544.
Zhang, Y., Chen, Z., Liu, S., & Xu, Y.-J. (2013). Size effect induced activity
enhancement and anti-photocorrosion of reduced graphene oxide/ZnO
composites for degradation of organic dyes and reduction of Cr(VI) in water.
Applied Catalysis B: Environmental, 140-141(0), 598-607.
Zhang, Y., Zhang, N., Tang, Z.-R., & Xu, Y.-J. (2012). Graphene transforms wide band
gap ZnS to a visible light photocatalyst. The new role of graphene as a
macromolecular photosensitizer. ACS Nano, 6(11), 9777-9789.
Zheng, C., He, C., Zhang, H., Wang, W., & Lei, X. (2015). TiO2-reduced graphene
oxide nanocomposite for high-rate application of lithium ion batteries. Ionics,
21(1), 51-58.
Zheng, C., Zheng, Y., Chen, W., & Wei, L. (2015). Encapsulation of graphene
oxide/metal hybrids in nanostructured sol–gel silica ORMOSIL matrices and its
applications in optical limiting. Optics & Laser Technology, 68, 52-59.
Zheng, W. T., Ho, Y. M., Tian, H. W., Wen, M., Qi, J. L., & Li, Y. A. (2009). Field
emission from a composite of graphene sheets and ZnO nanowires. The Journal
of Physical Chemistry C, 113(21), 9164-9168.
Zhou, Y., Bao, Q., Tang, L. A. L., Zhong, Y., & Loh, K. P. (2009). Hydrothermal
Dehydration for the “Green” Reduction of Exfoliated Graphene Oxide to
Graphene and Demonstration of Tunable Optical Limiting Properties. Chemistry
of Materials, 21(13), 2950-2956.
Zhu, C., Guo, S., Fang, Y., & Dong, S. (2010). Reducing Sugar: New Functional
Molecules for the Green Synthesis of Graphene Nanosheets. ACS Nano, 4(4),
2429-2437.
Zhu, Y., Murali, S., Stoller, M. D., Ganesh, K. J., Cai, W., Ferreira, P. J., Ruoff, R. S.
(2011). Carbon-Based Supercapacitors Produced by Activation of Graphene.
Science, 332(6037), 1537-1541.
Zou, W., Zhu, J., Sun, Y., & Wang, X. (2011). Depositing ZnO nanoparticles onto
graphene in a polyol system. Materials Chemistry and Physics, 125(3), 617-620.
Zou, W. B., Zhu, J. W., Sun, Y. X., & Wang, X. (2011). Depositing ZnO nanoparticles
onto graphene in a polyol system. Materials Chemistry and Physics, 125(3),
617-620.

122
LIST OF PUBLICATIONS AND PAPERS PRESENTED
1. Azarang, M., Shuhaimi, A., Yousefi, R., Moradi Golsheikh, A., & Sookhakian, M.
(2014). Synthesis and characterization of ZnO NPs/reduced graphene oxide
nanocomposite prepared in gelatin medium as highly efficient photo-degradation of
MB. Ceramics International, 40(7), 10217-10221.
2. Azarang, M., Shuhaimi, A., Yousefi, R., & Sookhakian, M. (2014). Effects of
graphene oxide concentration on optical properties of ZnO/RGO nanocomposites and
their application to photocurrent generation. Journal of Applied Physics, 116(8),
084307.
3. Azarang, M., Shuhaimi, A., & Sookhakian, M. (2015). Crystalline quality
assessment, photocurrent response and optical properties of reduced graphene oxide
uniformly decorated zinc oxide nanoparticles based on the graphene oxide
concentration. RSC Advances., 5(65), 53117-53128.
4. Azarang, M., Shuhaimi, A., Yousefi, R., & Jahromi, S. P. (2015). One-pot sol–gel
synthesis of reduced graphene oxide uniformly decorated zinc oxide nanoparticles in
starch environment for highly efficient photodegradation of Methylene Blue. RSC
Advances., 5(28), 21888-21896.