zostera marina beds a dissertation - virginia institute of
TRANSCRIPT

FUNCTION OF SEED-BANK ECOLOGY IN MID-ATLANTIC SEMI-ANNUAL AND
PERENNIAL ZOSTERA MARINA BEDS
__________________________
A Dissertation
Presented To
The Faculty of the School of Marine Science
The College of William & Mary in Virginia
In Partial Fulfillment
Of the Requirements for the Degree of
Doctor of Philosophy
__________________________
by
Jessie C. Jarvis
2009

ii
APPROVAL SHEET
This thesis is submitted in partial fulfillment of The requirements for the degree of
Doctor of Philosophy
____________________________
Jessie C. Jarvis
Approved, by the Committee, May 2009
____________________________ Kenneth A. Moore, Ph.D. Committee Chairman, Advisor
____________________________ Mark J. Brush, Ph.D.
____________________________ Carl H. Hobbs, Ph.D..
____________________________ W. Judson Kenworthy, Ph.D. NOS/NOAA Beaufort, NC
____________________________ Robert J. Orth, Ph.D..
_______________________ Sandy Wyllie-Echeverria, Ph.D. University of Washington Friday Harbor, Washington

iii
TABLE OF CONTENTS ACKNOWLEDGEMENTS.............................................................................................. VI
LIST OF TABLES...........................................................................................................VII
LIST OF FIGURES .......................................................................................................... IX
ABSTRACT........................................................................................................................ 1
INTRODUCTION .............................................................................................................. 2
BACKGROUND.................................................................................................................. 3 OBJECTIVES ..................................................................................................................... 4 ZOSTERA MARINA DESCRIPTION ........................................................................................ 5 ZOSTERA MARINA LIFE HISTORIES..................................................................................... 7 ZOSTERA MARINA SEDIMENT SEED-BANK........................................................................ 10 ZOSTERA MARINA SEED GERMINATION............................................................................ 11 ZOSTERA MARINA RESPONSE TO DISTURBANCE............................................................... 12 ZOSTERA MARINA SEXUAL REPRODUCTION MODEL AND SYNTHESIS .............................. 13 LITERATURE CITED........................................................................................................ 14
CHAPTER 1 : REPRODUCTIVE STRATEGIES FOR SEMI-ANNUAL AND PERENNIAL ZOSTERA MARINA L. BEDS IN NORTH CAROLINA....................... 20
ABSTRACT ..................................................................................................................... 21 INTRODUCTION .............................................................................................................. 23 METHODS ...................................................................................................................... 29
Site Selection ............................................................................................................ 29 Water Column and Sediment Characterization......................................................... 30 Zostera marina Characterization .............................................................................. 31 Zostera marina Seed-bank Characterization ............................................................ 32
DATA ANALYSIS ............................................................................................................ 33 RESULTS ........................................................................................................................ 34
Water Column and Sediment Characteristics ........................................................... 34 Zostera marina biomass............................................................................................ 35 Shoot Density and Seed Abundance ......................................................................... 36 Seed-bank.................................................................................................................. 38
DISCUSSION ................................................................................................................... 38 Conclusions............................................................................................................... 44
LITERATURE CITED........................................................................................................ 46
CHAPTER 2 : VIABILITY OF ZOSTERA MARINA L. SEMI-ANNUAL AND PERENNIAL SEEDS IN THE SEDIMENT SEED-BANK ............................................ 60
ABSTRACT ..................................................................................................................... 61 INTRODUCTION .............................................................................................................. 63 METHODS ...................................................................................................................... 67
Site Selection ............................................................................................................ 67 Seed Collection and Seed Viability .......................................................................... 68 Seed Viability Experiments ...................................................................................... 69 Ambient Site Characterization.................................................................................. 72

iv
DATA ANALYSIS ............................................................................................................ 73 RESULTS ........................................................................................................................ 75
Sediment Characteristics........................................................................................... 75 Ambient Seed-bank Viability ................................................................................... 79 Seed Viability Experiments ...................................................................................... 80 Water Column Characteristics .................................................................................. 83
DISCUSSION ................................................................................................................... 84 Conclusions............................................................................................................... 89
LITERATURE CITED........................................................................................................ 90
CHAPTER 3 : SEEDLING EMERGENCE AND SEED VIABILITY OF SEMI-ANNUAL AND PERENNIAL ZOSTERA MARINA L. SEEDS: THE EFFECTS OF SEED SOURCE, SEDIMENT TYPE, AND BURIAL DEPTH .................................... 108
ABSTRACT ................................................................................................................... 109 INTRODUCTION ............................................................................................................ 111 METHODS .................................................................................................................... 113
Seed Collection and Viability ................................................................................. 113 Sediment Collection and Characterization.............................................................. 114 Seed Source, Sediment Type, and Burial Depth Experiment ................................. 115
DATA ANALYSES ......................................................................................................... 117 RESULTS ...................................................................................................................... 119
Water Quality Conditions ....................................................................................... 119 Sediment Characteristics......................................................................................... 120 Maximum Seedling Emergence.............................................................................. 121 Time to Seedling Emergence .................................................................................. 122 Remaining Seed viability........................................................................................ 123 Seedling Biomass.................................................................................................... 124
DISCUSSION ................................................................................................................. 125 LITERATURE CITED...................................................................................................... 133
CHAPTER 4 : POTENTIAL LONG-TERM LOSS OF ZOSTERA MARINA BEDS IN THE CHESAPEAKE BAY FOLLOWING REPEATED DISTURBANCE EVENTS: THE ROLE OF SEEDLINGS AND SEED-BANK VIABILITY.................................. 147
ABSTRACT ................................................................................................................... 148 INTRODUCTION ............................................................................................................ 149 METHODS .................................................................................................................... 152
Site Selection .......................................................................................................... 152 Sediment Characterization ...................................................................................... 153 Water Column Characterization ............................................................................. 154 Recolonization Characteristics................................................................................ 155 Sediment Seed-bank................................................................................................ 155
DATA ANALYSIS .......................................................................................................... 156 RESULTS ...................................................................................................................... 157
Environmental Characterization ............................................................................. 157 Pre-Decline vs. Post-Decline .................................................................................. 160 Total Cover ............................................................................................................. 160 Above Ground Biomass.......................................................................................... 161

v
Density .................................................................................................................... 162 Seed-bank................................................................................................................ 163
DISCUSSION ................................................................................................................. 164 LITERATURE CITED...................................................................................................... 169
CHAPTER 5 : MODELING LOSS AND RECOVERY OF ZOSTERA MARINA BEDS IN THE CHESAPEAKE BAY FOLLOWING REPEATED DISTURBANCE EVENTS: THE ROLE OF SEEDLINGS AND SEED-BANK VIABILITY.................................. 185
ABSTRACT ................................................................................................................... 186 INTRODUCTION ............................................................................................................ 188 METHODS .................................................................................................................... 191
Model Description .................................................................................................. 191 Model Formulation ................................................................................................. 193 Calibration, Validation, and Testing....................................................................... 199 Model Scenarios...................................................................................................... 200
RESULTS ...................................................................................................................... 201 Model Calibration ................................................................................................... 201 Model Validation .................................................................................................... 202 Sensitivity Analysis ................................................................................................ 203 Model Scenarios...................................................................................................... 207
DISCUSSION ................................................................................................................. 210 Model Limitations................................................................................................... 210 Sexual Reproduction, Temperature, and Light ....................................................... 212 Conclusions............................................................................................................. 217
LITERATURE CITED...................................................................................................... 219
SYNTHESIS................................................................................................................... 239
VITA............................................................................................................................... 245

vi
ACKNOWLEDGEMENTS My research would not have been accomplished without the help of my major
advisor, Dr. Ken Moore, and my committee. I would especially like to thank Ken for taking every opportunity to teach, for always taking the time to listen and help, and for introducing me to the seagrass world in a million different ways. I would not be the scientist/person I am had you not been my advisor. I would also like to thank my committee members, Dr. Mark Brush, Dr. Carl Hobbs, Dr. Jud Kenworthy, Dr. Robert Orth, and Dr. Sandy Wyllie-Echeverria for their enthusiasm, for sharing their expertise, and for keeping me focused. I would especially like to thank Jud for all of his help with every aspect of the North Carolina sampling and Mark for his never-ending patience while teaching me how to create a seagrass model. Thank you!
In addition, I would like to thank numerous members of the VIMS community who have given me their support, guidance, knowledge, and friendship. First I would like to thank everyone at CBNERRVA. Working with the amazing people in this lab kept me excited about every aspect of marine science no matter what time of day. I would especially like to thank Erin Shields and Brittany Haywood for their help in the lab and in the field, for never complaining (even when I asked you to sample on holidays), for expanding my musical horizons (sledgehammer!) and for keeping me sane during the last four years. I would also like to thank Betty Neikirk, lab manager extraordinaire, for keeping me organized and for providing me with a family away from home. In addition, I wish to thank Amber Hardison, Lisa Majzlik, and Aaron Bever who are wonderful examples of the many different faces of true friendship. Without you three I would not have made it through my time at VIMS. Thank you!
I also wish to thank my mother Gayle, my father Dan, and my brother Daniel, who have always provided me with unwavering love and support. When I didn’t believe in myself you three kept me going. I love you. I would like to thank my best friend and husband Brandon Jarvis for the million ways in which he has made my life better and brighter. I am especially thankful for his willingness to help in the lab and in the field at any time (day or night), his constant support and understanding, for encouraging me to get my PhD even though it meant another four years married to a graduate student, and for putting my dreams first. Now, it is finally your turn. I love you. Thank you!

vii
LIST OF TABLES
CHAPTER 1 Table 1-1 Sediment characteristics for both North Carolina sampling sites. ................ 52 Table 1-2. Results of repeated measures ANOVA for above-ground biomass and
flowering shoot biomass for both North Carolina sites ........................................... 53 Table 1-3. Negative binomial regression model analyzing the effects of site on vegetative
shoot density, reproductive shoot density, potential number of produced seeds, total seed-bank density, and viable seed-bank density. .................................................. 54
Table 1-4. Mean sexual reproductive output for Z. marina beds located at both NC1 and NC2 during the 2007-2008 growing season. .......................................................... 55
Table 1-5. Mean total seed-bank density and percentage of viable seeds for Z. marina beds in both NC1 and NC2. .................................................................................... 55
CHAPTER 2 Table 2-1. A priori equation selection for both North Carolina and Virginia. (A) ambient
seed-bank and (B) seed core viability. ...................................................................... 96 Table 2-2. Average ambient and experimental sediment conditions for both (A) North
Carolina and (B) Virginia sites. .............................................................................. 97 Table 2-3. Ambient sediment seed-bank total seed density, viable seed density, and
percentage of seed viability in all North Carolina and Virginia sites. .................... 98 Table 2-4. Top ranked models describing the viability of (A) of the ambient seed-bank
and (B) experimental seed cores .............................................................................. 99 Table 2-5. North Carolina ambient seed-bank (A) density and (B) viability models and
odds ratios. ............................................................................................................ 100 Table 2-6. Logistic regression model and calculated odds ratios for (A) North Carolina
and (B) Virginia experimental seed viability cores. ............................................. 101 CHAPTER 3 Table 3-1. Sediment characteristics for the sand and mud treatments. ........................ 139 Table 3-2. Logistic regression results for the effects of seed source, sediment type, and
burial depth on semi-annual and perennial seedling emergence. ........................... 140 Table 3-3. Maximum emergence and mean time to emergence across all treatments. . 141 Table 3-4. Survival analysis results of the effects of seed source, sediment type, and
burial depth on time to emergence of perennial and semi-annual seeds. All significant results are denoted with an (*). ............................................................. 142
Table 3-5. Poisson regression results for remaining (A) viable, (B) non-viable, and (C) pre-emergent seeds. ................................................................................................ 143

viii
CHAPTER 4 Table 4-1. Negative binomial results and odds ratios for the effects of year, site, and their
interactions on Z. marina shoot density in the lower York River........................... 173 Table 4-2. Negative binomial results and odds ratios for the effects of year, and site on Z.
marina vegetative above ground biomass............................................................... 174 Table 4-3. Negative binomial results and odds ratios for the effects of year, and site on
vegetative Z. marina shoot density. ...................................................................... 175 Table 4-4. Mean percent of total Z. marina flowering shoots found in the shallow, mid-
bed, and deep regions of the GI1, GI2, and GP sites in 2006 and 2007. ............... 176 Table 4-5. Negative binomial results and odds ratios for the effects of date and transect
on total Z. marina seed-bank density...................................................................... 177 Table 4-6. Mean seed-bank density and seed viability in Z. marina seeds collected from
the ambient sediment seed-bank at GI1, GI2, and GP sites in 2006 and 2007....... 178 CHAPTER 5 Table 5-1. Z. marina production and reproduciton model governing equations. ......... 224 Table 5-2. Parameter estimates for the Z. marina production model. ......................... 225 Table 5-3. Parameter estimates for the Z. marina reproduction model. ....................... 226 Table 5-4. State variable sensitiviy analysis. ............................................................... 227 Table 5-5. Forcing function sensitivity analysis. ......................................................... 228 Table 5-6. Model projected maximum seed-bank densities between 2005 – 2007 for all
temperature runs. .................................................................................................... 229 Table 5-7. Model projected maximum viable seed-bank densities between 2005 – 2007
for all temperature runs. ........................................................................................ 229
ix
LIST OF FIGURES
CHAPTER 1 Figure 1-1. Location of NC1 and NC2 sampling sites in the southern outer banks region
of North Carolina. ................................................................................................... 56 Figure 1-2. Mean water column (A) temperature, (B) DO, and (C) salinity for both sites
over time. ................................................................................................................ 57 Figure 1-3. Mean aboveground biomass for (A) non-reproductve shoots and (B)
reproductive shoots during the 2007 – 2008 growing season at NC1 and NC2. ..... 58 Figure 1-4. Mean monthly values for (A) vegetative shoot density (B) reproductive shoot
density and (C) percentage of reproductive shoots at both NC1 and NC2. ............. 59 CHAPTER 2 Figure 2-1. Site locations for both the Virginia (CB1 and CB2) and North Carolina (NC1
and NC2) experiments. .......................................................................................... 102 Figure 2-2. Mean sediment redox profiles for all sampling sites (A) NC1; (B) NC2; (C)
CB1 (D) CB2 across all sampling dates. ............................................................... 103 Figure 2-3. Mean sediment redox profiles for each sediment treatment averaged across
both North Carolina sites. ...................................................................................... 104 Figure 2-4. Mean redox values for experimental sediment cores averaged across both
Virginia sites. ......................................................................................................... 105 Figure 2-5. Viability of remaining seeds in both (A) North Carolina and (B) Virginia
experimental seed cores. ....................................................................................... 106 Figure 2-6. Mean percent of total seeds removed from each experimental sediment core
in North Carolina sites. .......................................................................................... 107 Figure 2-7. Mean percent of total seeds removed from each experimental sediment core
in Virginia sites. .................................................................................................... 107 CHAPTER 3 Figure 3-1. Mean vertical redox (Eh) measurements from cores collected from all
treatments at the end of the experiment. ............................................................... 144 Figure 3-2. Cumulative mean percent germination curves for (A) mud 1 cm; (B) sand 1
cm; (C) mud 5 cm; (D) sand 5 cm treatments. ....................................................... 145 Figure 3-3. Mean total Z. marina seedling biomass. . .................................................. 146 CHAPTER 4 Figure 4-1. Study site locations with respect to the Chesapeake Bay. ........................ 179 Figure 4-2. Water quality conditions at both the up river and down river sites. ......... 180 Figure 4-3. Z. marina density at three locations in the lower York River, VA from 2004
– 2007. ................................................................................................................... 181 Figure 4-4. Mean Z. marina density for the down river and upriver shallow, medium, and
deep transects in 2006 – 2007. ............................................................................... 182 Figure 4-5. Mean vegetative shoot above ground biomass for all sites. ....................... 183 Figure 4-6. Mean reproductive shoot above ground biomass at the down river and
upriver sites. ........................................................................................................... 184

x
CHAPTER 5 Figure 5-1. Lower York River Virginia site locations for all calibration and forcing
function data collection. ......................................................................................... 230 Figure 5-2. Conceptual diagram for Zostera marina production and sexual reproduction
model. ..................................................................................................................... 231 Figure 5-3. Forcing functions for Goodwin Island and Gloucester Point...................... 232 Figure 5-4. Water column and sediment nutrient forcing functions for Goodwin Island
and Gloucester Point. ............................................................................................ 233 Figure 5-5. Calibration of Zostera marina above and below ground biomass model with
observed GI data. .................................................................................................. 234 Figure 5-6. Validation of Z. marina above and below ground biomass model with
observed GP data. ................................................................................................. 235 Figure 5-7. Goodwin Island and Gloucester Point (A) above ground biomass and (B)
below ground biomass model projections with and without sexual reproduction for 2005 – 2007 under ambient temperatures............................................................... 236
Figure 5-8. Goodwin Island and Gloucester Point model projections with sexual reproduction for 2005 – 2007 under all temperature scenarios .............................. 237
Figure 5-9. Model projections of Goodwin Island above ground biomass with both upriver water column light attenuation and downriver water column light attenuation conditions under all temperature scenarios............................................................. 238

1
ABSTRACT
The effects of water quality and sediment composition on mid-Atlantic semi-annual and perennial Zostera marina reproductive success, seed-bank viability, and seed germination were elucidated using laboratory and in situ experiments, quantitative field observations, and ecological model simulations. The sediment seed-bank was found to play a large role in the recovery of perennial Z. marina beds in the Chesapeake Bay and in the yearly re-establishment of beds in North Carolina which were determined to have a semi-annual life history. However, the resiliency provided by sediment seed-bank for both semi-annual and perennial Z. marina beds was limited as seeds remained viable for less than one year. When comparing the two life forms, semi-annual Z. marina beds produced a greater proportion of flowering shoots and more seeds than nearby perennial beds. Seed germination was significantly affected by sediment type and burial depth with maximum germination of seeds occurring in sediments containing > 3 % organic content and buried at depths < 3 cm. Model simulations indicate that York River Z. marina beds are currently at their maximum temperature threshold and that projected increases of ≥ 1 ºC in water temperature within the Chesapeake Bay may result in large scale declines. While the sediment seed-bank may provide a mechanism for recovery following one year of increased temperature stress, seed-banks are depleted following large scale germination events and may not provide resiliency to multiple consecutive years of stressful conditions. Further research into the interactive effects of sediment and water column conditions and seed physiology on seed viability are required to gain a more comprehensive understanding of seed-bank dynamics in Z. marina beds. Monitoring of semi-annual and perennial Z. marina beds in North Carolina indicated that multiple life history strategies may be found within one Z. marina bed. Shoots within the semi-annual Z. marina bed germinated from seeds, a portion of seedlings flowered during their first year of growth, and all shoots completed their life cycle and died within one year of germination like a semi-annual plant; however, not all shoots flowered and shoots reproduced both sexually and asexually similar to a perennial plant. Since the individual plants found within the semi-annual bed did not display the all of the defining characteristics of either perennial or annual Z. marina life histories, this population cannot be completely described by either life history strategy. Research into the development of a semi-annual life history strategy for Z. marina within this site and the possibility of this form occurring at other geographic regions requires additional research. Sexual reproduction is an important component of both semi-annual and perennial Z. marina populations that should be included in ecological studies and models. Although most perennial Z. marina beds rely on asexual reproduction as a primary form of bed maintenance, the ability to reproduce sexually is maintained and, as shown here, may play a large role in the recovery, maintenance, and expansion of these populations. For these reasons and due to the use of seeds in restoration of Z. marina beds within large systems such as the Chesapeake Bay, research into the dynamics of sexual reproduction within existing beds, a better understanding of seed physiology, and additional research into environmental effects (including the sediment) on seed germination and viability are essential.

2
INTRODUCTION
3
Background
Seagrasses, submerged marine angiosperms, are important components of global
coastal ecosystems (Green and Short, 2003). Seagrass communities provide habitat,
protection, and nursery functions for economically valuable fishery species (Duffy and
Baltz, 1998; Richardson et al., 1998), serve as indicators of and modify local water
quality conditions (Dennison et al., 1993; Moore, 2004), and decrease shoreline erosion
by attenuating wave and current energy (Fonseca and Cahalan, 1992). Over the last 50
years seagrass populations have declined globally with little recovery (Orth et al., 2006).
Decline of seagrasses are attributed to a combination of natural phenomena
(hurricanes, grazers, and diseases) and anthropogenic disturbances (Short and Wyllie
Echeverria, 1996). The majority of global seagrass loss, estimated to be close to 33,000
ha, is due to both indirect and direct anthropogenic impacts (Green and Short, 2003;
Ralph et al., 2006). These impacts include decreased light availability due to
deteriorating water quality conditions (Dennison et al., 1993; Tamaki et al., 2002; Kemp
et al., 2005) and increased sedimentation due to coastal development (Short and Wyllie
Echeverria, 1996). Seagrass conservation and restoration efforts have increased in
response to these global losses, however populations continue to decline (Orth et al.,
2006). Limited seagrass restoration success combined with continually deteriorating
water quality conditions requires an increased effort to understand how seagrasses
become established, successfully survive, and reproduce in their present environments
and under stressful conditions (Inglis, 2000).
Seagrasses maintain their populations primarily through clonal expansion and
vegetative growth (den Hartog, 1970; Tomlinson, 1974; Hemminga and Duarte, 2000;

4
Rasheed, 2004). Clonal expansion sustains a successful genotype and removes the
energetic cost of sexual reproduction (Ackerman, 2006). Despite the extra energy costs
many seagrass species flower on an annual basis. Sexual reproduction increases genetic
diversity (Harper, 1977), enhances recovery from large-scale declines (Whitfield et al.,
2004; Waycott et al., 2005), and provides a mechanism for increasing the geographic
range and establishment of new communities (Figuerola et al., 2002; Harwell and Orth,
2002; Källström et al., 2008). The role of sexual reproduction within a seagrass
population depends on the balance between the ‘costs’, such as energy costs for
producing flowering shoots, versus the ‘benefits’ like increased genetic diversity (Eckert,
2002). Due to the dominance of clonal expansion in seagrass beds the role of sexual
reproduction in seagrass population dynamics is poorly understood.
Objectives
The main objectives of this research were (1) to quantify the effects of
environmental conditions on seed germination, seed-bank viability, and the persistence of
Zostera marina beds using both laboratory and in situ experiments; (2) to elucidate the
role of sexual reproduction in the maintenance and recovery of established Z. marina
beds; (3) to quantify and compare responses to various environmental conditions between
semi-annual and perennial Z. marina populations; and (4) to develop an Z. marina
production model to more accurately characterize how Z. marina beds respond to large
scale disturbances and to determine what factors are most important for expanded
research relative to reproduction. The overarching goal of this research is to add to the
current understanding of the role of sexual reproduction in Z. marina bed maintenance

5
and recovery, and the potential role of seeds and seedlings in Z. marina conservation and
restoration.
Zostera marina Description
A circum-global species in the Zosteraceae family, Z. marina has been found in
both annual and perennial forms (Setchell, 1929; den Hartog, 1970) and is particularly
suited for understanding the role of sexual reproduction in the decline and recovery of
seagrasses. The wide distribution of Z. marina reflects an ability to live in a variety of
environmental conditions. Z. marina shoots are found in habitats where water
temperatures range from 0 ºC to 35 ºC (Biebel and McRoy, 1971), an average of 20 % of
surface irradiance reaches the leaf surface (Duarte, 1991), and substrates range from
sand to silty clay (Bradley and Stolt, 2006). Despite the ability to adapt to a variety of
environments, many Z. marina populations are under stress from coastal development
(Short and Wyllie-Echeverria, 1996) and have declined over the last several decades
(Orth and Moore, 1983; Orth et al., 2006).
In response to disturbances, Z. marina populations increase sexual rather than
asexual reproduction (Phillips et al., 1983a; van Lent and Vershuure, 1994). Sexual
reproduction, or the production of reproductive shoots, varies with region and life history
strategy resulting in total flowering shoot densities of 10 % to 100 % percent of total
shoots (Silberhorn et al. 1983; Thayer et al., 1984; Meling-Lopez and Ibarra-Obando,
1999). Z. marina is monecious with male and female flowers produced on the same
spadix found at the terminal end of the shoot (Setchell, 1929; Taylor, 1957; den Hartog,
1970). Reproductive shoot development is staggered such that inbreeding is minimized

6
(Ackerman, 2006). Production of reproductive shoots is variable within beds and across
regions (Orth and Moore, 1986; Harwell and Rhode, 2007) and begins in March and
April at lower latitudes with delayed production as latitude increases (Philips et al.,
1983b; Silberhorn et al., 1983). Phillips et al. (1983b) and Silberhorn et al. (1983)
hypothesized that temporal variations in temperature and light are important
environmental cues for flowering within Z. marina beds (Phillips et al., 1983b;
Silberhorn et al., 1983). Successful pollination of flowering shoots can result in the
production of 50 – 100,376 seeds m-2 depending upon life history (Silberhorn et al., 1983;
Meling-Lopez and Ibarra-Obando, 1999; Harwell and Rhode, 2007; Lee et al., 2007).
Although Z. marina beds rely primarily on asexual reproduction for maintenance
of existing beds (Setchell, 1929; den Hartog, 1970; Short and Moore, 2006), seeds are
important for dispersal (Churchill et al., 1985; Orth et al., 1994; Harwell and Orth, 2002;
Källström et al., 2008), as a recovery mechanism for large scale declines (Plus et al.,
2003; Greve et al., 2005; Lee et al., 2007), and most recently for use in Z. marina
restoration efforts (Orth et al., 1994; Orth et al., 2000; Pickerell et al., 2005; Orth et al.,
2006; Shafer and Bergstrom, 2008). Seed germination has been described as a potential
limiting stage in sexual reproduction (Harper, 1977). Limitations to germination are
attributed to the surrounding microenvironment which may lack the required signals to
break seed dormancy and enhance germination (Baskin and Baskin, 1998; Woodin et al.
1998). For Z. marina, the primary environmental germination cues which perennial
seeds have been most responsive to are changes in temperature (10-16 ºC; Setchell, 1929;
Taylor, 1957; Lamounette, 1977) dissolved oxygen (anoxic conditions; Churchill et al.,
1992; Moore et al., 1993; Probert and Brenchly, 1999); and sediment organic content

7
(> 1 %; Short, 1987; van Katwijk et al., 1997; van Katwijk and Wijgergangs, 2004).
Seedling growth and establishment may also be a limiting stage in Z. marina sexual
reproduction and requires further investigation.
Zostera marina Life Histories
Z. marina has developed perennial and annual life histories which allow the
species to exploit habitats ranging from tide pools (Phillips et al., 1983a; Robertson and
Mann, 1984; Keddy and Patriquin, 1978) and intertidal mud flats (Setchell, 1929;
Harrison, 1993; van Katwijk and Wijgergangs, 2004) to subtidal zones in both temperate
regions (Short and Moore, 2006; Lee et al., 2007) and in the tropical Gulf of California
(Meling-Lopez and Ibarra-Obando, 1999; Santamaría-Gallegos et al., 2000). Although
the species is found in a variety of forms, a majority of Z. marina populations are
perennial and rely on asexual or clonal growth for bed matainenance and expansion (den
Hartog, 1970). Understanding the evironmental factors and population dynamics that
affect the development of annual and perennial Z. marina beds may enhance our ability
to mange exisiting Z. marina beds and increase the number of successful restoration
attempts.
The current life history model for perennial Z. marina is driven by seasonal
changes in temperature (Setchell, 1929; Phillips et al., 1983a; Thayer et al., 1984; Short
and Moore, 2006). Z. marina remains in a state of quiescence when water temperatures
are below 10 ºC (Setchell, 1929). During this respiration and production are low (Nejrup
and Pederson, 2008); however, Z. marina is not in an active stage of decay (Setchell,
1929). Vegetative growth is the dominant process when water temperatures range from

8
10 ºC to 15 ºC with flowering occurring once temperatures increase above 15 ºC and
continues as temperatures remain below 20 ºC (Setchell, 1929; Phillips et al., 1983b;
Silberhorn et al., 1983; Thayer et al., 1984). When water temperatures range from 20 ºC
to 25 ºC Z. marina production is again reduced and the plants enter a period of heat rigor
(Setchell, 1929; Nejrup and Pederson, 2008). Unlike cold rigor, heat rigor results in
decreases in shoot density due to in part to decreased photosynthesis (Evans et al., 1986;
Nejrup and Pederson, 2008). When water temperatures decrease below 20 ºC perennial
Z. marina shows a secondary increase in growth and production in surviving shoots
before temperatures drop below 10 ºC (Silberhorn et al., 1983; Thayer et al., 1984). The
process begins again with vegetative growth once water temperatures increase above 10
ºC the following spring (Setchell, 1929). Although the current perennial Z. marina life
history model does include sexual reproduction (flowering), the model emphasizes clonal
expansion and does not take the seed-bank, seed germination, or seedling growth and
survival into account.
Annual populations of Zostera marina have been documented throughout the
species range (Keddy and Patriquin, 1978; Phillips et al., 1983b; Robertson and Mann,
1984; Santamaría-Gallegos et al., 2000). Annual forms of Z. marina inhabit stressful
environments such as tide pools and intertidal sediments where extreme temperature
fluctuations and desiccation inhibit the growth and survival of perennial populations
(Keddy and Patriquin, 1978; Harrison, 1979; Phillips et al., 1983a; Robertson and Mann,
1984; Keddy, 1987; Talbot, 2004). Shoots of annual Z. marina resemble typical perennial
flowering shoots and annual Z. marina beds consist completely of flowering shoots with
no production of vegetative shoots (Keddy and Patriquin, 1978; Keddy, 1987). All

9
annual shoots germinate from seeds and, unlike perennial Z. marina (Setchell, 1929;
Taylor, 1957; Silberhorn et al., 1983), flower during the first year of growth (Phillips et
al., 1983a; Robertson and Mann, 1984). Annual Z. marina populations have a
compressed life cycle with seedlings germinating, flowering, producing seeds and dying
in less than a year (Keddy and Patriquin, 1978; Phillips et al., 1983a; Santamaría-
Gallegos et al., 2000). After seeds are produced, all above-ground and below-ground
biomass is lost (Keddy and Patriquin, 1978; Phillips et al., 1983a; Harrison et al., 1993).
Seeds remain within the sediment seed-bank until germination occurs the following year
(Keddy and Patriquin, 1978; Phillips et al., 1983a).
In Chapter 1 two seagrass populations dominated by Z. marina in the Newport
River and Back Sound, North Carolina were assessed monthly from July 2007 to October
2008 to (1) determine the dominant reproductive from (perennial/annual) of Z. marina at
both sites and (2) to quantify differences in reproductive phenology (vegetative and
reproductive shoot biomass, vegetative and reproductive shoot density, seed production,
viable seed-bank density). Over a 15 month period I quantified differences in
reproductive phenology between the semi-annual and perennial Z. marina populations
and monitored changes in both water column (water temperature, salinity, dissolved
oxygen, chlorophyll a, total suspended solids, dissolved inorganic nitrogen (DIN) and
dissolved inorganic phosphorus (DIP) and sediment (organic content, % sand/silt/clay,
redox, DIN and DIP) conditions between the two beds. By comparing measurements of
semi-annual and perennial Z. marina bed growth I was able to document the presence of
a semi-annual Z. marina bed in North Carolina and the presence of a form of Z. marina
that cannot be completely characterized by either the annual or perennial life histories.

10
Zostera marina Sediment Seed-bank
Z. marina seeds do not typically germinate immediately after release (Moore et
al., 1993) and can become incorporated into the sediment forming a seed-bank (Harwell
and Orth, 2002). Sediment seed-banks are defined as a reservoir of seeds found within
the sediment which are viable, or capable of germinating, and therefore are able to
replace adult plants (Baker, 1989). In temperate areas such as Chesapeake Bay U.S.A.
seeds are released in mid-May to June (Silberhorn et al., 1983) and germination may not
occur until the end of October or November (Moore et al., 1993). Germination in the
cooler fall season ensures a longer period of growth and increases successful seedling
establishment before stressful summer water temperatures (>25º C; Moore et al., 1997).
Laboratory studies have shown that Z. marina seeds do not generally remain viable for
more than 11 months although it is not clear how long seeds remain viable under in situ
conditions (Harrison, 1991; Moore et al., 1993). How long Z. marina seeds remain
viable in the sediment seed-bank, the effect of seed source (semi-annual or perennial) on
seed viability and what factors (i.e. sediment organic content, sediment nutrients) affect
the viability of seeds is unknown.
In Chapter 2 I quantified the effects of time, seed source, site, and sediment type
on the viability of Z. marina seeds collected from both semi-annual and perennial Z.
marina beds in two separate experiments within the Chesapeake Bay and the Newport
River/Back Sound, North Carolina. In addition, I also quantified the effect of time and
site on ambient seed-bank viability at all sites over a 15 month sampling period. Through
the comparison of seed viability between semi-annual and perennial populations in an in
situ experiment and between the experimental results and ambient observations, I was
11
able to quantify the effects of environmental conditions on Z. marina seed-bank viability.
These results provide important information on the resiliency provided by seed-banks for
both semi-annual and perennial Z. marina populations.
Zostera marina Seed Germination
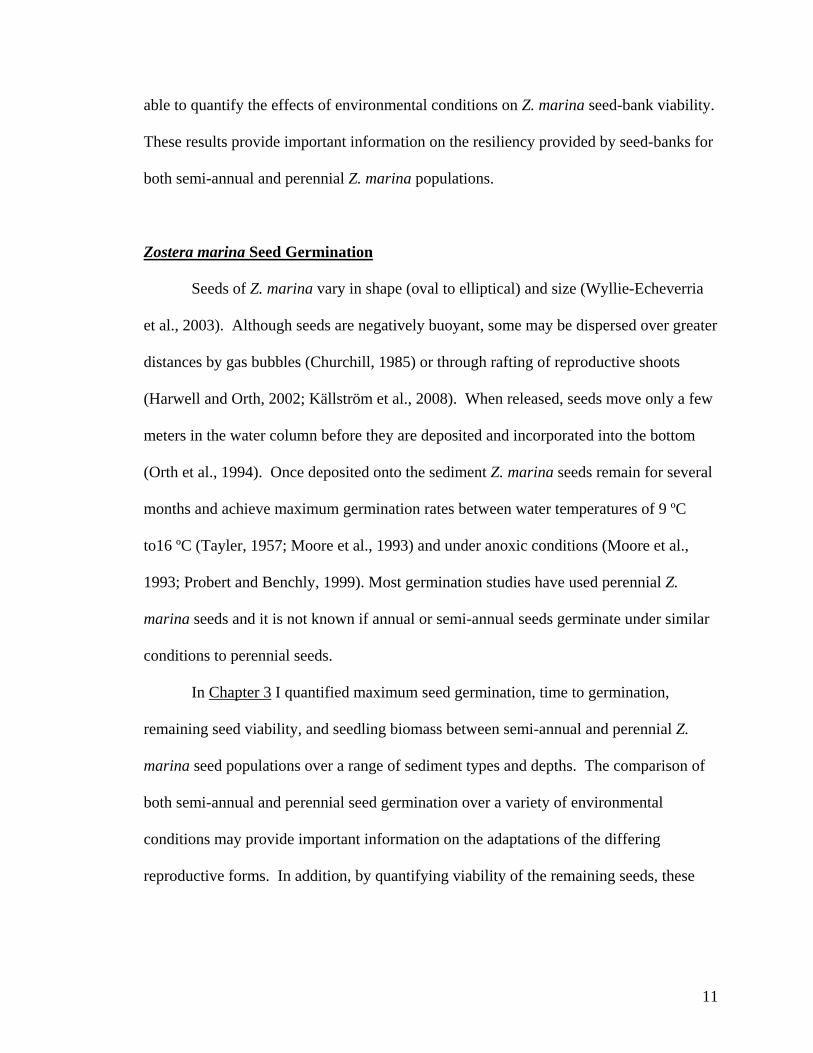
Seeds of Z. marina vary in shape (oval to elliptical) and size (Wyllie-Echeverria
et al., 2003). Although seeds are negatively buoyant, some may be dispersed over greater
distances by gas bubbles (Churchill, 1985) or through rafting of reproductive shoots
(Harwell and Orth, 2002; Källström et al., 2008). When released, seeds move only a few
meters in the water column before they are deposited and incorporated into the bottom
(Orth et al., 1994). Once deposited onto the sediment Z. marina seeds remain for several
months and achieve maximum germination rates between water temperatures of 9 ºC
to16 ºC (Tayler, 1957; Moore et al., 1993) and under anoxic conditions (Moore et al.,
1993; Probert and Benchly, 1999). Most germination studies have used perennial Z.
marina seeds and it is not known if annual or semi-annual seeds germinate under similar
conditions to perennial seeds.
In Chapter 3 I quantified maximum seed germination, time to germination,
remaining seed viability, and seedling biomass between semi-annual and perennial Z.
marina seed populations over a range of sediment types and depths. The comparison of
both semi-annual and perennial seed germination over a variety of environmental
conditions may provide important information on the adaptations of the differing
reproductive forms. In addition, by quantifying viability of the remaining seeds, these

12
experimental results provide important information on the potential effects of the
surrounding environment on Z. marina seed-bank viability.
Zostera marina Response to Disturbance
One role of sexual reproduction, through seeds and seed-banks, is to serve as a
recovery mechanism after large scale population declines (Plus et al., 2003; Whitfield et
al., 2004; Greve et al., 2005; Waycott et al., 2005). Global Z. marina declines have
occurred over both short (weeks to months; Plus et al., 2003; Greve et al., 2005) and long
(decades; Orth and Moore, 1983; Baden et al., 2003; Frederikson, 2004) time scales.
Sudden large scale declines resulting in a wide-scale die back of Z. marina have been
attributed to anoxic conditions (Greve et al., 2005) and water temperatures > 30 ºC
(Moore and Jarvis, 2008). Initial recolonization in both studies was due primarily to seed
germination and seedling establishment with minimal input by vegetative shoots. While
seedlings were a large part of the initial return of Z. marina into these areas, it is not
known if the seedlings will contribute to the continuation of the bed throughout the
growing season and into the following year. Further understanding how Z. marina beds
naturally recolonize will provide vital information for global conservation and restoration
efforts (Kenworthy et al., 2006).
In Chapter 4 I quantified the re-development of three perennial Z. marina beds
over two growing seasons following a large scale Z. marina decline in 2005. Perennial Z.
marina beds in upriver and downriver regions of the York River were sampled monthly
for changes in Z. marina abundance, shoot origin (seedling or surviving vegetative
shoots), and seed-bank abundance and viability. By quantifying the recovery of Z.

13
marina populations, the viability of the sediment seed-bank, and the surrounding
environmental conditions over time, the results of this chapter provide information on the
importance of seedlings in initial bed recovery following a single disturbance and
highlight the sensitivity of Z. marina beds in the Mid-Atlantic region to repeated stresses.
Zostera marina Sexual Reproduction Model and Synthesis
In Chapter 5 I synthesized the data from the previous four chapters and
highlighted areas of future research by developing a Z. marina production model with a
sexual reproduction component. By combining the results of data from field
measurements and experiments, perennial Z. marina seed germination, seed-bank
viability, and seedling survival were modeled under conditions similar to those found
immediately following the 2005 decline of Chesapeake Bay Z. marina in the York River,
Virginia. The model quantified the role of sexual reproduction in perennial Z. marina bed
recovery and projected the response of perennial Z. marina beds to episodic periods of
stressful environmental conditions. In addition, the model was used to evaluate the
resistance of Z. marina beds to, and recovery from episodic stresses such as increases in
water temperature and decreased light availability (due to changes in suspended
sediments and phytoplankton). Finally, by including data on sexual reproduction the
model developed in this chapter may be able to more accurately predict the response of Z.
marina beds to disturbance than existing models, focused only on vegetative biomass;
thereby, allowing managers and policy makers to make more informed decisions relative
to Z. marina habitat conservation and restoration.
14
Literature Cited Ackerman, J.D. 2006. Sexual reproduction in seagrasses: Pollination in the marine context. In: Larkum AWD, Orth RJ, Duarte CM eds. Seagrasses: Biology, Ecology, and Conservation. pp 89-109. Baden, S., M. Gullström, B. Lundé, L. Pihl, and R. Rosenburg. 2003. Vanishing seagrasses (Zostera marina L.) in Swedish coastal waters. Ambio 32(5):374-377. Baker, H.G. 1989. Some aspects of the natural history of seed banks. In: Leck, M.A.,
V.T. Parker, and R.L. Simpson eds. Ecology of Soil Seed Banks. Academic Press, Inc. San Diego, USA. pp 9-21.
Baskin, C.B. and J. Baskin. 1998. Ecologically Meaningful Germination Studies. In Seeds: Ecology, Biogeography, and Evolution of Dormancy and Germination. Academic Press, London. pp 5-26. Biebel, R. and C.P. McRoy. 1971. Plasmatic resistance and rate of respiration and photosynthesis of Zostera marina at different salinities and temperatures. Marine Biology 8: 48-56. Bradley, M.P. and M.H. Stolt. 2006. Landscape-level seagrass-sediment relations in a coastal lagoon. Aquatic Botany 84: 121-128. Churchill, A.C., G. Nieves, and A.H. Brenowitz. 1985. Flotation and dispersal of Z. marina seeds by gas bubbles. Estuaries 8(4): 352-354. den Hartog C. 1970. The Sea-Grasses of the World. North-Holland, Amsterdam. Dennison, W.C., R.J. Orth, K.A. Moore, J.C. Stevenson, V. Carter, S. Kollar, P.W. Bergstrom, and R.A. Batiuk. 1993. Assessing water quality with submersed aquatic vegetation: Habitat requirements as barometers of Chesapeake Bay health. BioScience. 43(2): 86-94. Duarte, C.M. 1991. Seagrass depth limits. Aquatic Botany 40: 363-377. Duffy, K.C. and D.M. Baltz. 1998. Comparison of fish assemblages associated with native and exotic submerged macrophytes in the Lake Pontchartrain estuary, U.S.A. Journal of Experimental Marine Biology and Ecology. 223: 199-221. Eckert, C.G. 2002. The loss of sex in clonal plants. Evolutionary Biology 15: 501-520. Evans, A.S., K.L. Webb, and P.A. Penhale. 1986. Photosynthetic temperature acclimation in two coexisting seagrasses, Zostera marina L. and Ruppia maritima L. Aquatic Botany 24:185-197.

15
Figureola, J., A.G. Green, and L. Santamaria. 2002. Comparative dispersal effectiveness of widgeon grass seeds by waterfowl wintering in southwest Spain: quantitative and qualitative aspects. Journal of Ecology 90: 989-1001. Fonseca, M.S. and J.A. Cahalan. 1992. A preliminary evaluation of wave attenuation by four species of seagrass. Estuary Coastal Shelf Science 35: 565-576. Frederiksen, M., D. Krause-Jensen, M. Holmer, and J. Sund Laursen. 2004. Long-term
changes in area distribution of eelgrass (Zostera marina) in Danish coastal waters. Aquatic Botany 78: 167-181.
Green, E.P. and F.T. Short. 2003. World Atlas of Seagrasses. Prepared by the UNEP World Conservation Monitoring Centre. University of California Press. Berkley, USA. pp 1-298. Greve, T.M., D. Krause-Jensen, M.B. Rasmussen, and P.B. Christensen. 2005. Means of rapid eelgrass (Zostera marina L.) recolonization in former dieback areas. Aquatic Botany 82(2): 143-156. Harper, J.L. 1977. Population Biology of Plants. Academic Press, London, UK. Harrison, P.G. 1979. Reproductive strategies in intertidal populations of two co-occurring seagrasses (Zostera spp). Canadian Journal of Botany 57: 2635-1638. Harrison P.G. 1991. Mechanisms of seed dormancy in an annual population of Zostera marina (eelgrass) from The Netherlands. Canadian Journal of Botany 69: 1972- 1976. Harrison, P.G. 1993. Variations in demography of Zostera marina and Z. moltii on an intertidal gradient. Aquatic Botany 45: 63-77. Harwell, M.C. and R.J. Orth. 2002. Long-distance dispersal potential in a marine macrophyte. Ecology 83: 3319–3330. Harwell, M.C. and J.M. Rhode. 2007. Effects of edge/interior and patch structure on reproduction in Zostera marina L. in Chesapeake Bay, USA. Aquatic Botany 87: 147-154. Hemminga, M.A. and C.M.Duarte. 2000. Seagrass Ecology. Cambridge University Press. New York, USA. Inglis, G.J. 2000. Disturbance-related heterogeneity in the seed-banks of a marine angiosperm. The Journal of Ecology 88(1): 88-99. Källström, B., A. Nyqvist, P. Åberg, M. Bodin, and C. André. 2008. Seed Rafting as a
dispersal strategy for eelgrass (Zostera marina). Aquatic Botany 88(2): 148-153.

16
Keddy, C.J. 1987. Reproduction of annual eelgrass variation among habitats and comparison with perennial eelgrass (Zostera marina L.). Aquatic Botany 27: 243-256.
Keddy, C.J. and D.G. Patriquin. 1978. An annual form of eelgrass in Nova Scotia. Aquatic Botany 5: 163-170. Kemp, W.M., W.R. Boynton, J.E. Adolf, D.F. Boesch, W.C. Boicourt, G. Brush, J.C. Cornwell, T.R. Fisher, P.M. Glibert, J.D. Hagy, L.W. Harding, E.D. Houde,
D.G. Kimmel, W.D. Miller, R.I.E. Newell, M.R. Roman, E.M. Smith, and J.C. Stevenson. 2005. Eutrophication of Chesapeake Bay: historical trends and ecological interactions. Marine Ecology Progress Series. 303: 1-29.
Kenworthy, J.W., S. Wyllie-Echeverria, and R.G. Coles. 2006. Seagrass conservation biology: An interdisciplinary science for protection of the seagrass biome. In: Seagrasses: Biology, Ecology, and Conservation; Edited by A.W.D. Larkum, R.J. Orth, and C.M. Durate. Springer. Netherlands pp 595-623. Lamounette, R.G. 1977. A study of the germination and viability of Zostera marina L. seeds. M.S. Thesis. Adelphi University. p 41. Lee, K.S., J.I Park, Y.K. Kim, S.R. Park, & J.H. Kim, 2007. Recolonization of Zostera marina following destruction caused by red tide algal bloom: the role of new shoot recruitment from seed-banks. Marine Ecology Progress Series 342: 105- 115. Meling-Lopez, A.E. and S.E. Ibarra-Obando. 1999. Annual life cycles of two Zostera marina L. populations in the Gulf of California: contrasts in seasonality and reproductive effort. Aquatic Botany 65: 59-69. Moore, K.A. 2004. Influence of seagrasses on water quality in shallow regions of the
lower Chesapeake Bay. Journal of Coastal Research 81: 162-178. Moore, K.A., R.J. Orth, and J.F. Nowak. 1993. Environmental regulation of seed germination in Zostera marina L. (eelgrass) in Chesapeake Bay: Effects of light, oxygen, and sediment burial. Aquatic Botany 45(1): 79-91. Moore K.A., R.L. Wetzel, and R.J. Orth. 1997. Seasonal pulses of turbidity and their relations to eelgrass (Zostera marina L.) survival in an estuary. Journal of Experimental Marine Biology and Ecology 215: 115–134. Moore, K.A. and J.C. Jarvis. 2008. Environmental factors affecting recent summertime eelgrass diebacks in the lower Chesapeake Bay: Implications for long-term persistence. Journal of Coastal Research SI 55: 135-147.
17
Nejrup, L.B. and M.F. Pedersen. 2008. Effects of salinity and water temperature on the ecological performance of Zostera marina. Aquatic Botany 88:239-246. Orth, R.J. and K.A. Moore. 1983. Chesapeake Bay: an unprecedented decline in submerged aquatic vegetation. Science. 222: 51-53. Orth, R.J. and K.A. Moore. 1986. Seasonal and year-to-year variations in the growth of Zostera marina L. (eelgrass) in the lower Chesapeake Bay. Aquatic Botany 24: 335-341. Orth, R.J., M. Luckenbach, and K.A. Moore. 1994. Seed dispersal in a marine macrophyte: implications for colonization and restoration. Ecology. 75(7): 1927- 1939. Orth, R.J., M.C. Harwell, E.M. Bailey, A. Bartholomew, J.T. Jawad, A.V. Lombana, K.A. Moore, J.M. Rhode, and H.E. Woods. 2000. A review of issues in seagrass seed dormancy and germination: implications for conservation and restoration. Marine Ecology Progress Series. 200: 277-288. Orth, R.J., T.J.B. Carruthers, W.C. Dennison, C.M. Duarte, J.W. Fourqurean, K.L. Heck Jr., A.R. Hughes, G.A. Kendrick, W.J. Kenworthy, S. Olyarnik, F.T. Short,
M.Waycott, and S.L.Williams. 2006. A global crisis for seagrass ecosystems. BioScience 56(12): 987-996.
Pickerell, C.H., S. Schott, S. Wyllie-Echeverria. 2005. Buoy-deployed seedling:
Demonstration of a new eelgrass (Zostera marina L.) planting method. Ecological Engineering 25: 127-136.
Phillips, R.C., W.S. Grant, and C.P. McRoy. 1983a. Reproductive strategies of eelgrass (Zostera marina) L. Aquatic Botany 16: 1-20.
Phillips, R.C., C. McMillan, and K.W. Bridges. 1983b. Phenology of eelgrass, Zostera marina L., along latitudinal gradients in North America. Aquatic Botany 15: 145- 156. Plus, M.J. M. Deslous-Paoli, and F. Dagault. 2003. Seagrass (Zostera marina L.) bed recolonization after anoxia-induced full mortality. Aquatic Botany 77(2): 149- 164. Probert, R.J. and J.L.Brenchly. 1999. The effect of environmental factors on field and laboratory germination in a population of Zostera marina L. from southern England. Seed Science Research. 9: 331-339.
18
Ralph, P.J., D.Tomasko, K. Moore, S. Seddon, and C.M.O. Macinnis-Ng. 2006. Human Impacts on Seagrasses: Eutrophication, Sedimentation, and Contamination. In: Larkum A.W.D., R.J. Orth, and C.M. Duarte eds. Seagrasses: Biology, Ecology, and Conservation. pp 567-593. Rasheed, M.A. 2004. Recovery and succession in a multi-species tropical seagrass meadow following experimental disturbance: the role of sexual and asexual reproduction. Journal of Experimental Marine Biology and Ecology 310: 13-45. Richardson ,W.B., S.J. Zigler, and M.R. Dewey. 1998. Bioenergetic relations in submerged aquatic vegetation: an experimental test of prey use by juvenile bluegills. Ecology of Freshwater Fish 7: 1-12. Robertson, A.I., and K.H. Mann. 1984. Disturbance of ice and life-history adaptations of the seagrass Zostera marina. Marine Biology 80: 131–141. Santamaría-Gallegos, N.A. J.L. Sánchez-Lizaso, and E.F. Félix-Pico. 2000. Phenology and growth cycle of annual subtidal eelgrass in a subtropical locality. Aquatic Botany 66: 329-339. Setchell, W.A. 1929. Morphological and phonological notes on Zostera marina L. University of California Publications in Botany 14: 389-452. Shafer, D. and P. Bergstrom. 2008. Large scale submerged aquatic vegetation restoration in the Chesapeake Bay. Final Report to the U.S. Army Corps of Engineers, ERDC/EL TR-09-20 pp. 63. Short, F.T. 1987. Effects of sediment nutrients on seagrasses: Literature review and mesocosm experiments. Aquatic Botany 16:149-161. Short, F.T. and S. Wyllie-Echeverria. 1996. Natural and human-induced disturbance of seagrasses. Environmental Conservation 23(1): 17-27. Short, F.T. and K.A. Moore. 2006. Zostera: Biology, Ecology, and Management. In: Larkum A.W.D., R.J. Orth, and C.M.Duarte eds. Seagrasses: Biology, Ecology, and Conservation. pp 361-386. Silberhorn, G.M., R.J. Orth, and K.A. Moore. 1983. Anthesis and seed production in
Zostera marina L. (eelgrass) from the Chesapeake Bay. Aquatic Botany 15: 133-144.
Talbot, S.L., G.K. Sage, J.R. Rearick , and R.M. Salazar. 2004. Genetic structure of Zostera marina in San Francisco Bay: Preliminary results of microsatellite analysis. Report to Caltrans.
http://www.biomitigation.org/reports/files/SF_Z. marina_Genetics_0_1578.pdf.

19
Tamaki, H., M. Tokuoka, W. Nishijima, T. Terawaki, and M. Okada. 2002. Deterioration of eelgrass, Zostera marina L., meadows by water pollution in Seto Inland Sea, Japan. Marine Pollution Bulletin. 44: 1253-1258. Taylor, A.R.A. 1957. Studies of the development of Zostera marina L. II. Germination and seedling development. Canadian Journal of Botany 35: 681-695. Thayer, G.A., W.J. Kenworthy, and K.S. Fonseca. 1984. The ecology off eelgrass meadows of the Atlantic Coast: A community profile. U.S. Fish Wildlife Service. FWS/OBS-84/02 147 pp. Tomlinson, P.B., 1974. Vegetative morphology and meristem dependence - The foundation of productivity in seagrasses. Aquaculture 4: 107–130. van Katwijk, M.M., L.H.T. Vergeer, G.H.W. Schmitz, and J.G.M. Roelofs. 1997. Ammonium toxicity in eelgrass Zostera marina. Marine Ecology Progress Series 157: 159-173. van Katwijk, M.M. and L.J.M. Wijgergangs. 2004. Effects of locally varying exposure, sediment type and low-tide water cover on Zostera marina recruitment from seed. Aquatic Botany 80: 1-12. van Lent, F. and J.M. Verschuure. 1994. Intraspecific variability of Zostera marina L. (eelgrass) in the estuaries and lagoons of the southwestern Netherlands II. Relation to environmental factors. Aquatic Botany 48: 59-75. Waycott, M., B.J. Longstaff, and J. Mellors. 2005. Seagrass population dynamics and water quality in the Great Barrier Reef region: A review and future research directions. Marine Pollution Bulletin 51: 343-350. Whitfield, P.E., W.J. Kenworthy, M.J Durako, K.K. Hammerstrom, and M.F. Merello. 2004. recruitment of Thalassia testudinum seedlings into physically disturbed seagrass beds. Marine Ecology Progress Series 267: 121-131. Woodin, S.A., R.L. Marinelli, and S.M. Lindsay. 1998. Process-specific cues for recruitment in sedimentary environments: Geochemical signals. Journal of Marine Research 56: 535-558. Wyllie-Echeverria, S., P.A.Cox, A.C. Churchill, J.D. Brotherson, and T. Wyllie- Echeverria. 2003. Seed size variation within Zostera marina L. (Zosteraceae). Botanical Journal of the Linnean Society 142:281-288.

20
CHAPTER 1 : REPRODUCTIVE STRATEGIES FOR SEMI-ANNUAL AND PERENNIAL ZOSTERA MARINA L. BEDS IN NORTH CAROLINA
21
Abstract
Two seagrass populations dominated by Zostera marina in the Newport River and Back
Sound, North Carolina were assessed monthly from July 2007 through October 2008 to
(1) determine the dominant reproductive from (perennial/annual) of Z. marina at both
sites and (2) to quantify differences in reproductive phenology (vegetative and
reproductive shoot biomass, vegetative and reproductive shoot density, reproductive
shoot production, seed production, viable seed-bank density). The presence of an annual
bed of Z. marina at Phillips Island (NC1) was confirmed by the complete loss of
aboveground biomass at this site in November 2007 (0 g DW m-2) and again in
September and October 2008 (0 g DW m-2). Although the Z. marina bed at NC1 was an
annual bed not all shoots followed the annual life history. NC1 Z. marina shoots
germinated from seeds, a portion of seedlings flowered during their first year of growth,
and all shoots completed their life cycle and died within one year of germination like an
annual plant; however, not all shoots flowered and shoots reproduced both sexually and
asexually similar to a perennial plant. Since the individual plants found within the bed
did not display all of the defining characteristics of either perennial or annual Z. marina
life histories, the NC1 population cannot be completely described by either life history
strategy and was characterized as a semi-annual population. Vegetative shoot density (p
< 0.001), reproductive shoot production (p = 0.002), and viable seed-bank density (p <
0.001) were significantly greater at NC1 than a nearby perennial bed at NC2. Seed-bank
viability was greater at NC1; however, seed-bank viability decreased over time with no
viable seeds remaining after 6 months in the sediment. Water column temperature (ºC),
salinity (PSS), and dissolved oxygen (mg l-1) followed seasonal patterns and did not

22
differ significantly between sites (temp p = 0.711; salinity p = 0.527; dissolved oxygen p
= 0.527). The development of the semi-annual life history strategy at NC1 is not
understood and further investigation into genetic variations and phenological response of
this population to environmental conditions is required. These results highlight the need
for annual replenishment of the seed-bank in both perennial and semi-annual life history
forms of Z. marina and indicate that the resiliency provided by the sediment seed-bank
may be limited.
Key Words: Zostera marina, semi-annual, seed-bank, phenology, North Carolina

23
Introduction
A member of the family Zosteraceae, Zostera marina is distributed
circumglobally throughout the Northern Hemisphere (Setchell, 1920; Setchell, 1929;
Green and Short, 2003; Short and Moore, 2006). A temperate species found in perennial
and annual forms (Setchell, 1929; den Hartog, 1970; Phillips et al., 1983a), Z. marina has
developed distinct life histories which allow the species to exploit habitats ranging from
tide pools (Phillips et al., 1983a; Keddy and Patriquin, 1978) and intertidal mud flats
(Setchell, 1929; Harrison, 1993; van Katwijk and Wijgergangs, 2004) to subtidal zones in
both temperate regions (Short and Moore, 2006; Lee et al., 2007) and in the tropical Gulf
of California (Meling-Lopez and Ibarra-Obando, 1999; Santamaría-Gallegos et al., 2000).
Annual populations are not common as the majority of Z. marina populations are
perennial and rely on asexual or clonal growth for bed matainenance and expansion (den
Hartog, 1970).
Despite the prevalence of asexual reproduction, most Z. marina populations
maintain the ability to flower (Setchell, 1929; den Hartog, 1970; Thayer et al., 1984). Z.
marina is monecious with male and female flowers produced on the same spadix at the
terminal end of the shoot (Setchell, 1929; Taylor, 1957; den Hartog, 1970). Flowering
shoots grow from the apex of the plant and flower development is staggered such that
inbreeding is minimized (Ackerman, 2006). The proportion of flowering shoots and
seeds produced within beds varies with habitat (Harrison, 1979; Phillips et al., 1983b; van
Lent and Verschuure, 1995; Reusch, 2006; Harwell and Rhode, 2007) and life history
(Phillips et al., 1983a; Mortia et al., 2007). Phenological cues such as temperature and
24
light are important environmental cues for flowering within Z. marina beds as flowering
begins in April or May at lower latitudes with delayed production as latitude increases
(Setchell, 1929; Philips et al., 1983b; Silberhorn et al., 1983).
The current life history model for perennial Z. marina is driven by seasonal
changes in temperature (Setchell, 1929; Phillips et al., 1983a; Thayer et al., 1984; Short
and Moore, 2006). Z. marina remains in a state of quiescence when water temperature is
below 10 ºC (Setchell, 1929) and respiration and production are low (Nejrup and
Pederson, 2008); however, Z. marina is not in an active stage of senescence (Setchell,
1929). Vegetative growth is the dominant process when water temperature ranges from
10 ºC to 15 ºC with flowering occurring once temperatures increase above 15 ºC and
continues as temperatures remain below 20 ºC (Setchell, 1929; Phillips et al., 1983b;
Silberhorn et al., 1983; Thayer et al., 1984). When water temperature ranges from 20 ºC
to 25 ºC Z. marina production is again reduced and the plants enter a period of heat rigor
(Setchell, 1929; Nejrup and Pederson, 2008). Unlike cold rigor, heat rigor results in a
decrease in shoot density due in part to decreased photosynthesis (Evans et al., 1986;
Nejrup and Pederson, 2008). When water temperature decreases below 20 ºC perennial
Z. marina shows a secondary increase in growth and production in surviving shoots
before temperatures drop below 10 ºC (Silberhorn et al., 1983; Thayer et al., 1984). The
process begins again with vegetative growth once water temperature increases above 10
ºC the following spring (Setchell, 1929). Although the current perennial Z. marina life
history model does include sexual reproduction (flowering), the model emphasizes clonal
expansion and does not adequately account for the seed-bank, seed germination, or
seedling growth and survival into account.

25
Annual Z. marina populations have been documented throughout the species
range (Keddy and Patriquin, 1978; Phillips et al., 1983b; Robertson and Mann, 1984;
Santamaría-Gallegos et al., 2000). Annual forms of Z. marina inhabit stressful
environments such as tide pools and intertidal sediments where extreme temperature
fluctuations and desiccation inhibit the growth and survival of perennial populations
(Keddy and Patriquin, 1978; Harrison, 1979; Phillips et al., 1983a; Robertson and Mann,
1984; Keddy, 1987; Talbot, 2004). Shoots of annual Z. marina resemble typical perennial
reproductive shoots and many annual beds consist completely of reproductive shoots with
no production of vegetative shoots (Keddy and Patriquin, 1978; Keddy, 1987). All
annual shoots germinate from seeds and, unlike perennial Z. marina populations
(Setchell, 1929; Taylor, 1957; Silberhorn et al., 1983), flower during the first year of
growth (Phillips et al., 1983a; Robertson and Mann, 1984). Annual Z. marina
populations have a compressed life cycle with seedlings germinating, flowering,
producing seeds and dying in less than a year (Keddy and Patriquin, 1978; Phillips et al.,
1983a; Santamaría-Gallegos et al., 2000). After seeds are produced, all above-ground
and below-ground biomass is lost (Keddy and Patriquin, 1978; Phillips et al., 1983a;
Harrison et al., 1993). Seeds remain within the sediment seed-bank until germination
occurs at the next optimum period (Keddy and Patriquin, 1978; Phillips et al., 1983a).
When comparing the production of reproductive shoots between Z. marina
populations in Denmark, Olsen (1999) reported that annual beds produced a significantly
greater proportion of flowering shoots and greater seed densities compared to perennial
beds. Keddy (1987) described similar results were in Nova Scotia where annual beds
produce up to seven times more seeds than perennial populations. As a spatial “bet-

26
hedging” strategy, annual plants produce greater densities of seeds to increase the
chances of seeds finding suitable germination sites which also improve the odds of
successful seedling establishment (Harper, 1977; Keddy, 1987; Symonides, 1988;
Shipley et al., 1989; Harrison, 1993; Rees, 1996). However, by expending more energy
on the production of seeds rather than on vegetative growth, annuals reduce the
continuation of a successful genotype (Inglis, 2000). Perennial Z. marina expends less
energy on sexual reproduction relying instead on the successful exploitation of a site by
clonal growth (Inglis, 2000).
Once seeds are produced, they may be deposited within the bed (Orth et al.,
2006); exported out of the bed on rafting flowering shoots (Harwell and Orth, 2002a;
Källström et al., 2008), or lost to a variety of factors including general decay and
predation (Fishman and Orth, 1996). A sediment seed-bank is defined as those seeds
found within the sediment which are viable (capable of germinating) and therefore are
able to replace adult plants (Baker, 1989). Seeds deposited in the sediments produce a
transient (seeds remain for less than 1 year) seed-bank (Simpson, 1990; Harwell and
Orth, 2002b; Jarvis, Chapter 3). Compared to the number of seeds produced in annual
beds the contribution of yearly seed production to the sediment seed-bank is minimal and
ranges from 5 % to 28 % (Mortia et al., 2007). Similar seed losses were reported in
perennial Z. marina beds in Jindong Bay, on the Korean peninsula, where seed-bank
densities varied inter-annually with highest densities occurring immediately after seed
production (850 to 1780 seeds m-2) and lowest after the period of maximum germination
(0 seeds m-2) (Lee et al., 2007). Overall 16 % of seeds produced were present in the
seed-bank after a period of 12 months. The loss of viable seeds within annual and

27
perennial beds may actually be greater as these studies reported total seed density not
viable seed density.
Environmental factors such as light availability (Dennison and Alberte, 1985;
Dennison, 1987; Zimmerman et al., 1991), sediment and water column nutrient
concentrations (van Lent and Verschuure, 1994), water temperature (Johnson et al., 2003;
Moore and Jarvis, 2008) and sediment composition (Barko and Smart, 1986) have
significant impacts on Z. marina growth, survival, and reproduction (van Lent and
Verschuure, 1994). Although annual Z. marina is reported to dominate in areas with
higher physical disturbance (Harlin et al., 1982; Robertson and Mann, 1984; van Lent and
Vershuure, 1994) and in habitats with wide ranging environmental conditions (Keddy and
Patriquin, 1978; Keddy, 1987; Talbot, 2004), the majority of phenological Z. marina
studies have focused on perennial Z. marina due to the dominance of the life history
throughout the majority of the species range (den Hartog, 1970; Short and Moore, 2006).
Comparisons between the response of annual and perennial Z. marina populations to
similar environmental conditions may provide a better understanding of the development
of the two differing life-histories.
The Newport River and Back Sound regions of North Carolina are located in a
transition zone between temperate and tropical seagrass regions at the southern limit of Z.
marina’s range and at the northern limit of Halodule wrightii along the western Atlantic
(Thayer et al. 1984, Short et al., 2007). At these two sites Z. marina dominates in the
winter and early spring and the tropical H. wrightii dominates in the late summer and fall
(Thayer et al., 1984; Short et al., 2007). Where the two dominant species overlap H.
wrightii dominates the shallow intertidal zone while Z. marina is more prevalent in the
28
deeper subtidal regions (Thayer et al., 1984). In addition, the eurythermal and euryhaline
seagrass species Ruppia maritima is also found to a lesser extent within seagrass beds in
this region (Thayer et al., 1984). Z. marina growth and survival may be limited in the
late summer when water temperatures can exceed 30 ºC (Thayer et al., 1984).
Despite the presence of annual Z. marina beds at the southern limit of the species
on the west coast of North America (Meling-Lopez and Ibarra-Obando, 1999;
Santamaría-Gallegos et al., 2000), no annual Z. marina populations have been reported
within North Carolina seagrass beds (Thayer et al., 1984). Recently one Z. marina bed at
Phillips Island in the Newport River, in Carteret County, NC, was observed to die-back
completely, re-establish with seedlings, and produce flowering shoot densities greater
than the reported 28 % average for this region (Thayer et al., 1984; Kenworthy
unpublished). Prior studies reported the Z. marina bed at Phillips Island was perennial,
but recent observations suggest this site may have shifted from a perennial to an annual
life history. It is the goal of this paper (1) to determine the dominant reproductive from
(perennial/annual) of Z. marina at Phillips Island to confirm if it is an annual bed and (2)
to compare differences in reproductive phenology (vegetative and reproductive shoot
biomass, vegetative and reproductive shoot density, total produced seed density, total
seed-bank density, and viable seed-bank density) between the annual and perennial beds.
I hypothesize that an annual form of Zostera marina has developed at Phillips
Island, North Carolina because it is located near the southern limit of Z. marina
distribution along the Western Atlantic. I also hypothesize that if the Phillips Island
population is an annual form of Z. marina, then sexual reproduction (including
reproductive shoot density, total produced seed density and viable seed-bank densities)

29
will be significantly greater and vegetative reproduction (vegetative shoot density) will
be significantly lower at this site than perennial beds also found within this system. By
evaluating phenological differences in reproduction between annual and perennial Z.
marina populations within the same system, a more thorough understanding of the
ecological consequences of in the responses of these two life histories to direct
environmental conditions may be gained.
Methods
Site Selection
Two sites were selected in the Newport River and Back Sound, North Carolina for
monthly monitoring based on historical Z. marina cover and observed dominant
reproductive strategy (Thayer et al., 1984). Phillips Island (NC1) is located in the
Newport River in Carteret County, North Carolina (NC1; 34º 43’ N, 76º 41’ W; Figure
1-1) and is a mix of Z. marina and R. maritima. Morgans Island (NC2), located
approximately 14 km southeast of Phillips Island in Back Sound (NC2, 34º 66’ N, 76º 52’
W; Figure 1-1), is a mixed bed of Z. marina, R. maritima, and H. wrightii. Both sites are
shallow, with water depth less than 2.0 m MLLW. In addition to water column
characteristics Z. marina reproductive phenology was monitored at each site monthly
from July 2007 through November 2008 while sediment characteristics were measured in
July and December 2007 and in June and September 2008.

30
Water Column and Sediment Characterization
Bottom water temperature (ºC) was monitored at each site every 15 minutes
throughout the entire monitoring period with three HOBOware Pro water temperature
sensors. Salinity (PSS) and dissolved oxygen (mg l-1) were measured during monthly site
visits with a Yellow Spring Instruments, Inc. (YSI, Inc., Yellow Spring, Ohio) model 650
sonde. During each monthly site visit, three 500 mL water samples were collected by
hand, filtered (Gelman Supor, 0.45 µm), and frozen until analyzed for dissolved
inorganic nitrogen (DIN) and dissolved inorganic phosphorus (DIP) with a Lachat auto
analyzer (Liao 2001, revised 2002; Knepel and Bogren 2001, revised 2002; Smith and
Bogren 2001, revised 2002). Water samples were also filtered and analyzed for
chlorophyll a (Strickland and Parson, 1972) and total suspended solids (TSS). TSS was
quantified from a well-mixed sample of known volume. The sample was filtered through
a GF/F filter and the residue retained on the filter was dried to constant weight at 103 –
105 ºC. Final TSS values were reported as mg l-1.
At each site, sediment samples were collected in August and December 2007 and
in June and September 2008. These samples were analyzed for organic content, sediment
exchangeable nutrients (DIN and DIP), percent sand/silt/clay, and redox potential. Five
sediment cores (10.4 cm diameter by 10 cm depth) were collected at each site, divided
into two 3 cm horizontal sections (0-3 cm, 3-6 cm), and each section was quartered. The
first quarter was wet sieved (63 μm sieve), washing slit and clay fractions into a
graduated cylinder. After 24 hours, pipette analysis was performed with the filtrate to
determine the clay (8 phi) and silt (4 phi) fractions of the sieved samples (modification of
31
Plumb, 1981). Dry weights of the aliquots were then compared and percent sand silt and
clay fractions were determined.
Sediment percent organic matter was determined by drying one half of the
sediment sub-section at 60 ºC for 5 days or until a constant dry weight was reached. The
samples were cooled in a desiccator and 10 g of sediment were then weighed and
combusted at 500 ºC for five hours. The sample was weighed again and percent organic
matter calculated as the difference in weight before and after combustion (Erftemeijer
and Koch, 2001). Sediment exchangeable nutrients of the remaining quarter of the
sample were extracted with 2 M KCl, shaken for 1 hour, centrifuged 6 minutes at 4000
RPM, filtered (Gelman Supor, 0.45 µm), and frozen until analysis. Dissolved inorganic
nitrogen (NH4+) and dissolved inorganic phosphate (PO4
-3) were determined on thawed
samples using a Lachat auto analyzer (Liao 2001, revised 2002; Knepel and Bogren
2001, revised 2002; Smith and Bogren 2001, revised 2002). In addition, daytime vertical
redox (Eh) profiles to a depth of 10 cm on 3 cores for each sediment type were measured
with a 21 cm platinum electrode. The probe was inserted into the top of the core and
redox was measured at 0.0, 0.5, 1.0, 1.5, 2.0, 3.0, 4.0, 6.0, 8.0, and 10.0 cm. Final
readings were corrected for temperature relative to the reference electrode (Hinchey and
Schaffner, 2005).
Zostera marina Characterization
Five Z. marina biomass cores (22 cm diameter, 10 cm depth) were collected
monthly from both NC1 and NC2 from August 2007 through October 2008. Samples
were sieved in the field and all plant material was transported back to the lab on ice for
32
further analysis. Biomass samples were sorted as flowering shoots or vegetative shoots.
Vegetative shoot density, reproductive shoot density, and the number of seeds per spathe
were recorded. Vegetative shoots were then separated from the rhizome directly below
the leaf sheath into above-ground and below-ground biomass. All biomass samples were
dried at 60 ºC until a constant dry weight to the nearest 0.01 g was reached.
Zostera marina Seed-bank Characterization
The potential number of seeds produced at each site for all sampling periods was
calculated as:
msps ISN *= (1)
Where Nps = potential number of seeds produced, Ss = average number of seeds per
spathe, and Im = the average number of spathes m-2 (van Lent and Verschuure, 1994). At
each site five additional sediment cores were collected quarterly and again in October and
November 2008 to quantify total and viable seed-bank densities. All cores were wet-
sieved (0.5 mm mesh); all seeds were collected, counted, and stored overnight in ambient
seawater at 4 ºC. Seed viability was tested using tetrazolium chloride which has
increased accuracy and time efficiency over traditional germination tests (Lakon, 1949;
AOSA 1981; Conacher et al., 1994; Sawma and Mohler, 2002). Seed embryos were
removed from their seed coats and soaked in a 1 % tetrazolium chloride solution for 24
hours before examination on a dissecting scope at 10 x magnification (Conacher et al.,
1994). Seeds with a pink to brown stained cotyledon and axial hypocotyl were
considered viable (Taylor, 1957; Harrison, 1993). Mean monthly seed-bank viability was
quantified as the percentage of total viable seeds collected. The percentage of seeds

33
retained within the sediment seed-bank was quantified compared to the potential number
of seeds produced at each site:
100*% ⎟⎟⎠
⎞⎜⎜⎝
⎛ −=
ps
sbps
NNN
R (2)
where % R = the percentage of viable seeds retained within the sediment seed-bank and
Nsb = the total number of seeds collected from seed-bank samples.
Data Analysis
The effects of site and time on vegetative and flowering shoot biomass, the
proportion of reproductive shoots, and the proportion of viable seeds in the seed-bank
between annual and perennial life histories were analyzed with repeated measures
Analysis of Variance (PROC GLM; SAS Institute Inc). Prior to analysis, data were
transformed when necessary (biomass – square root transformation; proportion data –
arcsine square root transformation), normality was confirmed, and homogeneity of
variance was verified with Cochran’s test (Zar, 1999).
Differences in vegetative and reproductive shoot density, seed production, and the
sediment seed-bank density between sites were analyzed using negative binomial
regression with time and site as factors (PROC GENMOD: SAS Institute Inc.; Allison,
1999). For all significant (p < 0.05) model terms odds ratios were calculated using Wald
chi square statistics (SAS; SAS Institute Inc). Likelihood ratio tests for all parameter
estimates were also calculated and compared to the Wald Chi Square Statistics (Allison,
1999).
Differences in water column characteristics and sediment sand silt clay
percentages between sites and over time were analyzed with nonparametric statistics as

34
the data were non-normally distributed (Kruskal-Wallis and Kolmogorov-Smirnov Tests;
The SAS System for Windows, SAS Institute Inc.). All remaining sediment data were
transformed when necessary and analyzed with repeated measures ANOVA to compare
the effects of time, site and the interactions of these factors.
Results
Water Column and Sediment Characteristics
Water column temperature (p = 0.711), salinity (p = 0.526), and dissolved oxygen
(p = 0.527) did not differ significantly between sites (Figure 1-2). Temperatures
followed seasonal trends and were significantly different over time (p < 0.001). Daily
mean temperature ranged from 7.2 ± 0.1 ºC to 30.3 ± 0.1 ºC at NC1 and from 4.8 ± 0.1 ºC
to 29.8 ± 0.1 ºC at NC2. Dissolved oxygen patterns also followed seasonal trends with
average values of 8.04 ± 0.58 mg l-1 for NC1 and 8.81 ± 0.42 mg l-1 for NC2. Salinities
were nearly constant at both sites throughout the sampling period with no significant
effect of time (p = 0.115). NC1 salinities averaged 32.4 ± 0.9 and NC2 salinities
averaged 33.2 ± 1.4 throughout 2007 and 2008.
Water column chlorophyll a and TSS concentrations were significantly greater at
NC1 than NC2 (p < 0.001) and were also significantly different over time (Chl a p =
0.003; TSS p < 0.001). Chlorophyll a mean concentrations were less than 6.0 µg l-1 at
both sites throughout 2007 and 2008. Water column NOx (NO2- + NO3
-) and NH4+ were
not significantly different between sites (p = 0.281 and 0.999 respectively). DIP was
significantly greater at NC1 (p = 0.003), however PO4-3 concentrations were below 0.4
µg l-1 for both sites. TSS followed a similar pattern to chlorophyll with concentrations

35
averaging less than 30.0 mg l-1 for both sites throughout the sampling period. Differences
in chlorophyll a and TSS over time were driven by the August 2007 results where
chlorophyll concentrations reached 10.72 ± 1.39 µg l-1 at NC1 and 15.61 ± 4.25 µg l-1 at
NC2 and TSS reached 70.27 ± 8.93 mg l-1 at NC1 and 114.89 ± 32.05 mg l-1 at NC2.
Sediment organic content and sand/silt/clay percentages were the only sediment
characteristics to differ significantly between sites. NC1 was the muddier site
characterized by 21.6 ± 1.1 % silt and 7.3 ± 0.5 % clay fractions which was significantly
greater (p = 0.005) than NC2 (1.3 ± 0.2 % silt and 10.4 ± 1.1 % clay). In addition, NC1
also had significantly greater sediment organic content (p < 0.001) than NC2 (Table 1-1).
Sediment DIN (NH4+ only, p = 0.341), DIP (p = 0.063) and redox (p = 0.943) did not
differ significantly between sites. Daytime redox profiles indicate that, on average, the
sediment retained some level of oxygen until depths of 2 cm where the levels dropped
below 0 mV to depths of 10 cm.
Zostera marina biomass
There was no significant difference in vegetative shoot above-ground biomass
between NC1 and NC2 (p = 0.477; Table 1-2) although there was a difference over time
(p < 0.001; Table 1-2). Above-ground biomass at both sites followed seasonal trends
with peak biomass occurring in July in both 2007 and 2008 (Figure 1-3). Below-ground
biomass was significantly greater at NC2 compared to NC1 (p < 0.001). NC1 above
ground biomass reached 118.74 ± 14.42 g DW m-2 while the NC2 biomass peak was
slightly lower at 97.25 ± 22.53 g DW m-2 (Figure 1-3). Seasonal biomass lows occurred
in October and November in both 2007 and 2008. Above-ground biomass was

36
completely absent from NC1 in October 2007 and again in September 2008. While NC2
biomass decreased to the lowest recorded value, 13.80 ± 5.00 g DW m-2, in October 2007,
there was biomass present during the entire sampling period at this site.
Reproductive shoot biomass was recorded at both sites from February to June
2008, reaching a maximum in April at both sites. NC1 reproductive shoot biomass
(30.93 ± 2.41 g DW m-2) was significantly greater than NC2 (15.66 ± 2.93 g DW m-2; p =
0.003; Table 1-2, Figure 1-3). After reaching maximum values, reproductive shoot
biomass quickly decreased at both sites before completely disappearing in July.
Shoot Density and Seed Abundance
Vegetative shoot density was significantly greater at NC2 than NC1 throughout
the sampling in 2007 and 2008 (p < 0.001; Table 1-3). From July 2007 to November
2008 there were 2.5 times more vegetative shoots at NC2 than at NC1 (Figure 1-4).
Vegetative shoot density followed seasonal patterns with peak shoot density occurring in
early to mid-summer, depending on the site. Following the annual decline to zero in
November 2007, NC1 peak vegetative shoot abundance occurred the following February
with densities of 1,973 ± 144 shoots m-2. Immediately following the peak density period,
NC1 vegetative shoot density decreased corresponding with the increase of reproductive
shoots (February to June 2008) and continued to decline to zero by September 2008.
Vegetative shoot density increased again with germination of new seedlings and reached
442 ± 105 shoots m-2 by November 2008. NC2 reached peak vegetative shoot density
(3,214 ± 288 shoots m-2) in April two months later than at NC1. While vegetative shoot

37
densities exhibited seasonal declines, shoot densities at NC2 were never below 531 ± 248
shoots m-2 (Figure 1-4).
Flowering shoot densities were similar between sites (p = 0.889; Table 1-3). NC1
flowering shoot density reached a maximum first in March 2008 with densities of 603 ±
157 flowering shoots m-2 (Figure 1-4). Densities of NC2 reproductive shoots peaked in
May 2008 with a maximum of 463 ± 224 shoots m-2. Despite the non-significant
difference in reproductive shoot density between sites, the Z. marina bed at NC1
produced a significantly higher proportion of reproductive shoots during the 2007-2008
season (p = 0.002). For all months during the Z. marina flowering period, NC1 plants
produced a greater proportion of reproductive shoots with up to 33 ± 3 % of total shoots
flowering. During the period of maximum flowering (March to May 2008) only 26 ± 13
% of all shoots in the Z. marina bed at NC2 were flowering (Figure 1-4).
Due to the non-significant difference in reproductive shoot density, the potential
number of total seeds produced also did not differ significantly between sites (p = 0.092;
Table 1-3). While the proportion of reproductive shoots at NC1 was significantly greater
than NC2 the overall total number of reproductive shoots, the number of rhipidia per
shoot, and the average number of seeds per spathe were similar resulting with a non-
significant difference between sites in the number of potential seeds produced (Table
1-4). While seed production was not significantly different, on average NC1 produced
17,000 more seeds per m-2 or 1.7 times more seeds than NC2.
38
Seed-bank
The greater abundance of seeds produced at NC1 than NC2 resulted in a 2.2 times
greater density of seeds in NC1 compared to NC2 seed-banks (p < 0.001; Table 1-3).
Compared to the observed total seed production in each site in 2008, less than 1 % of
seeds produced were retained within the sediment seed-bank at NC2 and only 2 % were
retained in NC1. Seed-bank densities were greatest in the samples collected in the fall of
2008 for NC2 and immediately after the end of the flowering shoot season in NC1 (Table
1-5). Seeds were always present in the seed-bank at both sites, although NC1 seed-banks
were significantly depleted following the large germination event in November 2008. Of
the less than 2 % of seeds retained within the sediment seed-bank at both sites, seed
viability ranged from 0 to 13 ± 13 % for NC2 and from 0 to 33 ± 21 % for NC1. On
average, densities of viable seeds were 27.2 times greater at NC1 than NC2 (p = 0.003;
Table 1-3). At NC1 seed viability was greatest in the period just prior to the fall
germination event (Table 1-5).
Discussion
The results presented here quantify the presence of a semi-annual Zostera marina
population at Phillips Island in the Newport River, NC. While the bed was annual and
regenerated from seeds on a yearly basis, the individual plants found within the bed did
not display all of the defining characteristics of either perennial (Setchell, 1929) or annual
(Keddy and Patriquin, 1978; Phillips et al., 1983a) Z. marina populations; therefore, the
NC1 population cannot solely be described by either life history strategy. All Z. marina
shoots were germinated from seeds, a portion of seedlings flowered during their first year

39
of growth, and all shoots completed their life cycle and died within one year of
germination like an annual plant; however, not all shoots flowered and shoots reproduced
both sexually and asexually, similar to a perennial plant. Therefore, the form of Z.
marina documented here is characterized by a semi-annual history strategy which
employs aspects of both perennial and annual forms of Z. marina.
Phillips et al. (1983a) observed Z. marina beds along the eastern Pacific which
also incorporated aspects of both annual and perennial reproduction. Pacific Z. marina
populations found in intertidal habitats characterized by increased environmental
extremes and a greater frequency in physical disturbances produced significantly greater
flowering shoots compared to perennial populations located in subtidal habitats. Phillips
et al. (1983a) concluded that an increase in sexual reproduction indicated a shift from a
perennial competitive life history to a perennial-annual life history although the plants
were observed throughout the year. Furthermore they concluded that the increase of
flowering in these perennial plants was related to environmental stress (Phillips et al.,
1983a). Like the populations described in Phillips et al., (1983a) the proportion of
flowering shoots at the semi-annual NC1 bed was significantly greater than NC2.
However, there was no significant difference in measured water column characteristics
between NC1 and NC2 in 2007 and 2008. Therefore, the presence of a semi-annual form
of Z. marina at NC1 could not be directly related to measured environmental conditions.
Similar to the results presented here for populations located at the southern limit
of Z. marina distribution along the western Atlantic, multiple life-histories have been
observed at the southern limit of Z. marina distribution along the eastern Pacific (Phillips
et al., 1983a; Meling-Lopez and Ibarra-Obando, 1999; Santamaría-Gallegos et al., 2000).

40
The presence of the semi-annual life history in Z. marina beds in the Gulf of California
has been related to water temperatures greater than 30 ºC which inhibit the growth and
survival of perennial Z. marina (Meling-Lopez and Ibarra-Obando, 1999; Santamaría-
Gallegos et al., 2000). Although late summer water temperatures across both NC sites
reached maximum daily water temperatures of 30.3 ± 0.1 ºC at NC1 and 29.8 ± 0.1 ºC at
NC2, almost 10 ºC greater than the optimum range of 10 to 20 ºC for perennial Z. marina
growth and survival (Nejrup and Pederson, 2008), perennial Z. marina was observed at
NC2 during all sampling dates in 2007 and 2008. In addition, maximum above-ground
biomass 97.25 ± 22.53 g DW m2 for NC2 was comparable to other perennial Z. marina
beds in North Carolina (106 g DW m2 to 200 g DW m2; Penhale, 1977; Kenworthy et al.,
1981; Thayer et al., 1984). Therefore, unlike the Z. marina populations located at the
southern limit of the species distribution along the eastern Pacific, temperatures do not
seem to completely inhibit the growth and survival of perennial Z. marina in North
Carolina.
In 2007 and 2008, the perennial bed at NC2 produced had 2.7 times more non-
flowering shoots than the semi-annual site. Maximum vegetative shoot density of 3,214
± 288 shoots m-2 at the perennial site are similar to reported values in the Chesapeake
Bay, Virginia (2,918 ± 970 shoots m-2; Orth and Moore, 1986) indicating that vegetative
shoot densities in the mixed life history bed at NC1 were lower than mid-Atlantic
perennial beds in general. The reduction in vegetative shoot density may be related to the
greater production of flowering shoots at NC1 compared to regional perennial Z. marina
beds. NC1 Z. marina beds produced several hundred more flowering shoots m-2 (603
± 157 shoots m-2) than NC2 (463 ± 224 shoots m-2) or Chesapeake Bay (424 ± 170 shoots
41
m-2) Z. marina beds (Orth and Moore, 1986). As a result, potential seed abundances were
up to 17,000 seeds m-2 greater at the mixed life history site than regional perennial beds.
Greater seed abundances within the semi-annual Z. marina bed at NC1 increased the
ability of the bed to re-establish on a yearly basis from seed. Perennial beds do not re-
establish on an annual basis; therefore, the Z. marina bed at NC2 may have reduced
sexual reproduction and increased vegetative reproduction to increase the chances of
survival of a successful clonal genotype (Inglis, 2000).
Z. marina at NC1 produced double the reproductive shoot biomass (30.93 ± 2.41
g DW m-2) compared to the perennial site at NC2 (15.66 ± 2.93 g DW m-2). In addition,
within 11 months shoots within the semi-annual; life-history Z. marina population at
NC1 were able to germinate, flower, and produce seeds similar to annual Z. marina beds
(Keddy and Patriquin, 1978; Phillips et al., 1983a; Santamaria-Gallegos et al., 2000).
This is substantially faster than perennial shoots within the same region which require up
to 18 months before producing reproductive shoots (Setchell, 1929; Silberhorn et al.,
1983; Thayer et al., 1984). The production of reproductive shoots during the first year of
growth provides an annual supply of seeds to the bed and surrounding areas. Seeds
within the bed will increase the density of the sediment seed-bank, providing a
mechanism for re-establishment (Leck et al., 1989; Orth et al., 2000; Jarvis Chapter 3),
while seeds transported out of the bed by rafting of reproductive shoots may disperse Z.
marina into new areas increasing the distribution within the region (Harwell and Orth,
2002a; Källström et al., 2008).
Unlike annual populations, the seedlings at NC1 reproduced both sexually and
asexually. As a result, the maximum proportion of reproductive shoots (33 ± 3 %) was
42
lower than the 100 % expected of annual populations (Keddy and Patriquin, 1978;
Robertson and Mann, 1984; Santamaria-Gallegos et al., 2000). Despite the lower
flowering shoot abundances, Z. marina at NC1 produced greater seed densities than NC2
resulting in the average production of 53,513 ± 7,365 seeds m-2. As with flowering shoot
densities, NC1 maximum potential seed abundance was much lower than the 78,224
seeds m-2 reported for annual beds in Nova Scotia (Keddy, 1987) and the 100,376 ±
18,765 seeds m-2 reported for annual beds in the Sea of Cortez, Mexico (Meling-Lopez
and Ibarra-Obando, 199). Based on the results presented here; the cost of reproducing
both asexually and sexually in the semi-annual life-history bed at NC1 may have resulted
in a reduction in the number of seeds produced compared to annual beds. However, by
reproducing both sexually and asexually, NC1 beds were able to increase the sediment
seed-bank therefore increasing the resiliency of the bed to disturbance (Leck et al., 1989;
Jarvis, Chapter 4) while also maximizing successful genotypes within the bed (Inglis,
2000). Therefore, Z. marina populations at NC1 may be able to exploit a variety of
conditions.
Fall sediment seed-bank density at NC1 represented less than 2 % of potential
seeds produced in 2008. Seed-bank densities are crucial during this time of year as this is
the maximum period of germination for Z. marina seeds in the mid-Atlantic region
(Silberhorn et al., 1983; Thayer et al., 1984). Similar losses of seeds have been reported
for both annual and perennial Z. marina beds throughout the species distribution
(Santamaria-Gallegos et al., 1999; Harwell and Orth, 2002b; Morita et al., 2007). Within
the Gulf of California 25 % of seeds produced by annual beds were estimated to be lost
while still attached to the reproductive shoot (Santamaria-Gallegos et al., 1999). In Ago

43
Bay, Japan 78 % of seeds were estimated to be lost from the bed with remaining seed-
bank densities of intact seeds ranging from 219 ± 103 seeds m-2 to 1,157 ± 360 seeds m-2
(Morita et al., 2007). These losses may be the result of dispersal (Källström et al., 2008),
decay (Morita et al., 2007), predation (Fishman and Orth, 1996), or germination (Harper,
1977; Jarvis, Chapter 2).
When seed viability is taken into account, the loss of seeds was even greater at the
semi-annual site as the total percentage of viable seeds within the seed-bank decreased
from 33 ± 21 % immediately following the 2007 seed release to 0 % after the maximum
fall germination period in the same year. While the viability of the sediment seed-bank
was greater at NC1 compared NC2 in both 2007 and 2008, viability of all seeds
decreased over time at both sites with no viable seeds collected within 6 months of seed
production. The greater viability of the sediment seed-bank at NC1 with the semi-annual
life history strategy may be a reflection of a bet-hedging strategy where the production of
more seeds may result in a greater potential for germination and bed re-establishment
(Keddy, 1987; Symonides, 1988; Shipley et al., 1989; Harrison, 1993; Rees, 1996).
Regardless of life history, seeds must remain viable in the sediment seed-bank
until conditions are favorable for germination and newly germinated seedlings can
replace adults within the established population (Baker, 1989; Murdoch and Ellis, 2000).
Laboratory experiments have shown that when kept in a liquid medium, perennial Z.
marina seeds remain viable for less than one year (McMillan, 1983; Harrison, 1991;
Moore et al., 1993). The in situ observations of both perennial and semi-annual Z.
marina beds presented here also indicated that seeds remain viable for less than one year
when incorporated into the sediment. The production of a transient seed-bank by semi-
44
annual life history strategy Z. marina beds has large implications for the long-term
survival of these populations. Flowering within Z. marina beds is influenced by a variety
of factors including temperature (Setchell, 1929) and photoperiod (Phillips et al., 1983a).
Reductions in flowering in response to variable environmental conditions may result in
lower seed densities within the bed, lower viable seed densities within the sediment seed-
bank and decrease the overall chances for successful germination. As semi-annual beds
rely solely on seed germination for bed re-establishment, reductions in the sediment seed-
bank could have extreme negative consequences.
Conclusions
The results reported here support a modification of the life-history model for Z.
marina populations not previously described in the literature. The semi-annual life
history strategy of Z. marina at NC1 was defined by seedlings reproducing both sexually
and asexually before completing their life cycle in less than 12 months. The life history
reported here ensures that a portion of the population at NC1 produces seeds during the
first year of growth while also maximizing a successful clonal genotype through
vegetative expansion. The development of the semi-annual life-history strategy at NC1 is
not understood and further investigation into genetic variations and phenological
response of this population to environmental conditions is required. Seed-bank viability
was greater at the semi-annual site; however, seed-bank viability decreased over time
with no viable seeds remaining after 6 months in the sediment. These results highlight
the need for an annul replenishment of the seed-bank in both perennial and semi-annual

45
life history forms of Z. marina and indicate that the resiliency provided by the sediment
seed-bank may be limited.
46
Literature Cited Ackerman, J.D. 2006. Sexual reproduction in seagrasses: Pollination in the marine context. In: Larkum A.W.D., R.J. Orth, and C.M. Duarte eds. Seagrasses: Biology, Ecology, and Conservation. pp 89-109. Allison, P.D. 1999. Logistic Regression Using the SAS System : Theory and Application. Cary NC, SAS Institute Inc. Association of Official Seed Analysts. 1981. Rules for testing seeds. Journal of Seed Technology 6(2): 1-126. Baker, H.G. 1989. Some aspects of the natural history of seed-banks. In: Leck, M.A., V.T. Parker, and R.L. Simpson eds. Ecology of Soil Seed-banks. Academic Press, Inc. San Diego, USA. pp 9-21. Conacher. C.A., I.R. Poiner, J. Butler, S. Pun, and D.J. Tree. 1994. Germination, storage and viability testing of seeds of Zostera capricorni Aschers. from a tropical bay in Australia. Aquatic Botany 49: 46-58. den Hartog C. 1970. The Sea-Grasses of the World. North-Holland, Amsterdam. Dennison, W.C. and R.S. Alberte. 1985. Role of daily light period in the depth
distribution of Zostera marina (eelgrass). Marine Ecology Progress Series 25: 51-61.
Dennison, W.C. 1987. Effects of light on seagrass photosynthesis, growth, and depth distribution. Aquatic Botany 27: 15-26. Erftemeijer, P.L.A. and E.W. Koch. 2001. Sediment geology methods for seagrass habitat. In Global Seagrass Research Methods. Short ,F.T. and R.G. Coles (eds). Elsevier Science B.V., Amsterdam pp 345-367. Evans, A.S., K.L. Webb, and P.A. Penhale. 1986. Photosynthetic temperature acclimation in two coexisting seagrasses, Zostera marina L. and Ruppia maritima L. Aquatic Botany 24: 185-197. Fishman, J.R. and R.J. Orth. 1996. Effects of predation on Zostera marina L. seed abundance. Journal of Experimental Marine Biology and Ecology 198: 11-26. Green, E.P. and F.T. Short. 2003. World Atlas of Seagrasses. Prepared by the UNEP World Conservation Monitoring Centre. University of California Press. Berkley, USA. pp 1-298. Harlin, M.M., B. Thorne-Miller, and J.C. Boothroyd. 1982. Seagrass-sediment dynamics of a flood-tidal delta in Rhode Island (U.S.A.). Aquatic Botany 14: 127-138.
47
Harper, J.L. 1977. Population Biology of Plants. Academic Press, London, UK. Harrison, P.G. 1979. Reproductive strategies in intertidal populations of two co-occurring seagrasses (Zostera spp). Canadian Journal of Botany 57: 2635-1638. Harrison P.G. 1991. Mechanisms of seed dormancy in an annual population of Zostera marina (eelgrass) from The Netherlands. Canadian Journal of Botany 69: 1972- 1976. Harrison, P.G. 1993. Variations in demography of Zostera marina and Z. noltii on an intertidal gradient. Aquatic Botany 45: 63-77. Harwell, M.C., and R.J. Orth. 2002a. Long-distance dispersal potential in a marine macrophyte. Ecology 83: 3319–3330. Harwell, M.C. and R.J. Orth. 2002b. Seed-bank patterns in Chesapeake Bay eelgrass (Zostera marina L.): A bay-wide perspective. Estuaries 25(6): 1196-1204. Harwell, M.C. and J.M. Rhode. 2007. Effects of edge/interior and patch structure on reproduction in Zostera marina L. in Chesapeake Bay, USA. Aquatic Botany 87: 147-154.
Hinchey, E.K. and L.C. Schaffner. 2005. An evaluation of electrode insertion techniques for measurement of redox potential in estuarine sediments. Chemosphere 59: 703- 710. Inglis, G.J. 2000. Disturbance-related heterogeneity in the seed-banks of a marine angiosperm. The Journal of Ecology 88(1): 88-99. Källström, B., A. Nyqvist, P. Åberg, M. Bodin, and C. André. 2008. Seed Rafting as a
dispersal strategy for eelgrass (Zostera marina). Aquatic Botany 88(2): 148-153. Keddy, C.J. 1987. Reproduction of annual eelgrass variation among habitats and
comparison with perennial eelgrass (Zostera marina L.). Aquatic Botany 27: 243-256.
Keddy, C.J. and D.G. Patriquin. 1978. An annual form of eelgrass in Nova Scotia. Aquatic Botany 5: 163-170. Kenworthy, J.W., S. Wyllie-Echeverria, and R.G. Coles. 2006. Seagrass conservation biology: An interdisciplinary science for protection of the seagrass biome. In: Seagrasses: Biology, Ecology, and Conservation; Edited by Larkum, A.W.D., R.J. Orth, and C.M. Durate. Springer, Netherlands pp 595-623.
48
Knepel, K. and K. Bogren. 2001. Revised 2002. Determination of orthophosphate by flow injection analysis. QuikChem Method 31-115-01-1-H. Lachat Instruments, Milwaukee, WI, USA. Lakon, G. 1949. The topographical tetrazolium method for determining the germinating capacity of seeds. Plant Physiology 24: 389-394. Leck, M.A., V.T. Parker, and R.L. Simpson. 1989. Ecology of Soil Seed-banks. Academic Press, Inc. Sand Diego, California, USA. Lee, K.S., J.I. Park, Y.K. Kim, S.R. Park, and J.H. Kim. 2007. Recolonization of Zostera marina following destruction caused by red tide algal bloom: the role of new shoot recruitment from seed-banks. Marine Ecology Progress Series 342: 105- 115. Liao, N. 2001. Revised 2002. Determination of ammonia in brackish or seawater by flow
injection analysis. QuikChem Method 31-107-06-1-B. Lachat Instruments, Milwaukee, WI, USA.
McMillan, C. 1991. The longevity of seagrass seeds. Aquatic Botany 40: 195-198. Meling-Lopez, A.E. and S.E. Ibarra-Obando. 1999. Annual life cycles of two Zostera marina L. populations in the Gulf of California: contrasts in seasonality and reproductive effort. Aquatic Botany 65: 59-69. Moore, K.A., R.J. Orth, and J.F. Nowak. 1993. Environmental regulation of seed germination in Zostera marina L. (eelgrass) in Chesapeake Bay: Effects of light, oxygen, and sediment burial. Aquatic Botany 45(1): 79-91. Morita, T., H. Okumura, M. Abe, A. Kurashima, and M. Maegawa. 2007. Density and distribution of seeds in bottom sediments in Zostera marina beds in Ago Bay, central Japan. Aquatic Botany 87: 38-42. Murdoch, A.J., and R.M. Ellis. 2000. Dormancy, viability and longevity. In: Fenner, M. (Ed.), Seeds, the Ecology of Regeneration in Plant communities, second ed. CAB International, London, UK, pp. 183–214. Nejrup, L.B. and M.F. Pedersen. 2008. Effects of salinity and water temperature on the ecological performance of Zostera marina. Aquatic Botany 88: 239-246. Olsen, B. 1999. Reproduction in Danish eelgrass (Zostera marina L.) stands: size- dependence and biomass partitioning. Aquatic Botany 65: 209-219. Orth, R.J. and K.A. Moore. 1986. Seasonal and year-to-year variations in the growth of Zostera marina L. (eelgrass) in the lower Chesapeake Bay. Aquatic Botany 24: 335-341.

49
Orth, R.J., M.C. Harwell, E.M. Bailey, A. Bartholomew, J.T. Jawad, A.V. Lombana, K.A. Moore, J.M. Rhode, and H.E. Woods. 2000. A review of issues in seagrass seed dormancy and germination: implications for conservation and restoration. Marine Ecology Progress Series. 200: 277-288. Orth, R.J., T.J.B. Carruthers, W.C. Dennison, C.M. Duarte, J.W. Fourqurean, K.L. Heck Jr., A. R. Hughes, G.A. Kendrick, W. J. Kenworthy, S. Olyarnik, F.T. Short, M. Waycott, and S.L. Williams. 2006. A Global Crisis for Seagrass Ecosystems. BioScience 56: 987-986. Penhale, P.A. 1977. Macrophyte-epiphyte biomass and productivity in an eelgrass (Zostera marina L.) community. Journal of Experimental Marine Biology and Ecology 26: 211-224. Phillips, R.C., W.S. Grant, and C.P. McRoy. 1983a. Reproductive strategies of eelgrass (Zostera marina) L. Aquatic Botany 16: 1-20.
Phillips, R.C., C. McMillan, and K.W. Bridges. 1983b. Phenology of eelgrass, Zostera marina L., along latitudinal gradients in North America. Aquatic Botany 15: 145- 156. Plumb, R.H. Jr. 1981. Procedures for Handling and Chemical Analysis of Sediment and Water Samples. Technical Report EPA/CE-81-1. Prepared by Great Lakes Laboratory, State University College at Buffalo, Buffalo, NY for the U.S. Environmental Protection Agency/Corps of Engineers Technical Committee on Criteria for Dredged and Filled Material: Environmental Laboratory, U.S. Army Waterways Experiment Station, Vicksburg, MS. p 403. Rees, M. 1996. Evolutionary ecology of seed dormancy and seed size. Philosophical Transactions: Biological Sciences 351(1345): 1299-1308. Reusch, T.B.H. 2006. Does disturbance enhance genotypic diversity in clonal organisms? A field test in the marine angiosperm Zostera marina. Molecular Ecology 15: 277-286 Robertson, A.I., and K.H. Mann. 1984. Disturbance of ice and life-history adaptations of the seagrass Zostera marina. Marine Biology 80: 131–141. Santamaría-Gallegos, N.A. J.L. Sánchez-Lizaso, and E.F. Félix-Pico. 2000. Phenology and growth cycle of annual subtidal eelgrass in a subtropical locality. Aquatic Botany 66: 329-339. Sawma, J.T. and C.L. Mohler. 2002. Evaluating seed viability by an umimbibed seed crush test in comparison with the tetrazolium test. Weed Technology 16: 781-786.
50
Setchell, W.A. 1920. Geographical distribution of marine spermatophytes. Bulletin of the Torrey Botanical Club 47(12): 563-579. Setchell, W.A. 1929. Morphological and phonological notes on Zostera marina L. University of California Publications in Botany 14: 389-452. Shipley, B., P.A. Keddy, D.R.J. Moore, and K. Lemky. 1989. Regeneration and establishment strategies of emergent macrophytes. The Journal of Ecology 77(4): 1093-1110. Short, F.T., T. Carruthers, W. Dennison, and M. Waycott. 2007. Global seagrass distribution and diversity: A bioregional model. Journal of Experimental Marine Biology and Ecology 350: 3-20. Short, F.T. and K.A. Moore. 2006. Zostera: Biology, Ecology, and Management. In: Larkum A.W.D., R.J. Orth, and C.M. Duarte eds. Seagrasses: Biology, Ecology, and Conservation. pp 361-386. Silberhorn, G.M., R.J. Orth, and K.A. Moore. 1983. Anthesis and seed production in
Zostera marina L. (eelgrass) from the Chesapeake Bay. Aquatic Botany 15: 133-144.
Simpson, G.M. 1990. Seed dormancy in grasses. Cambridge University Press, New York. Smith P. and K. Bogren. 2001. Determination of nitrate and/or nitrite in brackish or seawater by flow injection analysis colorimetry. QuikChem Method 31-107-04-1- E. Lachat Instruments, Milwaukee, WI, USA. Strickland, J. and T. Parsons, 1972. A Practical Handbook of Seawater Analysis, Bulletin 167 (2nd ed.), Fisheries Research Board Canada, Ottawa. 310 pp. Symonides, E. 1988. On the ecology and evolution of annual plants in disturbed environments. Vegetatio 27: 21-31. Talbot, S.L., G.K. Sage, J.R. Rearick , and R.M. Salazar. 2004. Genetic structure of Zostera marina in San Francisco Bay: Preliminary results of microsatellite analysis. Report to Caltrans. http://www.biomitigation.org/reports/files/SF_Z. marina_Genetics_0_1578.pdf. Taylor, A.R.A. 1957. Studies of the development of Zostera marina L. II. Germination and seedling development. Canadian Journal of Botany 35: 681-695. Thayer, G.A., W.J. Kenworthy, and K.S. Fonseca. 1984. The ecology of eelgrass meadows of the Atlantic Coast: A community profile. U.S. Fish Wildlife Service. FWS/OBS-84/02 147 pp.
51
van Katwijk, M.M. and L.J.M. Wijgergangs. 2004. Effects of locally varying exposure, sediment type and low-tide water cover on Zostera marina recruitment from seed. Aquatic Botany 80: 1-12. van Lent, F. and J.M. Verschuure. 1994. Intraspecific variability of Zostera marina L. (eelgrass) in the estuaries and lagoons of the southwestern Netherlands II. Relation to environmental factors. Aquatic Botany 48: 59-75. van Lent, F. and J.M. Verschuure. 1995. Comparative study on populations of Zostera marina L. (eelgrass): experimental germination and growth. Journal of Experimental Marine Biology and Ecology 185: 77-91. Zar, J.H. 1996. Bio-statistical Analysis. Third Ed. Prentice Hall, London, UK. Zimmerman, R.C. J.L. Reguzzoni, S. Wyllie-Echeveria, M. Josselyn, and R.S. Alberte. 1991. Assessment of environmental suitability for growth of Zostera marina L. (eelgrass) in San Francisco Bay. Aquatic Botany 39: 353-366

52
Table 1-1 Sediment characteristics for both North Carolina sampling sites. All values are monthly mean values ± S.E. Site NC1 NC2 Date Jul-07 Dec-07 Jun-08 Sep-08 Jul-07 Dec-07 Jun-08 Sep-08 % Organic 3.0 ± 0.2 3.3 ± 0.3 3.5 ± 0.8 2.8 ± 0.1 1.3 ± 0.1 1.3 ± 0.2 0.7 ± 0.1 1.2 ± 0.2 Nutrients NH3 um 14.7 ± 2.9 8.9 ± 2.9 42.1 ± 17.0 21.3 ± 7.5 20.4 ± 6.4 12.7 ± 0.8 15.2 ± 1.6 14.3 ± 2.4 PO4 um 0.9 ± 0.1 0.8 ± 0.2 0.9 ± 0.3 0.2 ± 0.1 1.5 ± 0.5 0.6 ± 0.2 3.8 ± 1.2 0.0 ± 0.0

53
Table 1-2. Results of repeated measures ANOVA for above-ground biomass and flowering shoot biomass for both sites over the 2007-2008 growing season. All significant results are denoted with an (*). Factor df Type III SS Mean SS F value p Vegetative Shoots Between Sites Site 1 0.33 0.33 0.56 0.477 Error (site) 8 4.73 0.59 Within Sites Time 15 214.55 14.30 23.20 <0.001* Time*Site 15 45.24 3.02 4.89 <0.001* Error (time) 120 73.98 0.62 Reproductive Shoots Between Sites Site 1 2.65 2.65 17.52 0.003* Error (site) 8 1.21 0.15 Within Sites Time 4 3.23 0.81 10.10 <0.001* Time*Site 4 0.83 0.21 2.59 0.055* Error (time) 32 2.56 0.08

54
Table 1-3. Negative binomial regression model analyzing the effects of site on vegetative shoot density, reproductive shoot density, potential number of produced seeds, total seed-bank density, and viable seed-bank density. Odds ratios calculated based on the parameter estimates. All significant results are denoted with an (*).
Wald 95 % CL Parameter DF Est SE X 2 p odds ratio Low High Vegetative Shoots Intercept 1 4.28 0.08 2745.61 <0.001* 72.23 Site 1 -0.90 0.12 56.95 <0.001* 0.41 0.32 0.51Dispersion 1 0.47 0.06 Reproductive Shoots Intercept 1 2.43 0.17 214.88 <0.001* 11.32 Site 1 0.03 0.22 0.02 0.889 1.03 0.67 1.58Dispersion 1 0.51 0.11 Potential Seed Production Intercept 1 5.61 0.23 600.26 <0.001* 272.95 Site 1 0.54 0.32 2.84 0.092 1.72 3.00 246.53Dispersion 1 1.25 0.21 Seed-bank Intercept 1 -0.28 0.18 2.52 0.112 0.75 Site 1 1.22 0.23 29.78 <0.001* 3.42 2.20 5.31Dispersion 1 0.86 0.21 Viable Seed-bank Intercept 1 -4.23 1.05 16.14 <0.001* 0.01 Site 1 3.30 1.13 8.62 0.003* 27.18 3.00 246.53Dispersion 1 7.66 3.53

55
Table 1-4. Mean sexual reproductive output for Z. marina beds located at both NC1 and NC2 during the 2007-2008 growing season. Values are averaged across all months when reproductive shoots were present (February to July). Values are reported as mean ± S.E.
Sexual Reproductive Output NC1 NC2 # reproductive shoots m-2 1280 ± 206 935 ± 223 # rhipidia per shoot 3.5 ± 0.2 3.5 ± 0.4 # seeds per rhipidia 11 ± 1 10 ± 1 # seeds m-2 53,513 ± 7,365 36,000 ± 8,595 % seed-bank retention 1.47 ± 0.21 0.91 ± 0.21
Table 1-5. Mean total seed-bank density and percentage of viable seeds for Z. marina beds in both NC1 and NC2. Values are mean ± S.E.
Total Density % Viable Date NC1 NC2 NC1 NC2 7/24/2007 190 ± 97 211 ± 74 33 ± 21 13 ± 13
12/28/2007 232 ± 84 211 ± 100 0 ± 0 0 ± 0 6/18/2008 906 ± 246 147 ± 42 18 ± 9 0 ± 0 9/15/2008 1243 ± 147 147 ± 79 10 ± 4 0 ± 0
10/31/2008 779 ± 140 232 ± 77 0 ± 0 0 ± 0 11/18/2008 232 ± 91 147 ± 26 0 ± 0 0 ± 0

56
Figure 1-1. Location of NC1 and NC2 sampling sites in the southern outer banks region of North Carolina. Site locations are denoted with a star.

57
Date
06/07 10/07 02/08 06/08 10/08
Salin
ity (P
SS)
26
28
30
32
34
36
38
Dis
solv
ed O
xyge
n (m
g l-1
)
5
6
7
8
9
10
11
12
Tem
pera
ture
(C)
-5
5
15
25
35
45
0
10
20
30
40
50 A
B
C
Figure 1-2. Mean water column (A) temperature, (B) DO, and (C) salinity for both sites over time. (A) Temperature data given as mean values (black) with minimum (blue) and maximum (red) values given for each month. (B) DO and (C) salinity values given as monthly averages. For all graphs NC1 data are given by dashed lines and NC2 data are denoted by solid lines.

58
06/07 10/07 02/08 06/08 10/08
Abo
vegr
ound
Bio
mas
s (g
DW
m-2
)
0
20
40
60
80
100
120
140
06/07 10/07 02/08 06/08 10/08
Abo
vegr
ound
Bio
mas
s (g
DW
m-2
)
5
15
25
35
0
10
20
30
40
A
B
Date
06/07 10/07 02/08 06/08 10/08
Abo
ve G
roun
d B
iom
ass (
g D
W m
-2)
0
20
40
60
80
100
120
140 C
Figure 1-3. Mean ± SE aboveground biomass for (A) non-reproductve shoots and (B) reproductive shoots during the 2007 – 2008 growing season at NC1 and NC2. NC1 = triangles. NC2 = circles. (C) NC1 2007 – 2008 surviving vegetative shoots and seedling above ground biomass. Surviving shoots = solid squares. Seedlings = open squares.

59
Den
sity
(sho
ots m
-2)
500
1500
2500
3500
0
1000
2000
3000
4000
Den
sity
(sho
ots m
-2)
100
300
500
700
0
200
400
600
800
Date
06/07 10/07 02/08 06/08 10/08
Perc
ent F
low
erin
g
5
15
25
35
45
0
10
20
30
40
50
A
B
C
Figure 1-4. Mean monthly values ± standard errors for (A) vegetative shoot density (B) reproductive shoot density and (C) percentage of reproductive shoots at both NC1 and NC2. NC1 data = triangles and dashed lines. NC2 data = circles with solid lines.

60
CHAPTER 2 : VIABILITY OF ZOSTERA MARINA L. SEMI-ANNUAL AND PERENNIAL SEEDS IN THE SEDIMENT SEED-BANK
61
Abstract
A seed viability study quantified the effects of time (6, 12, 15 months), seed source
(semi-annual, perennial – North Carolina; perennial – Virginia), site (sand substrate, mud
substrate), and sediment type (≥ 90% sand, ≤80% sand) on the viability of Zostera
marina seeds in two separate experiments in semi-annual and perennial beds in the
southern Albemarle-Pamlico Sound, North Carolina and in perennial beds in the lower
Chesapeake Bay, Virginia in 2007 and 2008. In addition, the effect of time and site on
ambient seed-bank viability was also quantified for all sites. Overall both North Carolina
(NC) sites had greater total seed-bank densities (147 ± 79 to 1,243 ± 147 seeds m-2) and
greater seed-bank viability (0 to 33 ± 21 %) than the Virginia (VA) sites (maximum
density 53 ± 18 seeds m-2; maximum viability 10 ± 10 %). Within the NC sites the semi-
annual bed seed-bank density was 9.9 times greater and contained 3.3 times more viable
seeds than the perennial bed. NC seed-bank densities followed Z. marina germination
cycles and were the lowest following the period of maximum germination (October –
November) in December 2007. VA ambient seed-bank densities were too low to quantify
differences over time or between sites. Experimental results indicate that viability of NC
seeds decreased significantly after 6 months in the sediment (p < 0.001). Site also had a
significant effect on NC seed viability with 1.3 times more viable seeds collected from
the muddy site compared to the sandy site (p = 0.002). Sediment type and seed source
(semi-annual, perennial) did not have a significant effect on NC seed viability (p = 1.000
and 0.109 respectively). As with the NC seeds, viability of VA seeds decreased with
time (p < 0.001). Viability of VA seeds decreased from 42 % to 0 – 4 % after 6 months
in the sediment. There was no direct effect of seed source (perennial sand, perennial

62
mud) on experimental VA seed viability (p = 1.000). Based on the experimental results
and ambient seed-bank monitoring, time was the over riding factor affecting both semi-
annual and perennial Z. marina seed viability in both NC and VA populations, resulting
in the production of transient seed-banks at all sites. The significant reduction of seed
viability after only 6 months in the sediment suggests that the resiliency provided by
seed-banks for both perennial and semi-annual Z. marina beds may be limited by seed
production on annual scales and by timing of disturbance events.
Key Words: seagrass, Zostera marina, semi-annual, seed-bank, viability

63
Introduction
Zostera marina is a dominant seagrass species circumglobally distributed in
temperate coastal environments in the Northern Hemisphere (den Hartog, 1970; Green
and Short, 2003; Short and Moore, 2006). Although found in both perennial, annual, and
semi-annual forms, the majority of Z. marina beds are perennial and maintain their
populations primarily through clonal expansion and vegetative growth (Setchell, 1929;
den Hartog, 1970; Tomlinson, 1974; Hemminga and Duarte, 2000; Rasheed, 2004; Jarvis
Chapter 1). Despite the prevalence of asexual reproduction, all Z. marina populations
retain the ability to flower (Setchell, 1929; den Hartog, 1970; Thayer et al., 1984).
Within Z. marina populations, sexual reproduction increases genetic diversity (Ackerman
et al., 2006), enhances recovery from small and large-scale declines (Plus et al., 2003;
Whitfield et al., 2004; Waycott et al., 2005), and provides a mechanism for increasing the
geographic range and establishment of new meadows (Figuerola et al., 2002; Källström et
al., 2008). The ability to re-establish populations and expand into new suitable habitats
has become increasingly important over the last several decades as seagrass populations,
including Z. marina, are declining on a global scale in response to anthropogenic
disturbances (Short and Wyllie Echeverria, 1996).
Z. marina has developed three life-history strategies to fully exploit habitats
ranging from tide pools and exposed intertidal mud flats to deeper subtidal light limited
areas (Keddy and Patriquin, 1978; Phillips et al., 1983a; Robertson and Mann, 1984; van
Lent and Verschuure, 1994; Jarvis Chapter 1). The current perennial life-history model
for Z. marina contains both asexual and sexual reproduction with changes in growth and
reproduction dictated by water temperature (Setchell, 1929; Phillips et al., 1983;

64
Silberhorn et al., 1983; Thayer et al., 1984; Short and Moore, 2006). Although perennial
Z. marina populations increase sexual reproduction in response to disturbances (Phillips
et al., 1983; den Hartog, 1987; van Lent and Verschuure, 1994), the current model
emphasizes clonal expansion and does not take the seed-bank, seed germination, or
seedling growth and survival into account (Setchell, 1929; Thayer et al., 1984). The
annual life-history strategy for Z. marina is reliant completely on sexual reproduction
with no clonal growth (Keddy and Patriquin, 1978; Phillips et al., 1983a; Robertson and
Mann, 1984; Santamaría-Gallegos et al., 2000). In addition, annual populations have a
compressed life cycle with seedlings germinating, flowering, producing seeds and dying
in less than a year (Keddy and Patriquin, 1978; Phillips et al., 1983a; Santamaría-
Gallegos et al., 2000). Seeds remain within the sediment seed-bank until germination
occurs the following year (Keddy and Patriquin, 1978; Phillips et al., 1983). Like annual
populations, semi-annual Z. marina populations rely on sexual reproduction for bed re-
establishment on an annual basis, flower as seedlings, and complete their life cycle in less
than one year; however, they also reproduce asexually (Jarvis, Chapter 1).
Flowering within Z. marina beds is not homogeneous, resulting in a non-even
distribution of seeds within the sediment seed-bank (Harwell and Orth, 2002; Morita et
al., 2007). Annual and perennial Zostera marina seeds typically do not germinate
immediately after release from the reproductive shoot (Taylor, 1957; Keddy, 1987;
Harrison, 1993; Moore et al., 1993). Once deposited on the sediment surface seeds may
become incorporated into the sediment forming a seed-bank (Simpson, 1990; Harwell
and Orth, 2002). Sediment seed-banks are defined as a reservoir of seeds found within
the sediment which are viable, or capable of germinating, and therefore are able to
65
replace adult plants (Baker, 1989). Seagrass seed-banks provide resiliency from small
and large scale declines (Olsen and Sand-Jensen, 1994; Plus et al., 2003; Olsen et al.,
2004; Greve et al., 2005), a mechanism of re-establishment for annual species
(Hootsmans et al., 1987; Hammerstrom et al., 2006; Lee et al., 2007), and a mode of
dispersal within the sediment (Bell et al., 2008). Although Z. marina seeds are not
produced at or below the sediment surface, which for seagrass genera Halodule,
Cymodocea, and Halophilia increases the probability for incorporation of seeds into the
sediment seed-bank (Inglis, 2000), seeds are negatively buoyant and do not move more
than a few meters once deposited onto the sediment (Orth et al., 1994). Despite the lack
of direct burial into the sediment, perennial Z. marina seed-banks have been reported to
contain between 0 and 1,200 seeds m-2 and annual seed-banks between 1,300 to 30,000
seeds m-2 (Harrison, 1993; Harwell and Orth, 2002; Lee et al., 2007; Mortia et al., 2007).
For the sediment seed-bank to perform any function, seeds have to be maintained
at the correct physiological state to ensure viability while also remaining in an
environment conducive for germination to occur at the necessary time (Murdoch and
Ellis, 2000; Thompson, 2000). Seed viability can be affected by many biotic (i.e.
predation) and abiotic (i.e. burial depth, sediment type, temperature, salinity) factors in
the surrounding environment (Baskin and Baskin, 1998; Murdoch and Ellis, 2000).
Seed-banks that retain viable seeds for less than one year are classified as transient while
seed-banks that retain viable seeds for more than one year are persistent (Thompson and
Grime, 1979). Under laboratory conditions, Z. marina seeds do not remain viable in a
liquid medium for longer than 11 months (McMillan, 1983; Harrison, 1991; Moore et al.,
1993) and therefore are assumed to produce transient seed-banks (Harwell and Orth,

66
2002). The micro-environment created by sediment conditions may have a significant
affect on the longevity of seed viability and may affect the type (transient or persistent) of
sediment seed-bank produced (Harper, 1977). However, there has been little research
directly testing the effects of time and variations in the surrounding sediment
environment on seed-bank viability. Understanding the effects of time and sediment
conditions on long term seed-bank viability is necessary to begin quantifying the role of
seeds in the maintenance and recovery of seagrass populations.
Z. marina populations in the lower Chesapeake Bay, Virginia and in the Newport
River and Back Sound, North Carolina were selected to quantify the effects of time and
sediment conditions on seed-bank viability due to stressful environmental conditions
associated with populations found at the species geographic limit (Kenworthy et al.,
1981; Keddy and Patriquin, 1978; Phillips et al., 1983; Santamaría-Gallegos et al., 2000).
Z. marina growth and survival at these sites, which are located at the southern limit of the
species distribution along the western Atlantic (Thayer et al. 1984, Short et al., 2007), can
be limited in the late summer when water temperatures exceed 30 ºC (Setchell, 1929;
Thayer et al., 1984). In both sites water temperatures have increased more than 1.0 ºC
over the last fifty years (Preston, 2004; Micheli et al., 2008) and are predicted to continue
rising over the next several decades (Harley et al., 2006). By quantifying the effects of
sediment composition and time on Z. marina seed-bank viability the resiliency provided
by the sediment seed-bank to increasing stressful environmental conditions may also be
quantified.
The purpose of this study was to use field experiments to quantify the in situ
effects of seed source (North Carolina – semi-annual, perennial; Virginia – perennial

67
only), time (6, 12, 15 months), sediment type (sand, mud) and site on Z. marina seed
viability between semi-annual and perennial beds in the Newport River/Back Sound,
Carteret County, North Carolina and in a separate experiment among perennial beds in
Chesapeake Bay, Virginia. In addition, the density and viability of ambient sediment
seed-banks was monitored over a 15 month period at all sites. I hypothesized that (1)
seeds derived from a mixed life history strategy bed would not have greater viability than
seeds derived from a perennial bed, (2) seed viability would not be significantly different
between sediments and sites similar to those found in the seed source bed (i.e. seeds
collected from sandy sites would maintain similar viability in either sandy or muddy
sediments and at sandy or muddy sites), and (3) overall seed viability would not decrease
over time.
Methods
Site Selection
The effect of sediment type (sand, mud), seed source, (semi-annual strategy and
perennial strategy), site (sandy substrate, muddy substrate), and time (0, 6, 12, 15
months) on the viability of Z. marina seed-banks was quantified in two separate field
experiments in the Newport River/Back Sound, North Carolina and in the lower
Chesapeake Bay, Virginia in 2007 and 2008. Experimental sites were selected in North
Carolina based on the historical presence of perennial and semi-annual beds of Z. marina
(Thayer et al., 1984) and preliminary sediment organic content and grain size analyses.
Virginia experimental sites were selected based on historical presence of perennial Z.
marina beds (Orth et al., 2006) and sediment composition. Seeds and sediment for the

68
North Carolina experiment were collected from Phillips Island (NC1, 34º 43’ N, 76º 41’
W), an semi-annual Z. marina bed with a muddy substrate (≥ 90% sand) in the Newport
River and from Morgans Island (NC2, 34º 66’ N, 76º 52’ W) a perennial bed with a
sandy substrate (≤ 80 % sand) in Back Sound (Figure 2-1). For the Virginia experiment
two historically persistent perennial beds in the lower York River, a tributary to the
Chesapeake Bay, were selected at the muddy Allens Island site (CB1, 37º 15’ N; 76º 25’
W) and at the sandy Goodwin Island site (CB2, 37° 13' N; 76° 23' W; Figure 2-1).
Seed Collection and Seed Viability
Reproductive shoots were collected from all four Z. marina beds during the
period of maximum seed release; early to late May in North Carolina (Thayer et al.,
1984) and late May and early June in Chesapeake Bay (Silberhorn et al., 1983).
Reproductive shoots were kept in separate aerated flow-through seawater tanks (2.4 m x
1.2 m x 1.0 m) until seeds dehisced from the reproductive shoots approximately one
month later (Orth et al., 2007). The seeds were then collected from the bottom of the
tank and kept in separate containers in aerated recirculating tanks (2.4 m x 1.2 m x 1.0 m)
at 20 ºC for one month until placement in experimental cores.
A sub-sample of 100 seeds from each seed source was tested for viability using
tetrazolium chloride (Lakon, 1949; AOSA 1981; Conacher et al., 1994; Sawma and
Mohler, 2002) prior to both experiments. Tetrazolium chloride was used due to increased
accuracy and greater time efficiency compared to traditional germination tests (Lakon,
1949; AOSA 1981; Sawma and Mohler, 2002). Seed embryos were removed from their
seed coats and soaked in a 1 % tetrazolium chloride solution for 24 hours before
69
examination on a dissecting scope at 10 x magnification (Conacher et al., 1994). Seeds
with a pink to brown stained cotyledon and axial hypocotyl were considered viable
(Taylor, 1957; Harrison, 1993).
Seed Viability Experiments
Sediment Collection and Characterization
Sediment for all experimental treatment cores was collected from each site and
stored at 7 to 9 ˚C until processing. Prior to analysis all sediment was dry sieved (0.5 mm
mesh) to remove any extraneous seeds and then homogenized. Five sediment plugs (10.4
cm diameter by 3 cm depth) were collected from each sediment type and quartered. The
first quarter was wet sieved (63 μm sieve), washing slit and clay fractions into a
graduated cylinder. After 24 hours, pipette analysis was performed with the filtrate to
determine the clay (8 phi) and silt (4 phi) fractions of the sieved samples (modification of
Plumb, 1981). Dry weights of the aliquots were then compared and percent sand silt and
clay fractions were determined.
After dry sieving to remove extraneous seeds, sediment percent organic matter
was determined by drying one half of the sediment sub-sample at 60 ˚C for 5 days or
until a constant dry weight was reached. The samples were cooled in a desiccator and
10 g of sediment was weighed and combusted at 500 ˚C for five hours. The sample was
weighed again and percent organic matter calculated (Erftemeijer and Koch, 2001).
Sediment exchangeable nutrients of the remaining quarter of the sample were extracted in
2 M KCl, shaken for 1 hour, centrifuged at 4000 RPM for 6 minutes, filtered (Gelman
Supor, 0.45 µm), and frozen until analysis. Dissolved inorganic nitrogen (DIN, NH4+

70
only) and dissolved inorganic phosphate (DIP, PO4-3) were determined using a Lachat
auto analyzer (Liao 2001, revised 2002; Knepel and Bogren 2001, revised 2002; Smith
and Bogren 2001, revised 2002).
North Carolina Seed Viability and Sediment Cores
Experimental seed viability cores (10.2 cm diameter x 15.2 cm) were partially
filled with sieved sediment and 50 seeds from each seed source were placed at depths
between 3 and 6 cm. Seed depth was selected based on observed vertical distributions of
viable Z. marina seeds in established seed-banks (Harrison, 1991; Harwell and Orth,
2002). Once the seeds were planted, the cores were capped with sediment and covered
with plastic mesh screening (0.5 cm) on both ends. Experimental treatments at each site
consisted of seeds derived from the semi-annual population placed in sand sediments and
in mud sediments, and seeds derived from the perennial population placed in sand
sediments and in mud sediments.
In addition, supplementary experimental sediment cores identical to the viability
cores, but filled with sediment only (no seeds), were established to quantify potential
experimental artifacts on sediment conditions within the viability cores. These cores
were necessary due to the destructive sampling protocols for sediment pore water
nutrients and organic content. All cores (treatment and supplementary sediment) were
replicated three times for each sampling period (total = 12 treatment cores and 6 sediment
cores per site per sampling period).
Three 1 m2 plots were established in July 2007 within vegetated areas at both
NC1 and NC2. Within each plot, one replicate core for each treatment was buried flush

71
with the sediment surface in randomly selected 20 cm2 quadrats within the plots. For the
North Carolina experiment, one replicate treatment core and one supplementary sediment
core for each sediment type were removed at each sampling time: 6 months (December
2007), 12 months (June 2008), and 15 months (September 2008) (18 cores per sampling
month per site).
Virginia Seed Viability and Sediment Cores
Virginia treatments and sediment cores were identical to the North Carolina cores
except that sediment and seeds were collected from Z. marina beds in the lower York
River. The Virginia experimental treatments also compared the effects of seed source,
sediment type, site, and time on sediment seed-bank viability. However, Virginia seed
source treatments did not differ in reproductive strategy as both sources were derived
from known perennial populations. Seeds collected from CB1 were exposed to a site
characterized by sandy sediments (Buzzelli, 1998) where seeds from CB2 were collected
from a site characterized by silt-clay dominated sediments (Hobbs, 1994; Jarvis Chapter
4). Experimental treatments in the Virginia cores consisted of perennial seeds collected
from sandy sites in sand sediments, perennial seeds collected from sandy sites in mud
sediments, perennial seeds from muddy sites in sand sediments, and perennial seeds from
muddy sites in mud sediments. As with the North Carolina sites, three 2 m2 plots were
established at each Virginia site and one replicate set of treatment and sediment cores
were collected after 6 months (January 2008), 12 months (June 2008), and 15 months
(September 2008).

72
Treatment Core Collection and Ambient Seed-bank Characterization
All collected experimental cores were wet sieved (0.5 mm mesh) to remove all
sediment. Seeds (intact seed coat) and seed coats (seed coat split open with missing
embryo) were collected and counted. Intact seeds were tested for viability using
tetrazolium staining as described previously.
To quantify the total density and viability of the ambient seed-bank, five
additional cores (10 cm diameter, 10 cm length) were also collected within a 2 m2 area
around the plots at each site. Ambient seed-bank cores were processed identically to the
treatment cores. Total seed density, viability of the seed-bank, and the changes in seed
viability were quantified.
Ambient Site Characterization
To characterize ambient sediments at each site six additional ambient sediment
cores (4 cm diameter, 10 cm length) were collected from within a 2 m area immediately
surrounding each plot. Day time vertical redox (Eh) profiles were quantified for the
remaining experimental and sediment cores with a 21 cm platinum electrode. The probe
was inserted into the top of the core and redox was measured at 0.0, 0.5, 1.0, 1.5, 2.0, 3.0,
4.0, 6.0, 8.0, and 10.0 cm. Final readings were corrected for temperature relative to the
reference electrode (Hinchey and Schaffner, 2005). Following redox analysis, each
experimental sediment only core and three of the ambient sediment cores were cut into
sections at 3 cm and 6 cm depths all sections were then halved. The first section was
analyzed for organic content and the second half was analyzed for sediment exchangeable
73
nutrients as described previously. Although samples were collected during each
sampling date, percent sand/silt/clay analysis was only completed on the initial samples.
Water temperature (ºC), salinity (PSS), and dissolved oxygen (mg l-1) were
measured with a Yellow Spring Instruments, Inc. (YSI, Inc., Yellow Spring, Ohio) model
650 sonde at each site during each core sampling. In addition, three water samples were
collected, filtered (Gelman Supor, 0.45 µm), and frozen until analyzed for DIN and DIP
with a Lachat auto analyzer (Liao 2001, revised 2002; Knepel and Bogren 2001, revised
2002; Smith and Bogren 2001, revised 2002). The remaining water samples were filtered
and analyzed for chlorophyll a (Strickland and Parson, 1972) and total suspended solids
(TSS). TSS was quantified from a well-mixed sample of known volume. The sample
was filtered through a GF/F filter and the residue retained on the filter was dried to
constant weight at 103 – 105º C and reported as mg total suspended solids l-1.
Data Analysis
Prior to the beginning of the experiments a set of models was developed to
describe the relationship between seed viability, seed source, time, sediment type, and
site (Table 2-1). In addition, a second set of models was derived to describe the
relationship between time, site and the total density and the proportion of viable of seeds
in the ambient, sediment seed-bank at each site (Table 2-1). The models were used for
both North Carolina and Virginia treatments, although all experimental and sediment
seed-bank data were analyzed separately. For all analyses it was assumed that viability
of one seed did not significantly affect the viability of surrounding seeds (Orth et al.,

74
2003). Therefore, each seed was considered an independent Bernoulli trial and analyzed
separately.
Experimental core seed viability data were analyzed using logistic regression with
time, seed source, sediment type, and site as factors (PROC GENMOD; SAS Institute
Inc.; Scott et al., 1984). Logistic regression was selected due to the binary response
variable, the large number of observations (600 per treatment), and low number of viable
seeds throughout the course of the experiment. Site seed-bank viability was also
analyzed using logistic regression with time and site as factors.
To compare differences between the total numbers of seeds in the sediment seed-
bank at each site, the data were analyzed using negative binomial regression with time
and site as factors (PROC GENMOD: SAS Insititute Inc.; Allison, 1999). Negative
binomial regression was selected due to the discrete highly skewed nature of the ambient
seed-bank data for all sites (Allison, 1999).
To determine the best fitting model the second-order Akaike Information
Criterion (AICc) was calculated using log likelihood ratios derived from all regression
analyses (Burnham and Anderson, 2002). AICc differences (Δi) between all models were
then calculated and the models were ranked. The model with the smallest Δi was selected
as the best fitting model. For all significant (p < 0.05) model terms, odds ratios were
calculated using Wald chi square statistics (SAS; SAS Institute Inc). Likelihood ratio
tests for all parameter estimates were also calculated and compared to the Wald Chi
Square Statistics (Allison, 1999).
Differences in sediment organic content and sediment exchangeable nutrients
between sediment types, sites, and over time were analyzed with nonparametric statistics

75
as the data were non-normally distributed (Kruskal-Wallis and Kolmogorov-Smirnov
Tests; The SAS System for Windows, SAS Institute Inc.). A three-way Analysis of
Variance (ANOVA) was used to compare the effects of time, sediment type, site and the
interactions of these factors on redox measurements. All post hoc analyses of the data
were preformed with Tukey’s HSD test (Tukey’s Test; The SAS System for Windows,
SAS Institute Inc.).
Results
Sediment Characteristics
For both the North Carolina and Virginia site characterizations, all sediment
characterization data, except for redox measurements, were averaged across dates and
depths and presented as mean values per site ± standard errors (Table 2-2).
North Carolina Ambient Sediment Characteristics
Site was the only factor that significantly affected ambient sediment organic
matter (p < 0.001), ambient porewater dissolved inorganic nitrogen concentrations
(p = 0.031), and ambient sand/silt/clay ratios (p = 0.005) in North Carolina sediments.
Sediment percent organic matter concentrations, NH4+ concentrations, and silt/clay ratios
were significantly greater at NC1 than NC2. However, PO4-3 concentrations did not
differ significantly with site (p = 0.446). Ambient organic content, porewater nutrients,
and percent sand, silt, and clay did not differ significantly with depth (% organic p =
0.999; NH4+ = 0.260; PO4
-3 = 0.260; sand, silt, and clay p = 0.446) or over time (%
organic p = 0.790; NH4+ = 0.453; PO4
-3 p = 0.470) at either North Carolina site. North

76
Carolina site sediment redox profiles did not differ significantly between sites (p = 0.060)
or over time (p = 0.071) but there was a significant difference with depth (p = 0.014).
Post hoc analysis with Tukeys HSD test indicated a significant difference in redox levels
between 0 cm and all other depths; between 0.5 cm and depths greater than 1.5 cm; and
between 1.0 cm and depths greater than 3.0 cm for both sites (Figure 2-2). Redox levels
were more reduced with depth until 3 cm where they became constant to a depth of 10
cm.
Virginia Ambient Sediment Characteristics
Virginia site sediments showed similar trends to the North Carolina sites with
ambient sediment organic content (p < 0.001), sediment nutrients (NH3+ p < 0.001; PO4
-3
p = 0.019), and sand/silt/clay ratios (p = 0.005) all significantly affected by site. Organic
content, NH3+ concentrations, and silt clay ratios were greater at CB than CB2 (Table 2-
2). In addition, Virginia site percent organic matter and sediment exchangeable nutrient
concentrations did not differ significantly with depth (% organic p = 0.999; NH3+ p =
0.446; PO4- p = 0.774) or over time (% organic p = 0.901; NH3
+ p = 0.303). Virginia
sediment PO4-3 did differ significantly with date (p = 0.001) however levels were near
0 µM. For the Virginia sites redox profiles were significantly different between sites
(p < 0.001) and dates (p < 0.001). There was also a significant site by date interaction
(p < 0.001). Redox conditions were more reduced during the summer sampling periods
at CB1 compared to CB2 (Figure 2-2). While redox was not significantly different
between depths (p = 0.077) post hoc analysis with Tukey’s HSD test indicates that redox
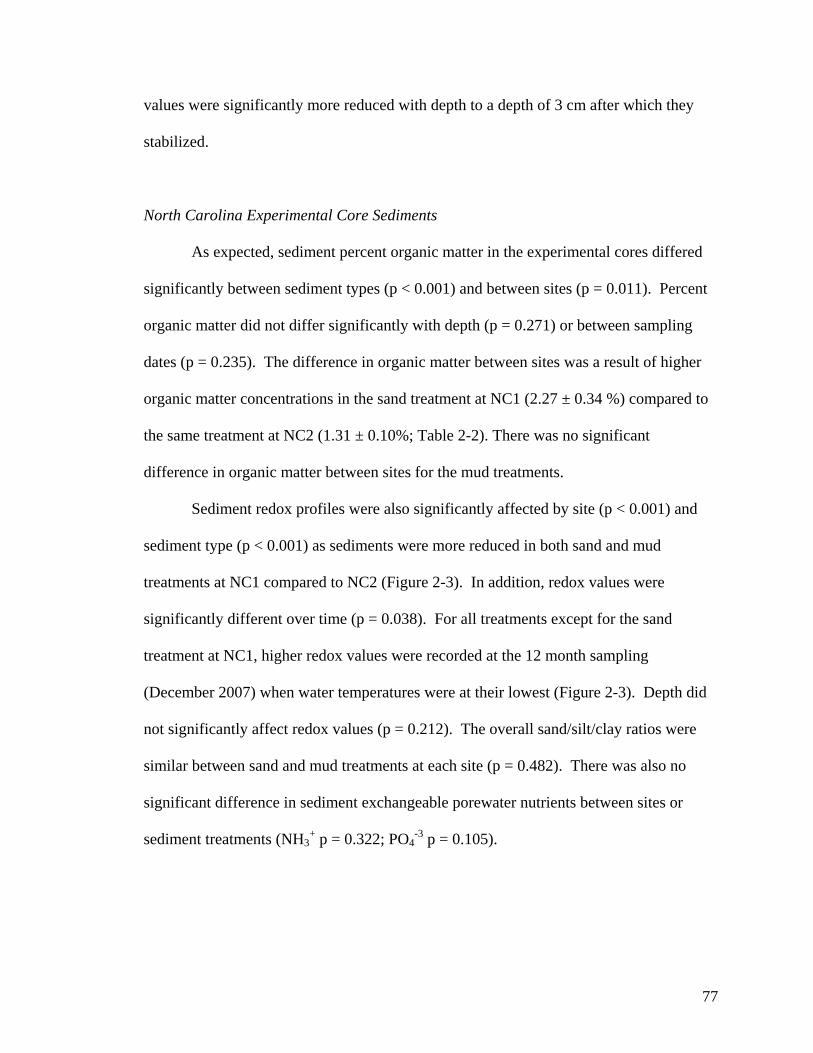
77
values were significantly more reduced with depth to a depth of 3 cm after which they
stabilized.
North Carolina Experimental Core Sediments
As expected, sediment percent organic matter in the experimental cores differed
significantly between sediment types (p < 0.001) and between sites (p = 0.011). Percent
organic matter did not differ significantly with depth (p = 0.271) or between sampling
dates (p = 0.235). The difference in organic matter between sites was a result of higher
organic matter concentrations in the sand treatment at NC1 (2.27 ± 0.34 %) compared to
the same treatment at NC2 (1.31 ± 0.10%; Table 2-2). There was no significant
difference in organic matter between sites for the mud treatments.
Sediment redox profiles were also significantly affected by site (p < 0.001) and
sediment type (p < 0.001) as sediments were more reduced in both sand and mud
treatments at NC1 compared to NC2 (Figure 2-3). In addition, redox values were
significantly different over time (p = 0.038). For all treatments except for the sand
treatment at NC1, higher redox values were recorded at the 12 month sampling
(December 2007) when water temperatures were at their lowest (Figure 2-3). Depth did
not significantly affect redox values (p = 0.212). The overall sand/silt/clay ratios were
similar between sand and mud treatments at each site (p = 0.482). There was also no
significant difference in sediment exchangeable porewater nutrients between sites or
sediment treatments (NH3+ p = 0.322; PO4
-3 p = 0.105).

78
Virginia Experimental Core Sediments
Sediment percent organic matter in the experimental cores differed significantly
between sediment types (p < 0.001) but did not differ significantly between sites
(p = 0.079) with depth (p = 0.810) or between sampling dates (p = 0.654). Sediment
redox profiles were also significantly affected by site (p < 0.001) and sediment type
(p < 0.001) as sediments were more reduced in both sand and mud treatments at CB1
compared to CB2 (Figure 2-4). In addition, redox values were significantly different
over time (p < 0.001) and depth (p < 0.001) and there were significant time and site
interactions (p < 0.001) and time depth interactions (p < 0.001). Redox values were
significantly different between all sampling dates with the most reduced values recorded
in August 2007 (Figure 2-4). Surface redox values (0 cm) were significantly less reduced
than all sediment redox values. Redox recorded at depths greater than 3 cm were
significantly lower than redox values between 0.5 and 2 cm.
The percentage of clay in the sediments was similar between sites (p = 0.461);
however percent sand was significantly greater at CB2 (p = 0.032) and percent silt was
significantly greater at CB1 (p = 0.032). Sediment exchangeable porewater PO4-3 was
significantly greater (p = 0.040) in CB1 core sediments than CB2; however for both sites
PO4-3 values were less than 1 µM (Table 2-2). There was no significant difference
between sediment porewater NH3+ (p = 0.959) between sites. There was also no
significant difference in sediment exchangeable porewater nutrients between sediment
treatments (NH3+ p = 0.305; PO4
-3 p = 0.999).
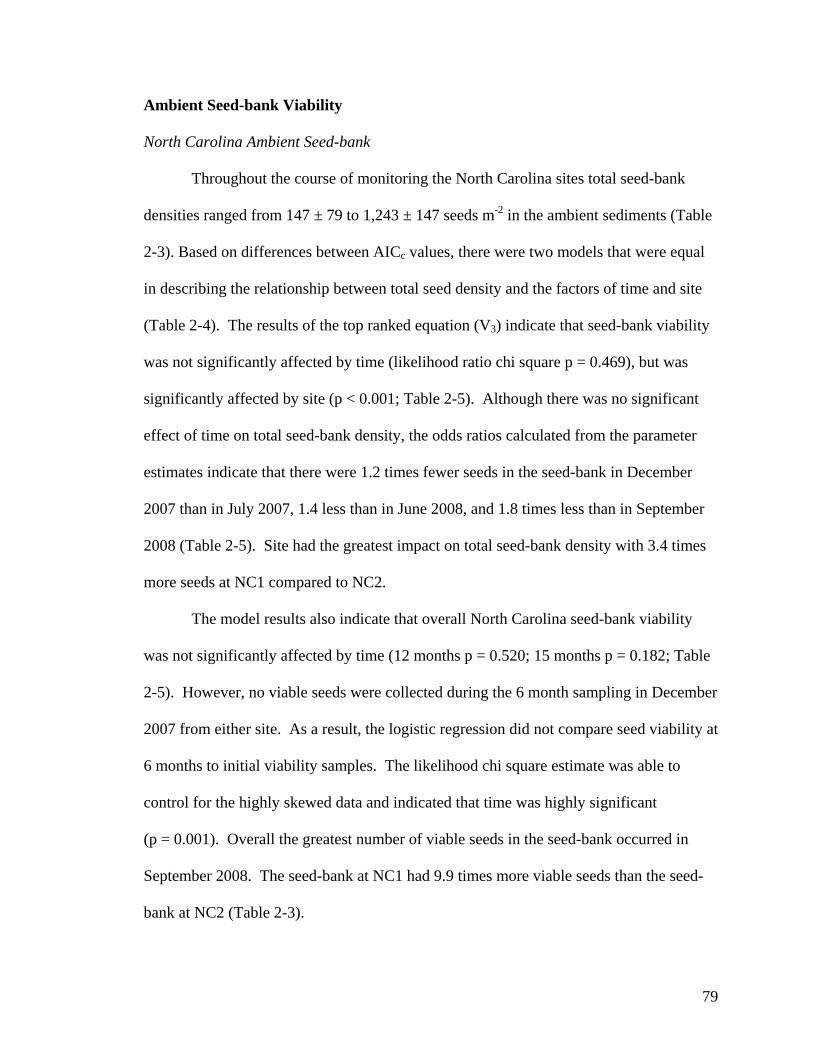
79
Ambient Seed-bank Viability
North Carolina Ambient Seed-bank
Throughout the course of monitoring the North Carolina sites total seed-bank
densities ranged from 147 ± 79 to 1,243 ± 147 seeds m-2 in the ambient sediments (Table
2-3). Based on differences between AICc values, there were two models that were equal
in describing the relationship between total seed density and the factors of time and site
(Table 2-4). The results of the top ranked equation (V3) indicate that seed-bank viability
was not significantly affected by time (likelihood ratio chi square p = 0.469), but was
significantly affected by site (p < 0.001; Table 2-5). Although there was no significant
effect of time on total seed-bank density, the odds ratios calculated from the parameter
estimates indicate that there were 1.2 times fewer seeds in the seed-bank in December
2007 than in July 2007, 1.4 less than in June 2008, and 1.8 times less than in September
2008 (Table 2-5). Site had the greatest impact on total seed-bank density with 3.4 times
more seeds at NC1 compared to NC2.
The model results also indicate that overall North Carolina seed-bank viability
was not significantly affected by time (12 months p = 0.520; 15 months p = 0.182; Table
2-5). However, no viable seeds were collected during the 6 month sampling in December
2007 from either site. As a result, the logistic regression did not compare seed viability at
6 months to initial viability samples. The likelihood chi square estimate was able to
control for the highly skewed data and indicated that time was highly significant
(p = 0.001). Overall the greatest number of viable seeds in the seed-bank occurred in
September 2008. The seed-bank at NC1 had 9.9 times more viable seeds than the seed-
bank at NC2 (Table 2-3).

80
V3 was selected as the representative equation to describe total seed-bank density
in North Carolina (Table 2-4). While this equation does not take the effects of time into
account, the effects of site on total seed-bank density were also highly significant
(p < 0.001; Table 2-5). Odds ratios indicate that there were 3.6 times more seeds in the
NC1 sediment seed-bank compared to the NC2 seed-bank.
Virginia Ambient Seed-bank
The ambient seed-bank in both Virginia sites was severely depleted through out
the entire monitoring period (Table 2-3). No seeds were found in either site in the
August 2007, January 2008, and July 2008 samples. Seeds were only found in the CB1
sediment seed-bank in October of 2008. Between all cores collected at both Virginia
sites 10 seeds total were collected. Based on the extremely low number of seeds
collected from the ambient sediment seed-bank, no analysis could be done on either total
seed densities or on seed-bank viability.
Seed Viability Experiments
North Carolina Experimental Seed Cores
North Carolina seed viability was best described by the relationship among time,
site, sediment, seed source and the individual interactions between time and all other
factors (V15; Table 2-3). For all experimental seed viability data, site refers only to the
location of the cores. Viability of North Carolina seeds in the experimental cores
decreased significantly with increasing time in the sediment (likelihood chi square
estimate p < 0.001; Figure 2-5). The effect of time on the density of viable seeds
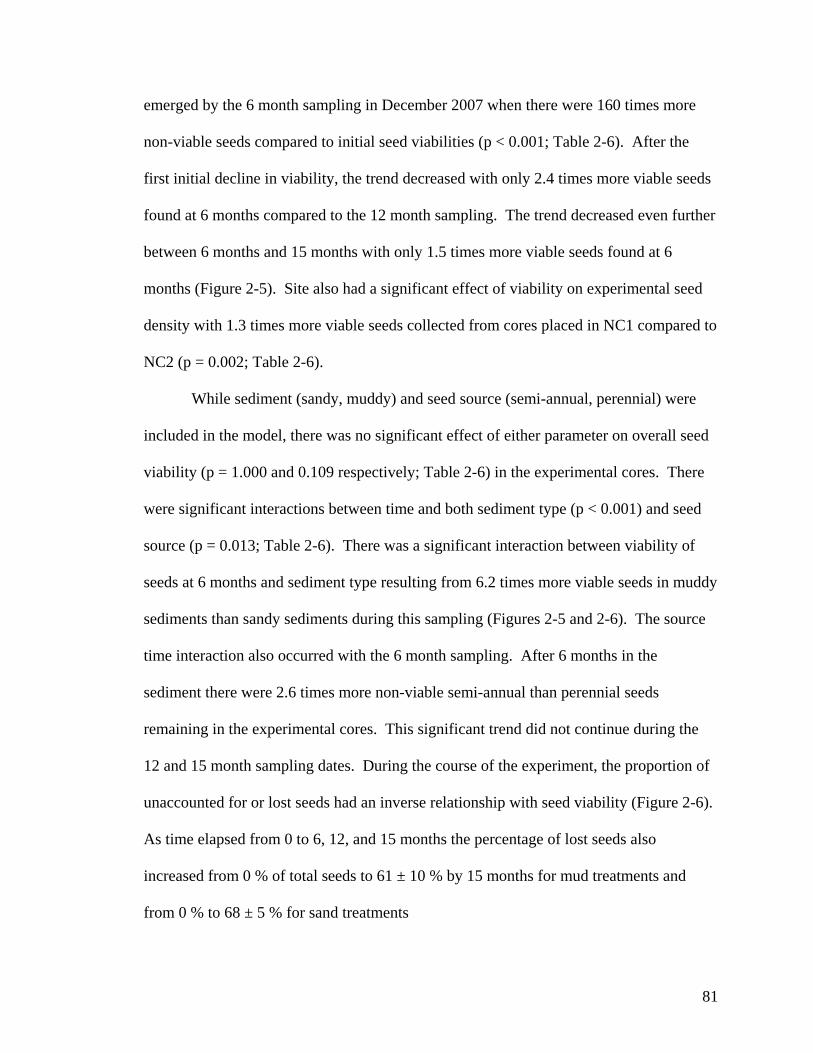
81
emerged by the 6 month sampling in December 2007 when there were 160 times more
non-viable seeds compared to initial seed viabilities (p < 0.001; Table 2-6). After the
first initial decline in viability, the trend decreased with only 2.4 times more viable seeds
found at 6 months compared to the 12 month sampling. The trend decreased even further
between 6 months and 15 months with only 1.5 times more viable seeds found at 6
months (Figure 2-5). Site also had a significant effect of viability on experimental seed
density with 1.3 times more viable seeds collected from cores placed in NC1 compared to
NC2 (p = 0.002; Table 2-6).
While sediment (sandy, muddy) and seed source (semi-annual, perennial) were
included in the model, there was no significant effect of either parameter on overall seed
viability (p = 1.000 and 0.109 respectively; Table 2-6) in the experimental cores. There
were significant interactions between time and both sediment type (p < 0.001) and seed
source (p = 0.013; Table 2-6). There was a significant interaction between viability of
seeds at 6 months and sediment type resulting from 6.2 times more viable seeds in muddy
sediments than sandy sediments during this sampling (Figures 2-5 and 2-6). The source
time interaction also occurred with the 6 month sampling. After 6 months in the
sediment there were 2.6 times more non-viable semi-annual than perennial seeds
remaining in the experimental cores. This significant trend did not continue during the
12 and 15 month sampling dates. During the course of the experiment, the proportion of
unaccounted for or lost seeds had an inverse relationship with seed viability (Figure 2-6).
As time elapsed from 0 to 6, 12, and 15 months the percentage of lost seeds also
increased from 0 % of total seeds to 61 ± 10 % by 15 months for mud treatments and
from 0 % to 68 ± 5 % for sand treatments

82
Virginia Experimental Seed Cores
During the model selection process for the Virginia experimental seed-core
viability the top three models were rejected based on the negative of the Hessian not
being definitive. Therefore, the top four models reported here do not include those which
did not meet all requirements of the logistic regression model. The model used in
analysis of experimental core data included the parameters time, seed source, and the
interaction between time and seed source (Table 2-4). Sediment type and site were not
included in the top ranked model and therefore, were not included in any further analysis.
As with the North Carolina seeds, viability of Virginia seeds decreased with
increasing time in the sediment (likelihood ratio estimate p < 0.001; Figures 2-5 and 2-7).
Although there was no significant difference between seed viability at 6 months and
initial seed viabilities (p = 0.254; Table 2-6) seed viability had decreased from initial
viabilities of 42 % to 4 % by 6 months. The lack of significance may be a reflection of
the 0 % viability of seeds at 12 and 15 months. By 12 months seed viability decreased
significantly (p < 0.001) resulting in 86 times more non-viable seeds in the sediment
cores after 12 months compared to initial testing (Table 2-5). After 15 months, the
number of viable seeds in the experimental cores was low enough and the data were
skewed so that the odds ratio could not be calculated, although seed viability was
significantly lower compared to initial seed viability (p < 0.001).
Although seed source was included in the model, there was no significant effect
of seed source on experimental seed viability (p = 1.000; Table 2-5). There was a
significant interaction between time and seed source on seed viability (p < 0.001). Seeds
collected from CB2 (the high energy sandy site) were 13.8 times more viable than seeds
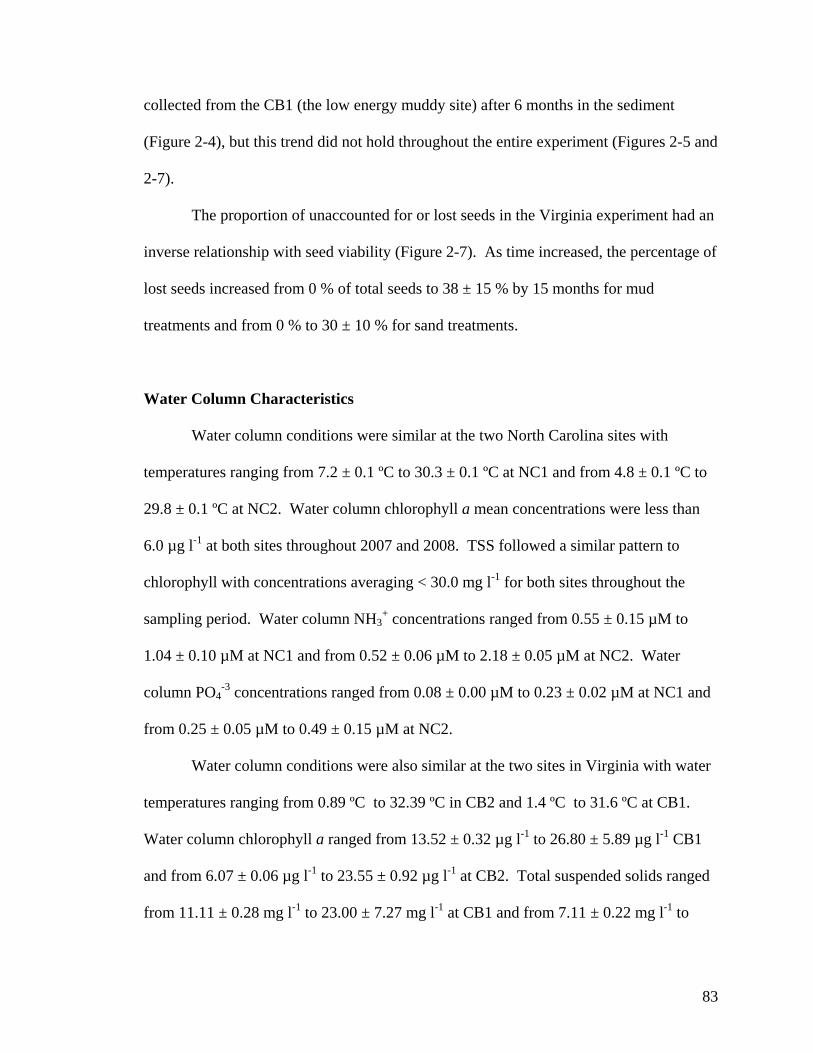
83
collected from the CB1 (the low energy muddy site) after 6 months in the sediment
(Figure 2-4), but this trend did not hold throughout the entire experiment (Figures 2-5 and
2-7).
The proportion of unaccounted for or lost seeds in the Virginia experiment had an
inverse relationship with seed viability (Figure 2-7). As time increased, the percentage of
lost seeds increased from 0 % of total seeds to 38 ± 15 % by 15 months for mud
treatments and from 0 % to 30 ± 10 % for sand treatments.
Water Column Characteristics
Water column conditions were similar at the two North Carolina sites with
temperatures ranging from 7.2 ± 0.1 ºC to 30.3 ± 0.1 ºC at NC1 and from 4.8 ± 0.1 ºC to
29.8 ± 0.1 ºC at NC2. Water column chlorophyll a mean concentrations were less than
6.0 µg l-1 at both sites throughout 2007 and 2008. TSS followed a similar pattern to
chlorophyll with concentrations averaging < 30.0 mg l-1 for both sites throughout the
sampling period. Water column NH3+ concentrations ranged from 0.55 ± 0.15 µM to
1.04 ± 0.10 µM at NC1 and from 0.52 ± 0.06 µM to 2.18 ± 0.05 µM at NC2. Water
column PO4-3 concentrations ranged from 0.08 ± 0.00 µM to 0.23 ± 0.02 µM at NC1 and
from 0.25 ± 0.05 µM to 0.49 ± 0.15 µM at NC2.
Water column conditions were also similar at the two sites in Virginia with water
temperatures ranging from 0.89 ºC to 32.39 ºC in CB2 and 1.4 ºC to 31.6 ºC at CB1.
Water column chlorophyll a ranged from 13.52 ± 0.32 µg l-1 to 26.80 ± 5.89 µg l-1 CB1
and from 6.07 ± 0.06 µg l-1 to 23.55 ± 0.92 µg l-1 at CB2. Total suspended solids ranged
from 11.11 ± 0.28 mg l-1 to 23.00 ± 7.27 mg l-1 at CB1 and from 7.11 ± 0.22 mg l-1 to

84
38.98 ± 7.41 mg l-1 at CB2. Water column nutrients were generally low at both sites.
Concentrations of NH3+ ranged from 0.24 ± 0.02 µM to 4.92 ± 0.79 µM at CB2 and from
0.80 ± 0.05 µM to 4.79 ± 0.45 µM at CB1. Water column PO4- concentrations ranged
from 0 ± 0 µM to 0.36 ± 0.01 µM at CB2 and from 0.21 ± 0.02 µM to 0.39 ± 0.09 µM at
CB1.
Discussion
Based on the results of the in situ experiments and ambient seed-bank monitoring,
semi-annual and perennial Zostera marina beds in North Carolina and perennial beds in
Virginia produce transient (seeds remain viable less than 12 months in the sediment)
seed-banks. Viability of all seed sources in both the Virginia and North Carolina in situ
core experiments were reduced significantly after only 6 months in the sediment and
were further reduced to < 5 % of initial viability by 15 months. These results are similar
to the trends in the ambient data where both semi-annual and perennial NC ambient seed-
bank viability decreased from 10 to 33 % depending on site in July 2007 to 0 % for all
sites in December 2007. The loss of seed viability monitored for all seed sources and
recorded at all sites presented here support experimental laboratory results which
concluded that Z. marina seeds do not remain viable in water for longer than 11 months
(McMillan, 1983; Harrison, 1991; Moore et al., 1993). Therefore, the loss of viability of
perennial and semi-annual Z. marina seeds appears similar in both water and sedimentary
environments.
Time was the only factor that significantly affected seed viability in both North
Carolina and Virginia seeds in both the in situ field experiments and in the ambient seed-
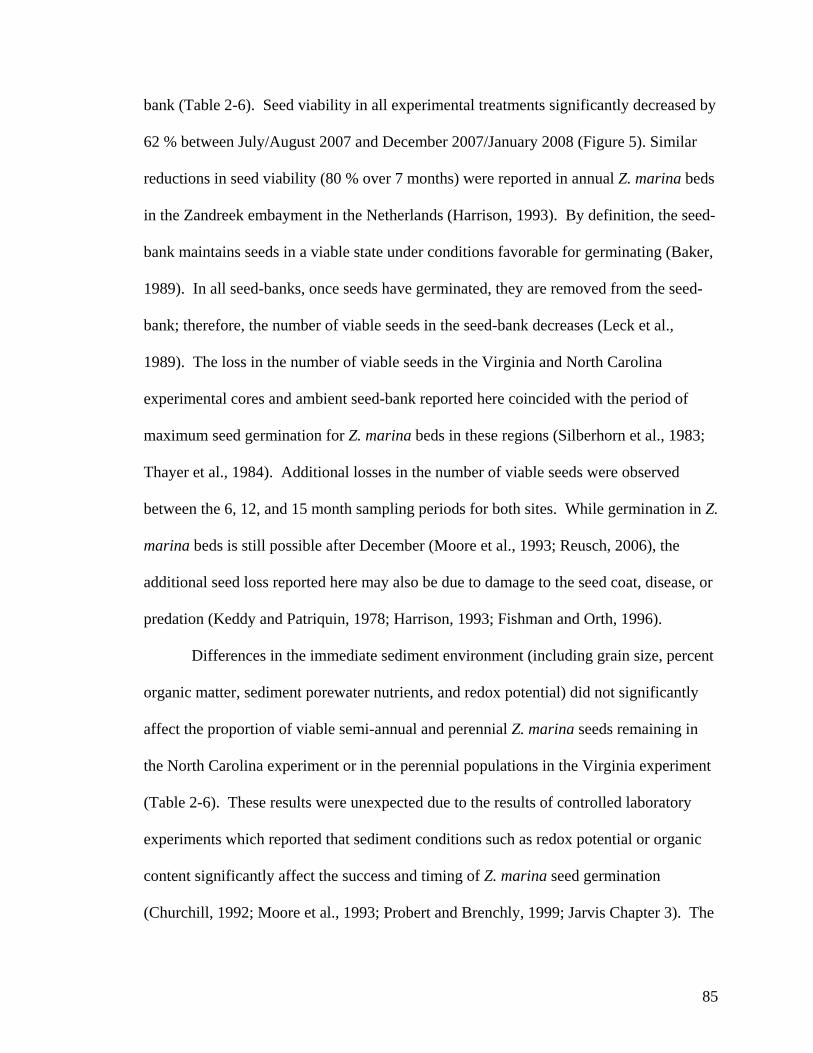
85
bank (Table 2-6). Seed viability in all experimental treatments significantly decreased by
62 % between July/August 2007 and December 2007/January 2008 (Figure 5). Similar
reductions in seed viability (80 % over 7 months) were reported in annual Z. marina beds
in the Zandreek embayment in the Netherlands (Harrison, 1993). By definition, the seed-
bank maintains seeds in a viable state under conditions favorable for germinating (Baker,
1989). In all seed-banks, once seeds have germinated, they are removed from the seed-
bank; therefore, the number of viable seeds in the seed-bank decreases (Leck et al.,
1989). The loss in the number of viable seeds in the Virginia and North Carolina
experimental cores and ambient seed-bank reported here coincided with the period of
maximum seed germination for Z. marina beds in these regions (Silberhorn et al., 1983;
Thayer et al., 1984). Additional losses in the number of viable seeds were observed
between the 6, 12, and 15 month sampling periods for both sites. While germination in Z.
marina beds is still possible after December (Moore et al., 1993; Reusch, 2006), the
additional seed loss reported here may also be due to damage to the seed coat, disease, or
predation (Keddy and Patriquin, 1978; Harrison, 1993; Fishman and Orth, 1996).
Differences in the immediate sediment environment (including grain size, percent
organic matter, sediment porewater nutrients, and redox potential) did not significantly
affect the proportion of viable semi-annual and perennial Z. marina seeds remaining in
the North Carolina experiment or in the perennial populations in the Virginia experiment
(Table 2-6). These results were unexpected due to the results of controlled laboratory
experiments which reported that sediment conditions such as redox potential or organic
content significantly affect the success and timing of Z. marina seed germination
(Churchill, 1992; Moore et al., 1993; Probert and Brenchly, 1999; Jarvis Chapter 3). The
86
lack of a sediment effect may have been an artifact of the sampling methodology. Moore
et al. (1993) reported that seed germination occurred earlier in Z. marina seeds held under
anoxic conditions than seeds under oxygenated conditions; however, after an extended
period of time, seed germination did occur in the oxygenated treatments. By not
sampling throughout the period of maximum germination, any sediment effects due to
removal of viable seeds from the seed-bank via germination may have been missed.
While sampling in 6 month intervals provided information on the type of seed-bank Z.
marina beds produce (transient or persistent), research with finer temporal sampling
schemes may be required to gain a more comprehensive understanding of sediment
effects on semi-annual and perennial seed-bank viability.
Surprisingly, seed source did not have a significant effect on seed viability in
either the North Carolina or Virginia experimental treatments (Table 2-6). These results
were unexpected due to the reliance of annual and semi-annual beds on seeds for bed re-
establishment on a yearly basis (Harper, 1977; Keddy and Patriquin, 1978; Phillips et al.,
1983; Santamaría-Gallegos et al., 2000; Jarvis Chapter 1). While seeds from semi-annual
beds were not significantly more viable than perennial seeds, there were significantly
greater densities of seeds in the semi-annual compared to perennial site seed-banks
(Table 2-3). Similar ambient seed-bank densities were reported for perennial (0 – 1,200
seeds m-2) and annual (1,300 – 30,000 seeds m-2) Z. marina populations throughout the
species geographic range (Harrison, 1993; Harwell and Orth, 2002; Lee et al., 2007;
Mortia et al., 2007). Greater densities in semi-annual compared to perennial seed-banks
may be the result of increased seed production (up to seven times greater) in semi-annual
compared to perennial beds (Keddy, 1987; Jarvis Chapter 1). Greater seed abundances

87
within the semi-annual Z. marina bed would increase the ability of the bed to re-establish
on a yearly basis from seed (Inglis, 2000). Therefore by maintaining similar seed
viabilities to perennial populations and producing significantly greater numbers of seeds,
semi-annual Z. marina populations may have a greater regeneration potential from the
seed-bank than perennial beds.
Viable seeds were only collected from Virginia seed-banks in October 2008. Low
seed-bank densities in 2007 may be related to a large scale decline of Z. marina in the
lower Chesapeake Bay in the summer of 2005 (Moore and Jarvis, 2008). Although cover
and vegetative shoot density recovered to pre-decline levels at CB2 and to a lesser extent
at CB1 by 2007 (Jarvis, Chapter 4), average reproductive shoot density was reduced to
less than 1 % of total shoot density at both sites. Historically within this region,
reproductive shoot densities range between 11 to 19 % of total shoot density (Silberhorn
et al., 1983). Reduced flowering in 2007 would have limited seed-bank replenishment
which may have resulted in non-viable seed-banks throughout the 2007 sampling period.
Interestingly, seeds were collected from the CB2 sediment seed-bank in October 2008
and not in the July 2008 samples (Table 2-3). Although the collection of ambient seed-
bank characterization samples was designed to represent the seed-bank during that
sampling period, seed-banks are hard to quantify due to their inherent spatial
heterogeneity (Harwell and Orth, 2002). In addition, seed-banks are not static
environments and seeds are deposited and removed throughout the year (Leck et al.,
1989). Seeds collected in the October 2008 sampling may have been introduced into the
sediment seed-bank from rafting reproductive shoots after the July sampling. (Källström

88
et al., 2008). Regardless of the mechanism for which seeds were introduced into CB
sediment seed-banks in 2007 and 2008 overall viable seed densities were extremely low.
The lack of long term viability in seed-banks could have a significant impact on
the resilience of Z. marina populations to disturbance (Keddy and Patriquin, 1978; Plus et
al., 2003; Greve et al., 2005). Perennial populations primarily rely on asexual
reproduction for bed maintenance and expansion into nearby areas (Olsen, 1994; Olsen,
2004; Inglis, 2000). However, when the majority of above-ground biomass is removed
from the bed due, for example, to anoxic conditions (Plus et al., 2003; Greve et al., 2005),
high summer water temperatures (Moore and Jarvis, 2008), or by increased light
attenuation from a large scale algae bloom (Lee et al., 2007) sexual reproduction in the
form of seed germination from the seed-bank provides the recovery mechanism. Z.
marina seedlings in biennial life history beds do not flower during their first growing
season (Setchell, 1929; den Hartog, 1970; Silberhorn et al., 1983); therefore, the sediment
seed-bank is not replenished for at least one year post decline and the resiliency provided
by the seed-bank may be lost (Jarvis Chapter 4). Long term persistence of perennial Z.
marina beds may be reduced by fewer viable seeds in the sediment seed-bank if there are
consecutive years of disturbance.
Semi-annual beds may not be as susceptible to multiple consecutive years of
disturbance events as perennial beds due to the ability of seedlings to flower and
replenish sediment seed-banks on a yearly basis. However, semi-annual beds still
produce transient seed-banks; therefore, the timing of disturbance events may be
extremely important. Z. marina seed viability is reduced after the period of maximum
germination and the seed-bank is not replenished until the following late spring/early
89
summer after seeds are released from flowering shoots (Silberhorn et al., 1983; Thayer et
al., 1984). During this time period seedlings have germinated and seed-bank viability is
at a low level. If a large scale disturbance, resulting in the reduction of above ground
biomass, occurs before seedlings are able to flower, the sediment seed-bank is reduced
and the recovery of the semi-annual bed may be limited. As large storms are predicted to
increase in frequency and intensity and global water temperatures continue to rise
(Najjar, 1999; Gibson and Najjar, 2000), Z. marina beds may be under increasingly
stressful conditions and their resilience to disturbance may be limited by the transient
nature of seed-banks.
Conclusions
While the results presented here indicate that both perennial and semi-annual Z.
marina populations in North Carolina and Virginia produced transient viable sediment
seed-banks the environmental and physiological factors that affect seed viability are still
unclear. Research into the effect of time on both semi-annual and perennial Z. marina
seed viability over finer time scales (< 6 months) is required to gain a better
understanding of the effect of sediment composition on seed viability. In addition, future
research directly comparing the regional difference in seed density and viability between
Z. marina populations is required to fully understand sediment seed-bank dynamics
within these valuable ecosystems.
90
Literature Cited
Ackerman, J.D. 2006. Sexual reproduction in seagrasses: Pollination in the marine context. In: Larkum AWD, Orth RJ, Duarte CM eds. Seagrasses: Biology, Ecology, and Conservation. pp 89-109. Allison, P.D. 1999. Logistic Regression Using the SAS System : Theory and Application. Cary NC, SAS Institute Inc. Association of Official Seed Analysts. 1981. Rules for testing seeds. Journal of Seed Technology 6(2): 1-126. Baker, H.G. 1989. Some aspects of the natural history of seed-banks. In: Leck, M.A., V.T. Parker, and R.L. Simpson eds. Ecology of Soil Seed-banks. Academic Press, Inc. San Diego, USA. pp 9-21. Baskin, C.B. and J. Baskin. 1998. Ecologically Meaningful Germination Studies. In Seeds: Ecology, Biogeography, and Evolution of Dormancy and Germination. Academic Press, London. pp 5-26. Bell, S.S., M.S. Fonseca, and W.J. Kenworthy. 2008. Dynamics of a subtropical seagrass landscape: links between disturbance and mobile seed-banks. Landscape Ecology 23: 67-74. Burnham, K.P. and D.R. Anderson. 2002. Model Selection and multimodel inference: a practical information-theoretic approach; Second Edition. Springer Science and Business Media Inc. New York, NY. pp 488. Buzzelli CP. 1998. Dynamic simulation of littoral zone habitats in lower Chesapeake Bay. I. Ecosystem characterization related to model development. Estuaries 21(4B): 659-672.
Churchill, A.C. 1992. Growth characteristics of Zostera marina seedlings under anaerobic conditions. Aquatic Botany 43: 379-392. Conacher, C.A., I.R. Poiner, J. Butler, S. Pun and D.J. Tree. 1994. Germination, storage and viability testing of seeds of Zostera capricorni Aschers. from a tropical bay in Australia. Aquatic Botany. 49(1): 47-58. den Hartog C. 1970. The Sea-Grasses of the World. North-Holland, Amsterdam. Erftemeijer P.L.A. and E.W. Koch. 2001. Sediment geology methods for seagrass habitat. In Global Seagrass Research Methods. Short FT and Coles RG (eds). Elsevier Science B.V., Amsterdam pp 345-367.
91
Figureola, J., A.G. Green, and L. Santamaria. 2002. Comparative dispersal effectiveness of widgeon grass seeds by waterfowl wintering in southwest Spain: quantitative and qualitative aspects. Journal of Ecology 90: 989-1001. Fishman, J.R. and R.J. Orth. 1996. Effects of predation on Zostera marina L. seed abundance. Journal of Experimental Marine Biology and Ecology 198: 11-26. Gibson, J.R. and R.G. Najjar. 2000. The response of Chesapeake Bay salinity to climate- induced changes in stream flow. Limnology and Oceanography 45(8): 1764-1772. Green, E.P. and F.T. Short. 2003. World Atlas of Seagrasses. Prepared by the UNEP World Conservation Monitoring Centre. University of California Press. Berkley, USA. pp 1-298. Greve T.M., D. Krause-Jensen, M.B. Rasmussen, and P.B. Christensen. 2005. Means of rapid eelgrass (Zostera marina L.) recolonization in former dieback areas. Aquatic Botany 82: 143-156. Hammerstrom, K.K., W.J. Kenworthy, M.S. Fonseca, and P.E. Whitfield. 2006. Seed-
bank, biomass, and productivity of Halophila decipiens, a deep water seagrass on the west Florida continental shelf. Aquatic Botany 84: 110–120.
Harley, C.D.G., A.R. Hughes, K.M. Hultgren, B.G. Miner, C.J.B. Sorte, C.S. Thornber, L. F. Rodriguez, L. Tomanek, and S. L. Williams. 2006. The impacts of climate change in coastal marine systems. Ecology Letters 9: 228-241. Harper, J.L. 1977. Population Biology of Plants. Academic Press, London, UK. Harrison P.G. 1991. Mechanisms of seed dormancy in an annual population of Zostera marina (eelgrass) from The Netherlands. Canadian Journal of Botany 69: 1972- 1976. Harrison, P.G. 1993. Variations in demography of Zostera marina and Z. noltii on an intertidal gradient. Aquatic Botany 45: 63-77. Harwell, M.C. and R.J. Orth. 2002. Seed-bank patterns in Chesapeake Bay eelgrass (Zostera marina L.): A bay-wide perspective. Estuaries 25(6): 1196-1204. Hemminga, M.A. and C.M. Duarte. 2000. Seagrass Ecology. Cambridge University Press. New York, USA.
Hinchey, E.K. and L.C. Schaffner. 2005. An evaluation of electrode insertion techniques for measurement of redox potential in estuarine sediments. Chemosphere 59: 703- 710.
92
Hobbs, C.H. III. 1994. York Estuary Sediments Data Report # 53. Special Report Virginia Institute of Marine Science. Gloucester Point, VA. pp 257. Hootsmans, M.J.M., J.E. Vermaat, and W. Van Vierssen. 1987. Seed-bank development, germination and early seedling survival of two seagrass species from the Netherlands: Zostera marina L. and Zostera noltii Hornem. Aquatic Botany 28: 275-285. Inglis, G.J. 2000. Disturbance-related heterogeneity in the seed-banks of a marine angiosperm. The Journal of Ecology 88(1): 88-99. Källström, B., A. Nyqvist, P. Åberg, M. Bodin, and C. André. 2008. Seed Rafting as a
dispersal strategy for eelgrass (Zostera marina). Aquatic Botany 88(2): 148-153. Keddy C.J. 1987. Reproduction of annual eelgrass: variation among habitats and
comparison with perennial eelgrass (Zostera marina L.). Aquatic Botany 27: 243-256.
Keddy C.J. and D.G. Patriquin. 1978. An annual from of eelgrass in Nova Scotia. Aquatic Botany 5: 163-170. Kenworthy, W.J. 1981. The interrelationship between seagrasses, Zostera marina and Halodule wrightii, and the physical and chemical properties of sediments in a mid-Atlantic coastal plain estuary near Beaufort, North Carolina (U.S.A.). M.S. Thesis University of Virginia, Charlottesville, pp 114. Knepel K and K. Bogren. 2001. Revised 2002. Determination of orthophosphate by flow
injection analysis. QuikChem Method 31-115-01-1-H. Lachat Instruments, Milwaukee, WI, USA.
Lakon G. 1949. The topographical tetrazolium method for determining the germinating capacity of seeds. Plant Physiology 24: 389-394. Leck, M.A., V.T. Parker, and R.L. Simpson. 1989. Ecology of Soil Seed-banks. Academic Press, Inc. Sand Diego, California, USA. Lee, K.S., J.I. Park, Y.K. Kim; S.R. Park, and J.H. Kim. 2007. Recolonization of Zostera marina following destruction caused by red tide algal bloom: the role of new shoot recruitment from seed-banks. Marine Ecology Progress Series 342: 105- 115. Liao N. 2001. Revised 2002. Determination of ammonia in brackish or seawater by flow
injection analysis. QuikChem Method 31-107-06-1-B. Lachat Instruments, Milwaukee, WI, USA.

93
McMillan, C. 1983. Seed germination for an annual from of Zostera marina from the Sea of Cortez, Mexico. Aquatic Botany 15: 217-220. Micheli, F., M.J. Bishop, C.H. Peterson, and J. Rivera. 2008. Alteration of seagrass species composition and function over two decades. Ecological Monographs 78(2): 225-244. Moore K.A., R.J. Orth, and J.F. Nowak. 1993. Environmental regulation of seed germination in Zostera marina L. (eelgrass) in Chesapeake Bay: Effects of light, oxygen, and sediment burial. Aquatic Botany 45(1): 79-91. Moore, K.A. and J.C. Jarvis. 2008. Environmental factors affecting recent summertime
eelgrass diebacks in the lower Chesapeake Bay: implications for long-term persistence. Journal of Coastal Research Special Issue 55: 135-147.
Morita, T., H. Okumura, M. Abe, A. Kurashima, and M. Maegawa. 2007. Density and distribution of seeds in bottom sediments in Zostera marina beds in Ago Bay, central Japan. Aquatic Botany 87: 38-42. Murdoch, A.J. and R.H. Ellis. 2000. Dormancy, viability and longevity. In, Fenner, M. (ed.), Seeds: The Ecology of Regeneration and Plant Communities, 2nd edition, pp. 183-214. CAB International, Wallingford, Oxon UK. Najjar, RG. 1999. The water balance of the Susquehanna River Basin and its response to climate change. Journal of Hydrobiologica 219(1-2): 7-19. Olsen, B. and K. Sand-Jensen. 1994. Patch dynamics of eelgrass (Zostera marina). Marine Ecology Progress Series 106: 147-156. Olsen B., N. Marba, C.M. Duarte, R.S. Savela, and M.D. Fortes. 2004. Recolonization dynamics in a mixed seagrass meadow: The role of clonal versus sexual processes. Estuaries 27(5): 770-780. Orth, R.J., M. Luckenbach, and K.A. Moore. 1994. Seed dispersal in a marine macrophyte: implications for colonization and restoration. Ecology 75(7): 1927- 1939. Phillips R., W.S. Grant, and C.P McRoy. 1983. Reproductive strategies of eelgrass (Zostera marina L.). Aquatic Botany 16:1-20. Plumb, R.H. Jr. 1981. Procedures for Handling and Chemical Analysis of Sediment and Water Samples. Technical Report EPA/CE-81-1. Prepared by Great Lakes Laboratory, State University College at Buffalo, Buffalo, NY for the U.S. Environmental Protection Agency/Corps of Engineers Technical Committee on Criteria for Dredged and Filled Material: Environmental Laboratory, U.S. Army Waterways Experiment Station, Vicksburg, MS. pp 403.
94
Plus M., J.M. Deslous-Paoli, and F. Dagault. 2003. Seagrass (Zostera marina L.) bed recolonization after anoxia-induced full mortality. Aquatic Botany 77:121-134. Preston, B.L. 2004. Observed winter warming of the Chesapeake Bay Estuary (1949- 2002): Implications for ecosystem management. Environmental Management 34(1): 125.139. Probert R.J. and J.L. Brenchly. 1999. The effect of environmental factors on field and laboratory germination in a population of Zostera marina L. from southern England. Seed Science Research 9: 331-339. Rasheed, M.A. 2004. Recovery and succession in a multi-species tropical seagrass meadow following experimental disturbance: the role of sexual and asexual reproduction. Journal of Experimental Marine Biology and Ecology 310: 13-45. Reusch, T.B.H. 2006. Does disturbance enhance genotypic diversity in clonal organisms? A field test in the marine angiosperm Zostera marina. Molecular Ecology 15: 277-286. Robertson, A.I., and K.H. Mann. 1984. Disturbance of ice and life-history adaptations of the seagrass Zostera marina. Marine Biology 80: 131–141. Santamaría-Gallegos, N.A. J.L. Sánchez-Lizaso, and E.F. Félix-Pico. 2000. Phenology and growth cycle of annual subtidal eelgrass in a subtropical locality. Aquatic Botany 66: 329-339. Sawma, J.T. and C.L. Mohler. 2002. Evaluating seed viability by an umimbibed seed crush test in comparison with the tetrazolium test. Weed Technology 16: 781-786. Scott, S.J., R.A. Jones, and W.A. Williams. 1984. Review of data analysis methods for seed germination. Crop Science. 24: 1192-1199. Setchell, W.A. 1929. Morphological and phonological notes on Zostera marina L. University of California Publications in Botany 14: 389-452. Short, F.T. and S. Wyllie-Echeverria. 1996. Natural and human-induced disturbance of seagrasses. Environmental Conservation 23(1): 17-27. Short, F.T. and H.A. Neckles. 1999. The effects of global climate change on seagrasses. Aquatic Botany. 63: 169-196. Short F.T. and K.A. Moore. 2006. Zostera: Biology, Ecology, and Management. In: Larkum A.W.D., R.J. Orth, and C.M. Duarte eds. Seagrasses: Biology, Ecology, and Conservation. pp 361-386.

95
Short, F.T., T. Carruthers, W. Dennison, and M. Waycott. 2007. Global seagrass distribution and diversity: A bioregional model. Journal of Experimental Marine Biology and Ecology 350: 3-20. Silberhorn, G.M., R.J. Orth, and K.A. Moore. 1983. Anthesis and seed production in
Zostera marina L. (eelgrass) from the Chesapeake Bay. Aquatic Botany 15: 133-144.
Simpson, G.M. 1990. Seed dormancy in grasses. Cambridge University Press, New York. Smith P. and K. Bogren. 2001. Determination of nitrate and/or nitrite in brackish or seawater by flow injection analysis colorimetry. QuikChem Method 31-107-04-1- E. Lachat Instruments, Milwaukee, WI, USA. Strickland, J. and T. Parsons, 1972. A Practical Handbook of Seawater Analysis, Bulletin 167 (2nd ed.), Fisheries Research Board Canada, Ottawa. 310 pp. Taylor, A.R.A. 1957. Studies of the development of Zostera marina L. II. Germination and seedling development. Canadian Journal of Botany 35: 681-695. Terrados, J. 1993. Sexual reproduction and seed-banks of Cymodocea nodosa (Ueria)
Ascherson meadows on the southeast Mediterranean coast of Spain. Aquatic Botany 46: 239-299.
Thayer, G.A., W.J. Kenworthy, and K.S. Fonseca. 1984. The ecology of eelgrass meadows of the Atlantic Coast: A community profile. U.S. Fish Wildlife Service. FWS/OBS-84/02 pp 147. Thompson, K. 2000. The functional ecology of soil seed-banks. In, Fenner, M. (ed.), Seeds: The Ecology of Regeneration and Plant Communities, 2nd edition, pp. 215-236. CAB International, Wallingford, Oxon UK. Thompson, K. and J.P. Grime. 1979. Seasonal variation in the seed-banks of herbaceous species in ten contrasting habitats. Journal of Ecology. 67(3): 893-921. van Lent, F. and J.M. Verschuure. 1994. Intraspecific variability of Zostera marina L. (eelgrass) in the estuaries and lagoons of the southwestern Netherlands II. Relation to environmental factors. Aquatic Botany 48: 59-75. Waycott, M., B.J. Longstaff, and J. Mellors. 2005. Seagrass population dynamics and water quality in the Great Barrier Reef region: A review and future research directions. Marine Pollution Bulletin 51: 343-350. Whitfield, P.E., W.J. Kenworthy, M.J. Durako, K.K. Hammerstrom, and M.F. Merello. 2004. Recruitment of Thalassia testudinum seedlings into physically disturbed seagrass beds. Marine Ecology Progress Series 267:121-131.

96
Table 2-1. A priori equation selection for both North Carolina and Virginia. (A) ambient seed-bank and (B) seed core viability.
Ambient Seed-bank Model k Experimental Core Model k A B 1. Total Seed-bank Density V1 = α + time 2 V1 = β0 + β1time + σε1 3 V2 = α + time + sediment 3 V2 = β0 + β2site + σε2 3 V3 = α + time + site 3 V3 = β0 + β1time + β2site + σε3 4 V4 = α + time + source 3 4 V5 = α + time + source + time*source 4 2. Proportion of Viable Seeds V6 = α + time + sediment + site 4 V1 = α + β1time + σε1 V7 = α + time + sediment + source 4 V2 = α + β2site + σε2 2 V8 = α + time + site + source 4 V3 = α + β1time + β2site + σε3 2 V9 = α + time + site + sediment + source 5 V4 = α + β1time + β2site + β3time*site+ σε4 3 V10 = α + time + site + source + time*site 5 4 V11 = α + time + site + source + time*source 5 V12 = α + time + site + source + time*site + time*source 6 V13 = α + time + sediment + source + time*sediment 5 V14 = α + time + sediment + source + time*source 5 V15 = α + time + sediment + source + time*sediment + time*source 6
V16 = α + time + site+ sediment + source + time*site + time*sediment
+ time*source 8
V17 = α + time + site + sediment + source + time*site + time*sediment + time*source + site*sediment + site*source + sediment*source + time*site*sediment + time*site*source + site*sediment*source + time*site*sediment*source
15

97
Table 2-2. Average ambient and experimental sediment conditions for both (A) North Carolina and (B) Virginia sites. Values are averaged across depths and over time, and are presented as means ± standard errors.
Core Ambient Experimental Site NC/CB1 NC/CB2 NC/CB1 NC/CB2 Sediment Type Mud Sand Mud Sand Mud Sand A. North Carolina % Organic 3.27 ± 0.16 1.19 ± 0.07 2.70 ± 0.19 2.27 ± 0.34 2.93 ± 0.67 1.31 ± 0.10 Sand:Silt:Clay % Sand 71.18 ± 1.46 88.35 ± 1.23 81.00 ± 1.94 90.13 ± 2.52 78.31 ± 0.29 91.38 ± 3.70 % Silt 21.57 ± 1.10 10.36 ± 1.08 13.45 ± 1.27 6.75 ± 1.93 15.20 ± 0.17 5.88 ± 2.91 % Clay 7.25 ± 0.52 1.30 ± 0.18 5.55 ± 1.76 3.11 ± 0.65 6.49 ± 0.30 2.74 ± 0.79 Nutrients NH3 µM 23.8 ± 3.5 15.3 ± 1.0 40.6 ± 8.5 68.8 ± 19.5 45.7 ± 9.7 56.6 ± 15.2 PO4
-3 µM 0.6 ± 0.1 1.2 ± 0.3 1.1 ± 0.5 0.3 ± 0.1 0.7 ± 0.2 0.6 ± 0.2 B. Virginia % Organic 2.71 ± 0.18 0.90 ± 0.03 2.14 ± 0.15 0.76 ± 0.11 1.76 ± 0.21 0.82 ± 0.11 Sand:Silt:Clay % Sand 61.00 ± 4.49 87.93 ± 1.35 65.35 ± 1.74 88.67 ± 4.66 81.44 ± 2.83 94.10 ± 0.72 % Silt 29.98 ± 3.57 8.61 ± 1.29 26.40 ± 1.99 8.38 ± 4.09 12.81 ± 2.36 3.50 ± 0.66 % Clay 9.02 ± 1.17 3.46 ± 0.78 8.25 ± 0.81 2.96 ± 0.61 5.74 ± 0.82 2.40 ± 0.20 Nutrients NH3 µM 31.9 ± 4.0 12.7 ± 1.1 41.8 ± 6.6 68.4 ± 17.6 58.7 ± 10.0 38.3 ± 5.4 PO4
-3 µM 0.0 ± 0.0 0.2 ± 0.0 0.5 ± 0.1 0.4 ± 0.1 0.2 ± 0.1 0.3 ± 0.1
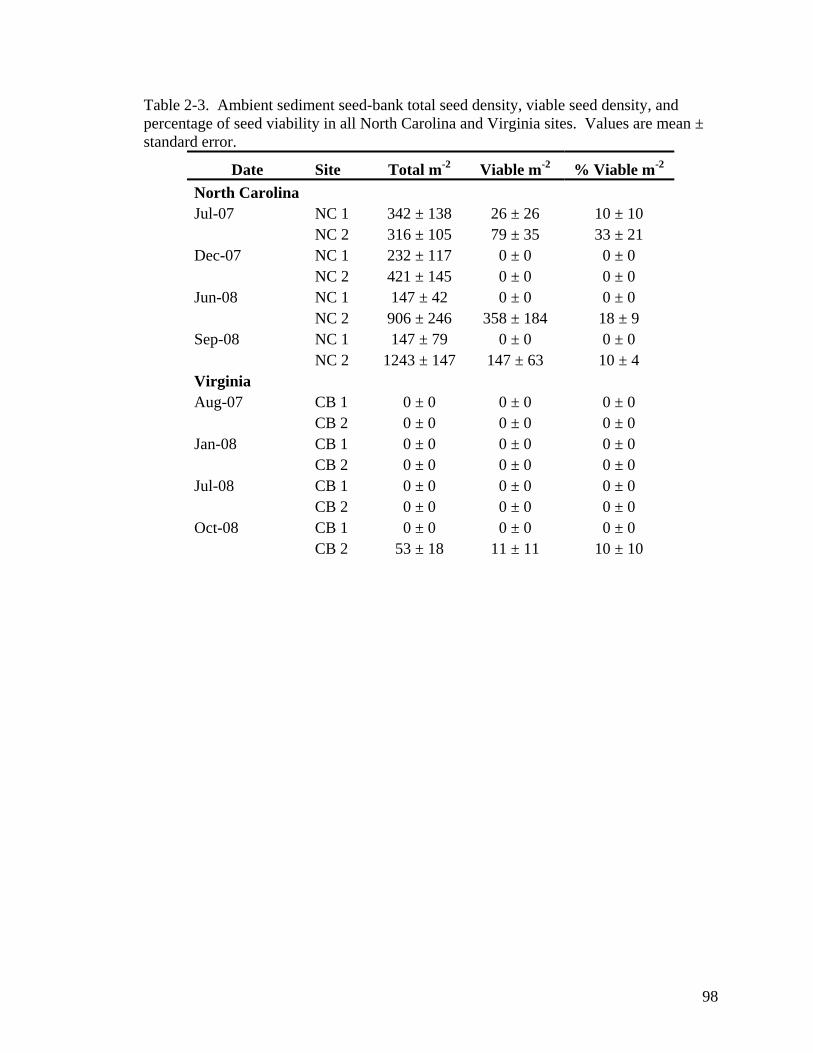
98
Table 2-3. Ambient sediment seed-bank total seed density, viable seed density, and percentage of seed viability in all North Carolina and Virginia sites. Values are mean ± standard error.
Date Site Total m-2 Viable m-2 % Viable m-2 North Carolina Jul-07 NC 1 342 ± 138 26 ± 26 10 ± 10 NC 2 316 ± 105 79 ± 35 33 ± 21 Dec-07 NC 1 232 ± 117 0 ± 0 0 ± 0 NC 2 421 ± 145 0 ± 0 0 ± 0 Jun-08 NC 1 147 ± 42 0 ± 0 0 ± 0 NC 2 906 ± 246 358 ± 184 18 ± 9 Sep-08 NC 1 147 ± 79 0 ± 0 0 ± 0
NC 2 1243 ± 147 147 ± 63 10 ± 4 Virginia Aug-07 CB 1 0 ± 0 0 ± 0 0 ± 0 CB 2 0 ± 0 0 ± 0 0 ± 0 Jan-08 CB 1 0 ± 0 0 ± 0 0 ± 0 CB 2 0 ± 0 0 ± 0 0 ± 0 Jul-08 CB 1 0 ± 0 0 ± 0 0 ± 0 CB 2 0 ± 0 0 ± 0 0 ± 0 Oct-08 CB 1 0 ± 0 0 ± 0 0 ± 0 CB 2 53 ± 18 11 ± 11 10 ± 10

99
Table 2-4. Top ranked models describing the viability of (A) total density of the ambient seed-bank and the proportion of viable seeds in seed-bank and (B) experimental seed cores for both North Carolina and Virginia experiments. Rankings were based on differences in QAICc values. (†) denotes model used in data analysis.
Model k Log likelihood QAIC QAICc Δi
A. Ambient Seed-bank Total Density – North Carolina V3 = β0 + β1time + β2site + σε3
† 4 130.4 -254.7 -254.7 0.0 V1 = β0 + β2site + σε1
† 3 129.1 -254.3 -254.2 0.5 V2 = β0 + β1time + σε2 3 122.4 -240.8 -240.8 13.9 Proportion of Viable Seeds – North Carolina V3 = α + β1time + β2site† 3 -59.5 124.9 124.9 0.0 V4 = α + β1time + β2site + β3time*site 4 -58.6 125.3 125.3 0.4 V2 = α + β1time 2 -63.1 130.3 130.3 5.4 V1 = α + β2site 2 -69.9 143.8 143.8 18.9 B. Experimental Seed Core North Carolina V15 = α + time + site+ sediment + source + time*site + time*sediment + time*source†
8 -941.3 1898.6 1898.7 0.0
V14 = α + time + sediment + source + time*sediment + time*source
6 -948.7 1909.4 1909.4 10.7
V12 = α + time + sediment + source + time*sediment 5 -953.1 1916.2 1916.2 17.5 V11 = α + time + site + source + time*site + time*source 6 -953.7 1919.4 1919.4 20.7 Virginia V5 = α + time + source + time*source† 4 -965.5 1939.1 1939.1 0.0 V14 = α + time + sediment + source + time*source 5 -965.4 1940.7 1940.8 1.7 V11 = α + time + site + source + time*source 5 -965.5 1941.0 1941.0 1.9 V10 = α + time + site + source + time*site 5 -977.9 1965.9 1965.9 6.8
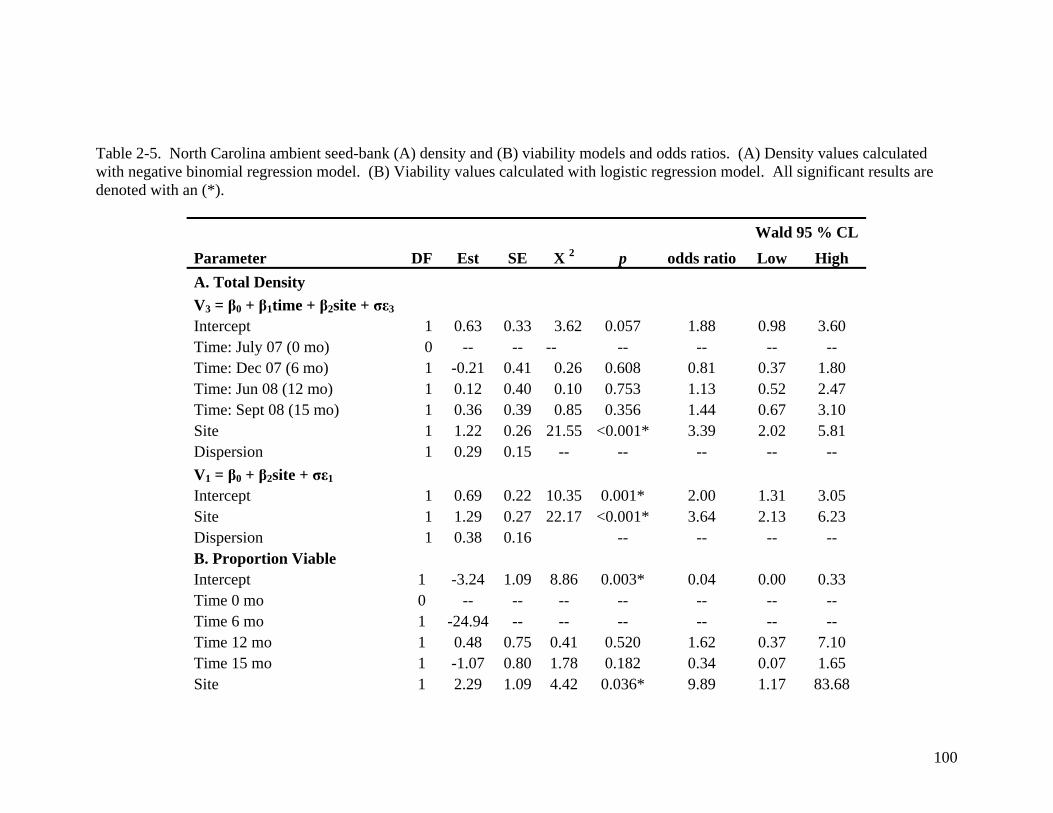
100
Table 2-5. North Carolina ambient seed-bank (A) density and (B) viability models and odds ratios. (A) Density values calculated with negative binomial regression model. (B) Viability values calculated with logistic regression model. All significant results are denoted with an (*).
Wald 95 % CL Parameter DF Est SE X 2 p odds ratio Low High A. Total Density V3 = β0 + β1time + β2site + σε3 Intercept 1 0.63 0.33 3.62 0.057 1.88 0.98 3.60 Time: July 07 (0 mo) 0 -- -- -- -- -- -- -- Time: Dec 07 (6 mo) 1 -0.21 0.41 0.26 0.608 0.81 0.37 1.80 Time: Jun 08 (12 mo) 1 0.12 0.40 0.10 0.753 1.13 0.52 2.47 Time: Sept 08 (15 mo) 1 0.36 0.39 0.85 0.356 1.44 0.67 3.10 Site 1 1.22 0.26 21.55 <0.001* 3.39 2.02 5.81 Dispersion 1 0.29 0.15 -- -- -- -- -- V1 = β0 + β2site + σε1 Intercept 1 0.69 0.22 10.35 0.001* 2.00 1.31 3.05 Site 1 1.29 0.27 22.17 <0.001* 3.64 2.13 6.23 Dispersion 1 0.38 0.16 -- -- -- -- B. Proportion Viable Intercept 1 -3.24 1.09 8.86 0.003* 0.04 0.00 0.33 Time 0 mo 0 -- -- -- -- -- -- -- Time 6 mo 1 -24.94 -- -- -- -- -- -- Time 12 mo 1 0.48 0.75 0.41 0.520 1.62 0.37 7.10 Time 15 mo 1 -1.07 0.80 1.78 0.182 0.34 0.07 1.65 Site 1 2.29 1.09 4.42 0.036* 9.89 1.17 83.68

101
Table 2-6. Logistic regression model and calculated odds ratios for (A) North Carolina and (B) Virginia experimental seed viability cores. All significant results are denoted with an (*). Wald 95 % CL
Parameter DF Est SE X 2 p odds ratio Low High
North Carolina Intercept 1 1.09 0.14 64.33 <0.001* 2.97 2.28 3.88 Time 0 mo 0 -- -- -- -- -- -- Time 6 mo 1 -5.07 0.47 117.94 <0.001* 0.01 0.00 0.02 Time 12 mo 1 -5.92 1.08 30.24 <0.001* 0.00 0.00 0.02 Time 15 mo 1 -5.47 0.69 62.84 <0.001* 0.00 0.00 0.02 Site 1 0.29 0.14 4.29 0.038* 1.33 1.02 1.75 Sediment 1 0.00 0.14 0.00 1.000 1.00 0.76 1.31 Source 1 0.02 0.14 0.02 0.890 1.02 0.78 1.34 Site*Time 0 mo 0 -- -- -- -- -- -- Site*Time 6 mo 1 -0.41 0.34 1.42 0.233 0.66 0.34 1.30 Site*Time 12 mo 1 1.72 1.05 2.69 0.101 5.56 0.71 43.25 Site*Time 15 mo 1 0.83 0.66 1.58 0.208 2.30 0.63 8.42 Sed*Time 0 mo 0 -- -- -- -- -- -- Sed*Time 6 mo 1 1.82 0.47 15.32 <0.001* 6.19 2.49 15.44 Sed*Time 12 mo 1 0.30 0.54 0.31 0.579 1.35 0.47 3.89 Sed*Time 15 mo 1 0.28 0.53 0.27 0.602 1.32 0.47 3.73 Source*Time 0 mo 0 -- -- -- -- -- -- Source*Time 6 mo 1 -0.96 0.38 6.22 0.013* 0.38 0.18 0.81 Source*Time 12 mo 1 -0.73 0.54 1.84 0.175 0.48 0.17 1.39 Source*Time 15 mo 1 0.30 0.53 0.31 0.575 1.34 0.48 3.79 Virginia Intercept 1 -0.36 0.19 3.85 0.05 0.69 0.48 1 Time 0 mo 0 -- -- -- -- -- -- -- Time 6 mo 1 0.85 0.72 1.3 0.254 2.33 0.54 10 Time 12 mo 1 -4.46 1.14 15.32 <0.001* 0.01 0.00 0.11 Time 15 mo 1 16.1 0.71 509.08 <0.001* -- -- -- Source 1 0 0.12 0 1.000 1.000 1.26 1.26 Source*Time 0 mo 0 -- -- -- -- -- -- -- Source*Time 6 mo 1 -2.55 0.63 16.47 <0.001* 0.08 0.02 0.27 Source*Time 12 mo 1 0.09 0.72 0.01 0.903 1.09 0.27 4.48 Source*Time 15 mo 1 -21.05 -- -- -- -- -- --
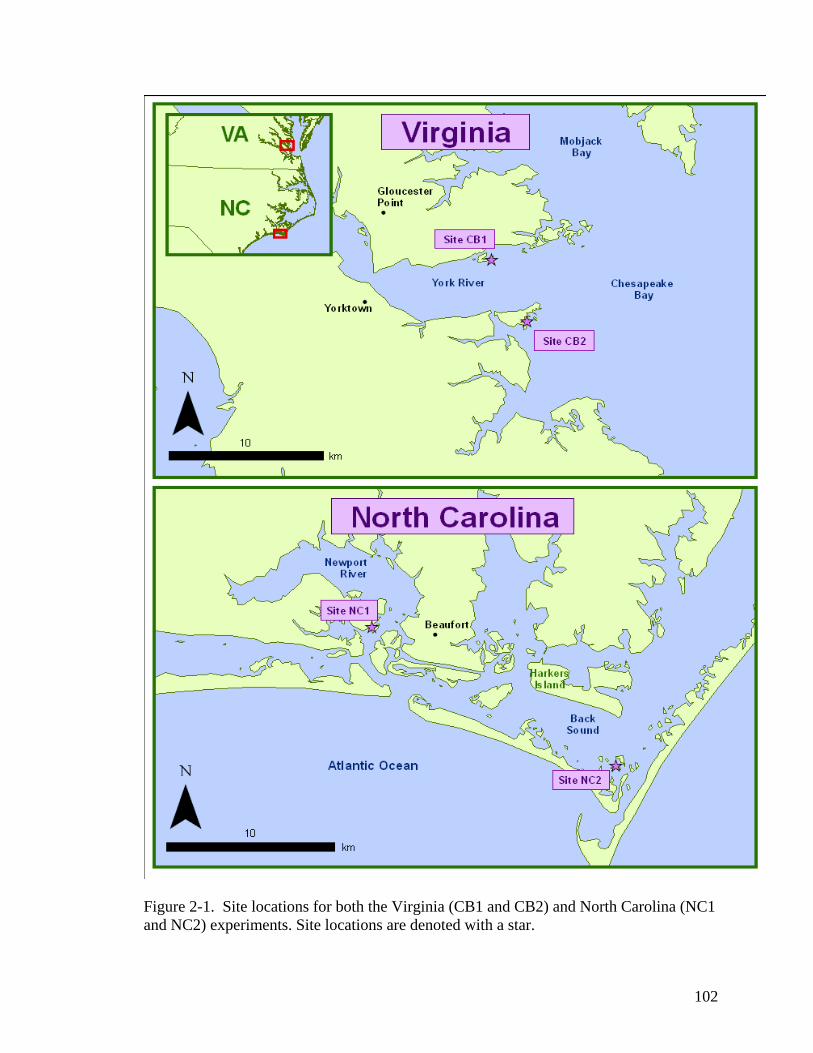
102
Figure 2-1. Site locations for both the Virginia (CB1 and CB2) and North Carolina (NC1 and NC2) experiments. Site locations are denoted with a star.

103
Eh (mV)-600 -400 -200 0 200 400 600
Dep
th (c
m)
1
3
5
7
9
0
2
4
6
8
10
Eh (mV)-600 -400 -200 0 200 400 600
1
3
5
7
9
0
2
4
6
8
10
0 mo6 mo12 mo15 mo
-600 -400 -200 0 200 400 600
Dep
th (c
m)
1
3
5
7
9
0
2
4
6
8
10
-600 -400 -200 0 200 400 600
1
3
5
7
9
0
2
4
6
8
10
A B
C D
Figure 2-2. Mean sediment redox profiles for all sampling sites (A) NC1; (B) NC2; (C) CB1 (D) CB2 across all sampling dates. Values are mean ± standard error.

104
Eh (mV)
-300 -100 100 300 500-400 -200 0 200 400D
epth
(cm
)
1
3
5
7
9
0
2
4
6
8
10
Eh (mV)
-300 -100 100 300 500-400 -200 0 200 400
1
3
5
7
9
0
2
4
6
8
10
6 mo12 mo15 mo
-300 -100 100 300 500-400 -200 0 200 400
1
3
5
7
9
0
2
4
6
8
10
-300 -100 100 300 500-400 -200 0 200 400
Dep
th (c
m)
1
3
5
7
9
0
2
4
6
8
10
A B
C D
Figure 2-3. Mean sediment redox profiles for each sediment treatment averaged across both North Carolina sites. (A) sand sediment perennial seeds; (B) sand sediment annual seeds (C) mud sediment perennial seeds, (D) mud sediment semi-annual seeds. Values are mean ± standard error.
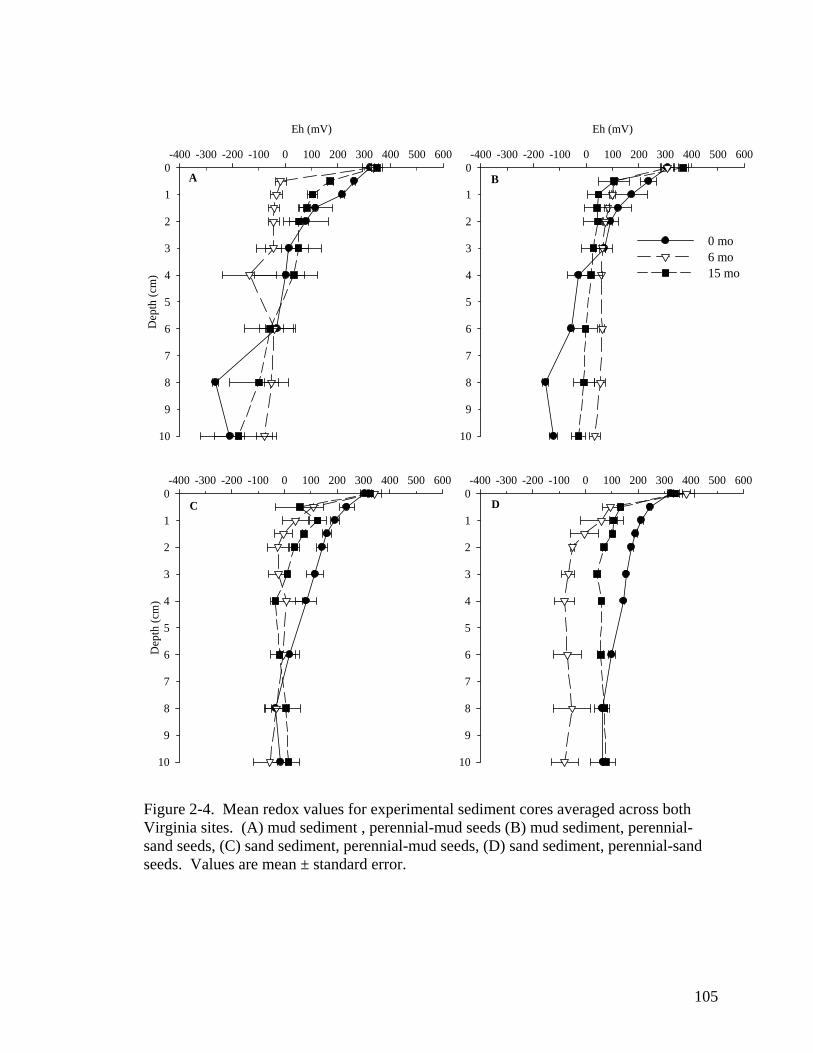
105
Eh (mV)
-300 -100 100 300 500-400 -200 0 200 400 600D
epth
(cm
)
1
3
5
7
9
0
2
4
6
8
10
Eh (mV)
-300 -100 100 300 500-400 -200 0 200 400 600
1
3
5
7
9
0
2
4
6
8
10
0 mo6 mo15 mo
-300 -100 100 300 500-400 -200 0 200 400 600
1
3
5
7
9
0
2
4
6
8
10
-300 -100 100 300 500-400 -200 0 200 400 600
Dep
th (c
m)
1
3
5
7
9
0
2
4
6
8
10
A B
C D
Figure 2-4. Mean redox values for experimental sediment cores averaged across both Virginia sites. (A) mud sediment , perennial-mud seeds (B) mud sediment, perennial-sand seeds, (C) sand sediment, perennial-mud seeds, (D) sand sediment, perennial-sand seeds. Values are mean ± standard error.

106
6 12 15
Months in Sediment
Perc
ent V
iabi
lity
0
5
10
15
20
25
30MudSand
6 12 15
A
B
Per
cent
Via
bilit
y
0
5
10
15
20
25
30
Figure 2-5. Viability of remaining seeds in both (A) North Carolina and (B) Virginia experimental seed cores. Dark gray bars represent seeds in mud treatments and white bars represent seeds in sand treatments.
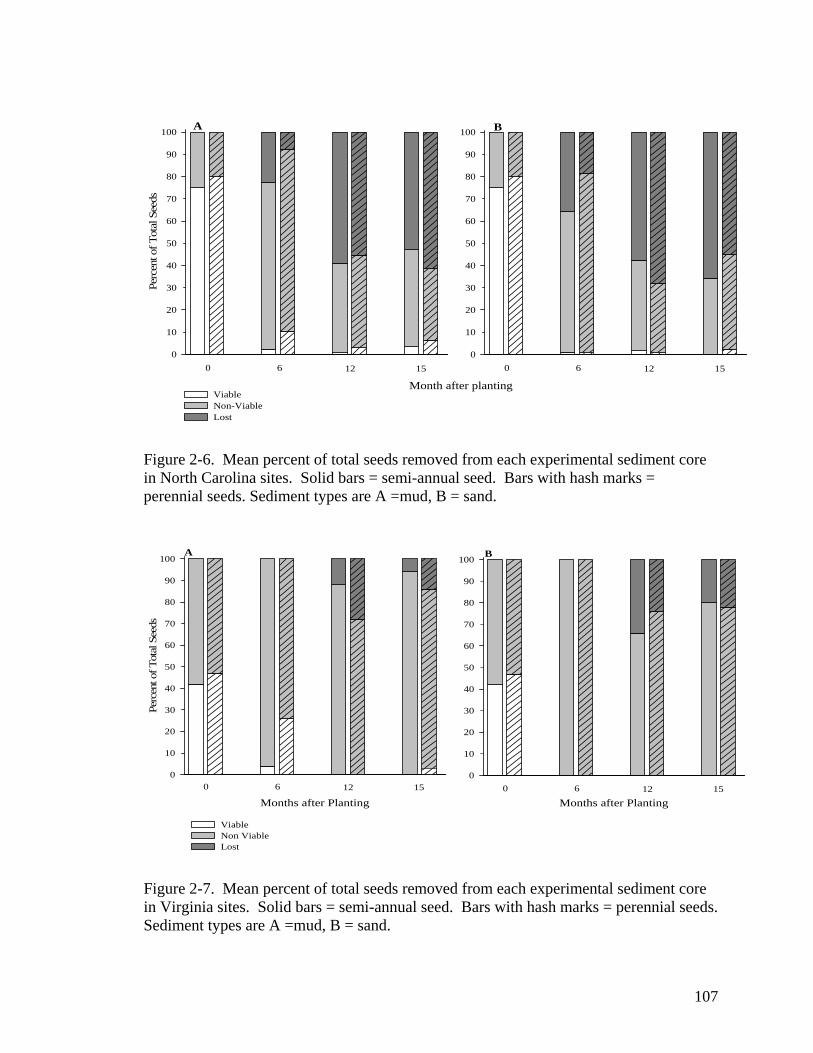
107
Month after planting
Perc
ent o
f Tot
al S
eeds
10
30
50
70
90
0
20
40
60
80
100
ViableNon-ViableLost
10
30
50
70
90
0
20
40
60
80
100
0 6 12 15 0 6 12 15
A B
Figure 2-6. Mean percent of total seeds removed from each experimental sediment core in North Carolina sites. Solid bars = semi-annual seed. Bars with hash marks = perennial seeds. Sediment types are A =mud, B = sand.
Months after Planting
Perc
ent o
f Tot
al S
eeds
10
30
50
70
90
0
20
40
60
80
100
ViableNon ViableLost
Months after Planting
10
30
50
70
90
0
20
40
60
80
100
0 6 12 15 0 6 12 15
A B
Figure 2-7. Mean percent of total seeds removed from each experimental sediment core in Virginia sites. Solid bars = semi-annual seed. Bars with hash marks = perennial seeds. Sediment types are A =mud, B = sand.

108
CHAPTER 3 : SEEDLING EMERGENCE AND SEED VIABILITY OF SEMI-
ANNUAL AND PERENNIAL ZOSTERA MARINA L. SEEDS: THE EFFECTS OF SEED SOURCE, SEDIMENT TYPE, AND BURIAL DEPTH
109
Abstract
Maximum seedling emergence, time to emergence, remaining seed viability, and initial
seedling biomass were compared between semi-annual and perennial Zostera marina
seed populations in sandy (< 1 % organic content) and muddy (> 3 % organic content)
sediments and at shallow (1 cm) and deep (5 cm) depths. Perennial seeds collected from
the York River, Virginia and from Back Sound, North Carolina had significantly greater
maximum percent germination, shorter time to germination, and greater seedling biomass
compared to semi-annual seeds collected from the Newport River, North Carolina. For
both semi-annual and perennial seeds, emergence was greatest in shallow muddy
sediments although mean time to germination was not significantly different. Viability of
the remaining seeds was not significantly affected by burial depth or sediment type;
however viability for all seed sources was < 10%. The percentage of non-viable but pre-
emergent seeds (embryo split from the seed coat, but did not emerge from the sediment
surface) was significantly greater in deep treatments, especially for perennial seeds in the
sandy treatment. Both perennial and semi-annual initial seedling biomass was greater in
muddy compared to sandy sediments and in shallow compared to deep depths. The
results reported here suggest differing strategies between western mid-Atlantic semi-
annual and perennial Z. marina populations for successful seedling establishment. Semi-
annual populations use a “bet hedging” strategy producing smaller, less fit seeds that are
able to disperse to more “safe sites” and escape local stressful conditions while perennial
populations produce fewer larger seeds that have higher emergence rates increasing their
competitive fitness within the more stable perennial bed. While there was no significant
regional difference in seedling emergence between perennial Z. marina sources, sediment

110
conditions did significantly affect seedling emergence, highlighting the role of the
surrounding sediment rather than the location of the source population on successful
sexual reproduction within mid-Atlantic perennial Z. marina beds. Reduced seedling
emergence of both semi-annual and perennial Z. marina seeds at burial depths > 1 cm
may represent a possible bottleneck in successful Z. marina sexual reproduction.
Implications of reduced Z. marina seed viability due to burial depth or sediment
conditions may affect the resiliency to and recovery from disturbance for both perennial
and semi-annual Z. marina beds.
Keywords: Zostera marina, semi-annual, seeds, sediment, viability

111
Introduction
Zostera marina, a dominant seagrass species in the temperate climates of the
Northern Hemisphere, is found in perennial (den Hartog, 1970; Tomlinson, 1974), annual
(den Hartog, 1970; Short and Moore, 2006), and semi-annual forms (Jarvis Chapter 1).
Perennial Z. marina, primarily reproduces asexually (Setchell, 1929; Tutin, 1942; Thayer
et al., 1984) although sexual reproduction is important for dispersal to new habitats
(Harwell and Orth, 2002a; Källström et al., 2008) and recovery from large scale declines
(Plus et al., 2003, Greve et al., 2005; Lee et al., 2007). Annual expressions of Z. marina
rely completely on the production of seeds for establishment and are found most
frequently in areas were environmental disturbance is historically greatest (Keddy and
Patriquin, 1978; Phillips et al., 1983a; van Lent and Vershuure, 1994). Semi-annual
forms of Z. marina rely on seeds for re-establishment on an annual basis, however they
reproduce both sexually and asexually (Jarvis, Chapter 1).
For perennial Z. marina the production of flowering shoots varies between 10 –
19 % of total shoot density (Silberhorn et al., 1983; Harwell and Orth, 2002b), but may
increase in response to disturbance (Phillips et al., 1983a; van Lent and Verschuure,
1994; Guidetti, 2000). Under the extreme conditions found at the limits of Z. marina
distribution a few populations have become completely reliant on sexual reproduction
(Phillips et al., 1983a; Meling-Lopez and Ibarra-Obando, 1999). As with other annual
plant species, survival as seeds in a sediment seed-bank during stressful times of the year
allows annual Z. marina populations to inhabit areas where severe environmental
conditions such as high temperatures (Meling-Lopez and Ibarra-Obando, 1999;
Santamaría-Gallegos, 2000) or ice scour (Keddy, and Patriquin, 1978; Phillips et al.,
112
1983a; Robertson and Mann, 1984) are lethal to perennial populations. More recently
there has been a documented shift from perennial to an semi-annual form of Z. marina in
a well studied Z. marina bed located near the southern limit of the species distribution
along the western Atlantic in the Newport River, North Carolina (Kenworthy unpublished
data.; Jarvis, Chapter 1). While it is hypothesized that the shift of this bed from perennial
to a semi-annual form may be in response to increasing water temperatures or other
environmental stressors the actual cause for the shift in reproductive strategy is unknown.
In addition to the shift from perennial to semi-annual reproductive strategy in one
site in the southern limit of Z. marina along the western Atlantic, large scale population
changes in the form of sudden and severe declines in Z. marina populations have also
been documented in the Chesapeake Bay (Moore and Jarvis, 2008). As populations
continue to decline, sexual reproduction may serve a vital role in the maintenance and
recovery of Z. marina populations (Plus et al., 2003; Greve et al., 2005; Lee et al., 2007)..
Despite the documented role of seeds in recovery of perennial Z. marina beds following
large scale declines and the importance of seeds for maintaining annual and semi-annual
populations, little is known concerning environmental and physiological factors that limit
sexual reproduction in Z. marina.
Harper (1977) described seed germination as a potential limiting stage in
angiosperm sexual reproduction. This was primarily attributed to the surrounding
microenvironment which may lack the required signals to break seed dormancy and
enhance germination (Baskin and Baskin, 1998; Woodin et al. 1998; Jurado and Flores,
2005). For Z. marina the primary environmental germination cues which perennial seeds
have been most responsive to are changes in temperature (10-16 ºC; Setchell, 1929;

113
Taylor, 1957; Lamounette, 1977), dissolved oxygen (anoxic conditions; Churchill et al.,
1992; Moore et al., 1993; Probert and Brenchly, 1999), and sediment organic content (>1
%; Short, 1987; van Katwijk et al., 1997; van Katwijk and Wijgergangs, 2004). Due to
the prevalence of perennial Z. marina, little comparison has been made between annual,
semi-annual, and perennial populations to examine germination responses between semi-
annual and perennial Z. marina seeds or the response of these two forms to the
surrounding sediment microenvironment.
In the present study we quantified the effects of semi-annual and perennial seed
sources, sandy (< 1 % organic content) and muddy (> 3 % organic content) sediments,
and shallow (1 cm) and deep (5 cm) burial depths on time to emergence and maximum
emergence of Z. marina seeds collected from the southern limit of the species western
Atlantic populations. I hypothesized that maximum germination and shorter time to
germination would occur in (1) semi-annual seeds compared to perennial seeds across all
treatments; (2) seeds planted in muddy sediments compared to sandy sediments; (3) seeds
planted in shallower depths compared to deep sediments.
Methods
Seed Collection and Viability
Reproductive shoots with mature flowers were collected from a semi-annual Z.
marina bed at Phillips Island (NC1, 34º 43’ N, 76º 41’ W) in the Newport River, North
Carolina and from a perennial bed at Morgans Island (NC2, 34º 66’ N, 76º 52’ W) in
Back Sound, North Carolina. Reproductive shoots were also collected from two
114
perennial beds in the lower York River, a tributary to the Chesapeake Bay, at Allens
Island (CB1, 37º 15’ N; 76º 25’ W) and Goodwin Island (CB2, 37° 13' N; 76° 23' W).
Reproductive shoots were collected from Z. marina beds during the period of maximum
seed release; early to late May in North Carolina (Phillips et al., 1983b; Thayer et al.,
1984) and late May and early June in Chesapeake Bay (Silberhorn et al., 1983).
Reproductive shoots were kept in separate aerated flow-through tanks (2.4 m x 1.2 m x
1.0 m) until seeds dehisced from the reproductive shoots (Orth et al., 2007). The seeds
were then collected from the bottom of the tank and kept in separate containers in aerated
recirculating tanks (2.4 m x 1.2 m x 1.0 m) at 20 ºC until placement in experimental
cores.
A sub-sample of 100 dark mature seeds from each seed source was tested for
viability using tetrazolium chloride (Lakon, 1949; AOSA 1981; Sawma and Mohler,
2002). Seed embryos were removed from their seed coats and soaked in a 1 %
tetrazolium chloride solution for 24 hours before examination with a dissecting scope at
10 x magnification (Conacher et al., 1994). Seeds with a red to brown stained cotyledon
were considered viable (Taylor, 1957).
Sediment Collection and Characterization
Sediment was collected from established Z. marina beds at CB1 (high organic,
> 3 %) and CB2 (low organic, < 1 %) and stored at 7 – 9 ˚C until processing. Prior to
analysis all sediment was sieved (0.5 mm mesh) to remove extraneous seeds then
homogenized. Five sediment plus (11.4 cm diameter by 2 cm depth) were collected from
each sediment mixture and quartered. The first quarter was sieved (63 μm sieve),
115
washing silt and clay fractions into a graduated cylinder. After 24 hours, pipette analysis
was performed to determine the clay (8 phi) and silt (4 phi) fractions of the sample
(modification of Plumb, 1981). Dry weights of the aliquots were then compared and
percent sand silt and clay fractions were determined. All sediment was classified based
on sand/silt/clay ratios (Shepard, 1954).
Percent organic matter in the sediment was determined by drying two quarters of
the sediment sub-sample at 60 ˚C for 5 days or until a constant dry weight was reached.
The samples were cooled in a desiccator and 10 g of sediment was weighed and
combusted at 500 ˚C for five hours. Each sample was weighed again and percent organic
matter calculated (Erftemeijer and Koch, 2001). Sediment exchangeable nutrients were
extracted from the fourth sample quarter in 2 M KCl, shaken for 1 hour, centrifuged at
4000 rpm for 6 minutes, filtered (Gelman Supor, 0.45 µm), and frozen until analysis.
Dissolved inorganic nitrogen (DIN) and dissolved inorganic phosphate (DIP) were
determined using a Lachat auto analyzer (Liao 2001, revised 2002; Knepel and Bogren
2001, revised 2002; Smith and Bogren 2001, revised 2002).
Seed Source, Sediment Type, and Burial Depth Experiment
To quantify the interactive effects of seed source, sediment type, and burial depth,
25 seeds from each seed source (3 perennial beds, 1 semi-annual bed) were buried in sand
(< 1% organic content) and mud (> 3% organic content) sediment treatments at depths of
1 and 5 cm in PVC cores (6.0 cm in diameter, 12.0 cm). Each core was replicated three
times for all treatments and placed in a large recirculating tank (1.2 m x 2.4 m x 1.0 m) in
a randomized complete block design. After initial testing indicated a maximum period of

116
1 to 2 days between seed germination (seed coat split and radicle emerged) and the
emergence of the cotyledon from the sediment surface (Jarvis unpublished data), seedling
emergence was selected as an accurate measurement of successful germination and
potential seedling establishment. Seedling emergence rather than germination was
quantified because seedling emergence represented all seeds which germinated and
emerged from the sediment surface minus those which died before the seedling could
emerge from the sediment surface (Harper, 1977). Seedling emergence was quantified
daily (Baskin and Baskin, 1998).
Water in each tank was maintained between 10-15 ºC with an aquarium chiller.
Water temperature (ºC), salinity (PSS), dissolved oxygen (mg l-1), and pH were measured
daily with a Yellow Spring Instruments, Inc. (YSI, Inc., Yellow Spring, Ohio) model 650
sonde for 61 days. In addition three water samples were collected at day 1 and day 61,
filtered (Gelman Supor, 0.45 µm), and frozen until analyzed for DIN and DIP with a
Lachat auto analyzer (Liao 2001, revised 2002; Knepel and Bogren 2001, revised 2002;
Smith and Bogren 2001, revised 2002). Water samples were also filtered and analyzed
for chlorophyll a (Strickland and Parson, 1972) and total suspended solids (TSS). TSS
was quantified from a well-mixed sample of known volume. The sample was filtered
through a GF/F filter. The residue retained on the filter was dried to constant weight at
103 – 105 ºC and reported as mg total suspended solids l-1. Ambient incident irradiance
was measured with a LI-COR, Inc. terrestrial sensor (LI-190SA).
Sediment samples from each treatment were collected a second time at day 61 and
analyzed for organic content, sediment exchangeable nutrients, and grain size as
described previously. In addition, vertical redox (Eh) profiles of all sediment types were

117
measured at day 61 with a 21 cm platinum electrode. The probe was inserted into the top
of the core and redox was measured at 0.0, 0.5, 1.0, 1.5, 2.0, 3.0, 4.0, 6.0, 8.0, and 10.0
cm. Final readings were corrected for temperature relative to the reference electrode
(Hinchey and Schaffner, 2005).
After the experiment all cores were removed from the tank, the sediment was
sieved (0.50 mm mesh), and all remaining seeds were counted and stored overnight at
4 ºC. Viability of the remaining seeds was tested using tetrazolium chloride (Lakon,
1949; AOSA 1970; Sawma and Mohler, 2002). Non-viable embryos were divided into
pre-emergent and intact seeds. Embryos which split the seed coat but did not emerge
from the sediment surface were defined as pre-emergence seeds. Embryos from whole
seeds that were completely contained within the seed coat but did not retain viability over
the experimental period were defined as non-viable.
Germinated seedlings were removed from all experimental cores. Biomass
samples were divided into flowering shoots or vegetative shoots. Vegetative shoots were
counted then separated from the rhizome directly below the leaf sheath into above-ground
and below-ground biomass samples. All biomass samples were dried at 60 ºC until a
constant dry weight to the nearest 0.01 g was reached.
Data Analyses
Prior to analysis data were transformed when necessary, normality was
confirmed, and homogeneity of variance was verified with Cochran’s test (Zar, 1999).
Differences in sediment organic content and sediment exchangeable nutrients between
sediment treatments were analyzed with separate one-way Analysis of Variance
118
(ANOVA; The SAS System for Windows, SAS Institute Inc.). A three-way ANOVA
was used to compare the effects of source, sediment type, burial depth, and the
interactions of these factors on redox measurements. All post hoc analyses of the data
were performed with Tukey’s HSD test (Tukey’s Test; The SAS System for Windows,
SAS Institute Inc.).
Maximum emergence data were analyzed using logistic regression with seed
source, sediment type, and burial depth as factors (PROC GENMOD; SAS Institute Inc.;
Scott et al., 1984). Logistic regression was used based on the assumption that
germination of one seed did not significantly affect germination of other seeds (Orth et al,
2007). Therefore, each seed was considered an independent Bernoulli trial and analyzed
separately (perennial n = 75; semi-annual n = 25). Initially the model describing
maximum germination containing both seed sources failed to converge due to strong
differences between source populations. Therefore, perennial and semi-annual seed
responses were analyzed separately. Confidence intervals for both parameter estimates
and odds ratios were calculated using the Wald Chi Square statistic (SAS; SAS Institute
Inc).
Survival analyses using LIFETEST and LIFEREG procedures were selected to
quantify mean time to emergence and treatment effects on time to emergence (SAS; SAS
Institute Inc). Survival analyses were selected due to the potential for a large amount of
right-censored data characteristic of germination experiments (Scott et al., 1984). Seed
data were censored if seedling emergence did not occur and non-emergent seeds were
flagged prior to analysis. As with maximum seedling emergence, time to seedling
emergence analysis of perennial and semi-annual seed populations was done separately.

119
Interaction terms were not included in the analysis of semi-annual and perennial seeds
after the difference in log-likelihood functions between the analyses with and with out
interaction terms were non-significant.
Negative binomial regression was used to analyze the effects of sediment type,
burial depth, and seed source on remaining semi-annual and perennial viable, non-viable,
and pre-emergent seeds (GENMOD; The SAS System for Windows, SAS Institute Inc.).
Over dispersion was accounted for using a Pearson chi-square correction factor. Model
selection for both semi-annual and perennial seed sources was based on log-likelihood
estimates.
Biomass data were transformed using 4th root transformation techniques (Zar,
1999) and analyzed with Analysis of Variance (ANOVA; The SAS System for Windows,
SAS Institute Inc.). The three-way ANOVA compared the effects of seed source,
sediment type, burial depth, and the interactions of these factors on total seedling
biomass. All post hoc analyses of the data were performed with Tukey’s test (Tukey’s
Test; The SAS System for Windows, SAS Institute Inc.).
Results
Water Quality Conditions
Water quality conditions remained consistent through the 61 day sampling period.
Average water temperature was 14.2 ± 0.8 ºC, salinity was 28.7 ± 0.5, dissolved oxygen
was 9.84 ± 0.54 mg l-1, and pH was 7.80 ± 0.14. Water column NH4+ levels on average
were 1.77 ± 0.20 µM and PO4-3 levels were 1.88 ± 0.29 µM. Water column conditions
were comparable to conditions in both the Chesapeake Bay and in the Newport River and
120
Back Sound during periods of Z. marina germination (Chesapeake Bay Program, 2008;
Jarvis Chapter 1).
Sediment Characteristics
Sediment organic content was significantly different between the two sediment
sources (p = 0.005). The mean organic content for the sand treatment was 0.4 % and
3.1 – 3.3 % for the mud treatment (Table 3-1). The sand treatment was comprised
primarily of sand, 96.5 – 96.7 %, and was classified as sandy substrate. The mud
treatment was sandy silt and contained 42.0 % sand, 44.2 % silt, and 14.5 % clay.
Sediment exchangeable NH4+ was significantly greater in the deep compared to shallow
treatments (p = 0.005) and in the muddy compared to sandy sediments (p = 0.015).
Sediment PO4-3 levels were generally low (< 1.0 µM) however sand treatments had
significantly greater PO4-3 concentrations than muddy sediments (p = 0.031). PO4
-3
concentrations did not differ significantly with depth (p = 0.532). There was no
interaction between depth and sediment on sediment nutrient concentrations in either
NH4+ (p = 0.226) or PO4
-3 (p = 0.966).
Overall, redox levels were high in both sand and mud treatments (Figure 3-1).
Sand treatments did not reach anoxic levels (Eh < 0) until depths greater than 8 cm,
whereas mud treatments only experienced anoxia at 6 cm and were above anoxic levels at
all other depths. Redox levels were significantly different between sediment types
(p = 0.049) and depth (p < 0.001) and there was no interaction between sediment type
and depth (p = 0.952). Tukey’s post hoc test results indicate that redox levels at 0.0 and
0.5 cm were significantly different than all depths greater than 1.0 cm, but no other

121
depths were significantly different. Therefore after an initial decrease in redox levels
over the first 1.0 cm, redox levels remained consistent with depth over both sediment
types.
Maximum Seedling Emergence
Across all treatments perennial seedlings were found to be 11.3 times more likely
to emerge from the sediment surface compared to semi-annual seeds (Table 3-2, Figure
3-2). These results were not related to differences in seed source viability as initial seed
viability was similar across seed sources and ranged from 60 to 80 %. The greater
maximum emergence of perennial seedlings was consistent between sediment types and
over burial depths (Table 3-2, Figure 3-2). Within the Chesapeake Bay perennial
populations (CB1 p = 0.031; CB2 p = 0.002) maximum seedling emergence was
significantly different than North Carolina perennial seeds (Table 3-2). Chesapeake Bay
seeds collected from the high organic sediment site (CB1) were 2.2 times more likely to
emerge compared to North Carolina seeds collected from NC2, a site with low organic
sediments (Table 3-2), whereas Chesapeake Bay seeds collected from the low organic
sediment site (CB2) were only 0.8 times as likely to emerge compared to North Carolina
seeds collected from low organic sediments (Table 3-2).
Maximum emergence of perennial seedlings, 63 ± 5 – 77 ± 9 %, occurred in the
shallow mud treatment for all sources (Table 3-3). No perennial seedlings emerged in the
deep sand treatment. Across sediment types, perennial seedlings were 4.7 times more
likely to emerge at shallow (1 cm) compared to deep (5 cm) depths (p < 0.001; Tables 3-2

122
and 3-3). Across depths, perennial seedlings were 6.7 times more likely to emerge in
mud compared to sandy sediments (p < 0.001; Tables 3-2 and 3-3).
Semi-annual seedling emergence was greatest, 19 ± 7 %, in the shallow mud
treatment (Table 3-3). Overall, increased depth significantly decreased emergence of
semi-annual seedlings (p < 0.001; Tables 3-2 and 3-3). Semi-annual seedlings in
shallower depth were 7.4 times more likely to emerge compared to seeds at deep depths
(Table 3-2). Semi-annual seedling emergence was not significantly affected by sediment
type (p = 0.163), however seedlings were 1.8 times more likely to emerge in mud
compared to sandy sediments (Table 3-2).
Time to Seedling Emergence
The rate of seedling emergence for both perennial and semi-annual seeds
increased over time (Figure 3-2). Mean time to seedling emergence was shorter for
perennial (41 ± 0.9 to 50 ± 0.7 days) compared to semi-annual (48 ± 0.9 to 54 ± 0.3 days)
seeds (Figure 3-2). For both semi-annual and perennial seed sources mean time to
seedling emergence could not be calculated for the deep sand treatment due to a lack of
emergence. For perennial seeds time to seedling emergence was affected by both
sediment type (p < 0.001) and burial depth (p < 0.001; Table 3-4). Time to seedling
emergence was 33 % longer for seeds in sandy sediment compared to muddy sediment
and was 10 % longer for seeds in deep compared to shallow depths. Seed source also
significantly affected time to seedling emergence of Chesapeake Bay seeds collected
from the high organic sediment site (CB1) compared to North Carolina seeds collected
from the low organic sediment site (NC2) seeds (p < 0.001). Time to seedling emergence
123
was 16 % longer for CB2 seeds. There was no significant difference in time to seedling
emergence between Chesapeake Bay seeds collected from the low organic site (CB1) and
NC2 seeds (p = 0.261). Time to emergence of semi-annual seedlings was significantly
affected by depth (p = 0.002) with seeds in the deep treatments taking 26 % longer to
emerge (Table 3-4). Sediment type had no significant effect on time to emergence for
semi-annual seedlings (p = 0.134; Table 3-4).
Remaining Seed viability
Viability of non-emerged seeds at the conclusion of the 61 day experiment was
low for both perennial and semi-annual seed sources (Table 3-3). Seed viability ranged
from 0 ± 0 % to 9 ± 3 % in perennial treatments and from 0 ± 0 % to 5 ± 1 % in semi-
annual treatments (Table 3-3). No treatment effects or interactions between treatments
had a significant effect on either semi-annual or perennial seed viability (Table 3-5).
There was a large range of pre-emergent perennial (5 ± 1% to 56 ± 13 %) and
semi-annual seeds (5 ± 4 % to 17 ± 1 %; Table 3-3). For perennial seeds burial depth
significantly effected the number of pre-emergent seeds with seeds at deeper depths 29 %
more likely to split the seed coat but not emerge from the sediment surface than seeds at
shallow depths (p = 0.001, Table 3-5). Chesapeake Bay seeds collected from the low
organic sediment site (CB2) had significantly greater numbers of pre-emergent seeds
compared to seeds collected from the low organic site in North Carolina (NC2; p = 0.025;
Table 3-5). Seeds collected from the high organic sediment sites in the Chesapeake Bay
(CB1) and North Carolina (NC2) were not significantly different (p = 0.195; Table 3-5).
Sediment type did not have a significant effect on pre-emergence of perennial seeds
124
(p = 0.343; Table 3-5). Semi-annual seed pre-emergence was not significantly affected
by sediment type (p = 0.149) or burial depth (p = 0. 298; Table 3-5). No interactions
between treatments were significant for either semi-annual or perennial seeds (Table 3-5).
Chesapeake Bay seeds collected from the high organic sediment site (CB1) had
the smallest proportion of non-viable seeds in the deep mud treatment (3 ± 1 %) and
Chesapeake Bay seeds collected from the low organic site (CB2) had the greatest
proportion of non-viable seeds in the deep sand treatment (48 ± 5 %; Table 3-3). Despite
the large range of non-viable seeds between seed sources, seed source did not have a
significant effect on the number of non-viable seeds (p = 0.447 CB1; p = 0.238 CB2;
Table 3-5). Perennial seeds in sandy sediments (p = 0.005) and seeds in the deep burial
depth treatments (p = 0.001) had significantly greater numbers of non-viable seeds
compared to muddy shallow treatments (Table 3-5). Between 61 ± 8 % and 83 ± 6 % of
all non-emergent semi-annual seeds were non-viable at the end of the experiment
compared to 3 ± 1 % and 48 ± 5 % of perennial seeds (Table 3-3). The proportion of
non-viable semi-annual seeds was similar across all treatments and neither sediment type
(p = 0.117) nor burial depth (p = 0.760) had a significant effect on the number of non-
viable seeds remaining at the end of the experiment (Table 3-5).
Seedling Biomass
Seed source had a significant effect on mean seedling biomass (p < 0.001). Post
hoc analysis with Tukey’s test indicated that mean initial biomass of perennial seedlings
was greater than semi-annual seedlings (p < 0.001) and that there was no significant
difference in biomass between perennial sources (Figure 3-3). Seedlings from muddy

125
treatments had significantly greater biomass compared to sandy treatments (p < 0.001).
Burial depth also significantly affected mean seedling biomass as seedlings from seeds
planted in deeper depths in muddy sediments had greater biomass than seedlings from
seeds planted at the shallow depths (p < 0.001). There was also a significant interaction
between sediment type and burial depth (p < 0.001) and among sediment type, burial
depth, and seed source (p = 0.035).
Discussion
In this study perennial Zostera marina seeds had greater overall seedling
emergence, shorter time to seedling emergence, and greater initial seedling biomass
compared to semi-annual seeds. As both semi-annual and perennial seeds were exposed
to the same environmental conditions, the lack of emergence in semi-annual seeds may
be a reflection of the generally smaller seed size or in differing reproductive strategies
between these semi-annual and perennial populations. In addition, similar responses
between Chesapeake Bay and North Carolina perennial seed sources signify that regional
differences between source beds was not the driving factor behind differing seedling
emergence responses. Of the environmental factors investigated here depth was the only
condition that affected both perennial and semi-annual seeds with maximum seedling
emergence of both forms occurring at shallow (1 cm) depths. While maximum
emergence and minimum time to emergence of perennial seedlings occurred in the
muddy (3 % organic content) treatments, there was no significant difference in semi-
annual seedling emergence between sediment types. Remaining seed viability was low

126
for all treatments indicating that non-germinated seeds may not contribute to a long-term
sediment seed-bank.
Maximum seedling emergence of perennial seed sources (77 ± 9 %) was
significantly greater compared to semi-annual seeds (19 ± 7 %). This result was
unexpected as the semi-annual beds rely completely on seedling emergence for bed re-
establishment. In general, perennial Z. marina beds allocate less energy to sexual
reproduction compared to annual Z. marina by producing fewer flowering shoots
(Phillips et al., 1983a; Keddy, 1987; Olsen, 1999). To compensate for the greater
production of reproductive material, annual Z. marina shoots significantly reduce below
ground production (Keddy, 1987). As a result, annual plants do not have the same
nutritive reserves provided by rhizomes to perennial plants during the period of sexual
reproduction (Harrison, 1979). Conditions of the parent plant during seed production
have significant effects on seed size, seed viability, seed germination, and seedling
emergence (Baskin and Baskin, 1998). Variation in Z. marina seed size has been
documented between populations (Wyllie-Echeverria et al., 2003) with larger more
robust seeds produced under environmental conditions that are more favorable for adult
plant growth and survival (Baskin and Baskin, 1998). For this study Z. marina seeds
from the semi-annual bed were notably smaller in width and length compared to those
from perennial beds. Larger heavier Z. marina seeds may have a greater chance at
germination (Luckenbach and Orth, 1999) and seedling establishment (Churchill, 1992)
compared to smaller seeds. Therefore, the lower seedling emergence rates of the semi-
annual Z. marina bed seeds presented in this study may be the result of a smaller seed
size rather than environmental conditions.

127
Low emergence rates may also be compensated for by producing greater numbers
of smaller seeds. Increased production of flowering shoots by annual populations results
in seed production up to seven times greater than perennial populations (Keddy, 1987).
As a spatial “bet-hedging” strategy smaller more easily dispersed seeds are capable of
escaping stressful location conditions associated with annual autotrophic populations
(Symonides, 1988; Shipley et al., 1989; Rees, 1996). By producing greater densities of
seeds, annual populations increase the chances of more seeds finding suitable
germination sites which also increase the odds of successful seedling establishment
(Keddy, 1987; Harrison, 1993). For example, Santamaría-Gallegos et al. (2000) reported
annual Z. marina populations in the Gulf of California produce between 2,334 shoots m-2
and 30,000 seeds m-2. Assuming initial seed viabilities similar to those found in this
study (60 – 80 %) the number of viable seeds would be between 18,000 and 24,000. To
reach reported shoot densities the maximum emergence rate would range between 9.7
and 12.9 % which is well within the emergence rates observed in this study of 5 – 19 %.
Therefore, the overall low emergence rates from semi-annual bed Z. marina seeds may
result in the sufficient number of seedlings required to re-establish annual or semi-annual
beds yearly.
In this study perennial Z. marina seeds had significantly greater seedling
emergence in sediments with 3 % organic content compared to sediments with < 1%
organic content. Similar seedling emergence responses were reported in the Dutch
Wadden Sea where perennial seed germination was greater in muddy sediments (2.2 ±
0.4 % organic content) compared to sandy sediments (1.0 ± 0.0 %; van Katwijk and
Wijgergangs, 2004). Due to the overall lack of emergence in either sediment type,

128
sediment organic content did not significantly affect emergence of semi-annual seedlings
in the results presented here. Increases in sediment organic content reflect shifts in grain
size (Koch, 2001), nutrient availability (Touchette and Burkholder, 2000; Tamaki et al.,
2002), and oxygen concentration (Moore et al., 1993) signifying large changes in the
sediment microenvironment. Small scale (order of mm to cm) changes in the
surrounding sediment microenvironment have significant effects on seed germination
responses (Harper, 1977). Diverging seedling emergence responses by semi-annual and
perennial seeds to the sediment environment highlights the need for further analysis on
the effects of edaphic factors on germination of semi-annual Z. marina seeds.
Greater overall perennial Z. marina seedling emergence in muddy compared to
sandy sediments has been attributed to anoxic conditions resulting from a reduced
environment (Moore et al., 1993; Probert and Brenchly, 1999; Terrados et al., 1999).
However, in this study redox values were not significantly different between sediment
sources and did not reach anoxic values at depths at which the seeds were planted. In
addition to more reduced conditions muddy sediments are characterized by greater
concentrations of inorganic phosphate and ammonia than sandy sediments (Thayer et al.,
1984; Touchette and Burkholder, 2000; Koch, 2001; Tamaki et al., 2002). In this study
the NH4+ concentrations were significantly greater in the muddy compared to sandy
treatments. While the effects of nutrients on Z. marina seed germination is unknown,
seeds of terrestrial plants are capable of N uptake prior to germination and the absence of
or supersaturated concentrations of DIN in the sediment inhibit germination for many
terrestrial species (Hilhorst and Karssen, 2000). Quantifying the effects of sediment
NH4+ concentrations on perennial and semi-annual Z. marina bed seed germination and

129
seedling emergence was beyond the scope of this research; however, these results
indicate that nutrient seed germination/emergence interactions require further research.
Aerobic sediment conditions may partially explain the delay in seedling
emergence for both perennial and semi-annual bed seed sources. In previous laboratory
studies perennial Z. marina seedling emergence was initiated within days of temperatures
reaching 15 ºC under anoxic conditions and was delayed for a period up to three months
at the same temperatures under aerobic conditions (Moore et al., 1993). For this study
water column temperatures were maintained at 14.2 ± 0.8 ºC yet mean time to emergence
ranged between 37 ± 1 days and 46 ± 2 days for perennial seeds and 48 ± 1 days and 54 ±
0 days for semi-annual seeds. The lack of an anoxic cue did not inhibit emergence
completely, rather it was delayed increasing the time the embryo is completely reliant on
the hypocotyl energy reserves (Taylor, 1957). The delay in seedling emergence for both
seed types may have favored perennial bed seeds which, in general, were larger and may
contain larger starch reserves (Harper, 1977; Wyllie-Echeverria et al., 2003).
Both perennial and semi-annual Z. marina seeds buried at 1 cm showed
significantly greater emergence compared to seeds buried at 5 cm depths. These results
are similar to Granger et al. (2000) who concluded that perennial Z. marina seeds buried
deeper than 2 cm resulted in significantly lower seedling emergence. The lack of
emergence of seeds buried at deeper depths may be related to hypocotyl elongation. The
length of hypocotyl elongation is directly related to burial depth and the deeper burial
depths may have delayed the emergence of the seedling cotyledon from the sediment
surface, therefore cutting off the necessary oxygen required for survival (Churchill,
1992). This trend is reflected in the significantly greater number of pre-emergent

130
perennial seeds found in the 5 cm, burial treatments in both sediment types. Although the
cues were present for the embryo to split the seed coat, Z. marina seeds may not have the
required reserves necessary to produce seedlings at depths of 5 cm therefore they did not
develop into seedlings. There was no significant difference in the number of pre-
emergent semi-annual Z. marina seeds with depth. However, this may be reflective of
the overall low germination characteristic of semi-annual seeds in this study.
The low viability of the remaining semi-annual (0 – 9 %) and perennial (0 – 5 %)
seeds support the observations that both perennial and semi-annual bed Z. marina seeds
do not form long-term seed-banks (Orth et al., 2000; Jarvis Chapter 2). Laboratory
results show that Z. marina seeds can remain viable for 8 to12 months after release from
flowering shoots when kept in water under aerated conditions (Lamounette, 1977; Orth et
al., 2007). Field experiments with perennial and semi-annual Z. marina seeds placed in
the sediment reported similar results with a time period for maximum Z. marina seed
viability of < 12 months (Jarvis, Chapter 2). Seeds play a large role in the recovery of
perennial beds from large scale declines (Plus et al., 2003; Greve et al., 2005) and in the
maintenance and re-establishment of annual beds (Phillips et al., 1983a; Santamaría-
Gallegos et al.; 2000). Low viability of seeds remaining in the sediment may have long-
term implications for the maintenance and survival of both perennial and semi-annual Z.
marina populations.
Initial seedling biomass was significantly affected by both sediment type and
burial depth for semi-annual and perennial Z. marina sources. Seedling biomass was
greater in the muddy compared to sandy treatments suggesting that sediment conditions
that were most conducive to Z. marina seed germination also enhanced initial seedling
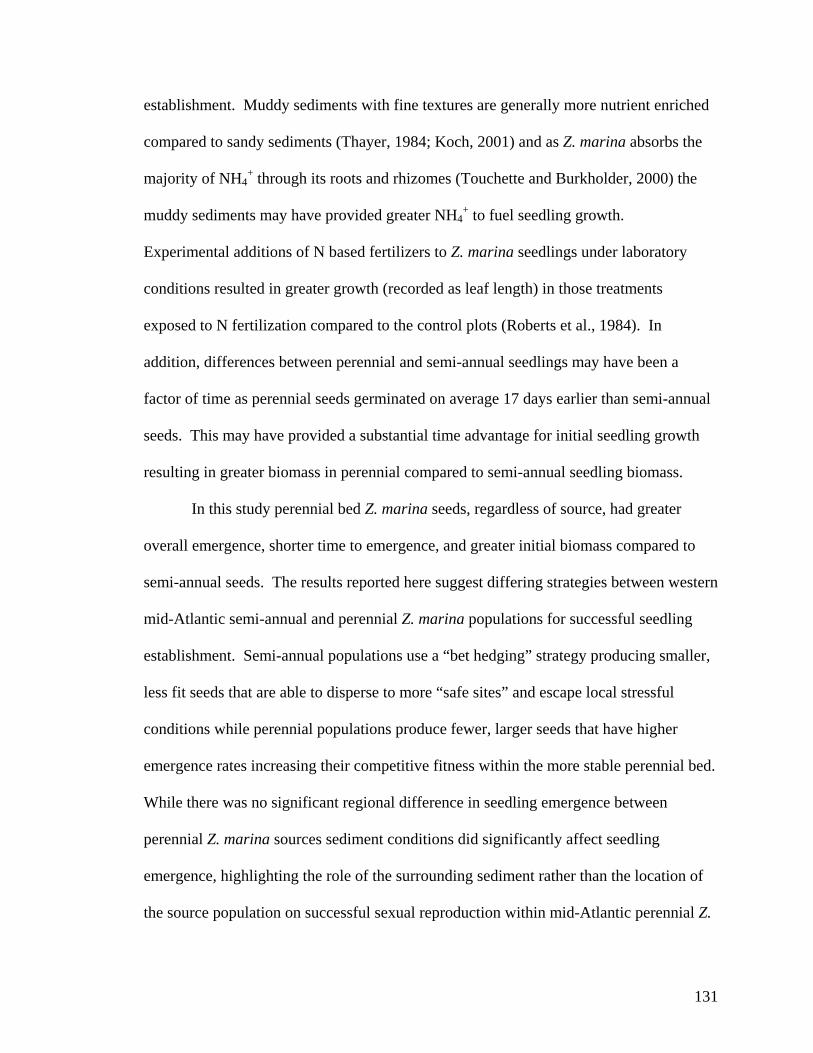
131
establishment. Muddy sediments with fine textures are generally more nutrient enriched
compared to sandy sediments (Thayer, 1984; Koch, 2001) and as Z. marina absorbs the
majority of NH4+ through its roots and rhizomes (Touchette and Burkholder, 2000) the
muddy sediments may have provided greater NH4+ to fuel seedling growth.
Experimental additions of N based fertilizers to Z. marina seedlings under laboratory
conditions resulted in greater growth (recorded as leaf length) in those treatments
exposed to N fertilization compared to the control plots (Roberts et al., 1984). In
addition, differences between perennial and semi-annual seedlings may have been a
factor of time as perennial seeds germinated on average 17 days earlier than semi-annual
seeds. This may have provided a substantial time advantage for initial seedling growth
resulting in greater biomass in perennial compared to semi-annual seedling biomass.
In this study perennial bed Z. marina seeds, regardless of source, had greater
overall emergence, shorter time to emergence, and greater initial biomass compared to
semi-annual seeds. The results reported here suggest differing strategies between western
mid-Atlantic semi-annual and perennial Z. marina populations for successful seedling
establishment. Semi-annual populations use a “bet hedging” strategy producing smaller,
less fit seeds that are able to disperse to more “safe sites” and escape local stressful
conditions while perennial populations produce fewer, larger seeds that have higher
emergence rates increasing their competitive fitness within the more stable perennial bed.
While there was no significant regional difference in seedling emergence between
perennial Z. marina sources sediment conditions did significantly affect seedling
emergence, highlighting the role of the surrounding sediment rather than the location of
the source population on successful sexual reproduction within mid-Atlantic perennial Z.

132
marina beds. Reduced seedling emergence of both semi-annual and perennial Z. marina
seeds at burial depths > 1 cm may represent a possible bottleneck in successful Z. marina
sexual reproduction. Implications of reduced Z. marina seed viability due to burial depth
or sediment conditions may affect the resiliency to and recovery from disturbance for
both perennial and semi-annual Z. marina beds.

133
Literature Cited
Association of Official Seed Analysts. 1981. Rules for testing seeds. Journal of Seed Technology 6(2): 1-126.
Baskin, C.B. and J. Baskin. 1998. Ecologically Meaningful Germination Studies. In Seeds: Ecology, Biogeography, and Evolution of Dormancy and Germination. Academic Press, London. pp 5-26.
Churchill, A.C. 1992. Growth characteristics of Zostera marina seedlings under anaerobic conditions. Aquatic Botany 43: 379-392. Conacher. C.A., I.R. Poiner, J. Butler, S. Pun, and D.J. Tree. 1994. Germination, storage and viability testing of seeds of Zostera capricorni Aschers. from a tropical bay in Australia. Aquatic Botany 49: 46-58. den Hartog, C. 1970. The Sea-Grasses of the World. North-Holland, Amsterdam. Erftemeijer, P.L.A. and E.W. Koch. 2001. Sediment geology methods for seagrass habitat. In Global Seagrass Research Methods. Short FT and Coles RG (eds). Elsevier Science B.V., Amsterdam pp345-367. Granger, S.L., M.S. Traber, and S.W. Nixon. 2000, The influence of planting depth and density of germination and development of Zostera marina L. seeds. Biol. Mar. Medit. 7(2): 55-58. Greve, T.M., D. Krause-Jense, M.B. Rasmussen, and P.B. Christensen. 2005. Means of rapid eelgrass (Zostera marina L.) recolonization in former dieback areas. Aquatic Botany 82: 143-156. Guidetti, P. 2000. Temporal Dynamics of Zostera marina L. off the Lagoon of Grado (Northern Adriatic Sea, Italy). Botanica Marina 43: 541-546. Harrison, P.G. 1979. Reproductive strategies in intertidal populations of two co-occurring seagrasses (Zostera spp.). Canadian Journal of Botany 57(23): 2635-2638. Harper, J.L. 1977. Population Biology of Plants. Academic Press, London, UK. Harrison, P.G. 1993. Variations in demography of Zostera marina and Z. noltii on an intertidal gradient. Aquatic Botany 45: 63-77. Harwell, M.C. and R.J. Orth. 2002a. Long-distance dispersal potential in a marine macrophyte. Ecology 83(12):3319-3330. Harwell, M.C. and R.J. Orth. 2002b. Seed-bank patterns in Chesapeake Bay eelgrass (Zostera marina L.): A bay-wide perspective. Estuaries 25(6): 1196-1204.
134
Hilhorst, H.W.M and C.M. Karssen. 2000. Effect of chemical environment on seed germination. In: Fenner, M. eds. Seeds: the Ecology of Regeneration in Plant Communities 2nd Edition. CABI International pp 293-310. Hinchey, E.K. and L.C. Schaffner. 2005. An evaluation of electrode insertion techniques for measurement of redox potential in estuarine sediments. Chemosphere 59: 703- 710. Juardo, E. and J. Flores. 2005. Is seed dormancy under environmental control or bound to plant traits? Journal of Vegetation Science 16: 559-564. Källström, B., A. Nyqvist, P. Åberg, M. Bodin, and C. André. 2008. Seed Rafting as a
dispersal strategy for eelgrass (Zostera marina). Aquatic Botany 88(2): 148-153. Keddy, C.J. 1987. Reproduction of annual eelgrass: variation among habitats and
comparison with perennial eelgrass (Zostera marina L.). Aquatic Botany 27:243-256.
Keddy, C.J. and D.G. Patriquin 1978. An annual from of eelgrass in Nova Scotia. Aquatic Botany 5:163-170. Knepel, K. and K. Bogren. 2001. Revised 2002. Determination of orthophosphate by
flow injection analysis. QuikChem Method 31-115-01-1-H. Lachat Instruments, Milwaukee, WI, USA.
Koch, E.W. 2001. Beyond light: geological and geochemical parameters as possible submersed aquatic vegetation habitat requirements. Estuaries 24(1): 1-17. Lakon, G. 1949. The topographical tetrazolium method for determining the germinating capacity of seeds. Plant Physiology 24:389-394. Lamounette, R.G. 1977. A study of the germination and viability of Zostera marina L. seeds. M.S. Thesis. Adelphi University. p41. Lee, K.S., S.R. Park, and Y.K. Kim. 2007. Effects of irradiance, temperature, and nutrients on growth dynamics of seagrasses: A review. Journal of Experimental Marine Biology and Ecology 350: 144-175. Liao, N. 2001. Revised 2002. Determination of ammonia in brackish or seawater by flow
injection analysis. QuikChem Method 31-107-06-1-B. Lachat Instruments, Milwaukee, WI, USA.
Luckenbach, M.W. and R.J. Orth. 1999. Effects of a deposit feeding invertebrate on the entrapment of Zostera marina L. seeds. Aquatic Botany 62: 235–247.

135
Moore, K.A., R.J. Orth, and J.F Nowak. 1993. Environmental regulation of seed germination in Zostera marina L. (eelgrass) in Chesapeake Bay: Effects of light, oxygen, and sediment burial. Aquatic Botany 45(1): 79-91. Meling-Lopez A.E. and S.E. Ibarra-Obando. 1999. Annual life cycles of two Zostera marina L. populations in the Gulf of California: contrasts in seasonality and reproductive effort. Aquatic Botany 65: 59-69. Moore, K.A. and J.C. Jarvis. 2008. Environmental factors affecting recent summertime eelgrass diebacks in the lower Chesapeake Bay: Implications for long-term persistence. Journal of Coastal Research SI 55: 135-147. Olsen, B. 1999. Reproduction in Danish eelgrass (Zostera marina L.) stands: size- dependence and biomass partitioning. Aquatic Botany 65: 209-219. Orth, R.J., M.C. Harwell, E.M. Bailey, A. Bartholomew, J.T. Jawad, A.V. Lombana, K.A. Moore, J.M. Rhode, and H.E. Woods. 2000. A review of issues in seagrass seed dormancy and germination: implications for conservation and restoration. Marine Ecology Progress Series 200: 277-288. Orth, R.J., S.R. Marion, and K.A. Moore. 2007. A summary of eelgrass (Zostera marina) reproductive biology with an emphasis on seed biology and ecology from the Chesapeake Bay region. SAV Technical Notes Collection. ERDC/TN SAV- 07-1. Vicksburg, MS: U.S. Army Engineer Research and Development Center. Phillips, R., W.S. Grant, and C.P. McRoy. 1983a. Reproductive strategies of eelgrass (Zostera marina L.). Aquatic Botany 16:1-20. Phillips R.C., C. McMillan, and K.W. Bridges. 1983b. Phenology of eelgrass, Zostera marina L., along latitudinal gradients on North America. Aquatic Botany 15: 145–156. Plumb, R.H. Jr. 1981. Procedures for Handling and Chemical Analysis of Sediment and Water Samples. Technical Report EPA/CE-81-1. Prepared by Great Lakes Laboratory, State University College at Buffalo, Buffalo, NY for the U.S. Environmental Protection Agency/Corps of Engineers Technical Committee on Criteria for Dredged and Filled Material: Environmental Laboratory, U.S. Army Waterways Experiment Station, Vicksburg, MS. pp 403. Plus, M., J.M. Deslous-Paoli, and F. Dagault. 2003. Seagrass (Zostera marina L.) bed
recolonization after anoxia-induced full mortality. Aquatic Botany 77: 121-134. Probert, R.J. and J.L. Brenchly. 1999. The effect of environmental factors on field and laboratory germination in a population of Zostera marina L. from southern England. Seed Science Research 9:331-339.
136
Rees, M. 1996. Evolutionary ecology of seed dormancy and seed size. Philosophical Transactions: Biological Sciences 351(1345): 1299-1308. Roberts, M.H., R.J. Orth, and K.A. Moore. 1984. Growth of Zostera marina seedlings under laboratory conditions of nutrient enrichment. Aquatic Botany 20: 321-328. Robertson, A.I. and K.H. Mann. 1984. Disturbance by ice and life-history adaptations of the seagrass Zostera marina. Marine Biology 80: 131-141. Santamaría-Gallegos, N.A., J.L. Sánchez-Lizaso, and E.F. Félix-Pico. 2000. Phenology and growth cycle of annual subtidal eelgrass in a subtropical locality. Aquatic Botany 66: 329-339. Sawma, J.T. and C.L. Mohler. 2002. Evaluating seed viability by an umimbibed seed crush test in comparison with the tetrazolium test. Weed Technology 16: 781-786. Scott, S.J., R.A. Jones, and W.A. Williams. 1984. Review of data analysis methods for seed germination. Crop Science 24: 1192-1199. Setchell, W.A. 1929. Morphological and phonological notes on Zostera marina L. University of California Publications in Botany 14: 389-452. Shepard, F.P. 1954. Nomenclature based on sand-silt-clay ratios: an interim report. Journal of Sedimentary Petrology 24: 151-155. Shipley, B., P.A. Keddy, D.R.J. Moore, and K. Lemky. 1989. Regeneration and establishment strategies of emergent macrophytes. The Journal of Ecology 77(4): 1093-1110. Short, F.T. 1987. Effects of sediment nutrients on seagrasses: Literature review and mesocosm experiments. Aquatic Botany 16:149-161.± Short, F.T. and K.A. Moore. 2006. Zostera: Biology, Ecology, and Management. In: Larkum A.W.D., R.J. Orth, and C.M.Duarte eds. Seagrasses: Biology, Ecology, and Conservation. Springer The Netherlands pp 361-386. Silberhorn, G.M., R.J. Orth, and K.A. Moore. 1983. Anthesis and seed production in Zostera marina L. (eelgrass) from the Chesapeake Bay. Aquatic Botany 15:133- 144. Smith P. and K. Bogren. 2001. Determination of nitrate and/or nitrite in brackish or seawater by flow injection analysis colorimetry. QuikChem Method 31-107-04-1- E. Lachat Instruments, Milwaukee, WI, USA. Strickland, J. and T. Parsons, 1972. A Practical Handbook of Seawater Analysis, Bulletin 167 (2nd ed.), Fisheries Research Board Canada, Ottawa. 310 pp.

137
Symonides, E. 1988. On the ecology and evolution of annual plants in disturbed environments. Vegetatio 27: 21-31. Tamaki, H., M. Tokuoka, W. Nishijima, T. Terawaki, and M. Okada. 2002. Deterioration of eelgrass, Zostera marina L., meadows by water pollution in Seto Inland Sea, Japan. Marine Pollution Bulletin 44: 1253–1258. Taylor, A.R.A. 1957. Studies of the development of Zostera marina L. II. Germination and seedling development. Canadian Journal of Botany 35: 681-695. Terrados, J., C.M. Duarte, L. Kamp-Nielsen, N.S.R. Agawin, E. Gacia, D. Lacap, M.D. Fortes, J. Borum, M. Lubanski, and T. Greve. 1999. Are seagrass growth and survival constrained by the reducing conditions of the sediment? Aquatic Botany 65: 175–197. Thayer, G.W., W.J. Kenworthy, and M.S. Fonseca. 1984. The ecology of eelgrass meadows of the Atlantic coast: a community profile . U.S. Fish Wildl.Serv. FWS/OBS-84/02. pp 147. Tomlinson, P.B., 1974. Vegetative morphology and meristem dependence - The foundation of productivity in seagrasses. Aquaculture 4: 107–130. Touchette, B.W. and J.M. Burkholder. 2000. Review of nitrogen and phosphorus metabolism in seagrasses. Journal of Experimental Marine Biology and Ecology 250: 133–167. Tutin, T.G. 1942. Zostera L. The Journal of Ecology 30(1): 217-226. van Katwijk, M.M., L.H.T. Vergeer, G.H.W. Schmitz, and J.G.M. Roelofs. 1997.
Ammonium toxicity in eelgrass Zostera marina. Marine Ecology Progress Series 157: 159-173.
van Katwijk, M.M. and L.J.M. Wijgergangs. 2004. Effects of locally varying exposure sediment type and low-tide water cover on Zostera marina recruitment from seed. Aquatic Botany 80: 1-12. van Lent, F. and J.M. Verschuure. 1994. Intraspecific variability of Zostera marina L. (eelgrass) in the estuaries and lagoons of the southwestern Netherlands II. Relation to environmental factors. Aquatic Botany 48: 59-75. Woodin SA, Marinelli RL, Lindsay SM. 1998. Process-specific cues for recruitment in sedimentary environments: Geochemical signals?. Journal of Marine Research 56: 535-558.

138
Wyllie-Echeverria, S., P.A.Cox, A.C. Churchill, J.D. Brotherson, and T. Wyllie- Echeverria. 2003. Seed size variation within Zostera marina L. (Zosteraceae). Botanical Journal of the Linnean Society 142: 281-288. Zar, J.H., 1999. Biostatistical Analysis (4th Ed.). Prentice Hall, Upper Saddle River, New Jersey.

139
Table 3-1. Sediment characteristics for the sand and mud treatments. All values are mean ± S.E. Sand Mud 1 cm 5 cm 1 cm 5 cm
% Organic 0.5 ± 0.0 0.4 ± 0.0 3.1 ± 0.1 3.5 ± 0.3
Sand:Silt:Clay % Sand 96.5 ± 0.1 96.7 ± 0.4 42.0 ± 0.2 41.3 ± 0.9 % Silt 1.6 ± 0.1 0.7 ± 0.2 42.8 ± 0.2 44.2 ± 0.3 % Clay 1.9 ± 0.2 2.6 ± 0.1 15.2 ± 0.1 14.5 ± 0.8
Shepard’s Index sand sand sandy silt sandy silt
Nutrients NH4
+ µM 18.2 ± 4.1 33.1 ± 3.8 32.5 ± 2.3 102.6 ± 30.7 PO4
-3 µM 0.3 ± 0.3 0.2 ± 0.1 0.0 ± 0.0 0.0 ± 0.0

140
Table 3-2. Logistic regression results and odds ratios for the effects of seed source, sediment type, and burial depth on maximum semi-annual and perennial seedling emergence. All significant results are denoted with an (*).
Wald 95 % CL odds Wald 95 % CL Parameter DF Estimate SE Low High Chi Sq p ratio Low High Perennial Intercept 1 -1.79 0.19 -2.16 -1.42 89.78 <0.001* -- -- -- Source – CB1 1 0.41 0.19 0.04 0.78 4.66 0.031* 1.50 1.04 2.18 Source – CB2 1 -0.60 0.19 -0.97 -0.22 9.66 0.002* 0.55 0.38 0.80 Source – NC2 0 -- -- -- -- -- -- -- -- -- Sediment 1 1.90 0.16 1.58 2.22 133.62 <0.001* 6.67 4.83 9.21 Depth 1 1.54 0.16 1.22 1.86 89.26 <0.001* 4.68 3.40 6.45 Semi-annual Intercept 1 -3.92 0.57 -5.04 -2.81 47.27 <0.001* -- -- -- Sediment 1 0.57 0.41 -0.23 1.39 1.95 0.163 1.78 0.79 4.00 Depth 1 2.00 0.55 0.91 3.08 13.05 <0.001* 7.38 2.50 21.84

141
Table 3-3. A. Maximum emergence and mean time to emergece across all treatments. B. Viability results across all treatments. All values are mean ± S.E.
A. Germinated Seeds B. Non-Germinated Seeds Source Sediment Depth (cm) MTG (days) Max % Germ % Viable % Non-Viable % Pre-Emerge
Perennial CB1 Mud 1 37 ± 1 77 ± 9 3 ± 1 15 ± 8 5 ± 1
5 46 ± 1 75 ± 5 1 ± 1 3 ± 1 21 ± 5 Sand 1 49 ± 1 73 ± 6 1 ± 1 17 ± 4 9 ± 5 5 -- 0 ± 0 9 ± 3 36 ± 10 56 ± 13
CB2 Mud 1 44 ± 2 64 ± 8 1 ± 1 21 ± 7 13 ± 5 5 46 ± 1 57 ± 7 1 ± 1 8 ± 0 33 ± 7 Sand 1 54 ± 1 29 ± 5 5 ± 4 24 ± 0 41 ± 7 5 --- 0 ± 0 5 ± 3 48 ± 5 45 ± 6
NC2 Mud 1 41 ± 1 63 ± 5 0 ± 0 21 ± 6 16 ± 2 5 46 ± 2 64 ± 5 3 ± 3 9 ± 1 24 ± 2 Sand 1 47 ± 1 68 ± 2 7 ± 7 15 ± 7 12 ± 4 5 --- 0 ± 0 5 ± 4 43 ± 4 52 ± 7
Semi-Annual NC1 Mud 1 48 ± 0.9 19 ± 7 3 ± 3 61 ± 8 17 ± 1
5 54 ± 0.3 5 ± 1 4 ± 0 75 ± 9 15 ± 7 Sand 1 51 ± 0.6 15 ± 4 0 ± 0 80 ± 2 5 ± 4 5 --- 0 ± 0 5 ± 1 83 ± 6 12 ± 6

142
Table 3-4. Survival analysis results of the effects of seed source, sediment type, and burial depth on time to emergence of perennial and semi-annual seeds. All significant results are denoted with an (*). Wald 95 % CL Parameter DF Estimate SE Low High Chi Sq P Perennial Intercept 1 3.97 0.05 3.88 4.06 7384.59 <0.001* Source - CB1 1 -0.05 0.04 -0.13 0.03 1.27 0.261 Source - CB2 1 0.15 0.04 0.07 0.24 12.46 <0.001* Source - NC2 0 -- -- -- -- -- -- Sediment 1 -0.55 0.04 -0.62 -0.48 216.03 <0.001* Depth 1 0.10 0.01 0.08 0.12 118.90 <0.001* Scale 1 0.44 0.02 0.41 0.48 Semi-Annual Intercept 1 4.53 0.24 4.07 5.00 365.89 <0.001* Depth 1 0.24 0.08 0.09 0.39 10.11 0.002* Sediment 1 -0.29 0.20 -0.68 0.09 2.24 0.134 Scale 1 0.46 0.08 0.33 0.65

143
Table 3-5. Poisson regression results for remaining (A) viable, (B) non-viable, and (C) pre-emergent seeds. All significant results are denoted with an (*).
A. Non-Germinated Viable B. Non-Germinated Non-Viable C. Pre-Emergent Non-Viable Parameter DF Est SE Χ2 p DF Est SE Χ2 p DF Est SE Χ2 p Viable Perennial Intercept 1 0.08 0.99 0.01 0.934 1 0.76 0.44 2.96 0.085 1 0.95 0.41 5.37 0.021*Source - CB1 1 -0.92 1.53 0.36 0.549 1 0.44 0.57 0.58 0.447 1 -0.83 0.64 1.68 0.195 Source - CB2 1 0.16 1.36 0.01 0.908 1 0.63 0.53 1.39 0.238 1 1.06 0.47 5.02 0.025*Source - NC2 0 -- -- -- -- 0 -- -- -- -- 0 -- -- -- -- Sediment 1 -1.31 1.52 0.74 0.389 1 1.34 0.48 7.91 0.005* 1 -0.46 0.49 0.90 0.343 Depth 1 0.08 0.22 0.14 0.707 1 0.27 0.08 11.54 0.001* 1 0.25 0.08 11.06 0.001*Sed.*CB1 1 0.64 1.31 0.24 0.624 1 -0.68 -0.48 1.99 0.159 1 -0.41 0.38 1.16 0.282 Sed.*CB2 1 0.12 1.38 0.01 0.929 1 -0.42 0.42 1.01 0.315 1 -0.13 0.35 0.14 0.713 Sed.*NC2 0 -- -- -- -- 0 -- -- -- -- 0 -- -- -- -- Depth*CB1 1 0.16 0.31 0.28 0.597 1 -0.11 0.11 0.98 0.321 1 0.16 0.12 2.04 0.153 Depth*CB2 1 -0.07 0.29 0.05 0.815 1 -0.08 0.96 0.76 0.384 1 -0.16 0.09 3.37 0.067 Depth*NC2 0 -- -- -- -- 0 -- -- -- -- 0 -- -- -- -- Sed.*Depth 1 -0.05 0.28 0.03 0.854 1 -0.48 0.10 24.92 <0.001* 1 -0.01 0.08 0.00 0.956 Dispersion 1 0.29 0.44 -- -- 1 -0.05 0.03 -- -- 1 -0.01 0.03 -- -- Semi-Annual Intercept 1 -1.94 1.42 1.86 0.173 1 2.98 0.12 581.88 <0.001* 1 -0.12 0.99 0.01 0.905 Sediment 1 1.24 1.71 0.53 0.468 1 -0.35 0.22 2.46 0.117 1 1.67 1.16 2.09 0.149 Depth 1 0.36 0.25 2.08 0.150 1 0.01 0.03 0.09 0.760 1 0.20 0.20 1.09 0.298 Sed.*Depth 1 -0.23 0.31 0.56 0.456 1 0.04 0.05 0.80 0.372 1 -0.24 0.24 1.05 0.306 Dispersion 1 -0.50 0.00 -- -- 1 -0.04 0.01 -- -- 1 0.04 0.24 -- --
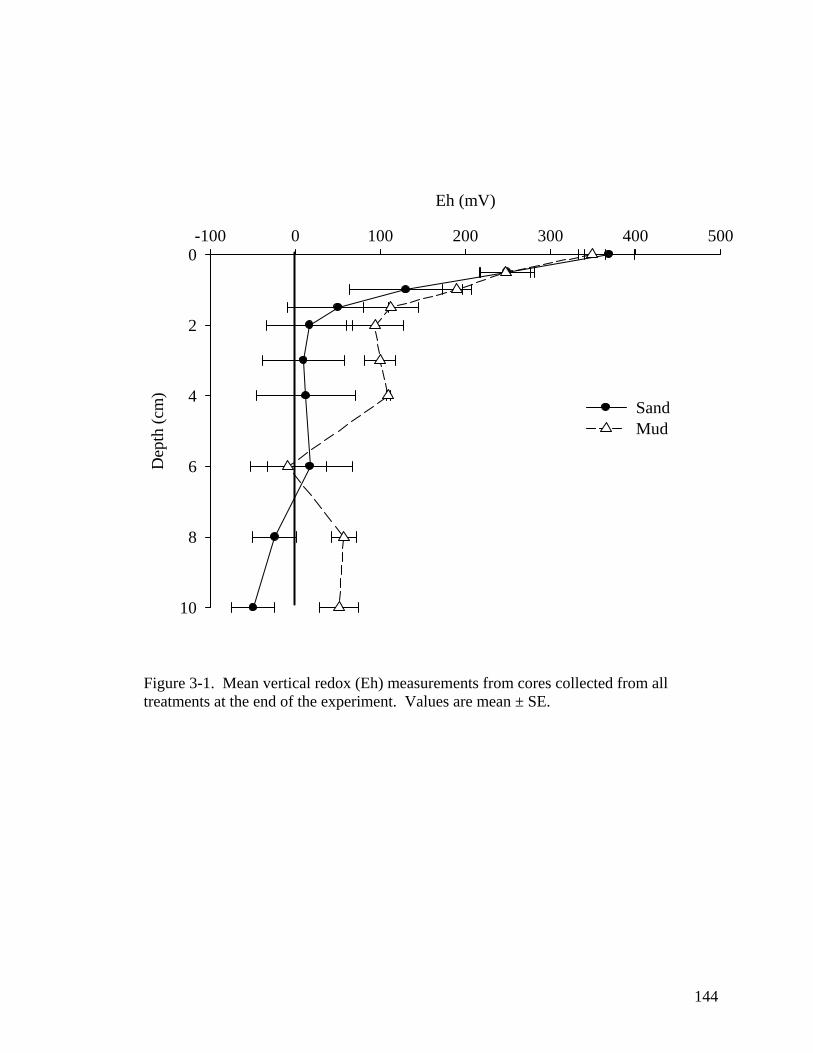
144
Eh (mV)
-100 0 100 200 300 400 500
Dep
th (c
m)
0
2
4
6
8
10
SandMud
Figure 3-1. Mean vertical redox (Eh) measurements from cores collected from all treatments at the end of the experiment. Values are mean ± SE.

145
Perc
ent G
erm
inat
ion
10
30
50
70
90
0
20
40
60
80
100
Day
5 15 25 35 45 55 650 10 20 30 40 50 60
Perc
ent G
erm
inat
ion
10
30
50
70
90
0
20
40
60
80
100
CB 1CB 2NC 1NC 2
Day
5 15 25 35 45 55 650 10 20 30 40 50 60
A B
C D
Figure 3-2. Cumulative mean percent germination curves for (A) mud 1 cm; (B) sand 1 cm; (C) mud 5 cm; (D) sand 5 cm treatments. Values are mean ± S.E.
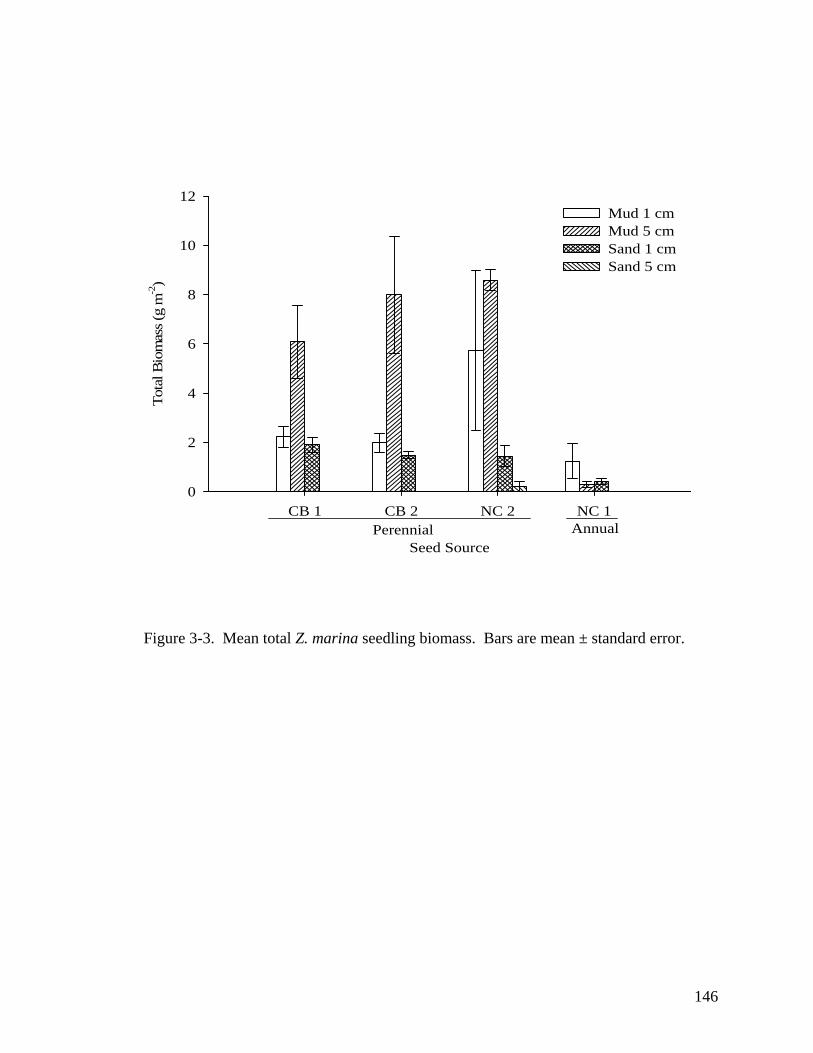
146
Seed Source
CB 1 CB 2 NC 2 NC 1
Tota
l Bio
mas
s (g
m-2)
0
2
4
6
8
10
12Mud 1 cmMud 5 cmSand 1 cmSand 5 cm
Perennial Annual
Figure 3-3. Mean total Z. marina seedling biomass. Bars are mean ± standard error.
147
CHAPTER 4 : POTENTIAL LONG-TERM LOSS OF ZOSTERA MARINA BEDS IN THE CHESAPEAKE BAY FOLLOWING REPEATED DISTURBANCE EVENTS:
THE ROLE OF SEEDLINGS AND SEED-BANK VIABILITY.
148
Abstract
Perennial Zostera marina beds in two spatially separated regions of the York River were
sampled for changes in Z. marina abundance from 2004 to 2008. In the summer of 2005
large declines in perennial Z. marina populations occurred throughout the lower
Chesapeake Bay, including these areas. From April – October 2006 and 2007 monthly
sampling of shoot origin (seedling or vegetative) and the density and viability of seeds
within the seed-bank was conducted to characterize bed re-development. In the spring of
2006 Z. marina beds in both regions re-established with seedlings providing 48 – 54 % of
the total shoot density. Few flowering shoots and no viable seeds in the sediment were
recorded. In 2007 vegetative shoots were dominant with new seedlings comprising only
0 – 6 % of total shoot density. A second consecutive decline occurred during the summer
of 2006 in the upriver region. Recovery in this region was minimal in 2007 with
maximum shoot density of only 6 ± 6 shoots m-2 compared to 526 ± 59 shoots m-2 in the
downriver region. These results demonstrate the importance of seedlings in initial bed
recovery following a single disturbance, but highlight the sensitivity of Z. marina beds in
this region to repeated stresses. After a single disturbance event few viable seeds remain
in the sediment following seedling germination. Since seedlings in this region during
their first year of growth are not observed to flower and produce seeds, the seed-bank is
not immediately replenished and there is limited capacity for bed re-growth. With this
loss of resiliency a repeated disturbance can result in nearly complete bed loss.
Key Words: Zostera marina, decline, seedling, seed-bank
149
Introduction
In 2005 Zostera marina populations suffered a sudden and near complete die-
back across the lower Chesapeake Bay (Moore and Jarvis, 2008). By comparing water
quality and Z. marina monitoring data from the York River, a tributary to the Chesapeake
Bay, the decline was related to a period of unusually high water temperatures in July and
August 2005. These stressful water temperatures combined with low light conditions
resulted in a large scale decline over a short period of only two months. While Z. marina
populations have been declining gradually throughout the Chesapeake Bay region over
the last 80 years (Orth and Moore, 1983; Moore et al., 2000) sudden declines in response
to episodic stress events have not been reported since Tropical Storm Agnes in 1972
(Orth, 1976; Orth and Moore, 1983, 1984; Moore et al., 2000). Therefore patterns or
mechanisms of recovery in these beds are uncertain.
Growth and survival of adult Z. marina plants are significantly affected by the
surrounding environment both in the water column and in the sediment (Dennison et al.,
1993). Z. marina mortality can increase 12 fold when water temperatures are between 25
and 30 ºC compared to mortality rates at temperatures ranging from 10 to 20 ºC (Nejrup
and Pederson, 2008). During the summer of 2005 York River water temperatures
reached 33 ºC over short time periods resulting in the removal of the majority of above
ground biomass (Moore and Jarvis, 2008). In Z. marina beds where damage to the bed
by fishing gear (Neckles et al., 2005) or disease (Frederiksen et al., 2004) does not result
in the complete removal of above ground biomass, beds are estimated to recover over a
time period of years to decades through rhizome elongation (Neckles et al., 2005). In
cases, such the one documented in the Chesapeake Bay in 2005, where nearly all of the

150
above ground biomass is lost the re-establishment mechanism may not be dependent
upon vegetative growth but rather on seed germination and seedling establishment (Plus
et al., 2003; Greve et al., 2005).
Sudden die-offs of Z. marina populations in response to episodic stress have been
documented in both France and Denmark (Plus et al., 2003, Greve et al., 2005). In the
Thau lagoon in the French Mediterranean Sea and the Odense Fjord in Denmark, large
scale declines in Z. marina populations occurred after prolonged periods of complete
anoxic conditions (Plus et al, 2003; Greve et al., 2005). Following the defoliation event
at both sites the initial recruitment into the degraded area was accomplished by seed
germination and seedling survival where between 80 % and 96 % of total shoots were
surviving seedlings (Plus et al., 2003; Greve et al., 2005). Only after this initial re-
establishment did asexual reproduction, the dominant mode of reproduction for perennial
Z. marina (den Hartog, 1970; Tomlinson, 1974), play a role in the recovery process as the
expansion of the beds and increases in biomass were due to vegetative growth. Recovery
periods were recorded on time scales of months to years (Plus et al., 2003).
Unlike perennial Z. marina beds which rely on asexual reproduction for growth
and persistence (Setchell, 1929; den Hartog, 1970), annual beds rely on seed germination
and seedling establishment for bed re-establishment on an annual basis (Keddy and
Patriquin, 1978; Phillips et al., 1983). By surviving as a seed in the sediment seed-bank
during potentially stressful times of the year, annual Z. marina populations are able to
grow and reproduce in areas where annual loss of above ground biomass to extreme
conditions such as water temperatures > 30 ºC (Meling-Lopez and Ibarra-Obando, 1999;
Santamaría-Gallegos et al., 2000) and physical removal by ice (Keddy and Patriquin,

151
1978; Robertson and Mann, 1984) or grazers (den Hartog, 1970) inhibits the persistence
of perennial beds (Keddy and Patriquin, 1978). For many aquatic plant species the role
of the seed-bank within the population increases in importance in direct relation to the
type of disturbance (Combroux et al., 2001). Although perennial beds are found in less
disturbed areas than annual beds they still produce seed-banks; however, the production
of seeds is extremely variable and not well understood (Orth et al., 2000).
Seeds need to remain viable in the sediment for the seed-bank to serve any
function (Leck et al., 1989). In the Chesapeake Bay, Z. marina reproductive shoots and
subsequent seed production are extremely patchy with flowering shoots making up
between 1 % and 88 % of total shoots in a 0.018 m-2 core (Harwell and Orth, 2002),
resulting in the production of 50 – 200 seeds per m-2 (Harwell and Rhode, 2007). As a
result of variable production, seed-banks are also extremely patchy with extrapolated
seed densities ranging from 55 to 6,160 seeds m-2 and viability ranging from 40 to 58 %
during an average year (Harwell and Orth, 2002). In addition, Chesapeake Bay Z. marina
plants do not produce a long term viable seed-bank as viability decreases significantly
after only 6 months in the sediment and is < 1 % after one year (Orth et al., 2000; Jarvis
Chapter 2).
The objective of this study was to quantify the spatial and temporal recolonization
characteristics of Z. marina beds in the York River, a tributary to the Chesapeake Bay,
for two years immediately following the 2005 decline. Specifically, percent cover,
density, and biomass of both vegetative and reproductive shoots for both seedlings and
surviving vegetative shoots were quantified. In addition, I estimated sediment seed-bank
reserves to determine how seeds could contribute to the resiliency of established Z.
152
marina beds in the York River subjected to multiple disturbances. Finally, in order to
gain a better understanding of the interactions between environmental conditions and
natural Z. marina re-establishment both water column and sediment characteristics were
quantified while monitoring recolonization patterns.
Methods
Site Selection
Three beds were chosen in the lower York River based on the documented decline
of Z. marina shoots in the fall of 2005 (Jarvis and Moore, 2008). Two downriver beds
were located at the mouth of the York River at the Goodwin Island National Estuarine
Research Reserve (GI1, GI2; 37° 13' N; 76° 23' W; Figure 4-1). The third bed was
located 10 km upriver adjacent to the Virginia Institute of Marine Science, Gloucester
Point campus (GP; 37˚ 14.8’ N, 76˚ 30.3’ W; Figure 4-1). All three beds have been
monitored for interannual variation in cover and density since 2004
(www.nerrs.noaa.gov/monitoring/biological.html).
Three transects running parallel to shore were established at each bed. Transects
were placed in the inner, middle, and outer edges of the bed and varied in placement and
length depending on bed size. On average, the GP and GI2 beds were 100 m and 130 m
wide, respectively. At these beds the inner transect was placed 20 m from the shore, the
mid-bed was placed at 50 m, and the outer edge was placed at 70 m. The GI1 bed was
700 m wide and transects were placed at 100 m, 300m, and 500 m from the shore,
respectively. Transects at the GP and GI2 beds were 30 m long while all transects at GI1
were 50 m long. Within each transect 6 or 12 (depending on transect length) randomly

153
selected 1 m-2 permanent quadrats were established to monitor changes in Z. marina
density and cover within the bed.
Sediment Characterization
Prior to sampling and during each sampling period, three sediment cores (11.4 cm
diameter by 10 cm depth) were collected from all transects, sectioned into 0-5 cm vertical
sections, and quartered. The first quarter was sieved (63 μm sieve), washing slit and clay
fractions into a graduated cylinder. After 24 hours, pipette analysis was performed to
determine the clay (8 phi) and silt (4 phi) fractions of the sample. Dry weights of the
aliquots were compared and percent sand silt and clay fractions were determined
(modification of Plumb, 1981). All sediments were classified based on sand/silt/clay
ratios (Shepard, 1954).
Percent organic matter in the sediment was determined by drying two quarters of
the sediment sub-sample at 60 ˚C for five days or until a constant dry weight was
reached. Ten grams of the dried sediment sub-sample were weighed and combusted at
500 ˚C for five hours. The sample was then weighed again and percent organic matter
was calculated (Erftemeijer and Koch, 2001). The fourth quarter of the sub-sample was
analyzed to determine sediment exchangeable nutrients. Samples were extracted in 2 M
KCl, shaken for 1 hour, centrifuged at 4000 rpm for 6 minutes, filtered (Gelman Supor,
0.45 µm), and frozen until analysis. Dissolved inorganic nitrogen (DIN – NH4+) and
dissolved inorganic phosphorous (DIP – PO4-3) were determined in the samples using a
Lachat auto analyzer (Liao 2001, revised 2002; Knepel and Bogren 2001, revised 2002;
Smith and Bogren 2001, revised 2002). In addition, vertical redox (Eh) profiles of all
154
sediment types were measured with a 21 cm platinum electrode. The probe was inserted
into the top of the core and redox was measured at 0.0, 0.5, 1.0, 1.5, 2.0, 3.0, 4.0, 6.0, 8.0,
and 10.0 cm. Final readings were corrected for temperature relative to the reference
electrode (Hinchey and Schaffner, 2005).
Water Column Characterization
Water temperature (ºC), salinity (PSS), and dissolved oxygen (mg l-1) were
measured with a Yellow Spring Instruments, Inc. (YSI, Inc., Yellow Spring, Ohio) model
6600 EDS sonde at both the down river (Goodwin Island) and upriver sites (Gloucester
Point). Water quality data were recorded from a depth of 25 cm above the bottom every
15 minutes for the duration of the study. In addition three water samples were collected
monthly throughout the duration of the study from each site. Samples were filtered
(Gelman Supor, 0.45 µm) and analyzed for DIN (NOx, NO2-, NH4
+) and DIP (PO4-3) with
a Lachat auto analyzer (Liao 2001, revised 2002; Knepel and Bogren 2001, revised 2002;
Smith and Bogren 2001, revised 2002). The remaining water samples were filtered and
analyzed for chlorophyll a (Strickland and Parson, 1972) and total suspended solids
(TSS). TSS was quantified from a well-mixed sample of known volume. The sample
was filtered through a GF/F filter and the residue retained on the filter was dried to
constant weight at 103 – 105 ºC and reported as mg total suspended solids l-1. Ambient
incident irradiance was measured with a LI-COR terrestrial sensor (LI-190SA) and light
attenuation, or Kd (m-1), to a depth of 1 m through the water column was quantified by
measuring light levels beneath the water surface at each site with a LI-COR underwater
light sensor (LI-192SA).

155
Recolonization Characteristics
To characterize vegetation at each site percent cover, vegetative shoot density,
and reproductive shoot density were measured monthly from April to October in 2006
and 2007 within permanent one m-2 quadrats randomly selected from each transect (6
quadrats for GI2 and GP; 12 quadrats for GI1). Percent cover was visually estimated and
Z. marina vegetative shoot and reproductive shoot density were quantified within each
quadrat.
Above and belowground biomass were also quantified at each site with a 22 cm
diameter corer (n = 5). Samples were collected monthly at five random locations
dispersed within five meters of each transect. All cores were sieved in the field (1 cm
mesh) and plant and root/rhizome material were stored in York River water at 4-6 ºC
until analysis. All plants within each sample were identified as seedlings or vegetative
shoots based on their rhizome structure and sectioned into above and below ground
material with separation occurring at the basal meristem. In addition, all reproductive
shoots, number of spathes per reproductive shoot, and the number of seeds per spathe
were counted. All biomass samples were dried in pre-weighed aluminum envelopes for
five days at 50 ˚C or until a constant dry weight was reached.
Sediment Seed-bank
Five additional cores (11.4 cm diameter by 10 cm depth) were collected monthly
from all transects and divided into 2 cm sections in the field. The sediment was stored at
4 ºC until analysis. Seeds were sieved from the sediment (0.5 mm mesh) and then tested
for viability using the tetrazolium staining method (Lakon, 1949; AOSA 1981; Sawma
156
and Mohler, 2002). Seed embryos were removed from their seed coats and soaked in a
1 % tetrazolium chloride (tetrazolium) solution for 24 hours before examination on a
dissecting scope at 10 x magnification.
Data Analysis
Differences in vegetative shoot density and biomass, reproductive shoot density
and biomass, and sediment seed-bank density between transects and sites and over time
were analyzed using negative binomial regression with time (year), transect, source
(seedling or vegetative shoot), and site as factors (PROC GENMOD: SAS Institute Inc.;
Allison, 1999). For all significant (p < 0.05) model terms odds ratios were calculated
using Wald chi square statistics (SAS; SAS Institute Inc). Model selection for both semi-
annual and perennial seed sources was based on log-likelihood estimates (Burnham and
Anderson, 2002).
Temporal effects on percent cover were analyzed using repeated measures
Analysis of Variance with time (year), transect, and site quantified as factors. (PROC
GLM; SAS Institute Inc). The effect of source on cover was not quantified due to the
non-destructive methods used to estimate percent cover. These methods did not allow for
the rhizomes to be examined therefore source could not be quantified. Prior to analysis
data were transformed with arcsine square root transformation, normality was confirmed,
and homogeneity of variance was verified with Cochran’s test (Zar, 1999).
The effect of bed and transect on the proportion of reproductive shoots produced
were analyzed with non-parametric Kruskal-Wallis and Kolmogorov-Smirnov tests (The
SAS System for Windows, SAS Institute Inc.) after the data were found to be non-normal

157
following transformation. Time (year) and source were not analyzed as reproductive
shoots were not produced in 2006 and no seedlings produced reproductive shoots in
2007.
Differences in water column characteristics and sediment percent sand/silt/clay
ratios between beds and over time were analyzed with nonparametric statistics as the data
were non-normally distributed (Kruskal-Wallis and Kolmogorov-Smirnov Tests; The
SAS System for Windows, SAS Institute Inc.). All remaining sediment data were
transformed when necessary and analyzed with a repeated measure ANOVA to compare
the effects of time, site and the interactions of these factors. Results are presented as non-
transformed means ± standard error of the mean.
Results
Environmental Characterization
All water column characteristics (temperature, salinity, chlorophyll a, TSS, Kd,
DIN, DIP) followed seasonal trends and were significantly different over time (p < 0.001
for all). Water column temperature (p = 0.291) and salinity (p = 0.848) did not differ
significantly between the upriver and down river sites in 2006 and 2007 (Figure 4-2A, B).
Temperatures ranged from 13.6 ± 0.1 ºC to 28.5 ± 0.1 ºC and salinity ranged from 15.5 ±
0.1 to 23.2 ± 0.1 at both sites.
Water column DIN did not vary significantly with site (NOx p = 0.100; NO2- p =
0.105; NH4+ p = 0.117) but did differ significantly over time (p < 0.001). All DIN
concentrations averaged < 1 µM and did not reach concentrations above 8 µM during the
2006 and 2007 sampling season. Water column DIP was significantly different between

158
sites (p < 0.001) and over time (p < 0.001) although concentrations did not increase
above 1 µM during the entire sampling period.
Water clarity (Kd to 1 m) was significantly greater at the downriver site compared
to the upriver site (p = 0.006). At the upriver site chlorophyll a ranged from 8.13 ± 0.39
µg l-1 to 26.80 ± 5.89 µg l-1 which was significantly greater (p = 0.002) than the down
river site where chlorophyll a ranged from 6.07 ± 0.06 µg l-1 to 23.55 ± 0.92 µg l-1. Total
suspended solids did not differ significantly between sites (p = 0.068) and ranged from
6.27 ± 1.05 mg l-1 to 38.98 ± 7.41 mg l-1.
In the upriver site < 22 % of light reached depths greater than 1 m in July and
August 2006 and again from June to October 2007 (Figure 4-2 C). Light at the
downriver site was reduced to below 22 % of surface irradiance in August 2007 and the
reduced light conditions persisted for < 1 month. The low light periods at the upriver site
in both 2006 and again in 2007 coincided with seasonally high summer water
temperatures (Figure 4-2).
All sediments were classified as sand (> 75% sand). Sediment percent organic
content varied significantly between sites (p < 0.001) and transects (p < 0.001) but not
over time (p = 0.317). Post hoc analysis with Tukey’s test indicates that all sites were
significantly different; however, only the shallow transects were significantly different
than the mid-bed and deep transects. There was no significant difference in organic
matter between the mid-bed and deep transects at all sites. The GI1 shallow transect
contained the greatest organic content with an average value of 1.77 ± 0.07 %. Mean
sediment organic content in both GI2 and GP shallow transects was < 1%. The sediment
organic content at the GP shallow transect averaged 0.85 ± 0.13 % and GI2 averaged 0.53
159
± 0.03 %. Comparatively, sediment organic content in the mid-bed and deep transects
averaged 0.57 ± 0.11 % for GI1, 0.42 ± 0.05 % for GP, and 0.43 ± 0.09 % for GI2.
Sediment NH4+ concentrations did not differ significantly between sites (p =
0.257) but were significantly different between transects (p = 0.001) and over time
(p < 0.001). Post hoc analysis with Tukey’s HSD test indicated that sediment NH4+
concentrations between the shallow and deep transects were significantly greater in the
shallower compared to deep transects; however, there was no significant difference
between the shallow and mid-bed or between mid-bed and deep transects. Tukey’s HSD
test also indicated significantly lower sediment NH4+ concentrations in April – July
compared to August – September. There was a significant interaction between time and
site (p < 0.001) and between time, site and transect (p < 0.001).
Sediment PO4-3 concentrations varied significantly with site and time (p < 0.001
for both) but not across transects (p = 0.142). Post hoc analysis with Tukey’s HSD test
revealed that sediment PO4-3 concentrations were significantly greater at GI2 than GI1
and GP but were not different between GI1 and GP. There was no clear trend with PO4-3
concentrations over time as all months were significantly different from all other months.
On average sediment PO4-3 concentrations were < 1 µM for all sites and did not rise
above 3.83 ± 0.84 µM throughout the monitoring period.
Eh was significantly different between sites (p < 0.001), across depths (p < 0.001)
and over time (p < 0.001) but not between transects (p = 0.065). Post hoc analysis with
Tukey’s HSD test reveals that sediments were more reduced at the GI1 and GI2 sites
compared to GP and at depths > 3 cm compared to shallower depths.
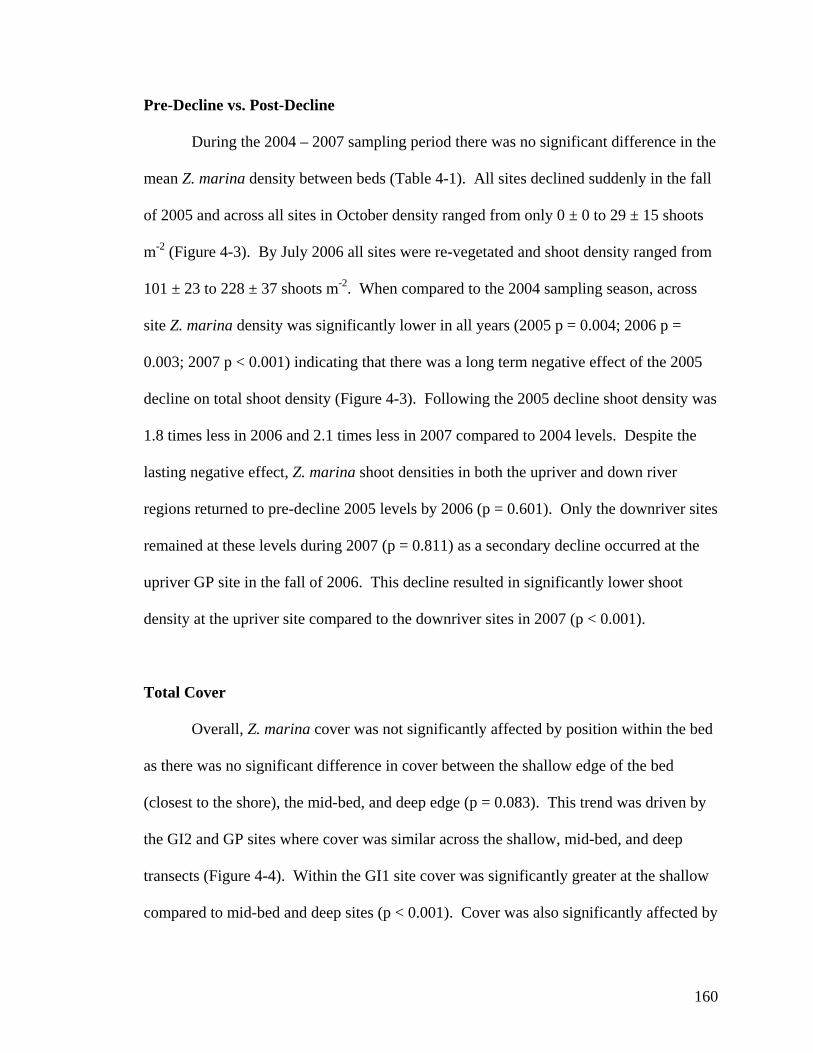
160
Pre-Decline vs. Post-Decline
During the 2004 – 2007 sampling period there was no significant difference in the
mean Z. marina density between beds (Table 4-1). All sites declined suddenly in the fall
of 2005 and across all sites in October density ranged from only 0 ± 0 to 29 ± 15 shoots
m-2 (Figure 4-3). By July 2006 all sites were re-vegetated and shoot density ranged from
101 ± 23 to 228 ± 37 shoots m-2. When compared to the 2004 sampling season, across
site Z. marina density was significantly lower in all years (2005 p = 0.004; 2006 p =
0.003; 2007 p < 0.001) indicating that there was a long term negative effect of the 2005
decline on total shoot density (Figure 4-3). Following the 2005 decline shoot density was
1.8 times less in 2006 and 2.1 times less in 2007 compared to 2004 levels. Despite the
lasting negative effect, Z. marina shoot densities in both the upriver and down river
regions returned to pre-decline 2005 levels by 2006 (p = 0.601). Only the downriver sites
remained at these levels during 2007 (p = 0.811) as a secondary decline occurred at the
upriver GP site in the fall of 2006. This decline resulted in significantly lower shoot
density at the upriver site compared to the downriver sites in 2007 (p < 0.001).
Total Cover
Overall, Z. marina cover was not significantly affected by position within the bed
as there was no significant difference in cover between the shallow edge of the bed
(closest to the shore), the mid-bed, and deep edge (p = 0.083). This trend was driven by
the GI2 and GP sites where cover was similar across the shallow, mid-bed, and deep
transects (Figure 4-4). Within the GI1 site cover was significantly greater at the shallow
compared to mid-bed and deep sites (p < 0.001). Cover was also significantly affected by
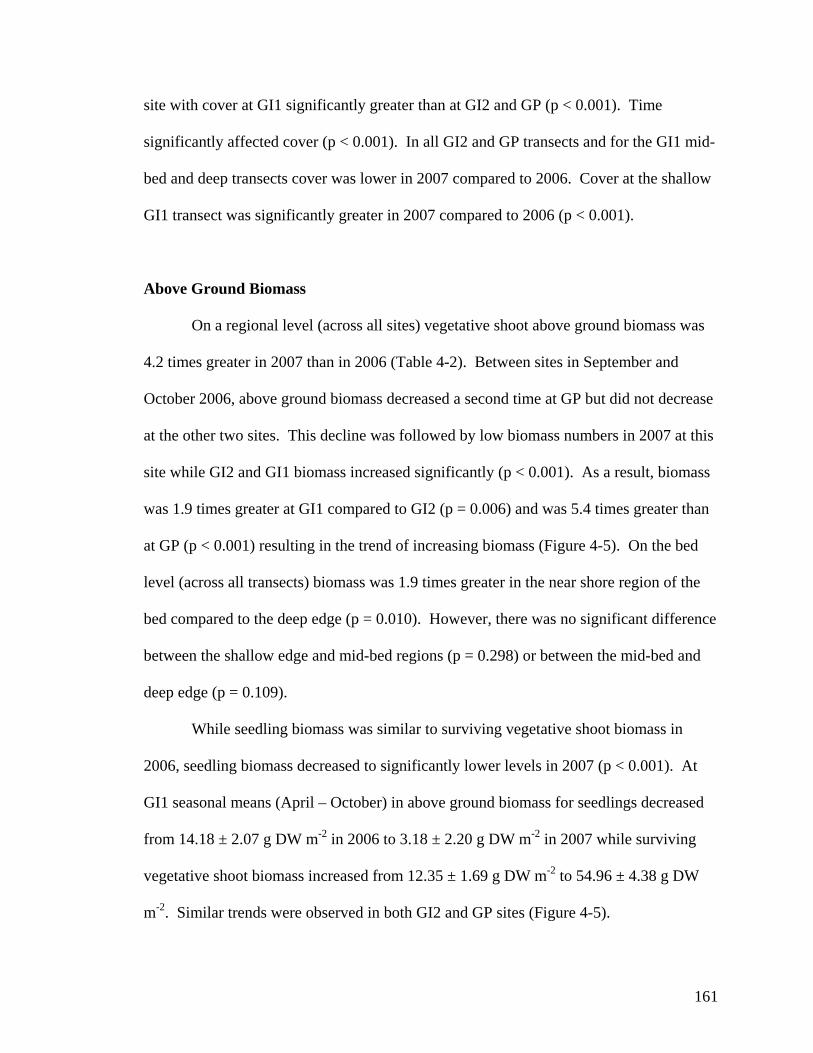
161
site with cover at GI1 significantly greater than at GI2 and GP (p < 0.001). Time
significantly affected cover (p < 0.001). In all GI2 and GP transects and for the GI1 mid-
bed and deep transects cover was lower in 2007 compared to 2006. Cover at the shallow
GI1 transect was significantly greater in 2007 compared to 2006 (p < 0.001).
Above Ground Biomass
On a regional level (across all sites) vegetative shoot above ground biomass was
4.2 times greater in 2007 than in 2006 (Table 4-2). Between sites in September and
October 2006, above ground biomass decreased a second time at GP but did not decrease
at the other two sites. This decline was followed by low biomass numbers in 2007 at this
site while GI2 and GI1 biomass increased significantly (p < 0.001). As a result, biomass
was 1.9 times greater at GI1 compared to GI2 (p = 0.006) and was 5.4 times greater than
at GP (p < 0.001) resulting in the trend of increasing biomass (Figure 4-5). On the bed
level (across all transects) biomass was 1.9 times greater in the near shore region of the
bed compared to the deep edge (p = 0.010). However, there was no significant difference
between the shallow edge and mid-bed regions (p = 0.298) or between the mid-bed and
deep edge (p = 0.109).
While seedling biomass was similar to surviving vegetative shoot biomass in
2006, seedling biomass decreased to significantly lower levels in 2007 (p < 0.001). At
GI1 seasonal means (April – October) in above ground biomass for seedlings decreased
from 14.18 ± 2.07 g DW m-2 in 2006 to 3.18 ± 2.20 g DW m-2 in 2007 while surviving
vegetative shoot biomass increased from 12.35 ± 1.69 g DW m-2 to 54.96 ± 4.38 g DW
m-2. Similar trends were observed in both GI2 and GP sites (Figure 4-5).
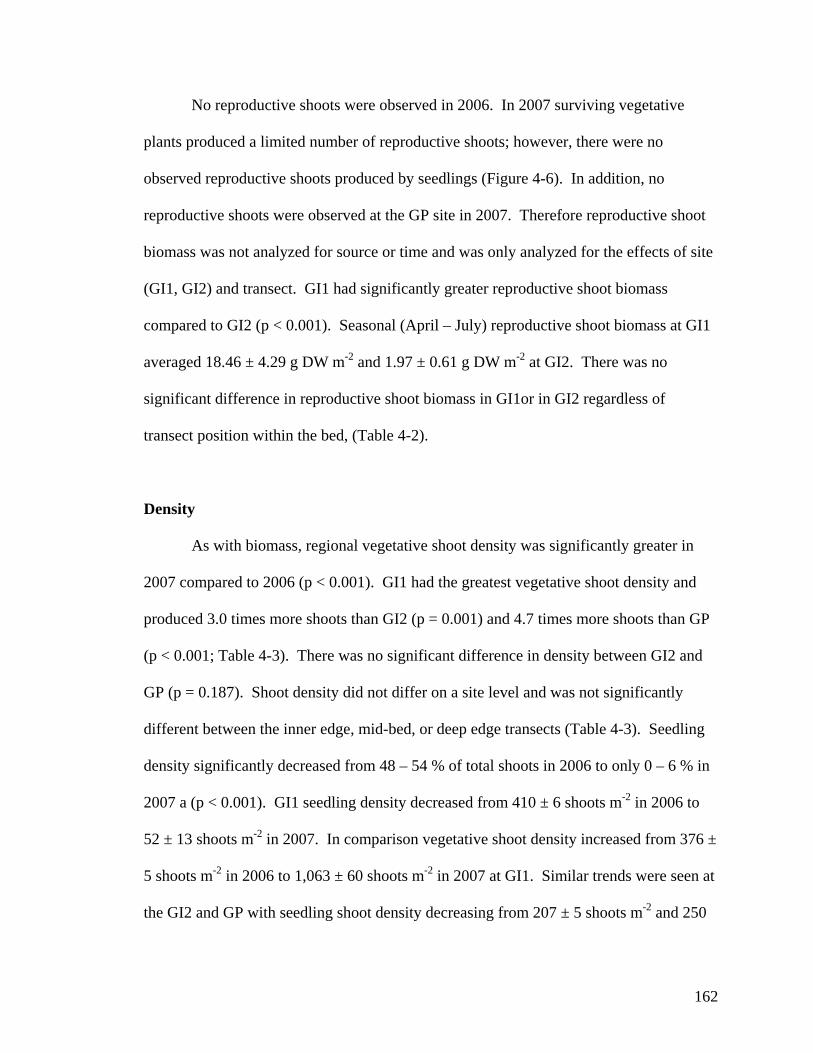
162
No reproductive shoots were observed in 2006. In 2007 surviving vegetative
plants produced a limited number of reproductive shoots; however, there were no
observed reproductive shoots produced by seedlings (Figure 4-6). In addition, no
reproductive shoots were observed at the GP site in 2007. Therefore reproductive shoot
biomass was not analyzed for source or time and was only analyzed for the effects of site
(GI1, GI2) and transect. GI1 had significantly greater reproductive shoot biomass
compared to GI2 (p < 0.001). Seasonal (April – July) reproductive shoot biomass at GI1
averaged 18.46 ± 4.29 g DW m-2 and 1.97 ± 0.61 g DW m-2 at GI2. There was no
significant difference in reproductive shoot biomass in GI1or in GI2 regardless of
transect position within the bed, (Table 4-2).
Density
As with biomass, regional vegetative shoot density was significantly greater in
2007 compared to 2006 (p < 0.001). GI1 had the greatest vegetative shoot density and
produced 3.0 times more shoots than GI2 (p = 0.001) and 4.7 times more shoots than GP
(p < 0.001; Table 4-3). There was no significant difference in density between GI2 and
GP (p = 0.187). Shoot density did not differ on a site level and was not significantly
different between the inner edge, mid-bed, or deep edge transects (Table 4-3). Seedling
density significantly decreased from 48 – 54 % of total shoots in 2006 to only 0 – 6 % in
2007 a (p < 0.001). GI1 seedling density decreased from 410 ± 6 shoots m-2 in 2006 to
52 ± 13 shoots m-2 in 2007. In comparison vegetative shoot density increased from 376 ±
5 shoots m-2 in 2006 to 1,063 ± 60 shoots m-2 in 2007 at GI1. Similar trends were seen at
the GI2 and GP with seedling shoot density decreasing from 207 ± 5 shoots m-2 and 250
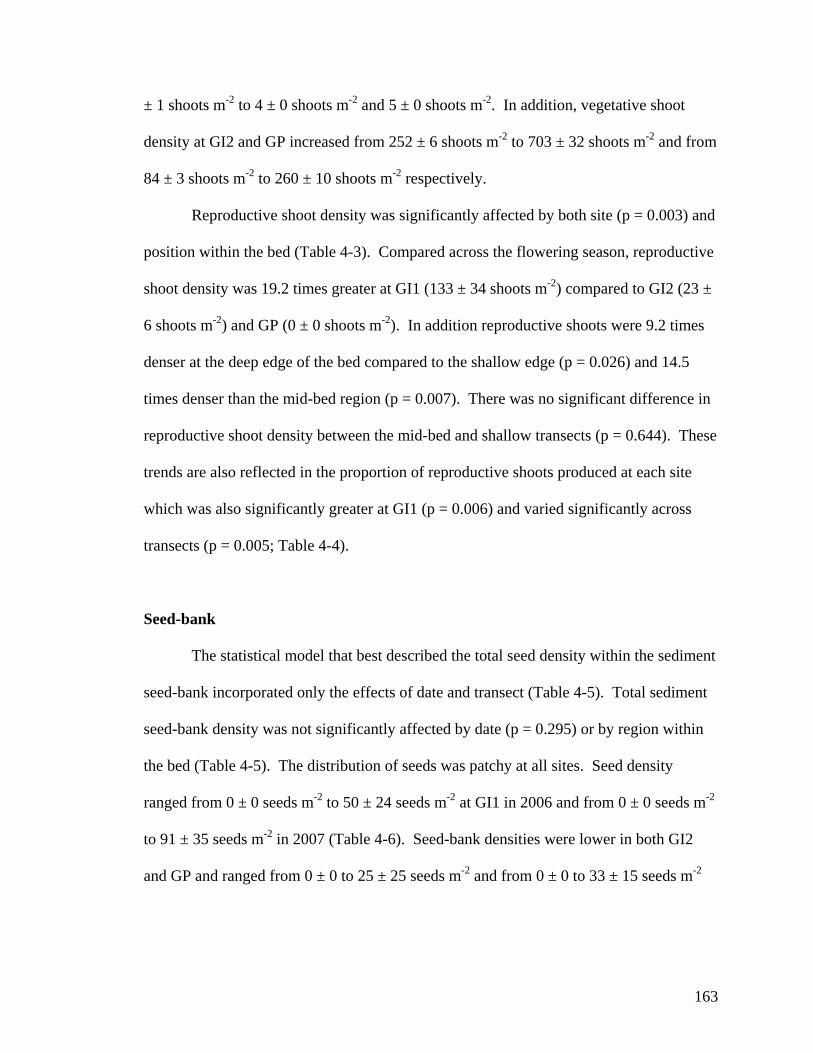
163
± 1 shoots m-2 to 4 ± 0 shoots m-2 and 5 ± 0 shoots m-2. In addition, vegetative shoot
density at GI2 and GP increased from 252 ± 6 shoots m-2 to 703 ± 32 shoots m-2 and from
84 ± 3 shoots m-2 to 260 ± 10 shoots m-2 respectively.
Reproductive shoot density was significantly affected by both site (p = 0.003) and
position within the bed (Table 4-3). Compared across the flowering season, reproductive
shoot density was 19.2 times greater at GI1 (133 ± 34 shoots m-2) compared to GI2 (23 ±
6 shoots m-2) and GP (0 ± 0 shoots m-2). In addition reproductive shoots were 9.2 times
denser at the deep edge of the bed compared to the shallow edge (p = 0.026) and 14.5
times denser than the mid-bed region (p = 0.007). There was no significant difference in
reproductive shoot density between the mid-bed and shallow transects (p = 0.644). These
trends are also reflected in the proportion of reproductive shoots produced at each site
which was also significantly greater at GI1 (p = 0.006) and varied significantly across
transects (p = 0.005; Table 4-4).
Seed-bank
The statistical model that best described the total seed density within the sediment
seed-bank incorporated only the effects of date and transect (Table 4-5). Total sediment
seed-bank density was not significantly affected by date (p = 0.295) or by region within
the bed (Table 4-5). The distribution of seeds was patchy at all sites. Seed density
ranged from 0 ± 0 seeds m-2 to 50 ± 24 seeds m-2 at GI1 in 2006 and from 0 ± 0 seeds m-2
to 91 ± 35 seeds m-2 in 2007 (Table 4-6). Seed-bank densities were lower in both GI2
and GP and ranged from 0 ± 0 to 25 ± 25 seeds m-2 and from 0 ± 0 to 33 ± 15 seeds m-2

164
respectively. Of the seeds collected from the seed-bank in either site in 2006 and 2007,
no seeds were found to be viable.
Discussion
The results of this study highlight the vulnerability of Chesapeake Bay Z. marina
beds to repeated disturbance events once the loss of resiliency provided by a viable
sediment seed-bank is removed. Following a sudden and large scale decline in the fall of
2005, Z. marina beds in the York River were re-established via both seedlings (48 – 54 %
of total shoot density) and surviving vegetative shoots in < 1 year. By the summer of
2006 the populations had returned to pre 2005 decline population levels. During the
second year of recovery in 2007 vegetative shoots were present at all beds while newly
established seedlings contributed < 6 % of total shoot density. Throughout the recovery
period few reproductive shoots were observed (2006: 0 % shoot density; 2007: < 1% of
total shoot density) and no viable seeds were recorded in the sediment seed-bank leaving
the seed-bank depleted. In the fall of 2006 the upriver bed (GP) suffered a second,
consecutive decline presumably due to poor water quality conditions. The re-
establishment at the upriver bed after the secondary decline was very limited compared to
the recovery observed at the same site in 2006 (1,020 ± 485 shoots m-2 in 2006; 168 ±
168 shoots m-2 in 2007). There was a lack of replenishment of the sediment seed-bank
following the 2005 disturbance event that restricted capacity for bed re-growth at the
upriver bed in 2007.
During the initial recovery stages (April – May 2006) seedlings dominated and
contributed > 80% to total shoot density at all beds. By September 2006 total shoot

165
density shifted from seedling to vegetative shoot dominance and throughout 2007 < 6 %
of shoots collected were seedlings. Similar trends of two step recruitment processes with
initial re-colonization by seeds shifting to vegetative shoot dominance have been reported
following large scale Z. marina die-backs (Plus et al., 2003; Greve et al., 2005; Lee et al.,
2007). The shift to vegetative shoot dominance has been attributed to substantial (90-
95 %) seedling mortality (Greve et al., 2005) and/or to increased rhizome
elongation/branching over time in surviving vegetative shoots (Plus et al., 2003; Lee et
al., 2007). The lack of a sudden decline in seedling density and biomass in this study
indicates that a massive seedling mortality event did not occur in 2006 and that the shift
is more likely due to greater rhizome branching rates by surviving vegetative shoots.
During the initial months of bed re-establishment following a sudden large scale
decline seedlings have been found to grow at accelerated rates reaching a stable size by
3.5 months (Greve et al., 2005). As a result, seed production may only be limited and not
completely lost for the first year post decline and return to or exceed pre-decline seed
production levels after two years of growth (Lee et al., 2007). While seedlings in this
study grew at an accelerated rate and reached maximum biomass numbers within 4
months, reproductive shoots were not observed during the first year post-decline and
contributed <1 % to total shoot production during the second year of monitoring. For
both years reproductive shoot densities were well below the 11-19 % Chesapeake Bay
average (Silberhorn et al., 1983). In the Chesapeake Bay, seedlings typically have not
been observed to flower until their second year of growth (Orth and Moore, 1986),
therefore the lack of flowering in 2006 was not completely unexpected. Reduced
flowering in 2007 may be attributed to interannual variation in flowering shoot

166
production suggesting that a variety of factors can affect Z. marina flowering success
(Orth and Moore, 1986).
As a result of reduced flowering, seed production was limited and the sediment
seed-bank was not replenished in 2006. Z. marina seed-banks are transient and seeds
remain viable for < 1 year once incorporated into the sediment (Lamounette, 1977; Orth
et al., 2000; Jarvis Chapter 2). The large scale germination event following the 2005
decline depleted the sediment seed-bank in the lower York River from an average of 605
± 275 seeds m-2 (Harwell and Orth, 2002) to a maximum density of 50 ± 24 seeds m-2.
When viability is taken into account, seed-bank density decreased from 330 ± 330 seeds
m-2 (Harwell and Orth, 2002) to 0 ± 0 seeds m-2. The lack of replenishment in both 2006
and 2007 resulted in the loss of the ecological function of the seed-bank for a minimum
of two years following the decline event.
The impact of the loss of resiliency provided by the sediment seed-bank on
Chesapeake Bay Z. marina beds was highlighted after a secondary decline occurred in the
upriver site in 2006. The upriver site declined presumably after low light conditions
(< 22 % of available light) coincided with high summer water temperatures (> 25 ºC).
While water temperatures did not increase above the 30 ºC threshold lethal to adult Z.
marina plants, water temperatures above 25 ºC are stressful and can result in reduced
production and survival (Nerjup and Pederson, 2008). The effect of high water
temperatures on seedlings is unknown. Under laboratory conditions, low light conditions
(< 23 % of incident light) resulted in reduced lateral shoot production and seedling
biomass (Bintz and Nixon, 2001). Therefore, in areas where seedlings receive < 23 % of
incident light during their first summer of growth long-term survival is unlikely, since a

167
reduction in light levels impedes clonal reproduction. During the 2006 growing season,
light levels were reduced below 22 % of incident light from June to October in the
upriver site. The combined effects of low light and high temperature conditions may
have had a significant impact on seedling survival resulting in the secondary decline. In
2007, no seedlings were observed, vegetative shoot density did not increase above 21
shoots m-2, and biomass did not increase above 5.26 g m-2 resulting in a nearly complete
loss of Z. marina at this site.
The limited re-establishment of Z. marina at the upriver site in 2007 highlights
both the important role of seedlings in the initial phase following a large scale decline
and the vulnerability of Z. marina beds to repeated disturbance. Protected in the
sediment seed-bank, Z. marina seeds were able to survive the high summer water
temperatures in July and August 2005 and germinate in the fall when water temperatures
returned to tolerable levels. A large scale germination event following the 2005 decline
initiated the recovery at all sites in 2006; however, it also depleted the sediment seed-
bank. Reduced flowering in the spring of 2006 combined with a lack of viability of the
remaining seeds in the sediment seed-bank resulted in a reduced seed-bank for at least
one year following the 2005 large scale germination event. Therefore, following a
second decline in the summer of 2006 the recovery of the upriver site was limited by a
lack of seed germination and seedling establishment.
Adaptations for Z. marina beds to repeated disturbances in the Chesapeake Bay
are limited. While sexual reproduction in Z. marina beds can increase in response to
disturbances (Phillips et al., 1983; van Lent and Verschuure, 1994), flowering in
perennial Z. marina seedlings is limited and the effects of stress on Z. marina flowering
168
are unknown. Although annual and semi-annual Z. marina seedlings are capable of
flowering, the development of annual and semi-annual beds is poorly understood (Keddy
and Patriquin, 1978; Meling-Lopez and Ibarra-Obando, 1999; Jarvis Chapter 1) and to
date no annual or semi-annual populations have been observed in the Chesapeake Bay.
During the next several decades, perturbations due to increased water temperatures
(Preston, 2004) and low light conditions as a result of rising sea level and climate
changes (Harley et al., 2006) are predicted to increase in coastal systems. Based on the
results shown here, without adaptation, multiple consecutive years of disturbance related
declines may result in large scale, long-term loss of Z. marina in the Chesapeake Bay.

169
Literature Cited
Allison, P.D. 1999. Logistic Regression Using the SAS System: Theory and Application. Cary NC, SAS Institute Inc. Association of Official Seed Analysts. 1981. Rules for testing seeds. Journal of Seed Technology 6(2): 1-126. Bintz, J.C. and S. W. Nixon. 2001. Responses of eelgrass Zostera marina seedlings to reduced light. Marine Ecology Progress Series 223: 133-141. Burnham, K.P. and D.R. Anderson. 2002. Model Selection and multimodel inference: a practical information-theoretic approach; Second Edition. Springer Science and Business Media Inc. New York, NY. pp 488. Combroux, I., G. Bornette, N.J. Willby, and C. Amoros. 2001. Regenerative strategies of aquatic plants in disturbed habitats: the role of the propagule bank. Arch. Hydrobiol 152(2): 215-235. den Hartog C. 1970. The Sea-Grasses of the World. North-Holland, Amsterdam. Dennison W.C., R.J. Orth, K.A. Moore, J.C. Stevenson, V. Carter, S. Kollar, P.W. Bergstrom, and R.A. Batiuk. 1993. Assessing water quality with submersed
aquatic vegetation: Habitat requirements as barometers of Chesapeake Bay health. BioScience 43(2): 86-94.
Erftemeijer P.L.A and E.W. Koch. 2001. Sediment geology methods for seagrass habitat. In Global Seagrass Research Methods. Short FT and Coles RG (eds). Elsevier Science B.V., Amsterdam pp 345-367. Frederiksen, M., D. Krause-Jensen, M. Holmer, and J.S. Laursen. 2004. Long-term
changes in area distribution of eelgrass (Zostera marina) in Danish coastal waters. Aquatic Botany 78(2): 167-181.
Greve, T.M. D. Krause-Jensen, M.B. Rasmussen, and P.B. Christensen. 2005. Means of
rapid eelgrass (Zostera marina L.) re-colonization in former dieback areas. Aquatic Botany 82(2): 143-156.
Harley, C.D.G., A.R. Hughes, K.M. Hultgren, B.G. Miner, C.J.B. Sorte, C.S. Thornber, L. F. Rodriguez, L. Tomanek, and S. L. Williams. 2006. The impacts of climate change in coastal marine systems. Ecology Letters 9: 228-241. Harper J.L. 1977. Population Biology of Plants. Academic Press, London, UK. Harwell, M.C. and R.J. Orth. 2002. Seed-bank patterns in Chesapeake Bay eelgrass (Zostera marina L.): A bay-wide perspective. Estuaries 25(6): 1196-1204.

170
Harwell, M.C. and J.M. Rhode. 2007. Effects of edge/interior and patch structure on reproduction in Zostera marina L. in Chesapeake Bay, USA. Aquatic Botany 87: 147-154. Hinchey, E.K. and L.C. Schaffner. 2005. An evaluation of electrode insertion techniques for measurement of redox potential in estuarine sediments. Chemosphere 59: 703- 710. Keddy, C.J. and D.G. Patriquin. 1978. An annual form of eelgrass in Nova Scotia. Aquatic Botany 5: 163-170. Knepel, K. and K. Bogren. 2001. Revised 2002. Determination of orthophosphate by flow injection analysis. QuikChem Method 31-115-01-1-H. Lachat Instruments, Milwaukee, WI, USA. Lakon, G. 1949. The topographical tetrazolium method for determining the germinating capacity of seeds. Plant Physiology 24:389-394. Lamounette, R.G. 1977. A study of the germination and viability of Zostera marina
seeds. M.S. Thesis. Adelphi University, Biology pp 1-41. Leck, M.A., V.T. Parker, and R.L. Simpson. 1989. Ecology of Soil Seed-banks. Academic Press, Inc. Sand Diego, California, USA. Lee, K.S., J.I. Park, Y.K. Kim, S.R. Park, and J.H. Kim. 2007. Recolonization of Zostera marina following destruction caused by red tide algal bloom: the role of new shoot recruitment from seed-banks. Marine Ecology Progress Series 342: 105-115. Liao, N. 2001. Revised 2002. Determination of ammonia in brackish or seawater by flow
injection analysis. QuikChem Method 31-107-06-1-B. Lachat Instruments, Milwaukee, WI, USA.
Meling-Lopez A.E. and S.E. Ibarra-Obando. 1999. Annual life cycles of two Zostera marina L. populations in the Gulf of California: contrasts in seasonality and reproductive effort. Aquatic Botany 65: 59-69. Moore, K.A., D.J. Wilcox, and R.J. Orth. 2000. Analysis of the abundance of submersed aquatic vegetation communities in the Chesapeake Bay. Estuaries 23(1): 115-127. Moore, K.A. and J.C. Jarvis. 2008. Environmental factors affecting recent summertime eelgrass diebacks in the lower Chesapeake Bay: Implications for long-term persistence. Journal of Coastal Research SI 55: 135-147.
171
Neckles, H.A., F.T. Short, S. Barker, and B.S. Kopp. 2005. Disturbance of eelgrass Zostera marina by commercial mussel Mytilus edulis harvesting in Maine: dragging impacts and habitat recovery. Marine Ecology Progress Series 285: 57- 73. Nejrup, L.B. and M.F. Pedersen. 2008. Effects of salinity and water temperature on the ecological performance of Zostera marina. Aquatic Botany 88: 239-246. Orth, R.J. 1976. The demise and recovery of eelgrass, Zostera marina, in the Chesapeake Bay, Virginia. Aquatic Botany 2: 141-159. Orth R.J. and K.A. Moore. 1983. Seed germination and seedling growth of Zostera marina L. (eelgrass) in the Chesapeake Bay. Aquatic Botany 15: 117-131. Orth, R.J. and K.A. Moore. 1984. Distribution and Abundance of Submerged Aquatic Vegetation in Chesapeake Bay: A Historical Perspective. Estuaries and Coasts 7(4B): 531-540. Orth, R.J. and K.A. Moore. 1986. Seasonal and year-to-year variations in the growth of Zostera marina L. (eelgrass) in the lower Chesapeake Bay. Aquatic Botany 24: 335-341. Orth, R.J., M.C. Harwell, E.M. Bailey, A. Bartholomew, J.T. Jawad, A.V. Lombana, K.A. Moore, J.M. Rhode, and H.E. Woods. 2000. A review of issues in seagrass seed dormancy and germination: implications for conservation and restoration. Marine Ecology Progress Series. 200: 277-288. Phillips, R.C., W.S. Grant, and C.P. McRoy. 1983. Reproductive strategies of eelgrass (Zostera marina L.). Aquatic Botany 16: 1-20. Plumb, R.H. Jr. 1981. Procedures for Handling and Chemical Analysis of Sediment and Water Samples. Technical Report EPA/CE-81-1. Prepared by Great Lakes Laboratory, State University College at Buffalo, Buffalo, NY for the U.S. Environmental Protection Agency/Corps of Engineers Technical Committee on Criteria for Dredged and Filled Material: Environmental Laboratory, U.S. Army Waterways Experiment Station, Vicksburg, MS. pp 403. Plus, M., J.M. Deslous-Paoli, and F. Dagault. 2003. Seagrass (Zostera marina L.) bed recolonization after anoxia-induced full mortality. Aquatic Botany 77(2): 149- 164. Preston, B.L. 2004. Observed winter warming of the Chesapeake Bay Estuary (1949- 2002): Implications for ecosystem management. Environmental Management. 34(1): 125.139.

172
Robertson, A.I., and K.H. Mann. 1984. Disturbance of ice and life-history adaptations of the seagrass Zostera marina. Marine Biology 80: 131–141. Santamaría-Gallegos, N.A., J.L. Sánchez-Lizaso, and E.F. Félix-Pico. 2000. Phenology and growth cycle of annual subtidal eelgrass in a subtropical locality. Aquatic Botany 66: 329-339. Sawma J.T. and C.L. Mohler. 2002. Evaluating seed viability by an umimbibed seed crush test in comparison with the tetrazolium test. Weed Technology 16:781-786. Setchell, W.A. 1929. Morphological and phonological notes on Zostera marina L. University of California Publications in Botany 14: 389-452. Shepard, F.P. 1954. Nomenclature based on sand-silt-clay ratios: an interim report. Journal of Sedimentary Petrology 24: 151-155. Silberhorn, G.M., R.J. Orth, and K.A. Moore. 1983. Anthesis and seed production in
Zostera marina L. (eelgrass) from the Chesapeake Bay. Aquatic Botany 15: 133-144.
Smith P. and K. Bogren. 2001. Determination of nitrate and/or nitrite in brackish or
seawater by flow injection analysis colorimetry. QuikChem Method 31-107-04- 1-E. Lachat Instruments, Milwaukee, WI, USA.
Strickland, J. and T. Parsons, 1972. A Practical Handbook of Seawater Analysis, Bulletin 167 (2nd ed.), Fisheries Research Board Canada, Ottawa. 310 pp. Tomlinson, P.B., 1974. Vegetative morphology and meristem dependence - The foundation of productivity in seagrasses. Aquaculture 4: 107–130. van Lent, F. and J.M. Verschuure. 1994. Intraspecific variability of Zostera marina L. (eelgrass) in the estuaries and lagoons of the southwestern Netherlands II. Relation to environmental factors. Aquatic Botany 48: 59-75. Zar, J.H., 1999. Biostatistical Analysis (4th Ed.). Prentice Hall, Upper Saddle River, New Jersey.

173
Table 4-1. Negative binomial results and odds ratios for the effects of year, site, and their interactions on Z. marina shoot density in the lower York River, VA between 2004 – 2007. All significant results are denoted with an (*).
Wald 95 % CL
Parameter DF Est SE X 2 p odds ratio Low High Intercept 1 5.59 0.15 1319.27 <0.001* -- -- -- Site GI 1 0 -- -- -- -- -- -- -- GI 2 1 -0.21 0.31 0.46 0.495 0.81 0.44 1.48 GP 1 0.12 0.37 0.11 0.744 1.13 0.54 2.34 Date
2004 1 -- -- -- -- -- -- -- 2005 1 -0.68 0.24 8.25 0.004* 0.51 0.32 0.81 2006 1 -0.57 0.19 9.10 0.003* 0.57 0.39 0.82 2007 1 -0.73 0.19 14.23 0.000* 0.48 0.33 0.71
Site*Date GI1*2004 0 -- -- -- -- -- -- -- GI1*2005 0 -- -- -- -- -- -- -- GI1*2006 0 -- -- -- -- -- -- -- GI1*2007 0 -- -- -- -- -- -- -- GI2*2004 1 -- -- -- -- -- -- -- GI2*2005 1 0.49 0.46 1.14 0.285 1.64 0.66 4.02 GI2*2006 1 0.28 0.38 0.55 0.456 1.32 0.63 2.76 GI2*2007 1 -0.11 0.38 0.08 0.778 0.90 0.42 1.90 GP*2004 1 -- -- -- -- -- -- -- GP*2005 1 -0.39 0.55 0.51 0.475 0.67 0.23 1.99 GP*2006 1 -0.77 0.46 2.51 0.094 0.46 0.19 1.14 GP*2007 1 -2.64 0.47 31.53 <0.001* 0.07 0.03 0.18
Dispersion 1 3.22 0.13

174
Table 4-2. Negative binomial results and odds ratios for the effects of year, and site on Z. marina vegetative above ground biomass. Reproductive shoot biomass was analyzed for the effects of site and transect only. All significant results are denoted with an (*).
Wald 95 % CL Parameter DF Est SE X 2 p odds ratio Low High
Vegetative Shoots Intercept 1 -2871.80 389.64 Time 1 1.43 0.19 54.44 <0.001* 4.19 2.86 6.13 Transect Shallow 0 -- -- -- -- -- -- -- Mid-Bed 1 0.25 0.24 1.08 0.298 1.20 0.80 2.07 Deep 1 0.63 0.25 6.69 0.010* 1.88 1.17 3.04 Site GI1 0 -- -- -- -- -- -- -- GI2 1 -0.65 0.24 7.66 0.006* 0.52 0.33 0.83 GP 1 -1.69 0.25 47.33 <0.001* 0.19 0.11 0.30 Source 1 8276.25 606.83 186.01 <0.001* -- -- -- Time*Source 1 -4.12 0.30 186.08 <0.001* 0.02 0.11 0.30 Transect*Source Shallow*Source 0 -- -- -- -- -- -- -- Mid-Bed*Source 1 -0.53 0.35 2.25 0.133 0.59 0.30 1.18 Deep*Source 1 -0.85 0.36 5.53 0.019* 0.43 0.21 0.87 Site*Source GI1*Source 0 -- -- -- -- -- -- -- GI2*Source 1 -1.38 0.36 14.27 <0.001* 0.25 0.12 0.52 GP*Source 1 -0.12 0.37 0.09 0.758 0.90 0.43 1.85 Dispersion 1 5.71 0.32 Reproductive Shoots Intercept 1 2.53 0.51 Site 1 -1.60 0.53 8.93 <0.001* 0.20 0.07 0.58 Transect Shallow 0 0.00 0.00 0.00 -- -- -- -- Mid-bed 1 -0.73 0.64 1.31 0.252 0.48 0.14 1.68 Deep 1 0.49 0.63 0.61 0.435 1.63 0.48 5.55 Dispersion 1 9.43 1.62
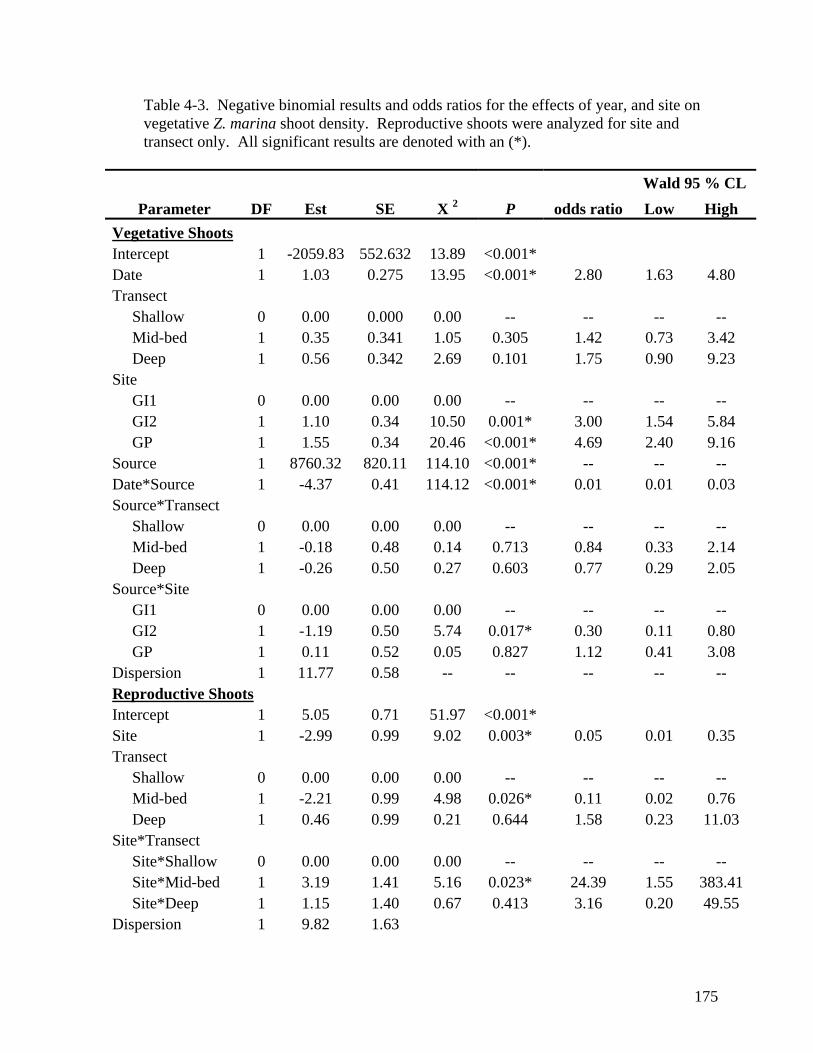
175
Table 4-3. Negative binomial results and odds ratios for the effects of year, and site on vegetative Z. marina shoot density. Reproductive shoots were analyzed for site and transect only. All significant results are denoted with an (*).
Wald 95 % CL Parameter DF Est SE X 2 P odds ratio Low High
Vegetative Shoots Intercept 1 -2059.83 552.632 13.89 <0.001* Date 1 1.03 0.275 13.95 <0.001* 2.80 1.63 4.80 Transect Shallow 0 0.00 0.000 0.00 -- -- -- -- Mid-bed 1 0.35 0.341 1.05 0.305 1.42 0.73 3.42 Deep 1 0.56 0.342 2.69 0.101 1.75 0.90 9.23 Site GI1 0 0.00 0.00 0.00 -- -- -- -- GI2 1 1.10 0.34 10.50 0.001* 3.00 1.54 5.84 GP 1 1.55 0.34 20.46 <0.001* 4.69 2.40 9.16 Source 1 8760.32 820.11 114.10 <0.001* -- -- -- Date*Source 1 -4.37 0.41 114.12 <0.001* 0.01 0.01 0.03 Source*Transect Shallow 0 0.00 0.00 0.00 -- -- -- -- Mid-bed 1 -0.18 0.48 0.14 0.713 0.84 0.33 2.14 Deep 1 -0.26 0.50 0.27 0.603 0.77 0.29 2.05 Source*Site GI1 0 0.00 0.00 0.00 -- -- -- -- GI2 1 -1.19 0.50 5.74 0.017* 0.30 0.11 0.80 GP 1 0.11 0.52 0.05 0.827 1.12 0.41 3.08 Dispersion 1 11.77 0.58 -- -- -- -- -- Reproductive Shoots Intercept 1 5.05 0.71 51.97 <0.001* Site 1 -2.99 0.99 9.02 0.003* 0.05 0.01 0.35 Transect Shallow 0 0.00 0.00 0.00 -- -- -- -- Mid-bed 1 -2.21 0.99 4.98 0.026* 0.11 0.02 0.76 Deep 1 0.46 0.99 0.21 0.644 1.58 0.23 11.03 Site*Transect Site*Shallow 0 0.00 0.00 0.00 -- -- -- -- Site*Mid-bed 1 3.19 1.41 5.16 0.023* 24.39 1.55 383.41 Site*Deep 1 1.15 1.40 0.67 0.413 3.16 0.20 49.55 Dispersion 1 9.82 1.63

176
Table 4-4. Mean percent of total Z. marina flowering shoots found in the shallow, mid-bed, and deep regions of the GI1, GI2, and GP sites in 2006 and 2007. Values mean ± S.E.
GI1 GI2 GP Date Shallow Mid-Bed Deep Shallow Mid-Bed Deep Shallow Mid-Bed Deep
2006 April 0 ± 0 0 ± 0 0 ± 0 0 ± 0 0 ± 0 0 ± 0 0 ± 0 0 ± 0 0 ± 0 May 0 ± 0 0 ± 0 0 ± 0 0 ± 0 0 ± 0 0 ± 0 0 ± 0 0 ± 0 0 ± 0 June 0 ± 0 0 ± 0 0 ± 0 0 ± 0 0 ± 0 0 ± 0 0 ± 0 0 ± 0 0 ± 0 July 0 ± 0 0 ± 0 0 ± 0 0 ± 0 0 ± 0 0 ± 0 0 ± 0 0 ± 0 0 ± 0 2007 April 4 ± 3 2 ± 2 41 ± 15 3 ± 3 0 ± 0 20 ± 9 0 ± 0 0 ± 0 0 ± 0 May 36 ± 17 7 ± 6 19 ± 1 1 ± 1 4 ± 3 4 ± 2 0 ± 0 0 ± 0 0 ± 0 June 0 ± 0 0 ± 0 3 ± 2 0 ± 0 7 ± 7 1 ± 1 0 ± 0 0 ± 0 0 ± 0 July 11 ± 6 0 ± 0 3 ± 2 0 ±0 1 ± 1 1 ± 1 0 ± 0 0 ± 0 0 ± 0

177
Table 4-5. Negative binomial results and odds ratios for the effects of date and transect on total Z. marina seed-bank density.
Wald 95 % CL Parameter DF Est SE X 2 p odds ratio Low High
Intercept 1 -1217.58 1166.60 1.09 0.297 Date 1 0.61 0.58 1.10 0.295 1.84 0.59 5.74 Transect Shallow 0 0.00 0.00 0.00 -- -- -- -- Mid-bed 1 -0.43 0.69 0.38 0.537 0.65 0.17 2.53 Deep 1 -0.81 0.68 1.42 0.233 0.44 0.12 1.69 Dispersion 1 47.82 5.85
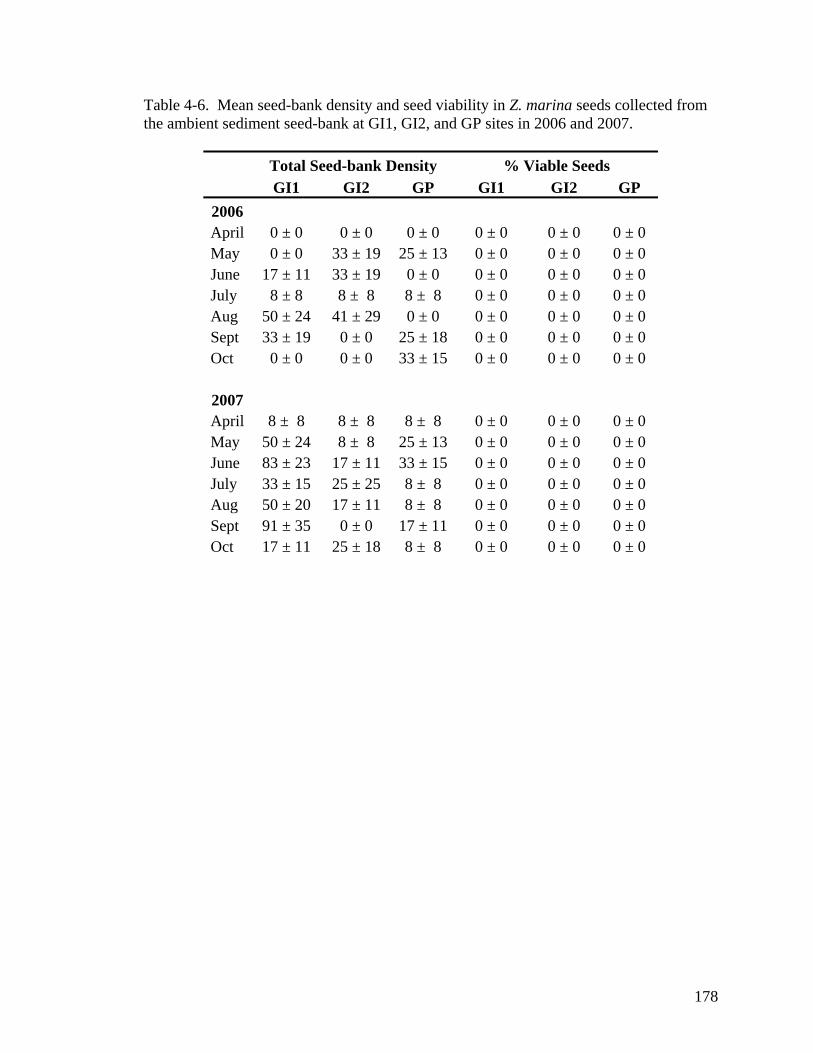
178
Table 4-6. Mean seed-bank density and seed viability in Z. marina seeds collected from the ambient sediment seed-bank at GI1, GI2, and GP sites in 2006 and 2007.
Total Seed-bank Density % Viable Seeds GI1 GI2 GP GI1 GI2 GP
2006 April 0 ± 0 0 ± 0 0 ± 0 0 ± 0 0 ± 0 0 ± 0 May 0 ± 0 33 ± 19 25 ± 13 0 ± 0 0 ± 0 0 ± 0 June 17 ± 11 33 ± 19 0 ± 0 0 ± 0 0 ± 0 0 ± 0 July 8 ± 8 8 ± 8 8 ± 8 0 ± 0 0 ± 0 0 ± 0 Aug 50 ± 24 41 ± 29 0 ± 0 0 ± 0 0 ± 0 0 ± 0 Sept 33 ± 19 0 ± 0 25 ± 18 0 ± 0 0 ± 0 0 ± 0 Oct 0 ± 0 0 ± 0 33 ± 15 0 ± 0 0 ± 0 0 ± 0
2007 April 8 ± 8 8 ± 8 8 ± 8 0 ± 0 0 ± 0 0 ± 0 May 50 ± 24 8 ± 8 25 ± 13 0 ± 0 0 ± 0 0 ± 0 June 83 ± 23 17 ± 11 33 ± 15 0 ± 0 0 ± 0 0 ± 0 July 33 ± 15 25 ± 25 8 ± 8 0 ± 0 0 ± 0 0 ± 0 Aug 50 ± 20 17 ± 11 8 ± 8 0 ± 0 0 ± 0 0 ± 0 Sept 91 ± 35 0 ± 0 17 ± 11 0 ± 0 0 ± 0 0 ± 0 Oct 17 ± 11 25 ± 18 8 ± 8 0 ± 0 0 ± 0 0 ± 0

179
Figure 4-1. Study site location with respect to the Chesapeake Bay. GI1 and GI2, the down river sites, are located at the mouth of the York River and GP, the upriver site, was located 10 km up river at Gloucester Point. Site locations are denoted with a star.

180
01/06 05/06 09/06 01/07 05/07 09/07 01/08
Wat
er T
empe
ratu
re (C
)
12
14
16
18
20
22
24
26
28
30 GIGP
01/06 05/06 09/06 01/07 05/07 09/07 01/08
Salin
ity (p
ss)
14
16
18
20
22
24
Date
01/06 05/06 09/06 01/07 05/07 09/07 01/08
Kd (
mm
ol m
-2 s-1
)
0.0
0.5
1.0
1.5
2.0
2.5
3.0
A
B
C
Figure 4-2. Water quality conditions at both the up river (GP) and down river sites (GI). Monthly mean (A) water temperature, (B) salinity, (C) and light attenuation values are given for 2006 and 2007. Values are ± S.E. The black line represents 22 % light available through the water column.

181
Date
04/04 10/04 04/05 10/05 04/06 10/06 04/07 10/07
Den
sity
(sho
ots m
-2)
0
100
200
300
400
500
600
GI 1GI 2GP
Pre-Decline Post-Decline
Figure 4-3. Z. marina density at three locations in the lower York River, VA from 2004 – 2007. Black line marks large scale decline of Z. marina in the lower Chesapeake Bay in 2005. Mean density ± standard error values are given for the up river (GI1 – black circle, GI2 - grey triangle and down river (GP – white square) sites for both pre-decline and post-decline time periods.

182
01/06 05/06 09/06 01/07 05/07 09/07 01/08
Den
sity
(sho
ots m
-2)
100
300
500
700
900
0
200
400
600
800
1000 ShallowMid-BedDeep
01/06 05/06 09/06 01/07 05/07 09/07 01/08
Den
sity
(sho
ots m
-2)
100
300
500
700
900
0
200
400
600
800
1000
Date
01/06 05/06 09/06 01/07 05/07 09/07 01/08
Den
sity
(sho
ots m
-2)
100
300
500
700
900
0
200
400
600
800
1000
A
B
C
Figure 4-4. Mean Z. marina density for the down river (A – GI1, B – GI2), and upriver (C – GP) shallow, medium, and deep transects in 2006 – 2007. Values are reported as mean ± standard error.

183
01/06 05/06 09/06 01/07 05/07 09/07 01/08
Abo
ve G
roun
d B
iom
ass (
g D
W m
-2)
25
75
125
175
0
50
100
150
200
SeedlingsVegetative Shoots
01/06 05/06 09/06 01/07 05/07 09/07 01/08
Abo
ve g
roun
d bi
omas
s (g
DW
m-2)
25
75
125
175
0
50
100
150
200
Date
01/06 05/06 09/06 01/07 05/07 09/07 01/08
Abo
ve G
roun
d B
iom
ass (
g D
W m
-2)
25
75
125
175
0
50
100
150
200
01/06 05/06 09/06 01/07 05/07 09/07 01/08
25
75
125
175
0
50
100
150
200
01/06 05/06 09/06 01/07 05/07 09/07 01/08
25
75
125
175
0
50
100
150
200
Date
01/06 05/06 09/06 01/07 05/07 09/07 01/08
25
75
125
175
0
50
100
150
200
01/06 05/06 09/06 01/07 05/07 09/07 01/08
25
75
125
175
0
50
100
150
200
01/06 05/06 09/06 01/07 05/07 09/07 01/08
25
75
125
175
0
50
100
150
200
Date
01/06 05/06 09/06 01/07 05/07 09/07 01/08
25
75
125
175
0
50
100
150
200
Down river - GI 1 Down river - GI 2 Upriver - GPA
B
C
Figure 4-5. Mean vegetative shoot above ground biomass for all sites. Data are shown for the (A) shallow (B) mid-bed and (C) deep transects. Values are shown as mean ± standard error.

184
01/06 05/06 09/06 01/07 05/07 09/07 01/08
Rep
rodu
cive
Sho
ot B
iom
ass (
g D
W m
-2)
0
20
40
60
80
100
120
140
ShallowMid-BedDeep
01/06 05/06 09/06 01/07 05/07 09/07 01/08
Rep
rodu
ctiv
e Sh
oot B
iom
ass (
g D
W m
-2)
0
20
40
60
80
100
120
140
Date
01/06 05/06 09/06 01/07 05/07 09/07 01/08
Rep
rodu
ctiv
e Sh
oot B
iom
ass (
g D
W m
-2)
0
20
40
60
80
100
120
140
A
B
C
Figure 4-6. Mean reproductive shoot above ground biomass at the down river (A – GI1, B – GI2), and upriver (C – GP) sites. Values are shown as mean ± standard error.
185
CHAPTER 5 : MODELING LOSS AND RECOVERY OF ZOSTERA MARINA BEDS IN THE CHESAPEAKE BAY FOLLOWING REPEATED DISTURBANCE EVENTS:
THE ROLE OF SEEDLINGS AND SEED-BANK VIABILITY.

186
Abstract
The loss and recovery processes following a large scale decline in Zostera marina in the
York River, Virginia was modeled using a Z. marina production model containing a
sexual reproduction component. Reproductive shoot production, total seeds produced,
density of seeds in the seed-bank, seed viability, and seed germination were added to
determine the contribution of sexual reproduction to bed resilience. The base model was
calibrated to Z. marina, water quality, and sediment data collected from a Z. marina bed
at Goodwin Island located at the mouth of the York River and validated using data from a
bed located 10 km up river at Gloucester Point. For both sites, model scenarios were run
for three years (2005 – 2007) where the effects of (1) the presence or absence of sexual
reproduction (2) projected increases in water temperature from ambient to ambient +5 º C
in 1 ºC increments; and (3) the potential interactive effects of low light and high
temperature conditions on bed maintenance and re-establishment were quantified. Model
projections of Z. marina production following the 2005 decline and subsequent recovery
period were more accurate relative to in situ measurements when sexual reproduction was
added compared to the traditional production model with vegetative reproduction only.
Following the 2005 decline, in simulations where sexual reproduction was included,
model results project an initial period of recovery in 2006 in all temperature treatments.
Without the inclusion of sexual reproduction, there is no projected recovery following the
2005 decline regardless of temperature. However, resiliency to increased water
temperature provided by sexual reproduction was limited, as a 1 ºC increase in
temperature resulted in a reduction of biomass to 0 g C m-2 by year three. Differences in
water quality between sites also affected Z. marina above and below ground production,

187
seed production, seed viability and seed germination. The combination of lower light and
temperature stress present at the upriver site resulted in overall lower production and
resiliency to declines compared to the down river site. The results of all model scenarios
highlight the need to incorporate sexual reproduction into Z. marina ecosystem models,
the projected sensitivity of established Z. marina beds to consecutive years of stress, and
the negative effects of multiple stressors on Z. marina recovery.
Key Words: Zostera marina, sexual reproduction, ecological model, seeds
188
Introduction
Seagrass populations, vital components of coastal ecosystems, have declined
globally over the last several decades (den Hartog, 1970; Orth et al., 2006; Short et al.,
2006). Global declines, predicted to increase over time (Durate, 2002), have been linked
to coastal development (Short and Wyllie-Echeverria, 1996), eutrophication (Short et al.,
2006a), and climate change (Short and Neckles, 1999). Within the Chesapeake Bay,
Virginia large scale declines in Zostera marina populations have been attributed to
chronic declines in water quality compounded by episodic stresses from short term events
such as tropical storms or high water temperatures (Orth and Moore, 1983; Moore and
Jarvis, 2008). Restoration attempts in the Chesapeake have increased in response to
continued declines; however, efforts have proven to be primarily unsuccessful (Shafer
and Bergstrom, 2008). In order to increase restoration efficiency, effectiveness, and
success a better understanding of bed resiliency to perturbations, as well as loss and
recovery processes within established seagrass beds is required (Duarte, 2002; Orth et al.,
2006).
Ecological models are a useful tool in quantitative analysis of complex
ecosystems such as seagrass beds. Through models, the response of Z. marina to
stressful environmental conditions such as low light, high nutrients, and high
temperatures has been quantified under a variety of situations (Wetzel and Neckles, 1986;
Bach, 1993; Aveytua-Alcázar et al., 2008). While these models provide insight into the
singular and combined effects of environmental stressors on Z. marina production, the
capacity to accurately model population responses to stressful conditions is limited by
focusing solely on vegetative reproduction and ignoring sexual reproduction (van Lent,

189
1995). Exclusion of sexual reproduction in carbon based models has been accepted due
the dominance of vegetative reproduction in perennial Z. marina beds and the relatively
low carbon value of seeds (Harwell, 2000). However, recent research has shown that
sexual reproduction plays a significant role in Z. marina bed recovery from large scale
declines (Plus et al., 2003; Greve et al., 2005); therefore a key component of the bed loss
and recovery dynamic may be missing from Z. marina production models when sexual
reproduction is excluded.
Sexual reproduction and seed production in Z. marina beds has been observed to
increase under stressful environmental conditions such as extreme temperatures (Phillips
et al., 1983). For perennial Z. marina populations, seeds in the sediment seed-bank
provide a measure of resiliency to large scale loss (Leck et al., 1989; Combroux, 2001).
Recolonization of Z. marina beds following sudden large scale declines through seed
germination and seedling establishment have been documented throughout the species
range (Plus et al., 2003; Greve et al., 2005; Lee et al., 2007). However, for the seed-bank
to provide any function, seed viability must be maintained (Leck et al., 1989). Perennial
Z. marina beds in the Chesapeake Bay region produce transient seed-banks (seeds remain
viable in the sediment for < 1 year) and must be replenished annually (Orth et al., 2000;
Jarvis Chapter 3). Successful germination of viable seeds is dependent upon
environmental cues and the surrounding sediment microenvironment (Moore et al., 1993;
Probert and Brenchly, 1999). Ecological models need to consider seed production, seed-
bank density, seed viability, and germination to accurately incorporate sexual
reproduction into seagrass production models.

190
Although vegetative reproduction is dominate in most beds, sexual reproduction
may become more important in Chesapeake Bay Z. marina beds as habitat conditions are
predicted to become increasingly stressful (Najjar, 1999; Gibson and Najjar, 2000). Over
the last fifty years (1949 – 2002) Chesapeake Bay winter water temperatures have
increased 0.8 – 1.1 ºC and are predicted to continue to increase over the next several
decades (Preston, 2004). Z. marina is a temperate seagrass species (den Hartog, 1970),
and an increase of 1 ºC may have a significant impact on Chesapeake Bay Z. marina beds
as these populations are located near the southern limit of the species distribution along
the western Atlantic where high summer water temperatures are limiting (Short and
Moore, 2006). In addition, disturbances in the form of more frequent large scale storms
and increases in rainfall are predicted to occur over the next century as one result of
global climate change (Harley, 2006). Climate change models predict that a 10 %
increase in rainfall over the Chesapeake Bay watershed will subsequently increase river
flow by 30 %, thereby increasing the nutrient and sediment input into the bay (Najjar,
1999; Gibson and Najjar, 2000). As a result of increased nutrient and sediment loads the
amount of light available to Z. marina will likely decrease, further stressing Z. marina
populations (Dennison et al., 1993).
Large scale declines in Z. marina populations due to increased water temperatures
have already been observed in the Chesapeake Bay (Moore and Jarvis, 2008). In the fall
of 2005 a sudden and large scale decline of Z. marina occurred in the lower York River, a
tributary to the Chesapeake Bay (Moore and Jarvis, 2008). The loss of above ground
biomass occurred after an extended period of summer water temperatures > 27 ºC. By
2007 Z. marina beds were re-established in the mouth of the river; however 10 km

191
upriver Z. marina re-establishment was limited. The objective of this study was to gain a
better understanding of the role of sexual reproduction in established perennial Z. marina
beds subject to temperature and light stress relative to a large scale decline through
modeling the 2005 Z. marina decline and a two year re-establishment period in the lower
York River. Sexual reproduction and a seed sub-model were used in a Z. marina
productivity model that was developed based on the established Z. marina models of
Madden and Kemp (1996), Buzzelli et al. (1999), and Cerco and Moore (2001). The
effects of (1) the presence or absence of sexual reproduction, (2) projected increases in
water temperature from ambient to ambient +5 ºC, and (3) the potential interactive effects
of low light and high temperature conditions on bed maintenance and re-establishment in
the model were simulated over the three year period. Specifically we quantified percent
change between ambient (base model conditions) and model scenarios in Z. marina
above and below ground biomass, total seed production, seed-bank density, and seed
germination.
Methods
Model Description
An established perennial Z. marina bed in the lower York River was chosen as a
basis for the production and reproduction models due to the documented decline of Z.
marina shoots in this area in the fall of 2005 (Moore and Jarvis, 2008). The model was
calibrated using data from a site located at the mouth of the York River at the Goodwin
Island National Estuarine Research Reserve (GI; 37° 13' N; 76° 23' W; Figure 5-1). Once
calibrated, the model was validated using data from a site located 10 km up river adjacent

192
to the Virginia Institute of Marine Science Gloucester Point campus (GP; 37˚ 14.8’ N,
76˚ 30.3’ W; Figure 5-1). Both sites have been monitored since 2004 as part of the
Chesapeake Bay National Estuarine Research Reserve Tier II Biological Monitoring
Program for interannual variation in cover and density.
The base Z. marina productivity model was modified from Madden and Kemp
(1996), Buzzelli et al. (1999), and Cerco and Moore (2001). State variables included
epiphyte biomass (Cepi), Z. marina vegetative shoot biomass (Czms), Z. marina vegetative
root biomass (Czmr), Z. marina seed-bank density (Zmseed); Z. marina seedling density
(Zmsd); Z. marina seedling shoot biomass (Czmss), and Z. marina seedling root biomass
(Czmsr; Figure 2). Biomass was quantified as g C m-2 and density was quantified as seeds
or shoots m-2. Forcing functions included water temperature (ºC), photoperiod (F),
photosynthetically active radiation (PAR, µE m-2 s-1), water column chlorophyll a (µg l-
1), total suspended solids (mg l-1), water column and sediment dissolved inorganic
nitrogen (DIN – NOx + NH4, µmol l-1 ), water column and sediment dissolved inorganic
phosphorus (DIP – PO4-3, µmol l-1), sediment organic content (% organic), and seed
burial depth (cm; Figures 5-3 and 5-4).
The initial model was developed with a simulation time of 1.5 years (April 1,
2006 through December 31 2007) with a time step (dt) of 0.125 days. The baseline
model was developed to reproduce conditions at a water depth of 0.5 m in established Z.
marina beds in the York River. Calibration values for above and below ground biomass,
flowering shoot production, and seed densities were derived from monitoring data, field
experiments, and literature values (Buzzelli et al., 1999; Harwell, 2000; Cerco and Moore
2001; Harwell and Orth 2002; Nerjup et al., 2008). Data for forcing functions were

193
collected from the Virginia Institute of Marine Science long term bi-weekly shallow
water monitoring program (Moore unpublished data) and from the Chesapeake Bay
National Estuarine Research Reserve of Virginia (CBNERRVA) water quality and
meteorological monitoring stations located at the Goodwin Islands and Taskinas Creek
sites respectively (http://www2.vims.edu/vecos/).
Z. marina production utilized both water column and sediment nutrients while
epiphytes used water column nutrients only. PAR available to epiphytes was modified by
water column chlorophyll a and total suspended solids while PAR available to Z. marina
was also attenuated by epiphyte biomass. Z. marina biomass was converted to shoot
density and a fraction of the total shoot density flowered and produced seeds. After seed
germination carbon was returned to the production model through seedling above and
below ground biomass (Figure 5-2).
Model Formulation
Production Model
Governing equations for Z. marina vegetative and seedling shoot biomass were
balanced between gains through photosynthesis and losses due to mortality, respiration
and translocation to roots and rhizomes (Table 5-1). Epiphytes were balanced similarly
with the added loss of grazing but no loss due to translocation. Production terms for both
epiphytes and Z. marina shoots were computed as the product of a temperature dependent
maximum rate (Pmax) and a limiting factor:
[ ]DIPDINPARMINPPR ,,max*= (1)
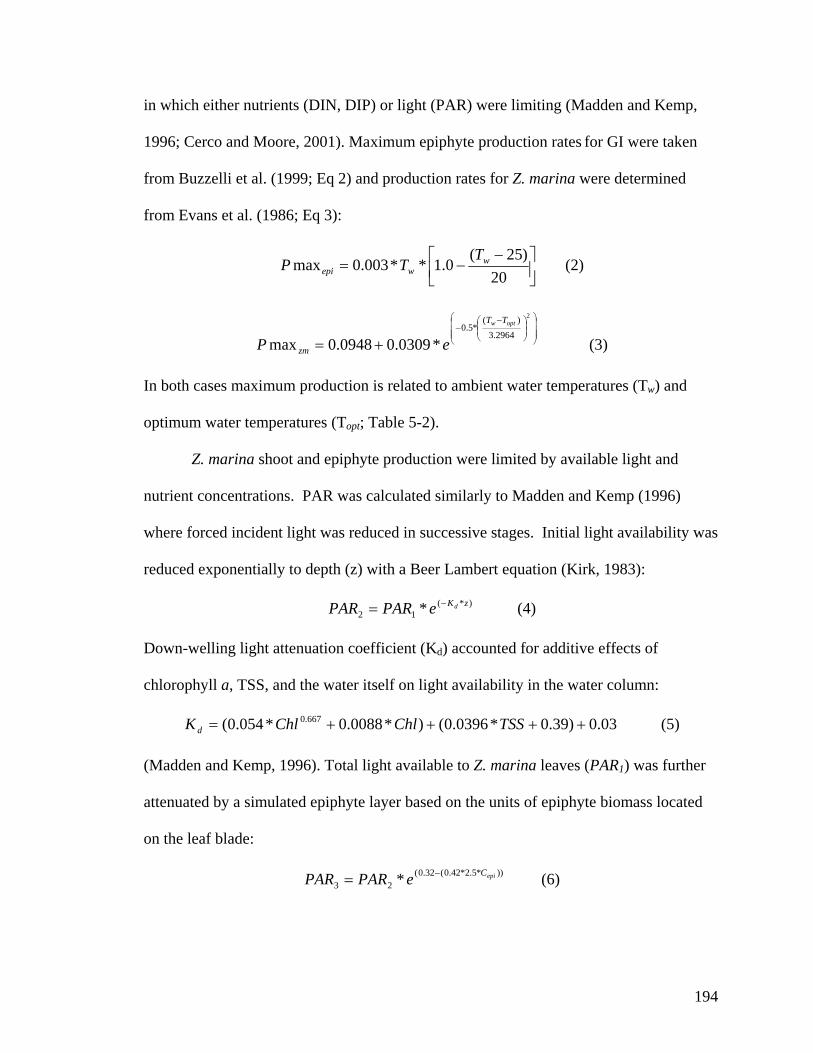
194
in which either nutrients (DIN, DIP) or light (PAR) were limiting (Madden and Kemp,
1996; Cerco and Moore, 2001). Maximum epiphyte production rates for GI were taken
from Buzzelli et al. (1999; Eq 2) and production rates for Z. marina were determined
from Evans et al. (1986; Eq 3):
⎥⎦⎤
⎢⎣⎡ −
−=20
)25(0.1**003.0max w
wepiT
TP (2)
⎟⎟⎟
⎠
⎞
⎜⎜⎜
⎝
⎛
⎟⎟⎠
⎞⎜⎜⎝
⎛ −−
+=
2
2964.3)(
*5.0
*0309.00948.0maxoptw TT
zm eP (3)
In both cases maximum production is related to ambient water temperatures (Tw) and
optimum water temperatures (Topt; Table 5-2).
Z. marina shoot and epiphyte production were limited by available light and
nutrient concentrations. PAR was calculated similarly to Madden and Kemp (1996)
where forced incident light was reduced in successive stages. Initial light availability was
reduced exponentially to depth (z) with a Beer Lambert equation (Kirk, 1983):
)*(12 * zKdePARPAR −= (4)
Down-welling light attenuation coefficient (Kd) accounted for additive effects of
chlorophyll a, TSS, and the water itself on light availability in the water column:
03.0)39.0*0396.0()*0088.0*054.0( 667.0 ++++= TSSChlChlK d (5)
(Madden and Kemp, 1996). Total light available to Z. marina leaves (PAR1) was further
attenuated by a simulated epiphyte layer based on the units of epiphyte biomass located
on the leaf blade:
))*5.2*42.0(32.0(23 * epiCePARPAR −= (6)

195
(Madden and Kemp, 1996). For both epiphytes and Z. marina light limitation on Pmax
values was calculated using Michaelis-Menteon kinetics:
)( PARKPARPAR
PAR += (7)
where light availability (PAR) is limited by a light half saturation constant ( PARK Table
5-2; Madden and Kemp, 1996).
Nutrient limitation in epiphytes was computed similarly to light limitation with
PAR substituted with water column nutrient concentrations (Nw) and the light half
saturation constant with nutrient half saturation constants for epiphytes (Table 5-2). For
Z. marina multiple sources of nutrients (sediment and water column) were taken into
account with a Monod-like function for nutrient limitation:
)*()*(
)( *
*
swhw
sw
NKNKNKN
Nf++
+= (8)
where Nw = water column nutrient concentrations (µmol l-1) in the water column, Ns =
sediment nutrient concentrations (µmol l-1); and Khw = half saturation constant for
nutrient uptake (µmol l-1) by shoots (Madden and Kemp, 1999; Cerco and Moore, 2001).
In addition:
hs
hw
KK
K =* (9)
where Khs = half saturation constant for nutrient uptake (µmol m-3) by roots (Madden and
Kemp, 1999; Cerco and Moore, 2001).
Losses from epiphytes and Z. marina shoots were attributed to mortality (leaf
sloughing in Z. marina) and respiration (Madden and Kemp, 1996; Buzzelli et al., 1999).
Z. marina had an additional loss term of translocation to the roots while epiphyte

196
production was also lost to grazing (Buzzelli et al., 1999). Epiphyte mortality was a
function of a density dependent mortality constant and the ratio of epiphyte and Z.
marina shoot carbon:
zm
epiepiepi C
CMRM *= (10)
where MRepi = the epiphyte mortality constant (Table 2; Buzzelli et al., 1999). Z. marina
mortality was a combination of a constant Z. marina mortality term over time and a
temperature dependent function:
( )zms
wzmszms C
TJDMRM *10
23*
365**0.2cos*125.00175.0 ⎟
⎠⎞
⎜⎝⎛ −
⎟⎠⎞
⎜⎝⎛−+=
π (11)
where MRzms = constant mortality rate over time (day-1, Table 5-2) and JD = Julian Day
(Buzzelli et al., 1999).
Epiphyte respiration was temperature dependent where KtBepi = constant epiphyte
respiration rate and BMRepi = epiphyte basal respiration rate:
))*((** optwepit TTBKepizmsepi eBMRCR −= (12)
(Buzzelli et al., 1999). Z. marina respiration, related to daily production via temperature,
was held at 0 and only increased when water temperatures were greater than 14 ºC
(Nejrup et al., 2008):
( ) ( )[ ]1.10*135.0105.0*00317.0** −++= wTwzmzmszms eTPRCR (13)
where Rzms = respiration and PRzm = Z. marina production (day-1; Buzzelli et al., 1999).
In addition to mortality and respiration Z. marina production was also lost through
translocation (Td) to the roots at a constant rate (day-1; Table 5-2). Epiphyte grazing was
also held constant:
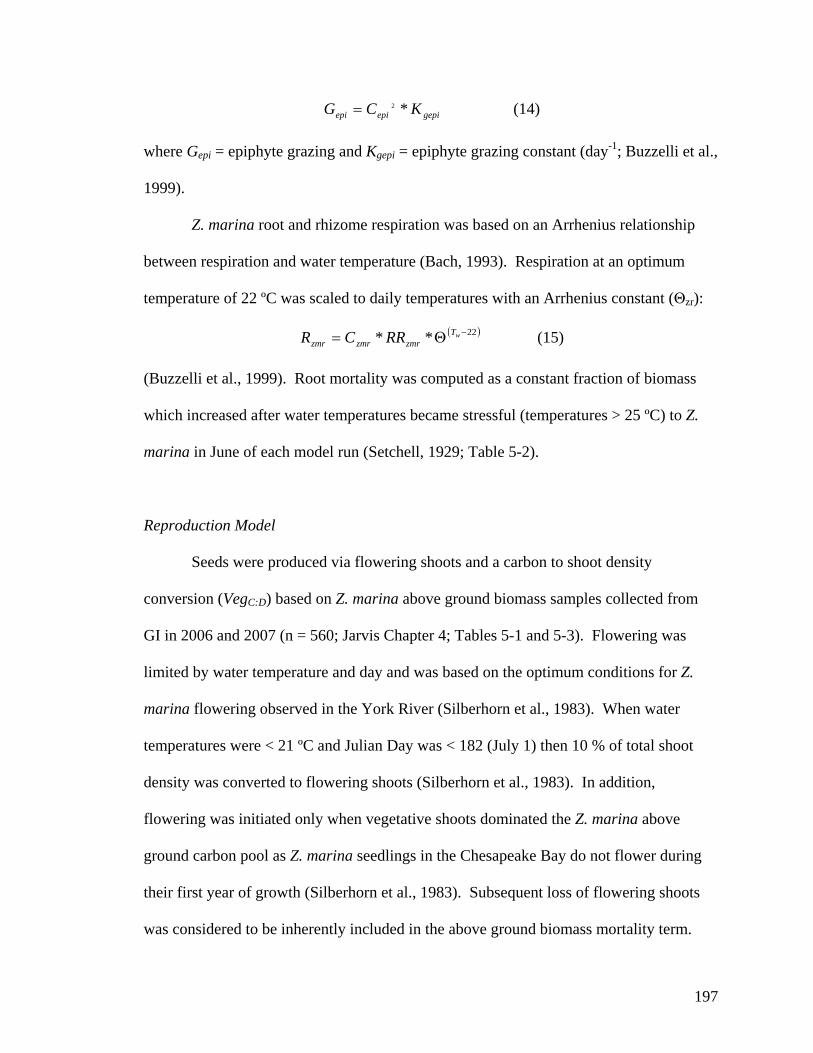
197
gepiepiepi KCG *2= (14)
where Gepi = epiphyte grazing and Kgepi = epiphyte grazing constant (day-1; Buzzelli et al.,
1999).
Z. marina root and rhizome respiration was based on an Arrhenius relationship
between respiration and water temperature (Bach, 1993). Respiration at an optimum
temperature of 22 ºC was scaled to daily temperatures with an Arrhenius constant (Θzr):
( )22** −Θ= wTzmrzmrzmr RRCR (15)
(Buzzelli et al., 1999). Root mortality was computed as a constant fraction of biomass
which increased after water temperatures became stressful (temperatures > 25 ºC) to Z.
marina in June of each model run (Setchell, 1929; Table 5-2).
Reproduction Model
Seeds were produced via flowering shoots and a carbon to shoot density
conversion (VegC:D) based on Z. marina above ground biomass samples collected from
GI in 2006 and 2007 (n = 560; Jarvis Chapter 4; Tables 5-1 and 5-3). Flowering was
limited by water temperature and day and was based on the optimum conditions for Z.
marina flowering observed in the York River (Silberhorn et al., 1983). When water
temperatures were < 21 ºC and Julian Day was < 182 (July 1) then 10 % of total shoot
density was converted to flowering shoots (Silberhorn et al., 1983). In addition,
flowering was initiated only when vegetative shoots dominated the Z. marina above
ground carbon pool as Z. marina seedlings in the Chesapeake Bay do not flower during
their first year of growth (Silberhorn et al., 1983). Subsequent loss of flowering shoots
was considered to be inherently included in the above ground biomass mortality term.

198
Seed-bank densities were derived from the product of total flowering shoot
densities and the average number of seeds per reproductive shoot (Seedstot, Table 5-3).
Once produced, seeds were then deposited into the sediment seed-bank. While in the
seed-bank a portion of the seeds were removed via mortality and predation (Table 5-3;
Fishman and Orth, 1996). The number of germinable seeds remaining in the seed-bank
was further reduced by a loss of viability (Vseeds; Table 5-3). The seeds remained in the
seed-bank until water temperatures decreased below 20 ºC as this is when germination is
initiated in Chesapeake Bay Z. marina populations (Moore et al., 1993). Due to the
transient nature of Chesapeake Bay seed-banks those seeds that did not germinate by day
365 (December 31) where then lost from the system via seed mortality (Orth et al., 2000;
Jarvis Chapter 3).
Germination of viable seeds (Seedsvia) was determined by a relationship between
sediment organic content (SO, %) and seed burial depth (BD, cm) which was held
constant at 3 cm:
( ) ( )( )( ) viaSOBDgerm Seedse
Seeds *1
1*3964.1*1261.11432.0 ⎟⎟
⎠
⎞⎜⎜⎝
⎛+
= −++− (16)
(Jarvis Chapter 2). Once germinated seedlings were then converted back to above and
below ground carbon values (Table 5-3). When above ground Z. marina biomass was <
0.44 g C m-2 then all above and below ground seedling biomass (Tczmss, Tczmsr, Table 5-1;
Figure 5-2) was transferred over to the vegetative shoot and root stocks. If vegetative
shoot carbon was > 0.44 g C m-2 then seedling mortality was 100 %. This relationship
was based on the inhibitory effect of shading by established vegetative above ground
biomass on the survival of seedlings (Phillips et al., 1983; Robertson and Mann, 1984).
199
Seedling biomass was not tracked separately through the first year of growth due to a
lack of information on seedling parameters.
Calibration, Validation, and Testing
Parameter values for epiphytes and Z. marina variables were selected from the
literature and revised to increase model fit to calibration data within ecological limits
(Table 2; Madden and Kemp, 1996; Buzzelli et al., 1999; Cerco and Moore, 2001). Due
to the lack of information on Z. marina seedling production, parameter estimates for all
variables except density to carbon ratios were assumed to be identical to vegetative
shoots. Based on in situ data, initial above ground biomass values on April 1 were 6.68 g
C m-2 and 0.77 g C m-2 at GI and GP respectively. Below ground biomass started at 9.21
g C m-2 for GI and 0.94 g C m-2 for GP. Initial epiphyte concentration was 0.25 g C m-2
for both sites. Seed-bank densities and seedling biomass (above and below ground)
started at 0. The model was calibrated to water column, sediment, and Z. marina data
collected from GI bi-weekly to monthly from April to October in 2006 and 2007 (Moore
unpublished data, Jarvis Chapter 4). Due to a lack of data on epiphytic biomass during
this time period, epiphyte values were compared solely to literature values (Cerco and
Moore, 2001). Comparisons were made between computed and observed values on a
monthly basis.
Once calibrated, the model was then validated using water quality, sediment, and
macrophyte data collected in 2006 and 2007 at GP (Jarvis Chapter 4). All model
parameters were identical to the base model; however, forcing functions were based on
GP data (http://www2.vims.edu/vecos/). Model validation was conducted both
200
graphically and statistically when possible. The sensitivity of base model conditions to
all parameter estimates and forcing functions was analyzed by sequentially varying
values by ± 5, 10, and 20 %. The percent change in all state variables between the base
model and sensitivity simulations was then calculated and tests that resulted in > 10 %
change in state variable concentrations were considered to have the greatest impact on
model results (Tables 5-4 and 5-5).
Model Scenarios
After calibration, the base model was extended to run from April 1, 2005 to
December 31, 2007 for both the downriver (GI) and upriver (GP) sites. The model was
extended to include 2005 in order to simulate the recovery of both sites after the fall 2005
decline. Forcing function data for 2005 were also collected from the CBNERRVA water
quality monitoring network (http://www2.vims.edu/vecos/).
To quantify the potential role of seeds and seedlings in the recovery and re-
establishment of Z. marina beds, the model was run with and with out sexual
reproduction. In addition, the role of the sediment seed-bank in providing resiliency to
established beds to repeated stress events was quantified by increasing water
temperatures in 1 ºC increments from ambient (base model) conditions to ambient + 5 ºC.
Finally, the singular and combined effects of light and temperature stress on Z. marina
reestablishment due to site differences in water column light attenuation were quantified
by comparing GI Z. marina bed resiliency to temperature stress (ambient to ambient + 5
ºC) under both GI and GP light attenuation conditions. Changes in above and below

201
ground Z. marina production, seed-bank density, viable seed output, and seedling density
were quantified for all runs and compared to observed values.
Results
Model Calibration
Based on field observations Z. marina above ground biomass (reported as mean ±
S.E.) in 2006 and 2007 at GI ranged seasonally from 2.42 ± 0.77 g C m-2 to 38.58 ± 8.32
g C m-2 while the model output ranged from 0.28 g C m-2 to 38.49 g C m-2 (Figure 5-5).
Overall the model captured seasonal trends in above ground biomass. The model was the
most accurate in describing the initial recolonization of GI between April and July 2006
with an average percent error between the model and field data of 30 ± 8 %. Following
the maximum peak in above ground biomass the model diverged substantially from field
measurements and the percent error from August to October averaged 87 ± 3 %. The
divergence during this time period was due to an under prediction of above ground
biomass in the model. A similar pattern in model prediction was observed in 2007 with
percent error from April to July 2007 decreasing slightly to 22 ± 12 % and to 63 ± 6 % in
August to December 2007 (Figure 5-5).
Below ground biomass also varied seasonally, but to a lesser extent than above
ground biomass. GI observed below ground biomass ranged from 9.21 ± 2.08 g C m-2 to
75.67 ± 10.25 g C m-2 while the model output ranged from 4.10 g C m-2 to 38.47 g C m-2
(Figure 5-5). Model predictions of belowground biomass were similar to observed values
in 2006 with the average percent error of 33 ± 4 %. The model was less accurate in
predicting 2007 below ground biomass as the average percent error increased to

202
41 ± 11 %. As with above ground biomass, the model under predicted below ground
biomass throughout the calibration period.
In 2007 observed seed production averaged 6,922 ± 778 seeds m-2. The model
predicted germinable seed densities of 13,034 seeds m-2 which is a percent error of 28 %.
Maximum viable seed-bank densities predicted by the model were also greater than
observed values. No viable seeds were found in the ambient sediment seed-bank in the
GI site in 2006 or 2007. In the calibration model runs 0 seeds m-2 were produced in 2006
due to seedling dominance during the spring flowering period. However, in 2007 the
model produced maximum seed viable seed-bank densities of 3,136 seeds m-2.
Model Validation
The model accurately predicted lower overall above and below ground biomass
values in GP Z. marina beds compared to GI (Figure 5-6). Observed GP above ground
biomass values ranged from 0.44 ± 0.15 g C m-2 to 7.37 ± 1.93 g C m-2 in 2006 and from
1.08 ± 0.21 g C m-2 to 15.77 ± 7.10 g C m-2 in 2007. In comparison, model projected
values ranged from 0.06 g C m-2 to 6.43 g C m-2 in 2006 and from 0.14 g C m-2 to 9.66 g
C m-2 in 2007 (Figure 5-6). Similar to the base model runs, the validation runs were the
most accurate in describing the initial recolonization in 2006 and the spring growth
period (April to July) in 2007 and under-predicted biomass during the fall (August
through October) period in both years. The model predictions for the spring growth
period in 2007 were more accurate than 2006 spring growth with an average percent error
of 27 ± 11 % in 2007 and 23 ± 11 % in 2006. Percent error from August to October

203
increased in both years with an average percent error of 56 ± 16 % in 2006 and
42 ± 21 % in 2007 (Figure 5-6).
Observed below ground biomass values were more variable at GP compared to GI
with below ground biomass ranging from 1.50 ± 0.35 g C m-2 to 11.44 ± 1.80 g C m-2 in
2006 and from 3.92 ± 1.62 g C m-2 to 26.21 ± 4.19 g C m-2 in 2007. Model projected
values were not as variable and ranged from 0.06 g C m-2 to 6.43 g C m-2 in 2006 to
0.41 g C m-2 to 9.66 g C m-2 in 2007 (Figure 5-6). Model accuracy in predicting
belowground biomass was similar between years with an average percent error of
58 ± 12 % in 2006 and 59 ± 15 % in 2007. As with above ground biomass, the model
under predicted below ground biomass throughout the validation period.
No flowering shoots were observed therefore no seeds were collected at GP in
2006 or in 2007. However, the model predicted germinable seed densities at 1,030 seeds
m-2. Maximum viable seed-bank densities predicted by the model were also greater than
observed values. No viable seeds were found in the ambient sediment seed-bank in GP in
2006 or 2007. In the validation model runs 0 seeds m-2 were produced in 2006; however,
in 2007 the model produced maximum viable seed-bank densities of 302 seeds m-2.
Sensitivity Analysis
Parameter Effects
Epiphyte biomass was most sensitive to changes in production and grazing (Table
4). Increasing grazing pressure by 5 % resulted in a significant (> 10% change) decrease
of 17.9 % in epiphyte biomass while decreasing epiphyte production by 5 % resulted in a
33.4 % reduction in epiphyte biomass. Overall epiphytes were least responsive to
204
changes in the mortality rate and in respiration. Changes in epiphyte mortality rates up to
± 20 % did not result in a significant change in epiphyte biomass while altering
respiration rates < 20 % did not significantly affect epiphyte biomass. In general
decreasing parameters had a greater effect on epiphyte biomass than increasing the
parameters by the same margin (Table 5-4).
Z. marina shoot biomass was also most sensitive to changes in production (Table
5-4). By increasing Z. marina Pmax by 5 % Z. marina biomass increased 53.5 %;
similarly increases in Z. marina photosynthetic rate by 5 % resulted in a 47.6 % increase
in Z. marina biomass. Changes in shoot to root translocation of carbon also had a
significant effect on Z. marina biomass. A reduction in carbon translocation between
shoots and roots of 5 % resulted in an increase in Z. marina biomass by 19.7 %
(Table 5-4). Mortality and respiration rates did not have a significant effect on Z. marina
biomass. Overall changes in parameter estimates which increased Z. marina shoot
production (increased Pmax and decreased translocation) had the greatest effect on Z.
marina biomass.
The greatest change in Z. marina below ground biomass occurred when
translocation of carbon from roots to shoots and shoot morality decreased by 20 % (Table
5-4). Z. marina below ground biomass decreased by 23.9 % when translocation was
reduced by 20 %. In addition a 20 % reduction in below ground mortality resulted in an
18.5 % increase in below ground biomass. Respiration did not significantly affect Z.
marina below ground biomass. As with above ground biomass, below ground parameter
estimates that increased below ground biomass (increased translocation and decreased
mortality) had the greatest effect on Z. marina below ground biomass.

205
Z. marina seed-bank densities were affected to a greater extent by factors which
reduced seed density (i.e. predation, mortality, and viability) than by factors that affected
seed production (shoot carbon to density ratio; reproductive shoot densities; Table 5-4).
Increasing and decreasing seed mortality, predation, and viability rates by 5 % resulted in
similar changes of ± 18.5 – 24.3 % in seed-bank density. Changes in flowering shoot
density directly affected seed-bank density with a 10 or 20 % increase or decrease in
flowering shoot density resulting in a similar increase or decrease in seed-bank density.
Once in the seed-bank, seed germination was highly sensitive to the number of viable
seeds (5 % increase in viable seeds = 43.9 % increase in germination) and seedling
mortality (5 % decrease in mortality = 41.2 % increase in germination). Overall seed
germination was more sensitive to increasing than decreasing seed viability while the
effects of seed mortality were similar across analyses.
Forcing Functions
All state variables were sensitive to changes in temperature (Table 5-5). Epiphyte
biomass increased 80 % with a 5 % increase in water temperature while a 5 % decrease
resulted in a 46.1 % decrease in epiphyte biomass. All Z. marina state variables were
more sensitive to decreases compared to increases in water temperature. Above and
below ground shoot production increased 87.5 % and 58.3 % respectively with a 5 %
decrease in water temperature. Seed-bank density was the most sensitive to increased
water temperature as seed-bank density increased 461.7 % in response to a 5 % decrease
in water temperature. Despite the large impact of decreased water temperature on seed-

206
bank density seed germination increased only 9.6 % when water temperatures decreased
5 % (Table 5-5).
Only epiphyte biomass and Z. marina above ground biomass were sensitive to
changes in total available PAR1 (Table 5-5). Epiphyte biomass decreased 15.5 % when
light was reduced by 5 % while increasing PAR1 by 5 % did not have a significant effect.
Above ground Z. marina biomass increased 10.4 % when PAR1 was increased by 10 %.
All state variables had a similar response to changes in PAR2 with only epiphyte and
above ground Z. marina biomass showing significant sensitivity to this forcing function.
As with PAR1 epiphyte biomass decreased 15.9 % when PAR2 was decreased 5 % and Z.
marina above ground biomass increased 10.4 % when PAR2 was increased 5 %. The
similar response in epiphytes and above ground Z. marina biomass to changes in PAR1
and PAR2 indicates a lack of sensitivity to light in this model.
When PAR3 was decreased by 5 % Z. marina above ground shoot biomass
decreased 11.6 % resulting in a 13.2 % decrease in epiphyte biomass (Table 5-5). Z.
marina below ground biomass was sensitive to PAR3 only after it had been
increased/decreased by 20 %. Below ground biomass responded similarly to a 20 %
change in PAR3 with an increase resulting in below ground biomass increasing by 18.9 %
and a decrease resulting in a 18.3 % decrease in biomass. Sensitivity to PAR3 was also
found for the Z. marina seed-bank due to changes in reproductive shoot density. Seed-
bank densities increased 12.3 % with a 5 % increase in PAR3. Seed germination was also
sensitive to increases in PAR3 with a 5 % increase in PAR3 resulting in a 56.0 % increase
in seed germination.

207
Model Scenarios
Water Temperature
Model scenarios simulating the 2005 decline and first two years of recovery in
York River Z. marina populations, quantified the effects of sexual reproduction,
temperature stress, and the combined effect of light and temperature stress on Z. marina
growth and survival. The negative effects of increased water temperature on above and
below ground Z. marina biomass were evident during year one of the model run after an
increase in water temperature of 1 ºC significantly decreased (% change > 10 %) above
and below ground biomass (Figure 5-7). During the first model run year biomass
decreased between 34.2 – 58.0 % depending on site and mode of reproduction (vegetative
only vs. mixed). Above ground biomass in subsequent model year runs also varied with
mode of reproduction; however, the trend was similar with biomass decreasing with
increasing water temperature. Maximum above ground biomass loss (100 %) occurred in
year two of the model run at both sites when water temperatures were increased to
ambient + 5 ºC. Below ground biomass was more stable and decreased by 9.8 – 10 %
with a 1 ºC temperature increase which increased to 48.8 % when water temperatures
were increased to ambient + 5 ºC.
As with above and below ground biomass, total seed production, seed-bank
density, and maximum viable seed density all decreased with increasing water
temperature (Tables 5-6 and 5-7). Decreasing seed production was similar between sites
with seed production decreasing 9.4 % in GI and 13.2 % at GP with a 1 ºC increase in
water temperature in 2005. Seed production decreased by 69.1 and 70.6 % at GI and GP
respectively when water temperature was increased 5 ºC. Although total seed production

208
under ambient conditions was the greatest of the three years with 13,034seeds m-2 and
1,656 seeds m-2 produced in GI and GP respectively, total seed production decreased to 0
seeds m-2 when water temperatures were increased to ambient + 1 ºC (Table 5-6). Seed-
bank and viable seed densities followed similar patterns to total seed production
(Table 5-7)
Reproduction
Overall the model scenarios with the mixed mode of reproduction had greater
above and below ground biomass than the vegetative only mode for year one and two
regardless of temperature. Regardless of reproduction, all biomass was lost at both sites
by year three once water temperature was increased 1 ºC (Figure 5-8). The greatest
difference between reproductive modes occurred after year one in the model run. For
models running in vegetative mode a minimum increase in water temperature of 1 ºC
resulted in complete above ground biomass loss in year one. Without a seed input above
ground biomass did not recover in year two or three regardless of site. While there was
also a decline in all Z. marina parameters in the mixed reproduction model, when seed
production was included beds at both sites recovered in year two. Despite this initial
recovery period in year two, biomass never reached year one levels and all above ground
biomass was lost by year three. Adding the mixed mode of reproduction (vegetative and
sexual) to the model allowed for limited recovery; however, multiple years of stressful
water temperatures resulted in complete loss of Z. marina regardless of reproductive
mode.

209
Below ground biomass loss was limited compared to above ground biomass
regardless of reproductive mode (Figure 5-8). For years one and two loss of below
ground biomass was similar between mixed and vegetative reproductive modes with
percent change between the two modes ranging from 0.0 to 32.8 %. By year three below
ground biomass was completely absent from either site in the vegetative only models
while the mixed models retained < 10 g C (Figure 5-8). By the end of year three below
ground biomass was absent from all runs where temperature was increased by ≥ 1 ºC.
Interactive Effects of Temperature and Light Stress
Overall model runs projected greater above ground biomass, below ground
biomass, seed production, and seed germination at GI than at GP (Figures 5-7 and 5-8).
While differences in water temperature between sites was < 10%, GP had daily TSS
values which were between 34.1 and 42.7 % greater and chlorophyll a concentrations
between 30.0 and 52.1 % greater than GI depending upon the year (Figure 5-3).
However, when the GI model was run with water column light attenuation values from
GP, the model only projected a significant decrease in above ground biomass (32.74 % in
2006 and 91.13 % in 2007) under ambient water temperatures (Figure 5-9). The
significant decrease under ambient conditions highlighted the interactive effects of
temperature and light stress on Z. marina survival. There was no significant difference in
above ground biomass between model comparisons of GI or GP water column light
attenuation conditions in 2005 or when temperatures were increased above ambient
conditions. Lowering the light levels at GI to GP conditions did not significantly
210
compound temperature stress and GI Z. marina populations continued to decline at rates
similar to the model simulations with temperature stress only (Figure 5-9).
Discussion
Model Limitations
The model presented here reproduces the general observed trends in above and
below ground Z. marina biomass in the York River following the 2005 decline; however,
it does have several limitations. One of the greatest percent errors in the base model
occurs due to a significant under-estimate (up to 84 ± 5 %) of fall Z. marina production.
Under-estimation of fall production values may be attributed to the use of constant rates
for translocation of carbon from Z. marina above ground to below ground biomass. As a
temperate species, Z. marina enters a period of quiescence or limited production when
water temperatures increase above 25 ºC (Setchell, 1929). In the Chesapeake Bay water
temperatures reach and remain above the 25 ºC threshold from late July to early
September significantly reducing Z. marina production and growth (Silberhorn et al.,
1983). The lack of above ground production may inhibit carbon translocation to below
ground biomass; however, as in Madden and Kemp (1996) and Cerco and Moore (2001),
the exact relationship is unknown therefore translocation remained constant throughout
all model runs possibly resulting in lower fall above ground biomass values. Defining
the seasonality of the relationship between temperature and translocation and leaf
sloughing within Z. marina plants is necessary to increase the accuracy of this model.
In addition, the total number of seeds produced was overestimated by the base
model in 2007 by 85 %. While this is a large percent error, the number of seeds produced

211
within the bed during the 2007 model run (1,656 to 13,034 seeds m-2) was not outside of
the reported range of perennial Z. marina seed production of 50 – 25,500 seeds m-2
(Silberhorn et al., 1983; Harwell and Rhode, 2007; Lee et al., 2007). The over-estimation
of Z. marina seed densities in the model prediction compared to in situ field
measurements may be a reflection of the relatively sparse field sampling (monthly)
compared to the finer model scenarios (daily). In addition, flowering shoot development
is affected by a variety of factors including temperature, light, and predation (Setchell,
1929; Phillips et al., 1983; Silberhorn et al., 1983). Not all impacts are lethal to the
flowering shoot; however, they may result in reduced seed production or lower seed
viability (Harper, 1977). As the relationship between environmental factors and seed
development is not defined, this remains a limitation of the model.
Once the model was expanded to include data from 2005 to 2007, the above
ground biomass predictions for GP data were up to three times greater in the model run
compared to observed values. The over-production of Z. marina biomass in the model
resulted in an average percent error of 235.17 % in 2006 and 449.74 % in 2007 compared
to observed values. The over-prediction is related to larger initial above ground biomass
conditions from seed germination following the 2005 decline. Relationships between Z.
marina seedling growth and survival and surrounding environmental conditions are not
well defined. There is some evidence that seedlings respond similarly to temperature
limitations when compared to established Z. marina plants (Bintz et al., 2003; Abe et al.,
2008); however, there is little other information available on Z. marina seedlings or the
effects of changes in habitat conditions on seedling growth and survival. Therefore, in
this model, seedling functions were identical to vegetative shoot functions and may have

212
resulted in the over-production of above ground biomass in 2006 and 2007. Information
on seedling physiology is required to increase the accuracy of the sexual reproduction
component of this model.
Sexual Reproduction, Temperature, and Light
Model projections for Z. marina production following the 2005 decline and
subsequent recovery period were more accurate when sexual reproduction was added
compared to the traditional production model with vegetative reproduction only.
Following the 2005 decline, in simulations where sexual reproduction is included, model
results project an initial period of recovery in 2006 in all temperature treatments (Figures
5-7 and 5-8). Without the inclusion of sexual reproduction, there was no recovery
following the 2005 decline regardless of temperature. However, the resiliency to
temperature stress provided by sexual reproduction is limited as a 1 ºC increase in
temperature resulted in a reduction of biomass to 0.00 g C m-2 by year three. Differences
in water quality between sites also affected Z. marina above and below ground
production, seed production, seed viability and seed germination. Under ambient
temperatures, the combination of light and temperature stress present at the upriver site
(GP) resulted in overall lower production and resiliency to declines compared to the
down river site (GI; Figure 5-9). However; when water temperatures were increased 1 ºC
temperature stress resulted in a complete reduction of above ground biomass regardless
of site (Figure 5-9). The results of all model scenarios highlight the need to incorporate
sexual reproduction into Z. marina ecosystem models, the projected sensitivity of

213
established Z. marina beds to consecutive years of stress, and the negative effects of
multiple stressors on Z. marina recovery.
Following the 2005 decline, re-establishment of both GI and GP was initiated by
seed germination and seedling establishment in the mixed reproduction model. These
results are similar to the observed recovery in the York River in 2006 where seedlings
constituted > 80 % of total shoot density at both GI and GP (Jarvis, Chapter 4). Similar
results were seen following a large scale decline in the Odense Fjord, Denmark where up
to up to 96 % of all observed shoots were seedlings during the initial recovery period
(Greve et al., 2005). While seed germination is necessary for the success of sexual
reproduction, seedling establishment and survival is a limiting factor for many autotrophs
including Z. marina (Harper et al., 1977; Harrison, 1993). In the Thau Lagoon, France
during the first 6 months following a massive germination event seedling survival rates
were 80 % (Plus et al., 2003). Similar results were seen in the model presented here
where above ground biomass increased until summer water temperatures became
limiting. The reduction in above ground biomass in response to temperature is also
observed in established Z. marina beds in the lower Chesapeake Bay (Orth and Moore,
1986).
Similarly when seeds were not produced (as in the spring and summer of 2006 in
all model runs) there was no recovery following the second consecutive decline during all
temperature scenarios in both sites (Figure 5-8). In the mixed model flowering shoot
production was absent during the spring of 2006 due to the prevalence of seedlings which
do not flower during their first year of growth in the Chesapeake Bay (Silberhorn et al.,
1983). Similarly, in the Thau Lagoon no reproductive shoots were produced during the

214
first year of re-establishment following the 2001 decline (Plus et al., 2003). A significant
increase was observed in the same system during the second year of recovery when 75 %
of total shoots were reproductive. The model described here did not increase flowering
rates at any point in the three year run. However, an increase in flowering shoot
production in the York River two years post-decline was not observed and reproductive
shoot densities remained within the 10 – 20 % of total shoot density recorded for the
York River (Silberhorn et al., 1983; Harwell and Orth, 2002).
Without the production of flowering shoots in the model in 2006 seeds were not
produced, the seed-bank was not replenished, and the resiliency provided by the seed-
bank was lost. On average, perennial Z. marina seed production ranges between 50 –
25,500 seeds m-2 (Silberhorn et al., 1983; Harwell and Rhode, 2007; Lee et al., 2007).
The model projected between 4,033 to 13,034 seeds m-2 in 2005 and between 0 and
1,656 seeds m-2 in 2007 depending upon site and water temperature (Table 5-6).
However, seed-bank density is not a direct reflection of yearly seed production (Baskin
and Baskin, 1998). Z. marina seeds are lost to dispersal (Källström et al. 2008),
predation (Fishman and Orth, 1996), and mortality (Morita et al., 2007). In Ago Bay
Japan up to 72 % of total seeds produced are lost from the system annually (Morita et al.,
2007). In this model seeds were subject to mortality and predation after they were
produced. As a result in this model seed-bank densities were 69.1 % less than total seed
production. Literature values for Z. marina sediment seed-bank densities range from 0 –
25,746 seeds m-2 (Harwell and Orth, 2002; Morita et al., 2007; Lee et al., 2007).
Maximum model seed-bank densities were found in 2005 and were well within the
literature values (max 14,970 seeds m-2). Projected seed-bank densities in 2006 were

215
similar to York River observations of 0 ± 0 seeds m-2 however projected seed-bank
densities were significantly greater in 2007 compared to observed York River values (0 ±
0 seeds m-2, Jarvis Chapter 4).
The discrepancy between model projected seed-bank values and observed values
may be explained by the patchy distribution of seeds within established Z. marina beds
(Harwell and Orth, 2002). The development of reproductive shoots within Z. marina
beds is not homogeneous (Harwell and Rhode, 2007). Seeds may still be attached to
reproductive shoots that have detached from the main vegetative shoot and may be
distributed in clumps rather than as individual seeds (Terrados, 1993). As a result
ambient seed-banks are extremely patchy and hard to quantify (Harwell and Orth, 2002).
The model does not have a spatial component therefore the patchy distribution of seeds is
not taken into account and all seeds are easily accounted for possibly resulting in the
greater predicted seed-bank densities.
In all model runs where temperature was increased, there was no re-establishment
following periods when seeds were not produced. The decline occurred in 2006 for the
runs with only vegetative reproduction, for the mixed reproduction runs the decline
occurred a year later in 2007. In the York River, Z. marina seed-banks are transient and
need to be replenished on a yearly basis because seeds are unable to maintain viability for
periods longer than 6 - 12 months (Orth et al. 2000; Harwell and Orth, 2002; Jarvis
Chapter 3). Therefore, any remaining non-germinating seeds from 2005 would not be
able to germinate in 2006 due to a loss of viability. Without the resiliency provided by
the sediment seed-bank neither bed was able to recover from a second consecutive year
of stressful conditions.

216
Within the model, Z. marina above and below ground production was able to
recover from the simulated 2005 decline under ambient water quality conditions. These
projections were supported by the observed recovery at both GI and GP in 2006 and 2007
when summer water temperatures were not limiting (Jarvis Chapter 4). However, once
temperatures were increased 1 ºC Z. marina biomass declined completely in year one in
the vegetative only model and a year later in the mixed model (Figure 5-8). These results
highlight the projected sensitivity of York River Z. marina populations to extended
periods of increased water temperatures. Z. marina populations in the York River are
located near the southern limit of the species western Atlantic distribution and are
stressed by summer water temperatures that can reach as high as 30 ºC during extreme
warming periods (Short and Moore, 2006; Moore and Jarvis, 2008). As water
temperatures increase above 20 ºC Z. marina respiration increases at a greater rate than
photosynthesis causing stress and eventually mortality when water temperatures are
greater than 25 ºC (Marsh et al., 1986; Nejrup et al., 2008). As a consequence, summer
water temperatures are limiting and result in seasonal declines in Z. marina biomass
(Orth and Moore, 1986). By increasing year round water temperatures by 1 ºC all above
ground biomass was removed from the model before cooler fall temperatures could
release Z. marina populations from summer water temperature limitation. The response
of temperature stressed Z. marina shoots to increased water temperature requires further
research as global water temperatures are predicted to rise at an increasing rate over the
next century (Stern, 2006).
Z. marina populations within the Chesapeake Bay are also stressed by low light
conditions (Dennison et al., 1993; Moore et al., 1996). This was most evident in the
217
upriver GP site where light was reduced compared to the downriver GI site (Figure 5-3).
Therefore this site was likely not as resilient to increases in water temperature as the
down river site and the Z. marina beds were not able to recover in the first year post the
2005 decline with a mixed reproduction model once temperatures were increased above
ambient + 3 ºC. These results highlight possible mechanisms behind reported limitations
in Z. marina restoration success and natural recovery of Z. marina beds in the York River
which have been attributed to seasonal pulses in turbidity (Moore et al., 1996). When
low light conditions are combined with increased water temperature the effects become
lethal to Z. marina survival (Moore and Jarvis, 2008).
Conclusions
Although the model presented here is designed with Z. marina seedling above and
below ground biomass as separate state variables, it currently moves all seedling biomass
directly to the vegetative shoot biomass pool as soon as it is produced. To gain a better
understanding of the relative amount of biomass produced by seedlings compared to
surviving vegetative material, this component of the model needs to be further refined
and run separately for at least one year. By quantifying the growth and survival of Z.
marina seedlings under a variety of environmental conditions over a longer period of
time, the role of seedlings in the recovery of perennial Z. marina beds can be elucidated.
In addition, the refinement of seedling state variables may expand the application of this
model to include annual/semi-annual as well as perennial Z. marina populations.
Overall the model results presented here highlight a need for the inclusion of
sexual reproduction within Z. marina models. This directly applies to models attempting

218
to project loss and recovery processes within Z. marina communities, as sexual
reproduction plays a large role in recovery from large scale declines. In addition, model
projections indicate that current York River Z. marina populations are near the limit for
temperature stress and increases in water temperatures as small as 1 ºC may have large
impacts on Z. marina survival. The loss of Z. marina due to temperature stress or
temperature and light stress can be ameliorated by sexual reproduction; however this
resiliency is limited by seed production and seed-bank viability and multiple concurrent
years of stress may result in long term loss of Z. marina. Further research into all aspects
of sexual reproduction, seedling establishment, growth, and survival in temperate Z.
marina beds is required to advance the understanding of loss and recovery patterns in
Chesapeake Bay Z. marina beds.
219
Literature Cited Abe, M., A. Kurashima, and M. Maegawa. 2008. Temperature requirements for seed germination and seedling growth of Zostera marina from central Japan. Fisheries Science 74: 589-593. Aveytua-Alcázar, L., V.F. Camacho-Ibar, A.J. Souza, J.I Allen, and R. Torres. 2008. Modeling Zostera marina and Ulva spp. In a coastal lagoon. Ecological Modeling 218: 354-366. Bach, H.K. 1983. A dynamic model describing the seasonal variations in growth and
distribution of Z. marina (Zostera marina L.) I. Model theory. Ecological Modeling 65: 31-50.
Baskin, C.B. and J. Baskin. 1998. Ecologically Meaningful Germination Studies. In Seeds: Ecology, Biogeography, and Evolution of Dormancy and Germination. Academic Press, London. pp 5-26. Buzzelli, C.P., R.L.Wetzel, and M.B Meyers. 1999. A linked physical and biological framework to assess bigeochemical dynamics in a shallow estuarine ecosystem. Estuarine Coastal and Shelf Science 49: 829-851. Cerco C.F. and K. Moore. 2001. System-wide submerged aquatic vegetation model for Chesapeake Bay. Estuaries 24(4): 522-534. Combroux, I., G. Bornette, N.J. Willby, and C. Amoros. 2001. Regenerative strategies of aquatic plants in disturbed habitats: the role of the propagule bank. Arch. Hydrobiol. 152(2): 215-235. den Hartog C. 1970. The Sea-grasses of the World, North Holland, Amsterdam. Dennison, W.C., R.J. Orth, K.A. Moore, J.C. Stevenson, V. Carter, S. Kollar, P.W. Bergstrom, and R.A. Batiuk. 1993. Assessing water quality with submersed aquatic vegetation: Habitat requirements as barometers of Chesapeake Bay health. BioScience 43(2): 86-94. Duarte, C.M. 2002. The future of seagrass meadows. Environmental Conservation 29(2): 192-206. Evans, A.S., K.L. Webb, and P.A. Penhale. 1986. Photosynthetic temperature acclimation in two coexisting seagrasses, Zostera marina L. and Ruppia maritima L. Aquatic Botany 24: 185-197. Fishman, J.R. and R.J. Orth. 1996. Effects of predation on Zostera marina L. seed abundance. Journal of Experimental Marine Biology and Ecology. 198: 11-26.

220
Gibson, J.R. and R.G. Najjar. 2000. The response of Chesapeake Bay salinity to climate- induced changes in stream flow. Limnology and Oceanography 45(8): 1764-1772. Greve, T.M., D. Krause-Jensen, M.B. Rasmussen, P.B. Christensen. 2005. Means of rapid eelgrass (Zostera marina L.) recolonisation in former dieback areas. Aquatic Botany 82(2): 143-156. Harley, C.D.G., A.R. Hughes, K.M. Hultgren, B.G. Miner, C.J.B. Sorte, C.S. Thornber, L. F. Rodriguez, L. Tomanek, and S. L. Williams. 2006. The impacts of climate change in coastal marine systems. Ecology Letters 9: 228-241. Harper, J.L. 1977. Population Biology of Plants. Academic Press, London, UK. Harrison, P.G. 1993. Variations in demography of Zostera marina and Z. noltii on an intertidal gradient. Aquatic Botany. 45: 63-77. Harwell, M.C. 2000. Ecological dispersal mechanisms, reproductive ecology and the importance of scale in Zostera marina in Chesapeake Bay. PhD Dissertation Virginia Institute of Marine Science, Gloucester Point VA pp 230. Harwell, M.C. and R.J.Orth. 2002. Seed-bank patterns in Chesapeake Bay eelgrass (Zostera marina L.): A bay-wide perspective. Estuaries. 25(6): 1196-1204. Harwell, M.C. and J.M. Rhode. 2007. Effects of edge/interior and patch structure on reproduction in Zostera marina L. in Chesapeake Bay, USA. Aquatic Botany 87: 147-154. Källström, B., A. Nyqvist, P. Åberg, M. Bodin, C. André. 2008. Seed Rafting as a
dispersal strategy for eelgrass (Zostera marina). Aquatic Botany, 88(2): 148-153. Kirk, J.T.O. 1983. Light and photosynthesis in aquatic ecosystems. Cambridge University Press, Cambridge, United Kingdom. Leck, M.A., V.T. Parker, and R.L. Simpson. 1989. Ecology of Soil Seed-banks. Academic Press, Inc. Sand Diego, California, USA. Lee, K.S., S.R. Park, and Y.K. Kim. 2007. Effects of irradiance, temperature, and nutrients on growth dynamics of seagrasses: A review. Journal of Experimental Marine Biology and Ecology 350: 144-175. Madden, C.J. and W.M. Kemp. 1996. Ecosystem model of an estuarine submersed plant community: calibration and simulation of eutrophication responses. Estuaries 19(2B): 457-474.
221
Marsh, J.A., W.C. Dennison, and R.S. Alberte. 1986. Effects of temperature on photosynthesis and respiration in eelgrass (Zostera marina L.). Journal of Experimental Marine Biology and Ecology 101: 257-267. Moore, K.A. and J.C. Jarvis. 2008. Environmental factors affecting recent summertime eelgrass diebacks in the lower Chesapeake Bay: Implications for long-term persistence. Journal of Coastal Research SI 55: 135-147. Moore K.A, R.J. Orth, and J.F. Nowak. 1993. Environmental regulation of seed germination in Zostera marina L. (eelgrass) in Chesapeake Bay: Effects of light, oxygen, and sediment burial. Aquatic Botany 45(1): 79-91. Moore, K.A., H.A. Neckles, and R.J. Orth. 1996. Zostera marina (eelgrass) growth and survival along a gradient of nutrients and turbidity in the lower Chesapeake Bay. Marine Ecology Progress Series 142: 247-259. Morita, T., H. Okumura, M. Abe, A. Kurashima, and M. Maegawa. 2007. Density and distribution of seeds in bottom sediments in Zostera marina beds in Ago Bay, central Japan. Aquatic Botany 87: 38-42. Najjar, R.G. 1999. The water balance of the Susquehanna River Basin and its response to climate change. Journal of Hydrobiologica 219(1-2): 7-19. Nejrup, L.B. and M.F. Pedersen. 2008. Effects of salinity and water temperature on the ecological performance of Zostera marina. Aquatic Botany 88: 239-246. Orth, R.J., T.J.B. Carruthers, W.C. Dennison, C.M. Duarte, J.W. Fourqurean, K.L. Heck Jr., A. R. Hughes, G.A. Kendrick, W. J. Kenworthy, S. Olyarnik, F.T. Short, M. Waycott, and S.L. Williams. 2006. A Global Crisis for Seagrass Ecosystems. BioScience 56(12): 987-986. Orth, R.J., M.C. Harwell, E.M. Bailey, A. Bartholomew, J.T. Jawad, A.V. Lombana, K.A. Moore, J.M. Rhode, and H.E. Woods. 2000. A review of issues in seagrass seed dormancy and germination: implications for conservation and restoration. Marine Ecology Progress Series 200: 277-288. Orth R.J. and K.A. Moore. 1983. Chesapeake Bay: an unprecedented decline in submerged aquatic vegetation. Science 222: 51-53. Orth, R.J. and K.A. Moore. 1986. Seasonal and year-to-year variations in the growth of Zostera marina L. (eelgrass) in the lower Chesapeake Bay. Aquatic Botany 24: 335-341. Phillips, R.C., W.S. Grant, and C.P. McRoy. 1983. Reproductive strategies of eelgrass (Zostera marina) L. Aquatic Botany 16: 1-20.

222
Plus, M., J.M. Deslous-Paoli, and F. Dagault. 2003. Seagrass (Zostera marina L.) bed recolonisation after anoxia-induced full mortality. Aquatic Botany 77(2): 149- 164. Preston, B.L. 2004. Observed winter warming of the Chesapeake Bay Estuary (1949- 2002): Implications for ecosystem management. Environmental Management 34(1): 125.139. Probert, R.J. and J.L. Brenchly. 1999. The effect of environmental factors on field and laboratory germination in a population of Zostera marina L. from southern England. Seed Science Research 9: 331-339. Robertson, A.I., and K.H. Mann. 1984. Disturbance of ice and life-history adaptations of the seagrass Zostera marina. Marine Biology 80: 131–141. Setchell, W.A. 1929. Morphological and phonological notes on Zostera marina L. University of California Publications in Botany 14: 389-452. Shafter, D. and P. Bergstrom. 2008. Large scale submerged aquatic vegetation restoration in the Chesapeake Bay. Final Report to the U.S. Army Corps of Engineers, ERDC/EL TR-09-20 pp 63. Short F.T. and K.A. Moore. 2006. Zostera: Biology, Ecology, and Management. In: Larkum A.W.D., R.J. Orth, and C.M. Duarte eds. Seagrasses: Biology, Ecology, and Conservation. pp 361-386. Short, F.T. and H.A. Neckles. 1999. The effects of global climate change on seagrasses. Aquatic Botany 63: 169-196. Short F.T. and S.Wyllie-Echeverria. 1996. Natural and human-induced disturbance of seagrasses. Environmental Conservation 23(1): 17-27. Silberhorn, G.M., R.J. Orth, and K.A. Moore. 1983. Anthesis and seed production in
Zostera marina L. (eelgrass) from the Chesapeake Bay. Aquatic Botany. 15: 133-144.
Stern N. 2006. The Economics of Climate Change; The Stern Review. http://www.hm- treasury.gov.uk/independent_reviews/stern_review_economics_climate_change/st ern_review_report.cfm. Terrados, J. 1993. Sexual reproduction and seed-banks of Cymodocea nodosa (Ueria) Ascherson meadows on the southeast Mediterranean coast of Spain. Aquatic Botany 46: 239-299.

223
van Lent, F.. 1995. Intraspecific variability of Zostera marina L. in the southwestern Nethrlands. PhD Dissertation. Laboratory of Aquatic Ecology, Catholic University of Nijmegen, Nijmegen, The Netherlands p 218. Wetzel, R.L. and H.A. Neckles. 1986. A model of Zostera marina L. photosynthesis and growth: Simulated effects of selected physical-chemical variables and biological interactions. Aquatic Botany 26: 307-323.

224
Table 5-1. Governing equations for (1) epiphyte biomass (Cepi; g C m-2 day-1); (2) Z. marina vegetative shoot biomass (Czms; g C m-2
day-1); (3) Z. marina vegetative root/rhizome biomass (Czmr; g C m-2
day-1); (4) Z. marina seedling shoot biomass (Czmss; g C m-2 day-1);
(5) Z. marina seedling root/ biomass (Czmsr; g C m-2 day-1); (6) Z. marina seed-bank density (Zmseeds; seeds m-2); and (7) Z. marina
seedling density (Zmsd; seedlings m-2). Terms include P = production; M = mortality; G = grazing; R = respiration; Td = translocation down; Tczmss = transfer of seedling biomass to vegetative shoot biomass; Tczmsr = transfer of seedling root/rhizome biomass to vegetative root/rhizome biomass; Seedsgerm = germinated seeds; Seeds tot = total seeds produced; Seedsvia = viable seeds; Pseeds = seed predation; Zmsd = germinated seedling density.
Differential Equations
dtRGMPdttCC epiepiepiepiepiepi *)()( −−−+−=
dtTRMTPdttCC dzmszmsczmsszmszmszms *)()( −−−++−=
dtRMTTdttCC zmrzmrczmsrdzmrzmr *)()( −−++−=
( )( )[ ] dtMSeedsSeedsPMSeedsdttZmZm germviaseedsseedstotseedsseeds *))( −−−−−+−=
dtMSeedsdttZmZm zmsdgermsdsd *)()( −+−=
( ) dtRMTTSeedsTPdttCC zmszmsdczmssDAGCczmsszmsszmsszmss *)*()( : −−−−++−=
( ) dtRMTSeedsTTdttCC zmsrzmrczmsrDBGCczmsrdzmsrzmsr *)*()( : −−−++−=

225
Table 5-2. Parameter estimates for the Z. marina production model. References: 1 = calibration, 2 = Buzzelli et al., 1999, 3 = Cerco and Moore, 2001, 4 = Madden and Kemp, 1996; 5 = Bach, 1993; 6 = Harwell and Orth, 1996.
Abbrev. Description Units Value Ref
JD Julian Day d-1 0-365 MRepi epiphyte mortality constant d-1 0.0085 1
Kgepi epiphyte grazing constant g C-1 day-1 0.01 1
BMRepi epiphyte basal metabolic rate day-1 0.047 2
KtBepi epiphyte respiration constant ºC1 0.069 2
Toptepi epiphyte optimum temperature for metabolism ºC 25 2
Khnepi epiphyte N half saturation constant µmol N m-3 1.79E-09 3
Khpepi epiphyte P half saturation constant µmol P m-3 7.14E-11 3 Khnwzm Z. marina N half saturation constant water µmol N m-3 7.14E-10 3 Khnszm Z. marina N half saturation constant sediment µmol N m-3 2.86E-09 3 Khpwzm Z. marina P half saturation constant water µmol P m-3 4.35E-10 3 Khpszm Z. marina P half saturation constant sediment µmol P m-3 7.14E-09 3, 4 KPARepi epiphyte PAR half saturation constant µE m-2 s-1 90 4 KPARzm Z. marina PAR half saturation constant µE m-2 s-1 57.5 3 MRzms Z. marina shoot mortality constant d-1 0.007 1 Toptzm Z. marina optimum temperature for metabolism ºC 22.5 3 Td Z. marina shoot to root transfer g C day -1 0.3 3 MRzmr Z. marina root mortality constant Jan - July d-1 0.000085 1 Z. marina root mortality constant July - Dec d-1 0.0095 1 RRzmr Z. marina root respiration at 20 ºC d-1 0.0005 1 Θzmr Z. marina root respiration constant unit-less 1.25 5 PRseeds Seed Predation shoots d-1 0.5 5 MRzmseeds Seed mortality constant seeds d-1 0.1 1 VRseeds Seed viability constant seeds d-1 0.4 1
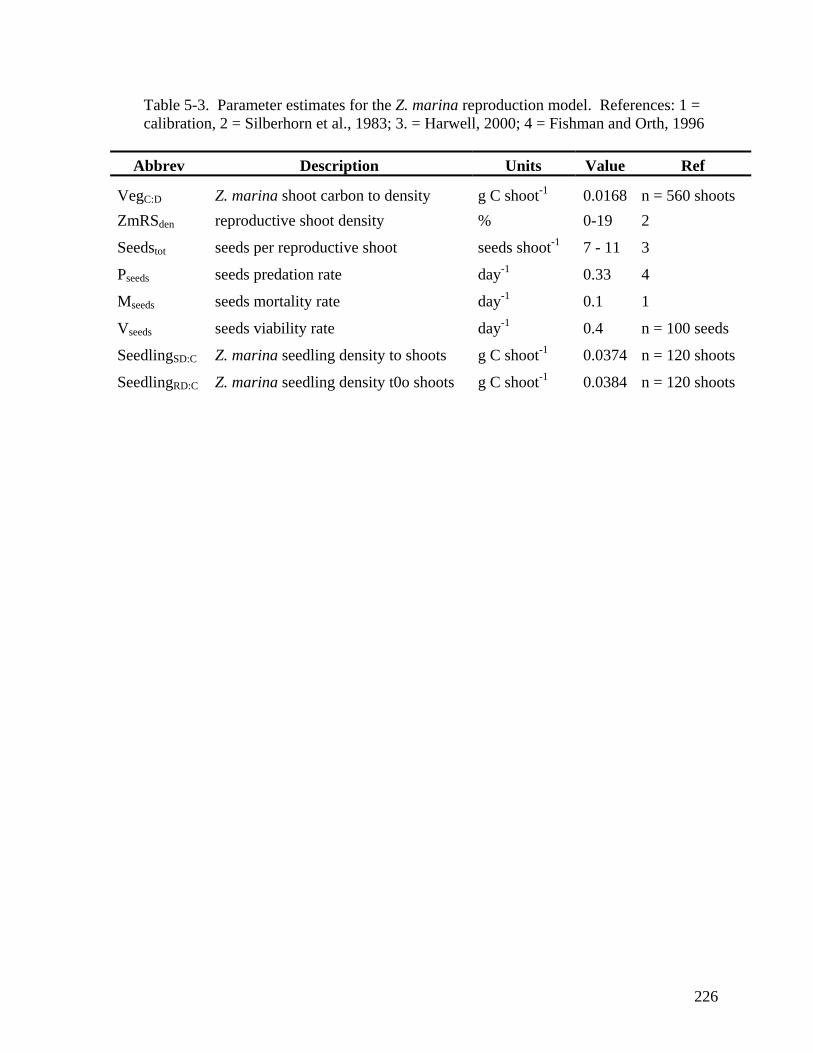
226
Table 5-3. Parameter estimates for the Z. marina reproduction model. References: 1 = calibration, 2 = Silberhorn et al., 1983; 3. = Harwell, 2000; 4 = Fishman and Orth, 1996
Abbrev Description Units Value Ref
VegC:D Z. marina shoot carbon to density g C shoot-1 0.0168 n = 560 shoots ZmRSden reproductive shoot density % 0-19 2
Seedstot seeds per reproductive shoot seeds shoot-1 7 - 11 3
Pseeds seeds predation rate day-1 0.33 4
Mseeds seeds mortality rate day-1 0.1 1
Vseeds seeds viability rate day-1 0.4 n = 100 seeds
SeedlingSD:C Z. marina seedling density to shoots g C shoot-1 0.0374 n = 120 shoots
SeedlingRD:C Z. marina seedling density t0o shoots g C shoot-1 0.0384 n = 120 shoots

227
Table 5-4. Minimum sensitivity simulation (± 5, 10, 20 %) for model parameters which resulted in significant variation (≥ 10 %) of state variables relative to base model concentrations. Non-significant values are denoted with (--).
State Variable Parameter Min % Change
Epiphytes PRepi -5
Pmax ± 5 Kgepi + 5 MRepi -- BMRepi ± 5 KtBepi ± 20 Z. marina shoots PRzm ± 5 Pmax ± 5 Tczms -- MRzms -- Rzms ± 20 Td ± 5 Z. marina Root/Rhizome Td -10 Tczmsr -- MRzmr ± 20 RRzmr -- Rzmr -- Seed-bank VegD:C -10 Fsden ± 10 MRseeds ± 5 PRseeds + 5 VRseeds ± 5 Seed Germination Vseeds ± 5 Msd ± 5
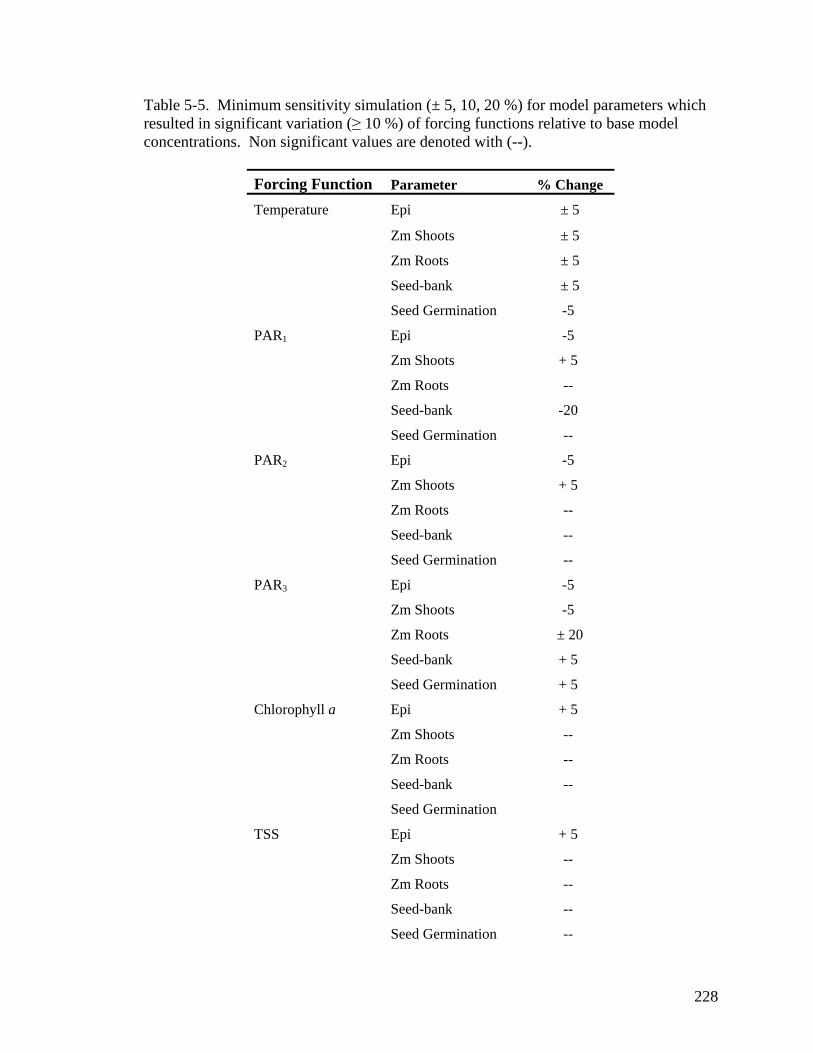
228
Table 5-5. Minimum sensitivity simulation (± 5, 10, 20 %) for model parameters which resulted in significant variation (≥ 10 %) of forcing functions relative to base model concentrations. Non significant values are denoted with (--).
Forcing Function Parameter % Change
Temperature Epi ± 5
Zm Shoots ± 5
Zm Roots ± 5
Seed-bank ± 5
Seed Germination -5
PAR1 Epi -5
Zm Shoots + 5
Zm Roots --
Seed-bank -20
Seed Germination --
PAR2 Epi -5
Zm Shoots + 5
Zm Roots --
Seed-bank --
Seed Germination --
PAR3 Epi -5
Zm Shoots -5
Zm Roots ± 20
Seed-bank + 5
Seed Germination + 5
Chlorophyll a Epi + 5
Zm Shoots --
Zm Roots --
Seed-bank --
Seed Germination
TSS Epi + 5
Zm Shoots --
Zm Roots --
Seed-bank --
Seed Germination --

229
Table 5-6. Model projected maximum seed-bank densities between 2005 – 2007 for all temperature runs. Temperatures are in ºC.
Germinable Seed Density m-2 Date Ambient Amb + 1 Amb + 2 Amb + 3 Amb + 4 Amb + 5 GI Fall 2005 13,034 11,805 8,842 6,232 4,986 4,033Fall 2006 0 0 0 0 0 0Fall 2007 9,677 0 0 0 0 0GP Fall 2005 1,656 1,438 1,141 693 526 487Fall 2006 0 0 0 0 0 0Fall 2007 10,030 0 0 0 0 0
Table 5-7. Model projected maximum viable seed-bank densities between 2005 – 2007 for all temperature runs. Temperatures are in ºC.
Maximum Viable Seed Density m-2 Year Ambient Amb + 1 Amb + 2 Amb + 3 Amb + 4 Amb + 5 GI Fall 2005 4,224 3,826 2,866 2,020 1,629 1,307Fall 2006 0 0 0 0 0 0Fall 2007 3,136 0 0 0 0 0GP Fall 2005 537 466 370 224 170 158Fall 2006 0 0 0 0 0 0Fall 2007 302 0 0 0 0 0

230
Figure 5-1. Lower York River Virginia site locations for all calibration and forcing function data collection. Goodwin Island (GI) is located at the mouth of the York River and Gloucester Point (GP) is located 10 km upriver. Site locations are denoted with a star.

231
Epi
Zm vegshoots
Zm vegroots
Seed Bank
SeedlingDensity
PAR Temp
DIPwc
DINwc
DINs
DIPs
Chl a TSS
SO
BD
Zm sdlngshoots
Zm sdlngroots
Gepi
MepiRepi
Pepi
PAR3Pzm
Mzmss
Rzmss
MzmrRzmr
Pzms
MzmsrRzmsr
Mzms
Rzms Td Td
Tczms
Tczmr
PAR2
VEGC:D
RSDen
Gseeds
Mseeds
Seedstot
Vseeds
Seedsgerm
MseedlingSEED
C:D AG
JD F
SEEDC:D BG
Figure 5-2. Conceptual diagram for Zostera marina production and sexual reproduction model. Circles = forcing functions, triangles = modifiers, squares = state variables, thick arrows = flows, and thin arrows = iterations. All variables defined in text. Temp, JD, and F affect multiple processes so are not connected to minimize diagram complexity.

232
Date (month)
PAR
(μE
m-2 m
in-1)
100
300
500
700
0
200
400
600
800
Wat
er T
empe
ratu
re (C
)
0
5
10
15
20
25
30
35
TSS
(mg
l-1)
5
15
25
35
45
0
10
20
30
40
50
Chl
orop
hyll
a (m
g l-1
)
0
20
40
60
80
100
120
140
160
180
Date (month)
Jan 05 Jul 05 Jan 06 Jul 06 Jan 07 Jul 07 Jan 08 Sedi
men
t Org
anic
Con
tent
(% o
rgan
ic)
0.0
0.5
1.0
1.5
2.0
2.5
3.0
Temperature
Turbidity
Chlorophyll a
Sediment % Organic
PAR
Figure 5-3. Forcing functions for Goodwin Island (solid line) and Gloucester Point (dashed line) for 2005 - 2007.

233
DIN
(μm
ol N
l-1)
0
5
10
15
20
25
30
DIP
(μm
ol P
l-1)
0.0
0.5
1.0
1.5
2.0
DIN
(μm
ol N
H4 l-1
)
0
5
10
15
20
25
30
Date (month)
Apr 05 Aug 05 Dec 05 Apr 06 Aug 06 Dec 06 Apr 07 Aug 07 Dec 07
DIP
(μm
ol P
O4 l
-1)
0
2
4
6
8
10Sediment DIP
Sediment DIN
Water Column DIP
Water Column DIN
Figure 5-4. Water column and sediment nutrient forcing functions for Goodwin Island (solid line) and Gloucester Point (dashed line) for 2005 – 2007.

234
Apr 06 Aug 06 Dec 06 Apr 07 Aug 07 Dec 07
Abo
ve G
roun
d C
arbo
n (g
C m
-2)
10
30
50
70
90
0
20
40
60
80
100
ModelGI
Apr 06 Aug 06 Dec 06 Apr 07 Aug 07 Dec 07
Bel
ow G
roun
d C
arbo
n (g
C m
-2)
10
30
50
70
90
0
20
40
60
80
100
A
B
Figure 5-5. Calibration of Zostera marina above and below ground biomass model (black line) with observed GI data (red triangles). Observed data are given in monthly means ± SE.

235
Apr Aug Dec Apr Aug Dec
Abo
ve G
roun
d C
arbo
n (g
C m
-2)
0
10
20
30
40
50
60
ModelGP
Date (month)
Apr Aug Dec Apr Aug Dec
Bel
ow G
roun
d C
arbo
n (g
C m
-2)
0
10
20
30
40
50
60
A
B
Figure 5-6. Validation of Z. marina above and below ground biomass model (black line) with observed GP data (red triangles). Observed data are given in monthly means ± SE.
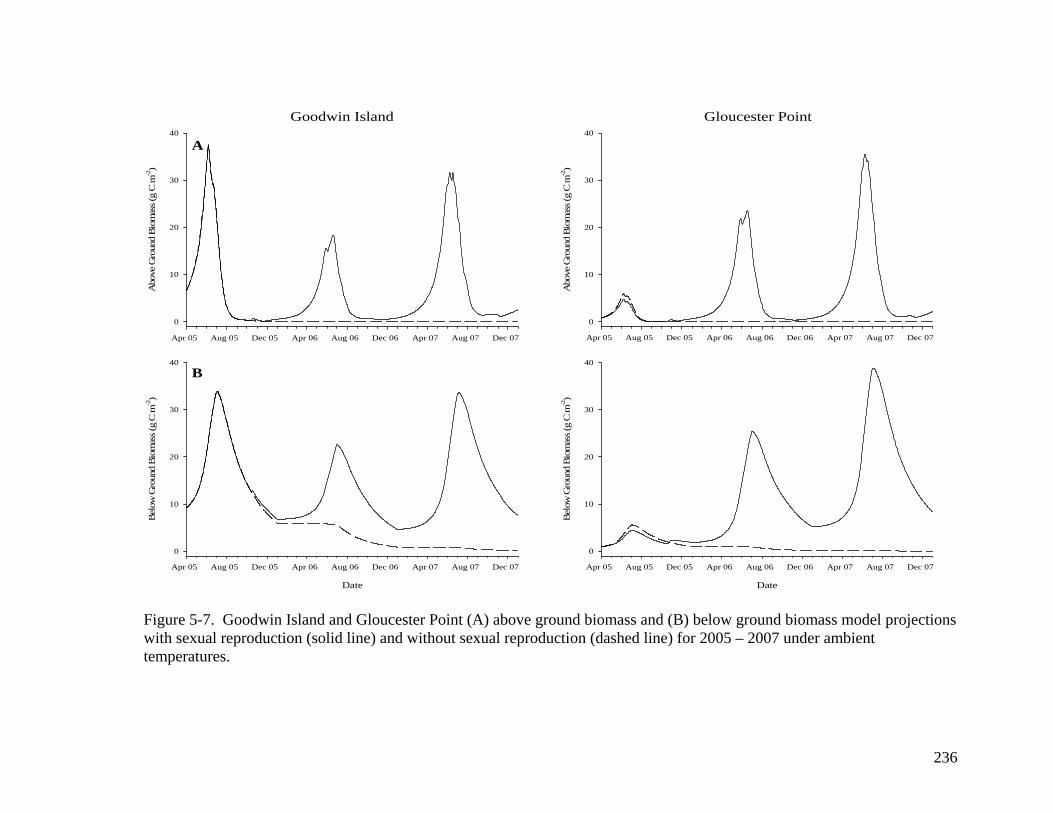
236
Apr 05 Aug 05 Dec 05 Apr 06 Aug 06 Dec 06 Apr 07 Aug 07 Dec 07
Abo
ve G
roun
d B
iom
ass (
g C
m-2)
0
10
20
30
40
Date
Apr 05 Aug 05 Dec 05 Apr 06 Aug 06 Dec 06 Apr 07 Aug 07 Dec 07
Bel
ow G
roun
d B
iom
ass (
g C
m-2)
0
10
20
30
40
Apr 05 Aug 05 Dec 05 Apr 06 Aug 06 Dec 06 Apr 07 Aug 07 Dec 07
Abo
ve G
roun
d B
iom
ass (
g C
m-2)
0
10
20
30
40
Date
Apr 05 Aug 05 Dec 05 Apr 06 Aug 06 Dec 06 Apr 07 Aug 07 Dec 07 B
elow
Gro
und
Bio
mas
s (g
C m
-2)
0
10
20
30
40
Goodwin Island Gloucester Point
A
B
Figure 5-7. Goodwin Island and Gloucester Point (A) above ground biomass and (B) below ground biomass model projections with sexual reproduction (solid line) and without sexual reproduction (dashed line) for 2005 – 2007 under ambient temperatures.

237
Apr 05 Aug 05 Dec 05 Apr 06 Aug 06 Dec 06 Apr 07 Aug 07 Dec 07
Abo
ve G
roun
d C
arbo
n (g
C m
-2)
0
10
20
30
40
Date (month)
Apr Aug Dec Apr Aug Dec Apr Aug Dec
Bel
ow G
roun
d C
arbo
n (g
C m
-2)
0
10
20
30
40
A
B
Apr 05 Aug 05 Dec 05 Apr 06 Aug 06 Dec 06 Apr 07 Aug 07 Dec 07
Abo
ve G
roun
d C
arbo
n (g
C m
-2)
0
10
20
30
40
AmbientAmb + 1Amb + 2Amb + 3Amb + 4Amb + 5
Date (month)
Apr 05 Aug 05 Dec 05 Apr 06 Aug 06 Dec 06 Apr 07 Aug 07 Dec 07 B
elow
Gro
und
Car
bon
(g C
m-2)
0
10
20
30
40
Goodwin Island Gloucester Point
Figure 5-8. Goodwin Island and Gloucester Point model projections with sexual reproduction for 2005 – 2007 under ambient temperatures (solid line), ambient temperatures + 1º C (dotted line), ambient temperatures + 2 ºC (short dashed line), ambient temperatures + 3 ºC (short dashed and dotted line), ambient temperatures + 4 º C (long dashed line), and ambient temperature + 5 ºC (long dashed and dotted line).

238
Abo
ve G
roun
d B
iom
ass (
g C
m-2)
5
15
25
35
45
0
10
20
30
40
50
5
15
25
35
0
10
20
30
40
DownriverUpriver
Abo
ve G
roun
d B
iom
ass (
g C
m-2)
5
15
25
35
45
0
10
20
30
40
50
5
15
25
35
45
0
10
20
30
40
50
Date
Apr 05
Aug 05
Dec 05
Apr 06
Aug 06
Dec 06
Apr 07
Aug 07
Dec 07
Abo
ve G
roun
d B
iom
ass (
g C
m-2)
5
15
25
35
45
0
10
20
30
40
50
Date
Apr 05
Aug 05
Dec 05
Apr 06
Aug 06
Dec 06
Apr 07
Aug 07
Dec 07
5
15
25
35
45
0
10
20
30
40
50
Amb Temp Temp + 1 ºC
Temp + 2 ºC Temp + 3 ºC
Temp + 4 ºC Temp + 5 ºC
Figure 5-9. Model projections of Goodwin Island above ground biomass with both upriver (GP) water column light attenuation (solid line) and downriver (GI) water column light attenuation (dashed line) conditions under all temperature scenarios.

239
SYNTHESIS

240
The main objectives of this research were to (1) quantify and compare responses
to various environmental conditions between semi-annual and perennial Z. marina
populations; (2) quantify the effects of environmental conditions on seed germination and
seed-bank viability on the persistence of Zostera marina beds using both controlled and
in situ experiments; (3) to elucidate the role of sexual reproduction in the maintenance
and recovery of established Z. marina beds; (4) to develop an Z. marina production
model to more accurately characterize how Z. marina beds respond to large scale
disturbances and to determine what factors are most important for expanded research
relative to seagrass reproduction. The overarching goal of this research was to add to the
current understanding of the role of sexual reproduction in seagrass bed maintenance and
recovery, and the potential role of seeds and seedlings in seagrass conservation and
restoration.
The presence of a semi-annual bed of Z. marina at the southern limit of Z. marina
along the western Atlantic in North Carolina was confirmed. Although semi-annual Z.
marina beds can be found in habitats which are limiting to perennial Z. marina beds,
water quality and sediment conditions were not significantly different between semi-
semi-annual and perennial Z. marina beds in North Carolina suggesting that factors other
than these environmental conditions may be related to the development of an semi-annual
Z. marina bed in this region. In addition, the semi-annual Z. marina bed in North
Carolina supported a Z. marina population with both annual and perennial life histories.
Z. marina shoots in the semi-annual bed germinated from seeds, a portion of seedlings
flowered during their first year of growth, and all shoots completed their life cycle and
died within one year of germination like an annual plant; however, not all shoots

241
flowered and shoots reproduced both sexually and asexually similar to a perennial plant.
The development of the mixed life history strategy in North Carolina Z. marina bed is not
understood and further investigation into genetic variations and phonological response of
this population to environmental conditions is required.
Regardless of life history, Virginia and North Carolina seed viability significantly
decreased after 6 months in the sediment and both semi-annual and perennial Z. marina
beds produced transient (seed-bank retains viability < 12 months) seed-banks. The
effects of time on seed viability were greater than seed source (semi-annual or perennial)
or sediment type (≥ 90% sand, ≤ 80% sand). Densities of viable seeds within the ambient
sediment seed-bank were greater at the semi-annual bed; however, seed-bank viability
decreased over time for semi-annual and perennial beds with no viable seeds after 6
months in the sediment. For both life histories ambient seed-bank densities followed Z.
marina germination cycles and were the lowest following the period of maximum
germination (October – November) in December 2007. The significant reduction of seed
viability after only 6 months in the sediment suggests that the resiliency provided by
seed-banks for both perennial and semi-annual Z. marina beds may be limited by seed
production on annual scales and by timing of disturbance events.
Seeds from perennial beds in both Virginia and North Carolina had significantly
greater maximum germination, shorter time to germination, and greater biomass
compared to seeds collected from the semi-annual bed in North Carolina. For seeds from
both semi-annual and perennial beds, emergence was greatest in shallow muddy
sediments although mean time to germination was not significantly different. Similar to
ambient seed-banks, viability of the remaining seeds was not significantly affected by

242
burial depth or sediment type; however viability for all seed sources was < 10%. While
there was no significant regional difference in seedling emergence between seeds from
perennial Z. marina beds, sediment conditions did significantly affect seedling
emergence, highlighting the role of the surrounding sediment rather than the location of
the source population on successful sexual reproduction within mid-Atlantic perennial Z.
marina beds. Reduced seedling emergence of both semi-annual and perennial Z. marina
seeds at burial depths > 1 cm may represent a possible bottleneck in successful Z. marina
sexual reproduction. Implications of reduced Z. marina seed viability due to burial depth
or sediment conditions may affect the resiliency to and recovery from disturbance for
both perennial and semi-annual Z. marina beds.
Seeds and seedlings played a significant role in the recovery of perennial beds
from a sudden and large scale decline. In the summer of 2005 large declines in perennial
Z. marina populations occurred throughout the lower Chesapeake Bay after prolonged
periods of high summer water temperatures. In the spring of 2006 Z. marina beds in the
York River re-established with seedlings providing 48 – 54 % of the total shoot density.
Due to the dominance of seedlings in the spring of 2006, the seed-bank was not
replenished. Since seedlings in these regions during their first year of growth are not
generally observed to flower and produce seeds, the seed-bank is not immediately
replenished and there is limited capacity for bed re-growth. These results demonstrate
the importance of seedlings in initial bed recovery following a single disturbance, but
highlight potential sensitivity of Z. marina beds here to repeated stresses. With this loss
of resiliency a repeated disturbance can result in nearly total bed loss.

243
Ecological models are a useful tool in quantitative analysis of complex
ecosystems such as seagrass beds. The loss and recovery processes following a large
scale decline in Zostera marina in the York River, VA were modeled using an Z. marina
production model containing a sexual reproduction component. Model projections of Z.
marina production following the 2005 decline and subsequent recovery period were more
accurate relative to in situ measurements when sexual reproduction was added compared
to the traditional production model with vegetative reproduction only. However,
resiliency to increased water temperature provided by sexual reproduction was limited, as
a 1 ºC increase in temperature resulted in a reduction of biomass to 0 g C m-2 by year
three. Differences in water quality between sites also affected Z. marina above and
below ground production, seed production, seed viability and seed germination. The
results of all model scenarios highlight the need to incorporate sexual reproduction into Z.
marina ecosystem models, the projected sensitivity of established Z. marina beds to
consecutive years of stress, and the negative effects of multiple stressors on Z. marina
recovery.
Sexual reproduction is an important component of both semi-annual and perennial
Zostera marina populations that should be included in ecological studies and models.
Although most perennial Z. marina beds rely on asexual reproduction as a primary form
of bed maintenance, the ability to reproduce sexually is maintained and, as shown here,
may play a large role in the recovery and expansion of these populations. For this reason
and due to the use of seeds in restoration of Z. marina beds within large systems such as
the Chesapeake Bay, research into the dynamics of sexual reproduction within existing
beds, a better understanding of seed physiology, and additional research into

244
environmental effects (including the sediment) on seed germination and viability is
required.

245
VITA
JESSIE C. JARVIS
Jessie was born in Easton, Maryland on July 9, 1981. After graduating from Easton High School in 1999 she went on to earn a B.S. in Biology from Chowan College in 2003. Jessie earned her Masters in Marine Science from the College of William and Mary, School of Marine Science in 2005. Continuing at the College of William and Mary, Jessie graduated with a Doctor of Philosophy in Marine Science from the School of Marine Science in August 2009.