zr,s-doped tio2 2008 synthesis, characterization, and ...€¦ · transition metal such as v, cr,...
TRANSCRIPT
Zr,S-Doped TiO2 as Visible Light Photocatalyst Bull. Korean Chem. Soc. 2008, Vol. 29, No. 6 1217
Synthesis, Characterization, and Application of Zr,S Co-doped TiO2 as Visible-light Active Photocatalyst
Sun Woo Kim, Romana Khan, Tae-Jeong Kim,* and Wha-Jung Kim†
Department of Applied Chemistry, Kyungpook National University, Daegu 702-701, Korea. *E-mail: [email protected]†School of Architecture, Kyungpook National University, Daegu 702-701, Korea
Received March 27, 2008
A series of Zr,S co-doped TiO2 were synthesized by a modified sol-gel method and characterized by variousspectroscopic and analytical techniques. The presence of sulfur caused a red-shift in the absorption band ofTiO2. Co-doping of sulfur and zirconium (Zr-TiO2-S) improves the surface properties such as surface area, porevolume, and pore diameter and also enhances the thermal stability of the anatase phase. The Zr-TiO2-S systemsare very effective visible-light active catalysts for the degradation of toluene. All reactions follow pseudo first-order kinetics with the decomposition rate reaching as high as 77% within 4 h. The catalytic activity decreasesin the following order: Zr-TiO2-S > TiO2-S > Zr-TiO2 > TiO2 P-25, demonstrating the synergic effect of co-doping with zirconium and sulfur. When the comparison is made within the series of Zr-TiO2-S, the catalyticperformance is found to be a function of Zr-contents as follows: 3 wt % Zr-TiO2-S > 0.5 wt % Zr-TiO2-S > 5 wt% Zr-TiO2-S > 1 wt % Zr-TiO2-S. Higher calcination temperature decreases the reactivity of Zr-TiO2-S.
Key Words : Zr,S-doping, TiO2, Visible light photocatalyst, Toluene decomposition
Introduction
Since Honda and Fujishima first reported a TiO2-photo-assisted electrochemical splitting of water in 1972,1 semi-conductor photocatalysts have received a great deal ofattention from both academic and industrial communities. Inparticular, nanocrystalline TiO2 photocatalysts have attractedextensive interest as promising materials in view of itsapplications in environmental pollution control and energystorage.2-6 However, TiO2 is only sensitive to UV light dueto its large band-gap energy (anatase: 3.2 eV). It is thereforenecessary to modify the TiO2 system for practical appli-cation because the whole radiant solar energy comprises ofonly 3-4% UV light. In this regard, a great deal of effort hasrecently been made to develop TiO2-based photocatalystssensitive to visible light for the purpose of efficient utili-zation of solar energy.
There are now known several approaches to improve thephotocatalytic activity of TiO2 materials under visible lightirradiation. Some representative examples are as follows: (1)doping with metal or non-metal ions,7-10 (2) surface modi-fication,11,12 and (3) combination with other semiconductors.13,14
It must be noted, however, that each of these methods hassome drawbacks. The first approach, for instance, results inthermal phase instability as well as low quantum efficiencyof the photoinduced charge carriers (e−/h+ pairs).15 In thisconnection, Ikeda has reported that TiO2 powder loaded withtransition metal such as V, Cr, Fe, Co, Cu, Mo, or W exhibitsthe acceleration of e−/h+ recombination as demonstrated byfemto-second pump-probe diffuse reflection spectroscopy.16
To avoid these problems, non-metal ions as a dopant havebeen employed as an alternative approach for the formationof visible light active TiO2 photocatalysts.17-19 Theoreticalcalculation has revealed that band-gap narrowing originates
from the electronic perturbations caused by the change oflattice parameters and/or by the presence of the trap stateswithin conduction and valence bands of TiO2. 20,21
It is interesting to note that sulfur, unlike other non-metaldopants, may exist in more than one oxidation state (S2−, S4+
or S6+) in TiO2 depending on the synthetic conditions or thetypes of sulfur precursor. The photocatalytic activity stillenhances regardless of the sulfur oxidation state.17,22
It has recently been reported that visible light activity ofTiO2 can be even further enhanced by suitable combinationof metals and/or nonmetal ions.23-26 Of various combina-tions, co-doping with sulfur and zirconium may draw specialinterest in that zirconium increases not only the surface areaand the thermal stability of TiO2 but also retards the e−/h+
recombination. For instance, zirconium doped TiO2 such asZrO2-TiO2 binary metal oxides27,28 or Ti1-xZrxO2 solid solu-tions29,30 have shown higher photocatalytic activity than pureTiO2 under UV. Further, ZrO2-modified mesoporous nano-crystalline TiO2-xNx photocatalysts showed higher photo-catalytic performance than TiO2-xNx for the catalytic conver-sion of ethylene to carbon dioxide under visible light.31 Evenmore recently, Zr-doped TiO2 film prepared by atomic layerdeposition has also exhibited visible light response.32
Intrigued by these observations and motivated by ourcontinued effort in the search of visible light active TiO2
photocatalysts, we have performed the synthesis of a seriesof Zr,S co-doped TiO2 (Zr-TiO2-S) using a modified sol-gelmethod developed by us.33 To the best of our knowledge,there has been no report on the synthesis as well as appli-cation of Zr,S co-doped TiO2 as a visible light active photo-catalyst. In this paper are reported their synthesis, analyticaland spectroscopic characterization, and catalytic applicationto the degradation of gas phase toluene under visible lightirradiation.
≈
1218 Bull. Korean Chem. Soc. 2008, Vol. 29, No. 6 Sun Woo Kim et al.
Experimental Section
Materials. Tetrabutyl orthotitanate, Ti(O-Bu)4, zirconiumacetylacetonate, Zr(acac)4 (Tokyo Chemical Industry Co.,Ltd.), thiourea (Aldrich), and absolute ethanol (Merck) wereused as received. All syntheses were carried out under anatmosphere of nitrogen at room temperature.
Synthesis of Zr-TiO2-S. Nanostructured Zr-TiO2-S cata-lysts with various Zr-contents were prepared initially bytaking advantage of the modified sol-gel method developedby us.33 In a typical experiment for the synthesis of 0.5 wt %Zr-TiO2-S, to a stirring solution of Ti(O-nBu)4 (21.3 mL) inEtOH (140.0 mL) was added drop wise a mixture of HCl(6.0 mL), deionized water (22.0 mL), and EtOH (70.0 mL).Simultaneously was added drop wise a mixture of Zr(acac)4
(0.15 g) and thiourea (2.38 g) in EtOH (70.0 mL). Afteraddition the reaction mixture was stirred for 24 h under RT.Then a solution of NH4OH (1.0 M) was added drop wiseuntil pH of the solution rose to 9.0. The gel thus formed wasaged for 2 h, separated by filtration, washed thoroughly withdeionized water for complete removal of chlorides. The gelwas dried at 110 oC for 12 h and was ground to powdermechanically. The resulting dry powders were calcined at450 oC or 600 oC at the rate of 1 oC/min and kept for 5 h toobtain the nanostructured 0.5 wt % Zr-TiO2-S. Those withother Zr-contents such as 1 wt % Zr-TiO2-S, 3 wt % Zr-TiO2-S, and 5 wt % Zr-TiO2-S were prepared in the samemanner.
Synthesis of Zr-TiO2, TiO2-S, and TiO2. These wereprepared by the same method as described above, yet in theabsence of thiourea and/or Zr(acac)4, respectively.
Characterization. IR spectra were run on a Mattson FT-IR Galaxy 7020A spectrophotometer. The XRD patternswere acquired on a Multi-Purpose X-ray Diffractometer(X'pert PRO MRD/X'pert PRO MPD, CuKα, λ = 1.5406 Å)at a scan rate of 0.03o 2θ s−1. The average crystallite size wascalculated according to the Scherrer’s equation,
(1)
where D is the mean crystallite size, k (0.89) is the Scherrerconstant, λ is the X-ray wavelength (1.5406 Å), and B is therelative value of the full-width at half-maximum (FWHM)of the (101) diffraction peak of catalysts. The content ofanatase (%) was calculated according to the equation,
(2)
where A is the content of anatase, IA is the intensity ofanatase and IR is the intensity of rutile. Raman spectra weremeasured on a Laser Raman spectrophotometer (model:Ramalog 9I). Nitrogen adsorption-desorption isotherms wererecorded at liquid nitrogen temperature (77 K) on a Quan-tachrome Instrument (NOVA 2000 series), and the specificsurface areas were determined by the Brunauer-Emmett-Teller (BET) method. The Barrett-Joyner-Halenda (BJH)method was used to determine the pore size distribution
derived from the BJH desorption isotherms. The morphologyof the samples was examined by high-resolution transmissionelectron microscope (HRTEM) (model: JEOL, JEM 3010)operating at 300 kV. For TEM images, a drop of dilutedispersion was deposited on a copper grid covered with aformal-carbon membrane. The diffuse reflectance UV-Visabsorption spectra (DRS) were obtained on a UV-Vis spectro-photometer (Model Shimadzu UV-2450 diffuse reflectancemode) using BaSO4 as a reflectance standard. X-ray photo-electron spectra (XPS) were recorded on a VG ScientificESCALAB 250 XPS spectrophotometer. The instrumentemploys a monochromated AlKα X-ray source (hν =1486.6 eV), which was used at 150 W. The area of analysiswas approximately 500 μm diameter for the samples analy-zed. All the binding energies were referenced to theadventitious C1s peak at 284.6 eV.
Photocatalytic Degradation of Toluene. The photo-catalytic activity was investigated by the photo-degradationof gaseous toluene under visible light irradiation. The photo-reaction was carried out in a closed circulation reactor underambient conditions (Figure 1). A Pyrex-glass tubular reactorwith a volume of 1 L, containing the catalyst (300 ± 0.5 mg)uniformly spread over the irradiation area was connected toa peristaltic pump through tubing. The gas flow rate was 320cm3/min. The reactor containing the catalyst was placed in ablack colored glass box (30 cm × 42 cm × 27 cm) that houseda 150 W halogen lamp (OSRAM HALOLINE) with 400 nmcutoff filter. The photon flux emitted from lamp was de-termined actinometrically using the potassium ferrioxalatemethod and found to be 3.9 × 10⁻⁶ Einstein/s. The distancebetween the lamp and the catalyst was 15 cm. To introducetoluene for photo-degradation study, the photo-reactor wasconnected to a glass mixing chamber, where the temperaturewas fixed at 70 oC to ensure the evaporation of toluene. Thetotal volume of the circulation reactor was 1.3 L. Theconcentration of toluene used in all experiments was 3.0 μL(2.54 × 10⁻⁵ M, 530 ppmv). The photo-reactor was kept inthe dark until the gas concentration remained constant,which indicated that toluene resulted in the steady statebetween the adsorption and desorption on the catalystsurface. In order to monitor the degradation of toluene atregular interval, Gas Chromatograph (Shimadzu GC-17A,Shimadzu Corporation) equipped with a gas sampler operat-
Dkλ
B θcos----------------=
A %( )IA
IA 1.256IR+----------------------------- 100×=
Figure 1. Schematic diagram of the photoreactor for degradationof toluene under visible light.

Zr,S-Doped TiO2 as Visible Light Photocatalyst Bull. Korean Chem. Soc. 2008, Vol. 29, No. 6 1219
ing with a flame ionization detector (FID) was connected togas exiting the reactor. The rate of degradation was estimat-ed to obey pseudo-first-order kinetics and hence the rateconstant for degradation, k, was obtained from the first-orderplot according to equation (3),
(3)
where C0 is the initial concentration, C is the concentrationafter a time (t) of the toluene degradation, and k is the first-order rate constant:
Results and Discussion
FT-IR Spectra. Figure 2 shows the FT-IR spectrum of 3wt % Zr-TiO2-S dried at 110 oC (Figure 2a) and of thatcalcined at 450 oC (Figure 2b). Some common features to benoted are the appearance of (i) broad bands below 1000 cm−1
assignable to the TiO2 crystal lattice vibration34 and (ii) thosein the regions 1621-1623 cm−1 and 3500-3000 cm−1, bothbeing due to stretching from the hydroxyl group.35 Thedeformation band (1407 cm−1, Figure 2a) of ammonium ionsleft behind on the surface by decomposition of thiourea isabsent in Figure 2b, demonstrating the effect of calcination
at 450 oC. Yet, the weak band observed at 1557 cm−1 (Figure2b) assignable to the deformation mode of C-N-H mayindicate that the dissociation of thiourea is incomplete as itleft a small amount in the TiO2 lattice.36 Finally, the Ti-Sband appears at about 590 cm−1,37 and the SO4
2− band in theregion 1047-1120 cm−1.38
XRD Analysis. The XRD patterns of TiO2, TiO2-S, and xwt % Zr-TiO2-S (x = 0.5, 1, 3, and 5) calcined at 450 oC areshown in Figure 3a-f (from bottom to top). The diffractionpeaks of anatase TiO2 can be observed in all samples(JCPDS 21-1272). Both TiO2-S and Zr-TiO2-S show the(101) peaks broader than that of TiO2. These observationssuggest that the lattice structure of TiO2 is locally distortedby incorporation of dopants, S or Zr ions into TiO2.17,29,37 Toclarify the effect of these dopants on the lattice structure ofTiO2, the lattice parameters of the catalysts were measuredusing (101) and (200) in anatase crystal planes by usingequations 4.1 and 4.2:
Bragg’s equation: d(hkl) = λ/2sinθ (4.1)
d −2(hkl) = h2a−2 + k2b−2 + l2c−2 (4.2)
where d(hkl) is the distance between crystal planes of (hkl), λis the X-ray wavelength, θ is the diffraction angle of crystalplane (hkl), hkl is the crystal index, and a, b and c are latticeparameters (in anatase form, a = ).
The results are summarized in Table 1. The table clearlyshows that the lattice parameters of all TiO2 samples remainalmost unchanged along the a- and b- axes, whereas c-axisparameter increases due to the presence of adventitious Zrand S. Ionic radius of Zr4+ (0.72 Å) and S2− (1.7 Å) asdopants are larger than Ti4+ (0.61 Å) and O2− (1.22 Å) in theTiO2 structure. For possible diffusion of Zr4+ and S2− alongthe c-axis to substitute Ti4+ or O2−, respectively in TiO2, thelattice parameters of c increase relative to that of TiO2
because of larger ionic radius of dopants.29,37,39 Therefore,the Zr-TiO2-S lattice exists in a strain form with high latticeenergy. Consequently, some structural defects such asoxygen vacancies might be generated on the surface of Zr-TiO2-S.
The average crystallite size of catalysts was measured bythe Scherrer’s equation from the (101) peak of anatase TiO2,and listed in Table 1. The average crystallite size of TiO2-S(11.3 nm) or Zr-TiO2-S (10.8-8.0 nm) is smaller than that of
C0
C------ln kt=
b c≠
Figure 2. FT-IR spectra of 3 wt % Zr-TiO2-S: (a) dried at 110 oCand (b) calcined at 450 oC.
Figure 3. XRD patterns of catalysts calcined at 450 oC: (a) TiO2,(b) TiO2-S, (c) 0.5 wt % Zr-TiO2-S, (d) 1 wt % Zr-TiO2-S, (e) 3 wt% Zr-TiO2-S, and (f) 5 wt % Zr-TiO2-S.
Table 1. Lattice parameters and average crystallite size of Zr-TiO2-S
Catalystslattice parameters (Å)a
Crystallitesize (nm)b
a = b c
TiO2 3.787 9.356 14.1TiO2-S 3.779 9.406 11.3
0.5 wt % Zr-TiO2-S 3.782 9.548 10.81 wt % Zr-TiO2-S 3.783 9.553 9.03 wt % Zr-TiO2-S 3.776 9.651 8.85 wt % Zr-TiO2-S 3.782 9.499 8.0
aEstimated according to the equations 4.1 and 4.2. bCalculated accordingto the Scherrer formula (D = kλ /Bcosθ).
1220 Bull. Korean Chem. Soc. 2008, Vol. 29, No. 6 Sun Woo Kim et al.
TiO2 (14.1 nm). When the comparison is made within theZr-TiO2-S series, increase in the Zr-content decreases thesize. This is because the crystallite growth in the TiO2 latticeis suppresses as Zr or S replaces Ti4+ ions during the sol-gelprocedure. Lattice parameters calculation confirms theseobservations as shown in Table 1.
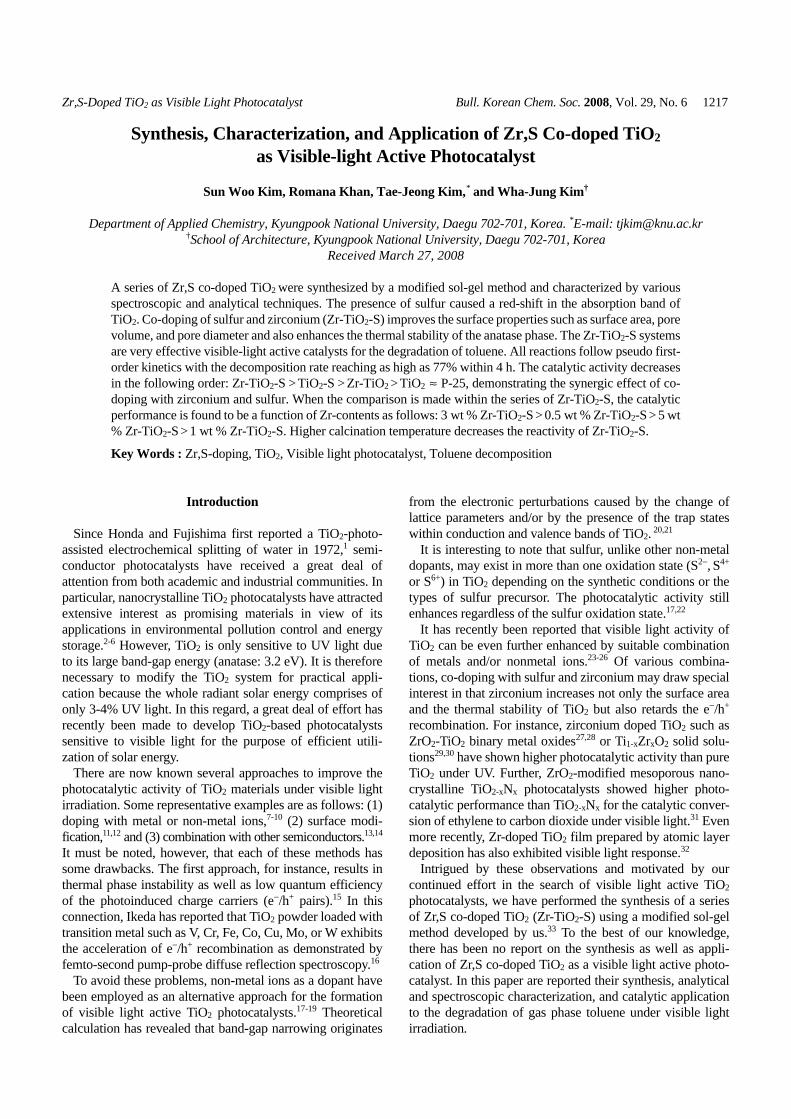
Figure 4 shows the XRD patterns of 3 wt % Zr-TiO2-Scalcined at various temperatures (600, 800, and 900 oC). Theanatase phase remains stable enough up to 800 oC for 5 h(Figure 4b), and undergoes transition to rutile at highertemperatures to leave 36% of anatase at 900 oC (Figure 4c).It is worth noting that the highest temperature known so farfor anatase remains stable is 900 oC.31,40,41
Raman Spectra. Raman spectroscopy provides additionalinformation about the anatase crystallinity. Typically TiO2 isknown to exhibit six Raman-active bands characteristic ofanatase phase at 144, 197, 399, 515, 519, and 639 cm−1 withthe symmetries of Eg, Eg, B1g, A1g, B1g, and Eg, respec-tively.42 Raman spectra of TiO2, TiO2-S, and 3 wt % Zr-TiO2-S calcined at 450 oC is shown in Figure 5a-c, respec-tively. All spectra match quite well with those in the liter-ature. In our hands, however, only five bands appear prob-ably due to overlapping of A1g and B1g bands. At the same
time, a blue- or red-shift is accompanied for some bands,which may be explained in terms of reduction in crystallitesizes in the doped TiO2 samples as noted earlier by others.43
It is worth noting that reduction in the crystallite sizes hasalso been confirmed by the XRD measurements mentionedabove.
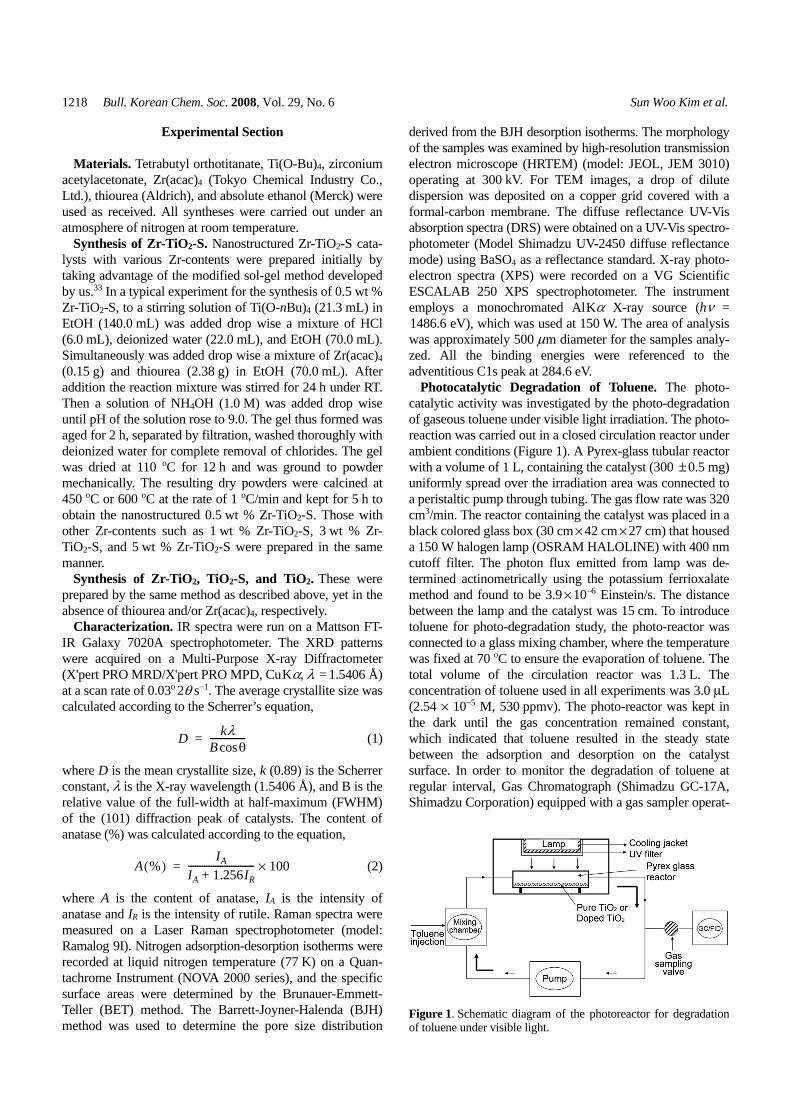
Textural Characterization. Textural properties of cataly-sts calcined at 450 oC were characterized by N2 adsorption-desorption measurements, and the corresponding datacollected in Table 2. The isotherms for both undoped anddoped TiO2 clearly demonstrate mesoporosity as they belongto type IV in their behavior (Figure 6).44 The average porediameter of catalysts falls within the range of 3.8-6.8 nm(Table 2), and assigned to the pores among inter-aggregatedparticles.45 The table also shows that the pore diameterincreases with increase in the content of S as well as Zr.These observations with zirconium have some precedence inthe literature. For instance, metal dopants such as Al, Zr, andNb are known to improve the mesoporosity of TiO2.46 Quiteinterestingly, it is the first time to observe that thiourea canbe employed as a pore forming agent leading to theformation of mesoporosity. In this connection, it is worthnoting that urea has already been used as a pore formingagent.47 All-in-all, Table 2 demonstrates that the modifiedsol-gel method involving the simultaneous co-doping of Zrand S provides greatly improved textual properties such asthe surface area, the pore volume, and the pore diameter.
Figure 4. XRD patterns of 3 wt % Zr-TiO2-S calcined at (a) 600oC, (b) 800 oC and (c) 900 oC.
Figure 5. Raman profiles of (a) TiO2, (b) TiO2-S, and (c) 3 wt %Zr-TiO2-S calcined at 450 oC (A = anatase).
Figure 6. Textural properties of catalysts calcined at 450 oC: (a) N2
adsorption-desorption isotherms and (b) BJH pore-size distributioncurves.
Zr,S-Doped TiO2 as Visible Light Photocatalyst Bull. Korean Chem. Soc. 2008, Vol. 29, No. 6 1221
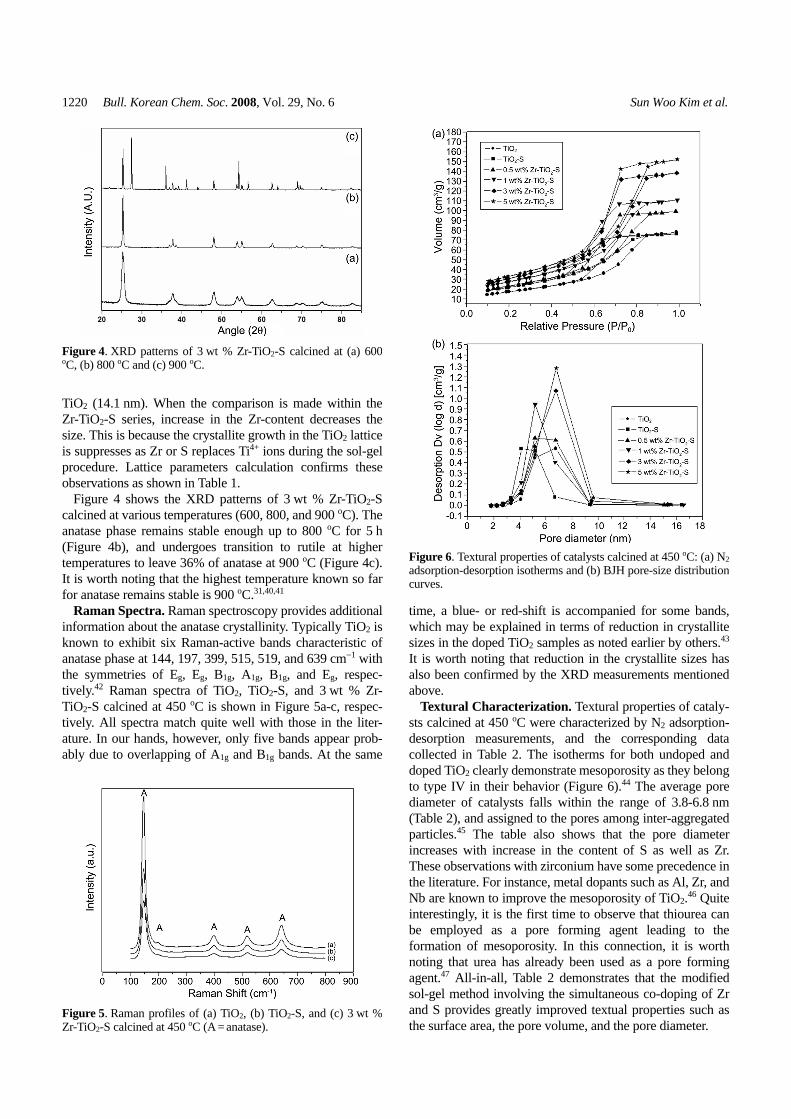
TEM Images. The TEM images of 3 wt % Zr-TiO2-Scalcined at 450 oC for 5 h in Figure 7(a) reveal the formationof mesopores due to small particle inter-aggregation. Theaverage particle size as determined by TEM is approxi-mately 7-8 nm, which is in good agreement with that calcu-lated from XRD patterns. The well-resolved lattice fringeswith spacing of 3.5 Å shown in Figure 7(b) demonstratecrystallinity typical of anatase TiO2.2,3
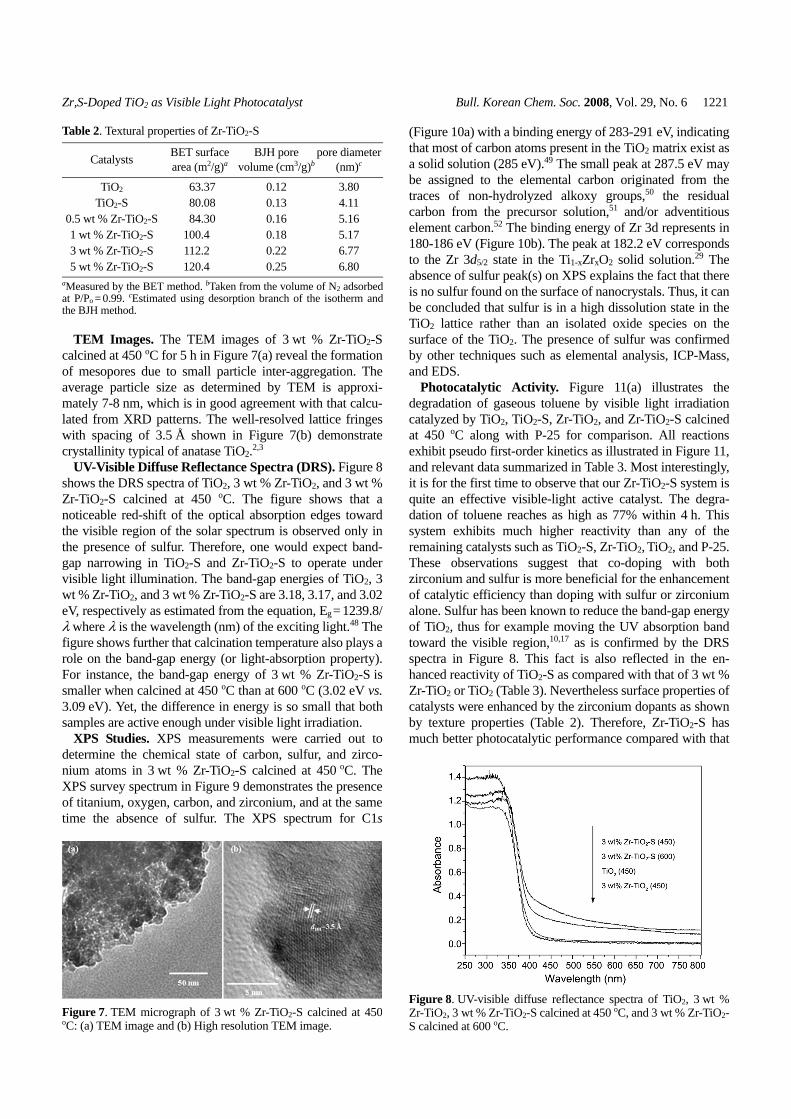
UV-Visible Diffuse Reflectance Spectra (DRS). Figure 8shows the DRS spectra of TiO2, 3 wt % Zr-TiO2, and 3 wt %Zr-TiO2-S calcined at 450 oC. The figure shows that anoticeable red-shift of the optical absorption edges towardthe visible region of the solar spectrum is observed only inthe presence of sulfur. Therefore, one would expect band-gap narrowing in TiO2-S and Zr-TiO2-S to operate undervisible light illumination. The band-gap energies of TiO2, 3wt % Zr-TiO2, and 3 wt % Zr-TiO2-S are 3.18, 3.17, and 3.02eV, respectively as estimated from the equation, Eg= 1239.8/λ where λ is the wavelength (nm) of the exciting light.48 Thefigure shows further that calcination temperature also plays arole on the band-gap energy (or light-absorption property).For instance, the band-gap energy of 3 wt % Zr-TiO2-S issmaller when calcined at 450 oC than at 600 oC (3.02 eV vs.3.09 eV). Yet, the difference in energy is so small that bothsamples are active enough under visible light irradiation.
XPS Studies. XPS measurements were carried out todetermine the chemical state of carbon, sulfur, and zirco-nium atoms in 3 wt % Zr-TiO2-S calcined at 450 oC. TheXPS survey spectrum in Figure 9 demonstrates the presenceof titanium, oxygen, carbon, and zirconium, and at the sametime the absence of sulfur. The XPS spectrum for C1s
(Figure 10a) with a binding energy of 283-291 eV, indicatingthat most of carbon atoms present in the TiO2 matrix exist asa solid solution (285 eV).49 The small peak at 287.5 eV maybe assigned to the elemental carbon originated from thetraces of non-hydrolyzed alkoxy groups,50 the residualcarbon from the precursor solution,51 and/or adventitiouselement carbon.52 The binding energy of Zr 3d represents in180-186 eV (Figure 10b). The peak at 182.2 eV correspondsto the Zr 3d5/2 state in the Ti1-xZrxO2 solid solution.29 Theabsence of sulfur peak(s) on XPS explains the fact that thereis no sulfur found on the surface of nanocrystals. Thus, it canbe concluded that sulfur is in a high dissolution state in theTiO2 lattice rather than an isolated oxide species on thesurface of the TiO2. The presence of sulfur was confirmedby other techniques such as elemental analysis, ICP-Mass,and EDS.
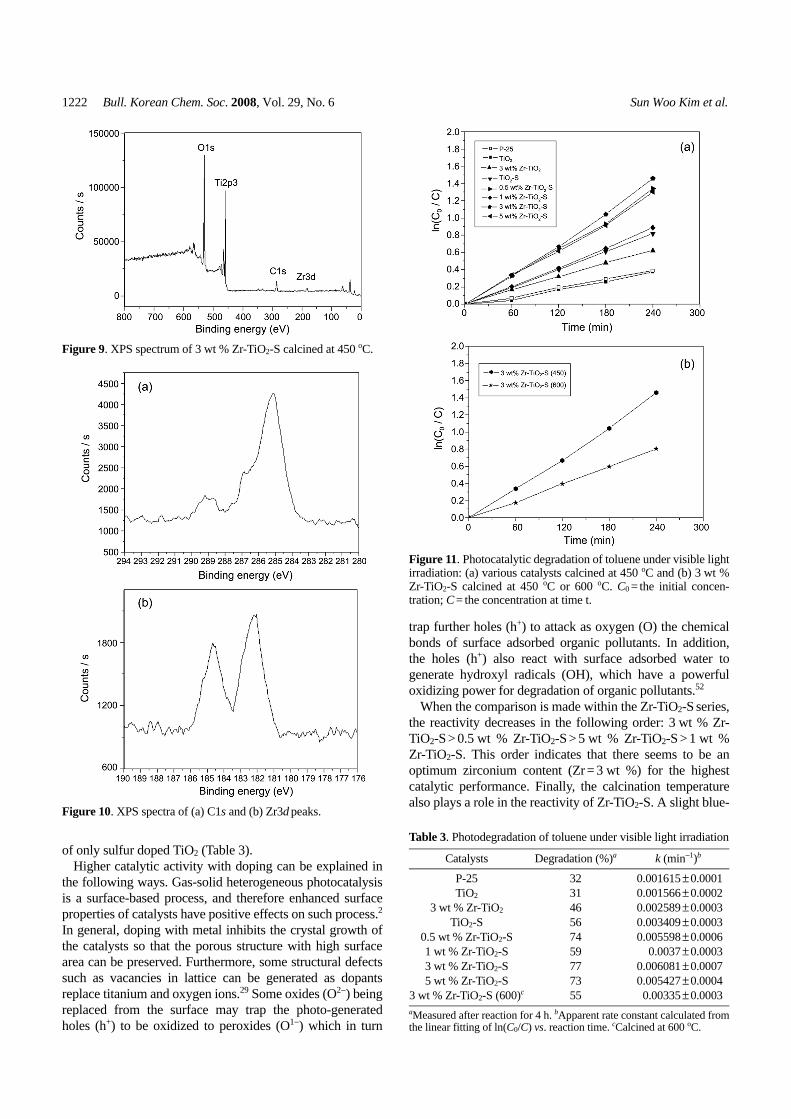
Photocatalytic Activity. Figure 11(a) illustrates thedegradation of gaseous toluene by visible light irradiationcatalyzed by TiO2, TiO2-S, Zr-TiO2, and Zr-TiO2-S calcinedat 450 oC along with P-25 for comparison. All reactionsexhibit pseudo first-order kinetics as illustrated in Figure 11,and relevant data summarized in Table 3. Most interestingly,it is for the first time to observe that our Zr-TiO2-S system isquite an effective visible-light active catalyst. The degra-dation of toluene reaches as high as 77% within 4 h. Thissystem exhibits much higher reactivity than any of theremaining catalysts such as TiO2-S, Zr-TiO2, TiO2, and P-25.These observations suggest that co-doping with bothzirconium and sulfur is more beneficial for the enhancementof catalytic efficiency than doping with sulfur or zirconiumalone. Sulfur has been known to reduce the band-gap energyof TiO2, thus for example moving the UV absorption bandtoward the visible region,10,17 as is confirmed by the DRSspectra in Figure 8. This fact is also reflected in the en-hanced reactivity of TiO2-S as compared with that of 3 wt %Zr-TiO2 or TiO2 (Table 3). Nevertheless surface properties ofcatalysts were enhanced by the zirconium dopants as shownby texture properties (Table 2). Therefore, Zr-TiO2-S hasmuch better photocatalytic performance compared with that
Table 2. Textural properties of Zr-TiO2-S
CatalystsBET surfacearea (m2/g)a
BJH porevolume (cm3/g)b
pore diameter(nm)c
TiO2 63.37 0.12 3.80TiO2-S 80.08 0.13 4.11
0.5 wt % Zr-TiO2-S 84.30 0.16 5.161 wt % Zr-TiO2-S 100.40 0.18 5.173 wt % Zr-TiO2-S 112.20 0.22 6.775 wt % Zr-TiO2-S 120.40 0.25 6.80
aMeasured by the BET method. bTaken from the volume of N2 adsorbedat P/Po = 0.99. cEstimated using desorption branch of the isotherm andthe BJH method.
Figure 7. TEM micrograph of 3 wt % Zr-TiO2-S calcined at 450oC: (a) TEM image and (b) High resolution TEM image.
Figure 8. UV-visible diffuse reflectance spectra of TiO2, 3 wt %Zr-TiO2, 3 wt % Zr-TiO2-S calcined at 450 oC, and 3 wt % Zr-TiO2-S calcined at 600 oC.
1222 Bull. Korean Chem. Soc. 2008, Vol. 29, No. 6 Sun Woo Kim et al.
of only sulfur doped TiO2 (Table 3).Higher catalytic activity with doping can be explained in
the following ways. Gas-solid heterogeneous photocatalysisis a surface-based process, and therefore enhanced surfaceproperties of catalysts have positive effects on such process.2
In general, doping with metal inhibits the crystal growth ofthe catalysts so that the porous structure with high surfacearea can be preserved. Furthermore, some structural defectssuch as vacancies in lattice can be generated as dopantsreplace titanium and oxygen ions.29 Some oxides (O2−) beingreplaced from the surface may trap the photo-generatedholes (h+) to be oxidized to peroxides (O1−) which in turn
trap further holes (h+) to attack as oxygen (O) the chemicalbonds of surface adsorbed organic pollutants. In addition,the holes (h+) also react with surface adsorbed water togenerate hydroxyl radicals (OH), which have a powerfuloxidizing power for degradation of organic pollutants.52
When the comparison is made within the Zr-TiO2-S series,the reactivity decreases in the following order: 3 wt % Zr-TiO2-S > 0.5 wt % Zr-TiO2-S > 5 wt % Zr-TiO2-S > 1 wt %Zr-TiO2-S. This order indicates that there seems to be anoptimum zirconium content (Zr = 3 wt %) for the highestcatalytic performance. Finally, the calcination temperaturealso plays a role in the reactivity of Zr-TiO2-S. A slight blue-
Figure 9. XPS spectrum of 3 wt % Zr-TiO2-S calcined at 450 oC.
Figure 10. XPS spectra of (a) C1s and (b) Zr3d peaks.
Figure 11. Photocatalytic degradation of toluene under visible lightirradiation: (a) various catalysts calcined at 450 oC and (b) 3 wt %Zr-TiO2-S calcined at 450 oC or 600 oC. C0 = the initial concen-tration; C = the concentration at time t.
Table 3. Photodegradation of toluene under visible light irradiation
Catalysts Degradation (%)a k (min−1)b
P-25 32 0.001615 ± 0.0001TiO2 31 0.001566 ± 0.0002
3 wt % Zr-TiO2 46 0.002589 ± 0.0003TiO2-S 56 0.003409 ± 0.0003
0.5 wt % Zr-TiO2-S 74 0.005598 ± 0.00061 wt % Zr-TiO2-S 59 0.0037 ± 0.00033 wt % Zr-TiO2-S 77 0.006081 ± 0.00075 wt % Zr-TiO2-S 73 0.005427 ± 0.0004
3 wt % Zr-TiO2-S (600)c 55 0.00335 ± 0.0003aMeasured after reaction for 4 h. bApparent rate constant calculated fromthe linear fitting of ln(C0/C) vs. reaction time. cCalcined at 600 oC.

Zr,S-Doped TiO2 as Visible Light Photocatalyst Bull. Korean Chem. Soc. 2008, Vol. 29, No. 6 1223
shift is observed in the DRS spectrum of 3 wt % Zr-TiO2-Swhen the sample is treated at higher temperature such as 600oC (Figure 8) along with decrease in the reactivity (Table 3,Figure 11b). These observations can be rationalized in termsof removal of sulfur at an elevated temperature.
Conclusions
A series of Zr-TiO2-S were synthesized by a modified sol-gel method developed earlier by us. They were characterizedby various spectroscopic and analytical techniques. Surfaceproperties as well as thermal stability of the anatase phaseare greatly enhanced by co-doping with zirconium andsulfur. The Zr-TiO2-S systems are very effective visible-lightactive catalysts for the degradation of toluene. The synergiceffect of co-doping with zirconium and sulfur is encounteredin the catalytic performance of Zr-TiO2-S to show thereactivity order as follows: Zr-TiO2-S > TiO2-S > Zr-TiO2 >TiO2 P-25. Within the same series the catalytic perfor-mance is found to be a function of Zr-contents as follows: 3wt % Zr-TiO2-S > 0.5 wt % Zr-TiO2-S > 5 wt % Zr-TiO2-S >1 wt % Zr-TiO2-S. Higher calcination temperature decreasesthe reactivity of Zr-TiO2-S.
Acknowledgements. TJK gratefully acknowledges thefinancial support from Korea Institute of Construction &Transportation Technology Evaluation and Planning (GrantNo. C10A1000018-06A0200-01220). Dr. Jin-Ook Baeg(Korea Research Institute of Chemical Technology) is alsoacknowledged for DRS measurements and Prof. Chang-moNam (Yeongnam College of Science & Technology) forproviding the photoreactor. Spectroscopic and analyticalmeasurements were performed by KBSI and the Center forScientific Instruments, KNU.
References
1. Fujishima, A.; Honda, K. Nature 1972, 238, 37. 2. Hoffmann, M. R.; Martin, S. T.; Choi, W.; Bahnemann, D. W.
Chem. Rev. 1995, 95, 69. 3. Linsebigler, A. L.; Lu, G.; Yates Jr., J. T. Chem. Rev. 1995, 95, 735. 4. Fujishima, A.; Hashimoto, K.; Watanabe, T. TiO2 Photocatalysis:
Fundamentals and Application; BKC: Tokyo, 1999. 5. Takahashi, Y.; Tatsuma, T. Langmuir 2005, 2, 12357. 6. Lim, S. H.; Luo, J.; Zhong, Z.; Ji, W.; Lin, J. Inorg. Chem. 2005,
44, 4124. 7. Kim, S.; Hwang, S.-J.; Choi, W. J. Phys. Chem. B 2005, 109, 24260. 8. Wang, X. H.; Li, J.-G.; Kamiyama, H.; Moriyoshi, Y.; Ishigaki, T.
J. Phys. Chem. B 2006, 110, 6804. 9. Ashi, R.; Morikawa, T.; Ohwaki, T.; Aoki, K.; Taga, Y. Science
2001, 293, 269.10. Umebayashi, T.; Yamaki, T.; Tanaka, S.; Asai, K. Chem. Lett.
2003, 32, 330.11. Robel, I.; Subramanian, V.; Kuno, M.; Kamat, P. V. J. Am. Chem.
Soc. 2006, 128, 2385.12. Jiang, D.; Xu, Y.; Hou, B.; Wu, D.; Sun, Y. J. Solid State Chem.
2007, 180, 1787.13. Lettmann, C.; Hinrichs, H.; Maier, W. F. Angew. Chem. Int. Ed.
Engl. 2001, 40, 3160. 14. Liu, B.; Zhao, X.; Zhang, N.; Zhao, Q.; He, X.; Feng, J. Surf. Sci.
2005, 595, 203.
15. Choi, W.; Termin, A.; Hoffmann, M. R. J. Phys. Chem. 1994, 98,13669.
16. Ikeda, S.; Sugiyama, N.; Pal, B.; Marcí, G.; Palmisano, L.; Noguchi,H.; Uosaki, K.; Ohtani, B. Phys. Chem. Chem. Phys. 2001, 3, 267.
17. Ohno, T.; Akiyoshi, M.; Umebayashi, T.; Asai, K.; Mitsui, T.;Matsumura, M. Appl. Catal., A 2004, 265, 115.
18. Cong, Y.; Zhang, J.; Chen, F.; Anpo, M. J. Phys. Chem. C 2007,111, 6976.
19. Ren, W.; Ai, Z.; Jia, F.; Zhang, L.; Fan, X.; Zou, Z. Appl. Catal.,B: Environ. 2007, 69, 138.
20. Serpone, N. J. Phys. Chem. B 2006, 110, 24287.21. Wang, H.; Lewis, J. P. J. Phys.: Condens. Matter. 2006, 18, 421.22. Ho, W.; Yu, J. C.; Lee, S. J. Solid State Chem. 2006, 179, 1171.23. Zhao, W.; Ma, W.; Chen, C.; Zhao, J.; Shuai, Z. J. Am. Chem. Soc.
2004, 126, 4782.24. Gao, B.; Ma, Y.; Cao, Y.; Yang, W.; Yao, J. J. Phys. Chem. B 2006,
110, 14391.25. Ohno, T.; Miyamoto, Z.; Nishijima, K.; Kanemitsu, H.; Xueyuan,
F. Appl. Catal., A 2006, 302, 62.26. Morikawa, T.; Irokawa, Y.; Ohwaki, T. Appl. Catal., A 2006, 314,
123.27. Fu, X.; Clark, L. A.; Yang, Q.; Anderson, M. A. Environ. Sci.
Technol. 1996, 30, 647.28. Twesme, T. M.; Tompkins, D. T.; Anderson, M. A.; Root, T. W.
Appl. Catal., B: Environ. 2006, 64, 153.29. Yu, J. C.; Lin, J.; Kwok, R. W. M. J. Phys. Chem. B 1998, 102, 5094.30. Huang, Y.; Zheng, Z.; Ai, Z.; Zhang, L.; Fan, X.; Zou, Z. J. Phys.
Chem. B 2006, 110, 19323.31. Wang, X.; Yu, J. C.; Chen, Y.; Wu, L.; Fu, X. Environ. Sci.
Technol. 2006, 40, 2369.32. Qui, S.; Starr, T. L. J. Electrochem. Soc. 2007, 154, H472.33. Khan, R.; Kim, S. W.; Kim, T.-J.; Lee, H. S. Bull. Korean Chem.
Soc. 2007, 28, 1951.34. Zhu, Y.; Liu, T.; Ding, C. J. Mater. Res. 1999, 14, 442.35. Cheng, P.; Qiu, J.; Gu, M.; Shangguan, W. Mater. Lett. 2004, 58,
3751.36. Ren, L.; Huang, X.; Sun, F.; He, X. Mater. Lett. 2007, 61, 427.37. Sun, H.; Bai, Y.; Cheng, Y.; Jin, W.; Xu, N. Ind. Eng. Chem. Res.
2006, 45, 4971.38. Bacsa, R.; Kiwi, J.; Ohno, T.; Albers, P.; Nadtochenko, V. J. Phys.
Chem. B 2005, 109, 5994. 39. Yu, J. C.; Ho, W.; Yu, J.; Yip, H.; Wong, P. K.; Zhao, J. Environ.
Sci. Technol. 2005, 39, 1175.40. Pillai, S. C.; Periyat, P.; George, R.; McCormack, D. E.; Seery, M.
K.; Hayden, H.; Colreavy, J.; Corr, D.; Hinder, S. J. J. Phys.Chem. C 2007, 111, 1605.
41. Padmanabhan, S. C.; Pillai, S. C.; Colreavy, J.; Balakrishnan, S.;McCormack, D. E.; Perova, T. S.; Gun`ko, Y.; Hinder, S. J.; Kelly,J. M. Chem. Mater. 2007, 19, 4474.
42. Ohsaka, T.; Izumi, F.; Fujiki, Y. J. Raman Spectrosc. 1978, 7, 321.43. Hamal, D. B.; Klabunde, K. J. J. Colloid Interface Sci. 2007, 311, 514.44. Sing, K. S. W.; Everett, D. H.; Haul, R. A. W.; Moscou, L.; Pierotti,
R. A.; Rouquerol, J.; Siemieniewska, T. Pure Appl. Chem. 1985,57, 603.
45. Yu, J.; Yu, J. C.; Leung, M. K.-P.; Ho, W.; Cheng, B.; Zhao, X.;Zhao, J. J. Catal. 2003, 217, 69.
46. Kondo, J. N.; Yamashita, T.; Nakajima, K.; Lu, D.; Hara, M.;Domen, K. J. Mater. Chem. 2005, 15, 2035.
47. O’Regan, B.; Grätzel, M. Nature 1991, 353, 737.48. Shi, Z. M.; Ye, X. Y.; Liang, K. M.; Gu, S. R.; Pan, F. J. Mater.
Sci. Lett. 2003, 22, 1255.49. Lettmann, C.; Hildenbrand, K.; Kish, H.; Macyk, W.; Maier, W. F.
Appl. Catal., B: Environ. 2001, 32, 215.50. Yu, J. C.; Yu, J. G.; Ho, W. K.; Jiang, Z. T.; Zhang, L. Z. Chem.
Mater. 2002, 14, 3808.51. Sakthivel, S.; Kisch, H. Angew. Chem. Int. Ed. 2003, 42, 4908.52. Ollis, D. F.; Al-Ekabi, H. Photocatalytic Purification and Treatment
of Water and Air; Elsevier: Amsterdam, 1993.
≈