zulfaqar journal of defence science, engineering & …
TRANSCRIPT

Mukhtaruddin et al./ Zulfaqar Int. J. Def. Sci. Eng. Tech. 3(2)(2020)
1
Zulfaqar J. Def. Sci. Eng. Tech. Vol.3 Issue 2 (2020) 1-17
ZULFAQAR Journal of Defence Science, Engineering & Technology
Journal homepage: zulfaqar.upnm.edu.my
APPLICATION OF ULTRA-HIGH FREQUENCY ANTENNA FOR PARTIAL DISCHARGE DETECTION IN OIL-FILLED POWER TRANSFORMER: A REVIEW
Azharudin Mukhtaruddina,*, Muzamir Isab, Mohd Fadzil Ainc, Mazlee Mohd Noord, Mohd Rafi Adzmanb, Mohamad Nur Khairul Hafizi Rohanib
a Faculty of Engineering, National Defence University of Malaysia, Malaysia b School of Electrical System Engineering, Universiti Malaysia Perlis, Malaysia c School of Electrical and Electronic Engineering, Universiti Sains Malaysia, Malaysia d School of Material Engineering, Universiti Malaysia Perlis, Malaysia
*Corresponding author: [email protected]
ARTICLE INFO ABSTRACT
Article history:
Received
13-05-2019
Received in revised
28-11-2019
Accepted
Partial discharge (PD) is a phenomenon that may lead to dielectric breakdown and
can provide important information for condition monitoring on electrical power
equipment, in particular transformer. One of the methods is the detection of the
electromagnetic (EM) wave signal emitted by PD. Although the frequency spectrum
in EM is very wide, this paper discusses the detection of EM only at ultra-high
frequency (UHF). One of the detectors that can be used to detect EM is the antenna.
There are a lot of antenna designs that have been proposed to detect the signal. The
designs can be generally divided into two: PCB-based design and physical antenna
design. An example of the latter is monopole. Some of the proposed antennas were
left at the design stage while others went to be applied in actual PD experimentation.
Discussion on the capabilities of these antennas can lead to the selection of a suitable
antenna.
© 2020 UPNM Press. All rights reserved.
14-09-2020
Available online
31-12-2020
Keywords: power transformer, dielectric liquid, partial discharge, ultra-high frequency, antenna
e-ISSN: 2773-5281Type: Article
Introduction
Partial discharge (PD) is a phenomenon where discharge between conductors takes place but not amounting to total breakdown. There are several types of PD: internal discharge (due to a cavity within dielectric), surface discharge (takes place at the boundary of different materials), corona discharge (due to the inhomogeneous electric field), and treeing (takes place inside solid dielectric). PD detection is now becoming commonly associated with the electrical power system condition monitoring especially on the condition of the insulation. In this paper, the focus is given on the detection of PD in an oil-filled power transformer. To put things into perspective, close to 40% of the breakdown in power transformers come from insulation or dielectric failure (Tenbohlen et al., 2017).

Mukhtaruddin et al./ Zulfaqar Int. J. Def. Sci. Eng. Tech. 3(2)(2020)
2
There are several PD detection techniques available such as electrical charge emission detection (EE). This method is also known as the conventional technique appears as standard in IEC 60207 (Bureau of Indian Standards, 2000). This method acts as benchmarking, also known as calibration, for other non-conventional techniques of detection (Gautchi et al., 2012). Among the non-conventional techniques are acoustic, electromagnetic (EM), dissolved gas analysis (DGA), optical or even combination of them (Rohani et al., 2016; Mukhtaruddin et al., 2016; Lemke et al., 2008).
The EM method involves the detection of the EM wave produced by PD using detectors, particularly
antenna. The EM wave radiated from PD can be characterised by its amplitude, frequency band and time of occurrence (Bojovschi et al., 2010). On top of that, the authors noted that the rate of ionisation and the dimension of cavities in which the PD initiated, also affect the characteristics.
Much of the frequency range of the EM wave that has been researched was within the radio
frequency (RF), in particular in ultrahigh-frequency (UHF: 300 – 3000 MHz) range. For comparison, RF has a wider spectrum from low frequency (LF: 30 – 300 kHz) up to extra high frequency (EHF: 30 – 300 GHz). A question of which range of the RF spectrum is more desirable for PD detection was brought forward in (Fan et al., 2016).
It is interesting to note that some of the authors consider EM emission from PD may cover a wider
spectrum than only UHF (Robles et al., 2016). Some of them opined that the spectrum may include very high frequency (VHF: 30 – 300 MHz) (Gautchi et al., 2012; Albarracin et al., 2015), super-high frequency (SHF: 3 – 30 GHz) (Zahed et al., 2017; Alkadi et al., 2016) or even 0 – 3 GHz (Coenen et al., 2008). In Wang et al., (2017), the authors noted that certain antenna designs cover only part of PD EM detection, namely UHF. Authors in Hoek et al., (2014) came out with a very interesting conclusion when a number of UHF sensors failed to detect a PD at 100 MHz – 1.5 GHz band. According to them, the particular PD which was due to the presence of gaseous microbubble might produce EM signal at frequency spectrum outside UHF range. Authors in (Sinaga et al., 2014) noted that the current pulse from PD produces a wide frequency spectrum that includes UHF.
Nevertheless, detection of PD in an oil-filled power transformer at UHF spectra has been a wide-
ranging practice. A lot of detail techniques, detectors and research have been produced. Commercial detectors for the technique are also readily available in the market. This paper will look into the application of the UHF detection technique for inspecting PD inside an oil-filled power transformer.
UHF Signal Detection from Partial Discharge The UHF detection signal from PD has been very popular among researchers. The range, which has its root in mid of the 1990s, is noted to be most widely applied detection method and attracts a lot of attention (Kraetge et al., 2013; Cai et al., 2014; Mirzaei et al., 2015). The method had previously been widely used to detect PD in the gas-insulated substation (GIS) before found its application into the power transformer (Ishak et al., 2013).
UHF detection has several advantages that attract its application. In (Harbaji et al., 2015; Akbari et al., 2016) UHF has been noted for its high sensitivity in detecting PD incidence. Sensitivity here refers to the benchmarking to the magnitude of charge value as measured using the EE technique. For example, it was found the EM is sensitive enough to detect PD incident level equivalent to 25 – 30 pC (Meijer et al., 2008). Another experiment has also been carried out in Hoek et al., (2014) in which the result showed that the UHF antenna was able to register more than 1000 µV for a PD level of 73 pC. Lower minimum detectable charge by UHF at 6 pC in Gautchi et al., (2012) and even 5 pC in Sinaga et al., 2014) has been demonstrated. The conclusion was based on the linearity relationship assumption between EM and EE measurements. Although the linearity relationship was found to be not entirely correct (Siegel et al., 2017; Coenen et al., 2016; Jahangir et al., 2017a). As a comparison, a healthy power transformer will produced 10 – 50 pC or lower of PD (Sokolov et al., 2018). Consequently, EM technique is generally comparable to result as detected using EE technique.
Another important advantage of having UHF measurement is its immunity against EM interference
(Jahangir et al., 2017a). Detection through the UHF method also provides immunity from external noises as demonstrated in (Hoek et al., 2014). In addition, the propagation of EM wave in dielectric oil suffers only

Mukhtaruddin et al./ Zulfaqar Int. J. Def. Sci. Eng. Tech. 3(2)(2020)
3
low signal attenuation (Cleary & Judd, 2006; Yaacob et al., 2014). In Coenen et al., (2016), the authors noted the figure is around 2 dB per meter.
It is also regarded as having a high signal to noise ratio (Kim & Hikita, 2013). Its ability to detect PD
under DC condition as well as the capability of pinpointing PD source well within the transformer winding has been noted in (Ishak et al., 2013). In term of application, the technique has been applied as an on-site and online PD monitoring technique (Coenen et al., 2016). It is also commonly used as an initiation signal for a hybrid method such as with acoustic (Hoek et al., 2014).
As for its disadvantages, measuring UHF has been found to be expensive (Harbaji et al., 2015).
Additionally, it was also difficult to install the UHF probe although Cigre had recommended providing specific DN50 drain valves for inserting the antenna (Siegel & Tenbohlen, 2016). The number of the probe is also limited to the number of opening available in a transformer.
Several designs of the antenna have been proposed by researchers as the PD UHF detector. It
includes monopole, dipole and broadband dipole, loop, fractal, a patch antenna and several other designs. Industry players also have come up with a commercial-grade UHF detector. There are two common types of detectors: a drain-valve antenna (BSS Hochspannungstechnik GmbH 2017) and dielectric window antenna (Power Diagnostics Service Co. Ltd. n.d.). Whilst the former can be driven through the standard drain valve, the latter needs a dielectric window which most probably needs to be retrofitted. Basic designs for the drain-valve antenna are a short monopole, plate, conical or any other design suitable inside a drain valve (Sinaga, 2012). For dielectric window antenna, it usually takes planar shape such as microstrip sensor, log-spiral, spiral or fractal (Sinaga, 2012). Figure 1 below shows examples for both commercial antenna types. The drain valve in the example has an insertion depth of 450 mm and ingression protection (IP) class of 65. While the dielectric window antenna has an IP 67 for its external connection box.
(a) (BSS Hochspannungstechnik GmbH 2017) (b) (Power Diagnostics Service Co. Ltd. n.d.)
Figure 1: Example of commercial (a) drain-valve antenna and (b) dielectric window antenna
UHF Antenna Review In this section, several studies that offered comparison and testing of antenna designs suit for drain-valve and dielectric window were studied. The studies must also include actual PD experimentation, preferably in a dielectric liquid environment. A review on antennas designed with the intention for PD detection application but without the actual PD experimentation will also be presented.
Simple monopole antenna applications in detecting UHF from PD have been repeatedly demonstrated in several studies. For instance, researchers in (Sinaga et al., 2012) proposed using four monopole antennas in order to detect and locate the PD source. No details about the antenna were offered. However, it was noted by the authors that the monopole antenna has a lower sensitivity. Nevertheless, the authors further noted that monopole has a faster signal response compared to a disk antenna. The former also has the least oscillation.
The fact that monopole has a fast signal response is preferred for PD detection since it means it can
capture a fast-changing signal (Sinaga, 2012). The same study also confirmed that monopole has lesser oscillation. This makes the antenna suitable for source location. As for frequency response, a monopole has

Mukhtaruddin et al./ Zulfaqar Int. J. Def. Sci. Eng. Tech. 3(2)(2020)
4
a relatively flat pattern, especially for lower frequency. Another variant of the monopole antenna, conical skirt monopole (conical for short), has about the same performance. For sensitivity test conducted in air, monopole performance is comparable to other designs of antennas (as low as 5 pC at 1.5 m and below). However, for 5 pC PD at 2 m source, the monopole registered detected only half of the magnitude compared to the conical antenna. The same study revealed that spiral and its variant, log spiral antenna have a stable response across wider frequency. This makes the design falls into wideband and category suitable for PD UHF detection. These two designs have the sensitivity of about the same as the conical antenna. Nevertheless, it is interesting to note that all antennas had shown a similar ability to pick-up PD signal as low as 20 pC for a source of 70 cm away in an experiment conducted in transformer oil.
Researchers in (Muñoz, 2013) performed comparison study for four designs of antennas: two
monopoles with different lengths (50 and 100 mm), a trapezoidal zigzag antenna (with a straight length of 165 mm), and a commercial log periodic antenna. The outcome of the experiment conducted by the team showed that the two monopoles were able to detect relative PD signal at cumulative power higher that zigzag and log periodic antenna. Relative PD signal here referred to the differences between detected the PD signal power level against the detected noise level. Further analysis using wavelet decomposition supported the previous conclusion. On top of that, from the analysis, it was found that shorter monopole antenna had captured more than 60% of the energy at UHF band.
Wavelet decomposition was used to study PD signal detection using antennas (Fan et al., 2016).
Three designs of the antenna, namely Goubau, monopole and discone, were used in a PD experiment involving an actual power transformer. The decomposition of the signal revealed bands of frequency in which the detection should be done. From the result, it was observed that Goubau and monopole designs had the highest accuracy in PD recognition for PD signals in such bands. Furthermore, the accuracy was consistent for all four wavelets considered for the decomposition process.
One of the antenna designs that widely employed in PD UHF detection is geometries variants that
can be made on PCB. Peano, Koch, tee-type and Sierpinski fractal geometries have been proposed in (Oraizi & Hedayati, 2012). It was noted that the resonance frequencies lie at the higher part of UHF and bandwidth for each is very limited. The size of the antenna surface was 30 x 30 mm while the thickness of the antenna was the thickness of the PCB. Authors in (Wang et al., 2017a) and (Wang et al., 2017b) had proposed a Minskowski variant with a wider bandwidth. In both reports, the whole stated bandwidth has been measured to be below -10 dB for S11. Compared to (Oraizi & Hedayati, 2012), the dimension of the antennas in both designs is bigger. Table 1 is the summary of the research in which the proposed antenna had never been subjected to any PD experimentation.
Table 1: Antennas Designed to be A PD Detector but Not Subjected to PD Experimentation
Reference/ fractal geometries Resonance
frequency (GHz) Bandwidth
(MHz) Antenna surface perimeter
x depth x thick (mm)
Oraizi & Hedayati, (2012)/ Peano 1.87 44 30 x 30 x 10
Oraizi & Hedayati, (2012)/ triangular Koch
1.91 36 30 x 30 x PCB
Oraizi & Hedayati, (2012)/ square Koch
2.15 82 30 x 30 x PCB
Oraizi & Hedayati, (2012)/ tee-type
2.14 40 30 x 30 x PCB
Oraizi & Hedayati (2012)/ Sierpinski
2.05 40 30 x 30 x PCB
Wang et al., (2017a)/ Minskowski Not available 700 – 3220 129 x 108 x PCB
Wang, (2017b)/ Minskowski Not available 700 – 4710 120 x 120 x PCB
Figure 2 below show examples of PCB-based antenna. All the designs are etched on PCB together
with their feeding line. There are actually several variants related to certain types of designs. For example, the Minkowski fractal geometries are not limited to the examples shown. Certain design can also stack on top of the other.

Mukhtaruddin et al./ Zulfaqar Int. J. Def. Sci. Eng. Tech. 3(2)(2020)
5
(a) Minkowski fractal geometries
(Oraizi & Hedayati, 2012) (b) Loop antenna with meandering
technique (Ye et al., 2014) (c) Equiangular spiral
antenna (Mao et al., 2009)
(d) Archimedean Sinusoidal Spiral Antenna (ASSA (Alkadi et
al., 2016)
(e) Ultra-wide band printed antenna (Yang et al., 2016)
(f) Monopole etched on PCB (Chai et al., 2018)
Figure 2: Examples of PCB-based antenna design Peano fractal and Hilbert fractal designs have been selected to be in the research conducted by
researchers in (Li et al., 2012). These designs still had a small relatively bandwidth and covered only part of PD spectrum up to 1 GHz. Both antennas were able to detect the PD signal despite the Peano antenna is smaller than the Hilbert design. In addition, it was noted by the authors the former had slightly wider spectrum coverage.
Authors in (Li, et al., 2013) showed that Hilbert could be improved further. The improvement in term
of bandwidth, as well as smaller size, could be noted from the result presented in the paper. From the result presented in the work, the antenna was expected to detect around 20 mV of the PD signal. A further experiment in a model transformer had been devised in order to validate the previous result which was done in a controlled regime. Three antennas were used in this experiment. One antenna was put inside the PD model (as the reference) and the other two on the two different dielectric windows. One of the windows was located adjacent to the PD model (S1) while another one was on the opposite wall and obstructed by a winding (S2). The results showed that S1 received about 70% of the signals’ power spectra while S2 lost most of them – around 30% for corona and 20% for surface discharge. In term of spectra, S1 was able to maintain most of them. However, for S2, it can be considered as an unusable.
Authors in (Li, et al., 2014) had proposed a meander line antenna to overcome the issue of low
bandwidth. From the results put forward in the article, it can be seen that the antenna was able to detect the PD signal at around 15 mV, both for surface and gas cavity model. The antenna was also able to detect the signals at the designed bandwidth.
Another meandering-based multiband antenna has been proposed in (Ye et al., 2014). It was a loop-
based geometry built from a metal patch. The performance of the purpose-built antenna was compared to a broadband antenna. Corona and free particle PD model had been selected to do the comparison. For the corona model, the constructed antenna could measure 90% against the signal detected by the broadband antenna. While for the free particle model, it was 65%. However, the authors noticed that the signal to noise
Mukhtaruddin et al./ Zulfaqar Int. J. Def. Sci. Eng. Tech. 3(2)(2020)
6
ratios (SNR) for the multiband antenna was better than the one recorded by the broadband antenna. Equiangular spiral antenna (ESA) that used a printed circuit board (PCB) has been proposed by
researchers in (Liu et al., 2015). In the study, three other antennas, namely a microstrip patch antenna (MPA), a microstrip slot antenna (MSA), and a printed dipole antenna (PDA)—were also fabricated. Testing in gigahertz transverse electromagnetic (GTEM) cell revealed that ESA had the lowest and most stable antenna factor. Results from PD experimentation showed that the ESA antenna had the highest signal magnitude with 35 mV along with detailed waveform. On the other hand, the lowest signal measured was recorded by MPA (4.5 mV) and for MSA it was 8 mV. The waveform for MPA, meanwhile, was the worse due to its narrowband character. PDA antenna recorded 15 mV signal magnitude with poor signal symmetry. The negative reading of the signal was not clear.
A specific spiral antenna variant, one-arm Archimedean Sinusoidal Spiral Antenna (ASSA), has been
designed to capture signals generated by PD in an oil filled transformer (Alkadi et al., 2016). In the conducted experiment using three PD models namely sharp edge, surface and corona, the developed antenna was able to record a PD signal of around 10 mV. The signals captured by the antenna were also subjected to a feature extraction system for PD source identification.
Authors in (Zahed et al., 2017) managed to improve the performance of Hilbert fractal design
comparable to Minskowski’s. The variants include 4th order Hilbert antenna, two sets of 4th order Hilbert antenna stacked together, and a smaller version of the original geometry. In experiments involving sharp edge, surface and corona models, the stacked antenna recorded the lowest reading of less than 10 mV, the third design recorded around 10 mV while the first design was able to detect PD signals of more than 10 mV. The three design antennas were also inspected on their sensitivity. By putting them at different distances from PD source (25, 35 and 56 cm), the authors concluded that design number three had the highest sensitivity. The antennas were then tested for their SNR. Again it was found that design number three emerged as the best antenna.
A novel type of UWB antenna called microstrip-fed planar elliptical monopole antenna (MPEM) has
been proposed in (Chai et al., 2018). It was basically a monopole antenna but designed on a substrate. The performance of the antenna was made against four other designs: monopole antenna, conical monopole, log-spiral antenna, elliptical antenna, and also a high-frequency current transformer (HFCT) or its variant (Rohani et al., 2016). It was observed that the planar elliptical monopole antenna detected PD signal at around +/- 0.1 V, which is comparable to the HFCT. However, no results from the other four antennas were offered in the article.
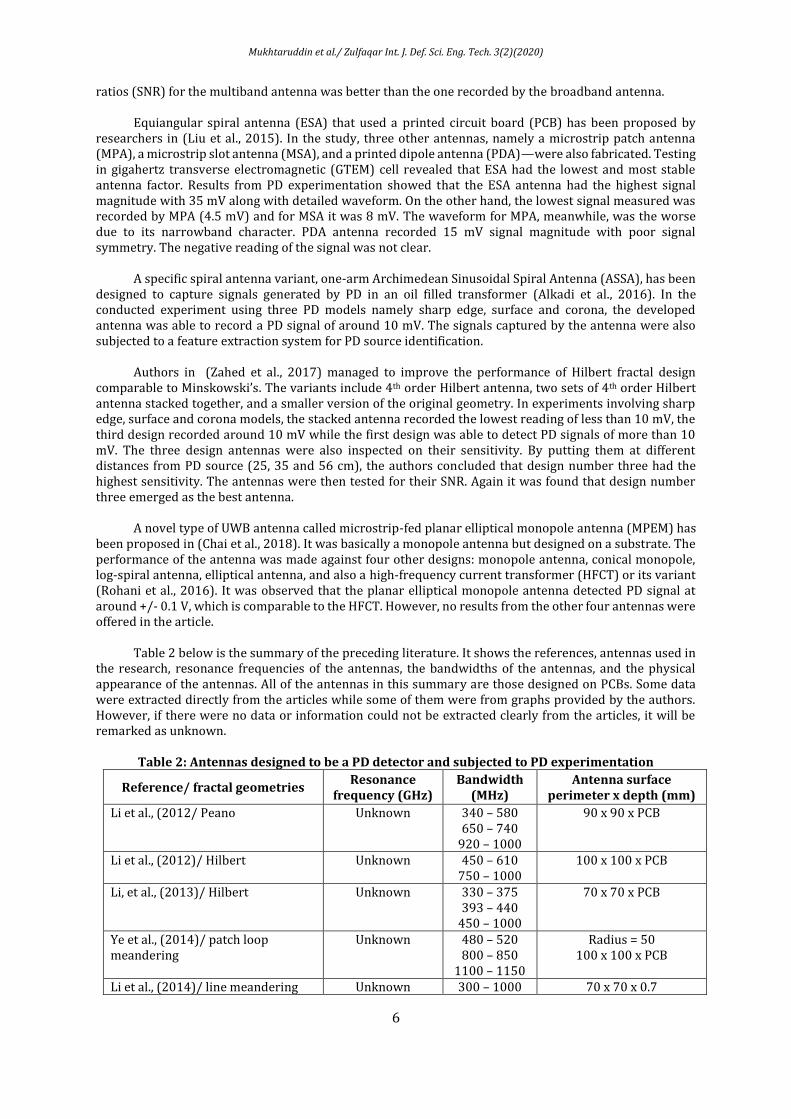
Table 2 below is the summary of the preceding literature. It shows the references, antennas used in
the research, resonance frequencies of the antennas, the bandwidths of the antennas, and the physical appearance of the antennas. All of the antennas in this summary are those designed on PCBs. Some data were extracted directly from the articles while some of them were from graphs provided by the authors. However, if there were no data or information could not be extracted clearly from the articles, it will be remarked as unknown.
Table 2: Antennas designed to be a PD detector and subjected to PD experimentation
Reference/ fractal geometries Resonance
frequency (GHz) Bandwidth
(MHz) Antenna surface
perimeter x depth (mm)
Li et al., (2012/ Peano Unknown 340 – 580 650 – 740
920 – 1000
90 x 90 x PCB
Li et al., (2012)/ Hilbert Unknown 450 – 610 750 – 1000
100 x 100 x PCB
Li, et al., (2013)/ Hilbert Unknown 330 – 375 393 – 440
450 – 1000
70 x 70 x PCB
Ye et al., (2014)/ patch loop meandering
Unknown 480 – 520 800 – 850
1100 – 1150
Radius = 50 100 x 100 x PCB
Li et al., (2014)/ line meandering Unknown 300 – 1000 70 x 70 x 0.7

Mukhtaruddin et al./ Zulfaqar Int. J. Def. Sci. Eng. Tech. 3(2)(2020)
7
(Ye et al., 2014)/ broadband Unknown 300 – 2000 Radius 150 x 260 (Liu et al., 2015)/ ESA Unknown 500 – 550
850 – 1050 1150 – 3000
Radius = 62 124 x 124 x PCB
(Alkadi et al., 2016)/ ASSA Unknown 500 – 5000 Radius = 98 100 x 100 x PCB
(Zahed et al., 2017)/ Hilbert Unknown 500 – 4000 600 – 2300
1300 – 4150
100 x 100 x PCB Stacked,
100 x 100 x PCB 50 x 50 x PCB
(Chai et al., 2018)/ MPEM Unknown 1000 – 10000 Radius 40, length 40 + 100 x 1.6
(Chai et al., 2018)/ monopole Unknown Unknown Unknown Chai et al., (2018)/ conical monopole
Unknown Unknown Unknown
(Chai et al., (2018)/ log-spiral Unknown Unknown Unknown Chai et al., (2018)/ elliptical Unknown Unknown Unknown
The following Figure 3 shows examples of physical antennas that have been applied in several
research. These antennas were either constructed by the researchers themselves or acquired from the market.
(a) From top, zig-zag antenna and monopole antennas with length variants (Robles et al., 2012)
(b) Discone antenna (Fan et al., 2016)
(c) Goubau antenna (Fan et al., 2016)
Figure 3: Example of physical antennas
Two simple monopoles (5 and 10 cm) antennas have been used in a PD-related experiment along with a zigzag and an off-the-shelf log periodic antenna (Robles et al., 2012). When subjected to the PD signal, the 5-cm monopole antenna was able to register around 20 mV and the 10-cm monopole recorded around 15 mV. The zigzag antenna, with 16.5 cm length of wire if straightened, detected around 10 mV worth of PD signal while the commercial antenna also at about 10 mV. The latter, however, exhibit asymmetrical of a positive and negative reading. The authors also tabulated results showing the magnitude of power received from the PD signal against background noise. Both the 5 and 10-cm antennas recorded a good performance (more than 7 dB different between PD signal power and background noise) in at least 7 from 10 frequency bands. The zigzag had 5, the same number as the log periodic antenna, both at low frequency and higher frequency bands. Further analysis showed that the shorter monopole captured more than 60% of energy at UHF range while 10-cm antenna captured 50% of energy at VHF range. The zigzag antenna was capturing more than 40% of energy in the band where FM radio is transmitted. However, no result for this analysis was offered for the commercial antenna.

Mukhtaruddin et al./ Zulfaqar Int. J. Def. Sci. Eng. Tech. 3(2)(2020)
8
A monopole antenna had also being used along with the conventional method in (Reid et al., 2011).
A comparison was made between these two methods for several types of PD. The authors noted that although the antenna had registered a 0.5 V of PD signal, the cumulative energy method is more accurate due to the resonant nature of the PD signal.
Another group of researchers were also applying the monopole antenna along with Goubau and
discone for the PD experiment using an actual power transformer (Fan et al., 2016). These antennas were tested for their capability to detect PD signals at different frequency bands. The bands that contained most PD signal were 156.25 – 312.5 MHz and 1093.75 – 1250 MHz. According to the study, Goubau and monopole antenna had the best ability to recognise PD signals at those bands. Both had over 90% recognition ability for the lower band. While for the higher frequency band, the monopole antenna had the performance of around 80 – 90%. Goubau antenna recorded around 90% accuracy for haar, db2 and db8 wavelets and 70 – 80% for sym2 and sym8 wavelets. This can be concluded that Goubau and monopole had a good PD recognition capacity despite different wavelets were.
Monopole antenna has been chosen together with double conical and strip antenna in a
demonstration on PD phenomena detection (An et al., 2016). The VSWR was recorded to be less than 2 for the antennas at 400 – 1000 MHz, 300 – 1500 MHz and 350 – 440 MH. All antennas were then subjected to 0.3 – 1.4 GHz, 5 V PD signal. The distance between antennas and the PD source was set at 1.2 m. The signal intensity ratio was then measured. It was found that the double cone had the flattest response at a 0.4 – 0.6 ratio across the frequency. Monopole antenna registered the ratio of 0.3 at 400 MHz and increased to more than 0.7 at 1000 MHz. This corresponds to the antenna’s frequency band. Beyond that, the readings were 0.2 at 300 MHz, 0.3 (1100 MHz), 0.1 (1200 MHz) and less than 0.1 for 1300 – 1400 MHz. For strip antenna, the ratio was more than 0.7 at 400 MHz, but less than 0.1 elsewhere.
Authors in Albarracin et al., (2016) had the opinion that wire antennas are justifiably suitable for
their study. Initially, the authors considered 4 choices of the monopole antenna. Eventually, a 10-cm antenna was selected (theoretical λ/4 resonant frequency of 750 MHz). A detailed study of the resonant frequencies of a model transformer has been demonstrated. Comparison between calculated and actual measurement showed that almost all theoretical values were detected, except for higher frequencies. The antenna was able to capture signals in the range of 500 – 2000 MHz. The detected signals’ power was from -8 to -43 dB, with the relative error of -0.03 to 7.3 %. The highest power reading correlated to a measured frequency of 787 MHz and calculated to be 780 MHz.
Six different types of antenna have been experimented in (Akbari et al., 2016), namely half cone
probe (HCP), grounded cone antenna (GCA), planar archimedean antenna (PAA), planar log-periodic (PLP), coupled sectorial loop antenna (CSLA) 1 and CSLA 2. There were four numbers of the same antenna used in measuring the PD, bringing the total to 24. Not many details on the antennas were offered in the article. All antennas were installed in the same transformer tank and were subjected to the same PD signal, albeit at different distances and angles. Table 3 below is a summary of the findings by the authors. From the table, it can be seen that the amplitude of detected PD signals cannot be correlated to distance or angle, even for the same antenna. For example, HCP number 1, positioned at 164 cm from PD source registered 0.6 V of PD signal while HCP 2 despite located at 91 cm away from the same PD source managed to record 0.2 V only.
Table 3: Maximum amplitude (A) of the PD signal detected by UHF antennas located at different
locations and at different angles from the PD source Antenna Distance (cm) Angles (o) A (V)
HCP:1/2/3/4 164/91/23/88 57/8/18/25 0.6/0.2/2/0.3 GCA:1/2/3/4 45/116/178/118 52/76/30/70 4/2/3.8/4 PAA:1/2/3/4 89/107/100/86 65/29/72/14 0.8/0.7/0.1/0.07 PLP:1/2/3/4 143/26/96/128 33/40/60/67 0.4/0.2/0.8/0.4
CSLA1:1/2/3/4 50/66/138/100 72/77/49/77 0.3/0.2/0.2/0.38 CSLA2:1/2/3/4 117/179/139/28 70/77/79/15 0.8/0.8/0.2/0.19
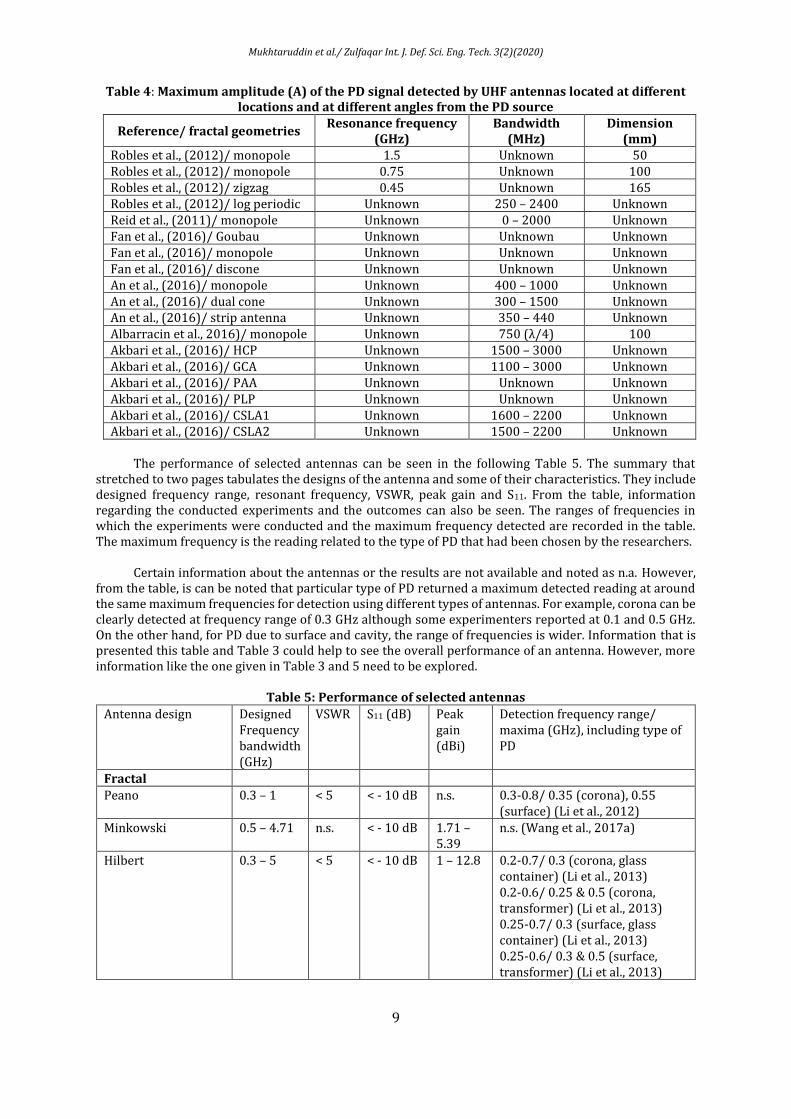
Summary of all of the preceding citations is presented in Table 4. Certain information sometimes was impossible to be extracted from the given graphs due to lacking clarity; hence it is noted as unknown. Unknown remarks are also given to information that was simply not stated in the said article.
Mukhtaruddin et al./ Zulfaqar Int. J. Def. Sci. Eng. Tech. 3(2)(2020)
9
Table 4: Maximum amplitude (A) of the PD signal detected by UHF antennas located at different locations and at different angles from the PD source
Reference/ fractal geometries Resonance frequency
(GHz) Bandwidth
(MHz) Dimension
(mm) Robles et al., (2012)/ monopole 1.5 Unknown 50 Robles et al., (2012)/ monopole 0.75 Unknown 100 Robles et al., (2012)/ zigzag 0.45 Unknown 165 Robles et al., (2012)/ log periodic Unknown 250 – 2400 Unknown Reid et al., (2011)/ monopole Unknown 0 – 2000 Unknown Fan et al., (2016)/ Goubau Unknown Unknown Unknown Fan et al., (2016)/ monopole Unknown Unknown Unknown Fan et al., (2016)/ discone Unknown Unknown Unknown An et al., (2016)/ monopole Unknown 400 – 1000 Unknown An et al., (2016)/ dual cone Unknown 300 – 1500 Unknown An et al., (2016)/ strip antenna Unknown 350 – 440 Unknown Albarracin et al., 2016)/ monopole Unknown 750 (λ/4) 100 Akbari et al., (2016)/ HCP Unknown 1500 – 3000 Unknown Akbari et al., (2016)/ GCA Unknown 1100 – 3000 Unknown Akbari et al., (2016)/ PAA Unknown Unknown Unknown Akbari et al., (2016)/ PLP Unknown Unknown Unknown Akbari et al., (2016)/ CSLA1 Unknown 1600 – 2200 Unknown Akbari et al., (2016)/ CSLA2 Unknown 1500 – 2200 Unknown
The performance of selected antennas can be seen in the following Table 5. The summary that
stretched to two pages tabulates the designs of the antenna and some of their characteristics. They include designed frequency range, resonant frequency, VSWR, peak gain and S11. From the table, information regarding the conducted experiments and the outcomes can also be seen. The ranges of frequencies in which the experiments were conducted and the maximum frequency detected are recorded in the table. The maximum frequency is the reading related to the type of PD that had been chosen by the researchers.
Certain information about the antennas or the results are not available and noted as n.a. However,
from the table, is can be noted that particular type of PD returned a maximum detected reading at around the same maximum frequencies for detection using different types of antennas. For example, corona can be clearly detected at frequency range of 0.3 GHz although some experimenters reported at 0.1 and 0.5 GHz. On the other hand, for PD due to surface and cavity, the range of frequencies is wider. Information that is presented this table and Table 3 could help to see the overall performance of an antenna. However, more information like the one given in Table 3 and 5 need to be explored.
Table 5: Performance of selected antennas
Antenna design Designed Frequency bandwidth (GHz)
VSWR S11 (dB) Peak gain (dBi)
Detection frequency range/ maxima (GHz), including type of PD
Fractal
Peano 0.3 – 1 < 5 < - 10 dB n.s. 0.3-0.8/ 0.35 (corona), 0.55 (surface) (Li et al., 2012)
Minkowski 0.5 – 4.71 n.s. < - 10 dB 1.71 – 5.39
n.s. (Wang et al., 2017a)
Hilbert 0.3 – 5 < 5 < - 10 dB 1 – 12.8 0.2-0.7/ 0.3 (corona, glass container) (Li et al., 2013) 0.2-0.6/ 0.25 & 0.5 (corona, transformer) (Li et al., 2013) 0.25-0.7/ 0.3 (surface, glass container) (Li et al., 2013) 0.25-0.6/ 0.3 & 0.5 (surface, transformer) (Li et al., 2013)

Mukhtaruddin et al./ Zulfaqar Int. J. Def. Sci. Eng. Tech. 3(2)(2020)
10
0.25-1/ 0.6 (cavity, antenna 1) (Li et al., 2013) 0.2-1/ 0.25 (cavity, antenna 2) (Li et al., 2013) 0.3-1/ 0.8 (surface, antenna 1) (Li et al., 2013) 0.2-1/ 0.4 (surface, antenna 2) (Li et al., 2013)
Sierpinski 1.96 – 3.78 2.05 (0.4)
n.s. < - 10 dB n.s. n.s. (Sung, 2011)
triangular Koch 1.96 (0.36)
n.s. n.s. n.s. n.s. (Oraizi & Hedayati, 2012)
square Koch 2.15 (0.82)
n.s. n.s. n.s. n.s. (Oraizi &Hedayati, 2012)
Meander-based
loop antenna 0.3 – 1 < 2 n.s. n.s. 0.25-1/ 0.3 (corona) (Li et al., 2014)
loop antenna 0.48 – 1.15
n.s. < - 10 dB n.s. 0-1/ 0.1 (corona) (Ye et al., 2014) 0-1.5/ 0.4 (surface) ( Ye et al., 2014) 0-1.5/ 0.5 (free particle) (Ye et al., 2014)
Pole-based
monopole 1 cm 0.75 – 30 n.s. n.s. n.s. n.s. (Albarracin et al., 2016)
monopole 5 cm 1.5 – 6 n.s. < - 10 dB1
n.s. n.s. (Robles et al., 2012; Albarracin et al., 2016)
monopole 10 cm 0.75 – 3 n.s. < - 10 dB1
n.s. n.s. (Robles et al., 2012; Albarracin et al., 2016)
monopole 16.5 cm 0.45 – 1.82
n.s. n.s. n.s. n.s. (Albarracin et al., 2016)
zig-zag 16.5 cm 0.45 (fr) n.s. < - 10 dB1
n.s. n.s. (Robles et al., 2012)
monopole 0.3 – 1 n.s. n.s. n.s. n.s. (Doble Lemke, 2009)
Monopole 0.2 – 1.2 n.s. n.s. n.s. n.s. (Power Diagnostics Service Co. Ltd. n.d.)
Monopole 0.3 – 1 n.s. n.s. n.s. n.s. (Power Diagnostix Systems GmbH n.d.)
Monopole 0.15 – 1 n.s. n.s. n.s. n.s. (Omicron Electronics GmbH n.d.)
Periodic
Log 0.24 – 2.4 n.s. n.s. n.s. n.s. (Robles et al., 2012; Mejino et al., 2013)
Spiral
Log 0.1 – 2 n.s. n.s. n.s. 0.1-2/ 0.9 (void), 0.9 (free particle), 0.5 (void and free particle) (Sinaga et al., 2014)
ASSA 0.5 – 6.5 n.s. < - 10 dB n.s. n.s. (Alkadi et al., 2016)
plane equiangular 1 – 4 n.s. n.s. n.s. n.s. (Zheng et al., 2014)
equiangular (ESA) 3.1 – 10.6 n.s. n.s. n.s. n.s. (Liu et al., 2015)
Archimedean 0.3 – 3 < 5 n.s. n.s. n.s. (Wu et al., 2013)
Others
double cone 0.3 – 1.5 < 5 n.s. n.s. n.s. (An et al., 2016)
semi -circular patch 0.74 – 0.855
n.s. < - 10 dB n.s. n.s. (Amin & Karmakar, 2016)

Mukhtaruddin et al./ Zulfaqar Int. J. Def. Sci. Eng. Tech. 3(2)(2020)
11
microstrip 0.32 – 0.47
n.s. n.s. n.s. n.s. (An et al., 2016)
Goubau n.s. n.s. n.s. n.s. 1.09375-1.250 (noted as the best range) (Fan et al., 2016)
monopole (length unknown)
n.s. n.s. n.s. n.s. 1.09375-1.250 (noted as the best range) (Fan et al., 2016)
discone n.s. n.s. n.s. n.s. 1.09375-1.250 (noted as the best range) (Fan et al., 2016)
Tee 2.14 (0.4) n.s. n.s. n.s. n.s. (Oraizi & Hedayati, 2012)
disc 0.2 – 1.2 n.s. n.s. n.s. n.s. (Power Diagnostics Service Co. Ltd. n.d.)
disc 0.3 – 1 n.s. n.s. n.s. n.s. (Power Diagnostix Systems GmbH n.d.)
disc 0.2 – 1 n.s. n.s. n.s. n.s. (Omicron Electronics GmbH n.d.)
Table 6 is constructed to summarise the experiments and their methodologies. From the table, the
information about the objectives and how the PD had been modelled are presented. Furthermore, the table also tells about how the experimenters modelled the transformer and the location of the PD sensor.
Table 6: Objectives and methodologies of the experiments
Objectives PD Modelling Transformer modelling
Location of detector;
distance (m)
Remarks
Antenna testing Void Glass container Outside; unknown
(Robles et al., 2012)
Antenna testing needle – plate + dielectric, plate – plate, void, suspended particle
Glass container Outside; 50 mm
(Li et al., 2012)
Detection PD at super high frequency
Plane – needle Glass container Outside; 1 Fukuzaki et al., 2012)
Antenna testing Plane – needle Glass container Outside; 2 (Liu et al., 2015) Antenna testing Plane – needle Glass container Outside; 50
mm (Li et al, 2014)
Antenna testing Cavity, surface Glass container Outside; 50 mm
(Li et al., 2013)
Antenna testing suspended particle, surface
Glass container Outside; 1.5 (Ye et al., 2014)
Antenna testing Corona, surface discharge
Glass container Unclear (Li et al., 2012)
Antenna testing Corona, surface discharge
Glass container Outside; 50 mm
(Li et al., 2013)
Parameters affecting PD measurement
Particle (in motion) between two electrodes
Plexiglas container
Outside; unknown
(Tang et al., 2016)
RF detection from external noise
Actual PD Actual transformer
Inside; unknown
(Hoek et al., 2014)
PD detection and location
Plane – needle Actual transformer
Inside; multiple sensors
(Mirzaei et al., 2015)
External noise immunity
Artificial (corona wire)
Actual transformer
Inside; unknown
(Kraetge et al., 2013)
UHF calibration Artificial pulse Actual transformer
Inside; unknown
(Siegel & Tenbohlen, 2016)

Mukhtaruddin et al./ Zulfaqar Int. J. Def. Sci. Eng. Tech. 3(2)(2020)
12
PD location Actual (introduction of free particle)
Actual transformer
Inside; multiple sensors
(Zheng et al., 2014)
Insertion distance of antenna
Artificial pulse Actual transformer
Inside; unknown
(Siegel et al., 2017)
Antenna testing Void, suspended particle, both
Actual transformer
Inside; unknown
(Sinaga, Phung, & Blackburn, 2014)
PD RF frequency emission
point – plate, slander surface, flat surface, suspended particle, void
Actual transformer
Inside; 0.5 – 1.5
(Fan et al., 2016)
Antenna testing Artificial pulse (spark plug, coupler pocket)
Actual transformer
Inside; multiple sensors
(Meijer et al., 2008)
Parameters affecting PD measurement
Artificial pulse (copper plates)
Actual transformer
Inside; multiple sensors
(Coenen et al., 2016)
PD detection and location
Needle – needle 67 cm × 160 cm × 158 cm model
Inside; multiple sensors
(Akbari et al., 2016)
Antenna testing Surface discharge, plane – needle, corona
Size not specified
Inside; unknown
(Alkadi et al., 2016)
UHF propagation characters
Signal generator 5.5 m x 2.5 m x 2.5 m model
Inside; unknown
(An et al., 2016)
PD calibration using UHF
Needle – plate + dielectric, plate – plate, needle – plate, void
Size not specified
Inside; 1 (Jahangir et al., 2017a)
Antenna testing Needle – plate + dielectric, needle – plate
Size not specified
Inside; unknown
(Zahed et al., 2017)
PD source location determination
needle – plate, suspended particle, creepage discharge
1.2 m x 1.2 m x 1 m model
Inside; about 1 m
(Xiaohu et al., 2014)
Antenna testing Surface discharge, void, point
Size not specified
Inside; unknown
(Harbaji et al., 2017)
The relationship between UHF signal energy and current pulse measurement
needle – plate, suspended particle, bad contact (plate – plate with thin barrier)
2.53 m × 1.27 m × 1.27 m model
Inside; 0.75 m, 2 m
(Cleary & Judd, 2006)
Pattern recognition algorithm
Void, surface discharge model, corona discharge, floating particle
90 mm x 70 cm x 90 cm model
Inside; unknown
(Jiang et al., 2011)
Antenna testing Surface, corona, void
Round model, 500 mm dia.
Inside; unknown
(Wu et al., 2013)
Parameters affecting PD measurement
Actual bubble (in motion) between two electrodes
3.1 m × 2.35 m × 2.05 m model
Inside; unknown
(Tang et al., 2015)
Discussion
Two important issues about the application of an antenna to detect UHF signal from PD can be drawn. The first is on the physical design of the antenna itself. This is supposedly related to the first requirement of the application of any antenna in a transformer tank – safety. Secondly is the question of

Mukhtaruddin et al./ Zulfaqar Int. J. Def. Sci. Eng. Tech. 3(2)(2020)
13
frequency selection of the antenna. However, after looking at the ability of the antenna to record readings from PD, the question must be coupled with the issue of sensitivity. Again by inspecting Table 1 through Table 5, selection on the best antenna for application in the oil-filled transformer could not be conclusive. This is due to missing information in any of the tables. More research and review need to be done. However, currently commercial PD detecting antennas also do not point to any specific antenna design. This is because the basic designs of the off-the-shelf products as varied as the designs of the experimental antennas. Meanwhile Table 6 can guide future research undertaking to choose related objected and methodologies.
Some of the researchers are looking to have a compact antenna design. The motivation behind the shrinking of the antenna design has always been due to avoid proximity to the transformer’s core. This is a good direction even though the smaller design may bring another problem. For example, there is a lot of evidence suggesting that distance from the PD source and the detector affects the measurement. One of the evidence comes from (An et al., 2016). From their study, it was observed that the UHF signal intensity generally weakens as the distance became greater, although it’s far from linear. Upon closer look at the result, the pattern of attenuation was actually differed between near and far field territories. Another observation made by the researchers was that the angle of the PD source as relative to the PD sensor also affects the measurements. The signal energy becomes weak gradually as the measuring angle changed from 0 degrees to 90 degrees. Again no straightforward linear correlation was offered by the authors nor in (Reid et al., 2011). Experimentation made in the former study was made in a tank model, without any internal component. The same non-correlation was also concluded in (Akbari et al., 2016), this time conducted inside a transformer tank complete with the internal component. Demonstration using a commercial grade PD detector and actual transformer in (Jahangir et al., 2017b) showed that the effect of antenna insertion on the quality of detected PD signal differed for different frequencies. But it was concluded that at 700 MHz and below, the insertion depth affects the antenna’s input impedance. While at higher frequencies, the radiation pattern was affected and had a great effect on the received power.
In most of the literature, SNR result of the selected antennas was used as the performance indicator.
Most of the antennas were able to register a reading of around tens of mV, even though some of them can read up to a few volts. These are very good readings considering that the background noise was reported to be around 0.1 – 1 mV (Robles et al., 2018). Furthermore, the transformer’s tank itself provides some degree of the shield from external EM noise. This fact was demonstrated in (Albarracin et al., 2016) although in (Jahangir et al., 2017b) it was noted that it is not a perfect shielding due to the presence of bushings and other dielectric windows. CIGRÉ WC 15.03 recommended sensitivity verification for the UHF method in place as an alternative for calibration. Sensitivity verification can be used on-site to determine the minimum sensitivity of the measuring system. Although it is referring for GIS’ PD detection, this method can also be applied to power transformers which use oil insulation perhaps with certain modification. The sensitivity of the UHF measuring method is very dependent on the type of sensor, on the type of the PD defect, and on the location of the PD source. It is clear that the UHF detection of the PD signal provides sensitivity.
Conclusion PD detection at the UHF spectrum can now be considered as a good contender to other methods. This can be seen at a number of research and availability of commercial products related to the technique. A score of studies covering a multitude of antennas was presented in this paper. All of them had shown the ability to detect a UHF PD signal at even a minute amplitude. Each of the antennas has its specific advantages and drawbacks. For example, some design may be too big to be considered as a detector inside a transformer. On the other hand, a smaller design of antenna may severely affect the quality of the PD signal arrived at its location. Nevertheless, detecting the PD signal at the UHF spectrum is proven to be worth research. Future research may include antenna design which is not only cheap, simple and has the appeal for the commercial viability but also fulfils the requirement of having an appropriate frequency range and sensitivity, together with a safe operation for a high voltage power transformer. Acknowledgement The author expresses gratitude to the Malaysian Ministry of Higher Education (MOHE) for assistance under the MyPhD scheme.

Mukhtaruddin et al./ Zulfaqar Int. J. Def. Sci. Eng. Tech. 3(2)(2020)
14
References Akbari, A., Werle, P., Akbari, M., & Mirzaei, H. R. (2016). Challenges in Calibration of the Measurement of
Partial Discharges at Ultrahigh Frequencies in Power Transformers. IEEE Electrical Insulation Magazine 32(2): 27–34.
Albarracin, R., Robles, G., Martinez-Tarifa, J. M., & Ardila-Rey, J. A. (2015). Separation of Sources in Radiofrequency Measurements of Partial Discharges Using Time-Power Ratios Maps. ISA Transactions 58: 389–397.
Albarracin, R., Ardila-Rey, J. A., & Mas'ud, A. A. (2016) On the Use of Monopole Antennas for Determining the Effect of the Enclosure of a Power Transformer Tank in Partial Discharges Electromagnetic Propagation. Sensors 16(2): 1–18.
Alkadi, R., Shaath, A., Gefe, F., Jaber, S., Al Rayes, N., El-Hag, A., & Qaddoumi, N. (2016). Smart Antenna-Based Partial Discharge Detection and Classification System. In Microwave Symposium (MMS), 2016 16th Mediterranean, IEEE, 1–4.
Amin, E. M., & Karmakar, N. C. (2016). A Passive RF Sensor for Detecting Simultaneous Partial Discharge Signals Using Time-Frequency Analysis. IEEE Sensors Journal 16(8): 2339–2348.
An, D., Du, L., Liu, S., & Wu, X. (2016). Study on Ultra-High Frequency Partial Discharge Simulator and Its Propagation Characteristics. In 2016 IEEE International Conference on High Voltage Engineering and Application (ICHVE), 1–4.
Bojovschi, A., Rowe, W., & Wong, K. L. (2010). Electromagnetic Field Intensity Generated by Partial Discharge in High Voltage Insulating Materials. Progress In Electromagnetics Research 104(1): 167–182.
BSS Hochspannungstechnik GmbH. (2017). Ultra-High Frequency (UHF) Partial Discharge (PD) Drain Valve Sensor.
Bureau of Indian Standards. (2000). IS/IEC 60270 (2000): High-Voltage Techniques Measurements [ETD 19: High Voltage Engineering].
Cai, Z., Wilkinson, R. H. & Bojovschi, A. (2014). Partial Discharge Detection Approach for a Medium Voltage Switchgear System. Progress in Electromagnetics Research 144: 221–228.
Chai, H, Phung, B. T., & Zhang, D. (2018). Development of UHF Sensors for Partial Discharge Detection in Power Transformer. In 2018 Condition Monitoring and Diagnosis (CMD), IEEE, 1–5.
Cleary, G. P., & Judd, M. D. (2006). UHF and Current Pulse Measurements of Partial Discharge Activity in Mineral Oil. IEE Proceedings-Science, Measurement and Technology 153(2): 252–256.
Coenen, S., Siegel, M., Luna, G., & Tenbohlen, S. (2016). Parameters Influencing Partial Discharge Measurements and Their Impact on Diagnosis, Monitoring and Acceptance Tests of Power Transformers. In CIGRE 2016, Paris: CIGRE.
Coenen, S., Tenbohlen, S., Markalous, S. M., & Strehl, T. (2008). Sensitivity of UHF PD Measurements in Power Transformers. IEEE Transactions on Dielectrics and Electrical Insulation 15(6): 1553–1558.
Lemke, D. (2009). “TransformerGuard: PD Monitoring System.”
Fan, H., Hu. J., Liu, H., & Yin, Y. (2016). UHF PD Experiments on Real Power Transformer and Its Frequency Characteristics Results. Engineering, Technology & Applied Science Research 6(1): 906–912.
Fukuzaki, M., Fukuda, K., & Ohtsuka, S. (2012). Frequency Bandwidth Dependence of PD Current Waveforms in Transformer Oil Measured with the SHF_PDPW System. 2012 IEEE International Conference on Condition Monitoring and Diagnosis.
Gautchi, D., Weiers, T., Buchs, G., & Wyss, S. (2012). Ultra High Frequency ( UHF ) Partial Discharge Detection for Power Transformers: Sensitivity Check on 800 MVA Power Transformers and First Field Experience. In CIGRE 2012, CIGRE.
Ye, H. F., Qian, Y., Dong, Y., Sheng, G. H., & Jiang, X. C. (2014). Development of Multi-Band Ultra-High-Frequency Sensor for Partial Discharge Monitoring Based on the Meandering Technique. IET Science, Measurement and Technology 8(5): 327–335.

Mukhtaruddin et al./ Zulfaqar Int. J. Def. Sci. Eng. Tech. 3(2)(2020)
15
Harbaji, M. M. O., Zahed, A. H., Habboub, S. A., Almajidi, M. A., Assaf, M. J., El-Hag, A. H., & Qaddoumi, N. N. (2017). Design of Hilbert Fractal Antenna for Partial Discharge Classification in Oil-Paper Insulated System. IEEE Sensors Journal 17(4): 1037–1045.
Harbaji, M., Shaban, K., & and El-Hag, A. (2015). Classification of Common Partial Discharge Types in Oil-Paper Insulation System Using Acoustic Signals. IEEE Transaction on Dielectrics and Electrical Insulation 22(2): 1674–1683.
Hoek, S. M., Krüger, M., Körber, S., & Kraetge, A. (2014). Application of the UHF Technology to Detect and Locate Partial Discharges in Liquid Immersed Transformer. Elektrotechnik und Informationstechnik 131(8): 386–392.
Ishak, A. M., Baker, P. C., Siew, W. H., & Judd, M. D. (2013). Characterizing the Sensitivity of UHF Partial Discharge Sensors Using FDTD Modeling. IEEE Sensors Journal 13(8): 3025–3031.
Jahangir, H., Akbari, A., Werle, P., & Szczechowski, J. (2017a). Possibility of PD Calibration on Power Transformers Using UHF Probes. IEEE Transactions on Dielectrics and Electrical Insulation 24(5): 2968–2976.
Jahangir, H., Akbari, A., Werle, P., & Szczechowski, J. (2017b). UHF PD Measurements on Power Transformers-Advantages and Limitations. IEEE Transactions on Dielectrics and Electrical Insulation 24(6): 3933–3940.
Jiang, T., Li, J., Zheng, Y., & Sun, C. (2011). Improved Bagging Algorithm for Pattern Recognition in UHF Signals of Partial Discharges. Energies 4(12): 1087–1101.
Kim, Y. J., & Hikita, M. (2013). A Proposal for Hybrid PD Sensor Identifying Absolute Distance from PD Source. In Annual Report Conference on Electrical Insulation and Dielecric Phenomena 2013, IEEE, 1177–1180.
Kraetge, A., Hoek, S., Koch, M., & Koltunowicz, W. (2013). Robust Measurement, Monitoring and Analysis of Partial Discharges in Transformers and Other HV Apparatus. IEEE Transactions on Dielectrics and Electrical Insulation 20(6): 2043–2051.
Lemke, E., Berlijn, S., Gulski, E., Muhr, H. M., Pultrum, E., Strehl, T., Hauschild, W., Rickmann, J., & Rizzi, G. (2008). Guide for Electrical Partial Discharge Measurements on Compliance to IEC 60270. Electra (241): 61–67.
Li, J., Wang, P., Bao, L., & He, Z. (2013). UHF Stacked Hilbert Antenna Array for Partial Discharge Detection. IEEE Transactions on Antennas and Propagation 61(11): 5798–5801.
Li, J., Cheng, C., Bao, L., & Jiang, T. (2012). Resonant Frequency Calculation and Optimal Design of Peano Fractal Antenna for Partial Discharge Detection. International Journal of Antennas and Propagation 2012: 1–9.
Li, J., Jiang, T., Cheng, C., & Wang, C. (2013). Hilbert Fractal Antenna for UHF Detection of Partial Discharges in Transformers. IEEE Transactions on Dielectrics and Electrical Insulation 20(6): 2017–2025.
Li, Jian, Tianyan Jiang, Caisheng Wang, and Changkui Cheng. 2012. “Optimization of UHF Hilbert Antenna for Partial Discharge Detection of Transformers.” IEEE Transactions on Antennas and Propagation 60(5): 2536–40.
Li, M., Gui, C. and Peng, Z. (2014). Design of Meander Antenna for UHF Partial Discharge Detection of Transformers. Sensors & Transducers 171(5): 232–238.
Liu, J., Zhang, G., Dong, J., & Wang, J. (2015). Study on Miniaturized UHF Antennas for Partial Discharge Detection in High-Voltage Electrical Equipment. Sensors 15(11): 29434–29451.
Meijer, S., Judd, M. D., & Tenbohlen, S. (2008). Sensitivity Check for Radio Frequency Partial Discharge Detection for Power Transformers. In Condition Monitoring and Diagnosis, 2008. CMD 2008. International Conference On, IEEE, 1031–1035.
Mejino, M., Albarracin, R., & Robles, G. (2013). Chromatic Classification of RF Signals for Partial Discharges and Noise Characterization. IEEE International Conference on Solid Dielectrics 2013: 67–70.
Mirzaei, H., Akbari, A., Gockenbach, E., & Miralikhani, K. (2015). Advancing New Techniques for UHF PD Detection and Localization in the Power Transformers in the Factory Tests. IEEE Transactions on Dielectrics and Electrical Insulation 22(1): 448–55.
Mukhtaruddin et al./ Zulfaqar Int. J. Def. Sci. Eng. Tech. 3(2)(2020)
16
Mukhtaruddin, A., Isa, M., Adzman, M. R., Syed Hasan, S. I., Rohani, M. N. K. H., & Yii, C. C. (2016). Techniques on Partial Discharge Detection and Location Determination in Power Transformer. In Electronic Design (ICED), 2016 3rd International Conference On, IEEE, 537–542.
Muñoz, R. (2013). Antennas Parameterization for the Detection of Partial Discharges. IEEE Transactions on Instrumentation and Measurement 62: 932–41.
Omicron Electronics GmbH. MPD 600: High-End Partial Discharge Measurement and Analysis System.
Oraizi, H., & Hedayati, S. (2012). Miniaturization of Microstrip Antennas by the Novel Application of the Giuseppe Peano Fractal Geometries. IEEE Transactions on Antennas and Propagation 60(8): 3559–3567.
Power Diagnostics Service Co. Ltd. UHF T10: UHF Power Transformer Hatch Cover PD Sensor. Cardross, UK: Power Diagnostics Service Co. Ltd.
Power Diagnostics Service Co. Ltd. UHF T50V/ T80V: UHF Power Transformer Drain Valve PD Sensor. Cardross, UK: Power Diagnostics Service Co. Ltd.
Power Diagnostix Systems GmbH. ICM Series Accessories: Sensors.
Reid, A. J., Judd, M. D., Fouracre, R. A., Stewart, B. G., Hepburn, D. M. (2011). Simultaneous Measurement of Partial Discharges Using IEC60270 and Radio-Frequency Techniques. Dielectrics and Electrical Insulation, IEEE Transactions on 18(2): 444–455.
Robles, G., Martinez-Tarifa, J. M., Rojas-Moreno, M. V., Albaracin, R., Ardila-Rey, J. (2012). Antenna Selection and Frequency Response Study for UHF Detection of Partial Discharges. In Instrumentation and Measurement Technology Conference (I2MTC), 2012 IEEE International, IEEE, 1496–1499.
Robles, G., Sanchez-Fernandez, M., Sanchez, R. A., Rojas-Moreno, M. V., Rajo-Iglesias, E., & Matinez-Tarifa, J. M. (2012). Antenna Parametrization for the Detection of Partial Discharges. IEEE Transactions on Instrumentation and Measurement 62(5): 932–941.
Robles, G., Sanchez-Fernandez, M., Sanchez, R. A., Rojas-Moreno, M. V., Rajo-Iglesias, E., & Matinez-Tarifa, J. M. (2018). Partial Discharge Spectral Characterization in HF, VHF and UHF Bands Using Particle Swarm Optimization. Sensors (Switzerland) 18(3): 1–19.
Robles, G., Albarracin, R., and Vasquez, J. L. (2016). Handbook of Antenna Technologies.” In Handbook of Antenna Technologies, ed. Chen, Z. N., Singapore: Springer Singapore.
Rohani, M. N. K. H., Yii, C. C., Isa, M., Syed Hasan, S. I., Ismail, B., Adzman, M. R., Shafiq, M. (2016). Geometrical Shapes Impact on the Performance of ABS-Based Coreless Inductive Sensors for PD Measurement in HV Power Cables. IEEE Sensors Journal 16(17): 6625–3662.
Mao, S. G., Yeh, J. C., & Chen, S. L. (2009). Ultrawideband Circularly Polarized Spiral Antenna Using Integrated Balun With Application to Time-Domain Target Detection. IEEE Transactions on Antennas and Propagation 57(7): 1914–1920.
Siegel, M., Beltle, M., Tenbohlen, S., & Coenen, S. (2017). Application of UHF Sensors for PD Measurement at Power Transformers. IEEE Transactions on Dielectrics and Electrical Insulation 24(1): 331–339.
Siegel, M., & Tenbohlen, S. (2016). Calibration of UHF Partial Discharge Measurement for Power Transformers and a Comparison to the Calibration of Electrical PD Measurement. In 2016 Electrical Insulation Conference, Montreal: IEEE, 19–22.
Sinaga, H. H., Phung, B. T., & Blackburn, T. R. (2012). Partial Discharge Localization in Transformers Using UHF Detection Method. IEEE Transactions on Plasma Science 19(6): 1891–1900.
Sinaga, H. H., Phung, B. T. & Blackburn, T. R. (2014). Recognition of Single and Multiple Partial Discharge Sources in Transformers Based on Ultra-High Frequency Signals. IET Generation, Transmission and Distribution 8(1): 160–169.
Sinaga, H. H. (2012). Detection, Identification and Localization of Partial Discharges in Power Transformers Using UHF Technique. PhD Thesis. The University of New South Wales.
Sokolov, V., Kuchinsky, G., & Golubev, A. (2018). On-Site Partial Discharge Measurement of Transformer. article. http://es.eaton.com/InsulGardSalesTool/Documentation/PD Transformer.pdf (March 6, 2018).

Mukhtaruddin et al./ Zulfaqar Int. J. Def. Sci. Eng. Tech. 3(2)(2020)
17
Sung, Y. J. (2011). Bandwidth Enhancement of a Wide Slot Using Fractal-Shaped Sierpinski. IEEE Transactions on Antennas and Propagation 59(8): 3076–79.
Tang, J., Ma, S., Li, X., Zhang, Y., Pan, C., & Su, J. ( 2016). Impact of Velocity on Partial Discharge Characteristics of Moving Metal Particles in Transformer Oil Using UHF Technique. IEEE Transactions on Dielectrics and Electrical Insulation 23(4): 2207–2212.
Tang, J., Ma, S., Zhang, M., Liu, Z., Li, X., Gui, Y. (2015). Influence of Microbubbles Motion State on Partial Discharge in Transformer Oil. IEEE Transactions on Dielectrics and Electrical Insulation 22(5): 2646–52.
Tenbohlen, S., Jagers, J., & Vahidi, F. (2017). Standardized Survey of Transformer Reliability. In Conference Proceedings of ISEIM 2017.
Wang, F., Bin, F., Sun, Q., Fan, J., & Ye, H. (2017). A Compact UHF Antenna Based on Complementary Fractal Technique. IEEE Access 5: 21118–25.
Wang, F., Bin, F., Sun, Q., Fan, J., Liang, F., & Xiao, X. (2017). A Novel UHF Minkowski Fractal Antenna for Partial Discharge Detection. Microwave and Optical Technology Letters 59(8): 1812–1819.
Wu, Q., Liu, G., Xia, Z., & Lu, L. (2013). The Study of Archimedean Spiral Antenna for Partial Discharge Measurement. In Proceedings of the 2013 International Conference on Intelligent Control and Information Processing, ICICIP 2013, , 694–698.
Xiaohu, X., Yongfen, L., Xiao, T., Peng, C., & Yanming, L. (2014). Relocatable Ultrasonic Array and UHF Combined Sensor Applied to PD Location in Oil. IEEE Sensors Journal 14(2): 357–361.
Yaacob, M. M., Alsedi, M. A., Rashed, J. R., Dakhil, A. M., & Atyah, S. F. (2014). Review on Partial Discharge Detection Techniques Related to High Voltage Power Equipment Using Different Sensors. Photonic Sensors 4(4): 325–337.
Yang, F., Peng, C., Yang, Q., Lou, H., Ullah, I., & Yang, Y. (2016). An UWB Printed Antenna for Partial Discharge UHF Detection in High Voltage Switchgears. Progress In Electromagnetics Research C 69(November): 105–114.
Zahed, A. A., El-Hag, A. H., Qaddoumi, N., Hussein, R., & Shaban, K. B. (2017). Comparison of Different Fourth Order Hilbert Fractal Antennas for Partial Discharge Measurement. IEEE Transactions on Dielectrics and Electrical Insulation 24(1): 175–182.
Zheng, S., Li, C., Tang, Z., & Chang, W. (2014). Location of PDs inside Transformer Windings Using UHF Methods. IEEE Transactions on Dielectrics and Electrical Insulation 21(1): 386–393.