zurichopenrepositoryand universityofzurich year: 2011
TRANSCRIPT
Zurich Open Repository andArchiveUniversity of ZurichMain LibraryStrickhofstrasse 39CH-8057 Zurichwww.zora.uzh.ch
Year: 2011
Productivity is a poor predictor of plant species richness
Adler, P B ; Seabloom, E W ; Borer, E T ; Hillebrand, H ; Hautier, Y ; Hector, A ; Harpole, W S ;O’Halloran, L R ; Grace, J B ; Anderson, T M ; Bakker, J D ; Biederman, L A ; Brown, C S ; Buckley,
Y M ; Calabrese, L B ; Chu, C J ; Cleland, E E ; Collins, S L ; Cottingham, K L ; Crawley, M J ;Damschen, E I ; Davies, K F ; DeCrappeo, N M ; Fay, P A ; Firn, J ; Frater, P ; Gasarch, E I ; Gruner,D S ; Hagenah, N ; Hille Ris Lambers, J ; Humphries, H ; Jin, V L ; Kay, A D ; Kirkman, K P ; Klein,
J A ; Knops, J M H ; La Pierre, K J ; Lambrinos, J G ; Li, W ; MacDougall, A S ; McCulley, R L ;Melbourne, B A ; Mitchell, C E ; Moore, J L ; Morgan, J W ; Mortensen, B ; Orrock, J L ; Prober, S M; Pyke, D A ; Risch, A C ; Schuetz, M ; Smith, M D ; Stevens, C J ; Sullivan, L L ; Wang, G ; Wragg, P
D ; Wright, J P ; Yang, L H
Abstract: For more than 30 years, the relationship between net primary productivity and species richnesshas generated intense debate in ecology about the processes regulating local diversity. The original view,which is still widely accepted, holds that the relationship is hump-shaped, with richness first rising andthen declining with increasing productivity. Although recent meta-analyses questioned the generalityof hump-shaped patterns, these syntheses have been criticized for failing to account for methodologi-cal differences among studies. We addressed such concerns by conducting standardized sampling in 48herbaceous-dominated plant communities on five continents. We found no clear relationship betweenproductivity and fine-scale (meters−2) richness within sites, within regions, or across the globe. Ecol-ogists should focus on fresh, mechanistic approaches to understanding the multivariate links betweenproductivity and richness.
DOI: https://doi.org/10.1126/science.1204498
Posted at the Zurich Open Repository and Archive, University of ZurichZORA URL: https://doi.org/10.5167/uzh-52491Journal ArticleAccepted Version
Originally published at:Adler, P B; Seabloom, E W; Borer, E T; Hillebrand, H; Hautier, Y; Hector, A; Harpole, W S; O’Halloran,L R; Grace, J B; Anderson, T M; Bakker, J D; Biederman, L A; Brown, C S; Buckley, Y M; Calabrese,L B; Chu, C J; Cleland, E E; Collins, S L; Cottingham, K L; Crawley, M J; Damschen, E I; Davies, KF; DeCrappeo, N M; Fay, P A; Firn, J; Frater, P; Gasarch, E I; Gruner, D S; Hagenah, N; Hille RisLambers, J; Humphries, H; Jin, V L; Kay, A D; Kirkman, K P; Klein, J A; Knops, J M H; La Pierre, KJ; Lambrinos, J G; Li, W; MacDougall, A S; McCulley, R L; Melbourne, B A; Mitchell, C E; Moore, JL; Morgan, J W; Mortensen, B; Orrock, J L; Prober, S M; Pyke, D A; Risch, A C; Schuetz, M; Smith,M D; Stevens, C J; Sullivan, L L; Wang, G; Wragg, P D; Wright, J P; Yang, L H (2011). Productivityis a poor predictor of plant species richness. Science, 333(6050):1750-1753.DOI: https://doi.org/10.1126/science.1204498
1
Productivity is a poor predictor of plant species richness
Peter B. Adler1*, Eric W. Seabloom2, Elizabeth T. Borer2, Helmut Hillebrand3, Yann Hautier4,
Andy Hector4, W. Stanley Harpole5, Lydia R. O'Halloran6, James B. Grace7, T. Michael
Anderson8, Jonathan D. Bakker9, Lori A. Biederman5, Cynthia S. Brown10, Yvonne M.
Buckley11, Laura B. Calabrese12, Cheng-Jin Chu13, Elsa E. Cleland14, Scott L. Collins11, Kathryn
L. Cottingham15, Michael J. Crawley16, Ellen I. Damschen17, Kendi F. Davies18, Nicole M.
DeCrappeo19, Philip A. Fay20, Jennifer Firn21, Paul Frater5, Eve I. Gasarch18, Daniel S. Gruner22,
Nicole Hagenah23,24, Janneke HilleRisLambers25, Hope Humphries18, Virginia L. Jin26, Adam D.
Kay27, Kevin P. Kirkman23, Julia A. Klein28, Johannes M. H. Knops29, Kimberly J. La Pierre23,
John G. Lambrinos30, Wei Li5, Andrew S. MacDougall31, Rebecca L. McCulley32, Brett A.
Melbourne18, Charles E. Mitchell33, Joslin L. Moore34, John W. Morgan35, Brent Mortensen5,
John L. Orrock17, Suzanne M. Prober36, David A. Pyke19, Anita C. Risch37, Martin Schuetz37,
Melinda D. Smith24, Carly J. Stevens38, Lauren L. Sullivan5, Gang Wang13, Peter D. Wragg2,
Justin P. Wright39, Louie H. Yang40
1Department of Wildland Resources and the Ecology Center, Utah State University, 5230 Old
Main, Logan, UT, 84322, USA. 2 Ecology, Evolution, and Behavior, University of Minnesota,
1987 Upper Buford Circle, St. Paul, MN, 55108, USA. 3 Institute for Chemistry and Biology of
the Marine Environment, University of Oldenburg, Schleusenstrasse 1, Wilhelmshaven, D-
26381, Germany. 4 Institute of Evolutionary Biology and Environmental Studies, University of
Zurich, Winterthurerstrasse 190, Zurich, 8057, Switzerland. 5 Ecology, Evolution and
Organismal Biology, Iowa State University, 133 Bessey Hall, Ames, IA, 50011, USA. 6
Department of Zoology, Oregon State University, 3029 Cordley Hall, Corvallis, OR 97331,
USA. 7 US Geological Survey, National Wetlands Research Center, 700 Cajundome Blvd.,
Lafayette, LA, 70506, USA, 8 Department of Biology, 206 Winston Hall, Wake Forest
2
4
6
8
10
12
14
16
18
20
22
24
26
2

2
University, Box 7325 Reynolda Station, Winston-Salem, NC, 27109, USA. 9 School of Forest
Resources, Box 354115, University of Washington, Seattle, WA, 98195-4115, USA. 10
Bioagricultural Sciences and Pest Management, Colorado State University, 1177 Campus
Delivery, Fort Collins, CO, 80523-1177, USA. 11 School of Biological Sciences, The University
of Queensland, St. Lucia, Queensland, 4072, Australia. 12 Department of Biology, MSC03-2020,
University of New Mexico, Albuquerque, NM, 87131, USA. 13 MOE Key Laboratory of Arid
and Grassland Ecology, Lanzhou University, 222 Tianshui South Road, Lanzhou, Gansu,
730000, China. 14 Ecology, Behavior & Evolution Section, University of California, San Diego,
9500 Gilman Dr. #0116, La Jolla, CA, 92093, USA. 15 Biological Sciences, 6044 Gilman
Laboratory, Dartmouth College, Hanover, NH, 3755, USA. 16 Department of Biological
Sciences, Imperial College London, Silwood Park, Ascot, Berks, SL5 7PY, UK. 17 Department of
Zoology, University of Wisconsin, 250 N. Mills Street, Madison, WI, 53704, USA.18 Ecology
and Evolutionary Biology, RL-1 120, University of Colorado, 1560 30th St, Boulder, CO, 80309,
USA. 19 U.S. Geological Survey, Forest & Rangeland Ecosystem Science Center, 3200 SW
Jefferson Way, Corvallis, OR, 97331, USA. 20 Grassland Soil and Water Research Lab, USDA
ARS , 808 E Blackland Rd, Temple, TX, 76502, USA. 21 Queensland University of Technology,
School of Biogeosciences, Brisbane QLD, 4001 Australia. 22 Department of Entomology,
University of Maryland, College Park, 4112 Plant Sciences, College Park, MD, 20742, USA. 23
School of Biological and Conservation Sciences, University of KwaZulu-Natal,
Pietermaritzburg, KwaZulu-Natal, 3209, South Africa. 24 Department of Ecology and
Evolutionary Biology, Yale University, New Haven, CT, 06520, USA. 25 Department of
Biology, University of Washington, Seattle, 24 Kincaid Hall, Seattle, WA, 98195, USA. 26
Agroecosystem Management Research Unit, 137 Keim Hall, USDA ARS, Lincoln, NE, 68583-
28
30
32
34
36
38
40
42
44
46
48
4
3
0937, USA. 27 Department of Biology, University of St. Thomas, 2115 Summit Avenue, St. Paul,
MN, 55105, USA. 28 Natural Resource Ecology Laboratory, Colorado State University, Campus
Delivery 1472, Fort Collins, CO, 80523, USA. 29 School of Biological Sciences, 348 Manter
Hall, University of Nebraska, , Lincoln, NE, 68588, USA. 30 Department of Horticulture, Oregon
State University, 4017 Ag and Life Sciences Building, Corvallis, OR, 97331, USA. 31
Department of Integrative Biology, University of Guelph, Guelph, Ontario, N1G 2W1, Canada.
32 Department of Plant and Soil Sciences, N-222D Ag Sci North, University of Kentucky,
Lexington, KY, 40546-0091, USA. 33 Department of Biology, 411 Coker Hall, University of
North Carolina at Chapel Hill, Chapel Hill, NC, 27599-3280, USA. 34 School of Botany,
University of Melbourne, Parkville, Victoria, 3010, Australia. 35 Department of Botany, La Trobe
University, Bundoora, Victoria, 3086, Australia. 36 CSIRO Ecosystem Sciences, Private Bag 5,
Wembley, Western Australia, 6913, Australia. 37 Community Ecology, Swiss Federal Institute
for Forest, Snow and Landscape Research, Zuercherstrasse 111, Birmensdorf, ZH, 8903,
Switzerland. 38 Department of Life Sciences, The Open University, Walton Hall, Milton Keynes,
Buckinghamshire, MK7 6AA, UK and Lancaster Environment Centre, Lancaster University,
Lancaster, LA1 4YQ, UK. 39 Department of Biology, Duke University, Durham, NC, 27708,
USA. 40 Department of Entomology, University of California, Davis, One Shields Avenue,
Davis, CA, 95616, USA.
*To whom correspondence should be addressed. E-mail: [email protected]
For over 30 years, the relationship between net primary productivity and species richness
has generated intense debate in ecology about the processes regulating local diversity. The
original view, still widely accepted, holds that the relationship is hump-shaped, with
50
52
54
56
58
60
62
64
66
68
70
72
6

4
richness first rising and then declining with increasing productivity. Although recent meta-
analyses questioned the generality of hump-shaped patterns, these syntheses have been
criticized for failing to account for methodological differences among studies. We
addressed such concerns by conducting standardized sampling in 48 herbaceous-
dominated plant communities on five continents. We found no clear relationship between
productivity and fine-scale (m-2) richness within sites, within regions, or across the globe.
Ecologists should focus on novel, mechanistic approaches to understand the multivariate
links between productivity and richness.
For over three decades, ecologists have debated the role of primary productivity in
regulating plant species richness at fine spatial scales (1, 2). Although some studies have
advocated multivariate approaches (3-5), much of the debate remains focused on evidence for a
single, general relationship between productivity and richness. This classic productivity-richness
relationship (PRR) is hump-shaped, with richness increasing at low to intermediate levels of
productivity and decreasing at high productivity (6). The mechanisms invoked to explain the
decreasing phase of the PRR in terrestrial plant communities have attracted the greatest
controversy and include disturbance (3, 7), competitive exclusion mediated by shifts in the
identity or heterogeneity of limiting resources (8-10), as well as evolutionary history and
dispersal limitation (11).
However, the theoretical justification for a hump-shaped PRR has been challenged
(12) and the empirical evidence is mixed. For example, recent meta-analytical syntheses
concluded that evidence for a single, canonical pattern was weak (13-15). A large percentage of
studies exhibited negative, U-shaped or nonsignificant PRR's in addition to unimodal and
positive linear patterns, and the frequency of these various patterns depended on taxon and
74
76
78
80
82
84
86
88
90
92
94
8

5
spatial scale. Subsequent critiques of the meta-analyses argued that the apparent lack of
generality in PRR's might simply reflect methodological inconsistencies among the field studies
(16, 17). First, PRR studies vary widely in their choice of both the grain (the area of the sampling
unit) and extent (the area over which sampling units are spread) (15, 18). Because of the strong
effects of area and heterogeneity on richness, such differences in scale confound cross-study
comparisons (19). Second, many of the studies included in PRR meta-analyses did not measure
primary production directly, but used weakly related surrogates such as latitude, temperature, or
altitude (14).
We assessed the generality of the PRR and addressed previous methodological
inconsistencies by conducting standardized, observational sampling in 48 herbaceous-dominated
plant communities on five continents (20) (Fig. 1, Supplementary Table S1). We sampled plant
species richness in standard 1-m2 quadrats located in blocks of 10 plots, holding grain constant
and minimizing differences in extent across sites. In addition, we used the same protocol at all
sites for estimating aboveground net primary production (ANPP) as peak growing season live
biomass, an effective measure of ANPP in herbaceous vegetation (21), especially when
consumption by herbivores is low (Fig. S1).
Previous work indicated that the form of the PRR might vary with the spatial extent
of sampling. While significant PRRs have been observed at spatial extents ranging from
individual plots located within one community to means of sites spread across continents, the
hump-shaped pattern has emerged most frequently in studies that cross community boundaries
(14, 22). PRRs described within communities may be weaker because of the potential for limited
variation in productivity among sampling plots as well as measurement error on individual
samples (22) , and because mechanisms involving variation in species pools and dispersal are
96
98
100
102
104
106
108
110
112
114
116
118
10

6
excluded. We tested for scale-dependence by characterizing the shape of the PRR at three spatial
extents: (i) The within-site extent compares richness and productivity sampled in individual
plots. (ii) The regional extent compares site level averages for 1-m2 richness and productivity
among sites occurring within a biogeographic province. (iii) The global extent compares site
level averages for richness and productivity among all sites.
The 48 within-site PRR's took all possible shapes in parametric regressions of
species richness on productivity (Fig. 2, Fig. S2, Table S2). The most common relationship was
nonsignificant (34 sites), five sites had a positive linear pattern, five sites had a negative linear
pattern, three sites were concave up (U-shape) and one site was concave down (the classical
hump shape). Repeating this analysis with quasipoisson regression (20) gave similar results (34
nonsignificant, five positive linear, six negative linear, two concave up, and one concave down).
We did not find factors that explained the variation in the shape of the within-site PRRs. For
example, if unproductive sites had positive linear PRRs and highly productive sites had negative
PRRs, then there should be a correlation between site level productivity and the slope of the
within-site linear relationship (18). We found no such pattern (r=0.07, df=46, P=0.62). Nor were
sites that spanned larger ranges in productivity more likely to show significant PRR's.
Specifically, the probability of finding a non-null PRR was unrelated to the range of ANPP
within a site (logistic regression P=0.20).
We tested the regional relationship between site level average species richness m-2
and average biomass production in the three biogeographic provinces of North America in which
we had more than four sites (Fig. 3). For the 11 Pacific coast sites, located west of the
Cascade/Sierra mountain ranges and dominated by non-native species (along with one salt
marsh), there was no significant quadratic (t=-1.0, P=0.33) or linear (t=-0.27, P=0.79) effect of
120
122
124
126
128
130
132
134
136
138
140
12
7
productivity on richness. Removing the highly productive salt marsh site did not change this
result. Results for the seven Intermountain West sites located between the Cascade/Sierra and
Rocky Mountains were similar: Neither the quadratic (t=0.52, P=0.63) nor linear (t=0.14,
P=0.89) effects of productivity were significant, and removing the one site grazed by domestic
livestock did not change this result. For the 13 Central Region grassland sites east of the Rockies
and west of the Appalachian Mountains, we did find evidence of a hump shape, with a
significant quadratic effect of productivity on richness (t=-2.35, P=0.041). However, when we
removed five sites of anthropogenic origin (restored prairies, pastures, or old fields), the
quadratic term was no longer significant (t=-0.177, P=0.87) while the linear term was significant
(t=2.5, P=0.046).
At the global extent (Fig. 3), the quadratic effect of productivity on richness was
significant (t=-2.39, P= 0.021). However, this hump-shaped model, which ignored uncertainty in
estimates of site means, explained little variation in average species richness (R2=0.11).
Furthermore, the pattern was sensitive to land-use history. When we removed 9 sites of
anthropogenic origin and the one salt marsh, the quadratic effect was no longer significant (t=-
1.36, P=0.18), but a positive linear effect was significant (t=2.61, P=0.013).
An alternative hypothesis states that productivity sets the upper limit on richness,
with stochastic forces such as disturbance causing deviations below this limit (3, 23). We tested
for a hump-shaped constraint on maximum richness by conducting quantile regressions on our
data at within-site and global extents (we did not have sufficient data to address the regional
extent). At the within-site extent, results for the 0.95 quantile regressions were similar to our
standard regression analysis, with 39 nonsignificant tests, two positive linear, five negative
linear, one concave up, and one concave down pattern (Figure S2). Using lower quantiles
142
144
146
148
150
152
154
156
158
160
162
164
14
8
(0.7,0.8,0.9) generated fewer significant PRRs. At the global extent (Fig. 3), the quadratic effect
was not significant (t=-1.63, P=0.11); instead a positive linear trend emerged (t=2.19, P=0.034).
Testing the relationship between mean productivity at a site and maximum richness observed at
that site (Fig. S3) produced a similar nonsignificant quadratic effect (t=-1.50, P=0.14) and
marginally significant linear effect (t=2.01, P= 0.051).
Overall, we found no consistent, general relationship between productivity and
richness of herbaceous-dominated plant communities at the local, regional or global extent.
Using both standard and quantile regressions, nonsignificant relationships were most common.
While linear or hump-shaped patterns occurred in particular cases, no strong correlates explained
these idiosyncrasies. Furthermore, consideration of land-use history and management changed
the form of the regional and global scale relationships. Despite using consistent and appropriate
data collection methods, our results show even less support for a general PRR than did previous
synthesis efforts based on meta-analysis (13-15), indicating that inadequate or non-comparable
data are not the explanation for the lack of a general PRR.
If theory provided a strong prediction for the form of the PRR, then deviations from
the expected pattern would be informative. However, ecologists have proposed many competing
models that predict every form of the PRR (12). Furthermore, recent work has emphasized that
productivity does not have a direct, mechanistic effect on fine-scale species richness, but rather
a complex set of interactions links the two variables (5, 24). For example, productivity and
richness each respond to the supply rate as well as the stoichiometry of resources (25-27), with
variation in these factors leading to different forms of the PRR. In addition, richness may
respond more strongly to disturbance, habitat heterogeneity and biogeographic and assembly
history (3, 11, 28-30) than to productivity. Finally, richness is not simply a function of
166
168
170
172
174
176
178
180
182
184
186
16
9
productivity, but may feedback to influence productivity (31). The weak and variable PRR's we
found are consistent with these hypotheses.
Rather than investing continued effort in attempting to identify a general PRR,
ecologists should focus on more sophisticated approaches already available for investigating the
complex, multivariate processes that regulate both productivity and richness (5, 25, 26).
Coordinated, global networks represent a research approach that will be invaluable not only for
addressing longstanding debates about the generality of empirical patterns but also for testing the
underlying mechanisms.
References and Notes
1. J. P. Grime, Nature 242, 344-347 (1973).
2. M. M. Al Mufti, C. L. Sydes, S. B. Furness, J. P. Grime, S. R. Band, Journal of Ecology 65,
759-791 (1977).
3. M. Huston, The American Naturalist 113, 81-101 (1979).
4. M. A. Huston, Biological Diversity: The Coexistence of Species on Changing Landscapes
(Cambridge University Press, UK, 1994).
5. J. B. Grace et al., Ecology Letters 10, 680-689 (2007).
6. M. L. Rosenzweig, Z. Abramsky, in Species Diversity in Ecological Communities, (University
of Chicago Press, Chicago, 1993), pp. 13-25.
7. M. Kondoh, Proc Biol Sci 268, 269-271 (2001).
8. D. Tilman, Resource competition and community structure (Princeton University Press,
Princeton, New Jersey, 1982).
9. D. E. Goldberg, T. E. Miller, Ecology 71, 213-225 (1990).
10. D. Tilman, S. Pacala, in Species Diversity in Ecological Communities, (University of
Chicago Press, Chicago, 1993), pp. 13-25.
11. M. Zobel, M. Pärtel, Global Ecology and Biogeography 17, 679-684 (2008).
188
190
192
194
196
18
10
12. P. A. Abrams, Ecology 76, 2019-2027 (1995).
13. R. Waide et al., Annual Review of Ecology & Systematics 30, 257-300 (1999).
14. G. Mittelbach et al., Ecology 82, 2381-2396 (2001).
15. L. N. Gillman, S. D. Wright, Ecology 87, 1234-1243 (2006).
16. R. J. Whittaker, E. Heegaard, Ecology 84, 3384-3390 (2003).
17. R. J. Whittaker, Ecology 91, 2522-2533 (2010).
18. S. M. Scheiner et al., Evolutionary Ecology Research 2, 791-802 (2000).
19. N. Gotelli, R. Colwell, Ecology Letters 4, 379-391 (2001).
20. Materials and Methods are available as supporting material on Science Online.
21. M. Oesterheld, S. J. McNaughton, in Methods in Ecosystem Science, O. E. Sala, R. B.
Jackson, H. A. Mooney, R. W. Howarth, Eds. (Springer, New York, 2000), pp. 151-157.
22. J. Grace, H. Jutila, Oikos 85, 398-408 (1999).
23. M. Huston, Oikos 86, 393-401 (1999).
24. W. Ma et al., Global Ecology and Biogeography 19, 233-243 (2010).
25. B. J. Cardinale, D. M. Bennett, C. E. Nelson, K. Gross, Ecology 90, 1227-1241 (2009).
26. B. J. Cardinale, H. Hillebrand, W. S. Harpole, K. Gross, R. Ptacnik, Ecology Letters 12, 475-
487 (2009).
27. W. Harpole, D. Tilman, Nature 446, 791-793 (2007).
28. J. M. Chase, M. A. Leibold, Nature 416, 427-430 (2002).
29. T. Fukami, P. J. Morin, Nature 424, 423-426 (2003).
30. J. M. Chase, Science 328, 1388-1391 (2010).
31. D. Hooper et al., Ecol Monogr 75, 3-35 (2005).
32. R. F. Daubenmire, Northwest Sci 33, 43-46 (1959).
33. W. K. Lauenroth, H. W. Hunt, D. M. Swift, J. S. Singh, Ecological Modelling 33, 297-314
(1986).
20

11
34. M. Oesterheld, S. J. McNaughton, in Methods in Ecosystem Science, O. E. Sala, R. B.
Jackson, H. A. Mooney, R. W. Howarth, Eds. (Springer, New York, 2000), pp. 151-157.
35. E. H. Muldavin, D. I. Moore, S. L. Collins, K. R. Wetherill, D. C. Lightfoot, Oecologia 155,
123-132 (2008).
Acknowledgements This work was generated using data from the Nutrient Network
collaborative experiment, funded at the site-scale by individual researchers and coordinated
through Research Coordination Network funding from NSF to E. Borer and E. Seabloom (Grant
#DEB-0741952). The authors declare no competing interests. We thank Brian Enquist, Andrew
Leakey and three anonymous reviewers for suggestions that improved the manuscript.
198
22
12
Figure captions:
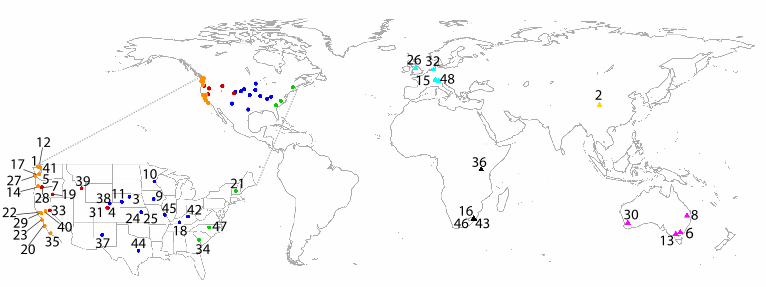
Fig. 1. Locations of the 48 Nutrient Network sites that provided data for this study. Numbers
correspond to the Code column in Table S1. Colors and symbols represent the distinct
biogeographic regions also shown in Fig. 3.
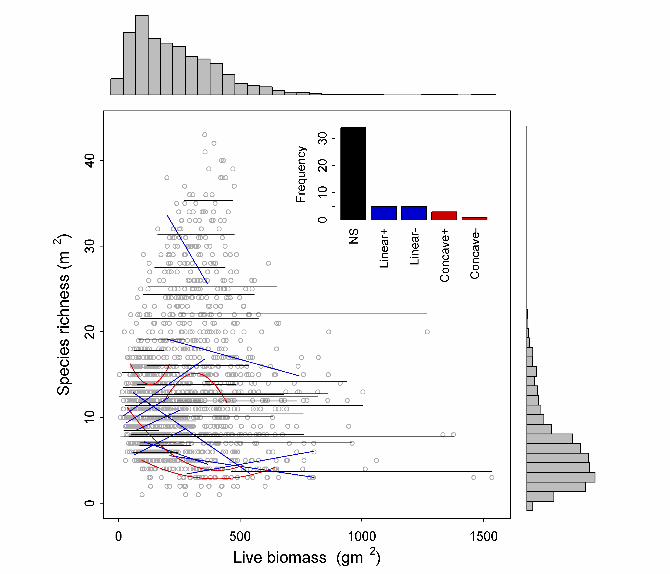
Fig. 2. Within-site relationships between productivity, measured as peak live biomass (dry
weight), and species richness. The inset shows the frequencies of relationships that were
nonsignificant (NS, black lines), positive or negative linear (blue lines), and concave up (+) or
down (-) (red curves). Statistical results and separate figures for each of the 48 sites are available
in Table S2 and Figure S1, respectively. The marginal histograms show the frequency of species
richness and peak live biomass across all sites.
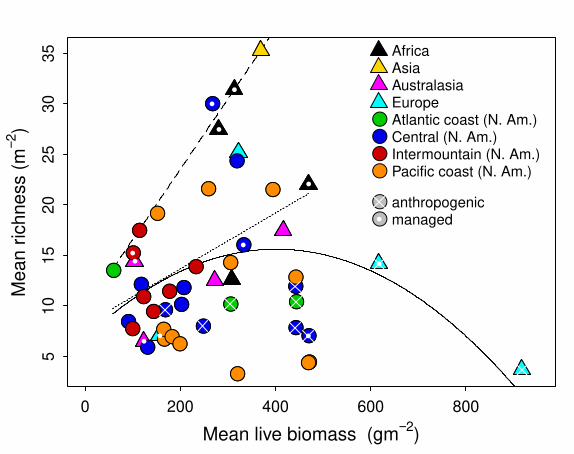
Fig. 3. The global relationship between mean productivity, measured as peak live biomass (dry
weight), and mean species richness m-2 at each site. White dots indicate managed sites (burned
regularly or grazed by domestic livestock) and crosses indicate sites of anthropogenic origin
(pastures, old fields and restored prairies). The solid curve shows the quadratic relationship
between productivity and richness with all sites included; the dotted line shows the linear
relationship that remains when the anthropogenic sites are removed; the dashed line shows the
0.95 quantile regression with all sites included.
200
202
204
206
208
210
212
214
216
218
220
24
13
1
2
3
4
57
8
911
12
14
15
16
17
18
19
20
21
22
23
24 25
27
28
293031
32
33
3435 37
38
36
40
41
42
43
44
45
4647
48
39
26
10
6
●
●
●
●●
●
●
●●
●
●
●
●●
●●
●
●
●
●
●
●●
●
●
●
●
●
●
●
●
●
●
●●
0 200 400 600 800
510
15
20
25
30
35
Mean live biomass (gm−2
)
Mean r
ichness (
m−2
)
●
●
●
●●
●
●
●●
●
●
●
●●
●●
●
●
●
●
●
●●
●
●
●
●
●
●
●
●
●
●
●●
●
●
●
●
● ●
●
●
●
●
●
●●●●
AfricaAsiaAustralasiaEuropeAtlantic coast (N. Am.)Central (N. Am.)Intermountain (N. Am.)Pacific coast (N. Am.)
●●
anthropogenicmanaged●

Supporting Online Material for
Productivity is a poor predictor of plant species richness
Peter B. Adler, Eric W. Seabloom, Elizabeth T. Borer, Helmut Hillebrand, Yann Hautier,
Andy Hector, W. Stanley Harpole, Lydia R. O'Halloran, James B. Grace, T. Michael
Anderson, Jonathan D. Bakker, Lori A. Biederman, Cynthia S. Brown, Yvonne M.
Buckley, Laura B. Calabrese, Cheng-Jin Chu, Elsa E. Cleland, Scott L. Collins, Kathryn
L. Cottingham, Michael J. Crawley, Ellen I. Damschen, Kendi F. Davies, Nicole M.
DeCrappeo, Philip A. Fay, Jennifer Firn, Paul Frater, Eve I. Gasarch, Daniel S. Gruner,
Nicole Hagenah, Janneke HilleRisLambers, Hope Humphries, Virginia L. Jin, Adam D.
Kay, Kevin P. Kirkman, Julia A. Klein, Johannes M. H. Knops, Kimberly J. La Pierre,
John G. Lambrinos, Wei Li, Andrew S. MacDougall, Rebecca L. McCulley, Brett A.
Melbourne, Charles E. Mitchell, Joslin L. Moore, John W. Morgan, Brent Mortensen,
John L. Orrock, Suzanne M. Prober, David A. Pyke, Anita C. Risch, Martin Schuetz,
Melinda D. Smith, Carly J. Stevens, Lauren L. Sullivan, Gang Wang, Peter D. Wragg,
Justin P. Wright, Louie H. Yang
correspondence to: [email protected]
This PDF file includes:
Materials and Methods
Figs. S1 to S3
Tables S1 to S2
1
Materials and Methods
Site selection
Each site in the Nutrient Network is dominated by low-statured, primarily
herbaceous vegetation and is representative of a particular ecosystem (e.g., shortgrass
steppe, tallgrass prairie, salt marsh, alpine tundra). All sites were located in a patch of
relatively homogeneous vegetation large enough to accommodate the >1000 m2 study
footprint. Sites were not excluded based on natural disturbances such as fire, but such
disturbances were recorded at each site. Most sites sampled vegetation in 2007, though
12 sites sampled in 2008 or 2009 (Table S1). The standard design was a completely
randomized block design with three blocks and 10 plots per block at each site, though
three of our sites had less than three blocks, three sites had more than three blocks and
one site with 40 plots used a completely random design. Four sites are grazed by
livestock and two sites were burned prior to sampling as part of the traditional site
management. Each plot was 5 x 5 m separated by 1 m walkways.
Species richness
At all sites, a single 1 x 1-meter subplot within each 5 x 5-m plot was
permanently marked and sampled at peak biomass. Areal cover was estimated using a
modified Daubenmire method (32), in which cover was recorded to the nearest 1% for
each species rooted in the plot. Cover estimates also included woody overstory, litter,
bare soil, and rock. Sites with strong seasonal variation in composition were sampled
twice during the season to assemble a complete list of species.
Productivity
Immediately adjacent to the permanent 1 x 1-m cover plot, growing season peak
standing crop was estimated destructively by clipping at ground level all aboveground
biomass of individual plants rooted within two 0.1-m2 (10 x 100 cm) strips. Biomass was
sorted into current (live and recently senescent material) and previous year's growth. For
shrubs and sub-shrubs, all leaves and current year’s stems were collected. All biomass
was dried at 60°C for 48 hrs prior to weighing to the nearest 0.01 g. We used the current
year's biomass as our estimate of aboveground net primary production (ANPP) (33,34).
All sites used this protocol to estimate productivity, except for the Sevilleta, NM, site
which relied on species-specific allometric relationships (35).
In communities where herbivores consume a significant fraction of production,
our method will underestimate ANPP. A correlation between the size of this
underestimate and ANPP could bias the relationship between productivity and richness.
We evaluated this potential bias using plot-level mammalian herbivore exclosures
constructed at 29 of the 48 sites included in our analysis (exclosures were installed the
year after collection of the observational data that is the main focus of this study).
Exclosures used barbed wire up to 2 m high to exclude large mammals with a bottom
overlay of hardware cloth folded against the ground to deter small mammals. We
calculated the percentage of ANPP consumed by herbivores at the block level as 100×B exclosure−B herbivory/Bexclosure
2
where Bexclosure and Bherbivory are live biomass inside and outside of exclosures,
respectively. We then averaged this measure of consumption across blocks within each
site. We set negative values of consumption, reflecting higher average biomass outside
the exclosures, equal to zero. Percent consumption was less than 20% for all but four
sites (two of which had only one exclosure) and was uncorrelated with ANPP (Figure
S1).
Statistical analysis
In preliminary analyses, we noticed potential outlier data points. We evaluated
and removed these outliers using a two-step procedure. First, we flagged data points with
values of Cook's distance (a measure of influence) greater than 1 in the within-site
quadratic regressions. Second, we tested whether removal of these data points altered the
hypothesis tests of the within-site regressions (as described below). We removed four
data points (from four sites) that changed the outcome of a hypothesis test as follows: one
concave-down pattern became positive linear, one nonsignificant became concave-down,
one linear became nonsignificant, and one concave-up became nonsignificant. All of our
final analyses were conducted after removal of the outliers.
To explore the relationship between productivity and species richness among
plots within each site, we first fit a model in which species richness was a linear and
quadratic function of live biomass. If the quadratic term was not significant at the α=0.1
level, we dropped the quadratic term and fit a model containing only the linear term. If
the linear term was not significant at α=0.1, we classified the relationship as
nonsignificant. This approach, which is consistent with previous meta-analyses (13,14),
emphasizes hypothesis testing of the quadratic term rather than overall model fit.
Nevertheless, we found that the results were consistent with an information-theoretic
approach using Akaike's Information Criteria (not shown). We chose the liberal α=0.1
level of significance because we wanted our conclusions about the lack of a general
pattern to be conservative.
Our response variable, counts of species richness, is not strictly normally-
distributed (Gaussian). Therefore, we first fit Poisson regressions in a generalized-linear
model framework. After finding that the data for almost all the sites were under-dispersed
(deviance/df <<1), we then refit all the models with both Gaussian and quasipoisson
approaches. These two approaches led to almost identical patterns in the frequency of
nonsignificant, linear, and quadratic models. Given that the choice of error distribution
did not affect our conclusions, we chose to focus on the results from the Gaussian
models, consistent with previous work on PRR's (14), but we do describe the
quasipoisson results in the main text.
To describe the regional and global scale across-site relationships between
productivity and species richness, we regressed the mean number of species m-2 on the
mean biomass production m-2 at each site. We then repeated the hypothesis tests of the
quadratic and linear terms as in the within-site analysis described above. We repeated
these regressions for subsets of sites with different management histories. We did not
conduct additional Poisson regressions for these site-averaged data because they met the
assumptions of normality better than the individual plot data.
We performed quantile regressions to test for relationships between maximum
richness and productivity at the within-site and global scales. We used the rq() function
3

of the quantreg package in R v.2.10.0. Although we only report results for the 0.95
quantile, we also tested the 0.7, 0.8 and 0.9 quantiles. We performed hypothesis tests
using the bootstrap option with 10000 replications.
4

Fig. S1.
No correlation between consumption and aboveground net primary production (ANPP)
estimated in exclosures at 29 sites. Consumption (%) is estimated as 100*(biomass in
exclosures – biomass in open plots)/(biomass in exclosures). The red symbols indicate
sites where consumption was negative (higher biomass outside the exclosures than
inside); we set these values to zero.
5
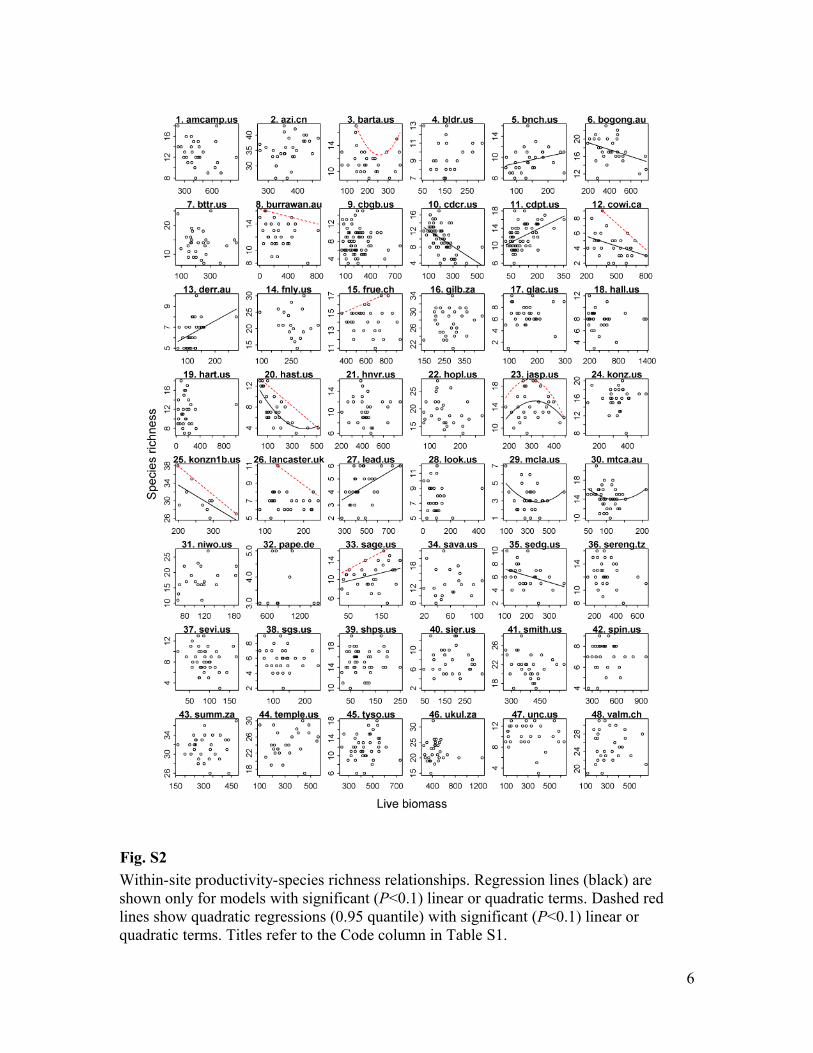
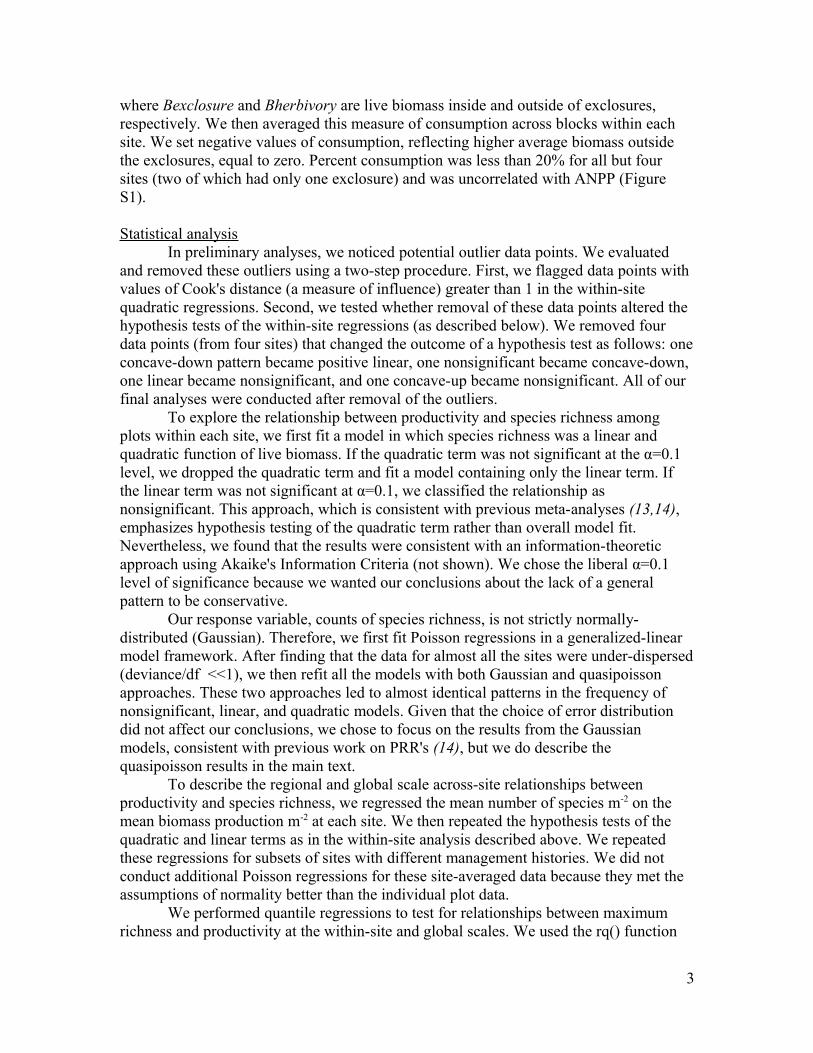
Fig. S2
Within-site productivity-species richness relationships. Regression lines (black) are
shown only for models with significant (P<0.1) linear or quadratic terms. Dashed red
lines show quadratic regressions (0.95 quantile) with significant (P<0.1) linear or
quadratic terms. Titles refer to the Code column in Table S1.
6
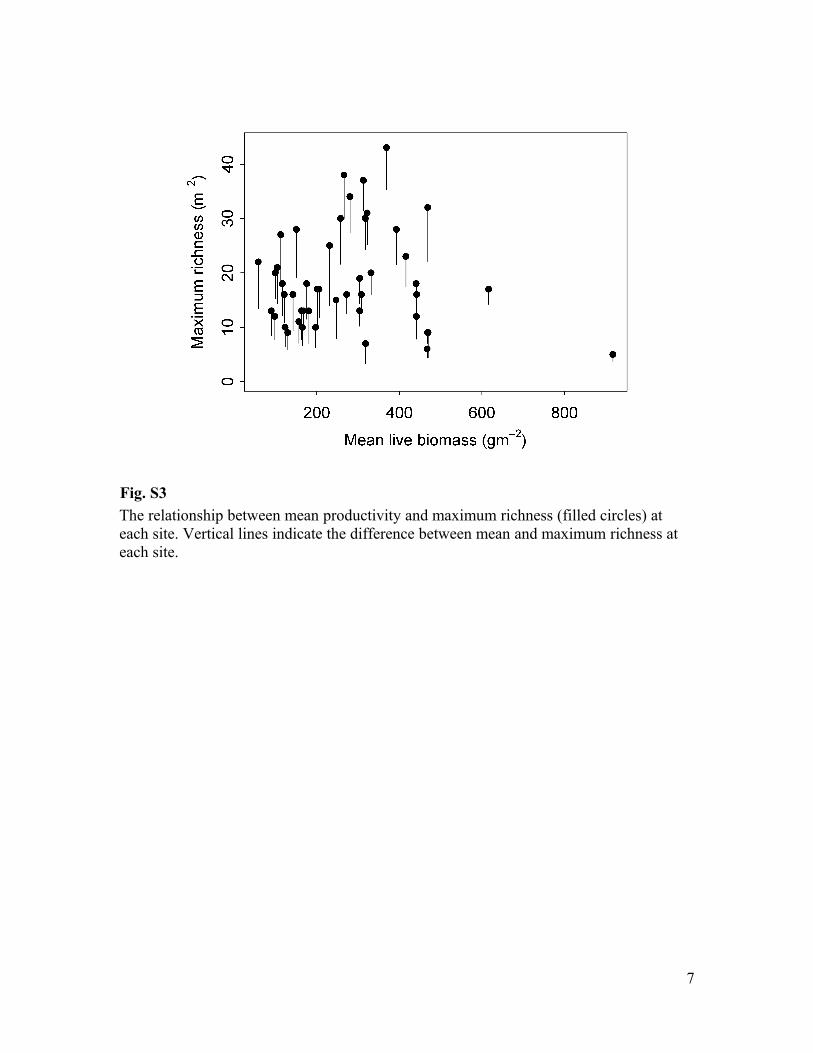
Fig. S3
The relationship between mean productivity and maximum richness (filled circles) at
each site. Vertical lines indicate the difference between mean and maximum richness at
each site.
7
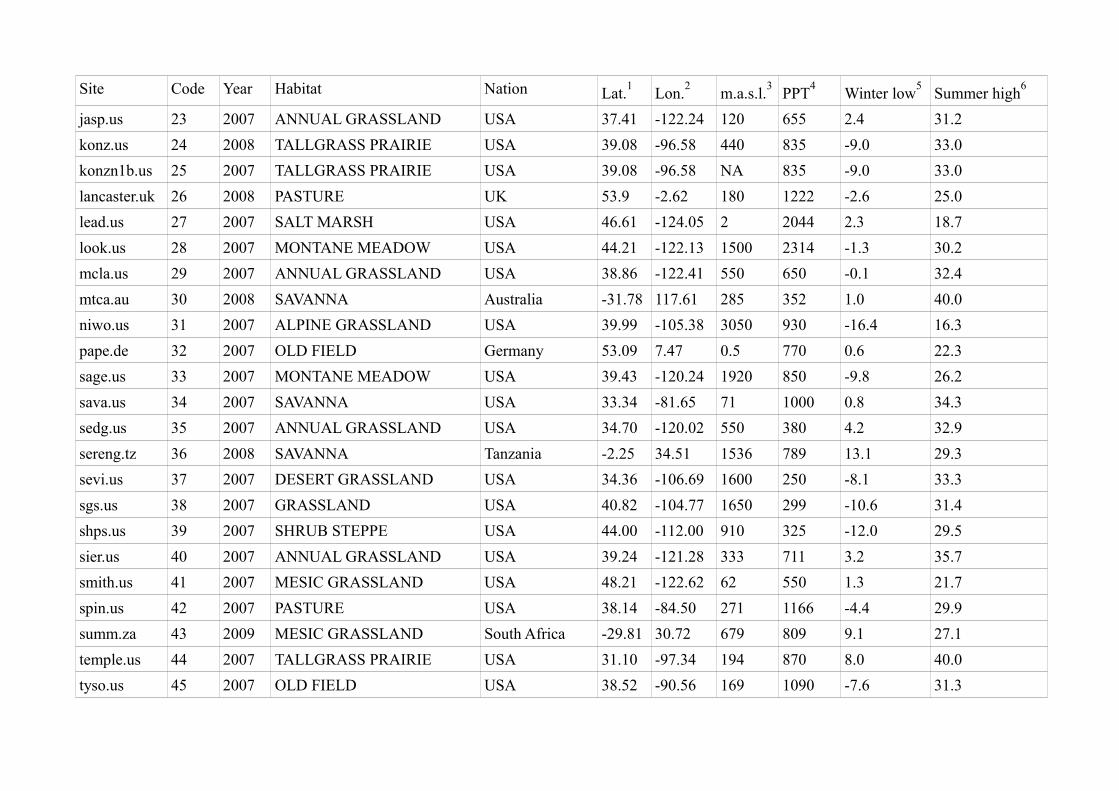
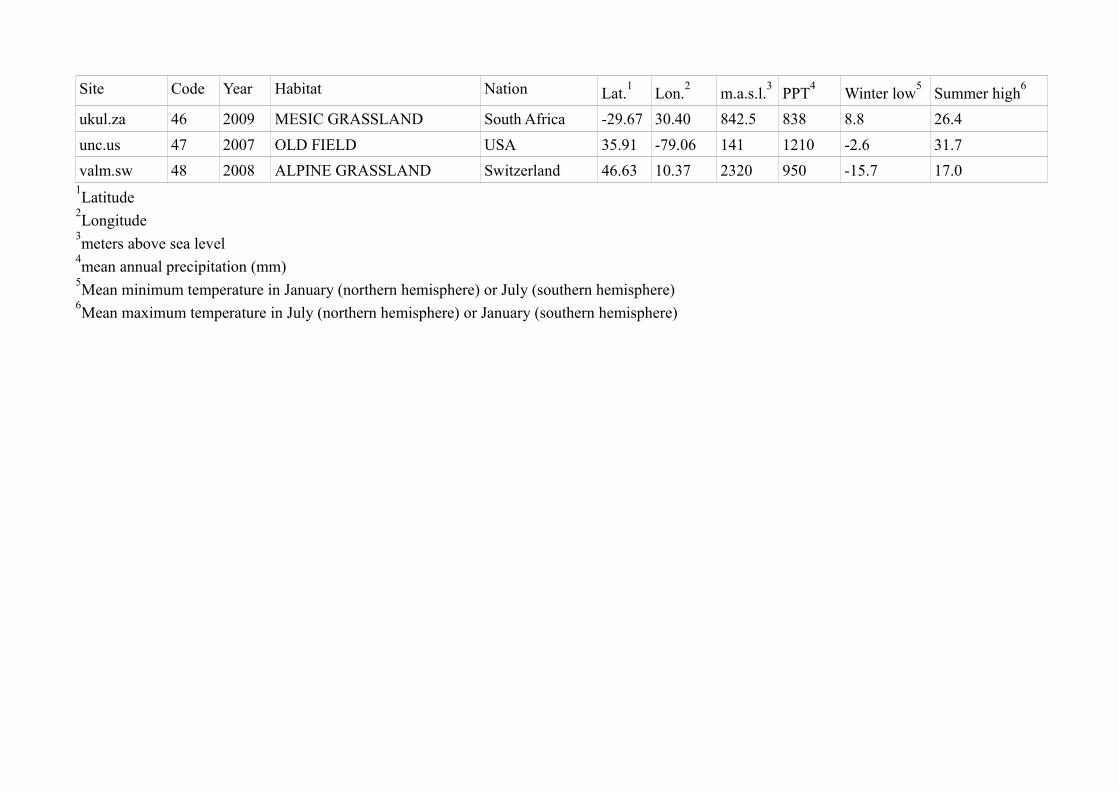
Table S1
Additional information on the 48 study sites.
Site Code Year Habitat Nation Lat.1
Lon.2
m.a.s.l.3
PPT4
Winter low5
Summer high6
amcamp.us 1 2007 MESIC GRASSLAND USA 48.47 -123.01 41 672 2.0 21.5
azi.cn 2 2007 ALPINE GRASSLAND China 33.58 101.53 3500 620 -13.0 32.0
barta.us 3 2007 MIXEDGRASS PRAIRIE USA 42.24 -99.65 767 568 -13.1 29.9
bldr.us 4 2008 SHORTGRASS PRAIRIE USA 39.97 -105.23 1633 482 -6.0 29.5
bnch.us 5 2007 MONTANE MEADOW USA 44.28 -121.97 1500 2160 -1.3 30.2
bogong.au 6 2006 ALPINE GRASSLAND Australia -36.87 147.25 1760 1217 -3 17.4
bttr.us 7 2007 MONTANE MEADOW USA 44.28 -121.96 1500 2160 -1.3 30.2
burrawan.au 8 2008 SEMIARID GRASSLAND Australia -27.73 151.14 425 600 4.7 33.5
cbgb.us 9 2009 TALLGRASS PRAIRIE USA 41.79 -93.43 275 891 -11.8 30.4
cdcr.us 10 2007 TALLGRASS PRAIRIE USA 45.40 -93.20 270 800 -16.8 26.9
cdpt.us 11 2007 SHORTGRASS PRAIRIE USA 41.20 -101.63 965 470 -9.4 32.1
cowi.ca 12 2007 SAVANNA Canada 48.46 -123.38 50 1039 -1.1 23.3
derr.au 13 2007 SEMIARID GRASSLAND Australia -37.81 144.79 38 544 4.9 25.6
fnly.us 14 2007 MESIC GRASSLAND USA 44.41 -123.28 68 1200 0.9 27.3
frue.sw 15 2008 PASTURE Switzerland 47.37 8.55 995 1102 -8.6 26.9
gilb.za 16 2009 MESIC GRASSLAND South Africa -29.28 30.29 1748 867 3.0 28.0
glac.us 17 2007 MESIC GRASSLAND USA 46.87 -123.03 33 1300 0.6 25.3
hall.us 18 2007 TALLGRASS PRAIRIE USA 36.96 -86.73 194 1282 -4.1 31.6
hart.us 19 2007 SHRUB STEPPE USA 42.72 -119.50 1508 305 -5.7 30.0
hast.us 20 2007 ANNUAL GRASSLAND USA 36.20 -121.55 750 550 6.3 20.1
hnvr.us 21 2007 OLD FIELD USA 43.42 -72.14 271 919 -13.5 27.4
hopl.us 22 2007 ANNUAL GRASSLAND USA 39.01 -123.06 416.67 940 2.8 32.6
Site Code Year Habitat Nation Lat.1
Lon.2
m.a.s.l.3
PPT4
Winter low5
Summer high6
jasp.us 23 2007 ANNUAL GRASSLAND USA 37.41 -122.24 120 655 2.4 31.2
konz.us 24 2008 TALLGRASS PRAIRIE USA 39.08 -96.58 440 835 -9.0 33.0
konzn1b.us 25 2007 TALLGRASS PRAIRIE USA 39.08 -96.58 NA 835 -9.0 33.0
lancaster.uk 26 2008 PASTURE UK 53.9 -2.62 180 1222 -2.6 25.0
lead.us 27 2007 SALT MARSH USA 46.61 -124.05 2 2044 2.3 18.7
look.us 28 2007 MONTANE MEADOW USA 44.21 -122.13 1500 2314 -1.3 30.2
mcla.us 29 2007 ANNUAL GRASSLAND USA 38.86 -122.41 550 650 -0.1 32.4
mtca.au 30 2008 SAVANNA Australia -31.78 117.61 285 352 1.0 40.0
niwo.us 31 2007 ALPINE GRASSLAND USA 39.99 -105.38 3050 930 -16.4 16.3
pape.de 32 2007 OLD FIELD Germany 53.09 7.47 0.5 770 0.6 22.3
sage.us 33 2007 MONTANE MEADOW USA 39.43 -120.24 1920 850 -9.8 26.2
sava.us 34 2007 SAVANNA USA 33.34 -81.65 71 1000 0.8 34.3
sedg.us 35 2007 ANNUAL GRASSLAND USA 34.70 -120.02 550 380 4.2 32.9
sereng.tz 36 2008 SAVANNA Tanzania -2.25 34.51 1536 789 13.1 29.3
sevi.us 37 2007 DESERT GRASSLAND USA 34.36 -106.69 1600 250 -8.1 33.3
sgs.us 38 2007 GRASSLAND USA 40.82 -104.77 1650 299 -10.6 31.4
shps.us 39 2007 SHRUB STEPPE USA 44.00 -112.00 910 325 -12.0 29.5
sier.us 40 2007 ANNUAL GRASSLAND USA 39.24 -121.28 333 711 3.2 35.7
smith.us 41 2007 MESIC GRASSLAND USA 48.21 -122.62 62 550 1.3 21.7
spin.us 42 2007 PASTURE USA 38.14 -84.50 271 1166 -4.4 29.9
summ.za 43 2009 MESIC GRASSLAND South Africa -29.81 30.72 679 809 9.1 27.1
temple.us 44 2007 TALLGRASS PRAIRIE USA 31.10 -97.34 194 870 8.0 40.0
tyso.us 45 2007 OLD FIELD USA 38.52 -90.56 169 1090 -7.6 31.3
Site Code Year Habitat Nation Lat.1
Lon.2
m.a.s.l.3
PPT4
Winter low5
Summer high6
ukul.za 46 2009 MESIC GRASSLAND South Africa -29.67 30.40 842.5 838 8.8 26.4
unc.us 47 2007 OLD FIELD USA 35.91 -79.06 141 1210 -2.6 31.7
valm.sw 48 2008 ALPINE GRASSLAND Switzerland 46.63 10.37 2320 950 -15.7 17.01Latitude
2Longitude
3meters above sea level
4mean annual precipitation (mm)
5Mean minimum temperature in January (northern hemisphere) or July (southern hemisphere)
6Mean maximum temperature in July (northern hemisphere) or January (southern hemisphere)

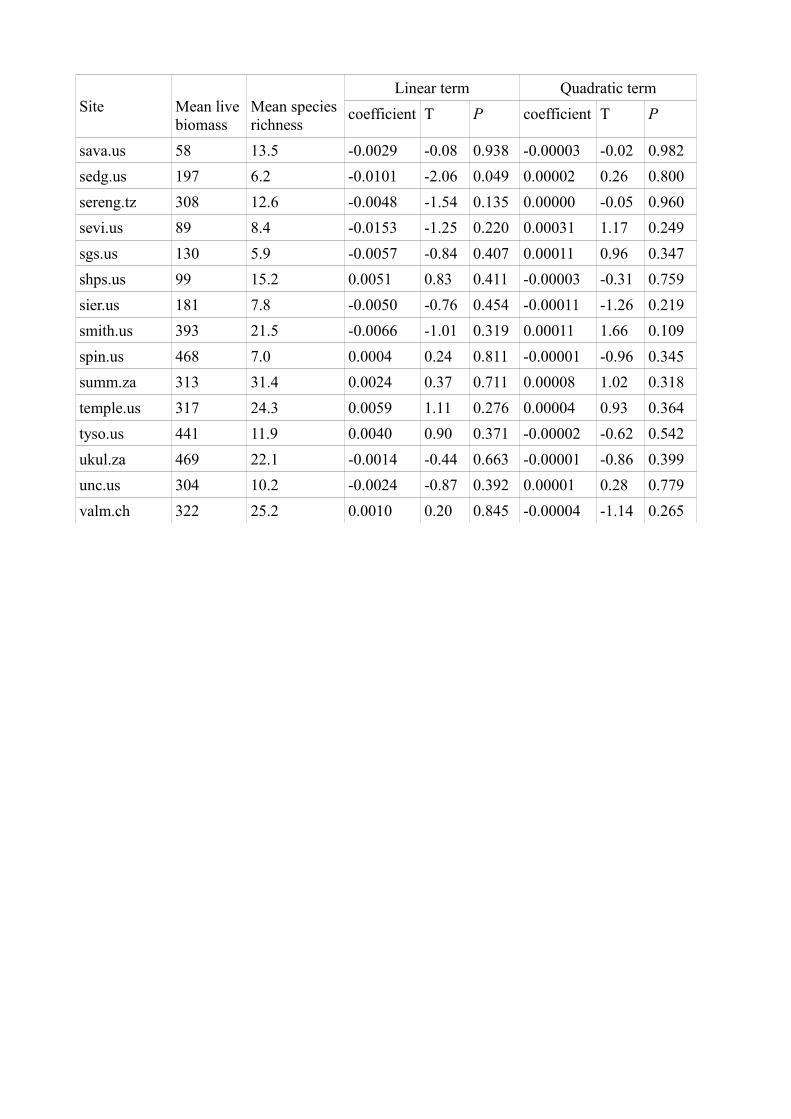
Table S2.
Statistical results for quadratic regressions at the within-site level.
Site Mean live
biomass
Mean species
richness
Linear term Quadratic term
coefficient t P coefficient t P
amcamp.us 441 12.8 -0.0041 -1.34 0.191 0.00002 0.96 0.345
azi.cn 369 35.3 0.0249 1.64 0.112 0.00028 1.12 0.274
barta.us 206 11.8 -0.0034 -0.74 0.466 0.00005 0.98 0.333
bldr.us 167 9.6 0.0028 0.44 0.667 0.00013 1.59 0.131
bnch.us 142 9.4 0.0129 1.72 0.096 -0.00019 -1.49 0.148
bogong.au 416 17.4 -0.0079 -2.20 0.036 -0.00002 -1.04 0.307
bttr.us 231 13.9 -0.0051 -0.61 0.547 0.00007 1.06 0.299
burrawan.au 272 12.5 -0.0025 -1.27 0.213 0.00001 0.86 0.399
cbgb.us 247 8.0 -0.0017 -0.65 0.518 0.00000 -0.33 0.740
cdcr.us 201 10.1 -0.0196 -4.82 0.000 0.00004 1.36 0.179
cdpt.us 116 12.1 0.0198 4.39 0.000 -0.00002 -0.43 0.668
cowi.ca 469 4.4 -0.0043 -2.28 0.031 0.00000 0.33 0.741
derr.au 123 6.5 0.0145 2.59 0.015 -0.00006 -0.89 0.381
fnly.us 258 21.6 -0.0135 -0.88 0.390 0.00011 0.70 0.491
frue.ch 617 14.2 -0.0007 -0.40 0.693 0.00000 -0.24 0.811
gilb.za 281 27.5 0.0068 0.73 0.469 0.00001 0.10 0.924
glac.us 165 6.7 0.0039 0.53 0.602 -0.00001 -0.11 0.910
hall.us 441 7.8 -0.0003 -0.30 0.766 0.00000 0.87 0.393
hart.us 176 11.4 0.0011 0.34 0.736 0.00000 0.33 0.745
hast.us 163 7.7 -0.0177 -4.75 0.000 0.00005 2.31 0.029
hnvr.us 442 10.4 -0.0007 -0.17 0.863 0.00002 0.82 0.417
hopl.us 150 19.1 -0.0197 -1.27 0.216 -0.00007 -0.26 0.796
jasp.us 304 14.3 0.0001 0.01 0.994 -0.00020 -1.89 0.070
konz.us 332 16.0 0.0005 0.08 0.937 0.00002 0.53 0.603
konzn1b.us 266 30.4 -0.0484 -2.54 0.034 0.00021 0.63 0.551
lancaster.uk 156 7.0 -0.0040 -0.73 0.474 -0.00008 -0.54 0.596
lead.us 467 4.4 0.0051 2.86 0.008 0.00000 -0.37 0.714
look.us 98 7.7 -0.0005 -0.09 0.925 0.00004 1.15 0.259
mcla.us 318 3.3 -0.0026 -1.04 0.308 0.00002 1.79 0.084
mtca.au 104 14.4 -0.0089 -0.78 0.441 0.00036 1.74 0.090
niwo.us 113 17.8 0.0441 1.64 0.120 -0.00043 -0.64 0.531
pape.de 918 3.7 -0.0003 -0.36 0.729 0.00000 -1.70 0.133
sage.us 121 10.9 0.0169 1.90 0.068 0.00011 0.59 0.558
Site Mean live
biomass
Mean species
richness
Linear term Quadratic term
coefficient T P coefficient T P
sava.us 58 13.5 -0.0029 -0.08 0.938 -0.00003 -0.02 0.982
sedg.us 197 6.2 -0.0101 -2.06 0.049 0.00002 0.26 0.800
sereng.tz 308 12.6 -0.0048 -1.54 0.135 0.00000 -0.05 0.960
sevi.us 89 8.4 -0.0153 -1.25 0.220 0.00031 1.17 0.249
sgs.us 130 5.9 -0.0057 -0.84 0.407 0.00011 0.96 0.347
shps.us 99 15.2 0.0051 0.83 0.411 -0.00003 -0.31 0.759
sier.us 181 7.8 -0.0050 -0.76 0.454 -0.00011 -1.26 0.219
smith.us 393 21.5 -0.0066 -1.01 0.319 0.00011 1.66 0.109
spin.us 468 7.0 0.0004 0.24 0.811 -0.00001 -0.96 0.345
summ.za 313 31.4 0.0024 0.37 0.711 0.00008 1.02 0.318
temple.us 317 24.3 0.0059 1.11 0.276 0.00004 0.93 0.364
tyso.us 441 11.9 0.0040 0.90 0.371 -0.00002 -0.62 0.542
ukul.za 469 22.1 -0.0014 -0.44 0.663 -0.00001 -0.86 0.399
unc.us 304 10.2 -0.0024 -0.87 0.392 0.00001 0.28 0.779
valm.ch 322 25.2 0.0010 0.20 0.845 -0.00004 -1.14 0.265