financials€¦ · · 2006-03-30agl resources inc. financials glossary of key terms 18 referenced...
TRANSCRIPT

AGL Resources Inc.
financials
Glossary of Key Terms 18
Referenced Accounting Standards 19
Selected Financial Data 20
Management’s Discussion and Analysis 21
Consolidated Balance Sheets—Assets 66
Consolidated Balance Sheets—Liabilities and Capitalization 67
Statements of Consolidated Income 68
Statements of Consolidated Common Shareholders’ Equity 69
Statements of Consolidated Cash Flows 70
Notes to Consolidated Financial Statements 71
Management’s Report on Internal Control over Financial Reporting 109
Reports of Independent Registered Public Accounting Firms 110
Shareholder Information 112

Glossary of Key Terms 18
AGL Capital AGL Capital Corporation
AGL Networks AGL Networks, LLC
Atlanta Gas Light Atlanta Gas Light Company
Chattanooga Gas Chattanooga Gas Company
Credit Facility Credit agreement supporting our commercial paper program
EBIT Earnings before interest and taxes, a non-GAAP measurethat includes operating income, other income, equity in SouthStar’sincome, minority interest in SouthStar’s earnings, donations and gainon sales of assets and excludes interest and tax expense; as an indi-cator of our operating performance, EBIT should not be consideredan alternative to, or more meaningful than, operating income or netincome as determined in accordance with GAAP
ERC Environmental remediation costs
FASB Financial Accounting Standards Board
Florida Commission Florida Public Service Commission
GAAP Accounting principles generally accepted in the UnitedStates of America
Georgia Commission Georgia Public Service Commission
Henry Hub The Henry Hub, located in Louisiana, is the largestcentralized point for natural gas spot and futures trading in the UnitedStates. NYMEX uses the Henry Hub as the point of delivery for its nat-ural gas futures contracts. Many natural gas marketers also use theHenry Hub as their physical contract delivery point or their pricebenchmark for spot trades of natural gas.
LNG Liquefied natural gas
Marketers Marketers selling retail natural gas in Georgia and certificated by the Georgia Public Service Commission
Medium-term notes Notes issued by Atlanta Gas Light withscheduled maturities between 2012 and 2027 bearing interest ratesranging from 6.6% to 9.1%
NJBPU New Jersey Board of Public Utilities
NYMEX New York Mercantile Exchange, Inc.
OCI Other comprehensive income
Operating margin A measure of income, calculated as revenuesminus cost of gas, that excludes operation and maintenanceexpense, depreciation and amortization, taxes other than incometaxes, and the gain on the sale of our Caroline Street campus; theseitems are included in our calculation of operating income as reflectedin our statements of consolidated income. Operating margin shouldnot be considered an alternative to, or more meaningful than, operat-ing income or net income as determined in accordance with GAAP
Pivotal Jefferson Island Pivotal Jefferson Island Storage & Hub, LLC
Pivotal Propane Pivotal Propane of Virginia, Inc.
Pivotal Utility Pivotal Utility Holdings, Inc., parent company of Elizabethtown Gas, Elkton Gas and Florida City Gas
PGA Purchased gas adjustment
PRP Pipeline replacement program
PUHCA Public Utility Holding Company Act of 1935, as amended
Sequent Sequent Energy Management, L.P.
SFAS Statement of Financial Accounting Standards
SouthStar SouthStar Energy Services LLC
Virginia Commission Virginia State Corporation Commission
Virginia Natural Gas Virginia Natural Gas, Inc.
AGL Resources Inc.

Referenced Accounting Standards 19
APB 20 Accounting Principles Board (APB) Opinion No. 20,“Accounting Changes”
APB 25 APB Opinion No. 25, “Accounting for Stock Issued to Employees”
EITF 98-10 Emerging Issues Task Force (EITF) Issue No. 98-10,“Accounting for Contracts Involved in Energy Trading and Risk Management Activities”
EITF 99-02 EITF Issue No. 99-02, “Accounting for Weather Derivatives”
EITF 02-03 EITF Issue No. 02-03, “Issues Involved in Accountingfor Contracts under EITF Issue No. 98-10, ‘Accounting for ContractsInvolved in Energy Trading and Risk Management Activities’”
FIN 46 & FIN 46R FASB Interpretation No. (FIN) 46, “Consolidationof Variable Interest Entities”
FIN 47 FIN 47, “Accounting for Conditional Asset RetirementObligations, an interpretation of FASB Statement No. 143”
SFAS 5 Statement of Financial Accounting Standards (SFAS) No. 5, “Accounting for Contingencies”
SFAS 13 SFAS No. 13, “Accounting for Leases”
SFAS 71 SFAS No. 71, “Accounting for the Effects of CertainTypes of Regulation”
SFAS 109 SFAS No. 109, “Accounting for Income Taxes”
SFAS 123 & SFAS 123R SFAS No. 123, “Accounting for Stock-Based Compensation”
SFAS 131 SFAS No. 131, “Disclosures about Segments of anEnterprise and Related Information”
SFAS 133 SFAS No. 133, “Accounting for Derivative Instrumentsand Hedging Activities”
SFAS 141 SFAS No. 141, “Business Combinations”
SFAS 142 SFAS No. 142, “Goodwill and Other Intangible Assets”
SFAS 149 SFAS No. 149, “Amendment of Statement 133 onDerivative Instruments and Hedging Activities”
SFAS 154 SFAS No. 154, “Accounting Changes and Error Corrections”
AGL Resources Inc.

Selected Financial Data 20
Selected financial data about us is set forth in the table below. We derived the data in the table from our audited financial statements. You should read the data in the table in conjunction with our consolidated financial statements
and related notes. On September 30, 2001, our Board of Directors elected to change our fiscal year end from September 30 to December 31, effective October 1, 2001. We refer to the three months ended December 31,
2001 as the “Transition period” in the table below.
Dollars and shares in millions, except per share amounts 2005 2004 2003 2002 Transition period 2001
Income statement dataOperating revenues $2,718 $1,832 $ 983 $ 877 $ 204 $ 946Cost of gas 1,626 995 339 268 49 327Operating margin 1,092 837 644 609 155 619Operating expenses
Operation and maintenance 477 377 283 274 68 267Depreciation and amortization 133 99 91 89 23 100Taxes other than income taxes 40 29 28 29 6 33
Total operating expenses 650 505 402 392 97 400Gain on sale of Caroline Street campus — — 16 — — —Operating income 442 332 258 217 58 219Equity in earnings of SouthStar Energy Services LLC — — 46 27 4 14Other (loss) income (1) — (6) 3 1 4Minority interest (22) (18) — — — —Interest expense (109) (71) (75) (86) (24) (98)Earnings before income taxes 310 243 223 161 39 139Income taxes 117 90 87 58 14 50Income before cumulative effect of change in accounting principle 193 153 136 103 25 89Cumulative effect of change in accounting principle,
net of $5 in income taxes — — (8) — — —Net income $ 193 $ 153 $ 128 $ 103 $ 25 $ 89Common stock dataWeighted average shares outstanding—basic 77.3 66.3 63.1 56.1 55.3 54.5Weighted average shares outstanding—fully diluted 77.8 67.0 63.7 56.6 55.6 54.9Total shares outstanding1 77.8 76.7 64.5 56.7 55.6 55.1Earnings per share—basic $ 2.50 $ 2.30 $ 2.03 $ 1.84 $ 0.45 $ 1.63Earnings per share—fully diluted $ 2.48 $ 2.28 $ 2.01 $ 1.82 $ 0.45 $ 1.62Dividends per share $ 1.30 $ 1.15 $ 1.11 $ 1.08 $ 0.27 $ 1.08Dividend payout ratio 52% 50% 55% 59% 60% 66%Book value per share2 $19.27 $18.04 $14.66 $12.52 $12.41 $12.20Market value per share3 $34.81 $33.24 $29.10 $24.30 $23.02 $19.97Balance sheet data1
Total assets $6,251 $5,637 $3,972 $3,742 $3,454 $3,368Long-term liabilities 737 682 647 702 671 711Minority interest 38 36 — — — —Capitalization
Long-term debt (excluding current portion) 1,615 1,623 956 994 1,015 1,065Common shareholders’ equity 1,499 1,385 945 710 690 671
Total capitalization $3,114 $3,008 $1,901 $1,704 $1,705 $1,736Financial ratios1
CapitalizationLong-term debt 52% 54% 50% 58% 60% 61%Common shareholders’ equity 48 46 50 42 40 39
Total 100% 100% 100% 100% 100% 100%Return on average common shareholders’ equity 13.4% 13.1% 15.5% 14.7% 14.6% 13.8%1 As of the last day of the fiscal period.2 Common shareholders’ equity divided by total outstanding common shares as of the last day of the fiscal period.3 Closing price of common stock on the New York Stock Exchange as of the last trading day of the fiscal period.
AGL Resources Inc.

21
Cautionary Statement Regarding Forward-looking Information
Certain expectations and projections regarding our future perform-ance referenced in this Management’s Discussion and Analysis ofFinancial Condition and Results of Operations section and elsewherein this report, as well as in other reports and proxy statements wefile with the Securities and Exchange Commission (SEC), are forward-looking statements. Officers and other employees may also make verbal statements to analysts, investors, regulators, the media andothers that are forward-looking.
Forward-looking statements involve matters that are not histor-ical facts, and because these statements involve anticipated eventsor conditions, forward-looking statements often include words suchas “anticipate,” “assume,” “can,” “could,” “estimate,” “expect,” “forecast,” “future,” “indicate,” “intend,” “may,” “outlook,” “plan,” “predict,” “project,” “seek,” “should,” “target,” “will,” “would” or simi-lar expressions. Our expectations are not guarantees and are basedon currently available competitive, financial and economic data alongwith our operating plans. While we believe that our expectations arereasonable in view of the currently available information, our expecta-tions are subject to future events, risks and uncertainties, and thereare several factors—many beyond our control—that could causeresults to differ significantly from our expectations.
Such events, risks and uncertainties include, but are not limitedto, changes in price, supply and demand for natural gas and relatedproducts; the impact of changes in state and federal legislation andregulation; actions taken by government agencies on rates and othermatters; concentration of credit risk; utility and energy industry consol-idation; the impact of acquisitions and divestitures; direct or indirecteffects on AGL Resources’ business, financial condition or liquidityresulting from a change in our credit ratings or the credit ratings of ourcounterparties or competitors; interest rate fluctuations; financial mar-ket conditions and general economic conditions; uncertainties aboutenvironmental issues and the related impact of such issues; the impactof changes in weather on the temperature-sensitive portions of thebusiness; the impact of natural disasters such as hurricanes on thesupply and price of natural gas; acts of war or terrorism; and other fac-tors that are described in detail in our filings with the SEC.
We caution readers that, in addition to the important factorsdescribed elsewhere in this report, the factors set forth in the RiskFactors on page 56, among others, could cause our business, results
of operations or financial condition in 2006 and thereafter to differ sig-nificantly from those expressed in any forward-looking statements.There also may be other factors that we cannot anticipate or thatare not described in this report that could cause results to differ sig-nificantly from our expectations.
Forward-looking statements are only as of the date they aremade, and we do not undertake any obligation to update these state-ments to reflect subsequent circumstances or events.
Overview
We are a Fortune 1000 energy services holding company whoseprincipal business is the distribution of natural gas in six states—Florida, Georgia, Maryland, New Jersey, Tennessee and Virginia. Oursix utilities serve more than 2.2 million end-use customers, makingus the largest distributor of natural gas in the southeastern and mid-Atlantic regions of the United States based on customer count. Wealso are involved in various related businesses, including retail natu-ral gas marketing to end-use customers primarily in Georgia; naturalgas asset management and related logistics activities for our ownutilities as well as for other nonaffiliated companies; natural gas stor-age arbitrage and related activities; operation of high-deliverabilityunderground natural gas storage assets; and construction and oper-ation of telecommunications conduit and fiber infrastructure withinselected metropolitan areas. We manage these businesses throughfour operating segments—distribution operations, retail energy operations, wholesale services and energy investments—and a non-operating corporate segment.
The distribution operations segment is the largest componentof our business and is regulated by regulatory agencies in six states.These agencies approve rates designed to provide us the opportunityto generate revenues to recover the cost of natural gas delivered toour customers and our fixed and variable costs such as depreciation,interest, maintenance and overhead costs, and to earn a reasonablereturn for our shareholders. With the exception of Atlanta Gas LightCompany (Atlanta Gas Light), our largest utility, the earnings of ourregulated utilities are weather sensitive to varying degrees. Althoughvarious regulatory mechanisms provide us a reasonable opportunityto recover our fixed costs regardless of natural gas volumes sold, theeffect of weather manifests itself in terms of higher earnings duringperiods of colder weather and lower earnings in warmer weather.
AGL Resources Inc.
MD&A

MD&A
Atlanta Gas Light charges rates to its customers primarily on monthlyfixed charges. Our retail energy operations segment, which consistsof SouthStar Energy Services LLC (SouthStar), also is weather sensi-tive and uses a variety of hedging strategies to mitigate potentialweather impacts. Our Sequent Energy Management, L.P. (Sequent)subsidiary within our wholesale services segment is weather sensi-tive, with typically increased earnings opportunities during periods ofextreme weather conditions.
During the year ended December 31, 2005, we derived approx-imately 86% of our earnings before interest and taxes (EBIT) from ourregulated natural gas distribution business and the sale of natural gasto end-use customers primarily in Georgia through SouthStar. This statistic is significant because it represents the portion of our earningsthat directly results from the underlying business of supplying naturalgas to retail customers. Although SouthStar is not subject to the sameregulatory framework as our utilities, it is an integral part of the retailframework for providing gas service to end-use customers in the stateof Georgia. For more information regarding our measurement of EBIT,see Results of Operations—AGL Resources.
The remaining 14% of our EBIT was principally derived frombusinesses that are complementary to our natural gas distributionbusiness. We engage in natural gas asset management and the oper-ation of high-deliverability natural gas underground storage as ancil-lary activities to our utility franchises. These businesses allow us to beopportunistic in capturing incremental value at the wholesale level,provide us with deepened business insight about natural gas marketdynamics and facilitate our ability, in the case of asset management,to provide transparency to regulators as to how that value can becaptured to benefit our utility customers through profit-sharingarrangements. Given the volatile and changing nature of the naturalgas resource base in North America and globally, we believe that par-ticipation in these related businesses strengthens our business.
Our Competitive Strengths
We believe our competitive strengths have enabled us to grow ourbusiness profitably and create significant shareholder value. Thesestrengths include:
Regulated distribution assets located in growing geographic
regions Our operations are primarily concentrated along the eastcoast of the United States, from Florida to New Jersey. We operateprimarily urban utility franchises in growing metropolitan areas wherewe can more effectively deploy technology to improve service deliv-ery and manage costs. We believe the population growth and result-ing expansion in business and construction activity in many of theareas we serve should result in increased demand for natural gas andrelated infrastructure for the foreseeable future.
Demonstrated track record of performance through superior
execution We continue to focus our efforts on generating signifi-cant incremental earnings improvements from each of our busi-nesses. We have been successful in achieving this goal in the pastthrough a combination of business growth, opportunistic acquisitionsand controlling or reducing our operating expenses. We achievedthese improvements to our operations in part through the implemen-tation of best practices in our businesses, including increased invest-ments in enterprise technology, workforce automation and businessprocess modernization. Our goal is a single operational platform thateliminates duplicate systems and disparate processes among ourvarious companies.
Demonstrated ability to acquire and integrate natural gas assets
that add significant incremental earnings We take a disciplinedapproach to identifying strategic natural gas assets that support ourlong-term business plan. For example, our 2004 acquisition of natu-ral gas distribution operations in New Jersey, Florida and Marylandprovided us an opportunity to leverage and strengthen one of ourcore competencies—the efficient, low-cost operation of natural gasfranchises. The disparity between these utilities’ pre-acquisition utilityoperating metrics and cost structure and those of our other utilitiesprovided us an opportunity to achieve significant improvements inthese businesses, which we have been able to do. We will continueto seek and implement better methods of operating in order toimprove our service delivery and reduce our costs. In addition, ouracquisition of a natural gas storage facility in Louisiana in 2004 added
22
AGL Resources Inc.

Management’s Discussion and Analysis of Financial Condition and Results of Operations
23
immediate incremental earnings to our business and, given the possibilities for expansion, has the potential to provide prospectiveearnings growth.
Business Accomplishments in 2005
We believe the results of our efforts are clear. We not only deliveredsolid results to our shareholders again in 2005 but also provided cus-tomers with improved service.
In 2005, we increased net income 26% over the prior year to$193 million and increased fully diluted earnings per share 9% to$2.48 despite increased average outstanding debt of $549 millionand 11 million additional shares outstanding in 2005 due to our pub-lic stock offering in November 2004, both of which were related toacquisitions in the fourth quarter of 2004. Our Board of Directorsraised our annual dividend 19% in November 2005, to an annual rateof $1.48 per share. The increase marked the fourth time in three yearsour Board has raised the dividend, bringing our payout ratio more inline with other publicly traded energy holding companies and localdistribution companies and ensuring a competitive dividend yield relative to alternative investments.
We have substantially completed the integration of our tworecent acquisitions: NUI Corporation (NUI), which we acquired on November 30, 2004, and Jefferson Island Storage & Hub, LLC(Jefferson Island), which we acquired on October 1, 2004. JeffersonIsland became a wholly owned subsidiary and was renamed PivotalJefferson Island Storage & Hub, LLC (Pivotal Jefferson Island). In2005, we consolidated a number of NUI’s business technology plat-forms into our enterprise-wide systems, including the accounting,payroll, human resources and supply chain functions. We also con-solidated the former NUI utility call center operations into our owncentralized call center. The combination of systems integration andthe application of our operational model to managing NUI has resultedin significant improvements in its operations, as measured by the various metrics we use to manage our business. As a result of theseintegration efforts, we believe that we have achieved our performancegoal of successfully integrating these acquisitions and making themaccretive to our consolidated earnings within one year of the acquisi-tion closing date.
We continued business process improvement actions, includ-ing the deployment of substantial technology resources, in each ofour business units. Additionally, through asset management, producer
services and storage arbitrage activities at Sequent, we captured andrecognized incremental net income from opportunities in the market-place as we provided services during and after hurricanes Katrina and Rita. Our operational platform was tested when, during hurricaneRita, Sequent relocated its trading floor from Houston to Richardson,Texas with virtually no service interruptions, in order to keep our com-mitments to customers and provide continuity in a market where service disruptions were prevalent.
Lastly, we worked cooperatively with our regulators during theyear. In Georgia, we negotiated a settlement in the Atlanta Gas Lightrate case whereby rates billed to customers will not change for a five-year period but Atlanta Gas Light will recognize reduced operatingrevenues of $5 million per year for a total of $25 million over the five-year period.
2006 Goals
Our fundamental business goals do not significantly change from oneyear to the next. However, we continue to refine our goals, taking intoconsideration our prior financial and operational performance andthose external factors impacting not only us and the natural gasindustry, but also the global marketplace. We are focused on deliver-ing earnings and income growth by effectively managing our gas distribution operations; selectively growing our gas distribution busi-nesses through acquisitions; and developing our portfolio of closelyrelated unregulated businesses.
Impact of Hurricanes on AGL Resources and Our Industry
The natural gas production, processing and pipeline infrastructure inthe Gulf of Mexico was significantly affected by hurricanes Katrina andRita in August and September 2005. This resulted in higher pricesand increased price volatility for natural gas, which we and the EnergyInformation Administration expected would significantly increase thecost to heat a home during the current heating season. Natural gasprices moderated by the end of 2005 and early 2006, and weatherhas been warmer than normal thus far in 2006, but we still expecthome heating costs to be significantly higher in the first quarter of2006 compared to prior years.
The impact of hurricanes Katrina and Rita on natural gas pricesand transportation costs created diverse offsetting effects on our
AGL Resources Inc.

24
business. Increased energy and transportation prices are expected toconsume a significantly larger portion of consumer householdincomes during the remaining winter heating season (first quarter of2006), raising the possibility that we will experience some additionalbad debt expense, as well as some margin erosion from increasedconsumer conservation. These higher prices have thus far been mitigated in part by significantly warmer-than-normal temperatures inthe eastern United States during the first half of the heating season.While we expect these factors to have some impact on our financialresults, primarily in the first half of 2006, we expect the regulatory andoperational mechanisms in place in most of our jurisdictions will helpmitigate our exposures to high natural gas prices.
Natural gas price volatility during 2005 made it further evidentthat we and our customers need to diversify our sources of naturalgas supply. We receive the majority of our natural gas supplies froma production region in and around the Gulf of Mexico, and generallydemand for this natural gas is growing faster than supply. Thisincreased demand can often lead to higher natural gas prices andgreater price volatility. We believe a diversification of our supply port-folio, in an effort to moderate prices, is in our customers’ best inter-est. We may need, from time to time, to invest in new projects toimprove the viability of such portfolio diversification and would expectto earn regulated returns on such investments.
The market dynamics brought on by the two hurricanes presented opportunities for Sequent, and for our utilities throughSequent’s affiliate asset management agreements. Sequent drew onits knowledge of the natural gas grid to move gas from supplysources and deliver it to its customers, which involved moving gasover less traditional routes due to Gulf Coast infrastructure limitations.For additional information regarding the impacts of these hurricaneson our business, see Results of Operations—Distribution Operationsand Results of Operations—Wholesale Services.
Regulatory Environment
We continue to manage the ongoing challenge of operating in a regulatory environment that generally does not measure or rewardinnovation and operational efficiency. In particular, traditional “cost ofservice” regulation, which was originally designed to simulate theactions of a competitive market, has not kept pace with the vastchanges taking place in the natural gas industry, in technology utiliza-tion and in the global economy. These are factors that to various
degrees affect our company. The staffs of various state ratesettingagencies have argued for significantly lower rates of return on regu-lated investments without adequate attention to the effects thoselower returns might have on capital reinvestment in the company’sregulated asset base; the “opportunity cost” to customers of not pro-viding better and more efficient services; and the disincentive forexcellence in management and operations that such returns create.
Much of the ratesetting is done in adversarial proceedingswhere rules of evidence and due process can vary greatly among thestates. As a result of these ongoing regulatory challenges, we willcontinue to work cooperatively with our regulators, legislators andothers as we seek, through rate freezes and performance-basedrates, to create a framework in each jurisdiction that is conducive toour business goals. Furthermore, we will continue to make strategicinvestments in energy-related businesses that either are not subjectto traditional state and federal rate regulation or are subject to lim-ited oversight in order to add value for our shareholders.
In August 2005, the Energy Policy Act of 2005 (Energy Act)was enacted. The Energy Act authorized many broad energy policyprovisions including significant funding for consumers and businessesfor energy-related activities, energy-related tax credits, accelerateddepreciation for certain natural gas utility infrastructure investmentsand the repeal of the Public Utility Holding Company Act of 1935, as amended (PUHCA). The effective date of the PUHCA repeal is Feb-ruary 8, 2006. We continue to evaluate the Energy Act, but we expectto benefit from provisions in the legislation that will support our effortsto promote energy efficiency in a manner that benefits customers and shareholders.
The Energy Act gives the Federal Energy Regulatory Commis-sion (FERC) increased authority over utility merger and acquisitionactivity, removes many of the geographic and structural restrictionson the ownership of public utilities and eliminates certain regula-tory burdens. Some of the SEC reporting requirements, financing authorizations and affiliate relationship approvals that previouslyapplied to us under the PUHCA were replaced by the requirementsof the Energy Act.
In addition, the Energy Act requires a public utility holding com-pany to maintain its books and records and make them available tothe FERC and to comply with certain reporting requirements. How-ever, the FERC may exempt a class of entities or class of transactionsif the FERC finds that they are not relevant to the jurisdictional rateof a public utility or natural gas company.
AGL Resources Inc.
MD&A

Management’s Discussion and Analysis of Financial Condition and Results of Operations
25
In February 2006, we requested an exemption from EnergyAct oversight of our local distribution companies that were previouslyexempt from regulation by the FERC. Our filing request will provideus with a temporary exemption. If the FERC has not taken actionwithin 60 days of our request, the exemption shall be deemed tohave been granted. We expect to qualify for an exemption from thesereporting requirements.
For more information regarding pending federal and state reg-ulatory matters, see Results of Operations—Distribution Operationsand Results of Operations—Wholesale Services.
Results of Operations
AGL Resources
Our results of operations for 2004 included three months of theacquired operations of Jefferson Island and one month of theacquired operations of NUI.
Pursuant to Financial Accounting Standards Board (FASB)Interpretation No. 46, “Consolidation of Variable Interest Entities” (FIN 46) as revised, which we adopted in January 2004, we consol-idated SouthStar’s accounts with our subsidiaries’ accounts as ofJanuary 1, 2004. For the years ended December 31, 2005 and2004, we recorded the Piedmont Natural Gas Company, Inc. (Piedmont) portion of SouthStar’s earnings as a minority interest inour statements of consolidated income and the Piedmont portion ofSouthStar’s contributed capital as a minority interest in our consoli-dated balance sheets. We eliminated any intercompany profitsbetween segments.
In 2003, we accounted for our 70% noncontrolling financialownership interest in SouthStar using the equity method of accountingbecause SouthStar did not meet the definition of a variable interestentity under FIN 46. Under the equity method, we reported our ownership interest in SouthStar as an infestment in our consolidatedbalance sheets, and we reported our share of SouthStar’s earningsbased on our ownership percentage in our statements of consoli-dated income as a component of other income.
Seasonality The operating revenues and EBIT of our distributionoperations, retail energy operations and wholesale services segmentsare seasonal. During the heating season (October–March), natural gas
usage and operating revenues are higher because generally morecustomers are connected to our distribution systems and becausenatural gas usage is higher in periods of colder weather than in peri-ods of warmer weather. Approximately 70% of these segments’ oper-ating revenues and EBIT for the year ended December 31, 2005 weregenerated during the six-month heating season and are reflected in ourconsolidated income statements for the quarters ended March 31,2005 and December 31, 2005. Our base operating expenses, exclud-ing cost of gas, interest expense and certain incentive compensationcosts, are incurred relatively equally over any given year. Thus ouroperating results vary significantly from quarter to quarter as a result ofseasonality. Seasonality also affects the comparison of certain balancesheet items such as receivables, unbilled revenue, inventories andshort-term debt across quarters.
Hedging Changes in commodity prices subject a significant por-tion of our operations to variability. Commodity prices tend to behigher in colder months. Our nonutility businesses principally usephysical and financial arrangements to economically hedge the risksassociated with both seasonal fluctuations and changing commodityprices. In addition, because these economic hedges are generally notdesignated for hedge accounting treatment, our reported earnings forthe wholesale services and retail energy operations segments reflectchanges in the fair values of certain derivatives; these values maychange significantly from period to period.
Elizabethtown Gas utilizes certain derivatives to hedge theimpact of market fluctuations in natural gas prices. These derivativeproducts are marked to market each reporting period. In accordancewith regulatory requirements, realized gains and losses related tothese derivatives are reflected in purchased gas costs and ultimatelyincluded in billings to customers. Unrealized gains and losses arereflected as a regulatory asset (loss) or liability (gain), as appropriate,in our consolidated balance sheets.
Revenues We generate nearly all our operating revenues throughthe sale, distribution and storage of natural gas. We include in ourconsolidated revenues an estimate of revenues from natural gas dis-tributed, but not yet billed, to residential and commercial customersfrom the latest meter reading date to the end of the reporting period.We record these estimated revenues as unbilled revenues in our con-solidated balance sheets.
AGL Resources Inc.

26
Operating Margin and EBIT We evaluate the performance of ouroperating segments using the measures of operating margin andEBIT. We believe operating margin is a better indicator than revenuesfor the contribution resulting from customer growth in our distributionoperations segment since the cost of gas can vary significantly and isgenerally passed directly to our customers. We also consider operat-ing margin to be a better indicator in our retail energy operations,wholesale services and energy investments segments since it is adirect measure of gross profit before overhead costs. We believe EBITis a useful measurement of our operating segments’ performancebecause it provides information that can be used to evaluate theeffectiveness of our businesses from an operational perspective,exclusive of the costs to finance those activities and exclusive ofincome taxes, neither of which is directly relevant to the efficiency ofthose operations.
Our operating margin and EBIT are not measures that are con-sidered to be calculated in accordance with accounting principlesgenerally accepted in the United States of America (GAAP). Youshould not consider operating margin or EBIT an alternative to, or amore meaningful indicator of our operating performance than, oper-ating income or net income as determined in accordance with GAAP.In addition, our operating margin or EBIT measure may not be com-parable to similarly titled measures of other companies.
The following table sets forth a reconciliation of our operatingmargin and EBIT to our operating income and net income, togetherwith other consolidated financial information for the years endedDecember 31, 2005 and 2004; and pro-forma results as if South-Star’s accounts were consolidated with our subsidiaries’ accounts forthe year ended December 31, 2003. The unaudited pro-forma resultsare presented for comparative purposes as a result of our consoli-dation of SouthStar’s accounts with our subsidiaries’ accounts as ofJanuary 1, 2004. This pro-forma basis is a non-GAAP presentation;however, we believe it is useful to readers of our financial statementssince it presents our revenues and expenses for 2003 on the samebasis as 2005 and 2004.
Pro-forma
In millions 2005 2004 2003
Operating revenues $2,718 $1,832 $1,557Cost of gas 1,626 995 789Operating margin 1,092 837 768Operating expenses
Operation and maintenance 477 377 343Depreciation and amortization 133 99 92Taxes other than income 40 29 28
Total operating expenses 650 505 463Gain on sale of Caroline
Street campus — — 16Operating income 442 332 321Other losses (1) — (6)Minority interest (22) (18) (17)EBIT 419 314 298Interest expense 109 71 75Earnings before income taxes 310 243 223Income taxes 117 90 87Income before cumulative effect
of change in accounting principle 193 153 136Cumulative effect of change
in accounting principle — — (8)Net income $ 193 $ 153 $ 128Basic earnings per common share:
Income before cumulative effect of change in accounting principle $ 2.50 $ 2.30 $ 2.15
Cumulative effect of change in accounting principle — — (0.12)
Basic earnings per common share $ 2.50 $ 2.30 $ 2.03
Fully diluted earnings per common share:Income before cumulative effect
of change in accounting principle $ 2.48 $ 2.28 $ 2.13Cumulative effect of change
in accounting principle — — (0.12)Fully diluted earnings per
common share $ 2.48 $ 2.28 $ 2.01Weighted average number
of common shares outstanding:Basic 77.3 66.3 63.1Diluted 77.8 67.0 63.7
AGL Resources Inc.
MD&A

Management’s Discussion and Analysis of Financial Condition and Results of Operations
27
Segment information Operating revenues, operating marginand EBIT information for each of our segments are presented in the fol-lowing table for the years ended December 31, 2005, 2004 and 2003:
Operating Operating
In millions revenues margin EBIT
2005
Distribution operations $1,753 $ 814 $299
Retail energy operations 996 146 63
Wholesale services 95 92 49
Energy investments 56 40 19
Corporate1 (182) — (11)
Consolidated $2,718 $1,092 $419
2004
Distribution operations $1,111 $ 640 $247Retail energy operations 827 132 52Wholesale services 54 53 24Energy investments 25 13 7Corporate1 (185) (1) (16)
Consolidated $1,832 $ 837 $3142003
Distribution operations $ 936 $ 599 $247Retail energy operations2 743 124 46Wholesale services 41 40 20Energy investments 6 5 (3)Corporate1,2 (169) — (12)
Consolidated $1,557 $ 768 $2981 Includes the elimination of intercompany revenues.2 Includes pro-forma results as if SouthStar’s accounts were consolidated with our subsidiaries’ accounts.
In the following table, our reported results in 2003 are reconciledto the pro-forma presentation in the tables above. In 2003, we rec-ognized our portion of SouthStar’s earnings of $46 million as equityearnings. The amounts presented below for SouthStar represent100% of its revenues and expenses for 2003 and include minorityinterest, which adjusts our 80% share of SouthStar’s earnings to reflectPiedmont’s and Dynegy Inc.’s share of SouthStar’s earnings.
For the twelve months ended December 31, 2003
In millions As reported SouthStar Eliminations Pro-forma
Operating revenues $983 $743 $(169) $1,557Cost of gas 339 619 (169) 789Operating margin 644 124 — 768Operating expenses
Operation and maintenance 283 60 — 343
Depreciation and amortization 91 1 — 92
Taxes other than income 28 — — 28Total operating expenses 402 61 — 463Gain on sale of
Caroline Street campus 16 — — 16Operating income 258 63 — 321Equity earnings
from SouthStar 46 — (46) —Other losses (6) — — (6)Minority interest — (17) — (17)EBIT 298 46 (46) 298Interest expense 75 — — 75Earnings before income taxes 223 46 (46) 223Income taxes 87 — — 87Income before cumulative
effect of change in accounting principle $136 $ 46 $ (46) $ 136
AGL Resources Inc.

28
Discussion of Consolidated Results
2005 compared to 2004 Our earnings per share and net incomefor the year ended December 31, 2005 were higher than the prioryear due to the acquisitions of NUI and Jefferson Island combinedwith strong contributions from our wholesale services and retailenergy operations businesses.
Consolidated EBIT for 2005 increased by $105 million or 33%from the previous year, of which $56 million related to EBIT contribu-tions from the 2004 acquisitions of NUI and Jefferson Island and fromPivotal Propane of Virginia, Inc. (Pivotal Propane), which became oper-ational in 2005. The increase further reflected increased contributionsof $8 million from Atlanta Gas Light in distribution operations, $11 mil-lion from retail energy operations and $3 million from AGL Networks,LLC (AGL Networks) in energy investments. Wholesale services’ EBITincreased $25 million primarily due to increased operating margins par-tially offset by higher operating expenses. The corporate segmentimproved by $5 million as compared to last year primarily due tomerger- and acquisition-related costs incurred in 2004 but not in 2005.
Operating margin increased $255 million or 30%, primarilyreflecting the NUI and Jefferson Island acquisitions and completion ofthe Pivotal Propane facility in Virginia, as well as improved marginsat SouthStar, Sequent and AGL Networks. Excluding the addition ofthe NUI utilities, distribution operations’ margins improved by $8 mil-lion mainly as a result of higher pipeline replacement revenues andadditional carrying costs charged to retail marketers in Georgia for gasstorage. Retail energy operations’ margins were up $14 million, dueprimarily to higher commodity margins. Wholesale services’ operat-ing margin increased $39 million year over year, primarily due to activ-ity during the third and fourth quarters of 2005. Energy investments’margins were also up $27 million, primarily as a result of the acquisi-tion of Jefferson Island that contributed $13 million; contributionsfrom NUI’s nonutility businesses of $8 million; contribution from Pivotal Propane of $3 million; and improved operating margin at AGL Networks of $4 million.
Operating expenses increased $145 million or 29%, primarily asa result of $124 million in higher expenses at distribution operationsdue to the addition of NUI. In addition, operating expenses at energyinvestments increased $15 million due to the addition of JeffersonIsland, the NUI nonutility assets and Pivotal Propane. Operatingexpenses at wholesale services increased $13 million due to increasedpayroll and employee incentive compensation costs resulting from
its operational and financial growth and depreciation on a trading and risk management system placed in service during 2004. Theincreased operating expenses were offset by lower corporate operat-ing expenses primarily due to prior-year costs incurred with mergerand acquisition activities.
Interest expense for 2005 was $109 million, or $38 millionhigher than in 2004. As indicated in the table below, higher short-terminterest rates and higher debt outstanding combined to increase ourinterest expense in 2005 relative to the previous year. The increase of$549 million in average debt outstanding for 2005 compared to 2004was due to additional debt incurred as a result of the acquisitions ofNUI and Jefferson Island, and higher working capital requirements asa result of higher natural gas prices.
Dollars in millions 2005 2004
Total interest expense $ 109 $ 71Average debt outstanding1 1,823 1,274Average interest rate 6.0% 5.6%1 Daily average of all outstanding debt.
We anticipate our interest expense in 2006 will be higher thanin 2005 due to higher projected interest rates. Based on $728 mil-lion of variable-rate debt, which includes $522 million of our short-term debt, $100 million of variable-rate senior notes and $106 millionof variable-rate gas facility revenue bonds outstanding at Decem-ber 31, 2005, a 100 basis point change in market interest rates from4.7% to 5.7% would result in an increase in annual pretax interestexpense of $7 million.
The increase in income tax expense of $27 million or 30% for2005 compared to 2004 reflected additional income taxes of $25 mil-lion due to higher corporate earnings year over year and $2 milliondue to a slightly higher effective tax rate of 38% for 2005 as comparedto 37% in 2004. We expect our effective tax rate for the year endingDecember 31, 2006 to be similar to the effective rate for the yearended December 31, 2005.
As a result of our 11 million share equity offering in November2004, earnings results for the year are based on weighted averageshares outstanding of 77.3 million, while 2004 results were basedon weighted average shares outstanding of 66.3 million.
AGL Resources Inc.
MD&A

Management’s Discussion and Analysis of Financial Condition and Results of Operations
29
2004 compared to 2003 Our EBIT for the year ended Decem-ber 31, 2004 was higher than the prior year due to stronger contribu-tions from our wholesale services business and retail energyoperations and from the acquisitions of NUI and Jefferson Island.
Consolidated EBIT for 2004 increased $16 million or 5% ascompared to 2003, of which $10 million related to EBIT contributionsfrom our acquisitions of NUI ($7 million) and Jefferson Island ($3 mil-lion) during the fourth quarter of 2004. Distribution operations’ EBIT for2004 remained relatively flat as compared to 2003. For comparisonpurposes, however, distribution operations’ EBIT in 2004 increased by$13 million after excluding the effect of a net $13 million pretax gain onthe sales of company property and a related charitable contributionin 2003. The increase further reflected increased contributions fromSouthStar in retail energy operations of $6 million, AGL Networks inenergy investments of $3 million and Sequent in wholesale services of$4 million. Additionally, our energy investments segment had a $4 mil-lion increase in EBIT due to the 2004 sale of Heritage Propane and ofa residential development property in Savannah, Georgia. Theseincreases were partially offset by lower contributions of $4 million fromour corporate segment due to increased outside service costs associated with software maintenance, licensing and implementationof our work management project, higher costs due to Section 404 ofthe Sarbanes-Oxley Act of 2002 (SOX 404) compliance efforts andmerger- and acquisition-related costs.
Our operating margin for 2004 increased $69 million or 9% as compared to 2003 pro-forma operating margin, primarily reflectingthe 2004 NUI and Jefferson Island acquisitions, which contributed$29 million. Sequent, SouthStar and AGL Networks also hadimproved 2004 operating margins of $13 million, $8 million (on a pro-forma basis) and $2 million, respectively. Excluding the addition of theNUI utilities, distribution operations’ margins improved by $17 mil-lion mainly at Atlanta Gas Light and Virginia Natural Gas, Inc. (VirginiaNatural Gas). Atlanta Gas Light’s operating margin increased as aresult of higher pipeline replacement revenues, additional carryingcosts charged to retail marketers in Georgia for gas storage, customergrowth and higher customer usage. Virginia Natural Gas’ operatingmargin increased primarily due to customer growth.
Operating expenses increased $42 million on a pro-forma basisor 9% primarily as a result of $19 million in higher expenses due to theadditions of NUI and Jefferson Island. In addition, operating expensesat wholesale services increased $9 million due to increased outsideservice costs related to its energy trading and risk management
system and SOX 404 compliance projects and an increase in thenumber of employees, as well as increased depreciation. Excludingthe effects of our acquisition of NUI, distribution operations’ expensesincreased $10 million as a result of increased costs related to infor-mation technology projects, SOX 404 compliance and depreciationexpense, offset by decreased bad debt expense.
Our corporate segment also had a $6 million increase in oper-ating expenses primarily from increased outside service costs asso-ciated with software maintenance, licensing and implementationprojects, as well as for SOX 404 compliance efforts and merger andacquisition activities. These increased operating expenses were off-set by a $2 million decrease at SouthStar on a pro-forma basis mainlydue to lower bad debt expense offset by higher corporate allocatedoverhead and SOX 404 compliance costs.
Interest expense for 2004 was $71 million or $4 million lowerthan in 2003. As shown in the following table, a favorable interest rateenvironment and the issuance of lower-interest long-term debt com-bined to lower the company’s interest expense in 2004 relative to theprevious year. The increase of $19 million in average debt outstand-ing for 2004 compared to 2003 was due to additional debt incurredas a result of the acquisitions of NUI and Jefferson Island.
Dollars in millions 2004 2003
Total interest expense $ 71 $ 75Average debt outstanding1 1,274 1,255Average interest rate 5.6% 6.0%1 Daily average of all outstanding debt.
The increase in income tax expense of $3 million or 3% for2004 compared to 2003 reflected $8 million of additional incometaxes due to higher corporate earnings year over year, offset by a $5 million decrease in income taxes due to a decrease in the effectivetax rate from 39% in 2003 to 37% in 2004. The decline in the effec-tive tax rate was primarily the result of income tax adjustmentsrecorded in the third quarter of 2004 in connection with our annualcomparison of filed tax returns to related income tax accruals.
As a result of our 11 million share equity offering in November2004, earnings results for the year are based on weighted averageshares outstanding of 66.3 million, while 2003 results were basedon weighted average shares outstanding of 63.1 million.
AGL Resources Inc.
30
Each utility operates subject to regulations provided by the stateregulatory agency in its service territories with respect to rates chargedto our customers, maintenance of accounting records, and variousother service and safety matters. Rates charged to our customers varyaccording to customer class (residential, commercial or industrial) andrate jurisdiction. Rates are set at levels that allow recovery of all pru-dently incurred costs, including a return on rate base sufficient to payinterest on debt and provide a reasonable return on common equity.Rate base consists generally of the original cost of utility plant in serv-ice, working capital, inventories and certain other assets; less accu-mulated depreciation on utility plant in service, net deferred income taxliabilities and certain other deductions. Our utilities are authorized touse a purchased gas adjustment (PGA) mechanism that allows them
to automatically adjust their rates to reflect changes in the wholesalecost of natural gas and to ensure the utilities recover 100% of the costsincurred in purchasing gas for their customers. We continuously mon-itor the performance of our utilities to determine whether rates need tobe further adjusted by making a rate case filing.
Increased Natural Gas Prices, Bad Debt and Conservation
Increased prices of natural gas are being driven by increased demandthat is exceeding the growth in available supply. The hurricanes in theGulf Coast region during the late summer and early fall of 2005impacted the availability of natural gas supply, causing a dramatic rise in natural gas prices. These higher prices have thus far been mit-igated in part by significantly warmer-than-normal temperatures in the
AGL Resources Inc.
MD&A
Distribution Operations
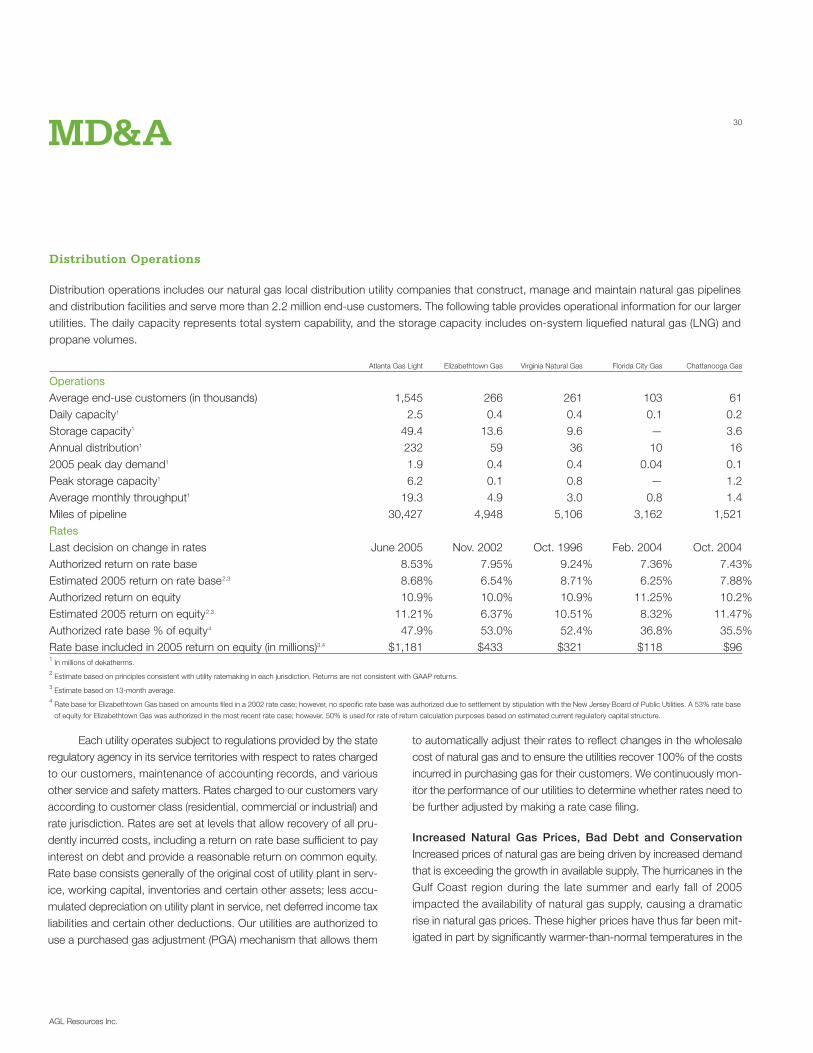
Distribution operations includes our natural gas local distribution utility companies that construct, manage and maintain natural gas pipelinesand distribution facilities and serve more than 2.2 million end-use customers. The following table provides operational information for our largerutilities. The daily capacity represents total system capability, and the storage capacity includes on-system liquefied natural gas (LNG) andpropane volumes.
Atlanta Gas Light Elizabethtown Gas Virginia Natural Gas Florida City Gas Chattanooga Gas
Operations
Average end-use customers (in thousands) 1,545 266 261 103 61Daily capacity1 2.5 0.4 0.4 0.1 0.2Storage capacity1 49.4 13.6 9.6 — 3.6Annual distribution1 232 59 36 10 162005 peak day demand1 1.9 0.4 0.4 0.04 0.1Peak storage capacity1 6.2 0.1 0.8 — 1.2Average monthly throughput1 19.3 4.9 3.0 0.8 1.4Miles of pipeline 30,427 4,948 5,106 3,162 1,521Rates
Last decision on change in rates June 2005 Nov. 2002 Oct. 1996 Feb. 2004 Oct. 2004Authorized return on rate base 8.53% 7.95% 9.24% 7.36% 7.43%Estimated 2005 return on rate base2,3 8.68% 6.54% 8.71% 6.25% 7.88%Authorized return on equity 10.9% 10.0% 10.9% 11.25% 10.2%Estimated 2005 return on equity2,3 11.21% 6.37% 10.51% 8.32% 11.47%Authorized rate base % of equity4 47.9% 53.0% 52.4% 36.8% 35.5%Rate base included in 2005 return on equity (in millions)3,4 $1,181 $433 $321 $118 $961 In millions of dekatherms.2 Estimate based on principles consistent with utility ratemaking in each jurisdiction. Returns are not consistent with GAAP returns.3 Estimate based on 13-month average.4 Rate base for Elizabethtown Gas based on amounts filed in a 2002 rate case; however, no specific rate base was authorized due to settlement by stipulation with the New Jersey Board of Public Utilities. A 53% rate base
of equity for Elizabethtown Gas was authorized in the most recent rate case; however, 50% is used for rate of return calculation purposes based on estimated current regulatory capital structure.

Management’s Discussion and Analysis of Financial Condition and Results of Operations
31
eastern United States during the first half of the heating season. Weexpect our customers will incur increases in their bills during theremainder of the current winter heating season.
An increase in the cost of gas due to higher natural gas com-modity costs generally has no direct effect on our utility’s net operat-ing margin and net income due to the PGA mechanisms at ourutilities. However, net income may be reduced as a result of higherexpenses that may be incurred for bad debt, as well as lower volumesof natural gas deliveries to customers due to customer conservationand thus lower natural gas consumption.
These risks of increased bad debt expense and decreasedoperating margins from conservation are minimized at our largest util-ity, Atlanta Gas Light, as a result of its straight-fixed-variable ratestructure and because customers in Georgia buy gas from certificatedmarketers rather than from Atlanta Gas Light. Our credit exposure atAtlanta Gas Light is primarily related to the provision of services forthe certificated marketers, but that exposure is mitigated because weobtain security support in an amount equal to a minimum of two timesa marketer’s highest month’s estimated bill.
As part of our integration strategy, we have implemented meas-ures at our New Jersey and Florida utilities to collect delinquentaccounts; these measures are similar to our processes at Virginia Natural Gas and Chattanooga Gas Company (Chattanooga Gas).Across our utility system, bad debt levels are lower year-to-date thanthey have been in previous years, and we will continue to monitor andmitigate the impact of uncollectible expenses.
We are partnering with regulators and state agencies in each ofour jurisdictions to educate customers about these issues, and partic-ularly to ensure that those who qualify for Low Income Home EnergyAssistance funds and similar programs receive that assistance.
Competition Our distribution operations businesses face com-petition based on customer preferences for natural gas comparedto other energy products and the comparative prices of those prod-ucts. Our principal competition relates to electric utilities and oil andpropane providers serving the residential and small commercial mar-kets throughout our service areas and the potential displacement orreplacement of natural gas appliances with electric appliances. Theprimary competitive factors are the price of energy and the desirabil-ity of natural gas heating versus alternative heating sources.
Competition for space heating and general household and smallcommercial energy needs generally occurs at the initial installationphase when the customer/builder makes decisions as to which typesof equipment to install. Customers generally continue to use the chosen energy source for the life of the equipment. Customer demandfor natural gas could be affected by numerous factors, including
▪ changes in the availability or price of natural gas and other formsof energy
▪ general economic conditions▪ energy conservation▪ legislation and regulations▪ the capability to convert from natural gas to alternative fuels▪ weather
In some of our service areas, net growth continues to be sloweddue to the number of customers who leave our systems because ofhigher natural gas prices and competition from alternative fuelsources, including incentives offered by the local electric utilities toswitch to electric heat alternatives.
We expect customer growth to improve in the future throughour efforts in new business and retention. These efforts include work-ing to add residential customers with three or more appliances, multi-family complexes and high-value commercial customers that usenatural gas for purposes other than space heating. In addition, wepartner with numerous entities to market the benefits of gas appli-ances and to identify potential retention options early in the processfor those customers who might consider leaving our franchise by con-verting to alternative fuels.
Atlanta Gas Light This natural gas local distribution utility operatesdistribution systems and related facilities throughout Georgia. AtlantaGas Light is regulated by the Georgia Public Service Commission(Georgia Commission).
Prior to Georgia’s 1997 Natural Gas Competition and Deregu-lation Act (Deregulation Act), which deregulated Georgia’s natural gasmarket, Atlanta Gas Light was the supplier and seller of natural gasto its customers. Today, Marketers—that is, marketers who are certifi-cated by the Georgia Commission to sell retail natural gas in Georgiaat rates and on terms approved by the Georgia Commission—sell
AGL Resources Inc.

32
natural gas to end-use customers in Georgia and handle customerbilling functions. Atlanta Gas Light’s role includes
▪ distributing natural gas for Marketers▪ constructing, operating and maintaining the gas system infrastruc-
ture, including responding to customer service calls and leaks▪ reading meters and maintaining underlying customer premise infor-
mation for Marketers
Since 1998, a number of federal and state proceedings haveaddressed the role of Atlanta Gas Light in administering and assign-ing interstate assets to Marketers pursuant to the provisions of theDeregulation Act. In this role, Atlanta Gas Light is authorized to offeradditional sales services pursuant to Georgia Commission–approvedtariffs and to acquire and continue managing the interstate transporta-tion and storage contracts that underlie the sales services providedto Marketers on its distribution system under Georgia Commission–approved tariffs.
Rate Settlement Agreement In June 2005, the GeorgiaCommission approved a Settlement Agreement with Atlanta Gas Light that froze Atlanta Gas Light’s base rates billed to customers asof April 30, 2005 through April 30, 2010. The Settlement Agreementalso requires Atlanta Gas Light to recognize reduced revenues of $25 million over the same period, to spend $2 million annually onenergy conservation programs and to spend an additional $2 millionfor social responsibility and education programs. The SettlementAgreement was effective for rates as of May 1, 2005. Atlanta GasLight offset the impact of the Settlement Agreement on its 2005 EBIT by identifying and implementing reductions in its operating costsand by realizing increased operating margins from net customergrowth in 2005.
During the term of the Settlement Agreement, Atlanta Gas Lightwill not seek a rate increase, nor will the Georgia Commission initiatea new rate proceeding. Atlanta Gas Light will file information equiva-lent to information that would be required for a general rate case onNovember 1, 2009, with new rates to be effective on May 1, 2010.
The Settlement Agreement establishes an authorized return onequity of 10.9% for Atlanta Gas Light, resulting in an overall rate ofreturn of 8.53%. Prior to the settlement, Atlanta Gas Light’s author-ized return on equity was 11% and its overall return was set at 9.16%.
The Settlement Agreement extends Atlanta Gas Light’s pipe-line replacement program (PRP) by five years to require that all
replacements be completed by December 2013 and sets the per-customer PRP rate to be billed at $1.29 per customer per month fromMay 2005 through September 2008 and at $1.95 from October 2008through December 2013. Atlanta Gas Light will apply the five-yeartotal reduction in recognized base rate revenues of $25 million to theamount of costs incurred to replace pipe, reducing the amount recov-ered from customers under the PRP. The timing of replacements wassubsequently specified in an amendment to the PRP stipulation.
This amendment, which was approved by the Georgia Com-mission on December 20, 2005, requires Atlanta Gas Light to replacethe remaining 152 miles of cast iron pipe and 70% of the remaining687 miles of bare steel pipe by December 2010. The remaining 30%of bare steel pipe is required to be replaced by December 2013. Theamendment requires an evaluation by Atlanta Gas Light and the Georgia Commission staff of 22 miles of 24-inch pipe in Atlanta byDecember 2010 to determine if such pipe requires replacement. If replacement of this pipe is required, the pipe must be replaced byDecember 2013. The additional cost to replace this pipe is projectedto be approximately $37 million.
The Settlement Agreement includes a provision that allows fora true-up of any over- or under-recovery of PRP revenues that mayresult from a difference between PRP charges collected through fixedrates and actual PRP revenues recognized through the remainder ofthe program.
Atlanta Gas Light will be allowed under the Settlement Agree-ment to recover through the PRP $4 million of the $32 million in cap-ital costs associated with its March 2005 purchase of 250 miles ofpipeline in central Georgia from Southern Natural Gas Company(SNG), a subsidiary of El Paso Corporation. We expect the acquiredpipeline to improve deliverable capacity and reliability of the storagecapacity from our LNG facility in Macon to our markets in Atlanta. Theremaining capital costs are included in Atlanta Gas Light’s rate baseand collected through base rates.
Straight-Fixed-Variable Rates Atlanta Gas Light’s revenueis recognized under a straight-fixed-variable rate design wherebyAtlanta Gas Light charges rates to its customers based primarily onmonthly fixed charges. This mechanism minimizes the seasonality ofrevenues since the fixed charge is not volumetric and the monthlycharges are not set to be directly weather dependent. Weather indi-rectly influences the number of customers that have active accountsduring the heating season, and this has a seasonal impact on Atlanta
AGL Resources Inc.
MD&A

Management’s Discussion and Analysis of Financial Condition and Results of Operations
33
Gas Light’s revenues since generally more customers are connectedin periods of colder weather than in periods of warmer weather.
Elizabethtown Gas This natural gas local distribution utility oper-ates distribution systems and related facilities in central and north-western New Jersey. Most Elizabethtown Gas customers are locatedin densely populated central New Jersey, where increases in the num-ber of customers primarily result from conversions to gas heating from alternative forms of heating. In the northwestern region of thestate, customer additions are driven primarily by new construction.Elizabethtown Gas is regulated by the New Jersey Board of PublicUtilities (NJBPU).
Weather Normalization The Elizabethtown Gas tariff con-tains a weather normalization clause that is designed to help stabilizeElizabethtown Gas results by increasing base rate amounts chargedto customers when weather is warmer than normal and decreasingamounts charged when weather is colder than normal. The weathernormalization clause was renewed in October 2004 and is based ona 20-year average of weather conditions.
Pipeline Replacement In April 2005, Elizabethtown Gas pre-sented the NJBPU with a proposal to accelerate the replacement ofapproximately 88 miles of 8˝ to 12˝ diameter elevated-pressure castiron pipe. Under the proposal, approximately $42 million in estimatedcapital costs incurred over a three-year period would be recoveredthrough a pipeline replacement rider similar to the program in effectat Atlanta Gas Light. If the program as proposed is approved, costrecovery would occur on a one-year lag basis, with collections start-ing on October 1, 2006 and extending through December 31, 2009,after which time the program would be rolled into base rates. OnDecember 7, 2005, Elizabethtown Gas filed testimony in support ofits proposal. The proposal and related testimony will be considered inthe following timeframe:
▪ The New Jersey Rate Payer Advocate will file testimony on Febru-ary 28, 2006.
▪ Elizabethtown Gas will file rebuttal testimony on March 17, 2006.▪ Public hearings will convene on March 30, 2006.
Virginia Natural Gas This natural gas local distribution utility oper-ates distribution systems and related facilities in southeastern Virginia.Virginia Natural Gas is regulated by the Virginia State CorporationCommission (Virginia Commission).
Performance-based Rates In March 2005, the VirginiaCommission staff issued a report alleging that Virginia Natural Gasrates were excessive and that its rates should be adjusted to producea $15 million reduction in revenue. The staff also filed a motionrequesting that Virginia Natural Gas rates be declared interim andsubject to refund.
In April 2005, Virginia Natural Gas responded to the staff’sreport and motion, contesting the allegations in the report and object-ing to the motion filed by the staff. On April 29, 2005, the VirginiaCommission ordered the staff’s motion to be held in abeyance anddirected Virginia Natural Gas to file a rate case by July 2005.
In July 2005, Virginia Natural Gas filed a performance-basedrate (PBR) plan with the Virginia Commission and included the sched-ules required for a general rate case in support of its proposal. Underthe PBR plan, Virginia Natural Gas proposes to freeze base rates attheir 1996 levels for 5 additional years. This would provide VirginiaNatural Gas customers an additional 5 years of rate stability, for a totalof 14 years without a rate increase. If the Virginia Commissionapproves the proposal, Virginia Natural Gas will become the first Virginia natural gas utility to operate under a 1996 state law thatauthorized PBR plans for natural gas utilities. Consistent with statelaw, Virginia Natural Gas has proposed two exceptions that allow foradjustments to frozen base rates. Virginia Natural Gas could requesta rate adjustment in connection with (1) any changes in taxation ofgas utility revenues by the Commonwealth and (2) any financial dis-tress of Virginia Natural Gas beyond its control.
Based on the Virginia Commission’s scheduling order issued onJuly 14, 2005, current rates will stay in effect until the PBR is decided;consequently, there was no impact on Virginia Natural Gas’ 2005 rev-enues. Based on this scheduling order and the Virginia Commission’sapproval of requests for extension made by the Virginia Commissionstaff in December 2005, the PBR proposal to freeze rates for anotherfive years will be considered on the following timeframe:
▪ Virginia Commission staff filed its testimony and exhibits on Janu-ary 24, 2006 and requested a $10 million rate decrease.
▪ Virginia Natural Gas filed rebuttal testimony and exhibits on Febru-ary 7, 2006.
▪ Public evidentiary hearings will convene on February 21, 2006.
AGL Resources Inc.

34
The Virginia state law authorizing PBR plans also allows a util-ity to withdraw or modify its PBR application at any time prior to a finalruling by the Virginia Commission. Virginia Natural Gas is currentlyevaluating the withdrawal or modification of its PBR plan in light ofcurrent market conditions including rising interest rates, tight naturalgas supplies, rising costs and material constraints caused by loweroil supplies. If the PBR plan is not approved or is modified by the Virginia Commission in a manner that Virginia Natural Gas choosesnot to accept, the Virginia Commission can take action in the generalrate case filing. Virginia Natural Gas’ proposal would not affect its Virginia Commission–authorized purchased gas cost, which passesgas commodity costs through to consumers.
On January 12, 2006, Virginia Natural Gas filed with the VirginiaCommission a proposed motion for approval of Virginia Natural Gas’PBR plan. If the proposed motion is approved, the PBR plan wouldbe implemented as filed and Virginia Natural Gas would commit tocertain actions, primarily to construct a pipeline that would connectVirginia Natural Gas’ northern system to its southern system. Partic-ipants in and supporters of the proposed motion include Virginia Natural Gas; AGL Resources; the Virginia Office of the Attorney General—Division of Consumer Counsel; and the Virginia IndustrialGas Users’ Association. On February 3, 2006, the Virginia Commis-sion’s hearing examiner recommended that the Virginia Commissionapprove the PBR plan. Accordingly, the rate case schedule remainsas previously stipulated.
Weather Normalization Adjustment (WNA) In September2002, the Virginia Commission approved a WNA program as a two-year experiment involving the use of special rates. The WNA pro-gram’s purpose is to reduce the effect of weather on customer billsby reducing bills when winter weather is colder than normal andincreasing bills when winter weather is warmer than normal. In Sep-tember 2004, Virginia Natural Gas received approval from the VirginiaCommission to extend the WNA program for an additional two yearswith certain modifications to the existing program. The significantmodifications include removal of the commercial class of customersfrom the WNA program and the use of a rolling 30-year average tocalculate the weather factor that is updated annually.
Florida City Gas This natural gas local distribution utility operatesdistribution systems and related facilities in central and southernFlorida. Florida City Gas customers purchase gas primarily for heat-ing water, drying clothes and cooking. Some customers, mainly in central Florida, also purchase gas to provide space heating duringthe winter season. Florida City Gas is regulated by the Florida PublicService Commission.
Chattanooga Gas This natural gas local distribution utility oper-ates distribution systems and related facilities in the Chattanooga andCleveland areas of southeastern Tennessee. Chattanooga Gas’ baserates include a weather normalization clause that allows for revenueto be recognized based on a factor derived from average tempera-tures over a 30-year period, which offsets the impact of unusually coldor warm weather on its operating income. Chattanooga Gas is regu-lated by the Tennessee Regulatory Authority (Tennessee Authority).
Base Rate Increase In June 2005, the Tennessee Authorityupheld its previous October 2004 order denying Chattanooga Gas a $4 million rate increase. The October 2004 order approved anincrease of approximately $1 million based on a 10.2% return onequity and a capital structure of 35.5% common equity.
Elkton Gas This natural gas local distribution utility operates distri-bution systems and related facilities serving approximately 5,800 cus-tomers in Cecil County, Maryland. Elkton Gas customers areapproximately 7% commercial and industrial and 93% residential. Elkton Gas is regulated by the Maryland Public Service Commission.
AGL Resources Inc.
MD&A

Management’s Discussion and Analysis of Financial Condition and Results of Operations
35
Results of Operations The following table presents results of oper-ations for distribution operations for the years ended December 31,2005, 2004 and 2003.
In millions 2005 2004 2003
Operating revenues $1,753 $1,111 $936Cost of gas 939 471 337Operating margin 814 640 599Operation and maintenance 372 286 261Depreciation and amortization 114 85 81Taxes other than income taxes 32 23 24
Total operating expenses 518 394 366Gain on sale of Caroline Street campus — — 21Operating income 296 246 254Donation to private foundation — — (8)Other income 3 1 1
EBIT $ 299 $ 247 $247
Metrics1
Average end-use customers (in thousands) 2,242 1,880 1,838
Operation and maintenance expenses per customer $166 $152 $142
EBIT per customer2 $133 $131 $127Throughput (in millions of dekatherms)
Firm 234 194 190Interruptible 120 105 109
Total 354 299 299Heating degree days3:
Florida 698 239 —Georgia 2,726 2,589 2,654Maryland 5,004 860 —New Jersey 5,017 873 —Tennessee 3,115 3,010 3,168Virginia 3,465 3,214 3,264
1 2004 metrics include only December for Florida City Gas, Elizabethtown Gas and Elkton Gas.2 Excludes the gain on the sale of our Caroline Street campus in 2003.3 We measure effects of weather on our businesses using “degree days.” The measure of degree days for
a given day is the difference between average daily actual temperature and a baseline temperature of
65 degrees Fahrenheit. Heating degree days result when the average daily actual temperature is less than
the 65-degree baseline. Generally, increased heating degree days result in greater demand for gas on our
distribution systems.
2005 compared to 2004 EBIT increased $52 million or 21%reflecting an increase in operating margin of $174 million, partially off-set by increased operating expenses of $124 million. The businessesacquired from NUI on November 30, 2004 contributed approximately$50 million of EBIT in 2005 compared to $7 million in 2004. This wasdue to the full-year inclusion of the NUI results in 2005 comparedto one month in 2004.
The $174 million or 27% increase in operating margin was primarily due to the addition of NUI’s operations, which contributed$167 million. The remainder was primarily due to $8 million of higheroperating margin at Atlanta Gas Light. The increase at Atlanta GasLight resulted primarily from higher PRP revenues of $6 million andhigher revenue of $3 million from additional carrying charges for gasstored for Marketers primarily due to higher gas prices. Atlanta GasLight also had approximately $3 million of increased operating mar-gin from net customer growth, which offset a $3 million decrease inoperating revenues that resulted from the June 2005 SettlementAgreement with the Georgia Commission. Operating margin at Virginia Natural Gas and Chattanooga Gas remained relatively flatcompared to last year.
The $124 million or 31% increase in operating expenses primar-ily reflected the addition of NUI’s operations that increased operatingexpenses by $125 million.
2004 compared to 2003 There was no change in distributionoperations’ EBIT from 2003; however, the 2003 results included a pretax gain of $21 million on the sale of our Caroline Street campus,offset by an $8 million donation to AGL Resources Private Foundation,Inc. Exclusive of the gain and donation, EBIT in 2004 increased $13 million or 5% due to increased operating margin, partially offset byincreased operating expenses.
The $41 million or 7% increase in operating margin from 2003included $17 million in combined increases at Atlanta Gas Light andVirginia Natural Gas. The increase in Atlanta Gas Light’s operating mar-gin was primarily due to higher PRP revenue as a result of continuedPRP capital spending, customer growth, higher customer usage andadditional carrying charges from gas stored for Marketers due to ahigher average cost of gas. The increase in operating margin at VirginiaNatural Gas was primarily due to customer growth. The acquisitionof NUI added $24 million of operating margin primarily from NUI’sDecember operations of Elizabethtown Gas and Florida City Gas.
Operating expenses increased $28 million or 8% from 2003.This was due primarily to the addition of NUI operations for the month
AGL Resources Inc.

36
of December of $17 million. The remaining increase of $11 million wasdue to increases in the cost of outside services related to increasedinformation technology services as a result of our ongoing implemen-tation of a work management system; increased legal services dueto increased regulatory activity; and increased accounting servicesrelated to our implementation of SOX 404. Employee benefit and com-pensation expenses also increased primarily as a result of higher healthcare insurance costs and increased long-term compensationexpenses. In addition, depreciation expenses increased primarily dueto new depreciation rates implemented at Virginia Natural Gas andincreased assets at each utility. These increases were partially offset bya reduction in bad debt expense, primarily due to a Tennessee Author-ity ruling that allowed for recovery of the gas portion of accounts writ-ten off as uncollectible at Chattanooga Gas and increased collectionefforts at both Chattanooga Gas and Virginia Natural Gas.
Retail Energy Operations
Our retail energy operations segment consists of SouthStar, a jointventure owned 70% by our subsidiary, Georgia Natural Gas Com-pany, and 30% by Piedmont. SouthStar markets natural gas andrelated services to retail customers on an unregulated basis, prin-cipally in Georgia.
The SouthStar executive committee, which acts as the govern-ing board, comprises six members, with three representatives fromus and three from Piedmont. Under the joint venture agreement, allsignificant management decisions require the unanimous approval ofthe SouthStar executive committee; accordingly, our 70% financialinterest is considered to be noncontrolling. Although our ownershipinterest in the SouthStar partnership is 70%, SouthStar’s earnings areallocated 75% to us and 25% to Piedmont, under an amended andrestated joint venture agreement executed in March 2004.
Beginning January 1, 2004, we consolidated the accounts ofSouthStar and eliminated all intercompany balances in the consolida-tion. We recorded the portion of SouthStar’s earnings that are attrib-utable to our joint venture partner, Piedmont, as a minority interest inour statements of consolidated income, and we recorded Piedmont’sportion of SouthStar’s capital as a minority interest in our consolidatedbalance sheets.
Competition SouthStar competes with other energy marketers,including Marketers in Georgia, to provide natural gas and relatedservices to customers in Georgia and the Southeast. Based on its market share, SouthStar is the largest Marketer of natural gas in Georgia, with average customers in 2003 through 2005 in excessof 530,000.
In addition, similar to distribution operations, SouthStar facescompetition based on customer preferences for natural gas com-pared to other energy products and the comparative prices of thoseproducts. SouthStar’s principal competition relates to electric utilitiesand the potential displacement or replacement of natural gas appli-ances with electric appliances. This competition with other energyproducts has been exacerbated by price volatility in the wholesalenatural gas commodity market, which has resulted in significantincreases in the cost of natural gas billed to SouthStar’s customers.
Operating Margin SouthStar generates its operating margin pri-marily in two ways. The first is through the sale of natural gas to retailcustomers in the residential, commercial and industrial sectors, primar-ily in Georgia. SouthStar captures a spread between wholesale andretail natural gas prices and also realizes a portion of its operating mar-gin through the collection of a monthly service fee and customer latepayment fees. SouthStar’s operating margins are impacted by weatherseasonality as well as by customer growth and SouthStar’s relatedmarket share in Georgia, which traditionally ranges from 35% to 38%.SouthStar employs a strategy to attract and retain a higher-quality cus-tomer base through the application of stringent credit requirements.This strategy results not only in higher operating margin contributions,as customers tend to utilize higher volumes of natural gas, but also inhigher EBIT through a reduction in bad debt expenses.
The second way in which SouthStar generates margin isthrough the optimization of storage and transportation assets.Through its hedging transactions and derivative instruments aimed at managing exposures arising from changing commodity prices,SouthStar utilizes natural gas storage transactions to profit from nat-ural gas pricing differences that occur over time. SouthStar does nothold speculative derivative instruments.
SouthStar is actively seeking to improve its margin-generatingcapabilities by evaluating a number of growth opportunities, includingincremental customer growth in Georgia and expansion of its retailmodel to other markets, through either organic growth or acquisitionof an existing customer portfolio.
AGL Resources Inc.
MD&A
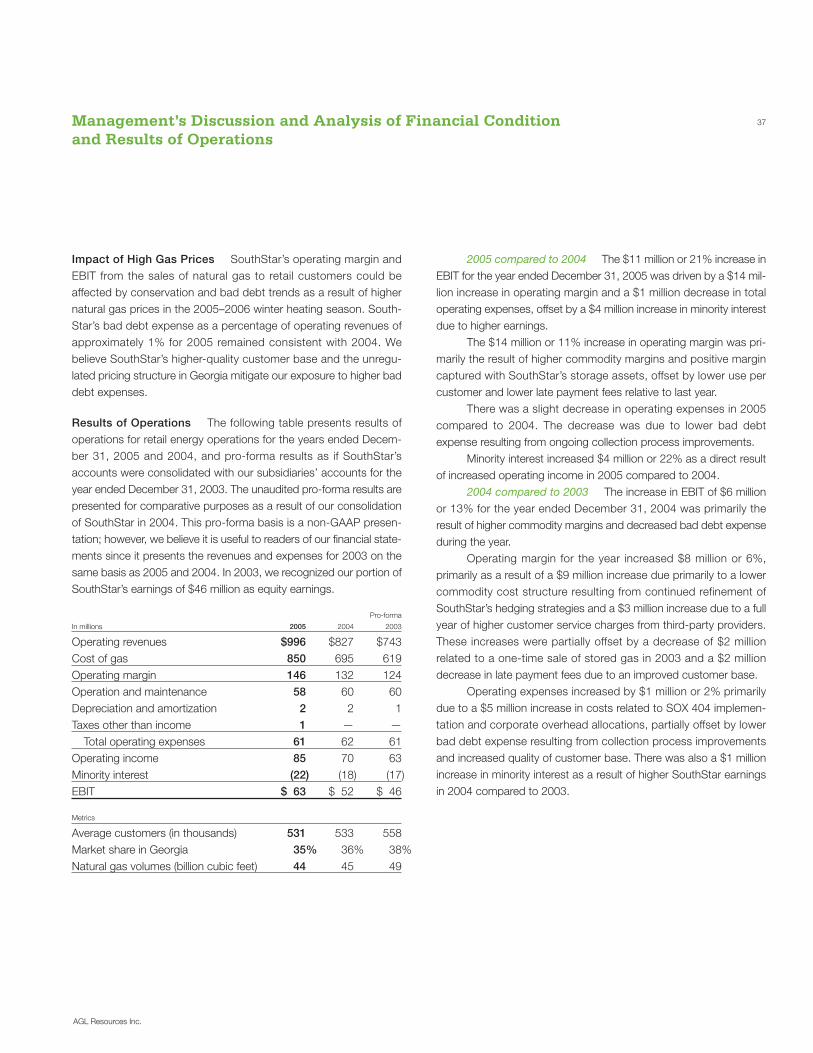
Management’s Discussion and Analysis of Financial Condition and Results of Operations
37
Impact of High Gas Prices SouthStar’s operating margin andEBIT from the sales of natural gas to retail customers could beaffected by conservation and bad debt trends as a result of highernatural gas prices in the 2005–2006 winter heating season. South-Star’s bad debt expense as a percentage of operating revenues ofapproximately 1% for 2005 remained consistent with 2004. Webelieve SouthStar’s higher-quality customer base and the unregu-lated pricing structure in Georgia mitigate our exposure to higher baddebt expenses.
Results of Operations The following table presents results ofoperations for retail energy operations for the years ended Decem-ber 31, 2005 and 2004, and pro-forma results as if SouthStar’saccounts were consolidated with our subsidiaries’ accounts for theyear ended December 31, 2003. The unaudited pro-forma results arepresented for comparative purposes as a result of our consolidationof SouthStar in 2004. This pro-forma basis is a non-GAAP presen-tation; however, we believe it is useful to readers of our financial state-ments since it presents the revenues and expenses for 2003 on thesame basis as 2005 and 2004. In 2003, we recognized our portion ofSouthStar’s earnings of $46 million as equity earnings.
Pro-forma
In millions 2005 2004 2003
Operating revenues $996 $827 $743Cost of gas 850 695 619Operating margin 146 132 124Operation and maintenance 58 60 60Depreciation and amortization 2 2 1Taxes other than income 1 — —
Total operating expenses 61 62 61Operating income 85 70 63Minority interest (22) (18) (17)EBIT $ 63 $ 52 $ 46
Metrics
Average customers (in thousands) 531 533 558Market share in Georgia 35% 36% 38%Natural gas volumes (billion cubic feet) 44 45 49
2005 compared to 2004 The $11 million or 21% increase inEBIT for the year ended December 31, 2005 was driven by a $14 mil-lion increase in operating margin and a $1 million decrease in totaloperating expenses, offset by a $4 million increase in minority interestdue to higher earnings.
The $14 million or 11% increase in operating margin was pri-marily the result of higher commodity margins and positive margincaptured with SouthStar’s storage assets, offset by lower use percustomer and lower late payment fees relative to last year.
There was a slight decrease in operating expenses in 2005compared to 2004. The decrease was due to lower bad debtexpense resulting from ongoing collection process improvements.
Minority interest increased $4 million or 22% as a direct resultof increased operating income in 2005 compared to 2004.
2004 compared to 2003 The increase in EBIT of $6 millionor 13% for the year ended December 31, 2004 was primarily theresult of higher commodity margins and decreased bad debt expenseduring the year.
Operating margin for the year increased $8 million or 6%, primarily as a result of a $9 million increase due primarily to a lowercommodity cost structure resulting from continued refinement ofSouthStar’s hedging strategies and a $3 million increase due to a fullyear of higher customer service charges from third-party providers.These increases were partially offset by a decrease of $2 millionrelated to a one-time sale of stored gas in 2003 and a $2 milliondecrease in late payment fees due to an improved customer base.
Operating expenses increased by $1 million or 2% primarilydue to a $5 million increase in costs related to SOX 404 implemen-tation and corporate overhead allocations, partially offset by lower bad debt expense resulting from collection process improvementsand increased quality of customer base. There was also a $1 millionincrease in minority interest as a result of higher SouthStar earningsin 2004 compared to 2003.
AGL Resources Inc.

38
Wholesale Services
Wholesale services consists of Sequent, our subsidiary involved inasset management, transportation, storage, producer and peakingservices and wholesale marketing. Our asset management businessfocuses on capturing economic value from idle or underutilized nat-ural gas assets, which are typically amassed by companies via invest-ments in or contractual rights to natural gas transportation andstorage assets. Margin is typically created in this business by partic-ipating in transactions that balance the needs of varying markets andtime horizons.
Sequent provides its customers in the eastern and mid-continental United States with natural gas from the major producingregions and market hubs in the country. Sequent also purchasestransportation and storage capacity to meet its delivery requirementsand customer obligations in the marketplace. Sequent’s customersbenefit from its logistics expertise and ability to deliver natural gas atprices that are advantageous relative to other alternatives available toits end-use customers.
Asset Management Transactions Our asset management customers include our own utilities, nonaffiliated utilities, municipal util-ities and large industrial customers. These customers must independ-ently contract for transportation and storage services to meet theirdemands, and they typically contract for these services on a 365-daybasis even though they may only need a portion of these services tomeet their peak demands. Sequent enters into agreements with thesecustomers, through either contract assignment or agency arrange-ment, whereby it uses their rights to transportation and storage serv-ices during periods when they do not need them. Sequent capturesmargin by optimizing the purchase, transportation, storage and saleof natural gas, and Sequent typically either shares profits with cus-tomers or pays them a fee for using their assets.
In April 2005, Sequent commenced asset management respon-sibilities for Elizabethtown Gas, Florida City Gas and Elkton Gas. InOctober 2005, the agreement between Sequent and Virginia NaturalGas was renewed for an additional three years. The agreement wasscheduled to expire in October 2005. In January 2006, the GeorgiaCommission extended the asset management agreement betweenSequent and Atlanta Gas Light for two additional years. The agree-ment was scheduled to expire in March 2006. Under the terms of theextended agreement, Sequent will increase its aggregate net sharingpercentage paid to Atlanta Gas Light from 50% to 60% on the major-ity of transactions Sequent will initiate going forward in its role as assetmanager. The following table provides additional information onSequent’s asset management agreements with its affiliated utilities.
AGL Resources Inc.
MD&A
Duration of Type of fee % shared or Profit-sharing /fees payments
Dollars in millions contract (in years) Expiration date structure annual fee 2005 2004 2003
Elkton Gas 2 March 2007 Fixed-fee (A) $— $— $—Chattanooga Gas 3 March 2007 Profit-sharing 50% 2 1 —Atlanta Gas Light 2 March 2008 Profit-sharing 60% 4 4 3Elizabethtown Gas 3 March 2008 Fixed-fee $4 — — —Florida City Gas 3 March 2008 Profit-sharing 50% — — —Virginia Natural Gas 3 March 2009 Profit-sharing (B) 5 3 5(A) Annual fixed fee is less than $1 million.
(B) Sharing is based on a tiered sharing structure.

Management’s Discussion and Analysis of Financial Condition and Results of Operations
39
Transportation and Storage Transactions In our wholesale mar-keting and risk management business, Sequent also contracts fornatural gas transportation and storage services. We participate intransactions to manage the natural gas commodity and transporta-tion costs that result in the lowest cost to serve our various markets.We seek to optimize this process on a daily basis, as market condi-tions change, by evaluating all the natural gas supplies, transporta-tion alternatives and markets to which we have access and identifyingthe least-cost alternatives to serve our various markets. This enablesus to capture geographic pricing differences across these variousmarkets as delivered gas prices change.
In a similar manner, we participate in natural gas storage trans-actions where we seek to identify pricing differences that occur overtime with regard to future delivery periods at multiple locations. Wecapture margin by locking in the price differential between purchas-ing natural gas at the lowest future price and, in a related transaction,selling that gas at the highest future price, all within the constraints of our contracts. Through the use of transportation and storage services, we are able to capture margin through the arbitrage of geo-graphical pricing differences that occur over time.
Producer Services Our producer services business primarilyfocuses on aggregating natural gas supply from various small andmedium-sized producers located throughout the natural gas produc-tion areas of the United States, principally in the Gulf Coast region.We provide producers with certain logistical and risk managementservices that offer them attractive options to move their supply intothe pipeline grid. Aggregating volumes of natural gas from these pro-ducers allows us to provide markets to producers who seek a reliableoutlet for their natural gas production.
Peaking Services Sequent generates operating margin through,among other things, the sale of peaking services, which includesreceiving a fee from affiliated and nonaffiliated customers that guar-antees those customers will receive gas under peak conditions.Sequent incurs costs to support our obligations under these agree-ments, which are reduced in whole or in part as the matching obli-gations expire. We will continue to seek new peaking transactionsas well as work toward extending those that are set to expire.
Competition Sequent competes for asset management businesswith other energy wholesalers, often through a competitive biddingprocess. There has been significant consolidation of energy whole-sale operations, particularly among major gas producers. Financialinstitutions have also entered the marketplace. As a result, energywholesalers have become increasingly willing to place bids for assetmanagement transactions that are priced to capture market share.We expect this trend to continue in the near term, which could resultin downward pressure on the volume of transactions and the relatedmargins available in this portion of Sequent’s business.
Seasonality Fixed cost commitments are generally incurred evenlyover the year, while margins generated through the use of these assetsare generally greatest in the winter heating season and occasionally inthe summer due to peak usage by power generators in meeting airconditioning load. This increases the seasonality of our business, gen-erally resulting in higher margins in the first and fourth quarters.
Energy Marketing and Risk Management Activities We accountfor derivative transactions in connection with our energy market-ing activities on a fair value basis in accordance with Statement ofFinancial Accounting Standards (SFAS) No. 133, “Accounting forDerivative Instruments and Hedging Activities” (SFAS 133). We recordderivative energy commodity contracts (including both physical trans-actions and financial instruments) at fair value, with unrealized gainsor losses from changes in fair value reflected in our earnings in theperiod of change.
Sequent’s energy-trading contracts are recorded on an accrualbasis as required under the Emerging Issues Task Force (EITF) IssueNo. 02-03, “Issues Involved in Accounting for Contracts under EITFIssue No. 98-10, ‘Accounting for Contracts Involved in Energy Trading and Risk Management Activities’” (EITF 02-03) rescission ofEITF 98-10, unless they are derivatives that must be recorded at fairvalue under SFAS 133.
AGL Resources Inc.

40
As shown in the table below, Sequent recorded net unrealizedlosses related to changes in the fair value of derivative instruments utilized in its energy marketing and risk management activities of $30 million during 2005, and unrealized gains of $22 million during2004 and $1 million during 2003. The tables below illustrate the changein the net fair value of the derivative instruments and energy-tradingcontracts during 2005, 2004 and 2003 and provide details of the netfair value of contracts outstanding as of December 31, 2005.
In millions 2005 2004 2003
Net fair value of contracts outstanding at beginning of period $ 17 $ (5) $ 7
Cumulative effect of change in accounting principle — — (13)
Net fair value of contracts outstanding at beginning of period, as adjusted 17 (5) (6)
Contracts realized or otherwise settled during period (47) 11 2
Change in net fair value of contract gains (losses) 17 11 (1)
Net fair value of new contracts entered into during period — — —
Net fair value of contracts outstanding at end of period (13) 17 (5)
Less net fair value of contracts outstanding at beginning of period, as adjusted for cumulative effect of change in accounting principle 17 (5) (6)
Unrealized (loss) gain related to changes in the fair value of derivative instruments $(30) $22 $ 1
The sources of our net fair value at December 31, 2005 are as follows. The “prices actively quoted” category representsSequent’s positions in natural gas, which are valued exclusively usingNew York Mercantile Exchange, Inc. (NYMEX) futures prices. “Pricesprovided by other external sources” are basis transactions that rep-resent the cost to transport the commodity from a NYMEX deliverypoint to the contract delivery point. Our basis spreads are primarilybased on quotes obtained either directly from brokers or throughelectronic trading platforms.
Prices Prices provided by
In millions actively quoted other external sources
Mature through 2006 $ (3) $(14)Mature 2007–2008 3 —Mature 2009–2011 — 1
Total net fair value $— $(13)
Mark-to-market Versus Lower of Average Cost or Market
Sequent purchases natural gas for storage when the current marketprice it pays plus the cost for transportation and storage is less thanthe market price it could receive in the future. Sequent attempts tomitigate substantially all the commodity price risk associated with itsstorage portfolio. Sequent uses derivative instruments to reduce therisk associated with future changes in the price of natural gas.Sequent sells NYMEX futures contracts or other over-the-counterderivatives in forward months to substantially lock in the profit marginit will ultimately realize when the stored gas is actually sold.
Natural gas stored in inventory is accounted for differently thanthe derivatives Sequent uses to mitigate the commodity price riskassociated with its storage portfolio. The natural gas that Sequentpurchases and injects into storage is accounted for at the lower ofaverage cost or market. The derivatives that Sequent uses to mitigatecommodity price risk are accounted for at fair value and marked to market each period. The difference in accounting can result involatility in Sequent’s reported results, even though the expectedprofit margin is essentially unchanged from the date the transactionswere consummated.
Earnings Volatility and Price Sensitivity The market dynamicscreated by the two Gulf Coast hurricanes significantly impacted natural gas prices, primarily in the last five months of 2005. From June 30, 2005 to September 30, 2005, the forward NYMEX pricesthrough March 2006 increased on average approximately $6.10, or75%. From October 1, 2005 to December 31, 2005, the same pricesdecreased on average approximately $3.10, or 21%. These marketdynamics created significant market opportunities for Sequent, as itsstorage and transportation activities created increased economicvalue compared to 2004.
AGL Resources Inc.
MD&A

Management’s Discussion and Analysis of Financial Condition and Results of Operations
41
The accounting differences described above also impact thecomparability of Sequent’s period-over-period results, since changesin forward NYMEX prices do not increase and decrease on a con-sistent basis from year to year. During most of 2005, Sequent’sreported results were negatively impacted by increases in forwardNYMEX prices, which resulted in the recognition of unrealized losses.During 2004, the reported results were not as significantly impactedby changes in forward NYMEX prices. As a result, a comparison ofthe 2005 and 2004 reported results yielded an unfavorable varianceduring the first nine months of 2005; however, the majority of theseunrealized losses were recovered during the fourth quarter of 2005.
Storage Inventory Outlook The following table presents theNYMEX forward natural gas prices as of September 30, 2005 andDecember 31, 2005 for the period January 2006 through March2006, and reflects the prices at which Sequent could buy natural gasat the Henry Hub for delivery in the same time period. January 2006futures expired on December 28, 2005; however, they are included inthe table below as they coincide with the January 2006 storage with-drawals. The Henry Hub, located in Louisiana, is the largest central-ized point for natural gas spot and futures trading in the United States.NYMEX uses the Henry Hub as the point of delivery for its natural gasfutures contracts. Many natural gas marketers also use the HenryHub as their physical contract delivery point or their price benchmarkfor spot trades of natural gas.
NYMEX forward natural gas prices as of
Sep. 2005 Dec. 2005 $ change % change
January 2006 $14.77 $11.43 $(3.34) (23)%February 2006 14.51 11.23 (3.28) (23)%March 2006 14.04 11.36 (2.68) (19)%
Average $14.44 $11.34 $(3.10) (21)%
The forward NYMEX prices decreased on average 21% in thefourth quarter of 2005 due to warmer-than-normal weather in lateDecember 2005 and the diminishing effects of hurricanes Rita andKatrina in the fall of 2005. Sequent’s original economic profit marginwas unaffected by these changes in the NYMEX forward natural gasprices due to the hedging instruments that it has in place. However,the decline in NYMEX prices during the fourth quarter of 2005resulted in the recovery of previously reported unrealized losses asso-ciated with Sequent’s NYMEX contracts.
Sequent’s expected withdrawals from physical salt dome andreservoir storage are presented in the table below along with itsexpected gross margin. Sequent’s expected gross margin is net ofthe impact of regulatory sharing and reflects the amounts that wewould expect to realize in future periods based on the inventory with-drawal schedule and forward natural gas prices at December 31,2005. Sequent’s storage inventory is fully hedged with futures as itsNYMEX short positions are equal to the physical long positions, whichresults in an overall locked-in margin, timing notwithstanding.Sequent’s physical salt dome and reservoir volumes are presentedin increments of 10,000 million British thermal units (MMBtu).
Withdrawal schedule (in MMBtu) Expected gross
Physical salt dome Physical reservoir margin (in millions)1
January 2006 119 92 $ 5February 2006 149 212 6March 2006 16 252 5
Total 284 556 $161 After regulatory sharing.
The weighted average cost of natural gas in inventory was$9.76 for physical salt dome storage and $8.98 for physical reser-voir storage.
As noted above, Sequent’s inventory level and pricing as ofDecember 31, 2005 should result in a gross margin of approximately$16 million through March 2006 if all factors remain the same, butcould change if Sequent adjusts its daily injection and withdrawalplans in response to changes in market conditions in future months.
Credit Rating Sequent has certain trade and credit contracts thathave explicit credit rating trigger events in case of a credit ratingdowngrade. These rating triggers typically give counterparties theright to suspend or terminate credit if our credit ratings are down-graded to non–investment grade status. Under such circumstances,we would need to post collateral to continue transacting with someof our counterparties. Posting collateral would have a negative effecton our liquidity. If such collateral were not posted, our ability to con-tinue transacting with these counterparties would be impaired. If atDecember 31, 2005 our credit ratings had been downgraded tonon–investment grade, the required amounts to satisfy potential collateral demands under such agreements between Sequent and itscounterparties would have totaled $51 million.
AGL Resources Inc.

42
Results of Operations The following table presents results ofoperations for wholesale services for the years ended December 31,2005, 2004 and 2003.
In millions 2005 2004 2003
Operating revenues $95 $54 $41Cost of sales 3 1 1Operating margin 92 53 40Operation and maintenance 39 27 20Depreciation and amortization 2 1 —Taxes other than income 1 1 —Total operating expenses 42 29 20Operating income 50 24 20Other loss (1) — —EBIT $49 $24 $20
Metrics
Physical sales volumes (billion cubic feet/day) 2.17 2.10 1.75
2005 compared to 2004 The increase in EBIT of $25 millionor 104% in 2005 compared to 2004 was due to an increase in oper-ating margin of $39 million partially offset by an increase in operatingexpenses of $13 million.
Sequent’s operating margin increased by $39 million or 74%primarily due to the significant effects of the Gulf Coast hurricanesduring the third quarter of 2005 and lingering market disruptions andprice volatility throughout the fourth quarter. For the first nine monthsof the year, reported operating margin was similar to that of the prioryear, with quarterly decreases being offset by quarterly increases.However, during the third quarter of 2005, while we created substan-tial economic value by serving our customers during the storms, ourreported operating margin was negatively impacted by accountinglosses associated with our storage hedges as a result of increasesin forward natural gas prices of approximately $6 per MMBtu. Dur-ing the fourth quarter, natural gas prices continued to be volatile in theaftermath of the hurricanes and we were able to further optimize ourstorage and transportation positions at levels in excess of the prioryear. In addition, our previously reported hedge losses were partiallyrecovered during the fourth quarter as forward natural gas pricesdecreased approximately $3 per MMBtu.
Operating expenses increased by $13 million or 45% due to additional payroll associated with increased headcount andincreased employee incentive compensation costs driven bySequent’s operational and financial growth and depreciation expensein connection with Sequent’s new energy trading and risk manage-ment (ETRM) system, which was implemented during the fourth quar-ter of 2004.
2004 compared to 2003 EBIT increased $4 million or 20%from 2003 to 2004 due to a $13 million increase in operating mar-gin, partially offset by a $9 million increase in operating expenses.
Operating margin increased by $13 million or 33% primarilydue to increased volatility during the fourth quarter of 2004, whichprovided Sequent with seasonal trading, marketing, origination andasset management opportunities in excess of those experiencedduring the prior year. Also contributing to the increase were advan-tageous transportation values to the Northeast and new peaking andthird-party asset management transactions. Sequent’s sales volumesfor 2004 averaged 2.10 billion cubic feet per day, a 20% increasefrom the prior year. This increase resulted primarily from the addi-tion of new counterparties, increased presence in the midwesternand northeastern markets and continued growth in origination andasset management activities, as well as business generated due tothe market volatility experienced during the fourth quarter.
As a result of a decline in forward NYMEX prices, the 2004results reflected the recognition of unrealized gains associated with thefinancial instruments used to economically hedge Sequent’s inventoryheld in storage. If the forward NYMEX price in effect at December 1,2004 had also been in effect at December 31, 2004, based onSequent’s storage positions at December 31, 2004, Sequent’sreported EBIT would have been $19 million. At December 31, 2003,an increase in forward NYMEX prices resulted in the recognition ofmodest unrealized losses associated with inventory hedges.
Partially offsetting the improved fourth-quarter results waslower volatility during the second quarter of 2004 compared to thesame period in 2003, which compressed Sequent’s trading and mar-keting activities and the related margins within its transportation port-folio. In addition, Sequent’s weighted average cost of natural gasstored in inventory was $5.06 per MMBtu during the first quarter of2004 compared to $2.20 per MMBtu during the same period in 2003.This significant difference in cost resulted in reduced operating mar-gins period over period.
AGL Resources Inc.
MD&A

Management’s Discussion and Analysis of Financial Condition and Results of Operations
43
Operating expenses increased by $9 million or 45% due primar-ily to additional salary expense as a result of an increase in the num-ber of employees; additional costs for outside services related to thedevelopment and implementation of Sequent’s ETRM system; theimplementation of SOX 404; and increased corporate costs. In addi-tion, 2004 operating expenses reflected depreciation associated withthe recently implemented ETRM system.
Energy Investments
Pivotal Jefferson Island This wholly owned subsidiary operates asalt dome storage and hub facility in Louisiana, approximately eightmiles from the Henry Hub. The storage facility is regulated by theLouisiana Public Service Commission and by the FERC, which has limited regulatory authority over the storage and transportationservices. The facility consists of two salt dome gas storage cavernswith 10 million dekatherms (MMDth) of total capacity and about 7.2 MMDth of working gas capacity. The facility has approximately720,000 Dth/day withdrawal capacity and 360,000 Dth/day injec-tion capacity. Pivotal Jefferson Island provides for storage and hubservices through its direct connection to the Henry Hub via the SabinePipeline and its interconnection with seven other pipelines in the area.Our subsidiary Pivotal Energy Development (Pivotal Development) isresponsible for day-to-day operation of the facility. Pivotal JeffersonIsland is fully subscribed for the 2005–2006 winter period.
In October 2005, Pivotal Jefferson Island announced that it issoliciting customer interest, in the form of nonbinding bids for capac-ity, in a project that would expand Pivotal Jefferson Island’s salt domestorage facility by 175% from its current capacity of 7.2 MMDth to asmuch as 19.8 MMDth. The expansion under consideration includesthe development of a third and a fourth storage cavern at the facility,with each cavern having a working gas capacity of 6 MMDth. If thereis sufficient customer interest in the project, construction would beginin early 2006. We would expect to complete the third cavern by 2009and would expect the fourth cavern to be operational by 2011. Theexpansion project also includes expanding the number of pipelineinterconnections in order to enhance Pivotal Jefferson Island’s flexibil-ity with regard to storage capacity and deliverability. In February 2006,our Board of Directors approved the project and authorized it to go forward. We expect to spend up to approximately $160 million on theexpansion project. Pivotal Development’s engineering estimates and
the need to acquire equipment with appropriate specifications couldresult in increased costs and delays in the completion of the project.
Pivotal Jefferson Island’s competition is limited to other saltdome caverns in the Gulf Coast. We believe that Pivotal JeffersonIsland is uniquely situated with its direct connection to the Henry Huband its connection to seven other pipelines. For these reasons webelieve that Pivotal Jefferson Island will be subscribed ahead of mostof its competitors.
Pivotal Propane In 2005, this wholly owned subsidiary completedthe construction of a propane air facility in the Virginia Natural Gasservice area that provides up to 28,800 Dth of propane air per day ona 10-day-per-year basis to serve Virginia Natural Gas’ peaking needs.
AGL Networks This wholly owned subsidiary is a provider oftelecommunications conduit and dark fiber. AGL Networks leases andsells its fiber to a variety of customers in the Atlanta, Georgia andPhoenix, Arizona metropolitan areas, with a small presence in othercities in the United States. Its customers include local, regional andnational telecommunications companies, internet service providers,educational institutions and other commercial entities. AGL Networkstypically provides underground conduit and dark fiber to its customersunder leasing arrangements with terms that vary from 1 to 20 years. Inaddition, AGL Networks offers telecommunications construction serv-ices to companies. AGL Networks’ competitors are any entities thathave or will lay conduit and fiber on the same route as AGL Networksin the respective metropolitan areas.
Sale of Certain NUI Assets In August 2005, we sold our 50%interest in Saltville Gas Storage Company, LLC (Saltville) and associ-ated subsidiaries (Virginia Gas Pipeline and Virginia Gas Storage) to asubsidiary of Duke Energy Corporation, the other 50% partner in theSaltville joint venture. We acquired these nonutility assets as part ofour purchase of NUI in November 2004. We received $66 million incash at closing, which included $4 million in working capital adjust-ments, and used the proceeds to repay short-term debt and for othergeneral corporate purposes.
AGL Resources Inc.

44
Results of Operations The following table presents results ofoperations for energy investments for the years ended December 31,2005, 2004 and 2003.
In millions 2005 2004 2003
Operating revenues $56 $25 $ 6Cost of sales 16 12 1Operating margin 40 13 5Operation and maintenance 17 5 9Depreciation and amortization 5 2 1Taxes other than income 1 1 —Total operating expenses 23 8 10Operating income 17 5 (5)Other income 2 2 2EBIT $19 $ 7 $ (3)
2005 compared to 2004 The $12 million or 171% increasein EBIT in 2005 was primarily the result of increased operating marginof $27 million, offset by $15 million in higher operating expenses.
Of the $27 million or 208% increase in operating margin, $13 mil-lion resulted from Pivotal Jefferson Island; $8 million from NUI’s non-utility businesses; and $3 million from Pivotal Propane. AGL Networkscontributed $4 million primarily from growth both in recurring revenuesfrom fiber leasing activities of $1 million and in construction and newbusiness activities of $3 million.
Of the $15 million or 188% increase in operating expenses,$8 million resulted from NUI’s nonutility businesses, $3 million resultedfrom Pivotal Jefferson Island and $1 million resulted from PivotalPropane. AGL Networks’ operating expenses were relatively flat in2005 as compared to 2004.
2004 compared to 2003 The increase in EBIT of $10 millionwas primarily the result of $3 million from Pivotal Jefferson Island and$3 million from AGL Networks. The remaining increase of $4 millionwas from the sale of Heritage Propane Partners, L.P. and the sale ofa residential and retail development property in Savannah, Georgia inthe second quarter of 2004.
Operating margin for the year increased $8 million primarily asa result of the addition of Pivotal Jefferson Island’s $4 million of oper-ating margin and an operating margin increase at AGL Networks of$4 million due to increased revenue from a variety of customers.
Operating expenses decreased by $2 million or 20% primarilydue to decreased headcount at AGL Networks.
Corporate
Our corporate segment includes our nonoperating business units,including AGL Services Company (AGSC), AGL Capital Corporation(AGL Capital) and Pivotal Development. AGSC is a service companyestablished in accordance with the PUHCA. AGL Capital provides forour ongoing financing needs through a commercial paper program,the issuance of various debt and hybrid securities, and other financ-ing arrangements.
Pivotal Development coordinates, among our related operatingsegments, the development, construction or acquisition of assets inthe southeastern, mid-Atlantic and northeastern regions in order toextend our natural gas capabilities and improve system reliability while enhancing service to our customers in those areas. The focusof Pivotal Development’s commercial activities is to improve the economics of system reliability and natural gas deliverability in these targeted regions.
We allocate substantially all of AGSC’s and AGL Capital’s oper-ating expenses and interest costs to our operating segments inaccordance with the PUHCA and state regulations. Our corporatesegment also includes intercompany eliminations for transactionsbetween our operating business segments. Our EBIT results includethe impact of these allocations to the various operating segments.The acquisition of additional assets, such as NUI and Pivotal Jeffer-son Island, typically will enable us to allocate corporate costs acrossa larger number of businesses and, as a result, lower the relative allo-cations charged to those business units we owned prior to the acqui-sition of the new businesses.
AGSC Restructuring As a result of the NUI acquisition, the asso-ciated centralization of certain administrative and operational functionsand our ongoing desire to operate as efficiently as possible, webegan, during the first quarter of 2005, a review of certain functionswithin our AGSC subsidiary. We expect this process to be part of anongoing effort to optimize staffing levels and work processes acrossour entire company.
The effects of this effort were the restructuring of certain keycorporate functions and the elimination of filled and vacant positionswithin AGSC. We recorded a charge of $3 million in 2005, primarilyas a result of severance-related costs associated with the restruc-turing and elimination of the filled positions at AGSC. Based on effortsperformed to date, as well as actual costs incurred to date and our original basis for the earnings guidance previously provided, we
AGL Resources Inc.
MD&A

Management’s Discussion and Analysis of Financial Condition and Results of Operations
45
estimate the annual savings from these efforts to be in the range of$6 million to $10 million.
Results of Operations The following table presents results of oper-ations for our corporate segment for the years ended December 31,2005, 2004 and 2003.
In millions 2005 2004 2003
Payroll $ 57 $ 48 $ 48Benefits and incentives 34 32 32Outside services 43 29 19Taxes other than income 5 4 2Other 52 46 44Total operating expenses
before allocations 191 159 145Allocations to operating segments (185) (147) (139)Operating expenses 6 12 6Loss on asset disposed—
Caroline Street campus — — (5)Operating loss (6) (12) (11)Other losses (5) (4) (1)EBIT $ (11) $ (16) $ (12)
The corporate segment is a nonoperating segment. As such,changes in EBIT amounts for the indicated periods reflect the relativechanges in various general and administrative expenses, such as pay-roll, benefits and incentives and outside services.
2005 compared to 2004 The $5 million or 31% increase inEBIT for 2005 compared to 2004 was primarily due to decreasedoperating expenses of $6 million. These decreased costs were primar-ily due to merger- and acquisition-related costs incurred in 2004 butnot in 2005. With respect to total operating expenses before alloca-tions, payroll expenses in 2005 increased due to headcount in thecorporate segment resulting from the acquisition of NUI in Novemberof 2004 and the realignment and transfer of certain corporate func-tions to AGSC.
Outside services expenses increased primarily due to highercosts associated with process improvement projects in the informa-tion technology, finance and human resources areas.
Benefits and incentives increased primarily as a result of higher payroll-related expenses. In addition, severance expensesincreased as a result of the AGSC restructuring and process improve-ment initiatives.
2004 compared to 2003 The decrease in EBIT of $4 mil-lion or 33% for the year ended December 31, 2004 compared to thesame period in 2003 primarily was due to an increase in operatingexpenses of $6 million. The increase in operating expenses was primarily due to increased outside services costs associated with software maintenance; licensing and implementation of our workmanagement system project; higher costs due to our SOX 404 compliance efforts; merger- and acquisition-related expenses; andexpenses related to Pivotal Development’s activities in 2004. Theincrease in operating expenses was offset by a loss of $5 million onthe sale of our Caroline Street campus in 2003.
Liquidity and Capital Resources
To meet our capital and liquidity requirements we rely on operatingcash flow; short-term borrowings under our commercial paper pro-gram, which is backed by our supporting credit agreement (CreditFacility); borrowings under Sequent’s and SouthStar’s lines of credit;and borrowings or stock issuances in the long-term capital markets.Our issuance of various securities, including long-term and short-termdebt, is subject to customary approval or authorization by state andfederal regulatory bodies including state public service commissionsand, through February 8, 2006, the SEC. Furthermore, a substantialportion of our consolidated assets, earnings and cash flow is derivedfrom the operation of our regulated utility subsidiaries, whose legalauthority to pay dividends or make other distributions to us is subjectto regulation. The availability of borrowings under our Credit Facility islimited and subject to a total-debt-to-capital ratio financial covenantspecified within the Credit Facility, which we currently meet.
We believe these sources will be sufficient for our working cap-ital needs, debt service obligations and scheduled capital expendi-tures for the foreseeable future. The relatively stable operating cashflows of our distribution operations businesses currently contributemost of our cash flow from operations, and we anticipate this to con-tinue in the future.
We will continue to evaluate our need to increase our availableliquidity based on our view of working capital requirements, includingthe impact of changes in natural gas prices, liquidity requirementsestablished by the rating agencies and other factors. Additionally, our
AGL Resources Inc.

46
liquidity and capital resource requirements may change in the futuredue to a number of other factors, some of which we cannot control.These factors include
▪ the seasonal nature of the natural gas business and our resultingshort-term borrowing requirements, which typically peak duringcolder months
▪ increased gas supplies required to meet our customers’ needs during cold weather
▪ changes in wholesale prices and customer demand for our productsand services
▪ regulatory changes and changes in ratemaking policies of regula-tory commissions
▪ contractual cash obligations and other commercial commitments▪ interest rate changes▪ pension and postretirement funding requirements▪ changes in income tax laws
▪ margin requirements resulting from significant increases or decreasesin our commodity prices
▪ operational risks▪ the impact of natural disasters, including weather
Contractual Obligations and Commitments We have incurredvarious contractual obligations and financial commitments in the normal course of our operating and financing activities. Contractualobligations include future cash payments required under existing contractual arrangements, such as debt and lease agreements.These obligations may result both from general financing activities andfrom commercial arrangements that are directly supported by relatedrevenue-producing activities.
We calculate any required pension contributions using the pro-jected unit credit cost method. Under this method, we were notrequired to make any pension contribution in 2005, but we voluntar-ily made a $5 million contribution in August 2005. The following tableillustrates our expected future contractual obligations as of Decem-ber 31, 2005.
AGL Resources Inc.
MD&A
Payments due before December 31,
In millions Total 2006 2007 & 2008 2009 & 2010 2011 & thereafter
Interest charges on outstanding debt1 $1,870 $ 103 $201 $200 $1,366Pipeline charges, storage capacity and gas supply2,3 1,766 285 515 411 555Long-term debt4 1,615 — 2 2 1,611Short-term debt 522 522 — — —PRP costs5 265 30 72 95 68Operating leases6 160 27 44 33 56Commodity and transportation charges 129 30 19 14 66Environmental remediation costs5 97 13 27 53 4
Total $6,424 $1,010 $880 $808 $3,7261 Floating rate debt is based on the interest rate as of December 31, 2005 and the maturity of the underlying debt instrument.2 Charges recoverable through a PGA mechanism or alternatively billed to Marketers. Also includes demand charges associated with Sequent.3 A subsidiary of NUI entered into two 20-year agreements for the firm transportation and storage of natural gas during 2003 with annual aggregate demand charges of approximately $5 million. As a result of our acquisition
of NUI and in accordance with SFAS No. 141, “Business Combinations,” we valued the contracts at fair value. The $38 million allocated to accrued pipeline demand charges in our consolidated balance sheets as of
December 31, 2005 represents our estimate of the fair value of the acquired contracts. The liability will be amortized over the remaining lives of the contracts.4 Includes $232 million of notes payable to Trusts redeemable in 2006 and 2007.5 Includes charges recoverable through rate rider mechanisms.6 We have certain operating leases with provisions for step rent or escalation payments and certain lease concessions. We account for these leases by recognizing the future minimum lease payments on a straight-line basis
over the respective minimum lease terms, in accordance with SFAS No. 13, “Accounting for Leases.” However, this accounting treatment does not affect the future annual operating lease cash obligations as shown herein.

Management’s Discussion and Analysis of Financial Condition and Results of Operations
47
SouthStar has natural gas purchase commitments related to thesupply of minimum natural gas volumes to its customers. These com-mitments are priced on an index plus premium basis. At December 31,2005, SouthStar had obligations under these arrangements for 8 Bcffor the year ending December 31, 2006. This obligation is not includedin the above table. SouthStar also had capacity commitments relatedto the purchase of transportation rights on interstate pipelines.
We also have incurred various financial commitments in thenormal course of business. Contingent financial commitments rep-resent obligations that become payable only if certain predefinedevents occur, such as financial guarantees, and include the natureof the guarantee and the maximum potential amount of future pay-ments that could be required of us as the guarantor. The followingtable illustrates our expected contingent financial commitments as ofDecember 31, 2005.
Commitments due
before December 31,
In millions Total 2006 2007 & thereafter
Standby letters of credit, performance/surety bonds $21 $21 $—
Cash Flow from Operating Activities We prepare our statementof cash flows using the indirect method. Under this method, we rec-oncile net income to cash flows from operating activities by adjustingnet income for those items that impact net income but do not resultin actual cash receipts or payments during the period. These recon-ciling items include depreciation, undistributed earnings from equityinvestments, changes in deferred income taxes, gains or losses onthe sale of assets and changes in the consolidated balance sheetfor working capital from the beginning to the end of the period.
Year-over-year changes in our operating cash flows are attrib-utable primarily to working capital changes within our distributionoperations, wholesale services and retail energy operations segmentsresulting from the impact of weather, the price of natural gas, the tim-ing of customer collections, payments for natural gas purchases anddeferred gas cost recoveries.
We generate a large portion of our annual net income and sub-sequent increases in our accounts receivable in the first and fourthquarters of each year due to significant volumes of natural gas deliv-ered by distribution operations and SouthStar to our customers dur-ing the peak heating season. In addition, our natural gas inventories,which usually peak on November 1, are largely drawn down in theheating season and provide a source of cash as this asset is usedto satisfy winter sales demand.
During this period, our accounts payable increases to reflectpayments due to providers of the natural gas commodity and pipelinecapacity. The value of the natural gas commodity can vary significantlyfrom one period to the next as a result of the volatility in the price ofnatural gas. Our natural gas costs and deferred purchased naturalgas costs due from or to our customers represent the differencebetween natural gas costs that we have paid to suppliers in the pastand amounts that we have collected from customers. These naturalgas costs can cause significant variations in cash flows from periodto period.
In 2005, our net cash flow provided from operating activitieswas $78 million, a decrease of $209 million or 73% from the sameperiod last year. The decrease was primarily a result of increasedworking capital requirements including increased spending of $183 million for seasonal inventory injections in advance of the wintersales demand. We spent more on these injections in 2005 primarilybecause of higher natural gas prices due to the effects of the hurri-canes in the Gulf Coast region and of the full-year impact associ-ated with the purchase of natural gas for the utilities acquired inNovember 2004 from NUI, principally for Elizabethtown Gas. Thesehigher natural gas prices resulted in a 45% increase in the averagecost of our natural gas inventories.
Our operating cash flow of $287 million for 2004 includedSouthStar’s operating cash flow of approximately $79 million as a result of our consolidation of SouthStar effective January 1, 2004.In 2003 our operating cash flow only included amounts for cash dis-tributions from SouthStar, consistent with the equity method ofaccounting. Excluding SouthStar, our cash flow from operations for2004 was $208 million, an increase of $86 million from 2003. Year-to-year changes in our operating cash flow, excluding SouthStar, wereprimarily the result of increased earnings of $25 million and decreasedspending for injection and purchase of natural gas inventories of $63 million.
AGL Resources Inc.

48
Cash Flow from Investing Activities Our investing activities con-sisted primarily of property, plant and equipment (PP&E) expendituresin 2005, 2004 and 2003 and our acquisitions of NUI for $116 millionand Jefferson Island for $90 million in 2004. In 2003, our investingactivities included our cash payment of $20 million for the purchase ofDynegy Inc.’s 20% interest in SouthStar. The following table providesadditional information on our actual and estimated PP&E expenditures.
In millions 20061 2005 2004 2003
Construction or preservation of distribution facilities $110 $135 $ 64 $ 60
SNG pipeline — 32 — —PRP 30 48 95 45Pivotal Propane plant — — 29 —Pivotal Jefferson Island 36 8 2 —Telecommunications 3 1 5 8Other2 54 43 69 45
Total $233 $267 $264 $1581 Estimated.2 The amounts for other primarily include corporate information technology systems and infrastructure
expenditures.
The increase of $3 million or 1% in PP&E expenditures for 2005compared to 2004 was primarily due to the $32 million acquisitionof a 250-mile pipeline in Georgia from SNG and increased expendi-tures of $71 million for the construction of distribution facilities, includ-ing $27 million at Elizabethtown Gas and Florida City Gas, both ofwhich were acquired in November 2004. Also contributing to theincrease was $6 million of additional expenditures at Pivotal JeffersonIsland, which completed a project that improved its compressioncapabilities. These increases were offset by reduced PRP expendi-tures of $47 million due to the Settlement Agreement between AtlantaGas Light and the Georgia Commission that extended the programto 2013, reduced expenditures of $29 million at the Pivotal Propaneplant in Virginia as most of its construction expenditures were incurredlast year and reduced expenditures of $7 million at Sequent as itsETRM system was implemented in 2004.
Approximately 18% of our PP&E expenditures in 2005 includedcosts for the PRP, which are approved by the Georgia Commission.In the near term, the primary financial impact to us from the PRP isreduced cash flow from operating and investing activities, as the tim-ing related to cost recovery through Atlanta Gas Light’s base rates,which include an allowed rate of return on its PRP capital expendi-tures, does not match the timing related to costs incurred.
We expect our future PRP expenditures will primarily includelarger-diameter pipe than in prior years, the majority of which islocated in more densely populated areas. The following table providesmore information on our expected PRP expenditures.
Year Miles of pipe to be replaced Expenditures (in millions)
2006 95 $ 302007 107 352008 150 372009 154 452010–2013 333 118
Totals 839 $265
The increase of $106 million or 67% in PP&E expenditures for2004 compared to 2003 was primarily due to increased PRP expen-ditures of $50 million and our construction of the Virginia propaneplant by Pivotal Propane for $29 million. Also contributing to theincrease were $9 million of expenditures for the construction of theMacon peaking pipeline, $7 million for the ETRM system at Sequent,$2 million at Pivotal Jefferson Island and $3 million at SouthStar.
Cash Flow from Financing Activities Our financing activities areprimarily composed of borrowings and payments of short-term debt,payments of medium-term notes, borrowings of senior notes, distri-butions to minority interests, cash dividends on our common stockand the issuance of common stock. Our capitalization and financingstrategy is intended to ensure that we are properly capitalized with theappropriate mix of equity and debt securities. This strategy includesactive management by us of the percentage of total debt relative toour total capitalization, as well as the term and interest rate profile ofour debt securities.
AGL Resources Inc.
MD&A

Management’s Discussion and Analysis of Financial Condition and Results of Operations
49
We also work to maintain or improve our credit ratings on ourdebt to effectively manage our existing financing costs and enhanceour ability to raise additional capital on favorable terms. Factors weconsider important in assessing our credit ratings include our balancesheet leverage, capital spending, earnings, cash flow generation, avail-able liquidity and overall business risks. We do not have any triggerevents in our debt instruments that are tied to changes in our speci-fied credit ratings or our stock price and have not entered into anytransaction that would require us to issue equity based on credit rat-ings or other trigger events. As of February 2006, our senior unsecureddebt ratings are BBB+ from Standard & Poor’s Ratings Services (S&P),Baa1 from Moody’s Investors Service (Moody’s) and A- from Fitch Ratings (Fitch).
In July 2004 upon the announcement of our proposed acquisi-tion of NUI, S&P placed our credit ratings on CreditWatch with nega-tive implications, Moody’s affirmed our ratings but changed its ratingoutlook to negative from stable, and Fitch placed our credit ratingson Rating Watch Negative. Since the closing of the acquisition onNovember 30, 2004, S&P removed us from CreditWatch and changedour outlook to negative; Fitch took us off Rating Watch Negative andaffirmed our ratings with a stable outlook; and Moody’s changed ouroutlook to stable. S&P has indicated that the negative outlook is theresult of the execution risks in integrating the NUI acquisition.
Our credit ratings may be subject to revision or withdrawal atany time by the assigning rating organization, and each rating shouldbe evaluated independently of any other rating. We cannot ensurethat a rating will remain in effect for any given period of time or that arating will not be lowered or withdrawn entirely by a rating agency if,in its judgment, circumstances so warrant. If the rating agenciesdowngrade our ratings, particularly below investment grade, it maysignificantly limit our access to the commercial paper market and ourborrowing costs would increase. In addition, we would likely berequired to pay a higher interest rate in future financings, and ourpotential pool of investors and funding sources would decrease.
Our debt instruments and other financial obligations includeprovisions that, if not complied with, could require early payment,additional collateral support or similar actions. Our most importantdefault events include maintaining covenants with respect to maxi-mum leverage ratio, insolvency events, nonpayment of scheduledprincipal or interest payments, and acceleration of other financial obligations and change of control provisions. Our Credit Facility’sfinancial covenant requires us to maintain a ratio of total debt to totalcapitalization of no greater than 70%; however, our goal is to main-tain this ratio at levels between 50% and 60% of debt to total capital-ization. We are currently in compliance with all existing debt provisionsand covenants. For more information on our debt, see Note 9.
We believe that accomplishing these capitalization objectivesand maintaining sufficient cash flow are necessary to maintain ourinvestment-grade credit ratings and to allow us access to capital atreasonable costs. The components of our capital structure, as of thedates indicated, are summarized in the following table.
Dollars in millions Dec. 31, 2005 Dec. 31, 2004
Short-term debt $ 522 14% $ 334 10%Long-term debt1 1,615 45 1,623 49
Total debt 2,137 59 1,957 59Common shareholders’ equity 1,499 41 1,385 41
Total capitalization $3,636 100% $3,342 100%1 Net of interest rate swaps.
Short-term debt Our short-term debt is composed of bor-rowings under our commercial paper program, Sequent’s lines ofcredit, SouthStar’s line of credit and the current portion of our capi-tal leases. Our short-term debt financing generally increases betweenJune and December because our payments for natural gas andpipeline capacity are generally made to suppliers prior to the collec-tion of accounts receivable from our customers. We typically reduceshort-term debt balances in the spring because a significant portionof our current assets are converted into cash at the end of the win-ter heating season.
AGL Resources Inc.

50
Our Credit Facility was amended in August 2005. Under theterms of the amendment, the term of the Credit Facility was extendedto August 31, 2010. The aggregate principal amount available underthe amended Credit Facility was increased to $850 million, with anoption to increase the aggregate cumulative principal amount avail-able for borrowing to $1.1 billion on not more than three occasionsduring each calendar year. The increased capacity under our CreditFacility increases our ability to borrow under our commercial paperprogram. Our total cash and available liquidity under our Credit Facilityas of the dates indicated are represented in the table below.
In millions Dec. 31, 2005 Dec. 31, 2004
Unused availability under the Credit Facility $850 $750Cash and cash equivalents 30 49Total cash and available liquidity
under the Credit Facility $880 $799
As of December 31, 2005 and 2004, we had no outstandingborrowings under the Credit Facility. However, the availability of bor-rowings and unused availability under our Credit Facility is limited andsubject to conditions specified within the Credit Facility, which we cur-rently meet. These conditions include
▪ maintaining a ratio of total debt to total capitalization of no greater than 70%
▪ the continued accuracy of representations and warranties containedin the agreement
In June 2005, Sequent’s existing $25 million unsecured line ofcredit was extended to July 2006. In September 2005, Sequententered into an agreement for an additional $20 million unsecured lineof credit scheduled to expire in September 2006. These unsecuredlines of credit, which total $45 million, are used solely for the postingof margin deposits for NYMEX transactions, and are unconditionallyguaranteed by us. At December 31, 2005, there were no outstand-ing amounts under these lines of credit, which is an $18 milliondecrease from the same time in 2004.
In September 2005, Pivotal Utility Holdings, Inc. entered into anagreement for a $20 million unsecured line of credit to be used solelyfor the posting of margin deposits for Elizabethtown Gas’ natural gashedging program. The line expires in September 2006 and is uncon-ditionally guaranteed by us. There were no amounts outstandingunder this line of credit at December 31, 2005.
SouthStar’s $75 million line of credit provides the additionalworking capital needed to meet seasonal demands and is not guar-anteed by us. This line of credit is secured by various percentagesof its accounts receivable, unbilled revenue and inventory. The line ofcredit expires in April 2007 and bears interest at the prime rate and/orLondon Interbank Offered Rate (LIBOR) plus a margin based on certain financial measures. At December 31, 2005, the line of credithad an outstanding balance of $36 million. There were no amountsoutstanding under this facility at the same time in 2004.
In 2004, we repaid $500 million outstanding under NUI’s creditfacility. Upon the repayment of the outstanding amounts, we termi-nated NUI’s credit facility.
Long-term Debt In 2004, AGL Capital issued $250 million of 6% Senior Notes Due October 2034 and $200 million of 4.95%Senior Notes Due January 2015. We fully and unconditionally guar-antee the senior notes. The proceeds from the issuance were used torefinance a portion of our outstanding short-term debt under ourcommercial paper program.
During 2004, we also made $82 million in medium-term notepayments using proceeds from the borrowings under our commercialpaper program. For more information on our long-term debt, includ-ing the debt assumed in the NUI acquisition, see Note 9.
Interest Rate Swaps To maintain an effective capital struc-ture, it is our policy to borrow funds using a mix of fixed-rate debt andvariable-rate debt. We have entered into interest rate swap agree-ments for the purpose of hedging the interest rate risk associated withour fixed-rate and variable-rate debt obligation. At December 31,2005, including the effects of $100 million of interest rate swaps, 66%of our total short-term and long-term debt was fixed.
Refinancing of Gas Facility Revenue Bonds In April andMay 2005 we refinanced $67 million of our gas facility revenue bonds.For more information, see Note 9.
Minority Interest As a result of our consolidation of South-Star’s accounts effective January 1, 2004, we recorded Piedmont’sportion of SouthStar’s contributed capital as a minority interest inour consolidated balance sheets. Cash distributions of $19 million in2005 and $14 million in 2004 for SouthStar’s dividend distributions toPiedmont were recorded in our consolidated statement of cash flowsas a financing activity.
AGL Resources Inc.
MD&A
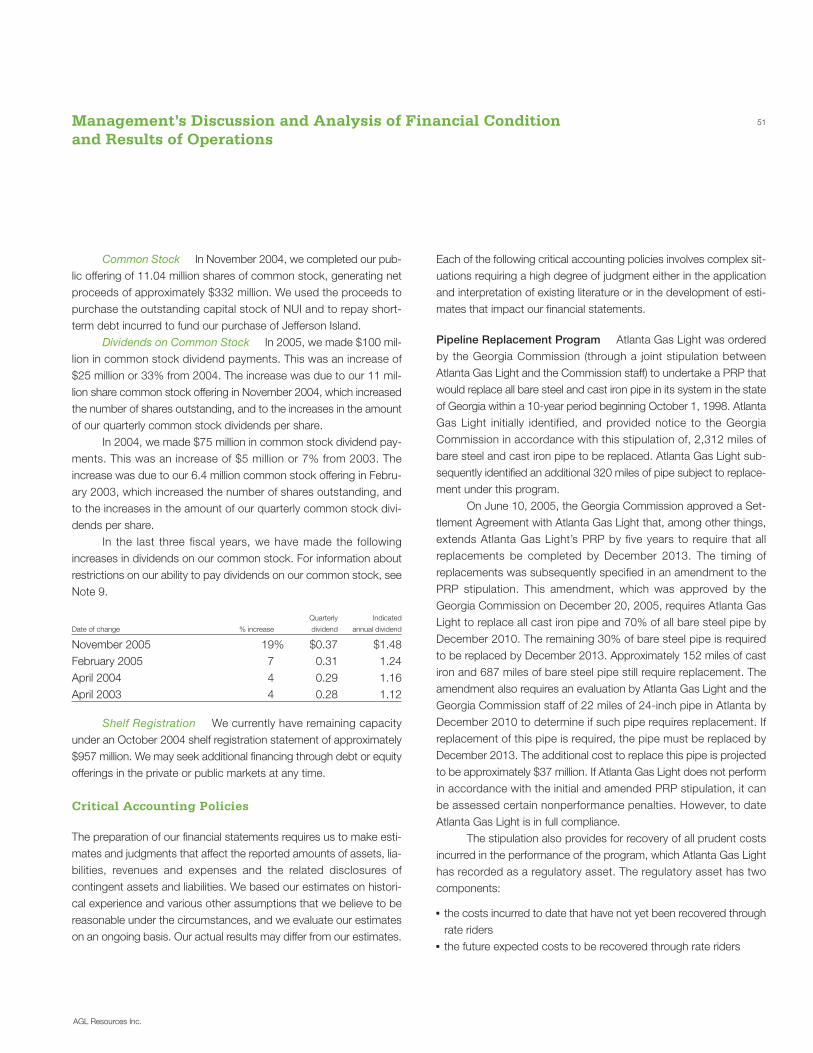
Management’s Discussion and Analysis of Financial Condition and Results of Operations
51
Common Stock In November 2004, we completed our pub-lic offering of 11.04 million shares of common stock, generating netproceeds of approximately $332 million. We used the proceeds topurchase the outstanding capital stock of NUI and to repay short-term debt incurred to fund our purchase of Jefferson Island.
Dividends on Common Stock In 2005, we made $100 mil-lion in common stock dividend payments. This was an increase of$25 million or 33% from 2004. The increase was due to our 11 mil-lion share common stock offering in November 2004, which increasedthe number of shares outstanding, and to the increases in the amountof our quarterly common stock dividends per share.
In 2004, we made $75 million in common stock dividend pay-ments. This was an increase of $5 million or 7% from 2003. Theincrease was due to our 6.4 million common stock offering in Febru-ary 2003, which increased the number of shares outstanding, and to the increases in the amount of our quarterly common stock divi-dends per share.
In the last three fiscal years, we have made the followingincreases in dividends on our common stock. For information aboutrestrictions on our ability to pay dividends on our common stock, seeNote 9.
Quarterly Indicated
Date of change % increase dividend annual dividend
November 2005 19% $0.37 $1.48February 2005 7 0.31 1.24April 2004 4 0.29 1.16April 2003 4 0.28 1.12
Shelf Registration We currently have remaining capacityunder an October 2004 shelf registration statement of approximately$957 million. We may seek additional financing through debt or equityofferings in the private or public markets at any time.
Critical Accounting Policies
The preparation of our financial statements requires us to make esti-mates and judgments that affect the reported amounts of assets, lia-bilities, revenues and expenses and the related disclosures ofcontingent assets and liabilities. We based our estimates on histori-cal experience and various other assumptions that we believe to bereasonable under the circumstances, and we evaluate our estimateson an ongoing basis. Our actual results may differ from our estimates.
Each of the following critical accounting policies involves complex sit-uations requiring a high degree of judgment either in the applicationand interpretation of existing literature or in the development of esti-mates that impact our financial statements.
Pipeline Replacement Program Atlanta Gas Light was orderedby the Georgia Commission (through a joint stipulation betweenAtlanta Gas Light and the Commission staff) to undertake a PRP thatwould replace all bare steel and cast iron pipe in its system in the stateof Georgia within a 10-year period beginning October 1, 1998. AtlantaGas Light initially identified, and provided notice to the Georgia Commission in accordance with this stipulation of, 2,312 miles of bare steel and cast iron pipe to be replaced. Atlanta Gas Light sub-sequently identified an additional 320 miles of pipe subject to replace-ment under this program.
On June 10, 2005, the Georgia Commission approved a Set-tlement Agreement with Atlanta Gas Light that, among other things,extends Atlanta Gas Light’s PRP by five years to require that allreplacements be completed by December 2013. The timing ofreplacements was subsequently specified in an amendment to thePRP stipulation. This amendment, which was approved by the Georgia Commission on December 20, 2005, requires Atlanta GasLight to replace all cast iron pipe and 70% of all bare steel pipe byDecember 2010. The remaining 30% of bare steel pipe is requiredto be replaced by December 2013. Approximately 152 miles of castiron and 687 miles of bare steel pipe still require replacement. Theamendment also requires an evaluation by Atlanta Gas Light and theGeorgia Commission staff of 22 miles of 24-inch pipe in Atlanta byDecember 2010 to determine if such pipe requires replacement. Ifreplacement of this pipe is required, the pipe must be replaced byDecember 2013. The additional cost to replace this pipe is projectedto be approximately $37 million. If Atlanta Gas Light does not performin accordance with the initial and amended PRP stipulation, it canbe assessed certain nonperformance penalties. However, to dateAtlanta Gas Light is in full compliance.
The stipulation also provides for recovery of all prudent costsincurred in the performance of the program, which Atlanta Gas Lighthas recorded as a regulatory asset. The regulatory asset has twocomponents:
▪ the costs incurred to date that have not yet been recovered throughrate riders
▪ the future expected costs to be recovered through rate riders
AGL Resources Inc.
52
The determination of future expected costs involves judgment.Factors that must be considered in estimating the future expectedcosts are projected capital expenditure spending and remaining footageof infrastructure to be replaced for the remaining years of the program.Atlanta Gas Light recorded a long-term liability of $235 million as of December 31, 2005 and $242 million as of December 31, 2004,which represented engineering estimates for remaining capital expen-diture costs in the PRP. As of December 31, 2005, Atlanta Gas Lighthad recorded a current liability of $30 million, representing expectedPRP expenditures for the next 12 months. We report these estimateson an undiscounted basis. If the recorded liability for PRP had beenhigher or lower by $10 million, Atlanta Gas Light’s expected recoverywould have changed by approximately $1 million.
Environmental Remediation Liabilities Atlanta Gas Light histor-ically reported estimates of future remediation costs based on prob-abilistic models of potential costs. We report these estimates on anundiscounted basis. As we continue to conduct the actual remedia-tion and enter cleanup contracts, Atlanta Gas Light is increasinglyable to provide conventional engineering estimates of the likely costsof many elements of its remediation program. These estimates con-tain various engineering uncertainties, and Atlanta Gas Light continu-ously attempts to refine and update these engineering estimates.
Our latest available estimate as of December 31, 2005 for thoseelements of the remediation program with in-place contracts or engi-neering cost estimates is $12 million for Atlanta Gas Light’s Georgiaand Florida sites. This is a reduction of $24 million from the estimateas of December 31, 2004 of projected engineering and in-place con-tracts, resulting from program expenditures during 2005. For elementsof the remediation program where Atlanta Gas Light still cannot per-form engineering cost estimates, considerable variability remains inavailable estimates. The estimated remaining cost of future actions atthese sites is $15 million. Atlanta Gas Light estimates certain othercosts it pays related to administering the remediation program andremediation of sites currently in the investigation phase. Through Jan-uary 2007, Atlanta Gas Light estimates the administration costs tobe $4 million. Beyond 2007, these costs are not estimable.
Atlanta Gas Light’s environmental remediation liability isincluded in its corresponding regulatory asset. As of December 31,2005, the regulatory asset was $133 million, which is a combina-tion of the accrued remediation liability and unrecovered cash expen-ditures. Atlanta Gas Light’s estimate does not include other potential
expenses, such as unasserted property damage, personal injury ornatural resource damage claims, unbudgeted legal expenses, orother costs for which it may be held liable but with respect to whichthe amount cannot be reasonably forecast. Atlanta Gas Light’srecovery of environmental remediation costs is subject to review bythe Georgia Commission, which may seek to disallow the recoveryof some expenses.
In New Jersey, Elizabethtown Gas is currently conducting reme-diation activities with oversight from the New Jersey Department ofEnvironmental Protection. Although the actual total cost of future envi-ronmental investigation and remediation efforts cannot be estimatedwith precision, the range of reasonably probable costs is $57 million to$104 million. As of December 31, 2005, no value within this range isbetter than any other value, so we recorded a liability of $57 million.
The NJBPU has authorized Elizabethtown Gas to recover pru-dently incurred remediation costs for the New Jersey propertiesthrough its remediation adjustment clause. As a result, ElizabethtownGas has recorded a regulatory asset of approximately $63 million,inclusive of interest, as of December 31, 2005, reflecting the futurerecovery of both incurred costs and future remediation liabilities in thestate of New Jersey. Elizabethtown Gas has also been successful inrecovering a portion of remediation costs incurred in New Jersey fromits insurance carriers and continues to pursue additional recovery. Asof December 31, 2005, the variation between the amounts of theenvironmental remediation cost liability recorded in the consolidatedbalance sheet and the associated regulatory asset is due to expendi-tures for environmental investigation and remediation exceedingrecoveries from ratepayers and insurance carriers.
We also own several former NUI remediation sites located out-side of New Jersey. One site, in Elizabeth City, North Carolina, is sub-ject to an order by the North Carolina Department of Energy andNatural Resources. We do not have precise estimates for the cost ofinvestigating and remediating this site, although preliminary estimatesfor these costs range from $10 million to $17 million. As of Decem-ber 31, 2005, we have recorded a liability of $10 million related to thissite. There is another site in North Carolina where investigation andremediation is probable, although no regulatory order exists and wedo not believe costs associated with this site can be reasonably esti-mated. In addition, there are as many as six other sites with whichNUI had some association, although no basis for liability has beenasserted. We do not believe that costs to investigate and remediatethese sites, if any, can be reasonably estimated at this time.
AGL Resources Inc.
MD&A

Management’s Discussion and Analysis of Financial Condition and Results of Operations
53
With respect to these costs, we currently pursue or intend topursue recovery from ratepayers, former owners and operators andinsurance carriers. Although we have been successful in recovering aportion of these remediation costs from our insurance carriers, we arenot able to express a belief as to the success of additional recoveryefforts. We are working with the regulatory agencies to prudentlymanage our remediation costs so as to mitigate the impact of suchcosts on both ratepayers and shareholders.
Derivatives and Hedging Activities SFAS 133, as updated bySFAS No. 149, “Amendment of Statement 133 on Derivative Instru-ments and Hedging Activities” (SFAS 149), established accountingand reporting standards which require that every derivative financialinstrument (including certain derivative instruments embedded inother contracts) be recorded in the balance sheet as either an assetor a liability measured at its fair value. However, if the derivative trans-action qualifies for and is designated as a normal purchase and sale,it is exempted from the fair value accounting treatment of SFAS 133,as updated by SFAS 149, and is accounted for using traditionalaccrual accounting.
SFAS 133 requires that changes in the derivative’s fair value berecognized currently in earnings unless specific hedge accounting cri-teria are met. If the derivatives meet those criteria, SFAS 133 allowsa derivative’s gains and losses to offset related results on the hedgeditem in the income statement in the case of a fair value hedge, or torecord the gains and losses in other comprehensive income (OCI) untilmaturity in the case of a cash flow hedge. Additionally, SFAS 133requires that a company formally designate a derivative as a hedgeas well as document and assess the effectiveness of derivatives asso-ciated with transactions that receive hedge accounting treatment.Two areas where SFAS 133 applies are interest rate swaps and gascommodity contracts at Sequent and SouthStar. Our derivative andhedging activities are described in further detail in Note 4.
Interest Rate Swaps We designate our interest rate swapsas fair value hedges as defined by SFAS 133, which allows us to des-ignate derivatives that hedge exposure to changes in the fair valueof a recognized asset or liability. We record the gain or loss on fairvalue hedges in earnings in the period of change, together with theoffsetting loss or gain on the hedged item attributable to the risk beinghedged. The effect of this accounting is to reflect in earnings only thatportion of the hedge that is not effective in achieving offsettingchanges in fair value.
Commodity-related Derivative Instruments We areexposed to risks associated with changes in the market price of nat-ural gas. Elizabethtown Gas utilizes certain derivatives for nontrad-ing purposes to hedge the impact of market fluctuations on assets,liabilities and other contractual commitments. Pursuant to SFAS 133,such derivative products are marked to market each reporting period.Pursuant to regulatory requirements, realized gains and losses relatedto such derivatives are reflected in purchased gas costs and includedin billings to customers. Unrealized gains and losses are reflected asa regulatory asset (loss) or liability (gain), as appropriate, in the con-solidated balance sheet. Through Sequent and SouthStar, we usederivative instruments to reduce our exposure to the risk of changesin the price of natural gas. Sequent recognizes the change in value ofderivative instruments as an unrealized gain or loss in revenues in theperiod when the market value of the instrument changes. Sequentrecognizes cash inflows and outflows associated with the settlementof its risk management activities in operating cash flows, and reportsthese settlements as receivables and payables in the balance sheetseparately from the risk management activities reported as energymarketing receivables and trade payables.
Under our risk management policy, we attempt to mitigate sub-stantially all our commodity price risk associated with Sequent’s nat-ural gas storage portfolio and lock in the economic margin at the timewe enter into purchase transactions for our stored natural gas. Wepurchase natural gas for storage when the current market price wepay plus storage costs is less than the market price we could receivein the future. We lock in the economic margin by selling NYMEXfutures contracts or other over-the-counter derivatives in the forwardmonths corresponding with our withdrawal periods. We use contractsto sell natural gas at that future price to substantially lock in the profitmargin we will ultimately realize when the stored natural gas is actu-ally sold. These contracts meet the definition of a derivative underSFAS 133.
The purchase, storage and sale of natural gas are accountedfor differently from the derivatives we use to mitigate the commodityprice risk associated with our storage portfolio. The difference inaccounting can result in volatility in our reported net income, eventhough the economic margin is essentially unchanged from the datethe transactions were consummated. We do not currently use hedgeaccounting under SFAS 133 to account for this activity.
AGL Resources Inc.
54
Natural gas that we purchase and inject into storage isaccounted for on an accrual basis, at the lower of average cost ormarket, and classified as inventory in our consolidated balancesheets; it is no longer marked to market following our implementationof the accounting guidance in EITF 02-03. Under current accountingguidance, we would recognize a loss in any period when the marketprice for natural gas is lower than the carrying amount of our pur-chased natural gas inventory. Costs to store the natural gas are rec-ognized in the period the costs are incurred. We recognize revenuesand cost of natural gas sold in our statement of consolidated incomein the period we sell gas and it is delivered out of the storage facility.
The derivatives we use to mitigate commodity price risk andsubstantially lock in the margin upon the sale of stored natural gas areaccounted for at fair value and marked to market each period, withchanges in fair value recognized as unrealized gains or losses in theperiod of change. This difference in accounting, the accrual basis forour storage inventory versus mark-to-market accounting for the deriv-atives used to mitigate commodity price risk, can result in volatility inour reported net income.
Over time, gains or losses on the sale of storage inventory willbe offset by losses or gains on the derivatives, resulting in realizationof the economic profit margin we expected when we entered into thetransactions. This accounting difference causes Sequent’s earningson its storage positions to be affected by natural gas price changes,even though the economic profits remain essentially unchanged.Sequent manages underground storage for our utilities and holds cer-tain capacity rights on its own behalf. The underground storage is oftwo types:
▪ reservoir storage, where supplies are generally injected and with-drawn on a seasonal basis
▪ salt dome high-deliverability storage, where supplies may be peri-odically injected and withdrawn on relatively short notice
SouthStar also uses derivative instruments to manage expo-sures arising from changing commodity prices. SouthStar’s objectivefor holding these derivatives is to minimize volatility in wholesale com-modity natural gas prices. A portion of SouthStar’s derivative trans-actions are designated as cash flow hedges under SFAS 133.Derivative gains or losses arising from cash flow hedges are recordedin OCI and are reclassified into earnings in the same period theunderlying hedged item is reflected in the income statement. As of
December 31, 2005, the ending balance in OCI for derivative trans-actions designated as cash flow hedges under SFAS 133 was $(0.8) million. Any hedge ineffectiveness, defined as when the gainsor losses on the hedging instrument do not offset the losses or gainson the hedged item, is recorded into earnings in the period in whichit occurs. SouthStar currently has minimal hedge ineffectiveness.SouthStar’s remaining derivative instruments are not designated ashedges under SFAS 133. Therefore, changes in their fair value arerecorded in earnings in the period of change.
Contingencies Our accounting policies for contingencies cover avariety of business activities, including contingencies for potentiallyuncollectible receivables, rate matters, and legal and environmentalexposures. We accrue for these contingencies when our assessmentsindicate that it is probable that a liability has been incurred or an assetwill not be recovered, and an amount can be reasonably estimated inaccordance with SFAS No. 5, “Accounting for Contingencies.” Webase our estimates for these liabilities on currently available facts andour estimates of the ultimate outcome or resolution of the liability in thefuture. Actual results may differ from estimates, and estimates can be,and often are, revised either negatively or positively, depending onactual outcomes or changes in the facts or expectations surroundingeach potential exposure.
Pension and Other Postretirement Plans Our pension and otherpostretirement plan costs and liabilities are determined on an actu-arial basis and are affected by numerous assumptions and estimatesincluding the market value of plan assets, estimates of the expectedreturn on plan assets, assumed discount rates and current demo-graphic and actuarial mortality data. We annually review the estimatesand assumptions underlying our pension and other postretirementplan costs and liabilities. The assumed discount rate and theexpected return on plan assets are the assumptions that generallyhave the most significant impact on our pension costs and liabilities.
The assumed discount rate, the assumed health care costtrend rate and assumed rates of retirement generally have the mostsignificant impact on our postretirement plan costs and liabilities.
The discount rate is utilized principally in calculating the actu-arial present value of our pension and postretirement obligations and net pension and postretirement cost. When establishing our discount rate, we consider absolute high-quality corporate bond
AGL Resources Inc.
MD&A

Management’s Discussion and Analysis of Financial Condition and Results of Operations
55
rates based on Moody’s Corporate AA long-term bond rate of 5.41%and the Citigroup Pension Liability rate of 5.51% at December 31,2005. We further use these market indices as a comparison to a single equivalent discount rate derived with the assistance of ouractuarial advisors.
The actuarial assumptions used may differ materially fromactual results due to changing market and economic conditions,higher or lower withdrawal rates, or longer or shorter life spans of par-ticipants. These differences may result in a significant impact on theamount of pension expense recorded in future periods.
The expected long-term rate of return on assets is utilized incalculating the expected return on plan assets component of ourannual pension and postretirement plan cost. We estimate theexpected return on plan assets by evaluating expected bond returns,equity risk premiums, asset allocations, the effects of active plan man-agement, the impact of periodic plan asset rebalancing and historicalperformance. We also consider the guidance from our investmentadvisors in making a final determination of our expected rate of returnon assets. To the extent the actual rate of return on assets realizedover the course of a year is greater than or less than the assumedrate, that year’s annual pension or postretirement plan cost is notaffected. Rather, this gain or loss reduces or increases future pensionor postretirement plan costs.
Prior to 2006, we estimated the assumed health care costtrend rate used in determining our postretirement net expense basedon our actual health care cost experience, the effects of recentlyenacted legislation and general economic conditions. However, start-ing in 2006, our postretirement plans have been capped at 2.5% forincreases in health care costs. Consequently, a one-percentage-pointincrease or decrease in the assumed health care trend rate does notmaterially affect our periodic benefit cost for our postretirement plans.A one-percentage-point increase in the assumed health care costtrend rate would increase our accumulated projected benefit obliga-tion by $6 million. A one-percentage-point decrease in the assumedhealth care cost trend rate would decrease our accumulated pro-jected benefit obligation by $5 million. Our assumed rate of retirementis estimated based on our annual review of our participant censusinformation as of the measurement date.
At December 31, 2005, we had an increase in our minimumpension liability of approximately $8 million, resulting in an aftertax loss to OCI of $5 million. This adjustment reflected our funding
contributions to the plan and updated valuations for the projectedbenefit obligation and plan assets. To the extent that our futureexpenses and contributions increase as a result of the additional min-imum pension liability, we believe that such increases are recoverablein whole or in part under future rate proceedings or mechanisms.
Equity market performance and corporate bond rates have asignificant effect on our reported unfunded accumulated benefit obli-gation (ABO), as the primary factors that drive the value of ourunfunded ABO are the assumed discount rate and the actual returnon plan assets. Additionally, equity market performance has a signif-icant effect on our market-related value of plan assets (MRVPA),which is a calculated value and differs from the actual market value ofplan assets. The MRVPA recognizes the differences between theactual market value and expected market value of our plan assetsand is determined by our actuaries using a five-year moving weightedaverage methodology. Gains and losses on plan assets are spreadthrough the MRVPA based on the five-year moving weighted averagemethodology, which affects the expected return on plan assets com-ponent of pension expense.
A one-percentage-point increase in the assumed discount ratewould decrease the AGL Resources Inc. Retirement Plan’s ABO byapproximately $39 million and decrease annual pension expense byapproximately $4 million. A one-percentage-point decrease in theassumed discount rate would increase the AGL Resources Inc.Retirement Plan’s ABO by approximately $44 million and increaseannual pension expense by approximately $4 million. Additionally, aone-percentage-point increase or decrease in the expected return onassets would decrease or increase the AGL Resources Inc. Retire-ment Plan’s annual pension expense by approximately $3 million.
Additionally, in 2004 we recorded a $36 million liability for theamount of NUI’s projected benefit obligation in excess of the fairvalue of pension plan assets at the date of our acquisition of NUI.At December 31, 2005 our accrued liability for NUI’s projected obli-gation is $31 million, reflecting $9 million in adjustments for termi-nations and settlement of liabilities affected by the NUI purchasetransaction offset by net periodic benefit cost of $3 million in 2005.A one-percentage-point increase in the assumed discount ratewould decrease the NUI Corporation Retirement Plan’s ABO byapproximately $14 million and decrease annual benefit cost by approximately $2 million. A one-percentage-point decrease in the assumed discount rate would increase the NUI Corporation
AGL Resources Inc.

56
Retirement Plan’s ABO by approximately $17 million and increaseannual pension expense by approximately $1 million. In addition, aone-percentage-point increase or decrease in the NUI Corporation Retirement Plan’s expected return on assets would decrease orincrease annual pension expense by approximately $1 million.
As of December 31, 2005, the market value of the pensionassets was $371 million compared to a market value of $390 mil-lion as of December 31, 2004. The net decrease of $19 millionresulted from
▪ contributions of $5 million in August 2005▪ contributions of $1 million in 2005 to our supplemental retire-
ment plan▪ an actual return on plan assets of $27 million less benefits paid of
$52 million
Our $5 million in contributions to the pension plan in 2005reduced annual pension expense by approximately $0.4 million. Theactual return on plan assets compared to the expected return on planassets will have an impact on our benefit obligation as of Decem-ber 31, 2005 and our pension expense for 2006. We are unable todetermine how this actual return on plan assets will affect future ben-efit obligation and pension expense, as actuarial assumptions and dif-ferences between actual and expected returns on plan assets aredetermined at the time we complete our actuarial evaluation as ofDecember 31, 2005. Our actual returns may also be positively or neg-atively impacted as a result of future performance in the equity andbond markets.
Accounting Developments
For information regarding accounting developments, see Note 3.
Risk Factors
The following are some of the factors that could affect our future per-
formance or could cause actual results to differ materially from those
expressed or implied in our forward-looking statements. We cannot
predict every event and circumstance that may adversely affect our
business, but the risks and uncertainties described below are the
most significant factors that we have identified at this time.
Risks Related to Our Business
Risks related to the regulation of our businesses could affect the
rates we are able to charge, our costs and our profitability.
Our businesses are subject to regulation by federal, state and localregulatory authorities. In particular, at the federal level our distribu-tion businesses have been regulated by the SEC under the PUHCAand, effective February 8, 2006, will be regulated by the FERC underthe Energy Act. At the state level, our distribution businesses are reg-ulated by the Georgia Commission, the Tennessee Authority, theNJBPU, the Florida Commission, the Virginia Commission and theMaryland Commission. These authorities regulate many aspects ofour distribution operations, including construction and maintenanceof facilities, operations, safety, rates that we can charge customers,rates of return, the authorized cost of capital, recovery of pipelinereplacement and environmental remediation costs, carrying costs wecharge Marketers for gas held in storage for their customer accountsand relationships with our affiliates. Our ability to obtain rate increasesand rate supplements to maintain our current rates of return dependson regulatory discretion, and there can be no assurance that we willbe able to obtain rate increases or rate supplements or continuereceiving our currently authorized rates of return.
Deregulation in the natural gas industry is the separation of the provision and pricing of local distribution gas services into discretecomponents. Deregulation typically focuses on the separation of thegas distribution business from the gas sales business and is intendedto cause the opening of the formerly regulated sales business to alter-native unregulated suppliers of gas sales services.
In 1997, the Georgia legislature enacted the Natural Gas Com-petition and Deregulation Act. To date, Georgia is the only state in thenation that has fully deregulated gas distribution operations, whichultimately resulted in Atlanta Gas Light exiting the retail natural gassales business while retaining its gas distribution operations. Gas
AGL Resources Inc.
MD&A

Management’s Discussion and Analysis of Financial Condition and Results of Operations
57
marketers then assumed the retail gas sales responsibility at dereg-ulated prices. The deregulation process required Atlanta Gas Light tocompletely reorganize its operations and personnel at significantexpense. It is possible that the legislature could reverse the deregu-lation process and require or permit Atlanta Gas Light to provide retailgas sales service once again or require SouthStar to change thenature of how it provides natural gas to certain customers. In addi-tion, the Georgia Commission has statutory authority on an emer-gency basis to order Atlanta Gas Light to temporarily provide thesame retail gas service that it provided prior to deregulation. If any ofthese events were to occur, we would incur costs to reverse therestructuring process or potentially lose the earnings opportunityembedded within the current marketing framework. Furthermore, theGeorgia Commission has authority to change the terms under whichwe charge Marketers for certain supply-related services, which couldalso affect our future earnings.
We have a concentration of credit risk in Georgia, which could
expose a significant portion of our accounts receivable to col-
lection risks.
We have a concentration of credit risk related to the provision of nat-ural gas services to Georgia Marketers. At September 30, 1998 (priorto deregulation), Atlanta Gas Light had approximately 1.4 million end-use customers in Georgia. In contrast, at December 31, 2005, AtlantaGas Light had only 10 certificated and active Marketers in Georgia,four of which (based on customer count and including SouthStar)accounted for approximately 33% of our consolidated operating margin for 2005. As a result, Atlanta Gas Light now depends on aconcentrated number of customers for revenues. The failure of theseMarketers to pay Atlanta Gas Light could adversely affect Atlanta GasLight’s business and results of operations and expose it to difficul-ties in collecting Atlanta Gas Light’s accounts receivable. Additionally,SouthStar markets directly to end-use customers and has periodicallyexperienced credit losses as a result of cold weather, variable pricesand customers’ inability to pay.
The cost of providing pension and postretirement health care
benefits to eligible former employees is subject to changes in
pension fund values and changing demographics and may have
a material adverse effect on our financial results.
We have a defined benefit pension plan for the benefit of substantiallyall full-time employees and qualified retirees. The cost of providing
these benefits to eligible current and former employees is subject tochanges in the market value of our pension fund assets and chang-ing demographics, including longer life expectancy of beneficiariesand an expected increase in the number of eligible former employeesover the next five years.
Any sustained declines in equity markets and reductions inbond yields may have a material adverse effect on the value of ourpension funds. In these circumstances, we may be required to recog-nize an increased pension expense or a charge to our statement ofconsolidated income to the extent that the pension fund values areless than the total anticipated liability under the plans.
We face increasing competition, and if we are unable to compete
effectively, our revenues, operating results and financial condi-
tion will be adversely affected.
The natural gas business is highly competitive, and we are facingincreasing competition from other companies that supply energy,including electric companies, oil and propane providers and, in somecases, energy marketing and trading companies. In particular, thesuccess of our investment in SouthStar is affected by the competitionSouthStar faces from other energy marketers providing retail naturalgas services in the Southeast. Natural gas competes with other formsof energy. The primary competitive factor is price. Changes in theprice or availability of natural gas relative to other forms of energy andthe ability of end-users to convert to alternative fuels affect thedemand for natural gas. In the case of commercial, industrial and agri-cultural customers, adverse economic conditions, including highergas costs, could also cause these customers to bypass our systemsin favor of special competitive contracts with lower per-unit costs ordisconnect from our system.
Our wholesale services segment competes with larger, full-
service energy providers, which may limit our ability to grow
our business.
Our wholesale services segment competes with national and regionalfull-service energy providers, energy merchants, and producers andpipelines for sales based on our ability to aggregate competitivelypriced commodities with transportation and storage capacity. Someof our competitors are larger and better capitalized than we are andhave more national and global exposure than we do. The consolida-tion of this industry and the pricing to gain market share may affectour margins. We expect this trend to continue in the near term, and
AGL Resources Inc.

58
the increasing competition for asset management deals could resultin downward pressure on the volume of transactions and the relatedmargins available in this portion of Sequent’s business.
Our asset management arrangements between Sequent and our
affiliated local distribution companies and between Sequent and
its nonaffiliated customers may not be renewed or may be
renewed at lower levels, which could have a significant impact
on Sequent’s business.
Sequent currently manages the storage and transportation assets ofour affiliates Atlanta Gas Light, Elizabethtown Gas, Virginia NaturalGas, Florida City Gas and Chattanooga Gas and shares profits itearns from the management of those assets with those customersand their customers, except at Elizabethtown Gas and Elkton Gaswhere Sequent is assessed an annual fixed-fee payment. In addi-tion, Sequent has asset management agreements with certain non-affiliated customers. Entry into and renewal of these agreements aresubject to regulatory approval. Sequent’s results could be signifi-cantly impacted if these agreements are not renewed or areamended or renewed with less favorable terms.
Our profitability may decline if the counterparties to Sequent’s
asset management transactions fail to perform in accordance
with Sequent’s agreements.
Sequent focuses on capturing the value from idle or underutilizedenergy assets, typically by executing transactions that balance theneeds of various markets and time horizons. Sequent is exposed tothe risk that counterparties to our transactions will not perform theirobligations. Should the counterparties to these arrangements fail toperform, we might be forced to enter into alternative hedging arrange-ments, honor the underlying commitment at then-current marketprices or return a significant portion of the consideration received forgas under a long-term contract. In such events, we might incur addi-tional losses to the extent of amounts, if any, already paid to orreceived from counterparties.
We have a concentration of credit risk at Sequent that could
expose us to collection risks.
We often extend credit to our counterparties. Despite performingcredit analyses prior to extending credit and seeking to effectuate net-ting agreements, we are exposed to the risk that we may not be ableto collect amounts owed to us. If the counterparty to such a transac-tion fails to perform and any collateral we have secured is inadequate,we could experience material financial losses.
We have a concentration of credit risk at Sequent, which couldexpose a significant portion of our credit exposure to collection risks.Approximately 52% of Sequent’s credit exposure is concentrated in20 counterparties. Although most of this concentration is with coun-terparties that are either load-serving utilities or end-use customersand that have supplied some level of credit support, default by any ofthese counterparties in their obligations to pay amounts due Sequentcould result in credit losses that would negatively impact our whole-sale services segment.
We are exposed to market risk and may incur losses in whole-
sale services.
The commodity, storage and transportation portfolios at Sequent con-sist of contracts to buy and sell natural gas commodities, includingcontracts that are settled by the delivery of the commodity or cash.If the values of these contracts change in a direction or manner thatwe do not anticipate, we could experience financial losses from ourtrading activities. Value at risk (VaR) is defined as the maximum poten-tial loss in portfolio value over a specified time period that is notexpected to be exceeded within a given degree of probability. Basedon a 95% confidence interval and employing a 1-day and a 10-dayholding period for all positions, Sequent’s portfolio of positions as ofDecember 31, 2005 had a 1-day holding period VaR of $0.6 millionand a 10-day holding period VaR of $1.9 million.
Our accounting results may not be indicative of the risks we are
taking or the economic results we expect due to changes in
accounting for wholesale services.
Although Sequent enters into various contracts to hedge the value ofour energy assets and operations, the timing of the recognition ofprofits or losses on the hedges does not always match up with the
AGL Resources Inc.
MD&A

Management’s Discussion and Analysis of Financial Condition and Results of Operations
59
profits or losses on the item being hedged. The difference in account-ing can result in volatility in Sequent’s reported results, even thoughthe expected profit margin is essentially unchanged from the date thetransactions were consummated.
Our business is subject to environmental regulation in all
jurisdictions in which we operate and our costs to comply are
significant, and any changes in existing environmental regu-
lation could negatively affect our results of operations and
financial condition.
Our operations and properties are subject to extensive environmen-tal regulation pursuant to a variety of federal, state and municipal lawsand regulations. Such environmental legislation imposes, amongother things, restrictions, liabilities and obligations in connection withstorage, transportation, treatment and disposal of hazardous sub-stances and waste and in connection with spills, releases and emis-sions of various substances into the environment. Environmentallegislation also requires that our facilities, sites and other propertiesassociated with our operations be operated, maintained, abandonedand reclaimed to the satisfaction of applicable regulatory authorities.Our current costs to comply with these laws and regulations are significant to our results of operations and financial condition. Failureto comply with these laws and regulations and failure to obtain anyrequired permits and licenses may expose us to fines, penaltiesand/or interruptions in our operations that could be material to ourresults of operations.
In addition, claims against us under environmental laws andregulations could result in material costs and liabilities. Existing envi-ronmental regulations could also be revised or reinterpreted, new lawsand regulations could be adopted or become applicable to us or ourfacilities, and future changes in environmental laws and regulationscould occur. With the trend toward stricter standards, greater regula-tion, more extensive permit requirements and an increase in the num-ber and types of assets operated by us subject to environmentalregulation, our environmental expenditures could increase in thefuture, particularly if those costs are not fully recoverable from our cus-tomers. Additionally, the discovery of presently unknown environmen-tal conditions could give rise to expenditures and liabilities, includingfines or penalties, which could have a material adverse effect on ourbusiness, results of operations or financial condition.
We could incur additional material costs for the environmental
condition of some of our assets, including former manufactured
gas plants.
We are generally responsible for all on-site and certain off-site liabilitiesassociated with the environmental condition of the natural gas assetsthat we have operated, acquired or developed, regardless of when theliabilities arose and whether they are or were known or unknown. Inaddition, in connection with certain acquisitions and sales of assets,we may obtain, or be required to provide, indemnification against cer-tain environmental liabilities. Before natural gas was widely available inthe Southeast, we manufactured gas from coal and other fuels. Thosemanufacturing operations were known as manufactured gas plants, orMGPs, which we ceased operating in the 1950s.
We have identified 10 sites in Georgia and 3 in Florida wherewe, or our predecessors, own or owned all or part of an MGP site.We are required to investigate possible environmental contaminationat those MGP sites and, if necessary, clean up any contamination. Todate, cleanup has been completed at these sites, and as of Decem-ber 31, 2005, the soil and sediment remediation program was com-plete for all Georgia sites, although groundwater cleanup continues.As of December 31, 2005, projected costs associated with the MGPsites were $31 million. For elements of the MGP program where westill cannot provide engineering cost estimates, considerable variabil-ity remains in available future cost estimates.
In addition, we are associated with former sites in New Jersey,North Carolina and other states that we assumed with our acquisitionof NUI in November 2004. Material cleanups of these sites have notbeen completed nor are precise estimates available for future cleanupcosts. For the New Jersey sites, cleanup cost estimates range from$57 million to $104 million. Costs have been estimated for only 1 ofthe non–New Jersey sites, for which current estimates range from$10 million to $17 million.
Our growth may be restricted by the capital-intensive nature of
our business.
We must construct additions to our natural gas distribution systemeach year to continue the expansion of our customer base. The costof this construction may be affected by the cost of obtaining govern-ment approvals, development project delays or changes in projectcosts. Weather, general economic conditions and the cost of funds to
AGL Resources Inc.

60
finance our capital projects can materially alter the cost of a project.Our cash flows are not fully adequate to finance the cost of this con-struction. As a result, we must fund a portion of our cash needsthrough borrowings and the issuance of common stock. This may limitour ability to increase infrastructure to connect customers due to lim-its on the amount we can economically invest, which shifts costs topotential customers. This may make it uneconomical for these poten-tial customers to connect to our distribution systems.
Changes in weather conditions may affect our earnings.
Weather conditions and other natural phenomena can have a largeimpact on our earnings. Severe weather conditions can impact oursuppliers and the pipelines that deliver gas to our distribution system.Extended mild weather, during either the winter period or the summerperiod, can have a significant impact on demand for and the cost ofnatural gas.
We have a WNA mechanism for Elizabethtown Gas, Chat-tanooga Gas and Virginia Natural Gas that partially offsets the impactof unusually cold or warm weather on residential and commercial cus-tomer billings and margin. The WNA is most effective in a reasonabletemperature range relative to normal weather using historical averages.The protection afforded by the WNA depends on continued regulatoryapproval. The loss of this continued regulatory approval could makeus more susceptible to weather-related earnings fluctuations.
Inflation and increased gas costs could adversely impact our
customer base and customer collections and increase our level
of indebtedness.
Inflation has caused increases in certain operating expenses and hasrequired us to replace assets at higher costs. We have a process inplace to continually review the adequacy of our utility gas rates in rela-tion to the increasing cost of providing service and the inherent reg-ulatory lag in adjusting those gas rates. Historically, we have been ableto budget and control operating expenses and investments within theamounts authorized to be collected in rates and intend to continue todo so. The ability to control expenses is an important factor that willinfluence future results.
Rapid increases in the price of purchased gas cause us toexperience a significant increase in short-term debt because we mustpay suppliers for gas when it is purchased, which can be significantlyin advance of when these costs may be recovered through the
collection of monthly customer bills for gas delivered. Increases in pur-chased gas costs also slow our utility collection efforts as customersare more likely to delay the payment of their gas bills, leading tohigher-than-normal accounts receivable. This situation also results inhigher short-term debt levels and increased bad debt expense.Should the price of purchased gas increase significantly in theupcoming heating season, we would expect increases in our short-term debt, accounts receivable and bad debt expense during 2006.
Finally, higher costs of natural gas in recent years have alreadycaused many of our utility customers to conserve in the use of ourgas services and could lead to even more customers utilizing suchconservation methods or switching to other more efficient competingproducts. The higher costs have also allowed products utilizingenergy sources other than natural gas for applications that have tra-ditionally used natural gas to be in a more competitive position,encouraging some customers to move away from natural gas firedequipment to equipment fueled by other energy sources.
A decrease in the availability of adequate pipeline transportation
capacity could reduce our revenues and profits.
Our gas supply depends on the availability of adequate pipeline trans-portation and storage capacity. We purchase a substantial portionof our gas supply from interstate sources. Interstate pipeline com-panies transport the gas to our system. A decrease in interstatepipeline capacity available to us or an increase in competition for inter-state pipeline transportation and storage service could reduce ournormal interstate supply of gas.
Risks Related to Our Corporate and Financial Structure
If we breach any of the material financial covenants under our
various indentures, credit facilities or guarantees, our debt serv-
ice obligations could be accelerated.
Our existing debt and the debt of certain of our subsidiaries containa number of significant financial covenants. If we or any of these sub-sidiaries breach any of the financial covenants under these agree-ments, our debt repayment obligations under them could beaccelerated. In such event, we may not be able to refinance or repayall our indebtedness, which would result in a material adverse effecton our business, results of operations and financial condition.
AGL Resources Inc.
MD&A

Management’s Discussion and Analysis of Financial Condition and Results of Operations
61
As a result of cross-default provisions in our borrowing arrange-
ments, we may be unable to satisfy all our outstanding obliga-
tions in the event of a default on our part.
Our Credit Facility and the indenture under which Atlanta Gas Light’soutstanding medium-term notes were issued contain cross-defaultprovisions. Accordingly, should an event of default occur under someof our debt agreements, we face the prospect of being in defaultunder other of our debt agreements, obliged in such instance to sat-isfy a large portion of our outstanding indebtedness and unable tosatisfy all our outstanding obligations simultaneously.
We depend on our ability to successfully access the capital mar-
kets. Any inability to access the capital or financial markets may
limit our ability to execute our business plan or pursue improve-
ments that we may rely on for future growth.
We rely on access to both short-term money markets (in the form ofcommercial paper and lines of credit) and long-term capital marketsas a source of liquidity for capital and operating requirements not sat-isfied by the cash flow from our operations. If we are not able toaccess financial markets at competitive rates, our ability to implementour business plan and strategy will be affected. Certain market dis-ruptions may increase our cost of borrowing or affect our ability toaccess one or more financial markets. Such market disruptions couldresult from
▪ adverse economic conditions▪ adverse general capital market conditions▪ poor performance and health of the utility industry in general▪ bankruptcy or financial distress of unrelated energy companies
or Marketers in Georgia▪ significant decrease in the demand for natural gas▪ adverse regulatory actions that affect our local gas distribution
companies▪ terrorist attacks on our facilities or our suppliers▪ extreme weather conditions
A downgrade in our credit rating could negatively affect our
ability to access capital.
S&P, Moody’s and Fitch currently assign our senior unsecured debt a rating of BBB+, Baa1 and A-, respectively. Our commercial papercurrently is rated A-2, P-2 and F-2 by S&P, Moody’s and Fitch,respectively. If the rating agencies downgrade our ratings, particularly
below investment grade, it may significantly limit our access to thecommercial paper market and our borrowing costs would increase.In addition, we would likely be required to pay a higher interest rate infuture financings and our potential pool of investors and fundingsources would likely decrease.
Additionally, if our credit rating by either S&P or Moody’s falls tonon–investment grade status, we will be required to provide additionalsupport for certain customers of our wholesale business. As ofDecember 31, 2005, if our credit rating had fallen below investmentgrade, we would have been required to provide collateral of approxi-mately $51 million to continue conducting our wholesale servicesbusiness with certain counterparties.
The use of derivative contracts in the normal course of our busi-
ness could result in financial losses that negatively impact our
results of operations.
We use derivatives, including futures, forwards and swaps, to man-age our commodity and financial market risks. We could recognizefinancial losses on these contracts as a result of volatility in the mar-ket values of the underlying commodities or if a counterparty fails toperform under a contract. In the absence of actively quoted marketprices and pricing information from external sources, the valuationof these financial instruments can involve management’s judgment oruse of estimates. As a result, changes in the underlying assumptionsor use of alternative valuation methods could adversely affect thevalue of the reported fair value of these contracts.
We are vulnerable to interest rate risk with respect to our debt,
which could lead to changes in interest expense.
We are subject to interest rate risk in connection with the issuance offixed-rate and variable-rate debt. In order to maintain our desired mixof fixed-rate and variable-rate debt, we use interest rate swap agree-ments and exchange fixed-rate and variable-rate interest payment obli-gations over the life of the arrangements, without exchange of theunderlying principal amounts. See Quantitative and Qualitative Disclo-sures About Market Risk. We cannot ensure that we will be success-ful in structuring such swap agreements to effectively manage ourrisks. If we are unable to do so, our earnings may be reduced. In addi-tion, higher interest rates, all other things equal, reduce the earningsthat we derive from transactions where we capture the differencebetween authorized returns and short-term borrowings.
AGL Resources Inc.

62
Risks Related to Our Industry
Transporting and storing natural gas involves numerous risks
that may result in accidents and other operating risks and costs.
Our gas distribution activities involve a variety of inherent hazards andoperating risks, such as leaks, accidents and mechanical problems,which could cause substantial financial losses. In addition, these riskscould result in loss of human life, significant damage to property, envi-ronmental pollution and impairment of our operations, which in turncould lead to substantial losses to us. In accordance with custom-ary industry practice, we maintain insurance against some, but not all,of these risks and losses. The location of pipelines and storage facil-ities near populated areas, including residential areas, commercialbusiness centers and industrial sites, could increase the level of dam-ages resulting from these risks. The occurrence of any of these eventsnot fully covered by insurance could adversely affect our financialposition and results of operations.
Natural disasters, terrorist activities and the potential for military
and other actions could adversely affect our businesses.
Natural disasters may damage our assets. The threat of terrorismand the impact of retaliatory military and other action by the UnitedStates and its allies may lead to increased political, economic andfinancial market instability and volatility in the price of natural gas thatcould affect our operations. In addition, future acts of terrorism couldbe directed against companies operating in the United States, andcompanies in the energy industry may face a heightened risk ofexposure to acts of terrorism. These developments have subjectedour operations to increased risks. The insurance industry has alsobeen disrupted by these events. As a result, the availability of insur-ance covering risks against which we and our competitors typicallyinsure may be limited. In addition, the insurance we are able to obtainmay have higher deductibles, higher premiums and more restrictivepolicy terms.
Quantitative and Qualitative Disclosures About Market Risk
We are exposed to risks associated with commodity prices, interestrates and credit. Commodity price risk is defined as the potential lossthat we may incur as a result of changes in the fair value of a partic-ular instrument or commodity. Interest rate risk results from our port-folio of debt and equity instruments that we issue to provide financingand liquidity for our business. Credit risk results from the extension ofcredit throughout all aspects of our business but is particularly con-centrated at Atlanta Gas Light in distribution operations and in whole-sale services.
Our Risk Management Committee (RMC) is responsible forestablishing the overall risk management policies and monitoringcompliance with, and adherence to, the terms within these policies,including approval and authorization levels and delegation of theselevels. Our RMC consists of senior executives who monitor commod-ity price risk positions, corporate exposures, credit exposures andoverall results of our risk management activities. It is chaired by ourchief risk officer, who is responsible for ensuring that appropriatereporting mechanisms exist for the RMC to perform its monitoringfunctions. Our risk management activities and related accountingtreatments are described in further detail in Note 4.
Commodity Price Risk
Retail Energy Operations SouthStar’s use of derivatives is gov-erned by a risk management policy, created and monitored by its riskmanagement committee, which prohibits the use of derivatives forspeculative purposes. A 95% confidence interval is used to evaluateVaR exposure. A 95% confidence interval means there is a 5% prob-ability that the actual change in portfolio value will be greater than thecalculated VaR value over the holding period. We calculate VaR basedon the variance-covariance technique. This technique requires sev-eral assumptions for the basis of the calculation, such as price volatil-ity, confidence interval and holding period. Our VaR may not becomparable to a similarly titled measure of another companybecause, although VaR is a common metric in the energy industry,there is no established industry standard for calculating VaR or for theassumptions underlying such calculations. The following table pro-vides more information on SouthStar’s 1-day and 10-day holdingperiod VaR.
AGL Resources Inc.
MD&A

Management’s Discussion and Analysis of Financial Condition and Results of Operations
63
In millions 1-day 10-day
2005 period end $0.3 $0.8
2004 period end 0.2 0.5
SouthStar generates operating margin from the active manage-ment of storage positions through a variety of hedging transactionsand derivative instruments aimed at managing exposures arising fromchanging commodity prices. SouthStar uses these hedging instru-ments to lock in economic margins (as spreads between wholesaleand retail commodity prices widen between periods) and thereby min-imize its exposure to declining operating margins.
Wholesale Services This segment routinely utilizes various typesof financial and other instruments to mitigate certain commodity pricerisks inherent in the natural gas industry. These instruments include avariety of exchange-traded and over-the-counter energy contracts,such as forward contracts, futures contracts, options contracts andfinancial swap agreements. The following table includes the fair val-ues and average values of our energy marketing and risk manage-ment assets and liabilities as of December 31, 2005 and 2004. Webase the average values on monthly averages for the 12 monthsended December 31, 2005 and 2004.
Average values at December 31,
In millions 2005 2004
Asset $ 83 $28Liability 102 21
Value at December 31,
In millions 2005 2004
Asset $ 97 $36Liability 110 19
We employ a systematic approach to evaluating and manag-ing the risks associated with our contracts related to wholesale mar-keting and risk management, including VaR. Similar to SouthStar,Sequent uses a 1-day and a 10-day holding period and a 95% con-fidence interval to evaluate its VaR exposure.
Sequent’s open exposure is managed in accordance withestablished policies that limit market risk and require daily reporting ofpotential financial exposure to senior management, including the chiefrisk officer. Because Sequent generally manages physical gas assetsand economically protects its positions by hedging in the futures mar-kets, its open exposure is generally minimal, permitting Sequent to
operate within relatively low VaR limits. Sequent employs daily risktesting, using both VaR and stress testing, to evaluate the risks of itsopen positions.
Sequent’s management actively monitors open commoditypositions and the resulting VaR. Sequent continues to maintain a relatively matched book, where its total buy volume is close to sell volume, with minimal open commodity risk. Based on a 95% confi-dence interval and employing a 1-day and a 10-day holding period forall positions, Sequent’s portfolio of positions for the 12 months endedDecember 31, 2005, 2004 and 2003 had the following 1-day and 10-day holding period VaRs.
In millions 1-day 10-day
2005
Period end $0.6 $1.9
12-month average 0.4 1.2
High 1.1 3.5
Low1 0.0 0.0
2004
Period end $0.1 $0.212-month average 0.1 0.3High 0.4 1.3Low1 0.0 0.02003
Period end $0.3 $1.012-month average 0.1 0.3High 2.5 4.7Low1 0.0 0.01 $0.0 values represent amounts less than $0.1 million.
During 2005 Sequent experienced increases in its high, 12-month average and period-end 1-day and 10-day VaR amounts.These increases were directly associated with the market impacts andrelated price volatility created by the Gulf Coast hurricanes during thethird quarter and the lingering effects through year end.
Interest Rate Risk
Interest rate fluctuations expose our variable-rate debt to changes ininterest expense and cash flows. Our policy is to manage interestexpense using a combination of fixed-rate and variable-rate debt. To facilitate the achievement of desired fixed-rate to variable-rate debtratios, AGL Capital entered into interest rate swaps whereby it agreed
AGL Resources Inc.

64
to exchange, at specified intervals, the difference between fixed andvariable amounts calculated by reference to agreed-on notional prin-cipal amounts. These swaps are designated to hedge the fair valuesof $100 million of the $300 million Senior Notes Due 2011.
At the beginning of 2005, we had $75 million of outstandinginterest rate swap agreements associated with our Note Payable atAGL Capital Trust II. On September 7, 2005, we terminated theseinterest rate swap agreements. We received a payment of $1 mil-lion related to this termination, which included accrued interest andthe fair value of these interest rate swap agreements at the termi-nation date.
In September 2005, we also executed five treasury-lock agree-ments totaling $125 million to hedge the interest rate risk associatedwith an anticipated 2006 financing. The agreements will result in a4.11% interest rate on the 10-year United States Treasury bondagainst which we will be measured in issuing our own debt instru-ments and were designated as cash flow hedges against the futureinterest payments on the anticipated financing.
Credit Risk
Distribution Operations Atlanta Gas Light has a concentrationof credit risk because it bills only 10 Marketers in Georgia for its serv-ices. The credit risk exposure to Marketers varies with the time ofthe year, with exposure at its lowest in the nonpeak summer monthsand highest in the peak winter months. Marketers are responsible forthe retail sale of natural gas to end-use customers in Georgia. Theseretail functions include customer service, billing, collections, and thepurchase and sale of the natural gas commodity. These Marketers, inturn, bill end-use customers. The provisions of Atlanta Gas Light’s tar-iff allow Atlanta Gas Light to obtain security support in an amountequal to a minimum of two times a Marketer’s highest month’s esti-mated bill from Atlanta Gas Light. For 2005, the 4 largest Marketersbased on customer count, one of which was SouthStar, accountedfor approximately 33% of our consolidated operating margin and 45%of distribution operations’ operating margin.
Several factors are designed to mitigate our risks from theincreased concentration of credit that has resulted from deregulation.In addition to the security support described above, Atlanta Gas Lightbills intrastate delivery service to Marketers in advance rather than inarrears. We accept credit support in the form of cash deposits, lettersof credit/surety bonds from acceptable issuers and corporate guar-antees from investment-grade entities. The RMC reviews on amonthly basis the adequacy of credit support coverage, credit ratingprofiles of credit support providers and payment status of each Mar-keter. We believe that adequate policies and procedures have beenput in place to properly quantify, manage and report on Atlanta GasLight’s credit risk exposure to Marketers.
Atlanta Gas Light also faces potential credit risk in connectionwith assignments to Marketers of interstate pipeline transportationand storage capacity. Although Atlanta Gas Light assigns this capac-ity to Marketers, in the event that a Marketer fails to pay the interstatepipelines for the capacity, the interstate pipelines would in all likelihoodseek repayment from Atlanta Gas Light. The fact that some of theinterstate pipelines require Marketers to maintain security for their obli-gations to the interstate pipelines arising out of the assigned capac-ity somewhat mitigates this risk.
Retail Energy Operations SouthStar credit-scores firm residentialand small commercial customers using a national credit reportingagency and enrolls, without security, only those customers that meetor exceed SouthStar’s credit threshold. The average credit score ofSouthStar’s Georgia customers has increased 9% since 2003.
SouthStar investigates potential interruptible and large com-mercial customers through reference checks, review of publicly avail-able financial statements and review of commercially available creditreports. Prior to entering into a physical transaction, SouthStar alsoassigns physical wholesale counterparties an internal credit rating andcredit limit based on their Moody’s, S&P and Fitch ratings, commer-cially available credit reports and audited financial statements.
Wholesale Services Sequent has established credit policies todetermine and monitor the creditworthiness of counterparties, as wellas the quality of pledged collateral. Sequent also utilizes master net-ting agreements whenever possible to mitigate exposure to counter-party credit risk. When Sequent is engaged in more than oneoutstanding derivative transaction with the same counterparty and italso has a legally enforceable netting agreement with that counterparty,
AGL Resources Inc.
MD&A

Management’s Discussion and Analysis of Financial Condition and Results of Operations
65
the “net” mark-to-market exposure represents the netting of the pos-itive and negative exposures with that counterparty and a reasonablemeasure of Sequent’s credit risk. Sequent also uses other nettingagreements with certain counterparties with whom it conducts signif-icant transactions.
Master netting agreements enable Sequent to net certainassets and liabilities by counterparty. Sequent also nets across prod-uct lines and against cash collateral, provided the master netting andcash collateral agreements include such provisions. Additionally,Sequent may require counterparties to pledge additional collateralwhen deemed necessary. Sequent conducts credit evaluations andobtains appropriate internal approvals for its counterparty’s line ofcredit before any transaction with the counterparty is executed. Inmost cases, the counterparty must have a minimum long-term debtrating of Baa3 from Moody’s and BBB- from S&P. Generally, Sequentrequires credit enhancements by way of guaranty, cash deposit orletter of credit for transaction counterparties that do not meet theminimum ratings threshold.
Sequent, which provides services to Marketers and utility andindustrial customers, also has a concentration of credit risk as meas-ured by its 30-day receivable exposure plus forward exposure. As ofDecember 31, 2005, Sequent’s top 20 counterparties representedapproximately 52% of the total counterparty exposure of $554 million,derived by adding together the top 20 counterparties’ exposures anddividing by the total of Sequent’s counterparties’ exposures.
As of December 31, 2005, Sequent’s counterparties, or thecounterparties’ guarantors, had a weighted average S&P equivalentcredit rating of A-, which is consistent with the prior year. The S&Pequivalent credit rating is determined by a process of converting thelower of the S&P or Moody’s ratings to an internal rating ranging from9 to 1, with 9 being equivalent to AAA/Aaa by S&P and Moody’s and1 being D or Default by S&P and Moody’s. A counterparty that doesnot have an external rating is assigned an internal rating based on thestrength of the financial ratios of that counterparty.
To arrive at the weighted average credit rating, each counter-party’s assigned internal rating is multiplied by the counterparty’scredit exposure and summed for all counterparties. That sum isdivided by the aggregate total counterparties’ exposures, and thisnumeric value is then converted to an S&P equivalent. The followingtable shows Sequent’s commodity receivable and payable positionsas of December 31, 2005 and 2004.
As of:
December 31,
In millions 2005 2004
Gross receivables
Receivables with netting agreements in place:Counterparty is investment grade $462 $378Counterparty is non–investment grade 66 36Counterparty has no external rating 113 78
Receivables without netting agreements in place:Counterparty is investment grade 34 16Counterparty is non–investment grade — 6
Amount recorded on balance sheet $675 $514Gross payables
Payables with netting agreements in place:Counterparty is investment grade $456 $291Counterparty is non–investment grade 56 45Counterparty has no external rating 255 139
Payables without netting agreements in place:Counterparty is investment grade 4 40Counterparty is non–investment grade — 6Counterparty has no external rating 4 —
Amount recorded on balance sheet $775 $521
Sequent has certain trade and credit contracts that have explicitrating trigger events in case of a credit rating downgrade. These ratingtriggers typically give counterparties the right to suspend or terminatecredit if our credit ratings are downgraded to non–investment gradestatus. Under such circumstances, Sequent would need to post collateral to continue transacting business with some of its counter-parties. Posting collateral would have a negative effect on our liquidity.If such collateral were not posted, Sequent’s ability to continue trans-acting business with these counterparties would be impaired. If atDecember 31, 2005 Sequent’s credit ratings had been downgradedto non–investment grade status, the required amounts to satisfypotential collateral demands under such agreements betweenSequent and its counterparties would have totaled $51 million.
AGL Resources Inc.

66
As of:
In millions December 31, 2005 December 31, 2004
Current assets
Cash and cash equivalents $ 30 $ 49Receivables
Energy marketing 675 514Gas 303 180Unbilled revenues 246 189Other 11 21Less allowance for uncollectible accounts (15) (15)
Total receivables 1,220 889Inventories
Natural gas stored underground 509 320Other 34 12
Total inventories 543 332Energy marketing and risk management assets 103 44Unrecovered environmental remediation costs—current portion 31 27Unrecovered pipeline replacement program costs—current portion 27 24Other current assets 78 89
Total current assets 2,032 1,454Property, plant and equipment
Property, plant and equipment 4,791 4,615Less accumulated depreciation 1,520 1,437
Property, plant and equipment—net 3,271 3,178Deferred debits and other assets
Goodwill 422 354Unrecovered pipeline replacement program costs 276 337Unrecovered environmental remediation costs 165 173Other 85 141
Total deferred debits and other assets 948 1,005Total assets $6,251 $5,637
See Notes to Consolidated Financial Statements.
Consolidated Balance Sheets—Assets
AGL Resources Inc.

67
As of:
In millions, except share amounts December 31, 2005 December 31, 2004
Current liabilities
Energy marketing trade payable $ 775 $ 521Short-term debt 522 334Accounts payable—trade 264 207Energy marketing and risk management liabilities—current portion 101 15Accrued wages and salaries 43 49Customer deposits 42 50Deferred purchased gas adjustment 36 60Accrued interest 32 28Accrued pipeline replacement program costs—current portion 30 85Accrued environmental remediation costs—current portion 13 27Other current liabilities 81 98
Total current liabilities 1,939 1,474Accumulated deferred income taxes 423 437Long-term liabilities
Accrued pipeline replacement program costs 235 242Accumulated removal costs 94 94Accrued pension obligations 88 84Accrued environmental remediation costs 84 63Accrued postretirement benefit costs 54 58Other long-term liabilities 182 141
Total long-term liabilities 737 682Commitments and contingencies (see Note 10)Minority interest 38 36Capitalization
Long-term debt 1,615 1,623Common shareholders’ equity, $5 par value; 750 million shares authorized;
77.7 million and 76.7 million shares outstanding at December 31, 2005 and 2004 1,499 1,385Total capitalization 3,114 3,008
Total liabilities and capitalization $6,251 $5,637See Notes to Consolidated Financial Statements.
Consolidated Balance Sheets—Liabilities and Capitalization
AGL Resources Inc.

68
Years ended December 31,
In millions, except per share amounts 2005 2004 2003
Operating revenues $2,718 $1,832 $ 983Operating expenses
Cost of gas 1,626 995 339Operation and maintenance 477 377 283Depreciation and amortization 133 99 91Taxes other than income taxes 40 29 28
Total operating expenses 2,276 1,500 741Gain on sale of Caroline Street campus — — 16Operating income 442 332 258Equity in earnings of SouthStar Energy Services LLC — — 46Other losses (1) — (6)Minority interest (22) (18) —Interest expense (109) (71) (75)Earnings before income taxes 310 243 223Income taxes 117 90 87Income before cumulative effect of change in accounting principle 193 153 136Cumulative effect of change in accounting principle, net of $5 in taxes — — (8)Net income $ 193 $ 153 $ 128Per common share dataBasic
Income before cumulative effect of change in accounting principle $ 2.50 $ 2.30 $ 2.15Cumulative effect of change in accounting principle — — (0.12)
Basic earnings per common share $ 2.50 $ 2.30 $ 2.03Fully diluted
Income before cumulative effect of change in accounting principle $ 2.48 $ 2.28 $ 2.13Cumulative effect of change in accounting principle — — (0.12)
Fully diluted earnings per common share $ 2.48 $ 2.28 $ 2.01Cash dividends paid per common share $ 1.30 $ 1.15 $ 1.11Weighted average number of common shares outstanding:
Basic 77.3 66.3 63.1Fully diluted 77.8 67.0 63.7
See Notes to Consolidated Financial Statements.
Statements of Consolidated Income
AGL Resources Inc.

69
Other Shares held
Common stock Premium on Earnings comprehensive in treasury
In millions, except per share amounts Shares Amount common stock reinvested income and trust Total
Balance as of December 31, 2002 57.8 $289 $210 $279 $(49) $(19) $ 710Comprehensive income:
Net income — — — 128 — — 128Other comprehensive income (OCI)—
gain resulting from unfunded pension obligation (net of tax of $6) — — — — 8 — 8
Unrealized gain from equity investment hedging activities (net of tax) — — — — 1 — 1
Total comprehensive income 137Dividends on common stock ($1.11 per share) — — — (70) — — (70)Issuance of common shares:
Equity offering on February 14, 2003 6.7 32 105 — — — 137Benefit, stock compensation, dividend
reinvestment and stock purchase plans (net of tax benefit of $2) — 1 11 — — 19 31
Balance as of December 31, 2003 64.5 322 326 337 (40) — 945Comprehensive income:
Net income — — — 153 — — 153OCI—loss resulting from unfunded
pension obligation (net of tax benefit of $7) — — — — (11) — (11)Unrealized gain from hedging activities (net of tax of $2) — — — — 4 — 4Other — — — — 1 — 1
Total comprehensive income 147Dividends on common stock ($1.15 per share) — — — (75) — — (75)Issuance of common shares:
Equity offering on November 24, 2004 11.0 55 277 — — — 332Benefit, stock compensation, dividend
reinvestment and stock purchase plans (net of tax benefit of $5) 1.2 7 29 — — — 36
Balance as of December 31, 2004 76.7 384 632 415 (46) — 1,385Comprehensive income:
Net income — — — 193 — — 193OCI—loss resulting from unfunded pension
obligation (net of tax benefit of $3) — — — — (5) — (5)Unrealized loss from hedging activities
(net of tax benefit of $1) — — — — (2) — (2)Total comprehensive income 186
Dividends on common stock ($1.30 per share) — — — (100) — — (100)Issuance of common shares:
Benefit, stock compensation, dividend reinvestment and stock purchase plans (net of tax benefit of $9) 1.1 5 23 — — — 28
Balance as of December 31, 2005 77.8 $389 $655 $508 $(53) $ — $1,499See Notes to Consolidated Financial Statements.
Statements of Consolidated Common Shareholders’ Equity
AGL Resources Inc.

70
Years ended December 31,
In millions 2005 2004 2003
Cash flows from operating activitiesNet income $ 193 $ 153 $ 128Adjustments to reconcile net income to net cash flow provided by operating activities
Depreciation and amortization 133 99 91Minority interest 22 18 —Change in risk management assets and liabilities 27 (32) (1)Deferred income taxes 17 65 55Cumulative effect of change in accounting principle — — 13Cash received from equity interests — — 40Equity in earnings of unconsolidated subsidiaries — (2) (47)Gain on sale of Caroline Street campus — — (16)Other noncash adjustments 12 11 10
Changes in certain assets and liabilitiesPayables 311 247 61Inventories (211) (28) (91)Receivables (338) (264) (67)Other—net (88) 20 (54)
Net cash flow provided by operating activities 78 287 122Cash flows from investing activitiesExpenditures for property, plant and equipment (267) (264) (158)Sale of Saltville Gas Storage Company, LLC 66 — —Acquisition of NUI Corporation, net of cash acquired — (116) —Acquisition of Jefferson Island Storage & Hub, LLC — (90) —Purchase of Dynegy Inc.’s 20% ownership interest in SouthStar Energy Services LLC — — (20)Cash received from sale of Caroline Street campus — — 23Sale of US Propane LP — 31 —Other 7 17 10
Net cash flow used in investing activities (194) (422) (145)Cash flows from financing activitiesNet payments and borrowings of short-term debt 188 (480) (82)Sale of common stock 28 36 12Distribution to minority interest (19) (14) —Dividends paid on common shares (100) (75) (70)Issuances of senior notes — 450 225Equity offering — 332 137Sale of treasury shares — — 19Payments of medium-term notes — (82) (207)Other — — (3)
Net cash flow provided by financing activities 97 167 31Net (decrease) increase in cash and cash equivalents (19) 32 8Cash and cash equivalents at beginning of period 49 17 9Cash and cash equivalents at end of period $ 30 $ 49 $ 17
Cash paid during the period forInterest (net of allowance for funds used during construction of $2 million
for the years ended December 31, 2005, 2004 and 2003, respectively) $ 89 $ 50 $ 60Income taxes 89 27 23See Notes to Consolidated Financial Statements.
Statements of Consolidated Cash Flows
AGL Resources Inc.

71
1Accounting Policies and Methods of Application
General
AGL Resources Inc. is an energy services holding company that conducts substantially all its operations through its subsidiaries.Unless the context requires otherwise, references to “we,” “us,” “our”or the “company” mean consolidated AGL Resources Inc. and itssubsidiaries (AGL Resources). We have prepared the accompanyingconsolidated financial statements under the rules of the Securities andExchange Commission (SEC). For a glossary of key terms and refer-enced accounting standards, see pages 18–19.
Basis of Presentation
Our consolidated financial statements as of and for the periods endedDecember 31, 2005 include our accounts, the accounts of our majority-owned and controlled subsidiaries and the accounts of variable inter-est entities for which we are the primary beneficiary. This means thatour accounts are combined with the subsidiaries’ accounts. We havereclassified certain amounts from prior periods to conform to the current-period presentation. We have eliminated any intercompanyprofits and transactions between segments in consolidation; however,we have not eliminated intercompany profits when such amounts areprobable of recovery under the affiliates’ rate regulation process.
We use the equity method when we have a 20% to 50% vot-ing interest to account for and report investments when we exercisesignificant influence but do not control and when we are not the primary beneficiary as defined by Financial Accounting StandardsBoard (FASB) Interpretation No. 46, “Consolidation of Variable InterestEntities” (FIN 46). FIN 46 requires the primary beneficiary of a variableinterest entity’s activities to consolidate the variable interest entity. Theprimary beneficiary is the party that absorbs a majority of theexpected losses and/or receives a majority of the expected residualreturns of the variable interest entity’s activities.
We currently own a noncontrolling 70% financial interest in SouthStar Energy Services LLC (SouthStar), and Piedmont NaturalGas Company, Inc. (Piedmont) owns the remaining 30%. Our 70%
interest is noncontrolling because all significant management deci-sions require approval by both owners. Prior to 2004, we accountedfor our 70% noncontrolling financial ownership interest in SouthStarusing the equity method of accounting because SouthStar did notmeet the definition of a variable interest entity under FIN 46. Under theequity method, we reported our ownership interest in SouthStar as aninvestment in our consolidated balance sheets, and we reported ourshare of SouthStar’s earnings based on our ownership percentage inour statements of consolidated income as a component of otherincome. However, because SouthStar’s results of operations andfinancial condition were material to our financial results in 2003, wepresent below the summarized amounts for 100% of SouthStar.These results are not comparable with our reported earnings or lossesfrom SouthStar in 2003.
In millions 2003
Revenues $746Operating margin 124Operating income 63Net income from continuing operations 63
In December 2003, the FASB revised FIN 46 (FIN 46R) to addthe following conditions for determining whether an entity is a variableinterest entity:
▪ the voting rights of some investors are not proportional to their obli-gations to absorb the expected losses of the entity, their rights toreceive the expected residual returns of the entity, or both
▪ substantially all the entity’s activities (for example, purchasing prod-ucts and additional capital) either involve or are conducted on behalfof an investor that has disproportionately fewer voting rights
In 2004, we determined that SouthStar was a variable interestentity as defined in FIN 46R because our equal voting rights withPiedmont are not proportional to our economic obligation to absorb75% of any losses or residual returns from SouthStar. In addition,SouthStar obtains substantially all its transportation capacity for deliv-ery of natural gas through our wholly owned subsidiary, Atlanta GasLight Company (Atlanta Gas Light).
As of January 1, 2004, we adopted FIN 46R and consolidatedall SouthStar’s accounts with our subsidiaries’ accounts and elimi-nated any intercompany balances between segments. We recordedPiedmont’s portion of SouthStar’s earnings as a minority interest in
AGL Resources Inc.
NOTES

72
our consolidated statements of income, and we recorded Piedmont’sportion of SouthStar’s capital as a minority interest in our consolidatedbalance sheet.
Prior to our sale of Saltville Gas Storage Company, LLC(Saltville) in August 2005, we used the equity method to account forand report our 50% interest in Saltville. Saltville was a joint venturewith a subsidiary of Duke Energy Corporation to develop a high-deliverability natural gas storage facility in Saltville, Virginia. We usedthe equity method because we exercised significant influence over butdid not control the entity and because we were not the primary ben-eficiary as defined by FIN 46R.
Cash and Cash Equivalents
Our cash and cash equivalents consist primarily of cash on deposit,money market accounts and certificates of deposit with original matu-rities of three months or less.
Receivables and Allowance for Uncollectible Accounts
Our receivables consist of natural gas sales and transportation serv-ices billed to residential, commercial, industrial and other customers.We bill customers monthly, and accounts receivable are due within 30 days. For the majority of our receivables, we establish anallowance for doubtful accounts based on our collection experience.On certain other receivables where we are aware of a specific cus-tomer’s inability or reluctance to pay, we record an allowance fordoubtful accounts against amounts due to reduce the net receivablebalance to the amount we reasonably expect to collect. However, if cir-cumstances change, our estimate of the recoverability of accountsreceivable could be different. Circumstances that could affect our esti-mates include, but are not limited to, customer credit issues, the levelof natural gas prices, customer deposits and general economic con-ditions. We write off accounts once we deem them to be uncollectible.
Inventories
For our regulated subsidiaries, we record natural gas stored under-ground at weighted average costs, except for gas stored by AtlantaGas Light on behalf of SouthStar. For our nonregulated subsidiaries,primarily Sequent Energy Management, L.P. (Sequent), SouthStar andPivotal Jefferson Island Storage & Hub, LLC (Pivotal Jefferson Island),
we account for natural gas inventory at the lower of weighted averagecost or market. For volumes of gas stored by Sequent under park andloan arrangements that are payable or to be repaid at predetermineddates to third parties, we record the inventory at fair value. Materialsand supplies inventories are stated at the lower of average cost or market.
In Georgia’s competitive environment, Marketers—that is, mar-keters who are certificated by the Georgia Public Service Commission(Georgia Commission) to sell retail natural gas in Georgia includingSouthStar, the marketing affiliate of Atlanta Gas Light—began sellingnatural gas in 1998 to firm end-use customers at market-basedprices. Part of the unbundling process, which resulted from deregu-lation that provides for this competitive environment, is the assign-ment to Marketers of certain pipeline services that Atlanta Gas Lighthas under contract. Atlanta Gas Light assigns, on a monthly basis,the majority of the pipeline storage services that it has under contractto Marketers, along with a corresponding amount of inventory.
Property, Plant and Equipment
A summary of our property, plant and equipment (PP&E) by classifi-cation as of December 31, 2005 and 2004 is indicated in the follow-ing table.
In millions 2005 2004
Transmission and distribution $ 3,867 $ 3,731Storage 209 206Other 476 418Construction work in progress 239 260
Total gross PP&E 4,791 4,615Accumulated depreciation (1,520) (1,437)
Total net PP&E $ 3,271 $ 3,178
Distribution Operations PP&E expenditures consist of propertyand equipment that is in use, being held for future use and under con-struction. We report it at its original cost, which includes
▪ material and labor▪ contractor costs▪ construction overhead costs▪ an allowance for funds used during construction, which represents
the estimated cost of funds used to finance the construction ofmajor projects; they are capitalized in the rate base for ratemakingpurposes when the completed projects are placed in service
AGL Resources Inc.
NOTES

Notes to Consolidated Financial Statements 73
We charge property retired or otherwise disposed of to accu-mulated depreciation since such costs are recovered in rates.
Retail Energy Operations, Wholesale Services, Energy Invest-
ments and Corporate PP&E expenditures include property that isin use and under construction, and we report it at cost. We record again or loss for retired or otherwise disposed of property.
Depreciation Expense
We compute depreciation expense for distribution operations byapplying composite, straight-line rates (approved by the state regula-tory agencies) to the investment in depreciable property. The compos-ite straight-line depreciation rate for depreciable property excludingtransportation equipment for Atlanta Gas Light, Virginia Natural Gas, Inc. (Virginia Natural Gas) and Chattanooga Gas Company(Chattanooga Gas) was approximately 2.6% during 2005, 2.6% dur-ing 2004 and 2.7% during 2003. The composite, straight-line rate forElizabethtown Gas, Florida City Gas and Elkton Gas was approxi-mately 3.1% during 2005 and was 3.25% for December 2004. Wedepreciate transportation equipment on a straight-line basis over aperiod of 5 to 10 years. We compute depreciation expense for othersegments on a straight-line basis over a period of 1 to 35 years.
Allowance for Funds Used During Construction (AFUDC)
The applicable state regulatory agencies authorize Atlanta Gas Light,Elizabethtown Gas and Chattanooga Gas to record the cost of debtand equity funds as part of the cost of construction projects in ourconsolidated balance sheets and as AFUDC in the statements of con-solidated income. The Georgia Commission has authorized a rate of8.53%, and the Tennessee Regulatory Authority has authorized a rateof 7.43%. The New Jersey Board of Public Utilities (NJBPU) hasauthorized a variable rate based on the Federal Energy RegulatoryCommission (FERC) method of accounting for AFUDC. At Decem-ber 31, 2005 the rate was 4.33%. The capital expenditures of ourother regulated utilities do not qualify for AFUDC treatment.
Goodwill
We adopted Statement of Financial Accounting Standards (SFAS) No. 142, “Goodwill and Other Intangible Assets” (SFAS 142), effec-tive October 1, 2001. Under SFAS 142, we no longer amortize good-will. SFAS 142 further requires us to perform an initial goodwillimpairment assessment in the year of adoption and annual impair-ment tests thereafter. We have included $422 million of goodwill in ourconsolidated balance sheets, of which $231 million is related to ouracquisition of NUI Corporation (NUI) in November 2004 (see Note 2for further details); $170 million is related to our acquisition of Virginia Natural Gas in 2000, a decrease of $6 million from last yeardue to a deferred income tax adjustment made in 2005; $14 millionis related to our acquisition of Jefferson Island Storage & Hub, LLC(Jefferson Island) in October 2004; and $7 million is related to ouracquisition of Chattanooga Gas in 1988.
We annually assess goodwill for impairment as of our fiscal yearend at a reporting unit level, which generally equates to our operatingsegments as discussed in Note 14, and have not recognized anyimpairment charges for the years ended December 31, 2005, 2004and 2003. We also assess goodwill for impairment if events orchanges in circumstances may indicate an impairment of goodwillexists. When such events or circumstances are present, we assessthe recoverability of long-lived assets by determining whether the carrying value will be recovered through the expected future cashflows. In the event the sum of the expected future cash flows result-ing from the use of the asset is less than the carrying value of theasset, an impairment loss equal to the excess of the asset’s carryingvalue over its fair value is recorded. We conduct this assessment principally through a review of financial results, changes in state andfederal legislation and regulation, and the periodic regulatory filings forour regulated utilities.
Accumulated Deferred Income Taxes
The reporting of our assets and liabilities for financial accounting purposes differs from the reporting for income tax purposes. The principal differences between net income and taxable income relateto the timing of deductions, primarily due to the benefits of tax depre-ciation since we generally depreciate assets for tax purposes over ashorter period of time than for book purposes. We report the taxeffects of depreciation and other differences in those items as
AGL Resources Inc.

74
deferred income tax assets or liabilities in our consolidated balancesheets. Investment tax credits of approximately $19 million previouslydeducted for income tax purposes for Atlanta Gas Light, ChattanoogaGas and Elizabethtown Gas have been deferred for financial account-ing purposes and are being amortized as credits to income over the estimated lives of the related properties in accordance with reg-ulatory requirements.
Revenues
Distribution Operations We record revenues when services areprovided to customers. Those revenues are based on rates approvedby the regulatory state commissions of our utilities.
As required by the Georgia Commission, in July 1998, AtlantaGas Light began billing Marketers in equal monthly installments foreach residential, commercial and industrial customer’s distributioncosts. As required by the Georgia Commission, effective February 1,2001, Atlanta Gas Light implemented a seasonal rate design for thecalculation of each residential customer’s annual straight-fixed-variable (SFV) capacity charge, which is billed to Marketers andreflects the historic volumetric usage pattern for the entire residentialclass. Generally, this change results in residential customers beingbilled by Marketers for a higher capacity charge in the winter monthsand a lower charge in the summer months. This requirement has anoperating cash flow impact but does not change revenue recognition. As a result, Atlanta Gas Light continues to recognize its residentialSFV capacity revenues for financial reporting purposes in equalmonthly installments.
Any difference between the billings under the seasonal ratedesign and the SFV revenue recognized is deferred and reconciled toactual billings on an annual basis. Atlanta Gas Light had unrecoveredseasonal rates of approximately $11 million as of December 31, 2005and 2004 (included as current assets in the consolidated balancesheets) related to the difference between the billings under the sea-sonal rate design and the SFV revenue recognized.
The Elizabethtown Gas, Virginia Natural Gas, Florida City Gas,Chattanooga Gas and Elkton Gas rate structures include volumetricrate designs that allow recovery of costs through gas usage. Rev-enues from sales and transportation services are recognized in thesame period in which the related volumes are delivered to customers.Sales revenues from residential and certain commercial and industrialcustomers are recognized on the basis of scheduled meter readings.
In addition, revenues are recorded for estimated deliveries of gas, notyet billed to these customers, from the meter reading date to the endof the accounting period. These are included in the consolidated bal-ance sheets as unbilled revenue. For other commercial and indus-trial customers and all wholesale customers, revenues are based onactual deliveries to the end of the period.
The tariffs for Elizabethtown Gas, Virginia Natural Gas andChattanooga Gas contain weather normalization adjustments (WNAs)that largely mitigate the impact of unusually cold or warm weather oncustomer billings and operating margin. The WNA’s purpose is toreduce the effect of weather on customer bills by reducing bills whenwinter weather is colder than normal and increasing bills whenweather is warmer than normal.
Wholesale Services Wholesale services’ revenues are recordedwhen services are provided to customers. Intercompany profits fromsales between segments are eliminated in the corporate segment andare recognized as goods or services sold to end-use customers.Transactions that qualify as derivatives under SFAS No. 133,“Accounting for Derivative Instruments and Hedging Activities” (SFAS133), are recorded at fair value with changes in fair value recorded asrevenues in our statements of income.
Prior to 2003, in accordance with SFAS 133, we accounted fornonderivative energy and energy-related activities in accordance withEmerging Issues Task Force (EITF) Issue No. 98-10, “Accounting forContracts Involved in Energy Trading and Risk Management Activi-ties” (EITF 98-10). Under these methods, we recorded energy com-modity contracts (including physical transactions and financialinstruments) at fair value and reflected unrealized gains and/or lossesin earnings in the period of change. Effective January 1, 2003, weadopted EITF 02-03, “Issues Involved in Accounting for Contractsunder EITF Issue No. 98-10, ‘Accounting for Contracts Involved inEnergy Trading and Risk Management Activities’” (EITF 02-03), which rescinded the provisions of EITF 98-10 and reached two gen-eral conclusions:
▪ Contracts that do not meet the definition of a derivative under SFAS 133 should not be marked to fair market value.
▪ Revenues should be shown in the statement of consolidatedincome net of costs associated with trading activities, whether ornot the trades are physically settled.
AGL Resources Inc.
NOTES

Notes to Consolidated Financial Statements 75
As a result of our adoption of EITF 02-03, we adjusted the carrying value of our nonderivative trading instruments (principallystorage capacity contracts) to zero and now account for them usingthe accrual method of accounting. In addition, we adjusted the valueof our natural gas inventories used in wholesale services to the lowerof average cost or market (they were previously recorded at fair value).This resulted in the cumulative effect of a change in accounting prin-ciple in our statements of consolidated income of $13 million ($8 mil-lion net of taxes). We also began reporting our trading activity on a netbasis (revenues net of associated costs). This reclassification had noimpact on our previously reported net income or shareholders’ equity.
Cost of Gas
Excluding Atlanta Gas LIght, we charge our utility customers for thenatural gas they consume using purchased gas adjustment (PGA)mechanisms set by the state regulatory agencies. Under the PGA, wedefer (that is, include as a current asset or liability in the consolidatedbalance sheets and exclude from the statements of consolidatedincome) the difference between the actual cost of gas and what is col-lected from or billed to customers in a given period. The deferredamount is either billed or refunded to our customers prospectivelythrough adjustments to the commodity rate.
Stock-based Compensation
We have several stock-based employee compensation plans andaccount for these plans under the recognition and measurement prin-ciples of Accounting Principles Board (APB) Opinion No. 25,“Accounting for Stock Issued to Employees” (APB 25), and relatedinterpretations. For our stock option plans, we generally do not reflectstock-based employee compensation cost in net income, as optionsfor those plans had an exercise price equal to the market value of theunderlying common stock on the date of grant. For our stock appre-ciation rights, we reflect stock-based employee compensation costbased on the fair value of our common stock at the balance sheetdate since these awards constitute a variable plan under APB 25. Thefollowing table illustrates the effect on our net income and earningsper share had we applied the fair value recognition provisions of SFASNo. 123, “Accounting for Stock-Based Compensation” (SFAS 123).
In millions, except per share amounts 2005 2004 2003
Net income, as reported $ 193 $ 153 $ 128Deduct: Total stock-based employee
compensation expense determined under fair value based method for all awards, net of related tax effect (1) (1) (1)
Pro-forma net income $ 192 $ 152 $ 127Earnings per share:Basic—as reported $2.50 $2.30 $2.03Basic—pro-forma $2.48 $2.28 $2.02Fully diluted—as reported $2.48 $2.28 $2.01Fully diluted—pro-forma $2.47 $2.26 $2.00
Comprehensive Income
Our comprehensive income includes net income plus other compre-hensive income (OCI), which includes other gains and losses affect-ing shareholders’ equity that accounting principles generally acceptedin the United States of America (GAAP) exclude from net income.Such items consist primarily of unrealized gains and losses on certainderivatives designated as cash flow hedges and minimum pension liability adjustments. The following table illustrates our OCI activityfor the years ended December 31, 2005, 2004 and 2003.
In millions 2005 2004 2003
Cash flow hedges:Net derivative unrealized gains
(losses) arising during the period (net of $3, $3 and $1 in taxes) $ 5 $ 6 $ (1)
Less reclassification of realized (gains) losses included in income (net of $4, $1 and $2 in taxes) (7) (2) 2
Unfunded pension obligation (net of $3, $7 and $6 in taxes) (5) (11) 8
Other (net of tax) — 1 —Total $ (7) $ (6) $ 9
AGL Resources Inc.

76
Earnings Per Common Share
We compute basic earnings per common share by dividing ourincome available to common shareholders by the daily weighted aver-age number of common shares outstanding. Fully diluted earningsper common share reflect the potential reduction in earnings per com-mon share that could occur when potentially dilutive common sharesare added to common shares outstanding.
We derive our potentially dilutive common shares by calculat-ing the number of shares issuable under performance units and stockoptions. The future issuance of shares underlying the performanceunits depends on the satisfaction of certain performance criteria. Thefuture issuance of shares underlying the outstanding stock optionsdepends on whether the exercise prices of the stock options are lessthan the average market price of the common shares for the respec-tive periods. No items are antidilutive. The following table shows thecalculation of our fully diluted earnings per share for the periods pre-sented if performance units currently earned under the plan ultimatelyvest and if stock options currently exercisable at prices below theaverage market prices are exercised.
In millions 2005 2004 2003
Denominator for basic earnings per share1 77.3 66.3 63.1
Assumed exercise of potential common shares 0.5 0.7 0.6
Denominator for fully diluted earnings per share 77.8 67.0 63.7
1 Daily weighted average shares outstanding.
Use of Accounting Estimates
The preparation of our financial statements in conformity with GAAPrequires management to make estimates and assumptions that affectthe reported amounts of assets, liabilities, revenues and expenses.The most significant estimates include our regulatory accounting, theallowance for doubtful accounts, allowance for contingencies, pipelinereplacement program (PRP) accruals, environmental liability accruals,unbilled revenue recognition, pension and postretirement obligations,derivative and hedging activities, and purchase price allocations.Actual results could differ from those estimates.
2Acquisition of NUI
On November 30, 2004, we acquired NUI for approximately $825 mil-lion, including the assumption of $709 million in debt. The acquisitionsignificantly expands our existing natural gas utilities, storage andpipeline businesses. During 2005, we adjusted our purchase price allo-cation by $74 million for additional known items, including adjustmentsrelated to pension obligations; severance; lease obligations related toNUI’s former corporate offices; environmental remediation liabilities;income tax liabilities; and asset sales. In connection with the acquisi-tion, we incurred $25 million in employee-related restructuring charges.As of December 31, 2005, $5 million of these payments remained tobe paid. Our purchase price allocation as of December 31, 2004 and2005 and the goodwill adjustments are indicated in the following table.
Dec. 31, Dec. 31,
In millions 2004 Adjustments 2005
Purchase price $ 825 $ — $ 825
Current assets 299 (1) 298
Property, plant and equipment 612 (15) 597
Other long-term assets 117 (21) 96
Goodwill 157 74 231
Current liabilities excluding debt (108) (4) (112)
Short-term debt and capital leases (502) — (502)
Long-term debt and capital leases (207) — (207)
Other long-term liabilities (143) (31) (174)
Equity 225 2 227
We believe the acquisition resulted in the recognition of good-will primarily because of the strength of NUI’s underlying assets andthe synergies and opportunities in the regulated utilities.
AGL Resources Inc.
NOTES

Notes to Consolidated Financial Statements 77
The table below reflects the unaudited pro-forma results of AGLResources and NUI for the years ended December 31, 2004 and2003 as if the acquisition and related financing had taken place onJanuary 1. The pro-forma results are not necessarily indicative of theresults that would have occurred if the acquisition had been in effectfor the periods presented. In addition, the pro-forma results are notintended to be a projection of future results and do not reflect anysynergies that might be achieved from combining the operations oreliminating significant expenses that NUI incurred in its last year ofoperations. Our results of operations for 2004 include one month ofthe acquired operations of NUI.
In millions, except per share amounts 2004 2003
Operating revenue $2,343 $1,630Income before cumulative effect
of change in accounting principle 105 88Net income 105 74Net income per fully diluted share 1.44 1.05
Sale of Saltville In August 2005, we sold our 50% interest inSaltville and associated subsidiaries (Virginia Gas Pipeline and VirginiaGas Storage) to a subsidiary of Duke Energy Corporation, the other50% partner in the Saltville joint venture. We acquired these assets aspart of our purchase of NUI. We received $66 million in cash at clos-ing, which included $4 million in working capital adjustments, andused the proceeds to repay debt and for other general corporate pur-poses. The transaction was reflected as a decrease of $4 million ingoodwill associated with the NUI acquisition.
Sale of Other NUI Assets In 2005, we sold an appliance businessin Florida and Virginia Gas Distribution Company for proceeds total-ing $7 million, which approximated their amounts on our consolidatedbalance sheets and have been recorded as adjustments to goodwill.
3Recent Accounting Pronouncements
SFAS 123(R) In December 2004, the FASB issued SFAS No. 123(R),“Accounting for Stock-Based Compensation” (SFAS 123R). SFAS123R revises the guidance in SFAS 123 and supersedes APB 25 andits related implementation guidance. SFAS 123R focuses primarily onthe accounting for share-based payments to employees in exchangefor services, and it requires a public entity to measure and recognizecompensation cost for these payments. Our share-based paymentsare typically in the form of stock option and performance unit awards.The primary change in accounting under SFAS 123R is related to therequirement to recognize compensation cost for stock option awardsthat was not recognized under APB 25. SFAS 123R requires com-pensation cost to be measured based on the fair value of the equityor liability instruments issued. For stock option awards, fair valuewould be estimated using an option pricing model such as the Black-Scholes model.
SFAS 123R is effective for equity compensation expense in fis-cal years beginning after December 15, 2005, and we will adopt itprospectively on January 1, 2006. We have assessed the impactSFAS 123R will have on our consolidated financial statements, andwe believe the pro-forma effects on our earnings of recognizing com-pensation expense related to our stock option awards, contained inNote 1, serves as a reasonable proxy for the impact of this statement(approximately $1 million net of income taxes for 2006 and 2007based on unvested stock options as of December 31, 2005).
AGL Resources Inc.

78
FIN 47 In March 2005, the FASB issued FASB Interpretation No. 47, “Accounting for Conditional Asset Retirement Obligations, aninterpretation of FASB Statement No. 143” (FIN 47). Asset retirementobligations (AROs) are legal obligations associated with the retirementof long-lived assets that result from the acquisition, construction,development and/or normal operation of a long-lived asset, exceptfor certain obligations of lessees. FIN 47 clarifies that liabilities asso-ciated with asset retirement obligations whose timing or settlementmethod are conditional on future events should be recorded at fairvalue as soon as fair value is reasonably estimable. FIN 47 also pro-vides guidance on the information required to reasonably estimate thefair value of the liability. FIN 47 is intended to result in
▪ more consistent recognition of liabilities relating to AROs amongcompanies
▪ more information about expected future cash outflows associatedwith those obligations stemming from the retirement of the asset(s)
▪ more information about investments in long-lived assets becauseadditional asset retirement costs will be recognized by increasingthe carrying amounts of the assets identified to be retired
FIN 47 is effective for fiscal years ending after December 15,2005. We adopted the provisions of FIN 47 during the fourth quarterof 2005. The impact of adoption was not material.
4Risk Management
Our risk management activities are monitored by our Risk Manage-ment Committee (RMC). The RMC consists of senior managementand is charged with reviewing and enforcing our risk managementactivities. Our risk management policies limit the use of derivativefinancial instruments and physical transactions within predefined risktolerances associated with pre-existing or anticipated physical natu-ral gas sales and purchases and system use and storage. We use thefollowing derivative financial instruments and physical transactions tomanage commodity price risks:
▪ forward contracts▪ futures contracts▪ options contracts▪ financial swaps▪ storage and transportation capacity transactions
Interest Rate Swaps
To maintain an effective capital structure, it is our policy to borrowfunds using a mix of fixed-rate and variable-rate debt. We haveentered into interest rate swap agreements through our whollyowned subsidiary, AGL Capital Corporation (AGL Capital), for thepurpose of managing the interest rate risk associated with our fixed-rate and variable-rate debt obligations. We designated these interestrate swaps as fair value hedges as prescribed by SFAS 133, whichallows us to designate derivatives that hedge exposure to changesin the fair value of a recognized asset or liability. We record the gainor loss on fair value hedges in earnings in the period of change,together with the offsetting loss or gain on the hedged item attrib-utable to the risk being hedged.
We adjust the carrying value of each interest rate swap to its fairvalue at the end of each period, with an offsetting and equal adjust-ment to the carrying value of the debt securities whose fair value isbeing hedged. Consequently, our earnings are not affected negativelyor positively by changes in the fair value of the interest swaps.
AGL Resources Inc.
NOTES

Notes to Consolidated Financial Statements 79
As of December 31, 2005, a notional principal amount of $100 million of these interest rate swap agreements effectively con-verted the interest expense associated with a portion of our seniornotes from fixed rates to variable rates based on an interest rate equalto the London Interbank Offered Rate (LIBOR), plus a spread deter-mined at the swap date. The floating rate swap rate for our interestrate swaps for the year ended December 31, 2005 was 7.21%.
At the beginning of 2005, we had $75 million of outstandinginterest rate swap agreements associated with our Note Payable atAGL Capital Trust II. On September 7, 2005, we terminated these inter-est rate swap agreements. We received a payment of $1 million relatedto this termination, which included accrued interest and the fair value ofthese interest rate swap agreements at the termination date.
In September 2005, we also executed five treasury-lock agree-ments totaling $125 million to hedge the interest rate risk associatedwith an anticipated 2006 financing. The agreements will result in a4.11% interest rate on the 10-year United States Treasury bondagainst which we will be measured in issuing our own debt securitiesand the agreements were designated as cash flow hedges againstthe future interest payments on the anticipated financing. The fairvalue of this agreement was $3 million at December 31, 2005, withthe increase in the fair value included as a credit to OCI.
Commodity-related Derivative Instruments
Elizabethtown Gas A program mandated by the NJBPU requiresElizabethtown Gas to utilize certain derivatives to hedge the impact ofmarket fluctuations in natural gas prices. Pursuant to SFAS 133, suchderivative products are marked to market each reporting period. Inaccordance with regulatory requirements, realized gains and lossesrelated to these derivatives are reflected in purchased gas costs andultimately included in billings to customers. As of December 31, 2005,Elizabethtown Gas had entered into New York Mercantile Exchange(NYMEX) futures contracts to purchase approximately 8.3 billion cubicfeet (Bcf) of natural gas and the fair values of these derivatives werereflected in our consolidated financial statements as an asset of $17 million and a liability of $21 million. Approximately 81% of thesecontracts have a duration of one year or less, and none of these con-tracts extends beyond October 2007.
Sequent We are exposed to risks associated with changes in themarket price of natural gas. Sequent uses derivative financial instru-ments to reduce our exposure to the risk of changes in the prices ofnatural gas. The fair value of these derivative financial instrumentsreflects the estimated amounts that we would receive or pay to ter-minate or close the contracts at the reporting date, taking intoaccount the current unrealized gains or losses on open contracts. Weuse external market quotes and indices to value substantially all thefinancial instruments we use.
We mitigate substantially all the commodity price risk associ-ated with Sequent’s natural gas portfolio by locking in the economicmargin at the time we enter into natural gas purchase transactions forour stored natural gas. We purchase natural gas for storage when thedifference in the current market price we pay to buy and transportnatural gas plus the cost to store the natural gas is less than the mar-ket price we can receive in the future, resulting in a positive net profitmargin. We use NYMEX futures contracts and other over-the-counterderivatives to sell natural gas at that future price to substantially lockin the profit margin we will ultimately realize when the stored gas isactually sold. These futures contracts meet the definition of deriva-tives under SFAS 133, are recorded at fair value and are marked tomarket in our consolidated balance sheets, with changes in fair valuerecorded in earnings in the period of change. The purchase, trans-portation, storage and sale of natural gas are accounted for on aweighted average basis rather than on the mark-to-market basis weutilize for the derivatives used to mitigate the commodity price riskassociated with our storage portfolio. This difference in accountingcan result in volatility in our reported net income, even though theeconomic margin is essentially unchanged from the date the transac-tions were consummated.
At December 31, 2005, Sequent’s commodity-related deriva-tive financial instruments represented purchases (long) of 411 Bcf andsales (short) of 464 Bcf, with approximately 94% of these scheduledto mature in less than two years and the remaining 6% in three to nineyears. At December 31, 2005, the fair values of these derivatives werereflected in our consolidated financial statements as an asset of $80 million and a liability of $97 million. Excluding the cumulativeeffect of a change in accounting principle in 2003, our unrealized losswas $30 million in 2005, and we had unrealized gains of $22 millionin 2004 and $1 million in 2003.
AGL Resources Inc.

80
SouthStar The commodity-related derivative financial instruments(futures, options and swaps) used by SouthStar manage exposuresarising from changing commodity prices. SouthStar’s objective forholding these derivatives is to utilize the most effective method toreduce or eliminate the impact of this exposure. We have designateda portion of SouthStar’s derivative transactions as cash flow hedgesunder SFAS 133. We record derivative gains or losses arising fromcash flow hedges in OCI and reclassify them into earnings in the sameperiod as the settlement of the underlying hedged item. We recordany hedge ineffectiveness, defined as when the gains or losses on thehedging instrument do not offset and are greater than the losses orgains on the hedged item, in cost of gas in our statement of consol-idated income in the period in which it occurs. SouthStar currently hasminimal hedge ineffectiveness. We have not designated the remain-der of SouthStar’s derivative instruments as hedges under SFAS 133and, accordingly, we record changes in their fair value in earnings inthe period of change.
At December 31, 2005, the fair values of these derivatives werereflected in our consolidated financial statements as an asset of $7 million and a liability of $4 million. The maximum maturity of openpositions is less than one year and represents purchases and sales of3.2 Bcf.
SouthStar also enters both exchange and over-the-counterderivative transactions to hedge commodity price risk. Credit risk is mitigated for exchange transactions through the backing of the NYMEX’s member firms. For over-the-counter transactions,SouthStar utilizes master netting arrangements to reduce overallcredit risk. As of December 31, 2005, SouthStar’s maximum expo-sure to any single over-the-counter counterparty was $2 million.
Concentration of Credit Risk
Atlanta Gas Light Concentration of credit risk occurs at AtlantaGas Light for amounts billed for services and other costs to its cus-tomers, which consist of 10 Marketers in Georgia. The credit riskexposure to Marketers varies seasonally, with the lowest exposure inthe nonpeak summer months and the highest exposure in the peakwinter months. Marketers are responsible for the retail sale of natu-ral gas to end-use customers in Georgia. These retail functionsinclude customer service, billing, collections, and the purchase and
sale of natural gas. Atlanta Gas Light’s tariff allows it to obtain secu-rity support in an amount equal to a minimum of two times a Marketer’s highest month’s estimated bill from Atlanta Gas Light.
Wholesale Services Sequent has a concentration of credit risk forservices it provides to marketers and to utility and industrial cus-tomers. This credit risk is measured by 30-day receivable exposureplus forward exposure, which is generally concentrated in 20 of itscustomers. Sequent evaluates the credit risk of its customers using aStandard & Poor’s Ratings Services (S&P) equivalent credit rating,which is determined by a process of converting the lower of the S&Por Moody’s Investors Service (Moody’s) rating to an internal ratingranging from 9.00 to 1.00, with 9.00 being equivalent to AAA/Aaaby S&P and Moody’s and 1.00 being equivalent to D or Default byS&P and Moody’s. A customer that does not have an external ratingis assigned an internal rating based on Sequent’s analysis of thestrength of its financial ratios. At December 31, 2005, Sequent’s top20 customers represented approximately 52% of the total credit expo-sure of $554 million, derived by adding together the top 20 customers’exposures and dividing by the total of Sequent’s counterparties’ expo-sures. Sequent’s customers or the customers’ guarantors had aweighted average S&P equivalent rating of A- at December 31, 2005.
The weighted average credit rating is obtained by multiplyingeach customer’s assigned internal rating by its credit exposure andthen adding the individual results for all counterparties. That total isdivided by the aggregate total exposure. This numeric value is con-verted to an S&P equivalent.
Sequent has established credit policies to determine and mon-itor the creditworthiness of counterparties, including requirements forposting of collateral or other security, as well as the quality of pledgedcollateral. Collateral or credit security is most often in the form ofcash or letters of credit from an investment-grade financial institution,but may also include cash or U.S. Government Securities held by atrustee. When Sequent is engaged in more than one outstandingderivative transaction with the same counterparty and it also has alegally enforceable netting agreement with that counterparty, the“net” mark-to-market exposure represents the netting of the positiveand negative exposures with that counterparty and a reasonablemeasure of Sequent’s credit risk. Sequent also uses other nettingagreements with certain counterparties with which it conducts sig-nificant transactions.
AGL Resources Inc.
NOTES

Notes to Consolidated Financial Statements 81
5Regulatory Assets and Liabilities
We have recorded regulatory assets and liabilities in our consolidatedbalance sheets in accordance with SFAS No. 71, “Accounting for theEffects of Certain Types of Regulation” (SFAS 71). Our regulatoryassets and liabilities, and associated liabilities for our unrecoveredPRP costs and unrecovered environmental remediation costs (ERC),are summarized in the table below.
December 31,
In millions 2005 2004
Regulatory assets
Unrecovered PRP costs $303 $361Unrecovered ERC 196 200Unrealized loss on hedging derivatives 17 6Unrecovered postretirement benefit costs 14 14Unrecovered seasonal rates 11 11Unrecovered PGA 8 2Regulatory tax asset 1 2Other 9 20
Total regulatory assets $559 $616Regulatory liabilities
Accumulated removal costs $ 94 $ 94Deferred PGA 36 60Unrealized gain on hedging derivatives 21 6Unamortized investment tax credit 19 20Regulatory tax liability 15 14Other 6 12
Total regulatory liabilities 191 206Associated liabilities
PRP costs 265 327ERC 97 90
Total associated liabilities 362 417Total regulatory and associated liabilities $553 $623
Our regulatory assets are recoverable through either rate ridersor base rates specifically authorized by a state regulatory commission.Base rates are designed to provide both a recovery of cost and areturn on investment during the period rates are in effect. As such, allour regulatory assets are subject to review by the respective state reg-ulatory commission during any future rate proceedings. In the eventthat the provisions of SFAS 71 were no longer applicable, we wouldrecognize a write-off of net regulatory assets (regulatory assets lessregulatory liabilities) that would result in a charge to net income, whichwould be classified as an extraordinary item. However, although thenatural gas distribution industry is becoming increasingly competitive,our utility operations continue to recover their costs through cost-based rates established by the state regulatory commissions. As aresult, we believe that the accounting prescribed under SFAS 71remains appropriate. It is also our opinion that all regulatory assets arerecoverable in future rate proceedings, and therefore we have notrecorded any regulatory assets that are recoverable but are not yetincluded in base rates or contemplated in a rate rider.
All the regulatory assets included in the table above areincluded in base rates except for the unrecovered PRP costs, unre-covered ERC and deferred PGA, which are recovered through spe-cific rate riders. The rate riders that authorize recovery of unrecoveredPRP costs and the deferred PGA include both a recovery of costsand a return on investment during the recovery period. We have tworate riders that authorize the recovery of unrecovered ERC. The ERCrate rider for Atlanta Gas Light only allows for recovery of the costsincurred and the recovery period occurs over the five years after theexpense is incurred. ERC associated with the investigation and reme-diation of Elizabethtown Gas remediation sites located in the stateof New Jersey are recovered under a remediation adjustment clauseand include the carrying cost on unrecovered amounts not currentlyin rates.
The regulatory liabilities are refunded to ratepayers through arate rider or base rates. If the regulatory liability is included in baserates, the amount is reflected as a reduction to the rate base in set-ting rates.
AGL Resources Inc.

82
Pipeline Replacement Program
The PRP, ordered by the Georgia Commission to be administered byAtlanta Gas Light, requires, among other things, that Atlanta Gas Lightreplace all bare steel and cast iron pipe in its system in the state ofGeorgia within a 10-year period beginning October 1, 1998. AtlantaGas Light identified, and provided notice to the Georgia Commissionof, 2,312 miles of pipe to be replaced. Atlanta Gas Light has subse-quently identified an additional 320 miles of pipe subject to replace-ment under this program. If Atlanta Gas Light does not perform inaccordance with this order, it will be assessed certain nonperformancepenalties. October 1, 2005 marked the beginning of the eighth year ofthe 10-year PRP.
The order also provides for recovery of all prudent costs incurredin the performance of the program, which Atlanta Gas Light hasrecorded as a regulatory asset. Atlanta Gas Light will recover from end-use customers, through billings to Marketers, the costs related to theprogram net of any cost savings from the program. All such amountswill be recovered through a combination of SFV rates and a pipelinereplacement revenue rider. The regulatory asset has two components:
▪ the costs incurred to date that have not yet been recovered throughthe rate rider
▪ the future expected costs to be recovered through the rate rider
On June 10, 2005, Atlanta Gas Light and the Georgia Commis-sion entered into a Settlement Agreement that, among other things,extends Atlanta Gas Light’s PRP by five years to require that allreplacements be completed by December 2013. The timing ofreplacements was subsequently specified in an amendment to thePRP stipulation. This amendment, which was approved by the GeorgiaCommission on December 20, 2005, requires Atlanta Gas Light toreplace all cast iron pipe and 70% of all bare steel pipe by Decem-ber 2010. The remaining 30% of bare steel pipe is required to bereplaced by December 2013. The amendment requires an evaluationby Atlanta Gas Light and the Georgia Commission staff of 22 miles of24-inch pipe in Atlanta by December 2010 to determine if such piperequires replacement. If replacement of this pipe is required, the pipemust be replaced by December 2013. The additional cost to replacethis pipe is projected to be approximately $37 million.
Under the Settlement Agreement, base rates charged to cus-tomers will remain unchanged through April 30, 2010, but Atlanta GasLight will recognize reduced base rate revenues of $5 million on anannual basis through April 30, 2010. The five-year total reduction inrecognized base rate revenues of $25 million will be applied to theallowed amount of costs incurred to replace pipe, which will reducethe amounts recovered from customers under the PRP rider. The Set-tlement Agreement also set the per customer PRP rate that AtlantaGas Light will charge a fixed rate at $1.29 per customer per monthfrom May 2005 through September 2008 and at $1.95 from October2008 through December 2013 and includes a provision that allowsfor a true-up of any over- or under-recovery of PRP revenues that mayresult from a difference between PRP charges collected through fixedrates and actual PRP revenues recognized through the remainder ofthe program.
The Settlement Agreement also allows Atlanta Gas Light torecover through the PRP $4 million of the $32 million capital costsassociated with its purchase of 250 miles of pipeline in central Georgiafrom Southern Natural Gas Company, a subsidiary of El Paso Corpo-ration. The remaining capital costs are included in Atlanta Gas Light’srate base and collected through base rates.
Atlanta Gas Light has recorded a long-term regulatory asset of$276 million, which represents the expected future collection of bothexpenditures already incurred and expected future capital expendi-tures to be incurred through the remainder of the program. AtlantaGas Light has also recorded a current asset of $27 million, which rep-resents the expected amount to be collected from customers over thenext 12 months. The amounts recovered from the pipeline replace-ment revenue rider during the last three years were
▪ $26 million in 2005▪ $28 million in 2004▪ $15 million in 2003
As of December 31, 2005, Atlanta Gas Light had recorded acurrent liability of $30 million, representing expected program expen-ditures for the next 12 months, and a long-term liability of $235 mil-lion, representing expected program expenditures from 2007 throughthe end of the program in 2013.
AGL Resources Inc.
NOTES

Notes to Consolidated Financial Statements 83
Atlanta Gas Light capitalizes and depreciates the capital expen-diture costs incurred from the PRP over the life of the assets. Opera-tion and maintenance costs are expensed as incurred. Recoveries,which are recorded as revenue, are based on a formula that allowsAtlanta Gas Light to recover operation and maintenance costs inexcess of those included in its current base rates, depreciationexpense and an allowed rate of return on capital expenditures. In thenear term, the primary financial impact to Atlanta Gas Light from thePRP is reduced cash flow from operating and investing activities, asthe timing related to cost recovery does not match the timing of whencosts are incurred. However, Atlanta Gas Light is allowed the recoveryof carrying costs on the under-recovered balance resulting from thetiming difference.
Environmental Remediation Costs
We are subject to federal, state and local laws and regulations gov-erning environmental quality and pollution control. These laws andregulations require us to remove or remedy the effect on the envi-ronment of the disposal or release of specified substances at cur-rent and former operating sites.
Atlanta Gas Light The presence of coal tar and certain otherbyproducts of a natural gas manufacturing process used to producenatural gas prior to the 1950s has been identified at or near 10 for-mer Atlanta Gas Light operating sites in Georgia and at 3 sites ofpredecessor companies in Florida. Atlanta Gas Light has active envi-ronmental remediation or monitoring programs in effect at 10 of thesesites. Two sites in Florida are currently in the investigation or prelimi-nary engineering design phase, and one Georgia site has beendeemed compliant with state standards.
Atlanta Gas Light has customarily reported estimates of futureremediation costs for these former sites based on probabilistic mod-els of potential costs. These estimates are reported on an undis-counted basis. As cleanup options and plans mature and cleanupcontracts are entered into, Atlanta Gas Light is better able to pro-vide conventional engineering estimates of the likely costs of reme-diation at its former sites. These estimates contain various engineeringuncertainties, but Atlanta Gas Light continuously attempts to refineand update these engineering estimates.
Atlanta Gas Light’s current engineering estimate projects costsof $12 million to complete site remediation in Georgia and Florida,excluding monitoring. This is a reduction of $24 million from last year’sestimate, resulting primarily from program expenditures. During thesame 12-month period Atlanta Gas Light realized changes in its futurecost estimates totaling $6 million related to
▪ an increase in the contract value at its Augusta, Georgia site fortreatment of two areas and a reduction of $2 million in groundwatercosts related to active treatment system operations
▪ a decrease at its Savannah, Georgia site of $4 million for ground-water treatment costs and contractual liability
▪ a decrease of $1 million at its Griffin, Georgia site for groundwatertreatment costs
▪ an increase of $1 million for additional remediation and investigativecosts at its various sites in Georgia and Florida
The current estimate for the remaining cost of future actionsat these former operating sites is $15 million, which may changedepending on whether future measures for groundwater will berequired. Atlanta Gas Light estimates certain other costs related toadministering the remediation program, including administrative costs,to be $4 million.
These liabilities do not include other potential expenses, suchas unasserted property damage claims, personal injury or naturalresource damage claims, unbudgeted legal expenses or other costsfor which Atlanta Gas Light may be held liable but with respect towhich it cannot reasonably estimate an amount. As of December 31,2005, the remediation expenditures expected to be incurred over thenext 12 months are reflected as a current liability of $10 million.
AGL Resources Inc.

84
The ERC liability is included as a corresponding regulatoryasset, which is a combination of accrued ERC and unrecovered cashexpenditures for investigation and cleanup costs. Atlanta Gas Lighthas three ways of recovering investigation and cleanup costs. First,the Georgia Commission has approved an ERC recovery rider. TheERC recovery mechanism allows for recovery of expenditures over afive-year period subsequent to the period in which the expendituresare incurred. Atlanta Gas Light expects to collect $29 million in rev-enues over the next 12 months under the ERC recovery rider, whichis reflected as a current asset. The amounts recovered from the ERCrecovery rider during the last three years were
▪ $28 million in 2005▪ $25 million in 2004▪ $23 million in 2003
The second way to recover costs is by exercising the legalrights Atlanta Gas Light believes it has to recover a share of its costsfrom other potentially responsible parties, typically former owners oroperators of these sites. There were no material recoveries frompotentially responsible parties during 2005, 2004 or 2003. The thirdway to recover costs is from the receipt of net profits from the saleof remediated property. There were no sales of property during 2005.
Elizabethtown Gas In New Jersey, Elizabethtown Gas is currentlyconducting remediation activities with oversight from the New JerseyDepartment of Environmental Protection. Although we cannot esti-mate the actual total cost of future environmental investigation andremediation efforts with precision, based on probabilistic models sim-ilar to those used at Atlanta Gas Light’s former operating sites, therange of reasonably probable costs is $57 million to $104 million. Asof December 31, 2005, no value within this range was a better esti-mate than any other value, so we have recorded a liability equal to thelow end of that range, or $57 million.
Prudently incurred remediation costs for the New Jersey prop-erties have been authorized by the NJBPU to be recoverable in ratesthrough a remediation adjustment clause. As a result, ElizabethtownGas has recorded a regulatory asset of approximately $63 million,inclusive of interest, as of December 31, 2005, reflecting the futurerecovery of both incurred costs and accrued carrying charges. Elizabethtown Gas has also been successful in recovering a portionof remediation costs incurred in New Jersey from its insurance carri-ers and continues to pursue additional recovery.
Sites in North Carolina We also own a former NUI remediationsite in Elizabeth City, North Carolina that is subject to a remediationorder by the North Carolina Department of Energy and NaturalResources. We currently have only partial information regarding envi-ronmental impacts at the Elizabeth City site, and therefore we canmake quantitative cost estimates only for limited components of a sitecleanup. However, experience at other similar sites suggests thatcosts for remediation of this site will likely range from $10 million to$17 million. As of December 31, 2005, we have recorded a liabilityof $10 million related to this site.
There is one other site in North Carolina where investigationand remediation is likely, although no remediation order exists andwe do not believe costs associated with this site can be reasonablyestimated. In addition, there are as many as six other sites with whichNUI had some association, although no basis for liability has beenasserted, and accordingly we have not accrued any remediation liability. There are currently no cost recovery mechanisms for theenvironmental remediation sites in North Carolina.
AGL Resources Inc.
NOTES
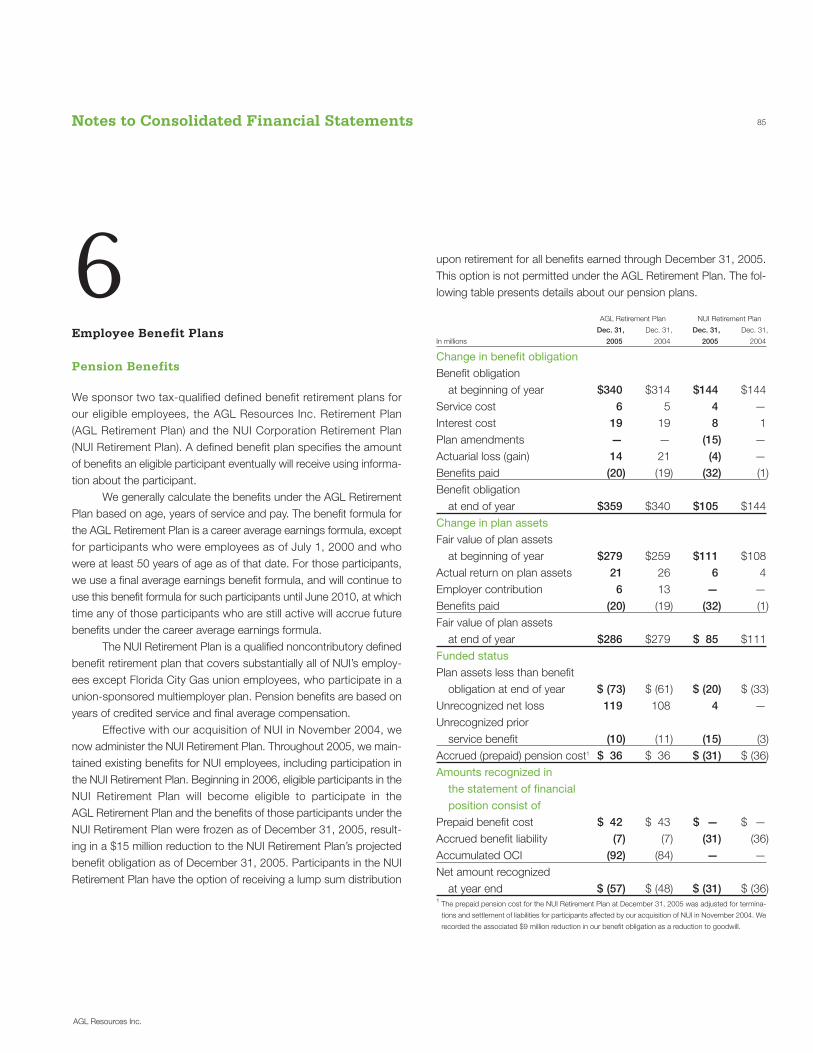
Notes to Consolidated Financial Statements 85
6Employee Benefit Plans
Pension Benefits
We sponsor two tax-qualified defined benefit retirement plans for our eligible employees, the AGL Resources Inc. Retirement Plan (AGL Retirement Plan) and the NUI Corporation Retirement Plan (NUI Retirement Plan). A defined benefit plan specifies the amountof benefits an eligible participant eventually will receive using informa-tion about the participant.
We generally calculate the benefits under the AGL RetirementPlan based on age, years of service and pay. The benefit formula forthe AGL Retirement Plan is a career average earnings formula, exceptfor participants who were employees as of July 1, 2000 and whowere at least 50 years of age as of that date. For those participants,we use a final average earnings benefit formula, and will continue touse this benefit formula for such participants until June 2010, at whichtime any of those participants who are still active will accrue futurebenefits under the career average earnings formula.
The NUI Retirement Plan is a qualified noncontributory definedbenefit retirement plan that covers substantially all of NUI’s employ-ees except Florida City Gas union employees, who participate in aunion-sponsored multiemployer plan. Pension benefits are based onyears of credited service and final average compensation.
Effective with our acquisition of NUI in November 2004, wenow administer the NUI Retirement Plan. Throughout 2005, we main-tained existing benefits for NUI employees, including participation inthe NUI Retirement Plan. Beginning in 2006, eligible participants in theNUI Retirement Plan will become eligible to participate in the AGL Retirement Plan and the benefits of those participants under theNUI Retirement Plan were frozen as of December 31, 2005, result-ing in a $15 million reduction to the NUI Retirement Plan’s projectedbenefit obligation as of December 31, 2005. Participants in the NUIRetirement Plan have the option of receiving a lump sum distribution
upon retirement for all benefits earned through December 31, 2005.This option is not permitted under the AGL Retirement Plan. The fol-lowing table presents details about our pension plans.
AGL Retirement Plan NUI Retirement Plan
Dec. 31, Dec. 31, Dec. 31, Dec. 31,
In millions 2005 2004 2005 2004
Change in benefit obligation
Benefit obligation at beginning of year $340 $314 $144 $144
Service cost 6 5 4 —Interest cost 19 19 8 1Plan amendments — — (15) —Actuarial loss (gain) 14 21 (4) —Benefits paid (20) (19) (32) (1)Benefit obligation
at end of year $359 $340 $105 $144Change in plan assets
Fair value of plan assets at beginning of year $279 $259 $111 $108
Actual return on plan assets 21 26 6 4Employer contribution 6 13 — —Benefits paid (20) (19) (32) (1)Fair value of plan assets
at end of year $286 $279 $ 85 $111Funded status
Plan assets less than benefit obligation at end of year $ (73) $ (61) $ (20) $ (33)
Unrecognized net loss 119 108 4 —Unrecognized prior
service benefit (10) (11) (15) (3)Accrued (prepaid) pension cost1 $ 36 $ 36 $ (31) $ (36)Amounts recognized in
the statement of financial
position consist of
Prepaid benefit cost $ 42 $ 43 $ — $ —Accrued benefit liability (7) (7) (31) (36)Accumulated OCI (92) (84) — —Net amount recognized
at year end $ (57) $ (48) $ (31) $ (36)1 The prepaid pension cost for the NUI Retirement Plan at December 31, 2005 was adjusted for termina-
tions and settlement of liabilities for participants affected by our acquisition of NUI in November 2004. We
recorded the associated $9 million reduction in our benefit obligation as a reduction to goodwill.
AGL Resources Inc.

86
The accumulated benefit obligation (ABO) and other informa-tion for the AGL Retirement Plan and the NUI Retirement Plan are setforth in the following table.
AGL Retirement Plan NUI Retirement Plan
Dec. 31, Dec. 31, Dec. 31, Dec. 31,
In millions 2005 2004 2005 2004
Projected benefit obligation $359 $340 $105 $144ABO 343 327 105 118Fair value of plan assets 286 279 85 111Increase in minimum liability
included in OCI 8 18 — —Components of net
periodic benefit cost
Service cost $ 6 $ 5 $ 4 $ —Interest cost 19 19 8 1Expected return on plan assets (24) (23) (9) (1)Net amortization (1) (1) — —Recognized actuarial loss 7 5 — —Net annual pension cost $ 7 $ 5 $ 3 $ —
The following table sets forth the assumed weighted averagediscount rates and rates of compensation increase used to determinebenefit obligations at the balance sheet dates.
AGL and NUI Retirement Plans
Dec. 31, 2005 Dec. 31, 2004
Discount rate 5.5% 5.8%Rate of compensation increase 4.0% 4.0%
We consider a number of factors in determining and selectingassumptions for the overall expected long-term rate of return on planassets. We consider the historical long-term return experience of ourassets, the current and expected allocation of our plan assets, and
expected long-term rates of return. We derive these expected long-term rates of return with the assistance of our investment advisors andgenerally base these rates on a 10-year horizon for various assetclasses, our expected investments of plan assets and active assetmanagement as opposed to investment in a passive index fund. Webase our expected allocation of plan assets on a diversified portfolioconsisting of domestic and international equity securities, fixed income,real estate, private equity securities and alternative asset classes.
The following tables present the assumed weighted averagediscount rate, expected return on plan assets and rate of compensa-tion increase used to determine net periodic benefit cost at the begin-ning of the period, which was January 1.
AGL Retirement Plan
Dec. 31, 2005 Dec. 31, 2004
Discount rate 5.8% 6.3%Expected return on plan assets 8.8% 8.8%Rate of compensation increase 4.0% 4.0%
NUI Retirement Plan
Dec. 31, 2005 Dec. 31, 2004
Discount rate 5.8% 5.8%Expected return on plan assets 8.5% 8.5%Rate of compensation increase 4.0% 4.0%
We consider a number of factors in determining and selectingour assumptions for the discount rate at December 31. We considercertain market indices, including the Moody’s Corporate AA long-termbond rate of 5.41% and the Citigroup Pension Liability rate of 5.51%,at December 31, 2005. We further use these market indices as acomparison to a single equivalent discount rate derived with theassistance of our actuarial advisors. The single equivalent discountrate is based on a yield-to-maturity regression analysis of a portfolioof corporate bonds rated AA by Moody’s and that have cash outflowsconsistent with payouts from our retirement plans. This analysis as of December 31, 2005 produced a single equivalent discount rate of 5.63%. Consequently, we selected a discount rate of 5.5% as ofDecember 31, 2005, following our review of these various factors.
AGL Resources Inc.
NOTES

Notes to Consolidated Financial Statements 87
Our actual retirement plans’ weighted average asset allocationsat December 31, 2005 and 2004 and our target asset allocationranges are as follows.
Target range AGL Retirement Plan
allocation of assets 2005 2004
Equity 40%–85% 66% 71%Fixed income 25%–50% 25% 25%Real estate and other 0%–10% 8% 3%Cash 0%–10% 1% 1%
Target range NUI Retirement Plan
allocation of assets 2005 2004
Equity 40%–85% 88% 72%Fixed income 25%–50% 12% 28%Real estate and other 0%–10% — —Cash 0%–10% — —
The Retirement Plan Investment Committee (the Committee)appointed by our Board of Directors is responsible for overseeing theinvestments of the retirement plan. Further, we have an InvestmentPolicy (the Policy) for the retirement plans that aims to preserve theretirement plans’ capital and maximize investment earnings in excessof inflation within acceptable levels of capital market volatility. Toaccomplish this goal, the retirement plan assets are actively managedto optimize long-term return while maintaining a high standard of port-folio quality and proper diversification.
The Policy’s risk management strategy establishes a maximumtolerance for risk in terms of volatility to be measured at 75% of thevolatility experienced by the S&P 500. We will continue to morebroadly diversify retirement plan investments to minimize the risk oflarge losses in a single asset class. The Policy’s permissible invest-ments include domestic and international equities (including convert-ible securities and mutual funds), domestic and international fixedincome (corporate and U.S. government obligations), cash and cashequivalents and other suitable investments. The asset mix of thesepermissible investments is maintained within the Policy’s target allo-cations as included in the table above, but the Committee can varyallocations between various classes and/or investment managers inorder to improve investment results.
Equity market performance and corporate bond rates have asignificant effect on our reported unfunded ABO, as the primary fac-tors that drive the value of our unfunded ABO are the assumed dis-count rate and the actual return on plan assets. Additionally, equitymarket performance has a significant effect on our market-relatedvalue of plan assets (MRVPA), which is a calculated value and differsfrom the actual market value of plan assets. The MRVPA recognizesthe difference between the actual market value and expected marketvalue of our plan assets and is determined by our actuaries using afive-year moving weighted average methodology. Gains and losseson plan assets are spread through the MRVPA based on the five-yearmoving weighted average methodology, which affects the expectedreturn on plan assets component of pension expense.
Our employees do not contribute to the retirement plans. Wefund the plans by contributing at least the minimum amount requiredby applicable regulations and as recommended by our actuary. How-ever, we may also contribute in excess of the minimum requiredamount. We calculate the minimum amount of funding using the projected unit credit cost method. We do not expect to make anycontribution to the pension plans in 2006.
Postretirement Benefits
We sponsor two defined benefit postretirement health care plans forour eligible employees, the AGL Resources Inc. Postretirement HealthCare Plan (AGL Postretirement Plan) and the NUI Corporation Postre-tirement Health Care Plan (NUI Postretirement Plan), which weacquired upon our acquisition of NUI. Eligibility for these benefits isbased on age and years of service.
The NUI Postretirement Plan provides certain medical and den-tal health care benefits to retirees, other than retirees of Florida CityGas, depending on their age, years of service and start date. The NUIPostretirement Plan is contributory, and NUI funded a portion of thesefuture benefits through a Voluntary Employees’ Beneficiary Associa-tion. Effective July 2000, NUI no longer offered postretirement bene-fits other than pensions for any new hires. In addition, NUI capped itsshare of costs at $500 per participant per month for retirees underage 65, and at $150 per participant per month for retirees over age65. Beginning in 2006, eligible participants in the NUI PostretirementPlan will become eligible to participate in the AGL Postretirement Plan.
AGL Resources Inc.

88
The AGL Postretirement Plan covers all eligible AGL Resourcesemployees who were employed as of June 30, 2002, if they reachretirement age while working for us. The state regulatory commissionshave approved phase-ins that defer a portion of other postretirementbenefits expense for future recovery. We recorded a regulatory assetfor these future recoveries of $14 million as of December 31, 2005and $14 million as of December 31, 2004. In addition, we recorded aregulatory liability of $3 million as of December 31, 2005 and $2 mil-lion as of December 31, 2004 for our expected expenses under theAGL Postretirement Plan.
Effective December 8, 2003, the Medicare Prescription Drug,Improvement and Modernization Act of 2003 was signed into law.This act provides for a prescription drug benefit under Medicare Part D as well as a federal subsidy to sponsors of retiree health carebenefit plans that provide a benefit that is at least actuarially equiva-lent to Medicare Part D.
On July 1, 2004, the AGL Postretirement Plan was amended toremove prescription drug coverage for Medicare-eligible retirees effec-tive January 1, 2006. Certain grandfathered NUI retirees participatingin the NUI Postretirement Plan will continue receiving a prescriptiondrug benefit through some period of time. The AGL PostretirementPlan’s accumulated postretirement benefit obligation decreased byapproximately $24 million and net annual cost decreased by $2 milliondue to the elimination of prescription drug coverage for Medicare-eligible retirees. The 2004 net periodic postretirement benefit costreflects both the plan amendment to remove prescription drug cover-age under the AGL Postretirement Plan, described above, and the federal subsidy for NUI grandfathered retirees. The following tablepresents details about our postretirement benefits.
AGL Postretirement Plan NUI Postretirement Plan
Dec. 31, Dec. 31, Dec. 31, Dec. 31,
In millions 2005 2004 2005 2004
Change in benefit obligation
Benefit obligation at beginning of year $ 98 $134 $ 23 $ 23
Service cost 1 1 — —Interest cost 5 7 1 —Plan amendments — (24) (7) —Actuarial (gain) loss (6) (12) 3 —Benefits paid (9) (8) (2) —Benefit obligation at end of year $ 89 $ 98 $ 18 $ 23Change in plan assets
Fair value of plan assets at beginning of year $ 49 $ 44 $ 9 $ 9
Actual return on plan assets 4 5 — —Employer contribution 6 8 2 —Benefits paid (9) (8) (2) —Fair value of plan assets
at end of year $ 50 $ 49 $ 9 $ 9Funded status
ABO in excess of plan assets $(39) $ (49) $ (9) $(14)Unrecognized loss 22 30 2 —Unrecognized transition amount 1 1 — —Unrecognized prior
service benefit (23) (26) (6) —Accrued benefit cost $(39) $ (44) $(13) $(14)Amounts recognized in
the statement of financial
position consist of
Prepaid benefit cost $ — $ — $ — $ —Accrued benefit liability (39) (44) (13) (14)Accumulated OCI — — — —Net amount recognized
at year end $(39) $ (44) $(13) $(14)
AGL Resources Inc.
NOTES

Notes to Consolidated Financial Statements 89
The following table presents details on the components of ournet periodic benefit cost at the balance sheet dates for our retirementplans. Amounts for the NUI Postretirement Plan were not material in 2004.
AGL NUI
Postretirement Plan Postretirement Plan
In millions 2005 2004 2005
Service cost $ 1 $ 1 $—
Interest cost 5 7 1
Expected return on plan assets (4) (3) —
Amortization of prior service cost (3) (2) (1)
Recognized actuarial loss 1 1 —
Net periodic postretirement benefit cost $— $ 4 $—
The following tables present our weighted average assumedrates used to determine benefit obligations at the beginning of theperiod, January 1 for the AGL Postretirement Plan and December 1for the NUI Postretirement Plan, and our weighted average assumedrates used to determine net periodic benefit cost at the beginning ofthese same periods.
AGL Postretirement Plan
2005 2004
Discount rate—benefit obligation 5.5% 5.8%Discount rate—net periodic benefit cost 5.8% 6.3%Expected return on plan assets 8.8% 8.8%Rate of compensation increase 4.0% 4.0%
NUI Postretirement Plan
2005 2004
Discount rate—benefit obligation 5.5% 5.8%Discount rate—net periodic benefit cost 5.8% 5.8%Expected return on plan assets 3.0% 2.0%Rate of compensation increase —% —%
For information on the discount rate assumptions used for our postretirement plans, see discussion contained in Note 6 underPension Benefits.
We consider the same factors in determining and selecting ourassumptions for the overall expected long-term rate of return on planassets as those considered in determining and selecting the overallexpected long-term rate of return on plan assets for our retirementplans. For purposes of measuring our accumulated postretirementbenefit obligation, the assumed pre-Medicare and post-Medicarehealth care inflation rates are as follows.
AGL Postretirement Plan
Pre-Medicare cost Post-Medicare cost
Assumed health care cost trend rates (pre–65 years old) (post–65 years old)
at December 31, 2005 2004 2005 2004
Health care costs trend assumed for next year 2.5% 11.3% 2.5% 11.3%
Rate to which the cost trend rate gradually declines 2.5% 2.5% 2.5% 2.5%
Year that the rate reaches the ultimate trend rate N/A 2006 N/A 2006
NUI
Assumed health care cost trend rates Postretirement Plan
at December 31, 2005 2004
Health care costs trend assumed for next year 2.5% 9.0%
Rate to which the cost trend rate gradually declines 2.5% 5.0%
Year that the rate reaches the ultimate trend rate N/A 2008
Effective January 2006, our health care cost trend rates forboth the AGL Postretirement and NUI Postretirement Plans have beencapped at 2.5%. This cap limits the increase in our contributions tothe annual change in the consumer price index (CPI). An annual CPIrate of 2.5% was assumed for future years.
Assumed health care cost trend rates impact the amountsreported for our health care plans. A one-percentage-point changein the assumed health care cost trend rates would have the follow-ing effects for the AGL Postretirement Plan and the NUI Postretire-ment Plan.
AGL Resources Inc.

90
AGL Postretirement Plan
One-percentage-point
In millions Increase Decrease
Effect on total of service and interest cost $— $—
Effect on accumulated postretirement benefit obligation 4 (3)
NUI Postretirement Plan
One-percentage-point
In millions Increase Decrease
Effect on total of service and interest cost $— $—
Effect on accumulated postretirement benefit obligation 2 (1)
The following table presents expected benefit payments cov-ering the periods 2006 through 2015 for our qualified pension plans,unqualified pension plans and postretirement health care plans. Therewill be benefit payments under these plans beyond 2015.
For the year ended Dec. 31, (in millions) AGL Retirement Plan AGL Postretirement Plan
2006 $ 19 $ 62007 19 62008 19 62009 19 62010 19 62011–2015 105 31
For the year ended Dec. 31, (in millions) NUI Retirement Plan NUI Postretirement Plan
2006 $ 7 $12007 7 12008 7 12009 7 12010 8 12011–2015 45 5
Our investment policies and strategies for our postretirementplans, including target allocation ranges, are similar to those for ourretirement plans. We fund the plans annually; retirees contribute 20%of medical premiums, 50% of the medical premium for spousal cov-erage and 100% of the dental premium. Our postretirement plans,weighted average asset allocations for 2005 and 2004 and our targetasset allocation ranges are as follows.
Target asset
allocation ranges 2005 2004
Equity 40%–85% 52% 67%Fixed income 25%–50% 46% 32%Real estate and other 0%–10% 1% —%Cash 0%–10% 1% 1%
Employee Savings Plan Benefits
We sponsor the Retirement Savings Plus Plan (RSP), a defined con-tribution benefit plan that allows eligible participants to make contri-butions to their accounts up to specified limits. Under the RSP, wemade matching contributions to participant accounts in the follow-ing amounts:
▪ $5 million in 2005▪ $5 million in 2004▪ $4 million in 2003
We also sponsor the Nonqualified Savings Plan (NSP), anunfunded, nonqualified plan similar to the RSP. The NSP providesan opportunity for eligible employees who could reach the maximumcontribution amount in the RSP to contribute additional amounts for retirement savings. Our contributions to the NSP have not beensignificant in any year.
Effective December 1, 2004, all NUI employees participatingin NUI’s qualified defined contribution benefit plan were eligible toparticipate in the RSP, and those who were participants in NUI’s non-qualified defined contribution plan became eligible to participate inthe NSP.
AGL Resources Inc.
NOTES

Notes to Consolidated Financial Statements 91
7Stock-based and Other Incentive Compensation Plans
Employee Stock-based Compensation Plans and Agreements
We currently sponsor the following stock-based compensation plans.
▪ The Long-Term Incentive Plan (1999) (LTIP) provides for grants ofincentive and nonqualified stock options, performance units andshares of restricted stock to key employees. The LTIP authorizes theissuance of up to 9.5 million shares of our common stock.
▪ A predecessor plan, the Long-Term Stock Incentive Plan (LTSIP),provides for grants of incentive and nonqualified stock options,shares of restricted stock and stock appreciation rights to keyemployees. Following shareholder approval of the LTIP, no furthergrants have been made under the LTSIP.
▪ The Officer Incentive Plan (Officer Plan) provides for grants of non-qualified stock options and shares of restricted stock to new-hireofficers. The Officer Plan authorizes the issuance of up to 600,000shares of our common stock.
▪ Stock appreciation rights (SARs) have been granted to key employ-ees under individual agreements that permit the holder to receivecash in an amount equal to the difference between the fair marketvalue of a share of our common stock on the date of exercise andthe SAR base value. A total of 26,863 SARs were outstanding as ofDecember 31, 2005.
▪ The 1996 Non-Employee Directors Equity Compensation Plan(Directors Plan) originally provided for the grant of nonqualified stockoptions and shares of restricted stock to nonemployee directorsas payment of their annual retainer. In December 2002, the Direc-tors Plan was amended to eliminate the granting of stock options.As a result, the Directors Plan now provides solely for the issuanceof our common stock. The Directors Plan authorizes the issuanceof up to 200,000 shares of our common stock.
▪ The Employee Stock Purchase Plan (ESPP) is a nonqualified, broad-based employee stock purchase plan for eligible employees. TheESPP authorizes the issuance of up to 600,000 shares of our com-mon stock.
Incentive and Nonqualified Stock Options
We grant incentive and nonqualified stock options at the fair marketvalue on the date of grant. The vesting of incentive options is subjectto a statutory limitation of $100,000 per year under Section 422A ofthe Internal Revenue Code. Otherwise, nonqualified options generallybecome fully exercisable not earlier than six months after the date of grant and generally expire 10 years after the date of grant. Partic-ipants realize value from option grants only to the extent that the fairmarket value of our common stock on the date of exercise of theoption exceeds the fair market value of the common stock on thedate of grant.
The following table summarizes activity related to grants ofstock options for key employees and nonemployee directors.
Number of Weighted average
options exercise price
Outstanding—December 31, 2002 3,633,957 $20.55Granted 939,262 26.76Exercised (863,112) 20.08Forfeited (199,137) 22.00Outstanding—December 31, 2003 3,510,970 $22.25Granted 103,900 29.72Exercised (1,050,053) 20.90Forfeited (390,745) 22.44Outstanding—December 31, 2004 2,174,072 $23.23Granted 1,014,121 33.80
Exercised (846,465) 22.60
Forfeited (120,483) 32.38
Outstanding—December 31, 2005 2,221,245 $27.79
AGL Resources Inc.

92
Summarized below are outstanding options that are fully exercisable.
Weighted average
Exercisable at: Number of options exercise price
December 31, 2003 2,154,877 $20.47December 31, 2004 1,658,260 $22.04December 31, 2005 1,275,689 $23.46
Our stock-based employee compensation plans are accountedfor under the recognition and measurement principles of APB 25 andrelated interpretations. For our stock option plans, we generally do notreflect stock-based employee compensation cost in net income, asoptions for those plans had an exercise price equal to the marketvalue of the underlying common stock on the date of grant. For ourSARs, we reflect stock-based employee compensation cost basedon the fair value of our common stock at the balance sheet date sincethese awards constitute a variable plan under APB 25.
In accordance with the fair value method of determining com-pensation expense, we used the Black-Scholes pricing model and theestimates listed below for the years ended December 31, 2005, 2004and 2003.
2005 2004 2003
Expected life (years) 7 7 7Interest rate 4.0% 3.7% 3.8%Volatility 17.3% 16.9% 19.2%Dividend yield 3.7% 3.9% 4.2%Fair value of options granted $4.70 $3.72 $3.75
The compensation costs that have been charged againstincome for performance units, restricted stock and other stock-basedawards were $5 million in 2005, $7 million in 2004 and $8 million in 2003.
Stock Appreciation Rights
We have granted SARs, which are payable in cash, at fair marketvalue on the date of grant. SARs generally become fully exercisablenot earlier than 12 months after the date of grant and generally expiresix years after that date. Participants realize value from SAR grantsonly to the extent that the fair market value of our common stock onthe date of exercise of the SAR exceeds the fair market value of thecommon stock on the date of grant.
We recognize the intrinsic value of the SARs as compensationexpense over the vesting period. Compensation expense for 2005,
AGL Resources Inc.
NOTES
Information about outstanding and exercisable options as of December 31, 2005 is as follows.
Options outstanding Options exercisable
Weighted average remaining Weighted average Weighted average
Range of exercise prices Number of options contractual life (in years) exercise price Number of options exercise price
$13.75 to $17.49 2,199 4.0 $16.99 2,199 $16.99$17.50 to $19.99 56,295 2.1 $18.82 56,295 $18.82$20.00 to $24.10 714,623 4.3 $21.10 714,623 $21.10$24.11 to $30.00 487,255 7.3 $27.00 454,840 $26.97$30.01 to $34.00 792,052 8.8 $33.09 46,453 $31.00$34.01 to $39.50 168,821 7.6 $36.65 1,279 $35.81Outstanding—December 31, 2005 2,221,245 6.8 $27.79 1,275,689 $23.46

Notes to Consolidated Financial Statements 93
2004 and 2003 was immaterial. The following table summarizes activ-ity related to grants of SARs.
Weighted average
Number of SARs exercise price
Outstanding as of December 31, 2002 141,253 $23.50Issued 45,790 24.30Exercised (17,718) 23.50Forfeited (9,368) 23.99Outstanding as of December 31, 2003 159,957 $23.70Issued — —Exercised (60,262) 23.70Forfeited (72,832) 23.50Outstanding as of December 31, 2004 26,863 $24.24Issued — —
Exercised — —
Forfeited — —
Outstanding as of December 31, 2005 26,863 $24.24
Performance Units
In general, a performance unit is an award of the right to receive (i) anequal number of shares of company common stock or (ii) cash, subjectto the achievement of certain pre-established performance criteria. Per-formance units are subject to certain transfer restrictions and forfeitureupon termination of employment. In January 2005, we grantedrestricted stock units and performance cash units to a select group ofofficers as described below.
Restricted Stock Units In general, a restricted stock unit is anaward that represents the opportunity to receive a specified numberof shares of our common stock, subject to the achievement of cer-tain pre-established performance criteria.
In January 2005, we granted to a select group of officers a totalof 86,800 restricted stock units (the 2005 restricted stock units) underthe LTIP, of which 77,300 of these units were outstanding as ofDecember 31, 2005. The 2005 restricted stock units had a 12-monthperformance measurement period related to management’s successin integrating its acquisitions and generating improvement in earningsfrom these acquired businesses. The performance measure wasachieved during 2005. On January 3, 2006, the 2005 restricted stockunits were converted to an equal number of shares of our commonstock and are now subject to time-based vesting.
Performance Cash Units In general, a performance cash unit is an award that represents the opportunity to receive a cash award, subject to the achievement of certain pre-established per-formance criteria.
In January 2005, we granted performance cash units to aselect group of officers under the LTIP. The performance cash unitsrepresent a maximum aggregate payout of $3 million. The perform-ance cash units have a performance measurement period that rangesfrom 12 to 36 months and a performance measure that relates to ourinternal measure of total shareholder return. As of December 31,2005, based on our anticipated performance, we had recorded aliability of $2 million for these performance cash units. In addition, in2005, we granted performance cash units to select executives thatwere intended to recognize the executive’s promotion into key sen-ior leadership roles and retain the executives.
At the end of the performance measurement period for the 12-month performance cash units (December 31, 2005), the perform-ance measure was achieved and in January 2006 an aggregate of$743,680 was paid.
2002 Performance Unit Awards In February 2002, we granted toa select group of officers a total of 1.5 million performance units witha performance measurement period that ended December 31, 2004.The amount actually earned was based on the highest average clos-ing price of our common stock over any 10 consecutive trading daysduring the performance measurement period and could range from aminimum of 10% to 100% of the units granted. During a portion of theperformance measurement period, these units were eligible for divi-dend credits based on vested performance units. Of the 1.5 millionunits that were granted, 1 million units were eligible for vesting atDecember 31, 2004. Upon vesting, at the election of the participantthe performance units were payable in shares of our common stock,or up to 50% in cash.
These units were paid out as follows:
▪ $2.6 million paid in cash▪ $2.8 million withheld to cover applicable taxes▪ 35,342 shares of common stock with an approximate value of
$1.2 million
AGL Resources Inc.

94
Stock and Restricted Stock Awards
In general, we refer to an award of our common stock that is subjectto time-based vesting or achievement of performance measures as“restricted stock.” Restricted stock awards are subject to certaintransfer restrictions and forfeiture upon termination of employment.
Stock Awards Under the Directors Plan, each nonemployee direc-tor receives an annual retainer that has an aggregate value of$60,000. At the election of each director, the annual retainer is paidin cash (with a $30,000 limit) and/or shares of our common stock oris deferred and invested in common stock equivalents under the 1998Common Stock Equivalent Plan for Non-Employee Directors. Uponinitial election to our Board of Directors, each nonemployee directorreceives 1,000 shares of common stock as of the first day of his orher service. Shares issued under the Directors Plan are 100% vestedand nonforfeitable as of the date of grant.
Restricted Stock Awards In January 2005, we granted to a selectgroup of executive officers a total of 41,200 shares of restricted stockunder the LTIP, of which 34,200 shares were outstanding as ofDecember 31, 2005. The restricted stock awards had a 12-monthperformance measurement period with a performance measurerelated to management’s success in integrating its acquisitions andgenerating improvement in earnings from these acquired businesses.At the end of the performance measurement period (December 31,2005), the performance measure was achieved, one-third of theshares vested, and the balance is now subject to time-based vesting.In addition, in 2005, we granted shares of restricted stock to selectexecutives that were intended to recognize the executive’s promotioninto key senior leadership roles and retain the executives.
We awarded shares of restricted stock to our key employeesand shares of company stock to our nonemployee directors, net offorfeitures, in the following amounts:
20051 2004 2003
Employees 133,542 51,300 244,128Nonemployee directors 7,621 8,727 12,152Total 141,163 60,027 256,280Weighted average fair value
at year end $34.44 $32.45 $27.151 Includes 35,342 shares that were converted as a result of the 2002 performance units that vested.
Employee Stock Purchase Plan
Under the ESPP, employees may purchase shares of our commonstock in quarterly intervals at 85% of fair market value. Employee con-tributions under the ESPP may not exceed $25,000 per employeeduring any calendar year. As of December 31, 2005, our employeeshad purchased a total of 40,927 shares leaving 485,819 shares avail-able for purchase. The ESPP expires January 31, 2015.
2005 2004 2003
Shares purchased on the open market 40,927 35,789 24,871
Average per share purchase price $ 30.52 $ 25.20 $ 22.08
Purchase price discount $220,847 $159,144 $97,400
8Common Shareholders’ Equity
Shareholder Rights Plan
On March 6, 1996, our Board of Directors adopted a ShareholderRights Plan. The plan contains provisions to protect our shareholdersin the event of unsolicited offers to acquire us or other takeover bidsand practices that could impair the ability of the Board of Directors tofully represent shareholders’ interests. As required by the ShareholderRights Plan, the Board of Directors declared a dividend of one pre-ferred share purchase right (a Right) for each outstanding share of ourcommon stock, with distribution made to shareholders of record onMarch 22, 1996.
The Rights, which will expire March 6, 2006, are represented byand traded with our common stock. The Rights are not currently exer-cisable and do not become exercisable unless a triggering eventoccurs. One of the triggering events is the acquisition of 10% or moreof our common stock by a person or group of affiliated or associatedpersons (subject to certain exceptions). Unless previously redeemed,
AGL Resources Inc.
NOTES

Notes to Consolidated Financial Statements 95
AGL Resources Inc.
upon the occurrence of one of the specified triggering events, eachRight will entitle its holder to purchase one one-hundredth of a shareof Class A Junior Participating Preferred Stock at a purchase price of$60. Each preferred share will have 100 votes, voting together with thecommon stock. Because of the nature of the preferred shares’ divi-dend, liquidation and voting rights, one one-hundredth of a share ofpreferred stock is intended to have the value, rights and preferencesof one share of common stock. As of December 31, 2005, 1 millionshares of Class A Junior Participating Preferred Stock were reservedfor issuance under that plan.
Dividends
We derive a substantial portion of our consolidated assets, earningsand cash flow from the operation of regulated utility subsidiaries,whose legal authority to pay dividends or make other distributions tous is subject to regulation. Our common shareholders may receivedividends when declared at the discretion of our Board of Directors.Dividends may be paid in cash, stock or other form of payment, andpayment of future dividends will depend on our future earnings, cashflow, financial requirements and other factors, some of which arenoted below. In certain cases, our ability to pay dividends to our com-mon shareholders is limited by the following:
▪ our ability to satisfy our obligations under certain financing agree-ments, including debt-to-capitalization and total shareholders’equity covenants
▪ our ability to satisfy our obligations to any preferred shareholders▪ restrictions under the Public Utility Holding Company Act of 1935,
as amended (PUHCA) on our payment of dividends out of capital orunearned surplus without prior permission from the SEC (thePUHCA is repealed effective February 8, 2006)
Additionally, under Georgia law, the payment of cash dividendsto the holders of our common stock is limited to our legally availableassets and subject to the prior payment of dividends on any out-standing shares of preferred stock and junior preferred stock. Our
assets are not legally available for paying cash dividends if, after pay-ment of the dividend,
▪ we could not pay our debts as they become due in the usual courseof business, or
▪ our total assets would be less than our total liabilities plus, subject tosome exceptions, any amounts necessary to satisfy (upon dissolu-tion) the preferential rights of shareholders whose preferential rightsare superior to those of the shareholders receiving the dividends
The following table provides information on increases in ourquarterly common stock dividends over the last three years.
Quarterly Indicated
Date % change dividend annual dividend
November 2005 19% $0.37 $1.48February 2005 7 0.31 1.24April 2004 4 0.29 1.16April 2003 4 0.28 1.12
Share Repurchase Program
In February 2006, our Board of Directors authorized a plan to repur-chase up to 8 million shares of our outstanding common stock overa five-year period. These purchases are intended to principally offsetshare issuances under our employee incentive compensation plans,director plans, and dividend reinvestment and stock purchase plans.Stock repurchases under this program may be made in the openmarket or in private transactions at times and in amounts that wedeem appropriate. However, there is no guarantee as to the exactnumber of additional shares that may be repurchased, and we mayterminate or limit the stock repurchase program at any time. We willhold the repurchased shares as treasury shares.

96
9Debt
Our issuance of various securities, including long-term and short-term debt, is subject to customary approval or authorization by state and fed-eral regulatory bodies, including state public service commissions, the SEC and the Federal Energy Regulatory Commission (FERC). On April 1,2004, we received approval from the SEC, under the PUHCA, for the renewal of our financing authority to issue securities through April 2007. InAugust 2005, the Energy Policy Act of 2005 (Energy Act) was enacted which repealed the PUHCA, effective February 8, 2006. The Energy Actprovided the FERC with granting of previous financing authorizations approvals that were previously required by the SEC under the PUHCA. Thefollowing table provides more information on our various securities.
Outstanding as of:
Dollars in millions Year(s) due Interest rate1 Dec. 31, 2005 Dec. 31, 2004
Short-term debt
Commercial paper2 2006 4.5% $ 485 $ 314SouthStar line of credit3 2006 7.3 36 —Sequent line of credit4 2006 — — 18Capital leases 2006 4.9 1 2
Total short-term debt5 4.8% $ 522 $ 334Long-term debt—net of current portion
Medium-term notes 2012–2027 6.6–9.1% $ 208 $ 208Senior notes 2011–2013 4.5–7.1 975 975Gas facility revenue bonds, net of unamortized issuance costs 2022–2034 3.2–5.7 199 199Notes payable to Trusts 2037–2041 8.0–8.2 232 232Capital leases 2013 4.9 6 8Interest rate swaps 2011 7.2 (5) 1
Total long-term debt5 6.1% $1,615 $1,623Total debt5 5.8% $2,137 $1,957
1 As of December 31, 2005.2 The daily weighted average interest rate was 3.6% for 2005 and 1.6% for 2004.3 The daily weighted average interest rate was 6.8% for 2005.4 The daily weighted average interest rate was 2.0% for 2004.5 Weighted average interest rate, including interest rate swaps if applicable and excluding debt issuance and other financing-related costs.
Short-term Debt
Our short-term debt at December 31, 2005 and 2004 was composed of borrowings under our commercial paper program that consisted of short-term, unsecured promissory notes with maturities ranging from 3 to 56 days; current portions of our capital lease obligations; SouthStar’s line ofcredit; and Sequent’s line of credit.
Commercial Paper On August 30, 2005, we amended our Credit Facility that supports our commercial paper program. Under the terms ofthe amendment, the aggregate principal amount available under the Credit Facility was increased from $750 million to $850 million and we have
AGL Resources Inc.
NOTES

Notes to Consolidated Financial Statements 97
the option to increase the aggregate principal amount available for borrowing to $1.1 billion on not more than three occasions during each calendar year. The amended Credit Facility expires onAugust 31, 2010.
SouthStar Line of Credit In April 2004, the SouthStar line of creditwas extended to April 2007. This line is collateralized by various percentages of eligible accounts receivable, unbilled revenue andinventory of SouthStar. The base rate on the line is the prime rateand/or LIBOR plus a margin based on certain financial measures. Wedo not guarantee or provide any other form of security for the repay-ment of any outstanding indebtedness.
Sequent Line of Credit In June 2005, Sequent’s $25 million unse-cured line of credit was extended to July 2006. In September 2005,Sequent entered into an additional $20 million unsecured line of creditscheduled to expire in September 2006. These unsecured lines ofcredit, which total $45 million and bear interest at the federal fundseffective rate plus 0.5%, are used solely for the posting of margindeposits for New York Mercantile Exchange transactions and areunconditionally guaranteed by AGL Resources.
Pivotal Utility Holdings Line of Credit In September 2005, Pivotal Utility entered into a $20 million unsecured line of credit expir-ing on September 30, 2006. This line of credit supports ElizabethtownGas’ hedging program and bears interest at the federal funds effec-tive rate plus 0.5%, is used solely for the posting of deposits and isunconditionally guaranteed by us. For more information on Elizabeth-town Gas’ hedging program, see Note 4.
Long-term Debt
Our long-term debt matures more than one year from the date ofissuance and consists of medium-term notes Series A, Series B andSeries C, which we issued under an indenture dated December 1,1989; senior notes; gas facility revenue bonds; notes payable toTrusts; and capital leases. The notes are unsecured and rank on par-ity with all our other unsecured indebtedness. Our annual maturitiesof long-term debt are as follows:
▪ $4 million in 2007–2010▪ $1,611 million in 2011 and beyond
Senior Notes The following table provides more information on oursenior notes, which were issued to refinance portions of our existing
short-term debt and medium-term notes, to finance acquisitions andfor general corporate purposes.
Issue date Amount (in millions) Interest rate Maturity
February 2001 $300 7.125% January 2011July 2003 225 4.45 April 2013September 2004 250 6.0 October 2034December 2004 200 4.95 January 2015
In March 2003, we entered into interest rate swaps of $100 mil-lion to effectively convert a portion of the fixed-rate interest obligationon the $300 million in Senior Notes Due 2011 to a variable-rate obligation. We pay floating interest each January 14 and July 14 atsix-month LIBOR plus 3.4%. The effective variable interest rate atDecember 31, 2005 was 7.2%. These interest rate swaps expire January 14, 2011, unless terminated earlier. For more informationon our interest rate swaps, see Note 4.
The trustee with respect to all of the above-referenced seniornotes is the Bank of New York Trust Company, N.A. (Bank of NewYork), pursuant to an indenture dated February 20, 2001. We fully andunconditionally guarantee all our senior notes.
Gas Facility Revenue Bonds Pivotal Utility has $200 million ofindebtedness pursuant to gas facility revenue bonds. We do not guar-antee or provide any other form of security for the repayment of thisindebtedness. Pivotal Utility is party to a series of loan agreementswith the New Jersey Economic Development Authority (NJEDA) pur-suant to which the NJEDA has issued four series of gas facility rev-enue bonds:
▪ $47 million of bonds at adjusting rates due October 1, 2022▪ $20 million of bonds at adjusting rates due October 1, 2024▪ $39 million of bonds at variable rates due June 1, 2026
(variable bonds)▪ $55 million of bonds at 5.7% due June 1, 2032▪ $40 million of bonds at 5.25% due November 1, 2033
In April 2005, we refinanced $20 million of our Gas Facility Rev-enue Bonds Due October 1, 2024. The original bonds had a fixedinterest rate of 6.4% per year and were refunded with $20 million ofadjustable-rate gas facility revenue bonds. The maturity date of thesebonds remains October 1, 2024. The new bonds were issued at aninitial annual interest rate of 2.8% and initially have a 35-day auctionperiod where the interest rate will adjust every 35 days. The interestrate at December 31, 2005 was 3.3%.
AGL Resources Inc.

98
In May 2005, we refinanced an additional $47 million in GasFacility Revenue Bonds Due October 1, 2022 and bearing interestat an annual fixed rate of 6.35%. The new bonds were issued at aninitial annual interest rate of 2.9% and initially have a 35-day auctionperiod where the interest rate will adjust every 35 days. The maturitydate remains October 1, 2022. The interest rate at December 31,2005 was 3.2%.
The variable bonds contain a provision whereby the holder can“put” the bonds back to the issuer. In 1996, Pivotal Utility executeda long-term Standby Bond Purchase Agreement (SBPA) with a syn-dicate of banks, which was amended and restated on June 1, 2005.Under the terms of the SBPA, as further amended, the participatingbanks are obligated under certain circumstances to purchase variablebonds that are tendered by the holders thereof and not remarketedby the remarketing agent. Such obligation of the participating bankswould remain in effect until the June 1, 2010 expiration of the SBPA,unless it is extended or earlier terminated.
Notes Payable to Trusts In June 1997, we established AGL Cap-ital Trust I (Trust I), a Delaware business trust, of which AGLResources owns all the common voting securities. Trust I issued andsold $75 million of 8.17% capital securities (liquidation amount $1,000per capital security) to certain initial investors. Trust I used the pro-ceeds to purchase 8.17% junior subordinated deferrable interestdebentures issued by us. Trust I capital securities are subject tomandatory redemption at the time of the repayment of the junior sub-ordinated debentures on June 1, 2037, or the optional prepaymentby us after May 31, 2007.
In March 2001, we established AGL Capital Trust II (Trust II), aDelaware business trust, of which AGL Capital owns all the commonvoting securities. In May 2001, Trust II issued and sold $150 million of8.00% capital securities (liquidation amount $25 per capital security).Trust II used the proceeds to purchase 8.00% junior subordinateddeferrable interest debentures issued by us. The proceeds from theissuance were used to refinance a portion of our existing short-termdebt under the commercial paper program. Trust II capital securitiesare subject to mandatory redemption at the time of the repaymentof the junior subordinated debentures on May 15, 2041, or theoptional prepayment by AGL Capital after May 21, 2006. Additionallywe entered into interest rate swaps to effectively convert a portion ofthe fixed-rate interest obligation on our notes payable to Trusts to avariable-rate obligation. At the beginning of 2005, we had $75 millionof outstanding interest rate swap agreements associated with our
Note Payable at AGL Capital Trust II. On September 7, 2005, we ter-minated these interest rate swap agreements. We received a paymentof $1 million related to this termination, which included accrued inter-est and the fair value of these interest rate swap agreements at thetermination date.
The trustee is the Bank of New York with respect to the 8.17%capital securities pursuant to an indenture dated June 11, 1997, andwith respect to the 8.00% capital securities pursuant to an indenturedated May 21, 2001. We fully and unconditionally guarantee all ourTrust I and Trust II obligations for the capital securities.
Other Preferred Securities As of December 31, 2005, we had 10 million shares of authorized, unissued Class A junior participatingpreferred stock, no par value, and 10 million shares of authorized,unissued preferred stock, no par value.
Capital Leases Our capital leases consist primarily of a sale/lease-back transaction completed in 2002 by Florida City Gas related toits gas meters and other equipment and will be repaid over 11 years.Pursuant to the terms of the lease agreement, Florida City Gas isrequired to insure the leased equipment during the lease term. Inaddition, at the expiration of the lease term, Florida City Gas has theoption to purchase the leased meters from the lessor at their fair mar-ket value.
Default Events
Our Credit Facility financial covenants and the PUHCA require us tomaintain a ratio of total debt to total capitalization of no greater than70%. As of December 31, 2005 this ratio was 59%. Our debt instru-ments and other financial obligations include provisions that, if notcomplied with, could require early payment, additional collateral sup-port or similar actions. Our most important default events include
▪ a maximum leverage ratio▪ insolvency events and nonpayment of scheduled principal or inter-
est payments▪ acceleration of other financial obligations▪ change of control provisions
We do not have any trigger events in our debt instruments thatare tied to changes in our specified credit ratings or our stock priceand have not entered into any transaction that requires us to issueequity based on credit ratings or other trigger events. We are currentlyin compliance with all existing debt provisions and covenants.
AGL Resources Inc.
NOTES

Notes to Consolidated Financial Statements 99
10Commitments and Contingencies
Contractual Obligations and Commitments
We have incurred various contractual obligations and financial commitments in the normal course of our operating and financing activities. Con-tractual obligations include future cash payments required under existing contractual arrangements, such as debt and lease agreements. Theseobligations may result from both general financing activities and from commercial arrangements that are directly supported by related revenue-producing activities. We calculate any expected pension contributions using the projected unit credit cost method. Under this method, we werenot required to make any pension contribution in 2005, but we voluntarily made a $5 million contribution in August 2005. The following table illus-trates our expected future contractual cash obligations as of December 31, 2005.
Payments due before December 31,
In millions Total 2006 2007 & 2008 2009 & 2010 2011 & thereafter
Interest charges1 $1,870 $ 103 $201 $200 $1,366Pipeline charges, storage capacity and gas supply2,3 1,766 285 515 411 555Long-term debt4 1,615 — 2 2 1,611Short-term debt 522 522 — — —PRP costs5 265 30 72 95 68Operating leases6 160 27 44 33 56Commodity and transportation charges 129 30 19 14 66Environmental remediation costs5 97 13 27 53 4
Total $6,424 $1,010 $880 $808 $3,7261 Floating rate debt is based on the interest rate as of December 31, 2005 and the maturity of the underlying debt instrument.2 Charges recoverable through a PGA mechanism or alternatively billed to Marketers. Also includes demand charges associated with Sequent.3 A subsidiary of NUI entered into two 20-year agreements for the firm transportation and storage of natural gas during 2003 with aggregate annual demand charges of approximately $5 million. As a result of our acquisition
of NUI and in accordance with SFAS No. 141, “Business Combinations,” the contracts were valued at fair value. The $38 million currently allocated to accrued pipeline demand charges in our consolidated balance sheets
represents our estimate of the fair value of the acquired contracts. The liability will be amortized over the remaining life of the contracts.4 Includes $232 million of notes payable to Trusts redeemable in 2006 and 2007.5 Charges recoverable through rate rider mechanisms.6 We have certain operating leases with provisions for step rent or escalation payments, or certain lease concessions. We account for these leases by recognizing the future minimum lease payments on a straight-line basis
over the respective minimum lease terms in accordance with SFAS No. 13, “Accounting for Leases.” However, this accounting treatment does not affect the future annual operating lease cash obligations as shown herein.
AGL Resources Inc.

100
SouthStar has natural gas purchase commitments related to thesupply of minimum natural gas volumes to its customers. These com-mitments are priced on an index plus premium basis. At December 31,2005, SouthStar had obligations under these arrangements for 8 Bcffor the year ending December 31, 2006. This obligation is not includedin the above table. SouthStar also had capacity commitments relatedto the purchase of transportation rights on interstate pipelines.
We also have incurred various financial commitments in thenormal course of business. Contingent financial commitments rep-resent obligations that become payable only if certain predefinedevents occur, such as financial guarantees, and include the natureof the guarantee and the maximum potential amount of future pay-ments that could be required of us as the guarantor. The followingtable illustrates our expected contingent financial commitments as ofDecember 31, 2005.
Commitments due
before December 31,
In millions Total 2006 2007 & thereafter
Standby letters of credit, performance/surety bonds $21 $21 $—
Rental Expense
We incurred $26 million, $22 million and $22 million in rental expensein 2005, 2004 and 2003, respectively.
Litigation
We are involved in litigation arising in the normal course of business.We believe the ultimate resolution of such litigation will not have amaterial adverse effect on our consolidated financial position, resultsof operations or cash flows.
11Fair Value of Financial Instruments
The following table shows the carrying amounts and fair values of ourlong-term debt including any current portions included in our consol-idated balance sheets.
In millions Carrying amount Estimated fair value
As of December 31, 2005 $1,615 $1,784
As of December 31, 2004 1,623 1,816
The estimated fair values are determined based on interestrates that are currently available for issuance of debt with similar termsand remaining maturities. For the notes payable to Trusts, we usedquoted market prices and dividend rates for preferred stock with sim-ilar terms.
Considerable judgment is required to develop the fair value esti-mates; therefore, the values are not necessarily indicative of theamounts that could be realized in a current market exchange. The fairvalue estimates are based on information available to managementas of December 31, 2005. We are not aware of any subsequent fac-tors that would significantly affect the estimated fair value amounts.For more information about the fair values of our interest rate swaps,see Note 4.
AGL Resources Inc.
NOTES

Notes to Consolidated Financial Statements 101
12Income Taxes
We have two categories of income taxes in our statements of consol-idated income: current and deferred. Current income tax expenseconsists of federal and state income tax less applicable tax creditsrelated to the current year. Deferred income tax expense generally isequal to the changes in the deferred income tax liability and regula-tory tax liability during the year.
Investment Tax Credits
Deferred investment tax credits associated with distribution opera-tions are included as a regulatory liability in our consolidated balancesheets (see Note 5). These investment tax credits are being amortizedover the estimated life of the related properties as credits to incomein accordance with regulatory requirements. We reduce income taxexpense in our statements of consolidated income for the investmenttax credits and other tax credits associated with our nonregulatedsubsidiaries. Components of income tax expense shown in the state-ments of consolidated income are as follows.
In millions 2005 2004 2003
Current income taxesFederal $ 84 $25 $20State 18 1 13
Deferred income taxesFederal 17 60 52State — 5 3
Amortization of investment tax credits (2) (1) (1)Total $117 $90 $87
The reconciliations between the statutory federal income taxrate, the effective rate and the related amount of tax for the yearsended December 31, 2005, 2004 and 2003 are presented below.
Dollars in millions Amount % of pretax income
2005
Computed tax expense at statutory rate $109 35.0%
State income tax, net of federal income tax benefit 11 3.7
Amortization of investment tax credits (2) (0.6)
Flexible dividend deduction (2) (0.6)
Other—net 1 0.2
Total income tax expense at effective rate $117 37.7%
2004
Computed tax expense at statutory rate $ 85 35.0%State income tax, net of federal
income tax benefit 9 3.5Amortization of investment tax credits (1) (0.6)Flexible dividend deduction (2) (0.6)Other—net (1) (0.2)
Total income tax expense at effective rate $ 90 37.1%
2003
Computed tax expense at statutory rate $ 78 35.0%State income tax, net of federal
income tax benefit 8 3.8Amortization of investment tax credits (1) (0.6)Flexible dividend deduction (1) (0.6)Other—net 3 1.4
Total income tax expense at effective rate $ 87 39.0%
AGL Resources Inc.

102
Accumulated Deferred Income Tax Assets and Liabilities
We report some of our assets and liabilities differently for financialaccounting purposes than we do for income tax purposes. We reportthe tax effects of the differences in those items as deferred incometax assets or liabilities in our consolidated balance sheets. We meas-ure the assets and liabilities using income tax rates that are currentlyin effect. Because of the regulated nature of the utilities business,we recorded a regulatory tax liability in accordance with SFAS No. 109, “Accounting for Income Taxes” (SFAS 109), which we areamortizing over approximately 30 years (see Note 5). Our deferred taxassets include an additional pension liability of $37 million, whichincreased $3 million from 2004 in accordance with SFAS 109 (seeNote 6).
As indicated in the table below, our deferred tax assets and liabilities include certain items we acquired from NUI. We have provided a valuation allowance for some of these items that reducesour net deferred tax assets to amounts we believe are more likely thannot to be realized in future periods. With respect to our continuing
operations, we have net operating losses in various jurisdictions.Components that give rise to the net accumulated deferred incometax liability are as follows.
As of:
December 31,
In millions 2005 2004
Accumulated deferred income tax liabilities
Property—accelerated depreciation and other property-related items $494 $323
Other 39 238Total accumulated deferred
income tax liabilities 533 561Accumulated deferred income tax assets
Deferred investment tax credits 7 8Deferred pension additional minimum liability 37 34Net operating loss—NUI1 26 31Net operating loss—Virginia Gas
Distribution Company2 0 6Capital loss carryforward3 4 5Alternative minimum tax credit4 8 7Other 37 41
Total accumulated deferred income tax assets 119 132
Valuation allowances5 (9) (8)Total accumulated deferred
income tax assets, net of valuation allowance 110 124
Net accumulated deferred tax liability $423 $4371 Includes NUI’s federal net operating loss carryforwards of approximately $62 million that expire in 2024.2 Includes Virginia Gas Distribution Company, which was sold in December 2005.3 Expires December 31, 2007.4 Generated by NUI and can be carried forward indefinitely to reduce future tax liability.5 Increase to valuation allowance is primarily due to increase in net operating losses on NUI headquarters
that are not usable in New Jersey.
AGL Resources Inc.
NOTES

Notes to Consolidated Financial Statements 103
13Related Party Transactions
We previously recognized revenue and had accounts receivable fromour affiliate, SouthStar, as detailed in the table below. As a result ofour adoption of FIN 46R on January 1, 2004, we consolidated allSouthStar’s accounts with our subsidiaries’ accounts and eliminatedany intercompany balances between segments.
In millions 2003
Recognized revenue $169Accounts receivable 11
14Segment Information
Prior to 2005, our business was organized into three operating seg-ments based on similarities in economic characteristics, products andservices, types of customers, methods of distribution and regulatoryenvironments as well as the manner in which we manage these seg-ments and our internal management information flows.
Beginning in 2005 we added an additional segment, retailenergy operations, which consists of the operations of SouthStar, ourretail gas marketing subsidiary that conducts business primarily inGeorgia. We added this segment as a result of the way managementviews its operations and in consideration of the impact of our acqui-sitions of NUI and Jefferson Island in the fourth quarter of 2004. Theaddition of this segment also is consistent with our desire to providetransparency and visibility to SouthStar on a stand-alone basis and toprovide additional visibility to the remaining businesses in the energyinvestments segment, principally Pivotal Jefferson Island and PivotalPropane of Virginia, Inc. (Pivotal Propane), which are more closelyrelated in structure and operation.
We have recast the segment information for the years endedDecember 31, 2004 and 2003 in accordance with the guidance setforth in SFAS No. 131, “Disclosures about Segments of an Enterpriseand Related Information,” as shown in the tables on pages 105–107.
AGL Resources Inc.

104
Our four operating segments are now as follows:
▪ Distribution operations consists primarily of
▪ Atlanta Gas Light
▪ Chattanooga Gas
▪ Elizabethtown Gas
▪ Elkton Gas
▪ Florida City Gas
▪ Virginia Natural Gas▪ Retail energy operations consists of SouthStar▪ Wholesale services consists of Sequent▪ Energy investments consists primarily of
▪ AGL Networks, LLC
▪ Pivotal Jefferson Island
▪ Pivotal Propane
We treat corporate, our fifth segment, as a nonoperating busi-ness segment, and it currently includes AGL Resources, AGL ServicesCompany, Pivotal Energy Development and the effect of intercompanyeliminations. We eliminated intersegment sales for the years endedDecember 31, 2005, 2004 and 2003 from our statements of consoli-dated income.
We evaluate segment performance based primarily on the non-GAAP measure of earnings before interest and taxes (EBIT), whichincludes the effects of corporate expense allocations. EBIT is a non-GAAP measure that includes operating income, other income, equityin SouthStar’s income in 2003, donations, minority interest in 2005and 2004 and gains on sales of assets. Items that we do not includein EBIT are financing costs, including interest and debt expense,income taxes and the cumulative effect of a change in accountingprinciple, each of which we evaluate on a consolidated level. Webelieve EBIT is a useful measurement of our performance because itprovides information that can be used to evaluate the effectiveness ofour businesses from an operational perspective, exclusive of the coststo finance those activities and exclusive of income taxes, neither ofwhich is directly relevant to the efficiency of those operations.
You should not consider EBIT an alternative to, or a moremeaningful indicator of our operating performance than, operatingincome or net income as determined in accordance with GAAP. Inaddition, our EBIT may not be comparable to a similarly titled meas-ure of another company. The reconciliations of EBIT to operatingincome and net income for the years ended December 31, 2005,2004 and 2003 are presented below.
In millions 2005 2004 2003
Operating revenues $2,718 $1,832 $983Operating expenses 2,276 1,500 741Gain on sale of Caroline Street campus — — 16Operating income 442 332 258Other income (1) — 40Minority interest (22) (18) —EBIT 419 314 298Interest expense 109 71 75Earnings before income taxes 310 243 223Income taxes 117 90 87Income before cumulative effect
of change in accounting principle 193 153 136Cumulative effect of change
in accounting principle — — (8)Net income $ 193 $ 153 $128
AGL Resources Inc.
NOTES

Notes to Consolidated Financial Statements 105
Summarized income statement, balance sheet and capital expenditure information by segment as of and for the years ended December 31,2005, 2004 and 2003 is shown in the following tables.
Distribution Retail energy Wholesale Energy Corporate and Consolidated
In millions operations operations services investments intersegment eliminations AGL Resources
2005
Operating revenues from external parties $1,571 $996 $ 95 $ 56 $ — $2,718
Intersegment revenues1 182 — — — (182) —
Total revenues 1,753 996 95 56 (182) 2,718
Operating expensesCost of gas 939 850 3 16 (182) 1,626
Operation and maintenance 372 58 39 17 (9) 477
Depreciation and amortization 114 2 2 5 10 133
Taxes other than income taxes 32 1 1 1 5 40
Total operating expenses 1,457 911 45 39 (176) 2,276
Operating income (loss) 296 85 50 17 (6) 442
Minority interest — (22) — — — (22)
Other income (loss) 3 — (1) 2 (5) (1)
EBIT $ 299 $ 63 $ 49 $ 19 $ (11) $ 419
Identifiable assets $4,720 $342 $1,058 $350 $(219) $6,251
Investment in joint ventures — — — — — —
Total assets $4,720 $342 $1,058 $350 $(219) $6,251
Goodwill $ 408 $ — $ — $ 14 $ — $ 422
Capital expenditures $ 215 $ 4 $ 1 $ 9 $ 38 $ 267
AGL Resources Inc.

106
Distribution Retail energy Wholesale Energy Corporate and Consolidated
In millions operations operations services investments intersegment eliminations AGL Resources
2004
Operating revenues from external parties $ 926 $827 $ 54 $ 25 $ — $1,832Intersegment revenues1 185 — — — (185) —
Total revenues 1,111 827 54 25 (185) 1,832Operating expenses
Cost of gas 471 695 1 12 (184) 995Operation and maintenance 286 60 27 5 (1) 377Depreciation and amortization 85 2 1 2 9 99Taxes other than income taxes 23 — 1 1 4 29
Total operating expenses 865 757 30 20 (172) 1,500Operating income (loss) 246 70 24 5 (13) 332Earnings in equity interests — — — 2 — 2Minority interest — (18) — — — (18)Other income (loss) 1 — — — (3) (2)
EBIT $ 247 $ 52 $ 24 $ 7 $ (16) $ 314Identifiable assets $4,383 $244 $ 696 $386 $ (86) $5,623Investment in joint ventures — — — 235 (221) 14
Total assets $4,383 $244 $ 696 $621 $(307) $5,637Goodwill $ 340 $ — $ — $ 14 $ — $ 354Capital expenditures $ 205 $ 4 $ 8 $ 36 $ 11 $ 264
AGL Resources Inc.
NOTES

Notes to Consolidated Financial Statements 107
Distribution Retail energy Wholesale Energy Corporate and Consolidated
In millions operations operations services investments intersegment eliminations AGL Resources
2003
Operating revenues1 $ 936 $ — $ 41 $ 6 $ — $ 983Operating expenses
Cost of gas 337 — 1 1 — 339Operation and maintenance 261 — 20 9 (7) 283Depreciation and amortization 81 — — 1 9 91Taxes other than income taxes 24 — — — 4 28
Total operating expenses 703 — 21 11 6 741Gain (loss) on sale of Caroline Street campus2 21 — — — (5) 16Operating income (loss) 254 — 20 (5) (11) 258Donation to private foundation (8) — — — — (8)Earnings in equity interests — 46 — 2 — 48Other income (loss) 1 — — — (1) —
EBIT $ 247 $ 46 $ 20 $ (3) $(12) $ 298Identifiable assets $3,325 $ — $ 460 $ 90 $ 2 $3,877Investment in joint ventures — 71 — 30 — 101
Total assets $3,325 $ 71 $ 460 $120 $ 2 $3,978Goodwill $ 177 $ — $ — $ — $ — $ 177Capital expenditures $ 126 $ — $ 2 $ 8 $ 22 $ 158
AGL Resources Inc.
1 Intersegment revenues—Wholesale services records its energy marketing and risk management revenue
on a net basis. The following table provides detail of wholesale services’ total gross revenues and gross
sales to distribution operations.
Third-party gross Intersegment Total gross
In millions revenues revenues revenues
2005 $6,017 $792 $6,809
2004 4,378 369 4,747
2003 3,298 353 3,651
2 The gain before income taxes of $16 million on the sale of our Caroline Street campus was recorded as
operating income (loss) in two of our segments. A gain of $21 million on the sale of the land was recorded
in distribution operations and a write-off of $5 million on the buildings and their contents was recorded
in our corporate segment.

NOTES 108
15Quarterly Financial Data (Unaudited)
Our quarterly financial data for 2005, 2004 and 2003 are summarized below. The variance in our quarterly earnings is the result of the seasonalnature of our primary business.
In millions, except per share amounts March 31 June 30 September 30 December 31
2005
Operating revenues $ 908 $ 430 $ 387 $ 993
Operating income 181 66 54 141
Net income 88 24 15 66
Basic earnings per share 1.15 0.31 0.19 0.86
Fully diluted earnings per share 1.14 0.30 0.19 0.85
2004
Operating revenues $ 651 $ 294 $ 262 $ 625Operating income 133 53 46 100Net income 66 21 20 46Basic earnings per share 1.02 0.34 0.31 0.64Fully diluted earnings per share 1.00 0.33 0.31 0.642003
Operating revenues $ 353 $ 187 $ 166 $ 277Operating income 101 41 58 58Income before cumulative effect of change
in accounting principle 60 19 22 35Net income 52 19 22 35Basic earnings per share before cumulative change
in accounting principle 0.99 0.30 0.35 0.54Basic earnings per share 0.86 0.30 0.35 0.54Fully diluted earnings per share before cumulative change
in accounting principle 0.98 0.29 0.34 0.54Fully diluted earnings per share 0.85 0.29 0.34 0.54
Our basic and fully diluted earnings per common share are calculated based on the weighted daily average number of common shares andcommon share equivalents outstanding during the quarter. Those totals differ from the basic and fully diluted earnings per share shown in thestatements of consolidated income, which are based on the weighted average number of common shares and common share equivalents out-standing during the entire year.
AGL Resources Inc.

Management’s Report on Internal Control over Financial Reporting 109
Our management is responsible for establishing and maintaining ade-quate internal control over financial reporting, as such term is definedin Exchange Act Rule 13a-15(f). Under the supervision and with theparticipation of our management, including our principal executiveofficer and principal financial officer, we conducted an evaluation ofthe effectiveness of our internal control over financial reporting basedon the framework in Internal Control—Integrated Framework issuedby the Committee of Sponsoring Organizations of the Treadway Com-mission (COSO).
Based on our evaluation under the framework in Internal
Control—Integrated Framework issued by COSO, our managementconcluded that our internal control over financial reporting was effec-tive as of December 31, 2005 in providing reasonable assuranceregarding the reliability of financial reporting and the prepara-tion of financial statements for external purposes in accordance with generally accepted accounting principles. Our manage-ment’s assessment of the effectiveness of our internal control overfinancial reporting as of December 31, 2005 has been audited by PricewaterhouseCoopers LLP, an independent registered publicaccounting firm, as stated in their report.
February 6, 2006
D. Raymond RiddleInterim Chairman and Chief Executive Officer
Andrew W. EvansSenior Vice President and Chief Financial Officer
AGL Resources Inc.
Reports of Independent Registered Public Accounting Firms 110
To the Board of Directors and Shareholders of AGL Resources Inc.:
We have completed integrated audits of AGL Resources Inc.’s 2005and 2004 consolidated financial statements and of its internal controlover financial reporting as of December 31, 2005 and an audit of its2003 consolidated financial statements in accordance with the stan-dards of the Public Company Accounting Oversight Board (UnitedStates). Our opinions on AGL Resources Inc.’s 2005, 2004, and 2003consolidated financial statements and on its internal control overfinancial reporting as of December 31, 2005, based on our audits andthe reports of other auditors, are presented below.
Consolidated Financial Statements
In our opinion, based on our audits and the report of other auditors,the consolidated financial statements present fairly, in all materialrespects, the financial position of AGL Resources Inc. and its sub-sidiaries at December 31, 2005 and 2004, and the results of theiroperations and their cash flows for each of the three years in theperiod ended December 31, 2005 in conformity with accounting prin-ciples generally accepted in the United States of America.These finan-cial statements are the responsibility of the Company’s management.Our responsibility is to express an opinion on these financial state-ments based on our audits. We did not audit the 2004 and 2003financial statements of SouthStar Energy Services LLC, a joint ven-ture in which a subsidiary of the Company has a non-controlling 70%financial interest, which statements reflect total assets of $243 mil-lion as of December 31, 2004 and total revenues of $827 million forthe year ended December 31, 2004. The Company’s equity in earn-ings in SouthStar Energy Services LLC was $46 million for the yearended December 31, 2003. Those statements were audited by otherauditors whose report thereon has been furnished to us, and ouropinion expressed herein, insofar as it relates to the amounts includedfor SouthStar Energy Services LLC., is based solely on the report ofthe other auditors. We conducted our audits of these statements inaccordance with the standards of the Public Company AccountingOversight Board (United States). Those standards require that we planand perform the audit to obtain reasonable assurance about whetherthe financial statements are free of material misstatement. An audit offinancial statements includes examining, on a test basis, evidencesupporting the amounts and disclosures in the financial statements,
assessing the accounting principles used and significant estimatesmade by management, and evaluating the overall financial statementpresentation. We believe that our audits and the report of other audi-tors provide a reasonable basis for our opinion.
As discussed in Note 1 to the consolidated financial state-ments, AGL Resources Inc. and subsidiaries changed its method ofaccounting for realized gains and losses on derivative energy com-modity contracts as of January 1, 2003, and its method of account-ing for variable interest entities as of January 1, 2004.
Internal Control over Financial Reporting
Also, in our opinion, management’s assessment, included in Manage-ment’s Report on Internal Control Over Financial Reporting appearingon page 109 of AGL Resources Inc. Annual Report to Shareholders,that the Company maintained effective internal control over financialreporting as of December 31, 2005 based on criteria established inInternal Control—Integrated Framework issued by the Committee ofSponsoring Organizations of the Treadway Commission (COSO), isfairly stated, in all material respects, based on those criteria. Further-more, in our opinion, the Company maintained, in all materialrespects, effective internal control over financial reporting as ofDecember 31, 2005, based on criteria established in Internal
Control—Integrated Framework issued by the COSO. The Com-pany’s management is responsible for maintaining effective internalcontrol over financial reporting and for its assessment of the effective-ness of internal control over financial reporting. Our responsibility is toexpress opinions on management’s assessment and on the effective-ness of the Company’s internal control over financial reporting basedon our audit. We conducted our audit of internal control over financialreporting in accordance with the standards of the Public CompanyAccounting Oversight Board (United States). Those standards requirethat we plan and perform the audit to obtain reasonable assuranceabout whether effective internal control over financial reporting wasmaintained in all material respects. An audit of internal control overfinancial reporting includes obtaining an understanding of internalcontrol over financial reporting, evaluating management’s assess-ment, testing and evaluating the design and operating effectivenessof internal control, and performing such other procedures as we consider necessary in the circumstances. We believe that our auditprovides a reasonable basis for our opinions.
AGL Resources Inc.

Reports of Independent Registered Public Accounting Firms 111
A company’s internal control over financial reporting is aprocess designed to provide reasonable assurance regarding the reliability of financial reporting and the preparation of financial state-ments for external purposes in accordance with generally acceptedaccounting principles. A company’s internal control over financialreporting includes those policies and procedures that (i) pertain to themaintenance of records that, in reasonable detail, accurately and fairlyreflect the transactions and dispositions of the assets of the company; (ii) provide reasonable assurance that transactions are recorded asnecessary to permit preparation of financial statements in accordancewith generally accepted accounting principles, and that receipts andexpenditures of the company are being made only in accordance withauthorizations of management and directors of the company; and (iii) provide reasonable assurance regarding prevention or timely detec-tion of unauthorized acquisition, use, or disposition of the company’sassets that could have a material effect on the financial statements.
Because of its inherent limitations, internal control over finan-cial reporting may not prevent or detect misstatements. Also, projec-tions of any evaluation of effectiveness to future periods are subjectto the risk that controls may become inadequate because of changesin conditions, or that the degree of compliance with the policies orprocedures may deteriorate.
Atlanta, GeorgiaFebruary 6, 2006
The Executive Committee and MembersSouthStar Energy Services LLC
We have audited the balance sheet of SouthStar Energy Services LLCas of December 31, 2004, and the related statements of income,changes in members’ capital, and cash flow for each of the two yearsin the period ended December 31, 2004. These financial statementsare the responsibility of the Company’s management. Our responsi-bility is to express an opinion on these financial statements basedon our audits.
We conducted our audits in accordance with the standards ofthe Public Company Accounting Oversight Board (United States).Those standards require that we plan and perform the audit to obtainreasonable assurance about whether the financial statements are freeof material misstatement. An audit includes examining, on a testbasis, evidence supporting the amounts and disclosures in the finan-cial statements. An audit also includes assessing the accounting prin-ciples used and significant estimates made by management, as wellas evaluating the overall financial statement presentation. We believethat our audits provide a reasonable basis for our opinion.
In our opinion, the financial statements referred to above pre-sent fairly, in all material respects, the financial position of SouthStarEnergy Services LLC at December 31, 2004, and the results of itsoperations and its cash flows for each of the two years in the periodended December 31, 2004 in conformity with U.S. generally acceptedaccounting principles.
Atlanta, Georgia February 4, 2005
AGL Resources Inc.

Shareholder Information 112
Corporate HeadquartersAGL Resources Inc., Ten Peachtree Place, N.E., Atlanta, GA 30309;404-584-4000; website: aglresources.com.
Transfer Agent and RegistrarComputershare serves as our transfer agent and registrar and canhelp with a variety of stock-related matters, including name andaddress changes; transfer of stock ownership; lost certificates; andForm 1099s.
Inquiries may be directed to: AGL Resources Shareholder Services, c/o Computershare Trust Company, N.A., P.O. Box 43010,Providence, RI 02190-3010; toll-free 800-633-4236; website: www-us.computershare.com.
Available InformationA copy of this Annual Report, as well as our Annual Report on Form 10-K, Quarterly Reports on Form 10-Q, Current Reports onForm 8-K, other reports that we file with or furnish to the Securities and Exchange Commission (SEC) and our recent news releases are available free of charge at our website aglresources.com as soonas reasonably practicable after we electronically file such reports with, or furnish such reports to, the SEC. These reports and newsreleases are also available through a toll-free interactive shareholderinformation line at 877-ATG-NYSE (877-284-6973). The informationcontained on our website does not constitute incorporation by refer-ence of the information contained on the website and should not beconsidered part of this document.
Our Annual Report on Form 10-K includes the certifications of our chief executive officer and chief financial officer required bySections 302 and 906 of the Sarbanes-Oxley Act of 2002. Addition-ally, we will file with the New York Stock Exchange, as required, thecertification by our chief executive officer that he is not aware of anyviolation of New York Stock Exchange corporate governance listingstandards following the 2006 Annual Shareholder Meeting.
Our corporate governance guidelines; our code of ethics; ourcode of business conduct; and the charters of our Board committeesare available on our website.
The above information will also be furnished free of chargeupon written request to our Investor Relations department at: AGL Resources, Investor Relations, Dept. 1071, Ten Peachtree Place,N.E., Atlanta, GA 30309; 404-584-3801.
Institutional Investor InquiriesInstitutional investors and securities analysts should direct inquiries to:Steve Cave, Director, Investor Relations, c/o AGL Resources, InvestorRelations, Dept. 1071, Ten Peachtree Place, N.E., Atlanta, GA 30309;404-584-3801; [email protected].
Annual MeetingThe 2006 annual meeting of shareholders will be held Wednesday,May 3, 2006, at Twelve Hotel Atlantic Station (17th and State Streets,N.W.), Atlanta, Georgia 30363.
ResourcesDIRECT™ New investors may make an initial investment, and shareholders ofrecord may acquire additional shares of our common stock, throughResourcesDIRECT™ without paying brokerage fees or servicecharges. Initial cash investments, quarterly cash dividends and/oroptional cash purchases may be invested through the plan, subjectto certain requirements. To obtain a copy of the plan prospectus andenrollment materials, contact our transfer agent, call our toll-free inter-active shareholder line at 877-ATG-NYSE (877-284-6973) or visit ourwebsite at aglresources.com.
Stock Price and Dividend InformationOur common stock is listed on the New York Stock Exchange underthe symbol ATG. At January 31, 2006, there were approximately10,979 record holders of our common stock. Quarterly informationconcerning our high and low prices and cash dividends that we paidin 2005 and 2004 is as follows:
2005
Sales price of common stock Cash dividend per
Quarter ended High Low common share
March 31, 2005 $36.09 $32.00 $0.31June 30, 2005 38.89 33.37 $0.31September 30, 2005 39.32 35.29 $0.31December 31, 2005 37.54 32.23 $0.37
2004
Sales price of common stock Cash dividend per
Quarter ended High Low common share
March 31, 2004 $30.63 $27.87 $0.28June 30, 2004 29.41 26.50 $0.29September 30, 2004 31.27 28.60 $0.29December 31, 2004 33.65 30.11 $0.29
We pay dividends four times a year: March 1, June 1, Septem-ber 1 and December 1. We have paid 233 consecutive quarterly div-idends beginning in 1948. Dividends are declared at the discretionof our Board of Directors, and future dividends will depend on ourfuture earnings, cash flow, financial requirements and other factors.In February 2005, we increased the quarterly dividend to $0.31 percommon share and in November of 2005, it was increased to $0.37per common share.
Preferred SecuritiesOur preferred securities are listed and traded on the New York StockExchange under the ticker symbol ATG_P.
AGL Resources Inc.