© 2010 pearson education canada copyright © 2013 pearson canada inc. housekeeping items for geog...
TRANSCRIPT

© 2010 Pearson Education Canada
Copyright © 2013 Pearson Canada Inc.
Housekeeping Items for GEOG 101, Day 5
• A reminder that outlines/ proposals for your two chosen assignments are due on January 30th – preferably in class, or alternatively by e-mail.
• Margaret Catley-Carlson, an internationally renowned specialist on water issues will be on campus next week, and will be giving a keynote address from 5:30 to 7 on Monday, followed by a reception, in the Malaspina Theatre.
• Today and Friday, we’ll be looking at human population issues and looking at part of a film on the same subject.

© 2010 Pearson Education Canada
6Human Population
PowerPoint® Slides prepared by Stephen Turnbull
Copyright © 2013 Pearson Canada Inc.
6-2
© 2010 Pearson Education Canada
Copyright © 2013 Pearson Canada Inc.
Upon successfully completing this chapter, you will be able to
• Assess the scope and historical patterns of human population growth
• Evaluate how human population, affluence and technology affect the environment
• Explain and apply the fundamentals concepts of demography
• Outline the concept of demographic transition
• Describe how wealth and poverty, the status of women, and family planning affect population growth
• Link population goals to sustainable development
6-3

© 2010 Pearson Education Canada
Copyright © 2013 Pearson Canada Inc.
Central Case: China’s one-child policy
• In 1970, the government instituted a one-child policy, drastically decreasing the growth rate (now 0.5%)
• Unintended consequences:
- Killing female infants
- Unbalanced sex ratio
- Black-market trade in teenage girls
“As you improve health in a society, population growth goes down. You know. I thought it was…before I learned about it, I thought it was paradoxical.”
– Bill Gates, Microsoft Corp.
6-4
© 2010 Pearson Education Canada
Copyright © 2013 Pearson Canada Inc.
The Human Population at 7 Billion
6-5
© 2010 Pearson Education Canada
Copyright © 2013 Pearson Canada Inc.
Human population: is now 7 billion and growing
• Populations continue to rise in most countries
- Particularly in developing nations
• Although the rate of growth is slowing, we are still increasing in absolute numbers
• How much is 7 billion?
- It would take 30 years, counting once each second, to reach 1 billion
6-6

© 2010 Pearson Education Canada
Copyright © 2013 Pearson Canada Inc.
The human population is growing nearly as fast as ever
• It took all of human history- after 1880 - to reach 1 billion
• In 1927 we reached 2 billion, and added the most recent billion in 12 years
6-7

© 2010 Pearson Education Canada
Copyright © 2013 Pearson Canada Inc.
The human population is growing nearly as fast as ever (cont’d)
• At today’s 2.1% annual growth rate, the population will double in 33 years
• If China’s rate had continued at 2.8%, it would have had 2 billion people in 2004.
6-8
© 2010 Pearson Education Canada
Copyright © 2013 Pearson Canada Inc.
Perspectives on human population have changed over time
• 1700s – more children meant better support in old age and more labour for factory work
• 1766: Thomas Malthus – growing population is eventually checked by limits on births or increases in deaths
• 1968: Paul Ehrlich – population is growing too fast and must be controlled
- Disastrous effects on the environment and human welfare
6-9

© 2010 Pearson Education Canada
Copyright © 2013 Pearson Canada Inc.
Perspectives on human population have changed over time (cont’d)
• Ehrlich and other neo-Malthusians have argued that population is growing much faster than our ability to produce and distribute food and that population control is the only way to prevent:
- Massive starvation
- Environmental degradation
- Civil strife
6-10

© 2010 Pearson Education Canada
Copyright © 2013 Pearson Canada Inc.
Is population growth really a “problem” today?
• Population growth results from technology, sanitation, food
- Death rates drop, but not birth rates
• Some people say growth is no problem
- New resources will replace depleted ones
- But, some resources (i.e., biodiversity, a balanced climate) are irreplaceable
• Quality of life will suffer with unchecked growth
- Less food, space, wealth per person
6-11
© 2010 Pearson Education Canada
Copyright © 2013 Pearson Canada Inc.
Is population growth really a “problem” today (cont’d)?
• Sheldon Richman – humans find potential stuff and human intelligence turns it into resources
• Humankind will always be able to save itself with a “technological fix”
• Yet not all resources can be replaced or reinvented once they are depleted (e.g. extinct species, land)
• Population growth is much more strongly correlated with poverty than with wealth
6-12

© 2010 Pearson Education Canada
Copyright © 2013 Pearson Canada Inc.
Is population growth really a “problem” today (cont’d)?
• Policymakers believe growth increases economic, political, military strength
- They offer incentives for more children
- 49% of European nations think their birth rates are too low
- In non-European nations, only 12% feel their birth rates are too low
6-13

© 2010 Pearson Education Canada
Copyright © 2013 Pearson Canada Inc.
The Science Behind the Story
• Mapping Our Population’s Environmental Impact
- Burgeoning numbers of people are making heavy demands on Earth’s natural resources and ecosystem services
- Humans are responsible for using up almost 24% of the planet’s NPP
- Direct harvesting of crops, timber, etc. account for most of this
- Densely populated and heavily farmed regions such as India, Eastern China, and Europe show the greatest proportional use of NPP
6-14

© 2010 Pearson Education Canada
Copyright © 2013 Pearson Canada Inc.
Population is one of several factors that affect the environment
• The IPAT model: I = P x A x T x S
- Our total impact (I) on the environment results from the interaction of population (P), affluence (A) and technology (T), with an added sensitivity (S) factor
- Population = individuals need space and resources
- Affluence = greater per capita resource use
- Technology = increased exploitation of resources
- Sensitivity = how sensitive an area is to human pressure
6-15
© 2010 Pearson Education Canada
Copyright © 2013 Pearson Canada Inc.
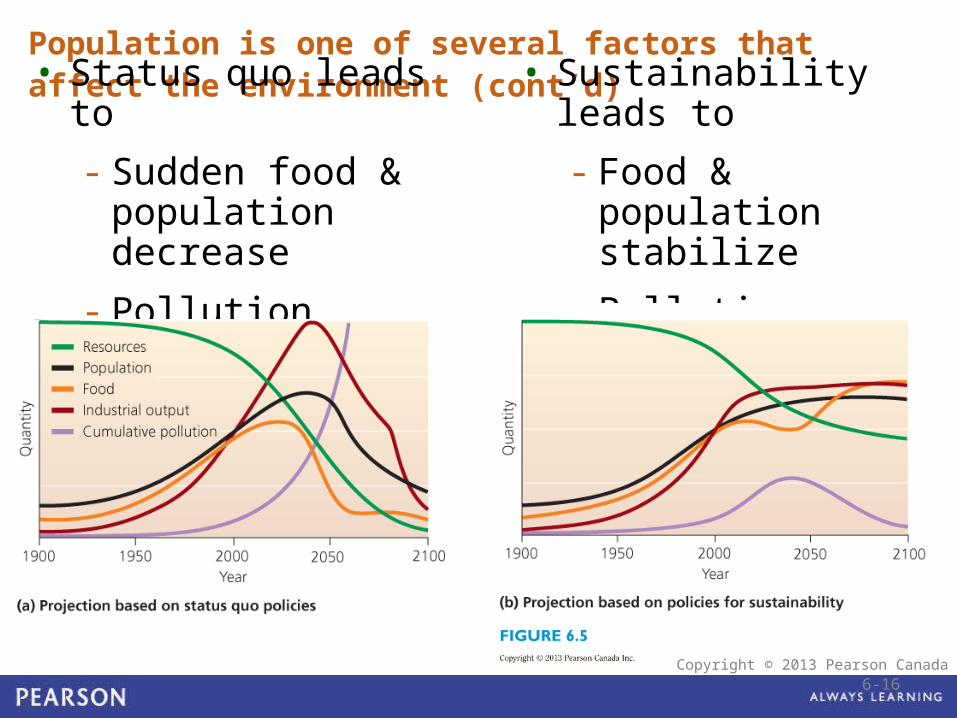
Population is one of several factors that affect the environment (cont’d)
• Status quo leads to
- Sudden food & population decrease
- Pollution increase
• Sustainability leads to
- Food & population stabilize
- Pollution decrease
6-16
© 2010 Pearson Education Canada
Copyright © 2013 Pearson Canada Inc.
Demography
6-17

© 2010 Pearson Education Canada
Copyright © 2013 Pearson Canada Inc.
The environment has a carrying capacity for humans• Demography: the application of population ecology
principles to the study of statistical change in human populations
• Environmental factors set limits on our population growth, and the environment has a carrying capacity for our species
• Four significant periods of societal change appear to have fundamentally altered the human relationship with the environment
6-18
© 2010 Pearson Education Canada
Copyright © 2013 Pearson Canada Inc.
The environment has a carrying capacity for humans (cont’d)
• Paleolithic period (Old Stone Age):
- Use of fire as much as 1.5 million years ago
- Shape and use of stones 2.5 million years ago, which helped modify their environment
- Little evidence about world populations at this time
6-19
FIGURE 6.7

© 2010 Pearson Education Canada
Copyright © 2013 Pearson Canada Inc.
The environment has a carrying capacity for humans (cont’d)
• Neolithic (New Stone Age):
- Agricultural Revolution
- 10,000 to 12,000 years ago
- Initiated a permanent change in the way humans relate to the natural environment
- Made cities, trades, science, armies, and other aspects of modern culture possible
6-20
FIGURE 6.7
© 2010 Pearson Education Canada
Copyright © 2013 Pearson Canada Inc.
The environment has a carrying capacity for humans (cont’d)
• Industrial Revolution:
- Began in the mid – 1700s
- A shift from rural life, animal-powered agriculture, and manufacturing by craftsmen, to an urban society powered by fossil fuels
- Improvements in sanitation and medical technology
- Enhanced agricultural production
6-21
FIGURE 6.7
© 2010 Pearson Education Canada
Copyright © 2013 Pearson Canada Inc.
The environment has a carrying capacity for humans (cont’d)
• Medical-Technological Revolution:
- Currently in the midst modern medical and technological advancements
- People live longer and healthier lives
- Green Revolution – shift to modern agricultural practices
6-22
FIGURE 6.7

© 2010 Pearson Education Canada
Copyright © 2013 Pearson Canada Inc.
Demography is the study of human population
• Demographers study:
- Population size
- Density
- Distribution
- Age structure
- Sex ratio
- Rates of birth, death, immigration, and emigration
6-23
© 2010 Pearson Education Canada
Copyright © 2013 Pearson Canada Inc.
Demography is the study of human population (cont’d)
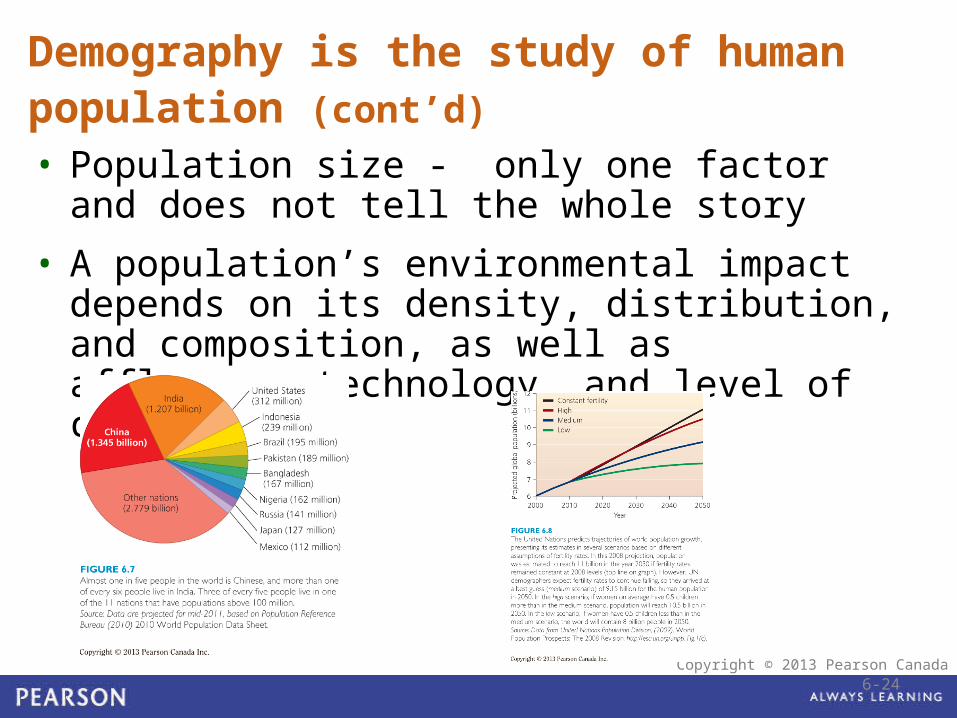
• Population size - only one factor and does not tell the whole story
• A population’s environmental impact depends on its density, distribution, and composition, as well as affluence, technology, and level of consumption
6-24

© 2010 Pearson Education Canada
Copyright © 2013 Pearson Canada Inc.
Demography is the study of human population (cont’d)
• Humans are unevenly distributed around the globe
• Highest population density is in temperate, subtropical, and tropical climates
- Unpopulated areas tend to be environmentally sensitive (high S value in the IPAT equation)
6-25

© 2010 Pearson Education Canada
Copyright © 2013 Pearson Canada Inc.
Demography is the study of human population (cont’d)
• Age structure important in predicting future dynamics of populations
• Having many individuals in young age groups results in high reproduction and rapid population growth
6-26
© 2010 Pearson Education Canada
Copyright © 2013 Pearson Canada Inc.
China’s reproductive policy
Consider the benefits as well as the problems associated with a reproductive policy such as China’s.
•Should a government be able to enforce strict penalties for citizens who fail to abide by such a policy?
•What alternatives can you suggest for dealing with the resource demands of a quickly growing population?
•
weighing
the issues
6-27

© 2010 Pearson Education Canada
Copyright © 2013 Pearson Canada Inc.
Demography is the study of human population (cont’d)
• Sex Ratios can affect population dynamics
• Naturally occurring sex ratios for humans slightly favour males (100 females born to 106 males)
• In China, 120 boys were reported for 100 girls
- Cultural gender preferences, combined with the government’s one-child policy, led to selective abortion of female fetuses
- Had the undesirable social consequences of many single Chinese men
- Teenage girls were kidnapped and sold as brides
6-28

© 2010 Pearson Education Canada
Copyright © 2013 Pearson Canada Inc.
Population change results from birth, death, immigration, and emigration
• Whether a population grows, shrinks, or remains stable depends on:
- Rates of birth, death, and migration
- Birth and immigration add individuals
- Death and emigration remove individuals
• Crude birth rate (nativity or natality) = number of births per 1000 individuals
• Crude death rate (mortality) = number of deaths per 1000 individuals
6-29
© 2010 Pearson Education Canada
Copyright © 2013 Pearson Canada Inc.
Population change results from birth, death, immigration, and emigration
• Technological advances led to dramatic decline in human death rates widening the gap between crude birth rates and crude death rates and resulting in population expansion
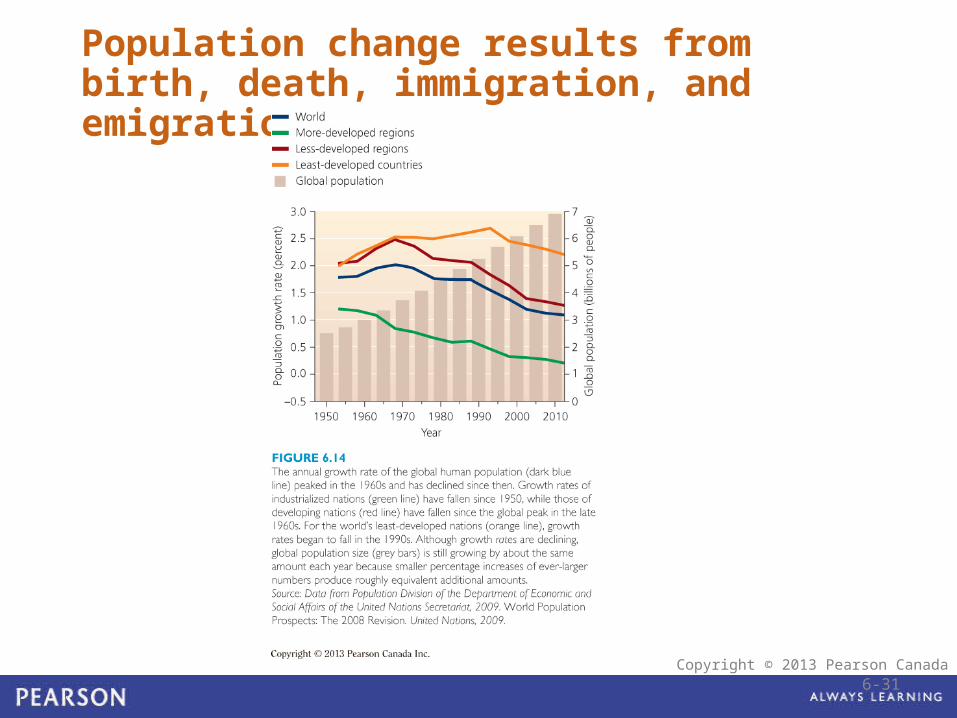
• Growth rates in many countries have been declining, even without population control policies
- Decline due in part from a steep drop in birth rates
6-30
© 2010 Pearson Education Canada
Copyright © 2013 Pearson Canada Inc.
6-31
Population change results from birth, death, immigration, and emigration
© 2010 Pearson Education Canada
Copyright © 2013 Pearson Canada Inc.
Total fertility rate influences population growth
• Total fertility rate (TFR) = average number of children born per female member of a population during her lifetime
• Replacement fertility = the TFR that keeps the size of a population stable
6-32

© 2010 Pearson Education Canada
Copyright © 2013 Pearson Canada Inc.
Total fertility rate influences population growth (cont’d)
• Increasing urbanization decreases TFR
- Children go to school, and increase costs
• With social security, elderly parents need fewer children to support them
• Greater education allows women to enter the labor force, with less emphasis on child rearing
6-33
© 2010 Pearson Education Canada
Copyright © 2013 Pearson Canada Inc.
Consequences of low fertility?
In Canada, the United States, and every European nation, the total fertility rate has now dipped below replacement fertility rate.
•What economic, social, or environmental consequences – positive or negative – do you think might result from below-replacement fertility rates?
weighing
the issues
6-34

© 2010 Pearson Education Canada
Copyright © 2013 Pearson Canada Inc.
Some nations have experienced the demographic transition
• Natural rate of population change = due to birth and death rates alone
- In countries with good sanitation, health care, and food, people live longer
• Life expectancy = average number of years that an individual is likely to continue to live
- Increased due to reduced rates of infant mortality
- Urbanization, industrialization, and personal wealth
6-35

© 2010 Pearson Education Canada
Copyright © 2013 Pearson Canada Inc.
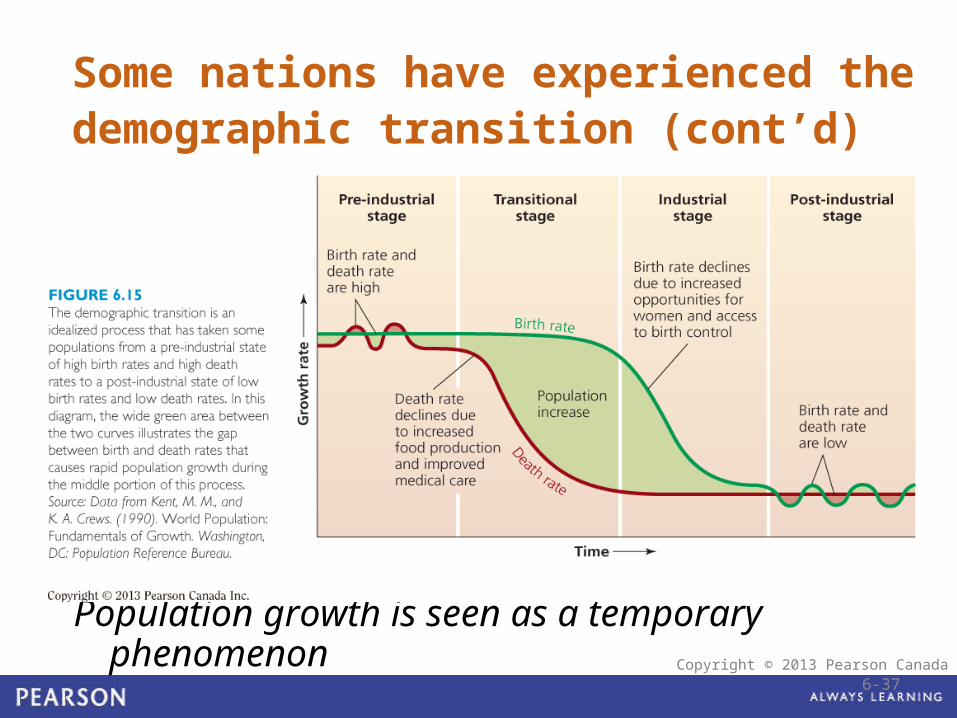
Some nations have experienced the demographic transition (cont’d)
• Demographic transition = a model of economic and cultural change to explain the declining death and birth rates in industrializing nations
• high birth and death rates change to low birth and death rates
• As mortality decreases, there is less need for large families
- Parents invest in quality of life
6-36
© 2010 Pearson Education Canada
Copyright © 2013 Pearson Canada Inc.
Some nations have experienced the demographic transition (cont’d)
Population growth is seen as a temporary phenomenon6-37
© 2010 Pearson Education Canada
Copyright © 2013 Pearson Canada Inc.
Is the demographic transition a universal process?• It has occurred in Europe, U.S., Canada, Japan,
and other nations over the past 200-300 years
• But, it may or may not apply to all developing nations
• The transition could fail in cultures that
- Place greater value on childbirth
- Grant women fewer freedoms
For people to attain the material standard of living of North Americans, we would need the natural resources of four and a half more Earths
6-38
© 2010 Pearson Education Canada
Copyright © 2013 Pearson Canada Inc.
Population and Society
6-39
© 2010 Pearson Education Canada
Copyright © 2013 Pearson Canada Inc.
The status of women greatly affects population growth rates
• 2010: 55% of married women (aged 15-49) worldwide reported using modern contraception to plan / prevent pregnancy
• Social empowerment of women reduces unintended pregnancy
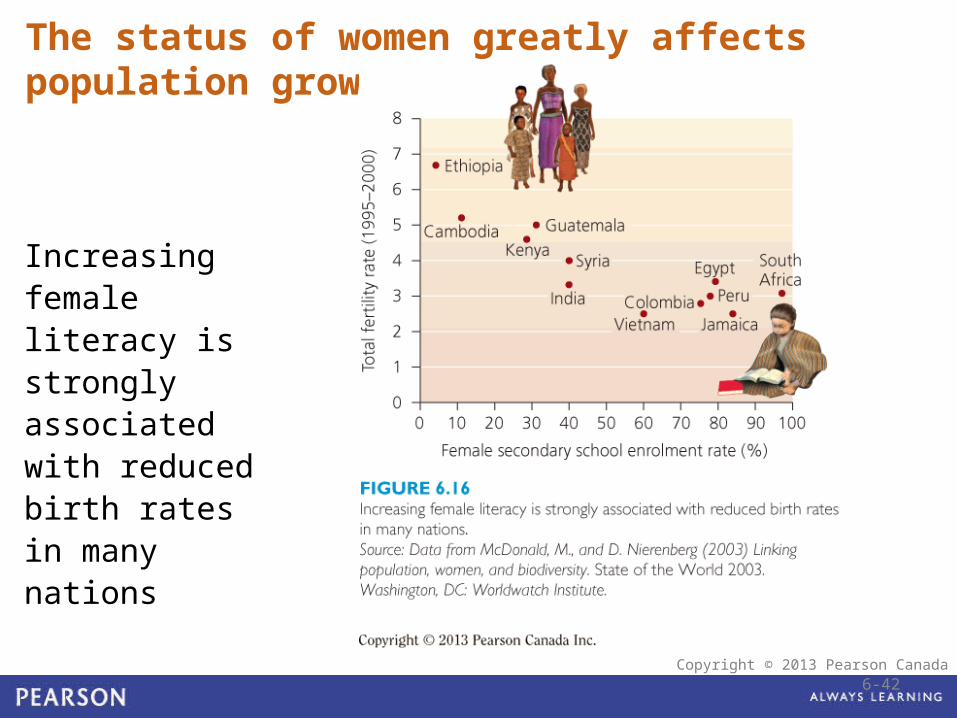
• Increasing female literacy is strongly associated with reduced birth rates
6-40

© 2010 Pearson Education Canada
Copyright © 2013 Pearson Canada Inc.
© 2010 Pearson Education Canada
Copyright © 2013 Pearson Canada Inc.
Increasing female literacy is strongly associated with reduced birth rates in many nations
6-42
The status of women greatly affects population growth rates (cont’d)
© 2010 Pearson Education Canada
Copyright © 2013 Pearson Canada Inc.
Population policies and family-planning programs are working
• These policies lower population growth rates in all types of nations
• Programs for population control:
- India – incentives for a “two-child norm”
- Thailand – family planning education and increased availability of contraceptives
• 1994: U.N. platform for governments to offer universal access to reproductive health care within 20 years.
6-43
© 2010 Pearson Education Canada
Copyright © 2013 Pearson Canada Inc.
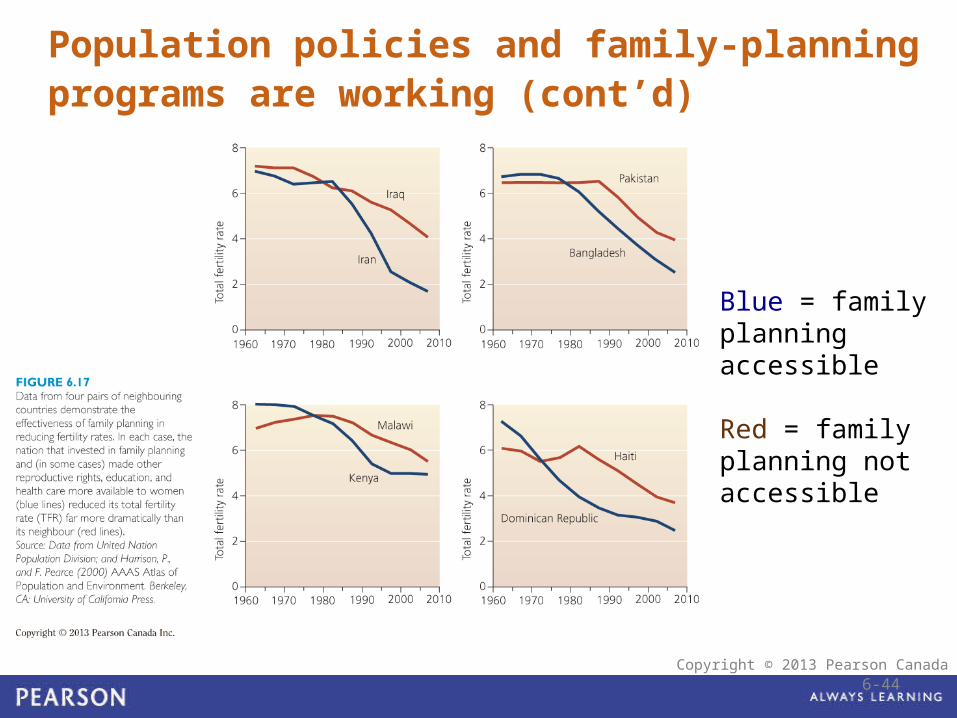
Population policies and family-planning programs are working (cont’d)
Blue = family planning accessible
Red = family planning not accessible
6-44
© 2010 Pearson Education Canada
Copyright © 2013 Pearson Canada Inc.
• Poorer societies have higher growth rates than wealthier societies
- Consistent with the demographic transition theory
- They have higher fertility and growth rates, with lower contraceptive use
• 99% of the next billion people added will be born in poor, less developed regions that are least able to support them
• Poverty often results in environmental degradation (e.g. soil degradation, hunting of large mammals)
Poverty is strongly correlated with population growth
6-45

© 2010 Pearson Education Canada
Copyright © 2013 Pearson Canada Inc.
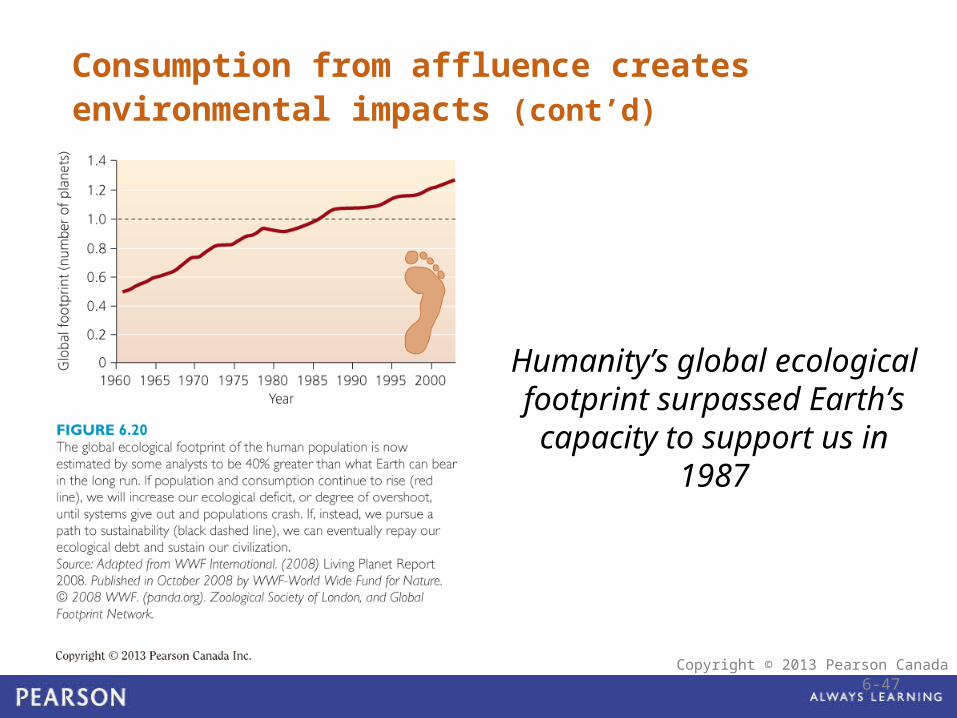
Consumption from affluence creates environmental impacts
• Affluent societies have enormous resource consumption and waste production
- People use resources from other areas, as well as from their own
- Individuals’ ecological footprints are huge
• The addition of 1 Canadian to the world has as much environmental impact as 6 Chinese, or 12 Indians or Ethiopians, or 40 Somalians.
6-46
© 2010 Pearson Education Canada
Copyright © 2013 Pearson Canada Inc.
Consumption from affluence creates environmental impacts (cont’d)
Humanity’s global ecological footprint surpassed Earth’s
capacity to support us in 1987
6-47

© 2010 Pearson Education Canada
Copyright © 2013 Pearson Canada Inc.
The wealth gap and population growth contribute to conflict
• The richest 20% use 86% of the world’s resources
• Leaves 14% of the resources for 80% of the world’s people to share
6-48
© 2010 Pearson Education Canada
Copyright © 2013 Pearson Canada Inc.
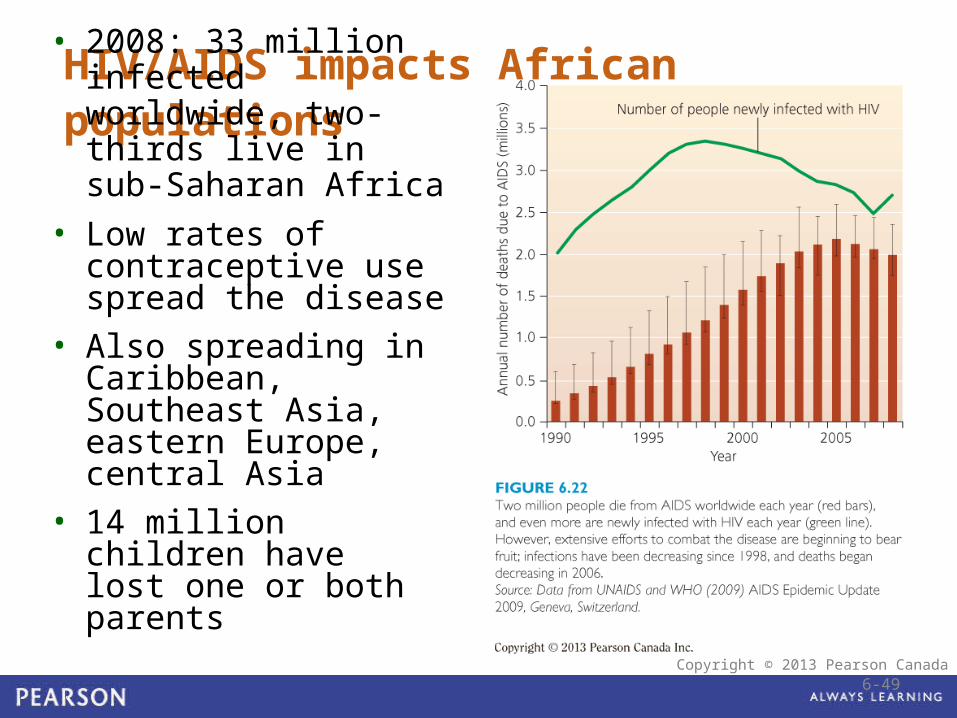
HIV/AIDS impacts African populations
• 2008: 33 million infected worldwide, two-thirds live in sub-Saharan Africa
• Low rates of contraceptive use spread the disease
• Also spreading in Caribbean, Southeast Asia, eastern Europe, central Asia
• 14 million children havelost one or both parents
6-49

© 2010 Pearson Education Canada
Copyright © 2013 Pearson Canada Inc.
Demographic change has social, economic, and environmental repercussions
• Demographic fatigue = governments face overwhelming challenges related to population growth.
- With the added of stress of HIV/AIDS; governments are stretched beyond their capabilities
- Problems grow worse
6-50
© 2010 Pearson Education Canada
Copyright © 2013 Pearson Canada Inc.
The U.N. has articulated sustainable development goals for humanity• Millennium Development Goals = by 2015
achieve goals for sustainable development
- Does not include population control
• Earth does not hold enough resources to sustain 6.7 billion of us at the North American standard of living
6-51

© 2010 Pearson Education Canada
Copyright © 2013 Pearson Canada Inc.
Conclusion• The human population is larger than at any time in the past
• Growing population as well as growing consumption, affects the environment
• Growth rate has decreased nearly everywhere
• Progress has been made in expanding rights for women worldwide
• How will the population stop rising?
- Demographic transitions
- Governmental intervention
- Disease
- Social conflict
6-52

© 2010 Pearson Education Canada
Copyright © 2013 Pearson Canada Inc.
QUESTION: ReviewWhat has accounted for the majority of the world’s population growth in recent years?
a) Women are having more babies
b) Death rates have dropped due to technology, medicine, and food
c) More women are using contraceptives
d) Nothing, the population has dropped in recent years
6-53

© 2010 Pearson Education Canada
Copyright © 2013 Pearson Canada Inc.
QUESTION: Review
According to the I = P x A x T formula, what would happen if China’s 1 billion people had a lifestyle like Canadians?
a) Their population would automatically drop
b) Their population would automatically increase
c) Their affluence and technology would increase
d) Their impact on the environment would even out
6-54

© 2010 Pearson Education Canada
Copyright © 2013 Pearson Canada Inc.
QUESTION: Review
How have humans been able to raise the environment’s carrying capacity for our species?
a) Through technology
b) By eliminating limiting factors
c) Through increased consumption
d) Spending more money on non-essential resources
6-55
© 2010 Pearson Education Canada
Copyright © 2013 Pearson Canada Inc.
QUESTION: Review
Areas that lack significant numbers of people, and have a low population density are…
a) No longer available
b) Best able to support higher densities of people
c) Sensitive areas least able to support high densities of people
d) Located around tropical and grassland areas
6-56
© 2010 Pearson Education Canada
Copyright © 2013 Pearson Canada Inc.
QUESTION: ReviewDescribe the relationship between growth rates and population size.
a) Falling growth rates automatically mean a smaller population
b) Falling growth rates automatically mean a larger population
c) Falling growth rates means we no longer have a population problem
d) Falling growth rates does not mean a smaller population, but that rates of increase are slowing
6-57
© 2010 Pearson Education Canada
Copyright © 2013 Pearson Canada Inc.
QUESTION: Weighing the Issues
Would you rather live in a country with a larger population or smaller population?
a) Small population, so there will be more resources for me
b) Small population, so there will be more resources for others, including wildlife
c) Large population, so I can find a date
d) Large population, because people are our biggest resource
6-58

© 2010 Pearson Education Canada
Copyright © 2013 Pearson Canada Inc.
QUESTION: Interpreting Graphs and Data
a) High birth and death rates rise cause population increases
b) High birth and death rates, but population is stable
c) High birth rates with low death rates cause population to increase
d) Low birth and death rates cause the population to decrease
What happens during the “pre-industrial” stage of the demographic transition?
6-59
© 2010 Pearson Education Canada
Copyright © 2013 Pearson Canada Inc.
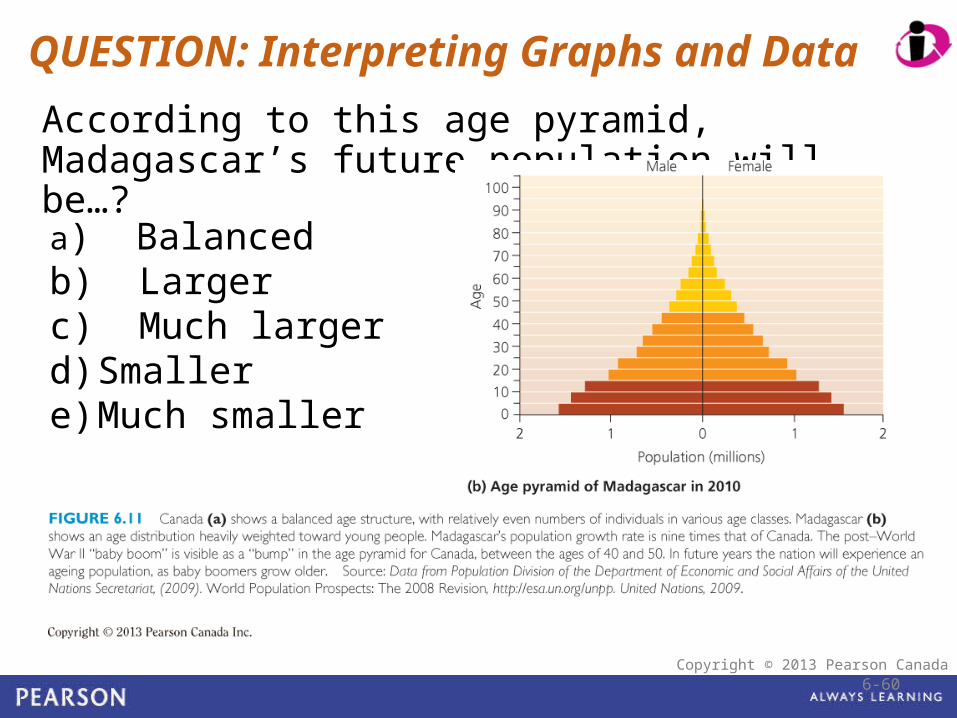
QUESTION: Interpreting Graphs and Data
According to this age pyramid, Madagascar’s future population will be…?
a) Balancedb) Largerc) Much largerd) Smallere) Much smaller
6-60

© 2010 Pearson Education Canada
Copyright © 2013 Pearson Canada Inc.
QUESTION: Interpreting Graphs and Data
6-61
a) Iraq and Pakistanb) Malawi and Haitic) Malawi and Kenyad) Kenya and Bangladesh
According to these graphs, which countries had access to family planning?