maasbusinesscase.commaasbusinesscase.com/business case/new western sydney muse… · web...
TRANSCRIPT

Segments
Segment: All NS1A1‘-
activities
All NSW n Concer..
GS West lults). MemGS Other ind activities
-0 A sit down
MAAS I Neo I Johnstaff 77
To change the population segment shown, select the 'Segment' drop-down from the top bar and choose one of the available segments:
· All NSW: all NSW participants
· GS West: West Greater Sydney participants
· GS Other: All Greater Sydney participants who do not live in GS West
· Rest of NSW: all NSW participants who don't live in Greater Sydney
· $20 per person
· Admission is free
· Live performances ar n/a

MAAS I Neo I Johnstaff 78
Attributes
...ervation areas
Museum highlights
A children and families zone, indoor ...
· Education labratories and workshop ...
· Temporary exhibitions
· Research and library spaces
International touring exhibitions
n/a
n/a n/a
A ceri • PlanetariumAd d ittmcarurottat TAT-IL=
A permanent shopping space
n/a
n/a
Fabrication laboratories and collabor..
Similar to the wi l l ingness to pay data-set , each scenario is a configuration of attr ibutes that describe the benef i ts, costs and location. To change the configuration of a scenario, select an attr ibute value from the drop-down.
For most attributes (e.g. temporary exhibit ions) the study tested if i t was available, or not. For these attributes, selecting the 'n/a' value removes it from the scenario while select ing e.g. 'Planetarium' adds it to the scenario.
For other attributes (e.g. food and drink facil it ies) the study tested multiple options (e.g. a sit down cafe, a food court, a wine bar, or a 4/5 star restaurant). For these attributes, all options are available in the value drop-down.

,e.Lent, via a pers...
Jping space
iboratories and collabor... -
I P
*fits
New Museum Concept
MAAS I Neo I Johnstaff 79
Multiple scenarios
It's possible to compare two different scenarios at once. To do so, tap/click the 'del option' button in the footer and then 'add option'.
When doing this, the simulator imagines that 2 different Museum's are available simultaneously. The '% share' values then indicate for the group of people who would possibly visit one of the new Museum's, the proportion who would visit one configuration over another.

MAAS I Neo I Johnstaff 80
Appendix 1. Willingness to pay scenarios
•

MAAS I Neo I Johnstaff 81
Appendix 1. Willingness to pay scenarios
This appendix contains a data set that shows how much
participants would pay to visit the New Museum, or
support it via a council levy.Context on these, how to interpret them, and outcomes
arising from them can be found in sections '2. Willingness
to pay scenarios' and '3. Willingness to pay outcomes' on
pages 9-28.The data set is also available in Excel format in the final

deliverables shared with this report.

WillINONESS TO PAY- USE
SCENARIO -Powerhouse Ultimo SOP® 957:C1 SCENARIO 1 - no einem...elation, no NSW touting gallery alITP a SW. CI SCENARIO - cinmnal MI towing gaiety,
PVT?990 CI SCENARIO 3- ememalplanetantins NSyl tenaling goiRty NEW WTP 9NSM
Current Melons Chang. features (comp.. to Ultimo) Changed features (con...3W MM.) changed features (compared to Alm.Powarhouse Intimo 00.00 ISMS Pa mama. MARS P11.111•114 MAAS Panel.. 39.05Museum hghligina $107 Cent. for Mahon $1.19 Centre for .shed 31.19 Centre for MshMn 31.19Temporary exhibitions $1.67 Can.. innovation SOW innovation WOO Centre for innovate. 0000
c.f. Planation space $0.00 . outdoor chidren and Nantes.. $1.67 An .door and WIdOW Cladtan and fanallaa Zane 3107 An indoor and Mika.' children and families zone 01.67Ex hibilmns for saMools, chid,. a. (whiles $2.36 Entry cost to a children and far.. cone 5510 per 6727 SO00 Entry cost to a GM.n and lei.. zone •I SI 0 per lam. 5.5 Entry coat to a Chadian and families zone is SIO per lardy 30.00An indoor children and Ismlies zone...... 0000 ''..6Pnolo9e Whom', $000 yeppetogy SOLO Tadinology $0.00Entry cost to ta Nildren end families zone is fr. $0.00 prod.. studio 00.109 M.ia production studio WOO Media product on studio 0.0.00Additional digital content via s para.., emaripnone al the museum SO.00 Business incubators 00.00 BuNnem Mc.ators 1000 Business incubaloes IMODInternational louring exhibition SOLO 00 Cinema Non, museum content 51.10 00 Cinema showing museum content 51.19Miming the MAAS collection n. on show $000 Planetarium $1.19 Planetarium 51.10Live performances and concerts $2.36 NSW touring .Nbilions 50.00Some special exhibitions and activities have an entrance fee in adda te general
..aion $0.00Members only spaces. a private rest and relaxation spa. PM free snacks and drink. 30.00Members benefits . 10.00CON Ito become a Member -575 per person (Adult.) -31.75
ad do. cafe 30.00Cost of food end dn.-STD per person -3071A permanent shopping ape. 30.00Research and .ivory spry ale]Conservation areas 31.79Hun.. laborsto.s and worlishop epees $1.57Conference art...notion Nchlies 5139PatitMalMn laboratories and coNaboration 30.00
Entry codaEntry cost to the P.ndeeai- 0"S ...mon OSMAN). Members free. 41a.00
Willingneso to P.O Willingness to pay Willingness to pyVVTP - difference 32.52 WTP difference 41019 WTI,- difference 43.61 WT9 - dittetenea 43.111WTP - total 517.32 WTP -total Intel WTP 611.13 WTP -total 811.18

WILLINGNESS TO PAY - NON-
SCENARIO 1 - no cinemalplanetarium, no NSW touring
, Changed features (compared to Ultimo)MAAS ParramattaCentre for fashion; Centre for innovation __ An indoor and outdoor children and families zone, Entry cost to a children and families zone is $10 per family, Technology laboratoryMedia production studio
Levy'sTray levy (9nearited) -$10 Council Wet levy, once a year for 3 years
WTP 95% CI
$10.73 $0.00 $0.00 $0.00 $0.29 $0.00 $0.
-iioth

WTP - difference1 WTP-total (assuming 3 yeam of
WTP c 95% CI SCENARIO 2- cinemalplanetarium, no NSW touring gallery WTP a 95% CI SCENARIO 3 - cinemalplanetarium, NSW touring gallery
Changed features (compared to Ultimo) Changed features (compared to Ultimo)$10.73 MAAS Parramatta $10.73 MAAS Parramatta
$0.00 Centre for fashion $0.00 Centre for fashion
$0.00 Centre for innovation $0.00 Centre for innovation$0.00 An indoor and outdoor children and families zone $0.00 An indoor and outdoor children and families zone
$0.29 Entry cost to a children and families zone is $10 per family $0.29 Entry cost to a children and families zone is $10 per family$0.00 Technology laboratory $0.00 Technology laboratory
$0.00 Media production studio $0.00 Media production studio
$0.00 Business incubators $0.00 Business incubators3D Cinema showing museum content $0.00 3D Cinema showing museum content
Planetarium $1.90 PlanetariumNSW touring exhibitions
Levy'si_Levy's-$10.00 ,Tax levy (linearlsed)- $10 Council rates levy, once a year for 3 years i 410.06 Tax levy (tinearised)- $10 Council rates levy, once a year for iyears
Nfillingness to pay Willingness to pay Willingness to pay
-
$1.02 WTP-difference lyi/TP - differenceI' 39

- i $$3:9933i $33.06 WTP -total (assuming 3 years of levy) $3$28.3926, 41NTP - total (assuming 3 years of levy)

Changed features (compared to Ultimo)MAAS ParramattaEntry cost to the Museum - $5 per person (Adults). Members freeCentre for fashionCentre for innovationAn indoor and outdoor children and families zoneEntry cost to a children and families zone is $10 per familyTechnology laboratory
Changed features (compared to Ultimo)$10.73' IA4AAS Parramatta$5.42, j Entry cost to the Museum- $5 per person (Adults). Members free.$0.00, 'Centre for fashion$0.00 'Centre for innovation$0.00 ' An indoor and outdoor children and families zone50.29 Entry cost to a children and families zone is $10 per family$0.00 Technology laboratory$0.00 Media production studio
$0.00: Business incubators$0.00 3D Cinema showing museum content$1.90. Planetarium
$10.73 $5.42' $0.00 $0.00 $0• 00 $0.29
Levy's- 1Tax levy (lineafised).- $10 Council rateslevy, once a year for 3 years -$10.00
WTP - differenceM1.- total (assuming 3 years of levy)
$6.44
WILLINGNESS TO PAY - NON-USE
SCENARIO 1 - no cinema/planetarium, no NSW touring gallery WTP t 95% CI SCENARIO 2- cinema/planetarium, no NSW touring gallery WTP @ 95% Cl SCENARIO 3 - cinema/planetarium, NSW touring gallery WTP @ 95% CI
C h a n g e d f e a t u r e s ( c o m p a r e d t o U l t i m o ).._ ;
MAAS Parramatta $10.73Entry cost to the Museum - $5 per person (Adults). Members free. $5.42Centre for fashion ' $0.00
Centre for innovation$0.00
An indoor and outdoor children and families zone $0.00Entry cost to a children and families zone is $10 per family $0.29Technology laboratory 80.00Media production studio $0.00Business Incubators $0.00, Business incubators
30 Cinema showing museum contentPlanetarium

Levy's'Tex levy (theorised,- $10 Council rates levy, once a year for 3 yews -$10.001
Levy'sTax levy (Nnearised)- $10 Council rates levy, once a year fOr 3 years !
,410.001
Willingness to pay,IMIlingness to pay;WTI, - difference $8.341 [WTP - difference 118:75!.WTP - tote! (assuming 3 years of levy) $55.02: WTP - total (assuming 3 yeam of levy) $56.251

Appendix 2. Choice Model Experiment methodology

MAAS I Neo I Johnstaff 83
Appendix 2. Choice Model Experiment methodologyThis appendix contains a detailed report that documents
the approach and validity of the choice experiment used
to generate the Willingness to Pay Scenarios. Context on
the approach to this can be found in section '1. Approach
and outputs' on pages 3-8. Context on how to interpret
them, and outcomes arising from them can be found in

sections '2. Willingness to pay scenarios' and '3.Willingness to pay outcomes' on pages 9-28.

Using a Discrete Choice Experiment to estimate willingness-to-pay and and visitation for the Museum of Applied Arts and Sciences Parramatta.
B. White, L.v.Butler. SurveyEngine Pty. Ltd.6th October, 2016Version : Final
AbstractPurpose To determine the Willingness-to-Pay (WTP) for proposed features and prices of the new museum of Applied Arts and Sciences in Parramatta and to understand the effect on visitation.
Methods Two Discrete Choice Experiments (DCEs) were run on an online panel (N=1602). Respondents answered 16 choice sets comprised of 3 options: 2 Museum concepts and a status-quo ('neither') option. 8 of the choice sets were concerned with visitation ('Use') with the remaining 8 relating to public support via a council tax levy ('Non-Use'). The 'Non-Use' Experiment explored 32 dimensions and 'Use' experiment explored 33 attributes. To maximise data capture and ensure modelling viability, a full rank ordering of the three options for each scenario was elicited. We analysed the data with a conditional logit model and used Chi-squared tests to compare sample representativeness. 'Willingness-to-Pay was calculated for the 'Non-Use' model using the council tax levy factors and using admission price for the 'Use' models.
Results Two Thousand, seven hundred and forty-four respondents were recruited to the study. 430 were screened out for not matching the study criteria, 242 were screened out as being over quota for their stated gender, region and age and 470 abandoned the study part-way. A total of 1,602 completed the survey. Incomplete responses were excluded from the study analysis. Respondents completed the survey in a median time of 14 minutes. 158 people voluntarily reported they had some difficulty with the survey with 1,307 voluntarily stating they found the survey easy or straightforward. Models for both DCEs were valid (P=0). 19 of the 32 dimensions in the 'Non-Use' were found to be significant at the 95% confidence level with 21 of the 33 of the 'Use' model attributes being
significant at 95% confidence. Estimates of the payment mechanism (price) utilities for both DCEs were found to be highly linear (both with R2 = 0.99) and monotonically decreasing values as expected. Willingness-to-Pay was calculated for both models independently. For the 'Non-Use' model, Willingness to Pay was expressed as a yearly council tax contribution, while for the 'Use' model, Willingness-To-Pay was expressed as a component of general admission price. Comparison of the two models showed general agreement in the importance and sign ( R2 = 0.95) between the two models. Both models exhibited a high degree of face validity with all price utilities monotonically decreasing. Clear visitor benefits generally had positive effect on preference with non-benefits generally having either negative or not significant effects. Scaled models incorporating real visitation figures were included in the 'Use' model providing agreement with current attendance figures.Conclusion While interpretation of the models and development of a strategy from the outputs is beyond the scope of this paper, the elements from this research should be sufficient to build a robust and optimal development strategy for the new MAAS at Parramatta.
IntroductionEconomic evaluation is an important concern in the evaluation of new technologies and services and is central in reimbursement decision-making processes in most developed countries.
In the development of the new Museum of Applied Arts and Sciences in Parramatta, it is crucial to understand the impact of proposed services, amenities and charges on both visitation ('Use') as well as public taxpayer support.
Among the methods available to researchers, a Choice
Page:1/16

Modelling approach is regarded as the most suitable method for estimating consumer's willingness to pay'Choice modelling uses a systematic experiment approach where respondents are forced, to a certain extent, to make trade-off decisions between costs and benefits. Such an experiment yields a rich dataset that allows the estimation of how individual components of a product or service contribute to overall preference.
In the Case of the MAAS move to Parramatta, choice modelling was chosen as the central method to evaluate various development options for review both by Treasury NSW and commercial concerns.
This Study addressed two related but independent needs: How would certain service and infrastructure development options valued by NSW taxpayers and how would these developments impact visitation. Two separate choice experiments were used to answer those questions.
MethodsThe methods used in this study were drawn from a previous pilot study' of 424 adults of 18 years or older NSW residents and concluded on 18.09.2016. The pilot examined the Willingness-To-Pay for proposed attributes of the new MAAS Parramatta. This pilot contained the same essential DCE attributes for both 'Use' and 'Non-Use'. The pilot validated the payment mechanisms used in this study as well as the DCE and WTP approach used.
Data Collection
Sampling and survey administration were undertaken by SurveyEngine, a survey company whichspecialises in DCEs. Respondents were drawn from two online panel of Australians (SSI and Toluna). Respondents were selected based on current residence in NSW and of being 18 years older.
Potential respondents received an email invitation to participate, including a hyper-link to the survey. They
completed the survey at their leisure and received a small payment upon completion (being not more than $10). The Survey had 9 sections over 36 web page comprised of:
1. Screening questions.
2. Introduction to the survey.
3. Usage and Attitudes for Museums and
Cultural institutions.0. Information on the proposed MAAS at
Parramatta.
1. Detailed information on possible attractions and amenities at the Museum.
2. A 'Use' or Visitation DCE.
3. A 'Non-Use' DCE.
4. Demographics Questions.
5. Opportunity for open-ended comments.
Respondent transitions between pages in the survey were recorded to assess time spent on the whole survey as well as the opportunity for individual page transition times.
Sample frameIn addition to the raw recruitment frame being NSW residents aged 18 and above (as of Jan 1, 2016) respondents were again screened on the first page of the survey unless they met these same requirements. In addition participants using mobile devices were excluded from participation due to the large amount of detailed text in the DCEs. Furthermore controls were put in place to prevent repeat participation for respondents from the same panel as well as respondents who may be on more than one panel to prevent completion of the survey more than once by the same individual.
Interlocking quota controls were'placed on gender, age and location to ensure a representative sample on these factors.
DCE Valuation Task
From the findings of the Pilot Study the following two Consequential Payment Mechanisms were selected. For the 'Non-Use' DCE, a proposed yearly council tax levy for 3 years in the range of $0 to $30. For the 'Use' DCE, general admission fee between $5 and $35 was chosen.
Both the 'Use' and 'Non-Use' tasks comprised 8 pairs of Museum Concepts or choice sets as well as an option to choose the status quo, being neither. For the Museum concepts options, 32 dimensions (attributes) were used and for the 'Non-Use' task and 33 dimensions for the 'Use' Task. The dimensions differed only in the respect that the 'Non-Use' included an additional council levy while the 'Use'
Page:2/16

Where
Spacia l Edlib leons
Fot
Food & Shope
Public and Pitvate Seams
task included additional museum accommodation and river boat attributes.
Each dimension had between 2 and 5 levels.In the 'Use' DCE the status quo option was phrased as 'Would not visit' and in the 'Non-Use' case it was phrased as 'Prefer the current Powerhouse site'.Respondents were in both cases invited to choose the option they preferred most, being 'would visit' for the 'Use' DCE and 'prefer' in the 'Non-Use'. Following their selection, the first choice was eliminated from
DCE presentation format the options and respondents were asked which of the remaining 2 they preferred. This method of data collection was chosen to maximise collection of trade-off data between two experimentally controlled choices and avoid the possibility that a majority selection of the status quo would jeopardise model viability. Furthermore this ensured a full rank ordering of the three options A,B and C such that any selection of (say) 'A' followed by 'B' would yield the preference data A>B, A>C and B>C.
Penma:mire Museum Mans
· Museum highlights· A central Installation space· Centre for Innovation· A children and families eons indoor only. admission is $10 per
(entity· Additional digital content. via a smartphone, tablet, or computer
at home
$25 per person (Adults). Members free.
· International touring exhibitions· 3D Cinema showing museum content· Live performances and concerts
$100entrance fee for each exhibition or activity in addition to general admission
· Members only spaces, private business facilities e.g. meeting spaces, walkA I ! .
$200 per person (Adults) annually
A 4f5 star restaurant, typically $40 petPersonA permanent shopping space
Research and Maury spaces
Technology laboratoryEducation lahratorim and wodishop spaces
· 1.1 use u m BoatMAAS Paramatta
· Temporary exhibitions· Centre for fashion· Exhibitions to; schools. ohildeen and families· A children and families sane, indoor and outdoor. admission is$20 per family· Additional digital content, via a personal smartphone at the museum
$35 per person (Adults). Meridiem**,
· NSW touring exhibitions· Viewing the MAAS collection not an show· 30 Cinema showing mainstream films· Planetarium
Some exhibitions and activities have an enhance fee in addition to general admission
· Members only spaces, a private rest and relaxation space with free smote, and drinks
Members benefits·
$50 per person (Adult.) annually
Ash down cafe. typically $00 per person An always changing pop-up shopping space
Conservation areasConference and function belittlesMedia production studio
Fabrication laboratories and
collaboration spaces
Business incubators
Museum AccommodationWo u ld n o t V i s i t
•
Powerhouse Museum Ultimo
•
MAAS Pwarnatta
•
Wvu k d Nat Visa
Figure 1: Example DCE Scenario
Given the large number of attributes for both DCEs, attributes were grouped into a familiar format similar to the current Powerhouse website • The groups were 'What's on', 'Special Exhibitions & Activities', 'For Members' and 'Food & Shops'. The groups 'Location' and Transport and Accommodation' were added for the 'Use' DCE and the group 'Cost per NSW household per year, (maximum 3 years)' was added for the 'Non-Use' DCE.
To simplify layout, attributes that were not-available were not displayed. Levels were also shortened for readability although a full description of each was available by 'hovering' the respondents mouse over each level.
The DCE designIn order to include actual visitation figures in the 'Use' model, it was critical that each dimension contained at least one level from the current base-case for the Powerhouse museum.The 'Non Use' DCE can be expressed by a total possible set of 220x3brex5 = 1.33 x10'5 unique options for the 'Non Use' and 223x35x48x5 = 6.68x10¹⁴for the 'Use' DCE.
To cover this space, an orthogonal main effects plan in 128 treatments was used for both DCEs with a random modulo generator >1 and < number of levels for pairwise generation to guarantee a contrast between levels in each experimentally controlled
Page:3/16

option. With 8 scenarios per respondent, a minimum of 320 respondents was estimated be the minimum required for a student sample (20) observations per treatment.For the 'Use' DCE, the dimension 'location', the location of Parramatta and Ultimo was also used in the experiment to isolate any independent effect from the actual location and to introduce a the status-quo location for scaling the model with current visitation figures.A fractional orthogonal design in 128 rows was used to implement the experiment.Finally, the order of the pairs was randomised to remove lexical ordering bias by respondents.
Willingness-To-Pay
The method used to derive Willingness-to-Pay (WTP), or more accurately, Implied Willingness-to-Pay, requires that at least one payment mechanism exists in each DCE. Deriving the impliedWillingness to pay uses the principle that an increase in price alone by $X should result in a reduction in overall utility by U. To restore the pre-existing preference ratios then the Utility must be raised from another attribute by the same amount U.By estimating the relationship between the $X and U, a value for the Implied Willingness-To-Pay for each attribute can be inferred. Ideally this relationship should be a linear one otherwise WTP becomes dependent on the actual price and the power of using WTP for non-price attributes becomes limited.
Since using Willingness-to-Pay uses one of the dimensions of the model for its calculation, a redundancy is introduced in the calculation of the willingness-to-pay for the same dimension. For this reason the dimension used should be linearised by the same method used in the WTP calculation.
Willingness-to-Pay is necessarily expressed in the units used to calculate it. In the case of the 'Non-Use', this will be Willingness-To-Pay a fixed yearly council tax and for 'Non-Use' Willingness-to-Pay would be expressed in as a component of General Admission. As the WTP is calculated as a change from one Utility state to another, it is expressed as a relative dollar amount for a change from one state to another.
Visitation PredictionRespondent statement of likely visitation is known to be unreliable in a survey context. While there is no doubting the sincerity of intention, there are not commensurate costs in time, money and opportunity as in the real world. While statement of absolute preference may not be reliable, the relative ratios of preference are known to be scale-invariant'. Therefore models may be robustly scaled to real world predictions with the introduction of revealed preference (RP) data such as actual visitation numbers. A scale factor for a model may be estimated using RP while preserving the preference ratios. This method is proposed for prediction of actual visitation.
DCE SamplingFor each DCE, an allocation deck of 128 treatments was maintained. A random-without-replacement scheme was used for each respondent, with unused treatments due to drop-out being recycled. This ensured full replication of treatments for each 128 sampled treatments, or a full replication per 16 respondents. This efficiency measure optimised use of the available sample, guaranteeing that an equal number of observations of each treatment would be observed for each multiple of 16 respondents and that the treatment allocation would be unbiased with regard to time yet random with regard to respondent regardless of eventual sample size.
Page:4/16

Usage and Attitudes
NSW 263,292Interstate 76,316International 41,974
Total 381,582
Table 2: 2013/2014 Visitations Powerhouse Ultimo"
Review of the Usage and Attitudes responses showed a majority (820) of the respondents had visited a museum or art gallery in the past year and that a majority (941) had heard of the MAAS Powerhouse museum. 341 (21%) of respondents claim to have visited the Powerhouse Museum in the past year. This appears to be larger that the estimated NSW visitation figures in Table 2 and is likely due to poor recall.
Choice ModelsModels for both DCEs were valid (P=0). 19 of the 32 dimensions in the 'Non-Use' were found to be significant at the 95% confidence level with 21 of
Results
Characteristic Level Number Proportion Population Chi Squared P value
Gender Male 843 52.6% 49.80% 5.102 <0.05Female 759 47.4% 50.20%
Age 18-29 287 17.9% 20.7% 0.712 <0.0530-39 282 17.6% 18.0%40-49 307 19.2% 18.2%50-59 247 15.4% 16.7%60-69 328 20.5% 13.0%70 and over 151 9.4% 13.4%
Location Sydney Metro 1028 64.2% 63.70% 0.153 <0.05NSW other 574 35.8% 36.30%
Table 1: Sample Demographics
SummaryTwo Thousand, seven hundred and forty-four respondents were recruited to the study. 430 were screened out for not matching the study criteria, 242 were screened out as being over quota for

their stated gender, region and age and 470 abandoned the study part-way. Incomplete responses were excluded from the study analysis yielding a total of 1,602 respondents completed the survey.Respondents completed the survey in a median time of 14 minutes.
DemographicsWe assessed the representativeness of the sample relative to the general populatio

n with Chi-squared tests for the categorical characteristics of age, gender and location. The sample was found to be representative on all characteristics as in Table 1.Textual Analysis of reported difficulty was made to assess whether the task was overly complex. A large majority (1,307) of the 1,602 completions voluntarily reported that they found the

survey either easy or straightforward with 158 people voluntarily reported they had some difficulty with the survey.
Page:5/16

SW. SignificanAttribute Levels Utility Error Wild se @95Museum Highlights (none) -0.01 0.008 0.215
Museum highlights 0.01 0.008 0.215Temporary Exhibitions (none) -0.022 0.008 0.005
Temporary exhibitions 0.022 0.008 0.005

Page:6/16
A Central Installation Space
(none)
-0.014
0.008
0.076
A central installation space
0.014
0.008
0.076
Centre For Fashion
(none)
-0.003
0.008
0.685 (not sig.)
Centre for fashion0.003
0.0080.685
Centre For Innovation
(none)
-0.001
0.008
0.867 (not sig.)
Centre for innovation0.001
0.0080.867
Exhibitions For Schools,
Children And Families
(none)
-0.011
0.008
0.168
Exhibitions for schools, children and families
0.011
0.008
0.168A Children And Families Zone
A children and families zone, indoor only0.002
0.008
0.788 (not sig.)

A children and families zone, indoor and outdoor-0.002
0.0080.788
Entry Cost To A Children And
Families Zone, admission is free
0.0050.0130.711
, admission is $10 per family
0.012
0.013
0.343
, admission is $20 per family-0.017
0.0130.189
Additional digital content, via a personal smart-phone at the
Additional Digital Contentmuseum
-0.0110.0130.404
Additional digital content, via a special device at the museum-0.019
0.0130.141
Additional digital content, via a smart-phone, tablet, or computer at
home0.03
0.0130.021
Entry Cost For The Museum
$5 per person (Adults). Members free.
0.193
0.016
0
$15 per person (Adults). Members free.0.062
0.0160

$25 per person (Adults). Members free.
-0.049
0.016
0.002
$35 per person (Adults). Members free.
-0.206
0.016
0
Special Touring Exhibitions
(none)
-0.016
0.013
0.212
International touring exhibitions0.022
0.013
0.086
NSW touring exhibitions-0.006
0.0130.65
Viewing The MAAS Collection
Not On Show(none)
-0.0140.0080.083
Viewing the MAAS collection not on show
0.014
0.008
0.0833D Cinema
(none)
0.01
0.013
0.427 (not sig)
3D Cinema showing museum content-0.016
0.0130.204
3D Cinema showing mainstream films
0.006
0.013
0.636Planetarium

(none)
-0.023
0.008
0.004
Planetarium0.023
0.0080.004
Live Performances And
Concerts(none)
-0.0060.0080.454 (not sig)
Live performances and concerts0.006
0.0080.454
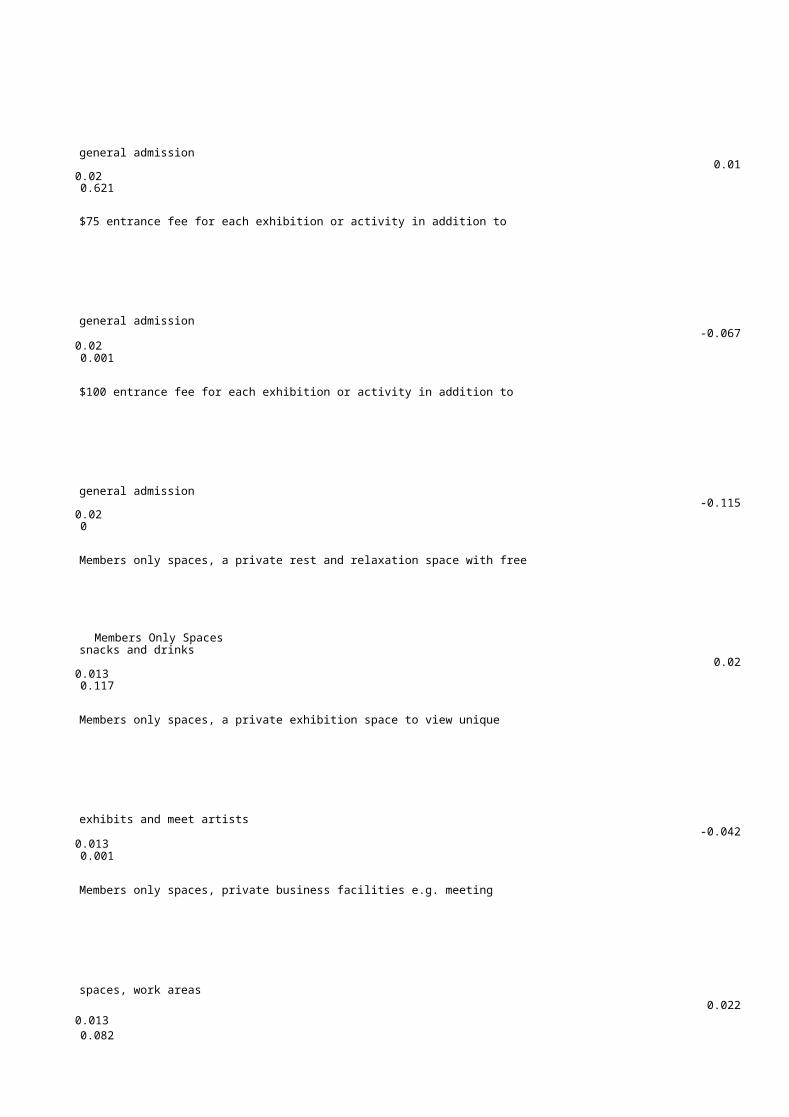
Entry Cost For SpecialSome exhibitions and activities have an entrance fee in addition to
Exhibitions And Activitiesgeneral admission
0.0990.020
$25 entrance fee for each exhibition or activity in addition to
general admission0.074
0.020
$50 entrance fee for each exhibition or activity in addition to
general admission0.01
0.020.621
$75 entrance fee for each exhibition or activity in addition to
general admission-0.067
0.020.001

$100 entrance fee for each exhibition or activity in addition to
general admission-0.115
0.020
Members only spaces, a private rest and relaxation space with free
Members Only Spacessnacks and drinks
0.020.0130.117
Members only spaces, a private exhibition space to view unique
exhibits and meet artists-0.042
0.0130.001
Members only spaces, private business facilities e.g. meeting
spaces, work areas0.022
0.0130.082
Members Benefits
(none)
0.004
0.008
0.636 (not sig)
Members benefits-0.004
0.0080.636
Page:7/16

Cost To Become A Member $50 per person (Adults) 0.092 0.016 0
$75 per person (Adults) 0.043 0.016 0.006
$100 per person (Adults) -0.009 0.016 0.574
$200 per person (Adults) -0.127 0.016 0
Food And Drink A sit down cafe 0.01 0.016 0.535
A food court 0.011 0.016 0.505
A wine bar -0.032 0.016 0.043
A 4/5 star restaurant 0.012 0.016 0.459
Cost Of Food And Drink $10 per person 0.038 0.016 0.017
$20 per person 0.016 0.016 0.316
$40 per person -0.007 0.016 0.65
$60 per person -0.047 0.016 0.003
Museum Shop A permanent shopping space 0.006 0.008 0.412 (not sig)
An always changing 'pop-up' shopping space -0.006 0.008 0.412
Research And Library Spaces (none) 0.011 0.008 0.186
Research and library spaces -0.011 0.008 0.186
Conservation Areas (none) -0.01 0.008 0.207
Conservation areas 0.01 0.008 0.207
Technology Laboratory (none) -0.004 0.008 0.607 (not sig)
Technology laboratory 0.004 0.008 0.607Education Laboratories AndWorkshop Spaces (none) -0.007 0.008 0.355 (not sig)
Education laboratories and workshop spaces 0.007 0.008 0.355Conference And FunctionFacilities (none) -0.002 0.008 0.754 (not sig)
Conference and function facilities 0.002 0.008 0.754
Media Production Studio (none) -0.004 0.008 0.625 (not sig)Media production studio 0.004 0.008 0.625
Fabrication Laboratories AndCollaboration Spaces (none) -0.007 0.008 0.359 (not sig)
Fabrication laboratories and collaboration spaces 0.007 0.008 0.359
Business Incubators (none) -0.002 0.008 0.826 (not sig)
Business incubators 0.002 0.008 0.826
Tax Levy No cost 0.379 0.016 0
$10 Council rates levy, once a year for 3 years 0.081 0.016 0
$20 Council rates levy, once a year for 3 years -0.088 0.016 0
$30 Council rates levy, once a year for 3 years -0.371 0.016 0
Alternative Specific Constant Museum Concept A 0.267 0.009 0
Museum Concept B -0.094 0.009 0
Neither - Prefer the current Powerhouse -0.173 0.009 0Table 3: Non-Use Model
Std. SignificanAttribute Levels Utility Error Wald ce @95
Location Powerhouse Museum Ultimo 0.076 ±0.008 0
MAAS Parramatta -0.076 ±0.008 0
Museum Highlights (none) -0.014 ±0.008 0.073
Museum highlights 0.014 ±0.008 0.073
Temporary Exhibitions (none) -0.013 ±0.008 0.095
Page:8/16

Temporary exhibitions
0.013
±0.008 0.095
A Central Installation Space
(none)
-0.007
±0.008 0.339 (not sig)
A central installation space0.007
±0.008 0.339
Centre For Fashion
(none)
-0.009
±0.008 0.243
Centre for fashion
0.009
±0.008 0.243
Centre For Innovation
(none)
-0.004
±0.008 0.586 (not sig)
Centre for innovation0.004
±0.008 0.586Exhibitions For Schools,
Children And Families
(none)
-0.02
±0.008 0.013
Exhibitions for schools, children and families0.02
±0.008 0.013
A Children And Families Zone
A children and families zone, indoor only
-0.014
±0.008 0.073
A children and families zone, indoor and outdoor0.014
±0.008 0.073Entry Cost To A Children And

Families Zone, admission is free
0.025±0.013 0.052
, admission is $10 per family
-0.007
±0.013 0.574
, admission is $20 per family-0.017
±0.013 0.169
Additional digital content, via a personal smart-phone at the
Additional Digital Contentmuseum
-0.001±0.013 0.93 (not sig)
Additional digital content, via a special device at the museum-0.007
±0.013 0.587
Additional digital content, via a smart-phone, tablet, or computer at
home0.008
±0.013 0.53
Entry Cost For The Museum$5 per person (Adults). Members free.
0.231
±0.016 0
$15 per person (Adults). Members free.
0.107
±0.016 0
$25 per person (Adults). Members free.
-0.067
±0.016 0
$35 per person (Adults). Members free.
-0.271
±0.016 0
Special Touring Exhibitions
(none)
-0.006
±0.013 0.643 (not sig)
International touring exhibitions-0.008
±0.013 0.521

NSW touring exhibitions0.014
±0.013 0.27Viewing The MAAS Collection
Not On Show(none)
-0.002±0.008 0.84 (not sig)
Viewing the MAAS collection not on show0.002
±0.008 0.84
3D Cinema
(none)
-0.02
±0.013 0.11
3D Cinema showing museum content
0
±0.013 1
3D Cinema showing mainstream films
0.02
±0.013 0.108Planetarium
(none)
-0.01
±0.008 0.185
Planetarium0.01
±0.008 0.185Live Performances And
Concerts(none)
-0.02±0.008 0.013
Live performances and concerts0.02
±0.008 0.013Entry Cost For Special
Some exhibitions and activities have an entrance fee in addition to
Exhibitions And Activitiesgeneral admission
0.13±0.020 0
$25 entrance fee for each exhibition or activity in addition to
general admission0.106
±0.020 0
$50 entrance fee for each exhibition or activity in addition to
general admission0.006
±0.020 0.75
$75 entrance fee for each exhibition or activity in addition to
general admission-0.097
±0.020 0
$100entrance fee for each exhibition or activity in addition to
general admission-0.145
±0.020 0
Members only spaces, a private rest and relaxation space with free
Members Only Spacessnacks and drinks
0.02±0.013 0.117
Members only spaces, a private exhibition space to view unique
exhibits and meet artists-0.017
±0.013 0.187
Members only spaces, private business facilities e.g. meeting
spaces, work areas-0.003
±0.013 0.79
Members Benefits
(none)
-0.003
±0.008 0.694 (not sig)
Page:9/16

Cost To Become A Member
Members benefits$50 per person (Adults)
$75 per person (Adults)
$100 per person (Adults)
0.003
0.09
0.004
0.011 -
0.105
±0.008 0.694
±0.016 0
±0.016 0.818
±0.016 0.474
±0.016 0
Food And Drink A sit down cafe 0.013 ±0.016 0.411
A food court -0.006 ±0.016 0.721
A wine bar -0.044 ±0.016 0.005
A 4/5 star restaurant 0.037 ±0.016 0.019
Cost Of Food And Drink $10 per person 0.038 ±0.016 0.016
$20 per person 0.011 ±0.016 0.494
$40 per person -0.028 ±0.016 0.077
$60 per person -0.021 ±0.016 0.186
Museum Shop A permanent shopping space 0.006 ±0.008 0.432 (not sig)
An always changing pop-up shopping space -0.006 ±0.008 0.432
Research And Library Spaces (none) -0.012 ±0.008 0.127
Research and library spaces 0.012 ±0.008 0.127
Conservation Areas (none) -0.015 ±0.008 0.047
Conservation areas 0.015 ±0.008 0.047
Technology Laboratory (none) -0.005 ±0.008 0.55 (not sig)
Technology laboratory 0.005 ±0.008 0.55Education Laboratories AndWorkshop Spaces (none) -0.014 ±0.008 0.082
Education laboratories and workshop spaces 0.014 ±0.008 0.082Conference And FunctionFacilities (none) -0.015 ±0.008 0.05
Conference and function facilities 0.015 ±0.008 0.05
Media Production Studio (none) -0.004 ±0.008 0.645 (not sig)
Media production studio 0.004 ±0.008 0.645Fabrication Laboratories AndCollaboration Spaces (none) -0.004 ±0.008 0.584 (not sig)
Fabrication laboratories and collaboration spaces 0.004 ±0.008 0.584
Business Incubators (none) 0.005 ±0.008 0.515 (not sig)
Business incubators -0.005 ±0.008 0.515
Museum Accommodation (none) -0.005 ±0.008 0.523 (not sig)
Museum Accommodation 0.005 ±0.008 0.523
Museum Boat (none) -0.019 ±0.008 0.013
Museum Boat 0.019 ±0.008 0.013
Alternative Specific Constant Museum A 0.253 ±0.009 0
Museum B 0.096 ±0.009 0
Would Not Visit -0.349 ±0.009 0Table 4: Use Model
Estimates of the payment mechanism attributes price
utilities for both DCEs were found to be highly linear
(both with R2 = 0.99) and monotonically decreasing as
expected.

Page:10/16

R2=
0.3
0.
0
-1 -0.2 -0.1 -a 0 0.11
- 0
0.5 0.4 -0.1$0 -0
-$5-- $10 $15-- --$25 $30- $35 •
0 .5 0 .4
0.1 lir
-0.1 $5 $10 $15.-'410,, $25 -0.2
Non-Use Utility
Figure 2: Comparison of Use and Non-Use Utilities Comparison of the two models in figure 2 above showed general agreement in the importance and sign ( R2 = 0.91) between the two models. Both models
exhibited a high degree of face validity with all price utilities monotonically decreasing.Dimensions with clear visitor benefits generally had a positive effect on preference with non-benefits having either negative or not significant effects.
Willingness-To-Pay
Council Tax per Household per Year
Figure 3: Council Tax vs Utility - Non-Use Model Willingness to pay for the 'Non-Use Model was calculated from the utility estimates for the Council Tax Levy Attribute.As can be seen in Figure 3, the relationship between Council Levy and Utility (preference) is nearly perfectly linear (R2 =0.99), being an ideal candidate to estimate the utility value per dollar increment.Using linear regression, a $1.00 increase in yearly
council tax levy produces a reduction in utility of -0.02419 and conversely an increase of 0.02419
utility implies a willingness to pay $1.00 for that increase in utility.
Admission PriceFigure 4: Admission prices vs Utility - Use
modelA similar process was applied to the 'Use' Model. As before the relationship is nearly perfectly linear (R2
=0.99). Using linear regression, a $1.00 increase in admission produces a reduction in utility of -0.0168 and conversely an increase of 0.0168 utility implies a willingness to pay $1.00 for that increase in utility.
To avoid spurious calculations involving WTP -attributes not significant at the 95% level were set to $0.00 in the WTP chart in table 5.Furthermore,where an attribute has 2 levels, one of which was "not available" a single WTP estimate is displayed. In all other cases the WTP is relative to the first levelFurthermore,where an attribute has 2 levels, one of which was "not available" a single WTP estimate is displayed. In all other cases the WTP is relative to the first level.
The alternative-specific constant, measuring general preference for experiment alternative was not used in the WTP calculation as this would be an identical and constant across all WTP scenario constructions. The implicit assumption is that site is not relevant to WTP calculation.
Page:11/16

An always changing pop-up shopping space $0.00 $0.00RESEARCH AND LIBRARY SPACES Research and library spaces -$0.91 $1.43
CONSERVATION AREAS Conservation areas $0.83 $1.79TECHNOLOGY LABORATORY Technology laboratory $0.00 $0.00EDUCATION LABORATORIES ANDWORKSHOP SPACES Education laboratories and workshop spaces $0.00 $1.67
CONFERENCE AND FUNCTION FACILITIES Conference and function facilities $0.00 $1.79MEDIA PRODUCTION STUDIO Media production studio $0.00 $0.00FABRICATION LABORATORIES ANDCOLLABORATION SPACES Fabrication laboratories and collaboration spaces $0.00 $0.00
BUSINESS INCUBATORS Business incubators $0.00 $0.00
MUSEUM ACCOMMODATION Museum Accommodation n/a $0.00
MUSEUM BOAT Museum Boat n/a $2.26
TAX LEVY $0.00 $0.00 n/a
$10.00 -$10.00 n/a
$20.00 -$20.00 n/a
$30.00 -$30.00 n/a
Table 5: Willingness to Pay for Use and Non-Use Models @ 95% confidence
Visitation Model Scaling
Using MAAS Powerhouse visitation data' and 2011 Census data" and NSW population growth figures" a predicted probability of a NSW resident attending the current Powerhouse museum in the next year can be estimated at 4.9%. It is not necessary to consider repeat visits as ultimately the prediction required is number of ticket sales regardless of repeat visitation.
Using this figure and incorporating hi the model produces the following scale factor as a utility. An approximate interpretation for this parameter is 'opportunity to visit'. Including this as an additional parameter
Parameter Utility Std. Error Wald
Would Visit -2.526 ±0.009 0.00
Would not Visit 0.8568 ±0.009 0.00
Table 6: Revealed Preference (RP) model scaling of visitation
These factors are included in the visitation model simulator, available in the digital appendices.
Discussion
A requirement for this project is that the principles of validity as out lined in the Treasury guidelines be followed.
Each of these 4 principles of Criterion, Convergent, Construct and Content validity are reproduced below with particular reference to how each was achieved in this study.
1. Criterion validity (i.e. "measuring what is intended to be measured") this could be tested by undertaking a pilot survey and checking whether the
results are realistic (by cross-checking against prices in comparable markets, values from economic experiments and benchmarking against values for other comparable projects)
Selection of consequent payment mechanisms were resolved in the Pilot study which is recapitulated here.
· Fixed admission price was both preferred and easiest to understand as anticipated.
· A fixed dollar amount for one year, followed by a fixed dollar amount over 3 years was the easiest to understand.

Furthermore, both DCEs exhibited highly realistic price sensitivity. As can be demonstrated in the simulator, increasing admission price reduces
Page:14/16

likelihood of visitation.
2. Convergent validity (i.e. "alignment with prices actually paid") — this could be tested by examining how results compare against expenditure patterns for substitute goods or services(perhaps by comparing results against recreational expenditure)
The price ranges tested in the visitation DCE was between zero admission and double the current Powerhouse admission fee at $35. The models showed that doubling the admission price would approximately halve the visitation, being convergent with the expectation of a highly elastic (optional) good such as museum visitation.
3. Construct validity (i.e. "consistency with basic economic theory") — this could be tested by checking whether the results are consistent with household budget constraints (by looking at NSW household disposable income and cost of living data) and household revealed preferences for cultural venues(perhaps by comparing results against at recreational expenditure)
The model results show consistent decreasing preference for every price variable tested for both DCEs, consistent with economic theory. In other dimensions, the models exhibit good 'face validity' (Carson et al) with visitation benefits having a generally positive influence on preference.
4. Content validity (i.e. "robust survey design") — this could be tested by presenting the sampling frame/method (to examine whether the sample is representative and statistically significant) and by presenting the survey design/questions (to examine whether the survey is following best practice design)
Table 1 shows the sample characteristics of Age, Gender and location against the Census proportions. A chi-squared test shows that the sample proportions of the selected characteristics are in good agreement with the expected proportions.
FundingThis project was funded by Neoteny Australia Pty. Ltd.
Conflict of InterestThe Authors declare they do not have conflicts of interest.
Informed ConsentInformed consent was obtained from all individuals participants included in the study.
Acknowledgements
Nic Chamberlain, Neoteny
Justin Sinclair, Neoteny
Yuan Deng, SGS Economics and Planning

Page:15/16

References
i Independent Pricing and Regulatory Tribunal of NSW - https://www.ipart.nsw.gov.au/files/sharedassets/website/trimholdingbay/report_-_review_of_willingness_to_pay_methodologies_-_centre_for_international_economics_-_ross_chapman_-_august_2001_-_pdf_version.pdf
ii MAAS_Pilot_results_report 18.09.2016 SurveyEngine Pty. Ltd.iii Combining Sources of Preference Data for Modelling Complex Decision
Processes. 1999 Louviere, Carson, Hensher et aliv Powerhouse Visitations 2013/2014 — SGS Economics & Planningv Australian Bureau of Statistics — 2011 population census data, http://www.abs.gov.au/Population vi Planning NSW, Population Projections —
http://www.planning.nsw.gov.au/Research-and-Demography/Demography/Population-Projections
Digital AppendicesAvailable on request to Author
Report Sourcesmodels.xlsx
report_tables
Data Filescovariates_dataalsx
experiment_non_use_data.xlsx
experiment_use_data.xlsx
page_timestamp_data.xlsx
Specificationsnon_use_specification.htmluse_specification.htmlquestionnaire.pdf

MiscellaneousMAAS_Pilot_results_report.pdf

Appendix 3. Pilot study

MAAS I Neo I Johnstaff 85
Appendix 3. Pilot study methodologyThis appendix contains a detailed report that documents
the pilot study that was used to validate the approach
taken for the final Choice Model Experiment. Context on
the final experiment methodology can be found in

`Appendix 2. Choice Model Experiment methodology'.

GermanyPotsdamerplatz 1Berlin 10785tel: +.49 30 201 692 320
Australia843 Drummond Street Carlton North Vic 2054 tel +61 3 9036 2885
Online
survey
MAAS Pilot ResultsAuthor: Ben White, SurveyEngine PLVersion: 1.0 draftDate: 18.09.2016
Summary of ResultsThis Pilot study was conducted to validate the approach for estimating Willingness-to-Pay (WTP) and visitation to the new Museum of Applied Arts and Sciences (MAAS) at Parramatta before commending a main larger study.
A review of the pilot results shows that the methodology selected for the proposed full MAAS WTP study is valid. All the Discrete Choice Experiments produced valid Discrete Choice Models (DCMs) with high face validity and significance above 99% confidence for many factors. Furthermore, the anticipated Payment Vehicle Mechanisms were shown to be valid and comprehensible.
Some refinement of the final study will be required, in particular the length and complexity of the current instrument may be causing respondent fatigue. Furthermore the price ranges chosen for the study are dominating respondents choices and several of the proposed features show no statistically significant effects on choice.
Specific Findings· A fixed dollar amount per houshold per year, with a maximum of 3 years, was the most
appropriate payment vehicle mechanism for the "Non-Use" Models, while as expected admission fee was appropriate for the "Use" or Visitation models.
· The Use and Non-Use models were dominated by admission fees and the governemnt levy.· The government levy estimate was both linear and monotonic being ideal for WTP calculation.· The Max-Diff experimment revealed significant high preferences for certain Museum
attributes and significant low preferences for most commercial attributes.· Evidence for respondent fatigue as the survey progressed as higher proportion of random
choices made deeper into the survey.· Average completion time was 23 minutes.
Proposed Actions for the Main WTP study· Shortening the survey via removal of MaxDiff & Payment Vehicle question.· Simplifying DCE comprrehansion via culling some attributes.· Reducing the price/payment ranges in the DCE.· Shortening the DCE to 4 scenarios per DCE rather than 8.· Adopting the payment vehicle of a fixed amount per year for 3 years and admission fee.· Randomise order of alternatives by respondent to isolate lexical prefernce· Selection of the 'Non-Use' model for WTP estimation
1111111111111

GermanyPotsdamerplatz 1Berlin 10785tel: +49 30 201 692 320
Australia843 Drummond Street Carlton North Vic 2054 tel +61 3 9036 2885
Online
survey
Recap on Pilot ObjectivesThe pilot had the following proposed objectives:
a) To evaluate possible payment vehicle mechanisms,b) provide an initial rank order of importance of attributes,c) gain initial feeback from the target group on the difficulty of the survey,d) provide an opportunity to discover missing attributes,e) verify the required sample proportions were feasible,f) include Usage and Attitudes and Demographics sections for evaluation andg) optionally, a cut-down DCE to provide initial model data
A sample of 400 NSW 18+ tax residents representative by Age, Gender and Region was proposed.
MethodologyStructure of the Questionnaire
A Web based survey was conducted containing the following sections:· Screening questions.· Introduction to the survey.· Usage and Attitudes for Museums and Cultural institutions.· Information on the proposed MAAS at Parramatta.· Detailed informaiton on possible attractions and amenities at the Museum.· A Max-Diff Experiment on the attractions and amenities.· A 'Use' or Visitation DCE.· Questions on Possible Payment Mechanisms.· A Payment Mechanism DCE.· A 'Non-Use' DCE.· Demographics Questions.· Comments.
A link to the full survey can be found here:
https://drive.google.com/file/d/OBOOPM004fdxdZFV6YVN1NzhQSDg/view? usp=sharing

1111111111111

GermanyPotsdamerplatz 1Berlin 10785tel: +49 30 201 692 320
Australia843 Drummond Street Carlton North Vic 2054 tel +61 3 9036 2885
Online
survey
Max-Diff Experiment Methodology
34 Detailed vigenettes were arranged according to a Balanced-Incomplete-Block-Design (BIBD) with 4 alternatives with 144 unique combinations.
Each respondent was given 10 scenarios and asked for their preferred, second preferred and 3rd preferred option, providing a full rank ordering of each scenario, yielding 60 datapoints per respondent.
Payment Vehicle Methodology4 Payment vehicles were evaluated for the Non-Use WTP. An unspecified government tax was indicated but not specifically described. The 4 mechanisms evaluated were:
· A fixed payment for one year,· A fixed payment over 3 years,· A percentage for one year and· A percentage over 3 years
The values chosen for the test were over comparable value, being approximately $100 per household for 1 year.
2 Payment Vehicles were also tested for the visitation DCE being:· A higher perccentage of admissions and· A fixed admission price
In addition, direct questions on comprehension and prefernce for each of the payment mechanisms was asked.
MAAS Use (Visitation) Discrete Choice Experiment
A set of 31 atttributes with possible levels from 2 to 6 was used for the DCE. These were provided by MAAS.
Importantly, the attributes contained at least one level from the current base-case for the Powerhouse museum to aid in model validation against actual visitation.
The location of Paramatta vs Ultimo was also used in the experiment to isolate any indepdent effect from the actual location.
A fractional orthogonal design in 128 rows was used to implement the experiment.
Respondents were given three options for preference for visitation being twohypothetical experimentally constructed museum concepts as well as a 'would not visit' option. Respondents were then asked to choose their preference from the remaining two.
This approach optimises data collection and guarantees the data is modellable even in the case the the 'None' option is universally preferred.
1111111111

GermanyPotsdamerplatz 1Berlin 10785tel: +49 30 201 692 320
Australia843 Drummond Street Carlton North Vic 2054 tel +61 3 9036 2885
Online
survey
Non-Use DCE
The Non-Use experiment attempted to determin the level of public support for the new museum through an as yet unspecified tax-levy.
Otherwise the Non-use DCE used a nearly identical approach to the 'Use' DCE with the following differences.
a) Respondents were provided with an addditional 'Tax Levy' attribute in the form of the anticipated payment mechanism, being a fixed amount per household over 3 years.
b) The alternatives were in this case 2 MAAS Parramatta concepts plus the 'Status Quo' option, to keep the Powerhouse musem.
As before respondents were then asked for their second preference from the remaining 2, guaranteeing valid modelling should the status quo be universally preferred or dominant.
Willingness-To-Pay
The method used to derive Willingness-to-Pay (WTP), or more accurately, Implied Willingness-to-Pay, requires that at least one payment vehicle exists in the DCE.
The method operates on the principal that an increase in price alone by $X should result in a reduction in overall utility by U. To restore the pre-existing preference ratios then the Utility must be raised from another attibute by U.
By estimating the relationship between the $X and U, the Willingness-To-Pay for all attributes can be inferred. Ideally the relationship should be a linear one otherwise WTP becomes dependent on the actual price and the power of using WTP for non-price attributes becomes limited.
Sample Frame
A sample of 424 NSW tax residents over the age of 18 on Janl 2016 was recruited over a period of 4 days. Respondents with handheld devices were screened from the survey as internal research has shown that this form of DCE produces statstically different results when asnwered by respondents on hand-held devices.
Sample representability was deliberately not controlled for in the pilot to observe the natural distribution of respondents. This was done so that a plan could be made for the full study should the sample be particularly skewed.
Quality Assurance
Simulations of 400 runs through the survey were conducted automatically and the resultant datasets were verified for correct data collection. Quality checks on content and logic were conducted to verify survey function.
111 11 111 1 1

GermanyPotsdamerplatz 1Berlin 10785tel: +49 30 201 692
survey
Pilot Survey FindingsRespondents took an average of 23 minutes to complete the survey being commensurate with the length of the survey being 42 pages. This agrees with theindustry expectations of approximatey 30 second per page of survey. Australia
843 Drummond StreetCadton North Vic 2054
Sample Representability tel +61 3 9036 288541% of respondents were from regional NSW with the remainder from the Sydneymetropolitan area. 69% of respondents were born in Australia and there was an Online
surveyengine.com
approximately even split by gender with 54% of respondents being female. [email protected]
The age spread followed a typical representative demographic as below.
Histogram of Age10
7.5
2.5
0
MI Age(count)
17 25.5 3 42.5 59.5 6 76.5 85
Age
Usage and AttitudesA full analysis of the U+A is beyond the scope of this document, however some ofstatistics relate to the DCE component.
16% of respondents claim to have visited the Powerhouse Museum in the past year which agrees approximately with the Powerhouse visitation figures of 10%-15% of the NSW population per year.
However within the survey 43% of respondent claim they would visit the MAAS Parramatta in the first 2 years of opening.
A link to the full frequency report can be found here:
https://drive.google.com/file/d/OBOOPM004fdxdUWdYSF92cHloNDg/yiew? usp=sharing
1111111111


GermanyPotsdamerplatz 1Berlin 10785tel: +49 30 201 692 320
Australia843 Drummond Street Carlton North Vic 2054 tel +61 3 9036 2885
Online
survey
Payment Vehicle Question and DCE
The resusts of the payment mechanism question revealed that:
Fixed addmission price was both preferred and easiest to understand as anticipated.· A fixed dollar amount for one year, followed by a fixed dollar amount over 3 years was the
easiest to understand.
This was supported by the models, and confirmed that a fixed admission fee was preferred as the visitation vehicle.
However the models showed that a fixed amount of $100 for one year was the least preferred and a fixed $35 for 3 years was statistically equivalent to the other most preferred option of a 2% council tax.
Putting the findings together, the fixed admission price is clearly the easiest and most preferred and should be used for the main study.
While results were somewhat mixed for the levy/tax question, a fixed amount over 3 years seems overall the most comprehensible and preferred.
In addition the lexical preference for left option vs. right option was also modelled an found to be statistically zero. This mean that respondents were entirely choosing based on the information and not randomly selecting options.
Max Diff Attractions & Amenities Findings
The Max-Diff exercise showed a clear preference structure for the proposed features and amenities with a 4 fold preference of least liked to most liked.
It is important in the analysis of this part of the research to remember that the features presented were without any attendant admission or travel costs or context.
Neverthless the results bear face validity with Special Touring, Temporary and highlights Exhibitions, the Planetarium and 3D Cinema and a Centre for innovation topping the list.
At the bottom of the list were the commercial amenities such as offices, accommodation, conference centres as well as niche demand attributes such as childcare.
As with the payment vehicle experiment, lexical preference for left option vs. right option was also modelled an found to be statistically zero, indication a large majority of considered selctions.
1 1 1 1 1 1 1 1 1 1 1

GermanyPotsdamerplatz 1Berlin 10785tel: +49 30 201 692 320
Australia843 Drummond Street Carlton North Vic 2054 tel +61 3 9036 2885
Online
s u r v e y
The DCE Use and Non-Use models
The Discrete Choice Experiment Models yielded consistent models.
The price attributes in all models are being nearly perfectly linear and monotinically decreasing in utility as prices increase, consistent with economic theory.
The price attributes do however dominate the model and that many of the non-price attributes have either small or non significant effects on preference.
There are a number of possibilities for this:
· The price ranges are too large, thereby reducing the resolution of smaller effects.
· The sample size of 400 is just at the limit for valid models which require a minimum of 20 observations per respondent, which would be 320 for the pilot.
· The large number of attributes meant there was a difficulty in comprehension or evaluation.
· The length of the survey may have given respondents a certain amount of fatigue, randomly selecing responses to finish the survey.
To this last point, it was observed that the lexical prefernce for the left option was also much higher than for most attributes. While this doesn't directly affect the model estimates, it does indicate that a respondent fatigue began to creep in, especially as these experiement would have been about 15 minutes into the survey. This effect became most pronounced with the final DCE.
Nevertheless, the large majority of the attributes have face validity with the museum and exhibition attributes having a positive preference and the commercial or niche ones having a zero or negative effect.
A note on confidence intervalsConfidence intervals for the 1,2 and 3 standard deviations were calculated for eachfactor in the model, representing confidence intervals of 67%, 95% and 99%.
While in the final DCE confidence intervals of 95% or 99% may be required, for the pilot it is recommended that confidence intervals of 67% be used as the purpose of the pilot is to examine any signal. An estimate with a 67% confidence interval means that it is more likely than not that the factor estimate is non-zero.
A link to all models and WTP calculation can be found here:
https://docs.google.com/a/surveyengine.com/spreadsheets/d/lc7rzpi-pnD5CigcIrW0PjxNwOOP7snwYPOpDY1WIODs/edit?usp=sharing

I III 11 111 1 111

GermanyPotsdamerplatz 1Berlin 10785tel: +49 30 201 692 320
Australia843 Drummond Street Carlton North Vic 2054 tel +61 3 9036 2885
Online
surveyWillingness-To-Pay
Calculation
Willngness to pay was calculated for both the Use and Non-Use models according to the following scheme.
1. The price variable for each model(General Admisssion for the 'Use' Model and 'Tax Levy' for the 'Non-Use' model.) was examined and linearised.
2. A goodness of fit parameter for each linerisation was made and found to have an R-squared of over 0.98 for both models. This is an exceptionally good result with the maximum being 1.0 for perfect correlation. The equivalent measure of Utility was calculated per $1 increase and found to be -0.016 for both models.
3. The raw model utilities were then converted to dollars (in the respective units) for each attribute in the model.
4. Since the models are expressed in relative terms, to aid comprehension, the WTP estimates were then adjusted to reflect a fixed dollar amount relative to the first level in each Attribute. The interpretation then is that WTP for some level is the additional amount people are willing to pay above the first level option.
This has clear meaning when the first level is 'not-available' at the WTP expresses the absolte WTP for that feature. However in the case where these is no 'non-available' level, WTP needs to be expressed as WTP for a change from one state to another — a relative WTP.
WTP 'Use Model' Results
An interpreation of the results is beyond the scope of this document, however a link to all the model results and WTP calculations may be found at:
https://docs.google.com/a/surveyengine.com/spreadsheets/d/lc7rzpi-pnD5CigchWOPPNwOOP7snwYPOpDY1WIODs/edit?usp=sharing
I I I I I I I I I I I I I