>> chile: exporting and the challenges of domestic ... · chile: exporting and the challenges...
TRANSCRIPT

Chile: Exporting and the Challenges of Domestic Transport Costs
When economists think about trade costs, the word “tariff” first comes to mind. But the large reduction in tariff rates that has taken place over the last two decades has increased the relative
importance of other trade costs, such as transport. While the impact of transport costs has been documented in the literature (Hummels, 2001; Clark, Dollar, and Micco, 2004; Mesquita, Volpe, and Blyde, 2008), the focus has been largely on its international component. One would be tempt-ed to assume that the shipping of a good within the country represents only a minor nuisance relative to all the other costs and tasks involved in international trade transactions. Why this is not true is demonstrated by the case of the Chilean brewery Cervecería Austral. From its location in the city of Punta Arenas at the southern tip of South America, the firm must first ship its product by land to the port of San Antonio, more than 3,000 kilometers away. Relative to some of its market destinations, this distance can represent up to 30 percent of the total distance of the shipment. Clearly for Cervecería Austral, shipping the beer within the country represents much more than a minor nuisance.
Examples of internal transport costs that account for significant shares of the total costs of transportation are plentiful, not only in Chile, but also in other countries. It is therefore important to examine the extent to which within-country transport costs constitute an important barrier
3>>
<< Too Far to Export74
to trade in general and in particular for a country’s remote regions. This chapter will focus on Chile.
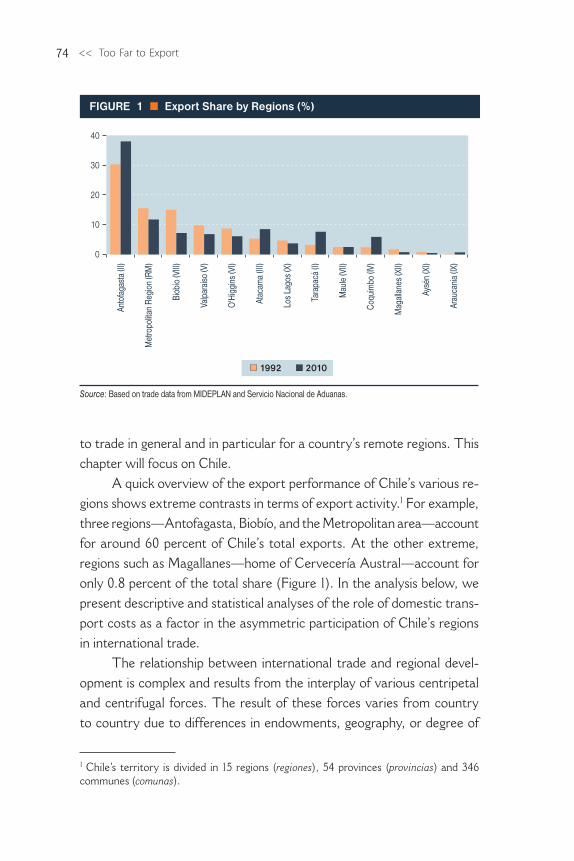
A quick overview of the export performance of Chile’s various re-gions shows extreme contrasts in terms of export activity.1 For example, three regions—Antofagasta, Biobío, and the Metropolitan area—account for around 60 percent of Chile’s total exports. At the other extreme, regions such as Magallanes—home of Cervecería Austral—account for only 0.8 percent of the total share (Figure 1). In the analysis below, we present descriptive and statistical analyses of the role of domestic trans-port costs as a factor in the asymmetric participation of Chile’s regions in international trade.
The relationship between international trade and regional devel-opment is complex and results from the interplay of various centripetal and centrifugal forces. The result of these forces varies from country to country due to differences in endowments, geography, or degree of
1 Chile’s territory is divided in 15 regions (regiones), 54 provinces (provincias) and 346 communes (comunas).
0
10
20
30
40
1992 2010
Source: Based on trade data from MIDEPLAN and Servicio Nacional de Aduanas.
Anto
faga
sta
(II)
Met
ropo
litan
Regi
on (R
M)
Biob
ío (V
III)
Valp
araí
so (V
)
O'H
iggi
ns (V
I)
Atac
ama
(III)
Los
Lago
s (X
)
Tara
pacá
(I)
Mau
le (V
II)
Coqu
imbo
(IV)
Mag
alla
nes
(XII)
Aysé
n (X
I)
Arau
caní
a (IX
)
FIGURE 1 Export Share by Regions (%)
Chile: Exporting and the Challenges of Domestic Transport Costs >> 75
openness. One potential outcome is that the transition from autarky to free trade may encourage firms to sell to the world market and receive some of their inputs from that market, which can lead to a process of deconcentration of economic activity away from the large metropolis. However, not all the theoretical and empirical analyses in this literature predict the same outcomes. Chile has had a very open economy for quite some time. By 1979, for example, the average effective protection rate was below 15 percent and the country’s cross-sectoral dispersion in tariff rates was virtually eliminated. Trade protection increased temporarily during the 1982–84 recession, but its commitment to free trade quickly resumed and has persisted until today.2 While analyzing the impact of this trade opening on the distribution of economic activity across space is not easy, casual observation suggests that the dispersion of economic activity away from the main centers has been slow, as we will see below.
Chile’s largest cities are the Santiago metropolis in the Metropolitan region (RM), greater Valparaíso in the Valparaíso region, and greater Concepción in the Biobío region. Together, these three cities account for around 40 percent of the country’s population and represent the main economic powerhouses, with the exception of the mining industry. In 1992, these regions accounted for around 40 percent of the country’s exports, but by 2010 this share declined to around 26 percent. While part of this drop may have been associated with the process of economic dispersion triggered by the opening of the economy in the late 1970s, the reduction in export shares of these three regions is more related to the boom in mining that has occurred during the 2000s, which has had the effect of increasing the export participation of the mining regions such as Antofagasta, Atacama, Tarapacá, and Coquimbo (see Figure 1). In fact, the participation of RM, Valparaíso, and Biobío—that is, until the 2002 mining boom—only dropped by 2 percentage points when compared to the early 1990s. Therefore, this raw evidence suggests that the trade liberalization process had not produced a rapid and significant deconcen-tration of economic activity away from the main cities.
2 See Tybout, de Melo, and Corbo (1991) and Pavcnick (2002) for details of the liberaliza-tion period.

<< Too Far to Export76
One factor that may explain the persistence in the concentration of production around the large metropolises could be the costs of domestic transportation. Chile stretches more than 4,000 km from north to south, with the main cities located mainly in the middle. It is reasonable to expect that the geographic location of a region, relative to the rest of the country, influences its economic development and potentially its export capacity. For instance, it may cost a great deal to transport intermediate inputs to distant regions. It is also possible that factors of production might be less likely to cluster in a region if it is too isolated from the rest of the country. Thus, lacking a strong comparative advantage—such as copper—the remoteness of a region may constitute an important obstacle to its ability to export to other markets. Figure 2, for example, shows that the lion’s share of Chile’s non-copper exports originates in the large metropolitan regions in the center of the country. The regions that are distant from the center tend to export much less.
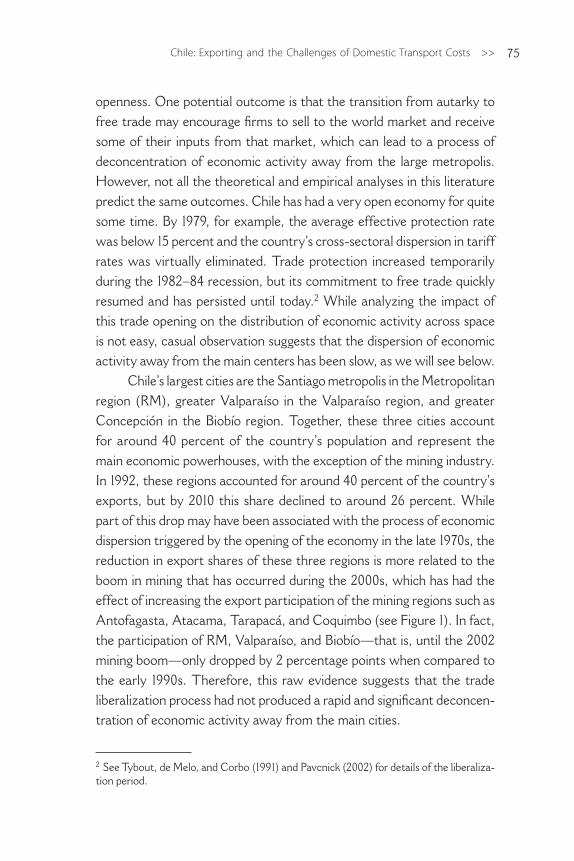
It should be noted that Chile has customs throughout its territory in many ports, airports, and border crossings. In principle, therefore, firms throughout the country could ship their exports through the nearest exit platform to minimize domestic transport costs. Even though many firms are able to do so, more often than not, exports in fact travel long distances within the country before they are shipped to external markets. Table 1 presents information on exports by regions in terms of origin and exit, and for each region of origin shows the main regions through which the exports are shipped out of the country: the region of origin itself, a neighboring region, or another region. It can be seen that a large propor-tion of these exports is shipped not only through the region of origin or a neighboring region, but through other regions as well. This is the case particularly for regions in the south of the country.
When we identify the country’s main exit points we find that around 45 percent of the exports are shipped through the regions of Valparaíso and Biobío. This finding is not surprising, because the port facilities in these regions have the largest capacities of any in the country. Nevertheless, in many cases reaching these ports requires that exports travel long distances within the country before they can be shipped to external markets. Evidence of this can be seen in Figure 3, which shows

Chile: Exporting and the Challenges of Domestic Transport Costs >> 77
the average distance to customs for the exports of each region.3 In the north and in the south of the country, these average distances tend to be much greater than those of shipments originating in the middle of the country. Therefore, exporters in different regions of the country face a marked disparity in terms of accessibility to ports, airports, and borders. This brings us to the question raised earlier: to what extent do transport
3 For each export flow at the 6-digit HS level of each region we first obtain the distance of the least-cost route between the commune of origin and the custom of exit (see Technical Appendix A for details). Then we take the weighted average distance of all the exports of the region where the export shares are used as weights.
Arica – Parinacota (XV)
Tarapacá (I)
Antofagasta (II)
Atacama (III)
Metropolitan Region (RM)
O’Higgins (VI)
Biobío (VIII)
Araucanía (IX)
Los Lagos (X)
Aysén (XI)
Magallanes (XII)
Coquimbo (IV)
Valparaíso (V)
Maule (VII)
Los Ríos (XIV)
Source: Based on GIS map of administrative divisions from DIVA-GIS and trade data from Servicio Nacional de Aduanas. Note: Excludes copper.
FIGURE 2 Regional Exports, 2010 (Percentage share of total exports excluding copper)
<< Too Far to Export78
costs within the country affect the capacity of the regions to trade? In the following subsections we dig deeper into this issue.
The first task is to obtain credible measures of transport costs within the country. As in other chapters in this report, domestic transport costs are estimated by combining spatially georeferenced data on the Chilean road network with truck operating costs to obtain a realistic measure of domestic transport costs. In the case of Chile, data cover the period 2006–2008. The details of the data and the calculations for Chile are presented in Technical Appendix A.4 The average ad valorem domestic transport costs of the exports are found to be around 3.6 percent, but these costs vary considerably from commune to commune because of
4 These ad valorem transport costs include only the costs faced by the transport industry and do not reflect other charges, gains, or markups incurred in the shipping activity or dif-ferences in market structures across the country. This shortcoming puts a limitation for using these costs to discuss issues about the absolute level of domestic ad valorem freights that exist in the country.
Table 1 Percentage of Exports Shipped through Chile’s Regions
Own region Neighboring region Other region
Arica-Parinacota (XV) 75 2 23
Tarapacá (I) 93 3 4
Antofagasta (II) 87 3 10
Atacama (III) 52 16 32
Coquimbo (IV) 73 24 3
Valparaíso (V) 95 4 1
Metropolitan Region (RM) 6 89 5
O’Higgins (VI) 0 98 2
Maule (VII) 0 14 86
Biobío (VIII) 91 0 9
Araucanía (IX) 0 90 10
Los Ríos (XIV) 8 33 59
Los Lagos (X) 7 1 92
Aysén (XI) 22 1 77
Magallanes (XII) 74 0 26
Source: Author’s calculation with data from Servicio Nacional de Aduanas.

Chile: Exporting and the Challenges of Domestic Transport Costs >> 79
the differences in distances that exporters must ship their goods and also because of the characteristics of the goods themselves. For example, Figure 4 shows that the average transport costs per ton for exporters in the middle of the country are much lower than those for exporters in other regions. Measured in terms of percentile, the south faces the highest transport costs, typically above the 60th percentile, while exporters in the middle of the country face the lowest costs. The type of merchandise and particularly the weight of the good are other factors that determine the costs of transportation; exporters of heavy products face high domestic transportation costs. It is then useful to examine differences in the pat-terns of specialization of the regions to distinguish where different types of goods are produced.
Distance to customs (Km)
FIGURE 3 Average Distance to Customs
Source: Author’s calculations.
0–100
100–200
200–500
more than 500

<< Too Far to Export80
Chile’s production patterns are geographically well defined. The dominant industries are mining in the north, wineries and cellulose in the center, fishing in the south, and a well-diversified manufacturing base around the metropolitan region. These production patterns translate into regional differences in weight to value ratios. Figure 5 shows the average weight to value ratio of the exports of each region expressed in percentiles. Regions with high percentiles produce heavy goods; regions with low percentiles specialize in lightweight goods.5 The latter includes
Average costs per unit (Percentile)
FIGURE 4 Average Transport Costs
Source: Author’s calculations.
0–3333–6666–100
5 Average weight to value ratios by commodity are constructed at the 6 digit-HS level of disaggregation using trade data for all the countries in the world from 1996 to 2010.

Chile: Exporting and the Challenges of Domestic Transport Costs >> 81
regions specializing in fishing and processing fish-related products, such as Los Ríos, Los Lagos, and Aysén. Fisheries products tend to be relatively lightweight, and as such the average percentiles of these regions are the lowest in the country. The percentile for the Metropolitan region is also low, which reflects a diversified set of manufacturing industries that export only limited amounts of heavy commodities. The remainder of Chile’s regions exhibit exports with much larger weight to value ratios due to their dependence on heavier resource-based industries. For example, the northern regions of Antofagasta and Atacama have large mining industries; central regions such as Maule are highly dependent on wine exports, another heavy product; and Magallanes in the south produces
FIGURE 5 Regional Differences in Weight to Value Ratio of Exports
Source: Author’s calculations.
Weight to value ratio of exports (Averagepercentile of the region)
0–60
60–80
80–100
Arica – Parinacota (XV)
Tarapacá (I)
Antofagasta (II)
Atacama (III)
Metropolitan Region (RM)
O’Higgins (VI)
Biobío (VIII)
Araucanía (IX)
Los Lagos (X)
Aysén (XI)
Magallanes (XII)
Coquimbo (IV)
Valparaíso (V)
Maule (VII)
Los Ríos (XIV)

<< Too Far to Export82
refined petroleum goods, among other products. Topping the scale are the regions of Biobío and Araucanía, which are highly specialized in the production of pulp and cellulose products that are among the heaviest relative to their values; these regions exhibit average weight to value ratios above the 80th percentile. The general finding from this figure is that with the exception of a few regions, including Santiago, the weight of goods is likely to be an important component of the transport costs for exporters due to the country’s reliance on resource-based products.
International Trade and Domestic Transport Costs
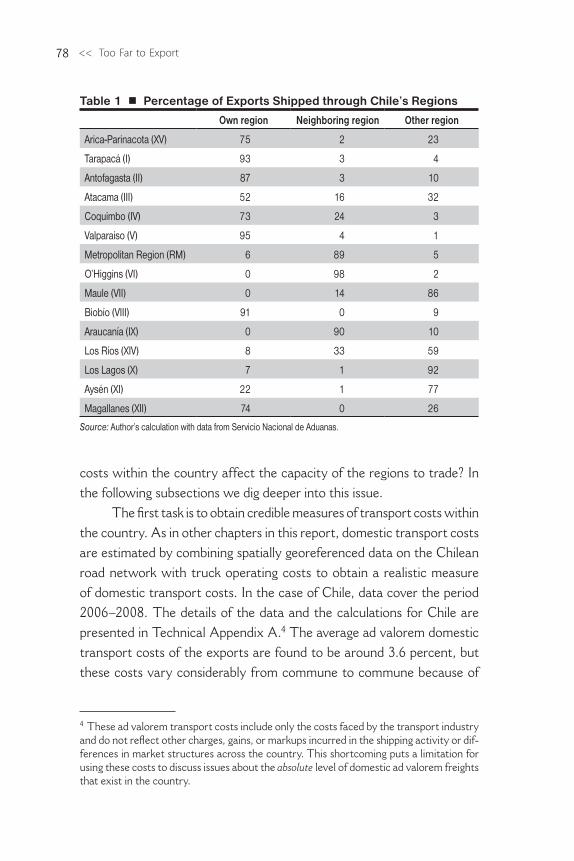
In our first assessment of the relationship between transport costs and trade flows we examine the distribution of the distances traveled by export shipments from their points of origin to their customs of destina-tion.6 If most of the exports are shipped over short distances, this would suggest that domestic transport costs might be an important obstacle to trade. The distribution of distances is shown in Figure 6. There is a clear pattern of concentration of exports within the first 200 km from customs. After this, the share drops significantly. Long distances to ports, airports, and border crossings seem to be negatively associated with the export performance of the locality.
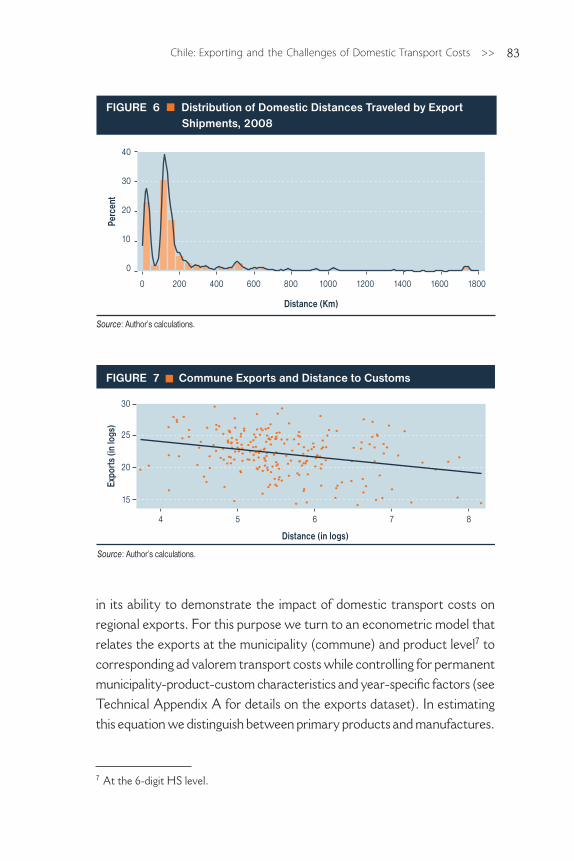
Figure 7 further illustrates the negative association between total exports at the commune level and the average distance of these exports to customs. The figure also shows some dispersion in the data. Some communes, for example, have exports that are below the trend line while others have exports above the trend. The main reason for this is that export performance is not solely determined by the costs of transporting goods or the distance to customs. Also influencing the export performance of a location are other factors such as the pool of endowments available, the types of goods produced, or the ports most frequently employed. Therefore, while Figure 7 illustrates the existence of a relationship between distance and export performance, this examination is far from rigorous
6 It is constructed with the actual distance from the commune of origin to the port, airport, or border effectively used.
Chile: Exporting and the Challenges of Domestic Transport Costs >> 83
in its ability to demonstrate the impact of domestic transport costs on regional exports. For this purpose we turn to an econometric model that relates the exports at the municipality (commune) and product level7 to corresponding ad valorem transport costs while controlling for permanent municipality-product-custom characteristics and year-specific factors (see Technical Appendix A for details on the exports dataset). In estimating this equation we distinguish between primary products and manufactures.
0
10
20
40
30
Source: Author’s calculations.
Distance (Km)
Perc
ent
0 800600400200 1600140012001000 1800
FIGURE 6 Distribution of Domestic Distances Traveled by Export Shipments, 2008
15
20
25
30
Expo
rts
(in lo
gs)
Distance (in logs)
FIGURE 7 Commune Exports and Distance to Customs
Source: Author’s calculations.
4 5 6 7 8
7 At the 6-digit HS level.

<< Too Far to Export84
This provides for more flexibility in specification, for example, by allowing the impacts of transport costs on exports to differ across sectors due to differences in their transportability.8 The outcomes of the estimations are shown in detail in Technical Appendix B. The econometric results indicate unequivocally that exports are negatively correlated with the level of domestic transport costs. All the coefficients are statistically significant and present the right signs. For example, the results indicate that a 1 percent reduction in ad valorem transport costs would lead to a 4.3 percent increase in manufacturing exports.
A potential limitation of this econometric model is the possibility of reverse causality between ad valorem transport costs and trade. Econo-metrically, this shortcoming can be addressed using, among other things, instrumental variable techniques or by exploiting exogenous sources of variation. We employ the latter strategy in a second model in which we exploit the random and exogenous variation in domestic transport costs associated with the earthquake that took place in Chile in February 2010.9 The results show that the road damage and the resulting increase in transport costs had a negative impact on the country’s export flows (see Box 1). While this econometric approach is different than the econo-metric model described above, the results indicate that the relationship between exports and domestic transport costs is real and is not produced by reverse causality.
We now use the results from the estimations to simulate the trade impacts associated with changes in transport costs, focusing on the regions with subpar export performance, which are the most remote regions. As explained earlier, the capital of Santiago, as well as the main ports and airport facilities, are located in the central part of the country, while the remote regions are located far from the center. One would expect that exporters in remote regions might make full use of nearby port and
8 We also estimate the same regression using additional controls for municipality, product and customs characteristics varying over time. The results, available upon request, are very similar.9 The analysis performs difference-in-difference estimations to compare the group of firms affected by the earthquake before and after the shock with the group of firms not affected by the earthquake. The earthquake event is used as a natural experiment to be able to identify the effects of domestic transport costs on exports.

Chile: Exporting and the Challenges of Domestic Transport Costs >> 85
n Box 1: Trade, Domestic Transport Costs, and Chile’s 2010 Earthquake
The 8.8 magnitude earthquake that struck Chile on February 27, 2010, was among the eight strongest tremors ever registered. Its epicenter was located about 330 kilometers southwest of the capital of Santiago and about 105 kilometers from Concepción, the country’s second largest city. Resulting interruptions of transit over Chile’s road network provided an opportunity to use sophisticated econometric techniques to examine the relationship between transport costs and trade flows. A summary of this analysis, carried by Volpe and Blyde (2013), is presented below.
The earthquake damaged many sections of the road network. According to the Chilean Ministry of Public Works, (MOP), a total of 717 points on the public road network were affected, including 396 roads and highways, 90 access roads, and 212 bridges. In addition, 62 points on the road network under private concessions also registered damages. In total, the MOP estimated that 1,554 kilometers were somewhat affected by the earthquake, which represents about 9 percent of the country’s total paved road network. Damage ranged from mudslides, which required warnings of caution to drivers, to the collapse of bridges and the complete loss of connectivity. Figure B.1 shows the location of the 55 points in the country’s primary and secondary road network where traffic was completely interrupted.
FIGURE B.1 Locations with Complete Road Interruptions
Continued on next page

<< Too Far to Export86
airport facilities instead of incurring high transport costs to the middle of the country, where the goods would be shipped to their final destinations. While some exporters do use nearby facilities, most tend to ship their goods to exit points in the center of the country. Evidence for this was presented in Table 1, which shows that significant shares of exports from the north and south regions are shipped out of the country not from their own regions (or neighboring regions) but from other regions.
Due to the intensive use of logistics facilities in the middle of the country, firms there have lower domestic transport costs than firms in re-mote regions. To assess the trade effects of the additional burden faced by the regions away from the center we simulate a counterfactual exercise in which we assume that the exporters in remote regions do not face longer routes than their counterparts in the middle of the country. Note that Figure 6 shows a large concentration of exports around 150 km from customs. This corresponds to the typical distance over which an exporter in the middle of the country, such as in Santiago, ships goods to a major port
The damage forced many vehicles to take detours, which increased costs related to the additional distance and time required to reach destinations. Through an analysis based on geographic information system data, the authors show that median distance to destination for exporters affected by the earthquake increased by more than 30 percent. But while many roads were damaged by the earthquake, others were not affected. Similarly, many firms were forced to utilize alternative routes, but many others were not. Volpe and Blyde (2013) rely on this random and exogenous variation in the domestic transport costs associated with the earthquake to identify the effects of domestic transport costs on exports. Examining 12 months of data, the analysis compares the export performance of the firms whose routes were affected by the earthquake before and after the event to the performance before and after the earthquake of the firms whose routes were not affected. In making the analysis, the researchers made difference-in-differences estimations on highly disaggregated firm-level data that inform the exact geographical origin of the exports and the location of the customs where the exports exit the country.
The analysis found that road damages indeed affected the export flows of the country. The exports whose routes were particularly affected had a rate of growth before and after the earthquake 33.7 percent lower than that of their non-affected counterparts. The authors also show that the main cause for this drop is a reduction in the number of shipments, which was particularly serious for large firms. The results show that infrastructure shortages can put a cap on the level of operations to serve foreign markets, thus limiting a firm’s ability to benefit from potential economies of scale and gains from trade in general. For details see Volpe and Blyde (2013).
n Box 1: Trade, Domestic Transport Costs, and Chile’s 2010 Earthquake (continued)

Chile: Exporting and the Challenges of Domestic Transport Costs >> 87
also in the middle of the country, such as Valparaíso. Our counterfactual exercise consists of assuming that the maximum distance transited by any shipment within the country (from point of origin to port) is 150 km. The implicit assumption here is that the country has adequate port, airport, and logistics facilities throughout its territory giving any exporter, regardless of location, similar access to a port of exit as a counterpart in the middle of the country.
As shown in Figure 8, transport costs are reduced least in the middle of the country, in particularly in regions RM, V, and VIII. (The bars (left graph) show the change in the average costs by region.) Exporters in these regions ship most of their exports through ports that are close to their locations because the major logistics facilities of the country are located in these regions. Therefore, the simulation does not represent large savings in terms of distance and time-related transport costs for
Change in ExportsChange in Transport Costs
Source: Author’s calculations.
FIGURE 8 Percentage Change in Transport Costs and Regional Exports when Distance of Shipment Does Not Exceed 150 km
–80% –60% –40% –20% 0%
XII
XI
X
XIV
IX
VIII
VII
VI
RM
V
IV
III
II
I
XV
0% 10% 20% 30% 40%
XII
XI
X
XIV
IX
VIII
VII
VI
RM
V
IV
III
II
I
XV

<< Too Far to Export88
these exports. When we move away from the center, however, the drop in transport costs becomes much greater, decreasing by more than 50 percent in some regions. Clearly, firms in these regions ship a significant portion of their exports over long distances within the country to reach a port; the simulation indicates large savings in terms of transport costs. Note that not all the remote regions located away from the center exhibit large decreases in transport costs. One example is region I. The results for this region are explained by the presence of the port of Iquique and the high concentration of region I’s exports that ship through this port. The port of Iquique specializes in the exports of minerals10 and more than 80 percent of this region’s exports are mining-related products. There-fore, even though the region is far from the center, its highly specialized exporters do not travel long distances to reach other logistics facilities, but rather ship most of their exports through this specialized port. But while the port of Iquique is for this region what the logistics services in the middle of the country are for the middle regions, this is not generally the case for other remote regions. Region II, for example, also specializes in mining, and it too has a port—Antofagasta—that is highly specialized in shipping mining products. Relative to region I, however, the exports of region II are more diversified in terms of the number of ports that the region uses for shipping its goods, which explains the larger decrease in transport costs from the simulation.
In Figure 8, the bars (right graph) show the percentage change in exports produced by the simulation. We observe a pattern of impacts similar to the changes in transport costs, in which the central regions generally exhibit the smallest increases in exports while the regions away from the center experience much larger gains. For some of the regions, the increase in exports can be quite substantial—up to 40 percent in some cases.11 The simulation illustrates the potential convergence effect that could be set in motion if exporters in remote regions could reach adequate
10 More than 60 percent of the exports passing through this port are mining products.11 Because the simulations focus on the goods that are actually exported, the impacts presented correspond to responses in the short term to changes in transport costs and not on the potential benefits that could arise in the long term from improving connectivity. In this sense, our estimates are conservative.
Chile: Exporting and the Challenges of Domestic Transport Costs >> 89
port infrastructure under comparable conditions as their counterparts in the center of the country.
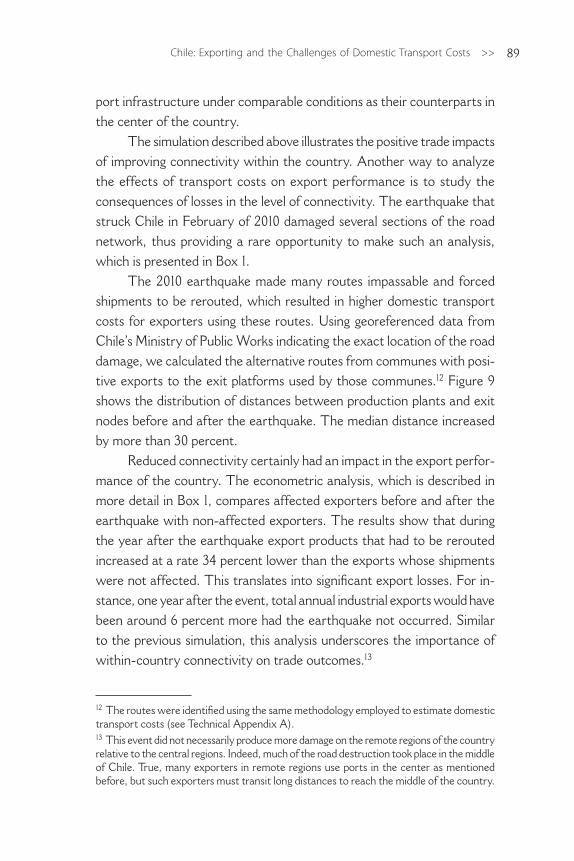
The simulation described above illustrates the positive trade impacts of improving connectivity within the country. Another way to analyze the effects of transport costs on export performance is to study the consequences of losses in the level of connectivity. The earthquake that struck Chile in February of 2010 damaged several sections of the road network, thus providing a rare opportunity to make such an analysis, which is presented in Box 1.
The 2010 earthquake made many routes impassable and forced shipments to be rerouted, which resulted in higher domestic transport costs for exporters using these routes. Using georeferenced data from Chile’s Ministry of Public Works indicating the exact location of the road damage, we calculated the alternative routes from communes with posi-tive exports to the exit platforms used by those communes.12 Figure 9 shows the distribution of distances between production plants and exit nodes before and after the earthquake. The median distance increased by more than 30 percent.
Reduced connectivity certainly had an impact in the export perfor-mance of the country. The econometric analysis, which is described in more detail in Box 1, compares affected exporters before and after the earthquake with non-affected exporters. The results show that during the year after the earthquake export products that had to be rerouted increased at a rate 34 percent lower than the exports whose shipments were not affected. This translates into significant export losses. For in-stance, one year after the event, total annual industrial exports would have been around 6 percent more had the earthquake not occurred. Similar to the previous simulation, this analysis underscores the importance of within-country connectivity on trade outcomes.13
12 The routes were identified using the same methodology employed to estimate domestic transport costs (see Technical Appendix A).13 This event did not necessarily produce more damage on the remote regions of the country relative to the central regions. Indeed, much of the road destruction took place in the middle of Chile. True, many exporters in remote regions use ports in the center as mentioned before, but such exporters must transit long distances to reach the middle of the country.

<< Too Far to Export90
Policy Actions
Before discussing policy recommendations it should be acknowledged that Chile has a comparatively robust transport infrastructure. For instance, according to the transport infrastructure index reported by the World Economic Forum in 2010–2011, Chile is ranked 37th out of 139 countries worldwide in this respect, which puts it ahead of the rest of Latin America.
The concessions program that Chile embarked upon about two de-cades ago is clearly one of the reasons behind the country’s achievements in this area. Through this program, Chile has expanded and modernized roads, airports, and ports, including the modernization of Highway 5, one of the main arterial roads of the country. Given the results of our simulation, the concessions program is an important endeavor and deserves support. At the same time, however, the program has tended to concentrate on road improvements in the center of the country, near Santiago. The challenge, therefore, is to extend it to other sections of the north-south corridor and to the regional road networks, most of which are currently administered
0
1000
2000
3000
Source: Volpe and Blyde (2013).Note: The figure is a quantile-quantile graph that plots distances in kilometers from the plant to the exiting customs before the earthquake (y-axis) against those traveled after the earthquake (x-axis) for exports that are positive in both periods.
Distance Post-Earthquake
Dist
ance
Pre
-Ear
thqu
ake
0 1000 2000 3000
FIGURE 9 Distribution of Distances Traveled to the Exit Points Before and After the Earthquake
As such, a significant portion of the overall trip is not affected by the damaged roads. In contrast, almost all of the routes used by exporters in the affected regions were affected.
Chile: Exporting and the Challenges of Domestic Transport Costs >> 91
by the public sector. The earthquake that affected the country in 2010, as mentioned earlier, has also created new demands for construction (see Box 1) that require the cooperation of both the public and the private sector.
The status of the road network is not the only determinant of trans-port costs. Many other factors also come into play, such as the market structure and the regulations governing the trucking industry. Although a comprehensive assessment of market structures and regulatory issues in Chile is beyond the scope of this chapter, a few examples will serve to illustrate some of the issues involved.
The market structure of Chile’s trucking industry is highly atomized, with about 70 percent of the firms owning only one vehicle.14 These small firms typically have very low levels of formality and professional standards. They usually lack accounting and record-keeping practices, and this lack of information may even result in charging tariff rates that do not cover their long-term costs. Despite lower rates, however, most of these firms do not directly compete with their larger and more efficient counterparts because the former typically engage in transportation activities with low levels of specialization, such as moving construction materials. Larger, more specialized firms tend to serve other segments of the market. The small and relatively inefficient firms, however, are usually associated with some negative externalities of the industry. For instance, their trucks are generally older, consume more fuel, and suffer more accidents than those of the larger firms. This leads to higher congestion, increased time costs, more damage to the roadways, and increased infrastructure costs. For these reasons it is important to remove barriers that prevent these firms from growing and becoming more efficient.
Better business practices would help these small firms to adopt better technology, improve efficiency, and encourage growth. At present, for example, it is difficult for many of these firms to evaluate the advantages of renovating their fleet or engaging in any kind of innovative activity be-cause most of them do not keep records of their own costs and revenues. Incentives to take courses in accounting and record-keeping could be the
14 According to the Ministry of Transport and Telecommunications.

<< Too Far to Export92
first step in helping them to realize the opportunities that may lie ahead if they upgrade their physical capital and business operations.
In the area of regulation, several examples illustrate how legisla-tion could also help to reduce transport costs and improve connectivity within the country. One example relates to incentives needed to help small trucking firms grow and become more efficient. In principle, Chile’s legislation does not directly shield trucking firms from competition. For instance, there are no regulations on freight rates or impediments to entry. Therefore, market forces provide firms with the necessary incentives to increase efficiency to survive competition or, alternatively, to exit the market. However, some aspects of the regulatory framework may reduce incentives for the trucking firms to grow. One example is a law (No. 19764 and subsequent modifications), which allows all firms to recover part of a specific tax on fuel under a scheme that enables smaller firms to recover a larger percentage of the tax than medium and large firms. While this might not be a big enough disincentive for many companies to expand, this law illustrates why the value of policies intended to benefit the smaller (and normally less efficient) firms should be carefully weighed against all the costs that the policy might generate, including the costs associated with the presence of negative externalities, such as those mentioned before.
A second example in the area of transport regulation is a norm (DFL-30), which mandates shipping firms to employ only storage facilities located in the same districts of the ports they are using. Imposing restric-tions on where trucking firms can store their goods clearly limits the abili-ties of firms to design optimal logistic plans and may result in sub-optimal configurations of routes for transporting and delivering goods. Ultimately, this inefficiency translates into higher shipping prices.
Beyond such regulatory issues, other initiatives could improve the efficiency of delivering goods within the country and reduce the costs of transportation. One is related to the problem of cargo imbalances. In Chile, trucks often travel empty on either the inbound or the outbound trip, which tends to raise the freight rates because the shipper pays for forgone capacity on half the distance traveled. In many instances this is a problem of lack of information; a trucker arriving at a port to deliver a cargo does not know that there is another potential cargo that could

Chile: Exporting and the Challenges of Domestic Transport Costs >> 93
be shipped back over the same route (or to another place). Or a shipper in the port does not know that there is an empty truck that could poten-tially cover the desired route. A solution would be to improve information through cargo-community systems that electronically provide information on origin, destination, time-tables, and truck capacity of all the shipping that takes place among the registered companies. The system helps improve the market clearing process of the shipping community, thus reducing cargo imbalances and freight costs. Such systems have been used extensively in the US and Europe.
Finally, alternative modes of transportation for shipping goods domestically can also increase competition and help to keep freight rates down. While full development of such alternative modes might take some time, some policies could produce almost immediate impacts. One example is removing restrictions on cabotage, in which a foreign-owned vessel transports cargo and passengers among different points in the same country.
At present, foreign ships that unload their cargo at Chilean ports do not have cabotage rights. Recently, however, the government announced the elimination of this restriction, which could increase the supply of carriers available and thus the level of competition, not only for marine transportation but also for land transportation.
In this last section of the chapter we have discussed some potential policy actions that could help reduce freight rates in Chile. Rather than present an exhaustive list of policies for doing so, we have provided con-crete examples that could produce the desired results. These examples illustrate the larger point that when it comes to lowering transport costs, it is not all about building roads, but also about soft policies related to regulations, incentives, and issues governing market structure. Finally there are important political economy issues regarding some of these policies, and their discussion goes beyond the scope of this chapter. It should be clear, however, that any attempt to improve the efficiency of the cargo industry would almost certainly require an understanding of such issues.
<< Too Far to Export94
Technical Appendix
Appendix A – Exports and Transport Costs Datasets
Exports
The export data is obtained at the transaction-level from the Chilean national customs authority, Servicio Nacional de Aduanas. Each record includes a firm identifier, the firm’s name, its location (comuna), the region from which the production originates, the type of good (at an 8-digit HS level), the port, airport, or land border through which the good exits Chile, the export value in US dollars, and the quantity (weight) in kilograms. For some observations, the location of the firm at the comuna level does not correspond to the region of origin. This is because the data on location for some firms correspond to the place where the firm is legally registered instead of the place where the production takes places. This corresponds to 35 percent of the observations. In those cases, we make the necessary adjustments using physical location information taken from directories of various industries including mining, fishery and forestry, as well as a general directory of industries of SOFOFA (Sociedad de Fomento Fabril). For those observations in which the directories were not useful to identify the place of production we applied an algorithm for reassigning the comuna. Based on all the observations in which the comuna corresponds to the region of origin, essentially the algorithm assigned the place of produc-tion to that of the comuna with the highest likelihood of producing the particular good and with the highest likelihood of shipping it through the indicated customs. All the econometric exercises that are shown in this chapter were also performed without the group of observations that were adjusted. The results do not change in any significant way.
Transport Costs
We use real distance and time-related cost data taken from an annual survey on the operational transport costs of land cargo services (Encuesta de Servicio de Transporte de Carga por Carretera), which is conducted by the INE. The survey covers trucking firms of all sizes and includes
Chile: Exporting and the Challenges of Domestic Transport Costs >> 95
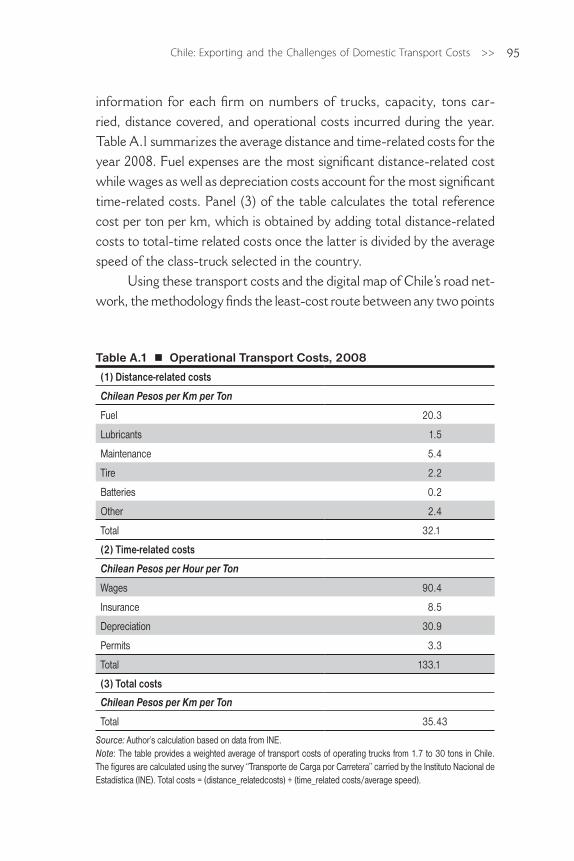
information for each firm on numbers of trucks, capacity, tons car-ried, distance covered, and operational costs incurred during the year. Table A.1 summarizes the average distance and time-related costs for the year 2008. Fuel expenses are the most significant distance-related cost while wages as well as depreciation costs account for the most significant time-related costs. Panel (3) of the table calculates the total reference cost per ton per km, which is obtained by adding total distance-related costs to total-time related costs once the latter is divided by the average speed of the class-truck selected in the country.
Using these transport costs and the digital map of Chile’s road net-work, the methodology finds the least-cost route between any two points
Table A.1 Operational Transport Costs, 2008
(1) Distance-related costs
Chilean Pesos per Km per Ton
Fuel 20.3
Lubricants 1.5
Maintenance 5.4
Tire 2.2
Batteries 0.2
Other 2.4
Total 32.1
(2) Time-related costs
Chilean Pesos per Hour per Ton
Wages 90.4
Insurance 8.5
Depreciation 30.9
Permits 3.3
Total 133.1
(3) Total costs
Chilean Pesos per Km per Ton
Total 35.43
Source: Author’s calculation based on data from INE.Note: The table provides a weighted average of transport costs of operating trucks from 1.7 to 30 tons in Chile. The figures are calculated using the survey “Transporte de Carga por Carretera” carried by the Instituto Nacional de Estadística (INE). Total costs = (distance_relatedcosts) + (time_related costs/average speed).
<< Too Far to Export96
(say a city and a port). We apply this method of analysis, which is based on Combes and Lafourcade (2005), to all pairs of origin-destinations of interest—all the communes (origins) and all the active customs (destina-tions)—to calculate the freight costs of transporting the exports from their location of production to their ports of departure in the country (ports, airports, or borders). These transport costs also incorporate adjustments for the conditions of the roads based on information from the Chilean Ministry of Public Works, which keeps track of conditions on the country’s main road network. This adjustment follows the same methodology as the one used in the chapter for Colombia (see Technical Appendix A in that chapter).
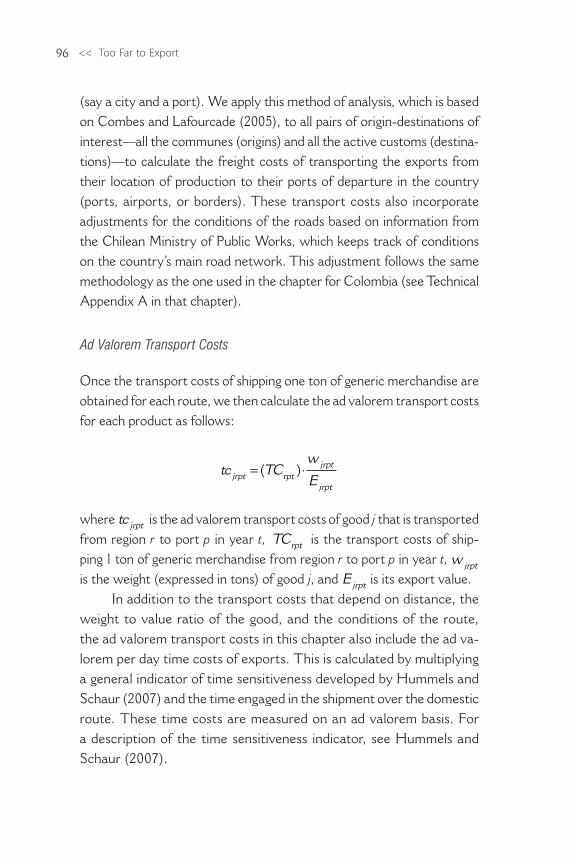
Ad Valorem Transport Costs
Once the transport costs of shipping one ton of generic merchandise are obtained for each route, we then calculate the ad valorem transport costs for each product as follows:
tc TCw
Ejrpt rptjrpt
jrpt
= ⋅( )
where tc TCw
Ejrpt rptjrpt
jrpt
= ⋅( ) is the ad valorem transport costs of good j that is transported from region r to port p in year t, TCrpt is the transport costs of ship-ping 1 ton of generic merchandise from region r to port p in year t,
tc TCw
Ejrpt rptjrpt
jrpt
= ⋅( )
is the weight (expressed in tons) of good j, and tc TC
w
Ejrpt rptjrpt
jrpt
= ⋅( ) is its export value.
In addition to the transport costs that depend on distance, the weight to value ratio of the good, and the conditions of the route, the ad valorem transport costs in this chapter also include the ad va-lorem per day time costs of exports. This is calculated by multiplying a general indicator of time sensitiveness developed by Hummels and Schaur (2007) and the time engaged in the shipment over the domestic route. These time costs are measured on an ad valorem basis. For a description of the time sensitiveness indicator, see Hummels and Schaur (2007).
Chile: Exporting and the Challenges of Domestic Transport Costs >> 97
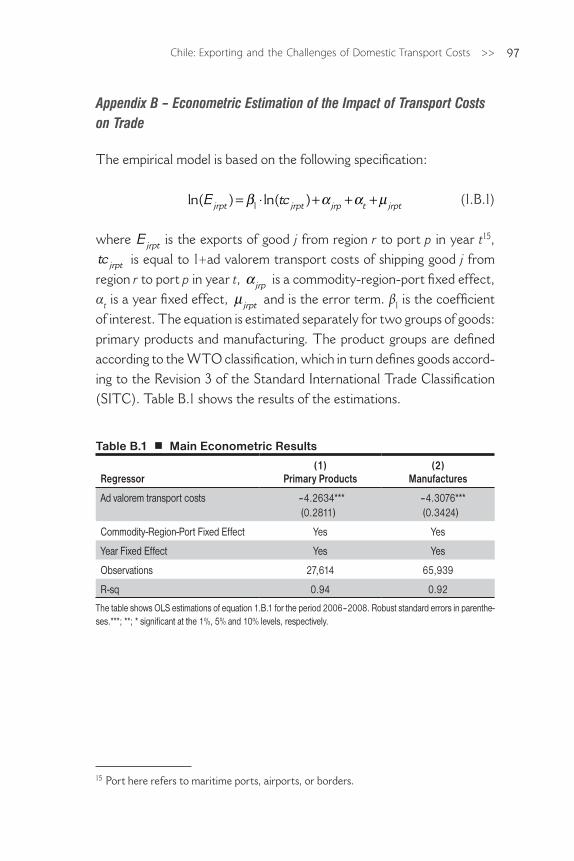
Appendix B – Econometric Estimation of the Impact of Transport Costs on Trade
The empirical model is based on the following specification:
ln( ) ln( )E tcjrpt jrpt jrp t jrpt= ⋅ + + +β α α µ1 (1.B.1)
where tc TC
w
Ejrpt rptjrpt
jrpt
= ⋅( ) is the exports of good j from region r to port p in year t15,
tc jrpt is equal to 1+ad valorem transport costs of shipping good j from region r to port p in year t, α jrp is a commodity-region-port fixed effect, αt is a year fixed effect, µ jrpt and is the error term. β1 is the coefficient of interest. The equation is estimated separately for two groups of goods: primary products and manufacturing. The product groups are defined according to the WTO classification, which in turn defines goods accord-ing to the Revision 3 of the Standard International Trade Classification (SITC). Table B.1 shows the results of the estimations.
Table B.1 Main Econometric Results
Regressor(1)
Primary Products(2)
Manufactures
Ad valorem transport costs –4.2634***(0.2811)
–4.3076***(0.3424)
Commodity-Region-Port Fixed Effect Yes Yes
Year Fixed Effect Yes Yes
Observations 27,614 65,939
R-sq 0.94 0.92
The table shows OLS estimations of equation 1.B.1 for the period 2006–2008. Robust standard errors in parenthe-ses.***; **; * significant at the 1%, 5% and 10% levels, respectively.
15 Port here refers to maritime ports, airports, or borders.

<< Too Far to Export98
References
Baldwin, R., R. Forslid, P. Martin, G. Ottaviano, and F. Robert-Nicoud. 2003. Economic Geography and Public Policy. Princeton: Princeton University Press.
Clark, X., D. Dollar, and A. Micco, 2004, “Port Efficiency, Maritime Transport Costs, and Bilateral Trade,” Journal of Development Economics. Vol 75: 417–450.
Combes, P.-P. and Lafourcade, M. 2005. “Transport Costs: Measures, Determinants, and Regional Policy. Implications for France.” Journal of Economic Geography 5.
Hummels, D. 2001. Toward a Geography of Trade Costs. Department of Ag-ricultural Economics, Purdue University. Mimeographed document.
Hummels, D. and G. Schaur. 2007. Time as a Trade Barrier. Department of Agricultural Economics, Purdue University. Mimeographed document.
Mesquita Moreira, M., C. Volpe, and J. S. Blyde. 2008. Unclogging the Arteries: The Impact of Transport Costs on Latin American and Ca-ribbean Trade, Special Report on Integration and Trade. Washington, DC: Inter-American Development Bank.
Pavcnik, N. 2002, “Trade Liberalization, Exit, and Productivity Improve-ments: Evidence from Chilean Plants.” Review of Economic Stud-ies 69, pp. 245–76.
Tybout, J., J. De Melo, and V. Corbo. 1991. “The Effects of Trade Re-forms on Scale and Technical Efficiency: New Evidence from Chile.” Journal of International Economics 31, 231–250.
Volpe, C. and J. S. Blyde. 2013. “Shaky Roads and Trembling Exports: Assessing the Trade Impacts of Transport Costs Using a Natural Experiment.” Journal of International Economics, Volume 90, No. 1, 2013, pp 148–161.