>> 愛媛大学 - ehime university high frequency plasma...
TRANSCRIPT

IYOKAN - Institutional Repository : the EHIME area http://iyokan.lib.ehime-u.ac.jp/dspace/
>> 愛媛大学 - Ehime University
This document is downloaded at: 2018-07-03 06:39:22
Title High Frequency Plasma in Liquid Method for Decompositionof Methane Hydrate under High Pressure( 学位論文全文 )
Author(s) ISMAIL
Citation . vol., no., p.-
Issue Date 2015-09-23
URL http://iyokan.lib.ehime-u.ac.jp/dspace/handle/iyokan/4706
Rights
Note
受理:2015-07-09,審査終了:2015-09-10,Applied Thermal Engineering Volume 90, 5 November 2015,Pages 120-126,DOI:10.1016/j.applthermaleng.2015.06.074

Dissertation
High Frequency Plasma in Liquid Method for Decomposition of Methane Hydrate
Under High Pressure
高周波液中プラズマ法による高圧下にお
けるメタンハイドレート分解
I s m a i l
2015

Chapter 1
General Introduction
1.1 Problem Statement
The search for new energy sources that are both economically viable and ecologically
sustainable is becoming one of the most pressing concerns worldwide. The demand for
energy has significantly increased due to the growth of world economic and global population.
Alternative energy sources such as solar energy, biomass, geothermal power, and tidal power
have been considered for solving the problem. All of these natural energy resources are
believed to minimize our dependency on fossil fuel that has increased global carbon emission
millions of times. Coal, natural gas, and oil accounted for 87% of global primary energy
consumption in 2012, as the growth of worldwide energy use continued to slow due to the
economic downturn. Coal rose from 29.7 to 29.9%, and oil fell from 33.4 to 33.1%.1

Chapter 1. General Introduction 2015
2
Natural gas as an important source of future energy supply has consistently been a
worldwide interest throughout the world when oil is exhausting. It is the cleanest burning of all
the fuel has been a major commodity of the energy market, which produced commercially
from oil fields and natural-gas fields. As the name implies, can be defined as any gaseous
material, usually combustible, and normally emerging from the ground either without outside
assistance, purely under its own pressure, or from a bore hole drilled from the surface into an
underground reservoir 2. In addition to methane, natural gas may contain other hydrocarbons,
such as ethane, propane, butane, pentane and heavier hydrocarbons in lower concentration
as shown in Table 1.1.
Table 1.1 Chemical composition of natural gas 3
Source : Pittcom Symposium: Advances in Energy Research, paper 1370-5, 2015
The Worldwatch Institute have statistics clarified that natural gas increased its share
of energy consumption from 23.8 to 23.9% during 2012. Natural-gas demand is also expected
to increase in the recent year. Based on BP Statistical Review of World Energy on June 2014,
world natural gas production increased by 1.1% in 2013, slightly below the growth rate of

Chapter 1. General Introduction 2015
3
global consumption (+1.4%) as shown in Figure 1.1. Therefore, natural gas performs an
important role as an energy supply to electricity generation through gas turbine and alternative
automotive fuel, in recent times.
Source: http://yearbook.enerdata.net. Enerdata, 2010.
Figure 1.1 Natural-gas production and consumption throughout the world 4
In recent year, hydrogen becomes feasible as the environmentally fuel that has
the potential to reduce dramatically dependence on oil fuel and the greenhouse gas
emission. Hydrogen contains no carbon at all. Burning it and converting it to energy
produces no CO2 and no greenhouse gas. Used as a fuel, it would reduce and eventually
eliminate at least the man-made share of CO2 deposited in the atmosphere. Switching to
hydrogen energy even using hydrogen from fossil fuels or natural gas and used in fuel cell
vehicle, it would reduce greenhouse gas emissions by approximately 50% right away 5.
Hydrogen in molecular form can be produced from many distinct sources, and in
many different ways. Hydrogen can be produced from any hydrocarbon fuel because by
definition, these fuels contain hydrogen, It also can be produced from various biological
Chapter 1. General Introduction 2015
4
materials and from water. Hydrogen is most typically produced today through the steam
reformation of natural gas.
As a fuel/energy source, however, the valuable active element of“natural gas” is
methane. It can be obtained from gas hydrates. Gas hydrates are also called methane hydrate
or chemically clathrates. Gas hydrates are potentially one of the most important energy
sources for the future. Gas hydrate is a crystalline solid formed by the combination of typical
gas such as methane, ethane, cyclopentane, or even CO2 with water at low temperature and
high pressure.
In addition, massive reserves of methane hydrates can be found under continental
shelves and on land of permafrost. The amount of organic carbon in methane hydrates is
estimated to be twice that in all other fossil fuel 3. Compare with the burning of other
hydrocarbon fuels, burning methane produces less carbon dioxide for each unit of heat
released. Methane’s combustion heat is lower than that of any other hydrocarbon, but the ratio
of the molecular mass divided by the heat of combustion shows that methane, being the
simplest hydrocarbon, produces more heat per unit mass than other complex hydrocarbons.
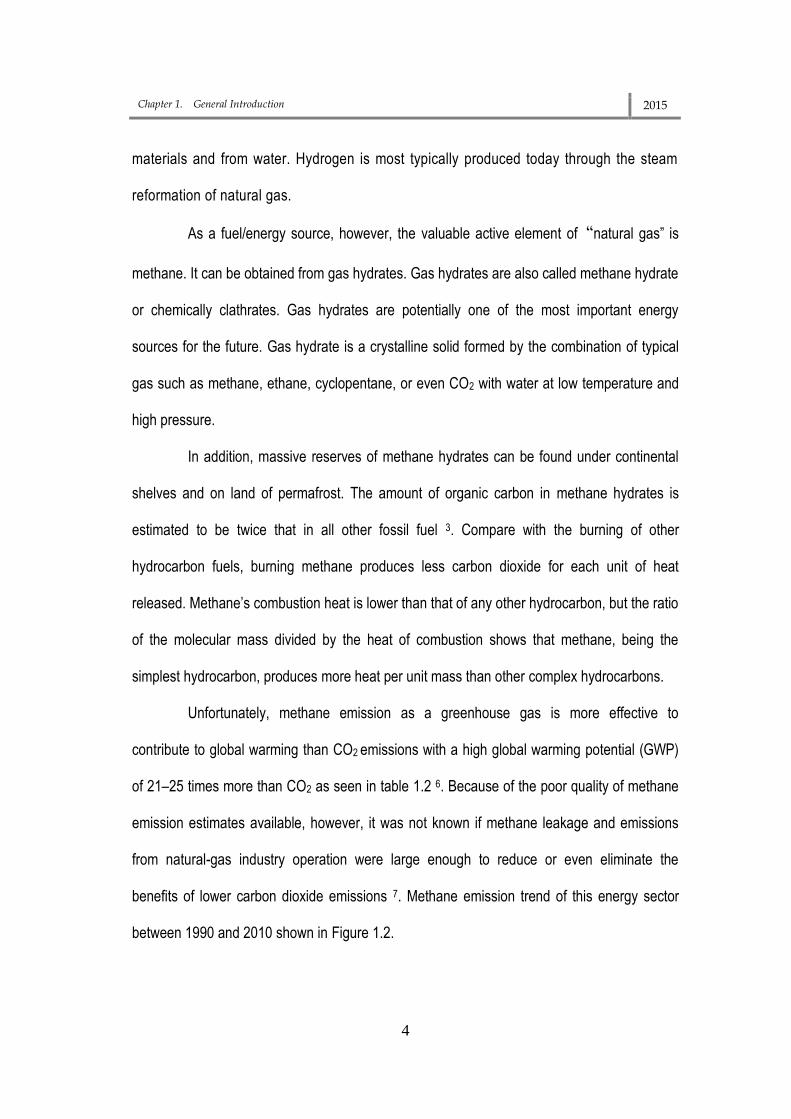
Unfortunately, methane emission as a greenhouse gas is more effective to
contribute to global warming than CO2 emissions with a high global warming potential (GWP)
of 21–25 times more than CO2 as seen in table 1.2 6. Because of the poor quality of methane
emission estimates available, however, it was not known if methane leakage and emissions
from natural-gas industry operation were large enough to reduce or even eliminate the
benefits of lower carbon dioxide emissions 7. Methane emission trend of this energy sector
between 1990 and 2010 shown in Figure 1.2.

Chapter 1. General Introduction 2015
5
Table 1.2 Fossil fuel emission levels, pounds per billion Btu of energy input
Pollutant Natural Gas Oil Coal
Carbon Dioxide 117,000 164,000 208,000
Carbon Monoxide 40 33 208
Nitrogen Oxides 92 448 457
Sulfur Dioxide 1 1,122 2,591
Particulates 7 84 2,744
Mercury 0.000 0.007 0,016
Source: EIA - Natural Gas Issues and Trends 1998 8
Source: Rafiu O.Yusuf et al, 2012, p. 5061. Renewable and Sustainable Energy Reviews.
Figure 1.2 Methane emissions trend from energy sector 9
In early 1990s, application of plasma technology on hydrocarbon reforming to
generate hydrogen has been gradually attracting attention due to some characteristics
that might be considered. Plasma could be operated at low pressure or atmospheric
pressure. Although the low-pressure plasma, such as radio frequency (RF) plasma or

Chapter 1. General Introduction 2015
6
microwave (MW) plasma, could achieve high hydrocarbon conversion and good hydrogen
selectivity. Plasmas contain energetic electrons and a variety of chemically active species,
which can greatly promote the reforming chemistry 10.
Research has been conducted in the production of hydrogen with application of
plasma technology. It is very promising for fuel reforming reaction to produce hydrogen
where overall reforming is same as the conventional processes. Production of hydrogen
via methane reforming using atmospheric pressure microwave plasma has been
conducted by Jasinski et al. 11. By plasma-reforming of methanol, a high selectivity of
hydrogen (85.5%) was found at a high applied power 12. Thermal plasma by partial
oxidation was produced hydrogen yield of 93.7% 13. The in-liquid plasma method has
been successful in producing hydrogen from hydrocarbon liquid in a conventional
microwave oven14, by radio frequency plasma in clathrate hydrate with hydrogen
selectivity of 97% 15,16.
Therefore, it is feasible that plasma technology may be used to decompose the
methane hydrate found in hydrates field as a foreseeable source of hydrogen production
with minimizing any effect on global warming through the release of methane and CO2 gas
byproducts into the atmosphere.
1.2 The Objectives of The Study
Because of the in-liquid plasma method can be applied to generate hydrogen
from clathrate hydrates, as well as the technology is one of the interesting research areas
for gas production in clathrate hydrate. Thus, its application to generate hydrogen from
clathrate hydrates comes to be the primary objectives in this dissertation. In spite of few
papers, focusing on hydrogen production from methane hydrate had been presented.

Chapter 1. General Introduction 2015
7
Figure 1.3 illustrate the scheme of hydrogen production from methane hydrate
fields by the in-liquid plasma method of high pressure as become the ultimate goal of this
research. Some point must be determined in order to achieve this goal, such as, he
feasibility of plasma irradiation under high pressure levels as well as the possibility of
hydrogen production from methane hydrate and plasma generation at more than 5 MPa
using a long transmission cable. Therefore, in this research, hydrogen generation from
methane hydrate by the in-liquid plasma method is conducted under atmospheric pressure
and high pressure. The studies were proceeded with following techniques and method.
Source: Ruppel, Nature knowledege, Hydrates/Climate, April 2011.
Figure 1.3 Scheme of plasma stimulation into methane hydrate field in the seabed.
In order to reach the target that discussed in the previous section, chapter 2 starts
with a narration of the utilization of plasma technology to streamline the variety of hydrocarbon
reforming methods. In this chapter, brief descriptions of the key emerging technologies for H2
production are also considered. In chapter 3, the potential of methane hydrate as a promising
source of hydrogen for the future is studied. Furthermore, the method of methane gas

Chapter 1. General Introduction 2015
8
hydrates formation and gas production are presented.
In chapter 4, plasma properties in pure water and artificial seawater under high
pressure are investigated using high frequency of 27.12 MHz. Plasma was maintained in a
pure water, artificial seawater. It becomes essential to generate a stable plasma in seawater
under the high pressure owing to methane hydrate resources are accumulated in
ocean-bottom sediments where water depth exceeds about 400 meters at a low temperature
and high pressure. Discharge in seawater is very hard and requires considerable high voltage.
Chapter 5 is focused to the discussion regarding decomposition of methane hydrate
using microwave and 27.12 MHz radio frequency in-liquid plasma methods, in which the
thermal stimulation method as one way for gas production from clathrate hydrates was used.
While the characteristic of argon plasma jet on methane hydrate decomposition for hydrogen
production is investigated in chapter 6. And conclusively, the entire results from this research
study are resolved briefly in chapter 7.

Chapter 1. General Introduction 2015
9
References
1. Institute, W. W. Fossil Fuels Dominate Primary Energy Consumption. (2013). at <http://www.worldwatch.org/fossil-fuels-dominate-primary-energy-consumption-1>
2. Nasr, G. G. & Connor, N. E. Natural Gas Engineering and Safety Challenges: Downstream Process, Analysis, Utilization and Safety. (Springer, 2014). at <https://books.google.com/books?id=C-01BAAAQBAJ&pgis=1>
3. Ayhan Demirbas. Methane Gas Hydrate. (Springer, 2010). at <www.springer.com>
4. http://yearbook.enerdata.net. Enerdata. (2010).
5. Hoffmann, P. Tomorrow’s Energy: Hydrogen, Fuel Cells, and the Prospects for a Cleaner Planet. (MIT Press, 2012). at <https://books.google.com/books?id=FwyCTCkN108C&pgis=1>
6. Wuebbles, D. J. & Hayhoe, K. Atmospheric methane and global change. Earth-Science Rev. 57, 177–210 (2002).
7. Kirchgessner, D. a., Lott, R. a., Cowgill, R. M., Harrison, M. R. & Shires, T. M. Estimate of methane emissions from the U.S. natural gas industry. Chemosphere 35, 1365–1390 (1997).
8. http://NaturalGas.org. Natural Gas and Environtment. (2014).
9. Yusuf, R. O., Noor, Z. Z., Abba, A. H., Hassan, M. A. A. & Din, M. F. M. Methane emission by sectors: A comprehensive review of emission sources and mitigation methods. Renew. Sustain. Energy Rev. 16, 5059–5070 (2012).
10. Chen, H. L., Lee, H. M., Chen, S. H., Chao, Y. & Chang, M. B. Review of plasma catalysis on hydrocarbon reforming for hydrogen production-Interaction, integration, and prospects. Appl. Catal. B Environ. 85, 1–9 (2008).
11. Jasiński, M., Dors, M. & Mizeraczyk, J. Production of hydrogen via methane reforming using atmospheric pressure microwave plasma. J. Power Sources 181, 41–45 (2008).
12. Wang, Y. F., You, Y. S., Tsai, C. H. & Wang, L. C. Production of hydrogen by plasma-reforming of methanol. Int. J. Hydrogen Energy 35, 9637–9640 (2010).
13. Kim, S. C. & Chun, Y. N. Production of hydrogen by partial oxidation with thermal plasma. Renew. Energy 33, 1564–1569 (2008).
14. Nomura, S. et al. Production of hydrogen in a conventional microwave oven. J. Appl. Phys. 106, 073306 (2009).

Chapter 1. General Introduction 2015
10
15. Putra, A. E. E., Nomura, S., Mukasa, S. & Toyota, H. HYDROGEN PRODUCTION BY REFORMING CLATHRATE HYDRATES USING THE IN-LIQUID. in 11 th International Conference on Sustainable Energy technologies (SET-2012) (2012).
16. Putra, A. E. E., Nomura, S., Mukasa, S. & Toyota, H. Hydrogen production by radio frequency plasma stimulation in methane hydrate at atmospheric pressure. Int. J. Hydrogen Energy 37, 16000–16005 (2012).

Chapter 2
Application of Plasma Technology for Hydrogen Production
2.1 Introduction
Hydrogen is the initial element in the periodic table, with an atomic number of one. In
the early 16th century, it was first artificially produced by mixing metal with acids. In 1766, the
first man who recognized that hydrogen gas as discrete substance was Henry Cavendish, and
that it produces water when burned, a property which in the future gave it its name in Greek,
hydrogen means “water-former”.
The world today is facing a seriousness in developing alternative fuels. Among various
alternatives, hydrogen fuel provides the highest potential advantages in terms of varied supply
and lowered emissions of pollutant and greenhouse gasses. Hydrogen fuel has been
recommended as the answer to the problems of air pollution and global warming. It possesses

Chapter 2. Application of Plasma Technology for Hydrogen Production 2015
12
all the key criteria for an ideal fuel substitute for gasoline, heating oil, natural gas, and other
fuel, which are inexhaustibility, cleanliness, convenience, and independence from foreign
control. The electrochemical property of hydrogen becomes one of its essential and interesting
features, due to it can be utilized in a fuel cell. At present, H2/O2 fuel cells are ready for use
under an efficiency of 50-60% with a lifetime of up to 3000 h. Energy-related properties of
hydrogen are compared with other fuels in Tables 2.1 through 2.3 1.
Table 2.1 Comparison of Hydrogen with Other fuels 1
Table 2.2 Properties of Conventional and Alternative Fuels 1

Chapter 2. Application of Plasma Technology for Hydrogen Production 2015
13
Table 2.3 LHV Energy Densities of Fuels 1
Hydrogen production is a large and growing industry at this present time. The annual
production of hydrogen is estimated to be about 55 million tons with its consumption
increasing by about 6% per year. Several application areas of hydrogen energy are presented
in Figure 2.1, out of which the use of hydrogen energy for vehicular application is of current
focus 1.
Source: Ram B. Gupta, Hydrogen Fuel Production, Transport, and Storage. CRC Press, 2009, p.6.
Figure 2.1 Various application areas of hydrogen energy

Chapter 2. Application of Plasma Technology for Hydrogen Production 2015
14
2.2 Hydrogen Production
For the aim of hydrogen production from gaseous or liquid fuels, a wide variety of
processes is available. They vary according to the nature of the primary fuel used and to the
chemical reactions involved.
2.2.1 Hydrogen from biomass
In compared to fossil fuels, biomass are abundantly available as well as more
uniformly dispersed geographically on a world-scale. It is present from a wide range of source
such as waste paper, corn, sawdust, aquatic plants, short rotation woody crops, agricultural
waste, animal wastes, municipal solid wastes, crop residues, and many more. The nature of
the diverse biomass feedstock varies to a large extent with regard to chemical composition
and physical appearance. The carbon content is significantly lower compared to coal, whereas
the oxygen content is much higher 1,2. Typical dry weight percentage for C, H, and O are
30-60%, 5-7%, and 30-45%, respectively.
Biomass has a relatively low hydrogen content as indicated earlier. Hydrogen yield not
only depends on this bound hydrogen, but also on the chemical splitting of water in the steam
reforming reaction. It is a disadvantage compared to, for example, natural gas from the
hydrogen source, especially in the view of the lower energy content per unit mass.
A schematic overview of the different routes of conversion of biomass into hydrogen is
shown Figure 2.2. Conversion technologies are divided into two groups, i.e. biological and
thermo-chemical. The temperature level becomes the main difference between these routes.
The biological processes take place at ambient to slightly higher-temperature levels, whereas
the thermo-chemical conversion routes take place at a temperature of several hundred
degrees Celsius.

Chapter 2. Application of Plasma Technology for Hydrogen Production 2015
15
Source: Krishna Kumar et al., 2013, Sustainable Energy, p.33.
Figure 2.2 Pathways from biomass to hydrogen
The common technology used to produce hydrogen from biomass is gasification. It is
a variation of pyrolysis and, therefore, is based upon partial oxidation of the materials into a
mixture of hydrogen, methane, carbon monoxide, carbon dioxide, and nitrogen known as a
producer gas. As the products of gasification are mostly gases, this process is more favorable
for hydrogen production than pyrolysis 3. Biomass gasification using supercritical water
technology (SCW) will be gasified the biomass almost entirely and the produced gas generally
contains mainly H2 and CO2 with a small percentage of CH4 and CO 4. A complete conversion
of glucose and xylose from plant biomass to H2 and CO2 with a yield of two H2 per carbon, the
maximum possible yield 5 by using in vitro synthetic enzymatic system. A membrane reactor
based process was successfully utilized for producing hydrogen from a feed with simulated
biomass-derived syngas 5.

Chapter 2. Application of Plasma Technology for Hydrogen Production 2015
16
As the moisture content in biomass must also be vaporized, the gasification process
normally suffers from low thermal efficiency. They can reach efficiencies 35-50% based on the
lower heating value. The huge amount of resources must be used to gather the large amount
of biomass to the central processing plants has become another problem with regard of this
technology. For cost effective hydrogen production from biomass, development of smaller
efficient distributed gasification plants may be required 1.
2.2.2 Hydrogen from water
The process whereby water is split into hydrogen and oxygen through the application
of electrical energy is known as water electrolysis, as in the equation:
H2O + electricity → H2 + ½O2 (2.1)
As the temperature increase, electrolysis is slightly increasing, while the required electrical
energy decreases. Thus, when high-temperature heat is available as waste heat from another
process, a high-temperature electrolysis process might be desirable. This is especially
important globally due to most of the electricity produced based on fossil fuel energy sources
with relatively low efficiencies (Hydrogen production and storage). A system efficiency of
56-73% can be achieved by a commercial low temperature electrolyzer.
Recently, high pressure unit with pressures more than 1000 ppsig are being
developed, hence, the capability of the electrolyzer to produce high purity hydrogen now is not
the only benefit. The advantage of high-pressure operation is the elimination of expensive
hydrogen compressor. At present, electrolysis is more costly to produce hydrogen than using
large scale fuel processing technology 2.
A proper selection of electrolytes can optimize hydrogen production by electrolysis
method. The activation of electrochemical reactions as well as more hydrogen production

Chapter 2. Application of Plasma Technology for Hydrogen Production 2015
17
have obtained by adding NaCl in the electrolytes 6. A method for generating molecular
hydrogen directly from the change separation effected via rapid flow of liquid water through a
metal orifice have studied by Duffin et.al 7.
2.2.3 Hydrocarbon reforming
In various organic compounds, it is easy to discover hydrogen, particularly in the
hydrocarbons that compose many of the fuels, such as gasoline, natural gas, methanol,
and propane. Through the application of heat, hydrogen can be separated from
hydrocarbons, and the process is known as Reforming.
In order to produce hydrogen from hydrocarbon fuels, three primary techniques
are used: steam methane reforming, partial oxidation, and autothermal reforming. The
summary of the advantages and challenges each of these processes is shown in Table
2.4 2.
Table 2.4 Comparison of reforming technologies
Source: J.D. Holladay et al., An overview of hydrogen production technologies. Catal. Today 139, 244–260
(2009).
Steam methane reforming is by far the most important and widely used process
for the industrial manufacture of hydrogen, amounting to about 40% of the total world
production. Steam reforming does not require oxygen, has a lower operating temperature
than others, and produces a high H2/CO ratio which is beneficial for hydrogen production.
However, it does have the highest emissions.

Chapter 2. Application of Plasma Technology for Hydrogen Production 2015
18
Figure 2.3 depicts the simplified block diagram of the steam methane reforming
plant in two major technological variation differing from one another mostly by the final
treatment of the product gas 1.
Source: Ram B. Gupta, Hydrogen Fuel Production, Transport, and Storage.CRC Press, 2009, p.39.
Figure 2.3 Block diagram of steam methane reforming plant
Partial oxidation of hydrocarbon has been proposed for use in hydrogen
production for automobile fuel cell and some commercial applications. A fuel and oxygen
(or air) in partial oxidation process are combined in proportions such that a fuel is
converted into a mixture of H2 and CO. under the range of lower temperature
(600-900oC), it can be carried out catalytically or noncatalycally at high temperature
(1100-1500oC). Utilization of any carbonaceous feedstock, including heavy residual oils
and coal are also possible. In order to guarantee the conversion completed and to reduce
carbon, non-catalytic partial oxidation of hydrocarbons in the presence of oxygen normally
takes place when flame temperatures of 1300-1500oC 2.
The autothermal reforming process has been used to produce hydrogen and
CO-rich synthesis gas for decades. This process is a combination of partial oxidation and

Chapter 2. Application of Plasma Technology for Hydrogen Production 2015
19
steam methane reforming technologies, which is the combustion of the hydrocarbon
feedstock in an adiabatic reactor provides thermal energy for production of syngas 1. In
this process, fuel is converted into a hydrogen-rich gas mixture according to the following
reactions 8:
CnHmOl + (n-1)H2O → nCO + (m/2+n-1)H2 ΔHo298 > 0 (2.2)
CnHmOl + (n-1)/2O2 → nCO + mH2 ΔHo298 < 0 (2.3)
CO + H2O → CO2 + H2 ΔHo298 < 0 (2.4)
CO + 3 H2 → CH4 + H2O ΔHo298 < 0 (2.5)
The partial oxidation of hydrocarbons (eq. 2.3) supply the required heat for the
endothermic steam reforming in eq. 2.2, then a gas composition that corresponds to
thermodynamic equilibrium is yielded by the simultaneous process of water-gas shift
reaction (eq. 2.4) and the methanation reaction (eq. 2.5).
In comparison to steam reforming, the autothermal reforming process have a
significant advantage, which it can be stopped and started very fast while producing a
larger quantity of hydrogen and partial oxidation alone. Thus, it is potential for economies
of scale, relative compactness, and lower capital cost. Based on the higher heating values,
the thermal efficiency for methane reforming is comparable to that partial oxidation
reactors by 60-75%, and slightly less than that of steam reformers 2.
Besides, methane cracking process is another alternative method for hydrogen
production. The process is performed at high temperature above 700 oC, which is provided by
heating up a fire brick furnace directly with a methane-air flame. This process also allows at
atmospheric pressure. Water gas shift and CO2 purification in steam methane reforming are
not required during this process because it only produces clean carbon as a byproduct of the

Chapter 2. Application of Plasma Technology for Hydrogen Production 2015
20
use of metallurgical industries.
CH4 → C + 2H2 ΔH298 K = +75 kJ/mol (2.6)
Hydrogen and carbon black were first produced by Kværner Process through
pyrolysis of hydrocarbon feedstocks in 1889. The moderately endothermic energy can break
up methane into carbon particles and 1 mole of hydrogen with 18 kCal/mole and the efficiency
of this process is estimated to exceed 49% 9. 1 mole of methane with gas feed temperature
and pressure of 500 oC and 1.5 bar was cracked to produce 2.6 moles hydrogen with the
efficiency of 78% 10.
2.3 Plasma Reforming for Hydrogen Production
It has been progressively attracting attention in the early 1990’s regarding of the
application of plasma technologies on hydrocarbon reforming to produce hydrogen. Some
characteristics has become the consideration such as; fast ignition, the compatibility for a
broad range of hydrocarbons, removal of the catalyst sensivity to trace impur ities in the
gas stream, and compactness 11. Plasmas contain a variety of chemically active species
and energetic electrons which can greatly promote the reforming chemistry. The
advantages of high products selectivity from thermal catalysis and the fast startup from
plasma technique have been developed by integrating plasma and thermal catalysis. The
overall reforming reactions in plasma reforming are the same as conventional reforming,
however, for the reforming reaction, energy and free radicals are provided by a plasma.
Plasma reforming is basically classified in two main categories: thermal and
non-thermal. In thermal plasma reforming, a high electric discharge (>1 kW) is applied in
order to raise both the electrons and the neutral species to a very high temperature
(50,000-100,000K). Whereas in non-thermal plasma, the only parameter that increased is

Chapter 2. Application of Plasma Technology for Hydrogen Production 2015
21
the electron temperatures (> 5000K), while the bulk species temperature does not
increase significantly. Thus, just a few hundred watts of power are involved since only the
electrons are directly excited 2.
For non-thermal plasma reformers, there are four types of plasma are well known:
gliding arc plasma, dielectric barrier discharge (DBD), microwave plasma, and corona
discharge. Among these technologies, the principal difference is how the power supply,
rate, and design control the current and discharge power. Wang et.al has investigated the
reforming of methanol for producing hydrogen with the conclusion that a higher conversion
of methanol with a higher selectivity of H2 was obtained at a higher applied power. While a
low required energy consumption of H2 was achieved at a low applied power (800 W)12.
Hydrogen production rate were up to 225 g[H2]h-1 and the corresponding energy efficiency
in methane reforming were 85 g[H2]h-1 by using microwave plasma under atmospheric
pressure. It is expected to be a low cost and effective method by the absence of oxygen
compounds as by-products in the off-gas is highly beneficial for producing hydrogen 13.
2.4 The In-liquid Plasma Method for Hydrogen Production
Plasma can be generated in a liquid from an underwater electrode by high frequency
or microwave irradiation. It is understood from the observation of the image of in-liquid plasma
using high speed camera that plasma can exist instead of by contact with liquid, but via vapor
that generated from the liquid evaporation by the heat of plasma 14. For the breakdown
generation as well as for desire processing in application of plasma discharge in liquids, HV,
high-power discharges are generally required. The high energy from a power source is first
used to evaporate the liquid adjacent to the HV electrode, generating gas bubbles that are
subsequently ionized by large electric fields produced by the HV 15. Nomura et.al in 2003

Chapter 2. Application of Plasma Technology for Hydrogen Production 2015
22
reported the establishment of a plasma within bubbles created in a hydrocarbon liquid, which
was simultaneously irradiated by both ultrasonic waves and microwaves 16.
In addition, an ordinary microwave oven as the source for 2.45 GHz MW radiation
under atmospheric pressure had been used to decompose clathrate hydrates to produce fuel
gas. It was found that Cyclopentane (CP) hydrate was decomposed by plasma at atmospheric
pressure with a content of 65% hydrogen, 12% CO, and 8% CO2 17. When using high
frequency plasma in-liquid to decompose methane hydrate, an H2 content of 55% in gas
production was obtained from conversion of 40% of CH4. It was also found that the methane
cracking reaction was dominant in conversion of CH4 into hydrogen 18.
Under the atmospheric pressure, comparison of methane hydrate decomposition
using radio frequency plasma and microwave oven by in-liquid plasma was observed.
Hydrogen with a purity of 75.8% was obtained by using radio frequency power source.
Whereas, by using 2.45GHz microwave oven, a 53.1% purity of hydrogen can be produced.
Decomposition of methane hydrate by radio frequency plasma method for hydrogen
production can optimize plasma decomposition of CH4 at a slow rate of CH4 release from
methane hydrate. Conversely, the methane hydrate decomposition by MW plasma method
occurs at a fast rate of CH4 release from methane hydrate 19.
2.5 Conclusion
An explanation of general idea of the conventional methods of hydrogen production
was described in this introduction session. also, the use of some type of plasma for
hydrocarbon reforming is presented. Finally, the potential of the in-liquid plasma method is
also described in the applications for hydrocarbon reforming. The entire discussion in this
session clearly resolve that hydrogen can be directly produced from methane hydrate by the

Chapter 2. Application of Plasma Technology for Hydrogen Production 2015
23
in-liquid plasma method and plasma irradiation is feasible under high pressure than
atmospheric pressure..
References
1. Hydrogen Fuel Production, Transport, and Storage. (Taylor & Francis Group, 2009).
2. Holladay, J. D., Hu, J., King, D. L. & Wang, Y. An overview of hydrogen production technologies. Catal. Today 139, 244–260 (2009).
3. Ni, M., Leung, D. Y. C., Leung, M. K. H. & Sumathy, K. An overview of hydrogen production from biomass. Fuel Process. Technol. 87, 461–472 (2006).
4. Zhang, J. Hydrogen Production by Biomass Gasification in Supercritical Water. Energeia 19, 2–7 (2008).
5. Abdollahi, M. et al. Hydrogen production from coal-derived syngas using a catalytic membrane reactor based process. J. Memb. Sci. 363, 160–169 (2010).
6. Ben, R. Production of Hydrogen by Electrolysis of Water: Effects of the Electrolyte Type on the Electrolysis Performances. Sci. Res. 2, 56 (2013).
7. Lutz, A. E., Bradshaw, R. W., Bromberg, L. & Rabinovich, A. Thermodynamic analysis of hydrogen production by partial oxidation reforming. Int. J. Hydrogen Energy 29, 809–816 (2004).
8. Pasel, J. et al. Hydrogen production via autothermal reforming of diesel fuel. Fuel Cells 4, 225–230 (2004).
9. Steinberg, M. Fossil fuel decarbonization technology for mitigating global warming. Int. J. Hydrogen Energy 24, 771–777 (1999).
10. Halabi, M. H., de Croon, M. H. J. M., van der Schaaf, J., Cobden, P. D. & Schouten, J. C. Modeling and analysis of autothermal reforming of methane to hydrogen in a fixed bed reformer. Chem. Eng. J. 137, 568–578 (2008).
11. Chen, H. L., Lee, H. M., Chen, S. H., Chao, Y. & Chang, M. B. Review of plasma catalysis on hydrocarbon reforming for hydrogen production-Interaction, integration, and prospects. Appl. Catal. B Environ. 85, 1–9 (2008).
12. Wang, Y.-F., You, Y.-S., Tsai, C.-H. & Wang, L.-C. Production of hydrogen by plasma-reforming of methanol. Int. J. Hydrogen Energy 35, 9637–9640 (2010).

Chapter 2. Application of Plasma Technology for Hydrogen Production 2015
24
13. Jasiński, M., Dors, M. & Mizeraczyk, J. Production of hydrogen via methane reforming using atmospheric pressure microwave plasma. J. Power Sources 181, 41–45 (2008).
14. Mukasa, S. et al. Growth of bubbles containing plasma in water by high-frequency irradiation. Int. J. Heat Mass Transf. 53, 3067–3074 (2010).
15. Yang, Y., Cho, Y. & Fridman, A. Plasma Discharge in Liquid. (2012).
16. Nomura, S. & Toyota, H. Sonoplasma generated by a combination of ultrasonic waves and microwave irradiation. Applied Physics Letters 83, 4503–4505 (2003).
17. Nomura, S., Putra, A. E. E., Mukasa, S., Yamashita, H. & Toyota, H. Plasma decomposition of clathrate hydrates by 2.45GHz mircowave irradiation at atmospheric pressure. Appl. Phys. Express 4, 2–4 (2011).
18. Putra, A. E. E., Nomura, S., Mukasa, S. & Toyota, H. Hydrogen production by radio frequency plasma stimulation in methane hydrate at atmospheric pressure. Int. J. Hydrogen Energy 37, 16000–16005 (2012).
19. Rahim, I., Nomura, S., Mukasa, S. & Toyota, H. a Comparison of Methane Hydrate Decompositon Using Radio Frequency Plasma and Microwave Plasma Methods. in The 15th International Heat Transfer Conference 1–10 (2014).

Chapter 3
Methane Gas Hydrate as A Prospective Source of Hydrogen Energy
3.1 Introduction
Gas hydrates are potentially one of the most significant energy resources for the
future. The terms “methane hydrate” and “gas hydrate” are refer to the methane-water
crystalline structure called a clathrate, and these terms are generally used alternately.
Methane gas can be obtained from methane hydrates. They have an icelike crystalline lattice
of water molecules with methane molecules trapped inside (see Fig. 3.1). Under the proper
combination of methane and water at low temperatures and high pressures cause them to be
possible to form. However, due to the solid form of the gas hydrates, conventional gas and oil
recovery methods are not suitable 1.

Chapter 3. Methane Gas Hydrate as a Prospective Source of Hydrogen Energy 2015
26
Source: National Oceanography Centre/Energy/Methane hydrate
Fig. 3.1 Water-ice like cage structure of gas hydrates
The less content of carbon-intensive fuel from methane than coal or oil become
another important factor of gas hydrate.
2Coal(CH) + 2½ O2 → 2CO2 + H2O (3.1)
CH4 + 2O2 → CO2 + 2H2O (3.2)
Two-thirds of coal combustion products are CO2 vs. one-third of methane, it means that
methane from hydrates or other sources provides only half as much carbon dioxide as coal
per unit of combustion products. Consequently, the usage of the methane contained in
natural-gas hydrate would not only guarantee the suffiency of world energy resources, but
would also reduce potential global climate change 2. Table 3.1 shows the amounts of organic
carbon sources in the worldwide.

Chapter 3. Methane Gas Hydrate as a Prospective Source of Hydrogen Energy 2015
27
Table 3.1 The amounts of organic carbon sources in the worldwide 1.
Source of organic carbon Amount (gigatons)
Gas hydrates (onshore and offshore) 10,000 – 11,000
Recoverable and non recoverable fossil fuel (oil, coal, gas) 5,000
Soil 1,400
Dissolved organic matter 980
Land biota 880
Peat 500
Others 70
Source: Ayhan Demirbas. Methane Gas Hydrate. (Springer, 2010)
3.2 The Origin of Gas hydrates
Huge reserves of gas hydrates can be found on the field under permafrost and
under continental shelves. It is estimated that the organic carbon quantity in gas hydrates to
be twice that in all other fossil fuels combined 1. In addition, clathrate is survive where the
conditions in under the sediments are in the methane clathrate stability region and where the
presences of methane and water are occupied. This stability is limited by temperature and
pressure, gas hydrates are stable at low temperature and/or high pressures. The recovery
process of methane generally involves dissociating or melting in situ gas hydrates by heating
the reservoir above the temperature of hydrate formation, or decreasing the reservoir pressure
below that of hydrate equilibrium 1. Based on the pressure and temperature, as well as the
relatively large amounts of organic matter for bacterial methanogenesis, clathrates are
principally restricted to two regions: (a) high latitudes and (b) along the continental margins in
the oceans 1.
The methane in gas hydrates is dominantly produced by bacterial degradation of
organic substance in low-oxygen surroundings. It could be that the methane is produced by

Chapter 3. Methane Gas Hydrate as a Prospective Source of Hydrogen Energy 2015
28
bacteria near the seafloor that are decomposing organic sediments. Organic matter in the
uppermost few centimeters of sediments is first attacked by aerobic bacteria, generating
carbon dioxide, which escapes from sediments into the water column. In this region aerobic
bacterial activity, sulfates are reduced to sulfides. If the sedimentation rate is low, the organic
carbon content is low, while oxygen is plentiful. But where sedimentation rates and the organic
carbon content are high, the pore waters in the sediments are anoxic at depths of only a few
centimeters, and methane is produced by anaerobic bacteria 1. Even so, it might also be that
the methane originates from oil deposits deep within Earth that leak to the seafloor bottom
through faults and cracks.
Source: Heat & Mass Transfer Laboratory, Ehime University, 2010
Figure 3.2 Burning of methane hydrate

Chapter 3. Methane Gas Hydrate as a Prospective Source of Hydrogen Energy 2015
29
Either way, it is still unidentified how the methane becomes imprisoned within ice
lattice. There is no idea yet regarding of what conditions are favorable for the methane
hydrates formation 1. Generally, clathrate hydrate is formed at high pressure and low
temperature but the exact temperature and pressure depends on the guest molecules. Some
of typical gases such as CH4, CO2, and even cyclopentane as liquid hydrocarbon become the
“guest” molecules that trapped in a cage of water 3.
3.3 Crystalline structure of Gas Hydrate
Crystalline structure of hydrate is nearly complete tetrahedron of hydrogen bonded.
The motion range of a methane molecule in a large cage is greater than that in a small cage.
This is implies that a methane molecule in a large cage more easily escapes from the
hydrates than one in a small one.
Source: U.S. Geological Survey
Figure 3.3 Crystalline structure of gas hydrates
At the boundary between water and a liquid of suitable guest molecules, some
clathrate hydrate can form under atmospheric pressure, e.g., CH3CCl2F in clathrate structure II
(sII) hydrate 4. Most clathrate hydrates decompose to release the guest molecules at

Chapter 3. Methane Gas Hydrate as a Prospective Source of Hydrogen Energy 2015
30
atmospheric pressure, except at low temperatures (below 270K) where they may stay in a
metastable state for some hours. Meanwhile, under higher pressures, clathrate show complex
phase behavior, and often providing filled hexagonal ice with the smaller guest
molecules/atoms 5.
Natural gas hydrates can consist of any combination of three crystal structures
relating to the size of the guest molecule, i.e.: (a) structure I (sI), (b) structure II (sII), and (c)
structure H (sH) as shown in Table 3.2. Gas hydrate crystallizes with hexagonal symmetry
when the pure liquid water freezes, but when it “freezes” as hydrocarbon hydrate, it does so
with cubic symmetry for sI and sII, reverting to hexagonal.
Table 3.2 Type of clathrates depend on the size 1
Type Lattice Space group
Unit cell Formula*
Structure I (sI) Cubic Pm3n a = 1.20 nm (S)2(L)6.46H2O
Structure II (sII) Face-centered cubic Fd3m a = 1.73 nm (S)16(L+)8.136H2O (S)16(L+)8.136H2O
Structure H (sH) Hexagonal P6/mmm a = 1.23 nm
(S)5(L++).34H2O c = 1.02 nm
*Not all cavities would normally be filled (S= small guest, L+= Larger guest, L++=largest guest)
3.3.1 Clathrate structure I
The cubic clathrate sI is shown Fig. 3.4. Its network formed by small nonpolar
(gaseous) molecules, such as methane and carbon dioxide, in aqueous solution
[e.g.(CO2)8-y.46H2O] under pressure and low but not normally freezing temperatures. Many of
the cavities are occupied by the included molecules randomly depending on their size. Three
orthogonal axes holding a dodecahedral sits formed by the linear tetrakaidecahedral (51262)
cavities (in a body-centered-cubic arrangement) within a cube formed by six
tetrakaidecahedral (51262) cavities. In order to form columns, these 51262 cavities join at their

Chapter 3. Methane Gas Hydrate as a Prospective Source of Hydrogen Energy 2015
31
hexagonal faces.
Figure 3.4 Structure I of gas hydrates (a) General, (b) Pentagonal dodecahedron, (c) Tetrakaidecahedron 1
The sI gas hydrate contain 46 water molecules per unit cell arranged in two
dodecahedral voids and six tetrakaidecahedral voids, the water molecules occupy the apices
in the stick diagrams of the void types (see Fig. 3.4) 3. The structure can accommodate at
most eight guest molecules up to 5.8Å in diameter. Diameter of guest molecules between 4.2
and 6 Å such as methane, ethane and carbon dioxide belongs to the cubic structure I 3. The
inclusion of both methane and ethane but not propane is allowed by sI. The sI gas hydrates
are usually formed by smaller molecules such as methane, ethane, and carbon dioxide, 46
water molecules per eight gas molecules, and consist of eight pentagonal dodecahedron
cages 1.

Chapter 3. Methane Gas Hydrate as a Prospective Source of Hydrogen Energy 2015
32
3.3.2 Clathrate Structure II
Figure 3.5 Structure II of gas hydrates (a) General, (b) Hexakaidecahedron,
(c) Decahedron1
The II hydrate structure is shown in figure 3.5. Cubic crystal containing sixteen 512
cavities, eight larger 51264 cavities, and 136 H2O molecules per unit cell, and containing larger
molecules such as 2-methylpropane in the larger cavities only 1. The tetrahedral 51264 cavities
form an open tetrahedral network, with their centre arranged in a manner reminiscent of the
cubic ice structure and separated by groups of three 512 cavities. The large proportion of 512
cavities is thought to be responsible for the similarities in the Raman spectra to gas-saturated
water 6.
The sII gas hydrates contain 136 water molecules per unit cell arranged in 16
dodecahedral voids and eight hexakaidecahedral voids, which can also modify up to 24 guest
molecules, but to a larger diameter of 6.9Å. This enables insertion of propane and isobutene
in addition to methane and ethane. The sII gas hydrates are typically formed by larger
molecules such as propane and isobutene, 136 water molecules per 24 gas molecules, and

Chapter 3. Methane Gas Hydrate as a Prospective Source of Hydrogen Energy 2015
33
consist of 24 hexakaidecahedron cages. A mixture of methane and ethane, and hydrogen as a
single guest having a diameter less than 4.2 Å is categorized as cubic structure II. The
diameter of propane or cyclopentane in interval 6 and 7 Å also forms cubic structure II 3.
3.3.3 Clathrate Structure H
Figure 3.6 Structure H of gas hydrates (a) General, (b) pentagonal dodecahedron, (c) icosahedrons, and (d) irregular dodecahedron 1
The sH hydrate structure is shown in Fig. 3.6. It has hexagonal crystals containing
three 512 cavities, two small 435663 cavities, one large 512618 cavity, and 34 water molecules
per unit cell, and contain even larger molecules such as 2.2-dimethylbutane in the larger
cavities only. Each 512618 barrel-shaped cavity is surrounded by six 435663 cavities around its
central ring of six hexagons. These 51268 cavities join at their top and bottom hexagonal faces
to form columns. Gas with a molecular size between 7 and 9 Å form hexagonal structure H 3.
The sH hydrates, which contain 34 water molecules per unit cell arranged in three
pentagonal dodecahedral voids, two irregular dodecahedral voids, and one icosahedral void,
can accommodate even larger guest molecules, such as isopentane. The sH gas hydrate are

Chapter 3. Methane Gas Hydrate as a Prospective Source of Hydrogen Energy 2015
34
usually formed by large molecules such as methylcyclohexane, but only in the presence of a
smaller molecule, 34 water molecules per six gas molecules. The large molecule occupies the
larger cage, and the small molecules occupy the smaller cage. Figure 3.7 shows the crystal
unit structures of three types of gas hydrate. Methane has a diameter of molecules of 4.36Å,
so there is approximately 1 molecule of methane for every 5¾ molecule of water (the ideal
hydration number=5.75). With 136 water molecules in a unit cell of cyclopentane as the
cubic structure II, the ideal hydration number becomes 17 8. The ideal hydration number
known as the ratio of water/guest molecule.
Figure 3.7 Structures of hydrate crystal unit and the properties of three common unit crystals 7
Besides, Methane hydrate is known in huge quantities and a wide geographical
distribution in seabed and permafrost within the conditions of high pressure and low
temperature represents a potentially enormous natural gas resource 9 as shown in figure
3.8. A single cubic meter of methane hydrate may contain as much as 170 m3 of methane

Chapter 3. Methane Gas Hydrate as a Prospective Source of Hydrogen Energy 2015
35
10, which estimates to be about 21×1015 m3 at standard temperature and pressure
condition (STP) all over the world 11.
Figure 3.8 The prospective existence of methane hydrates in the world 1,12
Methane hydrate may exist in equilibrium with liquid water or ice, methane and
some additive. Such temperature and pressure conditions are defined by the methane
hydrate equilibrium curve as shown in figure 3.9, if the equilibrium circumstances are
suitable, methane hydrate can form eventhough not in its environment. From the industrial
aspect, hydrates are valuable considering that the formation of these solids in gas and oil
production and transmission pipelines can raise the blockage, which can stop production
and compromise the structural integrity of both the pipelines and surface facilities. This
can lead to catastrophic economic loss and ecological risks, as well as potential safety

Chapter 3. Methane Gas Hydrate as a Prospective Source of Hydrogen Energy 2015
36
hazards to exploration and transmission personnel 13.
Figure 3.9 Pressure – temperature diagram for methane hydrate formation 1.
Methane hydrate could be used as the storage and transport of the high volume of
methane and has a high stability at atmospheric condition with the temperature 10 – 20 OC
under the water freezing point. Methane hydrate more easily transported by solid form hydrate
pellet so that transportation costs can be reduced by 18 – 25 % of the LNG system 14.
Methods of conventional natural gas storage are through liquefaction at cryogenic
temperatures (-162 oC) and an increase in pressure. Both of these methods can improve gas
storage volume of more than 200 times. However, both storage methods have great difficulty.
During the transportation process, the transportation costs are really high and a lot of gas can
evaporate. Moreover structure II hydrate is generally encountered in upstream oil and gas
operations.

Chapter 3. Methane Gas Hydrate as a Prospective Source of Hydrogen Energy 2015
37
3.4 Methane Hydrate Formation Method.
There are two methods for producing Methane hydrate: (a) methane injection into
small ice particles 15 or water 16 and (b) dripping water into methane 16,17. The surfactant
addition for the purpose of altering the chemical properties of the solution can reduce
hydrate induction time, increase hydrate formation and improve guest molecules storage
capacity in hydrates 18,19. Surfactant also reduces surface tension at the interface of the
water phases and guest molecule phases which can increase the solubility of guest
molecules in water. Nevertheless, due to increase in the dissociation rate of methane
hydrate below the ice point, the existence of surfactant can decrease the stability of
methane hydrate storage. Okutani et.al 20 have reported the effect of anionic surfactants
on the methane hydrate formation at 3.9 MPa and 273.15 K in the reactor without stirrer.
In addition, by using stirrer in the hydrate formation, affect to the increase of the
water-gas interfacial area improve process of heat and mass transfer with the result that it
efficiently can lessen the induction time 21. The process of heat transfer will remove the heat of
hydrate formation. Similarly, the guest molecule will be dissolved into gas-water contact with a
growing hydrate crystal by the process of mass transfer 22. Induction time can be defined as the
time from the first gas-liquid contact to the first detection of a hydrate phase.
Hence, the nucleation process is the initial step in the formation of gas hydrate
followed by the crystal growth which is continue to form a hydrate nucleous of a critical cluster
size in a supersaturated solution of water and guest molecules, which generally at the
gas–water interface for the continuation of the steady growth of hydrate crystals 13.
Nucleation may occur by induced around impurities (heterogeneous nucleation)
where nucleation commences without crystals present that occur in the vicinity of already

Chapter 3. Methane Gas Hydrate as a Prospective Source of Hydrogen Energy 2015
38
growing crystals in the system. Or else, it may be occur spontaneously (homogeneous
nucleation).
Figure 3.10 Methane hydrate formation with repressurization procedure 23.
Tr is reactor temperature and Tj is the jacket temperature.
Nevertheless, the repressurization procedure for two to three cycles has been conducted
for methane hydrate production in bulk, which contain about 560 g of water in a reactor that using
stirrer at 4 to 5 MPa and 275.16 K 23. The methane hydrate formation in this method initiated
straight away when the stirrer (400 rpm) was started at 5.3 MPa and 274.3 K, and there was a
pressure drop about 2.5 MPa. The repressurization process then carried out up to 4.3 MPa

Chapter 3. Methane Gas Hydrate as a Prospective Source of Hydrogen Energy 2015
39
followed by heated to a temperature close to the equilibrium curve. Figure 3.10 presents the
equilibrium curve. The figure reveals that the conversion of 90% water into hydrate will be more
efficient after three or four cycle of repressurization. Thus, this study is applicable for the
development of gas hydrate storage and transport technologies.
In addition, a study that reported by Stern et. al. reveals that methane injected at 27
MPa into granular ice with initial temperature 250 K, then the slow melting of the ice facilitates
the hydrate forming due heating the reactant above the melting point of the ice. hydrate
forming facilitated by the slow melting of the ice. This method can promotes CH4.5.9H2O and
the complete reaction was achieved by continued warming to 290 K and 30 MPa for
approximately 12 – 15 hours 15.
Figure 3.11 Methane hydrate formation with pressurized methane with granular ice 15

Chapter 3. Methane Gas Hydrate as a Prospective Source of Hydrogen Energy 2015
40
3.5 Processes of Gas Production from Methane Hydrates.
Methane molecules is become the primary gas contained in the natural-gas
hydrate sediment 24. Their large deposits are located near the areas where demand for energy
is expected to grow. Several countries in the world do not have original oil or gas resources
but do have nearby oceanic natural-gas hydrate deposits 1. Vehicles of economically and
securely producing methane from gas hydrate sediments are not yet on the drawing board.
Thus, for economic production of methane gas from offshore hydrates, the development of
new, lower-cost technologies and accesses is demanded. The gas dissociation rate becomes
the factor that can lower the cost production from gas hydrates. The production technique that
presents the simplest and lowest-cost is geothermal dissociation of gas hydrates. The
dissociation reaction of gas hydrate is 1:
CH4.6H2O(s) → CH4(g) + 6H2O(l) (3.3)
Currently, some methods are being developed regarding of the production of natural
gas from permafrost sediments and oceanic, such as depressurization, thermal stimulation,
and injection of hydrate inhibitors 25. Regarding of this matter, the structure properties of
hydrates such as permeability, hydrate saturation, and sediment porosity are essential to the
development of natural gas production. The porosity is particularly important for material flow
in sediment 26,27.
The solid form of fuel as well as the inflexibility to conventional gas and oil recovery
techniques has become the difficulties in recovering this source of energy 2. In general,
recommended methods of gas recovery from hydrates deal with dissociating or melting in situ
gas hydrates by heating the reservoir beyond the temperature of hydrate formation, or
decreasing the reservoir pressure below hydrate equilibrium. Hence, this becomes the key

Chapter 3. Methane Gas Hydrate as a Prospective Source of Hydrogen Energy 2015
41
problem in the production of methane from the hydrate layer. Another possible method is by
tapping the free methane below the gas hydrate zone. For the process of methane hydrates
dissociation, three methods have been proposed: thermal stimulation, depressurization, and
inhibitor injection.
3.5.1 Depressurization process
In this method, gas is produced based on the depressurization-induced dissociation of
the hydrates, which takes place in the unit by pumping process that causes the hydrate may
then dissociate downward into the low-pressure gas layer. However, in order to lower the
pressure in the free-gas zone immediately underneath the hydrate stability zone, the latent
heat of dissociation must still be supplied for leading to the hydrate decomposition at the base
of the hydrate stability zone and the released gas to transfer toward a well shaft. The
depressurization has involved the pore fluid in all cases.
In the depressurization of the gas hydrates, three important mechanisms are involved,
i.e. dissociation, conduction and convection heat transfer, and flow of fluids such as gas and
water. The gas production by the depressurization process is shown in figure 3.12. The heat
energy for the process comes from the ‘earth’s interior’ making the hydrates are exposed to a
low-pressure condition where they are unstable and decompose to methane and water. Then,
conventional technology can recover the methane released. The depressurization method as
visualized involves horizontal drilling in the underlying free-gas zone. As the free gas is
removed, the overlying hydrate depressurizes and decomposes into free gas. Continuous
removal of gas is expected to sustain this pressure-induced dissociation of the hydrate zone at
its base.

Chapter 3. Methane Gas Hydrate as a Prospective Source of Hydrogen Energy 2015
42
Source: MH21 Research Consortium, 2015. Available from: http:///www.mh21japan.gr.jp/
Figure 3.12 Gas production by the depressurization process
This method appears to be most matched to those deposits where widespread gas
occurs in a closure below the hydrate cap 28. This method is applicable only for hydrates that
exist in polar regions beneath permafrost when a free-gas phase exists beneath the hydrate
accumulation 1. Moreover, production of the free-gas leg using conventional gas development
techniques under such circumstances produces a pressure drop, which causes the unstable
condition of overlying hydrate and to progressively disassociate into free gas and water, a
process that adds gas to the underlying free-gas accumulation.
Some assumptions are considered for depressurization process, which is the model
behaves as a closed system with no boundaries 29–31:
(a) As the reservoir pressure drops below the dissociation pressure, hydrate dissociation is
occurring immediately at the reservoir pressure. The gas flows directly to the free-gas
zone;

Chapter 3. Methane Gas Hydrate as a Prospective Source of Hydrogen Energy 2015
43
(b) Hydrate decomposition is proportional to depressurization rate, and follows a first-order
kinetic model;
(c) During gas production process, rock expansion and water expansion are negligible;
(d) Heat transfer between the reservoir and the surroundings is neglected;
(e) The reservoir is produced from a single well positioned at the center.
3.5.2 Thermal Stimulation Process
In thermal stimulation method, injected steam or hot water or another heated liquid
becomes the source of heat that provided directly or indirectly via sonic means or electric. This
is applied to the hydrate stability zone to increase its temperature and leading to the hydrate
decomposition. In order to dissociate the gas, heat energy can be released into the methane
hydrate strata. As the heat energy needed for dissociation is about 6% of the energy
contained in the liberated gas, this process has a favorable net energy balance. Basically, for
dissociating the hydrate and release methane, steam or hot water can be pumped down a drill
hole. Then, through another drill hole, the methane released can be pumped to the surface of
the seafloor 32.
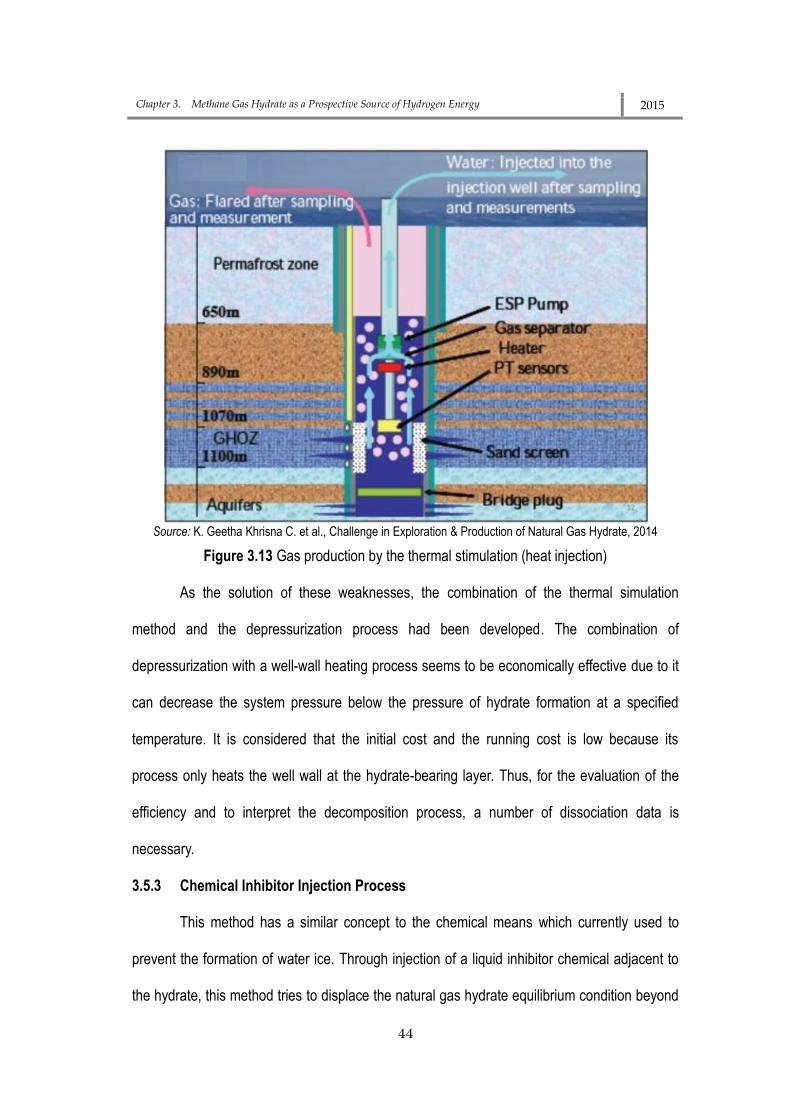
However, the thermal stimulation method has some weaknesses; up to 75% of the
applied energy could be lost to nonhydrate-bearing strata or thief zones; and second major
weaknesses is that the producing horizon must have good porosity for the heat flooding to be
effective. The gas production by thermal stimulation (heat injection) process is depicted in
figure 3.13.
Chapter 3. Methane Gas Hydrate as a Prospective Source of Hydrogen Energy 2015
44
Source: K. Geetha Khrisna C. et al., Challenge in Exploration & Production of Natural Gas Hydrate, 2014
Figure 3.13 Gas production by the thermal stimulation (heat injection)
As the solution of these weaknesses, the combination of the thermal simulation
method and the depressurization process had been developed. The combination of
depressurization with a well-wall heating process seems to be economically effective due to it
can decrease the system pressure below the pressure of hydrate formation at a specified
temperature. It is considered that the initial cost and the running cost is low because its
process only heats the well wall at the hydrate-bearing layer. Thus, for the evaluation of the
efficiency and to interpret the decomposition process, a number of dissociation data is
necessary.
3.5.3 Chemical Inhibitor Injection Process
This method has a similar concept to the chemical means which currently used to
prevent the formation of water ice. Through injection of a liquid inhibitor chemical adjacent to
the hydrate, this method tries to displace the natural gas hydrate equilibrium condition beyond
Chapter 3. Methane Gas Hydrate as a Prospective Source of Hydrogen Energy 2015
45
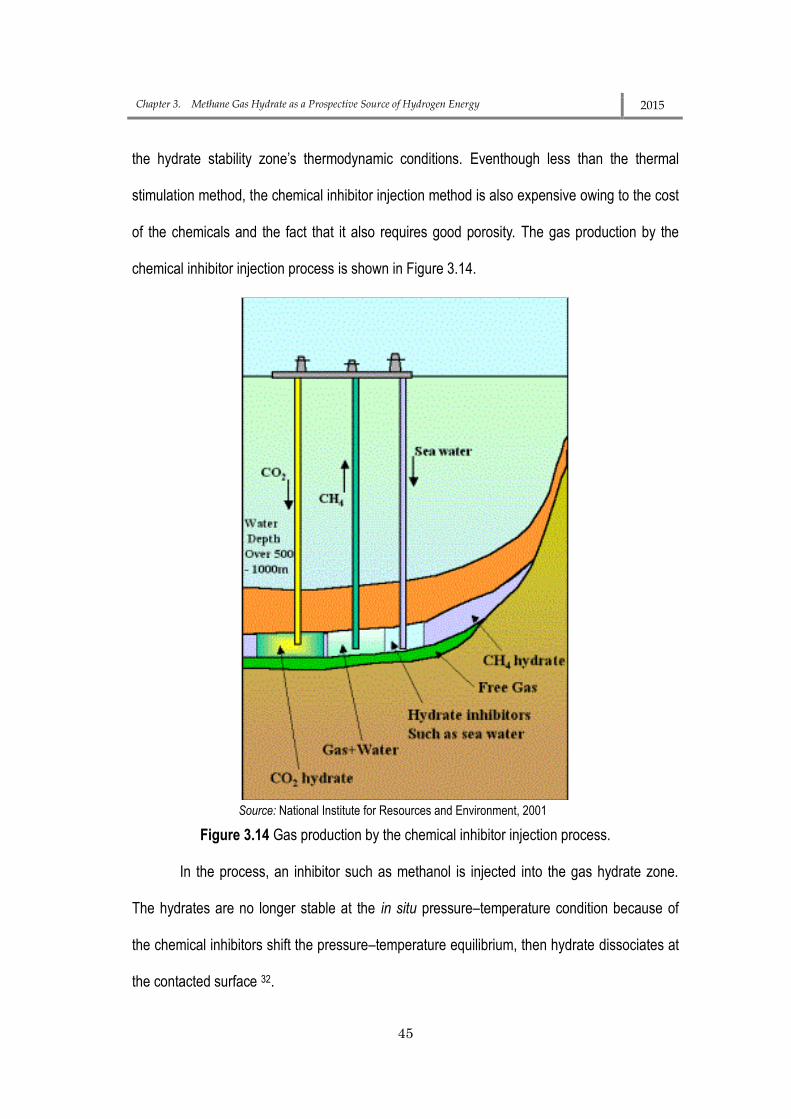
the hydrate stability zone’s thermodynamic conditions. Eventhough less than the thermal
stimulation method, the chemical inhibitor injection method is also expensive owing to the cost
of the chemicals and the fact that it also requires good porosity. The gas production by the
chemical inhibitor injection process is shown in Figure 3.14.
Source: National Institute for Resources and Environment, 2001
Figure 3.14 Gas production by the chemical inhibitor injection process.
In the process, an inhibitor such as methanol is injected into the gas hydrate zone.
The hydrates are no longer stable at the in situ pressure–temperature condition because of
the chemical inhibitors shift the pressure–temperature equilibrium, then hydrate dissociates at
the contacted surface 32.

Chapter 3. Methane Gas Hydrate as a Prospective Source of Hydrogen Energy 2015
46
Based on chemical concepts, there are two approaches for this method:
a. Chemical substitution, the process is conducted by substitute methane for carbon dioxide,
and recovering methane while sequestering carbon dioxide at the same time. The carbon
dioxide can be transported into contact with the methane hydrate in the gas phase, in the
liquid phase, or potentially dissolved in the circulating pore water 33,34; and
b. Chemical injection, where some chemicals are used as the inhibitors that depress
equilibrium conditions such as methanol, ethylene glycol, nitrogen, and salt brines. Their
injection causes hydrate dissolution and methane production; their effect is closely
connected with the imposed temperature difference 35–41.
3.6 Conclusion
Methane gas hydrates have an icelike crystalline lattice of water molecules with
methane molecules trapped inside. They can be formed in the presence of hydrocarbons in
equilibrium with liquid water at a certain temperature and pressure conditions. A single
cubic meter of methane hydrate may contain as much as 170 m3 of methane.
The methane in gas hydrates is dominantly produced by bacterial degradation of
organic substance in low-oxygen surroundings near the seafloor that are decomposing
organic sediments. Also, the methane could be originates from oil deposits deep within Earth
that leak to the seafloor bottom through faults and cracks.
Gas hydrates in general, can consist of any combination of three crystal structures
relating to the size of the guest molecule, i.e.: (a) structure I (sI), (b) structure II (sII), and (c)
structure H (sH). Some of typical gases such as CH4, CO2, and even cyclopentane as liquid
hydrocarbon become the “guest” molecules that trapped in a cage of water 3.

Chapter 3. Methane Gas Hydrate as a Prospective Source of Hydrogen Energy 2015
47
Three processes have been proposed for dissociation of methane hydrates: thermal
stimulation, depressurization, and inhibitor injection. Thus, it is possible to generate plasma
using high frequency stimulation of radio frequency and microwave irradiations in the hydrate
fields which are new exploration systems including a method for the reduction of the release
methane and CO2 into the atmosphere.
References
1. Ayhan Demirbas. Methane Gas Hydrate. (Springer, 2010). at <www.springer.com>
2. Lee, S.-Y. & Holder, G. D. Methane hydrates potential as a future energy source. Fuel Process. Technol. 71, 181–186 (2001).
3. Dendy Sloan, E. & Koh, C. Clathrate Hydrates of Natural Gases, Third Edition. 20074156, (CRC Press, 2007).
4. Ohmura, R., Shigetomi, T. & Mori, Y. H. Formation, growth and dissociation of clathrate hydrate crystals in liquid water in contact with a hydrophobic hydrate-forming liquid. J. Cryst. Growth 196, 164–173 (1999).
5. Hirai, H., Tanaka, T., Kawamura, T., Yamamoto, Y. & Yagi, T. Structural changes in gas hydrates and existence of a filled ice structure of methane hydrate above 40 GPa. J. Phys. Chem. Solids 65, 1555–1559 (2004).
6. Schicks, J. M., Erzinger, J. & Ziemann, M. a. Raman spectra of gas hydrates - Differences and analogies to ice 1h and (gas saturated) water. Spectrochimica Acta - Part A: Molecular and Biomolecular Spectroscopy 61, 2399–2403 (2005).
7. Sloan Jr, E. D. Fundamental principles and applications of natural gas hydrates. Nature 426, 353–363 (2003).
8. Zhang, Y., Debenedetti, P. G., Prud’homm, R. K. & Pethica, B. a. Differential Scanning Calorimetry Studies of Clathrate Hydrate Formation. J. Phys. Chem. B 108, 16717–16722 (2004).
9. Demirbas, A. Use of algae as biofuel sources. Energy Convers. Manag. 51, 2738–2749 (2010).

Chapter 3. Methane Gas Hydrate as a Prospective Source of Hydrogen Energy 2015
48
10. Kim, N.-J., Hwan Lee, J., Cho, Y. S. & Chun, W. Formation enhancement of methane hydrate for natural gas transport and storage. Energy 35, 2717–2722 (2010).
11. Rice, W. Hydrogen production from methane hydrate with sequestering of carbon dioxide. Int. J. Hydrogen Energy 31, 1955–1963 (2006).
12. Klauda, J. B. & Sandler, S. I. Global distribution of methane hydrate in ocean sediment. Energy and Fuels 19, 459–470 (2005).
13. Koh, C. a. Towards a fundamental understanding of natural gas hydrates. Chem. Soc. Rev. 31, 157–167 (2002).
14. Kanda, H. Economic study on natural gas transportation with natural gas hydrate (NGH) pellets. 23rd world gas Conf. Amsterdam (2006).
15. Stern, L. A. et al. Anomalous Preservation of Pure Methane Hydrate at 1 atm. J. Phys. Chem. B 1756–1762 (2001).
16. Giavarini, C. & Maccioni, F. Self-Preservation at Low Pressures of Methane Hydrates with Various Gas Contents. Ind. Eng. Chem. Res. 43, 6616–6621 (2004).
17. Zhong, D. L., Yang, C., Liu, D. P. & Wu, Z. M. Experimental investigation of methane hydrate formation on suspended water droplets. J. Cryst. Growth 327, 237–244 (2011).
18. Sun, Z., Ma, R., Fan, S., Guo, K. & Wang, R. Investigation on Gas Storage in Methane Hydrate. 13, 107–112 (2004).
19. Ganji, H., Manteghian, M., Sadaghiani zadeh, K., Omidkhah, M. R. & Rahimi Mofrad, H. Effect of different surfactants on methane hydrate formation rate, stability and storage capacity. Fuel 86, 434–441 (2007).
20. Kazunori Okutani, Kuwabara, Y. & Mori, Y. H. Surfactant effects on hydrate formation in an unstirred gas/liquid system: An experimental study using methane and micelle-forming surfactants. Chem. Eng. Sci. 73, 79–85 (2012).
21. Hao, W., Wang, J., Fan, S. & Hao, W. Study on methane hydration process in a semi-continuous stirred tank reactor. Energy Convers. Manag. 48, 954–960 (2007).
22. Mork, M., Gudmundsson, J. & Parlaktuna, M. Hydrate formation rate in a continuous stirred tank reactor. Interntional Gas Res. Conf. … 1–14 (2001).
23. Giavarini, C. & Maccioni, F. Production of concentrated methane hydrates in bulk, at medium pressure. J. Chem. Eng. Data 53, 2282–2287 (2008).
24. Kvenvolden, K. a. A review of the geochemistry of methane in natural gas hydrate. Org. Geochem. 23, 997–1008 (1995).

Chapter 3. Methane Gas Hydrate as a Prospective Source of Hydrogen Energy 2015
49
25. Moridis, G. J. et al. Numerical studies of gas production from several CH4 hydrate zones at the Mallik site, Mackenzie Delta, Canada. J. Pet. Sci. Eng. 43, 219–238 (2004).
26. Noiriel, C., Gouze, P. & Bernard, D. Investigation of porosity and permeability effects from microstructure changes during limestone dissolution. Geophys. Res. Lett. 31, 1–4 (2004).
27. Quispe, J. R., Rozas, R. E. & Toledo, P. G. Permeability-porosity relationship from a geometrical model of shrinking and lattice Boltzmann and Monte Carlo simulations of flow in two-dimensional pore networks. Chemical Engineering Journal 111, 225–236 (2005).
28. Max, M. D. & Cruickshank, M. J. Extraction of methane from oceanic hydrate system deposits. in Proceedings of the Annual Offshore Technology Conference 1, 71–78 (1999).
29. Dake, L. P. Fundamentals of Reservoir Engineering. Environmental science technology 42, (2008).
30. Ji, C., Ahmadi, G. & Smith, D. H. Natural gas production from hydrate decomposition by depressurization. Chem. Eng. Sci. 56, 5801–5814 (2001).
31. Khataniar, S., Kamath, V. a., Omenihu, S. D., Patil, S. L. & Dandekar, A. Y. Modelling and economic analysis of gas production from hydrates by depressurization method. Can. J. Chem. Eng. 80, 135–143 (2002).
32. Desa, E. Submarine methane hydrates-potential fuel resource of the 21st century. in Proc. of AP Akademi of Sciences 5, 101–114 (2001).
33. Park, Y. et al. Sequestering carbon dioxide into complex structures of naturally occurring gas hydrates. in Proceedings of the National Academy of Sciences of the United States of America 103, 12690–12694 (2006).
34. Ota, M., Abe, Y., Watanabe, M., Smith, R. L. & Inomata, H. Methane recovery from methane hydrate using pressurized CO2. Fluid Phase Equilib. 228-229, 553–559 (2005).
35. Jiten Chatterji & Griffith, J. E. Methods of Decomposing Gas Hydrates. (2003).
36. Graue, a et al. Magnetic Resonance Imaging of Methane — Carbon Dioxide Hydrate Reactions in Sandstone Pores. in SPE Annual Technical Conference and Exhibition 102915 (2006).

Chapter 3. Methane Gas Hydrate as a Prospective Source of Hydrogen Energy 2015
50
37. Kamath, V. a., Mutalik, P. N., Sira, J. H. & Patil, S. L. Experimental Study of Brine Injection Depressurization of Gas Hydrates Dissociation of Gas Hydrates. SPE Form. Eval. 6, (1991).
38. Østergaard, K. K., Masoudi, R., Tohidi, B., Danesh, A. & Todd, A. C. A general correlation for predicting the suppression of hydrate dissociation temperature in the presence of thermodynamic inhibitors. J. Pet. Sci. Eng. 48, 70–80 (2005).
39. Ota, M. et al. Replacement of CH4 in the hydrate by use of liquid CO 2. Energy Convers. Manag. 46, 1680–1691 (2005).
40. Sira, J. H., Patil, S. L. & Kamath, V. a. Study of hydrate dissociation by methanol and glycol injection. in Society of Petroleum Engineers (1990).
41. Yoon, J.-H., Kawamura, T., Yamamoto, Y. & Komai, T. Transformation of Methane Hydrate to Carbon Dioxide Hydrate: In Situ Raman Spectroscopic Observations. J. Phys. Chem. A 108, 5057–5059 (2004).
Chapter 4
Study on Plasma Properties in Pure Water and Seawater Under High Pressure by Radio Frequency
4.1 Introduction
Recently, interest has increased in plasma discharges in a liquid due to the potential
applications for various biological, environmental, medical, and energy technologies. In-liquid
plasma is a method that generated in the bubble and provides a chemical reaction field of the
high temperature. A number of study have been conducted on radio frequency plasma's
discharges, including plasma generation in water 1,2, high conductivity NaCl solution 3,
supercritical fluid 3,4, and methane hydrate 5,6 to name a few.
In recent years, proposed in-liquid plasma method have projected to decompose
methane hydrate for producing hydrogen as a promising energy source. Methane hydrate
resources are accumulated in ocean-bottom sediments where water depth exceeds about 400

Chapter4. Study on plasma properties in pure water and seawater under high pressure by radio frequency 2015
52
meters at a low temperature and high pressure. For this reason, it becomes essential to
generate a stable plasma in seawater under the high pressure. Discharge in seawater is very
hard and require considerable high voltage. Plasma had been generated in sea water with 5
kW power using fourth-generation plasma reactor and plasma air flotation with 1.2 kW of
power 7,8. There are some studies informed about plasma generation in atmospheric pressure
5,9–11, however, only limited have been investigated under high pressure.
In this study, plasma properties in pure water and artificial seawater under high
pressure are investigated using high frequency of 27.12 MHz. Plasma was maintained in a
pure water, and in synthetic seawater. The excitation temperature and OH temperature were
measured using spectroscope Hamamatsu Photonic PMA-11 and Ocean optics HR4000. In
addition, behavior of air bubbles in pure water and artificial seawater with pressure change
was observed with a high-speed video camera 3-15 with frame rate of 500 fps.
4.2 Experimental Apparatus
4.2.1 Plasma generation under high pressure condition.
Figure 4.1 shows a schematic diagram of the experimental apparatus for plasma
generation. A reaction vessel is made from SUS steel with an inner diameter of 63.3 mm and
provided with two observation windows made of a transparent quartz glass. A 3 mm of
tungsten rod with a sharpened tip with 1.5 mm of thickness was inserted into a quartz tube
with outer diameter of 6 mm as an electrode. A 12.5 mm copper tube used as a counter
electrode was placed 20 mm away from the coaxial electrode.

Chapter4. Study on plasma properties in pure water and seawater under high pressure by radio frequency 2015
53
Fig. 4.1 In-liquid plasma reactor of high pressure
A 520 ml of pure water and artificial sea water was filled into the reactor vessel.
Electricity was supplied from high-frequency power (27.12 MHz). By adjusting the reflection,
plasma was generated at the tip of the electrode in an input power range from 250W to 500W.
After plasma was generated under reduced pressure in 10 kPa, then the pressure gradually
increasing to 300 kPa in pure water and 600 kPa in seawater.
4.3 Result and Discussions
4.3.1 Emission spectrum of the plasma
An emission spectrum of the plasma was measured using a spectroscope
(Hamamatsu Photonics PMA-11) and the spectrum is shown in Fig.4.2. The peak of Hα, Hβ,
OH, O (777nm), O (845nm) is detected in pure water as shown in Fig. 4.2(a). The excitation
temperature from the emission of light ratio of Hα and Hβ was calculated using Boltzmann plot

Chapter4. Study on plasma properties in pure water and seawater under high pressure by radio frequency 2015
54
(a)
(b)
distribution.
Fig. 4.2 Spectrum of plasma at 300 kPa in pure water (a), artificial seawater (b)
Fig. 4.2(b) shows the plasma emission spectrum in artificial seawater obtained in the
same manner as in pure water. Since the light of Na is strong, it was not able to calculate the
exicitation temperature because Hα and Hβ become difficult to detect accurately. Therefore,
200 400 600 8000
2000
4000
6000
wavelength (nm)
inte
nsi
ty
OH
O(777)
O(845)
H
H
200 400 600 8000
10000
20000
wavelength (nm)
inte
nsi
ty
Na(498)
Na(569)
Na(819)
OH
H
H
Na(589)

Chapter4. Study on plasma properties in pure water and seawater under high pressure by radio frequency 2015
55
using Botlzman plot method, the excitation temperature of plasma in the artificial seawater
was found using three emission spectra of Na: 498 nm, 569 nm and 819 nm.
Plasma was increased to 300 kPa and maintained in the artificial seawater. The
emission spectrum of plasma was measured using a spectroscope (Ocean optics HR4000) as
displayed in figure 4.4. The OH temperature of pure water and artificial seawater was obtained
from the emission spectrum with AΣ-XΠ of OH radicals by comparing the peak ratio of Q2-
branch (309nm) and R1-branch in the emission spectrum with a LIFBASE a spectrum
simulation software (306nm).
Fig. 4.4 Comparison of the spectra of OH radicals obtained from experiment and calculation.
0
50
100 calculation(3065K)Q2(309)
R1(306)
wavelength(nm)
inte
nsi
ty
experiment300kPa sea waterR1(306)
Q2(309)
306 308 310 312 3140
50
100

Chapter4. Study on plasma properties in pure water and seawater under high pressure by radio frequency 2015
56
4.3.2 Measurement of excitation temperature
Figure 4.5 shows the relation between the excitation temperature of the plasma in
pure water and artificial seawater. As the pressure increase from 10 kPa to 300 kPa, the
excitation temperature of the pure water was decreased from 4800K to about 3500K ,
whereas in artificial seawater, the decreased trend also observed from 3300K to about 2300K.
Both excitation temperatures were decreased to pressure changes. It is considered that the
emission spectrum in plasma affected by the microscopic electric fields from the surrounding
ions and electrons. The electron kinetic energy in the number of collisions becomes larger as
the pressure increases. Furthermore, it was recognized that the excitation temperature in pure
water was higher than that was in seawater under the same pressure. Due to the excitation
temperature in the artificial seawater was found using three emission spectra of Na, which
was easier to detect at lower temperature than emission spectra of Hα and Hβ in pure water.
Fig. 4.5 Correlation of excitation temperature and pressure.
0 0.1 0.2 0.3
2000
3000
4000
5000
Ex
cita
tio
n T
emp
erat
ure
[K]
Pressure[MPa]
watersea water
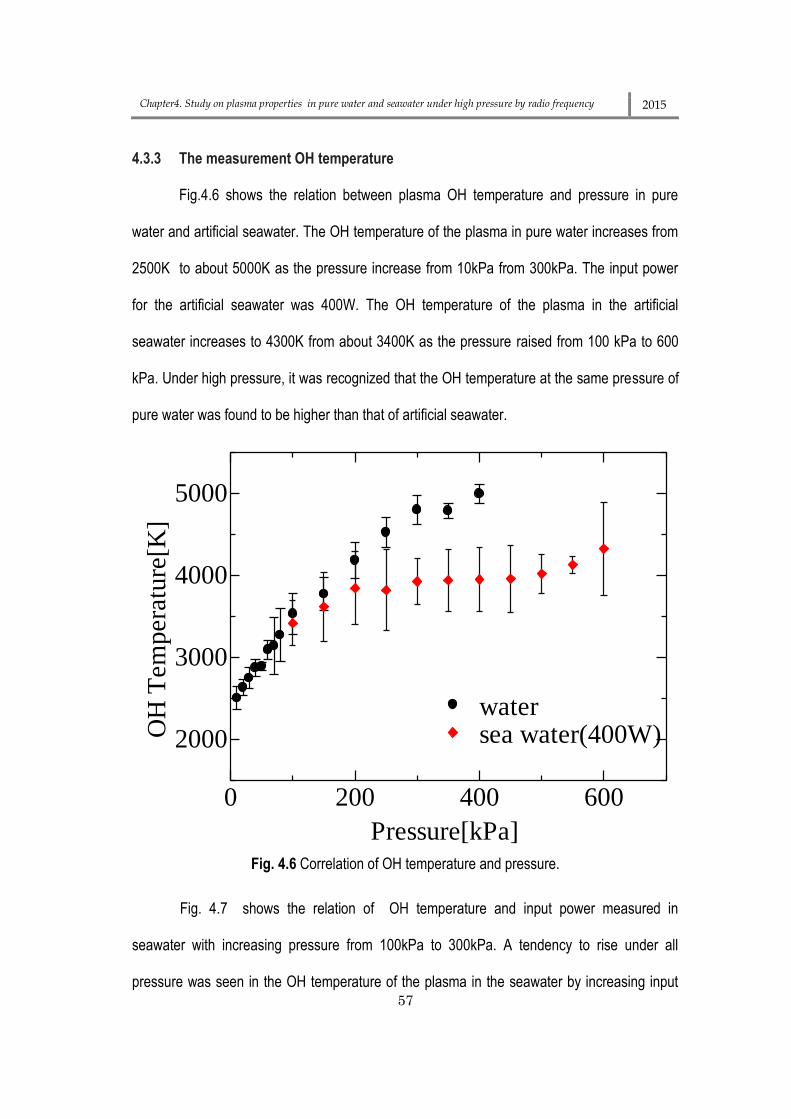
Chapter4. Study on plasma properties in pure water and seawater under high pressure by radio frequency 2015
57
4.3.3 The measurement OH temperature
Fig.4.6 shows the relation between plasma OH temperature and pressure in pure
water and artificial seawater. The OH temperature of the plasma in pure water increases from
2500K to about 5000K as the pressure increase from 10kPa from 300kPa. The input power
for the artificial seawater was 400W. The OH temperature of the plasma in the artificial
seawater increases to 4300K from about 3400K as the pressure raised from 100 kPa to 600
kPa. Under high pressure, it was recognized that the OH temperature at the same pressure of
pure water was found to be higher than that of artificial seawater.
Fig. 4.6 Correlation of OH temperature and pressure.
Fig. 4.7 shows the relation of OH temperature and input power measured in
seawater with increasing pressure from 100kPa to 300kPa. A tendency to rise under all
pressure was seen in the OH temperature of the plasma in the seawater by increasing input
0 200 400 600
2000
3000
4000
5000
watersea water(400W)
Pressure[kPa]
OH
Tem
pera
ture
[K]

Chapter4. Study on plasma properties in pure water and seawater under high pressure by radio frequency 2015
58
power from 250W to 500W. Furthermore, it should be noted that artificial seawater is to be
able to maintain plasma under high pressure in a wide input power range. On the other hand,
in the case of the pure water, it was not possible to maintain the plasma unless given more
power about 100W higher than that applied for seawater.
Fig. 4.7 Relation between OH temperature and input power.
4.3.4 Relations between departure frequency and bubble departure diameter
The behavior of the bubbles that occurs during plasma generation was observed
using a high-speed video camera. Figure 4.8 shows the state of plasma and the bubble of
pure water and artificial seawater at 300 kPa of pressure. Both bubbles were repeated growth
and departure, but the plasma of pure water is growing elongated from the electrode surface
and the other part in the electrode surface was remained covered. On the other hand, most of
200 300 400 500
3000
4000
5000
100kPa 200kPa 300kPa
sea water
Power[W]
OH
tem
pera
ture
[K]

Chapter4. Study on plasma properties in pure water and seawater under high pressure by radio frequency 2015
59
the states of plasma generated in artificial seawater repeated growth and separate with air
bubbles and covering the whole electrode. However, this phenomena also seen in pure water
when the pressure is low. The change of the air bubble shape was occured if the pressure
was increased immediately. Such a change was not observed in seawater.
Fig. 4.8 Plasma and bubble in pure water (upper) and artificial seawater (lower)
In addition, the spread sideways of bubbles grows in artificial seawater was seen. It is
believed that this is because gas was formed by more chemical reactions than that in the pure

Chapter4. Study on plasma properties in pure water and seawater under high pressure by radio frequency 2015
60
water. At the atmospheric pressure, the same tendency also reported by Maehara et.al. The
bubbles surrounding the plasma become slightly larger in NaCl solution rather than pure water
4. Figure 4.9 shows the relation between the departure frequency of the bubble and the bubble
departure diameter. Where 1/f expresses the time from the generation of bubble on an
electrode to the departure of bubble from the electrode and d expresses the diameter of the
bubble at the time of departure. Both the bubble departure diameter and time decrease as the
pressure increases. Moreover, bubble diameter in the artificial seawater is larger than that in
pure water under all pressure.
Fig. 4.9 Relations between departure frequency and bubble departure diameter
0.02 0.03
7
8
9
100kPa150kPa200kPa250kPa300kPa
d(m
m)
1/f(s)
pure waterf·d
2.32 = 4.17(mm
2.32/ms)
sea waterf·d
1.80 = 1.82 (mm
1.80/ms)

Chapter4. Study on plasma properties in pure water and seawater under high pressure by radio frequency 2015
61
4.4 Conclusion
Plasma was generated under high pressure in pure water and artificial seawater.
Along with the increase in pressure from 10 kPa to 300 kPa, excitation temperature decreased
about 4800K to 3500K in pure water and 3300K to 2300K in seawater. The OH temperature
is increased about 2500K to 5000K in pure water and 3400K to 4300K in artificial seawater.
Under the same conditions, both bubble departure time and bubble departure diameter in
artificial seawater was larger than that in pure water.
References
1. Nomura, S. et al. Discharge Characteristics of Microwave and High-Frequency In-Liquid Plasma in Water. Appl. Phys. Express 1, 046002 (2008).
2. Maehara, T. et al. Radio Frequency Plasma in Water. Jpn. J. Appl. Phys. 45, 8864–8868 (2006).
3. Amano, T. et al. Generation of Radio Frequency Plasma in High-Conductivity NaCl Solution. Jpn. J. Appl. Phys. 51, (2012).
4. Maehara, T. et al. Influence of conductivity on the generation of a radio frequency plasma surrounded by bubbles in water. Plasma Sources Sci. Technol. 20, 034016 (2011).
5. Putra, A. E. E., Nomura, S., Mukasa, S. & Toyota, H. Hydrogen production by radio frequency plasma stimulation in methane hydrate at atmospheric pressure. Int. J. Hydrogen Energy 37, 16000–16005 (2012).
6. Putra, A. E. E., Nomura, S., Mukasa, S. & Toyota, H. HYDROGEN PRODUCTION BY REFORMING CLATHRATE HYDRATES USING THE IN-LIQUID. in 11 th International Conference on Sustainable Energy technologies (SET-2012) (2012).
7. Ryu, S. M. et al. Characteristics of discharged sea water generated by underwater plasma system. Curr. Appl. Phys. 11, S87–S93 (2011).
8. Ryu, S., Hong, E., Park, J., Yoo, S. & Lho, T. The study on the particle separation and disinfection using plasma air flotation system. Int. J. Plasma Environ. Sci. Technol. 6,

Chapter4. Study on plasma properties in pure water and seawater under high pressure by radio frequency 2015
62
1–4 (2012).
9. Mishra, L. N., Shibata, K., Ito, H., Yugami, N. & Nishida, Y. Characterization of pulsed discharge plasma at atmospheric pressure. Surf. Coatings Technol. 201, 6101–6104 (2007).
10. Jasiński, M., Dors, M. & Mizeraczyk, J. Production of hydrogen via methane reforming using atmospheric pressure microwave plasma. J. Power Sources 181, 41–45 (2008).
11. Wang, Y. F., You, Y. S., Tsai, C. H. & Wang, L. C. Production of hydrogen by plasma-reforming of methanol. Int. J. Hydrogen Energy 35, 9637–9640 (2010).

Chapter 5
Decomposition of Methane Hydrate for Hydrogen Production by the In-liquid Plasma
Methods
5.1 Introduction
Hydrogen seems to be one of the mainly promising energy vectors since it is
considered to be environmentally friendly and has a high-energy efficiency characteristic, as
well. The total of energy yielded during hydrogen combustion is higher than any other fuel 1,2.
Consequently, hydrogen production for energy source has been explored recently, which is
several methods have been conducted such as water electrolysis 3, steam reforming for fossil
fuels 3,4, ethanol and methanol reforming 2,5, clathrate hydrate reforming 6, multi-generation of
energy production system 4,7, conversion of hydrocarbons by microwave plasma or
conventional microwave oven 8–10, radio frequency plasma stimulation 11, etc.
Furthermore, Methane hydrate has increasingly become one of the prospective
energy resources due to its abundance and methane content 12, including its potential role in
Chapter 5. Decomposition of Methane Hydrate for Hydrogen Production by The In-liquid Plasma Methods 2015
64
global climate change 13,14. It is formed by constituent molecules (i.e. CH4) held in under the
cavities of lattice water that occurs via an exothermic reaction under the proper combination of
pressure and temperature 15. Methane hydrate is an untapped source of hydrocarbon energy 16,
which is believed to be both plentiful and stable on the seabed and in permafrost at high
pressure and low temperature 10,12,17. The amount of energy held in methane hydrate in the
subsea could possibly be as much or even more than twice that of the entire energy reserves
of the various fossil fuels on Earth 12. Its considerable C : H ratio and availability make it an
attractive energy source for producing hydrogen and could be preferable to the currently most
commonly used mode of hydrogen production, steam methane reforming (SMR), which in
commercial application supplies from 80 to 85% of the world’s need for hydrogen 14.
Investigation into methane hydrate has increased over the last several years. Many
governments, including those of the USA, Canada, Russia, India, and Japan have become
concerned about the possibilities of methane hydrate 12,13. In the process of investigating
methane hydrate as an alternative potential source of hydrogen energy, a significant number
of methods for extracting hydrogen through methane hydrate decomposition has been
recommended and developed. Methane hydrate has a pressure phase equilibrium of 2.3 MPa
at 0 oC and consists of ice – liquid water – hydrate 12,16. It has been exploited for the recovery
from natural gas through the dissociation process. One of the hydrate dissociation processes is
one involving heating hydrate fields through thermal stimulation to a temperature above the
hydrate equilibrium temperature. This method is typically employed by injecting hot water (steam
and hot brine) into the hydrate field. Unfortunately, this method involves high production costs
due to the high-energy losses during injection process 13,16. On the other hand, the use of high-
frequency waves irradiated directly into the hydrate field can prove to be more rapid and

Chapter 5. Decomposition of Methane Hydrate for Hydrogen Production by The In-liquid Plasma Methods 2015
65
effective than the hot-water injection 10.
Besides, the radio frequency wave or microwave in-liquid plasma method use a
technology in which plasma is generated inside bubbles within a liquid and a high-temperature
chemical reaction field 2,18–20. The temperatures of the plasma exceed 3000 K at the
atmospheric pressure 21. The in-liquid plasma has been employed for decomposition of waste
oils or hydrocarbon liquids and can generate hydrogen gas and carbon particles
simultaneously 9. MW plasma, commonly used in microwave ovens, diamond depositions and
IC manufacturing, have the advantages of simple and low-priced operation, high plasma
density and high electron mean energy 2,22. When 2.45 GHz of microwave plasma is
generated in hydrocarbon liquids, hydrogen gas with a purity of 66% - 80% can be produced,
which means that the energy efficiency of hydrogen production with this method is estimated
to be 56% over that by electrolysis of alkaline water for the same power consumption 9,22. On
the other hand, radio frequency (RF) plasma irradiation could easily be used to generate the
plasma in water under high pressure 21. The energy consumption required to produce
hydrogen, oxygen, and hydrogen peroxide from water under atmospheric pressure being 0.4%
of 150W of Radio frequency input power 11. This means that RF plasma could be generated at
a lower power than microwave plasma in water. Thus, it is feasible to use RF irradiation for
methane hydrate decomposition from hydrate fields as a foreseeable method of hydrogen
production by plasma stimulation.
In the present study, decomposition of methane hydrate at the atmospheric pressure by
radio frequency wave (RF) and microwave (MW) plasma is conducted to compare the attributes
of these two methods. This becomes a first step in the process with the ultimate goal of
producing hydrogen from hydrate fields using an in-liquid plasma method as shown in Figure 5.1.

Chapter 5. Decomposition of Methane Hydrate for Hydrogen Production by The In-liquid Plasma Methods 2015
66
Source: Ruppel, Nature knowledege, Hydrates/climate, April 2011.
Fig. 5.1 Process of hydrogen production from hydrate fields in the subsea by the in-liquid plasma method
The in-liquid plasma method is simply generated through a high localized temperature
at high pressure where the plasma remains mostly around the tip of the electrode 6. This is what
makes this method to be considered as ideal for this purpose. During the initial process of
plasma generation in methane hydrate, the hydrate would melt from a solid phase straight into
fluid phase, hence, the plasma occurring in methane hydrate can be considered as the in-liquid
plasma.
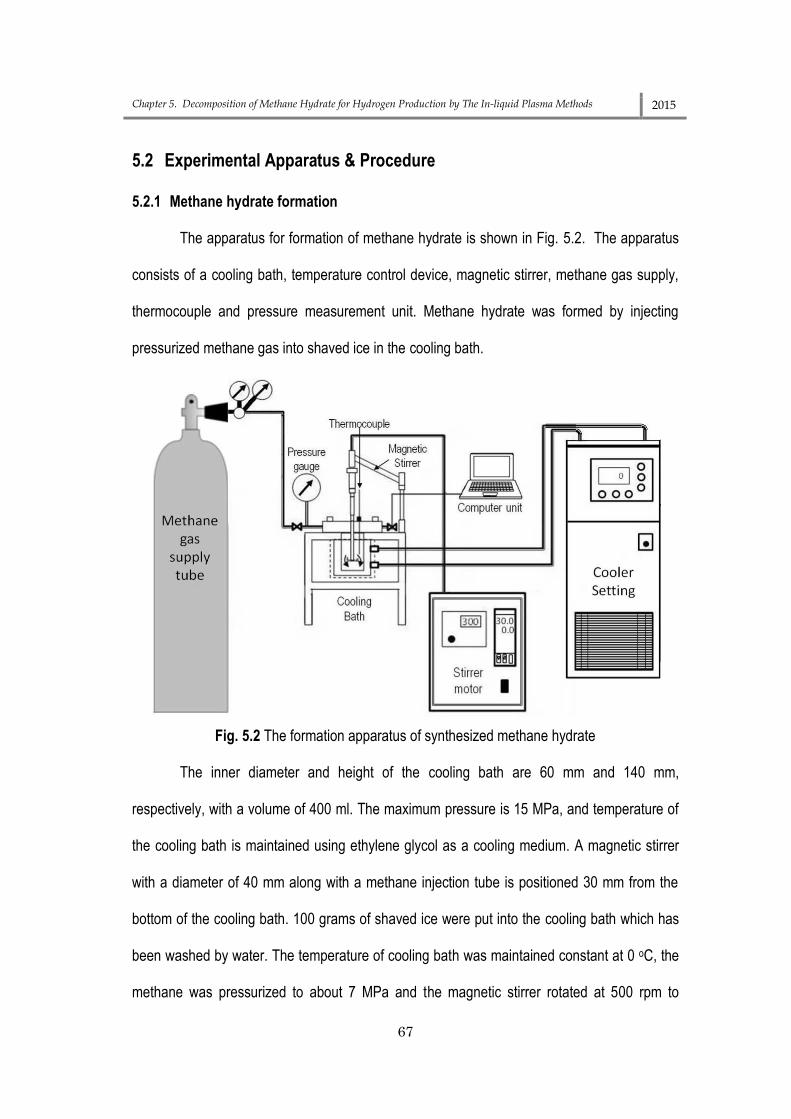
Chapter 5. Decomposition of Methane Hydrate for Hydrogen Production by The In-liquid Plasma Methods 2015
67
5.2 Experimental Apparatus & Procedure
5.2.1 Methane hydrate formation
The apparatus for formation of methane hydrate is shown in Fig. 5.2. The apparatus
consists of a cooling bath, temperature control device, magnetic stirrer, methane gas supply,
thermocouple and pressure measurement unit. Methane hydrate was formed by injecting
pressurized methane gas into shaved ice in the cooling bath.
Fig. 5.2 The formation apparatus of synthesized methane hydrate
The inner diameter and height of the cooling bath are 60 mm and 140 mm,
respectively, with a volume of 400 ml. The maximum pressure is 15 MPa, and temperature of
the cooling bath is maintained using ethylene glycol as a cooling medium. A magnetic stirrer
with a diameter of 40 mm along with a methane injection tube is positioned 30 mm from the
bottom of the cooling bath. 100 grams of shaved ice were put into the cooling bath which has
been washed by water. The temperature of cooling bath was maintained constant at 0 oC, the
methane was pressurized to about 7 MPa and the magnetic stirrer rotated at 500 rpm to

Chapter 5. Decomposition of Methane Hydrate for Hydrogen Production by The In-liquid Plasma Methods 2015
68
agitate the solution of methane gas and shaved ice. The temperature of methane hydrate
formation was recorded by a thermocouple at 30 mm from the bottom of the cooling bath,
while the pressure drop was recorded by a camera connected to a computer unit. Pressure
and temperature throughout the process were recorded every 15 minutes.
During the formation process of methane hydrate, there was a corresponding
increase in temperature to approximately 6 oC. The process then performed continuously as
the ice melted. The remainder of the ice melted to create hydrates when the cooling bath
temperature changed to 2 oC and the stirrer was turned off 6. Pressurization with methane to 7
MPa was conducted in several times 15. After the entire process was completed, and the
pressure was constant at 7 MPa. It then rapidly decreased to atmospheric pressure with the
extra cooling by the refrigerator. The further cooling is necessary to prevent hydrate
dissociation 23.
5.2.2 Decomposition of methane hydrate by radio frequency plasma .
The primary unit of the experimental apparatus for RF plasma decomposition is
shown in Fig. 5.3. A radio frequency plasma with a frequency of 27.12 MHz was used to
decompose methane hydrate. Argon gas was injected into the reactor vessel to expel air
before plasma generation at the electrode tip and methane hydrate was decomposed in the
reactor vessel at the atmospheric pressure. An electrode made of a 2 mm tungsten rod
protruded from a ceramic tube used as a dielectric substance 10 mm in length with an outer
diameter of 6 mm and 1.5 mm thickness was inserted in the reactor through the bottom and
connected to a unit of power source (T161-5766LQ, Thamway) via a matching box (T020-
5766M).

Chapter 5. Decomposition of Methane Hydrate for Hydrogen Production by The In-liquid Plasma Methods 2015
69
Fig. 5.3 Experimental apparatus using RF plasma decomposition.
A copper tube was inserted from the top of the reactor to a distance of 4 mm from the
lower electrode that functioned both as a counter electrode and a gas exhaust outlet. 10
grams of methane hydrate were put into the reactor vessel. The RF input power was set to
range of 300 - 350W at atmospheric pressure. The net power values were calculated by
subtraction of the reflected power from the forward power. The reflected power was
maintained constant at the lowest value possible.
5.2.3 Plasma decomposition from methane hydrate using microwave oven
A conventional microwave oven was utilized as the microwave power source for
generating the plasma with the antennas positioned facing downwards as shown in Fig. 5.4.
10 grams of methane hydrate were inserted under the tips of the antennas inside the reactor
vessel. The reactor vessel was irradiated by microwaves from a 700W magnetron with the
antennas receiving 2.45 GHz of microwaves at which point plasma was generated at the tip of
each antenna.

Chapter 5. Decomposition of Methane Hydrate for Hydrogen Production by The In-liquid Plasma Methods 2015
70
In order to prevent the microwave energy from being absorbed by components inside
the reactor such as the reaction vessel, the reactor platform, and piping were made using
heat-resistant glass and silicone rubber, also the antenna unit was installed on a Teflon® base
so that the reactor vessel would not be damaged by the heat generated by the plasma 6. The
electrode tips protrude from the surface of methane hydrate solution, and plasma starts
generating the fluid-phase. The gas produced was collected by the downward displacement of
water expelling it from the pipe mounted on the top of the device and connected to the reactor
vessel, and then extracted using a syringe. The reactor was filled with methane hydrate with
argon (Ar) gas induced into the piping to extract the exhaust. In this circumstances, MW
irradiation was applied and plasma generated. Approximately 1000 ml of generated gas was
recovered using the water displacement method.
A Shimadzu 8A gas chromatograph was applied with a column temperature 60oC to
160oC (hold 6 minutes) by using argon as the carrier gas to identify the content of exhaust
gases from both the RF and the MW plasma methods.
Fig. 5.4 Experimental apparatus for plasma generation using the microwave oven

Chapter 5. Decomposition of Methane Hydrate for Hydrogen Production by The In-liquid Plasma Methods 2015
71
5.3 Results and Discussion
Methane hydrate has a cubic structure I (sI) with a unit cell formula of
6(51262).2(512).46H2O 12,14,15,17. The basic formula for a methane hydrate is CH4.nH2O, where
n is the stoichiometric number or hydrate number which describes a variable number of water
molecules within the lattice structure of methane hydrate. Based on the pressure condition of
1.9-9.7 MPa and the formation temperature of 253-285 K, the sample of synthetic methane
hydrate used for this experiment had a Hydrate number (n) = 5.81 - 6.10 H2O with an average
of CH4.5.99 (±0.07) H2O 24. Methane hydrate began forming rapidly in the cooling bath after
the stirrer was activated. Due to the exothermic reaction, there was a concurrent pressure
decrease to about 5.6 MPa and temperature increase to around 2 oC as shown in Fig. 5.5.
Fig. 5.5 Pressure & temperature along methane hydrate formation.
Methane hydrate was then decomposed during the plasma irradiation into the product
gases which were hydrogen (H2) and carbon monoxide (CO) as the main products, and
carbon dioxide (CO), methane (CH4), carbon (C), and hydrocarbon (CxHy) as byproducts 2, the
same composition was also reported by Nomura et. al 3.

Chapter 5. Decomposition of Methane Hydrate for Hydrogen Production by The In-liquid Plasma Methods 2015
72
Some amounts of carbon black appear were fairly well available to methane
molecules during the decomposition 1,9. Hence, carbon was found attached to the reactor
walls, antennas and counter electrodes. Furthermore, decomposition of methane hydrate at
the copper interface of the antenna of the microwave oven was followed by dissolution of
carbon to metal and dispersing through the particle. The carbon then precipitated by the
copper–support interface of the antenna. The condition of the antennas before and after
methane hydrate decomposition using MW plasma is shown in Fig. 5.6.
Fig. 5.6 Condition of antennas/electrodes before and after methane hydrate decomposition
The results of the plasma decomposition of methane hydrate showed that there was
substantial methane content in the product gases from unconverted methane release, as can
be seen in Fig. 5.7, the product gas contained about 36% of CH4 when the methane hydrate
decomposition was conducted by the MW plasma method and 17.3% by the RF plasma
method at an input power of 330W and 20% from n-dodecane by the MW plasma method in
previous experimentation by Nomura et al 9.

Chapter 5. Decomposition of Methane Hydrate for Hydrogen Production by The In-liquid Plasma Methods 2015
73
Fig. 5.7 Content of product gases from methane hydrate decomposition.
The electromagnetic wave from microwave oven principally has three basic
properties; its wave will be reflected by metal material such as steel or iron, able to penetrate
a non-metallic material with no heat transfer 1, and the considerable one that it is easily
absorbed by water. This typical wave of MW oven radiation can transport enough energy to
heat water by the commission of molecules lead to the enhancement of the overall
temperature inside, and finally resulted the water turns into steam 10. Thus, it was
hypothesized that some portions of water & methane from the reaction of methane hydrate
dissociation were vaporized through the liquid and rose up without passing the plasma
decomposition process for producing hydrogen. This became the main reason of a significant
methane content in the product gases from the unconverted methane release of that by MW
oven, which was more than twice of that from the RF plasma method.
It took 60 seconds to collect 60 mL of the generated gas from methane hydrate
decomposition by the RF plasma method. However, it took 60 seconds to collect 1100 mL of

Chapter 5. Decomposition of Methane Hydrate for Hydrogen Production by The In-liquid Plasma Methods 2015
74
generated gas by the MW plasma method. The result of gas chromatography analysis of the
recovered gas is shown in Table 5.1 with the addition of the recovered gas results of n-
dodecane from previous experiment for comparison.
Table 5.I Content of the gas generated by the RF plasma and the MW plasma.
H2% CO% CH4% CO2% C2H2% C2H4%
MH/RF Plasma 64.2 4.5 28.8 0.5 0.2 0.1
MH/MW Plasma 42.1 3.3 48.6 0.5 5.0 0.4
n-Dodecane/MW Plasma 9 74.0 0.0 2.0 0.0 20.0 2.0
The entirety of the reactions can be expressed by the following:
CH4.nH2O → x(aH2+bCO+cCO2+dCH4+eC2H2+fC2H4) + yC(s) + zH2O (5.1)
Where, a, b, c, e, f are the content ratios of product gases as shown in Table 5.1.
x = 2/(a – b – 2c + 2d + e + 2f) (5.2)
y = (a – 3b – 4c – 3e – 2f)/(a – b – 2c + 2d + e + 2f) (5.3)
and
z = n - 2(b + 2c)/(a – b – 2c + 2d + e + 2f) (5.4)
The chemical reaction of plasma decomposition of methane hydrate which shown in Eq.
(5.1) is based on methane hydrate dissociation (MHD), steam methane reforming (SMR) and
methane cracking reaction (MCR) 11. At the beginning of the MHD reaction, CH4 and water were
produced, then the SMR and the MCR reactions simultaneously decompose the released CH4
into H2, CO and other byproducts. The water that turns into steam by the plasma reacted with
the CH4 to produce H2, CO and CO2 through the SMR process 11. The reaction equation and
enthalpies concerned with MHD, SMR and MCR are shown in Table 5.2.

Chapter 5. Decomposition of Methane Hydrate for Hydrogen Production by The In-liquid Plasma Methods 2015
75
Table 5.2 Basic reactions of methane hydrate decomposition
Reactions Category ΔH (kJ/mol)
CH46H2O CH4 + 6H2O (l) Methane Hydrate Dissociation 53.5 25
CH4 + H2O 3H2 + CO Steam Methane Reforming 206.16
CO + H2O H2 + CO2 Steam Methane Reforming -41.2
CH4 2H2 + C (s) Methane Cracking Reaction 1 74.87
2CH4 3H2 + C2H2 Methane Cracking Reaction 376.47
2CH4 2H2 + C2H4 Methane Cracking Reaction 202.21
The molarity of these mixed of product gases is expressed as ngas and becomes :
From MH/RF plasma decomposition :
→ a = nH2 = 0.642 . ngas (5.5)
b = nCO = 0.045 . ngas (5.6)
c = nCO2 = 0.005 . ngas (5.7)
d = nCH4 = 0.287 . ngas (5.8)
e = nC2H2 = 0.002 . ngas (5.9)
f = nC2H4 = 0.0006 . ngas (5.10)
The enthalpy of formation per 1 mole of methane hydrate by the reaction can be
determined whether the chemical reaction formulas in Table 5.2 are substituted in Eq. (5.1).
Accordingly,
x[a∆H(H2) + b∆H(CO) + c∆H(CO2) + d∆H(CH4) + e∆H(C2H2)
+ f∆H(C2H4)] + z∆H(H2O) – ∆H(MH) = 369 kJ/mol (5.11)
was obtained. With the same calculation, enthalpy of formation for MW plasma method was 368
kJ/mol. A positive enthalpy of formation indicates an endothermic reaction which energy input
was required 1. Through methane hydrate decomposition by the RF plasma method, it was
found that enthalpy of formation per 1 liter of gas in the reaction in Eq. (5.1) was 9.73 kJ/L. In
the same way, up to 11.46 kJ/L was obtained by the MW plasma method.

Chapter 5. Decomposition of Methane Hydrate for Hydrogen Production by The In-liquid Plasma Methods 2015
76
In this experiment, the power consumption to decompose methane hydrate by the RF
plasma method was 327.5W for an irradiation time of 60 seconds to produce 54 mL of gas.
Whereas the MW plasma method consumed 700 W of gas and took 48 seconds to produce
550 mL of gas. If the energy is converted into a unit per liter gas ratio, it was found to be 401.5
kJ/L for the RF plasma method and 65.8 kJ/L for the MW plasma method. As a result, the
amount of energy required to generate 1 mole of H2 for both plasma methods was found to be
12.7 MJ/mol (= (327.5 W)×(60 s)×(22.4 L/mol)/(0.054×0.642 L)) and 4.1 MJ/mol (= (700
W)×(60 s)×(22.4 L/mol)/(0.55×0.421 L) ), respectively.
Besides, advance analysis showed that during methane hydrate decomposition by the
MW plasma method, the formation of acetylene was a main factor for the energy expansion.
The enthalpy of formation of acetylene is 376.47 kJ/mol as shown in Table 5.2, which has a
higher than that of other substances. Besides, It can be seen from the data in Table 5.1 that
the percentage of acetylene in the gas content was up to 5.1% which is higher than that from
methane hydrate decomposition by the RF plasma method. In this case, it is required to
define reaction conditions that inhibit the formation of acetylene in the process of hydrogen
production 6.
The CH4 conversion rate was affected by the rate of methane hydrate dissociation.
This methane rate was assumed to be equal to the gas production rate. The total CH4
conversion ratio was calculated using equation (13) 11 :
CH4 conversion ratio = [(𝐶𝐻4)𝑟𝑒𝑎𝑐𝑡𝑎𝑛𝑡−(𝐶𝐻4)𝑝𝑟𝑜𝑑𝑢𝑐𝑡
(𝐶𝐻4)𝑟𝑒𝑎𝑐𝑡𝑎𝑛𝑡] 𝑥 100 (5.12)
(CH4)reactant was determined by the mole of CH4 trapped in 10 g of methane hydrate, and
(CH4)product was the mole of CH4 content in the product gases. Referring to the hydrate number

Chapter 5. Decomposition of Methane Hydrate for Hydrogen Production by The In-liquid Plasma Methods 2015
77
(n) = 6.0 6, the amount of CH4 trapped in 10 g of methane hydrate is thought to be 0.0806
mole.
The actual CH4 content in the product gases was 0.0115 mole for the MW plasma
method and 0.00069 mole for the RF plasma method. Subsequently, it can be seen from Fig.
5.8 that the total CH4 conversion ratio tended to decrease with the increasing of the H2 content
of product gases for both plasma decomposition methods, comparable trend also occurred for
CO content of product gas.
H2 selectivity was determined by the number of H atoms in the H2 content of the
product gases, divided by the total of H atoms in the converted reactant 11. Likewise, H2 yield
is the number of H atoms in the H2 content of the product gases, divided by the total of H
atoms in the reactant. Fig. 5.9 shows that the selectivity & yield of H2 by MW method tends to
increase by the rise of the gas production rate. Meanwhile, the selectivity & yield of H2 by RF
method tended to increase in slow rate of gas production, but it tended to decrease in fast rate.
The H2 energetic mass yield for the RF plasma method was up to 0.6 g[H2]/kWh with
a CH4 conversion ratio of 99.1% (Figure 5.8), while for the MW plasma method, it was equal to
2.6 g[H2]/kWh with a CH4 conversion ratio of 85.8% as shown in Fig. 5.9. In general, therefore,
it seems that the hydrogen energetic mass yield from the RF plasma method tended to
increase with the increasing of the gas production rate. However, it was followed by a
decrease of the CH4 conversion ratio.

Chapter 5. Decomposition of Methane Hydrate for Hydrogen Production by The In-liquid Plasma Methods 2015
78
Fig. 5.8 CH4 conversion ratio for methane hydrate decomposition by the RF and the MW Plasma method.

Chapter 5. Decomposition of Methane Hydrate for Hydrogen Production by The In-liquid Plasma Methods 2015
79
Fig. 5.9 H2 selectivity & H2 yield by the MW and the RF Plasma method.

Chapter 5. Decomposition of Methane Hydrate for Hydrogen Production by The In-liquid Plasma Methods 2015
80
This indicates that a slow rate of CH4 release from methane hydrate can optimize
plasma decomposition of CH4 to produce hydrogen by the RF plasma method. Otherwise, in
methane hydrate decomposition by the MW plasma method, the hydrogen energetic mass
yield tended to increase with the rise of as production rates, which was also followed by an
increase of the CH4 conversion ratio. This lead to the optimization of plasma decomposition to
produce hydrogen occurred at a fast rate of CH4 release from methane hydrate. Consequently,
this result indicates that there is a significant distinction between these two plasma
decomposition methods.
Figure 5.10 shows the comparison summary of the performance's results of these two
methods of plasma in-liquid.
Fig. 5.10 The Comparison summary of performance's results of plasma decomposition by the MW & RF methods
327.5
54 60 63.4
401.5
69.0 99.1
0.6
54
369
700.0
550
48 41.8 65.8 46.8
85.8
2.6
747
368
0
200
400
600
800
1000
Ign
ited
Po
wer
(W
att)
Ga
s G
ener
ated
Am
ou
nt
(mL
)
Irra
dia
tio
n T
ime
(sec
)
H2
sele
ctiv
ity
Co
nsu
med
En
erg
y p
er1
L o
f g
as
(kJ/
L)
H2
yie
lds
(%)
CH
4 co
nv
ersi
on
rat
io(%
)
En
erg
etic
ma
ss y
ield
of
H2
(g[H
2]/
kW
h)
Ga
s p
rod
uct
ion
rat
e(s
ccm
)
En
tha
lph
y o
fF
orm
ati
on
per
1 m
ole
of
MH
in
th
e…
Radio Frequency Microwave

Chapter 5. Decomposition of Methane Hydrate for Hydrogen Production by The In-liquid Plasma Methods 2015
81
5.4 Conclusions
Methane hydrate decomposition was conducted at the atmospheric pressure by
applying 2.45GHz Microwave plasma irradiation and 27.12MHz Radio Frequency irradiation.
The mechanism of reaction for this process started with the reaction of methane hydrate
dissociation (MHD), CH4 and water was produced during this process. Afterwards, steam
methane reforming (SMR) process and methane cracking reaction (MCR) was simultaneously
occurred and decomposed the released CH4 into H2, CO and other byproducts.
Methane hydrate could be decomposed to produce hydrogen with a purity of 42.1%
(CH4 conversion ratio of 85.8%) by the 2.45GHz Microwave plasma method using a
conventional Microwave oven, whereas a purity of 63.1% (CH4 conversion ratio of 99.1%) by
the 27.12MHz Radio Frequency plasma in-liquid method. Decomposition of methane hydrate
by the Microwave plasma method can optimize plasma decomposition of CH4 to produce
hydrogen at a fast rate of CH4 release from methane hydrate. Conversely, the methane
hydrate decomposition by Radio Frequency plasma method occurs at a slow rate of CH4
release from methane hydrate.
For the future research, in order to approaching the actual condition at high pressure
and low temperature in the subsea which methane hydrate can reach its stable state, the
experiment for decomposition of methane hydrate at high pressure will be executed using
argon plasma jet.

Chapter 5. Decomposition of Methane Hydrate for Hydrogen Production by The In-liquid Plasma Methods 2015
82
References
1. Abbas, H. F. & Wan Daud, W. M. a. Hydrogen production by methane decomposition: A review. Int. J. Hydrogen Energy 35, 1160–1190 (2010).
2. Bundaleska, N. et al. Hydrogen production from methanol reforming in microwave ‘tornado’-type plasma. Int. J. Hydrogen Energy 38, 9145–9157 (2013).
3. Nomura, S., Toyota, H., Tawara, M., Yamashita, H. & Matsumoto, K. Fuel gas production by microwave plasma in liquid. Appl. Phys. Lett. 88, 231502 (2006).
4. Fan, J. & Zhu, L. Performance analysis of a feasible technology for power and high-purity hydrogen production driven by methane fuel. Appl. Therm. Eng. 75, 103–114 (2015).
5. Silveira, J. L. et al. Incorporation of hydrogen production process in a sugar cane industry: Steam reforming of ethanol. Appl. Therm. Eng. 71, 94–103 (2014).
6. Putra, A. E. E., Nomura, S., Mukasa, S. & Toyota, H. HYDROGEN PRODUCTION BY REFORMING CLATHRATE HYDRATES USING THE IN-LIQUID. in 11 th International Conference on Sustainable Energy technologies (SET-2012) (2012).
7. Ozturk, M. & Dincer, I. Thermodynamic analysis of a solar-based multi-generation system with hydrogen production. Appl. Therm. Eng. 51, 1235–1244 (2013).
8. Jasinski, M., Dors, M., Nowakowska, H., Nichipor, G. V & Mizeraczyk, J. PRODUCTION OF HYDROGEN VIA CONVERSION OF HYDROCARBONS USING MICROWAVE PLASMA. J. Appl. Phys. 44, 7 (2010).
9. Nomura, S. et al. Production of hydrogen in a conventional microwave oven. J. Appl. Phys. 106, 073306 (2009).
10. Li, D.-L. et al. In situ hydrate dissociation using microwave heating: Preliminary study. Energy Convers. Manag. 49, 2207–2213 (2008).
11. Putra, A. E. E., Nomura, S., Mukasa, S. & Toyota, H. Hydrogen production by radio frequency plasma stimulation in methane hydrate at atmospheric pressure. Int. J. Hydrogen Energy 37, 16000–16005 (2012).
12. Dendy Sloan, E. & Koh, C. Clathrate Hydrates of Natural Gases, Third Edition. 20074156, (CRC Press, 2007).
13. Ayhan Demirbas. Methane Gas Hydrate. (Springer, 2010). at <www.springer.com>

Chapter 5. Decomposition of Methane Hydrate for Hydrogen Production by The In-liquid Plasma Methods 2015
83
14. Boyano, A., Blanco-Marigorta, A. M., Morosuk, T. & Tsatsaronis, G. Exergoenvironmental analysis of a steam methane reforming process for hydrogen production. Energy 36, 2202–2214 (2011).
15. Kim, N.-J., Park, S.-S., Kim, H. T. & Chun, W. A comparative study on the enhanced formation of methane hydrate using CM-95 and CM-100 MWCNTs. Int. Commun. Heat Mass Transf. 38, 31–36 (2011).
16. Stern, L. A. et al. Anomalous Preservation of Pure Methane Hydrate at 1 atm. J. Phys. Chem. B 1756–1762 (2001).
17. Alexiades, V. Methane hydrate formation and decomposition. Electron. J. Differ. Equations 17, 1–11 (2009).
18. Nomura, S. et al. Characteristics of in-liquid plasma in water under higher pressure than atmospheric pressure. Plasma Sources Sci. Technol. 20, 034012 (2011).
19. Mukasa, S. et al. Growth of bubbles containing plasma in water by high-frequency irradiation. Int. J. Heat Mass Transf. 53, 3067–3074 (2010).
20. Mukasa, S., Nomura, S., Toyota, H., Maehara, T. & Yamashita, H. Internal conditions of a bubble containing radio-frequency plasma in water. Plasma Sources Sci. Technol. 20, 034020 (2011).
21. Nomura, S. et al. Characteristics of in-liquid plasma in water under higher pressure than atmospheric pressure. Plasma Sources Sci. Technol. 20, 034012 (2011).
22. Nomura, S., Putra, A. E. E., Mukasa, S., Toyota, H. & Yamashita, H. FUEL GAS PRODUCTION BY PLASMA IN A MICORWAVE OVEN AT ATMOSPHERIC. in Proceedings of the ASME/JSME 2011 8th Thermal Engineering Joint Conference 1–6 (2011).
23. Giavarini, C. & Maccioni, F. Self-Preservation at Low Pressures of Methane Hydrates with Various Gas Contents. Ind. Eng. Chem. Res. 43, 6616–6621 (2004).
24. Circone, S., Kirby, S. H. & Stern, L. a. Direct measurement of methane hydrate composition along the hydrate equilibrium boundary. J. Phys. Chem. B 109, 9468–75 (2005).
25. Anderson, G. K. Enthalpy of dissociation and hydration number of methane hydrate from the Clapeyron equation. J. Chem. Thermodyn. 36, 1119–1127 (2004).

Chapter 6
Characteristic of Argon Plasma Jet on Decomposition of Methane Hydrate for Hydrogen
Production
6.1 Introduction
Serious environmental problems throughout the world by the burning of fossil fuels
and the increasing of greenhouse gas emission, including carbon dioxide have paid our
attention nowadays. The consideration has been focused to alternative energy sources such
as solar energy, biomass, geothermal power, and tidal power. All of these natural energy
resources are presumed to minimize our dependency on fossil fuel. Hence, due to its
characteristic as a clean energy carrier and environmental green nature 1, hydrogen has been
pointed out as a vital fuel to be used, which could replace the current combustion engines in
which diesel and or gasoline are used in common. However, since hydrogen cannot be
considered as a renewable fuel, it has to be obtained from other primary hydrogen-enriched

Chapter6. Characteristic of Argon Plasma Jet on Decomposition of Methane Hydrate for Hydrogen Production 2015
85
sources such as hydrocarbon or alcohol 2.
Methane hydrates have become one of the most attractive for hydrogen energy
resources for the future due to its massive reserves in the world, which is possibly twice the
global amount of carbon of all other fossil fuels combined 1,3. Methane hydrates are crystalline
solids formed by a compound of methane and water which stable at low temperature and high
pressure. They have an ice-like crystalline lattice of water molecules with methane molecules
trapped inside. Huge resources of hydrates can be found on the ocean floors of continental
shelves and in the permafrost region 1,3. Due to the solid form of methane hydrates, the
recovery of methane generally involves dissociating or melting methane hydrates in situ by
raising the temperature above that of hydrate formation, or decreasing the pressure below that
of hydrate equilibrium 1. Therefore, conventional techniques for gas and oil recovery are not
suitable.
The application of the in-liquid plasma method by radio frequency (RF) under
atmospheric pressure has been successfully applied to produce 65% of hydrogen from
cyclopentane (CP) 4, and also from waste oil and n-dodecane with 70-80% of hydrogen 5,6.
This method has also provided satisfactory results to produce hydrogen from the
decomposition of methane hydrate 7,8. However, in the case of its application under severe
environmental such as high pressure and low temperature, it was found that it is relatively
formidable to obtain a stable plasma irradiation. For the conventional in-liquid plasma method,
the plasma can be generated as long as the applied electric field across the discharge gap is
high enough to initiate a breakdown. However, under the condition of high pressure, the
electric field that required to stimulate the discharge is fairly high 9. Thus, a suitable method is
required to produce hydrogen under critical conditions since methane hydrates are stable only

Chapter6. Characteristic of Argon Plasma Jet on Decomposition of Methane Hydrate for Hydrogen Production 2015
86
at such conditions 7,8.
The study of plasma jet has received a lot of attention recently due to the versatility of
its application such as for synthesis of carbon nanotubes 10, microparticles/microsphere
production 11,12, surface modification 13, diamond deposition 14, and hydrogen production 15.
Methane reformation using a gliding plasma jet reactor can produce hydrogen-rich gas with a
54% H2 yield 16. Hydrogen generation by pulsed discharge of plasma jet can produce an
optimum energy yield when using an argon carrier and pure methanol 15. Likewise, discharge
plasma in plasma jet method is extended beyond the plasma generation region into the
surrounding ambience by an electromagnetic field, convective gas flow, shock wave, or a
gradient of a directionless physical quantity such as particle density, pressure, or temperature
17. The combination between its ability to penetrate and propagate into a narrow gap and
flexible dielectrics make this method easy to generate plasma with stable irradiation under the
high pressure condition 18,19.
In this study, the argon plasma jet is adopted as the method for the decomposition
process of methane hydrate ranging from 0.1 to 2.0 MPa because this method is applicable to
the condition of high pressure. Argon plasma jet is not confined by electrodes and can be
adjusted to the small gap 19. As well, there are yet no studies have been reported regarding of
the characteristics of plasma under high pressure condition, also the decomposition process
of methane hydrate by the argon plasma jet method. The analysis of emission spectrum of the
plasma jet and the gas yield, as well as the efficiency of hydrogen production from the
decomposition process are investigated in this study. This is another step in the process with
the ultimate goal of producing hydrogen from hydrate fields on the seabed and in permafrost
regions using an in-liquid plasma method.

Chapter6. Characteristic of Argon Plasma Jet on Decomposition of Methane Hydrate for Hydrogen Production 2015
87
6.2 Experimental Design.
6.2.1 Formation of methane hydrate.
Figure 6.1 represent the apparatus for synthesizing methane hydrate, which consists
of a methane supply tube, cooling bath, stirring motor, magnetic stirrer, pressure gauge,
thermocouple and computer. About 90 grams of shaved ice and 10 grams of methane hydrate
seed were inserted into the cooling bath (60 mm inner diameter, 140 mm height, 400 ml
volume, and maximum working pressure of 15 MPa.), which has been previously washed by
water. Pressurized methane gas was then injected into the cooling bath, 30 mm above the
bottom.
Fig. 6.1 Apparatus for synthesizing methane hydrate
The temperature was maintained constant at 1°C using ethylene glycol, and a
magnetic stirrer (40 mm) rotated at 500 rpm to stir up the solution of methane gas and shaved
ice. Methane gas was pressurized to about 7.0MPa and the temperature of methane hydrate

Chapter6. Characteristic of Argon Plasma Jet on Decomposition of Methane Hydrate for Hydrogen Production 2015
88
formation was monitored by a thermocouple positioned at the bottom of the cooling bath.
Pressure and temperature throughout the process were recorded every hour. The process of
methane hydrate formation was completed after 70 hours, and then synthetic methane
hydrate was collected. As a further cooling process, methane hydrate was subsequently
stored in a refrigerator to prevent from the dissociation 20.
6.2.2 Argon plasma jet irradiation for methane hydrate decomposition.
The experimental apparatus of the argon plasma jet is shown in Fig. 6.2. To maintain
a high-pressure level, a pressure control valve was attached to a gas outlet which increased
the pressure inside the reactor vessel to the target pressure. The reactor temperature was
kept at 0°C by a surrounding copper tubing coil refrigerated by circulating ethylene glycol.
Fig. 6.2 Experimental design of argon plasma jet for methane hydrate decomposition
Plasma was irradiated by applying a 27.12MHz high-frequency power source
(T161-5766LQ, Thamway) to an electrode unit. An insulator made of a heat-resistant
polymer resin (PEEK, up to 500°C) was attached to the apparatus to prevent energy loss and

Chapter6. Characteristic of Argon Plasma Jet on Decomposition of Methane Hydrate for Hydrogen Production 2015
89
carbide generation. The electrode unit for the argon plasma jet applied during the experiment
is shown in Fig. 6.3. A 1.5mm diameter electrode tip was positioned on the axis of a 1.8mm
diameter stainless steel tube, where its surface was insulated by another tube made of Teflon.
A copper cylindrical tube was installed as a counter electrode. Additionally, a hole for gas
extraction was drilled on the side wall of the stainless steel tube. A plasma jet was irradiated
from a 2.0mm diameter hole drilled in the counter electrode through, which was the argon gas
flowed from a stainless steel tube connected with the supply tube of argon. The Ar gas flow
was controlled at the desired rate of 200mL/min by a flow meter connected with the apparatus.
Fig.6.3 Electrode unit of the argon plasma jet
About 7 grams of methane hydrate produced from the cooling bath was inserted into
the reactor vessel. The input power was set to 250W for a net power of 200W after subtraction
of the reflected power. Immediately after the plasma jet initiation, the pressure in the reactor
vessel was adjusted to the target pressure of from 0.1MPa to 2.0MPa by adjusting the control
valve. Plasma irradiation time was recorded until all methane hydrate was dissolved, and the
generated gases were collected by the water displacement method. By this method,
generated gas was collected from the exhaust tube connected to the reaction vessel by
displace the gas above the liquid 4,8. Analysis of the gas content from decomposition of
methane hydrate was performed using a gas chromatograph (Shimadzu 8A), which argon as
the carrier gas under a flow rate of 34 mL/min and a head pressure of 600 kPa. Temperature
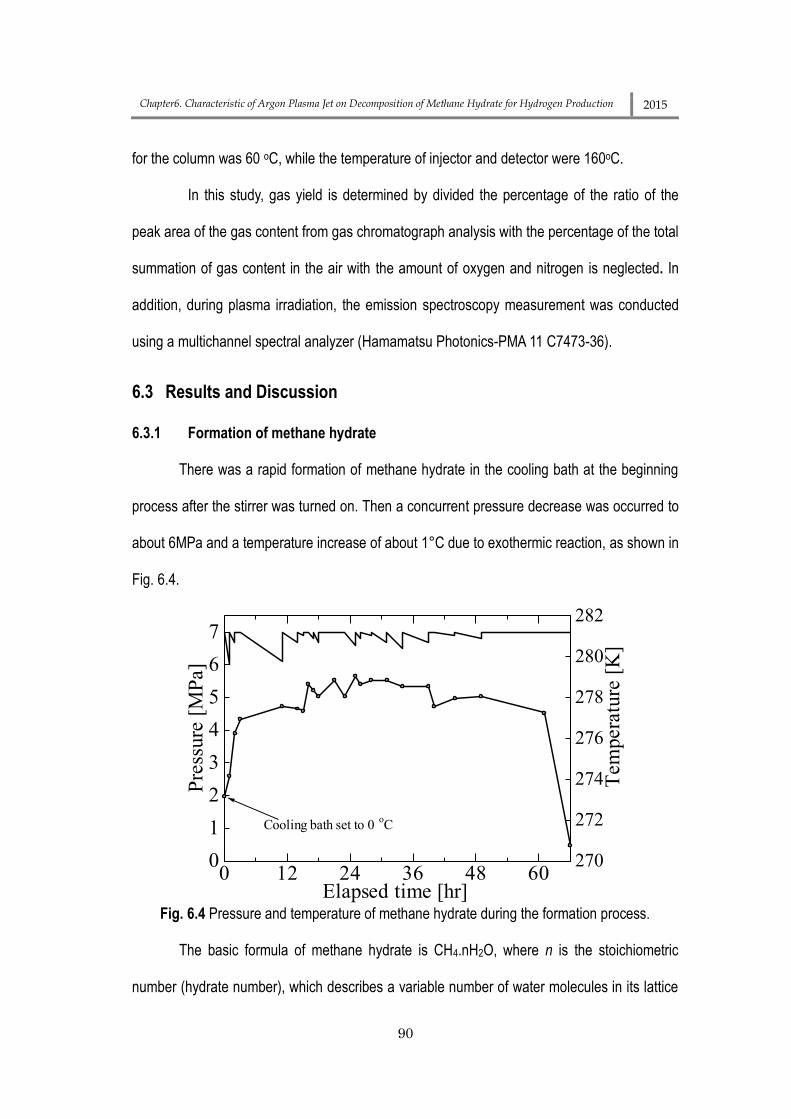
Chapter6. Characteristic of Argon Plasma Jet on Decomposition of Methane Hydrate for Hydrogen Production 2015
90
for the column was 60 oC, while the temperature of injector and detector were 160oC.
In this study, gas yield is determined by divided the percentage of the ratio of the
peak area of the gas content from gas chromatograph analysis with the percentage of the total
summation of gas content in the air with the amount of oxygen and nitrogen is neglected. In
addition, during plasma irradiation, the emission spectroscopy measurement was conducted
using a multichannel spectral analyzer (Hamamatsu Photonics-PMA 11 C7473-36).
6.3 Results and Discussion
6.3.1 Formation of methane hydrate
There was a rapid formation of methane hydrate in the cooling bath at the beginning
process after the stirrer was turned on. Then a concurrent pressure decrease was occurred to
about 6MPa and a temperature increase of about 1°C due to exothermic reaction, as shown in
Fig. 6.4.
Fig. 6.4 Pressure and temperature of methane hydrate during the formation process.
The basic formula of methane hydrate is CH4.nH2O, where n is the stoichiometric
number (hydrate number), which describes a variable number of water molecules in its lattice
0 12 24 36 48 600
1
2
3
4
5
6
7
270
272
274
276
278
280
282
Elapsed time [hr]
Pre
ssure
[M
Pa]
Tem
pera
ture
[K
]
Cooling bath set to 0oC

Chapter6. Characteristic of Argon Plasma Jet on Decomposition of Methane Hydrate for Hydrogen Production 2015
91
structure. The formation of synthetic methane hydrate in the present study required around 70
hours with a pressure range of 6 to 7MPa and temperature range of 272 to 279K. By direct
measurement, the hydrate number (n) was calculated from the amount of gaseous methane
and water released during the hydrate decomposition at constant pressure. Small amount of
methane hydrate (± 6 grams) were taken from the 100 grams of synthetic methane hydrate
produced. Using the water displacement method and stoichiometric calculation, values of
0.2896 of mol H2O and 0.049107 of mol CH4 were obtained. The n value was then determined
by the following equation:
(6.1)
Hence, the hydrate number of methane hydrate in this experiment was determined to
be 5.9, which can be written as CH4.5.9H2O in the basic formula of methane hydrate.
According to S. Circone et al. 21, along the natural equilibrium boundary of methane hydrate
for a stoichiometric number n = 5.81 to 6.10, the pressure ranges from 1.9 to 9.7MPa, and the
formation temperature ranges from 263 to 285 K. Hence, it can be stated that the synthetic
methane hydrate used in this experiment adequately represents the properties of actual
methane hydrate in nature.
6.3.2 Emission Spectroscopy of Argon Plasma Jet
The variation in emission intensities of several ArI lines as a function of pressure is
shown in Fig. 6.5. Basically, emission intensity is influenced by microscopic electric fields from
the adjacent ions and electrons, which leads to a stark broadening of the spectra lines, which
was extended by increasing the pressure 22.

Chapter6. Characteristic of Argon Plasma Jet on Decomposition of Methane Hydrate for Hydrogen Production 2015
92
Fig. 6.5 Optical Emission intensity of argon I lines as a function of pressure.
Based on previous research by Nomura et.al., the gas temperature of plasma is
known to be about 3500 K under atmospheric pressure 22. In this experiment, the spectrum is
dominated by Ar and Cu emission lines. The emission line spectrum of the argon plasma jet at
different pressures is shown in Fig. 6.6. The excitation temperature, Texc is a plasma
parameter that characterizing a population of stimulated atomic levels 23. This temperature is
evaluated from the inverse of the slope on a plot of the natural logarithm of ‘lijij/(giAij)’ versus
the transition of upper level energy (Ei). Such a plot is referred as a Boltzmann plot. The
Boltzmann method was employed with the assumption of local thermodynamic equilibrium
(LTE) 24–28. LTE plasma constrains that transitions and chemical reactions be dominated by
collisions and not by the radiative processes, as well, the local gradients of the plasma
properties (temperature, density, thermal conductivity) are low enough to let a particle in the
plasma reach an equilibrium 26.
0 0.5 1 1.5 2 2.5 30
1000
2000
3000
0
200
400
600
800
1000In
tensi
ty [
a.u
.]
Gas Pressure [MPa]
706.72 nm
738.39 nm
763.51 nm
801.47 nm
811.53 nm842.46 nm
852.14 nm
912.29 nm
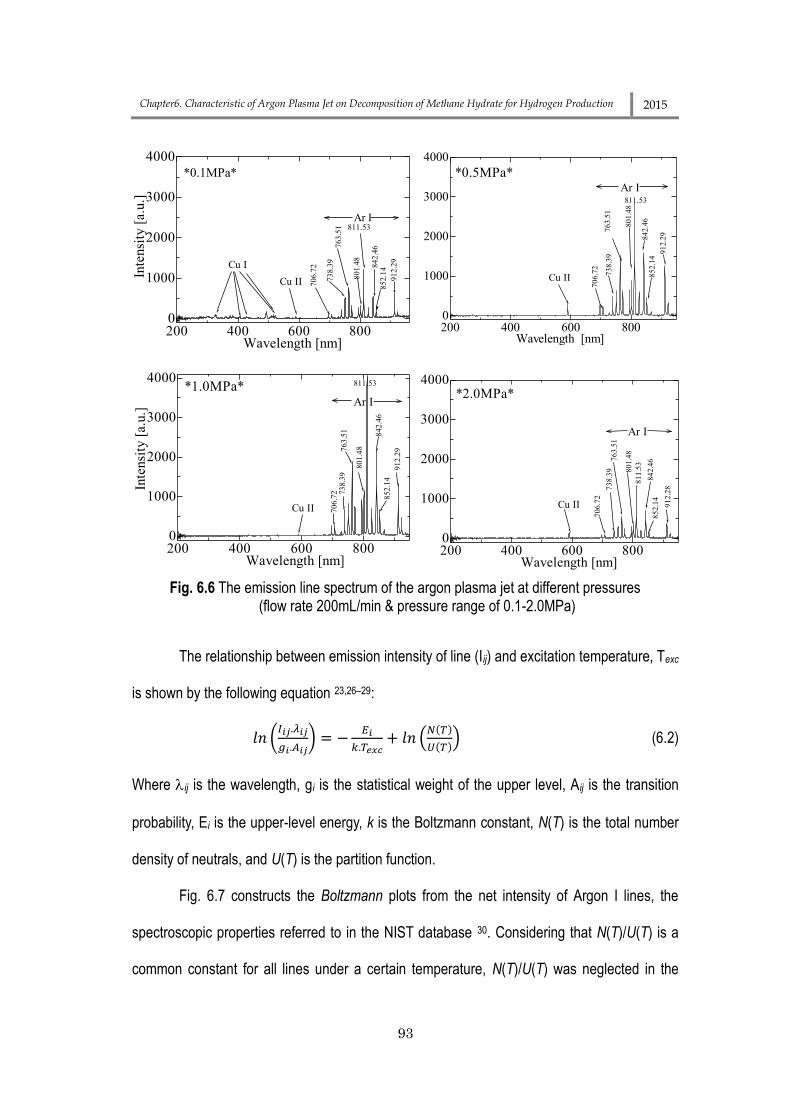
Chapter6. Characteristic of Argon Plasma Jet on Decomposition of Methane Hydrate for Hydrogen Production 2015
93
Fig. 6.6 The emission line spectrum of the argon plasma jet at different pressures (flow rate 200mL/min & pressure range of 0.1-2.0MPa)
The relationship between emission intensity of line (Iij) and excitation temperature, Texc
is shown by the following equation 23,26–29:
𝑙𝑛 (𝐼𝑖𝑗.𝜆𝑖𝑗
𝑔𝑖.𝐴𝑖𝑗) = −
𝐸𝑖
𝑘.𝑇𝑒𝑥𝑐+ 𝑙𝑛 (
𝑁(𝑇)
𝑈(𝑇)) (6.2)
Where ij is the wavelength, gi is the statistical weight of the upper level, Aij is the transition
probability, Ei is the upper-level energy, k is the Boltzmann constant, N(T) is the total number
density of neutrals, and U(T) is the partition function.
Fig. 6.7 constructs the Boltzmann plots from the net intensity of Argon I lines, the
spectroscopic properties referred to in the NIST database 30. Considering that N(T)/U(T) is a
common constant for all lines under a certain temperature, N(T)/U(T) was neglected in the
200 400 600 8000
1000
2000
3000
4000
Wavelength [nm]
Inte
nsi
ty [
a.u
.]
70
6.7
2
73
8.3
97
63
.51
80
1.4
8
811.53
84
2.4
68
52
.14
91
2.2
9
*0.1MPa*
Cu II
Cu I
Ar I
200 400 600 8000
1000
2000
3000
4000
Wavelength [nm]
Inte
nsi
ty [
a.u
.]
*1.0MPa*
70
6.7
2 73
8.3
97
63
.51
80
1.4
8
811.538
42
.46
85
2.1
4
91
2.2
9
Cu II
Ar I
200 400 600 8000
1000
2000
3000
4000
Wavelength [nm]
70
6.7
2
73
8.3
976
3.5
1
80
1.4
8
811.53
84
2.4
685
2.1
4
91
2.2
9
*0.5MPa*Ar I
Cu II
200 400 600 8000
1000
2000
3000
4000
Wavelength [nm]
70
6.7
2
73
8.3
97
63
.51
80
1.4
8
81
1.5
3
84
2.4
68
52
.14
91
2.2
8
*2.0MPa*
Cu II
Ar I

Chapter6. Characteristic of Argon Plasma Jet on Decomposition of Methane Hydrate for Hydrogen Production 2015
94
ln (
l/g
A)
calculation. The spectral lines that have been used to estimate the excitation temperature are
shown in Table 6.1. The excitation temperature obtained from the emission intensity of the
argon I lines were found to be in the range of 4477 - 7576K with the pressure range of 0.1 to
2.0MPa.
Table 6.1. The spectral lines of Argon I used for the estimation of the excitation temperature.
No. Substance Wavelength Configuration of upper level
1 Ar I 706.7 nm 3s23p4[3P]5p→3s23p4[3P]5d 2 Ar I 738.4 nm 3s23p5[2P°3/2]4s→3s23p5[2P°1/2]4p 3 Ar I 763.5 nm 3s23p5[2P°3/2]4s→3s23p5[2P°3/2]4p
4
4
Ar I 801.5 nm 3s23p5[2P°3/2]4s →3s23p5[2P°3/2]4p
5 Ar I 811.5 nm 3s23p5[2P°3/2]4s→3s23p5[2P°3/2]4p
6 Ar I 842.5 nm 3s23p5[2P°3/2]4s →3s23p5[2P°3/2]4p
7
7
Ar I 852.1 nm 3s23p5[2P°1/2]4s →3s23p5[2P°1/2]4p
8 Ar I 912.3 nm 3s23p5[2P°3/2]4s→3s23p5[2P°3/2]4p
Besides, due to the use of copper as the electrode tip reveals that some
luminescence in the copper spectra was observed with the region between 327 and 578 nm is
dominantly attached to Cu I at the pressure of 0.1MPa, while Cu II with the wavelength of
589.46 nm was detected at the entire pressure level (0.1 to 2.0MPa) as shown in Fig. 6.6.
Fig. 6.7 Boltzmann plots for intensity of argon I lines (flow rate 200mL/min & pressure range
0.1 – 3.0MPa)
12.9 13 13.1 13.2 13.3 13.4-6.5
-6
-5.5
-5
-4.5
-4
-3.5
-3
-6.5
-6
-5.5
-5
-4.5
-4
Ei [eV]
3.0MPa;Texc= 8561K0.1MPa;Texc= 4973K
1.5MPa;Tecx=7577K

Chapter6. Characteristic of Argon Plasma Jet on Decomposition of Methane Hydrate for Hydrogen Production 2015
95
The excitation temperatures obtained at different gas pressures are summarized in
Fig. 6.8(a). It is revealed that the excitation temperatures increases with the increasing of gas
pressure. It can be referred to a higher frequency of electron collisions with the increase of
pressure that affects to the excitation temperature enhancement 28. The highest excitation
temperature is obtained at 1.0MPa. However, any further increases in pressure consequence
in raised excitation temperature.
Plasma irradiation has also been performed along the argon flow rate range from 100
to 3000mL/min and it found that Texc comes to be reduced from 3960 to 2082K with an
increased flow rate of argon as shown in Fig. 6.8(b). Sismanoglu et.al. reported the same
trend by using micro-discharge at medium to high pressure in argon 31. On the other hand, a
decrease in excitation temperature with an increase pressure has been reported at low
pressure argon plasma discharge 22, low power microwave plasma 28, and high pressure of
in-liquid plasma in water 27. Fig. 6.8(b) shows that the excitation temperature tends to be
decreased by an increase of argon flow rate. An identical trend has also been reported at a
high argon flow rate at atmospheric pressure for microwave plasma 23.
0 0.5 1 1.5 2 2.5 3
4000
6000
8000
10000
Excit
ati
on T
em
pera
ture
[K
]
Gas Pressure [MPa](a)

Chapter6. Characteristic of Argon Plasma Jet on Decomposition of Methane Hydrate for Hydrogen Production 2015
96
(b) (a)
Fig.6.8 Correlation of gas pressure with (a) excitation temperature of argon and (b) and argon
flow rate
6.3.3 Influence of Electrode Materials and Plasma Impedance Stability
The plasma irradiation has also been performed by using two different materials for
the tip of the electrode: tungsten and copper to investigate the effect of the type of electrode
used in the argon plasma jet as shown in Fig. 6.9(a) and 6.9(b).
Fig. 6.9 Effects of plasma jet from two types of electrode tip (a) Tungsten, (b) Copper
500 1000 1500 2000 2500 3000
2000
3000
4000
Argon flow rate [mL/min]
Excit
ati
on T
em
pera
ture
[K
]
(b)

Chapter6. Characteristic of Argon Plasma Jet on Decomposition of Methane Hydrate for Hydrogen Production 2015
97
When the tungsten electrode was used, the reflected power was unstable and
difficult to adjust with the matching box. Conversely, it was much more stable using the copper
electrode and adjustment of this power was fairly easy. However, melting and damage to the
used of copper electrode was observed after the experiment. During the process of plasma
irradiation, which was maintained for about 60 seconds, the color of plasma turned out to be
light yellow. In addition, as the pressure increased between 0.1 and 2.0MPa, the reflection
power was reduced. Consequently, the increased in-system pressure indicated an increase of
net power supply 32.
6.3.4 Methane hydrate Decomposition by RF Argon Plasma Jet
The gas yield from methane hydrate decomposition by the argon plasma jet mostly
concurs with the previous results 7,8, for which hydrogen (H2), carbon monoxide (CO), carbon
dioxide (CO2), and methane (CH4) were the main products. However, some hydrocarbon
molecules such as C2H2 and C2H4 were not detected. The result of analysis of the gas yield
from the hydrate plasma-induced decomposition are shown in Table 6.2 and on the bar chart
in Fig. 6.10.
Table 6.2. Result of analysis of the gas produced from hydrate decomposition (input power: 200W)
Gas Pressure (Mpa)
Gas production rate [mL/s]
H2% O2% CO% CH4% CO2% Others
%
0.1 1.67 27.69 11.20 2.26 56.30 2.55 0.00
0.5 0.17 9.96 2.71 10.90 74.43 0.00 0.00
1.0 0.10 4.97 2.57 3.76 88.70 0.00 0.00
1.5 1.67 1.52 1.03 0.00 97.45 0.00 0.00
2.0 0.67 2.33 9.52 0.00 94.81 0.00 0.00

Chapter6. Characteristic of Argon Plasma Jet on Decomposition of Methane Hydrate for Hydrogen Production 2015
98
Fig. 6.10 Content of product gases with increase of pressure
In spite of argon plasma jet irradiation was successfully generated at high pressure,
the hydrogen yield shows a tendency to decrease as the pressure increase. It is assumed that
due to the simultaneous flow of argon gas during the process of plasma irradiation inside the
reactor vessel, a substantial amount of CH4 was forced out earlier into the collecting bath of
product gases before the decomposition process initiated. Consequently, the required basic
reactions for the methane hydrate decomposition as shown in Eqs. (6.3) to (6.8) were not
completely satisfied, due to an insignificant amount of CH4 that remained inside reactor vessel.
In the initial process, methane hydrate dissociation (MHD) reaction produced CH4 and H2O 7,8.
Then the release of CH4 reacted with the water that turn into steam by the plasma
simultaneously decomposed to yield H2, CO, and CO2 by the reaction of steam methane
reforming (SMR).
The required basic reactions for the decomposition process of methane hydrate are
as follows:

Chapter6. Characteristic of Argon Plasma Jet on Decomposition of Methane Hydrate for Hydrogen Production 2015
99
Methane hydrate dissociation (MHD):
1. CH45H2O CH4 + 5H2O(g), △H = +53.5 kJ/mol 33 (6.3)
Steam methane reforming (SMR) :
2. CH4 + H2O → 3H2 + CO, △H = +206.16 kJ/mol (6.4)
3. CO + H2O H2 + CO2, △H = -41.16 kJ/mol (6.5)
Methane cracking reaction (MCR) :
4. CH4 2H2 + C (s), △H = +74.87 kJ/mol (6.6)
5. 2CH4 3H2 + C2H2, △H = 376.47 kJ/mol (6.7)
6. 2CH4 2H2 + C2H4, △H = 202.21 kJ/mol (6.8)
Notwithstanding that there is a trend in the rate of H2 production to decrease as the
pressure increases by employing the argon plasma jet, the formation rate of carbon dioxide
was observed to decrease (see Fig. 6.10). Whereas the hydrogen and CO production rates
should vary simultaneously according to the methane steam methane reforming reaction. This
suggests an alternative production mechanism for CO, which is thought to be due to the
pyrolysis of Teflon from the electrode. Moreover, due to the absence of C2H2 and C2H4 as the
byproducts, which was observed from the content analysis of product gas by the gas
chromatograph, it was definitely confirmed that the methane-cracking reaction (MCR) was
only taken place to generated hydrogen and the C(s), which is estimated by the balance of
reaction in Eqs. (6.6).
The possibility of the hydrogen and the C(s) generation as by product by
methane-cracking reaction (MCR) also corresponds to the Fig. 6.11 that illustrates the amount
of effective energy (enthalpy) used for the decomposition of 1 mole of methane hydrate to
produce hydrogen by the argon plasma jet depends on the pressure. Moreover, in a real

Chapter6. Characteristic of Argon Plasma Jet on Decomposition of Methane Hydrate for Hydrogen Production 2015
100
hydrate system in a porous medium. C(s) attached to the reactor wall in the experiment also
attached to the surface of that medium. The deposition of C(s) on the porous medium could
substantially reduce its permeability and let the blockage of the porous medium to interfere
with hydrogen production 7.
Fig. 6.11 Net amount of energy used for methane hydrate decomposition by argon plasma Jet
Besides, Fig.10 also reveals that the enthalpies required during the process tend to
remain constant as the pressure increases for the methane hydrate dissociation reaction
(MHD), while the rest of basic reactions i.e. Steam methane reforming (SMR) and methane
cracking reaction (MCR) show a tendency to increase. In terms of comparison with the other
basic reactions, it was found that steam methane reforming (SMR) reaction became dominant
concerning of conversion methane into hydrogen.

Chapter6. Characteristic of Argon Plasma Jet on Decomposition of Methane Hydrate for Hydrogen Production 2015
101
6.3.5 Efficiency of Hydrogen Production
The hydrogen production efficiency is determined by divided the energy output in the
outlet stream, which is defined as the molar flow of hydrogen multiplied by the lower heating
value of hydrogen with the radio frequency input power for the plasma irradiation. This
parameter should be considered as a significant factor regarding of performance of the argon
plasma jet for decomposition process of methane hydrate. This is not just a measurement of
the decomposition process for hydrogen production but also an evaluation of energy efficiency
that concerns to any future commercial cost.
Fig. 6.12 Efficiency of Hydrogen Production from decomposition of methane hydrate
The hydrogen production efficiencies are depicted in Fig. 6.12. Although the hydrogen
production efficiency is relatively low for argon plasma jet compared to RF in-liquid plasma
method from the previous study, the reduction of carbon dioxide by the thermal decomposition
of Teflon from carbon monoxide making it possible to be considered as an advanced
promising technique. In order to enhance the hydrogen production efficiency of argon plasma
jet, the hydrogen yield will become a major challenge that must be improved in the future.
0 0.5 1 1.5 20
0.5
1
1.5
2
0
10
20
30
All gasH2
H2
All gasH2
Hyd
rog
en
Effic
ien
cy [%
]
All
ga
s E
ffic
ien
cy [%
]
Gas Pressure [MPa]

Chapter6. Characteristic of Argon Plasma Jet on Decomposition of Methane Hydrate for Hydrogen Production 2015
102
In the previous study by Eka Putra et al. 7, by the conventional in-liquid plasma
method, plasma can only be generated at atmospheric pressure 7. While using the argon
plasma jet at the same input power of 200 Watt, the plasma can successfully to generate
under higher pressure than atmospheric pressure (range from 0.1 MPa to 2.0MPa). In
practical condition, generating plasma under high pressure will give consequence to the
increase of input power. However, in the current study, by applying argon plasma jet, plasma
can generate under higher pressure with lower input power. In addition, this study became the
first time in observing the characteristic of argon plasma jet under very high pressure (2.0
MPa) particularly in the decomposition of methane hydrate.
6.4 Conclusions
Decomposition of methane hydrate has become feasible under high pressure levels
for hydrogen production. Eventhough the hydrogen production efficiency in the present study
is less than that of the radio frequency plasma in-liquid, the reduction of carbon dioxide by the
thermal decomposition of Teflon from carbon monoxide making it possible to be considered as
an advanced promising technique in the future.
The excitation temperature has been determined from Boltzmann plot method with the
pressure range of 0.1 to 2.0MPa. Due to a higher frequency of electron collisions from ions
and atoms, the excitation temperature increases from 4477 - 7576K along with an increase of
gas pressure, whereas along the argon flow rate range of 100 to 3000mL/min, it reduces from
3960 to 2082K.
As the pressure increases, the enthalpy required during the process tend to remain
constant for the methane hydrate dissociation reaction (MHD), while the rest of basic reaction
i.e. Steam methane reforming (SMR) and methane cracking reaction (MCR) tend to increase.

Chapter6. Characteristic of Argon Plasma Jet on Decomposition of Methane Hydrate for Hydrogen Production 2015
103
In comparison with the other basic reactions, it is shown that steam methane reforming (SMR)
reaction become dominant concerning of methane conversion into hydrogen. The content
analysis of product gas by the gas chromatograph confirmed that methane-cracking reaction
(MCR) taken place only to generated hydrogen and the C(s) during plasma irradiation, due to
the absence of C2H2 and C2H4 as the byproducts.
The ideal application of this method for producing hydrogen from methane hydrate
decomposition as correlated to the ultimate goal of this study. but in practical application, the
plasma in liquid method for methane hydrate decomposition, could also possibly to applied for
producing others useful fuel gas, such as CO, C2H4, and C2H2 (CO is commonly utilize in
bulk chemical manufacturing, C2H4 is widely use to produce polymer in industrial market,
while C2H2 generally used for welding, cutting and breezing. Therefore, in spite of the
hydrogen yield shows a tendency to decrease as the pressure increase, this method become
possible to be considered as an advanced promising technique for gas hydrate
decomposition.
Further improvement in the apparatus in the future is necessary to obtain higher
hydrogen generation efficiency. Therefore, as the future plan, the jet mechanism by
simultaneous flow of argon gas in the apparatus will be arrange to be circulated, in order to
avoid a large quantity of unconverted methane that not might not decomposed into fuel gas.

Chapter6. Characteristic of Argon Plasma Jet on Decomposition of Methane Hydrate for Hydrogen Production 2015
104
References
1. Ayhan Demirbas. Methane Gas Hydrate. (Springer, 2010). at <www.springer.com>
2. Rincón, R., Marinas, a., Muñoz, J. & Calzada, M. D. Hydrogen production from ethanol
decomposition by microwave plasma TIAGO torch. Int. J. Hydrogen Energy 39,
11441–11453 (2014).
3. Dendy Sloan, E. & Koh, C. Clathrate Hydrates of Natural Gases, Third Edition.
20074156, (CRC Press, 2007).
4. Nomura, S., Putra, A. E. E., Mukasa, S., Yamashita, H. & Toyota, H. Plasma
decomposition of clathrate hydrates by 2.45GHz mircowave irradiation at atmospheric
pressure. Appl. Phys. Express 4, 2–4 (2011).
5. Nomura, S., Toyota, H., Tawara, M., Yamashita, H. & Matsumoto, K. Fuel gas
production by microwave plasma in liquid. Appl. Phys. Lett. 88, 231502 (2006).
6. Nomura, S. et al. Production of hydrogen in a conventional microwave oven. J. Appl.
Phys. 106, 073306 (2009).
7. Putra, A. E. E., Nomura, S., Mukasa, S. & Toyota, H. Hydrogen production by radio
frequency plasma stimulation in methane hydrate at atmospheric pressure. Int. J.
Hydrogen Energy 37, 16000–16005 (2012).
8. Rahim, I., Nomura, S., Mukasa, S. & Toyota, H. a Comparison of Methane Hydrate
Decompositon Using Radio Frequency Plasma and Microwave Plasma Methods. in
The 15th International Heat Transfer Conference 1–10 (2014).
9. Lu, X., Laroussi, M. & Puech, V. On atmospheric-pressure non-equilibrium plasma jets
and plasma bullets. Plasma Sources Sci. Technol. 21, 034005 (2012).
10. Choi, S. I. et al. High purity synthesis of carbon nanotubes by methane decomposition
using an arc-jet plasma. Curr. Appl. Phys. 6, 224–229 (2006).
11. Vatzulik, B. & Bica, I. Production of magnetizable microparticles from metallurgic slag
in argon plasma jet. J. Ind. Eng. Chem. 15, 423–429 (2009).
12. Bica, I. Iron micro-spheres generation in argon plasma jet. Mater. Sci. Eng. B
Solid-State Mater. Adv. Technol. 88, 107–109 (2002).
13. Sarani, A. et al. Surface modification of PTFE using an atmospheric pressure plasma
jet in argon and argon+CO2. Surf. Coatings Technol. 206, 2226–2232 (2012).

Chapter6. Characteristic of Argon Plasma Jet on Decomposition of Methane Hydrate for Hydrogen Production 2015
105
14. Huang, T. B., Tang, W. Z., Lu, F. X., Gracio, J. & Ali, N. Argon-to-hydrogen ratio in
plasma jet diamond chemical vapour deposition. Surf. Coatings Technol. 190, 48–53
(2005).
15. Burlica, R., Shih, K. Y., Hnatiuc, B. & Locke, B. R. Hydrogen generation by pulsed
gliding arc discharge plasma with sprays of alcohol solutions. Ind. Eng. Chem. Res. 50,
9466–9470 (2011).
16. Yang, Y. C., Lee, B. J. & Chun, Y. N. Characteristics of methane reforming using
gliding arc reactor. Energy 34, 172–177 (2009).
17. Kong, M. G., Ganguly, B. N. & Hicks, R. F. Plasma jets and plasma bullets. Plasma
Sources Sci. Technol. 21, 030201 (2012).
18. Kostov, K. G., Machida, M. & Prysiazhnyi, V. Generation of Cold Argon Plasma Jet at
the End of Flexible Plastic Tube. Plasma Sources Sci. Technol. 24, (2012).
19. Sarani, A., Nikiforov, A. Y., Geyter, N. De, Morent, R. & Leys, C. Characterization of an
atmospheric pressure plasma jet and its application for treatment of non-woven textiles.
Ispc_20 7–10 (2011).
20. Giavarini, C. & Maccioni, F. Self-Preservation at Low Pressures of Methane Hydrates
with Various Gas Contents. Ind. Eng. Chem. Res. 43, 6616–6621 (2004).
21. Circone, S., Kirby, S. H. & Stern, L. a. Direct measurement of methane hydrate
composition along the hydrate equilibrium boundary. J. Phys. Chem. B 109, 9468–75
(2005).
22. Nomura, S. et al. Characteristics of in-liquid plasma in water under higher pressure
than atmospheric pressure. Plasma Sources Sci. Technol. 20, 034012 (2011).
23. Miotk, R.,Hrycak, B., Jasinski, M. & Mizeraczyk, J. Spectroscopic study of atmospheric
pressure 915 MHz microwave plasma at high argon flow rate. J. Phys. Conf. Ser. 406,
012033 (2012).
24. Hattori, Y., Mukasa, S., Toyota, H., Inoue, T. & Nomura, S. Continuous synthesis of
magnesium-hydroxide, zinc-oxide, and silver nanoparticles by microwave plasma in
water. Mater. Chem. Phys. 131, 425–430 (2011).
25. St-Onge, L., Detalle, V. & Sabsabi, M. Enhanced laser-induced breakdown
spectroscopy using the combination of fourth-harmonic and fundamental Nd:YAG laser
pulses. Spectrochim. Acta Part B At. Spectrosc. 57, 121–135 (2002).

Chapter6. Characteristic of Argon Plasma Jet on Decomposition of Methane Hydrate for Hydrogen Production 2015
106
26. Shaikh, N. M., Hafeez, S. & Baig, M. a. Comparison of zinc and cadmium plasma
parameters produced by laser-ablation. Spectrochim. Acta - Part B At. Spectrosc. 62,
1311–1320 (2007).
27. Park, H. & Choe, W. Parametric study on excitation temperature and electron
temperature in low pressure plasmas. Curr. Appl. Phys. 10, 1456–1460 (2010).
28. Iza, F. & Hopwood, J. a. Rotational, vibrational, and excitation temperatures of a
microwave-frequency microplasma. IEEE Trans. Plasma Sci. 32, 498–504 (2004).
29. Le Drogoff, B. et al. Temporal characterization of femtosecond laser pulses induced
plasma for spectrochemical analysis of aluminum alloys. Spectrochim. Acta Part
B-Atomic Spectrosc. 56, 987–1002 (2001).
30. Physical Measurement Laboratory. NIST: Atomic Spectra Database Lines Form.
(2010). at <http://physics.nist.gov/PhysRefData/ASD/lines_form.html>
31. Sismanoglu, B. N. & Cunha, C. L. a. Optical and electrical diagnostics of
microdischarges at moderate to high pressure in argon. 40, 0–4 (2010).
32. Nomura, S. et al. Characteristics of in-liquid plasma in water under higher pressure
than atmospheric pressure. Plasma Sources Sci. Technol. 20, 034012 (2011).
33. Mork, M. & Gudmundsson, J. S. Hydrate formation rate in a continuous stirred tank
reactor: experimental results and bubble-to-crystal model. 4th Int. Conf. Gas Hydrates,
May 19–23 (2002).

Chapter 7
General Conclusions
Natural gas as an important source of future energy supply has been a worldwide
interest throughout the world when oil is exhausting. Natural gas demand is also expected to
increase in the recent year. World natural gas production increased by 1.1% in 2013, slightly
below the growth rate of global consumption. Therefore, natural gas performs an important
role as an energy supply to electricity generation through gas turbine and alternative
automotive fuel, in recent times.
Among various alternatives, hydrogen fuel provides the highest potential advantages
in terms of diverse supply and lowered emissions of pollutant and greenhouse gasses.
Hydrogen fuel has been recommended as the answer to the problems of air pollution and
global warming. It possesses all the key criteria for an ideal fuel substitute for gasoline,

Chapter 7. General Conclusions 2015
108
heating oil, natural gas, and other fuel, which are inexhaustibility, cleanliness, convenience,
and independence from foreign control. The electrochemical property of hydrogen becomes
one of its essential and interesting features, due to it can be utilized in a fuel cell. In addition,
hydrogen production is a large and growing industry with the annual production is estimated to
be about 55 million tons with its consumption increasing by about 6% per year. For the aim of
hydrogen production from gaseous or liquid fuels, a wide variety of processes is available and
varies according to the nature of the primary fuel used and to the chemical reactions involved
such as from biomass, hydrogen from water, and from reforming hydrocarbon.
Besides, the application of plasma technologies on hydrocarbon reforming to
produce hydrogen has been progressively attracting attention in global scale. Some of its
characteristic has become the consideration such as; fast ignition, the compatibility for a
broad range of hydrocarbons, removal of the catalyst sensitivity to trace impurities in the
gas stream, and compactness 1. Plasmas contain a variety of chemically active species
and energetic electrons, which can greatly promote the reforming chemistry. The
advantages of high products selectivity from thermal catalysis and the fast startup from
plasma technique have been developed by integrating plasma and thermal catalysis. The
overall reforming reactions in plasma reforming are the same as conventional reforming,
however, for the reforming reaction, energy and free radicals are provided by a plasma.
Essentially, plasma reforming is classified in two main categories: thermal and
non-thermal. In thermal plasma reforming, a high electric discharge (>1 kW) is applied in
order to raise both the electrons and the neutral species to a very high temperature
(50,000-100,000 K). Whereas in non-thermal plasma, the only parameter that increased is
the electron temperatures (>5000 K), while the bulk species temperature does not

Chapter 7. General Conclusions 2015
109
increase significantly. Thus, just a few hundred watts of power are involved since simply
the electrons are directly excited 2.
In addition, Plasma can be generated in a liquid from an underwater electrode by high
frequency or microwave irradiation. It is understood from the observation of the image of
in-liquid plasma using a high speed camera that plasma can exist instead of by contact with
liquid, but via vapor that generated from the liquid evaporation by the heat of plasma 3. For the
breakdown generation as well as for desire processing in application of plasma discharge in
liquids, HV, high-power discharges are generally required. The high energy from a power
source is first used to evaporate the liquid adjacent to the HV electrode, generating gas
bubbles that are subsequently ionized by large electric fields produced by the HV4. Nomura
et.al in 2003 reported the establishment of a plasma within bubbles created in a hydrocarbon
liquid, which was simultaneously irradiated by both ultrasonic waves and microwaves 5.
Methane gas hydrates have an icelike crystalline lattice of water molecules with
methane molecules trapped inside. They can be formed in the presence of hydrocarbons in
equilibrium with liquid water at a certain temperature and pressure conditions. A single
cubic meter of methane hydrate may contain as much as 170 m3 of methane. The
methane in gas hydrates is dominantly produced by bacterial degradation of organic
substance in low-oxygen surroundings near the seafloor. Also, the methane could be
originates from oil deposits deep within Earth that leak to the seafloor bottom through faults
and cracks. Likewise, gas hydrates in general, can consist of any combination of three crystal
structures relating to the size of the guest molecule, i.e.: (a) structure I (sI), (b) structure II (sII),
and (c) structure H (sH). Some of the typical gases such as CH4, CO2, and even cyclopentane
as liquid hydrocarbon become the “guest” molecules that trapped in a cage of water 6.

Chapter 7. General Conclusions 2015
110
Three processes have been recommended for dissociation of methane hydrates:
thermal stimulation, depressurization, and inhibitor injection. Thus, it is possible to generate
plasma using high-frequency stimulation of radio frequency and microwave irradiations in
the hydrate fields which are new exploration systems, including a method to reduce the
release methane and CO2 into the atmosphere.
Because of the methane hydrate resources are accumulated in ocean-bottom
sediments where water depth exceeds about 400 meters at a low temperature and high
pressure, thus it becomes essential to generate a stable plasma in seawater under the high
pressure. Discharge in seawater is very hard and require considerable high voltage. Plasma
had been generated in sea water with 5 kW power using 4th generation plasma reactor and
plasma air flotation with 1.2 kW of power 7,8. There are some studies reported about plasma
generation in atmospheric pressure 9–12, but only limited have been investigated under high
pressure. When plasma was generated under high pressure in pure water and artificial
seawater, it was found that along with the increase in pressure from 10 kPa to 300 kPa,
excitation temperature decreased about 4800K to 3500K in pure water and 3300K to 2300K
in seawater. The OH temperature is increased about 2500K to 5000K in pure water and 3400K
to 4300K in artificial seawater. Under the same circumstances, both bubble departure time and
bubble departure diameter in artificial seawater was larger than that in pure water.
The papers involved in this dissertation certainly support that hydrogen can be directly
produced from decomposition of methane hydrate by applying 2.45GHz Microwave plasma
irradiation and 27.12MHz Radio Frequency plasma irradiation under atmospheric pressure.
The mechanism of reaction in the plasma decomposition of methane hydrate began with the
methane hydrate dissociation (MHD) process in which CH4 and water were produced. Then,

Chapter 7. General Conclusions 2015
111
continued to the simultaneously occurring steam methane reforming (SMR) process and
methane cracking reaction (MCR) which decomposes the released CH4 into H2, CO and other
byproducts. Decomposition of methane hydrate by the Microwave plasma method can
optimize plasma decomposition of CH4 to produce hydrogen at a fast rate of CH4 release from
methane hydrate. Conversely, the methane hydrate decomposition by Radio Frequency
plasma method occurs at a slow rate of CH4 release from methane hydrate.
On the other hand, It is also confirmed that plasma irradiation has become feasible
under high pressure levels for hydrogen production by applying the argon plasma jet as the
alternative method for decomposition of methane hydrate. Although the hydrogen production
efficiency is less than that of the radio frequency plasma in-liquid, the reduction of carbon
dioxide by the thermal decomposition of Teflon from carbon monoxide making it possible to be
considered as an advanced promising technique in the future.
The excitation temperature has been determined from Boltzmann plot method in the
pressure range of 0.1 to 2.0MPa. Due to a higher frequency of electron collisions from ions
and atoms, the excitation temperature increases from 4477 - 7576K along with an increase of
gas pressure, whereas along the argon flow rate range of 100 to 3000mL/min, it reduces from
3960 to 2082K.
As the pressure increases, the enthalpy required during the process tended to remain
constant for the methane hydrate dissociation reaction (MHD), while the rest of basic reaction
i.e. Steam methane reforming (SMR) and methane cracking reaction (MCR) tend to increase.
In comparison with the other basic reactions, it is shown that steam methane reforming (SMR)
reaction becomes dominant concerning of methane conversion into hydrogen. The content
analysis of product gas by the gas chromatograph confirmed that methane-cracking reaction

Chapter 7. General Conclusions 2015
112
(MCR) taken place only to generated hydrogen and the C(s) during plasma irradiation, due to
the absence of C2H2 and C2H4 as the byproducts.
The entire research in this present dissertation has discovered that hydrogen
production from methane hydrate is feasible under atmospheric pressure by using 2.45MHz
microwave and 27.12MHz radio frequency plasma sources. Also has become feasible under
high pressure levels by applying the argon plasma jet, eventhough the hydrogen production
efficiency is less than that of the radio frequency plasma in-liquid. Therefore, the process with
the ultimate goal of producing hydrogen from hydrate fields on the seabed and in permafrost
regions using an in-liquid plasma method has been visibly applicable. It can be stated that
methane hydrates as gas storage and transportation at atmospheric pressure have been a
foreseeable source of hydrogen and could contribute hydrogen production from the aspect of
practical use.
References
1. Chen, H. L., Lee, H. M., Chen, S. H., Chao, Y. & Chang, M. B. Review of plasma
catalysis on hydrocarbon reforming for hydrogen production-Interaction, integration,
and prospects. Appl. Catal. B Environ. 85, 1–9 (2008).
2. Holladay, J. D., Hu, J., King, D. L. & Wang, Y. An overview of hydrogen production
technologies. Catal. Today 139, 244–260 (2009).
3. Mukasa, S. et al. Growth of bubbles containing plasma in water by high-frequency
irradiation. Int. J. Heat Mass Transf. 53, 3067–3074 (2010).
4. Yang, Y., Cho, Y. & Fridman, A. Plasma Discharge in Liquid. (2012).
5. Nomura, S. & Toyota, H. Sonoplasma generated by a combination of ultrasonic waves
and microwave irradiation. Applied Physics Letters 83, 4503–4505 (2003).

Chapter 7. General Conclusions 2015
113
6. Dendy Sloan, E. & Koh, C. Clathrate Hydrates of Natural Gases, Third Edition.
20074156, (CRC Press, 2007).
7. Ryu, S. M. et al. Characteristics of discharged sea water generated by underwater
plasma system. Curr. Appl. Phys. 11, S87–S93 (2011).
8. Ryu, S., Hong, E., Park, J., Yoo, S. & Lho, T. The study on the particle separation and
disinfection using plasma air flotation system. Int. J. Plasma Environ. Sci. Technol. 6,
1–4 (2012).
9. Mishra, L. N., Shibata, K., Ito, H., Yugami, N. & Nishida, Y. Characterization of pulsed
discharge plasma at atmospheric pressure. Surf. Coatings Technol. 201, 6101–6104
(2007).
10. Jasiński, M., Dors, M. & Mizeraczyk, J. Production of hydrogen via methane reforming
using atmospheric pressure microwave plasma. J. Power Sources 181, 41–45 (2008).
11. Wang, Y.-F., You, Y.-S., Tsai, C.-H. & Wang, L.-C. Production of hydrogen by
plasma-reforming of methanol. Int. J. Hydrogen Energy 35, 9637–9640 (2010).
12. Putra, A. E. E., Nomura, S., Mukasa, S. & Toyota, H. Hydrogen production by radio
frequency plasma stimulation in methane hydrate at atmospheric pressure. Int. J.
Hydrogen Energy 37, 16000–16005 (2012).

114
Acknowledgement
In the name of Allah, the Most Gracious and the Most Merciful Alhamdulillah, all
praises only to Allah for the strengths and His blessing in completing this dissertation. After all,
I would really like to reveal my wholehearted appreciation to all those who have enabled me to
complete this research. The present dissertation would have not been completed without the
guidance, help, support, and efforts of a lot of individuals. As well, Ehime University of Japan
has become the place whereby this dissertation has been finished and achieved in Doctoral
Program of Graduate School of Science and Engineering.
First and foremost, I would like to express the deepest appreciation to my advisor,
Professor Shinfuku Nomura, for all the wisdom, encouragement, guidance, and invaluable
suggestion during my study. For the unwavering support, I am truly grateful to have him as
my professor.
My sincere thanks also go to all dissertation advisers, Professor Hiromichi Toyota
and Professor Masaya Nakahara for their encouragement and support. I am deeply grateful
to Senior Assistant Professor Shinobu Mukasa for providing huge numbers of priceless
response for some parts of the content of this dissertation.
During the course of this work, the constant association with the members of
methane hydrate experiment team has been most pleasurable. I would like to thank Mr.
Toshimitsu Tamura, Mr. Ken Fujiwara, Mr. Hozutaka Tanaka. I also would like to thank Dr.
Erwin Eka Putra for introducing me to this laboratory for the first time and supporting me to
take this change, Dr. Yoshiaki Hattori for some discussion regarding this study and usage of

115
some apparatus, Mr. Tomohide Kitamae as my first tutor, and all members (past and present)
in Heat and Mass Transfer Laboratory for helpful assistance. Next I thank to all doctoral
students in Heat and Mass Transfer Laboratory: Mr. Fadhli bin Syahrial, Mr. Muhammad
Agung, and Mr. Andi Amijoyo Mochtar, respectively, for their great support.
I would like to acknowledge the financial support from Directorate General of Human
Resources for Science, Technology and Higher Education of Indonesia (DIKTI). I would also
like to thank the Graduate School of Science and Engineering Ehime University for its
financial funding for attending the conference.
A special thanks I want to give to my both parents who already passed away since I
was a child. And definitely, I would like to thank my mother in law, my father in law and all of
my family in Indonesia for their infinite support. I also heartily thank my son Muhammad Faiz
Al-Ghifari, my daughters Nayla Syafiqah and Muthia Raihanun for all their love,
understanding and patience. Finally, this last word of acknowledgement I have saved for my
dear wife Novriany Amaliyah, I am eternally grateful to you. Thank you for being the best
partner during my study, for being with me through the good and bad times, for all your love
and support. To you I am eternally grateful.