· following a congressional mandate* to dev~lop new and ... and its special focus as a...
TRANSCRIPT

Thh, microfiche v,Us produced from documents received for hUllusion in the NCJRS data base. Since NeJRS cannot exercise
II)tJ'ntnl over the physical con dit ion t'lJf t he do cuments submitted, th~J individual frame quality will vary. The resolution chart on
'ltltis ~rame may be used to evaluah the document ~uality.
1.0
1.1 ------------
~~ 111!12,8 111112,5
n~ IIIII~ ~ !,;; I:I~~ l!.o 1"1 0 :: ~b ... ~ ..... ~
111111.25 11111.,1.4 111111.6
MICROCOPY RESOLUTION TEST CHART NATIONAL BUREAU OF STANDARDS 196.l··A
Microfilmin& procedures used to create this fiche comply with
the standards set forth in 41CFR 101·11.504
Points of view or opinions stated in this document are
those of the author!s! and do not represent th official position or policies of the U.S. Department of Justice.
U.S. DEPARTMENT OF JUSTICE LAW ENFORCEMENT ASSISTANCE ADMiNISTRATION NATIONAL CRIMINAL JUSTICE REFERENCE SERVICE WASHINGTON, D.C. 20531
f--*"'- -.. • ..... -----... .,.. ~ "--... .-". "<
,Date filmed t -. __ , .-,i~ ..... _ .,
1/29/76
-- -- ---'---- ~ ---~ --'-~~-- -- -""""-------- -------
. . / '.' .
. ~ '. '.' . ~ .
NILECJ-STD-0304.00 FEBRUARY 1975
( [}
\ I. r ~ .' \. , ..... • \.' 'r.,'
~ t· ... 10, •• ..... ''I , ' .. .
.41 .. I *' • , ...... ":..... ..
PASSIVE, FIRST GENERATION NIGHT VISION DEVICES
r:",.".'~';. .... r\.,-"'t'-""'~.~" / .• ~.".:f' .... : . .r ..... , ..... r..-'\ .- •. • .. _ .. \: ....... ; .. ,!."~~,t.:r-,, z.....1 1 • V' I V 0 , t l C • ... • ... ~J •• # "., •• ~" ~ ! ; l,o" • .J ..... ' .. : .. t .\ • 1 ~ l J ! ~ ~.l (.~ ~:.., V I ..
1\. ~, I '. ... fl.·.. ~ 1 'r· l' ~ ) I"'" , '1 (' .. , .. , '.", " . \,.... ~ v, 1...". ~.' ,-0, t.' '. -.: t. ~ ,.;.
. • ~". t
- . . .. "." ....... ,. t"t ~ •
~ ........ ; ~: ~ a .... ~ 4 ••
.. , .. ,..... .. ~,.,. ._ "1000. '-~ .... '''''''~ ••
- ----------~--------------------------------------~
If you have issues viewing or accessing this file contact us at NCJRS.gov.
•
,
LAW ENFORCEr~~ENT STAr,,'Dl\RDS PROGfU-\i\t~ t h G
FOR
PASSIVE, FIRST GENERATION NIGHT VISION DEVICES
l\ Voluntary National Stai1dar~.Promulgated by the
National Institute of Law Enforcement and Criininal Justice.
FEBRUARY 1975
u.s. DEPARTi\1ENT OF JUSTICE
;r •.•. \ 'f"
L I' 1 ) I 'I ! \' , , \
Lavv Enfcrcement Assistance Adm inistration National Institute of La\iv Enrorcenlent and Criminal Justice
For $lie by tbe Sup..'rlnt,'ntlrnt 01 O<XUtn~DL'. U.S. GO\'~rll!llCnt rrlnllnl: omen WG..lhlc~:on. 0.<:. ~;~IO'l- Vrloo cents
(Stock No.
I .<
LAW ENFORCEMENT ASSISTANCE ADMINISTRATION
Richard W. Vel de, Administrator Charles R. Work, Deputy Administrator
NATIONAL INSTITUTE OF LAW ENFORCEMENT AND CRIMINAL JUSTICE
Gerald M. Caplan, Director
A C K N 0 VI LED G t·, E N T S
This standard was formul~ted by the Law Enforcement Standards Laboratory of the National Bureau of Standards under the direction of Lawrence K. Eliason and Marshall A. Isler, Managers, Security Systems Program, and Jacob J. Diamond, Chief of LESL. Technical research was performed by Jos~nh C. Richmond of the ()ptical Radiation Section of the rH3S flent Division. The development of this standard was sponsored bv the NILECJ Office of Research Programs, Geoffrey M. Alp~in~ Director; Advanced Technology D;visiQn, Joseph T. Kochanskl, Director.
i i
. ' \ ".:

NILECJ Standard For
Passive, First Generation Night Vision Devices
Contents
F 0 re~JO rd .. . . . . . . . . . • . . . . 1. Purpose and Scope .... ..•...... 2. Classification • . . . .. . .. 3. Definitions ... " . . . . . .. 4. Requirements ........ . ...... .
4.1 User Information ..... . '4.2 Workmanship . • • . ....
4 . 3 ~~ ark i n q • • • • • • • • • • 4.4 Size a~d Weight . . . . . . . .. . 4.5 Objective Lens '1ounting ....... . 4.6 Battery Compartment .........• 4.7 Controls ......•..• 4.8 Tripod Socket ......•...•.... 4.9 EyepiecE~ • • • • • • • • •••••••
...... 4.10 Optical Gain. . . . . . . •. . .... '" 4.11 Optical Gain Stability .....•••... -4.12 Light Equivalent Background ....... . -4.13 Licht Induced Backqround . -4.14 lu~inance of Outout Screen ... . -4.15 luminance Uniformity ........... . -- 4.16 Cathode and Screen Duality .... . - 4.17 Contrast Transfer Function ........ . - 4. 1 8 Vie ~J e r . D 'j s tor t ion . . . . . • . .. . ---4.19 Flare .............. « ••
- 4 • 2 f) ,. e fl1 per a t u rea n d Hum i d i t y. • • •. •••• ~ 4.21 Vibratiof1\ Resistance. •. . ..
5. Test Methods 5.1 Sampling. . . . . . . . .. . .. 5.2 Testing Schedule. . ..••...... 5.3 Test Rooms ......•..•••.•••. 5.4 Test Equipment ...••.......... 5.5 Configuration .... . .•...... 5.6 Eyepiece Tests. . ........ . 5.7 Ge~dral Test Procedures
-5.8 Optical Gain Test .......•.....
iii
Page
""' 5.9, - 5.10 - 5.11 - 5.12 - 5.13 - 5.14
- 5.15 - 5.16 - 5.17 _C· 13
5.19 -. 5.20
Appendix Appendix Appendix Appendix Appendix
•
Optical Gain Stability Test ....•• light Equivalent Background Test. . .• Light Induced Background Test ..•••.• Output Screen luminance Test ' ....•. luminance Uniformity Test . " •. ~athode and Screen Quality Test ... . Contrast Transfer Function Test ..... . Distortion Test .....•.••••. Flare Test .............•... High and Low Temperature Storage, Oreration and Thermal Shock Tests ..... Humidity Test . . .....•. Vibration Test. " '" .•... A--Light Source ..•. 8--Scanning Device. . .. . .... C--Blackbody Cavity D--Plane Source Soot ........ . E--Large Size Res~lution Chart Pattern
Fabrication ..... . . ... .
iv

\
. , FOREWORD
Following a Congressional mandate* to dev~lop new and improved techniques, systems, and equipment to strengthen law enforcement and criminal justice, the National Institute of Law Enforcement and Criminal Justice (NILECJ) has established the Law Enforcement Standards Laboratory (LESL) at the National BureaU of Standards. LESL's function is to conduct research that will assist law enforcement and criminal justice agencies in the selection \nd procurement of quality equipment.
~ \
In response to priorities established by NILECJ, LESL is (1) subjecting existing equipment to laboratory testing and evaluation and (2) ~onducting research leading to the development of several series of documents, including national voluntary equipment standards, user guidelines, state-of-theart surveys and other reports.
This document, ,ILECJ-STD-0304.00, Passive, First Generation Night Vi$ion Devices, is a law enf9rcement equipment standard developed ,y LESL and approved and issued by NILECJ. Additional standard1!1 as well as other documents will be issued under the LESL prog1jam in the areas of protecti va e:quiprnen t, communications equi~)ment, securi ty systems, \'leapons;, emergency equipment, investig~lti'IJe aids, vehicle's and clothiIilg.
This equipment standard is a technical document consisting of performance and other requirements together with a description of test methods. Equipment which can meet these requirements is of superior quality and is suited to the needs of law enforcement agencies. Purchasing agents can use the test methods described in this standard to determine firsthand whether a particulaJ: equipment item meets the requirements of the standard, or they may have the tests conducted on their behalf by a qualified testing laboratory. Law enforcement personnel may also reference this standard in purchase documents and require that any equipment offered for purchase meet its requirements and that this compliance be either guaranteed by the vendor or attested to by an independent testing laboratory.
The necessarily technical nature of this NILECJ standard, and its special focus as a procurement aid, make it of limited use to those who seek general guidance concerning passive, first generation night vision devices. The NILECJ Guideline
*Section 402(b) of the Omnibus Crime Control and Safe Streets Act of 1968, as amended.
v
,
Series is designed to fill that need. We plan to issue guidelines to this as well as other law enforcement equinment as soon as possible, within the constraints of available' funding and the overall NILECJ program.
The guideline documents to be issued are highly readable and tutorial in nature in contrast to the standards, which are highly technical, and intended for laboratory use by technical personnel. The guidelines will nrovide, in non-technical language, information for purchasing agents and other interested persons concerning the capabilities of equipment currently available. They may then select enuirment appropriate to the performance required by their aqency. Recommendations for the development of rarticular guidelines should be sent to us.
NIlECJ standards are subjected to continuing review. Technical comments and recommended revisions are invited fro~ all interested parties. Suggestions should bq addressed to the Program Manager for Standards, National Institute of law Enforcement and Criminal Justice, law Enforcement As~istance Administration, U.S. Department of Justice, Washington, D.C. 20530.
Lester D. Shubin Program Manager for Standards National Institute of law
Enforcement and Criminal Justice
vi

t'
NIlECJ STANDARD fo,..
•
NILECJ-STD-0304.00
PASSIVE, FIRST GENERATION NIGHT VISION DEVICES
1. PUR PO S E MID S COP E
The purpose of this document is to estab1ish performance requirements and methods of test for passive nioht vision devices used for law enforcement. It applies to first . generation devices, which employ three-staqe.electrosta~lcal1y focused image intensifier tubes havinq ~ max:mum effect1ve diameter of 25mm and which operate at nlght 1n the absence of operator supplied artificial illumination.
2. CLASSIFICATION
For the purposes of this standard, passive night vision devices are classified into two classes on the basis of optical gain.
2.1 Class A
Passive night V1S10n devices designed for use where the ambient illumination is less than 0.005 lumens per souare meter.
2.2 Class B
Pasiive niaht V1S10n devices designed for use where the ambient illumination is at least n.005 lumens per s~uare Meter.
3. DEFINITIONS
3.1 Automatic Brightness Control
A control circuit in the electronic power supply of a night vision device that limits the current in the electron beam of the image intensifier tube to a preset value by varying the voltage across the tube. This limits the optical gain and brightness of the output screen when viewinq bright objects, protecting the intensifier tube frOM damage if accidentally turned on in a bright environMent, or if suddenly subjected to bright lights during use.
1.
c.
3.2 Contrast Transfer Function
The ratio of the modulation contrast in the image of a square wave pattern to that in the pattern. Sometimes called square wave modulation transfer function.
3.3 Critical Focus
The focal position at which a lens or an optical system gives the sharpest image under a given set of conditions.
3.4 Distortion
Failure of an image to truly represent the shape of the object imaged. due to variation in'magnification over the field of view.
3.5 Field Emission
An extraneous emission which appears as bright spots or patterns that flicker or appear intermittently in one general position on the phosphor screen of a night vision device. It is voltage dependent, and appears when there is no illumination on the photocathode.
3.6 Flare
Ghost images on the output screen of a night vision device produced by light from a bright source striking the outer surface of the objective lens, specularly reflected from the lens elements, diaphragm or barrel tp form definite patterns in the image. The bright source causing flare may be inside or outside the field of view.
3.7 Group Number
The large numbers that deSignate the groups of resolution patterns in the Air Force 1951 resolution test chart (see figure 1).
3.8 Ion Spot
A bright diffuse area or spot near the center of the field of a night vision device. It increases in luminance as the photocathode illumination is increased, but may be swamped out at high photocathode illumination.
2.

3.9 Light Equivalent Backgr~und
The luminance of a night vision device output screen when no light is incident on the input photocathode. This luminance is evaluated in terms of the irradiance on the photocathode required to produce an equivalent lum~nance in the absence of background. It is a measure of the dark current of the image intensifier tube.
3.10 Light Induced Background
The non-image-forming, more-Dr-less uniform background light from the surface of the outout ohosphor screen of a night vision device that is produced by light on the objective lens.
3.11 Luminance
Photometric brightness. The visual brightness of a surface, expressed as the 1Jminous flux leaving the surface in a given direction per unit solid angle ana per unit area projected normal to the given direction. Thp SI unit is the candela per square meter (cd/m2).
3.12 Modulation Contrast
For a periodic pattern of a given spatial 'frequency, in which some optical property such as luminance, illUMination, radiance. irradiance, transmittance or reflectance varies periodically, the ratio of the difference between the maximum and minimum values of the proper~y to their sum.
3.13 Modulation Transfer Function
A measure of the image quality .of an imaginlJ system or any part thereof, such as a lens, film,.TV camera, etc., usually plotted as a function of the spatial frel1uency in the image. At anyone spatial frequency, it is the ratio of the modulation contrast in thE image to that in the object imaged, when the object luminance varies sinusoidally in one dimension.
3.14 Optical Gain
The ratio of the luminance of the output screen of a night vision device to the luminance of the source, when viewing a large area uniform diffuse source having the spectral distribution of CIE standard source'A.l
1 The spectral distribution of CIE Standard Source A is given in ASTM Standard Recommended Practice for Sp~ctrophotome~ry and Description of Color in CIE 1931 System, E 313-66. The spectral distribution of Source A is indistinguishable from that of a blackbody at 285GK on the 196R International Practical Temperature Scale, over the ranoe of 350 to 1000 nm.
J. I ---I .
3.15 Optical Transfer Function
!he spatial frequency response of an optical system. It conslsts of two parameters; one descri~es the variation of mod u 1 a t i ? n ~Ii ~ h spa t ~ a 1 f r e que n c y, and the a the r des c rib est II e ~hase shlft,(ln the lmage) associated with that fre~uency. It 1S the Fourler transform of the line spread function.
3.16 Pattern Number
T ~ e n urn b e r des i 9 nat i n 9 ani n d i v i d u alp a t t ern \i nag r 0 u pin the Alr Force 1951 resolution test chart. A Dattern c~nsists of tW? e1ement~, each c?nsisting of three lines and two spaces, one,wlth the 11nes ve~tlcal, and the other with the lines h ? r 1 ~ 0 n tal. T h ,e spa t 1 a 1 f r e que n c y, f, i n 1 i n epa irs n e r ml111meter, of any pattern can be computed from the group num~e~, G, (any integer or zero), and pattern number' r (a posltlve lnteger from 1 to 6), as '
f = 2 [G + (p - 1 )/6J
3.17 Relay Lens
. A photographic lens designed for use at s~ort viewing ~lstances, where the magnification is near unity. A relay le~s 1~ ~sed to,photograph the image on the output screen of a niqht V1Sl0n devlce.
3. 18 Vi ewer
A night vision device. A sectional drawinq of a typical viewer is shown in figure 2.
4 • R E QUI R H1 E N T S
4.1 User Information
Th~ information supplied with the viewer by the manufacturer or distributor shall include:
(a) Complete operating "instructions including details on eye pie c e and 0 b j e c t ; vel ens 'f 0 c u sin 9 • •
(b) The focal length (in mm) and the f-number of the objective lens, and the T-number if available.
(c) The magnification factor of the eyepiece lens.
4.
.. ----------------------~~-----------------------------------
.:."
,.-------------- ----
, ,
(d) Complete details on the thread used for mounting tile eyepiece! lens.
(e) A complete identification or descrintion of the objective lens mount.
(f) Identification of the battery required and a source of supply including catalog number.
(9) Information on the use of a camera to photoqranh the image on the output scr~en of the viewer, inc1udinq relay lens, and the camera mount if re~uired.
(h) A list of additional objective lenses available from the manufacturer. .
(i) A statement that commonly available photographic lenses can or cannot be used as objective lenses. A source of supply and catalog number for any required adaotor, or an engineering drawing, shall be furnished.
4.2 Workmanship
Workmanship shall be first class ifl every respect. All threads shall fit smoothly and firmly, with essentially no play. All exterior surfaces shail have a non-glossy finish. All surfaces normally handled during use shall have a non-slip finish.
4 . 3 t·, ark i n 9
The night V1S1on device shall be permanently and 1eqib1y labeled with the manufacturer1s naMe, trade name of the device, if any, and model and serial numbers.
4.4 Size and Weight
The viewer, complete with monocular eyepiece. normal ~bjective lens (focal length not over 80 mm), and a pistol grip 1f used, shall not exceed 36 cm (14-1/8 in) in length, and its weight shall not exceed 2.5 kg (5.5 ·lb). .
5.
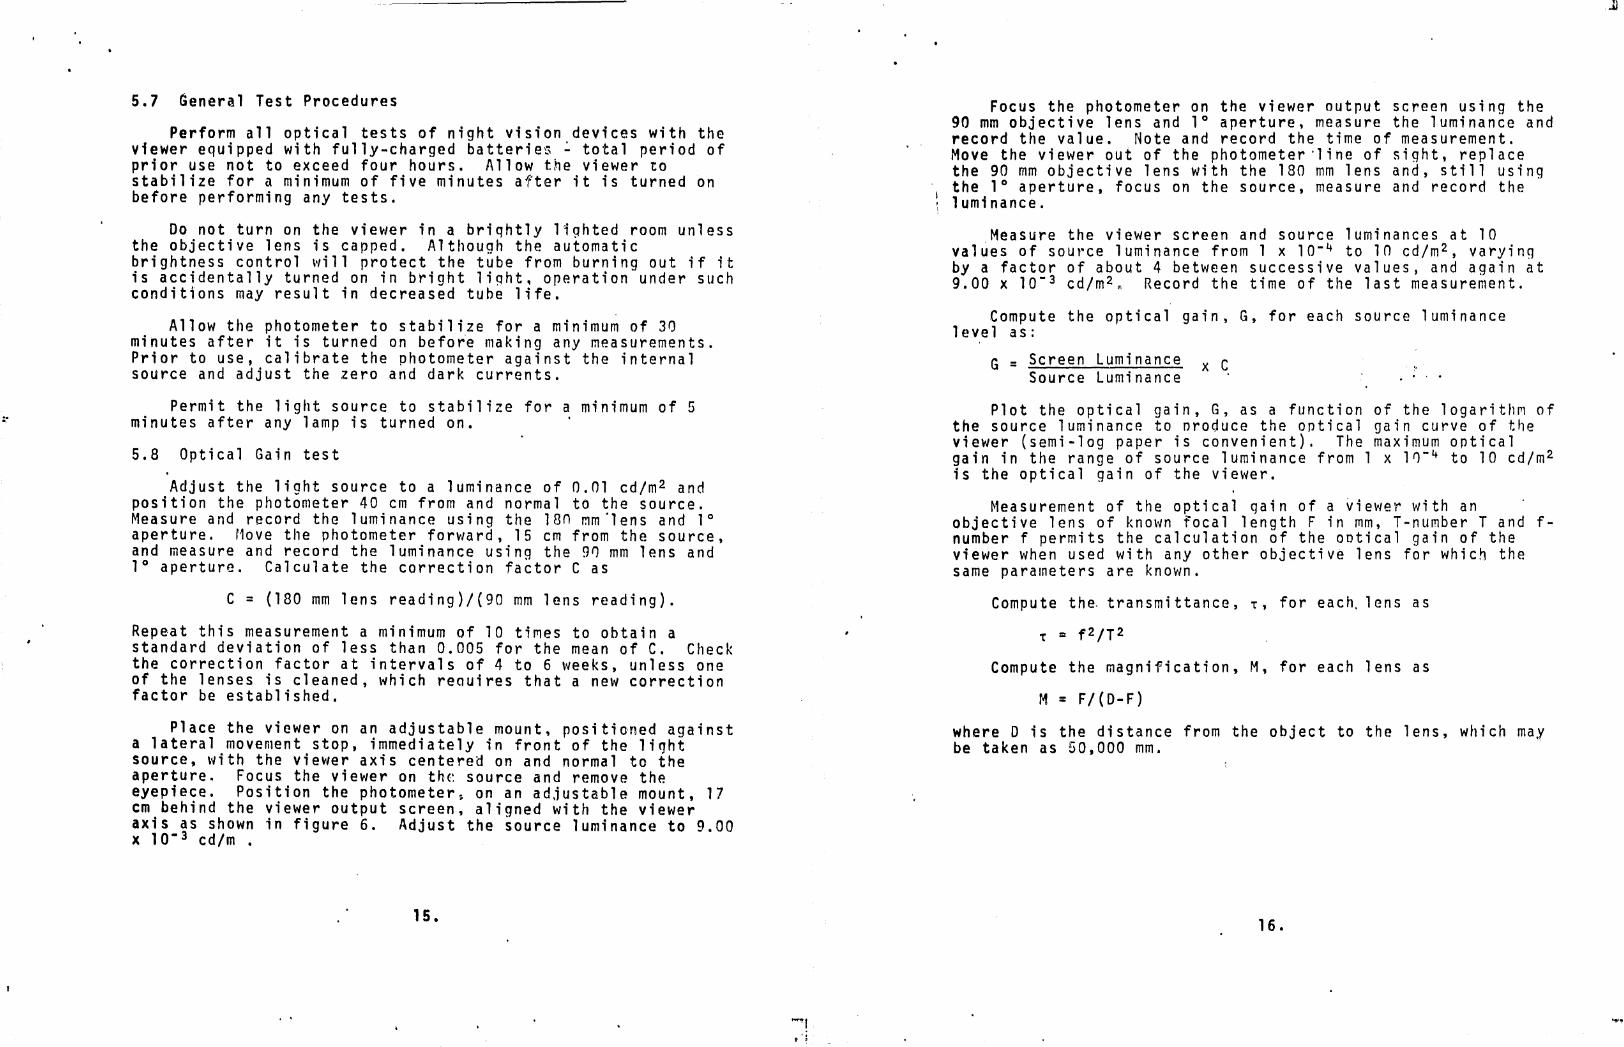
4.5 Objective Lens Mounting
T~e objective lens mounting shall permit easy and rapid changlng of lenses. The mount shall ho'ld the lens in a fixed and reproducible position relative to the input nhotocathodp of the night vision device, and shall lock in place oreventing" 1 ens rem a val wit h 0 u t ; n ten t ion air e 1 e a s e . The foe u sin q s 11 all be smooth and positive. The full focal range from the nearest focal point to infinity shall be covered by no more than one complete revolution of the lens barrel, focusing knob, or focusin~ l~v~r. The 1nfinit~ stop,shall be nlaced slightly beyond 1nflnlty (provldlng dlscern,ble defocusing) allowinq movement beyond and return to the position of sharpest focus when focusing on distant ubjects.
4.6 Battery Compartment
The battery compartment shall be clearly marked on the outside, or inside cover, with the type, vo)taqe, and identifying number of the battery or batter'ies' rCFluired. The proper polarity for inserting or connectina the batteries shall be clearly marked. If the device can be d~ma~ed'by insertion of batteries in reverse polarity, the contacts .sha'll be of such ~ e s i g nth ate 1 e c t ric a 1 can t act i s not mad e i f bat toe des. are lnserted with reverse polarity.
4.7 ContrQ1s
A1l switches and control settings shall be identified as to funct10n,by clear markings that are visible in diM liqht. The pow e ~ ~ \'/ ~ t c h s h a 11 be, 11 r a v i d ~ d \'/ i t h. a 9 u a r d, tom i n i m i z P. t tH~ posslb1l1ty of the sWltch belng turned on accidentally.
4.8 Tripod Socket
The night vision device shall be equipped with one or more metal tripod sockets (1/4 - 2n thread) in conformance with USASI Standard PH 3.6-1952, Reaffirmed 1963. 2 Threaded plastic is unacceptable. The depth of the threaded portion of the hole shall be not less than 5 mm (0.2 'in) wh,en fabricated of brass or s~eel, and not less than 7.5 mm (0.3 in) when fabricated of alumlnum or other soft metal. The axis of the tripod socket(s) shall be normal to the optical axis bf the viewer and lie in the vert~cal P!ane through it. There shall be a socket located s~ that 1tS aX1S pa~ses,near the center of gravity of the Vlewer for any comblnatl0n of object~ve lens, eyepiece, and camera and adaptor. When tested in accordance with paragraph 5.5, the torque required to maintain tile viewer in a horizontal pl ane sha 11 not exceed 1.10 ne\,/ton meter (9.7 1 bf-i n) .
2 Available from the American National Standards Institute, 1430 Broadway, New York, New York' lOn18.
6.
.4i I
.. ..

Accessories (lens, eyepiece, or camera with adaptor) shall be supplied with a combination support/mounting plate if the torque required to maintain the resulting assembly in a horizontal plane exceeds 1.10 newton ~eter (9.7 lbf-in). The sUpport/mounting plate ~hall have one or more tripod sockets meeting all requirements of this paragraph.
4.9 Eyepiece
4.9.1 Radiation
When measured in accordance "Ii ttl paragraph 5.6.1, the eyepiece radiation count shall not exceed twice the background radiation count.
4.9~2 Focus Adjustment
When tested in accordance with oaragraph 5.6.2, the eyepiece focus shall be adjustable over a range of at least B diopters, have a minimum positive adjustment of 2.0 diopters and a minimum negative adjustment of 4.0 diopters, and the adjusting torque shall not exceed 0.80 newton meter (7.1 lbfin) .
4.~.3 Curvature of Field
When measured in accordance with para~raph 5.6.3, the curvature of field of the eyepiece lens shall be not more than one half of its depth of focus, when focused at infinity.
4.9.4 Distortion
When tested in accordance with paragraph 5.6.4, the eyepiece lens shall have zero positive distortion, and not more than 10 percent negative distortion.
4.10 Optical Gain
When measured in accordance with paraqranh 5.8, the optical gain of a Class A night vision device shall be 10,000 or more, and the opt i cal 9 a i n of a C 1 ass B de vic e S)1 a 11 he 1, f) 0 0 0 r m 0 r e •
4.11 Optical Gain Stability
When evaluated in accordance with paragraph 5.9, the optical gain shall not change hy more than 5 percent per hour.
7.
. H
4.12 Light Equivalent Background
When evaluated in accordance with paraqraph 5.10, the light equivalent background shall not exceed 1 x 10-& cd/m 2 •
4.13 Light Induced Background
When evaluated in accordance with paragraph 5.11, the light induced background shall not exceed 0.08 for a Class A viewer or 0.10 for a Class B viewer.
4.14 Luminance of Output Screen
When measured in accordance with paragra~h 5.12, the luminance of the output screen shall not exceed 25nn cd/m 2 . There shall be provision for limiting the luminance of the output screen to 500 cd/m 2 , for use under da~k adanted conditions. A red filter may be used for thlS purpose.
4.15 Luminance Uniformity
When measured in accordance with paraqraph 5.13, the luminance of the output screen shall not fall outside the tolerance limits shown in figure 3, over the circular area centered on the optic axis of' the screen having a diameter of 80 percent of that of the output screen.
4.16 Cathode and Screen Quality
When the output face of the screen is examined in accordance with paragraph 5.14, with th~ objective lens carped, i t shall s h 0 \'I no i on spots, fie 1 d em iss i on., 1 e a k a CJ e or faceplate breakdo\vn. Hh~n the device is vie\'J~ng a source of uniform luminance, the '1ght ~nd dark spots wlth contrast greater than +30 percent relative to the surrounding area shall not exceed thi numbers listed in table 1 for 18 mm diameter tubes or in table 2 for 25 mm diameter tubes. There shall bR no ob~;ous dark boundaries between fiber optics bundles.
4.17 Contrast Transfer Function
When evaluated in accordance with paragraph 5.15, the contrast transfer functions at the respective spatial frequencies shall be not less than the values given below. Modulation transfer functions (r1TF) may be used instead of contrast transfer functions (ClF).
8 .

Spatial Frequency (Line Pairs per mm)
2.5 7.5
16.0
4.18 Viewer Distortion
CTF P1TF) Class A
0.90 0.58 O. 18
eTF U1TF) Class B
0.88 0.55 0.15
When measured in accordance with paragraph 5.16, the distortion shall be 20 percent or less.
4.19 Flare
When measured in accordance with oaragraph 5.17, the flare rating of Class A devices shall be no lower than -1, and the flare rating of Class B devices shall be no lower than -3.
4.20 Temperature and Humidity
When subjected to the high and low t~mperature storage, operation and thermal shock test in accordance with naraqranh 5.18, and the humidity test in accordance with paragraph 5.19, the 'vie\'Jer (complete with objective le,ns, eyepiece, and bat t e r i e s) s halls h 0 \', nor e s u 1 tan t 1 0 0 sen i n q, b rea k a q e 0 r corrosion of any finish, optical coating, connection or component, no condensation of moisture within the ontica1 system, no high voltage breakdown. and no failure to operate.
4.21 Vibration Resistance
After being subjected to the vibration test in accordance wit h par a g rap II 5. 2 0, the vie \-/ e r (c 0 m p 1 e t e wit hey e pie c e , objective lens, and batteries) shall show no evidence of intermittent electrical contact, loosening of parts, fallurc or breakage of any connection or component. or any change i'1 the quality of the image.
5 • T EST r1 E THO D S
5.1 Sampling
One viewer shall be selected at random for test. If this viewer passes all tests, it is considered to have complied with this standard. If this viewer fails to meet any re~uirement of this standard, testing of the unit shall be terminated and a re-test sample of two additional viewers shall be selected at random and subjected to test. If both additional viewers meet all requirements, the sample is considered to have complied with the standard.
9.
... ~ I
I I I
"
5.2 Testing Schedule
The testing sequence shall follow the numerical order of test method presentation within this standard.
Tests for optical gain, output screen luminance, contrast transfer function, flare, temperature and humidity, and vibration shall be repeated using each objective lens supplied wit h the vie \', e r . Allot her vie \'/ e r 0 p tic a 1 t est s s hall be performed one time, using any of the objective lenses supplied with the viewer.
5.3 Test Rooms
Optical tests must be performed in laboratories in which the luminance df any light source or leak does not exceed 1 x 10- 5 cd/m2. The luminance of a sheet of white naner "laced in any area viewed by the photometer during ~ test shall not exceed 1 x 10- 9 cd/m2, with all lights off. Precautions must be taken to shield pilot lights on telephones and e~uipment; and electronic tubes, so that no stray light escanes.
A minimum room size of 3.2 x 7.3'm (q.8 x 22.2 ft) is required for all tests except distortion and flare, which require a minimum size of 2.5 x 2n m (7.6 x 61 ft). The length of the latter room must be at least 8 m (24.4 ft) nlus 133 times the foc&l length of the longest focal lenqth objective lens on a device to be tested. A minimum room heiqht of 2.5 m (7.6 ft) is required. ' .
5.4 Test Equipment
5.4.1 Variable Luminance Light Source
The light source shall have the srectral distribution of eIE Standard Source A,l be completely d;ffu~e, be uniform in luminance to within 2 percent over its entire area, and haNe a luminance that is variable over the range of 1 x 10- 4 to lO~ cd/m2. For the light induced background test, the source shRll be large enough to fill the entire field of view of the view~r being tested. at a distance of 1 m. The vertical dimensions of the iource when measuring luminance uniformity must be larqer than the effective diameter of the opjective lens to be tested plus the diameter of the image intensifier tube in the device. For all other tests, the minimum diameter of the source must be larger than the effective diameter of the objective lens on the device to be tested. A source meeting these reouirements is described in appendix A. The use of a larQe area nlane illumination source is satisfactory, but is difficult to design in accordance with the above requirements.
10.
. ...

5.4.2 Photometer
The photometer shall measure luminance over the range of approximately 5 x 10- 5 to 100 cd/m2. The photometer must have at least three objective lenses: one of long focal length, approximately 180 mm; one of intermediate focal length, providing 1 to 1 magnification at a viewing distance of approximately 10 ~m~ and a microscope objective having lOx magnification, for use as a microphotometer.
The photometer shall have six apertures located in the objective lens image plane, five ci~cu1ar and one in the form of a rectangular slit. The circular apertures shall subtend conical angles of view having included ,lane anqles of approximately 2, 6 and 20 minutes, and 1 and 3 degrees, and fields of view, when used with the lx magnification lens, having diameters of approximately n.1, 0.3, 1.n. 3.0 and In.n mm. The slit aperture shall have a length ten times its width, and when used with the lOx magnification lens, the field viewed by the slit shall be no larger than 5 by 50 ~m.
The size of the various apertures may, vary by as much as 20 percent from these requirements, but the actual size shall be known to at least 1 percent.
The photometer shall provide both a di~ital display, reading in cd/m2, and an analog voltage proportional to the digital display. When properly calibrated, by uSP. of a 1araearea source of known 1uminance,3 the photometer error shall not exceed 5 percent, and the repeatability over a period of 1 hour shall be within 1 percent over the entire range.
A suitable photometer can be assembled from modular components manufactured by Gamma Scientific, Inc., 3777 Ruffin Road, San Diego, California 92123. The Spectra-Pritchard Model 1980 with 25 x 250 ~m slit aperture option and COB control console, manufactured by the Photo Research Division of Kollmorgen Corp., 30n North Hollywood Way, Burbank, California 91505 is also suitable.
5.4.3 Linear Motion Device
A linear motion device is requiren to move the resolution chart vertically in front of the anerture of the light source during the contrast transfer function test, and to move the viewer vertically during the 1uminence uniformity test. The linear motion device shall have constant vertical speeds in the range of 1 to 15 mm/min, and be capable of driving a load of 10 kg (22 lbs) with essentially no angular movement of the load while moving. A suitabl~ device is described in appendix B.
3Boris ~1erik, Light and 'Color r"leasurements of Small Light Sources, pp. 70-71. G~nera1 Electric Co~pany (1968).
11.
'" ~ i
5.4.5 Adjustable Testing Mounts
One adjustable mount shall 'd h 0
di~ections parallel and normal ~ro~~ e °r1zonta~ adjustment in adJustable mount f th 0 e opt1.ca1 aX1S. A second adjUstment in a ~or~;ont:1P~f!~:ept:r'1~n~11 provide microMeter line of sight d 0 0 ra e and normal to its of Sight. ' an 1n a vertlcal direction normal to the ,line
5.4.6 Test Charts
Three test charts are re~uir d' t ' . the Air Force 1951 design a ne e t : ~o resolutl0n charts of
=::::::ro:e:~:~:~onB:~~o~~:!~~t':S~::h:~::r~;~~~~Ylr~d!~d a from the Graphic Arts Resea I on es c arts are avallable Technology, Rochester, New ~~~kCf~~~~' RTo~hester ~nstitute of transparency is °d t'fo d ' '. e neqatlve and the Positivelr:~l~c~~ona~hRe~ol~t~on Test bbject, TR-3-72, Water Resistant. For use the a~ f~s tt~rqe Sh ca1e Test Ohject, cemented to a rigid flat ba k' e eC
hl0n c art must be
c lng, suc as plywood. The distortion chart (f' 4)'
within about 6 mm, painted !~~~: dlS l.~ m snuare, plane to of black 1inesi 3 mm wide on 10 an conslsts of a square qrid with sides at 45° to the grid ~m ~en~ers. A center snuare the four squares whose co~nersa~~=t1St ~~med by diagonals of is a~tached to a mount that can be ~. tedcp.f·nter: The chart vertlca1 and horizo t 1 l' a JUS e or tllt about first-surface mirro~ :t t~~e~~n:~~ ~~O~~SiO~ fotr ~oun~ing a surface parallel to that of th h t' 0 e c ar wlth ltS e c ar 1S requ1red,
12.
I 1
~

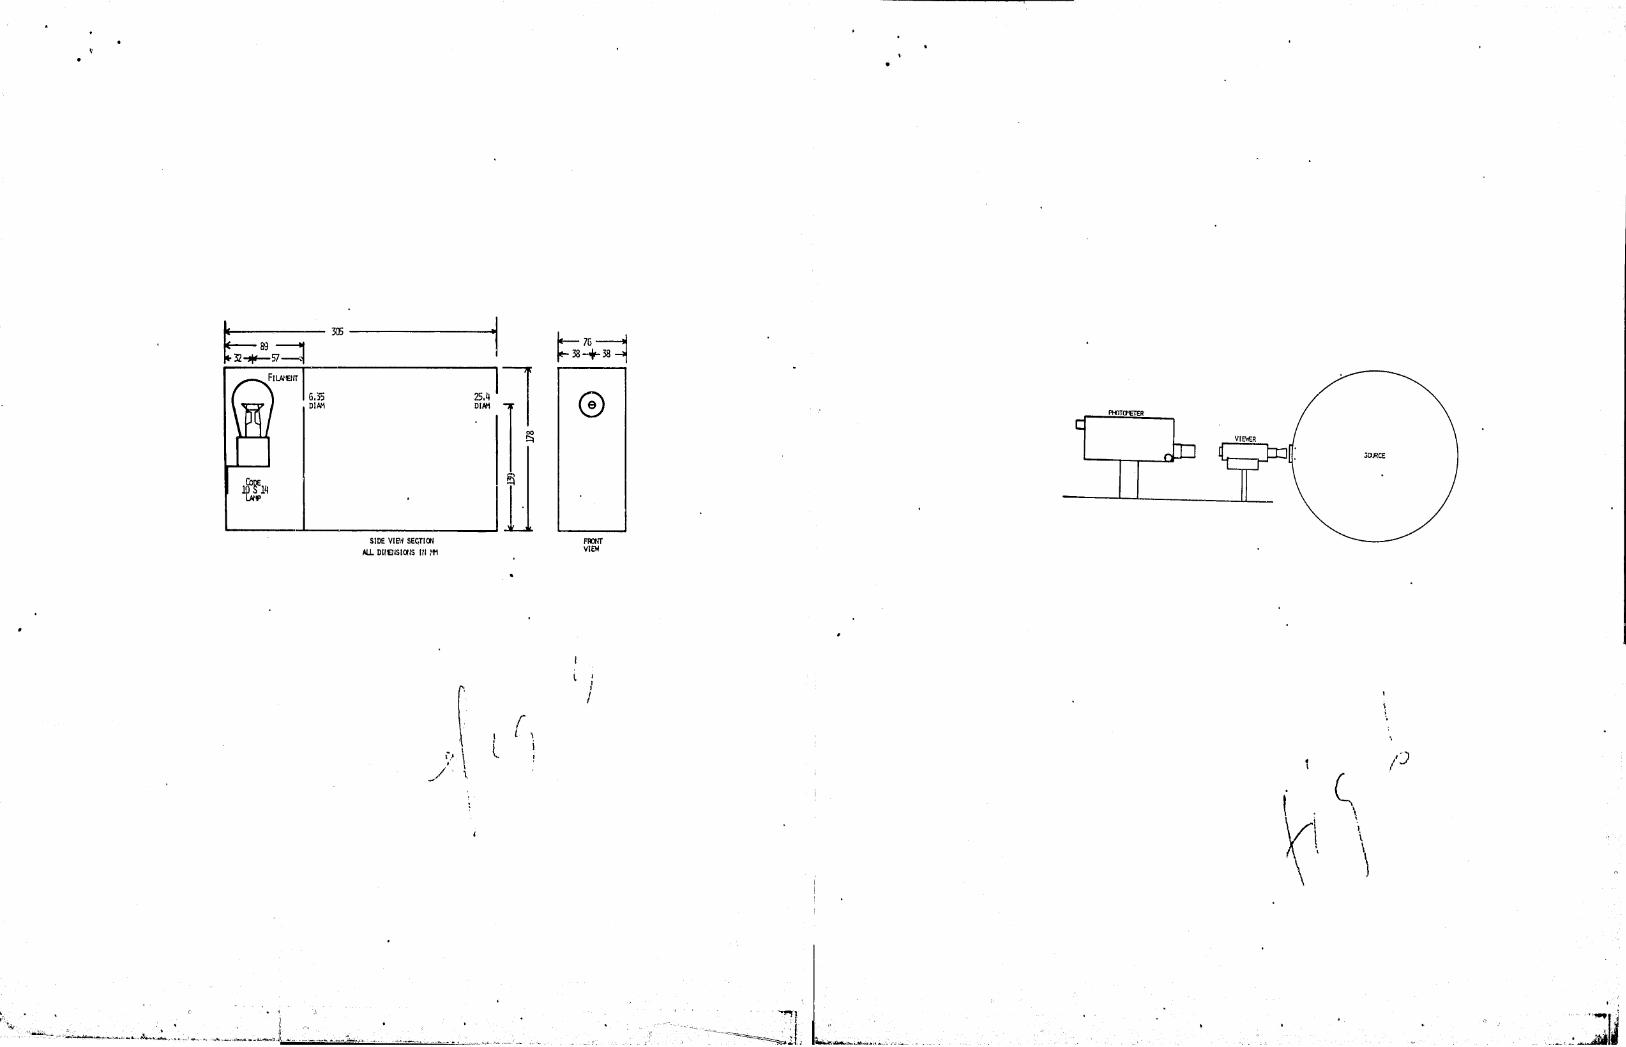
5.4.7 Flare-Light Sources
Three flare-light sources are re~uired, each providing a conical beam having an included plane ~ngle of 5°. A sketch of a suitable fJare-1ight source is shown in figure 5.
5.4.8 Vibration Table
A vibration table or fixture is reQuired, capable of imparting simple harmonic motion to a mass of 5 kg (11 lbs) in both horizontal and vertical planes at frequencies from 5 to 200 Hz. It shall be capable of providing peak-to-neak displacement of 2.5 mm (0.1 inch) over the fret"Juency interval from 5 to 20 Hz, constant acceleration levels of +2 g in the interval from 2{) to 33 Hz, constant peak-to-neak displacerlent of O.9mm (0.035 inch) in the interval from 33 to 52 Hz and constant acceleration levels of t5 9 at frequencies above 52 Hz.
An accelerometer and cathode ray tube disnlay or chart recorder shall be available for monitoring the frenuency, amp 1 i t u d e and \'I a v e for m 0 f the mot i' 0 n . i iii par ted tot h e vie \,1 e r during test.
5.4.9 Environmental Test Chambers
Two environmental test chambers are required~ one which can maintain temperatures in the ran~e from 22 to 5~oC (7~ to 122°F) with temperature control to t10C (tl.8°F) and maintain relative humidity between 90 and 98 rercent and, ~nother which can pro v ide t em per a t u res fro m 2 2 to, - 2 5 ° C (7 '2 t 0 - 1 3 ° ~) \,1 i t h t e In p e' rat u r e con t r 0 1 to + 1 ° C (1. 8 ° F) '. The \,10 r kin 9 vol u m e 0 f each chamber shall be n~t less than 30 x 3" x 45 cm (1 x 1 x 1.5 ft). Recorders shall be provided to continuously record temperature and humidity during a test.
5.5 Configuration
Examine the night V1S1on device to determine compliance with paragraphs 4.2 through 4.8.
Mount the viewer on a tripod, free to rotate in a vertical plane only, and measure the ver-tica1' force necessary to maintain the viewer in a horizontal plane, using a sprinq balance. Compute the torque required to maintain this position from the measured vertical force and horizontal distance from the point of measurement to the vertlcal plane through the horizontal axis of rotation.
1 3 •
. .i.1
".-
Repeat the above inspection and measurement for each viewer lens 5nd accessory combination and for each mounting/support plate furnished with the viewer.
5.6 Eyepiece Tests
5.6.1 Radiation
Place the viewer eyepiece in a shielded container \'Jith the surfac~ normally closest to the eye adjacent to the alrha rad1at1on.counter. Count the radioactive r~rticl~s detected for a per10d of 5 minutes. Remove the eypri~ce from the s~i~lded contai~er and count the backgro~nd for 5 minutes. D1v1de the eyep1ece radiation count by the backqround radiation count. '
5.6.2 Focus
Place the eyepiece in a temporary mount and adjust it to the ap~roximate ce~ter of its adjustable range, with a tarqet 13 m~ 1n front ~f 1t. Place a diopter tester aqainst the eyep1ece and adJust the tester for clear focus of the tarqet as seen. through the eyepiece and diopter tester. qecord the . read1ng on t~e dionter tester. Adjust the eyepiece to both extreme settlngs, and record the readinq on the dionter tester for clear focus at each position. .
f . Rtota1tekt~e eyepiece lens using a torque wrench and adapter, lrs. c OC'Wlse and then counterclockwise, and observe the
read1ng on the torque wrench in each case.
5.6.3 Curvature of Field
Test the eyepiece lens for curvature of field bv method 17 paragraph 5.1.2.13.2, focal lenqth b'y method 2, nal-aoraph ' 5.1.2.2.2; and aperture ratio (f-number) bv the method described in paragraph 5.1.2.8, all of l1IL::'STD-lsnA,'1 June 8, 1961. Compute the depth of focus in mm as n.04N where N is the aperture ratio of the eyepiece lens.
5.6.4 Distortion
Measure the distortion of the eyepiece lens by method 2R, par a g rap h 5. 1 • 2 • 1 6 • 4 0 f tH L - S T 0 - 1 5 n A ~ 1.1 u n e 8, 1 9 6 1 .
4Avai1ab1e from Naval Publications arid Forms Center, 5801 Tabor Avenue, Philadelphia, Pa. 19120.
14.
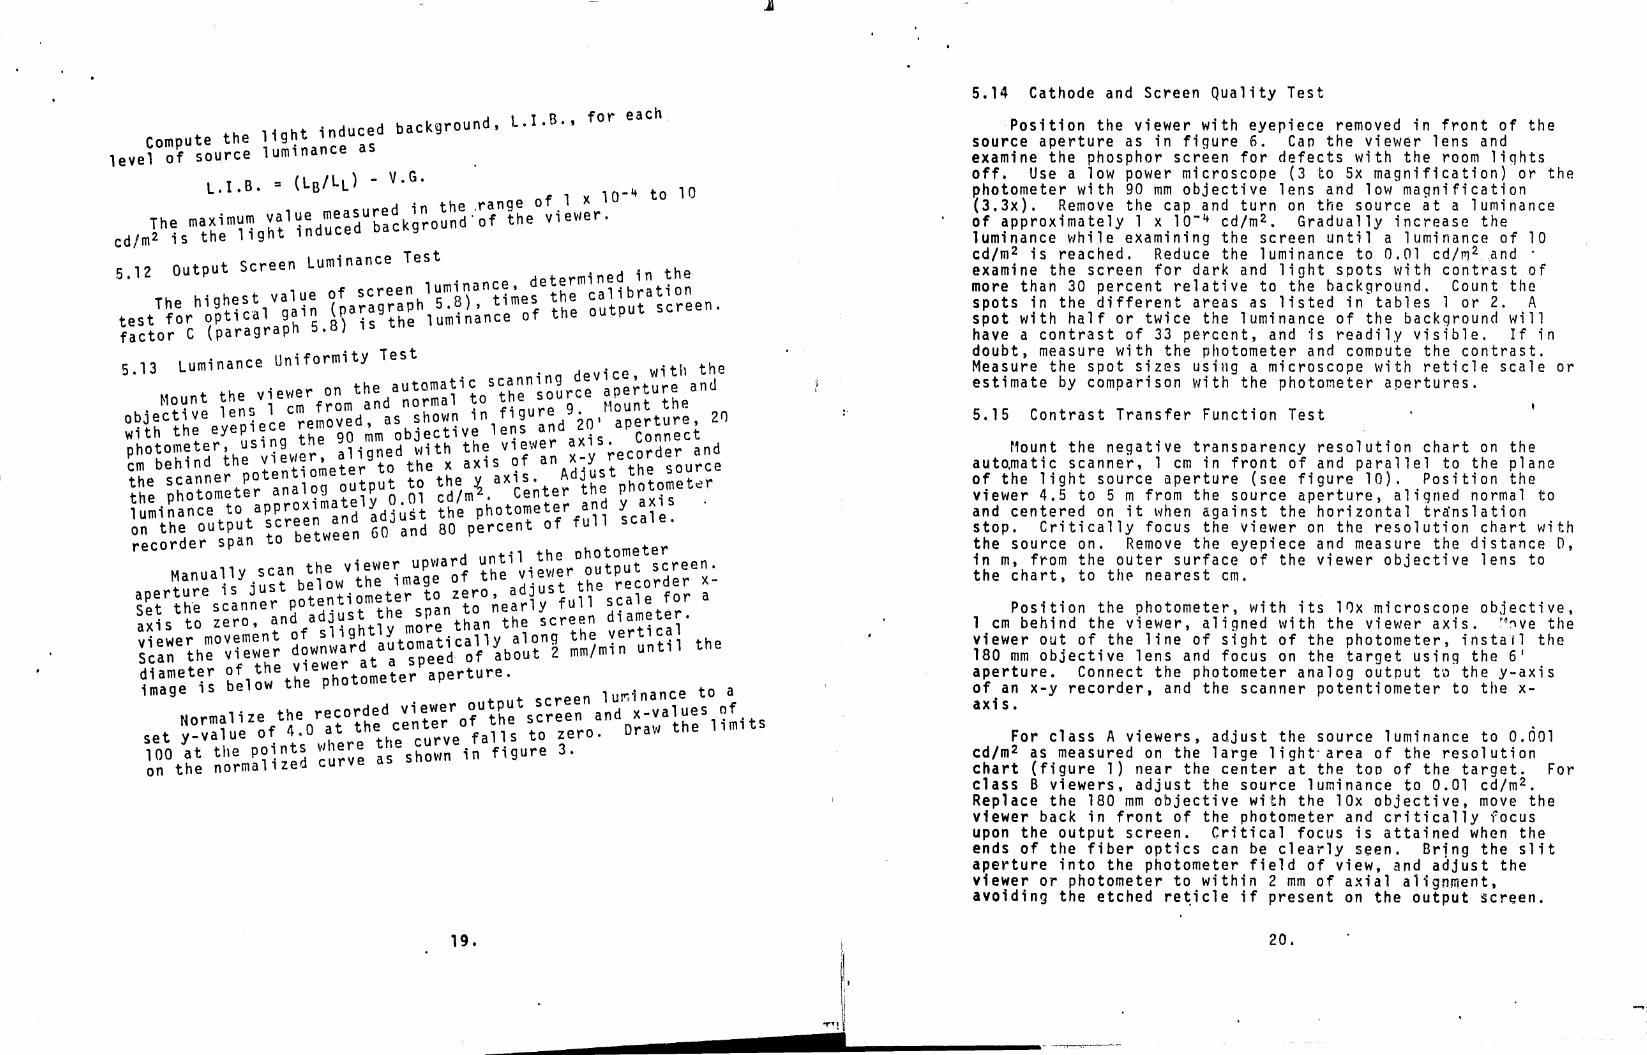
5.7 General Test Procedures
Perform all optical tests of night vision devices with the viewer equipped with fully-charged batterie~ ~ total period of prior use not to exceed four hours. Allow the viewer to stabilize for a minimum of five minutes after it is turned on before performing any tests.
Do not turn on the viewer in a briqht1y 11ghted room unless the objective lens is capped. Although the automatic brightness control will protect the tube from burning out if it is accidentally turned on in bright liqht. operation under such conditions may result in decreased tube life.
Allow the photometer to stabilize for a minimum of 30 minutes after it is turned on befo~e making any measurements. Prior to use, calibrate the photometer against the internal source and adjust the zero and dark currents.
Permit the light source to stabilize for a minimum of 5 minutes after any lamp is turned on.
5.8 Optical Gain test
Adjust the light source to a luminance of 0.01 cd/m2 and position the photometer 40 em from and normal to the source. Measure and record the luminance using the 18n mm"lens and 1° aperture. Move the photometer forward, 15 cm from the source, and measure and record the luminance using the 9~ mm lens and 1° aperture. Calculate the correction factor C as
C = (180 mm lens reading)/(90 mm lens reading).
Repeat this measurement a minimum of 10 times to obtain a standard deviation of less than 0.005 for the mean of C. Check the correction factor at intervals of 4 to 6 weeks, unless one of the lenses is cleaned, which reouires that a new correction factor be established.
Place the viewer on an adjustable mount, positioned against a lateral movement stop, immediately in front of the light source, with the viewer axis centere~ on and normal to the aperture. Focus the viewer on the source and remove the eyepiece. Position the photometer~ on an adjustable mount, 17 cm behind the viewer output screen, aligned with the viewer axis as shown in figure 6. Adjust the source luminance to 9.00 x 10- 3 cd/m •
15.
...... 1 " • !
Focus the photometer on the viewer output screen using the 90 mm objective lens and 1° aperture, measure the luminance and record the value. Note and record the time of measurement. Move the viewer out of the photometer 'line of sight, replace the 90 mm objective lens with the 180 mm lens and, still using the 1° aperture, focus on the source, measure and record the luminance.
Measure the viewer screen and source luminances at 10 values of source luminance from 1 x 10- 4 to 10 cd/m2, varying by a factor of about 4 between successive values, and again at 9.00 x 10- 3 cd/m2. Record the time of the last measurement.
Compute the optical gain, G, for each source luminance level as:
G = Screen Luminance x ~ Source Luminance
Plot the optical gain, G, as a function of the logarithM of the source luminance to nroduce the optical gain curve of the viewer (semi-log paper is convenient). The maximum optical gain in the range of source luminance from 1 x 10- 4 to 10 cd/m2 is the optical gain of the viewer.
Measurement of the optical gain of a viewer with an objective lens of known focal length F in mm, T-number T and fnumber f permits the calculation of the ootical gain of the viewer when used with any other objective lens for which the same parameters are known.
Compute the. transmi ttance, or, for each. 1 ens as
compute the magnification, M, for each lens as
M = F/(D-F)
where D is the distance from the object to the lens, which may be taken as 50,000 mm.
16 •

compute the optical gain, G, of the viewer with lens 2 from the measured optical gain, GI, with lens 1, by use of the following equation, where the subscripts indicate the parameters of lenses 1 and 2 respectively.
G a 2
G • T • [ ( 2 f 1 ) 2 • (r'1 1 + 1) 2 + 1 ] 1 2
T .[(2f )2 • (M 2 + 1)2 + 1] 1 2
5.9 Optical Gain Stability Test
The percentage change in optical gain per hour of operation, 6G, is computed from the optical gain, GB' measured at a source luminance of 9.00 x 10- 3 ~d/m2 at the beqinninq of the optical gain test, the Qptica1 gain GE' ~easured under the same conditions at the end of the optical galn test, and the elapsed time, 6t, in hours between the two tests, 6t not to exceed 2 hours.
6 G = x 100
5.10 Light Equivalent Background Test
Following completion of the optical gain test, cap the objective lens of the viewer and measure the luminance of its output screen as Lo. Compute the light equivalent background, l.E.B., as
where Go is the optical gain, measured at the lowest value of luminance of the source, approximately 1 x 10- 4 cd/m2.
17 •
.. 5.11 Light Induced Background Test
The photometer calibration requires a small hlack dot target. Cut a 0.5 mm (0.020 in) diameter dot from brass shim stock, blacken it with india ink, and ,mount it on a piece of flashed opal glass on the side opposite the flash. Place this target in a vertical position on a translation stage providinq horizontal and vertical motion in the plane of the glass and illuminate it from the rear with a frosted 40 watt light bulb, 17 em from the qlass, shielded with a 5 cm diameter tube blackened on the inside, as shown in figure 7. l10unt the photometer, usinq the 90 mm objective lens, on an adjustable stage providing motion parallel and normal to its line of sight in the horizontal plane. Center the dot in the ohotometer field of view, focus upon the dot, brinq the 6 1 aperture into the field of view, and center it on the dot. Adjust the photometer focus until the measured luminance is at its min i mum . ~1 e a sur e and r e cor d the 1 u min a n ceo f the dot LB' "1 a v e the glass until the aperture appears to be separated fr m th~ dot by approximately the diameter of the dot, measure and record the luminance of the li~ht area LL' Compute the veiling glare V.G. of the photometer as .
V.G. = LO/LL'
Place the viewer on an adjustable mount, positioned aaainst a lateral movement stop, immeaiately in front of the light. source, with the viewer axis centered on the arerture and normal to it. Position the photometer, in an adjustable mount, 17 cm behind the viewer outrut screen, aliened with the viewer axis. Remove the plug in the back wall of the light source sphere and place the black body behind and centered on the hole (figure 8). Focus the viewer on the hole, then remove the eyepiece, and focus the photometer on the outout screen, usina the 90 mm objective lens. Adjust the viewer to center the image of the hole on the screen. (If the screen has an etched reticle, the image should be near the center but not on the reticle lines). Bring the photometer aperture nearest the size of the image (bigger or smaller) into the field of view and center it on the image. Adjust the viewer objective lens, focusing to achieve minimum luminance as measurerl by the photometer, and then adjust the photometer focus until the measured luminance is minimum. Bring an anerture 1/3 to 2/3 the size of the hole image into the field of view, center it on the image, measure the luminance LB of the image and record. Move the photometer horizontally until the aoerture is separated from the hole image by the diameter of the hole imaged, measure the luminance of the light backgrounri LL' and record. Measure LB and LL at 10 levels of source luminance covering the range from 1 x10- 4 to 10 cd/m2.
18. ~
d L.I.B., for each lig ht induced backgro un ,
Compute the level of source luminance as
l.I.B. = (lB/ll) - V.G. d' the range of 1 x 10- 4 to 10
The maximu"! val~edmea~u~~ck~~ound:of the viev/er. cd 1m2 is the 11ght 1n uce
Output Screen luminance Test . ' the 5.12 luminance, determ1ned ln ,
The highest value of screen h 5 8) times the ca1ibrat10n , "1 gain (paragrap ., f the output screen.
test for opt1ca h 5 8) is the luminance 0 factor C (paragrap .
13 luminance Uniformity Test ,'til the 5. tic scanning devlce, W1 d
Mount the viewer on theda~~~::l to the source aperttU~~ean , ' lene 1 cm from an , figure 9 Moun .
obJect1ve ~ e removed as shown 1n d ~O' aperture, 2n with the eyep1~C h 90 ~m objective 1e~s an . Connect photom~ter'hus~~~w!r~ aligned with th~ V1~W~~ :~~s~ecorder and cm beh1nd t ~otentiometer to the x aX1S ~ Adjust the source th: s~~~~~~ter analog output to ~~em~ aX~~~ter the phot~met~r i~mi~ance to approximat~l~d~~~~ th~ photometer a~~ y a~~s on the output screen an 60 and 80 percent of fu sca •
order span to between ree d until the ohotometer
Manually scan the viewe~ upwa~f the viewer output screen. , 'st below the lmage d' t the recorder x-
;~~r~~:es~~n~~r ~ot~j~~~m~~:r s~~nz~~o~e:r~~s full ~~:~~t:~~ a axis to zero, an a . htl more than the screen 1 , 1
vsie~e~h~o~~~:~~ ~~w~~!~d a~tomat~c:~l~b~~~n~ ~~'m~~r~~~~l the ca f th viewer at a spee diamet~r 0 e th photometer aperture. image 1S below e lu~inance to a
d d viewer output screen 1 f Normalize the recorhe ter of the screen and x-va ues 0
set y-value of 4.0 at t e ce~urve falls to zero. Draw the limits 100 at tile po~nts ... there ~~eshOVIn in figure 3. on the norma11zed curve
5.14 Cathode and Screen Quality Test
Position the viewer with eyepiece removed in front of the source aperture as in figure 6. Cap the viewer lens and examine the phosphor screen for defects with the room lights off. Use a low power microscope (3 to 5x magnification) or the ~hotometer with 90 mm objective lens and low magnification (3.3x). Remove the cap and turn on the source at a luminance of approximately 1 x 10- 4 cd/m2. Gradually increase the luminance while examining the screen until a lUminance of 10 cd/m2 is reached. Reduce the luminance to 0.01 cd/M2 ~nd . examine the screen for dark and light spots with contrast of more than 30 percent relative to the background. Count the spots in the different areas as listed in tables 1 or 2. A spot with half or twice the luminance of the background will have a contrast of 33 percent, and is readily visible. If in doubt, measure with the photometer and compute the contrast. Measure the spot sizes usiHg a microscope with reticle scale or estimate by comparison with the photometer apertures.
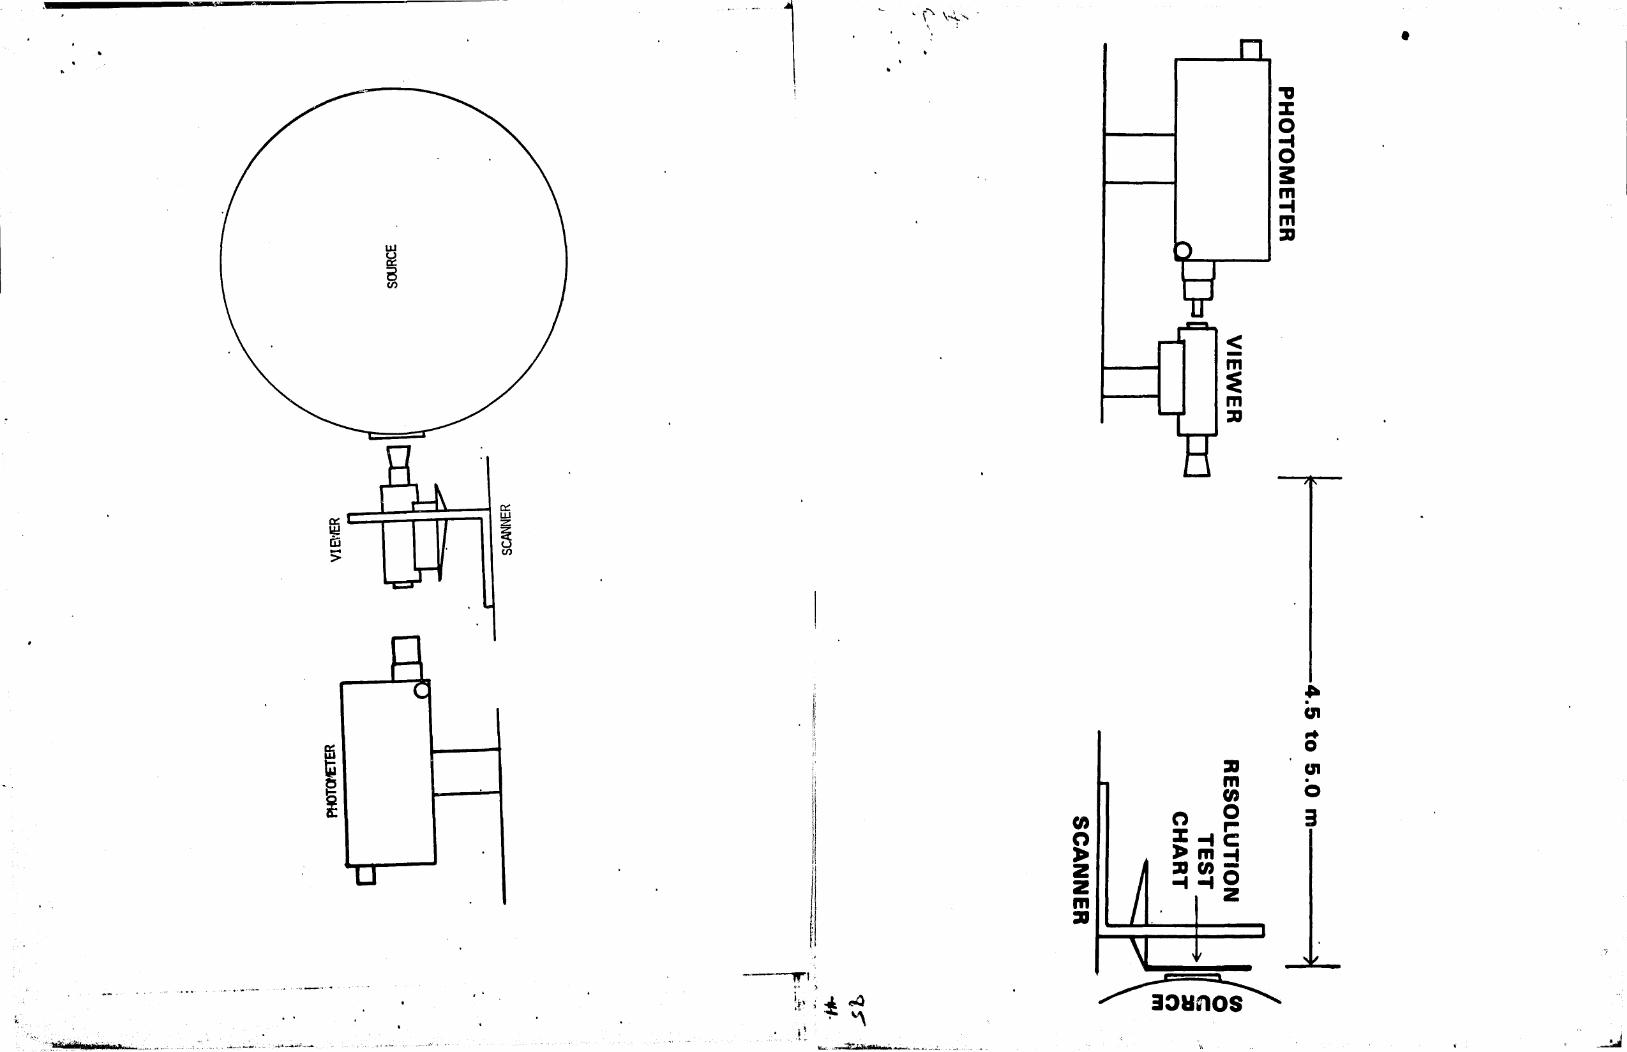
5.15 Contrast Transfer Function Test
t10unt the negative transparency resolution chart on the aut o.m a tic s can n e r, 1 em i n fro n t 0 fan d par all e 1 tot h e p 1 a n e of the light source aperture (see figure 10). Position the viewer 4.5 to 5 m from the source aperture, aligned normal to and centered on it when against the horizontal tr~nslation stop. Critically focus the viewer on the resolution chart with the source on. Remove the eyepiece and measure the distance 0, in m, from the outer surface of the viewer objective lens to the chart, to thp nearest cm.
Position the photometer, with its 10x microscone objective, 1 cm behind the viewer, aligned \'1;th the v;e\,/er axis. :~~we the viewer out of the line of sight of the photometer, install the 180 mm objective lens and focus on the target using the 6' aperture. Connect the photometer analog output t~ the y-axis of an x-y recorder, and the scanner potentiometer to the xaxis.
For class A viewers, adjust the source luminance to 0.001 cd/m2 as measured on the large light- area of the resolution chart (figure 1) near the center at the too of the target. For class B viewers, adjust the source luminance to 0.01 cd/m2. Replace the 180 mm objective with the lOx objective, move the viewer back in front of the photometer and critically focus upon the output screen. Critical focus is attained when the ends of the fiber optics can be clearly seen. Bring the slit aperture into the photometer field of view, and adjust the viewer or photometer to within 2 mm of axial alignment, avoiding the etched re~icle if present on the output screen.
20.
.....,

•
Manually adjust the position of the chart until the slit aperture is centered on a bright line whose imaqe is about the same width as the slit. Adjust the position of the chart until the photometer reading is at its maximum. Focus the viewer objective lens for the maximum photometer reading, and then focus the photometer to obtain the maximum reading. Reoeat this focusing procedure at least one time to optimize the focus of both the photometer and viewer.
Manually drive the resolution chart to center the groups -2 to +1 relative to the source aperture and critically focus the viewer objective lens, observing the imaqe with the photometer. Manually drive the chart to center the large light square about the photometer aperture. Set the photometer control to zero, and adjust the recorder to read zero on the y scale. Set the photometer control to read the luminance of the chart. Adjust the photometer output to maximum, and adjust the recorder y axis span to between 1/2 and full scale. Set the x-axis span for slightly less than full scale for the full range of the scanner potentiometer movement.
Manually drive the resolution chart upward until the slit aperture is centered on the dark area below the square light area in the image of the resolution chart. Set"the scanner potentiometer to zero and the scanning speed to approximately 3 mm/min. Scan the resolution chart downward automatically and record photometer and potentiometer outputs until the slit is about centered in the square light area. Then move the resolution chart "until the aperture is in the dark area beloltl the -4(1) pattern in the image of the chart. set the potentiometer to zero. and scan aytomaticaJly at about 3 mm/min~ recording until the slft is in the dark area above the pattern.
Move the chart manually to successively smaller patterns and scan automatically until the recorded pattern can no longer be resolved as three distant peaks and two valleys. Then repeat the recording scan across the edge of the large square light area.
The lowest spatial frequency scanned should be no higher than 4 line pairs per mm, and a value of 2.5 or less is desirable. To get such low spatial frequencies with night vision devices having objective lenses of less than 50 mm focal length, it may be necessary to use a resolution pattern in the -5 or -6 groups. The fabrication of such patterns is discussed in appendix E.
21 •
J
Compute the magnification factor, H, of the objective lens of the viewer from the focal lenqth, F, and the distance, 0, from the resolution chart as
~, = F/(O-F)
Compute the spatial frequency, f, of each pattern image scanned from the magnification, M, and the spatial frequency, f , of the pattern on the chart (table 3) as
c f = f c /t1
Compute the contrast modulation, C , at the frequency, f1 from the average heights above zero Off the peaks, LO' and the va 11 e y s, L L' 0 f the recorded sea n, "a s
Cf = (LL - lO)/(lL + lD)
Compute the contrast of the chart, Co' from the average heights above zero of the two curves made across the edge of the squarE~ light area recorded at the beginning and end of the test; LL 0 in the light area and LD in the dark area:
, ,0
Co = (ll,o - Lo,o)/LL,o + Lo,o)
Compute the contrast transfer function. CTF(f), at a frequency, f, from the contrast modulation, Cf' "at the frequency, f, and the contrast modulation of the chart, Co;
CTF(f) = Cf/Co
Plot the CTF(f) as a function of " spatial frequency, f, to produce the CTF curve of the viewer. Draw a smooth line through the plotted points and interpolate the values at the required frequencies.
22.
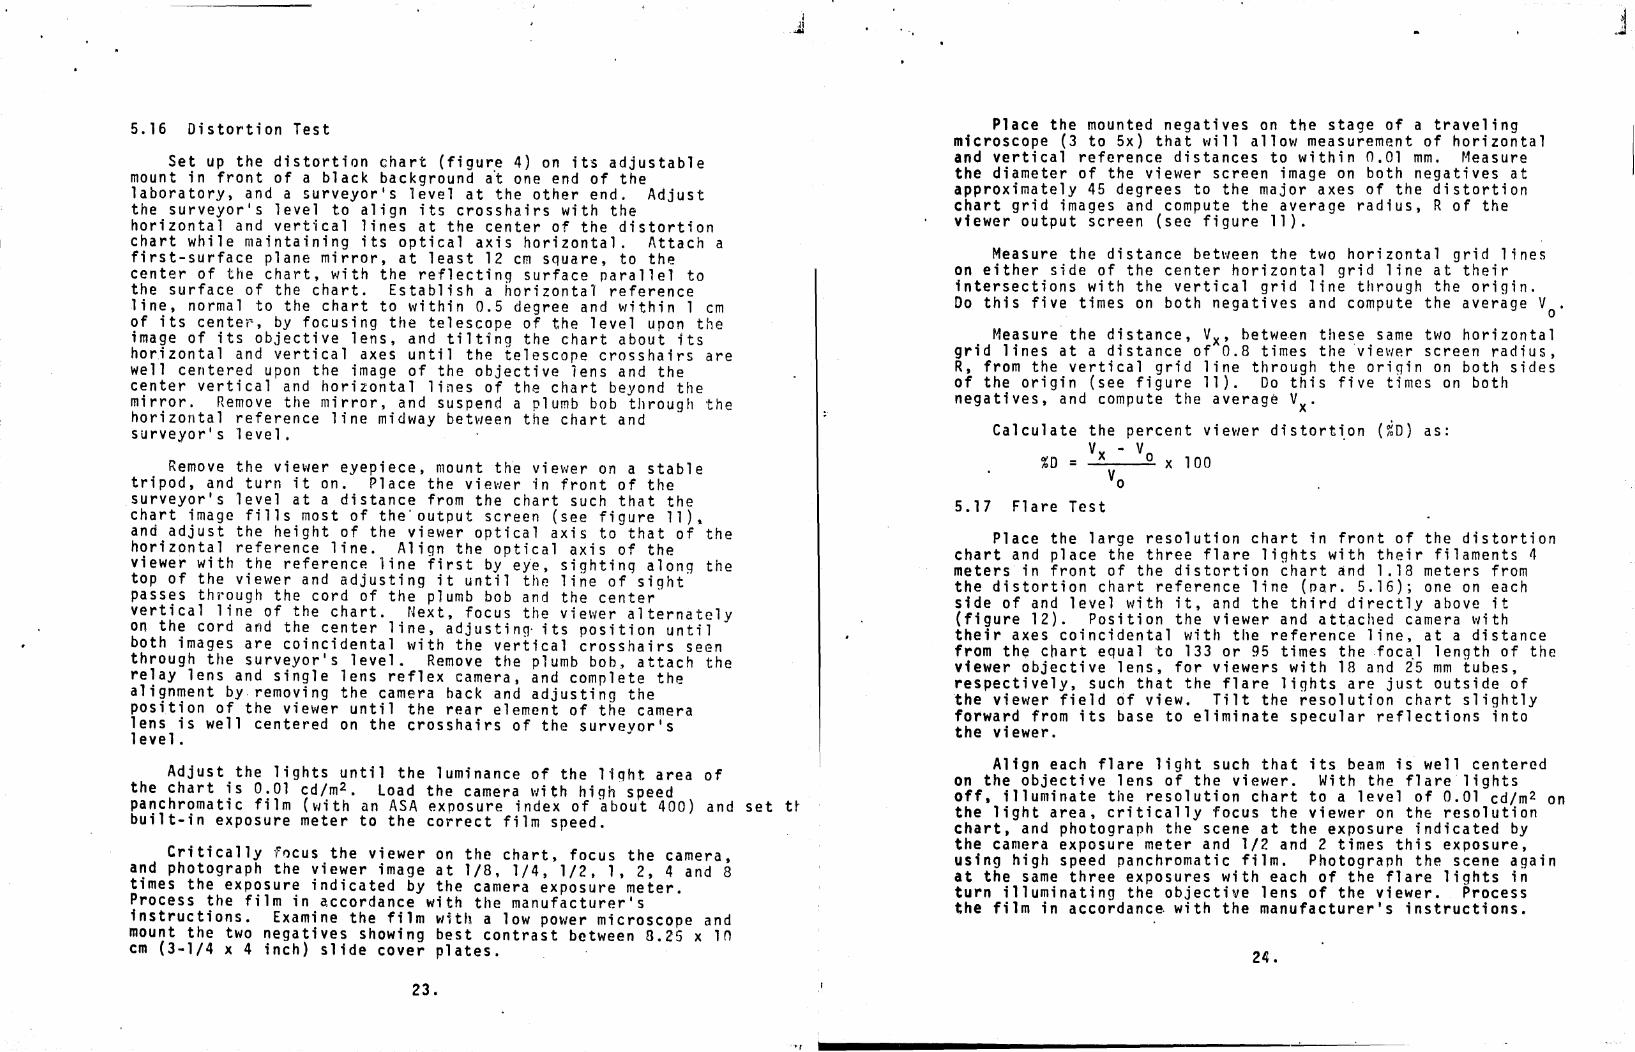
5.16 Distortion Test
Set up the distortion chart (figure 4) on its adjustable mount in front of a black background a~ one end of the laboratory, and a surveyor's level at the other end. Adjust the surveyor's 1evel to align its crosshairs with the horizontal and vertical lines at the center of the distortion chart while maintaining its optical axis horizontal. Attach a first-surface plane mirror, at least 12 cm square, to th~ center of the chart, with the reflecting surface parallel to the surface of the chart. Establish a horizontal reference line, normal to the chart to within 0.5 degree and within 1 cm of its center, by focusing the telescope of the level upon the image of its objective lens, and tilting the chart about its hor.izonta1 and vertical axes until the telescope crosshairs are well centered upon the image of the objective lens and the center vertical and horizontal lines of the chart beyond the mirror. Remove the mirror, and suspend a plumb bob through the horizontal reference line midway between the chart and surveyor's level.
Remove the viewer eyepiece, mount th~ viewer on a stable tripod, and turn it on. Place the viewer in front of the surveyor's level at a distance from the chart such that the chart image fills most of the'output screen (see figure 11)~ and adjust the height of the viewer optical axis to that of the horizontal reference line. Align the optical axis of the viewer with the reference line first by eye, sighting along the top of the viewer and adjusting it until the line of sight passes through the cord of the plumb bob and the center vertical line of the chart. Next, focus the viewer alternately on the cord and the center line, adjusting· its position until both images are coincidental with the vertical crosshairs seen through the surveyor's level. Remove the plumb bob, attach the relay lens and single lens reflex camera, and complete the alignment by removing the camera back and adjusting the position of the viewer until the rear element of the camera lens is well centered on the crosshairs of the surveyor's level.
I ,n ,4/
Adjust the lights until the luminance of the liqht area of the chart is 0.01 cd/m 2 • load the camera with high speed panchromatic film (with an ASA exposure index of about 400) and set tt built-in exposure meter to the correct film speed.
Critically focus the viewer on the chart, focus the camera, and photograph the viewer image at 1/8. 1/4, 1/2, 1, 2, 4 and 8 times the exposure indicated by the camera exposure meter. Process the film in accordance with the manufacturer's instructions. Examine the film with a low power microscope and mount the two negatives showing best contrast between 8.25 x 10 cm (3-1/4 x 4 inch) slide cover plates.
23.
.,
Place the mounted negatives on the stage of a traveling microscope (3 to 5x) that will allow measurement of horizontal and vertical reference distances to within n.Ol mm. Measure the diameter of the viewer screen image on both negatives at approximately 45 degrees to the major axes of.the distortion chart grid images and compute the average radlus, R of the viewer output screen (see figure 11).
Measure the distance between the two horizontal grid lines on either side of the center horizontal grid line at their intersections with the vertical grid line through the origin. Do this five times on both negatives and compute the average Vo'
Measure the distance, Vx ' between these.same two horizo~tal grid lines at a distance of 0.8 times the Vlewer screen radlus, R, from the vertical grid line through the ori9in on both sides of the origin (see figure 11). Do this five times on both negatives, and compute the average Vx '
Calculate the percent viewer distort~on (~O) as: Vx - Va
%0 = x 100 Vo
5.17 Flare Test
Place the large resolution chart in front of the distortion chart and place the three flare lights with their filaments 4 meters in front of the distortion chart and 1.18 meters from the distortion chart reference line (par. 5.16); one on each side of and level with it, and the third directly above it (figure 12). Position the viewer and attached camera \·lith their axes coincidental with the reference line. at a distance from the chart equal to 133 or 95 times the ,foc~l length of the viewer objective lens, for viewers with 18 and 25 mm tubes, respectively, such that the flare lights are just outside of the viewer field 6f view. Tilt the resolution chart slightly forward from its base to eliminate specular reflections into the viewer.
Align each flare light such that its beam is well centered on the objective lens of the viewer. With the flare lights off, illuminate the resolution chart to a level of 0.01 cd/m2 on the light area, critically focus the viewer on the resolution chart, and photograph the scene at the exposure indicated by the camera exposure meter and 112 and 2 times this exposure, . using high speed panchromatic film. Photograph the scene agaln at the same three exposures with each of the flare lights in turn illuminating the objective lens of the viewer. Process the film in accordance with the manufacturer's instructions.
24.
.., II: _________________________ -'-__ --'---__
j

Examine the negatives of the scene with flare lights off, using a microscope of about 20 x magnification, and determine for each the smallest pattern that can be see~ to consist of three distinct lines. Compute the resolution number R for each negative as
R = 1 - P - 6G
where G is the group number (always neqative on the large resolution chart) and P is the pattern number (always positive) of the smallest resolved pattern.
Identify the negative with the best resolution, or the one which appears to have the hi~hest contrast (judged visually) if two or more have the same resolution, and note the exposure at which it was taken. Calculate the resolution number for each of the three ne~atives, made with the resnective flare lights on, that were taken at this same eXDosure.
Subtract the largest resolution number of the three flare light scene negatives from that of the negative without flare light. The resulting number is the flare rating of the ~iewer.
S.18 High and Low Temperature Stora~e, Opera~ion and Thermal Shock Tests
Stabilize the high temperature test chamber at SO+2°C (122+3.6°F) and 94+4% relative humidity. Place the nlght vision device, which has been sto.red at room temperature (22+2°C, 72+3.6°F) for at least 4 hours prior to test, in the cha~ber for-8 hours. Durino the last 3D minutes nf this period, turn on the night vision device and check to see that a normal image is produced in a dark environment. At the end of the 8 hour period, remove the night vision device from the chamber and store it at room temperature for a minimum of 2 hours.
Then place the night V1Slon device in a low temperature test chamber, maintained at -?,S+2°C (-13+3.6°F), for In hours. Turn on the night vision device-during the last 30 minutes of this period and check to see that a normal image is produced in a dark environment. A battery pack kept at room temperature, external to the chamber, may be used to operate the unit. Remove the night vision device from the chamber and store for at least 4 hours at room temperature. Turn on the viewer during the last 10 minutes of this period and observe its operation. This completes one cycle of hiQh and low temperature storage, operation and thermal shock. Repeat the complete cycle once. Examine the viewer for evidence of damage immediately following the test. .
25.
5.19 Humidity Test
Place the night vision device in a high temperature test chamber at 22+2°C (72+3.6°F) and 94+4% relative humidity for 4 hours. Increase the temperature to-50+2°C (1~2~3.f)°F) in a period of 2 hours or less, the relati~~ humidity bc~nq maintained, ·and hold at that temperature for 4 hours, then reduce the temperature to 22°C in not more thiln 2 hours. T~lis constitutes one co~plete cycle. Repeat the cyclr. 5 additional times, for a total of G cycles. Turn on thp. night vi~ion device and observe its operation durin~ the last 3~ mlnutes of the 4th and 6th cycles. Examine the viewer for evidence of damage immediately following the test.
S.20 Vibration Test
. Mount the viewer, co~plete with eyepiece, objective lens and batteries, on a vibration table, with one accelerometer attached to the viewer near the objective lens, and another attached to the vibration table. Connect both accC'lnrorletcl's to oscilloscopes or recorders. Subject the viewer t? simnle harmonic motion separately in three mutually oerpend1cular directions; parallel to the optic axis and in the horizontal and ve r tic alp 1 a n est h r Cl u 9 h the 0 p t ; c a xis . S VII~ P. nth r? lJ 9 h the range from 5 to 200 Hz at the rate of 20 octaves per mlnute for a total of 5 sweeps for each axi s, 1,1i th amnl i tudes and accelerations as specified in' figure 13 ..
During the frequency sweeps, observe the oscilloscopes or recorders and note the frequencies and relative magnitudes of any resonances. If resonances are noted, vibrate the viewer at each of the noted resonances for two nerioris of 5 minutes eac~, with a two minute rest period hetween neriods of vibration, thn amplitude or acceleration being as sneciftcd for that fr~Quency in Figure 13. If more than four resonances are noted, vlbrate the v~ewer at only the four resonances.with the g~eatest relative amplitudes. If no resonance 15 noted, vlbrate thr viewer at a frequency of 20 Hz for two 5 minute periods.
If physical damage is observed at any time during the t~5t, terminate the testing immediately.
Following vibration, inspect the.viewer.for pro~er operation and any evidence of m~c~an1cal fa11u\c, ~lth particular emphasis on the cond1t1on of the obJect1ve lens and mounting.
26.

APPENDIX A--LIGHT SOURCE
A light source especially designed for the testing of night vision devices is shown in figure 14. ' It consists essentially of a 1 m diameter integrating sphere, with a 5~ cm diameter integrating sphere below and attached to it thr?ugh an 18 cm diameter iris diaphragm. Four recessed light flxtures are mounted on the lower sphere, 90 0 apart in a horizontal plane 10.5 em above the center of the lowe~ snhere, with their axes passing through the center of the sphere, ~o that they.are pointed downward at an angle of about 23.5 to the horlzontal. Each fixture is cylindrical, about 13.5 cm in diameter and 14 cm long, and holds one 6.6 ampere, 7 volt General Electric Code Q4SPAR 36 airport light. This;s a prefocused quartz-haloqen tungsten filament lamp. Each lamp is held in place so that its front surface is recessed about 5 cm from the inner surface of the sphere.
One lamp, identified as No.1, has a 1.5 mm aperture and an opal glass filter in front of it. A second lamp, identified as No.2, has an 18 mm aperture and an opal q1ass filter in front of it. The other two lamps, No.3 and No.4, have only the 9.5 cm diameter retaining ring as a limiting aoerture. The lamos are connected in parallel, with separate s\·Jitches. An electronic voltage regulator connected to a nominal 120 volt ac line supply maintains the input voltage constant at 120 volts ±.'Ll% for line voltage fluctuations from 105 to 135 volts. Thp. output of the voltage regulator i's connected to a variable voltagQ transformer with an output capacity of 2 kVA, aryd a voltage range of 0 to 135 volts. The output of the varlable transformer is connected to the lamps through a 10 to 1 stepdown transformer. '
There is a large aperture, 35 cm in diameter, in the large sphere, which is covered with a removable aperture plate having two apertures, 13 cm square, symmetrically placed 2.5 cm apart on either side of the center of the plate. A removable cover plate over the aperture plate has a single aperture 7 x 9 cm in size, centered over one of the 13 cm square apertures. The large sphere has a circular hole, 1.75 cm in diameter, diametrically opposite the large aperture. This hole subtends,. from the large aperture, a conical solid angle with an included plane angle of 10. The inner surfac~ of this plug is concave spherically, with the same radius as the s~herp.. The plug has a shoulder spaced so that, when inserted with the shoulder in contact with the rim of the hole, the inner surface of the plug conforms to the inner surface of the' sphere.
27.
The inner surface of the small sphere is coated with barium sulfate paint. s The inner surface of the large sphere, including the inner surface of all aperture plates and plugs, i s c 0 ate d \·11 t h Bur c h s p her epa i n t . 6 T.h e 1 e a v P. s 0 f the i r i s diaphragm are of uncoated polished stainless steal.
The color temperature of the light in the larqe sphere was adjusted to 2856 K with all lights on and the iris diaphragm fully open. A light blue filter 7 was required to overcome the slight yellowish cast of the Burch snhere paint. v/ith the blue filter in place the voltage to the lames was varied until the desired color temperature was attained.
The luminance in cd/m2 of the sphere wall opposite the aperture, with the iris diaphragm closed to its smallest diameter, was as follows: lamD No. 1--2 x 10- 5 , lamp No. 2--0.0026, lamps No.3 or No. 4--0.22; and with the diaphragm fully open: lamp No. 1--0.005, 1amr No. 2--0.9, lamps No.3 or No. 4--78.
5 Available from Eastman Kodak Co., Rochester, N.Y. 14650.
6 Available from the Burch Paint Mfg. Co., 1"6nO Briggs Rd., Cleveland, Ohio.
7 Cor n i n g t y p e 5900 g 1 ass, 2. 1 mm (n. 08 3 in.)' t h i c k .
28.
..' r""'tl . ,

APPENDIX B--SCANNING DEVICE
A suitable scanning device is the Motor Driven Meter Mover, Model 31-6,8 extensively modified for use in these tests. Replace the variable-speed de motor and control supplied with the unit with a 60 rpm synchronous ac motor having a torque rating of 0.25 newton meter (2.2 lbf-in.) operating through a reduction gear system having gear ratios of 1, 2.5, 5, 10, 25, 50, 100~ 250, 500, and 1000 to 1. The scanning speed at the 50 to 1 gear ratio (1.2 rpm) is 2.82 mm/min.
Connect a lO-turn potentiometer to the drive shaft through a magnetic clutch. Connect a low-voltage source through the potentiometer to produce a voltage that is proportional to the position of the scanner~ Magnetic clutches are used to connect the main drive shaft to the scanner and to the potentiometer, bec~use the motor is not reversible, and their use permits the scanner and photentiometer to be repositioned manually between scans.
Replace the chart holding device supplied with the scanner by a platform designed to hold a resolution chart, a viewer or the photometer head.
8Manufactured by Hoffman Engineering Corp., P. O. Box 30n, Old Greenwich, Conn. 06870.
29.
APPENDIX C--BLACKBODY CAVITY
A suitable blackbody cavity, shown in figure ~5, ;s in the form of an exponential horn. It;s ma~e from nomlnal ~.5 cm diameter Pyrex brand glass tubing tapered do~n t~ a pOlnt over a distance of about 12 cm. The tap~red sectlon lS then bent on about a 6 cm radius to form the cavlty.
The inside of the glass cavity is pa~nted w1th a high-gloss black enamel paint and the outside is palnted wlth a matte black paint. The reflectance of the cavity is less than 0.1%.
30.
71

APPENDIX D--PLANE SOURCE SPOT
The use of a large area plane illumination source for optical testing of night vision devices requires the use of a black dot for the m~as~rement of light induced background (paragraph 5.11). A c1rcular metal disc of appropriate size may be used as the black spot. The diameter of the disc is 0.0175 times the distance from the objective lens of the viewer to the source. This disc should be painted with a very low reflectance diffusely reflecting black paint, such as Parsons Optical Black,9 or covered with black velvet cloth, and attached to the surface of the diffusing screen with doublefaced pressure sensitive tape.
T~e use of a large-area source .re'luires that the test be made 1n a darkroom with walls painted with a matte black paint in order to minimize reflection of light from the source back to the surface of the black spot. As an alternative, curtains of black velvet may completely surround the e'luipment during test.
The Eppley Laboratory, Inc., 12 Sheffield Ave., Newport, Rhode Island 02840, has purchased riqhts to this coating from the Thomas Parsons Sons Co. of England.
31.
APPENDIX E--LARGE SIZE RESOLUTION CHART PATTERN FABRICATION
For contrast transfer tests of night vision devices with objective lenses of 50 mm focal lengtn, resolution patterns (figure 1) in the -5 group are required, and resolution patterns in the -6 group are reauired for tests of devices with objective lenses of 25 mm focal length. These can be made from brass shim stock, mounted between glass plates. The width of the lines and spaces of the various patterns are as follows, in mm.
Pattern Group No. No. -5 -6
1 16.00 32.00 2 14.25 28.51 3 12.70 25.40 4 11. 31 22.63 5 10.08 20. 16 6 8.98 17.90
32.

Largest Dimension C?f Spots
JrUU a ~ ....
>0.38
0.3 to <0.38
0.23 to <0.3
0.15 < 0.23
0.076 to < 0.15
0.025 to < 0.076
L argest Dimension of spots
IlUt\
>0.38
0.3 to < 0.38
0.23 to < 0.3
0.15 to < 0.23
0.076 to < 0.15
0.025 to < 0.076
TABLE 1. CATHODE AND SCREEN SPOTS FOR 18 mm TUBES
Number of SQots in Circles of Indicated Diameter Inside Outside 5.6 nun 5.6 mm Inside 14.7 mIn
0 0
'0 1
0 3
0 9
3 30
10 35
TABLE 2: CATHODE AND SCREEN SPOTS FOR 25 nun TUBES
Outside 14.7 nun Inside 17.8 rom
0
2
8
18
40
--
Number of soots in Circles of Indicated L!ia'TIeter Inside OUtside :}. 6 t:nm outside 20 mIn
'7.6 nun Inside 20 nun Inside 24.8 rom
0 0 0
0 1 2
0 , 3 8
0 12 26
3 40 . --15 -- --
", '.
Pattern No.
1
2
3
4
5
6. .
'-r! _________ _
-6
0.0156
0.0175
0.0197
0.0221
0.0248
0.0278
TABLE 3. SPATIAL FREQUENCIES ON
RESOL~JTION CHART
(LINE PAIRS PER MILLIMETER) , Group No.
-5 -4 -3 -2 -1
0.03t2 0.0625 0.1250 0.2500 0.5000
0.0350 a .0702 0.1403 0.2806 () .5612
0.0394 o .0787 0.1575 0.3150 o .6300
0.0442 o .0884 0.1768 0.3536 o .7071
0.0496 0.0992 0.1984 0.3969 0.7937 ,
0.0557 0.1114 0.2227 0.4554 ' 0.8909
0 1
1.0000 2.0000
1 .1225 2.2449
1 .2599 2.5198
1 .4142 2.8284
1 .5874 3.1748
1. 7818 3.5636
_. ,-

(' . . 1")
(.4. l;
'-'") f: \-,.3)" l,
" i
!AI ~:
~ w ii: M!
-, I~ ;'\.)1
,,-.
(~ 01 ---
, . . . . t ... 1.. ___________ _

'(
't .~,
f. ;1 ('
r'~,'---~ .> i
-:.. ;
.. ~" t~
• ff r. .:
~f,L', ~, ~;,,' .. ~;;,
. , i~ ./t . :.;...;
~.
~
..., .... c u en > ~ c ~ .... -co ~ c .. ..., u :z e :z -:& == ....
,; h
i f i. r:
r ~: t i .. ~
5 I
4
3
2
100
~:,,--.;~~ ;~ .... ;~# -r ........... .'":"-1f'~It--.
I. ~ I
I r ~"-
I REFERENCE POINT (LUMINACE I I AT CENTER OF TUBE SCREENI
I I I I·
I V ~ -J'
~
80 60 40 20 o 20 40 60 80 100
PERCENTAGE OF DISTANCE FROM CENTER TO EDGE OF TUBE
i
« .... ~,.. ~. ,
!j ~
,€
~t.';:-
.
./,-( .. ~
:~
J ,< .. ~ 1;
.i ~ ~ .... ~
, .. ; ;~ ... ( '4 ~ .. \. .... , .
,,:.~
ij , "'\ I ~(\ ~~
',. ,'a -~
,t
'It, i~ It- '," ~ :!~ 11, ' ...... . " ~ .,.. ·r~ 7.r "t ~.~ .. ~ ' .. '1;
" .:. '1-
4 -.... ~ .. :1;
·,1 ~.~
. -I, .. ~ :,l:,~ -(~;;
~;:J ! ., i !~
" ~~ 't'.. ~ .,~
, ') ~.,~~l ."
Y1} '" .~~
~'. t'
.:- .... ,.;. '.' . ,-J-~rl~ i~:' I ". • , " 1',=:" ""M': .-;----~ .:. , . ~ ,
.:.._ .. ': :.~,,:::,:,,~':..:,.:_p, , . ......--"''''''''~ -- ,,;;.;:f':, 'C' ;S .\"", '"' .' t. ~~. . a!"'e f eO::
------""._--
~----~----~----------------~i
6.35 OIN1
SlOE VI Eli SECTlctI AlL OIl£1ISICXIS 11/ :-t1
t.' . _/
( I
I l. \ \
r 1 ,
i
FfIlNT VIEW
I
(
I
•
t \\,
'"""Ii ., ~~<"'=-~it I
\.
/.) , ... !
( . \ I
\
\

. ,-, ',:~
i -~,,~
~' -, . ~
•
m ,.--. -n ,.. ~o
,..~
"0 ~~
"
Oft
~~ -len %% mm ,..0 :"0 n" ~:.. Or-oG) -I~
en en
•
" % o -I o i: m -I m :D
, ~ .
I ! I
• ,
II: w ... w :E o ~ % L
II: w ~ w ->
n
>-Q 0 CD ~
({~
\ ' ' .. , ..... ... -
~1\ .....
.. "
" , 1i
f t
; t I i:
., . !
of
, . .i' ,'1
l:i ® ,<
,' ............. ~_...:...._ .... _,~_~_~_ .... _~., ... ....:."-,p.: .... .;:..",', ... ".,~>-~~ .... f ... __ ' __ .";"""" c) .... ~:...~.,;..~_~.:-_ ~ ....... ~., .• _u.. ....... ..l... __ "~b.~~"",,:,,. '-'" .. ~ ~ ... ~~
>.
i,
" !,
I J
-'---,rl· i:, ~ ~ ~ .f. '.~ '" . , t ,- ~. "~""''''''~'ji''hl '.-:.. _.~_.~+ _<
< -m ~ m :II
:a m (I)
n ~ %-eC J:-m ... :acn...... 0 z
" % o d 3: m ... m :II
. U1 .. o U1 . o 3
•

t v. ~~--------~~~
I 1f.....";....--O.8R·--~1 :!:. r---__
'/ -j\
",
11 1: 1\ " 11
t:: co
.c: U c Q
'f: Q
'til .-. C
... C :::J Q
~ en c .--OJ
(..)
Q
~ ----.,.-. .,.-
""": .,.-
\
~\ \
\ \
.... OJ
~ OJ .-
::> Ct:J .... OJ E ca
(..)

• •
E E -
"'" Q = II--,-" ~
::E < :.: ·et &01.1 C:L.
C:;)
.-=c: < loLl CL.
ACCELERATION -LEVELS: g(PEAK)
2.5 ---r------..
0.91
I , , , I ! , I I I I I 5
I
I "
I
I
I I I I I I I I I I ,
20 3,3 52 I -"
FREQUENCY (Hz)
I ,
I I I
2?0
VIBRATION TEST AMPLITUDE Vs FREQUENCY
. -•
e
E .2 :: " . ('II
"1
"
'----.E au
.- 10 ". ,...,
" "1 -(!) :J ...J 0..
I I
:>S,Oi\ . I Lc:o I
,0 .. -1 C\I
E u o l()
:1 f i 1

i. .. ,".' . ",. 1
" .~
I I.
I t ij I
. f
:i ! j
!
• 1
I 1
l 'i ~ I' II '\ i
! j , i ~
.h \
I
1 j. I
~
AI M.'_ ..... ~"" !
, .
~ij '" •
FIGURE CAPTIONS
1. Resolution test chart used for contrast transfer function test.
2.
3.
4 •
5.
Schematic sectional drawing of passive niqht vision device.
Luminance uniformity requirement.
Distortion test chart.
Cross sectional view of flare-light source.
6 .. Equipment arrangement for optical gain and light equivalent background tests.
7. Equipment arrangement for measuring veiling glare of photometer.
8. Equipment arrangement for light induced background test.
9. Equipment arrangement for luminance unifOrmity test.
10. Equipment arrangement for'contrast transfer function te~t .
11. Distortion chart image and reQuired measurements.
12. Equipment arrangement for flare test.
13. Vibration t~st amplitude as a function of frequency.
14. Integrating sphere light source.
15. Blackbody cavity.
J _.li:ii.t..-

i'
-::'"
< \
"'~
'I I
~ .
-"'~~f' __ :~~. ,JL."."", .. ,,' ,,;j :.:~ .. ~ ..... ~ .. ,"',