ditorial note national center for education statisticsnational center for education statistics the...
TRANSCRIPT

National Center for Education StatisticsThe National Center for Education Statistics (NCES) fulfi lls a congressional mandate to collect and report “statistics and information showing the condi-tion and progress of education in the United States and other nations in order to promote and accelerate the improvement of American education.”
EDUCATION STATISTICS QUARTERLY Purpose and goals
At NCES, we are convinced that good data lead to good decisions about education. The Education Statistics Quarterly is part of an overall effort to make reliable data more accessible. Goals include providing a quick way to
■ identify information of interest;
■ review key facts, fi gures, and summary information; and
■ obtain references to detailed data and analyses.
Content
The Quarterly gives a comprehensive overview of work done across all parts of NCES. Each issue includes short publications, summaries, and descriptions that cover all NCES publications and data products released during a 3-month period. To further stimulate ideas and discussion, each issue also incorporates
■ a message from NCES on an important and timely subject in education statistics; and
■ a featured topic of enduring importance with invited commentary.
A complete annual index of NCES publications appears in the fourth issue of each volume. Publications in the Quarterly have been technically reviewed for content and statistical accuracy.
ED I T O R I A L NO T E
E D U C A T I O N S T A T I S T I C S Q U A R T E R L Y — V O L U M E 7 , I S S U E S 1 & 2 , 2 0 0 5 1
General note about the data and interpretations
Many NCES publications present data that are based on representative samples and thus are subject to sampling variability. In these cases, tests for statistical signifi cance take both the study design and the number of comparisons into account. NCES publications only discuss differences that are signifi cant at the 95 percent confi dence level or higher. Because of variations in study design, differences of roughly the same magnitude can be statistically signifi cant in some cases but not in others. In addition, results from surveys are subject to
nonsampling errors. In the design, conduct, and data processing of NCES surveys, efforts are made to minimize the effects of nonsampling errors, such as item nonresponse, measurement error, data processing error, and other systematic error.
For complete technical details about data and meth-odology, including sample sizes, response rates, and other indicators of survey quality, we encourage readers to examine the detailed reports referenced in each article.

N A T I O N A L C E N T E R F O R E D U C A T I O N S T A T I S T I C S2
TA B L E O F CO N T E N T S
Note From NCESMark Schneider, Commissioner ............................................................6
Presents important information about the Quarterly and discusses obtaining NCES data using the newly redesigned NCES website.
Featured Topic: NCES Programs and PlansPrograms and Plans of the National Center for Education Statistics, 2005 Edition
U.S. Department of Education, National Center for Education Statistics ... 9
Summarizes current NCES statistical programs and services, major publications, and plans for future work. Includes de-scriptions, timelines, and plans for all NCES data collections.
Early Childhood EducationRegional Differences in Kindergartners’ Early Education Experiences
Emily Rosenthal, Amy Rathbun, and Jerry West ..................................15
Describes kindergartners’ patterns of participation in pre-school and kindergarten programs, as well as characteristics of the programs and the kindergartners who attend them, to provide a regional picture of kindergartners’ early learning experiences.
Elementary and Secondary EducationA Profi le of the American High School Sophomore in 2002: Initial Results From the Base Year of the Education Longitu-dinal Study of 2002
Steven J. Ingels, Laura J. Burns, Stephanie Charleston, Xianglei Chen, and Emily Forrest Cataldi ...........................................26
Presents fi ndings from the base year of the Education Lon-gitudinal Study of 2002 (ELS:2002). Provides descriptive information about the experiences and characteristics of a nationally representative sample of 10th-graders who were studied in spring 2002.
Adolescent Cigarette Smoking: A Longitudinal Analysis Through Young Adulthood
David C. Miller ...................................................................................33
Presents the incidence of daily smoking among adolescents at various points over a 12-year period. Identifi es several specifi c developmental patterns and examines them in relation to various descriptive characteristics.
Internet Access in U.S. Public Schools and Classrooms: 1994–2003
Basmat Parsad and Jennifer Jones .......................................................45
Presents 10 years of data on internet access in public schools, including national estimates as well as selected fi ndings by school characteristics.
Rates of Computer and Internet Use by Children in Nurs-ery School and Students in Kindergarten Through Twelfth Grade: 2003
Matthew DeBell ...................................................................................54
Describes the percentages of students in grade 12 or below who used computers or the Internet in 2003.
Distance Education Courses for Public Elementary and Secondary School Students: 2002–03
J. Carl Setzer and Laurie Lewis ...........................................................57
Presents national estimates of the number of districts and schools with students enrolled in distance education courses, as well as the number of enrollments in these courses; identi-fi es the most common distance education technologies; and provides districts’ reasons for having distance education courses.
Computer Technology in the Public School Classroom: Teacher Perspectives
Lawrence Lanahan and Janet Boysen ..................................................67
Describes the types of technologies public school teachers fi nd essential and whether they consider technology suffi -ciently available in their classrooms. Also compares teacher opinions across various teacher characteristics.
Qualifi cations of Public Secondary School Biology Teachers, 1999–2000
Daniel J. McGrath, Emily W. Holt, and Marilyn M. Seastrom .............71
Describes the qualifi cations of public middle school and high school biology teachers in terms of the subject matter of their certifi cations and postsecondary majors and minors.
Private School Teacher Turnover and Teacher Perceptions of School Organizational Characteristics
Daniel J. McGrath and Daniel Princiotta ............................................75
Examines teacher-perceived school organizational character-istics, and relationships between these characteristics and teacher turnover in Catholic, other religious, and nonsectar-ian private schools.
Parent and Family Involvement in Education: 2002–03Nancy Vaden-Kiernan and John McManus ..........................................79
Presents data on students in kindergarten through 12th grade and focuses on their families’ involvement in their children’s education. Examines educational activities related to school and outside of school.
Dual Enrollment of High School Students at Postsecondary Institutions: 2002–03
Brian Kleiner and Laurie Lewis ..........................................................87
Reports on the prevalence of college coursetaking by high school students at their institutions, both within and outside of dual enrollment programs. Presents information on institu-tions with dual enrollment programs, at the national level and by institution type and size.

E D U C A T I O N S T A T I S T I C S Q U A R T E R L Y — V O L U M E 7 , I S S U E S 1 & 2 , 2 0 0 5 3
Dual Credit and Exam-Based Courses in U.S. Public High Schools: 2002–03
Tiffany Waits, J. Carl Setzer, and Laurie Lewis ...................................98
Provides national estimates of the number of public high schools that offered dual credit and/or exam-based courses (e.g., Advanced Placement and International Baccalaureate courses), as well as the number of enrollments in these courses.
Public Elementary and Secondary Students, Staff, Schools, and School Districts: School Year 2002–03
Lee Hoffman, Jennifer Sable, Julia Naum, and Dell Gray ..................109
Presents data about the students enrolled in public education, including the number of students by grade and the number receiving special education, migrant, or English language learner services.
Revenues and Expenditures by Public School Districts: School Year 2001–02
Frank Johnson ...................................................................................120
Reports on public school district revenues and expenditures per student. Presents national and state values for the median school district and for districts at the 5th and 95th percentiles.
Revenues and Expenditures for Public Elementary and Secondary Education: School Year 2002–03
Jason Hill and Frank Johnson ............................................................133
Presents national and state data on public education fi nances, including revenues by source, expenditures per student, and expenditures for instruction.
Postsecondary EducationWaiting to Attend College: Undergraduates Who Delay Their Postsecondary Enrollment
Laura Horn, Emily Forrest Cataldi, and Anna Sikora .......................152
Describes the characteristics and outcomes of students who delay enrollment in postsecondary education and how they differ from their peers who enroll immediately after high school graduation.
The Road Less Traveled? Students Who Enroll in Multiple Institutions
Katharin Peter and Emily Forrest Cataldi .........................................161
Examines the extent to which undergraduates attend multiple institutions as well as the relationship between multiple institution attendance and persistence, attainment, and time to degree.
2003–04 National Postsecondary Student Aid Study (NPSAS:04): Student Financial Aid Estimates for 2003–04
Lutz Berkner, Shirley He, Stephen Lew, Melissa Cominole, and Peter Siegel .................................................................................167
Presents key data on the percentages of undergraduate, gradu-ate, and fi rst-professional students receiving different types of fi nancial aid, and the average amounts of aid received.
2003–04 National Postsecondary Student Aid Study (NPSAS:04): Undergraduate Financial Aid Estimates for 2003–04 by Type of Institution
Lutz Berkner, Christina Chang Wei, Shirley He, Stephen Lew, Melissa Cominole, and Peter Siegel ...................................................175
Describes average tuition and fees, average total price of at-tendance, and the percentages of undergraduates receiving various types and combinations of fi nancial aid (and aver-age amounts received), with a particular focus on grants and loans.
Debt Burden: A Comparison of 1992–93 and 1999–2000 Bachelor’s Degree Recipients a Year After Graduating
Susan P. Choy and Xiaojie Li .............................................................183
Compares the borrowing patterns of 1992–93 and 1999–2000 bachelor’s degree recipients, and examines their repayment situations and resulting debt burdens a year after graduation.
Postsecondary Participation Rates by Sex and Race/Ethnicity: 1974–2003
Lisa Hudson, Sally Aquilino, and Greg Kienzl ..................................187
Examines participation in postsecondary education among traditionally college-age women and men and among different racial/ethnic groups from 1974 to 2003.
Gender Differences in Participation and Completion of Undergraduate Education and How They Have Changed Over Time
Katharin Peter and Laura Horn ........................................................190
Examines gender differences in undergraduate participation and completion rates, focusing on changes over time in col-lege enrollment, associate’s and bachelor’s degree awards, and the demographic and enrollment characteristics of undergrad-uate men and women.
Trends in Undergraduate Career EducationLisa Hudson and Ellen Carey ............................................................197
Examines trends in undergraduate credentials in career-related areas of study, at both the subbaccalaureate and baccalaureate levels, from 1984–85 to 2000–01.
Enrollment in Postsecondary Institutions, Fall 2002 and Financial Statistics, Fiscal Year 2002
Laura G. Knapp, Janice E. Kelly-Reid, Roy W. Whitmore, Shiying Wu, Seungho Huh, Burton Levine, Marcus Berzofsky, and Susan G. Broyles .........................................................................201
Presents national- and state-level data on postsecondary enrollment, fi nancial statistics, and student fi nancial aid, as well as graduation rate data for the 1996 and 1999 student cohorts.

N A T I O N A L C E N T E R F O R E D U C A T I O N S T A T I S T I C S4
TA B L E O F CO N T E N T S
Staff in Postsecondary Institutions, Fall 2003, and Salaries of Full-Time Instructional Faculty, 2003–04
Laura G. Knapp, Janice E. Kelly-Reid, Roy W. Whitmore, Seungho Huh, Luhua Zhao, Burton Levine, Scott Ginder, Jean Wang, and Susan G. Broyles ......................................................209
Presents race/gender information for faculty and staff em-ployed at Title IV degree-granting institutions in fall 2003, and salaries and fringe benefi ts of full-time instructional faculty for academic year 2003–04.
2004 National Study of Postsecondary Faculty (NSOPF:04) Report on Faculty and Instructional Staff in Fall 2003
Emily Forrest Cataldi, Mansour Fahimi, and Ellen M. Bradburn .....223
Describes the gender, race/ethnicity, tenure status, and income of all faculty and instructional staff employed in degree-grant-ing institutions, by employment status, institution type, and program area.
Postsecondary Institutions in the United States: Fall 2003 and Degrees and Other Awards Conferred: 2002–03
Laura G. Knapp, Janice E. Kelly-Reid, Roy W. Whitmore, Shiying Wu, Lorrie Gallego, June Cong, Marcus Berzofsky, Seungho Huh, Burton Levine, and Susan G. Broyles ................................................234
Presents universe data on institutional characteristics as well as on the numbers of degrees conferred in the 50 states, the District of Columbia, and other jurisdictions, by control of institution, gender and race/ethnicity of recipients, and degree level and fi eld.
Lifelong LearningReasons for Adults’ Participation in Work-Related Courses, 2002–03
Matthew DeBell and Gail Mulligan ...................................................249
Examines the reasons that adults participate in formal, work-related educational courses.
LibrariesSchool Library Media Centers: Selected Results From the Education Longitudinal Study of 2002 (ELS:2002)
Leslie Scott ........................................................................................255
Examines various aspects of school libraries—their space, organization, collections, resources, staffi ng, and use—that serve 10th-graders. Also provides information by 10th-graders on their use of and opinions about school libraries.
Fifty Years of Supporting Children’s Learning: A History of Public School Libraries and Federal Legislation From 1953 to 2000
Joan S. Michie and Barbara A. Holton ..............................................264
Presents national-, regional-, state-, and school-level descrip-tive data about public school libraries since 1953, as well as regional school accreditation standards and federal legislation affecting school libraries.
Public Libraries in the United States: Fiscal Year 2002Adrienne Chute, P. Elaine Kroe, Patricia O’Shea, Terri Craig, Michael Freeman, Laura Hudgins, Joanna Fane McLaughlin, and Cynthia Jo Ramsey ............................................................................267
Reports information on public libraries, including size of collection, circulation, library visits, reference transactions, interlibrary loans, children’s program attendance, service out-lets, public service hours, electronic measures, staff, income, and expenditures.
International StatisticsComparative Indicators of Education in the United States and Other G8 Countries: 2004
Anindita Sen, Lisette A. Partelow, and David C. Miller .....................271
Compares the U.S. education system to the education systems of several other economically developed countries. Covers numerous topics, such as access, achievement, attainment, and expenditures at various levels of education, as well as labor market outcomes.
Highlights From the 2003 International Adult Literacy and Lifeskills Survey (ALL)
Mariann Lemke, David C. Miller, Jamie Johnston, Tom Krenzke, Laura Alvarez-Rojas, David Kastberg, and Leslie Jocelyn .................276
Provides key fi ndings from the 2003 International Adult Lit-eracy and Lifeskills Survey (ALL), including overall literacy and numeracy performance of U.S. adults ages 16–65 com-pared to their peers in fi ve other countries.
Crosscutting StatisticsThe Condition of Education 2005
U.S. Department of Education, National Center for Education Statistics ...........................................................................281
Focuses on indicators of the condition and progress of education in the United States, including participation and persistence, student performance, and societal support. Also includes this year’s special analysis on the mobility of the elementary and secondary school teacher workforce.
MethodologyFeasibility of a Student Unit Record System Within the Integrated Postsecondary Education Data System
Alisa F. Cunningham and John Milam ...............................................289
Describes the feasibility of collecting individual enrollment and fi nancial aid information for each student in postsecond-ary education.
Estimating Undergraduate Enrollment in Postsecondary Education Using National Center for Education Statistics Data
David Hurst and Lisa Hudson ...........................................................296
Describes the process of generating comparable estimates of undergraduate enrollment in postsecondary institutions across four NCES datasets.

E D U C A T I O N S T A T I S T I C S Q U A R T E R L Y — V O L U M E 7 , I S S U E S 1 & 2 , 2 0 0 5 5
Data Products, Other Publications, and Funding Opportunities
Data ProductsData File: CCD School District Finance Survey: FY 1997 Final ....................................................................300
Data File: CCD School District Finance Survey: FY 2003 Preliminary .........................................................300
Data File: CCD National Public Education Financial Survey: FY 2003 Preliminary ............................................300
2003–04 National Postsecondary Student Aid Study (NPSAS:04): Undergraduate Data Analysis System ..........300
2003–04 National Postsecondary Student Aid Study (NPSAS:04): Graduate Data Analysis System ...................301
Data File, Public-Use: Public Libraries Survey: Fiscal Year 2002 .................................................................301
Data File, Public-Use: Public Libraries Survey: Fiscal Year 2003 .................................................................301
Other PublicationsThe Nation’s Report Card: An Introduction to the National Assessment of Educational Progress (NAEP)
U.S. Department of Education, National Center forEducation Statistics .......................................................................... 302
The Condition of Education in Brief 2005Andrea Livingston and John Wirt (editors) ...................................... 302
Directory of Public Elementary and Secondary Agencies 2002–03
Lena M. McDowell and John P. Sietsema ......................................... 302
America’s Public School Libraries: 1953–2000Joan S. Michie and Barbara A. Holton .............................................. 303
User’s Guide to Developing Student Interest Surveys Under Title IX
U.S. Department of Education, National Center for Education Statistics .......................................................................... 303
Training and Funding OpportunitiesTraining .............................................................................303
The AERA Grants Program ...............................................303
The NAEP Secondary Analysis Grant Program .................304
AIR Grants Program ..........................................................304
NPEC/AIR Focused Grants ...............................................305

N A T I O N A L C E N T E R F O R E D U C A T I O N S T A T I S T I C S6
NO T E FR O M NCESMark Schneider, Commissioner
Helping You Find the Education Data You NeedWe want to inform all our readers that this is the last issue of the Education Statistics Quarterly. Launched in the spring of 1999, the Quarterly was designed to be a comprehensive source of regularly issued summaries of all NCES publica-tions and data products under one cover. While we will no longer publish the Quarterly, the National Center for Education Statistics (NCES) remains committed to disseminating data to the broadest possible audience to meet the ever-increasing demand for information on the status of education in the United States and other countries. As the primary federal entity for collecting and analyzing education data, NCES has many activities under way to reach education data users.
The fi rst place for readers to turn is the newly redesigned NCES website at http://nces.ed.gov. Users can access nearly 2,000 publications on all aspects of education, including prekindergarten through postsecondary education, vocational and adult education, libraries, national assessments, and information on U.S. stu-dent performance in an international context from the results of international sur-veys. These publications and related data products are contained in an online cata-log with customized search capabilities. In addition, the website provides a variety of online data tools so that users can build their own tables using raw data from NCES surveys. The website also provides searchable databases to fi nd the location of and information on numerous education institutions, including public school districts, public and private schools, and libraries. The popular College Opportu-nities On-Line (COOL) tool has information on 7,000 colleges, universities, and technical institutions in the United States. In addition, the National Assessment of Educational Progress (NAEP) has a new and fl exible data tool, the NAEP Data Explorer, that allows the user to create statistical tables based on NAEP student performance results and factors that may be related to student learning. NCES has efforts under way to move more of its databases to the Data Analysis System (DAS) so that users will have increased access to our data for their own research needs.
Another place to fi nd out about NCES data collections and products is the featured publication in this issue, Programs and Plans. This publication provides a compre-hensive and user-friendly overview of all NCES statistical programs and plans for

E D U C A T I O N S T A T I S T I C S Q U A R T E R L Y — V O L U M E 7 , I S S U E S 1 & 2 , 2 0 0 5 7
future work. This new edition contains an index to help readers fi nd information on popular topics such as parents, teachers, public schools, assessments, dropouts, and student aid.
In closing, we want to thank you for your readership and urge you to continue to turn to NCES for your education data needs. To keep current, please sign up on the NCES website for News Flash to start receiving e-mail alerts about new products in areas of interest to you. A special thanks goes to the various members of the editorial board throughout the Quarterly’s history, to the managing editor, other contributing staff, and expert commentators.

N A T I O N A L C E N T E R F O R E D U C A T I O N S T A T I S T I C S8

E D U C A T I O N S T A T I S T I C S Q U A R T E R L Y — V O L U M E 7, I S S U E S 1 & 2, 2 0 0 5 9
FEATURED TOPIC: NCES PROGRAMS AND PLANS
Programs and Plans of the National Center for Education Statistics, 2005 Edition
U.S. Department of Education, National Center for Education Statistics .................9
NCES Programs and PlansPrograms and Plans of the National Center for Education Statistics, 2005 Edition——————————————————————————————————U.S. Department of Education, National Center for Education Statistics
This article was originally published as the introduction to the publication of the same name.
The Work of the National Center for Education Statistics
The National Center for Education Statistics (NCES), with-in the U.S. Department of Education’s Institute of Education Sciences, collects statistics on the condition of education in the United States; analyzes and reports the meaning and signifi cance of these statistics; and assists states, local edu-cation agencies, and postsecondary institutions in improv-ing their statistical systems. NCES supports a wide range of activities, providing policy-relevant data on issues as diverse as enrollment trends, access of minorities to postsecondary education, the academic achievement of students, compari-sons of the U.S. education system with education systems in
other countries, and the association between education and employment and economic productivity.
NCES’s program goals include the following:
■ maintaining and analyzing major cross-sectional databases:
– at the elementary/secondary level—the Common Core of Data (CCD), the Schools and Staffi ng Survey (SASS), and the Private School Universe Survey (PSS); and
– at the postsecondary level—the Integrated Postsecondary Education Data System (IPEDS), the National Postsecondary Student Aid

N A T I O N A L C E N T E R F O R E D U C A T I O N S T A T I S T I C S10
Featured Topic: NCES Programs and Plans
Study (NPSAS), the National Study of Postsecondary Faculty (NSOPF), and the Survey of Earned Doctor-ates (SED);
■ conducting a National Household Education Surveys Program (NHES) covering various education topics such as early childhood and adult education, program participation, education-related home activities, and parental involvement in education;
■ supporting surveys on topics related to school crime and safety: the School Crime Supplement (SCS) to the National Crime Victimization Survey (NCVS) and the School Survey on Crime and Safety (SSOCS);
■ conducting surveys and analyzing data from the Longitudinal Studies Program that address a variety of important education issues (from early learning through postsecondary school), including differences in early cognitive development, school readiness, student achievement, effects of fi nancial aid on access to postsecondary education, youth employ-ment, high school dropouts, discipline and order in schools, and the quality of education in public and private schools:
– at the early childhood level—the Early Childhood Longitudinal Study (ECLS), with birth and kin-dergarten cohorts (the latter of which plans to follow children into high school);
– at the secondary school level—the Education Lon-gitudinal Study of 2002 (ELS:2002) (10th-grade cohort) as well as the earlier National Longitu-dinal Study of the High School Class of 1972 (NLS:72) (12th-grade cohort), High School and Beyond Longitudinal Study (HS&B) (10th- and 12th-grade cohorts), and National Education Longitudinal Study of 1988 (NELS:88) (8th-grade cohort); and
– at the postsecondary level—the Beginning Postsecondary Students Longitudinal Study (BPS) and the Baccalaureate and Beyond Lon-gitudinal Study (B&B), which follow students attending or completing postsecondary institutions;
■ conducting the National Assessment of Educational Progress (NAEP), which regularly assesses academic achievement at the national level in a number of sub-jects, including reading, mathematics, writing, science, civics, history, and geography. The reading and math-ematics components of NAEP are administered every 2 years in grades 4, 8, and 12 at the national and state levels;
■ participating in international surveys of educational achievement and programs to develop cross-national education data and indicators, such as the Trends in International Mathematics and Science Study (TIMSS), Program for International Student Assess-ment (PISA), and Progress in International Reading Literacy Study (PIRLS);
■ administering targeted surveys that supplement on-going data collections through the Fast Response Sur-vey System (FRSS) and the Postsecondary Education Quick Information System (PEQIS), which rapidly provide data on current policy issues;
■ collecting and reporting information on libraries through the Public Libraries Survey (PLS), the Aca-demic Libraries Survey (ALS), the School Library Media Centers Survey, and the State Library Agencies Survey (StLA);
■ analyzing and reporting data on vocational education; and
■ synthesizing information from various surveys for the following annual NCES publications: Digest of Education Statistics, The Condition of Education, and Projections of Education Statistics.
Programs and Plans of the National Center for Education Statistics is a comprehensive summary of the work done across NCES to achieve these program goals. In the full publication, NCES center-wide programs and services are described in chapter 2, and the various statistical programs in the following chapters. Each chapter that covers a statis-tical program contains a brief introduction and provides information on data uses, individual studies, publications and data fi les, NCES contacts, future activities, and data collection schedules.
What Kinds of Data Does NCES Collect?
NCES collects statistical data on all levels of education from preprimary education through graduate study, includ-ing adult education. NCES surveys address a full range of education issues including student access, participation, and progress; achievement and attainment of students; organization and management of education institutions; curriculum, climate, and diversity of education institutions; and fi nancial and human resources of institutions, as well as economic and other outcomes of education. The surveys engage a broad spectrum of people and institutions involved in education. See fi gure 1 for the names and acronyms of the major NCES surveys, as well as those of the international surveys in which NCES participates.

E D U C A T I O N S T A T I S T I C S Q U A R T E R L Y — V O L U M E 7, I S S U E S 1 & 2, 2 0 0 5 11
Programs and Plans of the National Center for Education Statistics, 2005 Edition
ALL: Adult Literacy and Lifeskills
ALS: Academic Libraries Survey
B&B: Baccalaureate and Beyond Longitudinal Study
BPS: Beginning Postsecondary Students Longitudinal Study
CCD: Common Core of Data
CivEd: Civic Education Study
CPS: Current Population Survey (U.S. Census Bureau survey used in NCES studies)
ECLS-B: Early Childhood Longitudinal Study-Birth Cohort of 2001
ECLS-K: Early Childhood Longitudinal Study-Kindergarten Class of 1998–99
ELS:2002: Education Longitudinal Study of 2002
FRSS: Fast Response Survey System
HS&B: High School and Beyond Longitudinal Study
HSTS: NAEP High School Transcript Study
IALS: International Adult Literacy Survey
IPEDS: Integrated Postsecondary Education Data System
NAAL: National Assessment of Adult Literacy
NAEP: National Assessment of Educational Progress
NELS:88: National Education Longitudinal Study of 1988
NHES: National Household Education Surveys Program
NLS:72: National Longitudinal Study of the High School Class of 1972
NPSAS: National Postsecondary Student Aid Study
NSOPF: National Study of Postsecondary Faculty
PEQIS: Postsecondary Education Quick Information System
PIRLS: Progress in International Reading Literacy Study
PISA: Program for International Student Assessment
PLS: Public Libraries Survey
PSS: Private School Universe Survey
SASS: Schools and Staffi ng Survey
SCS/NCVS: School Crime Supplement to the National Crime Victimization Survey (NCES and the Bureau of Justice Statistics)
SDDB: School District Data Book
SED: Survey of Earned Doctorates
SSOCS: School Survey on Crime and Safety
StLA: State Library Agencies Survey
TFS: Teacher Follow-up Survey
TIMSS: Trends in International Mathematics and Science Study (formerly known as the Third International Mathematics and Science Study)
TIMSS-R: Third International Mathematics and Science Study-Repeat (now referenced as TIMSS 1999)
Figure 1. NCES survey names and acronyms
The following topics illustrate the scope of NCES data col-lection and analysis activities:
■ Adults are asked about their participation in adult education and other learning activities.
■ Children’s cognitive skills are directly measured.
■ Students are asked about their participation in school activities.
■ Parents are surveyed about their participation in their children’s education.
■ Teachers are asked to report information about their classes.
■ School administrators are asked to report information about their schools.
■ Principals are asked about crimes occurring in their schools.
■ Student dropout rates and achievement are measured.
■ Staffi ng ratios of public schools are compiled.
■ Comprehensive fi nance data are collected.
■ Postsecondary education student participation rates in fi nancial aid programs are gathered.
■ Institutions indicate program offerings.
■ Libraries report information on usage.

N A T I O N A L C E N T E R F O R E D U C A T I O N S T A T I S T I C S12
Featured Topic: NCES Programs and Plans
Which Surveys Cover Specifi c Education Levels and Topics?
NCES provides data and tabulations at various reporting levels: that is, on individual institutions, school districts, states, and the nation. Whether particular data are available at one or more than one of these reporting levels is based on a variety of factors, including survey design and confi denti-ality of data.
The data reporting level required for a particular use can be an important determinant in the selection of the most appropriate survey database. For example, those who are interested in national-level public school enrollments have a variety of possible sources of information, while those needing enrollments for specifi c schools have fewer sources. Some sample surveys, such as NHES, are limited to national-level estimates because of the design of the survey. Data from other surveys, such as the CCD, are published as state-level summaries and district tabulations for large districts. In addition, CCD data fi les contain school- and school district-level records. Detailed data for individual schools, school districts, and colleges generally are made available only through electronic products because of the size of the data fi les. Table 1 presents the survey sources of NCES data by topic, by education level (elementary/secondary, postsec-ondary, and lifelong learning), and by reporting level (from institutional to national).
Who Uses NCES Statistics—and for What Purposes?
Education statistics are used for a variety of purposes, from research to policy formation. Congress uses data to study education issues, to plan federal education programs, to apportion federal funds among the states, and to serve the needs of constituents. Federal agencies (such as the U.S. Departments of Defense, Labor, and Commerce, and the National Science Foundation) are concerned with the supply of trained manpower coming out of schools and colleges, and also with the subjects that are being taught. State and local offi cials confront problems of staffi ng and fi nancing public education. They use NCES statistics in all aspects of policy development and program administration. Education organizations and professional associations use the data for planning, policy development, and research. The news media (such as national television networks, national news magazines, and many of the nation’s leading daily newspapers) frequently use NCES statistics to inform *Descriptions of these publications appear in chapter 10 of the complete Programs
and Plans.
the public about such matters as student achievement, school expenditures per student, and international compari-sons. Business organizations use trend data on enrollments and expenditures to forecast the demand for their products. The general public uses education statistics to become more knowledgeable and to make informed decisions about current education issues.
How to Access NCES Data
To meet the demand for statistical information, NCES issues nearly 100 products each year in print and electronic form. These products include statistical reports, directories, data fi les, and handbooks of standard terminology. All NCES prod-ucts are available on the NCES website (http://nces.ed.gov). Many of these products are also available through ED Pubs (http://www.edpubs.org), the publications and products ordering system for the U.S. Department of Education.
While many NCES publications report the fi ndings of spe-cifi c surveys, three publications cover the fi eld of education statistics from a wide perspective: the Digest of Education Statistics (http://nces.ed.gov/programs/digest), Projections of Edu-cation Statistics (http://nces.ed.gov/programs/projections), and The Condition of Education (http://nces.ed.gov/programs/coe).*
Additionally, easy-to-use web tools for locating schools and colleges, carrying out peer comparisons of school district fi nances, and creating tables are available on the NCES website.
The U.S. Department of Education’s National Library of Education (http://www.ed.gov/NLE) provides a central loca-tion within the federal government for information about education; collecting and archiving resources on national education issues as well as on federal policy, research, evalu-ation, and statistics; and maintaining a collection of agency documents, including NCES publications.
The Library provides information services on matters re-lated to education to the general public through its toll-free telephone number (1-800-424-1616) and e-mail service ([email protected]), as well as through cooperative arrange-ments with the Library of Congress’s online reference service (www.loc.gov/rr/askalib/ask-digital.html) and the Education Resources Information Center (ERIC) (http://www.eric.ed.gov). The Library responds to more than 15,000 inquiries annually,

E D U C A T I O N S T A T I S T I C S Q U A R T E R L Y — V O L U M E 7, I S S U E S 1 & 2, 2 0 0 5 13
Reporting level
TopicSchool/
institution School district State National
Elementary/secondary
Students CCD, PSS, ECLS-K
CCD, SDDB CCD, SDDB CCD, NLS:72, HS&B, NELS:88, ELS:2002, PSS, TIMSS 2003, TIMSS-R, NAEP, ECLS-K, ECLS-B,
FRSS, SDDB, NHES, HSTS, SCS/NCVS, PIRLS, CPS, PISA, CivEd
Teachers/staff CCD, PSS CCD CCD, NAEP, SASS, PSS
CCD, SASS, NAEP, PSS, HS&B, NELS:88, ELS:2002, ECLS-K, ECLS-B, TIMSS 2003, TIMSS-R, FRSS, B&B
Public schools CCD CCD CCD, SASS NAEP, TIMSS 2003, TIMSS-R, FRSS, CCD, SASS, HS&B, NELS:88, ELS:2002, ECLS-K, ECLS-B, SSOCS
Public agency fi nances CCD CCD CCD
School libraries SASS SASS, ELS:2002
Assessment NAEP NAEP, NLS:72, HS&B, NELS:88, TIMSS 2003, TIMSS-R, PIRLS, ECLS-K,
ECLS-B, PISA, CivEd
Private schools PSS PSS PSS, SASS, FRSS, NELS:88, ELS:2002, ECLS-K, ECLS-B, HS&B, NLS:72
Parents NELS:88, HS&B, ELS:2002, ECLS-K, ECLS-B
Postsecondary
Students IPEDS IPEDS NPSAS, IPEDS, BPS, B&B, NLS:72, HS&B, NELS:88, ELS:2002, NHES, CPS, PEQIS
Faculty/staff IPEDS IPEDS IPEDS, NSOPF, PEQIS
Institutions IPEDS IPEDS IPEDS, PEQIS, NPSAS
Finances IPEDS IPEDS IPEDS
Student aid IPEDS IPEDS IPEDS, NPSAS, BPS, B&B
Completions IPEDS IPEDS IPEDS, BPS, B&B, NLS:72, HS&B, NELS:88, ELS:2002, SED, CPS
Lifelong learning
Adult education NHES, NAAL, IALS, B&B, CPS, NELS:88, ELS:2002, HS&B, NLS:72
Libraries ALS ALS ALS, PLS, StLA ALS, PLS, StLA, NHES, FRSS
Households SDDB SDDB SDDB, NHES, NELS:88, ELS:2002, NAAL, IALS, HS&B, CPS
NOTE: See fi gure 1 for defi nitions of survey acronyms.
Table 1. Survey sources of NCES data, by reporting level, education level, and topic
For more information about NCES programs and plans, see the complete publication:
U.S. Department of Education, National Center for Education Statistics. (2005). Programs and Plans of the National Center for Education Statistics, 2005 Edition (NCES 2005-113).
For questions about content, contact Thomas Snyder ([email protected]).
To obtain the complete publication (NCES 2005-113), call the toll-free ED Pubs number (877-433-7827) or visit the NCES Electronic Catalog (http://nces.ed.gov/pubsearch).
Programs and Plans of the National Center for Education Statistics, 2005 Edition
with most questions pertaining to U.S. Department of Education programs and statistics. In addition, the Library serves other libraries by lending books and other documents, including agency publications, from its collection.

N A T I O N A L C E N T E R F O R E D U C A T I O N S T A T I S T I C S14
E D U C A T I O N S T A T I S T I C S Q U A R T E R L Y — V O L U M E 7, I S S U E S 1 & 2, 2 0 0 5 15
EARLY CHILDHOOD EDUCATION
Regional Differences in Kindergartners’ Early Education ExperiencesEmily Rosenthal, Amy Rathbun, and Jerry West .....................................................15
Early Education ExperiencesRegional Differences in Kindergartners’ Early Education Experiences——————————————————————————————————Emily Rosenthal, Amy Rathbun, and Jerry West
This article was originally published as a Statistics in Brief report. The sample survey data are from the Early Childhood Longitudinal Study, Kindergarten Class of 1998–99 (ECLS-K). Technical notes and standard error tables from the original report have been omitted.
Introduction
There is a growing trend toward public funding (i.e., state) for prekindergarten classes (Hinkle 2000). In 1991–92, some 24 states reported funding prekindergarten initiatives. This number increased to 42 states in 1998–99 (Hinkle 2000). During the 2000–01 school year, approximately one-third of all public elementary schools in the United States offered prekindergarten classes (Smith et al. 2003). In addition, over time, more states have begun to offer full-day kinder-garten programs (Galley 2002). For example, in 1995, 10 states required that full-day kindergarten be offered. As of 2002, 14 states required full-day programs to be offered (Potts, Blank, and Williams 2002). In a review of state
policies regarding full-day kindergarten, Galley (2002) found that 25 states and the District of Columbia provide funds for full-day kindergarten programs in the districts that mandate or voluntarily offer it. Enrollment in full-day kindergarten programs has also increased. Between 1977 and 2001, the percent of children ages 4–6 enrolled in full-day kindergarten programs increased from 27 to 60 percent (Wirt et al. 2004). A recent report found that public school children’s likelihood of attending full-day kindergar-ten varied by the region in which their school was located (Walston and West 2004). Furthermore, the report indi-cated that full-day kindergartners, on average, made greater gains in both their reading and mathematics achievement
N A T I O N A L C E N T E R F O R E D U C A T I O N S T A T I S T I C S16
Early Childhood Education
scores from fall to spring, compared to those in half-day classes. Based on these fi ndings, this report looks more closely at regional differences in kindergartners’ early education experiences.
Recent fi ndings from the Early Childhood Longitudinal Study, Kindergarten Class of 1998–99 (ECLS-K), the Fast Response Survey System’s (FRSS) “Survey of Classes That Serve Children Prior to Kindergarten in Public Schools: 2000–2001,” and the Current Population Survey (CPS), October Supplement: 2001, provide new regional informa-tion on the early learning experiences of young children in the United States. For instance, the FRSS found that public schools in the Southeast were more likely to offer prekin-dergarten programs than public schools in the Northeast, Central, or West regions (Smith et al. 2003). In addition, public schools in the South during the 1998–99 school year were more likely to offer full-day kindergarten than schools in other regions of the country (Walston and West 2004). In the CPS, in 2001, children ages 4–6 enrolled in kinder-garten in the South were more likely to attend full-day kindergarten (78 percent) than children in the Northeast, Midwest, and West (60, 53, and 43 percent, respectively) (Wirt et al. 2004).
This Statistics in Brief report takes a closer look at two of kindergartners’ early education experiences, preschool and kindergarten, in each of four regions of the United States (i.e., Northeast, South, Midwest, and West). This report defi nes early education experiences as participation in preschool, the number of hours spent in preschool, and the type of kindergarten program (i.e., full-day versus half-day). Preschool experience was based on parental report and defi ned as kindergartners’ participation in either a child care center, preschool, nursery school, prekindergarten or Head Start program the year prior to kindergarten. The purpose of this report is to describe, rather than explain, kindergart-ners’ patterns of participation in preschool and kindergarten programs, and characteristics of the programs and the kin-dergartners who attend them, in an attempt to provide a re-gional picture of kindergartners’ early learning experiences. This report expands on the fi ndings from the earlier reports (Smith et al. 2003; Walston and West 2004; Wirt et al. 2004) by including kindergartners’ participation in all types of center-based care arrangements the year before kindergarten, rather than focusing only on public school prekindergarten programs, and also looks more closely at regional participa-tion in preschool and kindergarten for kindergartners with different individual, family, and school characteristics.
This report attempts to answer two questions about kinder-gartners’ early education experiences within and across four regions1 of the United States:
■ What are the regional differences in kindergartners’ preschool experiences (e.g., center-based care or Head Start the year before kindergarten entry) in the United States?
■ Are there regional differences in kindergartners’ participation in full-day versus half-day kindergarten programs in the United States?
The ECLS-K selected a nationally representative sample of kindergartners in the fall of 1998 and has followed these children through the spring of fi fth grade. The study col-lects information directly from children and their families, teachers, and schools. The fi ndings in this report come from the ECLS–K fall and spring kindergarten data collec-tions and are organized into three sections. First, this report compares percentage distributions of kindergartners within each region across the four regions of the United States. Sec-ond, it compares the percent of kindergartners within each region who attended preschool and the number of hours they spent in preschool each week. Finally, it presents com-parisons of the percentage of kindergartners who attended full-day kindergarten across regions. Regional comparisons are made overall and in relation to selected characteristics of children (i.e., sex, age at kindergarten entry, race/ethnicity), their families (i.e., mother’s education, mother’s employ-ment status, household poverty status), and their schools (i.e., urbanicity, type).
Comparisons in the text are tested for statistical signifi cance to ensure that the differences are larger than might be expect-ed due to sampling variation. All differences described are signifi cant at the .05 level. Due to the large sample size, many differences (no matter how substantively minor) are statisti-cally signifi cant. In this report, “substantive differences” are defi ned as percentage differences of 5 points or greater for preschool and full-day kindergarten participation, and as mean score differences of one-fi fth of a standard deviation (i.e., 3 hours) or more in terms of weekly hours of preschool.
1Regions used for the ECLS-K are the same as those used by the U.S. Bureau of the Census. The following is a list of states that are included in each region:
■ Northeast: Connecticut, Maine, Massachusetts, New Hampshire, New Jersey, New York, Pennsylvania, Rhode Island, Vermont;
■ Midwest: Illinois, Indiana, Iowa, Kansas, Michigan, Minnesota, Missouri, Nebraska, North Dakota, Ohio, South Dakota, Wisconsin;
■ South: Alabama, Arkansas, Delaware, District of Columbia, Florida, Georgia, Ken-tucky, Louisiana, Maryland, Mississippi, North Carolina, Oklahoma, South Carolina, Tennessee, Texas, Virginia, West Virginia; and
■ West: Alaska, Arizona, California, Colorado, Hawaii, Idaho, Montana, Nevada, New Mexico, Oregon, Utah, Washington, Wyoming.

E D U C A T I O N S T A T I S T I C S Q U A R T E R L Y — V O L U M E 7, I S S U E S 1 & 2, 2 0 0 5 17
FindingsPatterns in kindergartners’ child, family, and school characteristics across regions
As shown in table 1, certain child and family characteristics of kindergartners vary by region. For example, the ages of children at the start of kindergarten differ. Among kinder-gartners in each region, the percentage of young kindergart-ners turning 5 during the fi rst 4 months of the academic year (i.e., September through December 1993) was higher in the Northeast and West than in the Midwest and the South. This pattern is consistent with the kindergarten entry-age policies of states that make up these regions. Many states in the Northeast and West have policies on kindergarten entry age that allow children to start kindergarten if they turn 5 by December or January. In contrast, the majority of states in the Midwest and South have policies that require chil-dren to be at least 5 years of age by mid-September to start kindergarten (Education Commission of the States 2003).
The percent of kindergartners within each region who were Hispanic was largest among kindergartners in the West. About 40 percent of kindergartners in the West were His-panic, compared with 14 percent in the Northeast, 9 percent in the Midwest, and 15 percent in the South. On the other hand, relatively more kindergartners in the South were Black than in any other region. About 27 percent of kinder-gartners in the South were Black, compared with 12 percent in the Northeast, 11 percent in the Midwest, and 6 percent in the West.
Among the kindergartners in each region, higher percent-ages of kindergartners in the South and West than those in the Northeast and Midwest were from families with incomes below the federal poverty threshold. In 1998, the federal poverty threshold for a family of four was $16,655.
Kindergartners in the South and West were less likely than those in the Northeast or Midwest to have mothers with a bachelor’s degree or higher. Also, kindergartners in the South and West were more likely than those in the other regions to have mothers who completed less than high school.
Kindergartners in the Midwest and South were more likely to have mothers who worked full time (i.e., 35 hours or more per week) than those in the Northeast or West. In contrast, kindergartners in the West were more likely than kindergartners in the Midwest or the South to have a mother who was not in the labor force.
Kindergartners in the West were more likely to have at-tended schools in central cities than kindergartners in the Northeast or the Midwest. About 47 percent of kindergart-ners in the West attended schools in central cities, com-pared with 33 percent in the Northeast and 32 percent in the Midwest. In contrast, kindergartners in the Midwest were more likely to have attended schools in rural areas than kindergartners in the West or the Northeast.
The majority of kindergartners attended public school kindergarten programs rather than private school, regard-less of region. However, kindergartners in the South were more likely to attend a public school for kindergarten than kindergartners in any of the other regions.
Patterns in kindergartners’ preschool experience across regions
Overall, 68 percent of kindergartners attended preschool the year before entering kindergarten. As shown in table 2, kin-dergartners’ preschool experiences2 the year before kinder-garten differed by region. Kindergartners in the West were less likely to have attended preschool than kindergartners in any of the other regions. Sixty-two percent of kindergartners in the West attended preschool the year before kindergarten, compared with 71 percent in the Northeast, 72 percent in the Midwest, and 69 percent in the South. Of the kindergart-ners who attended preschool, those in the South spent more hours per week in their preschool programs, on average, than kindergartners in any of the other regions (fi gure 1).
Patterns in kindergartners’ preschool experiences across regions, by child, family, and school characteristics
Preschool attendance. Regional differences are also evident when examining the data within groups of kindergartners differing on various child, family, and school characteris-tics; these regional differences generally follow the pattern of regional differences found for the full sample of kinder-gartners (table 2). For example, Black kindergartners in the West were more likely to attend preschool than Black kindergartners in the South or the Northeast. About 83 percent of Black kindergartners in the West attended pre-school, compared with 70 percent in the Northeast and 76 percent in the South. In addition, Asian kindergartners in the Midwest were more likely to have attended preschool than their peers in the West.
2Preschool experience was based on parental report and defi ned as children’s par-ticipation in either a child care center, preschool, nursery school, prekindergarten, or Head Start program the year prior to kindergarten.
Regional Differences in Kindergartners’ Early Education Experiences

N A T I O N A L C E N T E R F O R E D U C A T I O N S T A T I S T I C S18
Early Childhood Education
Table 1. Percentage distribution of fall 1998 kindergartners, by region and selected child, family, and school characteristics: School year 1998–99
Characteristic Total Northeast Midwest South West
Total 100 100 100 100 100
Child’s sexMale 51 52 50 52 51Female 49 48 50 48 49
Child’s age at kindergarten entry (fall 1998)Age 4: Born Sept.–Dec. 1993 9 14 4 5 15Age 5: Born May–Aug. 1993 31 33 29 31 32Age 5: Born Jan.–Apr. 1993 31 29 32 31 31Age 5: Born Sept.–Dec. 1992 24 19 26 28 19Age 6: Born Jan.–Aug. 1992 6 4 10 5 4
Child’s race/ethnicity White, non-Hispanic 57 68 69 54 41Black, non-Hispanic 16 12 11 27 6Hispanic 19 14 9 15 40Asian 3 3 2 1 6Other 5 3 8 3 7
Federal poverty level1 At or above poverty threshold 78 84 83 74 76Below poverty threshold 22 16 17 26 24
Mother’s education2 Less than high school 15 9 10 17 21High school diploma or equivalent 31 30 29 35 28Some college, including vocational/technical 32 32 37 29 32Bachelor’s degree or higher 22 29 24 19 18
Mother’s employment2
35 hours or more per week 45 40 47 49 42Less than 35 hours per week 21 26 23 18 21Looking for work 4 4 4 5 4Not in the labor force 29 29 26 28 33
School urbanicityCentral city 38 33 32 39 47Urban fringe and large town 42 53 40 39 38Small town and rural 21 14 27 22 16
Kindergarten school typePublic 85 80 82 90 85Private 15 20 18 10 15
1Poverty is a function of household size and household income. Based on 1998 Census information, a household of four with a total income below $16,655 was considered to be below the federal poverty level.2Households in which there was no mother were not included in these estimates.NOTE: Detail may not sum to totals because of rounding.SOURCE: U.S. Department of Education, National Center for Education Statistics, Early Childhood Longitudinal Study, Kindergarten Class of 1998–99 (ECLS-K), Base-Year Public-Use Data File, fall 1998 and spring 1999.

E D U C A T I O N S T A T I S T I C S Q U A R T E R L Y — V O L U M E 7, I S S U E S 1 & 2, 2 0 0 5 19
Table 2. Percent of fall 1998 kindergartners who attended preschool the year before kindergarten and mean hours per week in preschool, by region and selected child, family, and school characteristics: School year 1998–99
Percent attending preschool the year before kindergarten Mean hours per week in preschool
Characteristic Total Northeast Midwest South West Total Northeast Midwest South West
Total 68 71 72 69 62 22 19 18 28 20
Child’s sexMale 68 70 72 69 61 23 19 18 28 21Female 69 71 73 69 63 22 20 18 28 20
Child’s age at kindergarten entry (fall 1998)Age 4: Born Sept.–Dec. 1993 64 68 70 71 56 23 21 20 27 22Age 5: Born May–Aug. 1993 69 71 74 69 62 23 20 18 28 21Age 5: Born Jan.–Apr. 1993 70 73 71 71 63 22 19 18 28 20Age 5: Born Sept.–Dec. 1992 69 70 73 69 64 23 17 19 29 19Age 6: Born Jan.–Aug. 1992 65 65 72 60 59 20 18 17 26 16
Child’s race/ethnicityWhite, non-Hispanic 71 74 74 69 68 20 17 17 25 19Black, non-Hispanic 76 70 77 76 83 31 28 26 33 28Hispanic 55 59 59 56 53 22 24 17 28 20Asian 66 65 74 68 61 23 22 19 27 23Other 65 66 72 70 54 23 20 22 29 23
Federal poverty level1 At or above poverty threshold 70 73 74 70 64 22 19 18 27 20Below poverty threshold 62 59 67 66 53 26 23 22 30 20
Mother’s education2 Less than high school 51 49 53 55 46 23 22 17 28 18High school diploma or equivalent 64 65 68 65 57 23 19 18 29 20Some college, including vocational/technical 72 73 74 74 66 22 20 18 29 21Bachelor’s degree or higher 82 82 84 82 79 21 18 18 25 20
Mother’s employment2
35 hours or more per week 72 72 73 74 65 27 24 23 32 25Less than 35 hours per week 72 76 78 70 66 18 15 14 24 17Looking for work 62 68 59 63 56 24 22 19 31 18Not in the labor force 61 65 68 60 55 17 15 13 23 15
School urbanicityCentral city 67 65 69 70 63 24 23 21 29 21Urban fringe and large town 71 75 76 71 63 21 18 17 27 20Small town and rural 65 66 71 65 55 21 16 17 27 18
Kindergarten school typePublic 66 68 70 68 58 22 19 18 29 19Private 81 80 82 81 82 22 22 19 25 24
Kindergarten program typeFull day 70 71 74 70 64 26 22 20 29 23Half day 67 70 71 66 61 18 17 17 21 19
1Poverty is a function of household size and household income. Based on 1998 Census information, a household of four with a total income below $16,655 was considered to be below the federal poverty level.2Households in which there was no mother were not included in these estimates.NOTE: Preschool experience is based on parental report and defi ned as participation in a center-based early care or education program or participation in Head Start the year before kindergarten. SOURCE: U.S. Department of Education, National Center for Education Statistics, Early Childhood Longitudinal Study, Kindergarten Class of 1998–99 (ECLS-K), Base-Year Public-Use Data File, fall 1998 and spring 1999.
Regional Differences in Kindergartners’ Early Education Experiences

N A T I O N A L C E N T E R F O R E D U C A T I O N S T A T I S T I C S20
Early Childhood Education
Kindergartners in the Midwest whose mothers were not in the labor force were more likely to have attended preschool than kindergartners in the South or West. In addition, kindergartners in the West whose mothers were not in the labor force were the least likely of all of the regions to have attended preschool. Kindergartners in the West whose moth-ers worked full time were also less likely to have attended preschool than kindergartners in any of the other regions.
In terms of kindergarten school urbanicity, kindergartners from central cities in the Midwest were more likely to have attended preschool than those from central cities in the West. Kindergartners from rural areas in the Midwest were also more likely to have attended preschool than those from rural areas in the West. Also, central city kindergartners from the South were more likely to have attended preschool than central city kindergartners in the West.
Kindergartners who attended public school kindergartens in the West were less likely to have attended preschool than kindergartners who attended public school kindergartens in the other regions.
Mean hours per week kindergartners spent in preschool. On average, kindergartners in the South spent more hours per week in preschool the year before kindergarten than kindergartners in any of the other regions (fi gure 1). This pattern of regional differences found for the full sample of kindergartners is also evident when examining data within groups of kindergartners differing on various child, family, and school characteristics (table 2).
For example, the youngest kindergartners (age 4: born Sep-tember through December 1993) in the South spent more hours in preschool than the youngest kindergartners in any
Figure 1. Kindergartners’ mean hours per week in preschool in the year prior to kindergarten, by region: School year 1998–99
NOTE: Preschool experience is based on parental report and defi ned as participation in a center-based early care or education program or participation in Head Start the year before kindergarten.SOURCE: U.S. Department of Education, National Center for Education Statistics, Early Childhood Longitudinal Study, Kindergarten Class of 1998–99 (ECLS-K), Base-Year Public-Use Data Fil `e, fall 1998.
Mean hours per week in preschool
Region
0
5
10
15
20
25
30
WestSouthMidwestNortheastAll regions
22
1918
28
20
E D U C A T I O N S T A T I S T I C S Q U A R T E R L Y — V O L U M E 7, I S S U E S 1 & 2, 2 0 0 5 21
Regional Differences in Kindergartners’ Early Education Experiences
of the other regions. Also, Black kindergartners in the South attended preschool for more hours on average than Black kindergartners in any of the other regions. Furthermore, Hispanic kindergartners in the South and Northeast spent more hours in preschool than those in the West or the Mid-west (28 and 24 hours vs. 20 and 17 hours, respectively).
Kindergartners whose families were below the poverty threshold followed the same pattern as most of the other groups (i.e., kindergartners in the South spent relatively more hours per week in preschool than kindergartners in any of the other regions).
Kindergartners whose mothers did not complete high school spent more hours, on average, in preschool in the Northeast and the South than in the West or the Midwest. Comparatively, kindergartners whose mothers completed a bachelor’s degree or higher followed the same pattern as most other groups mentioned previously (i.e., Southern kindergartners spent relatively more hours per week in preschool than kindergartners in any of the other regions). Also, on average, kindergartners whose mothers were not in the labor force spent more hours weekly in preschool in the South than in any of the other regions.
In addition, the number of hours per week kindergartners spent in preschool varied across regions with respect to their kindergarten school urbanicity. In both central city and rural areas, kindergartners in the South spent relatively more hours per week in preschool the year before kinder-garten than kindergartners from any of the other regions.
On average, public school kindergartners in the South who attended preschool the year before kindergarten spent more weekly hours in preschool than public school kindergart-ners in any of the other regions. For those children who attended private school kindergartens and had attended pre-school the year before kindergarten, children in the South and West spent more weekly hours in preschool, on average, than those in the Midwest.
Patterns in kindergartners’ kindergarten program type across regions
In the United States, in the fall of 1998, approximately 4 million children attended kindergarten; some attended full-day programs, and some attended half-day programs. In the fall of 1998, some 55 percent of all kindergarten children attended a full-day program (West, Denton, and Germino Hausken 2000). Kindergartners in the South were more likely to attend full-day kindergarten programs than kindergartners in any of the other regions (fi gure 2). In
contrast, kindergartners in the West were more likely to at-tend half-day kindergarten programs than kindergartners in any of the other regions.
Participation in full-day kindergarten across regions by child, family, and school characteristics
As noted above, kindergartners in the South were more like-ly to attend full-day kindergarten programs than kindergart-ners in any other region of the country and kindergartners in the West were least likely to do so (table 3). These overall patterns of regional differences found for the full sample of kindergartners are also evident when examining the data within groups of kindergartners differing on various child, family, and school characteristics (table 3).
When considering children’s race/ethnicity, the percent-age of Hispanic kindergartners attending full-day programs differed across the regions. For example, Hispanic kinder-gartners in the West were less likely to attend full-day kindergarten programs than Hispanic kindergartners in any of the other regions. No consistent pattern of differences in full-day program attendance across regions could be de-termined for Black and “other” kindergartners (e.g., while the percentage of Black kindergartners in the South that attended full-day programs [89 percent] was different from the percentage of Black kindergartners in the Midwest that attended full-day programs [60 percent], it was not measur-ably different from the percentage of Black kindergartners in the Northeast [79 percent]).
Young kindergartners in the South (age 4: born September through December 1993) were more likely than young kin-dergartners in other regions to attend full-day kindergarten programs. About 78 percent of young kindergartners in the South attended full-day kindergarten, compared with 55 percent in the Northeast, 33 percent in the Midwest, and 24 percent in the West.
Kindergartners whose families were below the poverty threshold were more likely to attend full-day kindergarten programs if they lived in the South than if they lived in any of the other regions. In contrast, poor kindergartners in the West were the least likely of any region to attend a full-day program.
Kindergartners whose mothers had not completed high school were more likely to be enrolled in full-day programs if they attended school in the South than if they attended school in any of the other regions. In contrast, these kindergartners in the West were the least likely to have attended full-day programs. Consistent with this pattern,

N A T I O N A L C E N T E R F O R E D U C A T I O N S T A T I S T I C S22
Early Childhood Education
kindergartners whose mothers were employed full time and kindergartners whose mothers were not in the labor force were most likely to be enrolled in full-day programs if they lived in the South and least likely to be enrolled in full-day programs if they lived in the West.
Kindergartners in central city schools were more likely to attend full-day programs if they lived in the South than if they lived in any of the other regions. Also, central city school kindergartners who lived in the Northeast were more likely to attend full-day programs than those in the Midwest or West. In contrast, kindergartners in rural schools in the Northeast were the least likely of rural school kindergartners of any region to attend a full-day program.
Kindergartners in public schools were most likely to attend full-day programs if they lived in the South, compared with any other region. Also, public school kindergartners who lived in the Midwest were more likely than those in the West to be enrolled in full-day programs. In contrast, kindergartners in private schools were more likely to attend
full-day kindergarten if they lived in the West or Northeast than if they lived in the Midwest.
Summary
Findings from this report indicate that kindergartners’ preschool experiences and kindergarten program type vary by the regions in which their schools are located and by the regional characteristics of these kindergartners, their families, and their schools. This report identifi es common regional patterns in early childhood experiences and notes exceptions to the general fi ndings.
Overall, 68 percent of kindergartners attended preschool the year before entering kindergarten. However, kindergart-ners in the West were less likely to have attended preschool than kindergartners in the South, Northeast, or Midwest. These estimates differ from those reported in the FRSS “Survey of Classes That Serve Children Prior to Kindergar-ten in Public Schools: 2000–2001” because the FRSS only collected information on public school prekindergarten pro-grams (Smith et al. 2003). In contrast to the overall pattern
Figure 2. Percentage distribution of kindergartners enrolled in full-day and half-day programs, by region: School year 1998–99
SOURCE: U.S. Department of Education, National Center for Education Statistics, Early Childhood Longitudinal Study, Kindergarten Class of 1998–99 (ECLS-K), Base-Year Public-Use Data File, fall 1998.
0
20
40
60
80
100
WestSouthMidwestNortheastAll regions
45
55
4448
83
30
5652
17
70
Percent
Region
Full day
Half day

E D U C A T I O N S T A T I S T I C S Q U A R T E R L Y — V O L U M E 7, I S S U E S 1 & 2, 2 0 0 5 23
Table 3. Percent of fall 1998 kindergartners attending full-day programs, by region and selected child, family, and school characteristics: School year 1998–99
Percent attending full-day kindergarten
Characteristic Total Northeast Midwest South West
Total 55 44 48 83 30
Child’s sexMale 55 42 47 82 29Female 56 45 48 83 30
Child’s age at kindergarten entry (fall 1998)Age 4: Born Sept.–Dec. 1993 46 55 33 78 24Age 5: Born May–Aug. 1993 53 43 45 81 27Age 5: Born Jan.–Apr. 1993 55 46 47 82 29Age 5: Born Sept.–Dec. 1992 60 34 51 84 37Age 6: Born Jan.–Aug. 1992 62 42 57 89 40
Child’s race/ethnicityWhite, non-Hispanic 52 34 44 80 32Black, non-Hispanic 78 79 60 89 41Hispanic 46 62 42 84 21Asian 48 56 49 84 30Other 61 33 72 71 52
Federal poverty level1 At or above poverty threshold 54 42 45 81 32Below poverty threshold 61 51 60 86 24
Mother’s education2 Less than high school 57 52 55 86 21High school diploma or equivalent 58 42 52 84 27Some college, including vocational/technical 54 41 48 82 32Bachelor’s degree or higher 53 45 40 77 38
Mother’s employment2
35 hours or more per week 60 48 52 84 33Less than 35 hours per week 50 39 44 79 29Looking for work 61 49 58 85 25Not in the labor force 51 42 43 82 25
School urbanicityCentral city 60 67 46 88 31Urban fringe and large town 47 39 30 83 15Small town and rural 64 9 76 73 60
School typePublic 53 36 46 84 22Private 68 74 56 71 73
Preschool experience3
No 53 43 46 81 28Yes 57 44 49 83 31
1Poverty is a function of household size and household income. Based on 1998 Census information, a household of four with a total income below $16,655 was considered to be below the federal poverty level.2Households in which there was no mother were not included in these estimates.3Preschool experience is based on parental report and defi ned as participation in a center-based early care or education program or participation in Head Start the year before kindergartenSOURCE: U.S. Department of Education, National Center for Education Statistics, Early Childhood Longitudinal Study, Kindergarten Class of 1998–99 (ECLS-K), Base-Year Public-Use Data File, fall 1998 and spring 1999.
Regional Differences in Kindergartners’ Early Education Experiences

N A T I O N A L C E N T E R F O R E D U C A T I O N S T A T I S T I C S24
Early Childhood Education
described in this report, Black kindergartners in the West were more likely to have attended preschool than Black kindergartners in the South or Northeast.
In general, kindergartners who attended preschool the year before kindergarten spent an average of 22 hours per week in such programs (table 2). Of kindergartners who attended preschool, those in the South spent more hours per week in their preschool programs, on average, than kindergart-ners in any of the other regions. This pattern was found for Black and Asian kindergartners, kindergartners whose fami-lies were below the poverty threshold, and kindergartners whose mothers completed a bachelor’s degree or higher.
Consistent with fi ndings from Full-Day and Half-Day Kin-dergarten in the United States (Walston and West 2004), this report found that kindergartners in the South were more likely to attend full-day kindergarten programs than kinder-gartners in any of the other regions, and kindergartners in the West were the least likely to attend full-day kindergar-ten programs. In the West, this pattern was consistent for Hispanic kindergartners, young kindergartners (those not yet 5 years old at kindergarten entry), kindergartners whose families were below the poverty threshold, kindergartners whose mothers had completed less than high school, kin-dergartners whose mothers were employed full time, and kindergartners whose mothers were not in the labor force.
Results from this report indicate that kindergartners’ partici-pation in preschool experiences and full-day kindergarten programs differs by the region in which they live. Given this fi nding, future research on early childhood program partici-pation should consider incorporating region into analyses of the relationships of preschool or kindergarten program attendance with educational outcomes.
ReferencesEducation Commission of the States. (2003, August). State Statutes
Regarding Kindergarten. Retrieved September 3, 2004, from http://www.ecs.org/clearinghouse/29/21/2921.pdf.
Galley, M. (2002). State Policies on Kindergarten Are All Over the Map. Education Week, 21(17): 45.
Hinkle, D. (2000). School Involvement in Early Childhood. U.S. Department of Education. Washington, DC: National Institute on Early Childhood Development and Education.
Potts, A., Blank, R., and Williams, A. (2002). Key State Education Policies on PK–12 Education: 2002, Results From the 2002 CCSSO Policies and Practices Survey. Washington, DC: Council of Chief State School Offi cers.
Smith, T., Kleiner, A., Parsad, B., Farris, E., and Greene, B. (2003). Prekindergarten in U.S. Public Schools: 2000–2001 (NCES 2003-019). U.S. Department of Education. Washington, DC: National Center for Education Statistics.
Walston, J., and West, J. (2004). Full-Day and Half-Day Kinder-garten in the United States: Findings From the Early Childhood Longitudinal Study, Kindergarten Class of 1998–99 (NCES 2004-078). U.S. Department of Education. Washington, DC: National Center for Education Statistics.
West, J., Denton, K., and Germino Hausken, E. (2000). America’s Kindergartners (NCES 2000-070). U.S. Department of Educa-tion. Washington, DC: National Center for Education Statistics.
Wirt, J., Choy, S., Rooney, P., Provasnik, S., Sen, A., and Tobin, R. (2004). The Condition of Education 2004 (NCES 2004-077). U.S. Department of Education, National Center for Education Statis-tics. Washington, DC: U.S. Government Printing Offi ce.
Data source: The NCES Early Childhood Longitudinal Study, Kindergarten Class of 1998–99 (ECLS-K).
For technical information, see the complete report:
Rosenthal, E., Rathbun, A., and West, J. (2005). Regional Differences in Kindergartners’ Early Education Experiences (NCES 2005-099).
Author affi liations: E. Rosenthal and A. Rathbun, Education Statistics Services Institute; J. West, NCES.
For questions about content, contact Elvira Germino Hausken ([email protected]).
To obtain the complete report (NCES 2005-099), visit the NCES Electronic Catalog (http://nces.ed.gov/pubsearch).

E D U C A T I O N S T A T I S T I C S Q U A R T E R L Y — V O L U M E 7, I S S U E S 1 & 2, 2 0 0 5 25
EL E M E N T A R Y A N D SE C O N D A R Y ED U C A T I O N
A Profi le of the American High School Sophomore in 2002: Initial Results From the Base Year of the Education Longitudinal Study of 2002
Steven J. Ingels, Laura J. Burns, Stephanie Charleston, Xianglei Chen, and Emily Forrest Cataldi .....................................................................................26
Adolescent Cigarette Smoking: A Longitudinal Analysis Through Young Adulthood
David C. Miller .......................................................................................................33
Internet Access in U.S. Public Schools and Classrooms: 1994–2003Basmat Parsad and Jennifer Jones ...........................................................................45
Rates of Computer and Internet Use by Children in Nursery School and Students in Kindergarten Through Twelfth Grade: 2003
Matthew DeBell ......................................................................................................54
Distance Education Courses for Public Elementary and Secondary School Students: 2002–03
J. Carl Setzer and Laurie Lewis ..............................................................................57
Computer Technology in the Public School Classroom: Teacher PerspectivesLawrence Lanahan and Janet Boysen ......................................................................67
Qualifi cations of Public Secondary School Biology Teachers, 1999–2000Daniel J. McGrath, Emily W. Holt, and Marilyn M. Seastrom ................................71
Private School Teacher Turnover and Teacher Perceptions of School Organizational Characteristics
Daniel J. McGrath and Daniel Princiotta ................................................................75
Parent and Family Involvement in Education: 2002–03Nancy Vaden-Kiernan and John McManus ..............................................................79
Dual Enrollment of High School Students at Postsecondary Institutions: 2002–03
Brian Kleiner and Laurie Lewis ..............................................................................87
Dual Credit and Exam-Based Courses in U.S. Public High Schools: 2002–03Tiffany Waits, J. Carl Setzer, and Laurie Lewis .......................................................98
Public Elementary and Secondary Students, Staff, Schools, and School Districts: School Year 2002–03
Lee Hoffman, Jennifer Sable, Julia Naum, and Dell Gray .................................... 109
Revenues and Expenditures by Public School Districts: School Year 2001–02Frank Johnson ...................................................................................................... 120
Revenues and Expenditures for Public Elementary and Secondary Education:School Year 2002–03
Jason Hill and Frank Johnson .............................................................................. 133

N A T I O N A L C E N T E R F O R E D U C A T I O N S T A T I S T I C S26
Elementary and Secondary Education
The data for this report, A Profi le of the American High School Sophomore in 2002, describe the tested achievement and educational status of a cohort based on a nationally representative probability sample of 15,362 10th-graders in 752 public, Catholic, and other private schools who were studied in the spring term of the 2001–02 school year. The base-year data collection for the Education Longitudinal Study of 2002 (ELS:2002) is the fi rst wave of a new longitu-dinal study of high school students that continues a series of nationally representative longitudinal studies conducted by the U. S. Department of Education’s National Center for Education Statistics (NCES) over recent decades. Future survey waves will follow both students and high school dropouts and will monitor the transition of the cohort to postsecondary education, the labor force, and family forma-tion. Although the base-year study comprised surveys of parents, teachers, school administrators, and library media specialists, as well as the cohort of high school sophomores, to remain concise, this report draws primarily on data from students, the primary unit of analysis for the study. (Parent, teacher, librarian, and school reports provide contextual data for better understanding the student cohort.)
Comparisons drawn in the text of this report have been tested for statistical signifi cance at the .05 level to ensure that the differences are larger than those that might be expected due to sampling variation. Most comparisons are tested with t statistics, although analysis of variance has been used to test for linear trends. Because comparisons drawn in the report are delimited and focused through their reliance on fi ndings from prior studies in the data series and the wider research literature, and because a criterion of sub-stantive signifi cance has been imposed as well (see below), the t tests have not been adjusted for multiple comparisons. Full details of statistical tests used can be found in appen-dix A in the full report. As noted above, all fi ndings have also been subjected to a test of substantive signifi cance. For comparisons of means, fi ndings must show a difference of at least a fi fth of a standard deviation (that is, an effect size of .20) to be reported. Further information on effect sizes can also be found in appendix A in the full report. For compari-sons of proportions, differences noted in the text are at least
5 percentage points.* Exceptions arise with comparisons that directly investigate stated research questions and hypotheses or when not performing basic comparisons would be seen as a critical omission. The text notes when comparisons do not meet statistical and/or substantive signifi cance.
HighlightsSociodemographic and educational characteristics of the cohort
Various background characteristics and differences are as-sociated with the educational experiences, achievement, and expectations of students as they progress through high school. The following descriptive characteristics of the sophomore class of 2002 are noted:
■ The majority of sophomores are Whites (60 percent). Hispanics comprise 16 percent and Blacks 14 percent of the sophomore cohort, Asian and multiracial sophomores each comprise 4 percent, and American Indians comprise 1 percent of the sophomore cohort (fi gure 1).
■ While 16 percent of White sophomores come from the lowest socioeconomic status (SES) quartile group, half of Hispanics and 35 percent of Blacks come from this group.
■ Some 57 percent of sophomores live in a family with both their biological parents. Others live in a single-parent household (22 percent), or with their mother or father and a guardian (17 percent). Still others (4 percent) live in a variety of other arrangements.
■ Approximately 6 out of 10 sophomores (59 percent) have a mother who continued her education beyond high school. Fifty-six percent have a father who con-tinued his education beyond high school.
■ The 2002 sophomore cohort has high ambitions: 72 percent expect to complete a bachelor’s degree or higher; indeed, about one-third (36 percent) expect to complete a graduate or professional degree. However,
*The selection of 5 percent as the criterion for substantive difference is based on simi-lar analyses in other NCES reports (e.g., NCES 2004-078). It should be noted that the magnitude of effect that would be regarded as substantively or practically signifi cant (and the categorization of the effect into large, medium, small, or trivial) may vary depending on the types and contexts of relationships and outcomes being measured.
High School SophomoresA Profi le of the American High School Sophomore in 2002: Initial Results From the Base Year of the Education Longitudinal Study of 2002——————————————————————————————————Steven J. Ingels, Laura J. Burns, Stephanie Charleston, Xianglei Chen, and Emily Forrest Cataldi
This article was originally published as the Executive Summary of the Statistical Analysis Report of the same name. The sample survey data are from the Education Longitudinal Study (ELS).

E D U C A T I O N S T A T I S T I C S Q U A R T E R L Y — V O L U M E 7, I S S U E S 1 & 2, 2 0 0 5 27
only about one-half (51 percent) indicate being en-rolled in a college preparatory program.
■ There are differences by racial/ethnic group in the likelihood that English is a sophomore’s native lan-guage. English is the native language of 94 percent of Black and 97 percent of White sophomores. It is the native language of 37 percent of Asian and 48 percent of Hispanic sophomores.
■ The overwhelming majority of sophomores (92 per-cent) attend public schools (4 percent attend Catholic schools and 3 percent attend other private schools) (fi gure 2).
■ Half of sophomores attend suburban schools; 30 per-cent attend urban schools; and 20 percent attend rural schools. However, nearly half (49 percent) of Black students attend urban schools, compared to 21 percent of Whites.
Sophomores’ school experiences
Sophomores reported their perceptions of their school and teachers, school safety, and school rules, as well as the importance they accorded good grades and their reasons for going to school.
Overall, students had a positive view of their school and teachers (e.g., 81 percent indicated that the quality of teaching was good, and nearly three-quarters [74 percent] reported that their teachers were interested in the students and that students and teachers got along well). The majority (65 percent) reported that they liked school somewhat, and 24 percent liked school a great deal.
Nevertheless, 12 percent of sophomores reported not feeling safe in school (13 percent in public schools, 3 percent in Catholic schools, and 4 percent in other private schools). Nearly two-thirds (66 percent) had experienced some mani-festation of school crime or violence during the fi rst term of the school year. One out of four was offered drugs for sale, and 24 percent reported that someone had threatened to hurt them. Students who felt safe at school were more likely to report that rules were clear, fair, and consistently enforced.
Most sophomores (87 percent) indicated that getting good grades was important or very important to them, and 57 per-cent reported that engagement with interesting and chal-lenging school subjects was one of their motivations for attending school.
However, there were some notable differences between subgroups (including, among others, racial/ethnic groups,
Figure 1. Percentage of high school sophomores, by racial/ethnic group: 2002
NOTE: Detail may not sum to totals because of rounding. All race categories exclude Hispanic.SOURCE: U.S. Department of Education, National Center for Education Statistics, Education Longitudinal Study of 2002 (ELS:2002). (Originally published as fi gure 2 on p. 9 of the complete report from which this article is excerpted.)
White (60%)
American Indian or Alaska Native (1%)
Hispanic or Latino (16%)
Asian or Pacific Islander (4%)
Black (14%)
Multiracial (4%)
A Profi le of the American High School Sophomore in 2002: Initial Results From the Base Year of the Education Longitudinal Study of 2002

N A T I O N A L C E N T E R F O R E D U C A T I O N S T A T I S T I C S28
Elementary and Secondary Education
males versus females, and sophomores in different school sectors) in their responses. Racial/ethnic differences, partic-ularly between Blacks and Hispanics, on the one hand, and Whites, on the other, form a complex pattern. For example:
■ Black and Hispanic sophomores were more likely than White sophomores to feel unsafe at school.
■ Black sophomores were less likely than White sopho-mores to report positive impressions about their school and teachers (when asked about school spirit, teaching quality, and teacher-student relationships).
■ Blacks (62 percent) and Hispanics (53 percent) were more likely than Whites (47 percent) to affi rm getting good grades as something very important to them.
■ Blacks and Hispanics more often reported that they went to school because their school subjects were interesting and challenging than did Whites (63 per-cent for Blacks and 65 percent for Hispanics versus 52 percent for Whites) and that they got satisfaction from their classwork (72 percent for Blacks and 70 percent for Hispanics versus 55 percent for Whites).
■ Black and Hispanic sophomores were more likely than their White peers to indicate that they liked school a great deal (29 percent and 30 percent versus 21 percent).
■ Blacks and Hispanics were more likely than Whites to report that their teachers expected them to succeed in school (67 percent for Blacks, 64 percent for Hispan-ics, and 58 percent for Whites).
Subgroup differences by sex include the following:
■ Females were more likely than males to report liking school a great deal (26 percent versus 21 percent).
■ Males were more likely than females to be the victim of school crimes (73 percent versus 59 percent), and they were also more likely to report involvement in physical fi ghts (21 percent for males versus 8 percent for females) and to have had someone offer to sell them drugs (31 percent versus 19 percent).
■ Females more often reported that getting good grades was very important to them (58 percent for females versus 44 percent for males).
■ Females were more likely to report that their school subjects were interesting and challenging (59 percent versus 54 percent), and they were more likely to re-port getting a feeling of satisfaction from doing their classwork (67 percent versus 55 percent).
■ Females were also more likely to report that their teachers expected them to succeed (63 percent for females versus 58 percent for males).
Figure 2. Percentage of high school sophomores attending various types of schools: 2002
NOTE: Detail may not sum to totals because of rounding. SOURCE: U.S. Department of Education, National Center for Education Statistics, Education Longitu-dinal Study of 2002 (ELS:2002). (Originally published as fi gure 9 on p. 16 of the complete report from which this article is excerpted.)
Public (92%)
Catholic (4%)Other private (3%)

E D U C A T I O N S T A T I S T I C S Q U A R T E R L Y — V O L U M E 7, I S S U E S 1 & 2, 2 0 0 5 29
Students in Catholic and other private schools generally reported a more positive perception of their school environ-ment than did public school students. For example, public school sophomores were less likely to report good quality teaching, teacher interest in students, or that students and teachers got along well:
■ Some 80 percent of public school sophomores reported good quality teaching in their schools, compared to 91 percent of Catholic and 90 percent of other private school sophomores.
■ When asked whether teachers were interested in students, 73 percent of public school sophomores agreed, compared to 86 percent of Catholic and 88 percent of other private school sophomores.
■ Some 73 percent of public school sophomores indi-cated that students and teachers got along well with each other in their schools, compared to 86 percent of Catholic and 87 percent of other private school sophomores.
An important line of distinction between private and public schools is refl ected in sophomores’ views of their school’s normative and disciplinary climate, as represented by the clarity, fairness, and enforcement of school rules:
■ Some 89 percent of sophomores in other private schools, and 87 percent of sophomores in Catho-lic schools, reported that everyone knew what the school rules were. This compared to 82 percent in public schools. In addition, 79 percent of Catholic school sophomores maintained that the rules were strictly enforced, compared to 66 percent of public school students.
■ Some 65 percent of other private school sophomores believed their school rules were fair, compared to 54 percent of public school students.
Sophomores in private schools were also more likely than public school students to cite sports or other extracurricular participation as a reason for going to school (67 percent of Catholic, 57 percent of other private, and 48 percent of pub-lic school students listed playing on a team or belonging to a club as one of their motivations for going to school). This is consistent with the higher rates of extracurricular, particular-ly sports, participation reported for private school students.
Sophomores’ extracurricular and sports participation
Sophomores were asked if they participated in any of vari-ous extracurricular activities. These school-sponsored ac-tivities were academic clubs, hobby clubs, musical activities
(band, orchestra, choir, or chorus), cheerleading, sports, and vocational education clubs.
Over half (55 percent) of all sophomores participated in sports, including play at the intramural level. Participa-tion in other activities was relatively lower: 8 percent for academic clubs, 13 percent for cheerleading, 10 percent for hobby clubs, 22 percent for musical activities, and 8 percent for vocational education clubs. Some subgroup differences are notable:
■ Sports participation varied by school type: 73 percent of Catholic and 74 percent of other private school sophomores participated in sports, compared to 53 percent of public school sophomores.
■ Males played sports at a higher rate than females (61 percent versus 49 percent), but females partici-pated in other extracurricular activities at a higher rate than males.
■ Participation in most extracurricular activities in-creased with ascending SES. For example, 6 percent of low-SES-quartile sophomores participated in academic clubs, compared to 13 percent from the high-SES quartile; 45 percent of low-SES-quartile sophomores were athletes, compared to 64 percent of high-SES sophomores; and 16 percent of low-SES sophomores took part in musical activities, compared to 27 percent of high-SES sophomores. The opposite was true for vocational clubs.
Sophomores who spent 9 hours or more per week in extra-curricular activities (the highest quartile of the distribution of hours) were compared to the full sample or sophomore norm (averaging over 4 hours of participation per week). High-intensity extracurricular participants were more likely to
■ expect to earn a 4-year degree or higher (87 percent versus 72 percent for the 10th-grade norm);
■ expect to go directly to college (83 percent compared to 72 percent for all sophomores);
■ perform in the highest test quartile (37 percent ver-sus 25 percent for the norm);
■ report to have “never cut class” (74 percent versus 68 percent); and
■ rate good grades as very important (59 percent versus 51 percent for sophomores as a whole).
Sophomores’ time use
Five specifi c dimensions of time use were measured: extracurricular activities, reading for pleasure, doing
A Profi le of the American High School Sophomore in 2002: Initial Results From the Base Year of the Education Longitudinal Study of 2002

N A T I O N A L C E N T E R F O R E D U C A T I O N S T A T I S T I C S30
Elementary and Secondary Education
homework, using the computer, and working for pay. For those who worked during the school year, time spent on the job averaged 15 hours per week. Sophomores reported using computers for about 1 hour per day for schoolwork and 2 additional hours daily for nonschool uses. Weekly time budgets for key activities were as follows:
■ school-sponsored extracurricular activities (5 hours);
■ outside reading (not assigned for class) (3 hours);
■ homework (outside of school) (6 hours); and
■ working for pay (15 hours).
Several subgroup differences in time use should be noted:
■ Asians spent more time on homework outside school (8 hours per week) than Blacks, Whites, or Hispanics (5–6 hours).
■ Catholic and other private school students spent more time on out-of-school homework (8 hours) than public school students (6 hours).
■ The average number of hours worked per week was negatively related to SES.
Sophomores’ tested achievement in reading and mathematics
Reading and mathematics achievement were reported in terms of various levels of skill and content mastery, or profi ciency. Overall results, and the content and processes embodied by each profi ciency level, are summarized below:
Overall, in reading:
■ 89 percent of sophomores had mastered the skills of simple reading comprehension (profi ciency level 1);
■ 46 percent were able to make relatively simple infer-ences beyond the author’s main thought (profi ciency level 2); and
■ 8 percent could make complex inferences (profi ciency level 3).
Overall, in mathematics:
■ 92 percent of sophomores were able to perform simple arithmetical operations on whole numbers (level 1);
■ 67 percent could perform simple operations with decimals, fractions, powers, and roots (level 2);
■ 46 percent could perform simple problem solving that involved the understanding of low-level mathe-matical concepts (level 3);
■ 20 percent could understand intermediate-level mathematical concepts and/or demonstrate ability
to formulate multistep solutions to word problems (level 4); and
■ 1 percent could solve complex multistep word prob-lems and had mastered material found in advanced mathematics courses (level 5).
Profi ciency results were also examined from the perspec-tive of sophomores’ sociodemographic characteristics. For example, an important area of interest is the relationship between racial/ethnic group, SES, and achievement:
■ Differences in profi ciency were seen by SES; higher SES was associated with higher profi ciency scores. For example, in mathematics, 8 percent of sophomores in the lowest quartile were profi cient at understanding intermediate-level mathematical concepts, while 18 percent of those in the middle quartiles and 39 per-cent of those in the highest SES quartile were profi -cient. Some 18 percent of sophomores in the highest SES quartile were profi cient at the highest reading level (ability to make complex inferences), compared to 3 percent in the lowest SES quartile.
■ Differences in profi ciency were observed by racial/ethnic subgroup. For example, in mathematics, Asians were more likely than Blacks to be profi cient in the understanding of intermediate-level mathe-matical concepts (32 percent compared to 5 percent). Some 27 percent of White sophomores had reached this level, compared to 9 percent of Hispanics.
■ In reading, Whites and Asians were more likely to be profi cient than were Blacks or Hispanics. Some 56 percent of Whites and 47 percent of Asians were profi cient at the level of simple inference, compared to 25 percent of Blacks and 28 percent of Hispanics. At the highest reading level (complex inference), 9 percent of Asian and 11 percent of White 10th-graders were profi cient, compared to 2 percent of Blacks and 3 percent of Hispanics.
■ Differences by racial/ethnic group persist, even when SES is taken into account. Whites were more likely to be profi cient at various reading and mathematics levels than their Black or Hispanic peers, within each of the three SES groupings. For example, at the level of simple mathematical problem solving, within the lowest SES group, 12 percent of Blacks, 18 percent of Hispanics, and 36 percent of Whites were profi cient. For the middle SES quartiles, the proportions profi -cient at this level were 19 percent of Blacks, 30 per-cent of Hispanics, and 54 percent of Whites. In the highest SES quartile, 42 percent of Blacks, 47 percent

E D U C A T I O N S T A T I S T I C S Q U A R T E R L Y — V O L U M E 7, I S S U E S 1 & 2, 2 0 0 5 31
of Hispanics, and 76 percent of Whites were profi -cient in simple problem solving. The same pattern—persistence of racial/ethnic differences within each SES category, with Whites showing higher achieve-ment than Blacks or Hispanics—was also discernible in reading.
A further area of interest is the alignment of sophomores’ educational expectations for the future and their high school preparation for their future education. Since transcripts with information about high school coursetaking have not yet been collected for the cohort, the primary source of available information about academic preparation is tested achieve-ment in mathematics and reading. The higher the students’ expectations, the higher their test scores. This generaliza-tion is true both overall and within racial/ethnic subgroups (specifi cally, Whites, Blacks, and Hispanics). However, racial/ethnic differences in achievement persist within each main level of educational expectation:
■ For example, 32 percent of 10th-graders who ex-pected to obtain a graduate or professional degree had mastered intermediate mathematical concepts. In contrast, 7 percent of those who expected to complete some college but less than a 4-year degree had done so. At the same time, racial differences were apparent even within expectation levels.
■ For example, among sophomores who expected to complete at least a 4-year degree, at reading level 2 (simple inference), 31 percent of Blacks, 35 percent of Hispanics, and 65 percent of Whites were profi -cient. Among sophomores who expected to complete at least a 4-year degree, at level 4 of mathematics (intermediate concepts), 6 percent of Blacks and 12 percent of Hispanics, contrasted to 33 percent of Whites, were profi cient.
Differences in achievement of male and female students were also investigated. Some statistically signifi cant differences were detected, showing a female advantage in reading and a male advantage in mathematics (e.g., at reading level 1, 77 percent of Hispanic males and 82 percent of Hispanic females were profi cient, and at mathematics level 4, 30 per-cent of White males and 24 percent of White females were profi cient). However, these differences were not substantively signifi cant. Neither overall nor within racial/ethnic groups were sex differences large, compared to the differences found by racial/ethnic group and SES.
In addition to subgroup differences by individual sociode-mographic characteristics, profi ciency in both reading and
mathematics was examined across a number of school char-acteristics, including school sector. Students from Catholic and other private schools were more likely to be profi cient than were students from public schools:
■ In mathematics at the level of understanding in-termediate concepts, 19 percent of public school sophomores were profi cient, compared to 32 percent of Catholic and 35 percent of other private school sophomores.
■ In reading, students in Catholic and other private schools were more likely to be profi cient than stu-dents in public schools. For example, 68 percent of Catholic and 65 percent of other private school 10th-graders were profi cient at level 2 (simple inferences), compared to 45 percent of public school 10th-graders.
Reading and mathematics results were also examined in relation to student engagement. Student engagement be-haviors were positively associated with achievement. For example:
■ Students who did more math homework were more profi cient in simple problem solving (35 percent of those who did no homework, 46 percent of those who did 1–4 hours of math homework per week, and 53 percent of those who did 5 or more hours of math homework per week were profi cient at this level).
■ Students who cut class frequently were less likely to be profi cient than those who never cut class. In read-ing, at level 2 (simple inference), 28 percent of those who skipped class seven or more times in the fi rst term of the school year were profi cient, compared to 51 percent of those who never skipped class.
Sophomores’ values and expectations
Values/life goals. Sophomores were asked about the out-comes they value for the future, about their educational expectations, and about their occupational expectations for age 30. Overall, the following proportions of sophomores rated the following life goals as “very important” to them:
■ getting a good education (83 percent);
■ becoming an expert in fi eld of work (71 percent);
■ having lots of money (42 percent);
■ having leisure time to enjoy own interests (68 percent);
■ fi nding the right person to marry (76 percent);
■ having children (47 percent);
■ having strong friendships (83 percent);
A Profi le of the American High School Sophomore in 2002: Initial Results From the Base Year of the Education Longitudinal Study of 2002

N A T I O N A L C E N T E R F O R E D U C A T I O N S T A T I S T I C S32
Elementary and Secondary Education
■ living close to parents and relatives (30 percent); and
■ working to correct social/economic inequalities (19 percent).
There were a number of differences by subgroup. For example:
■ Female sophomores (88 percent) and Black sopho-mores (90 percent) were more likely than male sophomores (78 percent) and White sophomores (80 percent) to rate a good education as very important.
■ Having lots of money was very important to more low-SES sophomores (47 percent) than high-SES sophomores (36 percent), and it was very important to more Black sophomores (60 percent) than White sophomores (36 percent).
■ Having leisure time was more often very important to high-SES sophomores than to low-SES sophomores (74 percent versus 60 percent).
■ Becoming an expert in one’s fi eld of work was more often very important to Black sophomores (80 per-cent) than to their White counterparts (68 percent).
Educational expectations. Overall, about 8 percent of the co-hort expected to complete only high school or less. Another 10 percent expected to attend college but to obtain less than a 4-year degree. Some 36 percent expected to graduate from a 4-year program, another 20 percent to obtain a master’s degree, and 16 percent to obtain a Ph.D., M.D., or other advanced doctoral or professional degree. (Around 10 per-cent have not yet formed an expectation of their probable highest level of future educational attainment.) Subgroup differences are apparent by sex, racial/ethnic group, SES, and other factors:
■ Although expectations increased with ascending SES and test performance, expectations were relatively high for all groups. For example, about three-fi fths (58 percent) of those in the lowest SES quartile and nearly half (48 percent) of those in the lowest achieve-ment test quartile expected to, at minimum, graduate from college with a 4-year degree. About one-quarter (24 percent) of those in the lowest SES quartile ex-pected to obtain a graduate or professional degree, as did 18 percent of those in the lowest test quartile.
■ Nearly twice as many females as males expected to complete a doctoral or professional degree (20 per-cent versus 12 percent), whereas twice as many males
as females expected to end their education with a high school diploma or less (11 percent versus 5 per-cent). A gender gap existed for White, Black, and Hispanic students. Some 41 percent of Black females expected to earn a graduate degree (master’s, Ph.D., or other advanced degree), compared to 25 percent of Black males. Some 44 percent of White females expected to earn a graduate degree, compared to 31 percent of White males.
■ This gender gap generally existed for White, Black, and Hispanic sophomores regardless of SES level. For example, among sophomores expecting to reach the highest level of educational attainment (gradu-ate or professional degree), for the high-SES group, this expectation was held by 47 percent of White males, compared to 57 percent of White females; by 40 percent of Black males, compared to 68 percent of Black females; and by 33 percent of Hispanic males, compared to 53 percent of Hispanic females.
Occupational expectations. Sophomores were also asked to name the occupation they expected or planned to hold at age 30. Some 34 percent of sophomores indicated that they did not know what job or occupation they expected to have at age 30. A further 45 percent of the cohort indicated that they expected to be in a professional-level job, while 20 percent indicated any of the wide array of nonprofessional occupations. About 1 percent of males and 1 percent of fe-males did not expect to work at age 30. Less than 1 percent of males and of females indicated that they would be full-time homemakers at age 30.
Data source: The NCES Education Longitudinal Study of 2002 (ELS:2002).
For technical information, see the complete report:
Ingels, S.J., Burns, L.J., Charleston, S., Chen, X., and Forrest Cataldi, E. (2005). A Profi le of the American High School Sophomore in 2002: Initial Results From the Base Year of the Education Longitudinal Study of 2002 (NCES 2005-338).
Author affi liations: S.J. Ingels, L.J. Burns, and S. Charleston, RTI International; X. Chen and E. Forrest Cataldi, MPR Associates, Inc.
For questions about content, contact Jeffrey A. Owings ([email protected]).
To obtain the complete report (NCES 2005-338), call the toll-free ED Pubs number (877-433-7827) or visit the NCES Electronic Catalog (http://nces.ed.gov/pubsearch).

E D U C A T I O N S T A T I S T I C S Q U A R T E R L Y — V O L U M E 7, I S S U E S 1 & 2, 2 0 0 5 33
Highlights
It is estimated that smoking results in more deaths each year in the United States than alcohol, cocaine, heroin, AIDS, suicide, homicide, motor vehicle accidents, and fi res combined (U.S. Department of Health and Human Services 2000). With about 8 out of 10 adult smokers in the United States having tried their fi rst cigarette before age 18 (U.S. Department of Health and Human Services 1994), it is not surprising that there has been considerable concern about adolescent smoking.
This analysis uses data from the National Education Lon-gitudinal Study of 1988 (NELS:88), where the smoking be-havior of a nationally representative cohort of 1988 eighth-graders was assessed at various time points over a 12-year period (i.e., from about age 14 to age 26). Data on smoking behavior were collected in 1988, when all study participants were in 8th grade; in 1990, when most were in 10th grade; in 1992, when most were in 12th grade; and in 2000, when most were 8 years removed from high school graduation. Participants in NELS:88 were not asked about their smoking behavior at the third follow-up in 1994. This took place 2 years after high school graduation for most individuals and when many were participating in postsecondary education.
In this report, the incidence of daily smoking at the various time points is shown. In addition, using the information obtained about individuals’ smoking behavior over the time period, several specifi c developmental patterns are identifi ed.
■ Nondaily smokers included those who reported usu-ally smoking not at all or less than one cigarette per day at each of the applicable survey waves (1988, 1990, 1992, and 2000).
■ Teen smokers included those who reported usually smoking one or more cigarettes per day at either of the fi rst three survey waves (1988, 1990, or 1992), but not at the last survey wave in 2000. Thus, indi-viduals in this group either quit smoking or reduced their amount of smoking to less than one cigarette per day at the time of the young adult survey.
■ Teen/young adult smokers included those who report-ed usually smoking one or more cigarettes per day at either of the fi rst three survey waves (1988, 1990, or 1992) and at the last survey wave in 2000.
■ Late-onset smokers included those who reported usu-ally smoking one or more cigarettes per day at the last survey wave in 2000, but not at any of the prior survey waves (1988, 1990, and 1992). Thus, this group includes individuals who either began smok-ing as young adults, or who increased the frequency with which they smoked from less than daily during adolescence to one or more cigarettes each day at the time of the young adult survey.
Using this classifi cation scheme, these developmental pat-terns were then examined in relation to various descriptive characteristics. The main fi ndings from this analysis include the following:
■ More individuals reported smoking at each subse-quent survey follow-up (table 1). Six percent at 8th grade, 12 percent at 10th grade, 17 percent at 12th grade, and one-quarter at the young adult years re-ported usually smoking one or more cigarettes a day.1 At the 10th grade, there were more new daily smok-ers than repeat daily smokers; however, the opposite was true at the young adult years.
■ Examining individuals’ smoking behavior over the time period, about two-thirds were nondaily smokers (68 percent), followed by teen/young adult smokers (15 percent) and then teen smokers (9 percent) and late-onset smokers (8 percent) (table 2). Accordingly, of the 24 percent of individuals who reported smoking as teenagers (i.e., adding together the teen smokers and teen/young adult smokers), almost two-thirds of them (63 percent) also reported smoking as young adults.
■ Examining the four developmental patterns with respect to various descriptive characteristics, most of the characteristics that were related to daily smok-ing in the set of bivariate analyses (table 2) were also signifi cant in a multivariate analysis.2 For example, individuals were more likely to be teen/young adult smokers than nondaily smokers if they were older as
Adolescent Cigarette SmokingAdolescent Cigarette Smoking: A Longitudinal Analysis Through Young Adulthood——————————————————————————————————David C. Miller
This article was originally published as the Statistics in Brief report of the same name. The sample survey data are from the National Education Longitudinal Study of 1988 (NELS:88). The technical appendix and a table from the original report have been omitted.
1As previously noted, not all of the 1988 8th-graders were in 10th grade at the fi rst fol-low-up in 1990 and not all of them were in 12th grade at the second follow-up in 1992 (e.g., some were held back a grade). But for ease of reporting, the 1990 survey wave is referred to throughout this report as the “10th grade” and the 1992 survey wave is referred to as the “12th grade.” In addition, respondents at the 2000 survey wave are often referenced as “young adults.”
2See table 3 in the full report for the results of the multinomial logistic regression analysis.
N A T I O N A L C E N T E R F O R E D U C A T I O N S T A T I S T I C S34
Elementary and Secondary Education
eighth-graders (i.e., those about 15 to 16 years old), if they were from a family with a lower socioeconom-ic status (SES), or if they were from a single-parent or one-parent/one other guardian family rather than a two-parent family. In regard to race/ethnicity, Whites and Native Americans were more likely than Asians, Blacks, and Hispanics to be teen/young adult smok-ers as opposed to nondaily smokers. With respect to school type, students from public schools and Catholic schools were more likely than those from non-Catholic private schools to be teen/young adult smokers as opposed to nondaily smokers. Consistent with prior research, smoking was also associated with lower academic achievement. Daily teenage smoking (including both groups—teen smokers and teen/young adult smokers) was generally more prevalent among students with lower achievement scores, lower grades, and among those not participating in an academic program in high school.
Introduction
Cigarette smoking is the leading cause of preventable dis-ease and death in the United States, where it is estimated that there are more deaths each year resulting from smoking than from alcohol, cocaine, heroin, AIDS, suicide, homi-cide, motor vehicle accidents, and fi res combined (U.S. Department of Health and Human Services 2000). There are an estimated 440,000 tobacco-related deaths nation-wide each year and approximately $157 billion in annual health-related economic losses due to smoking (Centers for Disease Control and Prevention 2002a). With about 8 out of 10 adult smokers in the United States having tried their fi rst cigarette before age 18 (U.S. Department of Health and Hu-man Services 1994), it is not surprising that there has been considerable concern about adolescent smoking.
This analysis uses data from the National Education Lon-gitudinal Study of 1988 (NELS:88), where the smoking be-havior of a nationally representative cohort of 1988 eighth-graders was assessed at various time points over a 12-year period (i.e., from about age 14 to age 26). In this report, the incidence of daily smoking at the various time points is shown. In addition, using the information obtained about individuals’ smoking behavior over the time period, several specifi c developmental patterns are identifi ed and then ex-amined in relation to various descriptive characteristics.
Comparisons made in the text of this report have been tested for statistical signifi cance at the .05 level. Most comparisons are tested with two-tailed t tests, although a multivariate
analysis was performed to examine the independent asso-ciation of several characteristics with smoking.3 Statistical testing was done in an effort to ensure that the differences are larger than those that might be expected due to sampling variation, although for any given comparison there is a 5 percent chance that an observed signifi cant difference may be due to chance.4 Not all signifi cant differences, however, are cited in the report. For example, in order to highlight those fi ndings of substantive signifi cance, only group differ-ences of at least 5 percentage points are cited in the text.5 Because comparisons made in the report are delimited and focused through their reliance on fi ndings from prior research, and because a criterion of substantive signifi cance has been imposed, the t tests carried out in this analysis have not been adjusted for multiple comparisons.
What is known about adolescent smoking?
Since 1991, two national studies, Monitoring the Future (MTF) (Johnston et al. 2004a) and the Youth Risk Behavior Survey (YRBS) (Centers for Disease Control and Prevention 2002b), have tracked the prevalence of cigarette smoking nationally among adolescents at various grade levels.6 These trend results show that cigarette smoking among 8th- through 12th-graders increased during much of the 1990s, but has since declined from the peak levels reached around 1996–97. According to recent 2003 data from MTF, 5 percent of 8th-graders, 9 percent of 10th-graders, and 16 percent of 12th-graders were daily smokers (i.e., they reported smoking cigarettes daily during the 30 days preceding the survey). These fi ndings are generally consistent with the 2001 YRBS. Using a slightly different measure, it was found that 14 percent of high school students were current frequent smokers— defi ned as smoking cigarettes on 20 or more of the 30 days preceding the survey.
A more limited number of longitudinal studies have tracked the frequency of smoking over time. These studies have shown that smoking is typically initiated during the ado-lescent years, and this behavior often persists or increases
3Full details of statistical tests used can be found in the technical appendix in the full report.
4Some differences shown throughout the tables of this report may appear large but not be statistically signifi cant. This is due in part to the relatively large standard errors surrounding some of the estimates (because of a relatively small sample size).
5The selection of 5 percentage points as the criterion for a substantive difference when reporting comparisons of proportions is based on similar analyses in other NCES reports (e.g., Walston and West 2004; Ingels et al. 2005), though it should be noted that the magnitude of effect that would be regarded as being of substantive or practical signifi cance may vary depending on the types and contexts of the relation-ships and outcomes being measured.
6MTF began in 1975, but at fi rst was limited to 12th-graders. In 1991, the study was expanded to include 8th- and 10th-graders.

E D U C A T I O N S T A T I S T I C S Q U A R T E R L Y — V O L U M E 7, I S S U E S 1 & 2, 2 0 0 5 35
during this time (Chassin et al. 1990; Chen and Kandel 1995; Schulenberg et al. 1994). Whereas the use of other drugs such as alcohol and marijuana has been found to de-cline during the young adult years, smoking has been found to remain fairly persistent during this time (Bachman et al. 1997; Chassin et al. 1996; Chen and Kandel 1995).
More recently, some longitudinal research has gone beyond simply identifying general trends in smoking behavior. That is, a few studies have identifi ed multiple developmental patterns in adolescent smoking. For example, studies have distinguished those adolescents who smoke at consistently high levels over time, those who increase their level of smoking or quit, those who initiate smoking only later on in adolescence, etc. (Chassin et al. 1991, 2000; Colder et al. 2001; Orlando et al. 2004; White, Pandina, and Chen 2002). Identifying distinct patterns of smoking and under-standing factors related to these patterns have implications for research and intervention, including efforts aimed at smoking prevention.
Studies that have specifi cally looked at adolescent smoking in relation to various individual or family characteristics have found that Whites are more likely to smoke compared to other racial/ethnic groups (Centers for Disease Control and Prevention 1998, 2002b, 2003; Orlando et al. 2004; Wills and Cleary 1997). In addition, nonsmokers are more likely than consistent smokers to come from intact nuclear families or from families with more highly educated parents (Orlando et al. 2004).
Other research has shown that adolescents who smoke also tend to have weaker ties to parents and school, more school behavior problems, and lower levels of self-esteem, academic achievement, and educational attainment (Bry-ant et al. 2000; Centers for Disease Control and Preven-tion 1998; Conrad, Flay, and Hill 1992; Schulenberg et al. 1994; U.S. Department of Health and Human Services 1994; White, Pandina, and Chen 2002). Adolescent smokers are also more likely to drop out of high school (Ellickson et al. 1998; Mensch and Kandel 1988) and more likely to use alcohol and other drugs (Substance Abuse and Mental Health Services Administration 2001; White, Pandina, and Chen 2002). These correlational fi ndings do not imply causal connections between smoking and other family and individual characteristics. However, they do indicate that adolescent smoking is associated with other adolescent behaviors and characteristics that may refl ect lower levels of engagement in learning and more alienation from parents and school.
There are, however, various limitations in past studies on adolescent smoking. For example, many studies are cross-sectional and utilize grade-specifi c samples (e.g., Centers for Disease Control and Prevention 2002b, 2003; Johnston et al. 2004a). Thus, changes in individuals over time cannot be measured, and high school dropouts are excluded. Many longitudinal studies also may exclude high school dropouts (e.g., Chassin et al. 1990, 1996, and 2000; Colder et al. 2001). Furthermore, some longitudinal studies are limited in their time frame, thus not incorporating both the adolescent and young adult years (e.g., Bachman et al. 1997; Colder et al. 2001), whereas others rely on retrospective data (e.g., Chen and Kandel 1995). In addition, some studies have a relatively small sample size (e.g., White, Pandina, and Chen 2002) or have limited racial/ ethnic, socioeconomic, and geographic diversity (e.g., Chassin et al. 1990, 1996, and 2000). Also, although a number of studies consider smok-ing in relation to various individual or family characteristics, these characteristics are often limited in scope due to limita-tions in the survey methodology (e.g., student self-report, mail-in surveys), and as previously noted, only a limited number of such studies identify multiple developmental pat-terns of smoking (i.e., Chassin et al. 1991, 2000; Orlando et al. 2004; White, Pandina, and Chen 2002).
Research objectives
To address prior limitations and expand the existing body of research on adolescent smoking, the present analysis uses data from NELS:88, which provides longitudinal data about the critical transitions experienced by members of the eighth-grade class of 1988 in the United States (i.e., those attending traditional public and private schools) as they de-veloped, attended school, embarked on careers, and formed families. There were 10,827 individuals who participated in the base-year survey (1988) and the four subsequent fol-low-ups—in 1990, 1992, 1994, and, most recently, in 2000.
Major strengths of the present study include its longitu-dinal design that spans from early adolescence well into young adulthood, and a methodology that can identify distinct developmental patterns of smoking across this time period. These developmental patterns are further exam-ined in relation to individual demographic characteristics, family demographic characteristics, and various educa-tion-related characteristics. Another major strength of the present study is that it includes measures that do not rely on student self-report (e.g., family socioeconomic status and student achievement scores) as well as some addi-tional measures that have not been looked at in previous studies on adolescent smoking (e.g., high school program
Adolescent Cigarette Smoking: A Longitudinal Analysis Through Young Adulthood

N A T I O N A L C E N T E R F O R E D U C A T I O N S T A T I S T I C S36
Elementary and Secondary Education
participation). Furthermore, the study utilizes a large, nationally representative sample. Whereas much of the data on adolescent smoking come from grade-based samples that exclude high school dropouts, NELS:88 included in its follow-ups those who had fallen out of grade sequence (such as through having repeated a grade) and those who had dropped out of high school. This has implications with respect to the generalizability of fi ndings. For example, research has found that the incidence of dropping out var-ies along such characteristics as socioeconomic status and race/ethnicity (Kaufman, Alt, and Chapman 2001). Thus, the exclusion of high school dropouts can lead to biases in the data by disproportionately eliminating certain popula-tion subgroups.
In sum, the three primary aims of this report are to
■ identify the incidence of daily smoking at several time points during the adolescent and young adult years, including the prevalence of new daily smokers relative to repeat daily smokers;
■ identify several specifi c developmental patterns of smoking from the information obtained about indi-viduals’ smoking behavior over the time period; and
■ examine the specifi c developmental patterns of smok-ing in relation to various descriptive characteristics.
Smoking as Assessed in NELS:88
In NELS:88, the prevalence of cigarette smoking was as-sessed at four survey waves—1988, 1990, 1992, and 2000. All respondents were in 8th grade at the initial 1988 survey, and most were in 10th grade as of the 1990 survey, in 12th grade as of the 1992 survey, and about 26 years old as of the 2000 survey—conducted 8 years after most respondents had graduated from high school.7 At each of these survey waves, respondents were asked how many cigarettes they usually smoked in a day. For this analysis, those who indi-cated smoking one or more cigarettes a day were classifi ed as daily smokers. Nondaily smokers included those who reported that they did not smoke or who reported smok-ing less than one cigarette a day.8 Note that participants in NELS:88 were not asked about their smoking behavior at the third follow-up in 1994. This took place 2 years after
high school graduation for most individuals and when many were attending postsecondary education.
This Statistics in Brief uses a relatively simplifi ed approach of classifying individuals either as daily smokers or non-daily smokers at the various survey waves rather than, for example, differentiating nonsmokers, occasional smokers, and heavy smokers at each of the four survey waves. While a number of factors went into the decision to use the current approach, there were two main factors. First, distinguish-ing daily smokers from nondaily smokers is consistent with what has been done in a number of other recent studies on adolescent smoking (e.g., Adalbjarnardottir and Rafnsson 2001; Burt et al. 2000; Johnson, McCaul, and Klein 2002; Windle and Windle 2001; Willoughby, Chalmers, and Bus-seri 2004). Second, smoking daily is related to a number of unfavorable developmental outcomes and, as such, is characterized as a particularly risky and problematic behav-ior (Johnson, McCaul, and Klein 2002; U.S. Department of Health and Human Services 1994; Willoughby, Chalmers, and Busseri 2004). Adolescents who, on average, smoke daily or almost daily for several years are at particular risk for health problems and have generally been found to have lower levels of educational attainment, greater use of other drugs, and more psychosocial adjustment problems com-pared to those who abstain from smoking or who smoke in-frequently or quit (Chassin et al. 2000; Orlando et al. 2004).
Prevalence of daily smoking at various time points during adolescence and young adulthood
More individuals reported daily smoking at each subse-quent survey follow-up (table 1). Six percent at 8th grade, 12 percent at 10th grade, 17 percent at 12th grade, and one-quarter at the young adult years reported usually smoking one or more cigarettes a day. At each wave of data collection, it was considered whether an individual who re-ported smoking was a new daily smoker (i.e., did not report daily smoking at a previous survey wave) or a repeat daily smoker (i.e., reported daily smoking at a previous survey wave). Results show that at the 10th grade there were more new daily smokers than repeat daily smokers; however, the opposite was true at the young adult years (the average age being 26). That is, at the 10th grade there were about three times as many new daily smokers as repeat daily smokers (9 vs. 3 percent). However, among the young adults there were about twice as many repeat daily smokers as new daily smokers (13 vs. 7 percent).
7As noted, not all individuals in 1990 were in 10th grade and not all in 1992 were in 12th grade (e.g., some were held back a grade). But for ease of reporting, the 1990 survey wave is referred to throughout this report as the “10th grade” and the 1992 survey wave is referred to as the “12th grade.” In addition, respondents at the 2000 survey wave are often referenced as “young adults.”
8The response option of “less than one cigarette a day,” however, was not offered at the initial 1988 survey wave.

E D U C A T I O N S T A T I S T I C S Q U A R T E R L Y — V O L U M E 7, I S S U E S 1 & 2, 2 0 0 5 37
Developmental patterns of daily smoking and nondaily smoking: A descriptive profi le
The prior analysis was meant to provide a snapshot of the prevalence of daily smoking at various time points dur-ing the adolescent and young adult years. A second set of analyses was then carried out in which multiple devel-opmental patterns of smoking were identifi ed, which is similar to what has been done in prior studies (Chassin et al. 1991, 2000; Orlando et al. 2004; White, Pandina, and Chen 2002). In this analysis, several distinct developmental patterns were derived from the information obtained about the NELS:88 eighth-grade cohort’s smoking behavior over the time period.
■ Nondaily smokers included those who reported usually smoking not at all or less than one cigarette per day at each of the applicable survey waves (1988, 1990, 1992, and 2000).
■ Teen smokers included those who reported usually smoking one or more cigarettes per day at either of the fi rst three survey waves (1988, 1990, or 1992), but not at the last survey wave in 2000. Thus, indi-viduals in this group either quit smoking or reduced their amount of smoking to less than one cigarette per day at the time of the young adult survey.
■ Teen/young adult smokers included those who report-ed usually smoking one or more cigarettes per day at either of the fi rst three survey waves (1988, 1990, or 1992) and at the last survey wave in 2000.
■ Late-onset smokers included those who reported usu-ally smoking one or more cigarettes per day at the last survey wave in 2000, but not at any of the prior survey waves (1988, 1990, and 1992). Thus, this
group includes individuals who either began smok-ing as young adults, or who increased the frequency with which they smoked from less than daily during adolescence to one or more cigarettes each day at the time of the young adult survey.
It is important to bear in mind that reports of daily smok-ing (or nondaily smoking) at two consecutive time points do not mean that there was continuous daily smoking (or nondaily smoking) over that time period. For example, an individual who reported smoking in 1990 and 2000 would be classifi ed as a teen/young adult smoker; however, this does not mean that the person smoked continuously throughout the 10-year period.
Overall patterns of smoking
Using the information obtained about individuals’ smoking behavior over time, 85 percent were classifi ed into one of the four developmental patterns.9 Of these, about two-thirds were nondaily smokers (68 percent), followed by teen/young adult smokers (15 percent), and then teen smokers (9 percent) and late-onset smokers (8 percent) (table 2). Adding together the teen smokers and teen/young adult smokers indicates that about one-quarter of individuals (24 percent) reported that they usually smoked cigarettes daily at some point during their teenage years. Of these, al-most two-thirds of them (63 percent) also reported smoking daily as young adults (i.e., the 15 percent who are teen/young adult smokers).
9The other 15 percent reported daily smoking or nondaily smoking at one or more survey waves, but had missing data at various survey waves that precluded their classifi cation into one of the four categories. Thus, these cases were not included in the main analyses of this report and the results shown in table 2 (and table 3 in the full report). However, a bias analysis of these excluded cases can be found in the technical appendix in the full report under Variables Used in Analysis—Smoking.
Adolescent Cigarette Smoking: A Longitudinal Analysis Through Young Adulthood
Table 1. Percentage distribution of 1988 eighth-graders’ cigarette smoking trends, by survey wave: Various years, 1988 to 2000
Daily smokers
Survey wave Nondaily smokers Total Repeat1 New2 Other3
1988 (all in eighth grade) 93.7 6.3 — — —1990 (most in 10th grade) 88.0 12.0 3.1 8.8 0.2 1992 (most in 12th grade)4 83.5 16.5 8.5 6.9 1.1 2000 (most at age 25 or 26) 74.7 25.3 13.1 7.0 5.2
— Not available.1Includes those daily smokers who also reported daily smoking at a previous survey wave.2Includes those daily smokers who did not report daily smoking at any previous survey wave.3Includes those daily smokers who had missing data at a previous survey wave(s) that precluded them from being classifi ed as “repeat daily smokers” or “new daily smokers.”4Item response rate is below 85 percent (i.e., 82 percent), and missing data have not been explicitly accounted for in the data. (See the technical appendix in the full report under Variables Used in Analysis—Smoking for a bias analysis of nonrespondents.)NOTE: Nondaily smokers include those who reported usually smoking not at all or less than one cigarette per day; daily smokers include those who reported usually smoking one or more cigarettes per day. Detail may not sum to totals because of rounding. SOURCE: U.S. Department of Education, National Center for Education Statistics, National Education Longitudinal Study of 1988 (NELS:88), “Base Year, Student Survey, 1988”; “First Follow-up, Student Survey, 1990”; “Second Follow-up, Student Survey, 1992”; and “Fourth Follow-up, Student Survey, 2000.”

N A T I O N A L C E N T E R F O R E D U C A T I O N S T A T I S T I C S38
Elementary and Secondary Education
CharacteristicNondaily smokers1 Teen smokers2
Teen/young adult smokers3
Late-onset smokers4
Total 67.6 9.0 15.2 8.2
SexMale 65.0 8.7 16.3 10.0 Female 70.2 9.2 14.1 6.5
Race/ethnicityAsian/Pacifi c Islander 78.8 7.2 5.7 8.3 Black, non-Hispanic 85.1 2.5 5.1 7.3 Hispanic 74.2 11.5 8.2 6.1 Native American/Alaska Native 71.3 4.2 19.3 5.1 White, non-Hispanic 63.8 9.7 17.8 8.7
Age in eighth grade13–14 years old (born 1974 or 1975) 71.4 8.2 12.2 8.2 15–16 years old (born 1972 or 1973) 60.2 10.1 21.5 8.3
Socioeconomic status (eighth grade, parent report)Low (lowest quartile) 62.2 8.9 22.4 6.5Middle (middle two quartiles) 65.8 10.2 15.4 8.7High (highest quartile) 74.3 7.0 10.1 8.5
Family composition (eighth grade, student report)Two parents 71.1 8.2 12.4 8.2 One parent and other guardian 56.9 13.5 20.7 8.9 Single parent 64.9 7.3 20.1 7.7 Other5 51.0 11.0 29.0 9.0
Achievement scores, reading and mathematics (eighth grade) Low (lowest quartile) 60.3 11.4 21.7 6.5Middle (middle two quartiles) 64.6 9.8 17.1 8.5 High (highest quartile) 77.1 6.2 7.5 9.2
Student-reported grades (grade 6 until grade 8 current)Low (lowest quartile) 48.4 14.1 30.0 7.4 Middle (middle two quartiles) 66.6 9.3 14.8 9.4 High (highest quartile) 81.5 5.3 5.9 7.2
Type of school attended in eighth gradePublic 66.9 8.9 16.0 8.1 Catholic 70.2 9.0 11.1 9.8 Other private 75.5 10.6 6.2 7.7
After eighth grade, high school program participationAcademic 74.7 7.2 9.4 8.7 Vocational 49.8 11.9 28.3 10.0 Other 52.3 13.3 27.7 6.7
1Includes those who reported usually smoking not at all or less than one cigarette per day at each of the applicable survey waves (1988, 1990, 1992, and 2000).2Includes those who reported usually smoking one or more cigarettes per day at either of the fi rst three survey waves (1988, 1990, or 1992) but not at the last survey wave in 2000. Some may have smoked cigarettes even daily beyond the teenage years and into their early twenties. But for the purpose of this analysis, they are referred to as “teen smokers” for ease of refer-ence and to distinguish them from the “teen/young adult smokers.” Unlike the teen/young adult smokers, the teen smokers did not report daily smoking when in their mid-twenties.3Includes those who reported usually smoking one or more cigarettes per day at either of the fi rst three survey waves (1988, 1990, or 1992) and at the last survey wave in 2000.4Includes those who reported usually smoking one or more cigarettes per day at the last survey wave in 2000, but not at any of the prior survey waves (1988, 1990, and 1992). Some may have been smoking daily as early as the late teenage years (e.g., sometime after the 12th grade). But for the purpose of this analysis, they are referred to as “late-onset smokers” for ease of reference and to distinguish them from the “teen smokers” and “teen/young adult smokers.”5Includes those who reported living with a relative besides a parent or living with a nonrelative.NOTE: All respondents were in eighth grade in the 1988 base-year survey wave (modal age of 14). Most respondents were in 10th grade as of the 1990 survey wave, 12th grade as of the 1992 survey wave, and 8 years after regular high school graduation as of the 2000 survey wave (modal ages of 16, 18, and 26, respectively). Percentage distribution shown is for the 85 percent of individuals who were classifi ed into one of the four developmental patterns. The other 15 percent reported daily smoking or nondaily smoking at one or more survey waves but had missing data at various survey waves that precluded their classifi cation into one of the four patterns. (See the technical appendix in the full report under Variables Used in Analy-sis—Smoking for a discussion about data imputations for some of the patterns and for a bias analysis of excluded cases.) Detail may not sum to totals because of rounding.SOURCE: U.S. Department of Education, National Center for Education Statistics, National Education Longitudinal Study of 1988 (NELS:88), “Base Year, Student Survey, 1988”; “Base Year, Parent Survey, 1988”; “Base Year, School Survey, 1988”; “First Follow-up, Student Survey, 1990”; “Second Follow-up, Student Survey, 1992”; “Second Follow-up, Transcript Survey, 1992”; “Third Follow-up, Student Survey, 1994”; and “Fourth Follow-up, Student Survey, 2000.”
Table 2. Percentage distribution of 1988 eighth-graders’ cigarette smoking patterns, by selected characteristics: Various years, 1988 to 2000
E D U C A T I O N S T A T I S T I C S Q U A R T E R L Y — V O L U M E 7, I S S U E S 1 & 2, 2 0 0 5 39
In the sections that follow, the patterns of smoking are shown by various descriptive characteristics. (Readers should con-sult the technical appendix in the full report in the section entitled Variables Used in Analysis for additional information about the variables used for these characteristics.)
Patterns of smoking by individual demographic characteristics
Three individual demographic characteristics were con-sidered in relation to the patterns of smoking: sex, race/ ethnicity, and age.
Sex. There were more females who were nondaily smokers compared to males (70 vs. 65 percent). However, no differ-ence was detected in the prevalence of males and females who were teenage smokers overall (i.e., adding together the teen smokers and teen/young adult smokers). This is consistent with other studies over the past decade that have generally not detected sex differences in current smoking among middle school and high school students (Byrnes, Miller, and Schafer 1999; Centers for Disease Control and Prevention 2002b, 2003).
Race/ethnicity. More Asians, Blacks, and Hispanics were nondaily smokers than Whites (79, 85, and 74 percent, respectively, compared to 64 percent). Likewise, fewer Asians, Blacks, and Hispanics were teen/young adult smok-ers than Whites (6, 5, and 8 percent, respectively, compared to 18 percent). Furthermore, more Blacks were nondaily smokers than Hispanics and Native Americans (71 percent), and fewer Blacks were teen smokers than Hispanics and Whites (3 percent compared to 12 and 10 percent, respec-tively). About one in fi ve (19 percent) Native Americans was a teen/young adult smoker, a rate higher than that of Asians, Blacks, and Hispanics. A similar overall pattern of racial/ethnic differences in adolescent smoking has been found in other studies over the past decade (Centers for Disease Control and Prevention 1998, 2002b, 2003; Orlando et al. 2004; Wills and Cleary 1997), although some recent studies suggest very little in the way of racial/ethnic differences at the middle school level (Centers for Disease Control and Prevention 2000, 2003). Trend data from Monitoring the Future (MTF) show that racial/ethnic differences among eighth-graders have narrowed over the past several years—largely the result of a decline in smok-ing among Whites. For example, the rate of daily smoking among White eighth-graders declined from 12 percent in 1995–96 to 5 percent in 2002–03 (Johnston et al. 2004b). Among Hispanic eighth-graders, the rate of daily smoking went from 8 percent to 4 percent during this same time
period, and for Black eighth-graders the rate was between 3 and 4 percent throughout this time period.
Age. There were more nondaily smokers among individuals who were younger as eighth-graders (i.e., those about 13 to 14 years old) than among their older peers (i.e., those about 15 to 16 years old in eighth grade) (71 vs. 60 percent).Likewise, fewer of the younger individuals were teen/young adult smokers compared to the older individuals (12 vs. 21 percent). No differences by age were detected for the teen smokers and late-onset smokers.
Patterns of smoking by family demographic characteristics
In an effort to shed light on the context that smoking occurs in, it is useful to explore family characteristics in relation to these developmental patterns. Two family characteristics as-sessed in the eighth grade were considered in this analysis: family socioeconomic status and family composition.
Family socioeconomic status (SES). SES was derived from parent-questionnaire data obtained when students were in the eighth grade. Each individual received a composite scale score based on father’s education level, mother’s education level, father’s occupation, mother’s occupation, and family income. For this analysis, scores were divided into three levels: low (lowest quartile), middle (middle two quartiles), and high (highest quartile). Results show that there were more nondaily smokers among those at the high SES level than among their peers at the low and middle SES levels (74 percent compared to 62 and 66 percent, respectively). Similarly, there were fewer teen/young adult smokers at each higher SES level (22, 15, and 10 percent for the low-, middle-, and high-SES groups, respectively).
Family composition. More individuals from two-parent families were nondaily smokers than those from the other family compositions shown (71 percent compared to a range from 51 to 65 percent). Similarly, fewer individuals from two-parent families were teen smokers than those from families with one parent and one other guardian (8 vs. 14 percent), and fewer individuals from two-parent families were teen/young adult smokers than those from single-parent families and those from families with one parent and one other guardian (12 percent compared to 20 and 21 percent, respectively). More individuals from single-par-ent families were nondaily smokers than those from families with one parent and one other guardian (65 vs. 57 percent). Likewise, fewer individuals from single-parent families were teen smokers compared to those from one-parent/one other guardian families (7 vs. 14 percent).
Adolescent Cigarette Smoking: A Longitudinal Analysis Through Young Adulthood

N A T I O N A L C E N T E R F O R E D U C A T I O N S T A T I S T I C S40
Elementary and Secondary Education
Patterns of smoking by education-related characteristics
As previously noted, prior research has found that lower academic achievement among adolescents is associated with smoking (Bryant et al. 2000; Ellickson et al. 1998; Mensch and Kandel 1988; Schulenberg et al. 1994; White, Pandina, and Chen 2002). This relationship was generally explored in the present analysis by examining two specifi c achieve-ment characteristics from the eighth grade: achievement scores and average grades.
Achievement scores. In addition to completing a student background questionnaire on their school and life experi-ences, eighth-graders were administered cognitive tests in reading comprehension, mathematics, science, and history/citizenship/geography. In this analysis, a combined score from the reading comprehension and mathematics tests was used, with the score broken down into three levels: low (lowest quartile), middle (middle two quartiles), and high (highest quartile). Results show that students who performed higher on the assessment were generally less likely to smoke. For example, more high-performing students were nondaily smokers than low- and middle-performing students (77 per-cent compared to 60 and 65 percent, respectively); likewise, fewer high-performing students were teen smokers compared to their low-performing peers (6 vs. 11 percent). Similarly, there were fewer teen/young adult smokers at each higher level of achievement (22, 17, and 8 percent, respectively, for the low, middle, and high achievement levels).
Average grades. Eighth-graders were asked to describe their school grades from grade 6 up until the time of data collec-tion (i.e., spring of eighth grade) in four subject areas: Eng-lish, mathematics, science, and social studies. The response categories in these subject areas were converted to a fi ve-point scale (i.e., mostly A’s = 4.0, mostly B’s = 3.0, mostly C’s = 2.0, mostly D’s = 1.0, and mostly below D = 0.5), and a quartile distribution of the averaged scores was created. For this analysis, students’ grades were classifi ed into three levels: low (lowest quartile), middle (middle two quartiles), and high (highest quartile). Results show that students who reported earning higher grades were generally less likely to smoke. For example, at each higher level of average grades, there were more nondaily smokers (48, 67, and 82 percent, respectively) and fewer teen/young adult smokers (30, 15, and 6 percent, respectively). In addition, fewer middle- and high-performing students were teen smokers than their low-performing peers (9 and 5 percent compared to 14 percent).
Lastly, school contextual factors were explored in relation to the patterns of smoking by considering the type of school
attended in eighth grade (i.e., public, Catholic, and other private schools) and the type of program individuals partici-pated in later in high school (i.e., academic, vocational, or other high school programs).
School type. More students from non-Catholic private schools were nondaily smokers compared to public school students (75 vs. 67 percent), and fewer students from non-Catholic private schools were teen/young adult smokers compared to public school students (6 vs. 16 percent). In addition, fewer Catholic school students were teen/young adult smokers (11 percent) compared to public school students, although this rate was higher than that of their counterparts at non-Catholic private schools.
Program type. In this analysis, program type refers to the most recent program that a student was involved in at his/her last high school. Results show that more individu-als from academic high school programs were nondaily smokers than those from vocational or other high school programs (75 percent compared to 50 and 52 percent, respectively). Likewise, there were fewer individuals among those from academic high school programs than among those from vocational or other high school programs who were teen smokers (7 percent compared to 12 and 13 per-cent, respectively) and teen/young adult smokers (9 percent compared to 28 percent for both vocational and other high school programs).
Results from multivariate analysis
All of the characteristics examined in the series of bivari-ate analyses discussed above were related to smoking to some extent. However, some of these characteristics may be related to each other. In order, then, to examine the inde-pendent association of these characteristics with smoking, a multivariate analysis was conducted. Specifi cally, a multino-mial logistic regression analysis was performed to determine whether each of these characteristics is related to the smok-ing patterns when controlling for the other characteristics.10
Results show that most of the characteristics that were related to the smoking patterns at the bivariate level were also signifi cant at the multivariate level.11 In other words, many of these characteristics were independently associated with smoking when accounting for the other individual, family, and education-related characteristics. Across the
10See the technical appendix in the full report under Statistical Tests—Multivariate Analysis for further discussion about this procedure.
11Table 3 in the full report shows the results of the multinomial logistic regression analysis.
E D U C A T I O N S T A T I S T I C S Q U A R T E R L Y — V O L U M E 7, I S S U E S 1 & 2, 2 0 0 5 41
three smoking patterns (i.e., teen smokers, teen/young adult smokers, and late-onset smokers), individuals were more likely to be daily smokers than nondaily smokers if they were White as opposed to Black, if they reported earning lower grades during the middle school years, or if they par-ticipated in a vocational high school program as opposed to an academic high school program.
In addition, individuals were more likely to be teen smok-ers and teen/young adult smokers than nondaily smokers if they were Asian or Hispanic as opposed to Black, if they were older than their eighth-grade peers, if they were from a family with one parent and one other guardian rather than a two-parent family, or if they participated in other (nonvo-cational) high school programs as opposed to an academic high school program.
There were also several other characteristics that were related to smoking, but only for teen/young adult smok-ing. That is, individuals were more likely to be teen/young adult smokers than nondaily smokers if they were White or Native American as opposed to Asian, Black, or Hispanic; if they were from a family with a lower SES or from a single-parent family rather than a two-parent family; if they had lower standardized test scores as eighth-graders; or if they attended a public or Catholic school in eighth grade as op-posed to a private non-Catholic school.
The only sex difference found in the smoking patterns was that males were more likely than females to be late-onset smokers as opposed to nondaily smokers.
Summary and Conclusion
In a longitudinal analysis that spanned three grade levels—grades 8, 10, and 12—and well into young adulthood, it was found that daily cigarette smoking increased at each subsequent time point. Six percent at 8th grade, 12 percent at 10th grade, 17 percent at 12th grade, and one-quarter at the age of about 26 years reported usually smoking one or more cigarettes a day. These results are generally consistent with the fi ndings from other studies. For example, just as this study found that in 1992 17 percent of individuals—most of whom were in 12th grade—were daily smokers, so too did the national Monitoring the Future (MTF) study fi nd that in 1992 17 percent of 12th-graders were daily smokers (Johnston et al. 2004a).
Results also show that at the 10th grade there were more new daily smokers than repeat daily smokers; however, the opposite was true at the young adult years. That is, at the
10th grade there were about three times as many new daily smokers as repeat daily smokers (9 vs. 3 percent). However, among the young adults there were about twice as many re-peat daily smokers as new daily smokers (13 vs. 7 percent).
In a separate analysis that uses the information obtained about individuals’ smoking behavior over the time period, several specifi c developmental patterns were derived. About two-thirds (68 percent) were nondaily smokers, followed by teen/young adult smokers (15 percent) and then teen smokers (9 percent) and late-onset smokers (8 percent). Accordingly, of the 24 percent of individuals who reported smoking as teenagers (i.e., adding together the teen smok-ers and teen/young adult smokers), almost two-thirds of them (63 percent) also reported smoking as young adults. This, together with the aforementioned fi ndings about the proportion of new daily smokers relative to repeat daily smokers at the various survey waves, suggests that there is a degree of persistence in smoking behavior. These results are also fairly consistent with prior research showing that about half (53 percent) of adult smokers in the United States became regular smokers before age 18 (U.S. Department of Health and Human Services 1994).
Examining the four developmental patterns with respect to various descriptive characteristics, it was found that there were more nondaily smokers among individuals who were younger as eighth-graders (i.e., those about 13 to 14 years old) than among their older peers (i.e., those about 15 to 16 years old in eighth grade) (71 vs. 60 percent). Like-wise, fewer of the younger individuals were teen/young adult smokers compared to the older individuals (12 vs. 21 percent), although no difference by age was detected for the late-onset smokers. Together, these fi ndings sug-gest that the younger individuals did not “catch up” with the older individuals in their incidence of daily smoking as tracked during the survey period. It should also be noted that many of the older individuals are those who have had to repeat a grade. As prior research (e.g., Bryant et al. 2000; Ellickson et al. 1998; Mensch and Kandel 1988; Schulen-berg et al. 1994; White, Pandina, and Chen 2002) and the current analysis indicate, adolescent smoking is associ-ated with lower academic achievement. The present set of results indicates that daily teenage smoking (including both groups—teen smokers and teen/young adult smokers) was more prevalent among students with lower achieve-ment scores, with lower grades, and not participating in an academic program in high school. In the current analysis, these relationships—between smoking and age and between smoking and academic achievement—were generally found
Adolescent Cigarette Smoking: A Longitudinal Analysis Through Young Adulthood

N A T I O N A L C E N T E R F O R E D U C A T I O N S T A T I S T I C S42
Elementary and Secondary Education
even when controlling for each other and for various indi-vidual, family, and school characteristics, including race/ethnicity, SES, family composition, and school type.
Results also show that, in addition to age and academic achievement, most of the characteristics that were related to daily smoking in the set of bivariate analyses were also signifi cant in the multivariate analysis. For example, the multivariate analysis indicates that individuals were more likely to be teen/young adult smokers than nondaily smok-ers if they were from a family with a lower SES or if they were from a single-parent or one-parent/one other guardian family rather than a two-parent family. In regard to race/ethnicity, Whites and Native Americans were more likely than Asians, Blacks, and Hispanics to be teen/young adult smokers as opposed to nondaily smokers. With respect to school type, students from public schools and Catholic schools were more likely than those from non-Catholic private schools to be teen/young adult smokers as opposed to nondaily smokers.
Taken together, the results show that all of the descrip-tive characteristics were related to smoking at some level as considered in this analysis. However, these relation-ships—especially those pertaining to school and academic achievement—were most consistently found for the teen/young adult smokers. That is, these relationships were most often found for those individuals who smoked regularly and with some degree of consistency beginning in the adolescent years. By the same token, this pattern of differences was gen-erally not found for the late-onset smokers. To some extent, this refl ects the fact that particular subgroups, such as low-SES and low-performing students, tend to start smoking earlier. But another possible explanation is that late-onset smoking is generally not associated with the characteristics examined in this analysis, but rather with a different cluster of characteristics or motivational factors that occur later in life, such as attending college, entering the workforce, or starting a family. For example, other longitudinal research has found that smoking tends to decline following marriage and during pregnancy (Bachman et al. 1997).
Identifying distinct patterns of smoking and understand-ing factors related to these patterns have implications for research and intervention, including efforts aimed at smok-ing prevention. However, it is important to caution that no causality can be inferred from the relationships identifi ed in this analysis. Furthermore, even though a multivariate analysis examined the independent association of several characteristics with regular cigarette smoking, this analy-
sis did not consider more complex interdependencies that may exist among these characteristics, such as one variable mediating the relationship between another variable and smoking. In addition, the list of characteristics included in the multivariate analysis was limited. Therefore, it is pos-sible that some of these relationships could be explained by accounting for additional variables—some of which may be contained in the NELS data fi les and some of which may not be. For example, as previously noted, the relationship between smoking and age was found even when control-ling for academic achievement. However, the achievement measures in this analysis focused on the middle school years. Thus, the extent to which academic success earlier on in one’s education can account for the relationship between smoking and age is not specifi cally known. Another variable that, although not measured in NELS, has been looked at in other studies on smoking is risk perception. For example, some research suggests that young people tend to under-estimate the health risks associated with smoking and overestimate people’s ability to quit smoking (Jamieson and Romer 2001a, 2001b). Furthermore, risk perception has been shown to be associated with smoking (Chassin et al. 2000; Orlando et al. 2004)—especially the decision to stop smoking (Romer and Jamieson 2001).
Future research using NELS and other datasets might fur-ther examine these and other characteristics. Using longitu-dinal data, these characteristics can be examined at multiple time points, linking the time frames of various charac-teristics with the onset and quitting of smoking. Other analytic strategies might also be employed, such as growth mixture modeling, which has recently been used in other longitudinal studies on smoking (e.g., Colder et al. 2001; Orlando et al. 2004; White, Pandina, and Chen 2002). Additional research may offer further insight, for example, into why some adolescents and young adults seem to quit smoking while others do not, and why some avoid smoking altogether whereas others take up smoking later on.
ReferencesAdalbjarnardottir, S., and Rafnsson, F.D. (2001). Perceived Control
in Adolescent Substance Use: Concurrent and Longitudinal Analyses. Psychology of Addictive Behaviors, 15(1): 25–32.
Bachman, J.G., Wadsworth, K.N., O’Malley, P.M., Johnston, L.D., and Schulenberg, J.E. (1997). Smoking, Drinking, and Drug Use in Young Adulthood: The Impacts of New Freedoms and New Re-sponsibilities. Mahwah, NJ: Lawrence Erlbaum Associates.
Bryant, A.L., Schulenberg, J., Bachman, J.G., O’Malley, P.M., and Johnston, L.D. (2000). Understanding the Links Among School Misbehavior, Academic Achievement, and Cigarette Use: A Na-tional Panel Study of Adolescents. Prevention Science, 1(2): 71–87.

E D U C A T I O N S T A T I S T I C S Q U A R T E R L Y — V O L U M E 7, I S S U E S 1 & 2, 2 0 0 5 43
Burt, R.D., Dinh, K.T., Peterson, A.V., and Sarason, I.G. (2000). Predicting Adolescent Smoking: A Prospective Study of Per-sonality Variables. Preventive Medicine: An International Journal Devoted to Practice & Theory, 30(2): 115–125.
Byrnes, J.P., Miller, D.C., and Schafer, W.D. (1999). Gender Differ-ences in Risk Taking: A Meta-Analysis. Psychological Bulletin, 125(3): 367–383.
Centers for Disease Control and Prevention. (1998). Tobacco Use Among U.S. Racial/Ethnic Minority Groups. Atlanta, GA: National Center for Chronic Disease Prevention and Health Promotion, Offi ce on Smoking and Health.
Centers for Disease Control and Prevention. (2000). Tobacco Use Among Middle and High School Students—United States, 1999. Morbidity and Mortality Weekly Report, 49(3): 49–53.
Centers for Disease Control and Prevention. (2002a). Annual Smoking-Attributable Mortality, Years of Potential Life Lost, and Economic Costs—United States, 1995–1999. Morbidity and Mortality Weekly Report, 51(14): 300–303.
Centers for Disease Control and Prevention. (2002b). Trends in Cigarette Smoking Among High School Students—United States, 1991–2001. Morbidity and Mortality Weekly Report, 51(19): 409–428.
Centers for Disease Control and Prevention. (2003). Tobacco Use Among Middle and High School Students—United States, 2002. Morbidity and Mortality Weekly Report, 52(45): 1093–1116.
Chassin, L., Presson, C.C., Pitts, S.C., and Sherman, S.J. (2000). The Natural History of Cigarette Smoking From Adolescence to Adulthood in a Midwestern Community Sample: Multiple Trajectories and Their Psychosocial Correlates. Health Psychol-ogy, 19(3): 223–231.
Chassin, L., Presson, C.C., Rose, J.S., and Sherman, S.J. (1996). The Natural History of Cigarette Smoking From Adolescence to Adulthood: Demographic Predictors of Continuity and Change. Health Psychology, 15(6): 478–484.
Chassin, L., Presson, C.C., Sherman, S.J., and Edwards, D.A. (1990). The Natural History of Cigarette Smoking: Predicting Young-Adult Smoking Outcomes From Adolescent Smoking Patterns. Health Psychology, 9(6): 701–716.
Chassin, L., Presson, C.C., Sherman, S.J., and Edwards, D.A. (1991). Four Pathways to Young-Adult Smoking Status: Adoles-cent Social-Psychological Antecedents in a Midwestern Commu-nity Sample. Health Psychology, 10(6): 409–418.
Chen, K., and Kandel, D.B. (1995). The Natural History of Drug Use From Adolescence to the Mid-Thirties in a General Popula-tion Sample. American Journal of Public Health, 85(1): 41–47.
Colder, C.R., Mehta, P., Balanda, K., Campbell, R.T., Mayhew, K.P., Stanton, W.R., Pentz, M.A., and Flay, B.R. (2001). Identifying Trajectories of Adolescent Smoking: An Application of Latent Growth Mixture Modeling. Health Psychology, 20(2): 127–135.
Conrad, K.M., Flay, B.R., and Hill, D. (1992). Why Children Start Smoking Cigarettes: Predictors of Onset. British Journal of Addic-tion, 87(12): 1711–1724.
Ellickson, P., Bui, K., Bell, R., and McGuigan, K.A. (1998). Does Early Drug Use Increase the Risk of Dropping Out of High School? Journal of Drug Issues, 28(2): 357–380.
Ingels, S.J., Burns, L.J., Chen, X., Forrest Cataldi, E., and Charleston, S. (2005). A Profi le of the American High School Sophomore in 2002: Initial Results From the Base Year of the Education Longitudinal Study of 2002 (NCES 2005-338). U.S. Department of Education. Washington, DC: National Center for Education Statistics.
Jamieson, P., and Romer, D. (2001a). A Profi le of Smokers and Smoking. In P. Slovic (Ed.), Smoking: Risk, Perception, & Policy (pp. 29–47). Thousand Oaks, CA: Sage Publications.
Jamieson, P., and Romer, D. (2001b). What Do Young People Think They Know About the Risks of Smoking? In P. Slovic (Ed.), Smoking: Risk, Perception, & Policy (pp. 51–63). Thou-sand Oaks, CA: Sage Publications.
Johnson, R.J., McCaul, K.D., and Klein, W.M.P. (2002). Risk In-volvement and Risk Perception Among Adolescents and Young Adults. Journal of Behavioral Medicine, 25(1): 67–82.
Johnston, L.D., O’Malley, P.M., Bachman, J.G., and Schulenberg, J.E. (2004a). Monitoring the Future: National Results on Adoles-cent Drug Use: Overview of Key Findings, 2003 (NIH Publication No. 04-5506). Bethesda, MD: National Institute on Drug Abuse.
Johnston, L.D., O’Malley, P.M., Bachman, J.G., and Schulenberg, J.E. (2004b). Demographic Subgroup Trends for Various Licit and Illicit Drugs, 1975–2003 (Monitoring the Future Occasional Paper No. 60). Ann Arbor, MI: Institute for Social Research. Available: http://monitoringthefuture.org.
Kaufman, P., Alt, M.N., and Chapman, C.D. (2001). Dropout Rates in the United States: 2000 (NCES 2002-114). U.S. Department of Edu-cation. Washington, DC: National Center for Education Statistics.
Mensch, B.S., and Kandel, D.B. (1988). Dropping Out of High School and Drug Involvement. Sociology of Education, 61(2): 95–113.
Orlando, M., Tucker, J.S., Ellickson, P.L., and Klein, D.J. (2004). Developmental Trajectories of Cigarette Smoking and Their Cor-relates From Early Adolescence to Young Adulthood. Journal of Consulting and Clinical Psychology, 72(3): 400–410.
Romer, D., and Jamieson, P. (2001). The Role of Perceived Risk in Starting and Stopping Smoking. In P. Slovic (Ed.), Smoking: Risk, Perception, & Policy (pp. 64–80). Thousand Oaks, CA: Sage Publications.
Schulenberg, J., Bachman, J.G., O’Malley, P.M., and Johnston, L.D. (1994). High School Educational Success and Subsequent Sub-stance Use: A Panel Analysis Following Adolescents Into Young Adulthood. Journal of Health and Social Behavior, 35(1): 45–62.
Substance Abuse and Mental Health Services Administration. (2001). Summary of Findings From the 2000 National Household Survey on Drug Abuse. NHSDA Series H-13, DHHS Publication No. (SMA) 01-3549. Rockville, MD: Offi ce of Applied Studies.
U.S. Department of Health and Human Services. (1994). Preventing Tobacco Use Among Young People: Report of the Surgeon General. Atlanta, GA: National Center for Chronic Disease Prevention and Health Promotion, Offi ce on Smoking and Health.
U.S. Department of Health and Human Services. (2000). Healthy People 2010: Understanding and Improving Health (2nd ed.). Washington, DC: U.S. Government Printing Offi ce.
Adolescent Cigarette Smoking: A Longitudinal Analysis Through Young Adulthood
N A T I O N A L C E N T E R F O R E D U C A T I O N S T A T I S T I C S44
Elementary and Secondary Education
Walston, J.T., and West, J. (2004). Full-Day and Half-Day Kinder-garten in the United States: Findings From the Early Childhood Longitudinal Study, Kindergarten Class of 1998–99 (NCES 2004-078). U.S. Department of Education. Washington, DC: National Center for Education Statistics.
White, H.R., Pandina, R.J., and Chen, P.H. (2002). Developmental Trajectories of Cigarette Use From Early Adolescence Into Young Adulthood. Drug and Alcohol Dependence, 65(2): 167–178.
Willoughby, T., Chalmers, H., and Busseri, M.A. (2004). Where Is the Syndrome? Examining Co-occurrence Among Multiple Problem Behaviors in Adolescence. Journal of Consulting and Clinical Psychology, 72(6): 1022–1037.
Wills, T.A., and Cleary, S.D. (1997). The Validity of Self-Reports of Smoking: Analyses by Race/Ethnicity in a School Sample of Ur-ban Adolescents. American Journal of Public Health, 87(1): 56–61.
Data source: The NCES National Education Longitudinal Study of 1988 (NELS:88).
For technical information, see the complete report:
Miller, D.C. (2005). Adolescent Cigarette Smoking: A Longitudinal Analysis Through Young Adulthood (NCES 2005-333).
Author affi liation: D.C. Miller, Education Statistics Services Institute.
For questions about content, contact Jeffrey Owings ([email protected]).
To obtain the complete report (NCES 2005-333), visit the NCES Electronic Catalog (http://nces.ed.gov/pubsearch).
Windle, M., and Windle, R.C. (2001). Depressive Symptoms and Cigarette Smoking Among Middle Adolescents: Prospective Associations and Intrapersonal and Interpersonal Infl uences. Journal of Consulting and Clinical Psychology, 69(2): 215–226.

E D U C A T I O N S T A T I S T I C S Q U A R T E R L Y — V O L U M E 7, I S S U E S 1 & 2, 2 0 0 5 45
The National Center for Education Statistics (NCES) has employed its Fast Response Survey System (FRSS) to track access to information technology in schools and class-rooms since 1994. FRSS is designed to administer short, focused, issue-oriented surveys that place minimal burden on respondents and have a quick turnaround from data col-lection to reporting. Each year, NCES has conducted a new nationally representative survey of public schools to gauge the progress made in computer and internet availability, based on measures such as student-to-computer ratio and the percentage of schools and classrooms with internet con-nections. As computers and the Internet became increas-ingly available in schools, the FRSS surveys were modifi ed to address new and continuing issues, such as the use of new types of internet connections to enhance connectivity. Recent FRSS surveys on internet access have been expanded to address other emerging issues. The 2002 survey, for in-stance, included items on the use of technologies or proce-dures to prevent student access to inappropriate material on the Internet, the availability of computers outside of regular school hours, and the availability of teacher professional development on technology use in the classroom.
This article presents key fi ndings from the 2003 FRSS sur-vey on internet access in U.S. public schools and selected comparisons with data from previous FRSS internet surveys. The 2003 survey, designed to update data on all of the ques-tions asked in 2002, covered the following topics:
■ school connectivity, including school and classroom access to the Internet, types of connections, and computer hardware, software, and internet support;
■ student access to computers and the Internet, includ-ing student-to-computer ratio, computer availability outside of regular school hours, the provision of hand-held computers, and laptop computers available for loan;
■ school websites;
■ technologies and procedures to prevent student ac-cess to inappropriate material on the Internet; and
■ teacher professional development on how to integrate the use of the Internet into the curriculum.
Questionnaires for the survey “Internet Access in U.S. Public Schools, Fall 2003” were mailed to a representative sample
of 1,207 public schools in the 50 states and the District of Columbia. The sample was selected from the 2001–02 NCES Common Core of Data (CCD) Public Elementary/Secondary School Universe File, the most current available at the time of selection. Over 95,000 schools are contained in the 2001–02 CCD Public Elementary/Secondary School Universe File. The sampling frame includes 83,842 regular elementary and secondary/combined schools. The estimated number of schools in the survey universe decreased to an estimated 82,232 because some of the schools were determined to be ineligible for the FRSS survey during data collection. Data have been weighted to yield national estimates. The un-weighted response rate was 91 percent, and the weighted response rate was 92 percent. Detailed information about the survey methodology is provided in appendix A in the full report, and the questionnaire can be found in appendix B. The primary focus of this article is to present national esti-mates for selected topics in 2003 and statistically signifi cant fi ndings over time. In addition, selected survey fi ndings are presented by the following school characteristics:
■ instructional level (elementary, secondary);
■ school size (enrollment of less than 300, 300 to 999, 1,000 or more);
■ locale (city, urban fringe, town, rural);
■ percent minority enrollment (less than 6 percent, 6 to 20 percent, 21 to 49 percent, 50 percent or more); and
■ percent of students eligible for free or reduced-price lunch (less than 35 percent, 35 to 49 percent, 50 to 74 percent, 75 percent or more), which is used as a measure of poverty concentration at the school. For the remainder of this article, we will refer to the percent of free or reduced-priced lunch as poverty concentration.
In general, comparisons by these school characteristics are presented only where signifi cant differences were detected and follow meaningful patterns. It is important to note that many of the school characteristics may also be related to each other. For example, enrollment size and instruc-tional level of schools are related, with secondary schools typically being larger than elementary schools. Similarly, poverty concentration and minority enrollment are related, with schools with a higher minority enrollment also more
Public School Internet AccessInternet Access in U.S. Public Schools and Classrooms: 1994–2003——————————————————————————————————Basmat Parsad and Jennifer Jones
This article was originally published as the Summary of the E.D. TAB of the same name. The sample survey data are from “Internet Access in U.S. Public Schools, Fall 2003,” conducted through the Fast Response Survey System (FRSS).

N A T I O N A L C E N T E R F O R E D U C A T I O N S T A T I S T I C S46
Elementary and Secondary Education
likely to have a higher concentration of poverty. Other relationships may exist between the school characteristics used for analysis. However, this article focuses on bivariate relationships between school characteristics and the data gathered in the survey, rather than more complex analyses, to provide descriptive information about internet access in public schools.
All specifi c statements of comparison made in this report have been tested for statistical signifi cance through trend analysis tests and t tests adjusted for multiple comparisons using the Bonferroni adjustment,1 and are signifi cant at the 95 percent confi dence level or better. However, only selected fi ndings are presented for each topic in the report. Throughout the report, differences that may appear large (particularly those by school characteristics) may not be statistically signifi cant. This is due in part to the relatively large standard errors surrounding the estimates and the use of the Bonferroni adjustment to control for multiple comparisons. A detailed description of the statistical tests supporting the survey fi ndings can be found in appendix A in the full report.
Selected Findings
The fi ndings are organized to address the following issues: school connectivity, student access to computers and the Internet, school websites, technologies and procedures to prevent student access to inappropriate material on the Internet, and teacher professional development on how to integrate the use of the Internet into the curriculum.
School connectivity
The FRSS surveys on internet access collected information on several key measures of school connectivity. Schools were asked whether they had access to the Internet. Schools with internet access were also asked about the number of instructional rooms that had at least one computer with internet access, the types of internet connections used, and the staff position of the person primarily responsible for computer hardware, software, and internet support at the school. Information on the number of instructional rooms with internet access was combined with information on the total number of instructional rooms in the school to calculate the percentage of instructional rooms with internet access.2
School and instructional room access
■ In fall 2003, nearly 100 percent of public schools in the United States had access to the Internet,3 com-pared with 35 percent in 1994. In 2003, no differ-ences in school internet access were observed by any school characteristics, which is consistent with data reported previously. There have been virtually no differences in school access to the Internet by school characteristics since 1999 (Kleiner and Lewis 2003).
■ Public schools have made consistent progress in expanding internet access in instructional rooms. In 2003, 93 percent of public school instructional rooms had Internet access, compared with 3 percent in 1994 (fi gure 1). Across school characteristics, the proportion of instructional rooms with internet access ranged from 90 to 97 percent.
Types of connections
The types of internet connections used by public schools and the speed at which computers are connected to the Internet have changed over the years. In 1996, dial-up internet connections (a type of narrowband connection) were used by about three-fourths (74 percent) of public schools having internet access (Heaviside, Riggins, and Far-ris 1997). In 2001, 5 percent of public schools used dial-up connections, while the majority of public schools (55 per-cent) reported using T1/DS1 lines (a type of broadband connection), a continuous and much faster type of internet connection than dial-up (Kleiner and Farris 2002). Because of the increasing complexity of detailed information on types of connections, the 2002 and 2003 surveys directly asked whether schools used broadband and narrowband connections.4 Schools also reported whether they used wireless connections to the Internet, the types of wireless connections used, and the number of instructional rooms with wireless connections.
■ In 2003, 95 percent of public schools with internet access used broadband connections to access the Inter-net. In 2001 and 2000, 85 percent and 80 percent of the schools, respectively, were using broadband connections.
1The Bonferroni adjustment was also used for previous FRSS internet reports. The Bonferroni adjustment is appropriate to test for statistical signifi cance when the analyses are mainly exploratory (as in this report) because it results in a more conservative critical value for judging statistical signifi cance.
2Instructional rooms include classrooms, computer and other labs, library/media centers, and any other rooms used for instructional purposes.
3This estimate was rounded to 100 percent.
4In 2000 and 2001, respondents were instructed to circle as many types of con-nections as there were in the school. The 2002 and 2003 questionnaires directly asked whether the schools used broadband and narrowband connections. These percentages include schools using only broadband connections, as well as schools using both broadband and narrowband connections. They do not include schools using narrowband connections exclusively. Broadband connections include T3/DS3, fractional T3, T1/DS1, fractional T1, and cable modem connections. In 2001, 2002, and 2003, they also included DSL connections, which had not been an option on the 2000 questionnaire.

E D U C A T I O N S T A T I S T I C S Q U A R T E R L Y — V O L U M E 7, I S S U E S 1 & 2, 2 0 0 5 47
■ In 2003, as in previous years (Kleiner and Lewis 2003), the likelihood of using broadband connec-tions increased with school size, from 90 percent for small schools to nearly 100 percent for large schools.5 In addition, rural schools were less likely than both town and urban fringe schools to have internet access using this type of connection (90 percent compared with 98 and 97 percent, respectively).
■ Thirty-two percent of public schools with internet access used wireless connections in 2003, an increase from 23 percent in 2002.6 In 2003, the proportion of public schools with wireless internet connections increased with school size but decreased as poverty concentration increased. For example, 36 percent of schools with the lowest poverty concentration had wireless connections, compared with 25 percent of schools with the highest poverty concentration. In addition, secondary schools were more likely than elementary schools to use wireless internet connec-tions (42 percent compared with 29 percent).
■ Of the schools using wireless internet connections in 2003, 92 percent indicated that they used broad-band wireless internet connections. Across all school characteristics, the percentage of public schools with wireless connections using broadband wireless inter-net connections ranged from 88 percent to 96 percent.
■ In 2003, 11 percent of all public school instructional rooms had wireless internet connections. This rep-resents a decrease from the previous year, when 15 percent of public school instructional rooms had wireless internet connections.
Computer hardware, software, and internet support
■ The staff position of the person with primary respon-sibility for computer hardware, software, and internet support varied across schools (fi gure 2). Thirty-seven percent of schools indicated that it was a full-time, paid school technology director or coordinator; 27 percent, district staff; 16 percent, a teacher or oth-er staff as part of formal responsibilities; 9 percent, a part-time, paid school technology director or coordi-nator; 3 percent, a consultant or outside contractor; 3 percent, a teacher or other staff as volunteers; and 5 percent, some other position.
5This estimate was rounded to 100 percent.
6A school could use both wireless and wired internet connections. Wireless internet connections can be broadband or narrowband.
Figure 1. Percent of public school instructional rooms with internet access: 1994–2003
NOTE: Percentages are based on all public schools. Information on the number of instructional rooms with internet access was combined with information on the total number of instructional rooms in the school to calculate the percentage of instructional rooms with internet access. All of the estimates in this report were recalculated from raw data fi les using the same computational algorithms. Consequently, some estimates presented here may differ trivially (i.e., 1 percent) from results published prior to 2001. SOURCE: U.S. Department of Education, National Center for Education Statistics, Fast Response Survey System, “Survey on Advanced Telecommunications in U.S. Public Schools, K–12,” FRSS 51, 1994; “Survey on Advanced Telecommunications in U.S. Public Schools, K–12,” FRSS 57, 1995; “Advanced Telecommunications in U.S. Public Schools, Fall 1996,” FRSS 61, 1996; “Internet Access in U.S. Public Schools, Fall 1997,” FRSS 64, 1997; “Internet Access in U.S. Public Schools, Fall 1998,” FRSS 69, 1998; “Internet Access in U.S. Public Schools, Fall 1999,” FRSS 75, 1999; “Internet Access in U.S. Public Schools, Fall 2000,” FRSS 79, 2000; “Internet Access in U.S. Public Schools, Fall 2001,” FRSS 82, 2001; “Internet Access in U.S. Public Schools, Fall 2002,” FRSS 83, 2002; and “Internet Access in U.S. Public Schools, Fall 2003,” FRSS 86, 2003.
Year
Percent
1995 1996 1997 1998 1999 2000 2001 2002 20030
20
40
60
80
100
814
27
51
64
7787
92 93
1994
3
Internet Access in U.S. Public Schools and Classrooms: 1994–2003

N A T I O N A L C E N T E R F O R E D U C A T I O N S T A T I S T I C S48
Elementary and Secondary Education
■ Differences were observed by locale and instructional level. For example, a higher percentage of secondary schools than elementary schools reported that a full-time, paid technology director or coordinator was the person primarily responsible for computer hardware, software, and internet support at the school (44 per-cent compared with 35 percent).
Student access to computers and the Internet
The FRSS surveys on internet access obtained information on various measures of student access to computers and the Internet. Schools reported the number of instructional computers with internet access; this information was then combined with enrollment data to compute the ratio of students to instructional computers with internet access. Schools were also asked about student access to the Internet outside of regular school hours, the provision of hand-held computers to students and teachers, and laptop computer loans to students.
Students per instructional computer with internet access
■ The ratio of students to instructional computers with internet access was computed by dividing the total number of students in all public schools by the total number of instructional computers with internet access in all public schools (including schools with
no internet access).7 In 2003, the ratio of students to instructional computers with internet access in pub-lic schools was 4.4 to 1, a decrease from the 12.1 to 1 ratio in 1998, when it was fi rst measured (fi gure 3).
■ The ratio of students to instructional computers dif-fered by all school characteristics in 2003. For exam-ple, the ratio of students to instructional computers with internet access was higher in schools with the highest poverty concentration than in schools with the lowest poverty concentration (5.1 to 1 compared with 4.2 to 1).
Availability of computers with internet access outside of regular school hours
Past research indicates that 5- to 17-year-olds whose fami-lies were in poverty were less likely to use the Internet at home than 5- to 17-year-olds whose families were not in poverty in 2001 (47 percent compared with 82 percent) (DeBell and Chapman 2003). Making the Internet acces-sible in schools outside of regular school hours allows stu-dents who do not have access to the Internet at home to use this resource for school-related activities such as homework.
7This is one method of calculating students per computer. Another method involves calculating the number of students in each school divided by the number of instruc-tional computers with internet access in each school and then taking the mean of this ratio across all schools. When “students per computer” was fi rst calculated for this NCES series in 1998, a decision was made to use the fi rst method; this method contin-ues to be used for comparison purposes. A couple of factors infl uenced the choice of that particular method. There was (and continues to be) considerable skewness in the distribution of students per computer per school. In addition, in 1998, 11 percent of public schools had no instructional computers with internet access.
Figure 2. Percentage distribution of the staff position of those who were primarily responsible for computer hardware, software, and internet support at the school: 2003
1This category includes consultant/outside contractor, teacher or other staff as volunteers, and other.NOTE: Percentages are based on the public schools with internet access (nearly 100 percent). Detail may not sum to totals because of rounding and not reporting where there are too few cases for a reliable estimate.SOURCE: U.S. Department of Education, National Center for Education Statistics, Fast Response Survey System, “Internet Access in U.S. Public Schools, Fall 2003,” FRSS 86, 2003.
Full-time, paid school technology director/coordinator (37%)
District staff (27%)
Teacher or other staff as part of formal
responsibilities (16%)
Part-time, paid school technology director/
coordinator (9%)
All other1 (11%)

E D U C A T I O N S T A T I S T I C S Q U A R T E R L Y — V O L U M E 7, I S S U E S 1 & 2, 2 0 0 5 49
The FRSS surveys on internet access asked whether schools made instructional computers with internet access avail-able to students outside of regular school hours, when the computers were made available, and the number of comput-ers made available.
■ In 2003, 48 percent of public schools with internet access reported that they made computers with ac-cess to the Internet available to students outside of regular school hours. Differences by school charac-teristics were observed for instructional level and school size. Secondary schools were more likely to make the Internet available to students outside of regular school hours than were elementary schools (69 percent compared with 41 percent). The likeli-hood of internet availability outside of regular school hours increased with school size, from 39 percent for small schools to 74 percent for large schools.
■ Among schools providing computers with internet access to students outside of regular school hours in 2003, 98 percent made them available after school, 71 percent before school, and 9 percent on weekends. The proportion of public schools allowing internet
access to students after school increased from 95 percent in 2001 to 98 percent in 2003.
■ The proportion of public schools allowing students to access the Internet before school was lower in schools with the highest minority enrollment (60 percent) than in schools with the two lowest cate-gories of minority enrollment (80 percent each). A similar pattern occurred by school poverty concentra-tion. Fifty-four percent of schools with the highest poverty concentration had computers with internet access available to students before school, compared with 82 percent and 80 percent of schools with the two lowest categories of poverty concentration.
■ In all public schools, the ratio of students to comput-ers with internet access available outside of regular school hours was 22 to 1 in 2003. This was a de-crease from the 26 to 1 ratio in 2001, when it was fi rst measured.8 Among public schools that allow
Figure 3. Ratio of public school students to instructional computers with internet access: 1998–2003
NOTE: The ratio of students to instructional computers with internet access was computed by dividing the total number of students in all public schools by the total number of instructional computers with internet access in all public schools (including schools with no internet access). All of the estimates in this report were recalculated from raw data fi les using the same computational algorithms. Consequently, some estimates presented here may differ trivially (i.e., 1 percent) from results published prior to 2001. SOURCE: U.S. Department of Education, National Center for Education Statistics, Fast Response Survey System, “Internet Access in U.S. Public Schools, Fall 1998,” FRSS 69, 1998; “Internet Access in U.S. Public Schools, Fall 1999,” FRSS 75, 1999; “Internet Access in U.S. Public Schools, Fall 2000,” FRSS 79, 2000; “Internet Access in U.S. Public Schools, Fall 2001,” FRSS 82, 2001; “Internet Access in U.S. Public Schools, Fall 2002,” FRSS 83, 2002; and “Internet Access in U.S. Public Schools, Fall 2003,” FRSS 86, 2003.
Year
Ratio
1998 1999 2000 2001 2002 20030
2
4
6
8
10
12
1412.1
9.1
6.65.4
4.8 4.4
Internet Access in U.S. Public Schools and Classrooms: 1994–2003
8The ratio of students to computers with internet access available outside of regular school hours was computed by dividing the total number of students in all public schools by the total number of computers with internet access available outside of regular school hours in all public schools (including schools with no internet access and schools that did not make computers with internet access available to students outside of regular school hours).

N A T I O N A L C E N T E R F O R E D U C A T I O N S T A T I S T I C S50
Elementary and Secondary Education
students to access the Internet outside of regular school hours, the ratio of students to computers with internet access available outside of regular school hours was 12 to 1 in 2003, a decrease from 15 to 1 in 2001.
■ Among public schools that allow students to access the Internet outside of regular school hours in 2003, the ratio of students to computers with internet ac-cess available outside of regular school hours differed by school size, locale, and percent minority enroll-ment. For example, schools with the highest percent minority enrollment had more students per computer available outside of regular schools (14 students per computer) than did schools with the lowest percent minority enrollment (10 students per computer).
Provision of hand-held computers
■ In 2003, 10 percent of public schools provided hand-held computers to students or teachers for instruc-tional purposes, an increase from 7 percent in the previous year.9
■ Among schools providing hand-held computers to students or teachers for instructional purposes in 2003, the median number of hand-held computers provided per school was 10 (i.e., half of the schools reported a lower number than 10 and the other half reported a higher number).10
■ In 2003, the proportion of schools that provided hand-held computers to students or teachers for in-structional purposes increased with school size from 5 percent for small schools to 21 percent for large schools. Furthermore, secondary schools were more likely than elementary schools (14 percent compared with 9 percent) to provide hand-held computers to students or teachers for instructional purposes.
Laptop computer loans
Public schools reported whether they lent laptop computers to students, the number of laptops available for loan, and the maximum length of time for which they could be borrowed. Schools that did not lend laptop computers to students were asked about their future plans for such loans; for example,
in 2003 schools were asked whether they planned to lend laptop computers to students in the 2004–05 school year.
■ In 2003, 8 percent of public schools lent laptop computers to students. In those schools, the median number of laptop computers available for loan was 5.11
■ Fifty-seven percent of schools lending laptop com-puters reported that students could borrow them for less than 1 week, 17 percent reported that students could borrow them for a period of 1 week to less than 1 month, 15 percent reported lending laptops for the entire school year, and 8 percent reported lending laptops for some other maximum length of time.
■ Of the 92 percent of schools without laptop comput-ers available for loan to students in 2003, 6 percent were planning to make laptops available for students to borrow during the 2004–05 school year.
School websites
Because nearly 100 percent of public schools were connected to the Internet in 2003,12 schools generally had the capabil-ity to make information available to parents and students directly via e-mail or through a website. Beginning in 2001, the FRSS surveys on internet access asked whether the schools had a website or a web page (e.g., a web page on the district’s website) and how often it was updated.13 In 2002 and 2003, schools also reported the status of the person who was primarily responsible for the school’s website support.14
■ Nationwide, 88 percent of public schools with access to the Internet had a website in 2003. This is an in-crease from 2001, when 75 percent of public schools reported having a website.
■ The proportion of schools with a website in 2003 differed by instructional level, school size, minority enrollment, and poverty concentration. For ex-ample, the likelihood of having a website was lower in schools with the highest minority enrollment of 50 percent or more (80 percent) than in schools with 6 to 20 percent or 21 to 49 percent minority enroll-ment (94 and 90 percent, respectively). In addition,
11This represents a ratio of 1 laptop computer per 27 students. The ratio of students per laptop computer would increase to 31 to 1 if one school in the sample were taken out of the calculation because the school reported a much higher number of laptop computers than any of the other schools in the sample. The number of laptop com-puters at that school was verifi ed with the respondent.
12This estimate was rounded to 100 percent.
13For brevity, “website or web page” is referred to as “website” in the remainder of the report.
14In 2001, the questionnaire asked about the school’s “website.” In 2002, the wording was changed to “website or web page.”
9Hand-held computers are computers, or personal digital assistants, small enough to be held in one hand. Examples are Palm Pilots or Pocket PCs.
10On average, 24 hand-held computers per school were provided to students or teachers in schools that supplied such computers in 2003. The average number of hand-held computers would decrease to 22 if the data for one school in the sample were taken out of the calculation because the school reported a much higher number of hand-held computers than any of the other schools in the sample. The number of hand-held computers at that school was verifi ed with the respondent.

E D U C A T I O N S T A T I S T I C S Q U A R T E R L Y — V O L U M E 7, I S S U E S 1 & 2, 2 0 0 5 51
the likelihood of having a website decreased as the poverty concentration increased, from 96 percent of schools with the lowest poverty concentration to 72 percent of schools with the highest poverty concentration.
■ Of the schools with a website in 2003, 73 percent reported that their website was updated at least monthly.15 Among the 27 percent of schools updat-ing their website less often than monthly, differences were detected by instructional level, locale, minority enrollment, and poverty concentration. For example, schools with the highest minority enrollments were more likely than schools with lower minority enroll-ments to update their website less than monthly (45 percent compared with 18 to 25 percent). In addition, the likelihood of updating the website less than monthly increased with poverty concentration, from 18 percent of schools with the lowest poverty concentration to 44 percent of schools with the high-est poverty concentration.
■ Among schools with a website in 2003, 27 percent reported that a teacher or other staff member was primarily responsible for the school’s website support
as part of his or her formal responsibilities (fi gure 4). Schools were less likely to report that primary respon-sibility was assigned to a full-time, paid school tech-nology director or coordinator (19 percent); a teacher or other staff as volunteers (19 percent); district staff (17 percent); a part-time, paid school technology director or coordinator (5 percent); students (2 percent); or a consultant or an outside contractor (3 percent). Some other person was cited by 8 percent of the schools.
Technologies and procedures to prevent student access to inappropriate material on the Internet
Given the diversity of the information carried on the Inter-net, student access to inappropriate material is a major concern of many parents and teachers. Moreover, under the Children’s Internet Protection Act (CIPA), no school may receive E-rate16 discounts unless it certifi es that it is enforc-ing a policy of internet safety that includes the use of fi ltering or blocking technology.17 Beginning in 2001, the FRSS sur-veys on internet access asked whether public schools used any technologies or procedures to prevent student access to
15This estimate is derived from the percentage of public schools updating their website monthly, weekly, or daily. Although estimates for the details are shown in table 15 in the full report, the total in the text is based on the raw data, and because of rounding it differs slightly from the estimate that would be obtained by adding details directly from the table.
Teacher or other staff as part of formal responsibilities (27%)
Full-time, paid school technology director/coordinator (19%)
Teacher or other staff as volunteers (19%)
District staff (17%)
All other1(18%)
1This category includes part-time, paid school technology director/coordinator, students, consultant/outside contractor, and other.NOTE: Percentages are based on 88 percent of public schools (99.8 percent with internet access x 88 percent with a website or web page).SOURCE: U.S. Department of Education, National Center for Education Statistics, Fast Response Survey System, “Internet Access in U.S. Public Schools, Fall 2003,” FRSS 86, 2003.
Figure 4. Percentage distribution of types of staff and students who were primarily responsible for the school’s website or web page support: 2003
Internet Access in U.S. Public Schools and Classrooms: 1994–2003
16The Education rate (E-rate) program was established in 1996 to make telecom-munications services, internet access, and internal connections available to schools and libraries at discounted rates based upon the income level of the students in their community and whether their location is urban or rural.
17More information about CIPA (Public Law 106-554) can be found at the website of the Schools and Libraries Division, Universal Service Administrative Company (http://www.sl.universalservice.org/reference/CIPA.asp). The law is effective for funding year 4 (July 1, 2001, to June 30, 2002) and for all future years. Schools and libraries receiving only telecommunications services are excluded from the requirements of CIPA.

N A T I O N A L C E N T E R F O R E D U C A T I O N S T A T I S T I C S52
Elementary and Secondary Education
inappropriate material on the Internet, the types of tech-nologies or procedures used, and whether such technologies were used on all computers with internet access used by students. The 2002 and 2003 surveys also asked about the methods used to disseminate information about the tech-nologies or procedures to students and parents.
■ In 2003, almost all public schools with internet access (97 percent) used various technologies or procedures to control student access to inappropriate material on the Internet. Across all school charac-teristics, between 96 and 100 percent18 of schools reported using these technologies or procedures. In addition, 99 percent of these schools used at least one of these technologies or procedures on all internet-connected computers used by students.
■ Among schools using technologies or procedures to prevent student access to inappropriate material on the Internet in 2003, 96 percent used blocking or fi ltering software. Ninety-three percent of schools reported that teachers or other staff members moni-tored student internet access, 83 percent had a writ-ten contract that parents have to sign, 76 percent had a contract that students have to sign, 57 percent used monitoring software, 45 percent had honor codes, and 39 percent allowed access only to their intranet.19 Most of the schools (97 percent) used more than one procedure or technology as part of their internet use policy.
■ Ninety-fi ve percent of public schools using technolo-gies or procedures to prevent student access to inap-propriate material on the Internet indicated that they disseminated the information about these technolo-gies or other procedures via their school policies or rules distributed to students and parents. Sixty-six percent did so with a special notice to parents, 58 per-cent used their newsletters to disseminate this infor-mation, 31 percent posted a message on the school website or web page, 25 percent had a notice on a bulletin board at the school, 17 percent had a pop-up message at computer or internet log-on, and 5 percent used a method other than the ones listed above.
18This estimate was rounded to 100 percent for some school characteristics.
19An intranet is a controlled computer network similar to the Internet but accessible only to those who have permission to use it. For example, school administrators can restrict student access to only their school’s intranet, which may include information from the Internet chosen by school offi cials, rather than full internet access.
Teacher professional development on how to integrate the use of the Internet into the curriculum
Past research indicates that approximately one-half of public school teachers in 1999 reported that they used computers or the Internet for instruction during class time and/or that they assigned their students work that involves research us-ing the Internet. One-third of teachers reported feeling well or very well prepared to use computers and the Internet for instruction (Smerdon et al. 2000). The 2002 and 2003 surveys on internet access asked whether public schools or their districts provided teacher professional development in the 12 months prior to the surveys on how to integrate the use of the Internet into the curriculum, and the percentage of teachers who attended such professional development.
■ In 2003, nationwide, 82 percent of public schools with internet access indicated that their school or school district had offered professional development to teachers in their school on how to integrate the use of the Internet into the curriculum in the 12 months prior to the fall survey.
■ Thirty-eight percent of the schools that offered pro-fessional development in 2003 had 1 to 25 percent of their teachers attending such professional de-velopment in the 12 months preceding the survey. Eighteen percent of the schools had 26 to 50 percent of their teachers, 13 percent of the schools had 51 to 75 percent of their teachers, and 30 percent of the schools had 76 percent or more of their teach-ers attending professional development on how to integrate the use of the Internet into the curriculum in the 12 months preceding the survey. Another 1 percent of schools reported not having any teachers attending such professional development during this time frame.
ReferencesDeBell, M., and Chapman, C. (2003). Computer and Internet Use
by Children and Adolescents in 2001 (NCES 2004-014). U.S. Department of Education. Washington, DC: National Center for Education Statistics.
Heaviside, S., Riggins, T., and Farris, E. (1997). Advanced Telecom-munications in U.S. Public Elementary and Secondary Schools, Fall 1996 (NCES 97-944). U.S. Department of Education. Washing-ton, DC: National Center for Education Statistics.
Kleiner, A., and Farris, E. (2002). Internet Access in U.S. Public Schools and Classrooms: 1994–2001 (NCES 2002-018). U.S. Department of Education. Washington, DC: National Center for Education Statistics.

E D U C A T I O N S T A T I S T I C S Q U A R T E R L Y — V O L U M E 7, I S S U E S 1 & 2, 2 0 0 5 53
Kleiner, A., and Lewis, L. (2003). Internet Access in U.S. Public Schools and Classrooms: 1994–2002 (NCES 2004-011). U.S. Department of Education. Washington, DC: National Center for Education Statistics.
Smerdon, B., Cronen, S., Lanahan, L., Anderson, J., Iannotti, N., and Angeles, J. (2000). Teachers’ Tools for the 21st Century: A Report on Teachers’ Use of Technology (NCES 2000-102). U.S. De-partment of Education, National Center for Education Statistics. Washington, DC: U.S. Government Printing Offi ce.
Data source: The NCES Fast Response Survey System (FRSS), “Internet Access in U.S. Public Schools, Fall 2003, ” (FRSS 86, 2003).
For technical information, see the complete report:
Parsad, B., and Jones, J. (2005). Internet Access in U.S. Public Schools and Classrooms: 1994–2003 (NCES 2005-015).
Author affi liations: B. Parsad and J. Jones, Westat.
For questions about content, contact Bernie Greene ([email protected]).
To obtain the complete report (NCES 2005-015), call the toll-free ED Pubs number (877-433-7827) or visit the NCES Electronic Catalog (http://nces.ed.gov/pubsearch).
Internet Access in U.S. Public Schools and Classrooms: 1994–2003

N A T I O N A L C E N T E R F O R E D U C A T I O N S T A T I S T I C S54
Elementary and Secondary Education
Computer and Internet UseRates of Computer and Internet Use by Children in Nursery School and Students in Kindergarten Through Twelfth Grade: 2003————————————————————————Matthew DeBell
This article was originally published as an Issue Brief. The sample survey data are from the Computer and Internet Use Supplement to the Current Population Survey (CPS), conducted by the U.S. Census Bureau.
The use of computers and the Internet by students has increased rapidly in recent years (U.S. Department of Edu-cation 1999; U.S. Department of Commerce 2002). In 2001, computer and internet use was more widespread among school-age children and adolescents than among adults (DeBell and Chapman 2003). The now commonplace use of these technologies follows the installation of computers and internet access in nearly all public schools and in a major-ity of households with children by 2000 (Kleiner and Lewis 2003; Newburger 2001).
The use of computers and the Internet may improve people’s everyday lives and improve their labor market prospects. Because these technologies have the potential to improve access to information, help to get tasks done better or more quickly, and facilitate communication (see National Research Council 1999), computer and internet use rates may be considered indicators of the standard of living. Also, the use of computers helps students gain experience with this technology, so use rates may indicate how well prepared the current generation of students is to enter a workforce where the ability to use a computer is expected (U.S. Department of Education 1999).
This Issue Brief describes the percentages of students in grades 12 or below who used computers or the Internet in 2003. Data for this Issue Brief come from the October 2003 Computer and Internet Use Supplement to the Cur-rent Population Survey (CPS). The CPS is a sample survey representative of the civilian noninstitutional population in the United States. The survey is conducted in approxi-mately 56,000 households each month. In October 2003 it collected information regarding 29,075 children enrolled in nursery school through 12th grade.1 A member of each household who is at least 15 years old provided information about household members. As a result of this data collec-tion method, data regarding computer and internet use by students were not collected directly from students in most
cases, but from another member of the household; this method is a potential source of error. Computer users are identifi ed by questions that ask if the subject uses comput-ers at home, at work, or at school. Internet users are identi-fi ed by questions that ask if the subject uses the Internet at any location. (For further detail about CPS survey methods, see U.S. Census Bureau 2002.)
As shown in table 1, the majority of students use comput-ers and the Internet.2 Overall, 91 percent used computers and 59 percent used the Internet in 2003. The use of these technologies begins at young ages; 67 percent of children in nursery school were computer users, as were 80 percent of those in kindergarten. About one-quarter (23 percent) of children in nursery school used the Internet, and about one-third (32 percent) of kindergarteners did so. By high school, nearly all students (97 percent) used computers, and a majority (80 percent) used the Internet.
Table 1 shows that the use of these technologies varied by several interrelated characteristics.3 Computer and internet use varied by race/ethnicity, disability status, parent educa-tional attainment, household language, poverty status, and family income. Differences by these characteristics have been found in previous analyses (U.S. Department of Com-merce 1995; U.S. Department of Commerce 1999; Rathbun and West 2003).
Current differences in computer use among students are smaller than those found among adults in previous analyses (e.g., U.S. Department of Commerce 1999), refl ecting the fact that most students now use computers. For example, in 2001, adults with graduate education were four times more likely than adults with less than a high school creden-tial to use computers, and adults living in families making over $75,000 per year were three times as likely as those in families making less than $20,000 per year to use comput-ers, refl ecting differences of 66 and 58 percentage points, re-spectively (DeBell and Chapman 2003). In contrast, in 2003
1The weighted sample represents approximately 58.3 million noninstitutionalized children age 3 and older in nursery school through 12th grade in October 2003. These estimates exclude children in long-term medical care facilities and juvenile detention facilities, as well as those who have dropped out of school. The Current Population Survey defi nes nursery school as a group or class organized to provide education for children before kindergarten. It includes preschool and prekindergarten. For ease of presentation, the population enrolled in nursery school through the 12th grade is referred to as “students” in this Issue Brief.
2Reported usage may involve the cooperation or assistance of an adult or older child, but that information was not collected.
3All differences cited in this report are signifi cant at the .05 level using Student’s t statistic. When analyzing data from large samples, many differences (no matter how substantively minor) can be statistically signifi cant. The discussion is limited to differ-ences of at least 5 percentage points.

E D U C A T I O N S T A T I S T I C S Q U A R T E R L Y — V O L U M E 7, I S S U E S 1 & 2, 2 0 0 5 55
students with a parent with some graduate education were about 1.2 times more likely to use computers than students whose parents had not completed high school, refl ecting a
difference of 13 percentage points (table 1). Students living in families making over $75,000 per year in 2003 were 1.1 times as likely to use computers as those in families making
Table 1. Percentage of children enrolled in grade 12 or below who use computers and the Internet, by child and family/household characteristics: 2003
CharacteristicNumber of students
(in thousands)Percent using
computersPercent using
the Internet
Total 58,273 91 59
Child characteristics
Enrollment levelNursery school1 4,928 67 23Kindergarten 3,719 80 32Grades 1–5 20,043 91 50Grades 6–8 12,522 95 70Grades 9–12 17,062 97 80
SexFemale 28,269 91 61Male 30,005 91 58
Race/ethnicity2
White, non-Hispanic 35,145 93 67Hispanic 10,215 85 44Black, non-Hispanic 8,875 86 47Asian or Pacifi c Islander, non-Hispanic 2,293 91 58American Indian, Aleut, or Eskimo, non-Hispanic 346 86 47More than one race, non-Hispanic 1,400 92 65
Disability statusDisabled 646 82 49Not disabled 47,949 91 61
Family & household characteristics
Parent educational attainment3
Less than high school credential 5,691 82 37High school credential 13,804 89 54Some college 16,548 93 63Bachelor’s degree 8,590 92 67Some graduate education 10,713 95 73
Household languageSpanish-only 2,840 80 28Not Spanish-only 55,434 91 61
Poverty status4
In poverty 10,173 84 40Not in poverty 39,016 93 66
Family incomeUnder $20,000 8,815 85 41$20,000–34,999 9,273 87 50$35,000–49,999 7,499 93 62$50,000–74,999 9,834 93 66$75,000 or more 13,769 95 74
1Data on “nursery school” enrollment may not refl ect enrollment in all kinds of early childhood programs.2American Indian includes Alaska Native, Black includes African American, Asian or Pacifi c Islander includes Native Hawaiian, and Hispanic includes Latino.3Parent educational attainment measures the highest level of education of either of the child’s parents.4Poverty status is derived from household size and income. Households with incomes below the poverty threshold for their household size (as defi ned by the U.S. Census Bureau for 2003) were classifed as poor. Some households reported incomes in a range that straddles the poverty threshold; these households were classifi ed as poor. The 2003 poverty threshold for a four-person household was $18,810. NOTE: Detail may not sum to total due to rounding or missing data. Population estimates in this table apply to children age 3 and older who are enrolled in nursery school or in grades K–12.SOURCE: U.S. Census Bureau, Current Population Survey, October 2003.
Rates of Computer and Internet Use by Children in Nursery School and Students in Kindergarten Through Twelfth Grade: 2003

N A T I O N A L C E N T E R F O R E D U C A T I O N S T A T I S T I C S56
Elementary and Secondary Education
less than $20,000 per year, refl ecting a difference of 9 per-centage points. Thus, these group differences in student computer use are smaller than differences observed among adults in recent years.
Differences in internet use among students are also smaller than some of the differences recently reported for adults. Adults with graduate education in 2001 were fi ve times more likely than adults with less than a high school credential to use the Internet, and adults with family incomes of $75,000 or more were 3.4 times more likely than adults with incomes below $20,000 to use the Internet, refl ecting differences of 68 and 58 percentage points, respectively (DeBell and Chapman 2003). In contrast, in 2003 students with a parent with some graduate education were twice as likely as students whose parents had not completed high school to use the Internet, and students from families with incomes of $75,000 or more were 1.8 times more likely than students from families with incomes below $20,000 to use the Internet. These refl ect dif-ferences of 36 and 33 percentage points, respectively.
Although differences among students in both computer and internet use are smaller than differences among adults, rates of internet use are more varied than rates of computer use. The differences in internet use are at least twice as large as those in computer use when making comparisons based on poverty status, household language, race/ethnicity for Blacks and Whites, and the highest and lowest categories of income and parent educational attainment. For family in-come and parent education, differences in computer use are 9 and 13 percentage points, respectively, while differences in internet use are 33 and 36 points, respectively. Another way of looking at the data is to consider that although most students now use computers, a majority of students with selected characteristics still do not use the Internet. These include students whose family income is under $20,000, students in poverty, students whose parents have less than a high school credential, Black (non-Hispanic) and Hispanic students, and students in households where Spanish is the only language spoken.
Conclusion
The use of computers and the Internet by students is com-monplace and begins early. In upper grade levels, nearly all students use computers and a substantial majority use the Internet. Even before kindergarten, a majority of nursery school children use computers, and 23 percent use the Inter-net. Differences exist in computer use among students, but differences by characteristics such as income and education are smaller—about 9 percentage points between the highest
and lowest income categories and about 13 percentage points between the highest and lowest categories of parental edu-cation—than differences that have been observed among adults. The differences among students are broader for internet use than computer use. Differences between groups by family income and parental education are as large as 33 and 36 percent, respectively, making students from the most advantaged backgrounds about twice as likely to use the Internet as those from the least advantaged backgrounds.
ReferencesDeBell, M., and Chapman, C. (2003). Computer and Internet Use by
Children and Adolescents in the United States, 2001 (NCES 2004-014). U.S. Department of Education. Washington, DC: National Center for Education Statistics.
Kleiner, A., and Lewis, L. (2003). Internet Access in U.S. Public Schools and Classrooms: 1994–2002 (NCES 2004-011). U.S. Department of Education. Washington, DC: National Center for Education Statistics.
National Research Council. (1999). Being Fluent With Information Technology. Washington, DC: Author.
Newburger, E. (2001). Home Computers and Internet Use in the United States: August 2000 (U.S. Census Bureau Special Study P23-207). Washington, DC: U.S. Department of Commerce.
Rathbun, A., and West, J. (2003). Young Children’s Access to Com-puters in the Home and at School in 1999 and 2000 (NCES 2003-036). U.S. Department of Education. Washington, DC: National Center for Education Statistics.
U.S. Census Bureau (2002). Technical Paper 63 Revised: Current Population Survey—Design and Methodology (TP63RV). Wash-ington, DC: U.S. Department of Commerce.
U.S. Department of Commerce. (1995). Falling Through the Net: A Survey of the “Have Nots” in Urban and Rural America. Washing-ton, DC: Author.
U.S. Department of Commerce. (1999). Falling Through the Net: Defi ning the Digital Divide. Washington, DC: U.S. Government Printing Offi ce.
U.S. Department of Commerce. (2002). A Nation Online: How Americans Are Expanding Their Use of the Internet. Washington, DC: Author.
U.S. Department of Education, National Center for Education Sta-tistics. (1999). The Condition of Education 1998 (NCES 98-013). Washington, DC: U.S. Government Printing Offi ce.
Data source: U.S. Census Bureau, Current Population Survey (CPS), October 2003.
For more information on the CPS, visit http://nces.ed.gov/surveys/cps.
Author affi liation: M. DeBell, Education Statistics Services Institute.
For questions about content, contact Chris Chapman ([email protected]).
To obtain this Issue Brief (NCES 2005-111rev), call the toll-free ED Pubs number (877-433-7827) or visit the NCES Electronic Catalog (http://nces.ed.gov/pubsearch).
E D U C A T I O N S T A T I S T I C S Q U A R T E R L Y — V O L U M E 7, I S S U E S 1 & 2, 2 0 0 5 57
Distance Education CoursesDistance Education Courses for Public Elementary and Secondary School Students: 2002–03————————————————————————J. Carl Setzer and Laurie Lewis
This article was originally published as the Summary of the E.D. TAB of the same name. The sample survey data are from “Distance Education Courses for Public Elementary and Secondary School Students: 2002–03,” conducted through the Fast Response Survey System (FRSS).
Background
Nontraditional methods of instructional delivery at the postsecondary level, such as technology-based distance edu-cation course offerings, have been a topic of considerable attention and debate. Research on this topic suggests that distance education course offerings and enrollments have proliferated at postsecondary education institutions within recent years (Lewis, Alexander, and Farris 1997; Lewis et al. 1999; Waits and Lewis 2003). There is also some anecdotal evidence that technology-based education at the elementary and secondary levels enables school districts to expand the range of courses available to their students and may facili-tate more fl exibility in student schedules and instructional delivery (Wildavsky 2001; Doherty 2002; Kennedy-Manzo 2002; Trotter 2002). To date, however, no nationally rep-resentative study has examined technology-based distance education availability, course offerings, and enrollments in the nation’s elementary and secondary schools. To ad-dress this gap, the Offi ce of Educational Technology in the U.S. Department of Education requested the “Distance Education Courses for Public Elementary and Secondary School Students” survey to collect and analyze nationally representative data on technology-based distance educa-tion in public elementary and secondary school districts. It provides baseline data, gathered for the 2002–03 12-month school year, on the prevalence of technology-based distance education courses across the nation, as well as estimated enrollments of public elementary and secondary school stu-dents in these distance education courses. It also identifi es the types of technologies most commonly used for deliver-ing distance education courses. The survey also provides information on districts’ reasons for having distance educa-tion courses and factors districts report that prevent their expansion of distance education course offerings.
The survey was mailed to public school district superin-tendents, who were asked to review the questionnaire and determine the person in the district who was best suited to complete it. Suggested respondents were the director of curriculum, the technology coordinator, or the distance education coordinator. Respondents were provided with a defi nition and description of distance education courses. For this study, distance education courses were defi ned as credit-granting courses offered to elementary and secondary
school students enrolled in the district in which the teacher and students were in different locations. Distance educa-tion courses could originate from the respondent’s district or from other entities, such as a state virtual school or postsecondary institution. These courses could be delivered via audio, video (live or prerecorded), or internet or other computer technologies. Additionally, the distance education courses could include occasional face-to-face interactions between the teacher and the students. Districts were also instructed to include information about distance educa-tion Advanced Placement or college-level courses in which students in their district were enrolled. For purposes of this survey, respondents were instructed to exclude information about supplemental course materials, virtual fi eld trips, on-line homework, staff professional development, or courses conducted mainly via written correspondence.
The survey asked whether there were any public elemen-tary or secondary school students in the district enrolled in distance education courses. Respondents were instructed to report only about distance education enrollments of students regularly enrolled in the district and to include all distance education courses in which students in the district were enrolled, regardless of where the courses originated. If the respondents indicated that there were public elementary or secondary school students in the district enrolled in distance education courses, they were asked to report the number of schools in their district with students enrolled in distance edu-cation courses by instructional level of the school. Respon-dents were also asked to report the number of distance educa-tion course enrollments in schools in their district by instruc-tional level of the school and curriculum area. Other survey items asked which technologies were used as primary modes of instructional delivery for distance education courses, which entities delivered distance education courses, whether any students accessed online distance education courses (and if so, from which locations), and the district’s reasons for having distance education courses. Finally, respondents were asked whether their district had any plans to expand their distance education courses, and if so, which factors, if any, might be keeping them from expanding those courses.
This survey was conducted by the National Center for Education Statistics (NCES) using the Fast Response Survey

N A T I O N A L C E N T E R F O R E D U C A T I O N S T A T I S T I C S58
Elementary and Secondary Education
System (FRSS). FRSS is designed to administer short, focused, issue-oriented surveys that place minimal burden on respondents and have a quick turnaround from data collection to reporting. Questionnaires for the survey were mailed in fall 2003 to a representative sample of 2,305 pub-lic school districts in the 50 states and District of Columbia. The sample was selected from the 2001–02 NCES Common Core of Data (CCD) “Local Education Agency Universe Survey” fi le, which was the most current fi le available at the time of selection. Data have been weighted to yield national estimates. The sampling frame includes 15,218 public school districts—14,229 regular public school districts and 989 “other education agencies” with at least one charter school. The number of districts in the survey universe de-creased to an estimated 15,040 because some of the districts were determined to be ineligible for the FRSS survey during data collection. The unweighted response rate was 94 per-cent and the weighted response rate was 96 percent.
The primary focus of the report is to present national esti-mates. In addition, selected survey fi ndings are presented by the following district characteristics:
■ district enrollment size (less than 2,500, 2,500 to 9,999, 10,000 or more—referred to as small, medium, and large, respectively);
■ metropolitan status (urban, suburban, rural);
■ region (Northeast, Southeast, Central, West); and
■ poverty concentration (less than 10 percent, 10 to 19 percent, 20 percent or more—referred to as low, medium, and high, respectively).
In general, comparisons by these district characteristics are presented only where signifi cant differences were detected and followed meaningful patterns. It is important to note that many of the district characteristics used for inde-pendent analysis may also be related to each other. For example, district enrollment size and metropolitan status are related, with urban districts typically being larger than rural districts. Other relationships between these analysis variables may exist. However, the E.D. TAB focuses on the bivariate relationships between district characteristics and the data gathered in the survey, rather than more complex analyses, to provide descriptive information about technol-ogy-based distance education.
All specifi c statements of comparison made in this report have been tested for statistical signifi cance through t tests and are signifi cant at the 95 percent confi dence level or bet-ter. However, only selected fi ndings are presented for each
topic in the report. Throughout the report, differences that may appear large (particularly those by district characteris-tics) may not be statistically signifi cant. This may be due to relatively large standard errors surrounding the estimates, particularly among subgroups.
Selected Findings
The fi ndings in this report are organized as follows:
■ distance education courses for public school students;
■ technologies used for delivering distance education courses;
■ entities delivering distance education courses;
■ reasons for having distance education courses; and
■ future expansion of distance education courses.
Distance education courses for public school students
The survey asked whether there were any public elemen-tary or secondary school students in the district enrolled in distance education courses in 2002–03 (12-month school year). Districts with students enrolled in distance education courses were asked to indicate the number of schools with at least one student enrolled in distance education courses and the number of enrollments in distance education courses of students regularly enrolled in the district.
Prevalence of distance education courses in public school districts
■ During the 2002–03 12-month school year, about one-third of public school districts (36 percent) had students in the district enrolled in distance education courses. This represents an estimated 5,500 out of a total of 15,040 public school districts.
■ A greater proportion of large districts than medium or small districts had students enrolled in distance education courses (50 vs. 32 and 37 percent, respec-tively). In addition, a greater proportion of districts located in rural areas than in suburban or urban areas indicated that they had students enrolled in distance education courses (46 compared with 28 and 23 per-cent, respectively).
■ A greater proportion of districts located in the South-east and Central regions had students enrolled in distance education courses than did districts in the Northeast and West (45 and 46 percent compared with 21 and 32 percent). The proportion of districts with students enrolled in distance education courses was lower in the Northeast than in other regions (21 vs. 32 to 46 percent).
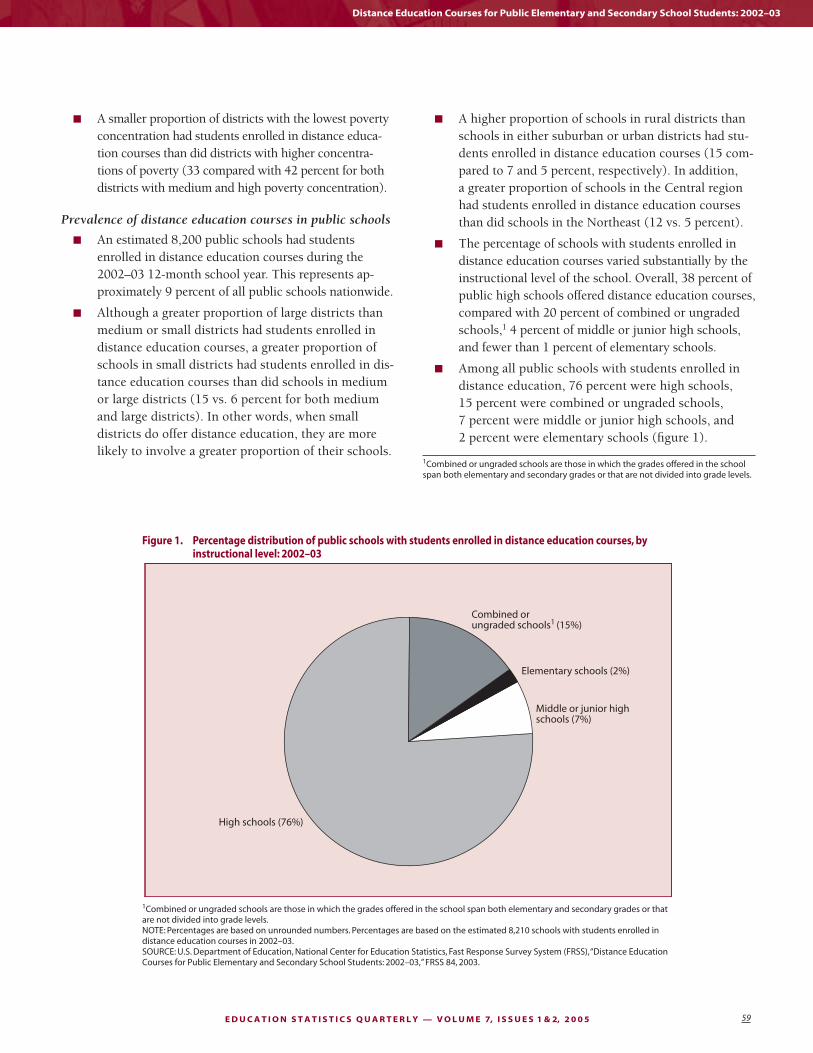
E D U C A T I O N S T A T I S T I C S Q U A R T E R L Y — V O L U M E 7, I S S U E S 1 & 2, 2 0 0 5 59
■ A smaller proportion of districts with the lowest poverty concentration had students enrolled in distance educa-tion courses than did districts with higher concentra-tions of poverty (33 compared with 42 percent for both districts with medium and high poverty concentration).
Prevalence of distance education courses in public schools
■ An estimated 8,200 public schools had students enrolled in distance education courses during the 2002–03 12-month school year. This represents ap-proximately 9 percent of all public schools nationwide.
■ Although a greater proportion of large districts than medium or small districts had students enrolled in distance education courses, a greater proportion of schools in small districts had students enrolled in dis-tance education courses than did schools in medium or large districts (15 vs. 6 percent for both medium and large districts). In other words, when small districts do offer distance education, they are more likely to involve a greater proportion of their schools.
■ A higher proportion of schools in rural districts than schools in either suburban or urban districts had stu-dents enrolled in distance education courses (15 com-pared to 7 and 5 percent, respectively). In addition, a greater proportion of schools in the Central region had students enrolled in distance education courses than did schools in the Northeast (12 vs. 5 percent).
■ The percentage of schools with students enrolled in distance education courses varied substantially by the instructional level of the school. Overall, 38 percent of public high schools offered distance education courses, compared with 20 percent of combined or ungraded schools,1 4 percent of middle or junior high schools, and fewer than 1 percent of elementary schools.
■ Among all public schools with students enrolled in distance education, 76 percent were high schools, 15 percent were combined or ungraded schools, 7 percent were middle or junior high schools, and 2 percent were elementary schools (fi gure 1).
Distance Education Courses for Public Elementary and Secondary School Students: 2002–03
Figure 1. Percentage distribution of public schools with students enrolled in distance education courses, by instructional level: 2002–03
High schools (76%)
Combined orungraded schools1 (15%)
Elementary schools (2%)
Middle or junior high schools (7%)
1Combined or ungraded schools are those in which the grades offered in the school span both elementary and secondary grades or that are not divided into grade levels.NOTE: Percentages are based on unrounded numbers. Percentages are based on the estimated 8,210 schools with students enrolled in distance education courses in 2002–03. SOURCE: U.S. Department of Education, National Center for Education Statistics, Fast Response Survey System (FRSS), “Distance Education Courses for Public Elementary and Secondary School Students: 2002–03,” FRSS 84, 2003.
1Combined or ungraded schools are those in which the grades offered in the school span both elementary and secondary grades or that are not divided into grade levels.

N A T I O N A L C E N T E R F O R E D U C A T I O N S T A T I S T I C S60
Elementary and Secondary Education
Distance education enrollments by instructional level
■ In 2002–03, there were an estimated 328,000 enroll-ments in distance education courses among students regularly enrolled in public school districts.2 If a student was enrolled in multiple courses, districts were instructed to count the student for each course in which he or she was enrolled. Thus, enrollments may include duplicated counts of students.
■ Of the total enrollments in distance education courses, 68 percent were in high schools, 29 percent were in combined or ungraded schools, 2 percent were in middle or junior high schools, and 1 percent3 were in elementary schools (fi gure 2).
Distance education enrollments by curriculum area
■ Distance education enrollments in various curricular areas ranged from an estimated 8,200 in general ele-
mentary school curriculum and 11,700 in computer science to 74,600 in social studies/social sciences.
■ About one-quarter (23 percent) of all enrollments in distance education courses of students regularly enrolled in the districts were in social studies/social sciences, 19 percent were in English/language arts, 15 percent were in mathematics, 12 percent were in natural/physical science, 12 percent were in foreign languages, and 14 percent were in other unspecifi ed curriculum areas. Enrollments in general elementary school curriculum and computer science accounted for the smallest proportions of distance education enrollments (3 and 4 percent, respectively).
■ The proportion of students enrolled in foreign language distance education courses was greater for small districts compared to medium or large districts (19 vs. 11 and 6 percent, respectively). Furthermore, the proportion of students enrolled in foreign lan-guage distance education courses was greater for rural districts than for suburban or urban districts (22 vs. 10 and 5 percent, respectively).
Figure 2. Percentage distribution of enrollments in distance education courses of students regularly enrolled in the districts, by instructional level: 2002–03
Highschools(68%)
Combined orungradedschools2
(29%)
Elementaryschools1
(1%)
Middle orjunior high
schools(2%)
1Interpret data with caution. The coeffi cient of variation for elementary schools is greater than 50 percent.2Combined or ungraded schools are those in which the grades offered in the school span both elementary and secondary grades or that are not divided into grade levels.NOTE: Percentages are based on unrounded numbers. Percentages are based on the estimated 327,670 enrollments in distance education courses in 2002–03. SOURCE: U.S. Department of Education, National Center for Education Statistics, Fast Response Survey System (FRSS), “Distance Education Courses for Public Elementary and Secondary School Students: 2002–03,” FRSS 84, 2003.
2To put this number into context, NCES reported 47,222,778 students enrolled in pub-lic elementary and secondary schools in fall 2000. It is important to note that distance education enrollments collected in the FRSS survey may include duplicated counts of students (i.e., the number of students enrolled in distance education courses could be smaller than the estimated 328,000 enrollments in distance education courses), while the NCES estimate of 47,222,778 students enrolled in public elementary and second-ary schools is an unduplicated count (Snyder and Hoffman 2003, p. 51).
3Interpret data with caution. The coeffi cient of variation for elementary schools is greater than 50 percent.

E D U C A T I O N S T A T I S T I C S Q U A R T E R L Y — V O L U M E 7, I S S U E S 1 & 2, 2 0 0 5 61
Advanced placement or college-level courses offered through distance education
■ Fifty percent of the districts with students enrolled in distance education courses had students enrolled in Advanced Placement or college-level courses offered through distance education in 2002–03. This repre-sents an estimated 2,700 districts.
■ There were an estimated 45,300 enrollments in Advanced Placement or college-level courses offered through distance education in 2002–03. This repre-sents 14 percent of the total enrollments in distance education.
■ The proportion of all distance education enrollments in Advanced Placement or college-level distance edu-cation courses was greater in small districts compared to medium or large districts (24 vs. 10 and 7 percent, respectively).
■ The proportion of all distance education enrollments in Advanced Placement or college-level distance edu-cation courses was greater in rural districts compared to urban or suburban districts (27 vs. 4 and 11 per-cent, respectively). Additionally, suburban districts had a higher proportion (11 percent) of all distance education enrollments in Advanced Placement or college-level distance education courses than urban districts (4 percent).
Technologies used for delivering distance education courses
Districts that reported offering distance education courses were asked about the types of technologies used as primary modes of instructional delivery for any distance education courses in which students in the district were enrolled. The technologies included internet courses using synchronous (i.e., simultaneous or “real-time”) computer-based instruc-tion, internet courses using asynchronous (i.e., not simul-taneous) computer-based instruction, two-way interactive video, one-way prerecorded video, and other technologies. Districts were also asked about online distance education courses, including where students were accessing distance education courses, and whether the district provided or paid for specifi c services (i.e., computer, internet service provider, other) for students accessing online distance education courses from home.
Technologies used as primary modes of instructional delivery
■ More districts reported two-way interactive video (55 percent) or internet courses using asynchro-nous computer-based instruction (47 percent) than
internet courses using synchronous computer-based instruction (21 percent), one-way prerecorded video (16 percent), or some other technology (4 percent) as a primary mode of delivery.4
■ In small districts, two-way interactive video was the technology most often cited as a primary instruc-tional delivery mode for distance education courses (60 percent vs. 5 to 42 percent for all remaining technologies). However, in both medium and large districts, internet courses using asynchronous com-puter-based instruction was the technology most often cited as a primary delivery mode (60 percent vs. 3 to 44 percent for all remaining technologies in medium districts; 72 percent vs. 6 to 33 percent for all remaining technologies in large districts).
■ In both urban and suburban districts, internet courses using asynchronous computer-based instruc-tion was the technology cited most often as a primary instructional delivery mode for distance education courses (69 percent vs. 3 to 38 percent for all remain-ing technologies in urban districts; 58 percent vs. 4 to 39 percent for all remaining technologies in suburban districts). However, in rural districts, two-way inter-active video was the technology cited most often as a primary delivery mode (64 vs. 5 to 40 percent for all remaining technologies).
■ When asked which technology was used to deliver the greatest number of distance education courses, 49 percent of districts selected two-way interac-tive video, more than any other technology. Thirty-fi ve percent of districts selected internet courses using asynchronous computer-based instruction, 9 percent selected internet courses using synchro-nous computer-based instruction, 7 percent selected one-way prerecorded video, and 1 percent selected other technologies (fi gure 3).
Online distance education courses
■ Fifty-nine percent of districts with students enrolled in distance education courses had students enrolled in online distance education courses (i.e., courses delivered over the Internet) in 2002–03.
■ A greater proportion of large districts than medium or small districts had students enrolled in online distance education courses (80 vs. 71 and 53 percent, respectively). Medium districts also had a greater
4Percentages sum to more than 100 because some districts used different types of technology as primary modes of instructional delivery for different distance education courses.
Distance Education Courses for Public Elementary and Secondary School Students: 2002–03

N A T I O N A L C E N T E R F O R E D U C A T I O N S T A T I S T I C S62
Elementary and Secondary Education
proportion of students enrolled in online distance education courses than small districts (71 vs. 53 per-cent). In addition, a smaller proportion of rural dis-tricts than suburban or urban districts had students enrolled in online distance education courses (51 vs. 71 and 74 percent, respectively).
■ Of those districts with students enrolled in online distance education courses, 92 percent had students accessing online courses from school, 60 percent had students accessing online courses from home, and 8 percent had students accessing online courses from some other location.5
■ A greater proportion of large districts than medium or small districts had students accessing online distance education courses from home (77 vs. 66 and 55 percent, respectively). Furthermore, a greater proportion of medium districts than small districts had students accessing online distance education
courses from home (66 vs. 55 percent). In addition, the proportion of rural districts with students access-ing online distance education courses from home was less than the proportion of suburban and urban districts with students accessing online courses from home (53 vs. 67 and 78 percent, respectively). No differences were detected in online access from home by poverty concentration.
■ Among districts with students accessing online distance education courses from home, 24 percent provided or paid for a computer for all students and 8 percent did so for some students. Additionally, 27 percent provided or paid for the internet service provider for all students and 7 percent did so for some students. Finally, 6 percent provided or paid for some other item (e.g., software programs, phone service for dial-up internet service) for all students and 2 percent did so for some students.
5Percentages sum to more than 100 because students in districts could access online courses from more than one location.
Figure 3. Percentage distribution of districts reporting that various technologies were used for the greatest number of distance education courses in which students in their district were enrolled: 2002–03
Two-way interactive
video1 (49%)
One-way prerecorded video (7%)
Othertechnologies3
(1%)
Internet courses usingsynchronous computer-based instruction2 (9%)
Internet courses using asynchronous computer-based instruction2 (35%)
1Two-way interactive video refers to two-way video with two-way audio. 2Asynchronous is not simultaneous, whereas synchronous is defi ned as simultaneous or “real-time” interaction.3Other technologies mentioned included teleconferencing, CD-ROM, and other software packages.NOTE: Percentages are based on unrounded numbers. Percentages are based on the estimated 5,480 districts with students enrolled in distance education courses in 2002–03. Detail may not sum to totals because of rounding.SOURCE: U.S. Department of Education, National Center for Education Statistics, Fast Response Survey System (FRSS), “Distance Education Courses for Public Elementary and Secondary School Students: 2002–03,” FRSS 84, 2003.

E D U C A T I O N S T A T I S T I C S Q U A R T E R L Y — V O L U M E 7, I S S U E S 1 & 2, 2 0 0 5 63
■ A greater proportion of small districts than medium or large districts provided or paid for computers for all students (29 vs. 17 and 11 percent, respectively). Simi-larly, a greater proportion of small districts than medi-um or large districts provided or paid for an internet service provider for all students (32 vs. 20 and 15 per-cent, respectively). In addition, the proportion of rural districts that provided or paid for computers for all students was greater than the proportion of suburban or urban districts that provided or paid for computers for all students (33 vs. 16 and 9 percent, respectively).
Entities delivering distance education courses
Districts that reported offering distance education courses were asked which entities delivered distance education courses to students regularly enrolled in their district. Entities included
■ a cyber (i.e., online) charter school in the district;
■ other schools in the district;
■ their district (i.e., delivered centrally from the district);
■ another local school district, or schools in another district, in their state;
■ education service agencies within their state (e.g., Board of Cooperative Educational Services [BOCES], Council on Occupational Education [COE], Interme-diate Units [IU]), not including the state education agency or local school districts;
■ a state virtual school in their state (i.e., state-central-ized K–12 courses available through internet- or web-based methods);
■ a state virtual school in another state;
■ districts or schools in other states (other than state virtual schools);
■ a postsecondary institution;
■ an independent vendor; and
■ other entities.
Districts were also asked whether they delivered distance education courses to students who were not regularly en-rolled in their district (e.g., to students from other districts, private school students, or homeschooled students).
Entities delivering courses
■ Of those districts with students enrolled in distance education courses in 2002–03, about half (48 per-cent) had students enrolled in distance education courses delivered by a postsecondary institution.
Thirty-four percent of districts had students enrolled in distance education courses delivered by another local school district, or schools in other districts, within their state. Eighteen percent of districts had students enrolled in distance education courses delivered by education service agencies within their state, 18 percent by a state virtual school within their state, and 18 percent by an independent vendor. Sixteen percent of districts had students enrolled in distance education courses delivered centrally from their own district. Eight percent of districts had stu-dents enrolled in distance education courses deliv-ered by other schools in the district (other than cyber charter schools). The proportion of school districts delivering distance education courses through vari-ous other entities ranged from 3 to 4 percent.
■ A greater proportion of large districts than medium or small districts had students enrolled in distance education courses delivered by other schools in the district (28 vs. 15 and 5 percent, respectively). Medi-um districts also had a greater proportion of students enrolled in distance education courses delivered by other schools in the district than small districts (15 vs. 5 percent). Additionally, a greater propor-tion of urban districts than either suburban or rural districts had students enrolled in distance education courses delivered by other schools in the district (25 vs. 9 and 6 percent, respectively).
■ A greater proportion of small districts than medium or large districts had students enrolled in distance education courses delivered by another local school district, or schools in other districts, within their state (39 percent vs. 25 and 13 percent, respective-ly). Furthermore, a greater proportion of medium districts than large districts had students enrolled in distance education courses delivered by another local school district, or schools in other districts, within their state (25 vs. 13 percent). Additionally, there were more rural districts than either suburban or urban districts that had students enrolled in distance education courses delivered by another local school district, or schools in other districts, within their state (40 percent vs. 25 and 20 percent, respectively).
■ A smaller proportion of small districts than medium or large districts had students enrolled in distance education courses delivered by a state virtual school in their state (15 vs. 27 percent each, respectively). Additionally, a greater proportion of districts in the Southeast than in other regions had students enrolled
Distance Education Courses for Public Elementary and Secondary School Students: 2002–03

N A T I O N A L C E N T E R F O R E D U C A T I O N S T A T I S T I C S64
Elementary and Secondary Education
in distance education courses delivered by a state virtual school in their state (43 vs. 6 to 17 percent).
■ A greater proportion of small districts than medium or large districts had students enrolled in distance education courses delivered by postsecondary insti-tutions (54 vs. 30 and 33 percent, respectively). In addition, there was a smaller proportion of urban districts than suburban or rural districts that had students enrolled in distance education courses delivered by postsecondary institutions (22 vs. 44 and 53 percent, respectively).
■ There was a greater proportion of large districts than small districts with students enrolled in distance education courses delivered by independent vendors (28 vs. 16 percent). Compared to rural districts, both urban and suburban districts had greater proportions of students enrolled in distance education courses delivered by independent vendors (15 vs. 29 and 23 percent, respectively).
Delivery of courses to students not regularly enrolled in the district
■ During the 2002–03 12-month school year, about one-fi fth (21 percent) of districts that offered distance education delivered courses to students who were not regularly enrolled in the district (e.g., to students from other districts, private school students, or homeschooled students).
■ A smaller proportion of districts in the Southeast than in the Northeast or Central regions delivered distance education courses to students not regularly enrolled in the district (13 vs. 29 and 22 percent, respectively).
Reasons for having distance education courses
Districts who reported offering distance education courses were asked how important various reasons were for hav-ing distance education courses in the district in 2002–03. Reasons included offering courses not otherwise available at the school, offering Advanced Placement or college-level courses, addressing growing populations and limited space, reducing scheduling confl icts for students, permitting stu-dents who failed a course to take it again, meeting the needs of specifi c groups of students, and generating more district revenues.6
■ The reason most frequently cited as very important for having distance education courses in the district was offering courses not otherwise available at the school (80 percent). Other reasons frequently cited as very important were meeting the needs of specifi c groups of students (59 percent) and offering Advanced Placement or college-level courses (50 percent). Reducing scheduling confl icts for students was men-tioned as very important by 23 percent of districts. The remaining reasons were listed as very important by 4 to 17 percent of districts.
■ Generating more district revenues as well as address-ing growing populations and limited space were rated as not important more often than other reasons for having distance education courses (77 and 72 percent, respectively, vs. 9 to 64 percent).
■ A greater proportion of small districts than medium or large districts rated offering courses not otherwise available at the school as a somewhat or very impor-tant reason for having distance education (93 vs. 86 and 82 percent, respectively). In addition, a greater proportion of rural districts than urban or suburban districts considered this to be a somewhat or very im-portant reason for offering distance education courses (95 vs. 79 and 86 percent, respectively).
■ A greater proportion of high-poverty districts than medium- or low-poverty districts rated meeting the needs of specifi c groups of students as a somewhat or very important reason for having distance education (88 vs. 79 and 80 percent, respectively).
■ A greater proportion of small districts than medium or large districts rated offering Advanced Placement or college-level courses as a somewhat or very impor-tant reason for having distance education (74 vs. 54 and 59 percent, respectively). In addition, a greater proportion of rural districts than urban or suburban districts cited this as a somewhat or very important reason for having distance education (76 vs. 49 and 59 percent, respectively).
■ A greater proportion of large districts than medium or small districts cited reducing scheduling confl icts for students as a somewhat or very important reason for having distance education (70 vs. 52 and 56 per-cent, respectively).
■ A greater proportion of large districts than medium or small districts reported permitting students who failed a course to take it again as a somewhat or very important reason for having distance education (50 vs. 34 and 30 percent, respectively). In addition,
6Although respondents were able to specify some other reason for having distance education, the only available options for this response were somewhat important and very important. Therefore, these “other” responses are not discussed further.
E D U C A T I O N S T A T I S T I C S Q U A R T E R L Y — V O L U M E 7, I S S U E S 1 & 2, 2 0 0 5 65
a greater proportion of urban districts than suburban or rural districts cited this reason as somewhat or very important for having distance education (47 vs. 33 and 31 percent, respectively).
■ A greater proportion of large districts than medium or small districts rated addressing growing popula-tions and limited space as a somewhat or very impor-tant reason for having distance education (44 vs. 33 and 21 percent, respectively). Furthermore, a smaller proportion of small districts than medium districts rated this as a somewhat or very important reason for having distance education (21 vs. 33 percent).
■ A greater proportion of high-poverty districts than low-poverty districts cited generating more district revenues as a somewhat or very important reason for having distance education (21 vs. 11 percent).
Future expansion of distance education courses
Districts that reported offering distance education courses were asked whether they planned to expand their distance education courses in the future. Those districts that planned to expand were asked about the extent to which various factors, if any, might be keeping them from expanding distance education courses. The factors included course development and/or purchasing costs; limited technologi-cal infrastructure to support distance education; concerns about course quality; restrictive federal, state, or local laws or policies; concerns about receiving funding based on student attendance for distance education courses; or some other reason.
■ Seventy-two percent of districts with students enrolled in distance education courses planned to ex-pand their distance education courses in the future. No differences were detected by district characteris-tics in plans to expand distance education courses.
■ Costs were cited as a major factor more often than any other factor as preventing districts from expand-ing their distance education courses. Thirty-six per-cent of districts that were planning to expand their distance education courses selected course devel-opment and/or purchasing costs as a major factor preventing their expansion.
■ Fifty-four percent of districts that were planning to expand their distance education courses said restric-tive federal, state, or local laws or policies were not a factor preventing them from expanding. In addition,
districts said the following were not factors prevent-ing them from expanding distance education courses: limited technological infrastructure to support dis-tance education (41 percent), concerns about receiv-ing funding for distance education courses based on student attendance (40 percent), and concerns about course quality (30 percent).
■ Among public school districts with plans to expand their distance education courses, approximately two-thirds (68 percent) said course development and/or purchasing costs were a moderate or major factor keeping the district from expanding distance edu-cation courses, followed by concerns about course quality (37 percent); concerns about receiving fund-ing for distance education courses based on atten-dance (36 percent); limited infrastructure to support distance education (33 percent); restrictive federal, state, or local laws or policies (17 percent); and some other reason (10 percent) (fi gure 4).
■ A greater proportion of urban districts than rural districts cited restrictive federal, state, or local laws or policies as a major or moderate factor prevent-ing expansion of distance education courses (30 vs. 15 percent). Additionally, a greater proportion of urban districts than suburban or rural districts cited receiving funding based on attendance for distance education courses as a major or moderate factor pre-venting them from expanding (54 vs. 38 and 34 per-cent, respectively).
■ A smaller proportion of districts in the Northeast than in other regions cited receiving funding based on attendance for distance education courses as a major or moderate factor preventing expansion (20 vs. 36 to 43 percent).
ReferencesDoherty, K.M. (2002, May 9). Students Speak Out. Education
Week. Retrieved December 12, 2002, from http://counts.edweek.org/sreports/tc02/article.cfm?slug=35fl orida.h21.
Kennedy-Manzo, K. (2002, May 9). Sizing Up Online Content. Education Week. Retrieved December 12, 2002, from http://counts.edweek.org/sreports/tc02/article.cfm?slug=35curric.h21.
Lewis, L., Alexander, D., and Farris, E. (1997). Distance Education in Higher Education Institutions (NCES 98-062). U.S. Department of Education. Washington, DC: National Center for Education Statistics.
Lewis, L., Snow, K., Farris, E., and Levin, D. (1999). Distance Edu-cation at Postsecondary Education Institutions: 1997–98 (NCES 2000-013). U.S. Department of Education. Washington, DC: National Center for Education Statistics.
Distance Education Courses for Public Elementary and Secondary School Students: 2002–03

N A T I O N A L C E N T E R F O R E D U C A T I O N S T A T I S T I C S66
Elementary and Secondary Education
Data source: The NCES Fast Response Survey System (FRSS), “Distance Education Courses for Public Elementary and Secondary School Students: 2002–03,” FRSS 84, 2003 .
For technical information, see the complete report:
Setzer, J.C., and Lewis, L. (2005). Distance Education Courses for Public Elementary and Secondary School Students: 2002–03 (NCES 2005-010).
Author affi liations: J.C. Setzer and L. Lewis, Westat.
For questions about content, contact Bernie Greene ([email protected]).
To obtain the complete report (NCES 2005-010), call the toll-free ED Pubs number (877-433-7827) or visit the NCES Electronic Catalog (http://nces.ed.gov/pubsearch).
Snyder, T.D., and Hoffman, C.M. (2003). Digest of Education Sta-tistics, 2002 (NCES 2003-060). U.S. Department of Education, National Center for Education Statistics. Washington, DC: U.S. Government Printing Offi ce.
Trotter, A. (2002, May 9). E-Learning Goes to School. Education Week. Retrieved December 12, 2002, from http://counts.edweek.org/sreports/tc02/article.cfm?slug=35elearn.h21.
Waits, T., and Lewis, L. (2003). Distance Education at Degree-Granting Postsecondary Institutions: 2000–2001 (NCES 2003-017). U.S. Department of Education, National Center for Edu-cation Statistics. Washington, DC: U.S. Government Printing Offi ce.
Wildavsky, B. (2001, October 15). Want More From High School? usnews.com. Retrieved October 21, 2002, from http://www.usnews.com/usnews/edu/articles/011015/archive_011072.htm.
Figure 4. Percent of districts indicating that various factors were preventing them from expanding distance education courses to a moderate or major extent: 2002–03
Coursedevelopment
and/orpurchasing
costs
Percent
Concernsaboutcoursequality
68
37 3633
17
10
Concernsabout
receivingfunding basedon attendance
for distanceeducation
courses
Limitedinfrastructure
to supportdistance
education
Restrictivefederal,state, or
local lawsor policies
Other10
20
40
60
80
100
1Other responses mentioned included scheduling confl icts, staffi ng issues, and lack of need.NOTE: Percentages are based on unrounded numbers. Percentages are based on the estimated 3,960 districts that indicated they were planning to expand distance education courses.SOURCE: U.S. Department of Education, National Center for Education Statistics, Fast Response Survey System (FRSS), “Distance Education Courses for Public Elementary and Secondary School Students: 2002–03,” FRSS 84, 2003.
E D U C A T I O N S T A T I S T I C S Q U A R T E R L Y — V O L U M E 7, I S S U E S 1 & 2, 2 0 0 5 67
In recent years, U.S. public school teachers have seen the level of education technology in their schools and class-rooms increase substantially. From 1994 to 2002, the percentage of public schools with access to the Internet increased from 35 to 99 percent. Furthermore, in 2001–02, 87 percent of public schools with internet access reported that professional development on how to integrate the use of the Internet into the curriculum was available to teachers (Kleiner and Lewis 2003).
Despite regular reports of increasing school-level access to computers and technology, little national-level data is available on teacher opinions regarding the availability and usefulness of the technology in their classrooms. This Issue Brief uses data from the 2000–01 Teacher Follow-up Survey (TFS) to examine teacher views on the technology in their classrooms.* Specifi cally, teachers reported which types of technology they considered essential for teaching and whether they felt such technology was suffi ciently available in their classrooms.
Which Types of Classroom Technology Do Teachers Consider to Be Essential?
In 2000–01, teachers reported on the types of technol-ogy—regardless of availability—they considered essential for teaching. Topping the list were types of technology that reached outside the classroom. A “teacher’s computer station with access to electronic mail” was most frequently reported as “essential” (68 percent) (fi gure 1). Following e-mail, classroom access to the World Wide Web (61 per-cent), a telephone in the classroom (56 percent), encyclope-dias and other reference materials on CD-ROM (51 per-cent), and the presence of at least one computer for every four students (49 percent) were the items most frequently reported as essential. Following those items, 35 percent of teachers reported presentation software (e.g., PowerPoint) as essential. The items least frequently reported as essential were multimedia authoring programs (e.g., HyperCard), full-page scanners, and video cameras (21 percent, 20 per-cent, and 18 percent, respectively).
Do Teachers Feel Technology Is Suffi ciently Available in Their Classrooms?
Teachers also reported on the availability of technology in their classrooms. In 2000–01, a majority of teachers (57 percent) agreed with the statement “Computers and other technology for my classroom(s) were suffi ciently available.” Of all teachers, 25 percent “strongly” agreed that this was the case. However, 35 percent of all teachers disagreed with the statement, including 15 percent who “strongly” disagreed (fi gure 2).
Teachers’ familiarity with computers was related to whether they agreed that classroom technology was suffi ciently available. Of the teachers who considered themselves “rea-sonably familiar and comfortable with using computers,” 60 percent agreed that technology was suffi ciently available in their classrooms, compared with 48 percent of those who did not report being “reasonably familiar and comfortable with using computers” (table 1). Also, teacher participation in technology-related professional development was related to views on classroom technology. Forty-seven percent of teachers who did not participate in this type of professional development agreed that classroom technology was suffi -ciently available, compared with 65 percent of teachers who had up to 16 hours and 61 percent of teachers who had 17 or more hours.
The presence of computers in the classroom was also re-lated to teacher reports of suffi cient availability of technol-ogy. Some 69 percent of teachers with a student-to-com-puter ratio of less than 4 agreed that classroom technology was suffi ciently available. In contrast, 39 percent of teach-ers without classroom computers for students agreed that classroom technology was suffi ciently available (table 1). In general, as the ratio of students to computers increased, teachers’ dissatisfaction with the available classroom tech-nology increased.
Conclusion
By presenting national data on teacher opinions on technol-ogy, this Issue Brief adds a new perspective to the literature on the proliferation of education technology. In 2000–01, technologies that allowed teachers to communicate with others or access resources outside the classroom (e-mail, the World Wide Web, and telephone) were among the most
*The TFS sampling frame consists of all eligible teachers who responded to the Schools and Staffi ng Survey (SASS) teacher questionnaires in 1999–2000. Analyses in this Issue Brief are based on data from the 4,153 public and charter school teachers in the 2000–01 TFS sample—a subsample of those 1999–2000 SASS respondents who continued teaching—representing a target population of 3.1 million teachers. All differences discussed in this Issue Brief are statistically signifi cant at the .05 level as measured by two-tailed Student’s t tests. Bonferroni adjustments were made to control for multiple comparisons where appropriate.
Technology in the ClassroomComputer Technology in the Public School Classroom: Teacher Perspectives————————————————————————Lawrence Lanahan and Janet Boysen
This article was originally published as an Issue Brief. The sample survey data are from the Teacher Follow-up Survey (TFS).
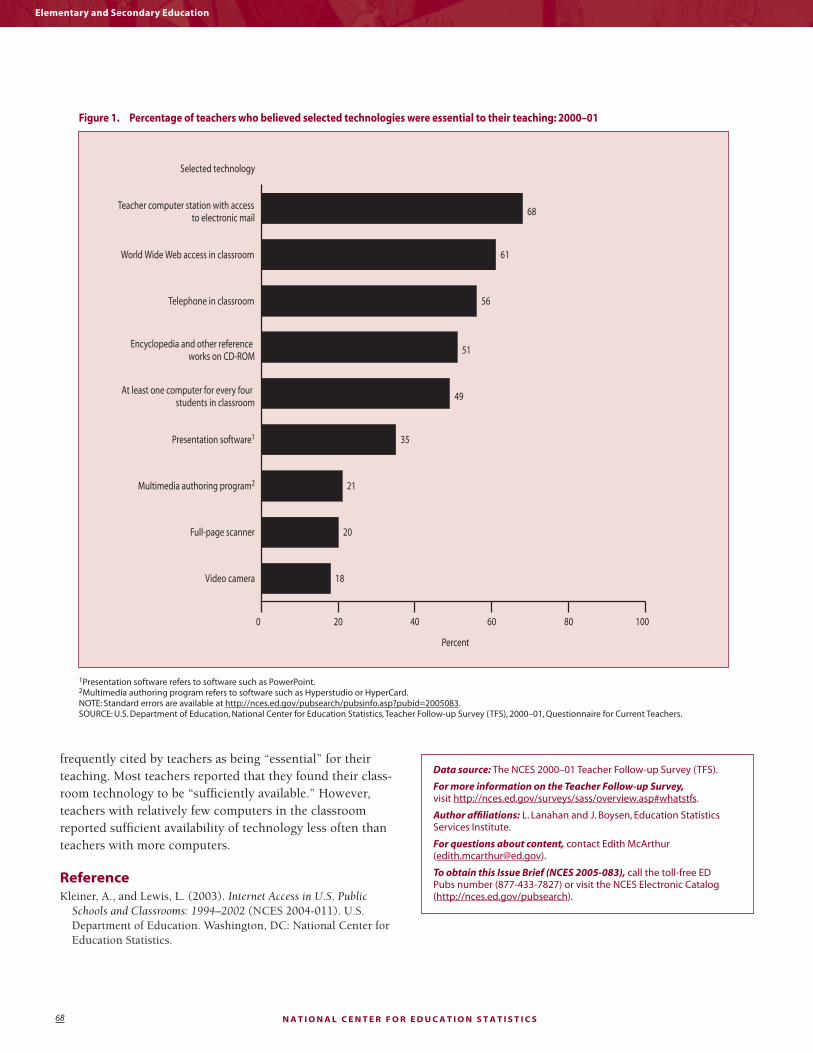
N A T I O N A L C E N T E R F O R E D U C A T I O N S T A T I S T I C S68
Elementary and Secondary Education
frequently cited by teachers as being “essential” for their teaching. Most teachers reported that they found their class-room technology to be “suffi ciently available.” However, teachers with relatively few computers in the classroom reported suffi cient availability of technology less often than teachers with more computers.
ReferenceKleiner, A., and Lewis, L. (2003). Internet Access in U.S. Public
Schools and Classrooms: 1994–2002 (NCES 2004-011). U.S. Department of Education. Washington, DC: National Center for Education Statistics.
Figure 1. Percentage of teachers who believed selected technologies were essential to their teaching: 2000–01
1Presentation software refers to software such as PowerPoint.2Multimedia authoring program refers to software such as Hyperstudio or HyperCard.NOTE: Standard errors are available at http://nces.ed.gov/pubsearch/pubsinfo.asp?pubid=2005083.SOURCE: U.S. Department of Education, National Center for Education Statistics, Teacher Follow-up Survey (TFS), 2000–01, Questionnaire for Current Teachers.
Percent
Video camera
Full-page scanner
Selected technology
Multimedia authoring program2
Presentation software1
At least one computer for every four students in classroom
Encyclopedia and other reference works on CD-ROM
Telephone in classroom
World Wide Web access in classroom
Teacher computer station with accessto electronic mail
0 20 40 60 80 100
68
61
56
51
49
35
21
20
18
Data source: The NCES 2000–01 Teacher Follow-up Survey (TFS).
For more information on the Teacher Follow-up Survey, visit http://nces.ed.gov/surveys/sass/overview.asp#whatstfs.
Author affi liations: L. Lanahan and J. Boysen, Education Statistics Services Institute.
For questions about content, contact Edith McArthur ([email protected]).
To obtain this Issue Brief (NCES 2005-083), call the toll-free ED Pubs number (877-433-7827) or visit the NCES Electronic Catalog (http://nces.ed.gov/pubsearch).

E D U C A T I O N S T A T I S T I C S Q U A R T E R L Y — V O L U M E 7, I S S U E S 1 & 2, 2 0 0 5 69
NOTE: Standard errors are available at http://nces.ed.gov/pubsearch/pubsinfo.asp?pubid=2005083.SOURCE: U.S. Department of Education, National Center for Education Statistics, Teacher Follow-up Survey (TFS), 2000–01, Questionnaire for Current Teachers.
Figure 2. Percentage of teachers who agreed that computers and other technology for their classrooms were suffi ciently available: 2000–01
Percent
Teachers’ opinions of classroom technology
Strongly agree
Somewhat agree
Neither agree nor disagree
Somewhat disagree
Strongly disagree
0
20
40
60
80
100
25
32
8
1915
Computer Technology in the Public School Classroom: Teacher Perspectives

N A T I O N A L C E N T E R F O R E D U C A T I O N S T A T I S T I C S70
Elementary and Secondary Education
Table 1. Percentage of teachers who agreed that computers and other technology for their classrooms were suffi ciently available, by selected teacher characteristics: 2000–01
Teacher characteristic Agree1Neither agree
nor disagree Disagree2
Total 57 8 35
Main assignmentPre-K, kindergarten, and general elementary 58 7 35Mathematics and science 62 9 29English/language arts 59 8 33Social science 64 5 ! 30Special education 53 9 39Foreign languages and bilingual/ESL 54 6 ! 40Vocational/technical 56 8! 36All others3 52 12 36
Hours of professional development for computersNo professional development 47 10 43Up to 16 hours 65 7 2817 hours or more 61 8 32
Agrees with “I am reasonably familiar and comfortable with using computers” Strongly or somewhat agree 60 8 32Neither agree nor disagree 53 14 33Strongly or somewhat disagree 48 8 45
Student-to-computer ratio4
With computers in classroomLess than 4 69 8 234 to less than 8 67 6 278 to less than 16 62 3 3516 or greater 55 5 40
No computers in classroom 39 13 ! 48
! Interpret data with caution; estimates are unstable. The coeffi cient of variation is greater than 30 percent.1 Estimate combines those teachers who either “somewhat” agreed or “strongly” agreed that technology for their classrooms was suffi ciently available.2 Estimate combines those teachers who either “somewhat” disagreed or “strongly” disagreed that technology for their classrooms was suffi ciently available.3 Includes religion, philosophy, home economics, health, computer science, American Indian studies, military science, gifted programs, arts, physical education, remedial education, and others.4 The classroom student-to-computer ratio was calculated by dividing the number of students in one “typical” class, designated by the teacher within the main assignment, by the number of computers in the classroom where that designated class was taught. Teachers with no computers in the classroom were excluded from the calculation. Percentages are based on the 58 percent of teachers who reported that their students used computers during class time.NOTE: Standard errors are available at http://nces.ed.gov/pubsearch/pubsinfo.asp?pubid=2005083.SOURCE: U.S. Department of Education, National Center for Education Statistics, Teacher Follow-up Survey (TFS), 2000–01, Questionnaire for Current Teachers.
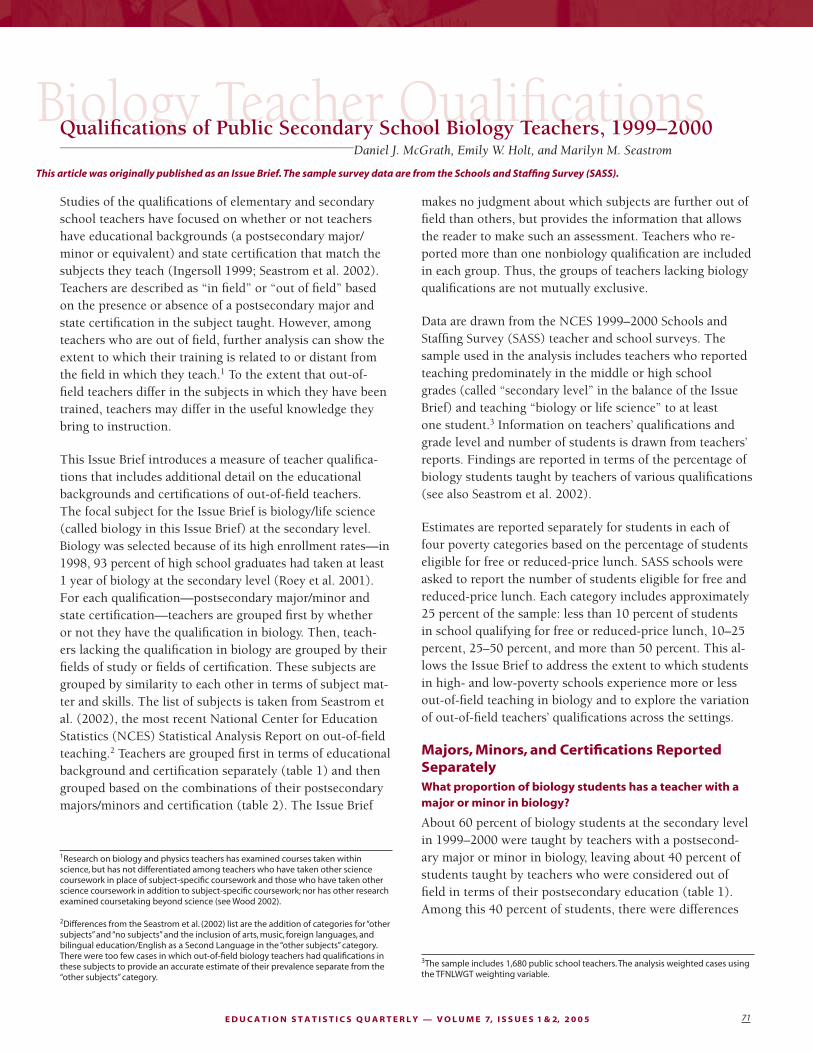
E D U C A T I O N S T A T I S T I C S Q U A R T E R L Y — V O L U M E 7, I S S U E S 1 & 2, 2 0 0 5 71
Biology Teacher Qualifi cationsQualifi cations of Public Secondary School Biology Teachers, 1999–2000——————————————————————————————————Daniel J. McGrath, Emily W. Holt, and Marilyn M. Seastrom
This article was originally published as an Issue Brief. The sample survey data are from the Schools and Staffi ng Survey (SASS).
Studies of the qualifi cations of elementary and secondary school teachers have focused on whether or not teachers have educational backgrounds (a postsecondary major/minor or equivalent) and state certifi cation that match the subjects they teach (Ingersoll 1999; Seastrom et al. 2002). Teachers are described as “in fi eld” or “out of fi eld” based on the presence or absence of a postsecondary major and state certifi cation in the subject taught. However, among teachers who are out of fi eld, further analysis can show the extent to which their training is related to or distant from the fi eld in which they teach.1 To the extent that out-of-fi eld teachers differ in the subjects in which they have been trained, teachers may differ in the useful knowledge they bring to instruction.
This Issue Brief introduces a measure of teacher qualifi ca-tions that includes additional detail on the educational backgrounds and certifi cations of out-of-fi eld teachers. The focal subject for the Issue Brief is biology/life science (called biology in this Issue Brief) at the secondary level. Biology was selected because of its high enrollment rates—in 1998, 93 percent of high school graduates had taken at least 1 year of biology at the secondary level (Roey et al. 2001). For each qualifi cation—postsecondary major/minor and state certifi cation—teachers are grouped fi rst by whether or not they have the qualifi cation in biology. Then, teach-ers lacking the qualifi cation in biology are grouped by their fi elds of study or fi elds of certifi cation. These subjects are grouped by similarity to each other in terms of subject mat-ter and skills. The list of subjects is taken from Seastrom et al. (2002), the most recent National Center for Education Statistics (NCES) Statistical Analysis Report on out-of-fi eld teaching.2 Teachers are grouped fi rst in terms of educational background and certifi cation separately (table 1) and then grouped based on the combinations of their postsecondary majors/minors and certifi cation (table 2). The Issue Brief
makes no judgment about which subjects are further out of fi eld than others, but provides the information that allows the reader to make such an assessment. Teachers who re-ported more than one nonbiology qualifi cation are included in each group. Thus, the groups of teachers lacking biology qualifi cations are not mutually exclusive.
Data are drawn from the NCES 1999–2000 Schools and Staffi ng Survey (SASS) teacher and school surveys. The sample used in the analysis includes teachers who reported teaching predominately in the middle or high school grades (called “secondary level” in the balance of the Issue Brief) and teaching “biology or life science” to at least one student.3 Information on teachers’ qualifi cations and grade level and number of students is drawn from teachers’ reports. Findings are reported in terms of the percentage of biology students taught by teachers of various qualifi cations (see also Seastrom et al. 2002).
Estimates are reported separately for students in each of four poverty categories based on the percentage of students eligible for free or reduced-price lunch. SASS schools were asked to report the number of students eligible for free and reduced-price lunch. Each category includes approximately 25 percent of the sample: less than 10 percent of students in school qualifying for free or reduced-price lunch, 10–25 percent, 25–50 percent, and more than 50 percent. This al-lows the Issue Brief to address the extent to which students in high- and low-poverty schools experience more or less out-of-fi eld teaching in biology and to explore the variation of out-of-fi eld teachers’ qualifi cations across the settings.
Majors, Minors, and Certifi cations Reported SeparatelyWhat proportion of biology students has a teacher with a major or minor in biology?
About 60 percent of biology students at the secondary level in 1999–2000 were taught by teachers with a postsecond-ary major or minor in biology, leaving about 40 percent of students taught by teachers who were considered out of fi eld in terms of their postsecondary education (table 1). Among this 40 percent of students, there were differences
1Research on biology and physics teachers has examined courses taken within science, but has not differentiated among teachers who have taken other science coursework in place of subject-specifi c coursework and those who have taken other science coursework in addition to subject-specifi c coursework; nor has other research examined coursetaking beyond science (see Wood 2002).
2Differences from the Seastrom et al. (2002) list are the addition of categories for “other subjects” and “no subjects” and the inclusion of arts, music, foreign languages, and bilingual education/English as a Second Language in the “other subjects” category. There were too few cases in which out-of-fi eld biology teachers had qualifi cations in these subjects to provide an accurate estimate of their prevalence separate from the “other subjects” category.
3The sample includes 1,680 public school teachers. The analysis weighted cases using the TFNLWGT weighting variable.
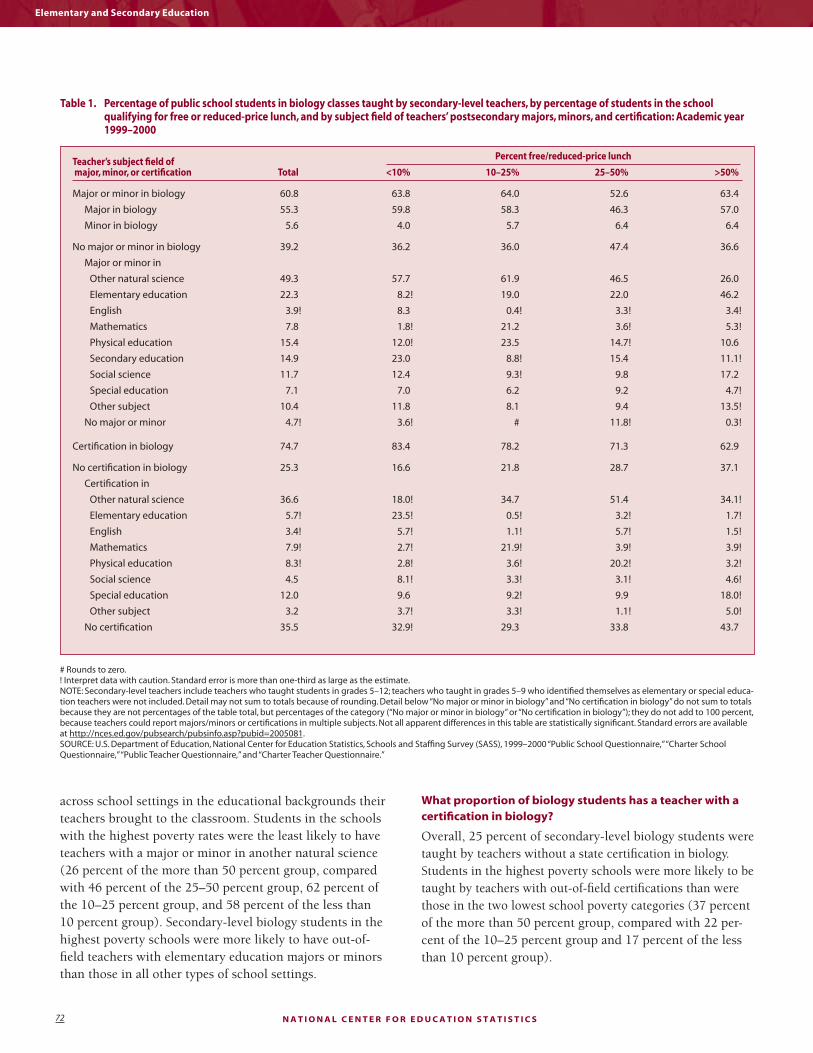
N A T I O N A L C E N T E R F O R E D U C A T I O N S T A T I S T I C S72
Elementary and Secondary Education
across school settings in the educational backgrounds their teachers brought to the classroom. Students in the schools with the highest poverty rates were the least likely to have teachers with a major or minor in another natural science (26 percent of the more than 50 percent group, compared with 46 percent of the 25–50 percent group, 62 percent of the 10–25 percent group, and 58 percent of the less than 10 percent group). Secondary-level biology students in the highest poverty schools were more likely to have out-of-fi eld teachers with elementary education majors or minors than those in all other types of school settings.
What proportion of biology students has a teacher with a certifi cation in biology?
Overall, 25 percent of secondary-level biology students were taught by teachers without a state certifi cation in biology. Students in the highest poverty schools were more likely to be taught by teachers with out-of-fi eld certifi cations than were those in the two lowest school poverty categories (37 percent of the more than 50 percent group, compared with 22 per-cent of the 10–25 percent group and 17 percent of the less than 10 percent group).
Teacher’s subject fi eld of major, minor, or certifi cation Total <10% 10–25% 25–50% >50%
Major or minor in biology 60.8 63.8 64.0 52.6 63.4
Major in biology 55.3 59.8 58.3 46.3 57.0
Minor in biology 5.6 4.0 5.7 6.4 6.4
No major or minor in biology 39.2 36.2 36.0 47.4 36.6
Major or minor in
Other natural science 49.3 57.7 61.9 46.5 26.0
Elementary education 22.3 8.2 ! 19.0 22.0 46.2
English 3.9 ! 8.3 0.4 ! 3.3 ! 3.4 !
Mathematics 7.8 1.8 ! 21.2 3.6 ! 5.3 !
Physical education 15.4 12.0 ! 23.5 14.7 ! 10.6
Secondary education 14.9 23.0 8.8 ! 15.4 11.1 !
Social science 11.7 12.4 9.3 ! 9.8 17.2
Special education 7.1 7.0 6.2 9.2 4.7 !
Other subject 10.4 11.8 8.1 9.4 13.5 !
No major or minor 4.7 ! 3.6 ! # 11.8 ! 0.3 !
Certifi cation in biology 74.7 83.4 78.2 71.3 62.9
No certifi cation in biology 25.3 16.6 21.8 28.7 37.1
Certifi cation in
Other natural science 36.6 18.0 ! 34.7 51.4 34.1 !
Elementary education 5.7 ! 23.5 ! 0.5 ! 3.2 ! 1.7 !
English 3.4 ! 5.7 ! 1.1 ! 5.7 ! 1.5 !
Mathematics 7.9 ! 2.7 ! 21.9 ! 3.9 ! 3.9 !
Physical education 8.3 ! 2.8 ! 3.6 ! 20.2 ! 3.2 !
Social science 4.5 8.1 ! 3.3 ! 3.1 ! 4.6 !
Special education 12.0 9.6 9.2 ! 9.9 18.0 !
Other subject 3.2 3.7 ! 3.3 ! 1.1 ! 5.0 !
No certifi cation 35.5 32.9 ! 29.3 33.8 43.7
Percent free/reduced-price lunch
Table 1. Percentage of public school students in biology classes taught by secondary-level teachers, by percentage of students in the school qualifying for free or reduced-price lunch, and by subject fi eld of teachers’ postsecondary majors, minors, and certifi cation: Academic year 1999–2000
# Rounds to zero.! Interpret data with caution. Standard error is more than one-third as large as the estimate. NOTE: Secondary-level teachers include teachers who taught students in grades 5–12; teachers who taught in grades 5–9 who identifi ed themselves as elementary or special educa-tion teachers were not included. Detail may not sum to totals because of rounding. Detail below “No major or minor in biology” and “No certifi cation in biology” do not sum to totals because they are not percentages of the table total, but percentages of the category (“No major or minor in biology” or “No certifi cation in biology”); they do not add to 100 percent, because teachers could report majors/minors or certifi cations in multiple subjects. Not all apparent differences in this table are statistically signifi cant. Standard errors are available at http://nces.ed.gov/pubsearch/pubsinfo.asp?pubid=2005081.SOURCE: U.S. Department of Education, National Center for Education Statistics, Schools and Staffi ng Survey (SASS), 1999–2000 “Public School Questionnaire,” “Charter School Questionnaire,” “Public Teacher Questionnaire,” and “Charter Teacher Questionnaire.”

E D U C A T I O N S T A T I S T I C S Q U A R T E R L Y — V O L U M E 7, I S S U E S 1 & 2, 2 0 0 5 73
Qualifi cations of Public Secondary School Biology Teachers, 1999–2000
Majors, Minors, and Certifi cations Reported in CombinationsAmong students of teachers with a certifi cation in biology
Fifty-two percent of secondary-level biology students had teachers with both a certifi cation and a major or minor in biology (table 2). Students in the two lowest school poverty categories were more likely than those in the 25 to 50 percent
school poverty category to have teachers with both qualifi ca-tions (58 percent of the less than 10 percent group and 57 percent of the 10–25 percent group, compared with 44 percent of the 25–50 percent group).4
Table 2. Percentage of public school students in biology classes taught by secondary-level teachers, by percentage of students in the school qualifying for free or reduced-price lunch, and by combinations of teachers’ postsecondary majors/minors and certifi cation subject fi elds: Academic year 1999–2000
Teacher’s combination of major/minor and certifi cation Total <10% 10–25% 25–50% >50%
Certifi cation in biology 74.7 83.4 78.2 71.3 62.9
And major or minor in biology 51.8 57.8 57.1 44.5 46.3
Major in biology 47.4 54.7 51.7 40.2 41.4
Minor in biology 4.4 3.2 5.4 4.3 4.9!
And no major or minor in biology 22.9 25.6 21.1 26.8 16.6
Major or minor in
Other natural science 55.5 58.5 57.2 56.3 44.9
Elementary education 17.6 4.4 ! 23.4 ! 16.2 ! 37.8
English 2.9 ! 6.0 ! 0.3 ! 2.1 ! 2.6 !
Mathematics 4.1 0.4 ! 10.4 ! 2.5 4.1 !
Physical education 19.1 14.4 ! 26.4 20.7 ! 13.0 !
Secondary education 20.8 29.3 8.9 ! 23.8 ! 17.0 !
Social science 12.2 11.7 ! 13.8 ! 10.4 ! 14.4 !
Special education 5.0 4.4 ! 4.6 ! 8.3 ! 0.3 !
Other subject 6.9 8.7 ! 5.4 ! 7.9 ! 3.7 !
No major or minor 1.7 ! 5.1 ! # 0.4 ! #
No certifi cation in biology 25.3 16.6 21.8 28.7 37.1
And major or minor in biology 9.0 6.0 6.9 8.2 17.1
Major in biology 7.9 5.2 ! 6.6 6.1 15.6
Minor in biology 1.2 ! 0.8 ! 0.3 ! 2.1 ! 1.5
And no major or minor in biology 16.3 10.6 14.9 20.6 20.0
Major or minor in
Other natural science 40.4 55.7 68.6 33.7 ! 10.3 !
Elementary education 29.1 17.4 ! 12.7 ! 29.7 ! 53.2
English 5.2 ! 13.7 ! 0.6 ! 5.0 ! 4.0 !
Mathematics 13.1 ! 5.0 ! 36.6 ! 5.0 ! 6.3 !
Physical education 10.2 6.3 ! 19.3 ! 6.8 ! 8.6 !
Secondary education 6.5 7.8 ! 8.7 ! 4.5 ! 6.1 !
Social science 10.9 14.0 ! 3.0 ! 9.0 ! 19.4 !
Special education 10.0 13.5 ! 8.6 ! 10.4 ! 8.4 !
Other subject 15.4 19.3 ! 11.9 ! 11.3 ! 21.6 !
No major or minor 9.0 ! # # 26.7 ! 0.6 !
# Rounds to zero.! Interpret data with caution. Standard error is more than one-third as large as the estimate.NOTE: Secondary-level teachers include teachers who taught students in grades 5–12; teachers who taught in grades 5–9 who identifi ed themselves as elementary or special education teachers were not included. Detail may not sum to totals because of rounding. Detail below “And no major or minor in biology” do not sum to totals because they are not percentages of the table total, but percentages of the category (“And no major or minor in biology”); they do not add to 100 percent, because teachers could report majors/minors or certifi cations in multiple subjects. Not all apparent differences in this table are statistically signifi cant. Standard errors are available at http://nces.ed.gov/pubsearch/pubsinfo.asp?pubid=2005081.SOURCE: U.S. Department of Education, National Center for Education Statistics, Schools and Staffi ng Survey (SASS), 1999–2000 “Public School Questionnaire,” “Charter School Questionnaire,” “Public Teacher Questionnaire,” and “Charter Teacher Questionnaire.”
Percent free/reduced-price lunch
4In the highest poverty group, 46 percent of students had a teacher with both quali-fi cations, but the estimate for this group had a large standard error and, as a result, apparent differences compared with the lower poverty groups are not statistically signifi cant.

N A T I O N A L C E N T E R F O R E D U C A T I O N S T A T I S T I C S74
Elementary and Secondary Education
Among students taught by teachers who reported having in-fi eld certifi cation but out-of-fi eld educational backgrounds, the most common type of postsecondary major or minor was natural science (56 percent of these students). Among the students with teachers who were certifi ed but had out-of-fi eld educational backgrounds, those in the highest poverty schools were more likely than those in the lowest poverty schools to have teachers with an elementary education major or minor (38 percent of the more than 50 percent group, compared with 4 percent of the less than 10 percent group).
Among students of teachers with no certifi cation in biology
Overall, 9 percent of secondary-level biology students had a teacher who had no certifi cation in biology but did have a major or minor in biology. This combination was more prevalent among the teachers of students in the highest poverty schools than in the two lowest school poverty categories (17 percent of the more than 50 percent group, compared with 7 percent of the 10–25 percent group and 6 percent of the less than 10 percent group).
Among all secondary-level biology students, 16 percent had teachers with neither a certifi cation nor a major or minor in biology. For these students, those in schools in the two lowest school poverty categories were more likely than those in the highest poverty schools to have teachers with a major or a minor in a natural science (56 percent of the less than 10 percent group and 69 percent of the 10–25 percent group, compared with 10 percent of the more than 50 per-cent group). Also in this group, students in the highest pov-erty schools were more likely than those in the 10–25 per-cent school poverty category to have teachers with a major or minor in elementary education (53 percent of the more than 50 percent group, compared with 13 percent of the 10–25 percent group).
Conclusion
Measures of out-of-fi eld teaching that report only the ab-sence or presence of educational and certifi cation qualifi ca-tions provide important but incomplete information about student exposure to teachers with differing qualifi cations in the subjects they teach. For subjects like secondary-level biology in which close to 40 percent of students have teach-ers without a major or minor in the fi eld, 25 percent have teachers without a certifi cation in the fi eld, and 16 percent have teachers with neither a certifi cation nor a major or mi-nor in the fi eld, it is useful to examine in more detail what certifi cations and majors and minors these teachers actually have. This Issue Brief reported the combination of certifi -cations and majors and minors to which secondary-level
biology students are exposed and how these qualifi cations vary across schools with differing levels of student poverty. Students of teachers lacking a major or minor in biology in the highest poverty schools were less likely than those in all other schools to have teachers with a major or minor in an-other natural science and more likely than those in all other schools to have teachers with a major or minor in elemen-tary education. Similarly, among those students with teach-ers who had neither a certifi cation nor a major or minor in biology, students in the highest poverty schools were less likely than those in the two lowest school poverty categories to have a teacher with a major or minor in natural science.
Of course, certifi cation and postsecondary education are not the only routes through which teachers can gain subject-matter expertise in the subjects they teach. Teachers may bring other professional and life experiences that provide them the subject-matter grounding needed to teach effec-tively; future data collections may address these issues. However, with current data, additional research could also examine if similar patterns of teacher qualifi cations across school settings are apparent among other subjects.
ReferencesIngersoll, R. (1999). The Problem of Underqualifi ed Teachers in
American Secondary Schools. Educational Researcher, 28(2): 26–37.
Roey, S., Caldwell, N., Rust, K., Blumstein, E., Krenzke, T., Legum, S., Kuhn, J., Waksberg, M., and Haynes, J. (2001). The 1998 High School Transcript Study Tabulations: Comparative Data on Credits Earned and Demographics for 1998, 1994, 1990, 1987, and 1982 High School Graduates (NCES 2001-498). U.S. Department of Education, National Center for Education Statistics. Washing-ton, DC: U.S. Government Printing Offi ce.
Seastrom, M.M., Gruber, K.J., Henke, R., McGrath, D.J., and Cohen, B.A. (2002). Qualifi cations of the Public School Teacher Workforce: Prevalence of Out-of-Field Teaching: 1987–88 to 1999–2000 (NCES 2002-603). U.S. Department of Education, National Center for Education Statistics. Washington, DC: U.S. Government Printing Offi ce.
Wood, K.D. (2002). 2000 National Survey of Science and Mathemat-ics Education: Status of High School Biology Teaching. Chapel Hill, NC: Horizon Research, Inc.
Data source: The NCES 1999–2000 Schools and Staffi ng Survey (SASS).
For more information on the Schools and Staffi ng Survey, visit http://nces.ed.gov/surveys/sass.
Author affi liations: D.J. McGrath and E.W. Holt, Education Statistics Services Institute; M.M. Seastrom, NCES.
For questions about content, contact Edith McArthur ([email protected]).
To obtain the complete report (NCES 2005-081), call the toll-free ED Pubs number (877-433-7827) or visit the NCES Electronic Catalog (http://nces.ed.gov/pubsearch).

E D U C A T I O N S T A T I S T I C S Q U A R T E R L Y — V O L U M E 7, I S S U E S 1 & 2, 2 0 0 5 75
Private School Teacher TurnoverPrivate School Teacher Turnover and Teacher Perceptions of School Organizational Characteristics—————————————————————————Daniel J. McGrath and Daniel Princiotta
This article was originally published as an Issue Brief. The sample survey data are from the Schools and Staffi ng Survey (SASS) and the Teacher Follow-up Survey (TFS).
National studies have included both private and public school teachers in analyses of teacher turnover (Ingersoll 2001). These studies have shown that teacher turnover is associated with teacher perceptions of school organizational characteristics, including low levels of administrative sup-port, little input into school decisions, student disciplinary problems, and insuffi cient salary (Ingersoll 2001). Private school teachers generally express less dissatisfaction with school organizational characteristics than do their public school counterparts (Ingersoll 2001; Holton 2003). However, teacher turnover rates are higher in private schools than in public schools; in 2000–01, 21 percent of private school teachers had switched schools or left the teaching force since the previous school year compared with 15 percent of public school teachers (Luekens, Lyter, and Fox 2004). Until recently, nationally representative data have not included suffi ciently large sample sizes to allow for in-depth studies of teacher turnover in U.S. private schools.1 Using the National Center for Education Statistics (NCES) 1999–2000 Schools and Staffi ng Survey (SASS) data fi le, this Issue Brief looks within the private sector to investigate teacher-perceived school organizational characteristics, and relationships be-tween these characteristics and teacher turnover in Catholic, other religious, and nonsectarian private schools.
The 1999–2000 SASS data fi le includes school principal or head reports on teacher turnover.2 As part of the sample se-lection for the Teacher Follow-up Survey (TFS), principals of elementary and secondary teachers in SASS schools in the year following SASS were asked to report whether the teach-ers had begun the 2000–01 school year in the same school, had moved to another school, or had left teaching entirely.3 For the purposes of the current analysis, a teacher was defi ned as a “stayer” if the principal reported at the start of
the 2000–01 school year that the teacher stayed in the same school as a teacher between 1999–2000 and 2000–01, a “mover” if the principal reported the teacher had changed schools, and a “leaver” if the principal reported the teacher had left the profession.4 School organizational characteris-tics studied include teacher perceptions of administrative support, salary level, student discipline, and infl uence over classroom and school policies. Teachers were described as “low” on satisfaction if they scored among the 20 percent least satisfi ed on the organizational factor. Because low satisfaction was defi ned relatively, teachers who expressed satisfaction, but less satisfaction than others, may have been described as low on satisfaction. For example, because so few teachers reported serious student discipline problems, teachers who reported that discipline was a mild problem were described as having low satisfaction with student discipline.5 Results are presented separately for teachers in Catholic, other religious, and nonsectarian private schools.6
Because SASS relies on principals for information regarding teacher turnover, a preliminary analysis compared principal and teacher reports on the teachers’ turnover status for the subset of private school SASS teachers who were included in the TFS sample.7 Agreement was suffi ciently high to sup-port use of the principal reports in the main analysis of the Issue Brief.8
1For example, the National Center for Education Statistics (NCES) Teacher Follow-Up Survey (TFS), a nationally representative survey often used to study teacher turnover, included about 1,600 private school teachers in 2001. This Issue Brief uses the NCES 1999–2000 Schools and Staffi ng Survey (SASS) dataset, which included, for the fi rst time, teacher turnover between the 1999–2000 and 2000–01 school years, as reported by school principals. This dataset included approximately 7,000 private school teachers.
2The analyses in this Issue Brief are based on a sample of 7,057 teachers who com-pleted the SASS Private School Teacher Questionnaire. When weighted using the TFNLWGT weighting variable, this sample is representative of U.S. private elementary and secondary school teachers during the 1999–2000 school year.
3This information was used to develop the sample for the 2001 TFS. Principals may have been new to the school in 2000–01.
4Teachers whose status was listed as unknown, deceased, or living outside the United States were not included. Altogether, there were 41 such teachers. Teachers who moved to administrative positions were considered leavers.
5Detailed descriptions of the school organization variables used in the analysis are included in the notes to table 1. Because of the distribution of teachers’ scores on the variables, not all the variables included exactly 20 percent of all teachers; the range was between 18 and 34 percent. On tests of internal reliability, the standardized Cronbach’s Alpha was 0.86 for the composite measure of satisfaction with administra-tive support, 0.84 for schoolwide infl uence, 0.78 for classroom infl uence, and 0.77 for student discipline.
6All fi ndings presented in this Brief are descriptive in nature. All differences discussed are statistically signifi cant at the .05 level as measured by two-tailed Student’s t tests.
7This analysis was based on a sample of 1,631 teachers who participated in both SASS and TFS and whose SASS school principal reported the teacher as a stayer, mover, or leaver at the start of the 2000–01 school year.
8In 97 percent of the cases in which private school principals reported teachers had stayed in the same school across the 1999–2000 and 2000–01 school years, teachers also reported they had stayed. When principals reported teachers as being in the mover or leaver category, 92 percent of teachers agreed. A second way of assess-ing principals’ accuracy is to look at teacher reports and see how often principal reports agreed. In 98 percent of the cases in which teachers reported they had stayed, principals had also reported the teachers stayed. In 87 percent of the cases in which teachers reported they had moved or left, principals had also reported the teachers moved or left.

N A T I O N A L C E N T E R F O R E D U C A T I O N S T A T I S T I C S76
Elementary and Secondary Education
Private School Type, School Organizational Characteristics, and Teacher Turnover
According to principal reports, between the 1999–2000 and 2000–01 school years, 19 percent of Catholic school teachers, 23 percent of other religious school teachers, and 21 percent of nonsectarian school teachers changed schools or left the teaching profession (not shown in tables). Table 1 presents the percentage of private school teachers who reported relatively low levels of administrative sup-port and satisfaction with salary, relatively greater problems with student behavior at school, and relatively low levels of classroom and schoolwide infl uence by teachers’ private school type and turnover status. The teacher reports on organizational characteristics are from 1999–2000.
Consistent with prior research (Ingersoll 2001), private school teachers who were reported to have left their schools (movers and leavers) were more likely than stayers to report relatively low levels of administrative support, satisfaction with salary, student discipline, control over classroom poli-cies, and input in school policies. These relationships held within each of the private school types. There were differ-ences, however, across private school type in terms of the percentage of all teachers, stayers, and movers and leavers who reported relatively low levels of organizational charac-teristics examined in this Issue Brief.
Teachers in Catholic schools were more likely than others to report strong dissatisfaction regarding their salary (48 percent compared with 23 percent of other religious and 31 percent of nonsectarian school teachers). They also were more likely to report relatively low levels of input at the school level (23 per-cent in low category compared with 19 percent of other religious and 13 percent of nonsectarian school teachers).
A greater percentage of teachers at private schools designat-ed as “other religious schools” reported relatively low levels of classroom input (22 percent) than did those teaching in nonsectarian (15 percent) or Catholic (17 percent) schools. They were less likely than others to report relatively low ad-ministrative support (16 percent compared with 22 percent of Catholic and 23 percent of nonsectarian school teachers), satisfaction with salary, and student discipline (18 percent compared with 21 percent of Catholic and 27 percent of nonsectarian school teachers).
Teachers in nonsectarian schools were more likely to report relatively low levels of student discipline than teachers in other private schools. They were also less likely than teach-ers in other types of private schools to report relatively low levels of input schoolwide and less likely than teachers in other religious schools to report relatively low levels of input in their own classrooms.
In some cases, differences among the private school types were such that stayers in one private school type were at least as likely as movers and leavers in another private school type to express relatively low levels of certain or-ganizational factors. For example, a higher percentage of Catholic school stayers reported strong dissatisfaction with salary (46 percent) than did movers or leavers from other religious schools (27 percent), and there was no statisti-cally signifi cant difference between Catholic school stayers and nonsectarian school movers and leavers (40 percent). Nonsectarian stayers (29 percent) were not signifi cantly different from other religious school movers and leavers (27 percent) in reports of strong dissatisfaction with sal-ary. Similarly, nonsectarian stayers were not signifi cantly different from movers and leavers in Catholic and other religious schools in their likelihood of reporting relatively low student discipline (25 percent of nonsectarian stayers compared with 24 percent of Catholic and 22 percent of other religious movers and leavers).
Conclusion
In a study of teacher turnover in U.S. private schools between the 1999–2000 and 2000–01 school years, within each private school type (i.e., Catholic, other religious, and nonsectarian), teachers who left their school or the profession (movers and leavers) were more likely to report relatively low levels of administrative support, satisfaction with salary, student discipline, and teacher input in class-room and school decisions than were those who remained in the same school (stayers). The percentage of all teachers, stayers, and movers and leavers who reported relatively low levels of organizational characteristics varied across private school type.
By employing principal reports, this Issue Brief’s analysis of teacher turnover took advantage of the large 1999–2000 SASS sample, which allowed for analysis of teachers by private school type.
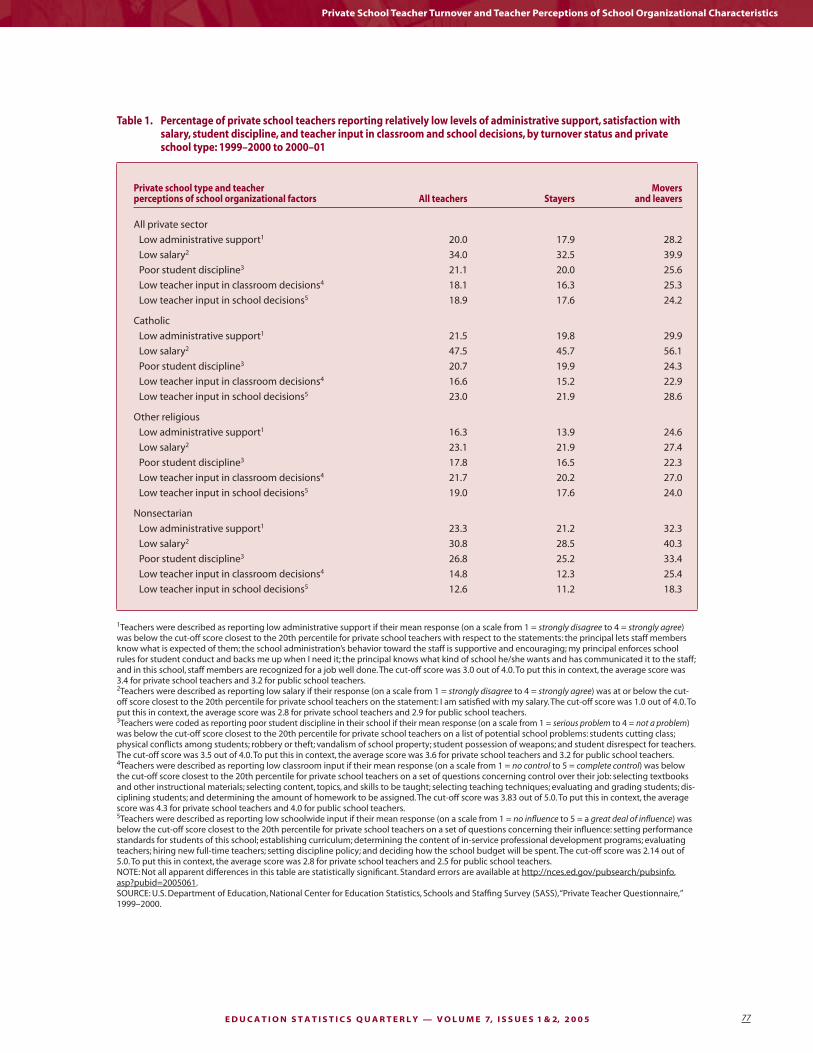
E D U C A T I O N S T A T I S T I C S Q U A R T E R L Y — V O L U M E 7, I S S U E S 1 & 2, 2 0 0 5 77
Table 1. Percentage of private school teachers reporting relatively low levels of administrative support, satisfaction with salary, student discipline, and teacher input in classroom and school decisions, by turnover status and private school type: 1999–2000 to 2000–01
Private school type and teacher perceptions of school organizational factors All teachers Stayers
Movers and leavers
All private sector
Low administrative support1 20.0 17.9 28.2
Low salary2 34.0 32.5 39.9
Poor student discipline3 21.1 20.0 25.6
Low teacher input in classroom decisions4 18.1 16.3 25.3
Low teacher input in school decisions5 18.9 17.6 24.2
Catholic
Low administrative support1 21.5 19.8 29.9
Low salary2 47.5 45.7 56.1
Poor student discipline3 20.7 19.9 24.3
Low teacher input in classroom decisions4 16.6 15.2 22.9
Low teacher input in school decisions5 23.0 21.9 28.6
Other religious
Low administrative support1 16.3 13.9 24.6
Low salary2 23.1 21.9 27.4
Poor student discipline3 17.8 16.5 22.3
Low teacher input in classroom decisions4 21.7 20.2 27.0
Low teacher input in school decisions5 19.0 17.6 24.0
Nonsectarian
Low administrative support1 23.3 21.2 32.3
Low salary2 30.8 28.5 40.3
Poor student discipline3 26.8 25.2 33.4
Low teacher input in classroom decisions4 14.8 12.3 25.4
Low teacher input in school decisions5 12.6 11.2 18.3
1Teachers were described as reporting low administrative support if their mean response (on a scale from 1 = strongly disagree to 4 = strongly agree) was below the cut-off score closest to the 20th percentile for private school teachers with respect to the statements: the principal lets staff members know what is expected of them; the school administration’s behavior toward the staff is supportive and encouraging; my principal enforces school rules for student conduct and backs me up when I need it; the principal knows what kind of school he/she wants and has communicated it to the staff; and in this school, staff members are recognized for a job well done. The cut-off score was 3.0 out of 4.0. To put this in context, the average score was 3.4 for private school teachers and 3.2 for public school teachers.2Teachers were described as reporting low salary if their response (on a scale from 1 = strongly disagree to 4 = strongly agree) was at or below the cut-off score closest to the 20th percentile for private school teachers on the statement: I am satisfi ed with my salary. The cut-off score was 1.0 out of 4.0. To put this in context, the average score was 2.8 for private school teachers and 2.9 for public school teachers.3Teachers were coded as reporting poor student discipline in their school if their mean response (on a scale from 1 = serious problem to 4 = not a problem) was below the cut-off score closest to the 20th percentile for private school teachers on a list of potential school problems: students cutting class; physical confl icts among students; robbery or theft; vandalism of school property; student possession of weapons; and student disrespect for teachers. The cut-off score was 3.5 out of 4.0. To put this in context, the average score was 3.6 for private school teachers and 3.2 for public school teachers.4Teachers were described as reporting low classroom input if their mean response (on a scale from 1 = no control to 5 = complete control) was below the cut-off score closest to the 20th percentile for private school teachers on a set of questions concerning control over their job: selecting textbooks and other instructional materials; selecting content, topics, and skills to be taught; selecting teaching techniques; evaluating and grading students; dis-ciplining students; and determining the amount of homework to be assigned. The cut-off score was 3.83 out of 5.0. To put this in context, the average score was 4.3 for private school teachers and 4.0 for public school teachers. 5Teachers were described as reporting low schoolwide input if their mean response (on a scale from 1 = no infl uence to 5 = a great deal of infl uence) was below the cut-off score closest to the 20th percentile for private school teachers on a set of questions concerning their infl uence: setting performance standards for students of this school; establishing curriculum; determining the content of in-service professional development programs; evaluating teachers; hiring new full-time teachers; setting discipline policy; and deciding how the school budget will be spent. The cut-off score was 2.14 out of 5.0. To put this in context, the average score was 2.8 for private school teachers and 2.5 for public school teachers. NOTE: Not all apparent differences in this table are statistically signifi cant. Standard errors are available at http://nces.ed.gov/pubsearch/pubsinfo.asp?pubid=2005061.SOURCE: U.S. Department of Education, National Center for Education Statistics, Schools and Staffi ng Survey (SASS), “Private Teacher Questionnaire,” 1999–2000.
Private School Teacher Turnover and Teacher Perceptions of School Organizational Characteristics

N A T I O N A L C E N T E R F O R E D U C A T I O N S T A T I S T I C S78
Elementary and Secondary Education
Data sources: The NCES 1999–2000 Schools and Staffi ng Survey (SASS) and the 2000-01 Teacher Follow-up Survey (TFS).
Author affi liations: D.J. McGrath and D. Princiotta, Education Statistics Services Institute.
For more information about SASS, visit http://nces.ed.gov/surveys/sass.
For questions about content, contact Edith McArthur([email protected]).
To obtain this Issue Brief (NCES 2005-061), call the toll-free ED Pubs number (877-433-7827) or visit the NCES Electronic Catalog (http://nces.ed.gov/pubsearch).
ReferencesHolton, B. (2003). A Brief Profi le of America’s Private Schools
(NCES 2003-417). U.S. Department of Education. Washington, DC: National Center for Education Statistics.
Ingersoll, R.M. (2001). Teacher Turnover and Teacher Shortages: An Organizational Analysis. American Educational Research Journal, 38(3): 499–534.
Luekens, M.T., Lyter, D.M., and Fox, E.E. (2004). Teacher Attrition and Mobility: Results From the Teacher Follow-up Survey, 2000–01 (NCES 2004-301). U.S. Department of Education, National Center for Education Statistics. Washington, DC: U.S. Govern-ment Printing Offi ce.

E D U C A T I O N S T A T I S T I C S Q U A R T E R L Y — V O L U M E 7, I S S U E S 1 & 2, 2 0 0 5 79
Parent and Family InvolvementParent and Family Involvement in Education: 2002–03—————————————————————————Nancy Vaden-Kiernan and John McManus
This article was originally published as the Highlights of the E.D. TAB of the same name. The sample survey data are from the Parent and Family Involvement in Education Survey of the National Household Education Surveys Program (PFI-NHES).
This report presents data on parents’ and families’ involve-ment in their children’s education in the United States. The data are from the Parent and Family Involvement in Educa-tion Survey of the 2003 National Household Education Sur-veys Program (PFI-NHES:2003). The survey was completed by parents of over 12,000 children in kindergarten through grade 12. Data highlights are shown below, along with ex-amples of questions for each topic area of the questionnaire.
The NHES:2003 sample was selected using random digit dial (RDD) methods, and the data were collected using computer-assisted telephone interviewing (CATI) technology. The sample for the 2003 survey is nationally representative of all children in kindergarten through grade 12 enrolled in regu-lar school or homeschooled in the 50 states and the District of Columbia. A screener was used to collect information on household composition and interview eligibility. Screener interviews had a weighted screener unit response rate of 65 percent. In households with one eligible child, the child was selected for PFI with certainty. In households with two eligible children, both were selected for PFI with certainty. If there were more than two eligible children or youth, then two were sampled with equal probability. The parent inter-view had a weighted unit response rate of 83 percent using base weights. The overall unit response rate for the Parent and Family Involvement in Education Survey in 2003 was 54 percent. A unit nonresponse bias analysis was undertaken for NHES:2003 (see Montaquila, Brick, and Brock forth-coming). The analysis of unit nonresponse bias showed no evidence of bias in estimates computed with nonresponse adjusted weights from PFI-NHES:2003.
The results presented below were chosen to highlight some of the fi ndings in the tables. To test the differences between estimates, Student’s t statistics were calculated. All differences reported were signifi cant at the .05 level. (More information about the statistical test used is in the Technical Notes sec-tion of the full report, along with a discussion of sampling methodology.)
Many of the tables include estimates for students in kinder-garten through grade 12. However, some tables are divided into estimates for students in kindergarten through grade 5 or in grades 6 through 12. This is because for some topic areas (e.g., home activities), different questions were asked of parents of younger children than of parents of older
children. Similarly, while a common set of selected school, household, and student characteristics is repeated across most tables, there are occasional variations in either the characteristics, the population, or both that are designed to fi t particular data items. Students who were homeschooled were excluded from all of the tables.
School Practices Encouraging Parents’ Involvement
Parents were asked about school communication with fami-lies, such as sending the family personal notes or e-mails specifi cally about their child; sending newsletters, memos, or notices; and calling the family on the telephone. Parents were also asked about school practices to provide informa-tion to parents, such as information about their child’s per-formance and their opportunities to volunteer at the school.
■ As the student’s grade level increased, relatively fewer parents reported that schools sent home notes or e-mails. Relatively more parents of fourth- and fi fth-graders re-ported that schools sent home notes or e-mails specifi -cally about their children (55 percent) than parents of students in sixth to eighth grade (49 percent). Similarly, more parents of students in 6th to 8th grade reported that schools sent home notes or e-mails specifi cally about their children (49 percent) than parents of stu-dents in 9th and 10th grade (42 percent).
Parents’ Involvement in Their Children’s School
Parents were asked if they had attended a general school meeting, a regularly scheduled parent-teacher conference, or a school or class event. They were also asked if they had acted as a volunteer or served on a school committee and if they had participated in fundraising for the school.
■ The percentage of students in kindergarten through grade 12 whose parents reported (in a single-item question) that they had acted as a volunteer at their children’s schools or served on a school committee was higher for students in private schools that were either church related or not church related (70 and 63 percent) than for students in public schools that were either assigned or selected by parents* (38 and 40 percent) (table A).
*The analysis in this report divides private school students into those attending private, church-related and private, not church-related schools. Public school students are divided into those attending public assigned and public chosen schools.
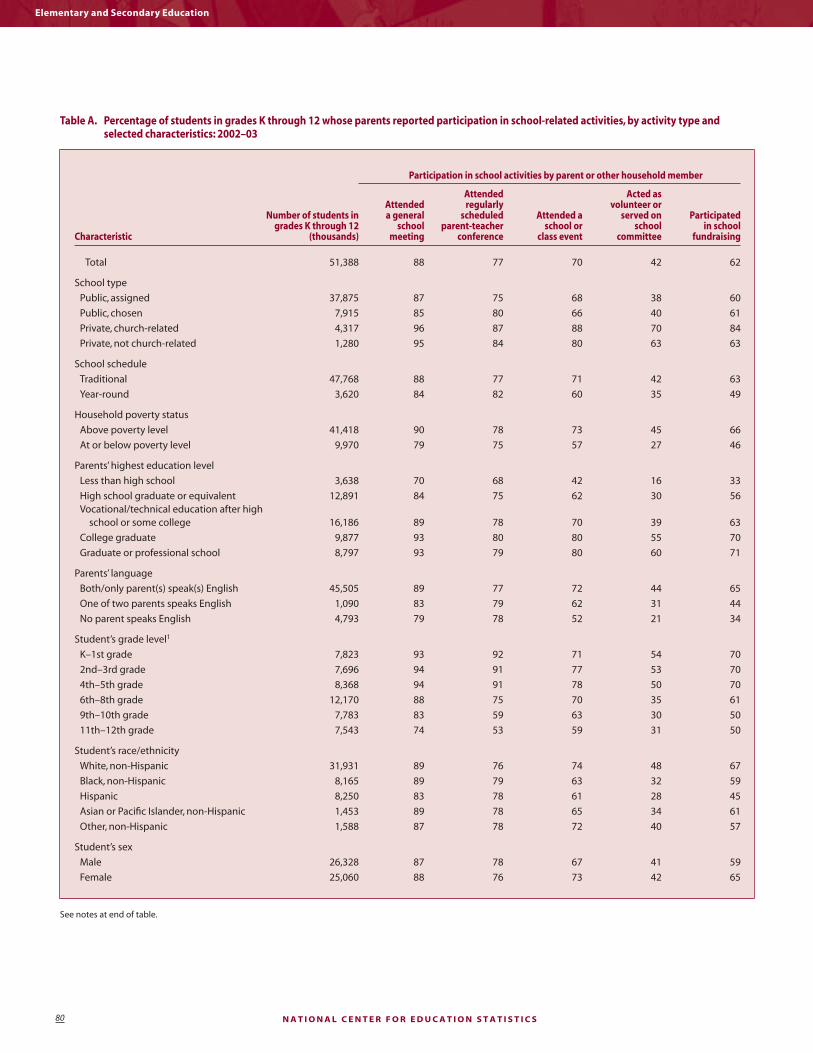
N A T I O N A L C E N T E R F O R E D U C A T I O N S T A T I S T I C S80
Elementary and Secondary Education
Table A. Percentage of students in grades K through 12 whose parents reported participation in school-related activities, by activity type and selected characteristics: 2002–03
Participation in school activities by parent or other household member
Characteristic
Number of students in grades K through 12
(thousands)
Attended a general
school meeting
Attended regularly
scheduled parent-teacher
conference
Attended a school or
class event
Acted asvolunteer or
served on school
committee
Participated in school
fundraising
Total 51,388 88 77 70 42 62
School type
Public, assigned 37,875 87 75 68 38 60
Public, chosen 7,915 85 80 66 40 61
Private, church-related 4,317 96 87 88 70 84
Private, not church-related 1,280 95 84 80 63 63
School schedule
Traditional 47,768 88 77 71 42 63
Year-round 3,620 84 82 60 35 49
Household poverty status
Above poverty level 41,418 90 78 73 45 66
At or below poverty level 9,970 79 75 57 27 46
Parents’ highest education level
Less than high school 3,638 70 68 42 16 33
High school graduate or equivalent 12,891 84 75 62 30 56Vocational/technical education after high
school or some college 16,186 89 78 70 39 63
College graduate 9,877 93 80 80 55 70
Graduate or professional school 8,797 93 79 80 60 71
Parents’ language
Both/only parent(s) speak(s) English 45,505 89 77 72 44 65
One of two parents speaks English 1,090 83 79 62 31 44
No parent speaks English 4,793 79 78 52 21 34
Student’s grade level1
K–1st grade 7,823 93 92 71 54 70
2nd–3rd grade 7,696 94 91 77 53 70
4th–5th grade 8,368 94 91 78 50 70
6th–8th grade 12,170 88 75 70 35 61
9th–10th grade 7,783 83 59 63 30 50
11th–12th grade 7,543 74 53 59 31 50
Student’s race/ethnicity
White, non-Hispanic 31,931 89 76 74 48 67
Black, non-Hispanic 8,165 89 79 63 32 59
Hispanic 8,250 83 78 61 28 45
Asian or Pacifi c Islander, non-Hispanic 1,453 89 78 65 34 61
Other, non-Hispanic 1,588 87 78 72 40 57
Student’s sex
Male 26,328 87 78 67 41 59
Female 25,060 88 76 73 42 65
See notes at end of table.

E D U C A T I O N S T A T I S T I C S Q U A R T E R L Y — V O L U M E 7, I S S U E S 1 & 2, 2 0 0 5 81
Parent and Family Involvement in Education: 2002–03
■ The percentage of students whose parents had attend-ed a general school meeting was higher in house-holds where parents had completed higher levels of education. Specifi cally, the percentage of students whose parents reported that they had attended a gen-eral school meeting was higher for children whose parents had attended graduate or professional school (93 percent) or completed college (93 percent) than for children whose parents had completed only a high school education or the equivalent (84 percent), and children whose parents had completed less than a high school education (70 percent) (table A).
Parents’ Involvement in Their Children’s Homework
Parents were asked about the frequency with which the student did homework at home and the number of hours the student spent doing homework. They were also asked if there is a place in their home set aside for the student to do homework, if an adult in the household checks that home-work is done, and the number of days per week that persons inside or outside the household help with homework.
■ In kindergarten through grade 12, 95 percent of chil-dren had parents who reported they assisted with homework. In addition, 85 percent of children in kin-dergarten through grade 12 had parents who reported that an adult in the household checked that home-work was done.
■ Overall, 90 percent of students in kindergarten through grade 12 had a place in their homes set aside for doing homework. Relatively fewer children of par-ents with less than a high school diploma had a place in their homes set aside for homework (80 percent), compared to children whose parents had completed a high school education or more—90 percent for high school education or the equivalent, 91 percent for vo-cational/technical education after high school or some college, 89 percent for completed college, and 92 per-cent for attended graduate or professional school.
Parents’ Involvement With Their Children in Nonschool Activities
Parents of students in kindergarten through grade 3 were asked how often someone in the family had read to the student
Table A. Percentage of students in grades K through 12 whose parents reported participation in school-related activities, by activity type and selected characteristics: 2002–03—Continued
Participation in school activities by parent or other household member
Characteristic
Number of students in grades K-through 12
(thousands)
Attended a general
school meeting
Attended regularly
scheduled parent-teacher
conference
Attended a school or
class event
Acted as volunteer or
served on school
committee
Participated in school
fundraising
Student experiences in school
Student participated in school activities 29,616 91 78 84 48 69Teacher or school contacted parent about
behavior problems 9,856 86 83 63 34 55Teacher or school contacted parent about
schoolwork problems 13,307 88 83 67 36 59
Student grades or marks2
Mostly A’s or excellent 20,868 91 77 78 50 69
Mostly B’s or above average 18,673 87 76 69 40 61
Mostly C’s or average 9,785 82 78 60 32 53Mostly D’s or lower, or below average
or failing 2,062 81 81 43 21 43
1Students whose parents reported that their classes were “ungraded” were excluded from the analyses of grade level.2Parents were asked whether overall, across all subjects, the student got mostly A’s, mostly B’s, mostly C’s, mostly D’s or lower, or whether the student’s school did not give those grades. If the student’s school did not give letter grades (e.g., A, B, C), parents were asked whether they would describe the student’s work at school as excellent, above average, average, below average, or failing. The two questions about grades or marks were combined for the table. NOTE: Students who were homeschooled were excluded from the table. Detail may not sum to totals because of rounding.SOURCE: U.S. Department of Education, National Center for Education Statistics, Parent and Family Involvement in Education Survey of the 2003 National Household Education Surveys Program (PFI-NHES:2003). (Originally published as table 3 on pp. 11–12 of the complete report from which this article is excerpted.)

N A T I O N A L C E N T E R F O R E D U C A T I O N S T A T I S T I C S82
Elementary and Secondary Education
in the past week. Parents of students in kindergarten through grade 12 were asked about home activities with the student in the past week and outings with the student in the past month.
■ In kindergarten through grade 5, the percentage of students whose parents reported they had played sports, active games, or exercised with them in-creased as parents’ education level increased. Spe-cifi cally, the percentage of students in kindergarten through grade 5 whose parents reported that they had played sports, active games, or exercised with their children was lower for children whose parents had completed less than a high school education (68 per-cent) than for children whose parents’ highest edu-cational attainment was a high school education or the equivalent (77 percent), children whose parents had completed vocational or technical education after high school or some college (80 percent), children whose parents had completed college (84 percent), and children whose parents had attended graduate or professional school (87 percent).
■ The percentage of students in kindergarten through grade 12 whose parents reported taking them to a public library in the past month was higher for Asian students (65 percent) than for White, non-Hispanic (41 percent), Black, non-Hispanic (49 percent), or Hispanic students (44 percent).
Student Experiences With Their Schools
Parents were asked about the extent to which they agreed or disagreed with statements about whether the student fi nds his or her schoolwork challenging, whether the student enjoys school, whether most students and teachers in the student’s school respect each other, and whether the school makes it easy for the family to be involved.
■ The percentage of students in kindergarten through grade 12 whose parents reported that they “strongly agreed” that the student’s school makes it easy for the family to be involved was higher for students in households above the poverty level (45 percent) than for students in households at or below the poverty level (35 percent).
Parents’ Expectations and Planned Financial Support for Their Children’s Postsecondary Education
Parents were asked about the highest education level they expected their children to attain. Those who expected their children to continue education after high school were also asked questions about their plans to help pay for their children’s education after high school.
■ The percentage of students in kindergarten through grade 12 whose parents expected their children to earn a graduate or professional degree was higher among students in private schools that were not church related (48 percent) than in other types of pri-vate and public schools (28 to 41 percent) (table B).
■ Among students in kindergarten through grade 12 whose parents expected them to continue their education after high school, the percentage whose parents planned to help pay for their children’s post-secondary education was higher in households where parents had completed higher levels of education. Specifi cally, the percentage of students whose parents reported that they planned to help their children pay for education after high school was higher for children whose parents had attended graduate or professional school (93 percent) or completed college (91 percent) than for children whose parents’ highest educational attainment was vocational or technical education after high school or some college (81 per-cent), children whose parents had completed only a high school education or the equivalent (75 percent), and children whose parents had completed less than a high school education (59 percent) (table B).
Student Activities in and out of School
Parents were asked whether the student participated in school activities. They were also asked about student par-ticipation in a variety of out-of-school activities, such as music lessons, sports, and educational programs.
■ In kindergarten through grade 12, the percentage of students who reportedly participated in school activi-ties increased as parents’ education level increased. Specifi cally, the percentage of students in kindergarten through grade 12 whose parents reported that their children participated in school activities was higher for students whose parents had attended or completed graduate or professional school (70 percent) than for students whose parents’ highest level of education completed was a vocational or technical education after high school or some college (58 percent), only a high school education or the equivalent (49 percent), and less than a high school education (35 percent).
Parents’ Satisfaction With School
Parents were asked how well the school did at providing information in various areas related to the child and the school (e.g., their child’s performance, opportunities to volunteer at the school). Parents were also asked about

E D U C A T I O N S T A T I S T I C S Q U A R T E R L Y — V O L U M E 7, I S S U E S 1 & 2, 2 0 0 5 83
Parent and Family Involvement in Education: 2002–03
Table B. Percentage of students in grades K through 12 whose parents reported educational expectations and plans to help pay for education after high school, by educational attainment expectation and selected characteristics: 2002–03
Parent expects student to . . .
Characteristic
Number of students in grades
K through 12 (thousands)
Receive less than a
high school diploma
Graduate from high
school
Attend vocational
or technical school after high school
Attend 2 or more years
of college
Finish 4- or 5-
year college degree
Earn a graduate or
professional degree
Family plans to help pay for student
education after high
school1
Total 51,388 # 7 7 16 39 30 83
School type
Public, assigned 37,875 # 8 8 17 39 28 82
Public, chosen 7,915 1 9 7 16 35 33 79
Private, church-related 4,317 # 2 2 9 45 41 91
Private, not church-related 1,280 1! 6 6 7 32 48 92
School schedule
Traditional 47,768 # 7 7 15 39 31 83
Year-round 3,620 1! 11 8 17 34 29 66
Household poverty status
Above poverty level 41,418 # 6 7 15 41 32 86
At or below poverty level 9,970 1 15 9 20 30 26 64
Parents’ highest education level
Less than high school 3,638 1! 23 10 20 27 20 59
High school graduate or equivalent 12,891 1 14 11 25 30 20 75Vocational/technical education
after high school or some college 16,186 # 6 9 18 39 27 81
College graduate 9,877 # 2 3 8 55 33 91
Graduate or professional school 8,797 # 1 3 4 38 54 93
Parents’ language
Both/only parent(s) speak(s) English 45,505 # 7 8 16 39 29 85
One of two parents speaks English 1,090 0 6 4 14 27 49 66
No parent speaks English 4,793 1! 9 4 10 36 41 61
Student’s grade level2
K–1st grade 7,823 # 6 4 13 44 34 †
2nd–3rd grade 7,696 # 7 5 15 40 33 †
4th–5th grade 8,368 # 7 7 16 39 30 †
6th–8th grade 12,170 # 8 8 15 37 31 83
9th–10th grade 7,783 1 10 10 17 35 27 82
11th–12th grade 7,543 1! 7 11 17 38 27 83
Student’s race/ethnicity
White, non-Hispanic 31,931 1 7 8 15 42 27 87
Black, non-Hispanic 8,165 # 9 7 17 30 36 76
Hispanic 8,250 # 8 6 16 36 34 72Asian or Pacifi c Islander,
non-Hispanic 1,453 # 2! 1! 9 30 56 76
Other, non-Hispanic 1,588 1! 10 8 20 31 29 85
Student’s sex
Male 26,328 1 9 10 15 38 28 82
Female 25,060 # 6 5 16 39 33 83
See notes at end of table.

N A T I O N A L C E N T E R F O R E D U C A T I O N S T A T I S T I C S84
Elementary and Secondary Education
their satisfaction with the school, their children’s teachers in 2002–03, the academic standards of the school, and order and discipline at the school. In addition, parents were asked about the amount of homework assigned and the amount of standardized testing at the school.
■ The percentage of students in kindergarten through grade 12 whose parents reported their children’s school did “very well” at providing information about the student’s performance was lower among students in public, assigned schools (58 percent) than in pub-lic schools selected by parents and private schools (64 to 76 percent).
■ The percentage of students in kindergarten through grade 12 whose parents reported being “very satis-fi ed” with their school was higher for students whose parents had graduated from college (64 percent) or attended graduate or professional school (64 percent) than for students whose parents’ highest education was a high school education or the equivalent (59 percent) or less than a high school education (56 percent).
School Choice
Parents of public school students were asked if their chil-dren were in a regularly assigned school or a school that they chose. They were also asked whether the family had moved to the neighborhood so that the student would be eligible for the school.
■ The percentage of public school students in kinder-garten through grade 12 whose parents reported that their children attended a public school of choice was higher for Black, non-Hispanic students (25 percent) and Asian or Pacifi c Islander, non-Hispanic students (22 percent) than for White, non-Hispanic students (13 percent) (table C). The percentage of public school students in kindergarten through grade 12 whose parents reported their children attended a public school of choice was also higher for Black, non-Hispanic students (25 percent) than for Hispanic students (14 percent).
■ The percentage of public school students in kinder-garten through grade 12 whose parents reported they moved to the neighborhood so that their child would be eligible for the school was higher for students
Table B. Percentage of students in grades K through 12 whose parents reported educational expectations and plans to help pay for education after high school, by educational attainment expectation and selected characteristics: 2002–03—Continued
Parent expects student to . . .
Characteristic
Number of students in grades K through
12 (thousands)
Receive less than a
high school diploma
Graduate from high
school
Attend vocational
or technical school after high school
Attend 2 or more years
of college
Finish 4- or 5-
year college degree
Earn a graduate or
professional degree
Family plans to help pay for student
education after high
school1
Student grades or marks3
Mostly A’s or excellent 20,868 # 3 2 9 40 45 85
Mostly B’s or above average 18,673 # 6 7 19 43 24 83
Mostly C’s or average 9,785 1 16 14 22 31 15 76Mostly D’s or lower, or below
average or failing 2,062 5 25 23 17 20 10 75
† Not applicable.# Rounds to zero.! Interpret data with caution.1This question was only asked of parents of children in grades 6 through 12 who expected their children to continue education after high school. 2Students whose parents reported that their classes were “ungraded” were excluded from the analyses of grade level.3Parents were asked whether overall, across all subjects, the student got mostly A’s, mostly B’s, mostly C’s, mostly D’s or lower, or whether the student’s school did not give those grades. If the student’s school did not give letter grades (e.g., A, B, C), parents were asked whether they would describe the student’s work at school as excellent, above average, average, below average, or failing. The two questions about grades or marks were combined for the table. NOTE: Students who were homeschooled were excluded from the table. Detail may not sum to totals because of rounding.SOURCE: U.S. Department of Education, National Center for Education Statistics, Parent and Family Involvement in Education Survey of the 2003 National Household Education Surveys Program (PFI-NHES:2003). (Originally published as table 10 on pp. 33–34 of the complete report from which this article is excerpted.)

E D U C A T I O N S T A T I S T I C S Q U A R T E R L Y — V O L U M E 7, I S S U E S 1 & 2, 2 0 0 5 85
Parent and Family Involvement in Education: 2002–03
Table C. Percentage distribution of public school students in grades K through 12 by school choice and percent of students whose families moved to neighborhood for students to attend school, by household and student characteristics: 2002–03
Enrollment by school choice
Characteristic
Number of students in grades K through 12
(thousands)
Student is in assigned
school
Student is in chosen
school
Student’s assigned school is school of
choice
Family moved to neighborhood so
student eligible for school
Total 45,790 83 15 2 26
Household poverty status
Above poverty level 36,181 83 15 2 27
At or below poverty level 9,609 82 17 2 22
Parents’ highest education level
Less than high school 3,535 80 18 2! 22
High school graduate or equivalent 12,262 83 15 2 24Vocational/technical education after high
school or some college 14,822 83 15 2 24
College graduate 8,144 83 14 2 29
Graduate or professional school 7,028 83 16 2 35
Parents’ language
Both/only parent(s) speak(s) English 40,298 83 16 2 26
One of two parents speaks English 991 76 22 3! 30
No parent speaks English 4,501 85 13 1 29
Student’s grade level1
K–1st grade 6,798 82 16 2 26
2nd–3rd grade 6,770 81 17 2 26
4th–5th grade 7,436 81 16 2 27
6th–8th grade 10,903 84 15 1 27
9th–10th grade 7,058 83 15 2 24
11th–12th grade 6,819 85 14 1 27
Student’s race/ethnicity
White, non-Hispanic 27,955 85 13 2 28
Black, non-Hispanic 7,472 74 25 1 19
Hispanic 7,672 84 14 2 26
Asian or Pacifi c Islander, non-Hispanic 1,252 78 22 # 33
Other, non-Hispanic 1,439 79 21 1! 19
Student’s sex
Male 23,496 83 15 2 26
Female 22,295 83 15 2 26
# Rounds to zero.! Interpret data with caution.1Students whose parents reported that their classes were “ungraded” were excluded from the analyses of grade level.NOTE: Students who were homeschooled were excluded from the table. Detail may not sum to totals because of rounding.SOURCE: U.S. Department of Education, National Center for Education Statistics, Parent and Family Involvement in Education Survey of the 2003 National Household Education Surveys Program (PFI-NHES:2003). (Originally published as table 14 on p. 49 of the complete report from which article is excerpted.)

N A T I O N A L C E N T E R F O R E D U C A T I O N S T A T I S T I C S86
Elementary and Secondary Education
Data source: The Parent and Family Involvement in Education Survey of the 2003 National Household Education Surveys Program (PFI-NHES:2003).
For technical information, see the complete report:
Vaden-Kiernan, N., and McManus, J. (2005). Parent and Family Involvement in Education: 2002–03 (NCES 2005-043).
Author affi liations: N. Vaden-Kiernan and J. McManus, Westat.
For questions about content, contact Chris Chapman ([email protected]).
To obtain the complete report (NCES 2005-043), call the toll-free ED Pubs number (877-433-7827) or visit the NCES Electronic Catalog (http://nces.ed.gov/pubsearch).
whose parents had graduated from college (29 per-cent) or attended graduate or professional school (35 percent) than for children whose parents had completed vocational or technical education after high school or some college (24 percent), children whose parents’ highest education was a high school education or the equivalent (24 percent), or children whose parents had less than a high school education (22 percent) (table C).
Services Provided for Students With Disabilities
Parents of students with disabilities were asked about the sources of services received for their children’s special health needs (e.g., the local school district, a doctor, a clin-ic, or other health care provider), Individualized Education Program (IEP) services, and their children’s participation in special education.
■ The percentage of students with disabilities in kinder-garten through grade 12 whose parents reported that their children received services through an IEP and that the family worked with the school to develop or change the student’s IEP was lowest for students whose parents did not have a high school diploma (71 percent) and highest for students whose parents had attended gradu-ate or professional school (96 percent).
■ The percentage of students with disabilities in kinder-garten through grade 12 whose parents reported that their children received services through an IEP and that the family worked with the school to develop or change the student’s IEP was higher for White, non-Hispanic students (92 percent) than for Black, non-Hispanic students (81 percent), and higher for both White, non-Hispanic (92 percent) and Asian or Pacifi c Islander, non-Hispanic students (93 percent) than for Hispanic students (75 percent).
ReferenceMontaquila, J.M., Brick, J.M., and Brock, S.P. (forthcoming). Poten-
tial Nonresponse Bias in Estimates From the National Household Education Surveys Program of 2003. U.S. Department of Educa-tion. Washington, DC: National Center for Education Statistics.

E D U C A T I O N S T A T I S T I C S Q U A R T E R L Y — V O L U M E 7, I S S U E S 1 & 2, 2 0 0 5 87
High School Dual EnrollmentDual Enrollment of High School Students at Postsecondary Institutions: 2002–03—————————————————————————Brian Kleiner and Laurie Lewis
This article was originally published as the Summary of the E.D. TAB of the same name. The sample survey data are from the “Dual Enrollment Programs and Courses for High School Students” survey conducted through the Postsecondary Education Quick Information System (PEQIS).
This article provides data from a nationally representative survey of Title IV degree-granting postsecondary insti-tutions on the topic of dual enrollment of high school students. Dual enrollment, also known as “dual credit,” “concurrent enrollment,” and “joint enrollment,” refers to the participation in college-level courses and the earning of college credits by high school students. Dual enrollment is viewed as providing high school students benefi ts such as greater access to a wider range of rigorous academic and technical courses, savings in time and money on a college degree, promoting effi ciency of learning, and enhancing admission to and retention in college. By providing a pathway for students to move seamlessly between K–12 and postsecondary systems, dual enrollment is thought to promote greater support for students’ college aspira-tions and greater collaboration between high schools and colleges (Bailey and Karp 2003; Clark 2001). In an effort to prepare high school students for college, 38 states have enacted dual enrollment policies that support the devel-opment of programs that promote a smoother transition between high school and postsecondary education (Karp et al. 2004). However, at present, there is no existing national source of information on dual enrollment of high school students at postsecondary institutions. The “Dual Enroll-ment Programs and Courses for High School Students” survey, undertaken by the National Center for Education Statistics (NCES), Institute of Education Sciences, U.S. Department of Education, was designed to provide policy-makers, researchers, educators, and administrators with baseline information on the prevalence and characteristics of dual enrollment programs. While the majority of the survey’s questions focused on dual enrollment programs, several key questions also revealed the prevalence of col-lege coursetaking outside of dual enrollment programs by high school students. The survey was requested by the Offi ce of Vocational and Adult Education, U.S. Department of Education.
The front page of the survey included a defi nition and description of dual enrollment. For this study, dual enroll-ment was defi ned as high school students who earn college credits for courses taken through a postsecondary institution. The defi nition specifi ed that courses could be part of a dual enrollment program, or courses could be taken outside of a
dual enrollment program. A dual enrollment program was defi ned as an organized system with special guidelines that allows high school students to take college-level courses. The guidelines might delineate entrance or eligibility require-ments, funding, limits on coursetaking, and so on. High school students who simply enrolled in college courses and were treated as regular college students were not considered to be participating in a dual enrollment program. Credit for courses could be earned at both the high school and college levels simultaneously or only at the college level, and credit could be earned immediately or upon enrollment at the post-secondary institution after high school graduation. Courses could be taught on a college campus, on a high school cam-pus, or at some other location. The time frame for the survey was the 2002–03 12-month academic year, including courses taken during summer sessions.1 The survey defi nition also specifi ed that information about summer bridge programs for students who had already graduated from high school should not be included.
This survey was conducted by NCES using the Postsec-ondary Education Quick Information System (PEQIS).2 PEQIS is a survey system designed to collect small amounts of issue-oriented data from a previously recruit-ed, nationally representative sample of institutions, with minimal burden on respondents and within a relatively short period of time. Questionnaires for the survey “Dual Enrollment Programs and Courses for High School Students” were mailed in February 2004 to the PEQIS survey coordi-nators at the approximately 1,600 Title IV degree-granting postsecondary institutions in the 50 states and the District of Columbia that compose the PEQIS panel. Coordinators were informed that the survey was designed to be com-pleted by the person(s) at the institution most knowledge-able about the institution’s dual enrollment programs and courses. Respondents were given the option of completing the survey online. Data were adjusted for questionnaire non-response and weighted to yield national estimates that rep-resent all Title IV eligible, degree-granting institutions in the
1The summer session included in the 2002–03 12-month academic year (i.e., the summer session of 2002 or the summer session of 2003) was whichever one each institution considered to be part of that 12-month academic year.
2More information about PEQIS may be found at http://nces.ed.gov/surveys/peqis.

N A T I O N A L C E N T E R F O R E D U C A T I O N S T A T I S T I C S88
Elementary and Secondary Education
United States.3 The unweighted response rate was 92 per-cent, and the weighted response rate4 was 93 percent.
Survey respondents at selected postsecondary institutions were asked to report on the prevalence of college course-taking by high school students at their institutions during the 2002–03 12-month academic year, both within and outside of dual enrollment programs. Among institutions with dual enrollment programs, additional information was obtained on the characteristics of programs, including course location and type of instructors, program and course curriculum, academic eligibility requirements, and funding. Institutions with dual enrollment programs were also asked whether they had programs specifi cally geared toward high school students at risk of education failure; if they answered yes, they were asked a series of questions about the features of such special programs.
The primary focus of this article is to present national estimates on dual enrollment. In addition, selected survey fi ndings are presented by the following institution characteristics:
■ Institution type: public 2-year, private 2-year, public 4-year, and private 4-year. Institution type was cre-ated from a combination of level (2-year and 4-year) and control (public and private). Two-year institu-tions are defi ned as institutions at which the high-est level of offering is at least 2 but less than 4 years (below the baccalaureate degree); 4-year institutions are those at which the highest level of offering is 4 or more years (baccalaureate or higher degree). Private institutions comprise private nonprofi t and private for-profi t institutions; these institutions are reported together because there are too few private for-profi t institutions in the survey sample to report them as a separate category.
■ Size of institution: less than 3,000 students, 3,000 to 9,999 students, and 10,000 or more students. These are referred to in the text as small, medium, and large institutions, respectively.
In general, comparisons by these institution characteris-tics are presented only where signifi cant differences were
detected and follow meaningful patterns. It is important to note that the characteristics of type and size are related to each other. For example, private institutions tend to be smaller than public ones. However, this E.D. TAB focuses on bivariate relationships between the analysis variables (institution type and size) and questionnaire variables rather than on more complex analyses.
All specifi c statements of comparison made in this report have been tested for statistical signifi cance through t tests and are signifi cant at the 95 percent confi dence level. However, only selected fi ndings are presented for each topic in the report. Throughout this report, differences that may appear large may not be statistically signifi cant due to the relatively large standard errors surrounding the estimates (because of the small sample size).
Interested readers may refer to a companion E.D. TAB, published by NCES, entitled Dual Credit and Exam-Based Courses in U.S. Public High Schools: 2002–03 (Waits, Setzer, and Lewis 2005). The companion report describes nation-ally representative fi ndings from a complementary high school-level survey requested by the Offi ce of Vocational and Adult Education and conducted by NCES through the Fast Response Survey System (FRSS). Unlike the survey for the current report, which focused more broadly on dual enrollment, the FRSS survey focused on dual credit, where dual credit was defi ned as a course or program where high school students can earn both high school and postsecond-ary credits for the same course.
The fi ndings in this article are organized as follows:
■ prevalence of and enrollment in dual enrollment programs and college-level courses outside of dual enrollment programs;
■ characteristics of dual enrollment programs and courses, such as location, instructors, curriculum, eligibility requirements, and funding; and
■ dual enrollment programs specifi cally geared toward students at risk of education failure.
Prevalence of and Enrollment in Dual Enrollment Programs and College-Level Courses
The survey asked whether institutions had any high school students who took courses for college credit during the 2002–03 12-month academic year. Institutions that did were then asked whether high school students took college-level courses outside of any dual enrollment program, followed by a question on whether any high school students took courses for college credit that were part of a dual
3Institutions participating in Title IV federal student fi nancial aid programs (such as Pell grants or Stafford loans) are accredited by an agency or organization recognized by the U.S. Department of Education, have a program of over 300 clock hours or 8 credit hours, have been in business for at least 2 years, and have a signed Program Participation Agreement with the Offi ce of Postsecondary Education (OPE), U.S. De-partment of Education. Degree-granting institutions are those that offer an associate’s, bachelor’s, master’s, doctoral, or fi rst-professional degree (Knapp et al. 2001).
4All weighted response rates were calculated using the base weight (i.e., the inverse of the probability of selection).

E D U C A T I O N S T A T I S T I C S Q U A R T E R L Y — V O L U M E 7, I S S U E S 1 & 2, 2 0 0 5 89
Dual Enrollment of High School Students at Postsecondary Institutions: 2002–03
enrollment program. If any high school students took courses outside of or within dual enrollment programs, institutions were asked to provide the number of students who did so.
Prevalence of dual enrollment programs and college coursetaking
■ During the 2002–03 12-month academic year, 57 percent of all Title IV degree-granting institutions had high school students taking courses for college credit within or outside of dual enrollment programs. Forty-eight percent of institutions had dual enroll-ment programs for high school students taking col-lege courses, and 31 percent of institutions had high school students taking college courses outside of such programs.
■ Of the 57 percent of institutions that had high school students who took courses for college credit during the 2002–03 12-month academic year, 85 percent had high school students taking courses for college credit in dual enrollment programs, and 55 percent had students who took college courses outside of dual enrollment programs.
■ Of those institutions with any high school students taking courses for college credit, 45 percent had high school students taking college-level courses within dual enrollment programs only, 15 percent had high school students taking college-level courses outside of dual enrollment programs only, and 40 percent had high school students taking college-level courses both within and outside of those programs (fi gure 1).
■ Ninety-eight percent of public 2-year institutions had high school students taking courses for college credit during the 2002–03 12-month academic year, compared to 77 percent of public 4-year institutions, 40 percent of private 4-year institutions, and 17 per-cent of private 2-year institutions.
■ Among all institutions, a greater percentage of public 2-year institutions than public 4-year and private 4-year institutions had high school students taking college-level courses within dual enrollment programs (93 percent versus 64 and 29 percent, respectively). Similarly, a greater percentage of public 2-year insti-tutions than public 4-year and private 4-year institu-tions had high school students taking college-level courses outside of dual enrollment programs (63 per-cent versus 40 and 18 percent, respectively).
Figure 1. Percentage distribution of Title IV degree-granting institutions with any high school students taking courses for college credit, by whether courses were taken within dual enrollment programs only, outside of dual enrollment programs only, or both within and outside of programs: 12-month academic year, 2002–03
NOTE: Percentages are based on the 2,410 institutions with any high school students taking courses for college credit. Detail may not sum to totals because of rounding.SOURCE: U.S. Department of Education, National Center for Education Statistics, Postsecondary Education Quick Information System (PEQIS), “Dual Enrollment Programs and Courses for High School Students,” PEQIS 14, 2004.
Within dual enrollment programs only (45%)
Outside of dual enrollment programs only (15%)
Both within and outside of dual enrollment programs (40%)

N A T I O N A L C E N T E R F O R E D U C A T I O N S T A T I S T I C S90
Elementary and Secondary Education
■ Among institutions with high school students taking college-level courses, a higher percentage of public 2-year institutions than public 4-year and private 4-year institutions had high school students taking courses within dual enrollment programs (95 percent versus 83 and 73 percent, respectively). Similarly, among those institutions with high school students taking college-level courses, a higher percentage of public 2-year institutions than public 4-year and private 4-year institutions had high school students taking courses outside of dual enrollment programs (64 percent versus 52 and 45 percent, respectively).
■ Forty-four percent of small institutions had high school students taking courses for college credit, compared to 83 percent of medium institutions and 94 percent of large institutions.
■ Based on all institutions, a lower percentage of small institutions than medium and large institutions had high school students taking courses for college credit within dual enrollment programs (36 percent versus 74 and 79 percent, respectively). In addition, based on all institutions, a lower percentage of small insti-tutions than medium and large institutions had high
school students taking courses outside of dual enroll-ment programs (22 percent versus 51 and 50 percent, respectively).
Enrollment of high school students in dual enrollment programs and college-level courses
■ Overall, approximately 813,000 high school students took college-level courses through postsecondary institutions, either within or outside of dual enrollment programs, during the 2002–03 12-month academic year. This number represents about 5 percent of all high school students. In fall 2001 (the last year for which data are available), there were over 15 million students enrolled in public and private high schools in the United States (U.S. Department of Education 2003).
■ Approximately 680,000 high school students took courses for college credit within dual enrollment programs. Fewer high school students (approximately 133,000) took college-level courses outside of dual enrollment programs. Thus, 84 percent of high school students who took courses for college credit through postsecondary institutions did so as part of a dual enrollment program (fi gure 2).
Figure 2. Percentage distribution of high school students taking courses for college credit within or outside of dual enrollment programs: 12-month academic year, 2002–03
NOTE: Percentages are based on the 812,700 high school students who took college-level courses at the 2,410 Title IV degree-granting institutions with any high school students taking courses for college credit during the 2002–03 12-month academic year. Detail may not sum to totals because of rounding.SOURCE: U.S. Department of Education, National Center for Education Statistics, Postsecondary Education Quick Information System (PEQIS), “Dual Enrollment Programs and Courses for High School Students,” PEQIS 14, 2004.
High school students taking college courses outside of dual enrollment programs (16%)
High school students taking college courses within dual enrollment
programs (84%)

E D U C A T I O N S T A T I S T I C S Q U A R T E R L Y — V O L U M E 7, I S S U E S 1 & 2, 2 0 0 5 91
Dual Enrollment of High School Students at Postsecondary Institutions: 2002–03
■ Public 2-year institutions had more high school students who took college-level courses than pub-lic 4-year and private 4-year institutions during the 2002–03 12-month academic year (619,000 versus 122,000 and 67,000, respectively). Thus, 77 per-cent of high school students who took college-level courses were in public 2-year institutions, versus 15 percent in public 4-year and 8 percent in private 4-year institutions (fi gure 3).
■ Public 2-year institutions also had more high school students than public 4-year and private 4-year insti-tutions within dual enrollment programs (517,000 versus 100,000 and 60,000, respectively) and outside of dual enrollment programs (102,000 versus 22,000 and 7,000, respectively).
■ Small institutions had fewer high school students taking college-level courses than medium and large institutions during the 2002–03 12-month academic year (171,000 versus 308,000 and 333,000, respec-tively). Similarly, small institutions had fewer high school students taking college-level courses than me-dium and large institutions, both within dual enroll-ment programs (149,000 versus 249,000 and 282,000,
respectively) and outside of dual enrollment programs (23,000 versus 59,000 and 51,000, respectively).
Characteristics of Dual Enrollment Programs
Those institutions that reported having high school stu-dents who took courses for college credit within dual en-rollment programs were asked about the characteristics of their programs. The topics explored in the survey included course location, course instructors, program curriculum, academic eligibility requirements, and funding.
Course location and type of instructors
Institutions with dual enrollment programs were asked whether high school students in the dual enrollment pro-grams took courses on the campus of the institution, on a high school campus, or at some other location. Institutions with courses taught on a high school campus were also asked whether the courses in the dual enrollment programs were taught by college instructors only, high school instruc-tors only, or by both high school and college instructors. If institutions indicated that at least some courses were taught by high school instructors, they were asked how the minimum qualifi cations for high school instructors who
Figure 3. Percentage distribution of high school students taking courses for college credit, by institution type: 12-month academic year, 2002–03
NOTE: Percentages are based on the 812,700 high school students who took college-level courses at the 2,410 Title IV degree-granting institutions with any high school students taking courses for college credit during the 2002–03 12-month academic year. Data for private 2-year institutions are not reported in a separate category because too few private 2-year institutions in the sample had any dual enroll-ment of high school students in 2002–03 to make reliable estimates. Detail may not sum to totals because of rounding.SOURCE: U.S. Department of Education, National Center for Education Statistics, Postsecondary Education Quick Information System (PEQIS), “Dual Enrollment Programs and Courses for High School Students,” PEQIS 14, 2004.
High school students taking college courses at public 4-year institutions (15%)
High school students taking college courses at public 2-year institutions (77%)
High school students taking college coursesat private 4-year institutions (8%)

N A T I O N A L C E N T E R F O R E D U C A T I O N S T A T I S T I C S92
Elementary and Secondary Education
taught the courses compared to the qualifi cations required for college instructors.
■ Among institutions with dual enrollment programs, 80 percent offered courses taken by high school students on their college campus, 55 percent offered courses on a high school campus, and 12 percent offered courses at some other location.5
■ A greater percentage of public 2-year than public 4-year and private 4-year institutions offered the courses taken by high school students on a high school campus (73 percent versus 47 and 28 percent, respectively).
■ Of those institutions with dual enrollment programs with courses taught on a high school campus, 26 per-cent reported that the courses were taught by college instructors only, 32 percent reported high school instructors only, and 42 percent reported both college and high school instructors.
■ A smaller percentage of private 4-year institutions had the courses taught on a high school campus taught by college instructors only, compared to pub-lic 2-year and public 4-year institutions (10 percent versus 28 and 31 percent, respectively).
■ Of those institutions with dual enrollment programs with at least some courses taught by high school instructors, 86 percent said that the minimum qua-lifi cations for high school instructors were the same as those required for college instructors, compared to 6 percent that said that the minimum qualifi cations were different. Four percent of institutions said that they had no set policy with respect to minimum qualifi cations, and 5 percent said that it varied.
■ A higher percentage of public 2-year institutions than public 4-year institutions reported the same mini-mum qualifi cations for high school instructors as for college instructors with respect to teaching college-level courses (90 percent versus 73 percent).
Curriculum and coursetaking patterns
Institutions were asked several questions regarding dual enrollment program curriculum and coursetaking patterns, including the typical coursetaking pattern for high school students and the maximum number of courses allowed per academic term. Institutions were also asked whether the curriculum for courses taken in the programs was specially designed for high school students.
■ Among institutions with dual enrollment programs, 48 percent of institutions responded that one course per academic term most closely resembled the typical high school enrollment pattern during the 2002–03 12-month academic year, compared to 19 percent that responded two courses per academic term, and 4 percent that responded three or more courses per academic term. Twenty-eight percent of institutions said that it varied.6
■ A higher percentage of public 4-year and private 4-year institutions than public 2-year institutions reported one course per academic term as the typi-cal pattern of high school enrollments (56 and 64 percent, respectively, versus 36 percent). A higher percentage of public 2-year institutions than public 4-year and private 4-year institutions reported that the typical pattern varied (37 percent versus 28 and 12 percent, respectively).
■ Fourteen percent of institutions with dual enrollment programs said that one course was the maximum number allowed per academic term, 30 percent report-ed allowing a maximum of two courses per academic term, and 25 percent reported allowing three or more courses per academic term. Another 31 percent of institutions said that there was no maximum number of courses per academic term.
■ A greater percentage of private 4-year institutions than public 2-year and public 4-year institutions allowed a maximum of one course per academic term (33 percent versus 5 and 11 percent, respectively). Thirty-eight percent of public 2-year institutions had no maximum number of courses per academic term, compared to 31 percent of public 4-year and 19 per-cent of private 4-year institutions.
■ A smaller percentage of large institutions allowed a maximum of one course per academic term, com-pared to small and medium institutions (8 percent versus 18 and 11 percent, respectively).
■ Eighty-nine percent of institutions said that the cur-riculum of the college-level courses taken by high school students as part of their dual enrollment programs was the same as for regular college stu-dents, compared to 3 percent of institutions that said
6The “it varied” response could indicate that there was no typical pattern of high school enrollments within a single program, or else that multiple programs within an institution had different typical patterns.
5The percentage of institutions with courses for high school students offered on their college campus, on a high school campus, or at some other location sum to more than 100 percent because institutions may have offered courses at more than one location. Other locations included community centers, vocational/technical schools, and hospitals. Respondents also included online courses as “other locations.”

E D U C A T I O N S T A T I S T I C S Q U A R T E R L Y — V O L U M E 7, I S S U E S 1 & 2, 2 0 0 5 93
Dual Enrollment of High School Students at Postsecondary Institutions: 2002–03
that the curriculum was specially designed for high school students, and 8 percent that said it varied.7
Credit awarded
Institutions were asked about when high school students were generally awarded college credit for courses taken, and whether they earned credit at the high school level for courses taken.
■ Ninety-four percent of institutions with dual enroll-ment programs awarded college credit for courses immediately after course completion, compared to 3 percent that awarded credit upon enrollment of students at their institutions and another 3 percent that awarded credit in some other way.8
■ Fifty-nine percent of institutions with dual enrollment programs indicated that credit for college courses was earned at both the high school and college level, compared to 6 percent where credit was earned at the college level only, and 21 percent where it varied.9 Four-teen percent of institutions did not know whether credit was earned at the high school level.
■ A greater percentage of respondents at private 4-year institutions than at public 2-year and public 4-year institutions did not know whether credit for courses was earned at the high school level (25 percent ver-sus 9 and 14 percent, respectively).
Academic eligibility requirements
Institutions with dual enrollment programs were asked a series of questions pertaining to academic eligibility require-ments for high school students to participate in the dual enrollment programs. Institutions were asked whether they had academic eligibility requirements, what were the requirements, and whether their academic eligibility requirements were the same or different than their institu-tions’ admissions standards for regular college students. In addition, institutions were asked to identify the grade levels at which high school students were eligible to take courses in dual enrollment programs.
Prevalence and type of requirements
■ Among institutions with dual enrollment programs, 85 percent had academic eligibility requirements for high school students to participate. A higher percentage of public 4-year institutions than public 2-year and private 4-year institutions had academic eligibility requirements (93 percent versus 83 and 81 percent, respectively).
■ A higher percentage of institutions with dual enroll-ment programs that had academic eligibility require-ments had a minimum high school grade point average (GPA) requirement, compared to other kinds of requirements (66 percent versus 16 to 45 percent). Forty-fi ve percent of the institutions used a minimum score on a standardized test, 44 percent used a college placement test, and 16 percent used minimum high school class rank as academic eligibility requirements for high school students to participate in dual enroll-ment programs. Thirty-one percent had some other academic eligibility requirements, including recom-mendations or permission (from a high school princi-pal, guidance counselor, or parent/guardian), course prerequisites, strong high school attendance, junior or senior grade level, or an essay or written letter.
■ Public 4-year and private 4-year institutions used minimum high school GPA as an academic eligibility requirement more frequently than 2-year institutions (79 and 86 percent, respectively, versus 46 percent). A higher percentage of public 2-year institutions than public 4-year and private 4-year institutions required passing a college placement test (73 percent versus 22 and 13 percent, respectively).
■ A greater percentage of public 4-year institutions than public 2-year and private 4-year institutions required a minimum score on a standardized test (60 percent versus 43 and 37 percent, respectively) and a minimum high school class rank (28 percent versus 8 and 19 percent, respectively).
Minimum high school GPA
■ Of those institutions with dual enrollment programs that had a minimum high school GPA requirement, the highest percentage (44 percent) required a mini-mum GPA between 2.75 and 3.24, compared to 7 per-cent that required between 1.75 and 2.24, 10 percent that required between 2.25 and 2.74, 22 percent that required between 3.25 and 3.74, and 3 percent that
7“It varied” could mean that the curriculum varied within a single program (e.g., was the same as for regular college students for some courses, but different for others), or else that the curriculum varied across multiple programs within an institution (i.e., was the same as for regular college students in one program, but specially designed for high school students in another program).
8Of the roughly 20 “other ways” cited by respondents, about half noted that credits were awarded after high school graduation. The remaining responses varied.
9The “it varied” response could indicate that credit was earned in various ways within a single program, or else that credit was earned in different ways across multiple programs within an institution.

N A T I O N A L C E N T E R F O R E D U C A T I O N S T A T I S T I C S94
Elementary and Secondary Education
required a minimum GPA of 3.75 or above. Four-teen percent of institutions said that it varied.10
■ A lower percentage of public 2-year institutions than public 4-year and private 4-year institutions required a minimum GPA between 3.25 and 3.74 (15 percent versus 27 and 29 percent, respectively).
Comparability of admissions standards
■ Of the 85 percent of institutions with dual enrollment programs that had academic eligibility requirements for high school students to participate, 38 percent indicated that their requirements were the same as admissions standards for regular college students, while 62 percent indicated that their requirements were different from admissions standards for regular college students.
■ Fifty-fi ve percent of public 2-year institutions report-ed that their academic eligibility requirements were the same as admissions standards for regular college students, compared to 21 percent of public 4-year and 27 percent of private 4-year institutions.
Eligible grade levels
■ Among institutions with dual enrollment programs, 96 percent allowed grade 12 high school students to take courses in the programs,11 86 percent al-lowed grade 11 students, 28 percent allowed grade 10 students, 16 percent allowed grade 9 students, and 2 percent allowed students in grades lower than grade 9.
■ A greater percentage of public 2-year institutions than public 4-year and private 4-year institutions al-lowed grade 9 (21 percent versus 15 and 12 percent, respectively) and grade 10 high school students (35 percent versus 26 and 18 percent, respectively) to take courses in dual enrollment programs. A smaller percentage of private 4-year institutions allowed grade 11 high school students to take courses in dual enrollment programs, compared to public 2-year and public 4-year institutions (76 percent versus 93 and 89 percent, respectively).
■ A greater percentage of large than of small or medium institutions allowed grade 9 (26 percent versus 14 and 16 percent, respectively), grade 10 (40 percent
versus 23 and 30 percent, respectively), and grade 11 (93 percent versus 83 and 88 percent, respectively) high school students to take courses in dual enroll-ment programs.
Funding
Institutions with dual enrollment programs were asked two questions relating to sources of funding for courses taken by high school students in their programs. The fi rst addressed the various sources for tuition payment, and the second ad-dressed how much high school students (and their parents) generally paid out of pocket for the college-level courses taken as part of dual enrollment programs.
■ Sixty-four percent of institutions with dual enroll-ment programs reported that parents and students were a source for tuition for courses taken as part of the programs. Thirty-eight percent of institutions in-dicated that their own postsecondary institution was a source for tuition (including both actual contribu-tions and tuition waivers), 37 percent said that high schools and public school districts were a source, and 26 percent said that their state was a source for tuition.12 Nine percent indicated that there was some other source(s) for tuition. The most commonly cited other sources included various federal and county grants, as well as scholarships from local businesses and nonprofi t organizations.
■ A lower percentage of private 4-year institutions than public 2-year and public 4-year institutions indicated that high schools/public school districts (21 percent versus 45 and 41 percent, respectively) and the state (15 percent versus 31 and 25 percent, respec-tively) were sources for tuition for courses taken in their dual enrollment programs. However, a higher percentage of private 4-year institutions than public 2-year and public 4-year institutions said that their own institution was a source for tuition (50 percent versus 33 percent each).
■ A smaller percentage of public 2-year institutions reported that parents and students were a source for tuition for courses taken in dual enrollment pro-grams, compared to public 4-year and private 4-year institutions (56 percent versus 72 and 71 percent, respectively).
■ Twenty percent of institutions with dual enrollment programs indicated that students and parents gener-ally paid full tuition for college-level courses taken in their dual enrollment programs. Another 20 percent
12Multiple sources could have been selected.
10“It varied” could indicate that the minimum GPA varied within a single program, or else that the minimum required GPA was different across multiple programs within an institution.
11Four percent of institutions did not allow grade 12 students to participate in dual enrollment programs, while they did allow students in other grades (predominantly grade 11) to participate in dual enrollment programs.

E D U C A T I O N S T A T I S T I C S Q U A R T E R L Y — V O L U M E 7, I S S U E S 1 & 2, 2 0 0 5 95
Dual Enrollment of High School Students at Postsecondary Institutions: 2002–03
said that students and parents generally paid partial tuition. Twenty-three percent said that students and parents generally paid for books and/or fees only, and 19 percent said that students and parents gener-ally paid nothing for courses in the dual enrollment programs. Nineteen percent of institutions reported that the amount paid out of pocket by students and parents varied.13
■ A greater percentage of public 4-year institutions than public 2-year and private 4-year institutions indicated that students and parents generally paid full tuition for courses taken in dual enrollment programs (28 percent versus 20 and 13 percent, respectively). Thirty-eight percent of private 4-year institutions said that students and parents generally paid partial tuition out of pocket, compared to 10 percent of public 2-year and 17 percent of public 4-year institutions.
Dual Enrollment Programs Specifi cally for Students at Risk of Education Failure
Some postsecondary institutions have developed programs for at-risk students as a way of promoting high school reten-tion as well as enthusiasm for education among a population of students at risk of complete withdrawal from the educa-tion system. Institutions with dual enrollment programs were asked whether they had a formal dual enrollment pro-gram geared specifi cally toward high school students who were at risk of education failure. If there was a dual enroll-ment program for at-risk high school students, institutions were then asked about features of that program, such as the number of students in the program, the primary focus of the program, the typical pattern of enrollments, and any extra support services provided to the at-risk students.
■ Among the estimated 2,050 institutions with dual enrollment programs, approximately 110 (5 percent) had dual enrollment programs specifi cally geared to-ward high school students at risk of education failure. Two percent of all institutions had such programs.
■ During the 2002–03 12-month academic year, there were approximately 6,400 students enrolled in dual enrollment programs geared specifi cally toward high school students at risk of education failure.14
■ Thirty-nine percent of institutions with dual enroll-ment programs geared toward students at risk of education failure reported that the primary focus of the program was career/technical (fi gure 4). Thirty-four percent said that the primary focus was academ-ic, and 21 percent said that the primary focus was equally academic and career/technical. Six percent reported some other primary focus.
■ Forty percent of institutions with dual enrollment programs for at-risk students indicated that the most common pattern of enrollments in such programs was one course per academic term, 14 percent reported two courses per academic term, 8 percent reported three or more courses per academic term, and 38 percent reported that the number of courses students took varied considerably (fi gure 5).
■ Sixty percent of institutions with programs for at-risk students provided extra support services specifi cally for the students in the program, such as tutoring, academic advising, study skills workshops, and pre-college counseling.15
■ Of those institutions with programs for at-risk stu-dents that provided extra support services, 84 percent provided academic advising, 82 percent provided tutoring, 76 percent provided study skills workshops, 75 percent offered college application/selection counseling, 62 percent offered fi nancial aid counsel-ing, and 38 percent offered other support services (fi gure 6). Mentoring and career counseling were commonly cited as other support services.
ReferencesBailey, T.R., and Karp, M. (2003). Promoting College Access and
Success: A Review of Credit-Based Transition Programs. U.S. Department of Education. Washington, DC: Offi ce of Adult and Vocational Education.
Clark, R.W. (2001). Dual Credit: A Report of Programs and Policies That Offer High School Students College Credits. Seattle, WA: Institute for Educational Inquiry.
Karp, M., Bailey, T.R., Hughes, K.L., and Fermin, B.J. (2004). State Dual Enrollment Policies: Addressing Access and Quality. U.S. Department of Education. Washington, DC: Offi ce of Adult and Vocational Education.
13“It varied” could indicate that the amount paid out of pocket by students and parents varied within a single program, or else that the amount paid varied across multiple programs within an institution.
14Standard error = 1,110.
15Standard error = 8.4. Respondents were asked to include only those support services beyond those usually provided to students taking courses through their institution.

N A T I O N A L C E N T E R F O R E D U C A T I O N S T A T I S T I C S96
Elementary and Secondary Education
Figure 4. Percentage distribution of Title IV degree-granting institutions with dual enrollment programs for at-risk high school students, by primary focus of such programs: 12-month academic year, 2002–03
NOTE: Percentages are based on the 110 institutions that had dual enrollment programs for at-risk high school students. Detail may not sum to totals because of rounding.SOURCE: U.S. Department of Education, National Center for Education Statistics, Postsecondary Education Quick Information System (PEQIS), “Dual Enrollment Programs and Courses for High School Students,” PEQIS 14, 2004.
Equally academic and career/technical focus (21%)
Academic focus (34%)
Career/technical focus (39%) Other focus (6%)
Figure 5. Percentage distribution of Title IV degree-granting institutions with dual enrollment programs for at-risk high school students, by typical patterns of enrollments in such programs: 12-month academic year, 2002–03
NOTE: Percentages are based on the 110 institutions that had dual enrollment programs for at-risk high school students. Detail may not sum to totals because of rounding.SOURCE: U.S. Department of Education, National Center for Education Statistics, Postsecondary Education Quick Information System (PEQIS), “Dual Enrollment Programs and Courses for High School Students,” PEQIS 14, 2004.
Two courses per academic term (14%)
One courseper academic
term(40%)
Number ofcoursesvaried
considerably(38%)
Three or more courses per academic term (8%)

E D U C A T I O N S T A T I S T I C S Q U A R T E R L Y — V O L U M E 7, I S S U E S 1 & 2, 2 0 0 5 97
Dual Enrollment of High School Students at Postsecondary Institutions: 2002–03
Knapp, L.G., Kelly, J.E., Whitmore, R.W., Wu, S., Gallego, L.M., and Grau, E. (2001). Postsecondary Institutions in the United States: Fall 2000 and Degrees and Other Awards Conferred: 1999–2000 (NCES 2002-156). U.S. Department of Education. Washington, DC: National Center for Education Statistics.
U.S. Department of Education. National Center for Education Statistics. (2003). Digest of Education Statistics, 2003. Retrieved February 24, 2005, from http://nces.ed.gov/programs/digest/d03.
Waits, T., Setzer, J.C., and Lewis, L. (2004). Dual Credit and Exam-Based Courses in U.S. Public High Schools: 2002–03 (NCES 2005-009). U.S. Department of Education. Washington, DC: National Center for Education Statistics.
Data source: The NCES Postsecondary Education Quick Information System (PEQIS), “Dual Enrollment Programs and Courses for High School Students,” PEQIS 14, 2004.
For technical information, see the complete report:
Kleiner, B., and Lewis, L. (2005). Dual Enrollment of High School Students at Postsecondary Institutions: 2002–03 (NCES 2005-008).
Author affi liations: B. Kleiner and L. Lewis, Westat.
For questions about content, contact Bernie Greene ([email protected]).
To obtain the complete report (NCES 2005-008), call the toll-free ED Pubs number (877-433-7827) or visit the NCES Electronic Catalog (http://nces.ed.gov/pubsearch).
Figure 6. Percent of Title IV degree-granting institutions with dual enrollment programs for at-risk high school students that had extra support services, by specifi c extra support services: 12-month academic year, 2002–03
NOTE: Percentages are based on the 60 institutions that had dual enrollment programs for at-risk high school students and provided extra sup-port services to students.SOURCE: U.S. Department of Education, National Center for Education Statistics, Postsecondary Education Quick Information System (PEQIS), “Dual Enrollment Programs and Courses for High School Students,” PEQIS 14, 2004.
Academicadvising
Tutoring
8482
76 75
62
38
Percent
Studyskills
workshops
Collegeapplication/
selectioncounseling
Financialaid
counseling
Othersupportservices
0
20
40
60
80
100
Extra support services

N A T I O N A L C E N T E R F O R E D U C A T I O N S T A T I S T I C S98
Elementary and Secondary Education
Background
Dual credit, whereby high school students can earn both high school and postsecondary credits for the same course, is an area in which interest has grown rapidly over the past decade (Bailey and Karp 2003; Clark 2001; Education Com-mission of the States 2004). However, there has been no ex-isting national source of information on dual credit courses at the high school level. This survey was requested by the Offi ce of Vocational and Adult Education, U.S. Department of Education, to provide baseline information regarding the prevalence and characteristics of dual credit courses. This survey also collected information on two types of exam-based courses, Advanced Placement (AP) and International Bac-calaureate (IB). These types of courses provide high school students with another way of bridging K–12 and postsec-ondary education.
Respondents for this survey were those selected by the school principal as the most knowledgeable about the school’s dual credit, AP, and IB courses. This was typically the school’s director of guidance counseling. Respondents were provided with a defi nition and description of dual credit and exam-based courses. For this study, dual credit was defi ned as a course or program where high school stu-dents can earn both high school and postsecondary credits for the same course. Dual credit courses could be located on a high school campus or the campus of a postsecondary institution, or taught through distance education. These courses might include courses with an academic focus, such as English, history, or foreign language, or those with a career and technical/vocational focus, such as computer maintenance technology and automotive technology. Ad-ditionally, the dual credit options must be either legislated by the state or have an articulated or other formal written agreement between the high school and the postsecondary institution.
AP courses were defi ned as courses that follow the content and curricular goals as described in the AP Course Descrip-tion booklets, developed and published by the College Board. A qualifying score on an AP exam may give the student col-lege credit or advanced standing in a college in the subject area in which the course/exam was taken. IB courses were defi ned as courses that compose a 2-year liberal arts cur-
riculum that leads to a diploma and meets the requirements established by the International Baccalaureate program. Students taking these courses are in grades 11 and 12 and must meet all requirements and pass examinations in each subject area in order to receive the IB diploma. In some schools, students who are not seeking the IB diploma are allowed to take individual IB courses. AP and IB credit is only given at the discretion of the colleges and therefore oc-curs after students have applied and been accepted to a col-lege, whereas dual credit courses are actual college courses and the credit is usually recorded on a college transcript from the postsecondary institution.
The survey asked respondents to report on the prevalence and enrollment of dual credit and exam-based courses in their high schools. Additional information was obtained on dual credit courses, including the location and educational focus of these courses, dual credit course characteristics, and school requirements surrounding dual credit courses. The time frame for this survey is the 2002–03 12-month school year. As specifi ed on the front of the questionnaire, this includes courses during the summer of 2002 or the summer of 2003, depending upon how the schools kept their records.
This survey was conducted by the National Center for Education Statistics (NCES) using the Fast Response Sur-vey System (FRSS). FRSS is designed to administer short, focused, issue-oriented surveys that place minimal burden on respondents and have a quick turnaround from data collection to reporting. Questionnaires for the survey “Dual Credit and Exam-Based Courses” were mailed in fall 2003 to a representative sample of 1,499 regular public second-ary schools in the 50 states and the District of Columbia. The sample was selected from the 2001–02 NCES Common Core of Data (CCD) Public School Universe fi le, which was the most current fi le available at the time of selection. The sampling frame includes 17,059 regular secondary schools. The estimated number of schools in the survey universe decreased to an estimated 16,483 because some of the schools were determined to be ineligible for the FRSS sur-vey during data collection. Data have been weighted to yield national estimates. The unweighted and weighted response rates were both 92 percent. Detailed information about the
Dual Credit, AP, and IB CoursesDual Credit and Exam-Based Courses in U.S. Public High Schools: 2002–03——————————————————————————————————Tiffany Waits, J. Carl Setzer, and Laurie Lewis
This article was originally published as the Summary of the E.D. TAB of the same name. The sample survey data are from the survey “Dual Credit and Exam-Based Courses,” conducted through the Fast Response Survey System (FRSS).

E D U C A T I O N S T A T I S T I C S Q U A R T E R L Y — V O L U M E 7, I S S U E S 1 & 2, 2 0 0 5 99
survey methodology is provided in appendix A of the full report, and the questionnaire can be found in appendix B of the full report.
The primary purpose of this report is to present national es-timates. In addition, selected survey fi ndings are presented by the following school characteristics, which are defi ned in more detail in appendix A of the full report:
■ school enrollment size1 (enrollment of less than 500; 500 to 1,199; 1,200 or more);
■ locale (city, urban fringe, town, rural);
■ region (Northeast, Southeast, Central, West); and
■ percent minority enrollment (less than 6 percent, 6 to 20 percent, 21 to 49 percent, 50 percent or more).
In general, comparisons by these school characteristics are presented only where signifi cant differences were detected and follow meaningful patterns. It is important to note that many of the school characteristics used for independent analysis may also be related to each other. For example, school enrollment size and locale are related, with city schools typically being larger than rural schools. Other relationships between these analysis variables may exist. However, this E.D. TAB report focuses on the bivariate re-lationships between the school characteristics and the data gathered in the survey, rather than more complex analyses, to provide descriptive information about dual credit and exam-based courses.2
All specifi c statements of comparison made in this report have been tested for statistical signifi cance through trend analysis tests and t tests and are signifi cant at the 95 per-cent confi dence level. However, only selected fi ndings are presented for each topic in the report. Throughout this report, differences that may appear large (particularly those by school characteristics) may not be statistically signifi -cant. This may be due to the relatively large standard errors surrounding the estimates. A detailed description of the statistical tests supporting the survey fi ndings can be found in appendix A of the full report.
Selected Findings
The fi ndings in this report are organized as follows:
■ prevalence of courses for dual credit and exam-based course offerings in regular public high schools;
■ location and educational focus of courses for dual credit;
■ characteristics of courses for dual credit; and
■ school requirements related to dual credit courses.
Prevalence of Courses for Dual Credit and Exam-Based Course Offerings in Regular Public High Schools
The survey asked whether schools offered dual credit, Advanced Placement, and/or International Baccalaureate courses during the 2002–03 12-month school year. Schools offering such courses were asked to indicate the course enrollment totals during the survey time frame.
Prevalence of dual credit and exam-based courses
■ During the 2002–03 12-month school year, most public high schools offered dual credit and/or exam-based courses. Overall, 71 percent of public high schools offered courses for dual credit, 67 percent offered AP courses, and 2 percent offered IB courses.3
■ The size of public high schools was positively related to the percentage of schools offering dual credit and/or AP courses. In 2002–03, 63 percent of small schools, 75 percent of medium-sized schools, and 82 percent of large schools offered courses for dual credit. Similarly, 40 percent of small schools, 82 per-cent of medium-sized schools, and 97 percent of large schools offered AP courses.
■ Schools located in cities were less likely than schools located in either towns or urban fringe areas to report offering dual credit courses (65 vs. 79 and 74 per-cent, respectively). In addition, schools located in rural areas were less likely to offer these types of courses than were schools located in towns (70 vs. 79 percent). Furthermore, schools located in rural ar-eas were the least likely to report offering AP courses at their schools when compared to all other locales (50 vs. 72 to 87 percent), while schools located in urban fringe areas were the most likely to report offering these courses (87 vs. 50 to 77 percent).
■ Public high schools in the Central region were the most likely to offer courses for dual credit (80 vs. 58 to 71 percent) and schools in the Northeast were the least likely to do so (58 vs. 69 to 80 percent). The reverse was true with regard to AP courses. Schools in the Central region were the least likely
1Throughout this report, school enrollment size will be referred to as small, medium, or large schools.
2E.D. TAB reports are designed to focus on the presentation of selected descriptive data in tabular format.
3Percentages sum to more than 100 because schools could offer more than one type of course.
Dual Credit and Exam-Based Courses in U.S. Public High Schools: 2002–03

N A T I O N A L C E N T E R F O R E D U C A T I O N S T A T I S T I C S100
Elementary and Secondary Education
to offer AP courses (54 vs. 69 to 84 percent), and schools in the Northeast were the most likely to do so (84 vs. 54 to 69 percent).
■ While schools with the highest minority enrollment were the least likely to offer dual credit courses when compared to schools with lower minority enrollment (58 vs. 72 to 78 percent), schools with the lowest minority enrollment were the least likely to offer AP courses when compared to schools with higher minority enrollment (58 vs. 69 to 75 percent).
■ Public high schools reported the total enrollment in dual credit courses, AP courses, and IB courses. In the 12-month 2002–03 school year, there were an estimated 1.2 million enrollments in courses for dual credit, 1.8 million enrollments in AP courses, and 165,000 enrollments in IB courses.4 If a student was enrolled in multiple courses, schools were instructed to count the student for each course in which he or
she was enrolled. Thus, enrollments may include duplicated counts of students.
Combinations of dual credit and exam-based courses
In order to provide an overall picture of the ways in which public high schools offer dual credit and exam-based courses, combinations of the two types of dual credit and exam-based courses were examined. These have been grouped as follows: the school offered dual credit courses only; AP courses only; AP and IB courses; AP and dual credit courses; IB and dual credit courses; AP, IB, and dual credit courses; and no exam-based courses or courses for dual credit.
■ Thirteen percent of public high schools did not offer any dual credit or exam-based courses during the 2002–03 12-month school year (fi gure 1). Thirty-six percent offered either dual credit or one of the types of exam-based courses, 50 percent offered a combination of two types of dual credit and exam-based courses, and 2 percent offered all three types of courses (dual credit, AP, and IB).
4To put these numbers into context, NCES reports 13,736,000 students enrolled in public high schools in fall 2001 (Snyder, Tan, and Hoffman 2004). It is important to note that the dual credit enrollments collected in the FRSS survey may include duplicated counts of students, while the NCES estimate of 13,736,000 students enrolled is an unduplicated count.
Figure 1. Percentage distribution of public high schools by whether they offered dual credit and/or exam-based courses and the number of types of these courses offered during the 2002–03 12-month school year: 2003
NOTE: Types of courses include Advanced Placement, International Baccalaureate, and any courses taken for dual credit. Percentages are based on all public high schools (16,500). Percentages are based on unrounded numbers. Detail may not sum to totals because of rounding.SOURCE: U.S. Department of Education, National Center for Education Statistics, Fast Response Survey System (FRSS), “Dual Credit and Exam-Based Courses,” FRSS 85, 2003.
Did not offer any dual credit or exam-based courses (13%)
1 type only (36%)
2 types (50%)
3 types (2%)

E D U C A T I O N S T A T I S T I C S Q U A R T E R L Y — V O L U M E 7, I S S U E S 1 & 2, 2 0 0 5 101
■ Forty-nine percent of public high schools offered both dual credit and AP courses, 20 percent offered only courses for dual credit, 16 percent offered only AP courses, 1 percent offered both courses for dual credit and IB courses, and 2 percent offered a com-bination of all three types of courses (dual credit, AP, and IB). There were no schools that offered IB courses exclusively.
■ A greater proportion of small schools than medium schools did not offer any dual credit or exam-based courses (25 vs. 4 percent). School enrollment size was positively related to the likelihood of offering a combination of both dual credit and AP courses (28 percent for small schools, 61 percent for medium schools, and 74 percent for large schools).
■ Public high schools located in rural areas were more likely than high schools in other locales to report that they offered dual credit courses only (32 vs. 7 to 21 percent). However, public high schools located in rural areas were the least likely to report that they offered a combination of both dual credit and AP courses, compared with schools in all other locales (37 vs. 53 to 63 percent). In addition, schools in rural areas were more likely than schools located in either urban fringe areas or towns to not offer any dual credit or exam-based courses (18 vs. 5 and 8 percent, respectively). Furthermore, schools located in cities were more likely than schools located in urban fringe areas to not offer these types of courses (15 vs. 5 percent).
■ Schools with the highest minority enrollment were the most likely to indicate that they did not offer any dual credit or exam-based courses. Twenty percent of these schools indicated that they did not offer any dual credit or exam-based courses, compared with 6 to 12 percent of schools with lower minority enrollment.
Location and Educational Focus of Courses for Dual Credit
Schools reported whether their students were offered courses for dual credit at three locations: courses taught on the high school campus, courses taught on the campus of a postsecondary institution, and courses taught through distance education technologies. In addition, schools also reported dual credit course enrollment totals, and whether the courses for dual credit taught on a high school or post-secondary campus had an academic focus (such as English, history, or foreign language) or a career and technical/voca-
tional focus (such as computer maintenance technology and automotive technology).
Location of courses
■ Overview. Of the 11,700 public high schools that offered courses for dual credit, 61 percent indicated that they offered courses for dual credit taught on a high school campus, 65 percent offered courses for dual credit taught on the campus of a postsecondary institution, and 25 percent offered courses for dual credit taught through distance education technologies.5
■ High school campus. Schools located in towns re-ported offering dual credit courses taught on a high school campus more often (73 percent) than did schools located in cities (54 percent), urban fringe ar-eas (59 percent), or rural areas (61 percent). Schools with the highest minority enrollment were the least likely to offer dual credit courses on the high school campus (51 vs. 63 to 64 percent).
■ Postsecondary campus. There was a positive relation-ship between enrollment size and the proportion of schools reporting that their courses for dual credit were taught on the campus of a postsecondary in-stitution (57 percent of small schools, 68 percent of medium schools, and 74 percent of large schools). In addition, schools located in cities and schools in urban fringe areas were both more likely to report that their dual credit courses were taught on the campus of a postsecondary institution than were schools located in rural areas (78 and 70 percent vs. 58 percent). A greater proportion of schools with the highest minority enrollment offered courses for dual credit taught on a campus of a postsecondary institu-tion (76 percent) than did schools with the lowest minority enrollment (59 percent).
■ Distance education. For dual credit courses taught through distance education, there was a negative rela-tionship between enrollment size and the likelihood of offering these courses through distance education (35 percent of small schools, 21 percent of medium schools, and 17 percent of large schools). Schools in rural areas and schools in towns were both more likely than either schools in cities or schools in urban fringe areas to offer courses for dual credit through
5The percentage of schools with courses for dual credit taught on a high school campus, on the campus of a postsecondary institution, and through distance educa-tion sum to more than 100 percent because many schools offered courses for dual credit at more than one location. An estimated 21 percent of schools offered courses for dual credit at both the high school and postsecondary institution campus, and an estimated 6 percent offered dual credit courses at the high school campus, postsec-ondary institution campus, and via distance education.
Dual Credit and Exam-Based Courses in U.S. Public High Schools: 2002–03

N A T I O N A L C E N T E R F O R E D U C A T I O N S T A T I S T I C S102
Elementary and Secondary Education
distance education (33 and 29 percent vs. 11 and 18 percent, respectively).
■ Enrollment. During the 2002–03 12-month school year, there were approximately 1.2 million enroll-ments in dual credit courses. Of these, 74 percent (855,000 enrollments) were in courses taught on a high school campus, 23 percent (262,000 enroll-ments) were in courses taught on the campus of a postsecondary institution, and 4 percent (44,900 en-rollments) were in dual credit courses taught through distance education (fi gure 2).
Educational focus of courses
Schools that reported offering courses for dual credit lo-cated on either a high school campus or on the campus of a postsecondary institution were asked to report separately for each location about courses with an academic focus and courses with a career and technical/vocational focus. Schools that offered dual credit courses taught through dis-tance education were not asked to report on the educational focus of their dual credit courses. To examine the extent to which schools offered dual credit courses with an academic or a career and technical/vocational focus across locations, dual credit courses with an academic focus that were taught on a high school campus or on the campus of a postsecond-
ary institution were combined into one category, while dual credit courses with a career and technical/vocational focus, regardless of course location, were combined into a second category.
■ Overview. Of the 11,400 schools that offered courses for dual credit that were taught on a high school cam-pus or on the campus of a postsecondary institution, 92 percent indicated that they offered dual credit courses with an academic focus, and 51 percent reported that they offered dual credit courses with a career and technical/vocational focus.
■ Academic focus. Schools located in towns were more likely to offer dual credit courses with an academic focus than were schools located in urban fringe areas (96 vs. 90 percent).
■ Career and technical/vocational focus. School enroll-ment size was positively related to the likelihood of offering dual credit courses with a career and techni-cal/vocational focus. In 2002–03, 43 percent of small schools, 52 percent of medium schools, and 61 per-cent of large schools offered these types of courses. Schools in rural areas were less likely to offer dual credit courses with a career and technical/vocational focus than were schools located in either urban fringe
Figure 2. Percentage distribution of enrollment in courses for dual credit, by course location: 2003
NOTE: Percentages are based on the total 1,162,000 enrollments in dual credit courses. Percentages are based on unrounded numbers. Detail may not sum to totals because of rounding.SOURCE: U.S. Department of Education, National Center for Education Statistics, Fast Response Survey System (FRSS), “Dual Credit and Exam-Based Courses,” FRSS 85, 2003.
Enrollments in courses taught through distance education (4%)
Enrollments in courses taught on a high school campus (74%)
Enrollments in courses taught on the campus of a postsecondary institution (23%)

E D U C A T I O N S T A T I S T I C S Q U A R T E R L Y — V O L U M E 7, I S S U E S 1 & 2, 2 0 0 5 103
areas or towns (43 vs. 56 and 63 percent, respectively). Schools located in the West (62 percent) were the most likely to report that they offered dual credit courses with a career and technical/vocational focus, while schools in the Northeast (30 percent) were the least likely to do so. Finally, schools with less than 6 percent minority enrollment were less likely than schools with 6 to 49 percent minority enrollment to report that they offered these types of courses.
■ Enrollment. During the 2002–03 12-month school year, there were 1.1 million enrollments in dual credit courses taught on a high school campus or the campus of a postsecondary institution. Of these, 64 percent (719,000 enrollments) were in courses with an academic focus, while 36 percent (398,000 enroll-ments) were in courses with a career and technical/vocational focus (fi gure 3).
Educational focus by course location
Schools reported the educational focus of the dual credit courses they offered separately for those courses that were located on a high school campus and for those located on the campus of a postsecondary institution.
Courses for dual credit taught on a high school campus
Schools that reported offering dual credit courses taught on their campus indicated whether any of these courses had an academic focus and whether any had a career and technical/vocational focus. Schools could offer both types of courses.
■ Overview. Of the schools that offered courses for dual credit taught on a high school campus, 83 percent offered courses that had an academic focus and 49 percent offered courses with a career and technical/vocational focus.
■ Academic focus. Of the schools that offered dual credit courses taught at the high school, small schools were more likely than large schools to offer such courses with an academic focus (87 vs. 78 percent).
■ Career and technical/vocational focus. School enroll-ment size was positively related to the likelihood of offering dual credit courses on a high school cam-pus with a career and technical/vocational focus. In 2002–03, 40 percent of small schools, 50 percent of medium schools, and 59 percent of large schools of-fered these types of courses. Rural schools were less likely than schools in all other locales to offer these dual credit courses on a high school campus (37 vs. 56 to 58 percent). In addition, schools in the West
Dual Credit and Exam-Based Courses in U.S. Public High Schools: 2002–03
Figure 3. Percentage distribution of enrollment in courses for dual credit taught on a high school campus or on the campus of a postsecondary institution, by educational focus of those courses: 2003
NOTE: Percentages are based on the 1,117,100 enrollments in dual credit courses taught on a high school campus and/or the campus of a postsecondary institution. Percentages are based on unrounded numbers. Detail may not sum to totals because of rounding.SOURCE: U.S. Department of Education, National Center for Education Statistics, Fast Response Survey System (FRSS), “Dual Credit and Exam-Based Courses,” FRSS 85, 2003.
Enrollments in courses with an academic focus (64%)
Enrollments in courses with a career and technical/vocational focus (36%)

N A T I O N A L C E N T E R F O R E D U C A T I O N S T A T I S T I C S104
Elementary and Secondary Education
were more likely than those in any other region to of-fer these dual credit courses on a high school campus (60 vs. 37 to 47 percent).
■ Enrollment. During the 2002–03 12-month school year, among dual credit courses taught on high school campuses, there were approximately 513,000 enrollments in dual credit courses with an academic course focus, and 342,000 enrollments in courses with a career and technical/vocational focus. These enrollments represent 46 percent and 31 percent, respectively, of the total enrollments in dual credit courses taught on either a high school campus or at a postsecondary institution (fi gure 4).
Courses for dual credit taught on the campus of a postsecondary institution
Schools that reported offering dual credit courses taught on the campus of a postsecondary institution indicated whether any of these courses had an academic focus and whether any had a career and technical/vocational focus. Schools could offer both types of courses.
■ Overview. Of the schools that offered dual credit courses taught on the campus of a postsecond-ary institution, 92 percent offered courses with an academic focus and 46 percent offered courses with a career and technical/vocational focus.
■ Academic focus. Schools in the Northeast (99 percent) were more likely than schools in the Southeast (90 percent), Central region (90 percent), or the West (92 percent) to report offering dual credit courses with an academic focus on the campus of a postsec-ondary institution.
■ Career and technical/vocational focus. Schools located in towns were more likely than those located in cities or rural areas to offer courses for dual credit with a career and technical/vocational focus on a postsec-ondary campus (57 vs. 42 percent respectively). Furthermore, schools in the Northeast were less likely than those in other regions to offer these courses on a postsecondary campus (13 percent vs. 48 to 54 percent).
■ Enrollment. During the 2002–03 12-month school year, there were 205,000 enrollments in academic dual credit courses that were taught on the campus of a postsecondary institution, and 56,000 enroll-ments in career and technical/vocational courses that were taught on the campus of a postsecondary insti-tution. These enrollments represent 18 percent and 5 percent, respectively, of the total enrollments in dual credit courses taught on the campus of a high school or postsecondary institution (fi gure 4).
NOTE: Percentages are based on the 1,117,100 enrollments in dual credit courses taught on a high school campus and/or the campus of a postsecondary institution. Percentages are based on unrounded numbers. Detail may not sum to totals because of rounding.SOURCE: U.S. Department of Education, National Center for Education Statistics, Fast Response Survey System (FRSS), “Dual Credit and Exam-Based Courses,” FRSS 85, 2003.
Figure 4. Percentage distribution of enrollment in courses for dual credit, by course location and educational focus: 2003
Enrollment in academic courses taught on a high school campus (46%)
Enrollment in career and technical/vocational courses taught on a high school campus (31%)
Enrollment in academic courses taught on the campus of a postsecondary institution (18%)
Enrollment in career and technical/vocational courses taught on the campus of a postsecondary institution (5%)
E D U C A T I O N S T A T I S T I C S Q U A R T E R L Y — V O L U M E 7, I S S U E S 1 & 2, 2 0 0 5 105
Characteristics of Courses for Dual Credit
Dual credit courses vary greatly with regard to a number of characteristics, including whether (1) they are offered indi-vidually (“cafeteria style”) or in a sequence of courses, (2) they are taught by high school instructors and/or postsecondary instructors, (3) they serve only public high school students or a mixture of public high school students and postsecondary students, and (4) the postsecondary credit is awarded immediately upon course completion or is held in escrow until after the student graduates from public high school and attends a specifi c postsecondary institution.
Course structure
In addition to dual credit course location or focus, high schools reported whether students could select courses for dual credit cafeteria style, whereby students selected indi-vidual courses from a wide range of courses for which pre-requisites were met; and whether students could select the courses for dual credit as part of a sequence, such as a series of courses in a specifi c content area, such as math, history, nursing, or automotive technology. Respondents could offer these courses both ways.
Sequence of courses
■ Among high schools offering dual credit courses on their campus, 53 percent of those offering courses with an academic focus and 72 percent of those of-fering courses with a career and technical/vocational focus indicated that some or all of these courses were offered as part of a sequence.
■ Similarly, among schools offering dual credit courses on the campus of a postsecondary institution, 53 per-cent of those offering courses with an academic focus and 72 percent of those offering courses with a career and technical/vocational focus reported that some or all of these courses were offered as part of a sequence.
■ Among schools that offered dual credit courses with an academic focus on a high school campus, 59 per-cent of schools located in towns reported offering some or all of these courses as part of a sequence, compared with 42 percent of schools located in cities.
■ Among schools that offered dual credit courses with an academic focus on a postsecondary institution’s campus, a greater proportion of schools located in urban fringe areas than in cities offered some or all of these courses as part of a sequence (60 vs. 46 percent, respectively).
6Information about course instructors was not collected for dual credit courses taught at a postsecondary institution, because research during survey development indicated that these courses are almost always taught by postsecondary faculty.
Cafeteria-style courses
■ Among schools that offered dual credit courses taught on a high school campus, 35 percent of those offering courses with an academic focus reported that some or all of these courses were offered cafeteria style, while 41 percent of those offering courses with a career and technical/vocational focus indicated that some or all of these courses were offered cafeteria style.
■ Among public high schools reporting that they of-fered dual credit courses taught on the campus of a postsecondary institution, 68 percent of those that of-fered dual credit courses with an academic focus and 59 percent of those that offered courses with a career and technical/vocational focus indicated that some or all of these courses were offered cafeteria style.
■ Of the schools that offered career and technical/vo-cational dual credit courses taught on a high school campus, fewer schools located in cities (29 percent) reported that some or all of these courses were of-fered cafeteria style, compared with 50 percent in ur-ban fringe areas and 44 percent in towns. In addition, schools in the Southeast region offering career and technical/vocational dual credit courses on a high school campus were less likely to indicate that some or all of these courses were offered cafeteria style than were schools in the other regions (25 vs. 42 to 46 percent).
■ Of the schools that offered career and technical/voca-tional dual credit courses taught on the campus of a postsecondary institution, schools in the Northeast were more likely to report that some or all of these courses were offered cafeteria style than were schools in all other regions (100 vs. 55 to 59 percent).
Course instructors
Public high schools indicating that they offered dual credit courses taught on their high school campus were asked to specify whether these courses were taught by high school instructors only, postsecondary instructors only, or both high school and postsecondary instructors.6 Most dual credit courses taught on a high school campus were taught by high school instructors only, regardless of the education-al focus of the dual credit courses.
■ Of the schools that offered academic courses for dual credit taught on a high school campus, 64 percent indicated that these courses were taught solely by
Dual Credit and Exam-Based Courses in U.S. Public High Schools: 2002–03

N A T I O N A L C E N T E R F O R E D U C A T I O N S T A T I S T I C S106
Elementary and Secondary Education
high school instructors, 24 percent reported that both high school and postsecondary instructors taught the courses, and 11 percent stated that the courses were taught only by postsecondary instructors.
■ For schools that offered career and technical/voca-tional courses for dual credit taught on a high school campus, 76 percent indicated that these courses were taught by high school instructors only, 12 percent of schools reported that the courses were taught by both high school and postsecondary instructors, and 12 percent reported that the courses were taught by postsecondary instructors only.
Student composition
Schools that offered dual credit courses taught on the cam-pus of a postsecondary institution were asked to indicate whether the most common student composition in these courses was high school students only or a combination of high school students and postsecondary students. The most common student composition for dual credit courses taught on the campus of a postsecondary institution was a mix of both high school and postsecondary students, regardless of the educational focus.
■ Of the schools that offered academic dual credit courses on a postsecondary campus, 82 percent reported that these courses enrolled both high school and postsecondary students, while 18 percent reported enrolling high school students only.
■ Similarly, of the schools that offered career and tech-nical/vocational dual credit courses on a postsecond-ary campus, 78 percent reported that these courses contained both high school and postsecondary stu-dents, while 22 percent reported they contained high school students only.
Awarding of postsecondary credit
There are two primary ways in which postsecondary credit for dual credit courses is awarded. The credit can be awarded immediately upon completion of the dual credit course, or it can be held in escrow until the student has graduated from public high school and enrolls in a specifi c postsecondary institution that accepts the credit. Students taking courses for dual credit were most commonly awarded postsecondary credit immediately upon completion of the course, regardless of course location or educational focus.
■ Among schools that offered academic dual credit courses on a high school campus, 86 percent awarded postsecondary credits to their students immediately and 15 percent held credits in escrow. Sixty-one
percent of schools offering career and technical/voca-tional dual credit courses reported immediate award of credits and 41 percent reported holding credits in escrow.
■ Among schools that offered academic dual credit courses taught on the campus of a postsecondary insti-tution, 91 percent awarded postsecondary credits to their students immediately and 10 percent held cred-its in escrow. Eighty-six percent of schools offering career and technical/vocational dual credit courses reported immediate award of credits and 18 percent of schools reported holding credits in escrow.
■ Schools that offered courses for dual credit on a high school campus or on the campus of a postsecond-ary institution were more likely to report that the postsecondary credit was awarded immediately rather than held in escrow, regardless of course location or focus. However, the percentage point difference between schools that offered postsecondary credit immediately and those that held it in escrow was smaller for dual credit courses with a career and technical/vocational focus taught on a high school campus than for any other dual credit course location or focus (20 percentage point difference vs. 68 to 81 percentage point difference) (fi gure 5).
School Requirements Related to Dual Credit Courses
Schools that offered courses for dual credit were asked whether their school had established any entrance require-ments, other than state or specifi c postsecondary entrance requirements, that their students must meet in order to enroll in courses for dual credit. Schools that had such requirements were asked to indicate which requirements students must meet.
■ Sixty-two percent of schools that offered courses for dual credit indicated that their school had established requirements for students to enroll in dual credit courses. Among schools with requirements, the most common requirement was grade level (84 percent), followed by minimum GPA (48 percent), teacher recommendation (42 percent), and minimum score on standardized tests (31 percent) (fi gure 6). Twenty-eight percent reported that their school had estab-lished some other requirement(s) than those listed.
■ A greater proportion of schools located in urban fringe areas reported that their school had specifi c requirements for taking dual credit courses (56 per-cent) than schools located in cities or towns

E D U C A T I O N S T A T I S T I C S Q U A R T E R L Y — V O L U M E 7, I S S U E S 1 & 2, 2 0 0 5 107
Dual Credit and Exam-Based Courses in U.S. Public High Schools: 2002–03
Figure 5. Percent of public high schools that offered courses for dual credit during the 2002–03 12-month school year indicating whether postsecondary credit was awarded immediately or held in escrow, by dual credit course location and focus: 2003
NOTE: Percentages are based on unrounded numbers. Detail may not sum to totals since schools could select more than one response option. SOURCE: U.S. Department of Education, National Center for Education Statistics, Fast Response Survey System (FRSS), “Dual Credit and Exam-Based Courses,” FRSS 85, 2003.
Credit held in escrow
Credit awarded immediately
Percent
Academic courses on a high school
campus
Career and techincal/vocational courses on a
high school campus
Academic courses on campus of postsecondary
institution
Career and technical/vocational courses
on campus of postsecondary institution
0
20
40
60
80
10086
15
61
41
91
10
86
18
Figure 6. Percent of public high schools reporting established requirements that students must meet in order to enroll in courses for dual credit: 2003
NOTE: Percentages are based on the 7,300 schools that reported having established requirements that students must meet to enroll in dual credit courses. Percentages are based on unrounded numbers.SOURCE: U.S. Department of Education, National Center for Education Statistics, Fast Response Survey System (FRSS), “Dual Credit and Exam-Based Courses,” FRSS 85, 2003.
Percent
Grade level Minimum GPA Teacher recommendation
Minimum score on standardized
tests
Other
0
20
40
60
80
100
84
4842
31 28

N A T I O N A L C E N T E R F O R E D U C A T I O N S T A T I S T I C S108
Elementary and Secondary Education
(69 and 68 percent, respectively). Furthermore, a greater proportion of schools in the Northeast (70 percent) and the Southeast (70 percent) than in the West (61 percent) or Central region (55 percent) reported having specifi c requirements.
ReferencesBailey, T., and Karp, M. (2003). Promoting College Access and
Success: A Review of Credit-Based Transition Programs (ERIC ED482497). Washington, DC: U.S. Department of Education, Offi ce of Adult and Vocational Education.
Clark, R.W. (2001). Dual Credit: A Report of Programs and Policy That Offer High School Students College Credits. Seattle, WA: Institute for Educational Inquiry.
Education Commission of the States. (2004). Dual/Concurrent Enrollment. Retrieved April 27, 2004, from http://www.ecs.org/html/IssueSection.asp?issueid=214&s=Quick+Facts.
Snyder, T.D., Tan, A.G., and Hoffman, C.M. (2004). Digest of Education Statistics 2003 (NCES 2005-025). U.S. Department of Education, National Center for Education Statistics. Retrieved February 23, 2005, from http://nces.ed.gov/programs/digest/d03/tables/dt002.asp.
Data source: The NCES Fast Response Survey System (FRSS).
For technical information, see the complete report:
Waits, T., Setzer, J.C., and Lewis, L. (2005). Dual Credit and Exam-Based Courses in U.S. Public High Schools: 2002–03 (NCES 2005-009).
Author affi liations: T. Waits, J.C. Setzer, and L. Lewis, Westat.
For questions about content, contact Bernie Greene ([email protected]).
To obtain the complete report (NCES 2005-009), call the toll-free ED Pubs number (877-433-7827) or visit the NCES Electronic Catalog (http://nces.ed.gov/pubsearch).

E D U C A T I O N S T A T I S T I C S Q U A R T E R L Y — V O L U M E 7, I S S U E S 1 & 2, 2 0 0 5 109
Introduction
This report presents information about public elementary and secondary education for the 2002–03 school year. The data were provided by state education agencies through the Common Core of Data (CCD) survey system. Discussion of data is limited to the 50 states and the District of Columbia, and excludes the Bureau of Indian Affairs, Department of Defense schools, and fi ve outlying areas: American Samoa, Guam, the Northern Marianas, Puerto Rico, and the Virgin Islands. (Note that tables include data for all jurisdictions.)
Selected Findings
More than 48.2 million students were enrolled in public schools in 2002–03. Among the states with the largest number of students in membership were California (6.4 million); Texas (4.3 million); and Florida, Illinois, and New York, which each reported more than 2 million students. The total 2002–03 student membership was an increase of 5.4 million, or 13 percent more students than in 1992–93 (table A).
Approximately 6.4 million students, or 13 percent of the total membership, had special education individualized education programs (IEPs) and received special education services in 2002–03 (table B). English language learner (ELL) services were provided to 4 million students (8 percent of all students), and 16.4 million (34 percent) were eligible for free or reduced-price meals.
A total of 2.6 million students were awarded a high school diploma in 2001–02, and an additional 45,000 received a certifi cate of completion or comparable credential (table C).
The average student/teacher ratio in 2002–03 was 15.9, or about 16 students for every teacher employed. This was a decrease from the pupil/teacher ratio of 17.4 in 1992–93 (derived from table A). In 2002–03, California, Oregon, and Utah had student/teacher ratios of more than 20 to 1.
Overall, public education employed almost 6 million full-time-equivalent (FTE) positions in 2002–03 (table D). More than 3 million of these were teachers and 664,000 were teacher aides. These instructional staff accounted for 62 per-cent of the reported personnel. School and school district administrators accounted for 4 percent of all staff.
More than 92,000 public schools had students in member-ship during 2002–03. Of these schools, 57 percent were primary schools, 17 percent were middle schools, and 19 percent were high schools. An additional 6 percent of schools had some other grade confi guration.
The average number of students in primary schools was 439 in 2002–03, in middle schools it was 617, and in high schools 754. In Florida, Hawaii, and Maryland, the average-size high school had more than 1,200 students.
In 2002–03, almost 13 percent of all public schools were in large cities. Another 29 percent were located in rural areas. The remaining 59 percent of schools were in midsize cities, urban fringes, or towns.
Across the states that reported these school characteristics, there were almost 50,000 Title I eligible schools in 2002–03 and these schools accounted for about 50 percent of all students. There were close to 2,600 charter schools. About 45 percent were administered directly by public school dis-tricts that also included noncharter schools, and 55 percent were administered by exclusively charter districts.
Not all local education agencies in 2002–03 were regular school districts. While 83 percent of local agencies were in this category, another 8 percent provided other services (e.g., administration, staff development) to local school districts. The remaining 8 percent of agencies were state- or federally administered, or charter school, districts.
Public Schools in 2002–03Public Elementary and Secondary Students, Staff, Schools, and School Districts: School Year 2002–03——————————————————————————————————Lee Hoffman, Jennifer Sable, Julia Naum, and Dell Gray
This article was originally published as the Summary of Findings of the E.D. TAB of the same name. The universe data are from the Common Core of Data (CCD).
Data sources: The NCES Common Core of Data (CCD), “Public Elementary/Secondary School Universe Survey,” 2002–03, Version 1a; “State Nonfi scal Survey of Public Elementary/Secondary Education,” 1992–93, Version 1c, 2002–03, Version 1a; and “Local Education Agency Universe Survey,” 2002–03, Version 1a.
For technical information, see the complete report:
Hoffman, L., Sable, J., Naum, J., and Gray, D. (2005). Public Elementary and Secondary Students, Staff, Schools, and School Districts: School Year 2002–03 (NCES 2005-314).
Author affi liations: L. Hoffman, NCES; J. Sable, Education Statistics Services Institute; J. Naum and D. Gray, U.S. Census Bureau.
For questions about content, contact Lee Hoffman ([email protected]).
To obtain the complete report (NCES 2005-314), call the toll-free ED pubs number (877-433-7827) or visit the NCES Electronic Catalog (http://nces.ed.gov/pubsearch).

N A T I O N A L C E N T E R F O R E D U C A T I O N S T A T I S T I C S110
Elementary and Secondary Education
Percent change Percent change from 1992–93 from 1992–93State 1992–93 2002–03 to 2002–03 1992–93 2002–03 to 2002–03
United States1 42,823,312 48,202,324 2 12.6 2,458,956 3,034,064 23.4
Alabama 731,634 739,678 2 1.1 41,961 47,104 2 12.3
Alaska 122,487 134,364 9.7 7,282 8,080 11.0
Arizona 673,477 937,755 39.2 36,076 47,101 30.6
Arkansas 441,490 450,985 2.2 26,017 30,330 16.6
California 5,254,844 6,356,348 3 21.0 218,566 307,672 3 40.8
Colorado 612,635 751,862 22.7 33,419 45,401 35.9
Connecticut 488,476 570,023 16.7 34,193 42,296 23.7
Delaware 104,321 116,342 11.5 6,252 7,698 23.1
District of Columbia 80,937 76,166 -5.9 6,064 5,005 4 -17.5
Florida 1,981,407 2,539,929 28.2 107,590 138,226 28.5
Georgia 1,207,186 1,496,012 23.9 66,942 96,044 43.5
Hawaii 177,448 183,829 3.6 10,083 10,973 8.8
Idaho 231,668 248,515 7.3 11,827 13,896 17.5
Illinois 1,873,567 2,084,187 11.2 111,461 131,045 17.6
Indiana 960,630 1,003,875 4.5 54,552 59,968 9.9
Iowa 494,839 482,210 -2.6 31,403 34,573 10.1
Kansas 451,536 470,957 4.3 29,753 32,643 9.7
Kentucky 655,041 660,782 0.9 37,868 40,662 7.4
Louisiana 797,985 730,464 -8.5 46,904 50,062 6.7
Maine 216,453 204,337 -5.6 15,375 16,837 9.5
Maryland 751,850 866,743 15.3 44,495 55,382 24.5
Massachusetts 859,948 982,989 14.3 57,225 74,214 29.7
Michigan 1,603,610 1,785,160 11.3 82,301 89,595 5 8.9
Minnesota 793,724 846,891 6.7 45,050 52,808 17.2
Mississippi 506,668 492,645 -2.8 27,829 31,598 13.5
Missouri 859,357 924,445 7.6 52,984 66,717 25.9
Montana 160,011 149,995 -6.3 10,135 10,362 2.2
Nebraska 282,414 285,402 1.1 19,323 21,043 8.9
Nevada 222,974 369,498 65.7 11,953 20,037 67.6
New Hampshire 181,247 207,671 14.6 11,654 14,977 28.5
New Jersey 1,130,560 1,367,438 21.0 83,057 107,004 28.8
New Mexico 315,668 320,234 1.4 17,912 21,172 18.2
New York 2,689,686 2,888,233 7.4 176,375 210,926 4 19.6
North Carolina 1,114,083 1,335,954 19.9 66,630 87,677 31.6
North Dakota 118,734 104,225 -12.2 7,794 8,078 3.6
Number of teachersTotal student membership
Table A. Public school student membership and number of teachers: United States and other jurisdictions, school years 1992–93 and 2002–03
See notes at end of table.

E D U C A T I O N S T A T I S T I C S Q U A R T E R L Y — V O L U M E 7, I S S U E S 1 & 2, 2 0 0 5 111
Public Elementary and Secondary Students, Staff, Schools, and School Districts: School Year 2002–03
Percent change Percent change from 1992–93 from 1992–93State 1992–93 2002–03 to 2002–03 1992–93 2002–03 to 2002–03
Ohio 1,795,199 1,838,285 2.4 106,233 125,372 18.0
Oklahoma 597,096 624,548 4.6 38,433 40,638 5.7
Oregon 510,122 554,071 8.6 26,634 27,126 1.8
Pennsylvania 1,717,613 1,816,747 5.8 100,912 118,256 17.2
Rhode Island 143,798 159,205 10.7 10,069 11,196 4 11.2
South Carolina 640,464 694,584 8.5 37,295 46,578 24.9
South Dakota 134,573 128,039 -4.9 8,767 9,257 5.6
Tennessee 855,231 928,000 2 8.5 43,566 58,652 34.6
Texas 3,541,769 4,259,823 20.3 219,385 288,655 31.6
Utah 463,870 489,072 5.4 19,191 22,415 16.8
Vermont 98,558 99,978 1.4 7,521 8,542 13.6
Virginia 1,031,925 1,177,229 14.1 68,181 99,919 46.5
Washington 896,475 1,014,798 13.2 44,295 52,953 19.5
West Virginia 318,296 282,455 -11.3 20,961 20,119 -4.0
Wisconsin 829,415 881,231 6.2 53,387 60,385 13.1
Wyoming 100,313 88,116 -12.2 5,821 6,795 2 16.7
Department of Defense (DoD) dependents schools, Bureau of Indian Affairs, and outlying areas
DoDDS: DoD schools (overseas) — 72,722 — — 4,793 —
DDESS: DoD schools (domestic) — 32,115 — — 2,424 —
Bureau of Indian Affairs — 46,126 — — — —
American Samoa 13,994 15,984 14.2 725 943 30.1
Guam 30,077 — — 1,628 — —
Northern Marianas 8,086 11,251 39.1 425 545 28.2
Puerto Rico 637,034 596,502 -6.4 38,381 42,369 10.4
Virgin Islands 22,887 18,333 -19.9 1,595 1,502 -5.8
Number of teachersTotal student membership
Table A. Public school student membership and number of teachers: United States and other jurisdictions, school years 1992–93 and 2002–03—Continued
— Not available.1U.S. totals include the 50 states and the District of Columbia.2Includes prekindergarten data imputed based on current-year (fall 2002) data.3California did not report the number of ungraded teachers, and the total number of teachers in California is therefore underestimated.4Data imputed based on prior-year (fall 2001) data.5Data disaggregated from reported total.NOTE: Teacher counts are full-time-equivalency (FTE) counts. SOURCE: U.S. Department of Education, National Center for Education Statistics, Common Core of Data (CCD), “State Nonfi scal Survey of Public Elementary/Secondary Education,” 1992–93, Version 1c; and “State Nonfi scal Survey of Public Elementary/Secondary Education,” 2002–03, Version 1a. (Originally published as table 2 on pp. 5–6 of the complete report from which this article is excerpted.)
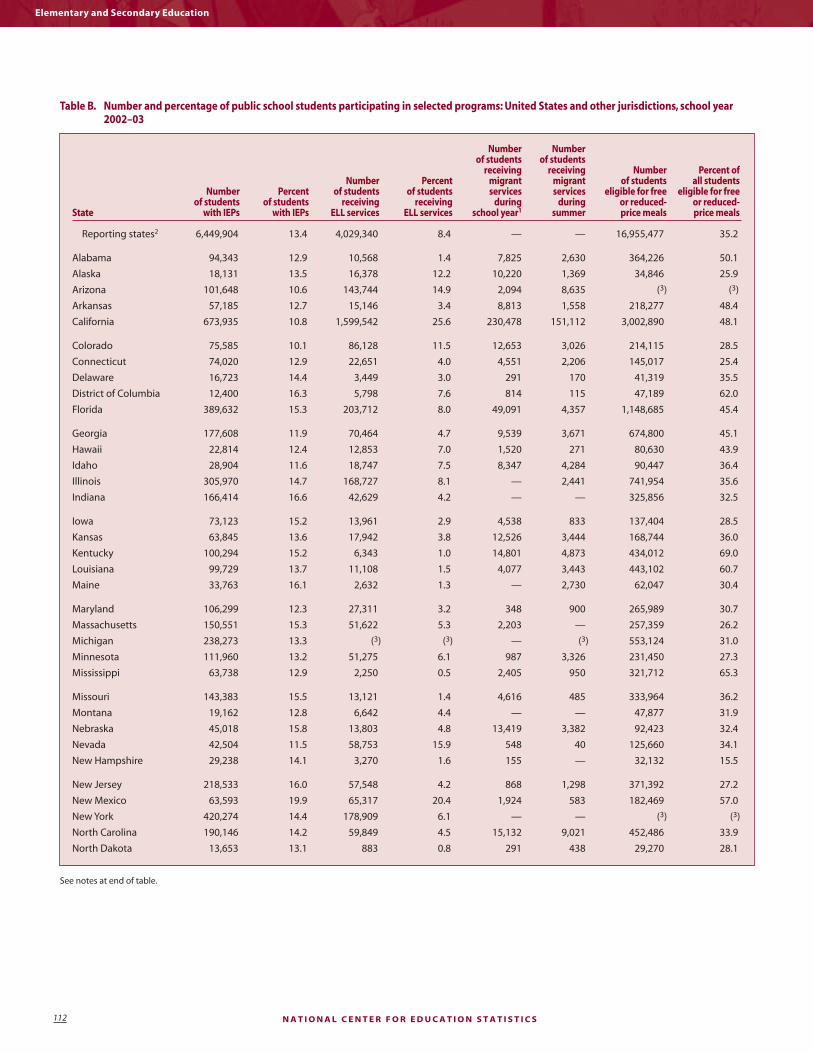
N A T I O N A L C E N T E R F O R E D U C A T I O N S T A T I S T I C S112
Elementary and Secondary Education
Number Number of students of students receiving receiving Number Percent of Number Percent migrant migrant of students all students Number Percent of students of students services services eligible for free eligible for free of students of students receiving receiving during during or reduced- or reduced-State with IEPs with IEPs ELL services ELL services school year1 summer price meals price meals
Reporting states2 6,449,904 13.4 4,029,340 8.4 — — 16,955,477 35.2
Alabama 94,343 12.9 10,568 1.4 7,825 2,630 364,226 50.1
Alaska 18,131 13.5 16,378 12.2 10,220 1,369 34,846 25.9
Arizona 101,648 10.6 143,744 14.9 2,094 8,635 (3) (3)
Arkansas 57,185 12.7 15,146 3.4 8,813 1,558 218,277 48.4
California 673,935 10.8 1,599,542 25.6 230,478 151,112 3,002,890 48.1
Colorado 75,585 10.1 86,128 11.5 12,653 3,026 214,115 28.5
Connecticut 74,020 12.9 22,651 4.0 4,551 2,206 145,017 25.4
Delaware 16,723 14.4 3,449 3.0 291 170 41,319 35.5
District of Columbia 12,400 16.3 5,798 7.6 814 115 47,189 62.0
Florida 389,632 15.3 203,712 8.0 49,091 4,357 1,148,685 45.4
Georgia 177,608 11.9 70,464 4.7 9,539 3,671 674,800 45.1
Hawaii 22,814 12.4 12,853 7.0 1,520 271 80,630 43.9
Idaho 28,904 11.6 18,747 7.5 8,347 4,284 90,447 36.4
Illinois 305,970 14.7 168,727 8.1 — 2,441 741,954 35.6
Indiana 166,414 16.6 42,629 4.2 — — 325,856 32.5
Iowa 73,123 15.2 13,961 2.9 4,538 833 137,404 28.5
Kansas 63,845 13.6 17,942 3.8 12,526 3,444 168,744 36.0
Kentucky 100,294 15.2 6,343 1.0 14,801 4,873 434,012 69.0
Louisiana 99,729 13.7 11,108 1.5 4,077 3,443 443,102 60.7
Maine 33,763 16.1 2,632 1.3 — 2,730 62,047 30.4
Maryland 106,299 12.3 27,311 3.2 348 900 265,989 30.7
Massachusetts 150,551 15.3 51,622 5.3 2,203 — 257,359 26.2
Michigan 238,273 13.3 (3) (3) — (3) 553,124 31.0
Minnesota 111,960 13.2 51,275 6.1 987 3,326 231,450 27.3
Mississippi 63,738 12.9 2,250 0.5 2,405 950 321,712 65.3
Missouri 143,383 15.5 13,121 1.4 4,616 485 333,964 36.2
Montana 19,162 12.8 6,642 4.4 — — 47,877 31.9
Nebraska 45,018 15.8 13,803 4.8 13,419 3,382 92,423 32.4
Nevada 42,504 11.5 58,753 15.9 548 40 125,660 34.1
New Hampshire 29,238 14.1 3,270 1.6 155 — 32,132 15.5
New Jersey 218,533 16.0 57,548 4.2 868 1,298 371,392 27.2
New Mexico 63,593 19.9 65,317 20.4 1,924 583 182,469 57.0
New York 420,274 14.4 178,909 6.1 — — (3) (3)
North Carolina 190,146 14.2 59,849 4.5 15,132 9,021 452,486 33.9
North Dakota 13,653 13.1 883 0.8 291 438 29,270 28.1
Table B. Number and percentage of public school students participating in selected programs: United States and other jurisdictions, school year 2002–03
See notes at end of table.

E D U C A T I O N S T A T I S T I C S Q U A R T E R L Y — V O L U M E 7, I S S U E S 1 & 2, 2 0 0 5 113
Number Number of students of students receiving receiving Number Percent of Number Percent migrant migrant of students all students Number Percent of students of students services services eligible for free eligible for free of students of students receiving receiving during during or reduced- or reduced-State with IEPs with IEPs ELL services ELL services school year1 summer price meals price meals
Ohio 248,127 13.5 25,782 1.4 (3) — 535,072 29.2
Oklahoma 91,184 14.6 40,192 6.4 — 631 320,600 51.3
Oregon 71,433 12.9 52,331 9.4 20,394 5,105 211,674 38.5
Pennsylvania 242,837 13.4 — — 8,768 7,446 528,011 29.1
Rhode Island 32,500 20.4 10,087 6.3 — — 53,084 33.4
South Carolina 109,423 15.8 7,467 1.1 518 1,022 343,810 49.6
South Dakota 17,241 13.5 4,524 3.5 2,265 245 38,800 30.3
Tennessee 142,566 15.8 — — — — — —
Texas 502,700 11.8 630,686 14.8 108,649 — 1,968,976 46.2
Utah 56,085 11.6 43,299 8.9 4,105 3,485 149,728 30.9
Vermont 13,765 13.8 1,057 1.1 858 411 25,501 25.5
Virginia 169,237 14.4 49,845 4.2 1,273 569 355,212 30.2
Washington 122,277 12.0 70,431 6.9 — 6,608 347,562 34.2
West Virginia 50,259 17.8 1,281 0.5 135 — 136,469 48.3
Wisconsin 126,259 14.3 25,764 2.9 1,028 394 242,158 27.5
Wyoming 11,620 13.4 3,519 4.1 210 291 25,953 30.0
Department of Defense (DoD) dependents schools, Bureau of Indian Affairs, and outlying areas
DoDDS: DoD schools (overseas) 6,056 8.3 6,140 8.4 — — — —
DDESS: DoD schools (domestic) 3,212 10.0 1,892 5.9 — — — —
Bureau of Indian Affairs — — — — — — — —
American Samoa 867 5.4 15,447 96.6 — — 15,891 99.4
Guam — — — — — — — —
Northern Marianas 542 4.8 — — 1,030 1,199 11,070 98.4
Puerto Rico 69,327 11.6 — — 14,128 (3) 484,069 81.2
Virgin Islands 1,497 8.2 1,223 6.7 — — — —
Table B. Number and percentage of public school students participating in selected programs: United States and other jurisdictions, school year 2002–03 —Continued
— Not available.1Migrant students include those who were enrolled at any time during the previous (2001–02) regular school year. They are reported for each school in which they enrolled; because this is a duplicated count, the table does not show migrants as a percentage of all students.2Reporting states total includes the 50 states and the District of Columbia. It is suppressed if data were missing for 15 percent or more of all schools or agencies. State totals exclude states for which data were missing for 20 percent or more of the schools or agencies.3Data were missing for more than 20 percent of schools or districts.NOTE: IEP is the acronym for individualized education program. ELL is the acronym for English language learner. Some data items were more likely to be missing from charter schools than from other schools. Free lunch data were missing for 459 of 2,575 charter schools in the 50 states and District of Columbia, and migrant student data were missing for 417. Data on ELL students were missing for 248 of the total 1,241 operational charter school districts in the 50 states and District of Columbia. Percentages are based on schools and agencies reporting. Detail may not sum to totals because of rounding. SOURCE: U.S. Department of Education, National Center for Education Statistics, Common Core of Data (CCD), “Public Elementary/Secondary School Universe Survey,” 2002–03, Ver-sion 1a; and “Local Education Agency Universe Survey,” 2002–03, Version 1a. (Originally published as table 3 on pp. 7–8 of the complete report from which this article is excerpted.)
Public Elementary and Secondary Students, Staff, Schools, and School Districts: School Year 2002–03

N A T I O N A L C E N T E R F O R E D U C A T I O N S T A T I S T I C S114
Elementary and Secondary Education
Total high school Other high school High school equivalencyState completers Diploma recipients completers1 recipients2
Reporting states3 — 2,635,277 45,081 —
Alabama — 35,887 3,529 —
Alaska 8,106 6,945 28 1,133
Arizona — 47,175 1,208 —
Arkansas 33,942 26,984 1,909 5,049
California — 325,895 † —
Colorado 45,239 40,760 232 4,247
Connecticut 33,323 32,327 158 838
Delaware 6,796 6,482 134 180
District of Columbia — 3,090 213 —
Florida 139,666 119,537 5,602 14,527
Georgia — 65,983 6,581 —
Hawaii — 10,452 217 —
Idaho — 15,874 34 —
Illinois — 116,657 † —
Indiana 62,102 56,722 1,531 3,849
Iowa 35,617 33,789 43 1,785
Kansas — 29,541 † —
Kentucky — 36,337 332 —
Louisiana 42,553 37,905 903 3,745
Maine 12,858 12,596 29 233
Maryland — 50,881 510 —
Massachusetts — 55,272 † —
Michigan 97,530 95,001 666 1,863
Minnesota 62,228 57,440 † 4,788
Mississippi 25,612 23,740 1,603 269
Missouri 56,530 54,487 † 2,043
Montana 11,488 10,554 † 934
Nebraska — 19,910 95 —
Nevada 18,608 16,270 685 1,653
New Hampshire — 12,452 — 947
New Jersey 83,393 77,664 † 5,729
New Mexico — 18,094 4 — —
New York — 153,879 4,889 —
North Carolina 75,217 65,955 691 8,571
North Dakota 9,473 8,114 † 1,359
See notes at end of table.
Table C. Number of public high school completers, by type of completion: United States and other jurisdictions, school year 2001–02

E D U C A T I O N S T A T I S T I C S Q U A R T E R L Y — V O L U M E 7, I S S U E S 1 & 2, 2 0 0 5 115
Total high school Other high school High school equivalencyState completers Diploma recipients completers1 recipients2
Ohio 114,694 110,608 † 4,086
Oklahoma 46,277 36,852 † 9,425
Oregon 41,466 31,153 3,927 6,386
North Dakota 123,510 114,943 † 8,567
Rhode Island 10,364 9,006 9 1,349
South Carolina — 31,302 2,384 —
South Dakota — 8,796 † —
Tennessee — 40,894 3,728 —
Texas 233,476 225,167 † 8,309
Utah 33,329 30,183 155 2,991
Vermont 7,190 7,083 92 15
Virginia 72,850 66,519 2,753 3,578
Washington 58,974 58,311 152 511
West Virginia 18,417 17,128 19 1,270
Wisconsin — 60,575 — 12,543
Wyoming — 6,106 40 —
Department of Defense (DoD) dependents schools, Bureau of Indian Affairs, and outlying areas
DoDDS: DoD schools (overseas) — 2,554 † —
DDESS: DoD schools (domestic) — 565 † —
Bureau of Indian Affairs — — † —
American Samoa 885 823 7 55
Guam — — † —
Northern Marianas 417 416 † 1
Puerto Rico (5) (5) (5) (5)
Virgin Islands — 883 † —
— Not available.† Not applicable.1 Includes individuals who receive certifi cates of attendance or some other credential in lieu of diplomas. Total other high school completers does not include New Hamp-shire, New Mexico, and Wisconsin. 2 Includes recipients ages 19 or younger, except in Minnesota, where they are ages 20 or younger.3 U.S. totals include the 50 states and the District of Columbia.4 Data imputed based on prior-year (fall 2001) data.5 Number was withheld from publication because the number of completers exceeded 12th-grade membership in 2001–02. NOTE: High school completer categories may include students not included in 12th-grade membership in the 2001–02 school year.SOURCE: U.S. Department of Education, National Center for Education Statistics, Common Core of Data (CCD), “State Nonfi scal Survey of Public Elementary/Secondary Educa-tion,” 2002–03, Version 1a. (Originally published as table 4 on pp. 9–10 of the complete report from which this article is excerpted.)
Table C. Number of public high school completers, by type of completion: United States and other jurisdictions, school year 2001–02—Continued
Public Elementary and Secondary Students, Staff, Schools, and School Districts: School Year 2002–03

N A T I O N A L C E N T E R F O R E D U C A T I O N S T A T I S T I C S116
Elementary and Secondary Education
State Total staff Number Percent Number Percent Number Percent Number Percent
United States3 5,956,689 4 3,034,064 50.9 4 664,385 11.2 4 47,998 0.8 4 100,901 1.7 5
Alabama 88,882 4 47,104 53.0 4 6,169 6.9 667 0.8 1,696 1.9
Alaska 17,101 2 8,080 47.2 2,328 13.6 172 1.0 4 289 1.7
Arizona 96,639 47,101 48.7 13,650 14.1 187 0.2 1,264 1.3
Arkansas 63,815 30,330 47.5 6,217 9.7 613 1.0 1,436 2.3
California 581,664 4 307,672 52.9 4,6 72,242 12.4 6,664 1.1 6,684 1.1
Colorado 90,396 45,401 50.2 11,008 12.2 926 1.0 1,390 1.5
Connecticut 86,361 42,296 49.0 12,076 14.0 400 0.5 1,328 1.5
Delaware 14,449 7,698 53.3 1,388 9.6 181 1.3 238 1.6
District of Columbia 11,549 5 5,005 43.3 5 1,536 13.3 5 20 0.2 5 243 2.1 5
Florida 287,090 138,226 48.1 31,040 10.8 658 0.2 5,640 2.0
Georgia 197,944 96,044 48.5 23,792 12.0 1,490 0.8 3,319 1.7
Hawaii 20,703 10,973 53.0 2,603 12.6 524 2.5 649 3.1
Idaho 24,897 13,896 55.8 2,641 10.6 274 1.1 591 2.4
Illinois 258,234 4 131,045 50.7 32,902 12.7 4 1,298 0.5 2,942 1.1
Indiana 126,998 59,968 47.2 17,426 13.7 1,623 1.3 1,812 1.4
Iowa 67,426 34,573 51.3 8,439 12.5 477 0.7 1,197 1.8
Kansas 63,911 32,643 51.1 6,805 10.6 118 0.2 1,142 1.8
Kentucky 95,839 40,662 42.4 14,078 14.7 846 0.9 1,460 1.5
Louisiana 102,333 50,062 48.9 11,372 11.1 1,348 1.3 3,094 3.0
Maine 34,578 16,837 48.7 5,903 17.1 218 0.6 646 1.9
Maryland 102,642 55,382 54.0 9,726 9.5 948 0.9 2,228 2.2
Massachusetts 143,944 5 74,214 51.6 19,945 13.9 3,603 2.5 2,924 2.0
Michigan 187,093 89,595 47.9 22,664 12.1 2,988 1.6 2,660 1.4
Minnesota 105,311 52,808 50.1 14,758 14.0 439 0.4 1,063 1.0
Mississippi 66,133 31,598 47.8 8,314 12.6 619 0.9 966 1.5
Missouri 128,124 66,717 52.1 11,884 9.3 1,057 0.8 2,730 2.1
Montana 19,379 4 10,362 53.5 2,368 12.2 4 171 0.9 432 2.2
Nebraska 40,743 21,043 51.6 4,692 11.5 408 1.0 777 1.9
Nevada 33,441 20,037 59.9 3,220 9.6 254 0.8 715 2.1
New Hampshire 30,087 14,977 49.8 6,050 20.1 196 0.7 7 772 2.6
New Jersey 199,381 107,004 53.7 22,671 11.4 1,464 0.7 3,611 1.8
New Mexico 43,826 21,172 48.3 5,158 11.8 660 1.5 775 1.8
New York 428,038 5 210,926 49.3 5 42,479 9.9 2,167 0.5 5 7,241 1.7
North Carolina 169,328 87,677 51.8 27,476 16.2 889 0.5 3,422 2.0
North Dakota 15,090 8,078 53.5 1,798 11.9 126 0.8 279 1.8
Guidancecounselors
Instructionalcoordinators and
supervisorsInstructional aidesTeachers
Table D. Number of staff employed by public elementary and secondary school systems and percentage of total staff, by category: United States and other jurisdictions, school year 2002–03
See notes at end of table.

E D U C A T I O N S T A T I S T I C S Q U A R T E R L Y — V O L U M E 7, I S S U E S 1 & 2, 2 0 0 5 117
State Total staff Number Percent Number Percent Number Percent Number Percent
Ohio 242,372 125,372 51.7 17,397 7.2 501 0.2 3,587 1.5
Oklahoma 74,422 40,638 54.6 6,323 8.5 217 0.3 1,570 2.1
Oregon 55,042 27,126 49.3 8,313 15.1 434 0.8 1,172 2.1
Pennsylvania 231,251 118,256 51.1 24,497 10.6 1,464 0.6 4,292 1.9
Rhode Island 18,774 5 11,196 59.6 5 2,344 12.5 5 67 0.4 5 351 1.95
South Carolina 63,165 4 46,578 73.7 1,947 3.1 741 1.2 1,717 2.7
South Dakota 19,031 9,257 48.6 3,312 17.4 376 2.0 320 1.7
Tennessee 114,357 58,652 51.3 14,199 12.4 1,179 1.0 5 1,878 1.6
Texas 594,002 288,655 48.6 58,933 9.9 1,335 0.2 9,924 1.7
Utah 41,555 22,415 53.9 5,602 13.5 653 1.6 684 1.6
Vermont 18,384 8,542 46.5 4,210 22.9 325 1.8 418 2.3
Virginia 162,994 4 99,919 61.3 2,632 1.6 1,465 0.9 2,362 1.4
Washington 112,740 52,953 47.0 10,116 9.0 2,394 2.1 1,972 1.7
West Virginia 38,132 20,119 52.8 3,087 8.1 336 0.9 660 1.7
Wisconsin 113,262 60,385 53.3 12,851 11.3 1,663 1.5 1,948 1.7
Wyoming 13,837 4 6,795 49.1 4 1,804 13.0 155 1.1 391 2.8
Department of Defense (DoD) dependents schools, Bureau of Indian Affairs, and outlying areas
DoDDS: DoD schools (overseas) 7,044 4,793 68.0 228 3.2 102 1.4 258 3.7
DDESS: DoD schools (domestic) 4,199 2,424 57.7 399 9.5 47 1.1 105 2.5
Bureau of Indian Affairs — — — — — — — — —
American Samoa 1,735 943 54.4 147 8.5 44 2.5 46 2.7
Guam — — — — — — — — —
Northern Marianas 1,093 545 49.9 212 19.4 9 0.8 16 1.5
Puerto Rico 74,553 42,369 56.8 233 0.3 360 0.5 995 1.3
Virgin Islands 3,036 1,502 49.5 313 10.3 19 0.6 84 2.8
Guidancecounselors
Instructionalcoordinators and
supervisorsInstructional aidesTeachers
Table D. Number of staff employed by public elementary and secondary school systems and percentage of total staff, by category: United States and other jurisdictions, school year 2002–03—Continued
See notes at end of table.
Public Elementary and Secondary Students, Staff, Schools, and School Districts: School Year 2002–03
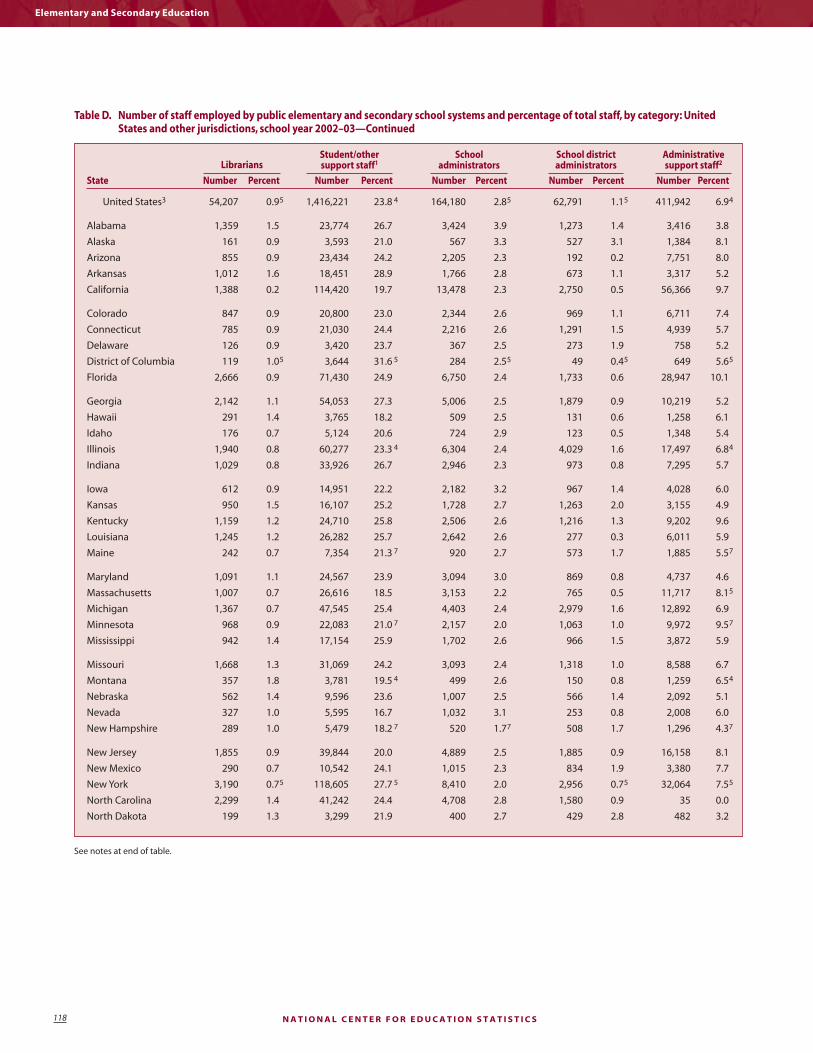
N A T I O N A L C E N T E R F O R E D U C A T I O N S T A T I S T I C S118
Elementary and Secondary Education
State Number Percent Number Percent Number Percent Number Percent Number Percent
United States3 54,207 0.9 5 1,416,221 23.8 4 164,180 2.8 5 62,791 1.1 5 411,942 6.9 4
Alabama 1,359 1.5 23,774 26.7 3,424 3.9 1,273 1.4 3,416 3.8
Alaska 161 0.9 3,593 21.0 567 3.3 527 3.1 1,384 8.1
Arizona 855 0.9 23,434 24.2 2,205 2.3 192 0.2 7,751 8.0
Arkansas 1,012 1.6 18,451 28.9 1,766 2.8 673 1.1 3,317 5.2
California 1,388 0.2 114,420 19.7 13,478 2.3 2,750 0.5 56,366 9.7
Colorado 847 0.9 20,800 23.0 2,344 2.6 969 1.1 6,711 7.4
Connecticut 785 0.9 21,030 24.4 2,216 2.6 1,291 1.5 4,939 5.7
Delaware 126 0.9 3,420 23.7 367 2.5 273 1.9 758 5.2
District of Columbia 119 1.0 5 3,644 31.6 5 284 2.5 5 49 0.4 5 649 5.6 5
Florida 2,666 0.9 71,430 24.9 6,750 2.4 1,733 0.6 28,947 10.1
Georgia 2,142 1.1 54,053 27.3 5,006 2.5 1,879 0.9 10,219 5.2
Hawaii 291 1.4 3,765 18.2 509 2.5 131 0.6 1,258 6.1
Idaho 176 0.7 5,124 20.6 724 2.9 123 0.5 1,348 5.4
Illinois 1,940 0.8 60,277 23.3 4 6,304 2.4 4,029 1.6 17,497 6.8 4
Indiana 1,029 0.8 33,926 26.7 2,946 2.3 973 0.8 7,295 5.7
Iowa 612 0.9 14,951 22.2 2,182 3.2 967 1.4 4,028 6.0
Kansas 950 1.5 16,107 25.2 1,728 2.7 1,263 2.0 3,155 4.9
Kentucky 1,159 1.2 24,710 25.8 2,506 2.6 1,216 1.3 9,202 9.6
Louisiana 1,245 1.2 26,282 25.7 2,642 2.6 277 0.3 6,011 5.9
Maine 242 0.7 7,354 21.3 7 920 2.7 573 1.7 1,885 5.5 7
Maryland 1,091 1.1 24,567 23.9 3,094 3.0 869 0.8 4,737 4.6
Massachusetts 1,007 0.7 26,616 18.5 3,153 2.2 765 0.5 11,717 8.1 5
Michigan 1,367 0.7 47,545 25.4 4,403 2.4 2,979 1.6 12,892 6.9
Minnesota 968 0.9 22,083 21.0 7 2,157 2.0 1,063 1.0 9,972 9.5 7
Mississippi 942 1.4 17,154 25.9 1,702 2.6 966 1.5 3,872 5.9
Missouri 1,668 1.3 31,069 24.2 3,093 2.4 1,318 1.0 8,588 6.7
Montana 357 1.8 3,781 19.5 4 499 2.6 150 0.8 1,259 6.5 4
Nebraska 562 1.4 9,596 23.6 1,007 2.5 566 1.4 2,092 5.1
Nevada 327 1.0 5,595 16.7 1,032 3.1 253 0.8 2,008 6.0
New Hampshire 289 1.0 5,479 18.2 7 520 1.7 7 508 1.7 1,296 4.37
New Jersey 1,855 0.9 39,844 20.0 4,889 2.5 1,885 0.9 16,158 8.1
New Mexico 290 0.7 10,542 24.1 1,015 2.3 834 1.9 3,380 7.7
New York 3,190 0.7 5 118,605 27.7 5 8,410 2.0 2,956 0.7 5 32,064 7.5 5
North Carolina 2,299 1.4 41,242 24.4 4,708 2.8 1,580 0.9 35 0.0
North Dakota 199 1.3 3,299 21.9 400 2.7 429 2.8 482 3.2
Administrativesupport staff2Librarians
School districtadministrators
Schooladministrators
Student/othersupport staff1
Table D. Number of staff employed by public elementary and secondary school systems and percentage of total staff, by category: United States and other jurisdictions, school year 2002–03—Continued
See notes at end of table.

E D U C A T I O N S T A T I S T I C S Q U A R T E R L Y — V O L U M E 7, I S S U E S 1 & 2, 2 0 0 5 119
State Number Percent Number Percent Number Percent Number Percent Number Percent
Ohio 1,615 0.7 54,587 22.5 6,543 2.7 6,549 2.7 26,221 10.8
Oklahoma 1,031 1.4 16,475 22.1 2,007 2.7 714 1.0 5,447 7.3
Oregon 510 0.9 10,492 19.1 1,597 2.9 701 1.3 4,697 8.5
Pennsylvania 2,227 1.0 58,495 25.3 4,581 2.0 1,639 0.7 15,800 6.8
Rhode Island 61 0.3 5 2,748 14.6 5 452 2.4 5 199 1.1 5 1,356 7.2 5
South Carolina 1,131 1.8 1,780 2.8 3,141 5.0 299 0.5 5,831 9.2 4
South Dakota 162 0.9 3,940 20.7 415 2.2 443 2.3 806 4.2
Tennessee 1,522 1.3 23,803 20.8 7 4,895 4.3 1,197 1.0 7,032 6.1 7
Texas 4,875 0.8 165,064 27.8 29,391 4.9 7,950 1.3 27,875 4.7
Utah 282 0.7 7,999 19.2 1,010 2.4 165 0.4 2,745 6.6
Vermont 234 1.3 3,098 16.9 430 2.3 145 0.8 982 5.3
Virginia 1,851 1.1 39,479 24.2 4,108 2.5 5 1,855 1.1 9,323 5.7
Washington 1,325 1.2 33,649 29.8 2,717 2.4 1,037 0.9 6,577 5.8
West Virginia 391 1.0 9,873 25.9 1,063 2.8 415 1.1 2,188 5.7
Wisconsin 1,340 1.2 24,176 21.3 2,538 2.2 923 0.8 7,438 6.6
Wyoming 135 1.0 3,001 21.7 342 2.5 278 2.0 936 6.8
Department of Defense (DoD) dependents schools, Bureau of Indian Affairs, and outlying areas
DoDDS: DoD schools (overseas) 153 2.2 487 6.9 268 3.8 39 0.6 716 10.2
DDESS: DoD schools (domestic) 70 1.7 671 16.0 113 2.7 36 0.9 334 8.0
Bureau of Indian Affairs — — — — — — — — — —
American Samoa 6 0.3 263 13.5 82 4.7 39 2.2 165 9.5
Guam — — — — — — — — — —
Northern Marianas 0 0.0 151 12.8 33 3.0 7 0.6 120 11.0
Puerto Rico 1,050 1.4 21,877 29.1 1,537 2.1 1,571 2.1 4,561 6.1
Virgin Islands 39 1.3 707 23.2 86 2.8 79 2.6 207 6.8
Administrativesupport staff2Librarians
School districtadministrators
Schooladministrators
Student/othersupport staff1
Table D. Number of staff employed by public elementary and secondary school systems and percentage of total staff, by category: United States and other jurisdictions, school year 2002–03—Continued
— Not available.1 Student/other support services include library support staff, student support services staff, and all other nonadministrative support staff.2 Administrative support staff includes district and school-level administrative support staff.3 U.S. totals include the 50 states and the District of Columbia.4 Data imputed based on current-year (fall 2002) data.5 Data imputed based on prior-year (fall 2001) data.6 California did not report the number of ungraded teachers, and the total numbers of teachers in California is therefore underestimated.7 Data disaggregated from reported total.NOTE: All staff counts are full-time-equivalency (FTE) counts. Detail may not sum to totals because of rounding.SOURCE: U.S. Department of Education, National Center for Education Statistics, Common Core of Data (CCD), “State Nonfi scal Survey of Public Elementary/Secondary Educa-tion,” 2002–03, Version 1a. (Originally published as table 6 on pp. 13–16 of the complete report from which this article is excerpted.)
Public Elementary and Secondary Students, Staff, Schools, and School Districts: School Year 2002–03

N A T I O N A L C E N T E R F O R E D U C A T I O N S T A T I S T I C S120
Elementary and Secondary Education
Revenues and ExpendituresRevenues and Expenditures by Public School Districts: School Year 2001–02—————————————————————————Frank Johnson
This article was originally published as the E.D. TAB of the same name. The universe data are from the Common Core of Data (CCD) “School District Finance Survey (F-33).” The Methodology and Defi nitions sections from the original report have been omitted.
This report presents fi ndings from the Common Core of Data (CCD) “School District Finance Survey.” These data are collected annually from state education agencies through the U.S. Census Bureau’s “Survey of Local Gov-ernment Finances: School Systems.” Data in the “School District Finance Survey” include revenues by source, expen-ditures by function and object, long-term and short-term debt, and student membership for each school district in the United States.
This short report on school district revenues and expen-ditures is a companion to the state-level E.D. TAB, Rev-enues and Expenditures for Public Elementary and Secondary Education: School Year 2001–02 (Cohen and Johnson 2004), which presents total state and national spending on pub-lic elementary and secondary education. These data were collected and edited between March 2003 and March 2004. These data are fi nal.
Only regular school districts with student counts greater than 0, current expenditures per student between $2,500 and $35,000, and that are on the CCD “Local Education Agency Universe Survey” fi le were included in this analysis. There were 14,002 such districts in school year 2001–02.
Data on the number of students and districts within each state also show the variation in the organization of educa-tion across the country. For example, Florida, with over 2 million students, has 67 school districts, whereas Nebraska, with fewer than 300,000 students, has 524 school districts. The number and size of school districts may affect adminis-trative and other overhead costs.
The District of Columbia is a single urban school district. It is treated separately from the states in the analysis below, because it is often an outlier with larger revenues and expenditures per student than 95 percent of the districts in most states. The District of Columbia did not report any fi nance data for its charter schools.
The federal range ratio is used in this report as an indica-tor of the difference between districts with relatively high revenues (or expenditures) per student and districts with relatively low revenues (or expenditures) per student, within the state and the nation. It is the difference between
the amount per student of the district at the 95th percentile and the district at the 5th percentile, divided by the amount for the district at the 5th percentile.1
HighlightsRevenues per student received by school districts
■ In the 2001–02 school year, the median school district received $8,572 per student in revenues from state, local, and federal sources (table 1). The median revenue per student indicates that half of the districts received less than $8,572 per student and half of the districts received more than $8,572 per student.
■ Median school district revenues per student among the states ranged from $6,039 in Tennessee to $16,342 in Alaska. Revenues in the District of Columbia were $16,627.
■ Ninety percent of the school districts in the country received between $6,208 and $16,286 per student. When school district revenues per student are ranked from highest to lowest, the value for the district at the 5th percentile was $6,208, and the value for the district at the 95th percentile was $16,286. The fed-eral range ratio indicates the difference, or “dispar-ity,” between the 5th and 95th percentile. The federal range ratio for total revenues per student was 1.62, indicating that the district at the 95th percentile received 162 percent more revenue per student as the district at the 5th percentile.
■ The federal range ratio varied from 0.3 in Kentucky, Maryland, and West Virginia to 2.7 in Montana. In 25 states the revenues per student were relatively homogeneous, with districts at the 95th percentile reporting less than twice the amount of revenue per student as the district at the 5th percentile; that is, their federal range ratios were under 1.0. On the other hand, the top 5 percent of the districts in four states received revenues per student of more than three times the revenue per student of the districts
1Comparisons using the federal range ratio exclude the top and bottom 5 percent of districts, and reduce the infl uence of extreme cases. The federal range ratio conveys an idea of the magnitude of differences between districts with relatively high revenues or expenditures per student and districts with relatively low revenues or expenditures per student, after excluding extremes. The federal range ratio has been used by Berne and Stiefel (1984); Parrish, Matsumoto, and Fowler (1995); and Hussar and Sonnenberg (2000).

E D U C A T I O N S T A T I S T I C S Q U A R T E R L Y — V O L U M E 7, I S S U E S 1 & 2, 2 0 0 5 121
at the bottom 5 percent; that is, their federal range ratios were greater than 2.0.
Total expenditures per student by school districts
■ In 2001–02, the median total expenditure by school districts in the nation was $8,424 per student (table 2). This included current operating expenditures, capi-tal outlays (for school construction and equipment), expenditures for programs other than elementary/secondary education (such as adult education and community service programs), interest payments on long-term debt, and payments to state and local gov-ernments. Total expenditures do not include payments to other school districts. (Revenues received from other school districts are included in total revenues.)
■ Tables 2 and 3 include median expenditures across districts in all states for specifi c types of expenditures and for the total of these expenditures. The median district in total expenditures is unlikely to be the median district in current expenditures or other types of expenditures. Therefore, the median expenditures for the components (e.g., current, instruction, sup-port services, etc.) do not sum to the median for total expenditures.
■ Total expenditures per student ranged between $6,001 and $16,184 for 90 percent of the school districts in the country (i.e., those districts between the 5th and 95th percentiles; table 2). The federal range ratio for total expenditures per student was 1.70, indicating that the district at the 95th percentile spent 170 percent more per student as the district at the 5th percentile. The federal range ratio was slightly less for current expenditures (1.38) and instruction (1.44) and slightly more for support services (1.90).
■ Per student spending on capital outlay (for school construction and equipment) in districts with per student expenditures at the 95th percentile was 8,417 percent more than that of districts at the 5th percen-tile (table 2). Most of the expenditures reported for capital outlay are for school construction. School dis-tricts with stable student populations may not need to make large expenditures for school construction, whereas districts experiencing a growing population of children tend to spend more money on school con-struction. In addition, expenditures for construction do not appear regularly from one year to the next. Districts may build several schools at the same time. This results in a large expenditure for capital outlays one year and small expenditures in subsequent years.
■ Per student spending for programs other than elemen-tary/secondary education was approximately 29 times greater in high-spending districts than the national median ($263 vs. $9; table 2). The adult education and community service programs that make up most of the other program spending do not exist in many school districts. At least 5 percent of all school districts do not have programs other than elementary/secondary education, nor do they have interest pay-ments or payments to other government agencies.
■ Median total expenditures per student ranged from $5,954 in Mississippi to $16,456 in Alaska (table 3). Total expenditures in the District of Columbia were $16,738. The median total expenditure per student was over $10,000 in Alaska, Connecticut, Delaware, the District of Columbia, Massachusetts, New Jersey, New Mexico, New York, and Wyoming.
■ Median per student expenditures for instruction (teach-er salaries, classroom supplies, etc.) ranged from $3,254 in Mississippi to $8,931 in Alaska (table 3). Among the 10 states with the highest median expenditures per student for instruction, 8 were in the Northeast.2
■ Median per student expenditures for capital projects (primarily school construction) ranged from $145 in Vermont to $1,597 in Delaware (table 3) among the 50 states. Capital expenditures per student were $3,198 in the District of Columbia.
Current expenditures per student
Because of the variation in the kinds of programs run by school districts and the large swings in school construction expenditures, researchers often use current rather than total expenditures when reporting and comparing school district expenditures. Current expenditures are expenditures for the day-to-day operations of schools and school districts. They do not include expenditures for construction, equipment, debt fi nancing, and programs outside of public elementary/secondary education.
■ The median current expenditure per student for the nation was $7,294 (table 4).
■ Per student spending in districts at the 95th percen-tile was more than 138 percent more than per student spending in districts at the 5th percentile (i.e., the federal range ratio was 1.38). Spending in districts at the 95th percentile was less than 50 percent higher
Revenues and Expenditures by Public School Districts: School Year 2001–02
2These states are New York, New Jersey, Rhode Island, Connecticut, Massachusetts, Maine, Vermont, and Delaware. Instruction expenditures per student in the District of Columbia were higher than any state’s median per student instruction expenditures, except in Alaska and New York.
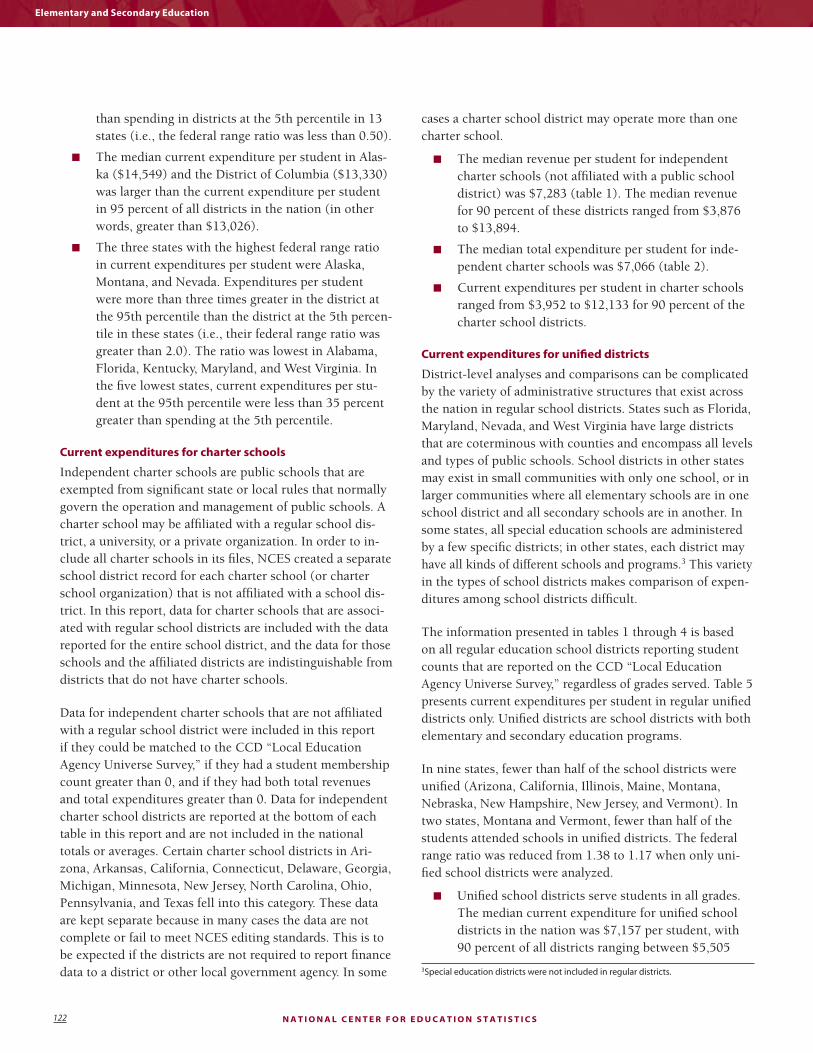
N A T I O N A L C E N T E R F O R E D U C A T I O N S T A T I S T I C S122
Elementary and Secondary Education
than spending in districts at the 5th percentile in 13 states (i.e., the federal range ratio was less than 0.50).
■ The median current expenditure per student in Alas-ka ($14,549) and the District of Columbia ($13,330) was larger than the current expenditure per student in 95 percent of all districts in the nation (in other words, greater than $13,026).
■ The three states with the highest federal range ratio in current expenditures per student were Alaska, Montana, and Nevada. Expenditures per studentwere more than three times greater in the district at the 95th percentile than the district at the 5th percen-tile in these states (i.e., their federal range ratio was greater than 2.0). The ratio was lowest in Alabama, Florida, Kentucky, Maryland, and West Virginia. In the fi ve lowest states, current expenditures per stu-dent at the 95th percentile were less than 35 percent greater than spending at the 5th percentile.
Current expenditures for charter schools
Independent charter schools are public schools that are exempted from signifi cant state or local rules that normally govern the operation and management of public schools. A charter school may be affi liated with a regular school dis-trict, a university, or a private organization. In order to in-clude all charter schools in its fi les, NCES created a separate school district record for each charter school (or charter school organization) that is not affi liated with a school dis-trict. In this report, data for charter schools that are associ-ated with regular school districts are included with the data reported for the entire school district, and the data for those schools and the affi liated districts are indistinguishable from districts that do not have charter schools.
Data for independent charter schools that are not affi liated with a regular school district were included in this report if they could be matched to the CCD “Local Education Agency Universe Survey,” if they had a student membership count greater than 0, and if they had both total revenues and total expenditures greater than 0. Data for independent charter school districts are reported at the bottom of each table in this report and are not included in the national totals or averages. Certain charter school districts in Ari-zona, Arkansas, California, Connecticut, Delaware, Georgia, Michigan, Minnesota, New Jersey, North Carolina, Ohio, Pennsylvania, and Texas fell into this category. These data are kept separate because in many cases the data are not complete or fail to meet NCES editing standards. This is to be expected if the districts are not required to report fi nance data to a district or other local government agency. In some
cases a charter school district may operate more than one charter school.
■ The median revenue per student for independent charter schools (not affi liated with a public school district) was $7,283 (table 1). The median revenue for 90 percent of these districts ranged from $3,876 to $13,894.
■ The median total expenditure per student for inde-pendent charter schools was $7,066 (table 2).
■ Current expenditures per student in charter schools ranged from $3,952 to $12,133 for 90 percent of the charter school districts.
Current expenditures for unifi ed districts
District-level analyses and comparisons can be complicated by the variety of administrative structures that exist across the nation in regular school districts. States such as Florida, Maryland, Nevada, and West Virginia have large districts that are coterminous with counties and encompass all levels and types of public schools. School districts in other states may exist in small communities with only one school, or in larger communities where all elementary schools are in one school district and all secondary schools are in another. In some states, all special education schools are administered by a few specifi c districts; in other states, each district may have all kinds of different schools and programs.3 This variety in the types of school districts makes comparison of expen-ditures among school districts diffi cult.
The information presented in tables 1 through 4 is based on all regular education school districts reporting student counts that are reported on the CCD “Local Education Agency Universe Survey,” regardless of grades served. Table 5 presents current expenditures per student in regular unifi ed districts only. Unifi ed districts are school districts with both elementary and secondary education programs.
In nine states, fewer than half of the school districts were unifi ed (Arizona, California, Illinois, Maine, Montana, Nebraska, New Hampshire, New Jersey, and Vermont). In two states, Montana and Vermont, fewer than half of the students attended schools in unifi ed districts. The federal range ratio was reduced from 1.38 to 1.17 when only uni-fi ed school districts were analyzed.
■ Unifi ed school districts serve students in all grades. The median current expenditure for unifi ed school districts in the nation was $7,157 per student, with 90 percent of all districts ranging between $5,505
3Special education districts were not included in regular districts.

E D U C A T I O N S T A T I S T I C S Q U A R T E R L Y — V O L U M E 7, I S S U E S 1 & 2, 2 0 0 5 123
and $11,931 (table 5). The federal range ratio was 1.17, indicating a slight reduction in variation of per student spending compared with all regular school districts (1.38) reported in table 4.
ReferencesBerne, R., and Stiefel, L. (1984). The Measurement of Equity in
School Finance. Baltimore: Johns Hopkins University Press.
Cohen, C., and Johnson, F. (2004). Revenues and Expenditures for Public Elementary and Secondary Education School Year 2001–02 (NCES 2004-341). U.S. Department of Education. Washington, DC: National Center for Education Statistics. Available: http://nces.ed.gov/pubs2004/2004341.pdf.
Hussar, W., and Sonnenberg, W. (2000). Trends in Disparities in School District Level Expenditures per Pupil (NCES 2000-020). U.S. Department of Education. Washington, DC: National Cen-ter for Education Statistics.
Parrish, T.B., Matsumoto, C.S., and Fowler, W.J., Jr. (1995). Dispari-ties in Public School District Spending 1989–90 (NCES 95-300). U.S. Department of Education. Washington, DC: National Cen-ter for Education Statistics.
Data source: The NCES Common Core of Data (CCD), “School District Finance Survey (F-33),” FY 2002.
For technical information, see the complete report:
Johnson, F. (2005). Revenues and Expenditures by Public School Districts: School Year 2001–02 (NCES 2005-342).
Author affi liation: F. Johnson, NCES.
For questions about content, contact Frank Johnson ([email protected]).
To obtain the complete report (NCES 2005-342), visit the NCES Electronic Catalog (http://nces.ed.gov/pubsearch).
Revenues and Expenditures by Public School Districts: School Year 2001–02

N A T I O N A L C E N T E R F O R E D U C A T I O N S T A T I S T I C S124
Elementary and Secondary Education
Table 1. Revenues per student for public elementary and secondary school districts, by state: School year 2001–02
Revenues per student
State5th
percentile Median95th
percentileFederal
range ratio1Number of
districtsNumber of
students
United States $6,208 $8,572 $16,286 1.62 14,002 46,941,294
Alabama 6,149 6,768 8,492 0.38 128 726,367
Alaska 7,930 16,342 28,555 2.60 53 133,010
Arizona 5,659 8,173 18,035 2.19 230 864,264
Arkansas 5,956 6,611 8,974 0.51 310 449,161
California 6,710 7,979 14,628 1.18 971 6,066,162
Colorado 6,607 8,272 14,653 1.22 178 741,319
Connecticut 9,357 11,300 16,820 0.80 166 543,829
Delaware 9,102 10,239 12,295 0.35 16 105,752
District of Columbia †2 16,627 †2 †2 1 68,449
Florida 6,512 7,207 9,435 0.45 67 2,500,179
Georgia 6,973 8,119 10,632 0.52 179 1,466,836
Hawaii †2 10,239 †2 †2 1 184,546
Idaho 5,730 7,510 13,691 1.39 114 246,415
Illinois 6,439 8,135 13,680 1.12 891 2,047,836
Indiana 7,360 8,474 11,144 0.51 292 994,348
Iowa 7,225 8,332 11,477 0.59 371 485,932
Kansas 6,858 8,392 11,460 0.67 303 470,204
Kentucky 6,167 6,837 8,021 0.30 176 654,363
Louisiana 6,126 7,220 9,367 0.53 66 725,027
Maine 8,158 10,620 20,750 1.54 224 204,949
Maryland 8,202 9,250 11,017 0.34 24 860,640
Massachusetts 8,164 10,623 19,685 1.41 302 935,424
Michigan 7,617 8,715 12,098 0.59 553 1,661,301
Minnesota 7,414 8,775 12,013 0.62 342 832,369
Mississippi 5,246 6,087 8,085 0.54 152 492,198
Missouri 6,201 7,513 11,321 0.83 522 909,918
Montana 5,278 8,148 19,325 2.66 442 151,745
Nebraska 5,125 8,551 16,750 2.27 524 283,789
Nevada 6,938 8,309 17,348 1.50 17 356,814
New Hampshire 7,309 10,618 21,521 1.94 162 203,072
New Jersey 9,775 12,458 19,636 1.01 551 1,306,347
New Mexico 6,792 10,404 18,727 1.76 89 320,068
New York 10,283 12,838 20,939 1.04 687 2,846,644
North Carolina 6,497 7,475 9,836 0.51 117 1,296,156
North Dakota 5,902 8,355 16,957 1.87 218 105,936
Ohio 6,848 8,045 14,991 1.19 611 1,796,601
Oklahoma 5,520 6,897 10,677 0.93 542 621,573
Oregon 7,107 8,322 19,671 1.77 197 549,604
Pennsylvania 7,819 9,167 12,296 0.57 500 1,766,513
Rhode Island 8,751 10,142 14,682 0.68 36 156,624
See notes at end of table.
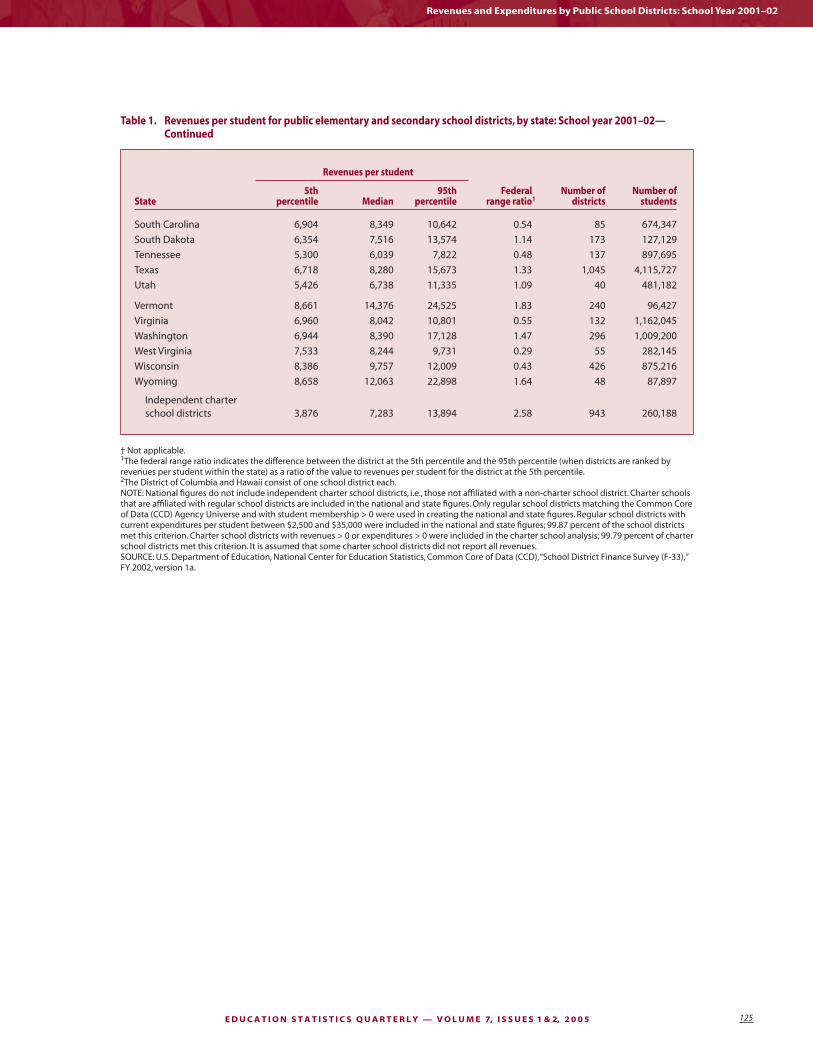
E D U C A T I O N S T A T I S T I C S Q U A R T E R L Y — V O L U M E 7, I S S U E S 1 & 2, 2 0 0 5 125
Table 1. Revenues per student for public elementary and secondary school districts, by state: School year 2001–02—Continued
Revenues per student
State5th
percentile Median95th
percentileFederal
range ratio1Number of
districtsNumber of
students
South Carolina 6,904 8,349 10,642 0.54 85 674,347
South Dakota 6,354 7,516 13,574 1.14 173 127,129
Tennessee 5,300 6,039 7,822 0.48 137 897,695
Texas 6,718 8,280 15,673 1.33 1,045 4,115,727
Utah 5,426 6,738 11,335 1.09 40 481,182
Vermont 8,661 14,376 24,525 1.83 240 96,427
Virginia 6,960 8,042 10,801 0.55 132 1,162,045
Washington 6,944 8,390 17,128 1.47 296 1,009,200
West Virginia 7,533 8,244 9,731 0.29 55 282,145
Wisconsin 8,386 9,757 12,009 0.43 426 875,216
Wyoming 8,658 12,063 22,898 1.64 48 87,897
Independent charter school districts 3,876 7,283 13,894 2.58 943 260,188
† Not applicable.1The federal range ratio indicates the difference between the district at the 5th percentile and the 95th percentile (when districts are ranked by revenues per student within the state) as a ratio of the value to revenues per student for the district at the 5th percentile. 2The District of Columbia and Hawaii consist of one school district each.NOTE: National fi gures do not include independent charter school districts, i.e., those not affi liated with a non-charter school district. Charter schoolsthat are affi liated with regular school districts are included in the national and state fi gures. Only regular school districts matching the Common Core of Data (CCD) Agency Universe and with student membership > 0 were used in creating the national and state fi gures. Regular school districts with current expenditures per student between $2,500 and $35,000 were included in the national and state fi gures; 99.87 percent of the school districts met this criterion. Charter school districts with revenues > 0 or expenditures > 0 were included in the charter school analysis; 99.79 percent of charter school districts met this criterion. It is assumed that some charter school districts did not report all revenues.SOURCE: U.S. Department of Education, National Center for Education Statistics, Common Core of Data (CCD), “School District Finance Survey (F-33),” FY 2002, version 1a.
Revenues and Expenditures by Public School Districts: School Year 2001–02

N A T I O N A L C E N T E R F O R E D U C A T I O N S T A T I S T I C S126
Elementary and Secondary Education
Table 2. Expenditures per student for elementary and secondary education, by type of expenditure for regular districts and for independent charter school districts: School year 2001–02
Expenditures per student
Type of expenditure 5th percentile Median 95th percentileFederal
range ratio1
Regular districts
Total $6,001 $8,424 $16,184 1.70
Current 5,463 7,294 13,026 1.38
Instruction 3,311 4,500 8,087 1.44
Support services 1,641 2,481 4,762 1.90
Non-instruction services 20 321 635 30.44
Capital outlay 50 443 4,298 84.17
Other programs 0 9 263 †
Payments to state and local governments 0 0 139 †
Interest on long-term debt 0 115 662 †
Payments to other school districts2 0 52 1,356 †
Independent charter school districts
Total 4,000 7,066 14,215 2.55
Current 3,952 6,545 12,133 2.07
Instruction 1,453 3,439 6,667 3.59
Support services 1,354 2,861 6,125 3.52
Non-instruction services 0 62 582 †
Capital outlay 0 0 2,266 †
Other programs 0 0 282 †
Payments to state and local governments 0 0 0 †
Interest on long-term debt 0 0 184 †
Payments to other school districts2 0 0 67 †
† Not applicable.1The federal range ratio indicates the difference between the district at the 5th percentile and the 95th percentile (when districts are ranked by expen-ditures per student within the state) as a ratio of the value to expenditures per student for the district at the 5th percentile.2Total expenditures do not include payments to other school districts.NOTE: National fi gures do not include independent charter school districts, i.e., those not affi liated with a non-charter school district. Charter schools that are affi liated with regular school districts are included in the national and state fi gures. Only regular school districts matching the Common Core of Data (CCD) Agency Universe and with student membership > 0 were used in creating the national and state fi gures. Regular school districts with current expenditures per student between $2,500 and $35,000 were included in the national and state fi gures; 99.87 percent of the school districts met this criterion. Charter school districts with revenues > 0 or expenditures > 0 were included in the charter school analysis; 99.79 percent of charter school districts met this criterion. The District of Columbia and Hawaii consist of one school district each. Other programs include community services, adult education, and community colleges. SOURCE: U.S. Department of Education, National Center for Education Statistics, Common Core of Data (CCD), “School District Finance Survey (F-33),” FY 2002, version 1a.

E D U C A T I O N S T A T I S T I C S Q U A R T E R L Y — V O L U M E 7, I S S U E S 1 & 2, 2 0 0 5 127
Table 3. School district expenditures per student, by type of expenditure and state: School year 2001–02
Median per pupil expenditures
StateTotal
expenditures 1 Current
expenditures2Instruction
expendituresCapital outlay expenditures
Other programs and payments to other govt.
agencies
3
Interest expenditures on
long-term debt
Payments to other districts1
United States $8,424 $7,294 $4,500 $443 $15 $115 $52
Alabama 6,755 6,042 3,725 380 132 72 1
Alaska 16,456 14,549 8,931 759 21 0 0
Arizona 7,585 6,197 3,287 679 0 12 0
Arkansas 6,438 5,813 3,671 283 0 118 0
California 8,109 7,003 4,448 617 20 29 32
Colorado 8,129 7,101 4,160 523 0 126 131
Connecticut 10,558 9,737 6,182 314 14 255 120
Delaware 10,726 8,742 5,489 1,597 17 81 300
District of Columbia4 16,738 13,330 6,617 3,198 210 0 0
Florida 7,262 6,015 3,437 907 107 91 0
Georgia 7,901 6,975 4,450 628 1 73 6
Hawaii4 7,785 7,306 4,417 228 250 0 0
Idaho 7,439 6,645 4,077 358 0 107 0
Illinois 8,157 7,043 4,257 585 1 117 286
Indiana 8,362 6,887 4,178 604 609 32 215
Iowa 7,551 6,796 4,173 434 0 83 694
Kansas 8,149 7,397 4,330 453 0 107 5
Kentucky 6,705 6,221 3,852 222 96 132 0
Louisiana 7,148 6,525 3,964 356 25 116 0
Maine 9,723 9,016 5,859 188 24 62 225
Maryland 9,272 8,077 4,853 793 25 87 89
Massachusetts 10,445 9,343 6,073 175 0 215 245
Michigan 8,467 7,268 4,532 450 76 346 10
Minnesota 8,478 7,014 4,502 581 291 299 264
Mississippi 5,954 5,420 3,254 282 4 112 0
Missouri 7,309 6,457 3,980 383 73 85 58
Montana 8,245 7,572 4,702 186 0 0 27
Nebraska 8,473 7,801 5,268 324 0 0 0
Nevada 8,530 7,807 4,623 496 40 242 1
New Hampshire 9,445 8,489 5,344 277 0 129 187
New Jersey 11,826 10,630 6,440 370 49 156 233
New Mexico 10,238 8,205 4,423 1,201 32 133 0
New York 13,629 11,219 7,449 995 51 318 29
North Carolina 7,425 6,633 4,131 380 28 107 0
North Dakota 7,859 7,303 4,225 391 0 0 403
Ohio 7,781 6,735 4,037 455 88 105 28
Oklahoma 6,897 6,601 3,780 200 4 15 0
Oregon 8,646 7,408 4,469 301 0 98 9
Pennsylvania 9,040 7,625 4,794 485 17 392 427
Rhode Island 9,845 9,530 6,209 150 54 153 210
See notes at end of table.
Revenues and Expenditures by Public School Districts: School Year 2001–02

N A T I O N A L C E N T E R F O R E D U C A T I O N S T A T I S T I C S128
Elementary and Secondary Education
Table 3. School district expenditures per student, by type of expenditure and state: School year 2001–02—Continued
Median per pupil expenditures
StateTotal
expenditures 1 Current
expenditures2Instruction
expendituresCapital outlay expenditures
Other programs and payments to other govt.
agencies
3 Interest expenditures on long-term
debt
Payments to other districts1
South Carolina 8,478 6,936 4,144 832 80 178 12
South Dakota 7,865 6,772 4,007 640 0 43 39
Tennessee 6,378 5,523 3,611 369 67 146 0
Texas 8,417 7,066 4,372 531 5 168 40
Utah 6,727 5,656 3,492 722 151 171 0
Vermont 9,293 8,818 5,736 145 0 107 4,784
Virginia 7,797 6,989 4,325 449 13 104 60
Washington 8,156 7,049 4,279 415 1 182 12
West Virginia 8,361 7,671 4,695 496 52 0 8
Wisconsin 9,478 8,294 5,126 377 134 343 99
Wyoming 11,268 9,539 5,620 1,066 3 92 0
Independent charter school districts 7,066 6,545 3,439 0 0 0 0
1Total expenditures do not include payments to other school districts.2Current expenditures includes instruction, support services, and non-instruction services.3Other programs include community services, adult education, and community colleges.4The District of Columbia and Hawaii consist of only one school district each.NOTE: National fi gures do not include independent charter school districts, i.e., those not affi liated with a non-charter school district. Charter schools that are affi liated with regular school districts are included in the national and state fi gures. Only school districts matching the Common Core of Data (CCD) Agency Universe and with student membership > 0 were used in creating this table. Districts with current expenditures per student between $2,500 and $35,000 were included in the national and state fi gures; 99.87 percent of the school districts met this criterion. Charter schools with revenues > 0 and expenditures > 0 were included in the charter school analysis; 99.79 percent of the charter school districts met this criterion. This table reports the median school district expenditure for each category; therefore, totals do not equal the sum of the detail.SOURCE: U.S. Department of Education, National Center for Education Statistics, Common Core of Data (CCD), “School District Finance Survey (F-33),” FY 2002, version 1a.

E D U C A T I O N S T A T I S T I C S Q U A R T E R L Y — V O L U M E 7, I S S U E S 1 & 2, 2 0 0 5 129
Table 4. Current expenditures per student for public elementary and secondary school districts, by state: School year 2001–02
Expenditures per student
State5th
percentile Median95th
percentileFederal range
ratio1Number of
districtsNumber of
students
United States $5,463 $7,294 $13,026 1.38 14,002 46,941,294
Alabama 5,410 6,042 7,207 0.33 128 726,367
Alaska 7,740 14,549 24,377 2.15 53 133,010
Arizona 4,481 6,197 12,828 1.86 230 864,264
Arkansas 5,116 5,813 7,947 0.55 310 449,161
California 5,865 7,003 11,777 1.01 971 6,066,162
Colorado 5,568 7,101 13,175 1.37 178 741,319
Connecticut 8,424 9,737 12,869 0.53 166 543,829
Delaware 7,359 8,742 10,077 0.37 16 105,752
District of Columbia †2 13,330 †2 †2 1 68,449
Florida 5,432 6,015 7,012 0.29 67 2,500,179
Georgia 6,114 6,975 8,942 0.46 179 1,466,836
Hawaii †2 7,306 †2 †2 1 184,546
Idaho 5,087 6,645 11,326 1.23 114 246,415
Illinois 5,436 7,043 11,053 1.03 891 2,047,836
Indiana 6,057 6,887 9,027 0.49 292 994,348
Iowa 5,915 6,796 8,593 0.45 371 485,932
Kansas 5,903 7,397 9,932 0.68 303 470,204
Kentucky 5,554 6,221 7,353 0.32 176 654,363
Louisiana 5,725 6,525 8,050 0.41 66 725,027
Maine 7,221 9,016 15,707 1.18 224 204,949
Maryland 7,339 8,077 9,668 0.32 24 860,640
Massachusetts 7,575 9,343 14,038 0.85 302 935,424
Michigan 6,404 7,268 10,257 0.60 553 1,661,301
Minnesota 5,989 7,014 9,490 0.58 342 832,369
Mississippi 4,607 5,420 7,225 0.57 152 492,198
Missouri 5,287 6,457 9,378 0.77 522 909,918
Montana 4,946 7,572 17,000 2.44 442 151,745
Nebraska 5,063 7,801 14,147 1.79 524 283,789
Nevada 5,797 7,807 18,295 2.16 17 356,814
New Hampshire 6,542 8,489 12,341 0.89 162 203,072
New Jersey 8,620 10,630 15,157 0.76 551 1,306,347
New Mexico 5,924 8,205 12,883 1.17 89 320,068
New York 8,997 11,219 17,853 0.98 687 2,846,644
North Carolina 5,850 6,633 8,241 0.41 117 1,296,156
North Dakota 5,000 7,303 14,818 1.96 218 105,936
Ohio 5,848 6,735 9,410 0.61 611 1,796,601
Oklahoma 5,156 6,601 10,116 0.96 542 621,573
Oregon 6,393 7,408 15,451 1.42 197 549,604
Pennsylvania 6,346 7,625 10,307 0.62 500 1,766,513
Rhode Island 7,964 9,530 11,948 0.50 36 156,624
See notes at end of table.
Revenues and Expenditures by Public School Districts: School Year 2001–02

N A T I O N A L C E N T E R F O R E D U C A T I O N S T A T I S T I C S130
Elementary and Secondary Education
Table 4. Current expenditures per student for public elementary and secondary school districts, by state: School year 2001–02 —Continued
Expenditures per student
State5th
percentile Median95th
percentile Federal range
ratio1Number of
districtsNumber of
students
South Carolina 6,140 6,936 9,149 0.49 85 674,347
South Dakota 5,434 6,772 11,532 1.12 173 127,129
Tennessee 4,783 5,523 7,217 0.51 137 897,695
Texas 5,821 7,066 11,752 1.02 1,045 4,115,727
Utah 4,447 5,656 9,646 1.17 40 481,182
Vermont 6,577 8,818 13,512 1.05 240 96,427
Virginia 6,135 6,989 9,512 0.55 132 1,162,045
Washington 6,027 7,049 15,840 1.63 296 1,009,200
West Virginia 6,978 7,671 8,807 0.26 55 282,145
Wisconsin 7,053 8,294 10,133 0.44 426 875,216
Wyoming 7,492 9,539 16,327 1.18 48 87,897
Independent charter school districts 3,952 6,545 12,133 2.07 943 260,188
† Not applicable.1The federal range ratio indicates the difference between the district at the 5th percentile and the 95th percentile (when districts are ranked by expen-ditures per student within the state) as a ratio of the value to expenditures per student for the district at the 5th percentile. 2The District of Columbia and Hawaii consist of one school district each.NOTE: National fi gures do not include independent charter school districts, i.e., those not affi liated with a non-charter school district. Charter schools that are affi liated with regular school districts are included in the national and state fi gures. Only regular school districts matching the Common Core of Data (CCD) Agency Universe and with student membership > 0 were used in creating this table. Districts with current expenditures per student be-tween $2,500 and $35,000 per student were included in the national and state fi gures; 98.87 percent of school districts met this criterion. Charter schools with revenues > 0 and expenditures > 0 were included in the charter school analysis; 99.79 percent of the charter school districts met this criterion.SOURCE: U.S. Department of Education, National Center for Education Statistics, Common Core of Data, “School District Finance Survey (F-33),” FY 2002, version 1a.

E D U C A T I O N S T A T I S T I C S Q U A R T E R L Y — V O L U M E 7, I S S U E S 1 & 2, 2 0 0 5 131
Table 5. Current expenditures per student for unifi ed school districts, by state: School year 2001–02
Expenditures per student
State5th
percentile Median95th
percentileFederal
range ratio1
Number of districts
unifi ed
Percent of districts
unifi ed
Number of
students
Percent of students
in unifi ed districts
United States $5,505 $7,157 $11,931 1.17 10,629 75.9 43,405,395 92.5
Alabama 5,410 6,042 7,207 0.33 128 100.0 726,367 100.0
Alaska 7,740 14,549 24,377 2.15 53 100.0 133,010 100.0
Arizona 4,619 5,938 11,382 1.46 101 43.9 551,987 63.9
Arkansas 5,116 5,813 7,947 0.55 310 100.0 449,161 100.0
California 6,105 6,984 11,077 0.81 364 37.5 4,480,470 73.9
Colorado 5,568 7,101 13,175 1.37 178 100.0 741,319 100.0
Connecticut 8,525 9,588 13,157 0.54 113 68.1 511,008 94.0
Delaware 7,359 8,742 10,077 0.37 16 100.0 105,752 100.0
District of Columbia †2 13,330 †2 †2 1 100.0 68,449 100.0
Florida 5,432 6,015 7,012 0.29 67 100.0 2,500,179 100.0
Georgia 6,114 6,966 8,834 0.44 174 97.2 1,464,902 99.9
Hawaii †2 7,306 †2 †2 1 100.0 184,546 100.0
Idaho 5,087 6,481 9,938 0.95 108 94.7 246,281 99.9
Illinois 5,487 6,794 8,733 0.59 405 45.5 1,298,575 63.4
Indiana 6,057 6,890 9,027 0.49 291 99.7 994,112 100.0
Iowa 5,924 6,784 8,052 0.36 350 94.3 482,404 99.3
Kansas 5,903 7,397 9,932 0.68 303 100.0 470,204 100.0
Kentucky 5,556 6,220 7,343 0.32 171 97.2 652,514 99.7
Louisiana 5,725 6,525 8,050 0.41 66 100.0 725,027 100.0
Maine 7,111 8,347 10,783 0.52 111 49.6 177,396 86.6
Maryland 7,339 8,077 9,668 0.32 24 100.0 860,640 100.0
Massachusetts 7,666 9,165 12,906 0.68 210 69.5 869,432 92.9
Michigan 6,422 7,252 9,832 0.53 524 94.8 1,659,757 99.9
Minnesota 5,989 6,978 9,164 0.53 327 95.6 830,173 99.7
Mississippi 4,607 5,391 6,680 0.45 148 97.4 490,857 99.7
Missouri 5,277 6,399 8,824 0.67 449 86.0 898,337 98.7
Montana 5,686 8,957 19,932 2.51 55 12.4 18,404 12.1
Nebraska 6,276 7,699 10,423 0.66 245 46.8 271,346 95.6
Nevada 5,797 7,665 18,295 2.16 16 94.1 356,725 100.0
New Hampshire 6,646 8,152 10,691 0.61 67 41.4 157,793 77.7
New Jersey 9,059 10,721 14,582 0.61 218 39.6 980,363 75.0
New Mexico 5,924 8,205 12,883 1.17 89 100.0 320,068 100.0
New York 8,952 11,092 16,435 0.84 638 92.9 2,796,260 98.2
North Carolina 5,850 6,633 8,241 0.41 117 100.0 1,296,156 100.0
North Dakota 5,152 7,053 11,687 1.27 164 75.2 102,500 96.8
Ohio 5,851 6,742 9,410 0.61 610 99.8 1,796,546 100.0
Oklahoma 5,115 6,514 9,586 0.87 430 79.3 599,534 96.5
Oregon 6,385 7,293 13,779 1.16 178 90.4 549,130 99.9
Pennsylvania 6,346 7,625 10,350 0.63 498 99.6 1,765,610 99.9
Rhode Island 7,964 9,461 11,948 0.50 32 88.9 154,482 98.6
See notes at end of table.
Revenues and Expenditures by Public School Districts: School Year 2001–02

N A T I O N A L C E N T E R F O R E D U C A T I O N S T A T I S T I C S132
Elementary and Secondary Education
Table 5. Current expenditures per student for unifi ed school districts, by state: School year 2001–02—Continued
Expenditures per student
State5th
percentile Median95th
percentile
Federal range
ratio1
Number of districts
unifi ed
Percent of districts
unifi ed
Number of
students
Percent of students
in unifi ed districts
South Carolina 6,140 6,936 9,149 0.49 85 100.0 674,347 100.0
South Dakota 5,434 6,689 10,170 0.87 168 97.1 126,031 99.1
Tennessee 4,804 5,523 7,207 0.50 123 89.8 875,998 97.6
Texas 5,821 7,026 11,208 0.93 979 93.7 4,105,037 99.7
Utah 4,447 5,656 9,646 1.17 40 100.0 481,182 100.0
Vermont 6,586 8,450 12,032 0.83 37 15.4 34,632 35.9
Virginia 6,135 6,989 9,512 0.55 132 100.0 1,162,045 100.0
Washington 6,104 6,962 13,784 1.26 246 83.1 999,210 99.0
West Virginia 6,978 7,671 8,807 0.26 55 100.0 282,145 100.0
Wisconsin 7,159 8,297 9,950 0.39 368 86.4 839,670 95.9
Wyoming 7,492 9,385 14,730 0.97 46 95.8 87,322 99.3
Independent charter school districts 4,009 6,154 13,933 2.48 257 27.3 85,179 32.7
† Not applicable.1The federal range ratio indicates the difference between the district at the 5th percentile and the 95th percentile (when districts are ranked by expenditures per student within the state) as a ratio of the value to expenditures per student for the district at the 5th percentile. 2The District of Columbia and Hawaii consist of one school district each.NOTE: National fi gures do not include independent charter school districts, i.e., those not affi liated with a non-charter school district. Charter schools that are affi liated with regular school districts are included in the national and state fi gures. Only regular school districts matching the Common Core of Data (CCD) Agency Universe and with stu-dent membership > 0 were used in creating this table. Districts with current expenditures per student between $2,500 and $35,000 per student were included in the national and state fi gures; 98.87 percent of school districts met this criterion. Charter schools with revenues > 0 and expenditures > 0 were included in the charter school analysis; 99.79 percent of the charter school districts met this criterion.SOURCE: U.S. Department of Education, National Center for Education Statistics, Common Core of Data, “School District Finance Survey (F-33),” FY 2002, version 1a.

E D U C A T I O N S T A T I S T I C S Q U A R T E R L Y — V O L U M E 7, I S S U E S 1 & 2, 2 0 0 5 133
Revenues and ExpendituresRevenues and Expenditures for Public Elementary and Secondary Education: School Year 2002–03—————————————————————————Jason Hill and Frank Johnson
This article was excerpted from the Introduction and Selected Findings of the E.D. TAB of the same name. The universe data are from the ”National Public Education Financial Survey” (NPEFS), part of the Common Core of Data (CCD). Technical notes and defi nitions from the original report have been omitted.
Approximately $440 billion in revenue was raised to fund public education for grades prekindergarten through 12 in school year 2002–03, also referred to as fi scal year 2003. Total expenditures for public education, including school construction, debt fi nancing, community services, and adult education programs, came to $455 billion. Current expen-ditures (those excluding construction, equipment, and debt fi nancing) were over $387 billion, a 5.2 percent increase from fi scal year 2002. About three out of every fi ve current expen-diture dollars were spent on teachers, textbooks, and other instructional services and supplies. An average of $8,044 was spent on each student—an increase of 4.0 percent from $7,734 in school year 2001–02 (in unadjusted dollars).1
These and other fi nancial data on public elementary and secondary education are collected and reported each year by the National Center for Education Statistics (NCES), U.S. Department of Education. The data are part of the “National Public Education Financial Survey” (NPEFS), one of the components of the Common Core of Data (CCD) collection of surveys. The initial release data in this report were col-lected from March to September 2004. Editing and imputa-tions were completed in November 2004.
Revenues for Public Elementary and Secondary Education
■ Approximately $440 billion were collected for public elementary and secondary education for school year 2002–03 in the 50 states and the District of Columbia (table 1). Total revenues ranged from a high of around $57 billion in California, which serves about 1 out of every 8 students in the nation, to a low of about $825 million in North Dakota, which serves roughly 1 out of every 449 students in the nation (table 5).
■ Nationally, revenues increased an average of 4.9 per-cent over the previous year’s revenues of nearly $420 billion (in unadjusted dollars).
■ The greatest part of education revenues came from state and local governments, which together provided nearly $403 billion, or 91.5 percent of all revenues (tables 1 and 2).
■ The federal government contribution to education revenues made up approximately $38 billion. The relative contributions from these levels of govern-ment can be expressed as portions of the typical edu-cation dollar (fi gure 1). Local sources for school year 2002–03 made up 43 cents of every dollar in revenue, state revenues comprised 49 cents, and the remaining 9 cents came from federal sources. (The cents do not sum to $1 due to rounding.)
■ Among states with more than one school district, revenues from local sources ranged from 12.9 percent in New Mexico to 62.8 percent in Nevada (table 2).2 Revenues from state sources also showed a wide distribution in their share of total revenues. The state revenue share of total revenues was 30.2 percent in Nevada and 73.8 percent in Minnesota. Federal rev-enues ranged from 4.3 percent in New Jersey to 17.7 percent in Alaska. Federal sources contributed 10 percent or more of the revenues in Alabama, Alaska, Arizona, Arkansas, the District of Columbia, Florida, Kentucky, Louisiana, Mississippi, Montana, New Mexico, North Dakota, Oklahoma, South Dakota, Tennessee, and West Virginia.
Current Expenditures for Public Elementary and Secondary Education
■ Current expenditures for public education in 2002–03 totaled approximately $388 billion (table 3). This represents a $19 billion (5.2 percent) increase over expenditures in the previous school year ($368 billion in unadjusted dollars). Nearly $238 billion in current expenditures were spent on instruction. In-structional expenditures include teacher salaries and benefi ts, supplies (e.g., textbooks), and purchased services. Another $134 billion were expended for a cluster of services that support instruction. Almost $16 billion were spent on noninstructional services.
■ Expressed in terms of the typical education dollar, instructional expenditures accounted for approxi-mately 61 cents of the education dollar for current
1 Comparisons are based on the previous edition of this report, Revenues and Expendi-tures for Public Elementary and Secondary Education: School Year 2001–02 (Cohen and Johnson 2004).
2Both the District of Columbia and Hawaii have only one school district each. There-fore, neither is comparable to other states. Hawaii funds public education primarily through state taxes. Local revenues in Hawaii consist almost entirely of student fees and charges for services, such as food services, summer school, and student activities.

N A T I O N A L C E N T E R F O R E D U C A T I O N S T A T I S T I C S134
Elementary and Secondary Education
expenditures (fi gure 2). About 35 cents of the educa-tion dollar went for support services, which include operation and maintenance of buildings, school administration, transportation, and other student and school support activities (e.g., student counsel-ing, libraries, and health services). Just over 4 cents of every education dollar went to noninstructional activities, which include school meals and enterprise activities, such as bookstores.
■ Most states were clustered around the national aver-age (61.3 percent) in terms of the share of current expenditures spent on instruction (table 4). Among the states, New Mexico spent the smallest percentage (55.5 percent) of its current expenditures on instruc-tion, while New York spent the largest percentage (68.7 percent) of its current expenditures on instruc-tion. The District of Columbia spent 52.5 percent of its current expenditures on instruction.
Current Expenditures per Student
■ In 2002–03, the 50 states and the District of Colum-bia spent an average of $8,044 in current expendi-tures for every pupil in membership (table 5). This represents a 4.0 percent increase in current expen-ditures per student from the previous school year ($7,734 in unadjusted dollars).
■ The median of the state per pupil expenditures was $7,574, indicating that one-half of all states educated students at a cost of less than $7,574 per student (derived from table 5). Three states—New Jersey ($12,568), New York ($11,961), and Connecticut ($11,057)—expended more than $11,000 per pupil. The District of Columbia, which comprises a single urban district, spent $11,847 per pupil. Only one state, Utah, had expenditures of less than $5,000 for each pupil in membership ($4,838).
■ On average, for every student in 2002–03, about $4,934 was spent for instructional services. Expendi-tures per pupil for instruction ranged from $3,103 in Utah to $ 8,213 in New York. Support services expen-ditures per pupil were highest in the District of Co-lumbia ($5,331) and New Jersey ($4,757), and lowest in Mississippi ($1,966), Tennessee ($1,885), and Utah ($1,461). Expenditures per pupil for noninstructional services such as food services were $329 for the nation.
Expenditures for Instruction
■ Expenditures for instruction totaled nearly $238 bil-lion for school year 2002–03 (table 6). Nearly $169
billion went for salaries for teachers and instructional aides. Benefi ts for instructional staff made up almost $46 billion, bringing the total for salaries and benefi ts for teachers and teacher aides to nearly $215 billion.
■ Instructional supplies, including textbooks, made up over $11 billion. (Expenditures for computers and desks are not considered current expenditures, but are otherwise part of replacement equipment in table 7.) Expenditures for purchased services were over $7 billion. These expenditures include the costs for contract teachers (who are not on the school district’s payroll), educational television, computer-assisted instruction, and rental of equipment for instruction.
■ Tuition expenditures for sending students to out-of-state schools and nonpublic schools within the state totaled over $3 billion.
Total Expenditures
■ Total expenditures made by school districts came to approximately $455 billion in the 2002–03 school year (table 7). About $388 billion of total expendi-tures were current expenditures for public elementary and secondary education. Of the total expenditures made by school districts, a little less than $43 billion were spent on facilities acquisition and construction, about $6 billion were spent on replacement equipment, and a little over $11 billion were spent on interest payments on debt. The remaining amount ($7 billion) was spent on other programs, such as community services and adult education, which are not part of public elementary and secondary education.
ReferenceCohen, C., and Johnson, F. (2004). Revenues and Expenditures for
Public Elementary and Secondary Education: School Year 2001–02 (NCES 2004-341). U.S. Department of Education. Washington, DC: National Center for Education Statistics.
Data source: The NCES Common Core of Data (CCD), “National Public Education Financial Survey” (NPEFS), 2002–03.
For technical information, see the complete report:
Hill, J., and Johnson, F. (2005). Revenues and Expenditures for Public Elementary and Secondary Education: School Year 2002–03 (NCES 2005-353).
Author affi liations: J. Hill, Education Statistics Services Institute; F. Johnson, NCES.
For questions about content, contact Frank Johnson ([email protected]).
To obtain the complete report (NCES 2005-353), visit the NCES Electronic Catalog (http://nces.ed.gov/pubsearch).

E D U C A T I O N S T A T I S T I C S Q U A R T E R L Y — V O L U M E 7, I S S U E S 1 & 2, 2 0 0 5 135
Figure 2. Current expenditures by function: School year 2002–03
SOURCE: U.S. Department of Education, National Center for Education Statistics, Common Core of Data (CCD), “National Public Education Financial Survey,” 2002–03.
Support services(school
maintenance,nurses,
administration,library, etc.)
(34.6%)
Noninstruction (food service, bookstore, etc.) (4.1%)
Instruction (teachersalaries, textbooks, etc.) (61.3%)
Current expenditures: $388 billion
Revenues and Expenditures for Public Elementary and Secondary Education: School Year 2002–03
Figure 1. Revenues by source: School year 2002–03
SOURCE: U.S. Department of Education, National Center for Education Statistics, Common Core of Data (CCD), “National Public Education Financial Survey,” 2002–03.
State sources(48.7%)
Federal sources (8.5%)
Local sources(42.8%)
Total revenues: $440 billion

N A T I O N A L C E N T E R F O R E D U C A T I O N S T A T I S T I C S136
Elementary and Secondary Education
Table 1. Revenues for public elementary and secondary schools, by source, state, and outlying areas: School year 2002–03
[In thousands of dollars]
State Total Local State Federal
United States $440,157,2991 $188,363,9831 $214,277,407 $37,515,909
Alabama 5,153,795 1,591,360 2,966,979 595,456Alaska 1,468,276 373,952 834,259 260,064Arizona 7,351,3101 2,956,4631 3,555,570 839,278Arkansas 3,266,318 1,079,085 1,804,362 382,871California 57,021,363 17,830,356 33,561,358 5,629,649
Colorado 6,299,536 3,174,971 2,715,206 409,359Connecticut 7,087,302 4,065,646 2,652,212 369,444Delaware 1,197,512 335,292 759,290 102,929District of Columbia 1,114,021 960,776 † 153,246Florida 18,984,106 8,699,188 8,285,654 1,999,264
Georgia 13,448,966 5,876,044 6,489,049 1,083,873Hawaii 2,078,876 35,183 1,873,316 170,377Idaho 1,698,503 528,369 1,003,508 166,626Illinois 19,154,705 11,208,836 6,327,132 1,618,737Indiana 7,926,062 2,656,914 4,663,625 605,523
Iowa 4,241,508 1,951,347 1,974,707 315,454Kansas 4,071,712 1,374,386 2,326,819 370,506Kentucky 4,764,253 1,460,287 2,799,254 504,713Louisiana 5,549,582 2,092,810 2,723,938 732,835Maine 2,161,238 1,040,061 927,774 193,403
Maryland 8,668,097 4,768,098 3,317,559 582,440Massachusetts 11,801,318 6,267,814 4,827,630 705,875Michigan 17,954,395 5,188,315 11,358,303 1,407,777Minnesota 8,349,227 1,688,920 6,165,549 494,757Mississippi 3,263,897 1,006,635 1,754,445 502,816
Missouri 7,662,199 4,302,867 2,743,289 616,043Montana 1,204,497 471,698 558,114 174,685Nebraska 2,550,525 1,447,099 877,657 225,769Nevada 2,784,681 1,747,987 840,435 196,258New Hampshire 1,957,267 897,514 957,850 101,904
New Jersey 18,905,028 9,869,241 8,230,289 805,498New Mexico 2,685,725 346,541 1,936,713 402,471New York 37,894,517 17,981,391 17,267,655 2,645,471North Carolina 9,379,577 2,504,549 5,975,983 899,045North Dakota 825,135 395,181 303,925 126,029
Ohio 18,143,062 8,843,542 8,132,703 1,166,816Oklahoma 4,161,621 1,355,733 2,277,241 528,646Oregon 4,599,717 1,841,006 2,342,430 416,281Pennsylvania 18,751,160 10,430,431 6,867,531 1,453,198Rhode Island 1,744,838 898,017 733,211 113,611
South Carolina 5,732,697 2,410,997 2,757,948 563,752South Dakota 963,997 487,671 325,091 151,235Tennessee 6,114,870 2,820,286 2,680,969 613,615Texas 34,605,869 17,041,583 14,146,697 3,417,588Utah 2,912,991 999,579 1,643,684 269,728
See notes at end of table.

E D U C A T I O N S T A T I S T I C S Q U A R T E R L Y — V O L U M E 7, I S S U E S 1 & 2, 2 0 0 5 137
Table 1. Revenues for public elementary and secondary schools, by source, state, and outlying areas: School year 2002–03—Continued
[In thousands of dollars]
State Total Local State Federal
Vermont 1,149,920 290,683 779,215 80,022Virginia 10,283,182 5,531,962 4,072,761 678,459Washington 8,696,472 2,543,056 5,373,852 779,564West Virginia 2,552,446 712,551 1,568,125 271,770Wisconsin 8,858,181 3,594,201 4,727,338 536,643Wyoming 961,248 387,510 489,201 84,536
Outlying areasAmerican Samoa 68,812 2,545 12,591 53,676Guam — — — —Northern Marianas 60,712 299 37,230 23,183Puerto Rico 2,619,532 95 1,816,733 802,703Virgin Islands 177,087 139,969 0 37,119
— Not available.† Not applicable.1 Value affected by redistribution of reported values to correct for missing data items.NOTE: Detail may not sum to totals because of rounding. National totals do not include outlying areas. Local revenues include intermediate revenues. Both the District of Columbia and Hawaii have only one school district each; therefore, neither is comparable to other states. Local revenues in Hawaii consist almost entirely of student fees and charges for services, such as food services, summer school, and student activi-ties.SOURCE: U.S. Department of Education, National Center for Education Statistics, Common Core of Data (CCD), “National Public Education Financial Survey,” 2002–03.
Revenues and Expenditures for Public Elementary and Secondary Education: School Year 2002–03

N A T I O N A L C E N T E R F O R E D U C A T I O N S T A T I S T I C S138
Elementary and Secondary Education
Table 2. Percentage distribution of revenue for public elementary and secondary schools, by source, state, and outlying areas: School year 2002–03
Within-state percentage distribution
State Local State Federal
United States1 42.8 48.7 8.5
Alabama 30.9 57.6 11.6Alaska 25.5 56.8 17.7Arizona1 40.2 48.4 11.4Arkansas 33.0 55.2 11.7California 31.3 58.9 9.9
Colorado 50.4 43.1 6.5Connecticut 57.4 37.4 5.2Delaware 28.0 63.4 8.6District of Columbia 86.2 † 13.8Florida 45.8 43.6 10.5
Georgia 43.7 48.2 8.1Hawaii 1.7 90.1 8.2Idaho 31.1 59.1 9.8Illinois 58.5 33.0 8.5Indiana 33.5 58.8 7.6
Iowa 46.0 46.6 7.4Kansas 33.8 57.1 9.1Kentucky 30.7 58.8 10.6Louisiana 37.7 49.1 13.2Maine 48.1 42.9 8.9
Maryland 55.0 38.3 6.7Massachusetts 53.1 40.9 6.0Michigan 28.9 63.3 7.8Minnesota 20.2 73.8 5.9Mississippi 30.8 53.8 15.4
Missouri 56.2 35.8 8.0Montana 39.2 46.3 14.5Nebraska 56.7 34.4 8.9Nevada 62.8 30.2 7.0New Hampshire 45.9 48.9 5.2
New Jersey 52.2 43.5 4.3New Mexico 12.9 72.1 15.0New York 47.5 45.6 7.0North Carolina 26.7 63.7 9.6North Dakota 47.9 36.8 15.3
Ohio 48.7 44.8 6.4Oklahoma 32.6 54.7 12.7Oregon 40.0 50.9 9.1Pennsylvania 55.6 36.6 7.7Rhode Island 51.5 42.0 6.5
South Carolina 42.1 48.1 9.8South Dakota 50.6 33.7 15.7Tennessee 46.1 43.8 10.0Texas 49.2 40.9 9.9Utah 34.3 56.4 9.3
See notes at end of table.

E D U C A T I O N S T A T I S T I C S Q U A R T E R L Y — V O L U M E 7, I S S U E S 1 & 2, 2 0 0 5 139
Table 2. Percentage distribution of revenue for public elementary and secondary schools, by source, state, and outlying areas: School year 2002–03—Continued
Within-state percentage distribution
State Local State Federal
Vermont 25.3 67.8 7.0Virginia 53.8 39.6 6.6Washington 29.2 61.8 9.0West Virginia 27.9 61.4 10.6Wisconsin 40.6 53.4 6.1Wyoming 40.3 50.9 8.8
Outlying areasAmerican Samoa 3.7 18.3 78.0Guam — — —Northern Marianas 0.5 61.3 38.2Puerto Rico 0.0 69.4 30.6Virgin Islands 79.0 0.0 21.0
— Not available.† Not applicable.1 Distribution affected by redistribution of reported values to correct for missing items.NOTE: Detail may not sum to totals because of rounding. National totals do not include outlying areas. Local revenues include intermediate revenues. Both the District of Columbia and Hawaii have only one school district each; therefore, neither is com-parable to other states. Local revenues in Hawaii consist almost entirely of student fees and charges for services, such as food services, summer school, and student activities.SOURCE: U.S. Department of Education, National Center for Education Statistics, Common Core of Data (CCD), “National Public Education Financial Survey,” 2002–03.
Revenues and Expenditures for Public Elementary and Secondary Education: School Year 2002–03

N A T I O N A L C E N T E R F O R E D U C A T I O N S T A T I S T I C S140
Elementary and Secondary Education
Table 3. Current expenditures for public elementary and secondary schools, by function, state, and outlying areas: School year 2002–03
[In thousands of dollars]
State Total Instruction Support services Noninstruction
United States $387,592,4941 $237,731,7341 $134,021,897 $15,838,863
Alabama 4,657,643 2,818,526 1,521,337 317,780Alaska 1,326,226 771,237 510,329 44,661Arizona 5,891,105 3,530,858 2,082,411 277,836Arkansas 2,923,401 1,786,323 990,294 146,784California 47,983,402 29,170,269 17,017,791 1,795,342
Colorado 5,551,506 3,180,392 2,180,040 191,074Connecticut 6,302,988 4,019,659 2,058,828 224,501Delaware 1,127,745 693,970 381,184 52,592District of Columbia 902,318 473,414 406,079 22,825Florida 16,355,123 9,616,720 5,938,232 800,171
Georgia 11,630,576 7,367,694 3,678,590 584,293Hawaii 1,489,092 888,473 521,929 78,689Idaho 1,511,862 924,975 521,688 65,199Illinois 17,271,301 10,320,227 6,393,248 557,826Indiana 8,088,684 4,951,003 2,807,529 330,153
Iowa 3,652,022 2,174,018 1,210,993 267,011Kansas 3,510,675 2,078,415 1,269,958 162,303Kentucky 4,401,627 2,686,505 1,475,797 239,325Louisiana 5,056,583 3,069,994 1,673,753 312,837Maine 1,909,268 1,281,073 566,838 61,357
Maryland 7,933,055 4,934,017 2,636,403 362,635Massachusetts 10,281,820 6,542,762 3,426,551 312,507Michigan 15,674,698 8,929,871 6,264,837 479,990Minnesota 6,867,403 4,404,702 2,147,923 314,779Mississippi 2,853,531 1,707,391 968,645 177,495
Missouri 6,793,9571 4,142,2851 2,358,352 293,320Montana 1,124,291 690,810 387,437 46,044Nebraska 2,304,223 1,470,002 673,441 160,780Nevada 2,251,044 1,408,570 768,641 73,834New Hampshire 1,781,594 1,156,573 570,229 54,792
New Jersey 17,185,966 10,152,232 6,504,334 529,401New Mexico 2,281,608 1,266,008 910,138 105,462New York 34,546,965 23,721,563 9,989,057 836,345North Carolina 8,766,968 5,574,861 2,703,000 489,107North Dakota 716,007 427,511 232,465 56,031
Ohio 15,868,494 9,110,815 6,232,340 525,340Oklahoma 3,804,570 2,203,126 1,349,256 252,188Oregon 4,150,747 2,458,745 1,550,553 141,449Pennsylvania 16,344,439 10,095,432 5,609,932 639,074Rhode Island 1,647,587 1,064,304 540,735 42,548
South Carolina 4,888,250 2,915,986 1,711,287 260,977South Dakota 851,429 498,922 307,100 45,407Tennessee 5,674,7731 3,647,9861 1,748,705 278,082Texas 30,399,603 18,347,986 10,516,120 1,535,497Utah 2,366,897 1,518,242 714,894 133,760
See notes at end of table.

E D U C A T I O N S T A T I S T I C S Q U A R T E R L Y — V O L U M E 7, I S S U E S 1 & 2, 2 0 0 5 141
Table 3. Current expenditures for public elementary and secondary schools, by function, state, and outlying areas: School year 2002–03—Continued
[In thousands of dollars]
State Total Instruction Support services Noninstruction
Vermont 1,045,213 671,163 345,762 28,289Virginia 9,208,329 5,661,332 3,184,354 362,643Washington 7,359,5661 4,381,1861 2,620,468 357,911West Virginia 2,349,833 1,444,689 774,469 130,675Wisconsin 7,934,755 4,904,809 2,775,318 254,628Wyoming 791,732 474,108 292,306 25,317
Outlying areasAmerican Samoa 47,566 24,662 14,268 8,637Guam — — — —Northern Marianas 50,843 43,548 4,922 2,372Puerto Rico 2,541,385 1,876,195 361,322 303,868Virgin Islands 125,405 81,742 39,754 3,910
— Not available.1 Value affected by redistribution of reported values to correct for missing data items.NOTE: Detail may not sum to totals because of rounding. National totals do not include outlying areas. Both the District of Columbia and Hawaii have only one school district each; therefore, neither is comparable to other states. SOURCE: U.S. Department of Education, National Center for Education Statistics, Common Core of Data (CCD), “National Public Education Financial Survey,” 2002–03.
Revenues and Expenditures for Public Elementary and Secondary Education: School Year 2002–03

N A T I O N A L C E N T E R F O R E D U C A T I O N S T A T I S T I C S142
Elementary and Secondary Education
Table 4. Percentage distribution of current expenditures for public elementary and secondary schools, by function, state, and outlying areas: School year 2002–03
Within-state percentage distribution
State Instruction Support services Noninstruction
United States1 61.3 34.6 4.1
Alabama 60.5 32.7 6.8Alaska 58.2 38.5 3.4Arizona 59.9 35.3 4.7Arkansas 61.1 33.9 5.0California 60.8 35.5 3.7
Colorado 57.3 39.3 3.4Connecticut 63.8 32.7 3.6Delaware 61.5 33.8 4.7District of Columbia 52.5 45.0 2.5Florida 58.8 36.3 4.9
Georgia 63.3 31.6 5.0Hawaii 59.7 35.1 5.3Idaho 61.2 34.5 4.3Illinois 59.8 37.0 3.2Indiana 61.2 34.7 4.1
Iowa 59.5 33.2 7.3Kansas 59.2 36.2 4.6Kentucky 61.0 33.5 5.4Louisiana 60.7 33.1 6.2Maine 67.1 29.7 3.2
Maryland 62.2 33.2 4.6Massachusetts 63.6 33.3 3.0Michigan 57.0 40.0 3.1Minnesota 64.1 31.3 4.6Mississippi 59.8 33.9 6.2
Missouri1 61.0 34.7 4.3Montana 61.4 34.5 4.1Nebraska 63.8 29.2 7.0Nevada 62.6 34.1 3.3New Hampshire 64.9 32.0 3.1
New Jersey 59.1 37.8 3.1New Mexico 55.5 39.9 4.6New York 68.7 28.9 2.4North Carolina 63.6 30.8 5.6North Dakota 59.7 32.5 7.8
Ohio 57.4 39.3 3.3Oklahoma 57.9 35.5 6.6Oregon 59.2 37.4 3.4Pennsylvania 61.8 34.3 3.9Rhode Island 64.6 32.8 2.6
South Carolina 59.7 35.0 5.3South Dakota 58.6 36.1 5.3Tennessee1 64.3 30.8 4.9Texas 60.4 34.6 5.1Utah 64.1 30.2 5.7
See notes at end of table.

E D U C A T I O N S T A T I S T I C S Q U A R T E R L Y — V O L U M E 7, I S S U E S 1 & 2, 2 0 0 5 143
Table 4. Percentage distribution of current expenditures for public elementary and secondary schools, by function, state, and outlying areas: School year 2002–03—Continued
Within-state percentage distribution
State Instruction Support services Noninstruction
Vermont 64.2 33.1 2.7Virginia 61.5 34.6 3.9Washington1 59.5 35.6 4.9West Virginia 61.5 33.0 5.6Wisconsin 61.8 35.0 3.2Wyoming 59.9 36.9 3.2
Outlying areasAmerican Samoa 51.8 30.0 18.2Guam — — —Northern Marianas 85.7 9.7 4.7Puerto Rico 73.8 14.2 12.0Virgin Islands 65.2 31.7 3.1
— Not available1 Distribution affected by redistribution of reported values to correct for missing items.NOTE: Detail may not sum to totals because of rounding. National totals do not include outlying areas. Both the District of Columbia and Hawaii have only one school district each; therefore, neither is comparable to other states.SOURCE: U.S. Department of Education, National Center for Education Statistics, Common Core of Data (CCD), “National Public Education Financial Survey,” 2002–03.
Revenues and Expenditures for Public Elementary and Secondary Education: School Year 2002–03

N A T I O N A L C E N T E R F O R E D U C A T I O N S T A T I S T I C S144
Elementary and Secondary Education
Table 5. Student membership and current expenditures per pupil in membership for public elementary and secondary schools, by function, state, and outlying areas: School year 2002–03
Current expenditures per pupil in membership
StateFall 2002 student
membership Total Instruction Support services Noninstruction
United States 48,183,0861 $8,0441,2 $4,9341,2 $2,7821 $3291
Alabama 739,3661 6,3001 3,8121 2,0581 4301
Alaska 134,364 9,870 5,740 3,798 332Arizona 937,755 6,282 3,765 2,221 296Arkansas 450,985 6,482 3,961 2,196 325California 6,353,6671 7,5521 4,5911 2,6781 2831
Colorado 751,862 7,384 4,230 2,900 254Connecticut 570,023 11,057 7,052 3,612 394Delaware 116,342 9,693 5,965 3,276 452District of Columbia 76,166 11,847 6,216 5,331 300Florida 2,539,929 6,439 3,786 2,338 315
Georgia 1,496,012 7,774 4,925 2,459 391Hawaii 183,829 8,100 4,833 2,839 428Idaho 248,604 6,081 3,721 2,098 262Illinois 2,084,187 8,287 4,952 3,068 268Indiana 1,003,875 8,057 4,932 2,797 329
Iowa 482,210 7,574 4,508 2,511 554Kansas 470,957 7,454 4,413 2,697 345Kentucky 660,782 6,661 4,066 2,233 362Louisiana 730,464 6,922 4,203 2,291 428Maine 204,337 9,344 6,269 2,774 300
Maryland 866,743 9,153 5,693 3,042 418Massachusetts 982,989 10,460 6,656 3,486 318Michigan 1,785,160 8,781 5,002 3,509 269Minnesota 846,891 8,109 5,201 2,536 372Mississippi 492,645 5,792 3,466 1,966 360
Missouri 906,4991 7,4951,2 4,5701,2 2,6021 3241 Montana 149,995 7,496 4,606 2,583 307Nebraska 285,402 8,074 5,151 2,360 563Nevada 369,498 6,092 3,812 2,080 200New Hampshire 207,671 8,579 5,569 2,746 264
New Jersey 1,367,438 12,568 7,424 4,757 387New Mexico 320,234 7,125 3,953 2,842 329New York 2,888,233 11,961 8,213 3,459 290North Carolina 1,335,954 6,562 4,173 2,023 366North Dakota 104,225 6,870 4,102 2,230 538
Ohio 1,838,285 8,632 4,956 3,390 286Oklahoma 624,548 6,092 3,528 2,160 404Oregon 554,071 7,491 4,438 2,798 255Pennsylvania 1,816,747 8,997 5,557 3,088 352Rhode Island 159,2051 10,349 6,685 3,396 267
South Carolina 694,389 7,040 4,199 2,464 376South Dakota 130,048 6,547 3,836 2,361 349Tennessee 927,6081 6,1181,2 3,9331,2 1,8851 3001
Texas 4,259,823 7,136 4,307 2,469 360Utah 489,262 4,838 3,103 1,461 273
See notes at end of table.
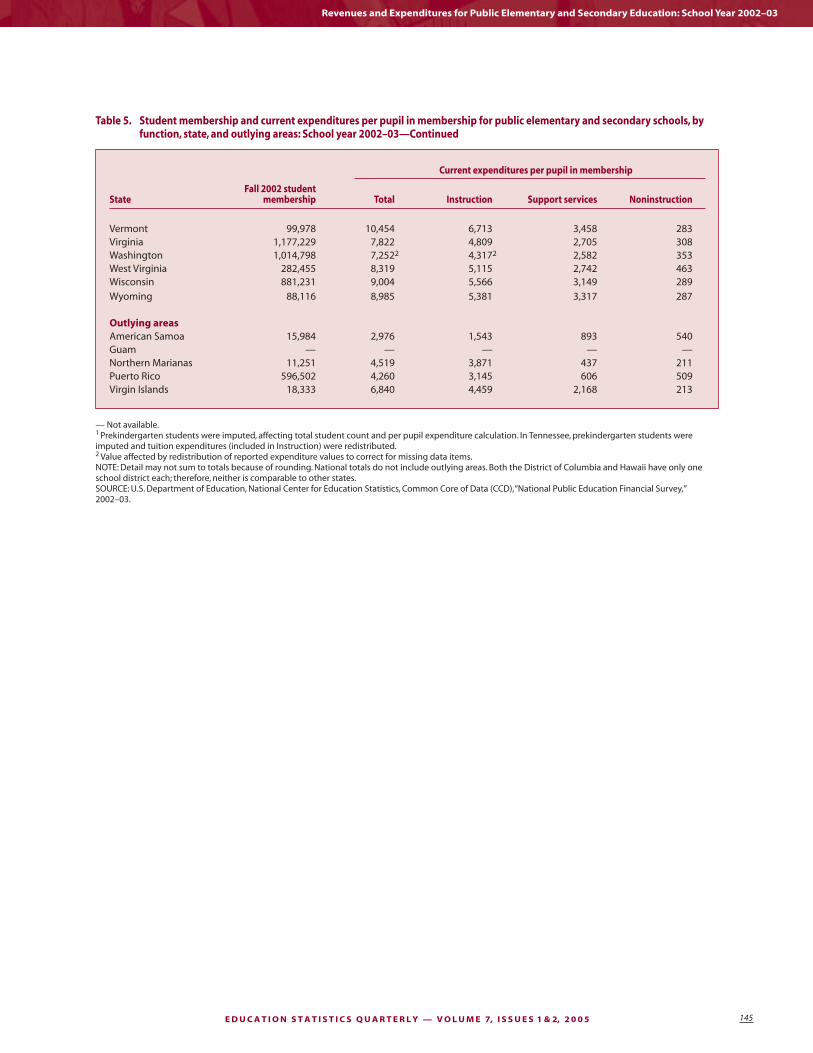
E D U C A T I O N S T A T I S T I C S Q U A R T E R L Y — V O L U M E 7, I S S U E S 1 & 2, 2 0 0 5 145
Table 5. Student membership and current expenditures per pupil in membership for public elementary and secondary schools, by function, state, and outlying areas: School year 2002–03—Continued
Current expenditures per pupil in membership
StateFall 2002 student
membership Total Instruction Support services Noninstruction
Vermont 99,978 10,454 6,713 3,458 283Virginia 1,177,229 7,822 4,809 2,705 308Washington 1,014,798 7,2522 4,3172 2,582 353West Virginia 282,455 8,319 5,115 2,742 463Wisconsin 881,231 9,004 5,566 3,149 289
Wyoming 88,116 8,985 5,381 3,317 287
Outlying areasAmerican Samoa 15,984 2,976 1,543 893 540Guam — — — — —Northern Marianas 11,251 4,519 3,871 437 211Puerto Rico 596,502 4,260 3,145 606 509Virgin Islands 18,333 6,840 4,459 2,168 213
— Not available.1 Prekindergarten students were imputed, affecting total student count and per pupil expenditure calculation. In Tennessee, prekindergarten students were imputed and tuition expenditures (included in Instruction) were redistributed.2 Value affected by redistribution of reported expenditure values to correct for missing data items.NOTE: Detail may not sum to totals because of rounding. National totals do not include outlying areas. Both the District of Columbia and Hawaii have only one school district each; therefore, neither is comparable to other states.SOURCE: U.S. Department of Education, National Center for Education Statistics, Common Core of Data (CCD), “National Public Education Financial Survey,” 2002–03.
Revenues and Expenditures for Public Elementary and Secondary Education: School Year 2002–03

N A T I O N A L C E N T E R F O R E D U C A T I O N S T A T I S T I C S146
Elementary and Secondary Education
Table 6. Current expenditures for instruction for public elementary and secondary schools, by type of expenditure, state, and outlying areas: School year 2002–03
[In thousands of dollars]
State Total SalariesEmployee
benefi tsPurchased
services
Tuition to out-of-state and private
schoolsInstructional
supplies Other
United States $237,731,7341 $168,828,9341 $45,947,1801 $7,289,6231 $3,298,5881 $11,294,2711 $1,073,1391
Alabama 2,818,526 1,979,767 530,508 74,940 1,628 219,288 12,396Alaska 771,237 518,112 143,069 45,372 0 41,992 22,691Arizona 3,530,858 2,506,5691 671,1541 101,5261 68,0081 163,7091 19,8921
Arkansas 1,786,323 1,282,075 280,711 50,660 3,671 157,189 12,017California 29,170,269 20,548,956 5,596,635 850,615 615,502 1,555,769 2,792
Colorado 3,180,392 2,364,954 443,785 62,450 42,688 220,620 45,894Connecticut 4,019,659 2,783,320 743,765 124,293 253,786 109,335 5,158Delaware 693,970 473,465 160,279 13,161 6,557 31,708 8,799District of Columbia 473,414 279,891 87,079 11,831 79,524 14,141 947Florida 9,616,720 6,451,460 1,622,841 951,541 239 479,965 110,673
Georgia 7,367,694 5,343,778 1,535,410 108,902 3,716 368,600 7,287Hawaii 888,473 628,259 174,755 28,228 2,690 44,225 10,317Idaho 924,975 657,590 195,701 22,616 632 48,144 292Illinois 10,320,227 7,507,171 1,925,826 239,329 235,211 396,136 16,554Indiana 4,951,003 3,261,483 1,442,278 57,031 21 178,136 12,054
Iowa 2,174,018 1,582,285 444,273 56,911 17,087 71,025 2,436Kansas 2,078,415 1,571,521 322,489 57,397 1,169 107,427 18,413Kentucky 2,686,505 2,010,083 494,189 49,081 478 119,368 13,306Louisiana 3,069,994 2,207,461 620,927 57,199 740 164,083 19,584Maine 1,281,073 808,446 307,685 51,388 66,055 40,457 7,041
Maryland 4,934,017 3,409,666 1,055,203 107,728 207,197 142,771 11,452Massachusetts 6,542,762 4,590,788 1,451,904 36,314 292,563 157,385 13,808Michigan 8,929,871 5,978,301 2,251,300 338,487 127 325,071 36,585Minnesota 4,404,702 3,180,600 852,050 156,024 34,870 158,353 22,805Mississippi 1,707,391 1,229,621 317,134 41,021 4,789 107,961 6,866
Missouri 4,142,2851 3,020,805 655,388 108,3361 27,2581 308,578 21,9201
Montana 690,810 479,486 131,610 21,893 626 54,103 3,091Nebraska 1,470,002 1,062,668 278,989 48,874 15,511 49,655 14,306Nevada 1,408,570 959,395 292,228 23,572 265 66,601 66,508New Hampshire 1,156,573 770,344 221,417 31,783 93,994 36,377 2,658
New Jersey 10,152,232 6,882,187 2,047,112 242,964 496,819 380,087 103,063New Mexico 1,266,008 919,979 241,945 26,219 0 77,540 325New York 23,721,563 16,980,488 4,973,883 893,203 204,731 665,614 3,644North Carolina 5,574,861 4,307,889 805,555 117,705 0 338,096 5,617North Dakota 427,511 301,152 87,473 13,572 1,094 22,345 1,875
Ohio 9,110,815 6,342,858 1,867,422 269,331 104,195 397,876 129,133Oklahoma 2,203,126 1,602,392 404,457 32,428 0 157,301 6,549Oregon 2,458,745 1,567,870 645,630 95,924 22,599 121,848 4,874Pennsylvania 10,095,432 7,176,001 1,857,297 480,109 161,525 404,584 15,916Rhode Island 1,064,304 739,961 234,364 8,146 56,512 23,401 1,921
South Carolina 2,915,986 2,093,030 575,609 70,932 234 149,800 26,380South Dakota 498,922 349,991 90,500 21,841 5,947 28,890 1,753Tennessee 3,647,9861 2,610,771 587,124 53,374 2911 382,532 13,893Texas 18,347,986 14,088,723 2,137,116 535,880 37,469 1,398,826 149,972Utah 1,518,242 1,041,674 368,343 27,676 295 74,741 5,512
See notes at end of table.

E D U C A T I O N S T A T I S T I C S Q U A R T E R L Y — V O L U M E 7, I S S U E S 1 & 2, 2 0 0 5 147
Table 6. Current expenditures for instruction for public elementary and secondary schools, by type of expenditure, state, and outlying areas: School year 2002–03—Continued
[In thousands of dollars]
State Total SalariesEmployee
benefi tsPurchased
services
Tuition to out-of-state and private
schoolsInstructional
supplies Other
Vermont 671,163 436,793 127,245 35,179 50,371 19,998 1,576Virginia 5,661,332 4,218,653 1,065,839 110,321 2,222 260,582 3,715Washington 4,381,1861 3,234,041 699,110 207,742 8,0811 199,704 32,509West Virginia 1,444,689 949,554 416,838 22,805 401 54,824 267Wisconsin 4,904,809 3,212,515 1,360,394 77,351 68,477 170,732 15,341Wyoming 474,108 324,091 103,342 18,416 721 26,777 761
Outlying areasAmerican Samoa 24,662 15,725 3,040 2,858 0 2,253 785Guam — — — — — — —Northern Marianas 43,548 30,217 7,986 2,505 0 2,840 0Puerto Rico 1,876,195 1,430,330 214,335 6,665 0 24,985 199,880Virgin Islands 81,742 63,994 16,143 164 0 1,380 60
— Not available.1 Value affected by redistribution of reported values to correct for missing data items.NOTE: Detail may not sum to totals because of rounding. National totals do not include outlying areas. Both the District of Columbia and Hawaii have only one school district each; therefore, neither is comparable to other states.SOURCE: U.S. Department of Education, National Center for Education Statistics, Common Core of Data (CCD), “National Public Education Financial Survey,” 2002–03.
Revenues and Expenditures for Public Elementary and Secondary Education: School Year 2002–03
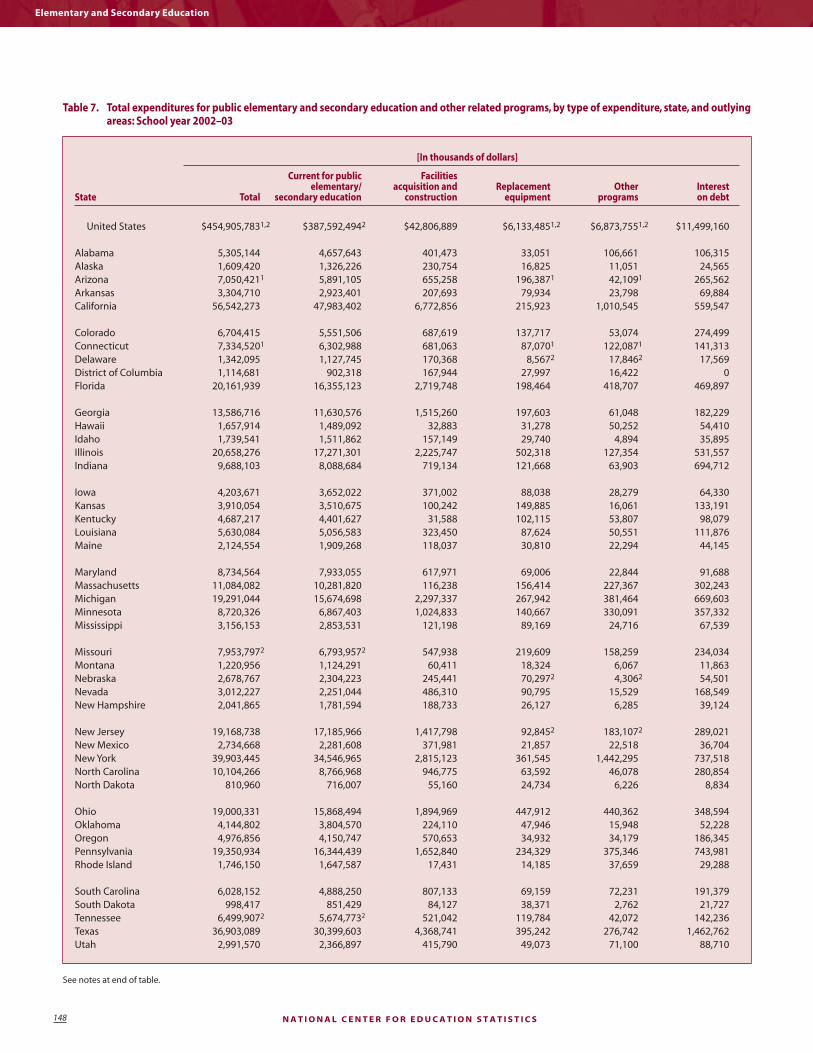
N A T I O N A L C E N T E R F O R E D U C A T I O N S T A T I S T I C S148
Elementary and Secondary Education
Table 7. Total expenditures for public elementary and secondary education and other related programs, by type of expenditure, state, and outlying areas: School year 2002–03
[In thousands of dollars]
State Total
Current for public elementary/
secondary education
Facilities acquisition and
constructionReplacement
equipmentOther
programsInterest on debt
United States $454,905,783 1,2 $387,592,494 2 $42,806,889 $6,133,485 1,2 $6,873,755 1,2 $11,499,160
Alabama 5,305,144 4,657,643 401,473 33,051 106,661 106,315Alaska 1,609,420 1,326,226 230,754 16,825 11,051 24,565Arizona 7,050,4211 5,891,105 655,258 196,3871 42,1091 265,562Arkansas 3,304,710 2,923,401 207,693 79,934 23,798 69,884California 56,542,273 47,983,402 6,772,856 215,923 1,010,545 559,547
Colorado 6,704,415 5,551,506 687,619 137,717 53,074 274,499Connecticut 7,334,5201 6,302,988 681,063 87,0701 122,0871 141,313Delaware 1,342,095 1,127,745 170,368 8,5672 17,8462 17,569District of Columbia 1,114,681 902,318 167,944 27,997 16,422 0Florida 20,161,939 16,355,123 2,719,748 198,464 418,707 469,897
Georgia 13,586,716 11,630,576 1,515,260 197,603 61,048 182,229Hawaii 1,657,914 1,489,092 32,883 31,278 50,252 54,410Idaho 1,739,541 1,511,862 157,149 29,740 4,894 35,895Illinois 20,658,276 17,271,301 2,225,747 502,318 127,354 531,557Indiana 9,688,103 8,088,684 719,134 121,668 63,903 694,712
Iowa 4,203,671 3,652,022 371,002 88,038 28,279 64,330Kansas 3,910,054 3,510,675 100,242 149,885 16,061 133,191Kentucky 4,687,217 4,401,627 31,588 102,115 53,807 98,079Louisiana 5,630,084 5,056,583 323,450 87,624 50,551 111,876Maine 2,124,554 1,909,268 118,037 30,810 22,294 44,145
Maryland 8,734,564 7,933,055 617,971 69,006 22,844 91,688Massachusetts 11,084,082 10,281,820 116,238 156,414 227,367 302,243Michigan 19,291,044 15,674,698 2,297,337 267,942 381,464 669,603Minnesota 8,720,326 6,867,403 1,024,833 140,667 330,091 357,332Mississippi 3,156,153 2,853,531 121,198 89,169 24,716 67,539
Missouri 7,953,7972 6,793,9572 547,938 219,609 158,259 234,034Montana 1,220,956 1,124,291 60,411 18,324 6,067 11,863Nebraska 2,678,767 2,304,223 245,441 70,2972 4,3062 54,501Nevada 3,012,227 2,251,044 486,310 90,795 15,529 168,549New Hampshire 2,041,865 1,781,594 188,733 26,127 6,285 39,124
New Jersey 19,168,738 17,185,966 1,417,798 92,8452 183,1072 289,021New Mexico 2,734,668 2,281,608 371,981 21,857 22,518 36,704New York 39,903,445 34,546,965 2,815,123 361,545 1,442,295 737,518North Carolina 10,104,266 8,766,968 946,775 63,592 46,078 280,854North Dakota 810,960 716,007 55,160 24,734 6,226 8,834
Ohio 19,000,331 15,868,494 1,894,969 447,912 440,362 348,594Oklahoma 4,144,802 3,804,570 224,110 47,946 15,948 52,228Oregon 4,976,856 4,150,747 570,653 34,932 34,179 186,345Pennsylvania 19,350,934 16,344,439 1,652,840 234,329 375,346 743,981Rhode Island 1,746,150 1,647,587 17,431 14,185 37,659 29,288
South Carolina 6,028,152 4,888,250 807,133 69,159 72,231 191,379South Dakota 998,417 851,429 84,127 38,371 2,762 21,727Tennessee 6,499,9072 5,674,7732 521,042 119,784 42,072 142,236Texas 36,903,089 30,399,603 4,368,741 395,242 276,742 1,462,762Utah 2,991,570 2,366,897 415,790 49,073 71,100 88,710
See notes at end of table.

E D U C A T I O N S T A T I S T I C S Q U A R T E R L Y — V O L U M E 7, I S S U E S 1 & 2, 2 0 0 5 149
Table 7. Total expenditures for public elementary and secondary education and other related programs, by type of expenditure, state, and outlying areas: School year 2002–03—Continued
[In thousands of dollars]
State Total
Current for public elementary/
secondary education
Facilities acquisition and
constructionReplacement
equipmentOther
programsInterest on debt
Vermont 1,110,930 1,045,213 28,261 18,338 3,710 15,409Virginia 10,487,025 9,208,329 846,658 222,728 63,288 146,022Washington 8,927,6052 7,359,5662 1,075,313 125,979 42,793 323,954West Virginia 2,557,190 2,349,833 97,800 65,941 33,080 10,537Wisconsin 9,300,201 7,934,755 521,023 161,800 182,299 500,324Wyoming 911,017 791,732 78,484 31,831 2,289 6,681
Outlying areasAmerican Samoa 54,744 47,566 2,864 1,112 3,201 03 Guam — — — — — —Northern Marianas 51,249 50,843 374 31 1 03 Puerto Rico 2,632,580 2,541,385 212 19,174 53,394 18,415Virgin Islands 133,034 125,405 4,680 1,239 1,710 03
— Not available.1 Value contains imputation for missing data. Imputed value is less than 2 percent of total expenditures in any one state.2 Value affected by redistribution of reported values to correct for missing data items.3 Interest on debt expenditures is not made by the departments of education in these outlying areas.NOTE: Detail may not sum to totals because of rounding. National totals do not include outlying areas. Both the District of Columbia and Hawaii have only one school district each; therefore, neither is comparable to other states.SOURCE: U.S. Department of Education, National Center for Education Statistics, Common Core of Data (CCD), “National Public Education Financial Survey,” 2002–03.
Revenues and Expenditures for Public Elementary and Secondary Education: School Year 2002–03

N A T I O N A L C E N T E R F O R E D U C A T I O N S T A T I S T I C S150