· original paper observed spatiotemporal characteristics of drought on various time scales over...
TRANSCRIPT
1 23
Theoretical and Applied Climatology ISSN 0177-798X Theor Appl ClimatolDOI 10.1007/s00704-013-0908-y
Observed spatiotemporal characteristicsof drought on various time scales over theCzech Republic
Vera Potop, Constanţa Boroneanţ,Martin Možný, Petr Štěpánek & PetrSkalák

1 23
Your article is protected by copyright and
all rights are held exclusively by Springer-
Verlag Wien. This e-offprint is for personal
use only and shall not be self-archived
in electronic repositories. If you wish to
self-archive your article, please use the
accepted manuscript version for posting on
your own website. You may further deposit
the accepted manuscript version in any
repository, provided it is only made publicly
available 12 months after official publication
or later and provided acknowledgement is
given to the original source of publication
and a link is inserted to the published article
on Springer's website. The link must be
accompanied by the following text: "The final
publication is available at link.springer.com”.

ORIGINAL PAPER
Observed spatiotemporal characteristics of droughton various time scales over the Czech Republic
Vera Potop & Constanţa Boroneanţ & Martin Možný &
Petr Štěpánek & Petr Skalák
Received: 29 May 2012 /Accepted: 12 April 2013# Springer-Verlag Wien 2013
Abstract This paper analyses the observed spatiotemporalcharacteristics of drought in the Czech Republic during thegrowing season (April to September) as quantified using theStandardised Precipitation Evapotranspiration Index (SPEI)on various time scales. The SPEI was calculated for variouslags (1, 3, 6, 12, and 24 months) from monthly records ofmean temperature and precipitation totals using a densenetwork of 184 climatological stations for the period1961–2010. The characteristics of drought were analysedin terms of the temporal evolution of the SPEI, the frequencydistribution and duration of drought at the country level, andfor three regions delimited by station altitude. The driest andthe wettest years during the growing season were identified.The frequency distribution of the SPEI values for sevendrought category classes (in per cent) indicates that normalmoisture conditions represent approximately 65 % of thetotal SPEI values for all time scales in all three regions,
whereas moderate drought and moderate wet conditions arealmost equally distributed around 10.5 %. Differences inextremely dry conditions (5 %) compared with extremelywet conditions (1.5 %) were observed with increasing SPEItime scales. The results of the non-parametric Mann–Kendalltrend test applied to the SPEI series indicate prevailingnegative trends (drought) at the majority of the stations.The percentage of stations displaying a significant negativetrend for the 90, 95, 99, and 99.9 % confidence levels isapproximately 40 %. An Empirical Orthogonal Functions(EOF) analysis was used to identify the principal patternsof variability of the SPEI during the growing season thataccounted for the highest amount of statistical variance. Thevariance explained by the leading EOF range 66 to 56 %,whereas for EOF2 and EOF3, the value is between 7 and 11%and between 4 and 7%, respectively, for the SPEI is calculatedfor 1- to 24-month lags.
1 Introduction
Drought is one of the most complex natural hazards, withimpacts on agriculture, water resources, natural ecosystems,and society. The negative societal consequences of droughtinclude extreme economic losses, famine, epidemics, andland degradation (Beguería et al. 2010). However, few studieshave characterised the complexity of drought phenomena atlocal, regional, or national scales to document its impact andtrack trends in regional sectors to help decision makersimprove their level of preparedness and adopt appropriatepolicies for impact mitigation and adaptation to droughtthreats (Wilhite et al. 2007). Drought can be classified into
V. Potop (*)Czech University of Life Sciences Prague, Faculty of Agrobiology,Food and Natural Resources, Department of Agroecologyand Biometeorology, Prague, Czech Republice-mail: [email protected]
C. BoroneanţCenter for Climate Change, Geography Department,University Rovira I Virgili, Tortosa, Spain
M. MožnýCzech Hydrometeorological Institute, Doksany Observatory,Czech Republic
P. Štěpánek : P. SkalákGlobal Change Research Centre AS CR, Brno, Czech Republic
Theor Appl ClimatolDOI 10.1007/s00704-013-0908-y
Author's personal copy
three types (Dai 2011a): (1) meteorological drought is aperiod of months to years with below-normal precipitation.It is often accompanied by above-normal temperatures andprecedes and causes other types of droughts. (2) Agriculturaldrought is a period with dry soils that results from below-normal precipitation, intense but less frequent rain events, orabove-normal evaporation, all of which lead to reduced cropproduction and plant growth. (3)Hydrological drought occurswhen river streamflow and water storage in aquifers, lakes, orreservoirs fall below long-term mean levels. Hydrologicaldrought develops more slowly because it involves storedwater that is depleted but not replenished. A lack of precipi-tation often triggers agricultural and hydrological droughts,but other factors, including more intense but less frequentprecipitation, poor water management, and erosion, can alsocause or enhance these types of droughts.
One category of drought studies addresses the causes ofdrought and the search to improve knowledge of the large-scale atmospheric circulation associated with drought occur-rences (e.g. Jones et al. 1996; Chiew et al. 1998; Barlow et al.2002; Girardin and Tardif 2005). A second category of studiesis oriented towards the assessment of the probability ofdrought occurrence for various degrees of severity and spatialdistributions (e.g. Bravar and Kavvas 1991; Tallaksen 2000;Briffa et al. 2009; Potop and Soukup 2009; Bordi et al. 2009;Özger et al. 2009; Beguería et al. 2010). A third category ofstudies is focused on the assessment and understanding of theimpact of drought (e.g. Maracchi 2000; Narasimhan andSrinivasan 2005; Mavromatis 2007; Lorenzo-Lacruz et al.2010; Potop et al. 2010; Potop 2011). The fourth categoryaddresses societal responses to drought threats and appropriatestrategies to mitigate and adapt to the impact of drought(Szalai et al. 2000; Wilhite et al. 2007; Vicente-Serrano et al.2012).
At the European scale, research on drought has beenparticularly focused on the Iberian Peninsula, Mediterranean,and Balkans, which are regions mostly prone to severedrought with impacts on agriculture, water recourses, andecosystems (Estrela et al. 2000; Livada and Assimakopoulos2007; Koleva and Alexandrov 2008; Cindrić et al. 2010;Vicente-Serrano et al. 2011). During the last two decades,both droughts and floods in central Europe have increasedpublic awareness of the severity of extreme meteorologicalevents and their environmental and social–economic impacts(e.g. Szalai et al. 2000; Dubrovsky et al. 2008; Brázdil et al.2009; Trnka et al. 2009a, b; Potop et al. 2010, 2012a, b).According to Dubrovsky et al. (2008), the projected increasesin temperature in central Europe along with a slight gain inprecipitation amounts during both winter and spring months(associated with decreases in precipitation in summer months)are very likely to increase the frequency of drought occurrenceand its severity in central Europe and to enhance the impactsassociated with these events.
At the global scale, the recent drought studies of Dai(2011b) and Vicente-Serrano et al. (2011) suggested that theincreasing drying trends detected in the global dataset of thePalmer Drought Severity Index (PDSI) and StandardisedPrecipitation Evapotranspiration Index (SPEI) over many landareas are mainly due to the increasing temperature trend(via evapotranspiration processes) since the mid-1980s.Trenberth (2011) indicated a direct influence of global warmingon precipitation. Increased heating leads to greater evapora-tion and surface drying, thereby increasing the intensity andduration of drought. The models project that patterns ofprecipitation will not change much and will result in dryareas becoming drier (generally throughout the subtropics)and wet areas becoming wetter, particularly in the mid- tohigh latitudes. In addition, global warming is leading to anincreased risk of heat waves associated with drought. Oncesoil moisture is depleted, this heating will further contributeto temperature increases and plant wilting.
The 2003 heat wave that affected much of Europe fromJune to September bears a close resemblance to what manyregional climate models are projecting for summers in the latterpart of the twenty-first century (Beniston 2004). It was thewarmest summer since observations began, and only a fewsummers have been drier since continuous and reliable precip-itation records started. The heat and drought conditionsimpacted river flows, the power market, and central Europeanglaciers (Fink et al. 2004) and exceptionally increased the inci-dence of wild fires (Trigo et al. 2006). The 2007 European heatwave during June–August affected mostly south-eastern Europe,with record-breaking temperatures and unprecedented condi-tions, even for regions accustomed to conditions of extreme heat(Busuioc et al. 2007; Corobov et al. 2010). The summer of 2010was exceptionally warm in eastern Europe and large parts ofRussia, which caused adverse impacts that exceeded in ampli-tude and spatial extent the previous hottest summer of 2003. The“mega-heat waves” of the 2003 and 2010 events likely broke the500-year-long seasonal temperature records over approximately50 % of Europe (Barriopedro et al. 2011). These major heatwaves, which affected much of Europe during the last decade,rank among the most severe, both in intensity and duration,during the instrumental period.
In such an atmospheric context, a new concept of drought hasbeen introduced, the “flash drought” (Senay et al. 2008), whichhas been defined as a severe, short-term event characterisedby moisture deficit and abnormally high temperature. A flashdrought is the result of a synoptic meteorological pattern inwhich the reference level of evapotranspiration greatly exceedsthe level of precipitation for a period no shorter than 3 weeksduring which the Soil Moisture Index (a new drought indexrecently tested in the Czech Republic) is lower than −5 (Možnýet al. 2012).
In previous studies on drought in the Czech Republic(Potop and Možný 2011a, b; Potop and Soukup 2011; Potop
V. Potop et al.
Author's personal copy
et al. 2011, 2012a, b), the Standardised Precipitation Index(SPI) and the SPEI were analysed. The SPEI takes intoconsiderations the role of antecedent conditions in quanti-fying drought severity. A decadal trend in drought extentwas detected by the SPEI in the Czech Republic. Moredrought episodes were observed during the 1940s, early1950s, and the 1990s and fewer during the 1910s, 1930s, and1980s. These drought episodes in the Czech Republic coincidewith the secular drought evolution reported for central Europe(Lloyd-Hughes and Saunders 2002; Brázdil et al. 2009). Thecomparison between the SPEI and SPI indicated differences inrepresenting severe drought records during the decades for (1)the lowest summer negative temperature anomalies combinedwith the lowest negative precipitation anomalies (cold and dry;during the first two decades of the twentieth century), (2) thehighest summer positive temperature anomalies (at the end ofthe twentieth century), (3) both high spring positive temperatureand precipitation anomalies (warm and wet, at the beginning ofthe twentieth century), and (4) the highest deficits of waterbalance (1947, 2003, 1994, 1983, and 1933, sorted by thehighest deficit) (Potop et al. 2012a, b). Similarities in droughtdetection with the SPI and SPEI were reported during thedecades displaying (1) high positive temperature anomaliesin spring associated with below-normal precipitation (warmand dry, during the 1950s, 1990s, and 2000s) and (2) extremelylong sunshine duration (155% of the normal sunshine durationreported for the extremely dry June 2006 and August 2003, upto twice as long as the normal sunshine duration for April 2007
and 2009) associated with a large number of consecutive drydays. It was apparent that temperature played a driving role insummer drought episodes. The positive temperature anomaliescontributed to a higher water demand due to increased potentialevapotranspiration (PET) at the end of the last century.
The present study aimed to provide a comprehensive analysisof the Czech Republic drought characteristics as quantified withthe SPEI for various time lags during the growing season (April–September) during the period 1961–2010.
The paper is organised as follows. The data and methodologyare described in Section 2. In Section 3, the results are presentedand discussed. This section is organised in the followingsubsections: 3.1, 3.2, 3.3, 3.4, 3.5, and 3.6 for temporalevolution and persistence of drought, the frequency distribution,temporal extent, spatial extent, trend analysis, and principalmodes of SPEI variability, respectively. The summary andconclusions are presented in Section 4.
2 Data and methods
2.1 The SPEI as a multi-scalar drought indicator
To monitor and quantify drought, various indices have beendeveloped, but a unique and universally accepted droughtindicator does not exist (Heim 2002; Dai 2011a). A largenumber of studies related to drought analysis and monitoringhave been conducted using either (1) the SPI (McKee et al.
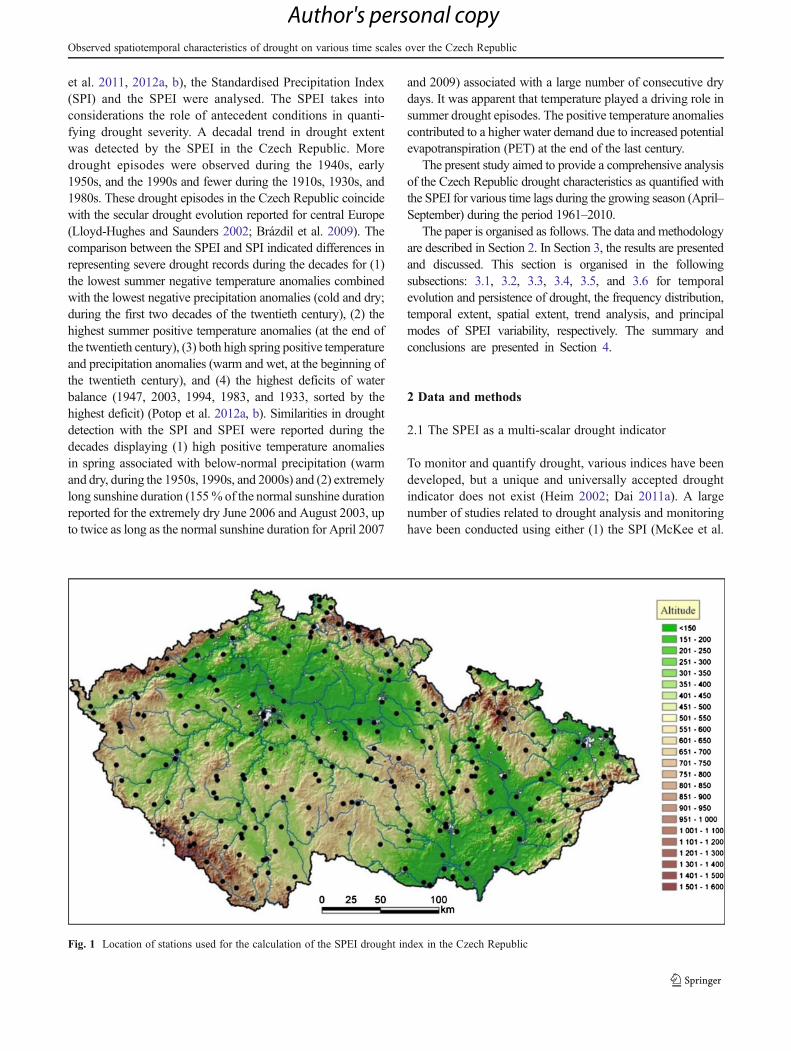
Fig. 1 Location of stations used for the calculation of the SPEI drought index in the Czech Republic
Observed spatiotemporal characteristics of drought on various time scales over the Czech Republic
Author's personal copy
1993), based on a precipitation probabilistic approach or (2)the PDSI (Palmer 1965), based on a soil–water balance equa-tion. Mavromatis (2007) and van der Schrier et al. (2011)obtained similar results for the PDSI using either a simple orcomplex method to calculate the PET as an input parameterfor calculating the PDSI.
A multi-scaling drought indicator is needed to take intoaccount deficits that affect different usable water sources andto distinguish between different types of drought. The newlydeveloped SPEI (Vicente-Serrano et al. 2010) is based onmonthly precipitation totals and temperature means and fol-lows a simple approach to calculate the PET based on anormalisation of the simple water balance (Thornthwaite1948). In developing the SPEI, Vicente-Serrano et al. (2010)followed the same conceptual approach that McKee et al.(1993) devised to develop the SPI. Mathematically, the SPEIis similar to the SPI, but it includes the role of temperature.Because the SPEI is based on a water balance, it can becompared with the self-calibrated PDSI (Wells et al. 2004),as demonstrated with global datasets from observatorieslocated in different climatic zones (Vicente-Serrano et al.2010). The SPEI combines the sensitivity of the PDSI tochanges in evaporative demand (related to temperature fluc-tuations and trends) with the multi-temporal nature of the SPI.
Another advantage of the SPEI is its independence withrespect to the method used to calculate the PET. This indepen-dence was demonstrated in previous studies (Potop 2011; Potopet al. 2011b, 2012a, b) when the effect of two differentparameterisations of PET for calculating water balance weretested. The first parameterisation was derived from the dailyprecipitation, saturation vapour pressure, vapour pressure, thevapour pressure deficit, and air temperature mean at 14:00local time (AMBAV model; Löpemier 1994). The secondparameterisation was based on the minimum and maximumair temperature and extra-terrestrial radiation (Hargreaves mod-el; Hargreaves and Samani 1985). The two parameterisationsyielded similar SPEI values.
Various lags that might be considered for the SPEI calcu-lation can be related to different drought types in a region.Short lag time scales display a strong relationship with varia-tions in soil moisture that determine water availability forvegetation and agriculture, whereas water resources in reser-voirs are mostly related to longer time scales (Dai 2011b;Beguería et al. 2010; Vicente-Serrano et al. 2011). The SPEIis particularly suited for detecting, monitoring, and assessingthe effects of global warming on drought conditions.
2.2 Station data
In this study, the SPEI was calculated from monthly recordsof temperature means and precipitation totals during theperiod 1961–2010, using a dense network of 184 climato-logical stations uniformly covering the territory of the Czech
Republic. The station elevations range between 158 and1,490m above sea level (Fig. 1). The selected stations representdifferent climate conditions in both lowland and highland re-gions and reflect differences in the maritime and continentalweather regimes that are present across the Czech Republic.Based on the station altitude, three regions were defined: regionI groups 89 stations with altitudes below 400 m; region IIgroups 73 stations with altitudes between 401 and 700 m; andregion III groups 22 stations with altitudes above 700 m. Thisregionalisation has been previously used in other climatic stud-ies in the Czech Republic (Quitt 1971; Tolasz 2007; Trnka et al.2009b) and corresponds to different land-use types with mostlyintensive agriculture, less-intensive agriculture, and forestedwith limited agricultural production, respectively. Monthlyseries of temperature and precipitation were selected fromthe Czech Hydrometeorological Institute CLIDATA databasebased on the spatial distribution and completeness of time series.
2.3 Quality control and homogenisation
Quality control of the data was conducted by combiningseveral methods: (1) an analysis of the series of differencesbetween the candidate and neighbouring stations (i.e. pairwisecomparisons) and (2) applying limits derived from interquartileranges.
Neighbouring stations (method 1) or reference series(method 2) were selected either by means of correlation ordistance scores. Correlation coefficients were applied either tothe raw series or to series of first differences (Peterson 1998).In our case, for comparison with neighbouring stations, up toeight nearest stations were selected with a distance limit of300 km, with altitude difference restricted to 500 m andsignificant correlation coefficients (Štěpánek et al. 2009).
The relative homogeneity tests applied were as follows:the Standard Normal Homogeneity Test developed byAlexandersson (1986, 1995), the Maronna and Yohai bivari-ate test (Potter 1981), and the Easterling and Peterson (1995)test. The reference series were calculated as a weighted aver-age from the five nearest stations (with the same period ofobservations as the candidate series) with statistically signifi-cant correlations. The power of weights (inverse distance) wastaken as 1 for temperature and as 3 for precipitation. The testswere applied to the monthly temperature means and precipita-tion totals. All the procedures for quality control and homoge-nisation were conducted with ProClimDB and AnClimsoftwares (Štěpánek 2010). More details on quality control andhomogenisation procedures are provided Štěpánek et al. (2009).
2.4 The SPEI calculation
For calculating the SPEI, the algorithm developed byVicente-Serrano et al. (2010) was used. The documen-tation and executable files are freely available at
V. Potop et al.
Author's personal copy

http://digital.csic.es/handle/10261/10002. A batch scriptwas created and used to optimise the calculation of the SPEIfor the 184 stations and five accumulation periods: 1, 3, 6, 12,and 24 months. The drought at these time scales is relevant foragriculture (1, 3, and 6 months), hydrology (12 months), andsocioeconomic impact (24 months), respectively. The SPEIwas calculated for each month of the year, but for this study,only the months of the growing season (April to September)were selected for analysis. A drought episode was defined as aperiod longer or equal to 1 month during the growing season(April to September) when the SPEI value was less than orequal to −1. The monthly SPEI values of more than −0.99 orless than 0.99 were considered normal conditions. Thedrought categories according to the SPEI values are presentedin Table 1. Drought in the three selected climatic regions wasevaluated in greater detail by considering the characteristics ofthe climatic conditions in the Czech Republic, such as thedegree of continentality and the diversity of physico-geographical conditions (topography and soil type).
2.5 Trend analysis
The rank-based non-parametric Mann–Kendall trend test(Mann 1945; Kendall 1975), recommended by the WorldMeteorological Organisation (Sneyers 1990), was used todetect the SPEI series trends. The Mann–Kendall Z-scorewas used as an indicator of SPEI trends. Compared withparametric tests, the non-parametric Mann–Kendall test ismore practical because the data do not need to conform toany particular distribution (Mann 1945; Kendall 1975).Therefore, the Mann–Kendall test can be used in researchfor trend analysis using monthly and seasonal climatic data.It has been used by many researchers to evaluate the signifi-cance of monotonic trends in hydrometeorological time series(Partal and Kahya 2006; Mourato et al. 2010; Longobardi andVillani 2010; Caloiero et al. 2011; Sinoga et al. 2011), includingseries of drought indices (Rim 2012).
Mann–Kendall statistics are computed as follows. LettingX1, X2, … , Xn be a sequence of measurements over time, thenull hypothesis (H0) is that the data come from a population inwhich the random variables are independent and identically
distributed. The alternative hypothesis (H1) is that the datafollow a monotonic trend over time.
Under H0, the Mann–Kendall test statistic is
S ¼Xn�1
i¼1
Xn
j¼iþ1
sgn Xj � Xi
� � ð1Þ
where sgn θð Þ ¼þ1 . . . θ > 00 . . . θ ¼ 0�1 . . . θ < 0
8<
: ð2Þ
Under the hypothesis of independent and randomly dis-tributed random variables, when n≥8, the S statistic isapproximately normally distributed, with zero mean andvariance as follows:
σ2 ¼ n n � 1ð Þ 2n þ 5ð Þ18
ð3Þ
As a consequence, the standardised Z statistics follow anormal standardised distribution:
Z ¼S�1σ if S > 00 if S ¼ 0Sþ1σ if S < 0
8<
: ð4Þ
The hypothesis that there is no trend is rejected when theZ value computed by Eq. (4) is greater in absolute value thanthe critical value Zα at a chosen level of significance α.
2.6 Modes of SPEI variability
To identify the principal patterns of variability of the SPEI in theCzech Republic, an Empirical Orthogonal Functions (EOF)analysis (Preisendorfer 1988; von Storch 1995) was performed.The EOF technique aims to identify a new set of variables thatcaptures most of the observed variance from data through alinear combination of the original variables, which facilitatesthe study of the spatial and temporal variability of the timeseries in a given domain. This method splits the temporalvariance of data into orthogonal patterns called empiricaleigenvectors. This approach has been widely used to identifythe patterns of drought at global (Dai 2011a, b), European(Ionita et al. 2012), or local (Busuioc et al. 2007) scales.
The EOFs were calculated on detrended and standardisedanomalies of the 6-month averaged SPEI series (April toSeptember) of 184 stations.
3 Results and discussion
3.1 Temporal evolution and persistence of drought
3.1.1 General aspects
The SPEI associated with a specific time scale is a usefultool for monitoring drought. Different SPEI series were
Table 1 The seven classes of SPEI categories according to value
SPEI Drought category Probability
≥2.0 Extreme wet 0.02
1.50 to 1.99 Severe wet 0.06
1.49 to 1.00 Moderate wet 0.10
0.99 to −0.99 Normal 0.65
−1.00 to −1.49 Moderate drought 0.10
-1.50 to −1.99 Severe drought 0.05
≤−2.00 Extreme drought 0.02
Observed spatiotemporal characteristics of drought on various time scales over the Czech Republic
Author's personal copy

obtained for different time scales representing the cumulativewater balance over the previous nmonths. To characterise thetemporal evolution of drought during the growing season, themonthly series of the SPEI for the months of April toSeptember were averaged at each station for each SPEI accu-mulation period (1, 3, 6, 12, and 24 months, respectively).Then, these SPEI time series were averaged over all 184stations to obtain a time series of the drought index at thecountry level. To obtain the time series of the drought indexcharacterising each of the three regions, the SPEI time serieswere averaged over 89, 73, and 22 stations, respectively. It isworth noting that when calculating the SPEI for variousaccumulation periods longer than 1 month, the moisture
characteristic of the lag period is contained in the actualSPEI calculated for the lags of 3months, 6months, 12months,etc. In addition, when averaging the SPEI over the 6 monthsof the growing season (April to September), the resultingSPEI represents an average characteristic of moisture for thesemonths, also taking into consideration that eachmonthly SPEIvalue contains the moisture memory of previous months. Assuch, the temporal evolution of the SPEI with a 1-month lagrepresents the year-by-year moisture characteristic of the actualgrowing season.
In this respect, according to the SPEI values at the countrylevel, during the second half of the twentieth century and thefirst decade of the twenty-first century, the driest years during
48
1612
2024
SP
EI a
t tim
e-sc
ales
extremedrought
severedrought
moderatedrought normal
moderatewet
severewet
extremewet
Kopisty - 50.54°N, 13.62°E h= 240 m a.s.l.
1965 1970 1975 1980 1985 1990 1995 2000 2005 2010
Fig. 2 The evolution ofmoisture characteristics asquantified by the SPEIindicating the development ofdrought from 1 to 24 months(12 months×50 years×24 SPEItime scales) (top) and temporalevolution of the SPEI at 3-, 6-,12-, and 24-month lags duringthe growing season (April–September) (bottom) at theKopista climatological stationsituated in region I (north-westof the Czech Republic)
V. Potop et al.
Author's personal copy

the growing season were (from most dry to least dry) 2003,1992, 2000, 1983, 1982, 1976, 2009, and 1999. By contrast,the wettest years during the growing season were 1965, 2010,1977, 1996, 1966, 2001, 1972, 1980, and 1995. These yearshave also been identified as extremely dry or extremely wet,respectively, in previous studies of the Czech Republic mois-ture extremes based on observations at representative stations(Potop et al. 2010). These years appear to be associated withprecipitation anomalies in Europe (Brázdil et al. 2009). Theseresults also emphasise that the persistence of lower-than-normal precipitation is the primary cause of drought in centralEurope, whereas other meteorological factors, such astemperature, wind, and humidity usually contribute to theintensification of the impact of drought.
The upper panel of Fig. 2 shows an aggregated picture ofmonthly SPEI at 24 time scales during the period 1961–2010 at Kopisty climatological station, which is situated inregion I (altitude lower than 400 m), as an example of thestations situated in the rain shadow of the Ore Mountainschain (the north-western region of the Czech Republic). Thepicture emphasises the evolution of moisture characteristics asquantified by the SPEI at 1- to 24-month lags. The followinglower panels display the temporal evolution of the monthly
SPEI at 3-, 6-, 12-, and 24-month lags during the growingseason (April to September) at the same station. According tothe SPEI values characterising the categories of dry and wetconditions, the periods of drought were 1962–1964, 1971–1974, 1976–1977, 1983–1985, 1991–1992, 1995–2000, and2003–2007, whereas the periods with wet conditions were1965–1970, 1978–1982, 1986–1987, and 2001–2002 (Fig. 2).
When averaging over the 6 months of the growing sea-son, either for all stations at the country level or for theselected stations at the regional level, the SPEI values di-minish correspondingly. The value of −0.3 (+0.3) was con-sidered the threshold for the averaged SPEI for the 6 months(April to September) at the country level (184 stations) or atthe regional level (89, 72, or 22 stations, respectively) tocharacterise the moderate dry (wet) growing season. Thisthreshold was chosen as a compromise between the sevenclasses of SPEI categories, according to its value (Table 1)calculated for a single station, and the averaged SPEI seriesover a number of stations (184, 89, 72, and 22) at thecountry or regional level, respectively.
At the country level, the numbers of years with SPEIvalues lower (higher) than this threshold was counted for theaveraged SPEI series at various lag periods. The averaged
-2-1.5
-1-0.5
00.5
11.5
2
1960 1965 1970 1975 1980 1985 1990 1995 2000 2005 2010
I II IIISPEI-3
-2-1.5
-1-0.5
00.5
11.5
2
1960 1965 1970 1975 1980 1985 1990 1995 2000 2005 2010
I II IIISPEI-6
-2-1.5
-1-0.5
00.5
11.5
2
1960 1965 1970 1975 1980 1985 1990 1995 2000 2005 2010
I II IIISPEI-12
-2-1.5
-1-0.5
00.5
11.5
2
1960 1965 1970 1975 1980 1985 1990 1995 2000 2005 2010
I II IIISPEI-24
Fig. 3 Temporal evolution ofthe averaged SPEI over thegrowing season (April–September) at various lags (3, 6,12, and 24 months) for the threeregions defined by stationaltitude: regions I (below400 m), II (between 400 and700 m), and III (above 700 m)
Observed spatiotemporal characteristics of drought on various time scales over the Czech Republic
Author's personal copy

SPEI for the growing season at a 1-month lag indicates 14(13) dry (wet) years; at a 3-month lag, 16 (17) dry (wet)years; at a 6-month lag, 19 (16) dry (wet) years; at a 12-month lag, 18 (20) dry (wet) years; and, at a 24-month lag, 17(17) dry (wet) years, respectively. The differences in thesenumbers for different SPEI lags may be due to the memory ofmoisture conditions in previousmonths. Although the averagedvalues of the SPEI for the growing season are considerablylower than the individual SPEI value of each month belongingto this season, the exceptionally dry year 2003 is highlightedby the SPEI values for the 3- and 6-month lags.ManymonthlySPEI values (April to September) for 2003 were exceptionallydry mainly due to extremely high temperatures during thegrowing season, which increased evapotranspiration andenhanced drought (Potop et al. 2012a, b). The longestand most intense dry period emphasised by all SPEI series at3-, 6-, 12- and 24-month lags was 1988–1994. This period isfollowed, in terms of intensity and duration (SPEI at 12- and24-month lags), by the periods 1972–1974, 1983–1985, and2007–2009. By contrast, the wettest periods (SPEI at 12- and24-month lags) were 1965–1968, 1975–1982, 1986–1988,and 1996–1997.
3.1.2 Regional characteristics
The averaged SPEI series for the three regions delimited on thebasis of station altitude were processed in the samemanner. Theanalysis of the regional SPEI series allowed us to highlight thepeculiarities of drought characteristics based on station eleva-tions in the Czech Republic. Figure 3 shows the temporalevolution of the averaged SPEI over the six months at thegrowing season at 3-, 6-, 12-, and 24-month lags for the threeregions as defined by station altitude.
No essential difference in drought evolution for these threeregions was observed. The year 2003 was the driest and 1965was the wettest during the growing season, according to theSPEI values calculated at 3- and 6-month lags. The SPEIseries at 12- and 24-month lags integrate the moisture charac-teristics of the preceding months with those of the growingseason and highlight the persistence of dry (wet) conditions.The driest growing seasons were during 1972–1974, 1985–1985, and 1989–1994, and the wettest growing seasons wereduring 1965–1968, 1978–1982, and 1995–1999, respectively.
The number of years with SPEI values lower (higher)than −0.3 (+0.3) was counted for the averaged SPEI seriesof each region at various lags. Region I (stations withaltitudes below 400 m) is characterised by the warmestclimate in the country, the highest PET during the growingseason, and mostly intensive agriculture. Based on the sameselection criteria, the numbers of dry (wet) years accordingto the averaged SPEI are as follows: 13 (14) dry (wet) yearsat a 1-month lag, 19 (17) dry (wet) years at a 3-month lag,18 (19) dry (wet) years at a 6-month lag, 17 (21) dry (wet)
years at a 12-month lag, and 17 (19) dry (wet) years at a 24-month lag.
Region II (stations with altitudes between 401 and 700 m)is characterised by a moderate-temperature regime and less-intensive agriculture. The evolution of drought in region II issimilar to region I. The number of years with an SPEI valuelower (higher) than −0.3 (+0.3) at a 1-month lag was 12 (14),at a 3-month lag was 15 (16), at a 6-month lag was 19 (16), at a12-month lag was 19 (22), and at a 24-month lag was 19 (20).
Region III (stations with altitude above 700 m) is mostlyforested and characterised by limited agricultural production.Figure 3 shows the similarities in drought evolution in regionIII with those in the previous two regions. However, accordingto the SPEI values for all lags, particularly during the lastdecade, the intensity of drought in region III was lower than inregions I and II. The averaged SPEI for region III at a 1-monthlag indicates 14 (12) dry (wet) years; at a 3-month lag, 17 (13)dry (wet) years; at a 6-month lag, 17 (15) dry (wet) years; at a12-month lag, 20 (16) dry (wet) years; and at a 24-month lag,17 (20) dry (wet) years, respectively.
The highest precipitation amounts usually occur at stationsalong the border of mountain ranges, which is attributable tothe strong effect of the windward location of the stations andto “precipitation-forming” cyclones. Conversely, the lowestprecipitation amounts are associated with leeward areas in thefoothills of the Ore Mountains (which extend into Central,Western, and Southern Bohemia) and Southern Moravia(Tolasz 2007). Consequently, the windward and leewardeffects may bias the expected dependence of dry (wet) growingseasons on station elevation.
3.2 Frequency distribution
In this subsection, drought occurrence is investigated on thebasis of the frequency distribution of the SPEI values inseven classes (Table 1). The frequency was calculated as theratio between the number of occurrences in each SPEIcategory and the total number of events counted for allstations in a given region and for a given SPEI calculatedfor various lags (1, 3, 6, 12, and 24 months). The aim was toidentify the spatial patterns of frequency distribution ofmoderate, severe, and extreme droughts (Table 1) over thecountry for various SPEI lags during the growing season(April–September) based on individual station frequencydistribution. The occurrence of these drought categoriesaccording to SPEI classes at various lags was also analysedon a regional basis to highlight the drought characteristics ofthe three climatic regions defined by station altitude as wellas on a climatic basis as warm, moderately warm, and cold,respectively. The frequency distribution of the SPEI valueswas calculated at each station, and the frequency distribu-tion of the three drought categories (moderate, severe, andextreme) was then plotted at the country level (Fig. 4).
V. Potop et al.
Author's personal copy

In Table 2, the percentage of drought and wet occurrence isexpressed in seven classes of moisture categories (in per cent)based on the SPEI series calculated at 1, 3, 6, 12, and24 months for each individual region for the period 1961–2010. The normal conditions represent between 60.26 and65.47 % of the total values of the SPEI for all lags in all threeregions, whereas moderate drought and moderate wet condi-tions are almost equally distributed approximately at 10 %.The differences in extremely dry conditions compared withextremely wet conditions increased with increasing SPEI lags;for example, the percentage of extreme drought for the SPEI ata 24-month lag in region I (lowland) was 5.27 %, whereas thepercentage of extreme wetness was 1.16 %. The resultspresented in Table 2 indicate that the occurrence of extremelydry conditions (SPEI value lower than −2.0) tended to prevailover the occurrence of extremely wet conditions (SPEI value
higher than +2.0), mostly for the SPEI calculated for longeraccumulation periods (12 and 24 months).
The resulting percentages corresponding to moderate, se-vere, and extreme drought for each station were mapped usingthe Surfer program. The Surfer program permits the generationof calculated data points (184 station observations) on a regulargrid. We used this grid to generate the contour map of thespatial distribution of the frequency of the SPEI values(gridding using the Kriging interpolation technique) for 1-,3-, 6-, 12-, and 24-month lags (Fig. 4). The spatial interpolationof the SPEI values ranges between longitudes 12.2° and 18.8°E and latitudes 48.6° and 51.0° N. The lowest and higheststation altitudes were 158 and 1490 m, respectively.
The left panel of Fig. 4 indicates the spatial distribution ofthe frequency of moderate drought based on the station per-centage of the SPEI values falling into this drought category
12 13 14 15 16 17 18
49
50
51
Longitude (°E)
Latit
ude
(°N
)
%
1month moderate drought(%) 1357911131517
%
1357911131517
12 13 14 15 16 17 18
49
50
51
Longitude (°E)
Latit
ude
(°N
)
1month severe drought(%)
6
55
Longitude (°E)
Latit
ude
(°N
) %
1month extreme drought(%) 1357911131517
12 13 14 15 16 17 18
49
50
51
3
22
2 23
Longitude (°E)
Latit
ude
(°N
) %
3months moderate drought(%) 1357911131517
12 13 14 15 16 17 18
49
50
51
10
%
Longitude (°E)
Latit
ude
(°N
)
3months severe drought(%) 1357911131517
12 13 14 15 16 17 18
49
50
51
5
56
5
5
Longitude (°E)
Latit
ude
(°N
)%
3months extreme drought(%) 1357911131517
12 13 14 15 16 17 18
49
50
51
22 2
Longitude (°E)
Latit
ude
(°N
)
%
6months moderate drought(%)
12 13 14 15 16 17 18
49
50
51
10
1357911131517
%Longitude (°E)
Latit
ude
(°N
)
6months severe drought(%) 1357911131517
12 13 14 15 16 17 18
49
50
51
565
Longitude (°E)
Latit
ude
(°N
)
%
6months extreme drought(%) 1357911131517
12 13 14 15 16 17 18
49
50
51
22
2
Longitude (°E)
Latit
ude
(°N
)
%
12months moderate drought(%)1357911131517
12 13 14 15 16 17 18
49
50
51%
Longitude (°E)
Latit
ude
(°N
)
12months severe drought(%) 1357911131517
12 13 14 15 16 17 18
49
50
51
5 55
66
Longitude (°E)
Latit
ude
(°N
)
%
12months extreme drought(%) 1357911131517
12 13 14 15 16 17 18
49
50
51
4
44
33
3
Longitude (°E)
Latit
ude
(°N
)
%
24months moderate drought(%)
12 13 14 15 16 17 18
49
50
51
1357911131517
10
17
1717 1710
10
%
Longitude (°E)
Latit
ude
(°N
)
24months severe drought(%) 1357911131517
12 13 14 15 16 17 18
49
50
51
65
55
Longitude (°E)
Latit
ude
(°N
)
%
24months extreme drought(%) 1357911131517
12 13 14 15 16 17 18
49
50
51
4
4
4
45
5
5
Fig. 4 Spatial distribution of the frequency (in per cent) of the SPEI values falling into the category of moderate (left), severe (middle), and extreme(right) drought based on the station values of the SPEI at various lags (1, 3, 6, 12, and 24 months)
Observed spatiotemporal characteristics of drought on various time scales over the Czech Republic
Author's personal copy
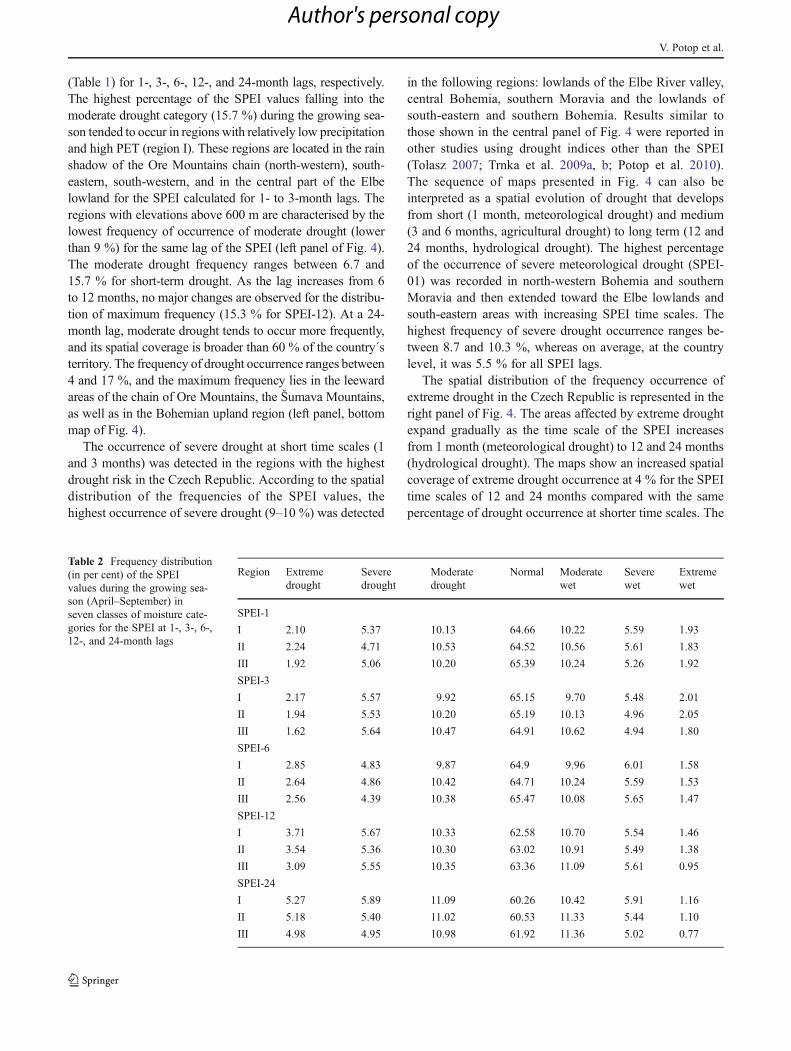
(Table 1) for 1-, 3-, 6-, 12-, and 24-month lags, respectively.The highest percentage of the SPEI values falling into themoderate drought category (15.7 %) during the growing sea-son tended to occur in regions with relatively low precipitationand high PET (region I). These regions are located in the rainshadow of the Ore Mountains chain (north-western), south-eastern, south-western, and in the central part of the Elbelowland for the SPEI calculated for 1- to 3-month lags. Theregions with elevations above 600 m are characterised by thelowest frequency of occurrence of moderate drought (lowerthan 9 %) for the same lag of the SPEI (left panel of Fig. 4).The moderate drought frequency ranges between 6.7 and15.7 % for short-term drought. As the lag increases from 6to 12 months, no major changes are observed for the distribu-tion of maximum frequency (15.3 % for SPEI-12). At a 24-month lag, moderate drought tends to occur more frequently,and its spatial coverage is broader than 60 % of the country´sterritory. The frequency of drought occurrence ranges between4 and 17 %, and the maximum frequency lies in the leewardareas of the chain of Ore Mountains, the Šumava Mountains,as well as in the Bohemian upland region (left panel, bottommap of Fig. 4).
The occurrence of severe drought at short time scales (1and 3 months) was detected in the regions with the highestdrought risk in the Czech Republic. According to the spatialdistribution of the frequencies of the SPEI values, thehighest occurrence of severe drought (9–10 %) was detected
in the following regions: lowlands of the Elbe River valley,central Bohemia, southern Moravia and the lowlands ofsouth-eastern and southern Bohemia. Results similar tothose shown in the central panel of Fig. 4 were reported inother studies using drought indices other than the SPEI(Tolasz 2007; Trnka et al. 2009a, b; Potop et al. 2010).The sequence of maps presented in Fig. 4 can also beinterpreted as a spatial evolution of drought that developsfrom short (1 month, meteorological drought) and medium(3 and 6 months, agricultural drought) to long term (12 and24 months, hydrological drought). The highest percentageof the occurrence of severe meteorological drought (SPEI-01) was recorded in north-western Bohemia and southernMoravia and then extended toward the Elbe lowlands andsouth-eastern areas with increasing SPEI time scales. Thehighest frequency of severe drought occurrence ranges be-tween 8.7 and 10.3 %, whereas on average, at the countrylevel, it was 5.5 % for all SPEI lags.
The spatial distribution of the frequency occurrence ofextreme drought in the Czech Republic is represented in theright panel of Fig. 4. The areas affected by extreme droughtexpand gradually as the time scale of the SPEI increasesfrom 1 month (meteorological drought) to 12 and 24 months(hydrological drought). The maps show an increased spatialcoverage of extreme drought occurrence at 4 % for the SPEItime scales of 12 and 24 months compared with the samepercentage of drought occurrence at shorter time scales. The
Table 2 Frequency distribution(in per cent) of the SPEIvalues during the growing sea-son (April–September) inseven classes of moisture cate-gories for the SPEI at 1-, 3-, 6-,12-, and 24-month lags
Region Extremedrought
Severedrought
Moderatedrought
Normal Moderatewet
Severewet
Extremewet
SPEI-1
I 2.10 5.37 10.13 64.66 10.22 5.59 1.93
II 2.24 4.71 10.53 64.52 10.56 5.61 1.83
III 1.92 5.06 10.20 65.39 10.24 5.26 1.92
SPEI-3
I 2.17 5.57 9.92 65.15 9.70 5.48 2.01
II 1.94 5.53 10.20 65.19 10.13 4.96 2.05
III 1.62 5.64 10.47 64.91 10.62 4.94 1.80
SPEI-6
I 2.85 4.83 9.87 64.9 9.96 6.01 1.58
II 2.64 4.86 10.42 64.71 10.24 5.59 1.53
III 2.56 4.39 10.38 65.47 10.08 5.65 1.47
SPEI-12
I 3.71 5.67 10.33 62.58 10.70 5.54 1.46
II 3.54 5.36 10.30 63.02 10.91 5.49 1.38
III 3.09 5.55 10.35 63.36 11.09 5.61 0.95
SPEI-24
I 5.27 5.89 11.09 60.26 10.42 5.91 1.16
II 5.18 5.40 11.02 60.53 11.33 5.44 1.10
III 4.98 4.95 10.98 61.92 11.36 5.02 0.77
V. Potop et al.
Author's personal copy
highest percentage of extreme drought occurrence is 3.7 %at the short time scale (SPE-1), whereas at longer time scales(SPEI-3 to SPEI-24), the highest percentage of extremedrought increases and ranges between 5.7 and 8.0 %. Thestations at an altitude higher than 1,000 m present the lowestpercentage of extreme drought occurrence, 0.3 % or lower.
3.3 Temporal extent of drought (SPEI≤-1)
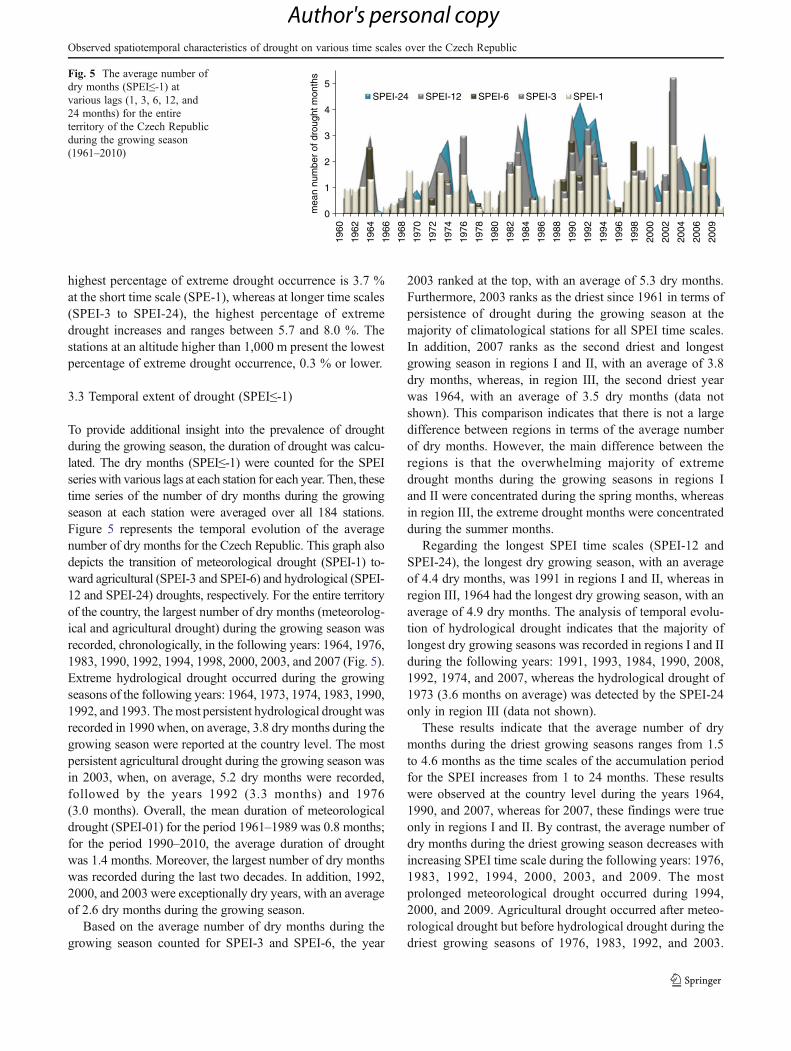
To provide additional insight into the prevalence of droughtduring the growing season, the duration of drought was calcu-lated. The dry months (SPEI≤-1) were counted for the SPEIseries with various lags at each station for each year. Then, thesetime series of the number of dry months during the growingseason at each station were averaged over all 184 stations.Figure 5 represents the temporal evolution of the averagenumber of dry months for the Czech Republic. This graph alsodepicts the transition of meteorological drought (SPEI-1) to-ward agricultural (SPEI-3 and SPEI-6) and hydrological (SPEI-12 and SPEI-24) droughts, respectively. For the entire territoryof the country, the largest number of dry months (meteorolog-ical and agricultural drought) during the growing season wasrecorded, chronologically, in the following years: 1964, 1976,1983, 1990, 1992, 1994, 1998, 2000, 2003, and 2007 (Fig. 5).Extreme hydrological drought occurred during the growingseasons of the following years: 1964, 1973, 1974, 1983, 1990,1992, and 1993. Themost persistent hydrological drought wasrecorded in 1990 when, on average, 3.8 dry months during thegrowing season were reported at the country level. The mostpersistent agricultural drought during the growing season wasin 2003, when, on average, 5.2 dry months were recorded,followed by the years 1992 (3.3 months) and 1976(3.0 months). Overall, the mean duration of meteorologicaldrought (SPEI-01) for the period 1961–1989 was 0.8 months;for the period 1990–2010, the average duration of droughtwas 1.4 months. Moreover, the largest number of dry monthswas recorded during the last two decades. In addition, 1992,2000, and 2003 were exceptionally dry years, with an averageof 2.6 dry months during the growing season.
Based on the average number of dry months during thegrowing season counted for SPEI-3 and SPEI-6, the year
2003 ranked at the top, with an average of 5.3 dry months.Furthermore, 2003 ranks as the driest since 1961 in terms ofpersistence of drought during the growing season at themajority of climatological stations for all SPEI time scales.In addition, 2007 ranks as the second driest and longestgrowing season in regions I and II, with an average of 3.8dry months, whereas, in region III, the second driest yearwas 1964, with an average of 3.5 dry months (data notshown). This comparison indicates that there is not a largedifference between regions in terms of the average numberof dry months. However, the main difference between theregions is that the overwhelming majority of extremedrought months during the growing seasons in regions Iand II were concentrated during the spring months, whereasin region III, the extreme drought months were concentratedduring the summer months.
Regarding the longest SPEI time scales (SPEI-12 andSPEI-24), the longest dry growing season, with an averageof 4.4 dry months, was 1991 in regions I and II, whereas inregion III, 1964 had the longest dry growing season, with anaverage of 4.9 dry months. The analysis of temporal evolu-tion of hydrological drought indicates that the majority oflongest dry growing seasons was recorded in regions I and IIduring the following years: 1991, 1993, 1984, 1990, 2008,1992, 1974, and 2007, whereas the hydrological drought of1973 (3.6 months on average) was detected by the SPEI-24only in region III (data not shown).
These results indicate that the average number of drymonths during the driest growing seasons ranges from 1.5to 4.6 months as the time scales of the accumulation periodfor the SPEI increases from 1 to 24 months. These resultswere observed at the country level during the years 1964,1990, and 2007, whereas for 2007, these findings were trueonly in regions I and II. By contrast, the average number ofdry months during the driest growing season decreases withincreasing SPEI time scale during the following years: 1976,1983, 1992, 1994, 2000, 2003, and 2009. The mostprolonged meteorological drought occurred during 1994,2000, and 2009. Agricultural drought occurred after meteo-rological drought but before hydrological drought during thedriest growing seasons of 1976, 1983, 1992, and 2003.
0
1
2
3
4
5
1960
1962
1964
1966
1968
1970
1972
1974
1976
1978
1980
1982
1984
1986
1988
1990
1992
1994
1996
1998
2000
2002
2004
2006
2009
mea
n nu
mbe
r of
dro
ught
mon
ths
SPEI-24 SPEI-12 SPEI-6 SPEI-3 SPEI-1
Fig. 5 The average number ofdry months (SPEI≤-1) atvarious lags (1, 3, 6, 12, and24 months) for the entireterritory of the Czech Republicduring the growing season(1961–2010)
Observed spatiotemporal characteristics of drought on various time scales over the Czech Republic
Author's personal copy

According to the SPEI values at longer time scales (SPEI-12and SPEI-24), the most persistent hydrological droughtswere recorded during the periods 1973–1974 and 1990–1994 in all regions.
3.4 Spatial extent
The high density of climatological stations in the CzechRepublic used in this study enabled the definition of another
0
20
40
60
80
100
1960
1962
1964
1966
1968
1970
1972
1974
1976
1978
1980
1982
1984
1986
1988
1990
1992
1994
1996
1998
2000
2002
2004
2006
2008
2010
SPEI-1 SPEI-3 SPEI-6 SPEI-12 SPEI-24Fig. 6 Percentage of stations(in per cent) for the entireterritory of the Czech Republicwith an SPEI≤-1 at various lags(1, 3, 6, 12, and 24 months)during the growing season(1961–2010)
13 14 15 16 17 18
49
49.5
50
50.5
51SPEI-1
Longitude (°E)
Latitu
de (
°N)
..... ] ( ............ ] (............. ] (...............] (........0........) [.........) [...........) [..........) [.......... < - 3.29 -2.575 -1.96 -1.645 1.645 1.96 2.575 3.29 >
no significant 90% 95% 99% 99.9%99.9% 99% 95% 90%
13 14 15 16 17 18
49
49.5
50
50.5
51SPEI-3
Longitude (°E)
Latitu
de (
°N)
..... ] ( ............ ] (............. ] (...............] (........0........) [.........) [...........) [..........) [.......... < - 3.29 -2.575 -1.96 -1.645 1.645 1.96 2.575 3.29 >
no significant 90% 95% 99% 99.9%99.9% 99% 95% 90%
13 14 15 16 17 18
49
49.5
50
50.5
51SPEI-6
Longitude (°E)
Latitu
de (
°N)
..... ] ( ............ ] (............. ] (...............] (........0........) [.........) [...........) [..........) [.......... < - 3.29 -2.575 -1.96 -1.645 1.645 1.96 2.575 3.29 >
no significant 90% 95% 99% 99.9%99.9% 99% 95% 90%
13 14 15 16 17 18
49
49.5
50
50.5
51SPEI-12
Longitude (°E)
Latitu
de (
°N)
..... ] ( ............ ] (............. ] (...............] (........0........) [.........) [...........) [..........) [.......... < - 3.29 -2.575 -1.96 -1.645 1.645 1.96 2.575 3.29 >
no significant 90% 95% 99% 99.9%99.9% 99% 95% 90%
13 14 15 16 17 18
49
49.5
50
50.5
51SPEI-24
Longitude (°E)
Latitu
de (
°N)
..... ] ( ............ ] (............. ] (...............] (........0........) [.........) [...........) [..........) [.......... < - 3.29 -2.575 -1.96 -1.645 1.645 1.96 2.575 3.29 >
no significant 90% 95% 99% 99.9%99.9% 99% 95% 90%
Fig. 7 Mann–Kendall test results for positive and negative trend detection at the 90, 95, 99, and 99.9 % confidence levels (two-tailed test) for theSPEI at 1-, 3-, 6-, 12-, and 24-month lags averaged over the growing season (April–September) at 183 stations
V. Potop et al.
Author's personal copy
indicator of drought characteristics at the country level, thepercentage of stations with an SPEI≤-1 during the growingseason. The temporal evolution of the percentage of stationswith drought (SPEI≤-1) during the growing season(April-September) at five lags of the SPEI for the entireterritory of the Czech Republic is shown in Fig. 6. As theSPEI lags increases (1 to 24 months), this indicator demon-strates that the prevalence of drought at the country level tendsto decrease. In many years, the meteorological drought (SPEI-1) had a broad extent at the country level during the growingseason, as was the case of in 1983, when drought quantifiedby SPEI≤-1 was recorded at 100 % of the stations, and during1992, 2000, 2003, 2007, and 2009, when drought wasrecorded at 99 % of the stations. These findings are in linewith other studies on drought in the Czech Republic (Trnka etal. 2009a; Potop et al. 2010). The most extensive agriculturaldroughts during the growing season, which were recorded atmore than 50% of the stations, occurred in 25 years accordingto SPEI-3 and in 19 years according to SPEI-6. The largestextent of agricultural drought for both intervals (SPEI-3 andSPEI-6) was recorded during 2003, when SPEI≤-1 occurred at99 % of the stations. Long-term droughts (SPEI-12 and SPEI-24) were detected in 17 and 13 years, respectively. The mostextensive 2-year hydrological drought was recorded in 1990and 1991 as a consequence of a deficit of moisture accumu-lation during the previous years. During the growing season of1990, the prevalence of drought was high (approximately85 % of the stations) at all SPEI timescales (Fig. 6). Thismeans that the meteorological drought gradually developedinto agricultural and hydrological drought, yielding asignificant cumulative socio-economic impact (Vicente-Serrano et al. 2010, 2011, 2012).
During the first decade of the twenty-first century, droughtwas detected at 98–99 % of the stations during 4 years (2000,2003, 2007, and 2009). These drought events were mainlyrecorded during spring months (April–May), a period withincreased moisture demand for the growth and developmentof crops (Potop et al. 2010, 2012a, b). The droughts of April
2007 and 2009 were characterised by insufficient water sup-ply in the soil, very little precipitation (14 % of normal), andpositive air temperature anomalies accompanied by longer-than-normal sunshine duration, which resulted in a highamount of PET. From an agronomic perspective, thesedrought conditions mainly impacted the lowland regions withaltitudes below 400 m, which are the regions with profitablevegetable cultivation. The consequences of drought impact onthe majority of vegetable species were quantified by thereduction or even total loss of production and poor qualityyield, often occurring in cases of only short-term drought.When a dry period occurs during an initial stage of cropdevelopment, ripening for market is often delayed, and theyield is reduced (Potop et al. 2012a, b). By contrast, theextremely wet anomalies recorded during the growing seasonof 2010, which were due to high precipitation amounts andnegative temperature anomalies recorded during the summermonths (June and August), had a devastating impact on cropsof certain species of vegetable. Particularly high losses forcucumber crops were reported (Potop and Soukup 2011;Potop et al. 2012a, b).
3.5 Trend analysis
The standardised Z statistics (Eq. 4) of the non-parametricMann–Kendal test were calculated for each SPEI at 1-, 3-,6-, 12-, and 24-month accumulation periods, averaged over6 months (April to September) and for each of the 184 stationsthat were included in this study. After the analysis of theresults, one station was discarded because it appeared to bean outlier. The null hypothesis that there is no trend wasrejected when the standardised Z statistic computed usingEq. (4) was greater in absolute value than the critical value Zat the 90, 95, 99, and 99.9 % confidence levels. Because theSPEI is a multi-scalar drought indicator with values rangingfrom less than or equal to −2 (extreme drought) to more thanor equal to 2 (extreme wet) (Table 1), the two-tailed standardnormal distribution was considered for the standardised Z
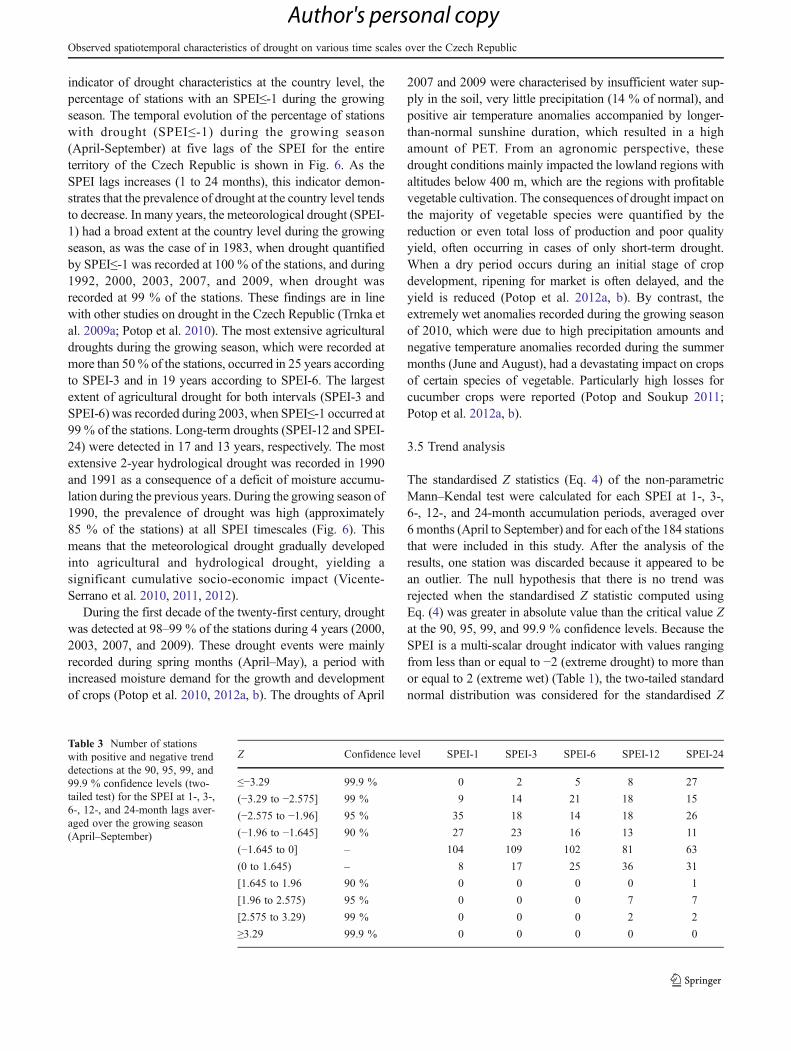
Table 3 Number of stationswith positive and negative trenddetections at the 90, 95, 99, and99.9 % confidence levels (two-tailed test) for the SPEI at 1-, 3-,6-, 12-, and 24-month lags aver-aged over the growing season(April–September)
Z Confidence level SPEI-1 SPEI-3 SPEI-6 SPEI-12 SPEI-24
≤−3.29 99.9 % 0 2 5 8 27
(−3.29 to −2.575] 99 % 9 14 21 18 15
(−2.575 to −1.96] 95 % 35 18 14 18 26
(−1.96 to −1.645] 90 % 27 23 16 13 11
(−1.645 to 0] – 104 109 102 81 63
(0 to 1.645) – 8 17 25 36 31
[1.645 to 1.96 90 % 0 0 0 0 1
[1.96 to 2.575) 95 % 0 0 0 7 7
[2.575 to 3.29) 99 % 0 0 0 2 2
≥3.29 99.9 % 0 0 0 0 0
Observed spatiotemporal characteristics of drought on various time scales over the Czech Republic
Author's personal copy

statistics of the Mann–Kendall test. The results of the Mann–Kendall trend test at each station for the SPEI at 1-, 3-, 6-, 12-,and 24-month lags are represented in Fig. 7, and the number ofstations where positive or negative trends of the SPEI weredetected at 90, 95, 99, and 99.9 % confidence levels ispresented in Table 3. For SPEI-1, a negative trend(drought) was detected at 27 stations at the 90 % confidencelevel, at 35 stations at the 95 % confidence level, and at 9stations at the 99 % confidence level. Furthermore, a non-significant negative trend was detected at 104 stations forSPEI-1.
The number of stations where a negative trend of theSPEI was detected at high confidence levels (99 and 99.9 %)increases when the accumulation period for the calculationof the SPEI increases. Thus, for SPEI-3, a negative signif-icant trend was detected at 14 stations at the 99 % confi-dence level and at 2 stations at the 99.9 % confidence level.For SPEI-6, a negative significant trend was detected at 21stations at the 99 % confidence level and at 5 stations at the99.9 % confidence level. For SPEI-12, a negative significanttrend was detected at 18 stations at a 99 % confidence leveland at 8 stations at a 99.9 % confidence level, whereas forSPEI-24, a negative significant trend was detected at 15stations at a 99 % confidence level and at 27 stations at a
99.9 % confidence level. The results also indicate that a non-significant positive trend is observed at a larger number ofstations as the accumulation period for the calculation of theSPEI increases. Concurrently, a significant positive trendwas detected at 7 stations at a 95 % confidence leveland at 2 stations at a 99 % confidence level for SPEI-12and SPEI-24, respectively (Table 3). For the spatial distribu-tion of stations with a significant negative trend of theSPEI for all five accumulation periods (1, 3, 6, 12, and24 months), it is worth noting that these stations are pre-dominantly located in the lowlands, which are regionscharacterised by intense agriculture (Fig. 7). In these re-gions, a negative correlation (i.e. damaging effects) wasobserved between the detrended yield of sugar beets andthe SPEI at time scales from 1 to 7 months during themonths of May, July, and August (r=−0.37 to −0.55)(Potop and Türkott 2012). In addition, significant negativecorrelations between the SPEI during the growing seasonand the detrended yields of root vegetables (r=−0.68) werealso reported (Potop et al. 2012a, b).
As the accumulation period for calculation of the SPEIincreases (from 1 to 24 months), the persistence of droughtin these regions is increasingly significant at high confi-dence levels (99 and 99.9 %). The majority of the stationswhere a significant positive trend of the SPEI was detectedare located in the highlands (Fig. 7). The thermic andpluviometric regimes of these stations were not significantlyaffected by the overall increasing temperature trend anddecreasing precipitation trends in Europe (Brifa et al.2009). Other studies (Trnka et al. 2009a; Brázdil et al.2009) indicate that the number of stations with statisticallysignificant trends towards drier conditions (in terms ofavailable soil moisture) prevail in the Czech Republic overthose where either no trend at all or a tendency towardswetter conditions was noted.
Table 4 Percentages of explained variance of the leading EOFs of theSPEI at 1-, 3-, 6-, 12-, and 24-month lags averaged over the growingseason (April–September)
Explained variance (%)
SPEI-1 SPEI-3 SPEI-6 SPEI-12 SPEI-24
EOF1 66.04 61.82 60.48 57.66 55.56
EOF2 6.86 7.53 8.45 10.28 10.70
EOF3 4.00 5.15 5.23 5.78 6.51
a)Longitude (°E)
Lat
itu
de
(°N
)
EOF1
-0.16
-0.08
0
0.08
0.16
0 00
0-0.08
-0.080.078
0
0
12 13 14 15 16 17 18
49
50
51
0.07
growing season
0.076
b)Longitude (°E)
Lat
itu
de
(°N
)
EOF2
-0.16
-0.08
0
0.08
0.16
0 00
0-0.08
-0.080.078
0
0
12 13 14 15 16 17 18
49
50
51
0
00.05
growing season
c)Longitude (°E)
Lat
itu
de
(°N
)
EOF3
-0.16
-0.08
0
0.08
0.16
0 00
0-0.08
-0.080.078
0
summer
0
00.05
12 13 14 15 16 17 18
49
50
51
00
growing season
d)PC1 SPEI-1avgSPEI-1
1960 1970 1980 1990 2000 2010-3-2-10123
e)PC2 SPEI-1avgSPEI-1
1960 1970 1980 1990 2000 2010-3-2-10123
f)PC3 SPEI-1avgSPEI-1
1960 1970 1980 1990 2000 2010-3-2-10123
Fig. 8 The spatial distribution of the three leading EOFs of the 1-month lag SPEI averaged over the growing season (April–September) (top) andthe standardised coefficient time series of the corresponding PCs, together with the spatially averaged series of SPEI-1 (bottom)
V. Potop et al.
Author's personal copy

Our results indicating an increasing number of stationsprone to significant drought trends at increasing time scalesare in line with other recent findings (Lloyd-Hughes 2012;Ionita et al. 2012).
3.6 Principal modes of SPEI variability
To identify the dominant pattern of variability of the SPEIduring the growing season (April to September), an EOFanalysis of the SPEI for five accumulation periods (1, 3, 6,12, and 24 months) at 184 stations was performed. Theexplained variance of the EOF1 of the averaged SPEI overthe growing season ranges between 66.04 and 55.56 % as thetime scale of the accumulation period for the calculation of theSPEI increases from 1 to 24 months (the first row of Table 4).The explained variances of the EOF2 and EOF3 ranges between6.86 and 10.70 and 4 and 6.51 %, respectively, as the SPEI iscalculated for 1- to 24-month lags (the second and the third rowof Table 4, respectively). Because the spatial patterns of thethree leading EOFs do not differ essentially for various lags inthe calculation of the SPEI, only the loading patterns of theSPEI at a 1-month lag are shown, as an example, in Fig. 8. Thepattern of EOF1 is presented in Fig. 8a. Its spatial coefficientshave the same sign at all stations. These results indicate thatthe moisture variability quantified by the SPEI is influencedby large-scale factors. The spatial coefficients of EOF2separate the western and eastern halves of the country’sterritory (Fig. 8b), whereas the spatial coefficients of EOF3delimit the southern and northern parts.
Such a regionalisation roughly separates the lowlandsand the highlands and corresponds, to some extent, to theregionalisation previously used in other studies (Tolasz2007; Trnka et al. 2009a, b). In these studies, three climat-ically homogeneous regions corresponding to the altitudesbelow 400, between 401 and 700, and above 700 m (Figs. 1and 8a–c) were identified. Moreover, these regions also
correspond to the climatic classification of Quitt (1971), inwhich three main climatic regions (warm, moderate warm,and cold) were defined based on 14 climatic characteristics.
The corresponding PC1, PC2, and PC3 temporal series ofcoefficients are represented in Fig. 8d–f, respectively. Therepresentative time series of the spatially averaged SPEI-1for all 184 stations is superimposed on these graphs. ThePC1 temporal series of coefficients displays the same tem-poral evolution as the spatially averaged series of SPEI-1identifying the dry and wet years and the intensity of theirmoisture anomalies. As shown in Fig. 8d, both the magni-tudes of the PC1 series of the coefficients and of the aver-aged SPEI-1 indicate that the year 2003 was the driestduring the period 1961–2010. The periods with consecutivedry years were 1975–1976, 1981–1983, 1988–1994, 1998–2000, and 2006–2009. The similarity in the evolution of thePC1 temporal series of coefficients and of the spatiallyaveraged series of SPEI-1, together with the high percentageof variance explained by the EOF1, indicate that large-scalefactors are driving the dry and wet conditions at the countrylevel. As for the temporal evolution of PC2 and PC3, theseries of coefficients are presented in Fig. 8e, f, respectively,and are only partly in phase with the spatially averagedSPEI-1 for all 184 stations. This is understandable becausethe patterns of EOF2 and EOF3 represent the regionalcharacteristics of moisture variability quantified by SPEI-1. In addition, the percentages of variance explained byEOF2 and EOF3 are 6.86 and 4 %, respectively, which aremuch lower than that explained by EOF1. However, someperiods with consecutive dry years identified both in theaveraged SPEI-1 series and in the PC1 series of coefficientsare also captured by the PC2 and PC3 series of coefficients.These are as follows: 1975–1976, 1981–1982, and 1997–2001 for PC2 and 1975–1976 and 2004–2006 for PC3.
Similarly, the PC1 temporal series of coefficients of theSPEI at 3-, 6-, 12-, and 24-month lags were compared with
PC1 SPEI-3avgSPEI-3
1960 1970 1980 1990 2000 2010-3-2-10123 PC1 SPEI-6
avgSPEI-6
1960 1970 1980 1990 2000 2010-3-2-10123
PC1 SPEI-12avegSPEI-12
1960 1970 1980 1990 2000 2010-3-2-10123 PC1 SPEI-24
avgSPEI-24
1960 1970 1980 1990 2000 2010-3-2-10123
Fig. 9 Standardised coefficienttime series of the principalcomponent (PC1) of the SPEIat 3-, 6-, 12-, and 24-month lagsaveraged over the growingseason (April–September),together with the spatiallyaveraged series of the SPEI
Observed spatiotemporal characteristics of drought on various time scales over the Czech Republic
Author's personal copy
the corresponding spatially averaged series of the SPEI. Thegraphs represented in Fig. 9 display a good match betweenthese series. The year 2003 appears to be the driest in termsof the magnitude of PC1 and averaged SPEI at 3- and 6-month lags. In addition, the periods with consecutive dryyears are almost identical for SPEI-3 and SPEI-6. These areas follows: 1973–1976, 1981–1983, 1988–1994, and 2002–2004. As for SPEI-12 and SPEI-24, due to the increase inthe lags taken into consideration in calculating the SPEI, themoisture variability is higher and accordingly modulates thetime series behaviour. The temporal evolutions of the PC2and PC3 series of coefficients for SPEI-3, SPEI-6, SPEI-12,and SPEI-24, as in the case of SPEI-1, only partly fit withthe corresponding spatially averaged SPEI series (data notshown).
4 Summary and conclusions
This study investigated the spatiotemporal characteristics ofdrought in the Czech Republic during the growing season(April to September), as represented by the SPEI calculatedwith various lags (1, 3, 6, 12, and 24 months). The character-istics of drought were analysed both at the country level (184stations) and at the regional levels of the three regions definedby station altitude: region I (89 stations with an altitude below400 m), which is characterised by mostly intensive agricul-ture; region II (73 stations with altitudes between 401 and700 m), which is characterised by less intensive agriculture;and region III (22 stations with altitudes above 700 m), whichis mostly forested and has limited agricultural production. Ourresults provide a comprehensive assessment of drought duringthe growing season in terms of temporal and spatial evolution,regionalisation, frequency distribution, duration, tendency,and patterns of spatial and temporal variability. Most of theresults presented in this paper are in line with findings reportedin other studies and enhance the knowledge and understand-ing of drought phenomena in the Czech Republic. The mainresults are summarised as follows:
– The temporal evolution of the averaged SPEI during thegrowing season at the country level for various lags (1,3, 6, 12, and 24 months) highlights the year-by-yearmoisture characteristics of this season. The longest andmost intense dry period was 1988–1994, followed bythe periods 1972–1974, 1983–1985, and 2007–2009(according to the SPEI values at 12- and 24-monthlags). The wettest periods were 1965–1968, 1975–1982, 1986–1988, and 1996–1997. These results agreewith other studies at the European scale (Lloyd-Hughes2012; Briffa et al. 2009) and country level (Trnka et al.2009a, b; Potop et al. 2011), and update the knowledgeof drought in the Czech Republic.
– The temporal evolution of the averaged SPEI during thegrowing season for the three regions delimited by sta-tion altitude presents features similar to those identifiedat the country level. However, the main difference be-tween the regions is that the majority of extreme drymonths during the growing seasons in regions I and IIwere concentrated in spring months, whereas in regionIII, extreme dry months were concentrated in the sum-mer months. The analysis of the temporal evolution ofdrought indicates that the majority of the longest drygrowing seasons were recorded in regions I and II. As atthe country level, the number of dry (wet) growingseasons at the regional level increases as the SPEI lagincreases from 1 to 6 months in all three regions andthen slightly decreases as the SPEI lag increases from12 to 24 months.
– The spatial distribution of the frequency SPEI values atvarious lags indicates that the highest percentage ofdrought occurrence for SPEI at 1-, 3-, and 6-month lagsoccurred in the lowlands (region I), which ischaracterised by low precipitation and high evapotrans-piration. Moderate drought ranges between 6.7 and15.7 %. The occurrence of severe drought at short timescales (1 to 3 months) was detected in the lowlands ofthe Elbe River valley, central Bohemia, southernMoravia, and the lowlands of southern Bohemia. Thefrequency of severe drought ranges between 8.7 and10.3 %. On average, at the country level, the extremedrought ranges between 1.62 (for SPEI at a 3-monthlag) and 5.27 % (for SPEI at a 24-month lag), and thehighest percentage reaches 8 %. These results enhancethe current knowledge of drought in the Czech Republic.
– To provide greater insight into the duration of droughtduring the growing season, the number of dry months(SPEI≤-1) was counted for each SPEI series with vari-ous lags at each station and then averaged at the countryand regional level. The year 2003 had the most persistentdrought (5.3 months) during the growing seasonaccording to the SPEI at lags of 3 and 6 months. Thetemporal evolution of the percentage of stations with anSPEI≤-1 at various lags was another indicator of droughtextension at the country level. These indicate that droughtat shorter time scales (1- to 6-month lags) has a greaterprevalence than drought at longer time scales (12- and 24-month lags). However, during the period 1990–1993,drought at 12- and 24-month lags exhibited the largestexpansion at the country level (approximately 80% of thestations) during the growing season. The exceptionallyhot and dry year of 2003 and other extreme events of thelast few decades have been extensively analysed (Beniston2004; Fink et al. 2004; Trigo et al. 2006; Lloyd-Hughes2012) both at the European and at the country levels(Brázdil et al. 2009; Barriopedro et al. 2011). Our results
V. Potop et al.
Author's personal copy
are in line with these findings and provide greater insightsinto the complexity of these phenomena and their ancillaryeffects on various systems at the regional scale.
– The results of the non-parametric Mann–Kendall trendtest applied to the SPEI series indicated negative trends(drought) at themajority of the stations. The percentage ofstations displaying significant negative trends for the 90,95, 99, and 99.9 % confidence levels is approximately40 %. The approach we used has been (Sneyers 1990)extensively applied in other studies to detect trends intemperature and precipitation series (Caloiero et al. 2011;Coroborov et al. 2010; Longobardi and Villani 2010;Partal and Kahya 2006) and also for drought index series(Dai 2011b; Lloyd-Hughes and Saunders 2002; Rim2012). Our results complete the knowledge of droughttrends in the Czech Republic.
– The EOF analysis of the SPEI at 1-, 3-, 6-, 12-, and 24-month lags during the growing season identified pat-terns of spatial and temporal variability. These resultsupdate the knowledge on drought variability at thecountry level. The patterns of the three leading EOFsof the SPEI at various lags do not display essentialdifferences. The explained variance of EOF1 of theSPEI at various lags ranges between 66 and 56 % asthe time scale of the SPEI lag increases from 1 to24 months. These results indicate that large-scale fac-tors drive the drought conditions in the Czech Republic.Our results are in line with other studies in Europe(Ionita et al. 2012). EOF2 and EOF3 explain between7 and 11 and 4 and 7 % of the variance, respectively,when the SPEI lag increases from 1 to 24 months. Thespatial patterns of EOF2 and EOF3 for all time scales ofthe SPEI correspond to some extent to the regionalisationbased on station altitude used in this and previous studies(Tolasz 2007; Trnka et al. 2009b).
The approach to drought characterisation based on theSPEI calculated for various accumulation periods applied toa dense network of climatological stations for the period1961–2010, provides comprehensive results on the complexityof drought phenomena in the Czech Republic. The resultsemphasise that drought in the Czech Republic is part of alarger-scale phenomenon but still possesses regional character-istics, most of which being also reported in other studies oridentified in the present study. Also, the SPEI suitability for thedetection, monitoring, and assessment of drought conditionsboth at the local and regional scale is worth mentioning.
Acknowledgements The research on drought conditions in theCzech Republic was supported by S grant of MSMT CR and projects6046070901, LD11041, CZ.1.07/2.3.00/20.0248, CZ.1.07/2.4.00/31.0056, and CZ.1.05/1.1.00/02.0073 (CzechGlobe—Centre for Glob-al Climate Change Impacts Studies, Reg. No.) and National Agency forAgriculture Research project Q191C054.
References
Alexandersson A (1986) A homogeneity test applied to precipitationdata. J Climatol 6:661–675
Alexandersson A (1995) Homogenity testing, multiple breaks andtrends. In: Proc. 6th Int. Meeting on Stat. Climatology, Galway,Ireland, pp. 439–441
Barriopedro D, Fischer EM, Luterbacher J, Trigo RM, García-HerreraR (2011) The hot summer of 2010: redrawing the temperaturerecord map of Europe. Science 8:220–224
Barlow M, Cullen H, Bradfield L (2002) Drought in Central andSouthwest Asia: La Nińa, the warm pool, and Indian Oceanprecipitation. J Clim 15:697–700
Beguería S, Vicente-Serrano SM, Angulo M (2010) A multi-scalarglobal drought data set: the SPEIbase: a new gridded productfor the analysis of drought variability and impacts. Bull AmMeteorol Soc 91:1351–1354
Beniston M (2004) The 2003 heat wave in Europe: a shape ofthings to come? An analysis based on Swiss climatological data andmodel simulations. Geophys Res Lett 31:L02202. doi:10.1029/2003GL018857
Bordi I, Fraedrich K, Sutera A (2009) Observed drought and wetnesstrends in Europe: an update. Hydrol Earth Syst Sci 13:1519–1530
Brázdil R, Trnka M, Dobrovolný P, Chroma K, Hlavinka P, Žalud Z(2009) Variability of droughts in the Czech Republic, 1881–2006.Theor Appl Climatol 97:297–315
Bravar L, Kavvas ML (1991) On the physics of drought. I. A concep-tual framework. J Hydrol 129:281–297
Briffa KR, van der Schrier G, Jones PD (2009) Wet and dry summersin Europe since 1750: evidence of increasing drought. Int JClimatol 29:1894–1905
Busuioc A, Dumitrescu A, Soare E, Orzan A (2007) Summer anoma-lies in 2007 in the context of extremely hot and dry summers inRomania. Roman J Meteorol 9:1–17
Caloiero T, Coscarelli R, Ferrari E, Mancini M (2011) Trend detectionof annual and seasonal rainfall in Calabria (Southern Italy). Int JClimatol 31:44–56
Cindrić K, Pasarić Z, Gajić-Čapka M (2010) Spatial and temporalanalysis of dry spells in Croatia. Theor Appl Climatol 102:171–184
Corobov R, Sheridan S, Overcenco A, Terinte N (2010) Air tempera-ture trends and extremes in Chisinau (Moldova) as evidence ofclimate change. Clim Res 42:247–256
Chiew FHA, Piechota TC, Dracup JA, McMahon TA (1998) El NińoSouthern Oscillation and Australian rainfall, streamflow anddrought—links and potential for forecasting. J Hydrol 204(1–4):138–149
Dai A (2011a) Drought under global warming: a review. WileyInterdiscip Rev Clim Chang 2:45–65
Dai A (2011b) Characteristics and trends in various forms of thePalmer Drought Severity Index during 1900–2008. J GeophysRes 116:D12115. doi:10.1029/2010JD015541
Dubrovsky M, Svoboda MD, Trnka M, Hayes MJ, Wilhite DA, ZaludZ, Hlavinka P (2008) Application of relative drought indices inassessing climate-change impacts on drought conditions inCzechia. Theor Appl Climatol 96:155–171
Easterling DR, Peterson TC (1995) A new method for detecting un-documented discontinuities in climatological time series. Int JClimatol 15:369–377
Estrela MJ, Penarrocha D, Millan M (2000) Multi-annual droughtepisodes in the Mediterranean (Valencia region) from 1950–1996. A spatio-temporal analysis. Int J Climatol 20:1599–1618
Fink AH, Brücher T, Krüger A, Leckebusch GC, Pinto JG, Ulbrich U(2004) The 2003 European summer heatwaves and drought: syn-optic diagnosis and impact. Weather 59:209–216
Observed spatiotemporal characteristics of drought on various time scales over the Czech Republic
Author's personal copy
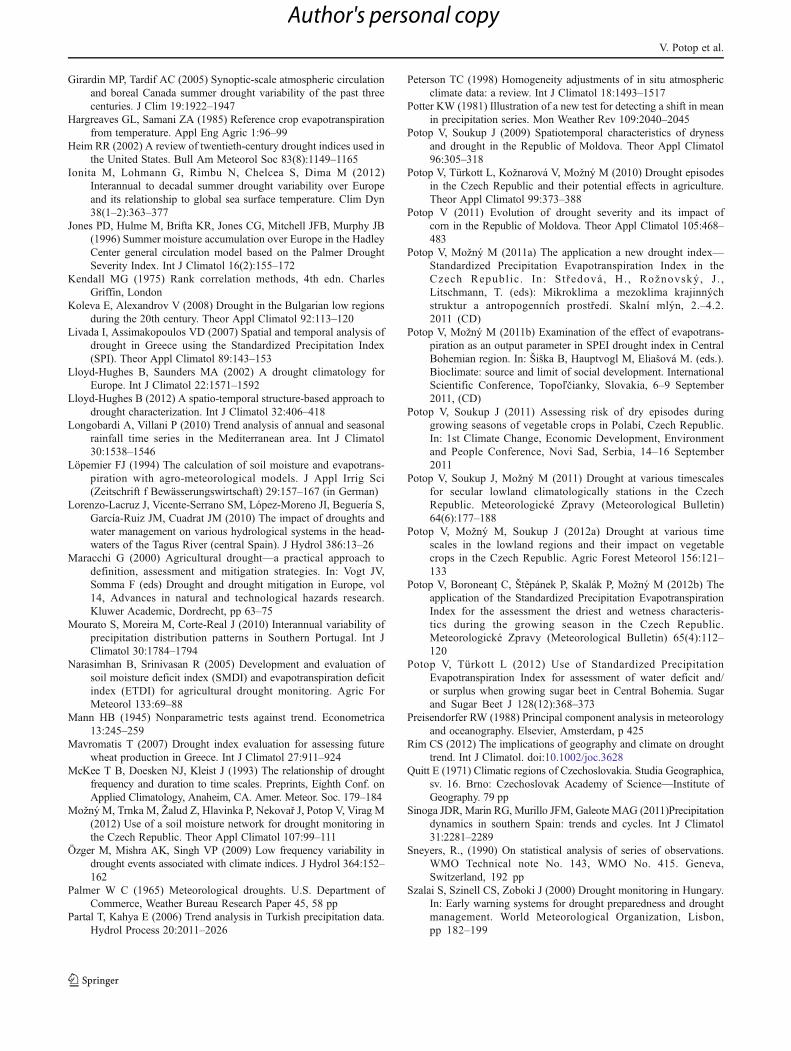
Girardin MP, Tardif AC (2005) Synoptic-scale atmospheric circulationand boreal Canada summer drought variability of the past threecenturies. J Clim 19:1922–1947
Hargreaves GL, Samani ZA (1985) Reference crop evapotranspirationfrom temperature. Appl Eng Agric 1:96–99
Heim RR (2002) A review of twentieth-century drought indices used inthe United States. Bull Am Meteorol Soc 83(8):1149–1165
Ionita M, Lohmann G, Rimbu N, Chelcea S, Dima M (2012)Interannual to decadal summer drought variability over Europeand its relationship to global sea surface temperature. Clim Dyn38(1–2):363–377
Jones PD, Hulme M, Brifta KR, Jones CG, Mitchell JFB, Murphy JB(1996) Summer moisture accumulation over Europe in the HadleyCenter general circulation model based on the Palmer DroughtSeverity Index. Int J Climatol 16(2):155–172
Kendall MG (1975) Rank correlation methods, 4th edn. CharlesGriffin, London
Koleva E, Alexandrov V (2008) Drought in the Bulgarian low regionsduring the 20th century. Theor Appl Climatol 92:113–120
Livada I, Assimakopoulos VD (2007) Spatial and temporal analysis ofdrought in Greece using the Standardized Precipitation Index(SPI). Theor Appl Climatol 89:143–153
Lloyd-Hughes B, Saunders MA (2002) A drought climatology forEurope. Int J Climatol 22:1571–1592
Lloyd-Hughes B (2012) A spatio-temporal structure-based approach todrought characterization. Int J Climatol 32:406–418
Longobardi A, Villani P (2010) Trend analysis of annual and seasonalrainfall time series in the Mediterranean area. Int J Climatol30:1538–1546
Löpemier FJ (1994) The calculation of soil moisture and evapotrans-piration with agro-meteorological models. J Appl Irrig Sci(Zeitschrift f Bewässerungswirtschaft) 29:157–167 (in German)
Lorenzo-Lacruz J, Vicente-Serrano SM, López-Moreno JI, Beguería S,García-Ruiz JM, Cuadrat JM (2010) The impact of droughts andwater management on various hydrological systems in the head-waters of the Tagus River (central Spain). J Hydrol 386:13–26
Maracchi G (2000) Agricultural drought—a practical approach todefinition, assessment and mitigation strategies. In: Vogt JV,Somma F (eds) Drought and drought mitigation in Europe, vol14, Advances in natural and technological hazards research.Kluwer Academic, Dordrecht, pp 63–75
Mourato S, Moreira M, Corte-Real J (2010) Interannual variability ofprecipitation distribution patterns in Southern Portugal. Int JClimatol 30:1784–1794
Narasimhan B, Srinivasan R (2005) Development and evaluation ofsoil moisture deficit index (SMDI) and evapotranspiration deficitindex (ETDI) for agricultural drought monitoring. Agric ForMeteorol 133:69–88
Mann HB (1945) Nonparametric tests against trend. Econometrica13:245–259
Mavromatis T (2007) Drought index evaluation for assessing futurewheat production in Greece. Int J Climatol 27:911–924
McKee T B, Doesken NJ, Kleist J (1993) The relationship of droughtfrequency and duration to time scales. Preprints, Eighth Conf. onApplied Climatology, Anaheim, CA. Amer. Meteor. Soc. 179–184
Možný M, Trnka M, Žalud Z, Hlavinka P, Nekovař J, Potop V, Virag M(2012) Use of a soil moisture network for drought monitoring inthe Czech Republic. Theor Appl Climatol 107:99–111
Özger M, Mishra AK, Singh VP (2009) Low frequency variability indrought events associated with climate indices. J Hydrol 364:152–162
Palmer W C (1965) Meteorological droughts. U.S. Department ofCommerce, Weather Bureau Research Paper 45, 58 pp
Partal T, Kahya E (2006) Trend analysis in Turkish precipitation data.Hydrol Process 20:2011–2026
Peterson TC (1998) Homogeneity adjustments of in situ atmosphericclimate data: a review. Int J Climatol 18:1493–1517
Potter KW (1981) Illustration of a new test for detecting a shift in meanin precipitation series. Mon Weather Rev 109:2040–2045
Potop V, Soukup J (2009) Spatiotemporal characteristics of drynessand drought in the Republic of Moldova. Theor Appl Climatol96:305–318
Potop V, Türkott L, Kožnarová V, Možný M (2010) Drought episodesin the Czech Republic and their potential effects in agriculture.Theor Appl Climatol 99:373–388
Potop V (2011) Evolution of drought severity and its impact ofcorn in the Republic of Moldova. Theor Appl Climatol 105:468–483
Potop V, Možný M (2011a) The application a new drought index—Standardized Precipitation Evapotranspiration Index in theCzech Republ ic. In: Středová, H., Rožnovský, J . ,Litschmann, T. (eds): Mikroklima a mezoklima krajinnýchstruktur a antropogenních prostředí. Skalní mlýn, 2.–4.2.2011 (CD)
Potop V, Možný M (2011b) Examination of the effect of evapotrans-piration as an output parameter in SPEI drought index in CentralBohemian region. In: Šiška B, Hauptvogl M, Eliašová M. (eds.).Bioclimate: source and limit of social development. InternationalScientific Conference, Topoľčianky, Slovakia, 6–9 September2011, (CD)
Potop V, Soukup J (2011) Assessing risk of dry episodes duringgrowing seasons of vegetable crops in Polabí, Czech Republic.In: 1st Climate Change, Economic Development, Environmentand People Conference, Novi Sad, Serbia, 14–16 September2011
Potop V, Soukup J, Možný M (2011) Drought at various timescalesfor secular lowland climatologically stations in the CzechRepublic. Meteorologické Zpravy (Meteorological Bulletin)64(6):177–188
Potop V, Možný M, Soukup J (2012a) Drought at various timescales in the lowland regions and their impact on vegetablecrops in the Czech Republic. Agric Forest Meteorol 156:121–133
Potop V, Boroneanţ C, Štěpánek P, Skalák P, Možný M (2012b) Theapplication of the Standardized Precipitation EvapotranspirationIndex for the assessment the driest and wetness characteris-tics during the growing season in the Czech Republic.Meteorologické Zpravy (Meteorological Bulletin) 65(4):112–120
Potop V, Türkott L (2012) Use of Standardized PrecipitationEvapotranspiration Index for assessment of water deficit and/or surplus when growing sugar beet in Central Bohemia. Sugarand Sugar Beet J 128(12):368–373
Preisendorfer RW (1988) Principal component analysis in meteorologyand oceanography. Elsevier, Amsterdam, p 425
Rim CS (2012) The implications of geography and climate on droughttrend. Int J Climatol. doi:10.1002/joc.3628
Quitt E (1971) Climatic regions of Czechoslovakia. Studia Geographica,sv. 16. Brno: Czechoslovak Academy of Science—Institute ofGeography. 79 pp
Sinoga JDR, Marin RG, Murillo JFM, Galeote MAG (2011)Precipitationdynamics in southern Spain: trends and cycles. Int J Climatol31:2281–2289
Sneyers, R., (1990) On statistical analysis of series of observations.WMO Technical note No. 143, WMO No. 415. Geneva,Switzerland, 192 pp
Szalai S, Szinell CS, Zoboki J (2000) Drought monitoring in Hungary.In: Early warning systems for drought preparedness and droughtmanagement. World Meteorological Organization, Lisbon,pp 182–199
V. Potop et al.
Author's personal copy
Senay GB, Budde MB, Brown JF, Verdin JP (2008) Mapping flashdrought in the US: Southern Great Plains. In: 22nd Conference onHydrology, AMS, New Orleans, LA
Štěpánek P, Zahradníček P, Skalák P (2009) Data quality control andhomogenization of air temperature and precipitation series in thearea of the Czech Republic in the period 1961–2007. Adv Sci Res3:23–26
Štěpánek P (2010) ProClimDB—software for processing climatologicaldatasets. CHMI, regional office Brno. http://www.climahom.eu/ProcData.html
Tallaksen LM (2000) Streamflow drought frequency analysis. In:Vogt JV, Somma F (eds.) Drought and drought mitigation inEurope—advances in natural and technological hazards re-search, vol. 14. Kluwer, Dordrecht, pp. 103–117
Thornthwaite CW (1948) An approach toward a rational classificationof climate. Geogr Rev 38:55–94
Tolasz R (ed) (2007) Atlas podnebí Česká. Climate Atlas of Czechia.ČHMÚ, Univerzita Palackého v Olomouci, Praha-Olomouc, 254 p
Trenberth KE (2011) Changes in precipitation with climate change.Clim Res 47:123–138
Trigo RM, Pereira JMC, Pereira MG, Mota B, Calado TJ, DacamaraCC, Santo FE (2006) Atmospheric conditions associated with theexceptional fire season of 2003 in Portugal. Int J Climatol26:1741–1757
Trnka M, Kysely J, Možný M, Dubrovský M (2009a) Changes inCentral-European soil-moisture availability and circulation pat-terns in 1881–2005. Int J Climatol 29(5):655–672
Trnka M, Dubrovský M, Svoboda MD, Semeradová D, Hayes MJ,Žalud Z, Wilhite DA (2009b) Developing a regional drought
climatology for the Czech Republic for 1961–2000. Int J Climatol29:863–883
van der Schrier G, Jones PD, Briffa KR (2011) The sensitivity of thePDSI to the Thornthwaite and Penman-Monteith parameteriza-tions for the potential evapotranspiration. J Geophys Res 116,D03106
von Storch H (1995) Spatial patterns: EOFs and CCA. In: VonStorch H, Navarra A (eds) Analysis of climate variability:application of statistical techniques. Springer, New York, pp 227–258
Vicente-Serrano SM, Beguería S, López-Moreno JI (2010) Amulti-scalardrought index sensitive to global warming: the StandardizedPrecipitation Evapotranspiration Index—SPEI. J Clim 23(7):1696–1718
Vicente-Serrano SM, Beguería S, López-Moreno JI (2011) Commenton “Characteristic and trends in various forms on the PalmerDrought Severity Index (PDSI) during 1900–2008” by AiguoDai. J Geogr Res 116, D19112
Vicente-Serrano SM, Beguería S, Eklundh L, Gimeno G, Weston D,Kenawy AE, López-Moreno JI, Nieto R, Ayenew T, Konte D,Ardö J, Pegram GGS (2012) Challenges for drought mitigation inAfrica: the potential use of geospatial data and drought informa-tion systems. Appl Geogr 34:471–486
Wells N, Goddard S, Hayes MJ (2004) A Self-calibrating PalmerDrought Severity Index. J Clim 17:2335–2351
Wilhite DA, Svoboda MD, Hayes MJ (2007) Understanding thecomplex impacts of drought: a key to enhancing droughtmitigation and preparedness. Water Resour Manag 21(5):763–774
Observed spatiotemporal characteristics of drought on various time scales over the Czech Republic
Author's personal copy