= total long term load/shareholders’ fund = shareholders ... vi - ar 7615 - sapm.pdf · iv....
TRANSCRIPT

Model Answer / Suggested Solution
Code AR 7615 Subject: Security Analysis and Portfolio Management
Q.1. Short Answered Questions
i. The deviation from the Arithmetic Mean from the following figures through
graphic presentation:
45, 44, 40, 45, 50, 35, 30, 42, 43 and 46
Average of given numbers=420/10=42
ii. Debt-Equity Ratio = total long term load/shareholders’ fund
=25,000/(60,000+20,000+10,000)
=25,000/90,000 = 1:3.6
Proprietary Ratio = Shareholders’ fund/total assets
= 90,000/1,50,000 = 1:1.67
iii. When a person invests his funds for the acquisition of some financial assets like
shares, debentures, insurance policies, mutual fund units etc, such investments
are known as financial investments.
When a person invests his funds for the acquisition of some physical assets, say
a building or equipment, such types of investments are called economic
investments. Economic investment can be defined as the investment that
contributes to the net additions to the capital stock of society.
0
10
20
30
40
50
60
1 2 3 4 5 6 7 8 9 10
Arithmatic Mean
Actual Value

iv. Components of risks:
For the purpose of better analysis and understanding, the total risks in an
investment can be split into two types, viz. systematic and unsystematic risk.
Total risk = Systematic risk + Unsystematic risk
Systematic risk is that risk that is caused by caused by system-wide factors.
Changes in economic conditions, changes in political system, changes in social
system etc., are some factors that affect the entire community. These are called
system-wide factors.
Systematic risk can be divided into the following three sub heads:
Market risk, Interest rate risk and Purchasing power risks
Unsystematic risk is caused by factors specific to the company issuing securities.
In other words, unsystematic risk is caused by ‘firm-specific’ factors.
Unsystematic risk is unique to companies to companies and differs from one
company to another.
The unsystematic risk, which is caused due to firm-specific factors, can be
classified into two types, viz. Business risk and Financial risk.
v. Porter Model:
Michael Porter identified the following five factors as the essential factors
required for the sustenance of an industry. He puts forth that profit required for
the sustenance of an industry. He puts forth that the profit potential of an
industry depends on the combined strength of these five factors.
a. Threat of new entrant
b. Rivalry among the existing firms
c. Pressure from substitute products
d. Bargaining power of buyers
e. Bargaining power of suppliers

vi. Leverage Ratios: Leverage ratios represent the nature of capital structure of a
company. Leverage ratios indicate the long term solvency of a company, i.e.,
the ability of the company to service long-term debts.
The following are some of the Leverage Ratios:
Debt Equity Ratio
Total Debt to Total Assets Ratio
Proprietary Ratio
Interest Coverage Ratio
vii. DOW Theory: According to Dow Theory the prices of securities in the stock
market do not move at random, but more in cyclical pattern influenced by three
distinct cyclical trends. DOW observed that the price of most stocks move in
accordance with the movement of the market. When the market goes up, the
price of most stocks also go up and vice-versa. Hence, before attempting to
predict the price movement of a particular security, the behavior of the market
Substitute
products
Buyers
Rivalry
among
existing firms
in an industry Suppliers
Bargaining
power of
suppliers
New Entrants
Threat from
new entrants
Bargaining
power of
buyers
Pressure from
substitute products
Figure: Porter Model

as a whole is to be studied and understood. Dow theorized that the trend of
overall stock prices could be determined by studying the price movements of a
selected group of stocks. To understand the behavior of the market, Dow
constructed two indices calling them as Industrial Average and Rail Average.
The industrial average is known by the name DOW-Jones Industrial Average
(DJIA).
The DJIA is a price-weighted average of 30 large, well-known industrial stocks
that are generally the leaders in their industry and are listed on the New York
Stock Exchange. By the time the index was built by Charles H. DOW there
were 15 stocks included in the index which was later expanded to 30.
The Rail Average was built with 12 rail road stocks. The Rail Average was
intended to serve as a representative index for transportation stocks. With the
evolution of joint stock companies of other modes of transportation, the Rail
Average was latter modified as the Transportation Average incorporating
addition of stocks of transportation companies of other modes than Rail road
mode and the index later came to be known as DOW-Jones Transportation
Average (DJTA).
viii. Triangle:
The wedge is formed after the arrival of some information about the scrip in
the market. The commencement of wedge formation means that the market has
started to react on the basis of information received. However, to start with,
there used to be greater uncertainty about the validity as well as the influence of
the information on the performance of the company. As the time progresses, the
information received and its impact are better assimilated by the market and the
uncertainty gradually gets reduced. This is reflected in the formatting triangle
from wedge. Finally when the uncertainty is resolved, the resistance and support
boundaries intersect. Following figures show the formation of a triangle pattern
from a wedge pattern.
Pri
ce
Time
Pri
ce
Time
Pri
ce
Time
Pri
ce
Time
Pri
ce
Time
Pri
ce
Time
ix. Semi Strong form Efficiency:
Semi strong form of the efficiency market hypothesis holds that the current stock
prices not only reflect all known information with regard to past stock prices
and their movements but also reflect all publicity available information about
the company, whose stocks are being studied.
The following are some of the publicly available information:
Latest corporate annual reports.
Expectations regarding future annual reports with regard to changes in sales,
earnings, dividends, capital structure etc.
Company announcements of forthcoming dividends, stock splits etc.
Press releases
Charges in Government policies that will affect/improve the prospects of the
company.
x. Optimal Portfolio: All the portfolios that lie on the efficient frontier are efficient
portfolios and rational investors opt to invest only in such efficient portfolios.
The particular portfolio that an investor will select from among the efficient
portfolios depends upon the degree of risk that investor prefers to bear. An
investor who is highly averse to risk may prefer the global minimum variance
portfolio. An investor who is prepared to take the maximum risk will prefer to
choose the portfolio represented by the top most point in the Efficient Frontier
curve. Investors who opt for moderate risk will choose any portfolio that lie on
the Efficient Frontier between the starting and end point of the effective frontier,
depending on their risk bearing capacity.
Q.2. Investment Avenues:
There are many investment avenues available for investors. The investment
avenues differ in their risk-return characteristics. The investment avenues with higher
level of risk offer higher returns while the avenues with minimum level of risk offer
lower return. There is nothing such as a bad investment. A good investment can
become a bad if not handled properly. The term good and bad for investments is
relative to the investor and his expectation for returns. Everyone would like to earn a
fortune out of their investments but it is impossible to do so without facing risk; risk
of losing one's hard earned money. Investments are made to meet specific financial
goals and one wrong step could take one’s plan back over years.

Modern investment theory states that - 'High risk, High returns; Low risk, low
returns'. This gives the possibility of high returns on high risk, not the guarantee of
high returns as there are chances of high potential losses also. Hence, before investing
a person needs have to be certain about his risk bearing capacity and various
investment options to suit his financial condition, risk tolerance, life situation and
financial goals. It is important to balance the risk and return while investing to
achieve a trade off. If a person’s investments are giving him too much anxiety, it
cannot be termed as a balanced investment. Risks cannot be totally isolated from
investments, but the amount of risk associated with a particular investment should be
acceptable. Acceptable risk means managing and controlling risk and returns so that
the returns are maximized and risk minimized.
One of the basic rules of investing is to make diversified investments. This is the
best method to spread the risk across various investments instead of concentrating it at
a single place. Sometimes, losses in a particular investment are offset against the
profits from other investments in a diversified portfolio. Diversification of
investments means investing in different high risk as well as risk free instruments to
reduce the inherent risk in a particular investment. The proportion of investment in
different risk bearing securities depends on the risk tolerance of a person. A young
earning individual can put more in risky instruments while an old age person can keep
more amounts in fixed income securities. There is no thumb rule that specifies the
percentages of investments in different securities; it is relative to the person investing.
There are a variety of financial and non financial instruments to choose from for
investing. On the basis of risk involved these can be classified as -
The major investment avenues available for investment can be broadly classified into
two categories as below:
Ownership Securities
Creditorship Securities
Ownership Securities:
Ownership securities are of two types, viz.

Equity Shares
Preference Shares
(Students are supposed to discuss these points with their advantages and disadvantages)
Creditorship Securities:
While ownership securities represent the equity capital, creditorship securities represent
the debt capital of company. Debentures and Bonds are the creditorship securities.
Debentures
Bonds
(Students are supposed to discuss these points with their advantages and disadvantages)
Q.3. Economy Analysis
Return assumptions for the stock and bond markets and sales, cost, and profit
projections for industries and nearly all companies necessarily embody economic
assumptions. Investors are concerned with those forces in the economy which affect
the performance of organization in which they wish to participate, through purchase
of stock. By identifying key assumptions and variables, we can monitor the economy
and gauge the implications of new information on our economic outlook and industry
analysis. In order to beat the market on a risk adjusted basis, the investor must have
forecasts that differ from the market consensus and must be correct more often than
not.
Economic trends can take two basic forms: cyclical changes that arise from ups
and downs of the business cycle, and structural changes that occur when the economy
is undergoing a major change in how it functions. Some of the broad forces which
impact the economy are:
a. Agriculture
b. Population
c. Interest rate
d. Natural resources
e. Government policies/ Government spending, revenues
f. Foreign trade, balance of payments and exchange rate
g. Inflation
h. National income
i. Demographic factors
j. Stability of government
k. Level of savings
l. Infrastructural facilities
m. Research and development activities.
(Students are supposed to discuss these points briefly)
Q.4. Limitations of Markowitz Model:
The analysis as done by Markowitz require a large number of data
inputs and involve lengthily / complex computations. The complexity
increases as the number of available securities increases. If there are ‘N’
securities available for investment, the data inputs required for analyzing the
risk-return relationship of the portfolio containing the ‘N’ securities are as
under:
No. of return estimates from securities = N
No. of variance estimates from securities = N
No. of covariance estimates from securities = N (N -1)/2
Hence,
Total no. of data inputs = 2N + N(N-1)/2
Suppose 50 securities are available for investment. The number of data
inputs required is 122500. Thus, the identification of efficient portfolios on the
basis of Markowitz’s model has found little use in practical applications only
if the data inputs required are considerably reduced and the process of
calculation is simplified. In this regard, William Sharp developed a simplified
variant of the Markowitz model.
Sharp Single Index Model:
William Sharp developed a simplified variant of the Markowitz model.
This model reduces the data inputs and computational requirements

considerably and thus overcome the practical difficulties encountered by
average investors in the application of Markowitz model.
Sharp single index model has its name because it relies on a single
index that represents the security market. Instead of comparing each security
with every other available security, each security is compared only with the
market index. In other words, the return from each security is compared only
with the market return. The market index may be any widely accepted index
like the BSE index in India. Sharpe suggested that the relationship of each
security with the market index gives reasonably accurate information about
that security and that it is needless to study the relationship of each security
with every other security.
Sharpe gave the following relationship for arriving at the expected return from
a security.
Ri = i + i Rm + ei
Where
Ri = expected return of security ‘i'
i = component of return from security ‘I’ that is independent of the
performance of the market (Alpha coefficient of security)
i = a constant that measure the expected change in Ri for a given change in
Rm(Beta coefficient of security)
Rm= rate of return on the market index
ei = error term representing the residual return
According to Sharpe, fluctuation in the value of a stock relative to the value of
another stock depends on the correlation between each security return with a
security market index.
The error term ‘ei' is the unexpected return resulting from influences not
identified by the model. Sharpe observed that in the long run (i.e., when more
and more number of securities are analysed) the value of ‘ei’ terms out to be
zero. In other words + ei and - ei cancel out and hence the formula can be
simplified as,
Ri = i + i Rm
i.e.,
Return from a security = ‘’ of the security + [‘’ of the security x market
return]
Q.5. TECHNICAL ANALYSIS
Technical analysis has an important bearing on the study of price behavior and
has its own method in predicating significant price behavior.
Technical analysis is probably the most controversial aspect of investment
management. That technical analysis is a delusion, that it can never be more
useful in predicating stock performance than examining the insides of a dead
sheep, in the ancient Greek traditions. Technical analysis involves a study of
market generated data like prices and volumes to determine the future direction of
price movement. Martin J. Pring explains as “The technical approach to investing
is essentially a reflection of the idea that prices move in trends which are
determined by the changing attitudes of investors toward a variety of economic,
monetary, political and psychological forces. The art of technical analysis-for it is
an art-is to identify trend changes at an early stage and to maintain an investment
posture until the weight of the evidence indicates that the trend has been reversed.
Limitations of Technical Analysis:
The arguments against the technical analysis are,
i. Most technical analysts are not able to offer convincing explanations for the tools
employed by them.
ii. Empirical evidence in support of the random-walk hypothesis casts its shadow over
the usefulness of technical analysis.
iii. By the time an uptrend or downtrend may have been signaled by technical analysis, it
may already have taken place.
iv. Ultimately, technical analysis must be self-defeating proposition. As more and more
people employ it, the value of such analysis tends to decline.
v. The numerous claims that have been made for different chart patterns are simply
untested assertions.

vi. There is a great deal of ambiguity in the identification of configurations as well as
trend lines and channels on the charts. The same chart can be interpreted differently.
Differences between Technical Analysis and Fundamental Analysis
The key differences between technical analysis and fundamental analysis are as
follows:
i. Technical analysis mainly seeks to predict short –term price movements, whereas
fundamental analysis tries to establish long term values.
ii. The focus of technical analysis is mainly on internal market data, particularly price
and volume data. The focus of fundamental analysis is on fundamental factors relating
to the economy, the industry, and the firm.
iii. Technical analysis appeals mostly to short-term traders, whereas fundamental analysis
appeals primarily to long-term investors.
(These points are expected from the students; change in description may be accepted)
Q.6. Markowitz efficient frontier:
The efficient frontier is a concept in modern portfolio theory introduced by Harry
Markowitz and others. A combination of assets, i.e. a portfolio, is referred to as
"efficient" if it has the best possible expected level of return for its level of risk
(usually proxied by the standard deviation of the portfolio's return). Here, every
possible combination of risky assets, without including any holdings of the risk-free
asset, can be plotted in risk-expected return space, and the collection of all such
possible portfolios defines a region in this space. The upward-sloped (positively-
sloped) part of the left boundary of this region, a hyperbola, is then called the
"efficient frontier". The efficient frontier is then the portion of the opportunity set that
offers the highest expected return for a given level of risk, and lies at the top of the
opportunity set or the feasible set. For further detail see modern portfolio theory.
Dominance of Efficient frontier:
If we draw Loci of all possible combinations of a portfolio starting from two
securities to ‘n’ securities, the number of curves will be too many with the result we
will get an entire region as a feasible region for investment.

The many points in the feasible region represent the feasible set of portfolios in which
an investor can possibly invest. This set of feasible portfolios is called the portfolio
opportunity set.
It may be noted that if there are ‘n’ securities available in the market for investment, it
is not necessary (and not practical) for an investor to invest in all the ‘n’ securities. He
may choose a handful of securities that are acceptable to him and construct a
portfolio. However, the extreme situation of choosing all the ‘n’ securities can also be
not ruled out, since this is also a feasible portfolio theoretically. Thus, the portfolio set
will consist of all feasible combination of the available security. Every point in the
feasible region corresponds to a particular portfolio (containing a few securities) that
has its own risk-return characteristics. Looking at the feasible region we find that the
locus EF (which is called the Efficient Frontier) dominates all the other portfolios in
the regions.
Q.7. Security – A
(xi) P(xi) xi p(xi) Expected
return ̅
x - ̅ (x - ̅)2
p(xi).(x - ̅)2
15 0.50 7.50 }
16.80
- 1.80 3.24 1.620
17 0.20 3.40 0.20 0.04 0.008
19 0.10 1.90 2.20 4.84 0.484
20 0.20 4.00 3.20 10.24 2.048
∑
16.80 2 4.160
Expected return = 16.80%
Variance of the expected return ( 2) = 4.16
Standard deviations of the expected = √
= 2.04

Security – B
(xi) P(xi) xi p(xi) Expected
return ̅
x - ̅ (x - ̅)2
p(xi).(x - ̅)2
15 0.60 7.20 }
16.80
- 4.80 23.04 13.824
17 0.20 4.00 3.20 10.24 2.048
19 0.10 2.20 5.20 27.04 2.704
20 0.20 3.40 17.20 295.84 29.584
∑
16.80 2 48.160
Expected return = 16.80%
Variance of the expected return ( 2) = 48.16
Standard deviations of the expected = √
= 6.94
Though the expected return from the two securities is the same, the Standard
Deviations of the return from security B is higher than that of security A. Hence security ‘A’
shows lesser risk.
Q.8.
Day Closing price EMA (Exponential
Moving Average)
(1) (2) (3)
1 90 90.00
2 95 91.67
3 94 92.45
4 96 93.63
5 100 95.75
6 98 96.50
7 96 96.33
8 95 95.89
9 97 96.26
10 100 97.51
11 102 99.00
12 100 99.33
13 99 99.22
14 98 98.81
15 96 97.87
16 94 96.58
17 90 94.39
18 95 94.59
19 98 95.73
20 100 97.15
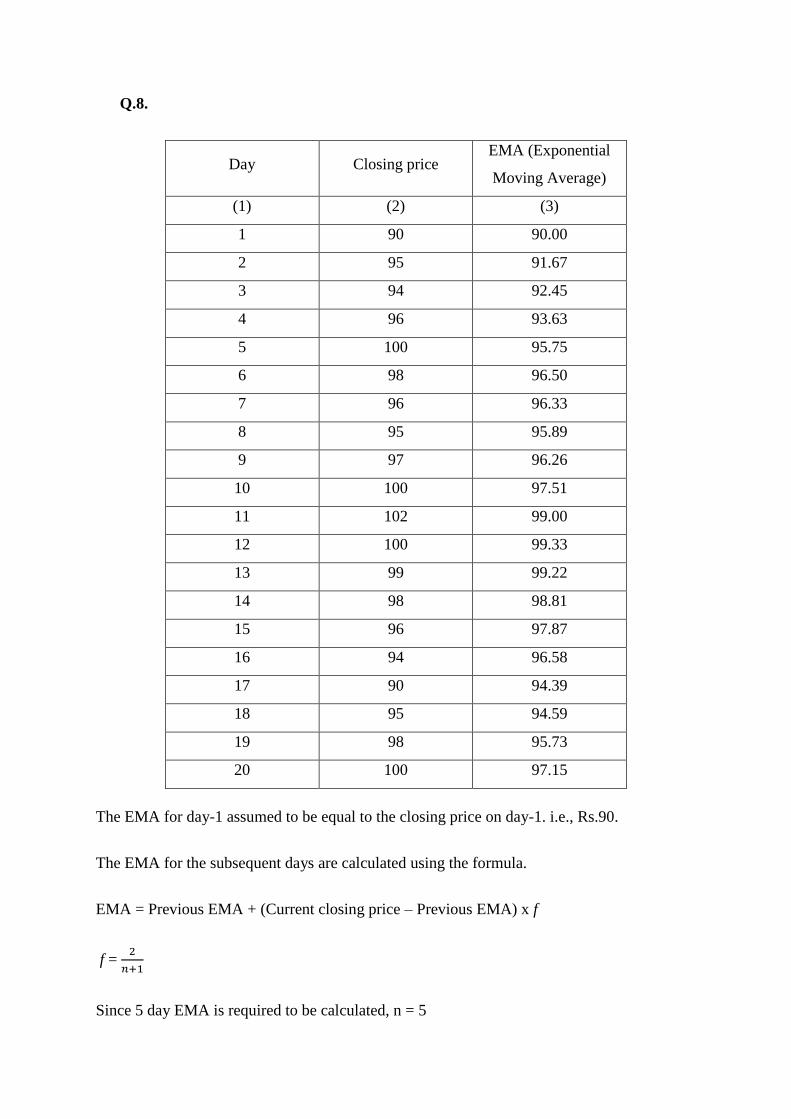
The EMA for day-1 assumed to be equal to the closing price on day-1. i.e., Rs.90.
The EMA for the subsequent days are calculated using the formula.
EMA = Previous EMA + (Current closing price – Previous EMA) x f
f =
Since 5 day EMA is required to be calculated, n = 5
f =
= 0.333
EMA (for day 2) = 90 + (95-90) x 0.333 = 91.67
EMA (for day 2) = 90 + (95-90) x 0.333 = 92.45
EMA (for day 2) = 90 + (95-90) x 0.333 = 93.63
………………………………………………….. and so on.
The EMA for all the other days have been calculated and entered in the table.
Prepared By:
Dr. Shishir Pandey
Assistant Professor
Department of Commerce
Guru Ghasidas
Vishwavidyalaya, Bilaspur, C.G.