understanding the financial short comings. impact on village finances
TRANSCRIPT

VILLAGE OF BRADFORD FINANCIAL REPORT

Meeting Objectives

Meeting Objectives
Understanding the financial short comings.

Meeting Objectives
Understanding the financial short comings.
Impact on Village finances.

Meeting Objectives
Understanding the financial short comings.
Impact on Village finances. Options to assist in financial relief.

Village Funds
• General

Village Funds
• General • Street

Village Funds
• General • Street • State Highway

Village Funds
• General • Street • State Highway• Fire Levy

Village Funds
• General • Street • State Highway• Fire Levy• Street Light

Village Funds
• General • Street • State Highway• Fire Levy• Street Light • Water

Village Funds
• General • Street • State Highway• Fire Levy• Street Light • Water• Sewer

Village Funds
• General • Street • State Highway• Fire Levy• Street Light • Water• Sewer • Refuse

Village Funds
• General • Street • State Highway• Fire Levy• Street Light • Water• Sewer • Refuse• Agency Bond

Where does the money come from that supports the
Funds?

General Fund11 Revenue Sources
• Real Estate Taxes – 9.53%• Tangible Intangible - .38% • Local Government – 27.65% • Cigarette Tax - .02%• Liquor Permits - .7%• Tax Zoning Permit - .1%• State Income Taxes - .6% • Reimbursable / Refunds - .16% • Interest - .48% • Other – 6.83%• Local Income Tax – 53.55%

Street Fund
• Street Levy – 61.2%• License Fees – 5.8%• Gasoline Taxes – 27.3%• Sidewalk Assessments –
5.7%

State Highway
• License Fees – 83%• Gasoline Taxes – 17%

Fire Levy
• Based on current Fire Levy in effect.
• Money received within this fund is transferred to Fire Department.

Street Light
• Special assessment to the property taxes – 100%

Water, Sewer and Refuse
• Water from utility billing – 100%
• Sewer from utility billing – 100%
• Refuse from utility billing – 100%

GENERAL FUND

UNDERSTANDING THE MAJOR COMPONENTS OF
GENERAL FUND

Understanding the Major Components of General Fund(Revenue)
Two largest contributors are Local Government funds and Village income taxes.

Understanding the Major Components of General Fund(Revenue)
Local Government Fund and Income Taxes Account for 82% of Revenue in General Fund.

Information to Understand
In 2011 The State reduced Local Government Revenue by 25% with an additional 50% expected for 2012 and beyond.

Information to Understand
In 2011 The State reduced Local Government Revenue by 25% with an additional 50% expected for 2012 and beyond.
An income tax revenue decline is evident due to the struggling economy.

Information to Understand
In 2011 The State reduced Local Government Revenue by 25% with an additional 50% expected for 2012 and beyond.
An income tax revenue decline is evident due to the struggling economy.
We cannot transfer from other funds into the General Fund, unless a court order is granted.

Local Income Taxes Past Five Years
2006 - $197,244.09

Local Income Taxes Past Five Years
2006 - $197,244.09 2007 - $225,090.91

Local Income Taxes Past Five Years
2006 - $197,244.09 2007 - $225,090.91 2008 - $261,383.36

Local Income Taxes Past Five Years
2006 - $197,244.09 2007 - $225,090.91 2008 - $261,383.36 2009 - $212,498.86
Local Income Taxes Past Five Years
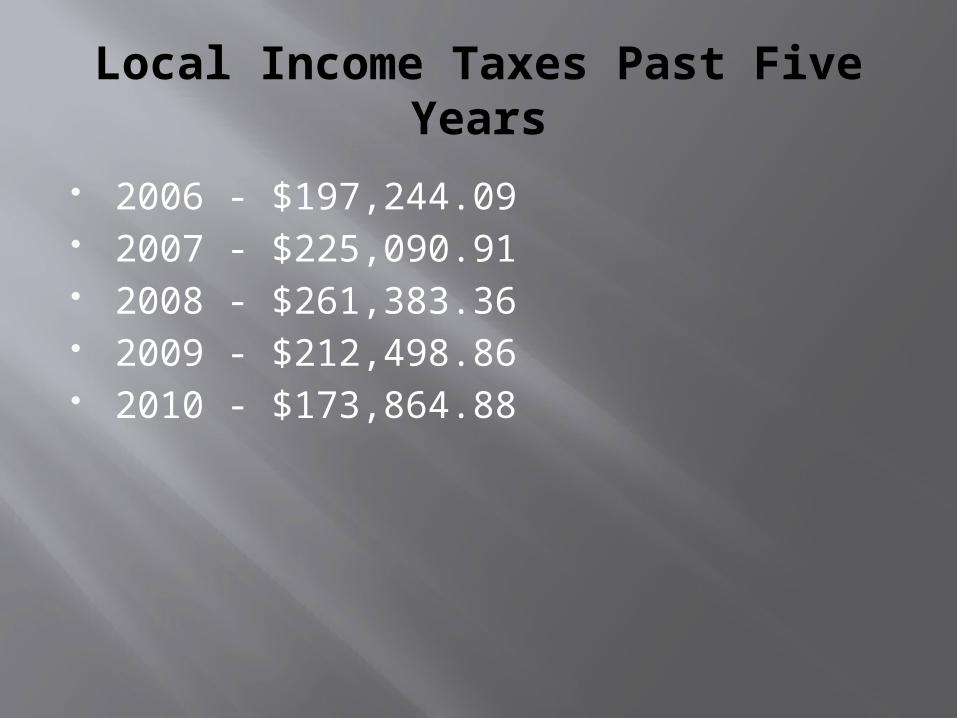
2006 - $197,244.09 2007 - $225,090.91 2008 - $261,383.36 2009 - $212,498.86 2010 - $173,864.88

Local Income Taxes Past Five Years
2006 - $197,244.09 2007 - $225,090.91 2008 - $261,383.36 2009 - $212,498.86 2010 - $173,864.88 2011 - $135,000.00 (Estimated)

Local Income Taxes
Average Received From 2006 to 2010
$214,016.42

Local Income Taxes
Average Received From 2006 to 2010
$214,016.42Estimated Amount Received in
2011
$135,000.00

Local Income Taxes
Income taxes have decreased by $79,016from the average amount over the past five
years.
A 37% Decrease

Local Government Fund Past Five Years
2006 - $106,559.29

Local Government Fund Past Five Years
2006 - $106,559.29 2007 - $106,405.63

Local Government Fund Past Five Years
2006 - $106,559.29 2007 - $106,405.63 2008 - $106,228.95

Local Government Fund Past Five Years
2006 - $106,559.29 2007 - $106,405.63 2008 - $106,228.95 2009 - $92,972.93

Local Government Fund Past Five Years
2006 - $106,559.29 2007 - $106,405.63 2008 - $106,228.95 2009 - $92,972.93 2010 - $92,671.24

Local Government Fund Past Five Years
2006 - $106,559.29 2007 - $106,405.63 2008 - $106,228.95 2009 - $92,972.93 2010 - $92,671.24 2011 - $85,000.00 (Estimated)

Local Government Fund
Average Received From 2006 to 2010
$100,967.61

Local Government Fund
Average Received From 2006 to 2010
$100,967.61Estimated Amount Received in
2011
$85,000.00

Local Government Fund
Local Government Revenue has decreased by $15,967.61
from the average amount over the past five years.
A 16% Decrease

Total Revenue Past Five Years
Revenue 2006 - $438,386.48

Total Revenue Past Five Years
Revenue Grants 2006 - $438,386.48 - $63,256.69 =

Total Revenue Past Five Years
Revenue GrantsTotal
2006 - $438,386.48 - $63,256.69 = $375,129.79

Total Revenue Past Five Years
Revenue GrantsTotal
2006 - $438,386.48 - $63,256.69 = $375,129.79
2007 - $542,699.30

Total Revenue Past Five Years
Revenue GrantsTotal
2006 - $438,386.48 - $63,256.69 = $375,129.79
2007 - $542,699.30 -$145,771.30

Total Revenue Past Five Years
Revenue GrantsTotal
2006 - $438,386.48 - $63,256.69 = $375,129.79
2007 - $542,699.30 -$145,771.30= $396,928.00

Total Revenue Past Five Years
Revenue GrantsTotal
2006 - $438,386.48 - $63,256.69 = $375,129.79
2007 - $542,699.30 -$145,771.30= $396,928.00
2008 - $451,518.78

Total Revenue Past Five Years
Revenue GrantsTotal
2006 - $438,386.48 - $63,256.69 = $375,129.79
2007 - $542,699.30 -$145,771.30= $396,928.00
2008 - $451,518.78 -$27,824.20 =

Total Revenue Past Five Years
Revenue GrantsTotal
2006 - $438,386.48 - $63,256.69 = $375,129.79
2007 - $542,699.30 -$145,771.30= $396,928.00
2008 - $451,518.78 -$27,824.20 = $423,694.58

Total Revenue Past Five Years
Revenue GrantsTotal
2006 - $438,386.48 - $63,256.69 = $375,129.79
2007 - $542,699.30 -$145,771.30= $396,928.00
2008 - $451,518.78 -$27,824.20 = $423,694.58
2009 - $371,852.25

Total Revenue Past Five Years
Revenue GrantsTotal
2006 - $438,386.48 - $63,256.69 = $375,129.79
2007 - $542,699.30 -$145,771.30= $396,928.00
2008 - $451,518.78 -$27,824.20 = $423,694.58
2009 - $371,852.25 - $5,137.00 =

Total Revenue Past Five Years
Revenue GrantsTotal
2006 - $438,386.48 - $63,256.69 = $375,129.79
2007 - $542,699.30 -$145,771.30= $396,928.00
2008 - $451,518.78 -$27,824.20 = $423,694.58
2009 - $371,852.25 - $5,137.00 = $366,715.25
Total Revenue Past Five Years
Revenue GrantsTotal
2006 - $438,386.48 - $63,256.69 = $375,129.79
2007 - $542,699.30 -$145,771.30= $396,928.00
2008 - $451,518.78 -$27,824.20 = $423,694.58
2009 - $371,852.25 - $5,137.00 = $366,715.25
2010 - $358,772.62

Total Revenue Past Five Years
Revenue GrantsTotal
2006 - $438,386.48 - $63,256.69 = $375,129.79
2007 - $542,699.30 -$145,771.30= $396,928.00
2008 - $451,518.78 -$27,824.20 = $423,694.58
2009 - $371,852.25 - $5,137.00 = $366,715.25
2010 - $358,772.62 - $5,545.30 =

Total Revenue Past Five Years
Revenue GrantsTotal
2006 - $438,386.48 - $63,256.69 = $375,129.79
2007 - $542,699.30 -$145,771.30= $396,928.00
2008 - $451,518.78 -$27,824.20 = $423,694.58
2009 - $371,852.25 - $5,137.00 = $366,715.25
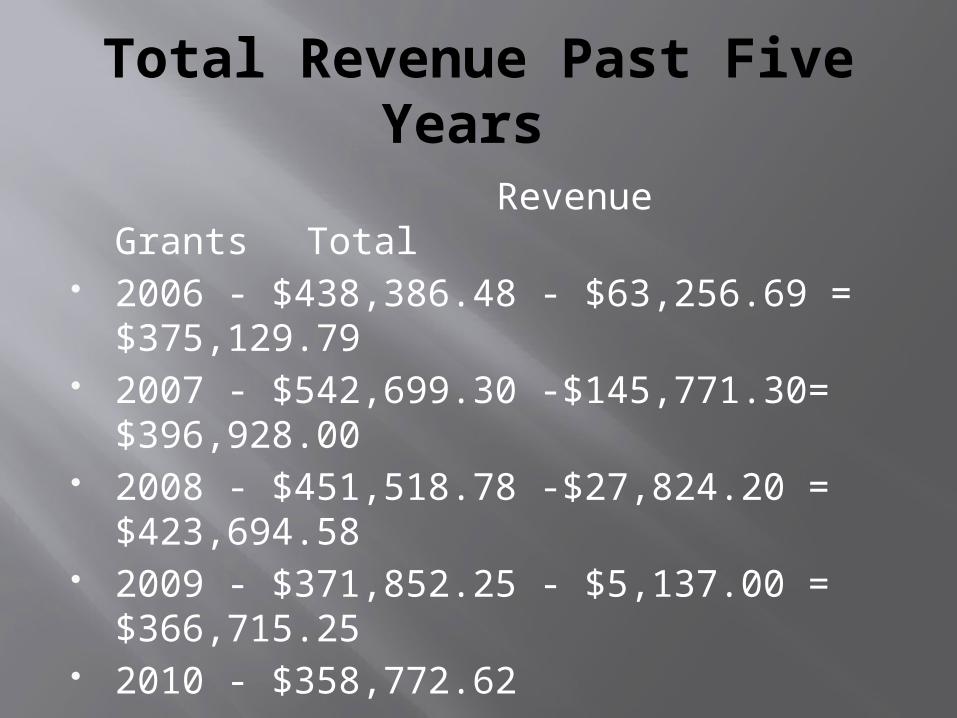
2010 - $358,772.62 - $5,545.30 = $353,227.32

Total Revenue Past Five Years
Revenue GrantsTotal
2006 - $438,386.48 - $63,256.69 = $375,129.79
2007 - $542,699.30 -$145,771.30= $396,928.00
2008 - $451,518.78 -$27,824.20 = $423,694.58
2009 - $371,852.25 - $5,137.00 = $366,715.25
2010 - $358,772.62 - $5,545.30 = $353,227.32
2011 - $276,950.00

Total Revenue Past Five Years
Revenue GrantsTotal
2006 - $438,386.48 - $63,256.69 = $375,129.79
2007 - $542,699.30 -$145,771.30= $396,928.00
2008 - $451,518.78 -$27,824.20 = $423,694.58
2009 - $371,852.25 - $5,137.00 = $366,715.25
2010 - $358,772.62 - $5,545.30 = $353,227.32
2011 - $276,950.00 - $0

Total Revenue Past Five Years
Revenue GrantsTotal
2006 - $438,386.48 - $63,256.69 = $375,129.79
2007 - $542,699.30 -$145,771.30= $396,928.00
2008 - $451,518.78 -$27,824.20 = $423,694.58
2009 - $371,852.25 - $5,137.00 = $366,715.25
2010 - $358,772.62 - $5,545.30 = $353,227.32
2011 - $276,950.00 - $0 = $276,950.00

General Fund Revenue From 2006 to 2010
Average amount Received from 2006 to 2010
Average - $383,138.99

General Fund Revenue From 2006 to 2010
Average amount Received from 2006 to 2009
Average - $383,138.99Amount Estimated to Receive 2011
Estimated - $276,950.00

General Fund Revenue From 2006 to 2010
Average amount Received from 2006 to 2010
Average - $383,138.99Amount Estimated to Receive 2011
Estimated - $276,950.00
Difference of $106,188.99Or 28% Loss in Revenue

Important Information
Equipment fund was placed within the General Fund in 2010. This added $23,788.92 to the General Fund total. Total revenue projection was estimated at $353,227.32, however if you were to remove the amount added by equipment fund the General Fund balance would have been $329,438.40.

What is spent from the General Fund?Expenditures
• Council Salaries • Mayor Salaries • Administrator (partial Salary)• Clerk/Treasurer (partial Salary) • Park maintenance salary• Employee Benefits (partial), Workman Comp, Life/Health Insurance, PERs.
• Law Enforcement Contract • Tax Collectors Contract • Solicitor’s fees• Park Expenses• Public Defender and Prosecutor contracts • State Examiners fees (auditor’s fees)• City Tax Refunds• Electric/Gas expenses for City Building and Maintenance Building • Other operating.• Equipment expenses

Understanding the Major Expense in the General Fund
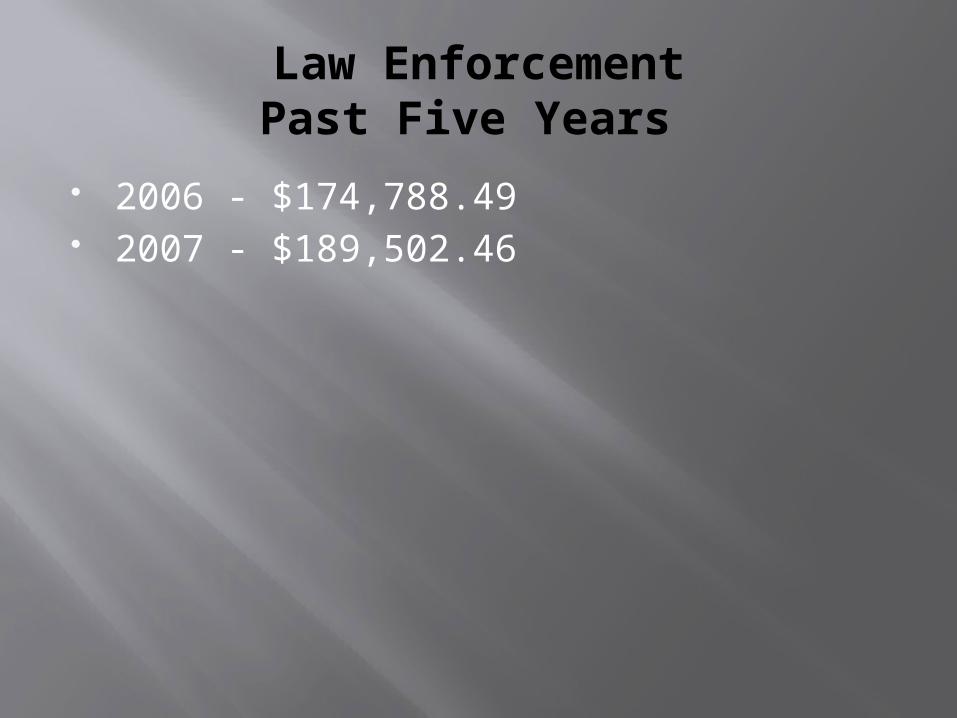
The largest expense in the General Fund is Law Enforcement.

Understanding the Major of General Fund(Expenses)
The largest expense in the General Fund is Law Enforcement.
Law Enforcement contract is 43% of the total General Fund Revenue.

Law EnforcementPast Five Years
2006 - $174,788.49
Law EnforcementPast Five Years
2006 - $174,788.49 2007 - $189,502.46

Law EnforcementPast Five Years
2006 - $174,788.49 2007 - $189,502.46 2008 - $147,028.00

Law EnforcementPast Five Years
2006 - $174,788.49 2007 - $189,502.46 2008 - $147,028.00 2009 - $150,179.52

Law EnforcementPast Five Years
2006 - $174,788.49 2007 - $189,502.46 2008 - $147,028.00 2009 - $150,179.52 2010 - $150,179.52

Law EnforcementPast Five Years
2006 - $174,788.49 2007 - $189,502.46 2008 - $147,028.00 2009 - $150,179.52 2010 - $150,179.52 2011 - $150,179.52

Services Provided bySheriff Department
Daily coverage 16 to 20 hours (exclusively)
Services Provided bySheriff Department
Daily coverage 16 to 20 hours (exclusively)
Detective Services

Services Provided bySheriff Department
Daily coverage 16 to 20 hours (exclusively)
Detective Services Canine Services

Services Provided bySheriff Department
Daily coverage 16 to 20 hours (exclusively)
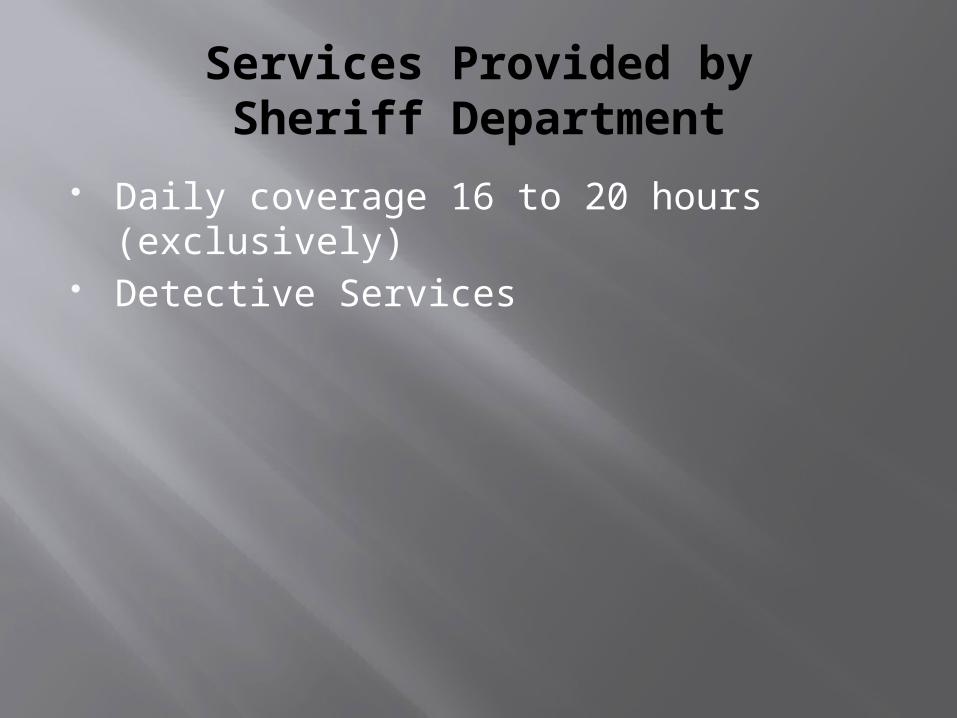
Detective Services Canine Services Any other services provided by County
Sheriff Office.

Important Information
2006 – We operated with only two full time patrol officers instead of three. We filled the shifts with auxiliary patrol personnel and part time employees.
2007 – We operated primary with one full time employee and in September Miami County Sheriff entered into contract with Bradford.

Operating Cost Past Five Years
2006 - $356,008.36

Operating Cost Past Five Years
2006 - $356,008.36 2007 - $375,999.93

Operating Cost Past Five Years
2006 - $356,008.36 2007 - $375,999.93 2008 - $310,866.13

Operating Cost Past Five Years
2006 - $356,008.36 2007 - $375,999.93 2008 - $310,866.13 2009 - $338,554.11

Operating Cost Past Five Years
2006 - $356,008.36 2007 - $375,999.93 2008 - $310,866.13 2009 - $338,554.11 2010 - $309,070.27

Operating Cost Past Five Years
2006 - $356,008.36 2007 - $375,999.93 2008 - $310,866.13 2009 - $338,554.11 2010 - $309,070.27 2011 - $298,718.52 (Estimated)

Operating Cost
Average cost to Operate from 2006 to 2010

Operating Cost
Average cost to Operate from 2006 to 2010
$345,356.00

Operating Cost
Average cost to Operate from 2006 to 2009
$345,356.00Cost to Operate 2011
$298,718.52Estimated

Operating Cost
Decrease of 14% in Operating Cost in 2011 compared to the average cost to operate
the five previous years.

Projects Funded within the General Fund
2006 - Land Purchase (High Walk), Grant Funded
2006 – Feed Elevator Demolition, Grant Funded
2006- Purchased Picnic Tables, Grant Funded
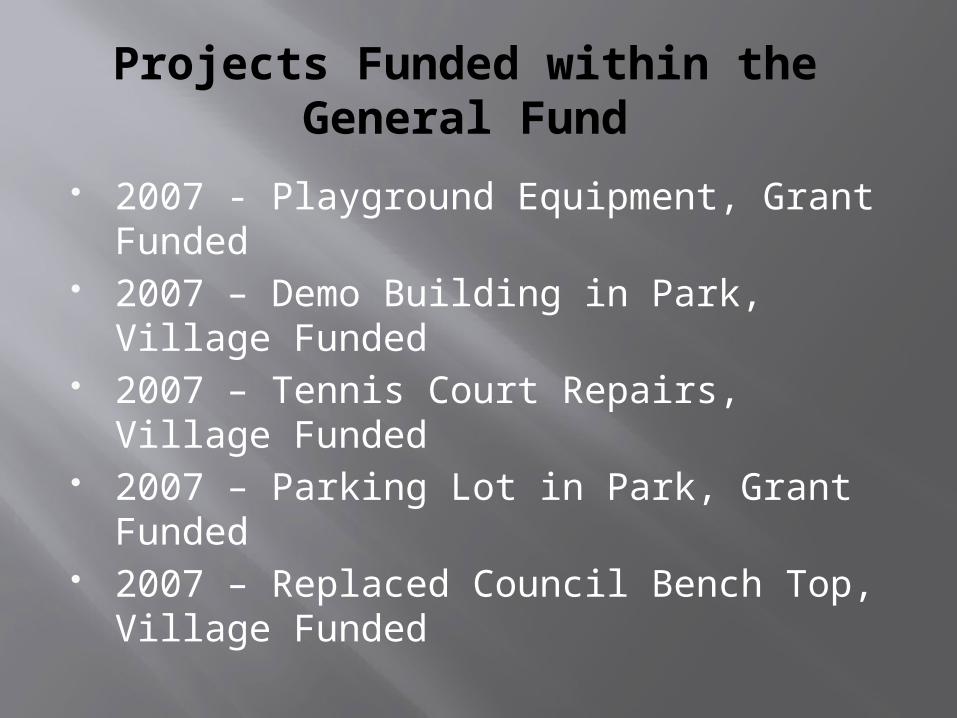
Projects Funded within the General Fund
2007 - Playground Equipment, Grant Funded
2007 – Demo Building in Park, Village Funded
2007 – Tennis Court Repairs, Village Funded
2007 – Parking Lot in Park, Grant Funded 2007 – Replaced Council Bench Top,
Village Funded

Projects Funded within the General Fund
2008- Walking Trails in Park, Grant Funded
2008 – Signs in the Park, Village Funded 2008 – City Building Renovation, Village
Funded 2008 – First payment railroad property,
Village Funded

Projects Funded within the General Fund
2009 – Renovation of Park Shelter, Grant Funded
2009 – City Building Renovation, Village Funded
2009 – Parking area city building area and Tower/Dumpster area project, Village Funded
2009 – 2nd payment for Railroad Property, Village Funded

Projects Funded within the General Fund
2010 – Final payment tower/dumpster area project, Village Funded.
2010 – Third payment of four, railroad property, Village Funded.

Ways to Increase General Fund/off set projected deficit.
Increase Income Tax1. A ½ percent increase (1% to 1.5%)to local
income tax was placed on ballet and failed twice. In November the same increase will be placed on ballet for voters approval.
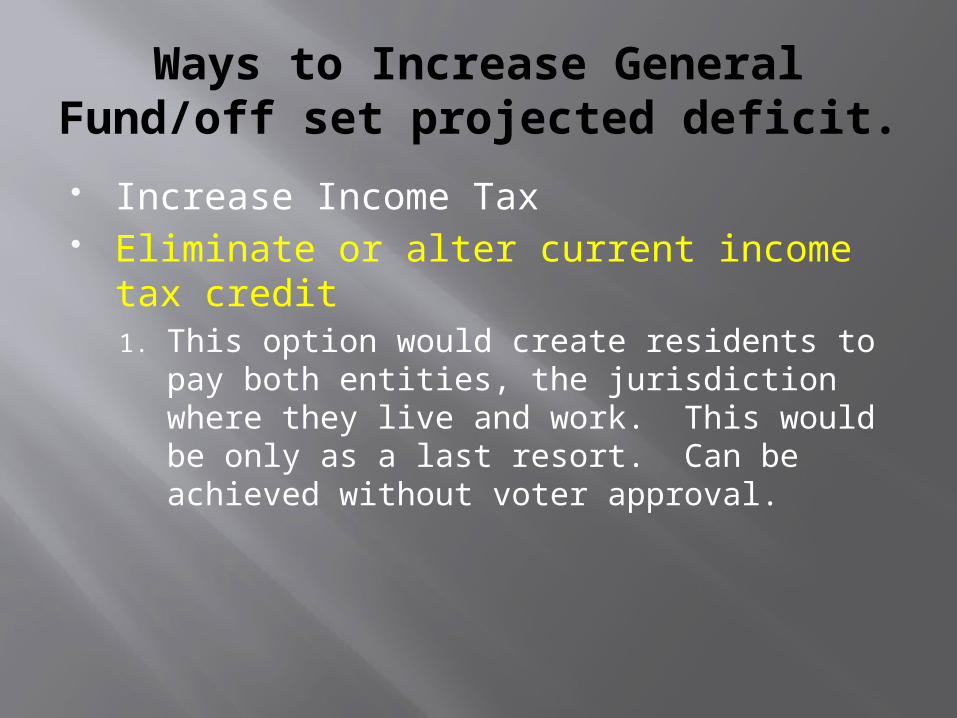
Ways to Increase General Fund/off set projected deficit.
Increase Income Tax Eliminate or alter current income tax
credit1. This option would create residents to pay
both entities, the jurisdiction where they live and work. This would be only as a last resort. Can be achieved without voter approval.

Ways to Increase General Fund/off set projected deficit.
Increase Income Tax Eliminate or alter current income tax
credit Decrease operating costs
1. For the last few years we have significantly reduced operating costs.

Ways to Increase General Fund/off set projected deficit.
Increase Income Tax Eliminate or alter current income tax
credit Decrease operating costs Decrease/alter current services provided
1. Law Enforcement is the single largest expense to the General Fund.
2. A reduction in coverage is imminent if income taxes are not increased.
3. If income tax levy is passed we still will fall short and may need to reduce coverage.
4. All other services are difficult to reduce

Ways to Increase General Fund/off set projected deficit.
Increase Income Tax Eliminate or alter current income tax
credit Decrease operating costs Decrease/alter current services provided Increase Jobs

QUESTIONS?