cancerres.aacrjournals.orgcancerres.aacrjournals.org/highwire/filestream/362947/... · web...
TRANSCRIPT

Supplementary materials
Co-mutations in DNA Damage Response Pathways as a Potential
Biomarker for Immune Checkpoint Blockades
Contents:
Table S1-S6
Figure S1-S8

Table S1. Data source.
Data source
Tumor N WGS WES RNAseq Neoantigen Clinical outcome
TCGA 29 cohorts 11186 - 8552 8482 5935 -
ICGC - - 2638 - - - -
Rizvi cohort
Non-small cell lung cancer
with anti-PD-1
therapy
34 - 34 - 34ORRDCBPFS
Allen cohort
Melanoma with anti-CTLA-4 therapy
110 - 110 - 110ORROS
Snyder cohort
Melanoma with anti-CTLA-4 therapy
64 - 64 - - OS
Hugo cohort
Melanoma with anti-
PD-1 therapy
38 - 38 - - ORROS
TCGA, The Cancer Genome Altlas; ICGC, The Interantional Cancer Genome
Consortium; WGS, whole-genome sequencing; WES, whole-exome sequencing;
ORR, Objective response rate; DCB, durable clinical benefit; PFS, progression-free
survival; OS, Overall survival.

Table S2. Gene list for DNA repair response pathways.Pathway Genes
BER (n = 37) APEX1, APLF, APTX, CCNO, FEN1, HMGB1, LIG1, LIG3, MBD4, MPG, MUTYH, NEIL1, NEIL2, NEIL3, NTHL1, OGG1, PARP1, PARP2, PARP3, PARP4, PCNA, PNKP, POLB, POLD1, POLD2, POLD3, POLD4, POLE, POLE2, POLE3, POLE4, POLL, SMUG1, TDG, TDP1, UNG, XRCC1
CPF (n = 22) AEN, ATM, ATR, ATRIP, CHEK1, CHEK2, HUS1, HUS1B, PER1, PER2, PER3, RAD1, RAD17, RAD9A, RAD9B, RFC2, RFC3, RFC4, RFC5, TIMELESS, TIPIN, TP53
FA (n = 30) CENPS, BLM, BRCA1, BRCA2, BRIP1, FAAP100, FAAP24, FAN1, FANCA, FANCC, FANCD2, FANCE, FANCF, FANCG, FANCI, FANCL, FANCM, HES1, PALB2, RAD51, RAD51C, RMI1, RMI2, CENPX, TELO2, TOP3A, TOP3B, UBE2T, USP1, WDR48
HRR (n = 44) BLM, BRCA1, BRCA2, DMC1, EME1, EME2, GEN1, HFM1, MRE11, MUS81, NBN, PPP4C, PPP4R1, PPP4R2, PPP4R4, RAD50, RAD51, RAD51B, RAD51C, RAD51D, RAD52, RAD54B, RAD54L, RAD54L2, RDM1, RECQL, RECQL4, RECQL5, RMI1, RMI2, RPA1, RPA2, RPA3, SEM1, SLX1A, SLX4, PPP4R3A, PPP4R3B, SPO11, TOP3A, TOP3B, WRN, XRCC2, XRCC3
MMR (n = 25) EXO1, HMGB1, LIG1, MLH1, MLH3, MSH2, MSH3, MSH4, MSH5, MSH6, PCNA, PMS1, PMS2, POLD1, POLD2, POLD3, POLD4, RFC1, RFC2, RFC3, RFC4, RFC5, RPA1, RPA2, RPA3
NER (n = 47) BIVM-ERCC5, CCNH, CDK7, CUL3, CUL4A, CUL5, DDB1, DDB2, ERCC1, ERCC2, ERCC3, ERCC4, ERCC6, ERCC8, GTF2H1, GTF2H3, GTF2H4, GTF2H5, LIG1, MMS19, MNAT1, POLR2A, POLR2B, POLR2C, POLR2D, POLR2E, POLR2F, POLR2G, POLR2H, POLR2I, POLR2J, POLR2J2, POLR2K, POLR2L, RAD23A, RAD23B, RBX1, RPA1, RPA2, RPA3, ELOC, ELOB, ELOA, ELOA2, ELOA3B, XPA, XPC
NHEJ (n = 15) APLF, APTX, DCLRE1C, DNTT, LIG4, MRE11A, NHEJ1, POLB, POLL, POLM, PRKDC, RAD50, XRCC4, XRCC5, XRCC6
TLS (n = 13) HLTF, POLH, POLI, POLK, POLN, RAD18, REV1, REV3L, TMEM189, UBE2B, UBE2N, UBE2V1, UBE2V2
BER, base excision repair; CPF, checkpoint factors; FA, Fanconi anemia; HRR,
homologous recombination repair; MMR, mismatch repair; NER, nucleotide excision
repair; NHEJ, non-homologous end-joining; TLS, translesion DNA synthesis.

Table S3. Gene list of immune gene signature.
Classification Genes
Immune checkpoint PD-1, PD-L1, PD-L2, LAG3, CTLA4, TIM3, VTCN1
T-effector and INFγ pathway GBP1, IFI16, IFI30, IFNG, IRF1, STAT1, TAP1, TAP2, FAS, PSMB9, IL15RA, GZMA, GZMB, EOMES, CXCL10, CXCL9, CXCL11, TBX21, PRF1
T cell receptor CD27, GRAP2, LCK, PTPRCAP, CCL5, IL2RB, IKZF3, CD3G, CD74, CD3D, CD8A, CD4, TIGIT
Tumor microenvironment IDO1, PTGS2, IL1B, IL18, IL6, IL12A, TNF, CD73
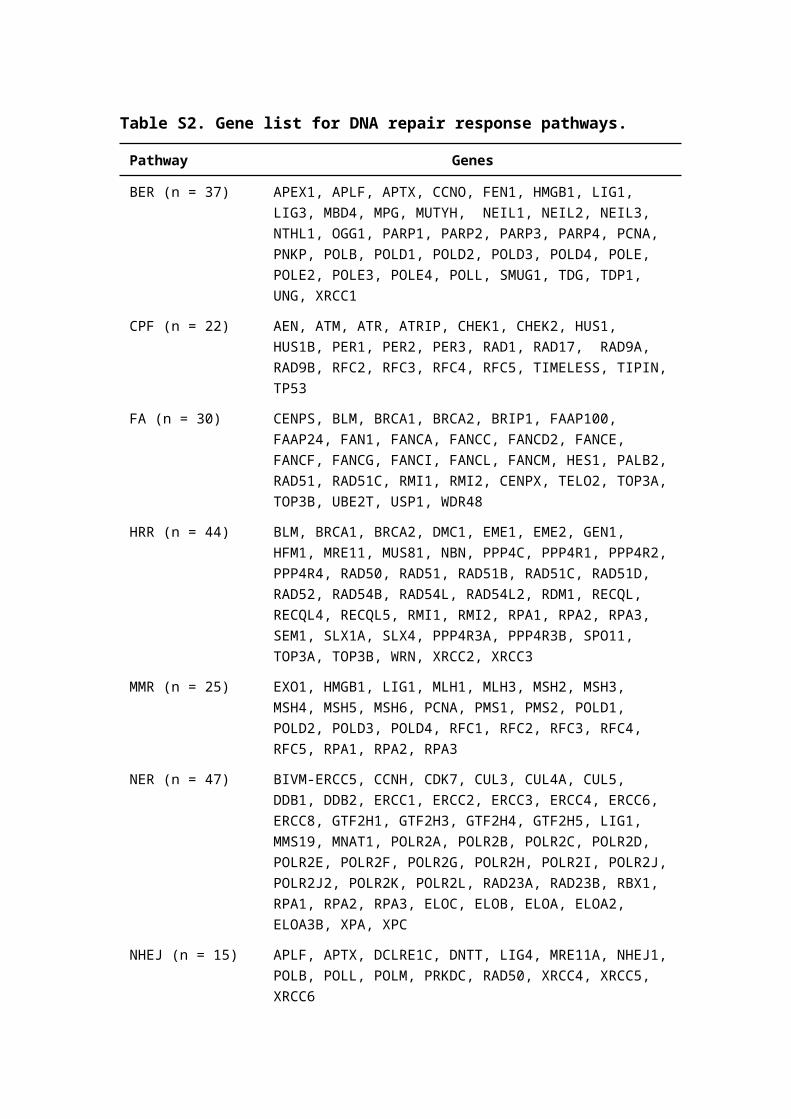
Table S4. Correlations of co-mut status with tumor mutational burden.
TumorCo-mut- Co-mut+
PN mean SD N mean SD
ACC 81 104.16 83.43 9 558.56 626.37 0.0002
BLCA 92 211.96 152.30 38 510.03 341.12 0.0000
BRCA 952 49.56 77.15 30 595.03 1015.89 0.0000
CESC 176 95.57 99.54 18 718.39 540.16 0.0000
CHOL 30 109.27 32.06 5 251.40 278.39 0.0208
CRAC 188 84.57 79.20 35 1375.37 1967.28 0.0000
ESCA 162 181.92 77.70 23 434.26 506.33 0.0005
GBM 284 55.12 18.82 6 89.00 46.91 0.0233
HNSC 455 138.81 110.13 57 392.86 503.25 0.0000
KICH 65 69.82 26.49 1 816.00 NA -
KIRC 427 57.15 82.99 24 507.38 417.87 0.0000
KIRP 273 51.27 24.28 9 63.89 10.42 0.0475
LGG 283 24.47 12.75 3 170.00 207.12 0.0055
LIHC 347 80.80 61.86 26 508.73 400.66 0.0000
MESO 80 29.20 10.71 2 156.50 171.83 0.1075
NSCLC 954 212.92 174.34 190 521.55 385.54 0.0000
OV 306 48.38 27.13 10 69.00 31.07 0.0251
PAAD 144 49.51 24.24 6 2490.83 5960.69 0.0759
PRAD 490 39.93 33.72 9 918.00 2125.63 0.0002
SARC 242 50.80 123.19 5 87.60 89.82 0.2937
SKCM 272 279.61 302.20 96 1352.70 3283.76 0.0000
STAD 316 128.72 128.25 79 1407.06 1192.82 0.0000
TGCT 151 56.13 14.25 4 149.00 192.95 0.2759
THCA 404 13.45 9.12 1 10.00 NA -
THYM 122 11.63 10.76 1 646.00 NA -
UCEC 198 97.20 115.45 50 2331.74 3090.05 0.0000
UCS 54 59.19 18.55 3 1631.67 1955.56 0.0040
Abbreviation: NA, not available.


Table S5. Correlations of co-mut status with neoantigen load.
TumorCo-mut- Co-mut+
PN mean SD N mean SD
BLCA 91 176.88 195.76 38 406.13 297.04 0.0000
BRCA 939 50.40 83.34 30 538.80 867.55 0.0000
CESC 169 90.27 113.75 18 841.83 665.79 0.0000
CRAC 73 61.60 70.20 12 1118.67 2055.12 0.0000
GBM 143 53.09 27.16 4 119.00 63.48 0.0289
HNSC 428 110.49 86.05 55 357.33 515.73 0.0000
KICH 65 49.46 25.88 1 1030.00 NA -
KIRC 397 54.07 30.99 18 78.00 39.91 0.0047
KIRP 156 73.30 46.18 5 95.00 40.78 0.1740
LIHC 177 84.05 58.11 17 175.24 173.38 0.0037
NSCLC 553 197.12 188.56 99 508.15 424.42 0.0000
OV 266 47.41 31.85 8 67.75 56.37 0.5041
PAAD 139 75.10 61.46 6 2594.50 6094.63 0.0059
PRAD 414 34.44 32.79 6 336.83 467.86 0.0036
SKCM 250 212.33 219.53 90 756.76 702.47 0.0000
STAD 73 98.45 65.54 12 1439.42 2812.43 0.0005
THCA 378 15.71 15.46 1 2.00 NA -
UCEC 196 107.73 158.43 50 2302.48 3117.23 0.0000 Abbreviation: NA, not available.

Table S6. Correlations between clinical prognosis and co-mut status or TMB
Rizvi cohort Allen & Synder cohort Hugo cohort
N mPFS P N mOS P N mOS P
Co-mut
Co-mut– 23 4.1 (2.1-8.3) 0.006 124 10.6 (8.4-17.7) 0.04 23 27.9 (14.6-NR) 0.20
Co-mut+ 11 NR (8.3-NR) 50 32.4 (20.1-NA) 14 NR (23.0-NR)
TMB
TMB<75th 25 6.3 (3.3-8.3) 0.07 131 13.2 (9.6-19.2) 0.20 28 31.5 (14.6-NR) 0.53
TMB≥75th 9 14.5 (8.3-NR) 43 27.0 (14.4-49.3) 9 31.8 (22.1-NR)
TMB<median 17 3.4 (1.9-6.5) <0.001 87 12.0 (9.6-20.9) 0.26 19 27.9 (14.6-NR) 0.13
TMB≥median 17 NR (8.3-NR) 87 20.4 (12.0-34.9) 18 32.7 (22.1-NR)
Abbreviations: TMB, tumor mutational burden. NR, not reached.

Figure S1-S8
Figure S1. Correlations between DDR pathways and tumor mutational burden,
neoantigen load. A, Comparison of tumor mutational burden between different
numbers of mutated DDR pathways (0, 1, 2, vs ≥2) from TCGA database. B,
Comparison of tumor mutational burden between different numbers of mutated DDR
pathways (0, 1, 2, vs ≥2) from ICGC database. C, Comparison of neoantigen load
between different numbers of mutated DDR pathways (0, 1, 2, vs ≥2) from TCGA
database. DDR, DNA damage response; TCGA, The Cancer Genome Atlas; ICGC,
the International Cancer Genome Consortium.

Figure S2. Mutation frequency of DDR genes in HRR, BER and MMR pathways.
BER, base excision repair; HRR, homologous recombination repair; MMR, mismatch
repair; ACC, adrenocortical carcinoma; BLCA, bladder urothelial carcinoma; LGG,
brain lower grade glioma; BRCA, breast invasive carcinoma; CESC, cervical
squamous cell carcinoma and endocervical adenocarcinoma; CHOL,
cholangiocarcinoma; CRAC, colorectal adenocarcinoma; ESCA, esophageal
carcinoma; GBM, glioblastoma multiforme; HNSC, head and neck squamous cell
carcinoma; KICH, kidney chromophobe; KIRC, kidney renal clear cell carcinoma;
KIRP, kidney renal papillary cell carcinoma; LIHC, liver hepatocellular carcinoma;
NSCLC, non-small cell lung cancer; MESO, mesothelioma; OV, ovarian serous
cystadenocarcinoma; PAAD, pancreatic adenocarcinoma; PCPG, pheochromocytoma
and paraganglioma; PRAD, prostate adenocarcinoma; SARC, sarcoma; SKCM, skin
cutaneous melanoma; STAD, stomach adenocarcinoma; TGCT, testicular germ cell
tumors; THYM, thymoma; THCA, thyroid carcinoma; UCS, uterine carcinosarcoma;
UCEC, uterine corpus endometrial carcinoma; UVM, uveal melanoma.

Figure S3. Correlations between DDR pathways and MSI-H. The proportion of
patients with co-mut+ or MSI-H in different tumor. DDR, DNA damage response;
BLCA, bladder urothelial carcinoma; BRCA, breast invasive carcinoma; CRAC,
colorectal adenocarcinoma; GBM, glioblastoma multiforme; HNSC, head and neck
squamous cell carcinoma; KIRC, kidney renal clear cell carcinoma; KIRP, kidney
renal papillary cell carcinoma; LIHC, liver hepatocellular carcinoma; LGG, brain
lower grade glioma; NSCLC, non-small cell lung cancer; OV, ovarian serous
cystadenocarcinoma; SKCM, skin cutaneous melanoma; STAD, stomach
adenocarcinoma; TGCT, testicular germ cell tumors; THCA, thyroid carcinoma;
UCEC, uterine corpus endometrial carcinoma.
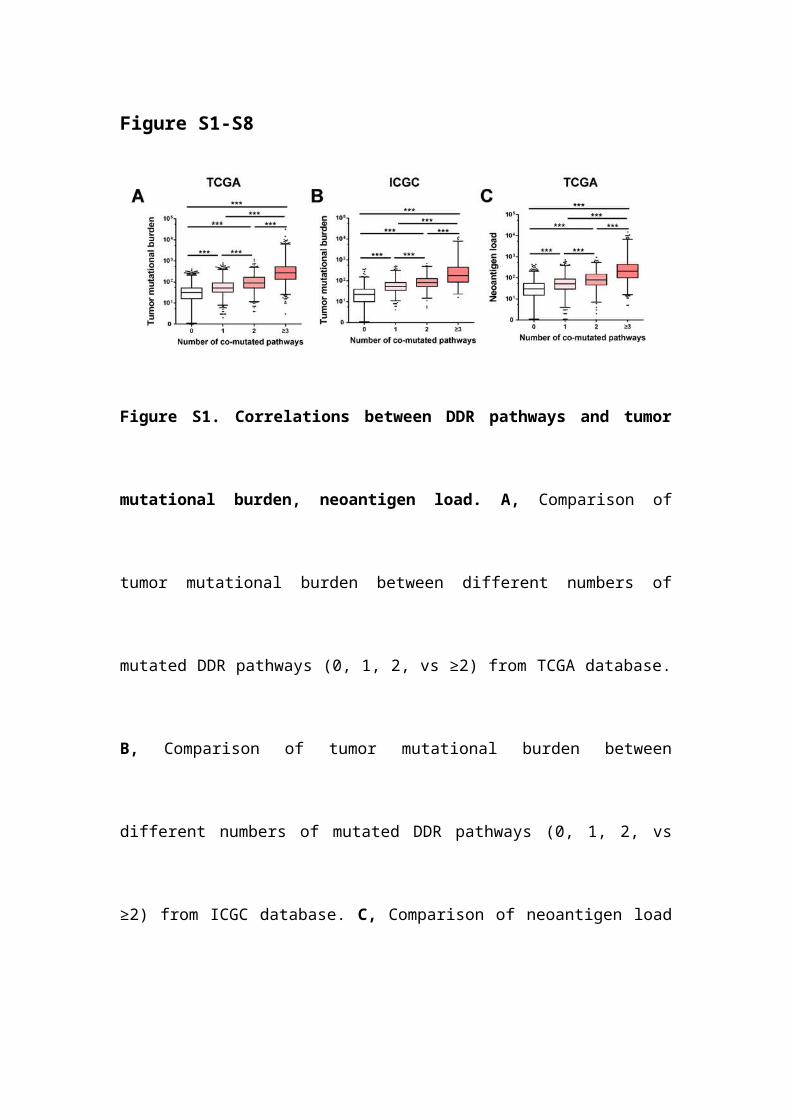
Figure S4. Association between co-mut status and immune genes expression.
Heatmap depicting Mann-Whitney U test P values of associations between co-mut
status and immune genes expression in 14 cancer types with at least one gene whose
expression is significantly higher in co-mut+ group. NS, not significant.
Figure S5. Correlations between co-mut status and Tumor mutational burden or
neoantigen load. A-C, Comparisons of TMB and neoantigen load in co-mut+ and co-
mut– group from Rizvi cohort (A), Allen cohort & Snyder cohort (B) or Hugo cohort
(C). *P<0.05, **P<0.01, ***P<0.001.

Figure S6. Comparison of clinical prognosis in DDR wild-type and single
mutated DDR pathway. A, Kaplan-Meier survival curves of PFS comparing DDR
wild-type and single DDR pathway mutated groups from the Rizvi cohort. B, Kaplan-
Meier survival curves of OS comparing DDR wild-type and single DDR pathway
mutated groups from the Allen and Snyder cohorts. C, Kaplan-Meier survival curves
of OS comparing DDR wild-type and single DDR pathway mutated group from the
Hugo cohort. PFS, progression-free survival; OS, overall survival; HR, hazard’s ratio.

Figure S7. Associations between co-mut status and clinical prognosis by
subgroup analysis in melanoma. A, Kaplan-Meier survival curves of OS comparing

co-mut+ with co-mut– groups from the Allen and Snyder cohorts stratified by TMB.
B, Comparison of the objective response rate between co-mut+ and co-mut– groups
from the Allen and Snyder cohorts stratified by TMB. C, Kaplan-Meier survival
curves of OS comparing co-mut+ with co-mut– groups from the Hugo cohort
stratified by TMB. D, Comparison of the objective response rate in co-mut+ and co-
mut– groups from the Hugo cohort stratified by TMB. Abbreviations: TMB, tumor
mutational burden; OS, overall survival; NR, not reached.

Figure S8. Associations between 34 DDR genes mutations and clinical prognosis
of PD-1 blockade treatment. A, Kaplan-Meier survival curves of PFS comparing
DDR genes mutations with wild-type groups from Rizvi cohort. B, Kaplan-Meier
survival curves of OS comparing DDR genes mutations with wild-type groups from
Hugo cohort. Thirty-four gene list was cited from Teo MY et al. J Clin Oncol, 2018.
DDRwt, no any mutation in 34 DDR genes. DDRdel, at least one gene with known or
likely deleterious DDR mutations including nonsense mutations, and frameshift or
splice site alterations. For missense mutations, deleterious status was determined by
manual review for their documentation in the Catalogue of Somatic Mutations in
Cancer algorithmically determined recurrent hot spot mutations and annotation of
oncogenicity by related publications. DDRvous, at least one gene with unknown
deleterious DDR mutations.