fadhilconsult.files.wordpress.com file · web viewit emphasises cost recovery. merely recovering...
TRANSCRIPT

1
WEEK 6
CAPITAL INVESTMENT DECISIONS
FINANCIAL MANAGEMENT

2
THE IMPORTANCE OF
CAPITAL EXPENDITURE
Their outcomes extend well into the future
Frequently the amounts involved are large.
They are often irreversible
They are most likely to commit a company to a particular technology.
They may have considerable influence on future operating cash flows

3
Capital Budgeting is a Six Stage process
1. Identification
2. Search
3. Information-Acquisition
4. Selection
5. Financing
6. Implementation & Control
4

5
TIME VALUE OF MONEY
The time value of money takes into account that a dollar received today is worth more than a dollar received tomorrow.
Since a dollar received today can be invested to earn interest, it is worth more than a dollar received tomorrow.
The time value of money is the opportunity cost of receiving money later rather than sooner.

6
Methods of Project Evaluation
ACCOUNTING RATE OF RETURN
Strengths
Consistent with other profitability measures normally computed from accrual basis financial statements
Weaknesses
It is arbitrary. This is because it is based upon accounting
figures rather than cash flows.Ignores the timing of the earning stream.
I.e – the time value of money.
Calculation

7
Net Annual Cash Flows
Average Capital Invested
Net Annual Cash FlowsInitial Investment
Net Annual Cash FlowsAverage Book Values
8

9

10

11

12
Additionally, if projects have the same capital costs and total earnings, but different lives, the Accounting Rate of Return method automatically favours projects with short lives and large returns in the early years.
13
Methods of Project Evaluation
PAYBACK PERIOD
Strengths
Simple to CalculateEmphasises cost recovery.Liquidity may be more important than profitability.
Weaknesses
Only accounts for flows up to recovery. Ignores cash flows after recovery
Ignores the timing of the earning stream. I.e – the time value of money.
Is not a measure of profitability.
Decision Rules a. Single Investment Alternative
Select if payback period is within the range specified by management.
b. Multiple Investment AlternativesSelect proposal with shortest payback period if within range specified by management.

14
PAYBACK PERIOD Is the length of time for a stream of net cash inflows received from a project to equal the initial cash outlay on the project.
Stresses risk reduction by identifying projects which have the shortest length of time during which the initial outlay is outstanding.
Has some merit where the liquidity of a project is important in assessing its attractiveness.
Timely cash flows are often more critical than profit maximisation for newly established or developing companies.
CALCULATION
1. For investments with equal annual cash flows.
2. For investments with unequal annual cash flows
15
Cash flows are accumulated until the cumulated amount of the cash flows equals the initial investment.

16
It is Not a Measure of a Project's Profitability –
It Emphasises Cost Recovery.
Merely recovering the outlay of a project yields no profit at all. If there is a profit on the project, it must be the result of additional cash inflows after the investment outlay has been recovered.
Therefore, the major weakness of the Payback method is its failure to take account of the magnitude and timing of all of a project's cash flows.
Notice ** Both have the same Payback

17
period

18
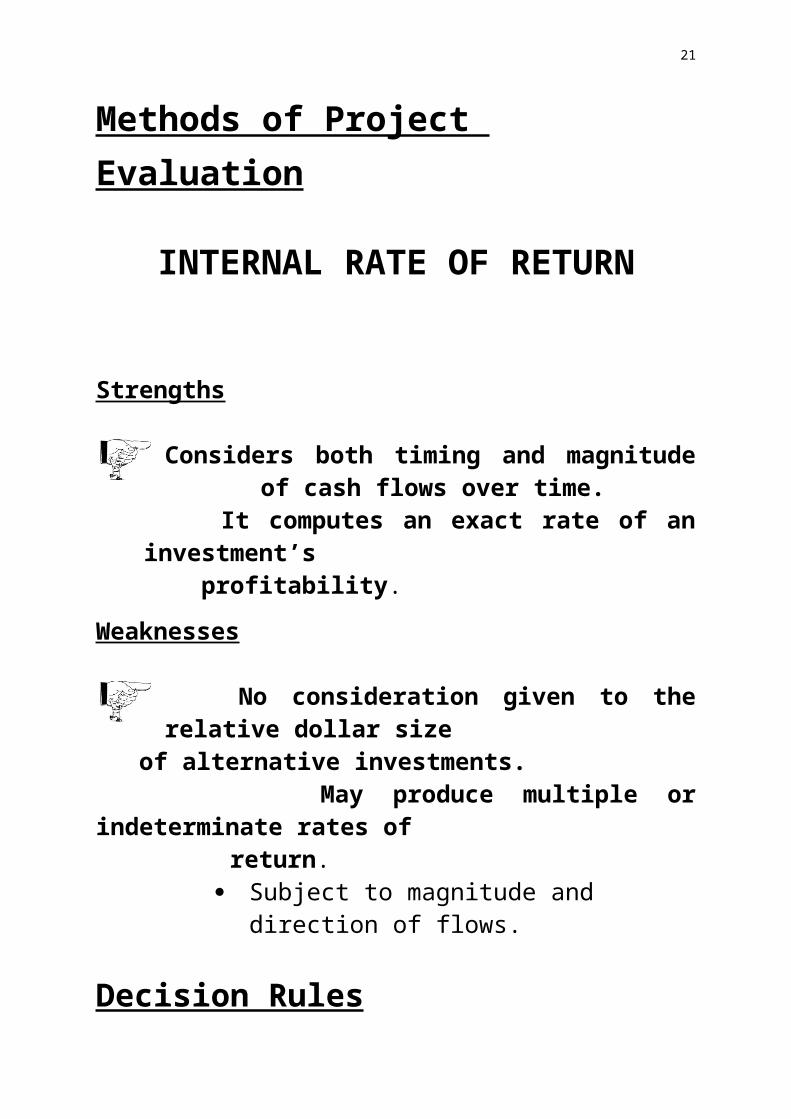
Methods of Project Evaluation
INTERNAL RATE OF RETURN
Strengths
Considers both timing and magnitude of cash flows over time.
It computes an exact rate of an investment’s profitability.
Weaknesses
No consideration given to the relative dollar size of alternative investments.
May produce multiple or indeterminate rates of return.
Subject to magnitude and direction of flows.
Decision Rules
a. Single Investment AlternativeSelect if IRR exceeds a minimum rate specified by management.
b. Multiple Investment AlternativesSelect investment with highest IRR if exceeds minimum rate specified by management.

19
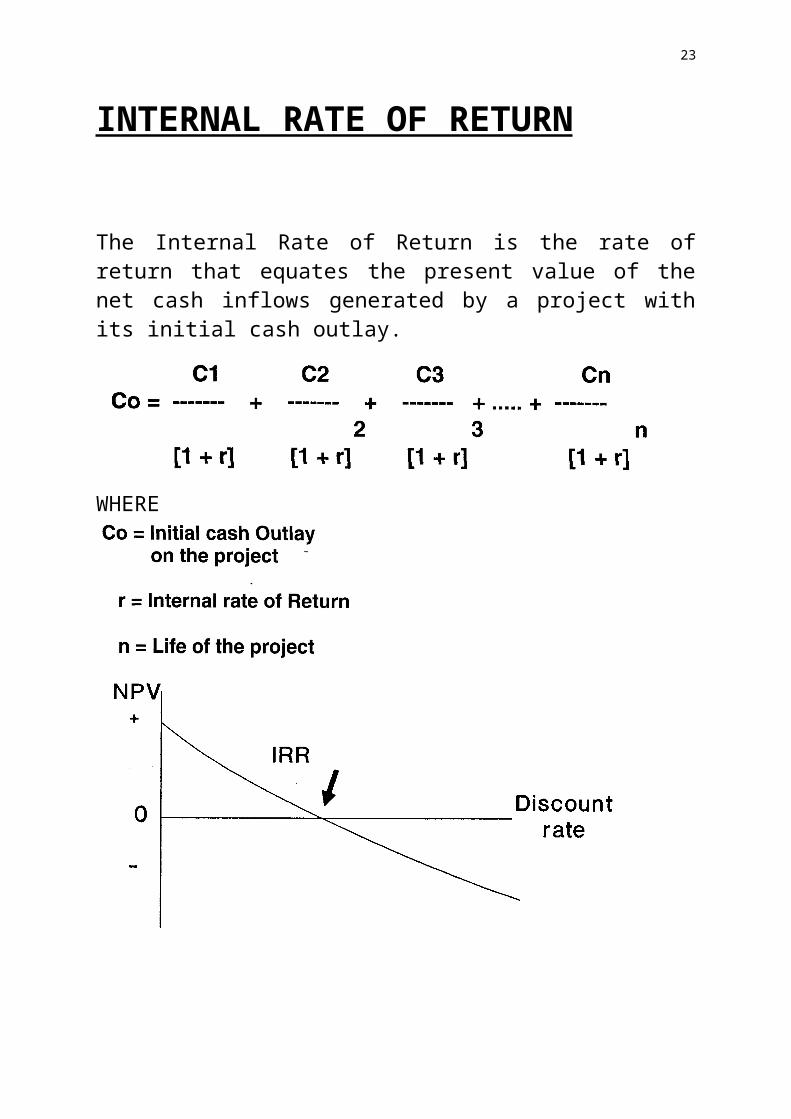
INTERNAL RATE OF RETURN
The Internal Rate of Return is the rate of return that equates the present value of the net cash inflows generated by a project with its initial cash outlay.
WHERE

20
IRR =-1000 +15001.50 1.50 1+ = 0
If the IRR > RRR then NPV must be positive
RRR = -1000 +15001.35 1.35 1+ = 111
RRR = -1000 +15001.10 1.10 1+ = 364
Notice NPV increases as the RRR decreases or alternativelyNPV decreases as the RRR increases
Pitfall 1
Not all cash flow streams have NPVs that decline as the discount rate increases.
Consider the following project
NPVC0 C1 10%
+1000 -1500 0.5 -364
ProjectCash Flows
IRR
RRR = 1000 -15001.10 1.10 1+ = -364
RRR = 1000 -15001.35 1.35 1+ = -111
General rule is that if the IRR is greater than the RRR then accept the project
However in this situation the RRR would have to be greater than the IRR for a positive NPV to arise
Notice that NPV increases as the Required Rate of Return Increases
21
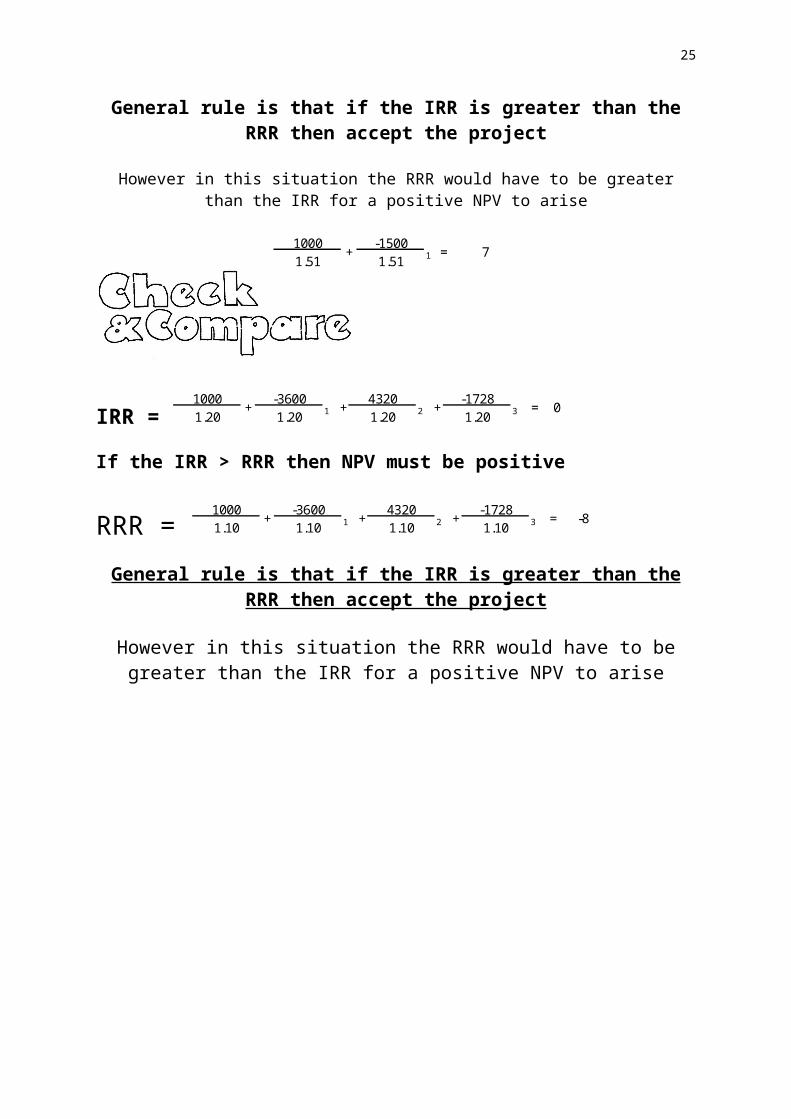
1000 -15001.51 1.51 1+ = 7
IRR = 1000 -3600 4320 -17281.20 1.20 1 1.20 2 1.20 3+ + = 0+
If the IRR > RRR then NPV must be positive
RRR = 1000 -3600 4320 -17281.10 1.10 1 1.10 2 1.10 3+ + = -8+
General rule is that if the IRR is greater than the RRR then accept the project
However in this situation the RRR would have to be greater than the IRR for a positive NPV to arise
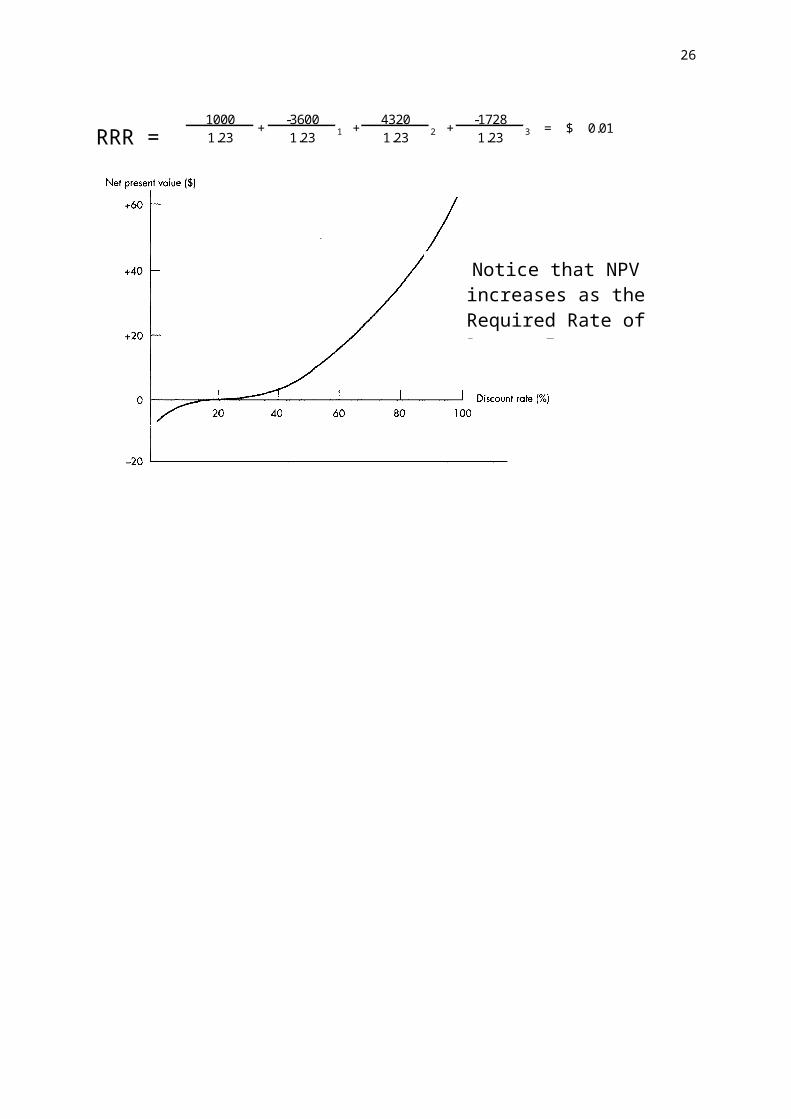
RRR = 1000 -3600 4320 -17281.23 1.23 1 1.23 2 1.23 3+ + = 0.01$ +
Notice that NPV increases as the Required Rate of Return
Increases

22
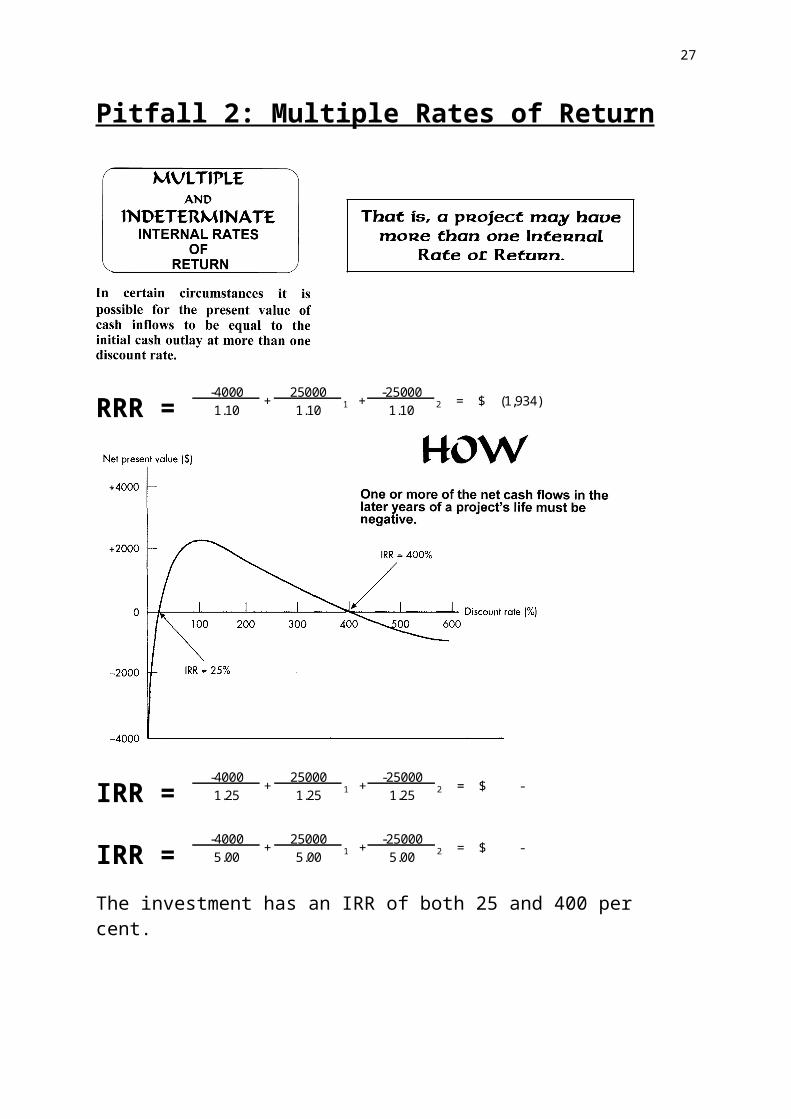
Pitfall 2: Multiple Rates of Return
RRR =-4000 25000 -250001.10 1.10 1 1.10 2+ = (1,934)$ +
IRR =-4000 25000 -250001.25 1.25 1 1.25 2+ = -$ +
IRR =-4000 25000 -250005.00 5.00 1 5.00 2+ = -$ +
The investment has an IRR of both 25 and 400 per cent. There can be as many different internal rates of return for a project as there are changes in the sign of the cash flows.
23
RRR =1000 -3000 25001.10 1.10 1 1.10 2+ = 339$ +
NPV10% 339$ 20% 236$ 30% 172$ 40% 133$ 50% 111$ 60% 102$ 70% 100$ 80% 105$ 90% 114$
100% 125$
IRR = NONE
Pitfall 3: Interpretation of IRRProject A
IRR = -1000 0 0 13311.10 1.10 1 1.10 2 1.10 3+ + = -$ +
Project B
IRR = -1000 600 50 5501.10 1.10 1 1.10 2 1.10 3+ + = -$ +
Notice – Both have the same IRR
The assumption would be for such investments that they are both earning a compounded rate of 10% over the term
A B600$ 50$
1,331$ 550$ 1,331$ 1,200$
Accumulated Cash
Compounding would give
10 I3 n
1000 +/- PVCOMP FV
= 1,331$
B does not earn 10% compound per annum
B must earn some rate below 10% compounded

24
Calculating the IRR
25
Present Value of an Annuity of $1 per period for t periods
Look up 10 periods (n)Find where 5.98 is located12% = 5.6502 10% = 6.1445
26
Methods of Project Evaluation NET PRESENT VALUE
Strengths
Considers both timing and magnitude of cash flows Over time
It computes an exact rate of an investment’s profitability.
Indicators
Positive NPV [+] Investment rate of return is greater than the minimum desired rate of return.
Negative NPV [-] Investment rate of return is less than the minimum desired rate of return.
NPV [0] Investment rate of return is equal to the minimum desired rate of return.
Decision RulesIf initial cost and lives are equala. Single Investment Alternative
Select if NPV is greater than or equal to zero.
b. Multiple Investment AlternativesSelect investment with highest NPV.
If initial cost and lives are not equalCompute Profitability Index or Benefit Cost Ratio
Benefit CostRatio = Present Value of Net Cash Inflows
Initial Cash OutlaySelect the alternative with the highest profitability index.[provides the highest returns per investment dollar]
27

28
WHAT TO INCLUDE IN THE CALCULATION
Use cash flows, not Accounting income
Cashflow generated by a project is not the same as accounting income.
Cash flows are actual flows of cash whereas accounting income is based on accounting standards and includes such items as depreciation of capital expenditure (e.g. plant and machinery).
Accounting seeks to spread income across time and does not take into account the time value of money.
Cashflow analysis charges the cost of the asset at the time it is purchased (usually t0) as a cash outflow.
Ignore Sunk Costs Sunk costs are costs that have already been incurred and cannot be recouped. I.e. -incurred whether the project proceeds or not.
These costs are irrelevant in project evaluation as the costs will have to be paid regardless of whether the project is accepted or not.
o Consultancy fees to assess the feasibility of a new product range are an example of sunk costs.
Include Opportunity Costs An opportunity cost is the most valuable alternative option that is given up if a particular investment is undertaken.
If a corporation uses a resource in a project which would otherwise be available for an alternative use, then the dollar value of that lost cash inflow is treated as an outflow for the project at hand.

29
Include Side Effects
Side Effects are included in capital budgeting because they impact upon the value of existing business.
One of the side effects of a new project is that negative cash flows often occur with the company’s existing projects.
Example, if McDonalds in Mackay, Queensland, Australia, (population approx. 72 000) opened another outlet, then the sales would decrease at the existing stores. Likewise, the introduction of another flavour of thick shake would result in sales for the existing flavours to reduce. It is therefore important to include in the analysis all the cash flows that would arise from the implementation of the project.
Company Tax Taxation represents a cash outflow and needs to be deducted from operating cash flows in order to determine free cash flows.
There are two sets of tax that are relevant to evaluating capital projects—(corporate) income tax and capital gains tax.
The Australian Taxation Office (ATO) levies income tax in Australia on the difference between taxable income (revenues) and allowable deductions (expenses) at the company tax rate.
Capital gains tax is levied at the company tax rate on the ‘real gain’ in the value of the capital assets of a company, once they are sold. The real gain in the value of assets is the increase in the value of an asset over and above any increase in value associated with changes in inflation (as measured by an indexation factor based on the Consumer Price Index).
Salvage Value Salvage value is the cash inflow received when the asset is sold on the open market at the project’s end.
It is an actual cash flow and must be shown in the table. It itself is not a taxable flow as it, like the initial outlay, is a “capital item”, but the difference between it and the written—down book value (WDBV) is treatable for tax purposes.
If the WDBV is less than the salvage value, the difference is a taxable gain: If the WDBV is greater than the salvage value, the difference is a tax deduction.

30
Working Capital In some projects, there will be a need for a pool of working capital to be set up in the initial years.
It is important to note that changes in net working capital often accompany capital expenditure decisions, regardless of their motive. If a firm acquires new machinery to expand its level of operations,
accompanying such expansion will be increased levels of cash, accounts receivable, inventories, accounts payable and accruals.
Where working capital is required, the total cash outlay amount of this is included in the total overall initial cash outlay of the project. Of course, it is not depreciable.
When the project terminates, the usual assumption is that the working capital flows back into the firm from the project at its initial value.
The idea here is that the project is simply charged for a pool of funds, which simply sits in the project over its entire life. The cash flow is simply out in Y0 and in at year YEND (non-taxable, non-depreciable and unchanging).
Depreciation Depreciation is not a cash flow; it is not a decline in value; it is not a measure of an asset’s exhaustion: it is only a book journal entry showing the amortisation (write-off) of an asset’s initial cost.
We are concerned with depreciation only because it is a tax deductible expense; and we are concerned with tax only because it is in itself a cash outflow.
Cash Flows
All cash flows are assumed to occur at the end of each year, for ease of calculation, with the initial flow occurring at the “end of year zero”. With large long—lived projects this structure is acceptable.

31
NPV is usually considered the best method of assessing investment
opportunities because it takes account of:
1. The timing of the cash flows.
By discounting the various cash flows associated with each project according to when it is expected to arise, it recognises that fact that cash flows do not all occur simultaneously. Associated with this is the fact that, by discounting, using the opportunity cost of finance (i.e. the return which the next best alternative opportunity would generate), the net benefit after financing costs have been met is identified (as the NPV).
2. The whole of the relevant cash flows.
NPV includes all of the relevant cash flows irrespective of when they are expected to occur. It treats them differently according to their date of occurrence, but they are all taken into account of in the NPV and they all have, or can have, an influence on the decision.
3. The objectives of the business.
NPV is the only method of appraisal where the output of the analysis has a direct bearing on the wealth of the business. (Positive NPV’s enhance wealth, negative ones reduce it). Since most private sector businesses seek to increase their value and wealth, NPV clearly is the best approach to use.
4. NPV provides clear decision rules concerning acceptance/rejection of projects and the ranking of projects. It is fairly simple to use, particularly with the availability of modern computer software which takes away the need for routine calculations to be done manually.

32
Tax Shield Companies and individuals pay tax on their profits
(taxable income).
.Since tax deductible expenses reduce profit,
they also reduce tax payments
The tax shield from an expense is the reduction in tax as a result of that expense.
An easy way to interpret a tax shieldis to think of the government
as a 33% partner in the firm(assuming tax rate is 33%).
Every time the firm earns $1,the government claims a 33 % share
(by way of tax).

33
Similarly, every time the firm incurs an expense,the government will contribute 33% of this expense
(the tax shield).A firm is considering purchasing a new machine with the following attributes:
Initial Investment $100,000Salvage Value $20,000Useful Life 4 yearsDepreciation Method Straight LineTax Rate 40%Required Rate of Return (Cost of Capital) 10%Net operating flows from operations $60,000(before tax) per annum
But excluding1. Financing Charges $4,0002. Depreciation $25,0003. Payments to Creditors $5,000
All cash flows (including tax payments and benefits) are assumed to occur at year end.
Calculate the Net Present Value
NET PRESENT VALUE=
(100,000)$ 41,000$ 41,000$ 41,000$ 53,000$
1 (1.10)1 (1.10)2 (1.10)3 (1.10)4
(100,000)$ + 37,273$ + 33,884$ + 30,804$ + 36,200$
38161
+ + + +

34
Written Down Value Depreciation
0 100000 1 75000 250002 50000 250003 25000 250004 0 25000
Salvage Value 20000Written Down Value 0
Profit 20000Tax (40%) 8000
METHOD 1
0 1 2 3 4
Initial Outlay (100,000)$
Salvage value 12,000$ Operations 36,000$ 36,000$ 36,000$ 36,000$ Depreciation 10,000$ 10,000$ 10,000$ 10,000$ Payments to Creditors (5,000)$ (5,000)$ (5,000)$ (5,000)$ Net Cash Flow (100,000)$ 41,000$ 41,000$ 41,000$ 53,000$
METHOD 2

35
0 1 2 3 4
Initial Outlay (100,000)$
Salvage value 20,000$ Operating Flows(Before Tax)Operations 60,000$ 60,000$ 60,000$ 60,000$ Depreciation (25,000)$ (25,000)$ (25,000)$ (25,000)$
35,000$ 35,000$ 35,000$ 55,000$
Tax -40% (14,000)$ (14,000)$ (14,000)$ (22,000)$ 21,000$ 21,000$ 21,000$ 33,000$
Payments to Creditors (5,000)$ (5,000)$ (5,000)$ (5,000)$ Add back Depreciation $25,000 $25,000 $25,000 $25,000Net Cash Flow (100,000)$ 41,000$ 41,000$ 41,000$ 53,000$
Comparison of IRR and NPV
Assume a discount factor of 10%
This problem contrasts the implied reinvestment rates of return under the Internal rate-of-return and net-present-value method. Where the economic lives of mutually exclusive projects are unequal, this clash of reinvestment rates may easily give different conclusions under the two methods. This is so because the internal rate-of-return approach assumes that the reinvestment rate is at least equal to the computed rate of return on the project. The net-

36
present-value approach assumes that the funds obtainable from competing projects can be reinvested at the rate of the company's cost of capital. Comparisons follow:
