€¦ · web viewthe panel sees a stronger local government sector in metropolitan perth as the...
TRANSCRIPT

METROPOLITAN LOCAL GOVERNMENT REVIEW
FINAL REPORT OF THE INDEPENDENT PANEL
JULY 2012


Metropolitan Local Government ReviewFinal Report of the Independent Panel - July 2012
CHAIR’S TRANSMITTAL LETTER
Hon G M (John) Castrilli MLAMinister for Local Government; Heritage; Citizenship and Multicultural Interests8th Floor Dumas House 2 Havelock Street WEST PERTH WA 6005
Dear Minister
I am pleased to provide you with the Metropolitan Local Government Review Panel’s Final Report.
The Panel has unanimously made 30 recommendations, in accordance with its Terms of Reference, which we believe will build the strength, capacity, effectiveness and authority of local government.
The Panel sees a stronger local government sector in metropolitan Perth as the key outcome of this Review. The Panel believes that implementation of its recommendations will enhance the role that local government plays in supporting communities. I am sure that you will agree that the Review is an opportunity for State and local governments, and the community, to support changes that will strengthen the standing of local government in community life.
On behalf of the Panel I would like to thank you for the opportunity to undertake this Review and I look forward to hearing of your consideration of the recommendations the Panel made.
Yours sincerely
Emeritus Professor Alan Robson AM, CitWACHAIR, METROPOLITAN LOCAL GOVERNMENT REVIEW12 July 2012
3 | P a g e

Metropolitan Local Government ReviewFinal Report of the Independent Panel - July 2012
CHAIR’S FOREWORD
In June 2011 the Minister for Local Government, Hon John Castrilli MLA, appointed the Metropolitan Local Government Panel to undertake the important task of considering the current structures and arrangements for local government in Perth and recommending improvements to maximise benefits to the Perth community. The Review has been a once in a generation opportunity to shape the future of Perth, and I have been grateful for the opportunity to be involved.
One of my main observations through this Review is that Perth has a great collection of suburbs, but it does not function as well as it should as a city. The people of Perth are in a buoyant mood and the city is on the edge of a period of great change. This Review of local government provides a chance to make the most of the current environment, and help Perth to take off on the right foot and face its future.
I would like to take this opportunity to thank the members of the Advisory Groups to the Panel including:
Ms Jennifer Mathews, Director General, Department of Local Government Mr Eric Lumsden, Director General, Department of Planning Mayor Troy Pickard, President, and Cr Steve Martin, formerly Deputy
President, Western Australian Local Government Association.The Advisory Groups provided invaluable support and advice to the Panel throughout the Review.
I would also like to thank the Panel Secretariat for their excellent work on this project in preparing research materials and providing executive support. In addition to the Issues Paper and Draft Findings, over 40 background and briefing papers were produced. The Panel also appreciates the administrative, information technology and cartographic assistance provided by staff in the Departments of Local Government and Planning.
Nearly 450 submissions were made to the Panel and I was pleased to have the opportunity to review these and to meet with many members of the community. I would like to thank all of the local government and stakeholder representatives and community members who took the time to participate. Their input was most important and the Review would have been poorer without that participation.
Finally, I would like to thank the other members of the Panel for their contribution to the Review:
Dr Peter Tannock AM, Vice Chancellor Emeritus Dr Sue van Leeuwen, Chief Executive Officer, Leadership WA.
This Final Report makes 30 recommendations which the Panel believes are both achievable and vital for the continued success of Perth.
Perth has a good local government system. I would like the outcome of this Review to be that Perth has a great local government system. I believe the recommendations made by the Panel lay the foundations for this, and I look forward to seeing how these are progressed.
Emeritus Professor Alan Robson AM CitWACHAIR, METROPOLITAN LOCAL GOVERNMENT REVIEWJuly 2012
4 | P a g e

Metropolitan Local Government ReviewFinal Report of the Independent Panel - July 2012
LIST OF ABBREVIATIONS
ACELG Australian Centre for Excellence in Local Government
AC21 Swan Canning Policy Group
CaLD Culturally and Linguistically Diverse
CAT Central Area Transit
CBD Central Business District
COAG Council of Australian Governments
DAP Development Assessment Panel
DLG Department of Local Government
DR Development and Resources stream (of SAT)
EMRC East Metropolitan Regional Council
FPTP First-past-the-post
GRV Gross Rental Value
HACC Home and Community Care
LGAB Local Government Advisory Board
LGMA Local Government Managers Australia
LPS Local Planning Scheme
MRA Metropolitan Redevelopment Authority
MRPA Metropolitan Regional Planning Authority
MRS Metropolitan Region Scheme
NRM Natural Resource Management
PAMG Perth Airport Municipalities Group
QEII Queen Elizabeth II Medical Centre
RC Regional Council
RDC Regional Development Commission
RLG Regional Local Government
ROC Regional Organisation of Councils
SAT State Administrative Tribunal
SMRC South Metropolitan Regional Council
TPS Town Planning Scheme
UV Unimproved Value
UWA University of Western Australia
WALGA Western Australian Local Government Association
WAPC Western Australian Planning Commission
WESROC Western Suburbs Regional Organisation of Councils
WMRC Western Metropolitan Regional Council
5 | P a g e

Metropolitan Local Government ReviewFinal Report of the Independent Panel - July 2012
CONTENTSCHAIR’S TRANSMITTAL LETTER.................................................................................................1CHAIR’S FOREWORD...............................................................................................................2LIST OF ABBREVIATIONS..........................................................................................................3CONTENTS.............................................................................................................................. 4LIST OF FIGURES..................................................................................................................... 6LIST OF TABLES...................................................................................................................... 7EXECUTIVE SUMMARY AND RECOMMENDATIONS.......................................................................8
Recommendations..........................................................................................................13SECTION 1: THE REVIEW: ESTABLISHMENT AND PROCESS.........................................16
1.1 Introduction.........................................................................................................161.2 Background.........................................................................................................161.3 Panel members...................................................................................................161.4 Terms of reference..............................................................................................171.5 Defining metropolitan Perth.................................................................................171.6 Principles for the Metropolitan Local Government Review..................................191.7 Engaging the community.....................................................................................20
SECTION 2: THE NEED FOR MORE EFFECTIVE METROPOLITAN GOVERNANCE........212.1 A need for change...............................................................................................212.2 Previous reviews and boundary changes in Perth..............................................232.3 A vision for metropolitan Perth............................................................................252.4 Changes to Perth local government arrangements.............................................262.5 Relationships, roles and functions.......................................................................262.6 Working towards an ideal structure for local government....................................272.7 Governance.........................................................................................................28
SECTION 3: KEY DRIVERS AFFECTING THE FUTURE OF PERTH AND LOCAL GOVERNMENT......................................................................................................................29
3.1 ECONOMIC ISSUES..............................................................................................303.2 SOCIAL ISSUES.....................................................................................................32
3.2.1 Population.......................................................................................................323.2.2 Ageing.............................................................................................................343.2.3 Changing household structure and demographic diversity..............................353.2.4 Urban consolidation and housing....................................................................383.2.5 Critical public infrastructure.............................................................................393.2.6 Impacts of new technology..............................................................................40
3.3 ENVIRONMENTAL ISSUES...................................................................................413.3.1 Coastal zone management.............................................................................423.3.2 Water Management.........................................................................................433.3.3 The Swan and Canning River system.............................................................443.3.4 Waste management........................................................................................44
3.4 REGIONAL ISSUES...............................................................................................463.4.1 Governance and planning...............................................................................463.4.2 Urban planning in Perth...................................................................................483.4.3 Organisation of State Government agencies...................................................563.4.4 The Commonwealth Government....................................................................563.4.5 Other players in metropolitan governance.......................................................573.4.6 Review of capital city strategic planning systems............................................57
3.5 CONCLUSION............................................................................................................60SECTION 4: LOCAL GOVERNMENT IN METROPOLITAN PERTH – ROLES AND RELATIONSHIPS................................................................................................................... 61
4.1 CURRENT STATUS.....................................................................................................614.1.1 The legislative context.....................................................................................614.1.2 The role of local government in metropolitan Perth.........................................684.1.3 State and local government relationship, roles and functions.........................714.1.4 Conclusions.....................................................................................................77
4.2 RECOMMENDATIONS..................................................................................................77
6 | P a g e

Metropolitan Local Government ReviewFinal Report of the Independent Panel - July 2012
SECTION 5: IMPROVED LOCAL GOVERNMENT STRUCTURES......................................795.1 CURRENT STATUS - LOCAL GOVERNMENT IN PERTH....................................................79
5.1.1 Local government finance...............................................................................815.1.2 Regional Local Governments..........................................................................855.1.3 Local government employment.......................................................................875.1.4 Integrated Planning in local government.........................................................88
5.2 KEY ISSUES..............................................................................................................905.3 ALTERNATIVE REFORM ARRANGEMENTS.....................................................................96
5.3.1 The amalgamation debate...............................................................................975.3.2 Options for structural change in metropolitan Perth......................................1045.3.3 Towards metropolitan governance................................................................109
5.4 THE PANEL’S CONCLUSIONS ON STRUCTURAL REFORM............................1125.4.1 Benefits of reform..........................................................................................1125.4.2 Community and representation.....................................................................1245.4.3 The future of regional local governments......................................................1275.4.4 Potential for Council Controlled Organisations/Local Government Enterprises
1275.4.5 Institutions.....................................................................................................1285.4.6 A process for periodic boundary reviews.......................................................1285.4.7 The size of the City of Perth.........................................................................1295.4.8 The edge of the metropolitan area................................................................129
5.5 THE PANEL’S PREFERRED MODEL: RECOMMENDATIONS ON NEW LOCAL GOVERNMENT BOUNDARIES....................................................................................................................... 130
5.5.1 A new structure and boundaries for local government in metropolitan Perth 1315.5.2 Proposed local government entities..............................................................136
5.6 RECOMMENDATIONS................................................................................................143SECTION 6: IMPROVED MODELS OF GOVERNANCE.....................................................145
6.1 CURRENT GOVERNANCE ARRANGEMENTS................................................................1456.1.1 Local government elections...........................................................................1456.1.2 Election of Mayors.........................................................................................1516.1.3 Roles, remuneration and training..................................................................151
6.2 RECOMMENDATIONS.........................................................................................157SECTION 7: IMPLEMENTATION ISSUES..........................................................................159
7.1 THE NEED FOR AN INDEPENDENT BODY....................................................................1627.2 ISSUES FOR CONSIDERATION IF BOUNDARY CHANGES OCCUR....................................1657.3 THE PANEL’S VIEW AND FINDINGS...........................................................................1677.4 RECOMMENDATIONS................................................................................................168
APPENDICES...................................................................................................................... 169Appendix 1.1 Issues Paper submissions.......................................................................170Appendix 1.2 Submissions received on the Draft Findings...........................................173Appendix 2 Engagement and consultation by the Panel during the Review.................175Appendix 3.1.................................................................................................................178Regional arrangements for government in metropolitan Perth......................................178Appendix 3.2 COAG Criteria for future strategic planning of capital cities....................185
7 | P a g e

Metropolitan Local Government ReviewFinal Report of the Independent Panel - July 2012
LIST OF FIGURES
Figure 1.1 Local governments in the Perth metropolitan region, 2012……………. 18Figure 3.1 WAPC Central sub-region and local government areas……………….. 54Figure 3.2 WAPC Planning sub-regions and local government areas……………… 55Figure 5.1 Regional local government arrangements, 2005………………………… 86Figure 5.2 Local Government Performance Measurement Framework
– Metropolitan Baseline Survey Results…………………………………. 90Figure 5.3 Option A: Amalgamations only………………………………………….… 132Figure 5.4 Preferred Option B: Amalgamation and splitting of local government
areas……………………………………………………………………….… 134
8 | P a g e

Metropolitan Local Government ReviewFinal Report of the Independent Panel - July 2012
LIST OF TABLES
Table 2.1 Local Government in Australia’s capital cities………………………… 25Table 3.1 Population forecasts to 2026 by metropolitan local government…… 33Table 3.2 Average family weekly income in metropolitan Perth, 2006………… 36Table 3.3 Median family income in Australian cities, 2006…………………….. 37Table 3.4 Town Planning Schemes (TPS) in metropolitan Perth………….…… 49Table 3.5 Findings for Perth against the COAG criteria for future strategic planning of
capital cities ……………………………………………………………… 59Table 4.1 Endowment of lands rating, Town of Cambridge……………………… 64Table 5.1 Diversity in the Western Australian local government sector………… 79Table 5.2 Diversity in metropolitan Perth local governments…………………… 80Table 5.3 Metropolitan local government as percentage of State total…………. 80Table 5.4 Metropolitan local government operating revenues from
2005/06 to 2010/11………………………………………………………… 83Table 5.5 Financial Assistance Grant Allocations for 2011/12…………………………84Table 5.6 Employment in Perth metropolitan local governments,
by operating program, 2010-11…………………………………………. 87Table 5.7 SAT recommendations on CEO Salaries………………………………. 88Table 5.8 Complaints received by Department of Local Government about metropolitan
local governments…………………………………………………………. 93Table 5.9 Population projections for planning sub-regions……………………….. 107Table 5.10 Option A: Amalgamations only…………………………………………… 133Table 5.11 Preferred Option B: Amalgamations and splitting of local government
areas……………………………………………………………………….. 135Table 6.1 Participation rates in metropolitan local government general
Elections, 2005-2011……………………………………………………………146Table 6.2 Interstate electoral systems comparative data……………………….. 148Table 6.3 First-past-the-post voting – Electoral Reform Society arguments…… 150Table 6.4 Elected member remuneration legislative provisions……………….. 155Table 6.5 Payments to elected members by metropolitan local government…… 156
9 | P a g e

Metropolitan Local Government ReviewFinal Report of the Independent Panel - July 2012
EXECUTIVE SUMMARY AND RECOMMENDATIONS
Drivers of change
With the population expected to reach 2.3 million by 2026, and perhaps 3.5 million by 2050, Perth’s metropolitan area is experiencing an unprecedented rate of growth. The city is on the cusp of a period of transformational change due to population growth and economic development. The community is already seeing the visible evidence of this change in major new developments such as Elizabeth Quay, the City Link, Fiona Stanley Hospital and the Gateway WA airport project.
Historically, Perth’s position was seen as peripheral to the nation, but a recent shift in global power to Asian economies means that Perth now holds a more strategic global position. A shift in global power is evident, and Perth is strategically closer to the Asian economic powerhouses than other Australian cities. Perth is increasing its engagement with the world economy as a locale of decision-making and power and is becoming one of the global headquarters for the energy and mining sectors. It is important that we establish structures and frameworks that will accommodate these changes and ensure that Perth is enhanced by its development rather than struggling to keep pace.
Nationally and internationally, major cities have recently reviewed or are currently reviewing their local government structures and governance models to better deal with the same issues and challenges that Perth is facing.
The Council of Australian Governments (COAG) has recognised the importance of cities for Australia’s growth, prosperity, sustainability and liveability. A key message in recent work for COAG is that Australia is at a watershed point for its capital cities and their strategic planning. The assumptions underpinning the development of our capital cities have changed, so development must change accordingly.
While working with other levels of government, metropolitan local government faces some major challenges in planning for an increasing and changing population, including: securing the land required to accommodate the increased population changing community perceptions of housing size and density fulfilling the demand for a diversity of housing of suitable size and location
(including the ‘empty-nester’ market) minimising impacts such as biodiversity and habitat loss, air and water pollution planning for increased road use, or promoting alternatives planning sustainable urban forms that retain amenity, liveability and affordability.
In addition to its role in managing accelerated growth, local government also needs to play its part in challenges it has not faced previously: facilitating the continued supply of affordable housing managing demographic change responding to the effects of environmental change reducing urban congestion contributing to the provision of an adequate transport system maintaining ageing assets co-ordinating the effective provision of critical infrastructure adapting to the changing use of technology.
10 | P a g e

Metropolitan Local Government ReviewFinal Report of the Independent Panel - July 2012
Despite this context of growth and economic, social and technological change, Perth’s local government structure has remained unchanged since the early 1900s. Perth is one of the few major Australian cities which has not seen major local government reform.
The Review
The Metropolitan Local Government Review Panel was appointed in June 2011 to examine the current and anticipated regional, social, environmental and economic issues affecting, or likely to affect, the growth of metropolitan Perth in the next 50 years, as well as current and anticipated national and international factors. The Panel’s task was to recommend the most appropriate local government structures and governance models for metropolitan Perth.
After nearly a year’s work, the Panel has concluded that maintaining the status quo, comprising 30 metropolitan local governments of varying sizes and capacities, is not in the best interests of metropolitan Perth. To reach this conclusion, the Panel considered a broad range of evidence, including: over 40 specifically prepared information papers academic literature from various sources the views expressed at two community forums and one local government forum over 250 submissions on its Issues Paper and 195 submissions on its Draft
Findings direct conversations with representatives of local governments, State government
agencies, community organisations and individuals advice from the expert representatives on its Advisory Groups.
The Panel found weaknesses with the current metropolitan local government arrangements: There is a significant level of duplication and wasted resources. There are great inconsistencies in processes and approaches which result in
difficulties for business, lost opportunities for communities, and confusion for consumers.
The fragmented approach to local planning results in a system that is unnecessarily complicated, uncoordinated and lacking in strategic focus.
Some local government boundaries are illogical. There is a great variation in the size and capacity of local governments. A large disparity in service levels between different local governments exists. The structure has limited ability to address region-wide issues. The current structure will not serve Perth’s future needs.
Many issues of metropolitan governance examined by the Panel do not have quick or one-off solutions. Due to their complexity, and the fact that they usually span more than one local government area, they require cooperation and support between agencies, and a joint commitment to reach outcomes. In examining the critical and strategic issues affecting the future of metropolitan Perth, pertaining to the natural environment and to the urban environment and infrastructure, the Panel has concluded that some issues are beyond the current capacity of local government and a more strategic response is required.
In summary, the Panel was unanimous in its finding that 30 local governments are too many for the Perth region.
11 | P a g e

Metropolitan Local Government ReviewFinal Report of the Independent Panel - July 2012
Roles and relationships
The role of local government has extended beyond the provision of the traditional services of ‘roads, rates and rubbish’. It is now responsible for delivering services while considering the triple bottom line for the community – prosperity, environmental sustainability and social justice. Local government is under pressure to provide an expanding range and higher standard of services. The role of local government has changed dramatically over the years, particularly in recent times, but the structure has changed little in a century.
While legislation is key in determining the role of local government, most of the services that local governments traditionally provide, such as community services, recreation, footpaths and parks, do not fall within specific legislation. Instead, they are provided to communities based on demand and local governments’ general competence powers.
The Panel notes the argument that the functions of local government have expanded and diversified without a corresponding increase in financial capacity. In some cases, state and Commonwealth governments have handed functions to local government with accompanying funding, but the funding has not always kept pace with changes in demand and costs.
The Panel found the relationship between State and local government to be deficient in many areas. It concluded that improving this relationship and reforming roles and functions are essential to help Perth function better as a city. The Panel recommends that a collaborative process between State and local government should be established. A new Partnership Agreement, identifying issues important to the State and key result areas for both levels of government, will provides a basis for improved working relationships.
A central theme that emerged from the Review was that some functions of local government require greater co-ordination across local governments. This may be because the same issue affects multiple local governments, or because the decision made in one local government will influence another. The Panel examined if some local government functions could be managed from a metropolitan-wide perspective. For example, many respondents agreed that waste management would have improved co-ordination if it was the State’s responsibility. The Panel agrees and recommends that the State Government take over the role of waste management.
Structure
At the time of releasing its Draft Findings, the Panel considered the most appropriate options for to be the following: 10 to 12 local governments five to six local governments one metropolitan local government.
Feedback from the submissions showed limited support for five to six, and one local government. After further deliberation, including considering the information presented in the submissions the Panel determined that a structure based on 12 local governments was its preferred model.
These 12 new local governments were based on activity centres identified in the West Australian Planning Commission’s Directions 2031 and Beyond. The Panel
12 | P a g e

Metropolitan Local Government ReviewFinal Report of the Independent Panel - July 2012
then needed to decide on boundaries for these 12 local governments. In doing so, they considered the financial viability of local governments, communities of interest, environmental issues, demographic change and population growth. The size of each local government was determined by considering the degree of existing duplication across the metropolitan area, the potential for functional realignment, the capacity for advocacy, the spread of the rates base mix, and the capacity to undertake significant projects in conjunction with other levels of government.
In addition to the structure and boundaries for local government in Perth, the Panel makes recommendations regarding: the need for best practice community engagement the size and role of the City of Perth a mechanism for greater region-wide co-ordination and cooperation, such as a
forum of mayors periodic boundary reviews the role of regional local governments (RLGs).
Governance
The Panel recommends changes to the current governance model to ensure the ongoing legitimacy of local government. Priorities for the Panel were addressing declining rates of participation in elections, and providing clarity about the roles and responsibilities of elected members and senior staff.
The Panel agreed that local government elections should have the same standing as State and Commonwealth elections and therefore recommends that all local government elections are managed by the Western Australian Electoral Commission, and that voting is compulsory. The Panel also recommends that Mayors be elected directly by the community and limits should apply on the number of consecutive terms an elected member can serve.
The current roles of the Mayor/President and Chief Executive Officer are set out in the Local Government Act 1995, but the Panel heard consistently throughout the Review that the roles need clarification. A number of major inquiries have stemmed from problems in the relationship between elected members and senior staff. The Panel recommends a series of measures to address these issues including a review of the legislation, increased training, appropriate remuneration and greater recognition of the leadership role of elected members.
Implementation
The Panel recommends that an independent Commission be established to oversee the implementation of its recommendations. While some local governments will have the technical and leadership skills required to implement change, others will not, so there will need to be considerable attention given to change management processes.
The Panel strongly recommends the timely implementation of the proposals and views this as critical to laying the foundations for the success of the new entities. The local government sector has expressed concern with the damage caused by the uncertainty of the reform process to date, such as losing staff to other sectors, reduction in morale, and an inability to attract new staff.
The Panel’s recommendations are geared towards providing the right foundations for Perth’s future. The changes it has proposed are framed around: a focus on the future
13 | P a g e

Metropolitan Local Government ReviewFinal Report of the Independent Panel - July 2012
providing the foundation for better services and communities through more strategic leadership and decision making
facilitating better community engagement.
The Panel believes these objectives cannot be achieved by minor boundary amendments or piecemeal amalgamations. This has been the approach in the past, and experience shows that it costs money, causes friction and animosity, fails to achieve significant outcomes, and directs council resources away from core issues. The Panel also notes there have been previous reviews, but these have not produced a meaningful modification of the arrangements.
The Panel has carefully considered its recommendations to work together as a suite. While some of the recommendations may bring benefit if adopted alone, the Panel strongly recommends they be considered as a complete reform package, which should be implemented in its entirety for maximum success.
Finally, the Panel sees a stronger, more effective and enhanced local government sector in metropolitan Perth as the outcome of this Review. It does not wish to see any diminution of the role that local government plays in creating and supporting liveable and vibrant communities. The changes proposed in this report are intended to build the strength, capacity, effectiveness and authority of local government.
14 | P a g e

Metropolitan Local Government ReviewFinal Report of the Independent Panel - July 2012
Recommendations
The Panel recommends that:
1. The State Government give consideration to the inequities that exist in local government rating, including rate-equivalent payments and State Agreement Acts.
2. A collaborative process between State and local government be commenced to establish a new Partnership Agreement which will progress strategic issues and key result areas for both State Government and local government.
3. The State Government facilitate improved co-ordination between State Government agencies in the metropolitan area, including between State Government agencies and local government.
4. A full review of State and local government functions be undertaken by the proposed Local Government Commission as a second stage in the reform process.
5. In conjunction with the proposed structural and governance reforms, that local government planning approval powers be reinstated in metropolitan Perth by the State Government.
6. The State Government consider the management of waste treatment and disposal at a metropolitan-wide scale either be undertaken by a State authority or through a partnership with local government.
7. A shared vision for the future of Perth be developed by the State Government, in conjunction with local government, stakeholder and community groups.
8. A Forum of Mayors be formed to facilitate regional collaboration and effective lobbying for the needs of the metropolitan area and to provide a voice for Perth.
9. The Forum of Mayors be chaired by the Lord Mayor of the modified City of Perth in the first instance.
10. The newly created local governments should make the development and support of best practice community engagement a priority, including consideration of place management approaches and participatory governance modes, recognition of new and emerging social media channels and the use of open-government platforms.
11. The existing Regional Local Governments in the metropolitan area be dissolved, their provisions in the Local Government Act 1995 be repealed for the metropolitan area and a transitional plan for dissolving the existing bodies in the metropolitan area be developed.
12. The State Government give consideration to transferring oversight responsibility for developments at Perth’s airports, major hospitals and universities to the Metropolitan Redevelopment Authority.
15 | P a g e

Metropolitan Local Government ReviewFinal Report of the Independent Panel - July 2012
13. Periodic local government boundary reviews are undertaken by an independent body every 15 years to ensure the city’s local government structure continues to be optimal as the metropolitan region develops.
14. The Local Government Advisory Board be dissolved and its operating and process provisions in the Local Government Act 1995 be rescinded, with the Local Government Commission taking over its roles, including consideration of representation reviews.
15. A new structure of local government in metropolitan Perth be created through specific legislation which:
a) incorporates all of the Swan and Canning Rivers within applicable local government areas
b) transfers Rottnest Island to the proposed local government centred around the City of Fremantle
c) reduces the number of local governments in metropolitan Perth to 12, with boundaries as detailed in Section 5 of this report.
16. Consideration be given to all local government elections being conducted by the Western Australian Electoral Commission.
17. Compulsory voting for local government elections be enacted.
18. All Mayors and Presidents be directly elected by the community.
19. Party and group nominations for local government electoral vacancies be permitted.
20. Elected members be limited to serving three consecutive terms as councillor and two consecutive terms as Mayor/President.
21. Elected members be provided with appropriate training to encourage strategic leadership and board-like behaviour.
22. A full review of the current legislation be conducted to address the issue of the property franchise and the most appropriate voting system (noting the Panel considers that first-past-the-post is inappropriate for the larger districts that it has recommended).
23. Implementation of the proposed setting of fees and allowances for elected members as set by the Salaries and Allowances Tribunal.
24. Payments made to elected members be reported to the community on a regular basis by each local government.
25. The Public Sector Commission provide advice and assistance to local governments in the appointment and performance management of local government Chief Executive Officers with consideration given to the Public Sector Commission being represented on relevant selection panels and committees.
16 | P a g e

Metropolitan Local Government ReviewFinal Report of the Independent Panel - July 2012
26. A State Government decision on reform should be made as soon as possible, and if the decision is to proceed with structural reforms, the process of implementation should begin without delay.
27. Councils take on a leadership role in the reform debate and prepare their residents now for the possibility of changes in the future.
28. The State Government assist and support local governments by providing tools to cope with change and developing an overarching communication and change management strategy.
29. A Local Government Commission be established as an independent body to administer and implement the structural and governance reforms recommended by the Panel, and facilitate the ongoing relationship between State and local government.
30. The recommendations from the Panel should be considered as a complete reform package and be implemented in their entirety.
17 | P a g e
Metropolitan Local Government ReviewFinal Report of the Independent Panel - July 2012
SECTION 1: THE REVIEW: ESTABLISHMENT AND PROCESS
1.1 Introduction
This is the Final Report of the independent Metropolitan Local Government Review Panel, which commenced its work in July 2011.
1.2 Background
On 24 June 2011 a review of Perth metropolitan local government and broader governance structures was announced by the Minister for Local Government, the Hon John Castrilli MLA.
The Metropolitan Local Government Review Panel was appointed to examine the social, economic and environmental challenges facing metropolitan Perth. This independent Panel was charged with recommending appropriate boundaries and governance models for local governments in the Perth metropolitan area.
1.3 Panel members
The Panel members were: Emeritus Professor Alan Robson AM CitWA, former Vice Chancellor of The
University of Western Australia (Chair)
Dr Peter Tannock, former Vice Chancellor of the University of Notre Dame Australia
Dr Sue van Leeuwen, Chief Executive Officer of Leadership WA.
As well as having strong academic backgrounds, the Panel members were selected for their extensive experience in administration, management and leadership within the education, not-for-profit and government sectors. The Panel members were appointed by the Minister on the basis of their experience and capacity to provide strategic advice and leadership on the future for local government in metropolitan Perth.
Two Advisory Groups were appointed to provide expert advice to the Panel. One consisted of the Directors General of the Departments of Local Government (Ms Jennifer Mathews) and Planning (Mr Eric Lumsden). The other consisted of the President (Mayor Troy Pickard) and (former) Deputy President Cr Steve Martin of the Western Australian Local Government Association (WALGA).
The Panel was very well supported by staff seconded from the Department of Local Government (DLG), principally Dr Chris Berry (Project Director), Helena Waldmann (Senior Policy Officer), and Laura Dell'Utri (Project Officer). Assistance was also provided as needed by Linda Sperring and Rachel Millard.
18 | P a g e

Metropolitan Local Government ReviewFinal Report of the Independent Panel - July 2012
1.4 Terms of reference
The Panel’s Terms of Reference were to:1. Identify current and anticipated specific regional, social, environmental and
economic issues affecting, or likely to affect, the growth of metropolitan Perth in the next 50 years.
2. Identify current and anticipated national and international factors likely to impact in the next 50 years.
3. Research improved local government structures, and governance models and structures for the Perth metropolitan area, drawing on national and international experience and examining key issues relating to community representation, engagement, accountability and State imperatives among other things the Panel may identify during the course of the review.
4. Identify new local government boundaries and a resultant reduction in the overall number of local governments to better meet the needs of the community.
5. Prepare options to establish the most effective local government structures and governance models that take into account matters identified through the review including, but not limited to, community engagement, patterns of demographic change, regional and State growth and international factors which are likely to impact; and
6. Present a limited list of achievable options together with a recommendation on the preferred option.
The Panel was required to submit its final recommendations to the Minister by 30 June 2012.
1.5 Defining metropolitan Perth
The area subject to this Review is metropolitan Perth, which corresponds to the area of the Metropolitan Region Scheme (MRS), containing 30 local governments. The region stretches from Yanchep and Two Rocks in the north to Singleton in the south, and from Bullsbrook in the north-east to Serpentine in the south-east.
Under the Local Government Act 1995 the ‘Metropolitan Area’ is defined as having the same meaning as ‘Metropolitan Region’ under the Planning and Development Act 1995. This Planning and Development Act 1995 area is also the same as the Australian Bureau of Statistics’ Perth Metropolitan Statistical Division.1
The Panel notes that Department of Planning’s Directions 2031 and Beyond, Metropolitan Planning Beyond the Horizon document covers both the Perth and Peel regions. There are separate sub-regional strategies for the central metropolitan Perth region and the outer metropolitan Perth and Peel region. The outer sub-regional strategy covers 14 local governments and focuses on the planned management of urban expansion, and includes councils in the Peel region. Mandurah is not a part of the Perth metropolitan region, and therefore not part of the Review, but the Panel notes that it has a strong planning and economic connection to the metropolitan region. The City of Mandurah contributed to the Review by meeting with and
1 The Panel notes that ‘Metropolitan’ is defined differently in the Regional Development Commission Act, which classifies the Shire of Serpentine-Jarrahdale in the Peel Region. However, by virtue of the Local Government Act 1995, the Shire of Serpentine-Jarrahdale is included the Perth metropolitan region for this review.
19 | P a g e

Metropolitan Local Government ReviewFinal Report of the Independent Panel - July 2012
providing submissions to the Panel. The Shire of Murray also made a submission to the panel.
Figure 1.1: Local governments in the Perth metropolitan region, 2012
20 | P a g e

Metropolitan Local Government ReviewFinal Report of the Independent Panel - July 2012
1.6 Principles for the Metropolitan Local Government Review
The Panel recognised early in its deliberations that in preparing options for Perth’s future local government arrangements, it was desirable that key principles be developed.
The principles developed in 2000 by the Organisation for Economic Co-operation and Development (OECD) for improving governance in metropolitan areas provided a starting point,2 as did recent work by the Grattan Institute.3 The Panel considered the latter paper which investigates governance arrangements and decision-making in eight4 of the world’s most liveable cities.
The following principles were developed by the Panel to guide its decision-making:5
Long-term approach: the Panel’s recommendations will focus on long-term and strategic proposals for local government in the metropolitan area. This approach will ensure Perth is prepared for the future and able to sustain a productive economy, diverse communities and a healthy environment.
Community outcomes: community wellbeing, both short and long term, will underpin the Panel’s recommendations. Change to local government, if required, should improve metropolitan Perth for the people that live in it, work in it, and visit the area.
Equity: the Panel’s recommendations will seek equity, not only among the residents of the metropolitan area, but equity between generations. Decisions made now should not adversely affect future generations.
Clarity: the Panel’s recommendations will seek clarity as to which level of government, or other organisation, is best placed to provide services to communities. The recommendations will identify funding sources, and provide evidence of the sustainability of any proposed arrangements.
City scale: the Panel will make recommendations for the benefit of metropolitan Perth as a city. While acknowledging the diversity of local communities, and the value of local-level governance, the Panel will focus on outcomes that are best for the metropolitan area as a whole.
Best city: the Panel’s recommendations will build on the best of Perth’s attributes, ensuring its future as a sustainable, liveable, attractive, competitive, dynamic and connected city while building its international reputation as one of the world’s most successful cities.
Evidence based: the Panel’s recommendations will be based on thorough investigation and sound research.
By returning to these principles throughout the Review, the Panel established a clear and sound basis for its final recommendations.
2 OECD (2000), The reform of metropolitan governance, viewed 26 June 2012, http://www.oecd.org/dataoecd/3/17/1918016.pdf3 Jane-Frances Kelly, Grattan Institute (2010), Cities: Who Decides?, viewed 26 June 2012, http://grattan.edu.au/static/files/assets/69a79996/052_cities_who_decides.pdf4 Vancouver, Toronto, Seattle, Portland, Chicago, Austin, Dublin and Copenhagen.5 MLGR (2011), Draft Key Principles for the Review, http://metroreview.dlg.wa.gov.au/BackgroundInformation.aspx
21 | P a g e

Metropolitan Local Government ReviewFinal Report of the Independent Panel - July 2012
1.7 Engaging the community
A key priority for the Panel was to engage with the community, State and local governments and stakeholder organisations throughout the Review. To meet this aim, the Panel:
conducted two public forums and one local government forum met individually with representatives of 25 metropolitan local governments met with representatives of 21 other key organisations, including 11 government
agencies released an Issues Paper in October 2011 and Draft Findings in April 2012 for
public comment maintained a website displaying the papers and information considered by the
Panel, and submissions on the Issues Paper and Draft Findings6.
The release of both the Issues Paper and Draft Findings was accompanied by significant electronic and printed media coverage. Over 250 and 190 submissions were received on each paper respectively. The Panel considered all submissions in reaching the conclusion outlined in this report. At the time of submitting this Final Report, the Panel’s website has had almost 20,000 visits, demonstrating the significant interest generated by the Review. Appendix 2 details the engagement and consultation process the Panel undertook.
The Panel would like to acknowledge the valuable contributions of those who have participated in the Review. In particular it would like to thank the community members and organisations who met with the Panel and submitted comments on the Issues Paper and Draft Findings, the Panel Advisory Groups, the West Australian Local Government Association, and the local government sector in metropolitan Perth, including both elected members and staff.
Throughout its consultation phase, the Panel confirmed its view that it sees a stronger, enhanced local government sector in metropolitan Perth as the main outcome of this Review. It does not wish to see any diminution of the role that local government plays in supporting communities. The changes proposed in this report are intended to build the strength, capacity, effectiveness and authority of local government. The Review is an opportunity for state and local governments, and the community, to support changes that will strengthen the standing of local government in community life.
6 Not all submitters gave permission for their comments to be made public. See Appendix 1 for list of individuals and organisations from whom submissions were received.
22 | P a g e

Metropolitan Local Government ReviewFinal Report of the Independent Panel - July 2012
SECTION 2: THE NEED FOR MORE EFFECTIVE METROPOLITAN GOVERNANCE (Addressing Terms of Reference 1 and 2)
2.1 A need for change
Coming from professions outside of the local government sector, Panel members were independent of vested interests and able to commence this Review with open minds. As such, it was not a judgement of individual local governments, but a review for the future of the whole structure and system.
After considering a broad range of information and hearing from a variety of stakeholders and community members, the Panel concludes that that there is a need for significant change in Perth’s local government arrangements. While there are many positive aspects to local government in metropolitan Perth, the Panel believes it is not in the best interests of the wider community for the status quo to be maintained.
The Panel received information in research and background papers, and in submissions and consultations which it has used to inform its decisions. While there are some gaps in the data and information available, the evidence is sufficiently detailed for conclusions to be drawn about the local government system in Perth and the improvements that should be made.
The Panel found that in addition to some of the local government boundaries being illogical, and great variations in size, thirty local governments is simply too many for the Perth region. The current arrangement and severely fragmented structure creates a high level of duplication, inconsistencies and difficulties for business, lost opportunities for communities, confusion for consumers and planning that is complicated, uncoordinated and un-strategic. Renowned urbanist Charles Landry made similar observations during his appointment as ‘thinker in residence’ in Perth in 2007.7
It was evident to the Panel that some local governments are performing well. They provide excellent services, engage well with their communities and create a place where people want to live. Perth has a vast collection of diverse neighbourhoods and many appealing suburbs, but it needs to function better as a metropolitan area. In seeking to improve the governance of metropolitan Perth, it is important that the best aspects of the existing system are retained.
Current growth scenarios for Perth create a sense of urgency for the community to contemplate its future. Perth added 1 million people to its population between 1971 and 2006 and it is expected that the next 1 million will be added in just 20 years. With a faster rate of growth than ever experienced before, Perth is undoubtedly changing as a city. It has a strong economy and a sense of optimism. The current phase of major developments, both inner-city and region-wide, is changing the fabric of the city. The growth is also impacting on adjoining regions including the Peel. The State, through the Western Australian Planning Commission (WAPC), has developed Directions 2031 as the overarching planning document for Perth, identifying strategic activity centres and areas where people will live in the future.
7 Charles Landry (2007), Perth: Town or City, viewed 26 June 2012, http://www.charleslandry.com/index.php?l=artic
23 | P a g e

Metropolitan Local Government ReviewFinal Report of the Independent Panel - July 2012
While other regional cities such as Karratha are also growing, Perth will remain the principal city of Western Australia.
The 21st Century has been described as ‘the century of the city’. As noted in a discussion paper commissioned by Warringah Council (Sydney, NSW), ‘the balance of influence internationally is shifting from nation states to cities – economic and cultural relations are more and more city-to-city rather than country-to-country. This makes how we govern our cities increasingly important. If Sydney is to compete with other global cities, it needs metropolitan and local governance which is equal to the best in the world.’8 The Panel believes the same statement applies to Perth.
A key message in recent work for the COAG is that Australia is at a watershed point for its capital cities and their strategic planning. Population growth, demographic change, increasing energy costs and the shift to a knowledge economy have changed the assumptions underpinning the shape and development of Australian cities.
Nationally and internationally, major cities have recently reviewed or are currently undertaking a review of their local government structures and governance models. Reforms have been proposed or implemented in Hobart and Adelaide, across Queensland and New South Wales, and in Auckland and Wellington.
It is therefore timely that this Review of Perth’s local government structures and governance be undertaken. The challenge for the Panel has been to consider what kind of local government system and structure would be ideally placed to meet the demands of Perth into the future. The first priority was not to focus on how many local governments there should be, but on how to best deliver effective local government services to the community into the future.
A recent paper prepared for the Australian Centre for Excellence in Local Government (ACELG) notes that:
The available evidence points to a particular need for ongoing consolidation of local government activities in metropolitan areas. Growing concerns about Australia’s capacity to manage rapid metropolitan growth and change, and the federal government’s move to develop a national urban policy and promote better metropolitan planning, call for a demonstration of local government’s capacity to make a strong contribution on behalf of local communities and in the broader regional and national interest. There is a widespread view that this calls for substantially larger local government units as well as collaborative planning and resource sharing.9
The Panel’s view is that local government reform is needed not just for economic development, but for social and environmental reasons as well.
The Committee for Perth notes the importance of city-wide regional governance in the Discussion Paper from the Perth @ 3.5 Million Visioning Workshop:
In order to effectively compete with other metropolitan regions throughout the world, the Perth metropolitan region needs to be formally organised to explicitly serve the purposes of the region in pursuit of economic
8 McKinlay Douglas Ltd, Warringah Council (2011), Local Government Reform: Have your say, p. 8, viewed 26 June 2012, http://yoursaywarringah.com.au/LGovreform9 Aulich, C et al (2011) Consolidation in local government: a fresh look, Volume 1: Report, p. 8, viewed 27/06/2012, http://www.acelg.org.au/upload/Consolidation%20Final%20Report%20Vol%201_web.pdf
24 | P a g e

Metropolitan Local Government ReviewFinal Report of the Independent Panel - July 2012
development. The current governance structure fails to achieve this for two reasons: local government is too fragmented; and there is no dedicated mechanism for integrated regional cooperation (i.e. there is no specific mechanism for regional integration and there are poor links at a state government level between different Ministries influencing regional development.10
The Panel’s recommendations are aimed at providing the right foundations for Perth’s future growth. The recommendations cannot be achieved by minor boundary amendments. This has been the approach in the past, and experience has shown that these changes cost money, cause friction and animosity, fail to achieve significant outcomes and direct council resources away from core issues. This is not the right way to progress genuine reform.
2.2 Previous reviews and boundary changes in Perth
Perth’s local government structure has been virtually static since the early 1900s when the population was around 73,000. During Perth’s first boom, the number of local authorities increased from seven in 1890, to 25 in 1899, and 34 in 1907 to reflect the population growth.11 The numerous previous reviews of local government have not resulted in significant change. Previous reviews have included:
1954 Departmental Report on Boundaries (Chairman: White)recommended reduction to 11 or 19.
1968 Local Government Assessment Committee (Chairman: Mathea) recommended reduction from 27 to 17.
1972 Local Government Boundaries Commission (Chairman: Heron) recommended reduction from 26 to 18.
1974 Royal Commission on Metropolitan Municipal Boundaries (Chairman: Johnston) recommended reduction from 26 to 22.
1995 Structural Reform Advisory Committee
2006 Local Government Advisory Board (Chairman: Gregorini)recommended reduction from 30 to 23, and possible further reduction to 20.12
Despite these major reviews, the net result has been little change in Perth’s local government arrangements. Hence, many of Perth’s existing local governments could be said to be, in the words of one commentator, ‘survivors of a simpler past’.13
The statutory body responsible for considering boundary change proposals in Perth is the Local Government Advisory Board (LGAB), which was established under
10 Committee for Perth (2012), Perth @ 3.5 million, viewed 27 June 2012, http://www.committeeforperth.com.au/images/stories/NewsMedia/Publications/18-%20Perth%20@%203%205m%20Discussion%20Paper%202%20.pdf11 Berry, C (2012), Local government and the urban transformation of metropolitan Perth during the colonial gold rush era: A study in development and community. In Urban Transformations: proceedings of the 11th urban history/planning history conference, 2012, Perth.12 Local Government Advisory Board (2006), Ensuring the future sustainability of communities, p. 45, viewed 27 June 2012, Available on the Department of Local Government website: http://dlg.wa.gov.au/Content/LG/AdvisoryBoard/StructuralElectoralReform.aspx13 Quoted in Abbot, J (2010), Regions of Cities: Metropolitan planning and governance in Australia, Chapter 8 in Xu, Jiang and Anthony Yeh (eds.), (2010), Governance and Planning of Mega-City Regions: An International Comparative Perspective, Routledge, New York.
25 | P a g e

Metropolitan Local Government ReviewFinal Report of the Independent Panel - July 2012
section 2.44 of the Local Government Act 1995 (the Act). The Board’s role is to conduct inquiries into boundary amendment proposals in accordance with Schedule 2.1 of the Act, and recommend ward and representation arrangements for each council.
Since its creation, the Board has considered 12 boundary amendment proposals in the metropolitan area, most of which have been rejected, such as the proposal to create a Shire of Dalkeith. The inability of the current system to bring about change is further demonstrated by the recent experience with the proposed merger of the Cities of Subiaco and Nedlands, even though an analysis found that the merger could achieve between $3.1 and $4.4 million savings per year and create organisational efficiencies through improved access to grants, new strategic State partnerships, improved workforce planning, reduced service duplication, economies of scale, greater purchasing power and increased productivity.14
Perth remains one of the few major Australian cities that has not seen major local government reform. Even in Adelaide, a city where there were local government amalgamations in the mid-1990s, there have been calls for further reform, including the state's peak business group Business SA suggesting in 2010 that the number of metropolitan councils be reduced to just three.15
14 Cities of Nedlands and Subiaco (2011), Draft Merger Feasibility Study, prepared with the assistance of KPMG, viewed 22 May 2012, http://www.rtg.subiaco.wa.gov.au/Merger+feasibility+study15Business SA (2010), Business SA releases visionary Charter, viewed 27 June 2012, http://business-sa.com/your-voice/all-news/article/business-sa-releases-visionary-charter.
26 | P a g e

Metropolitan Local Government ReviewFinal Report of the Independent Panel - July 2012
Table 2.1: Local Government in Australia’s capital cities
Metropolitan Area (square km)
Metropolitan Population (1991)
No. of Local Governments (1991)
Metropolitan Population (2011)
No. of Local Governments (2011)
Comments
Sydney 12,138 3,672,855 44 4,575,532 43
Independent panel appointed in March 2012 to
review NSW governance and
structure.
Melbourne 7,692 3,155,576 54 4,077,036 31
Amalgamation of 54 to 26 in 1993.
Broader metropolitan region now includes 31.
Brisbane 5,950 1,357,993 8 2,043,185 6
Since the creation of the Brisbane City
Council in 1925 (through merging 20 smaller local governments),
the urban area of Brisbane has
expanded considerably, past the City
Council boundaries. Now includes City of Brisbane and 5 other councils (after further
amalgamations in 2008).
Perth 5,386 1,188,762 26 1,696,062 30
City of Perth split in 1993; City of
Wanneroo split in 1998.
Adelaide 1,827 1,056,561 30 1,203,873 18 Amalgamations in 1995.
Hobart 1,357 190,739 5 214,705 5
2011 Recommendation for creation of a City of Greater
Hobart.
Darwin 112 86,415 127,500 3
2.3 A vision for metropolitan Perth
This Review has revealed many individual visions for the future of metropolitan Perth, but the Panel is surprised by the lack of an overarching vision.
The State Government, or more specifically the Metropolitan Redevelopment Authority (MRA), has a vision for Perth. The MRS might also be considered a vision, in terms of land use zones and reservations. The City of Perth has a vision. Some stakeholders, such as the Committee for Perth or Future Perth, also have a vision. Each has a vision different in scope and scale. This diversity is compounded by the fact that there are 30 local governments in the Perth metropolitan region each with
27 | P a g e

Metropolitan Local Government ReviewFinal Report of the Independent Panel - July 2012
their own vision for the future of their local communities. There is nothing wrong with this, but it is the lack of an overarching vision for the Perth metropolitan region that concerns the Panel.
As noted earlier, the Panel’s vision is for a stronger, more enhanced local government sector in metropolitan Perth. This includes enhancing its foundations through strong, effective, sustainable, leading local governments that have strong engagement with their communities and maintain communities that people value and want to live in. This will require all stakeholders to work together to create a world-class city built on strong communities that are healthy, prosperous, and sustainable.
2.4 Changes to Perth local government arrangements
The changes the Panel is proposing to Perth’s local government arrangements are framed around: a focus on the future
providing a foundation for better services and communities through more strategic leadership and decision-making
facilitating better community engagement.
The Panel believes making changes to Perth’s governance is not simply about saving money (although there is the potential for savings), but about getting better value for the community. Given the extent of duplication in the current system, there is huge potential to mobilise public resources for more efficient purposes, such as better community facilities, or more consistent planning leading to increased local economic development.
The Panel notes that many residents are happy with the status quo. However, the Review is not about the performance of individual local governments, it is about the system as a whole. The satisfaction of individuals is not a reason to maintain the current arrangements, as this will perpetuate existing inequities across the metropolitan area. The Panel believes changes have to be considered in the interests of the whole metropolitan community.
There are intergenerational considerations as well. For example, to house Perth’s future population there will need to be a mix of infill in existing suburbs and greenfield developments on the urban fringe. Typically, the urban fringe areas are populated by households with lower disposable incomes and higher transport costs. Housing intensification in existing suburbs is an important issue, as it will give existing and future residents of metropolitan Perth more housing choices and greater opportunity to access services and reduce transaction costs. A restructured system, comprised of local governments with appropriate planning powers and acting as effective planning authorities, can help develop a city which is fair for everyone.
The Panel’s recommendations are therefore geared towards ensuring appropriate governance on behalf of all of Perth’s residents.
28 | P a g e

Metropolitan Local Government ReviewFinal Report of the Independent Panel - July 2012
2.5 Relationships, roles and functions
It is clear to the Panel that the structure and governance arrangements for local government in Perth cannot be considered in isolation. The role and function of local government and the relationship between state and local government also need to be considered.
Many respondents to the Review understand and accept the principle that form follows function. Changing the responsibilities of local government needs to go hand in hand with significant structural and governance reforms so they can meet those new responsibilities, and have a role in achieving a shared vision for metropolitan Perth.
WALGA’s submission to the Panel (submission IP246)16 called for ‘a strong and robust partnership agreement’ that provides a basis, through meaningful engagement, for working together and discussing changes. The Panel believes more specific communication provisions and protocols need to be negotiated. While any State Government will have valid reasons for making policy decisions from time to time which impact on local government, with a restructured local government sector it will be essential to have a new respect and partnership approach to governing Perth. Together with a new partnership agreement between the State Government and the local government sector, there is a need for improved coordination between State Government agencies.
2.6 Working towards an ideal structure for local government
As outlined above, the Panel has concluded that maintaining the status quo, comprising 30 metropolitan local governments of varying sizes and capacities, will not serve Perth’s best interests into the future.
At the time of releasing its Draft Findings, the Panel considered the most appropriate options to be the following:
10 to 12 local governments
five to six local governments
one metropolitan local government.
The Panel’s deliberations on each option are discussed in more detail in Section 5 of this report. The Panel noted that WALGA and many councils supported an alternative option of 15 to 20 local governments.
One of the claimed strengths of the existing local government system is its closeness to the people. However the Panel believes this strength is overstated, and that in reality, relatively few people interact closely with their local government. The Panel has noticed that tension arises when considering local government reform. This is because there is difficulty in reconciling the community connectiveness of smaller local governments with the strategic capacity and efficiency opportunities in larger local governments. The Panel’s recommendations for community engagement are intended to abate this tension.17
16 Throughout this document submissions on the Panel’s issues paper are identified in this format, and submissions on the Panel’s Draft Findings are identified in a similar format (for example, (DF1)0. For a full sit of submissions, see Appendix 1.1 and 1.2)
17 Described in a WALGA paper as ‘how can community representation and participation be optimised while planning and service delivery for the metropolitan region is enhanced’? WALGA (September 2011) Metropolitan Governance
29 | P a g e

Metropolitan Local Government ReviewFinal Report of the Independent Panel - July 2012
The size of the City of Perth emerged as an important consideration from the Review The Panel noted that the former City of Perth was split into four local governments in 1993. Increasing the area of the City of Perth is not about reversing those changes, but about creating more logical boundaries and building a connection between the City and the main infrastructure and facilities that serve the metropolitan region. The Panel believes that the City of Perth should be larger and have an enhanced role. This will boost its capability, diversify its population, and allow it to become a serious national and global player.
The Panel also acknowledged that Metropolitan Perth lacks a voice to represent it as a whole. A forum or council of Perth mayors, chaired by the Lord Mayor, was considered as an option to try to address this.
The Panel also considered if institutions such as hospitals, universities and airports should continue to be dissected by local government boundaries. Currently, this creates a less-than-optimal situation for the institutions and local governments involved. One option is to take the institutions out of local government jurisdiction, and adopt a regime similar to the existing situation for Kings Park and Rottnest Island, which both have controlling boards. This is already the case to some extent for Perth Airport, given that all development occurs on Commonwealth land.
The Panel also considered the scope for a periodic boundary review to be undertaken by an independent body, similar to the way the Electoral Commission reviews electoral boundaries. Given the ongoing population growth in the metropolitan area, this could occur at a pre-determined interval of 15 years to ensure the structure remains optimal. Without a periodic review, the structure is likely to stay the same for too long. Ongoing reviews are essential to take into account the changing demographics of a growing metropolitan region.
The ongoing role of RLGs must be considered further, depending on the final structure adopted. Even if the future of regional councils is called into question, there would still be a need for voluntary regional groupings of local governments to cooperate on common issues and joint lobbying. There is a potential place for such groupings in any structure, but on their own they are not the solution to Perth’s governance needs.
2.7 Governance
The Panel is aware that some of its recommendations will have implications for the rest of the state. At present, in accordance with its Terms of Reference, the Panel envisages that the proposed governance changes will only apply to metropolitan Perth. The State Government will also need to consider amendments to the Local Government Act 1995 to implement these recommendations.
A number of issues were raised during the Review that were strongly linked to, but not part of, the Terms of Reference. For example, local government respondents commented on the critical role of the State Government in metropolitan governance, but proposing changes to State Government operations is beyond the Panel’s Terms of Reference other than in the way they relate to local government.
Some respondents called for a review of the Local Government Act 1995. The Panel has noted some changes to the Act need to be considered, in line with improving
Models - Information Paper, p.22, viewed 29 November 2011 http://www.walga.asn.au/LGReform/MetropolitanLocalGovernmentReview.aspx
30 | P a g e

Metropolitan Local Government ReviewFinal Report of the Independent Panel - July 2012
governance in the sector, but a review of the Act was not undertaken. This is a separate matter for the Minister and DLG to consider.
While there are matters of legislation to be addressed, the main difficulties for current metropolitan governance are not matters residing under the Act.
31 | P a g e

Metropolitan Local Government ReviewFinal Report of the Independent Panel - July 2012
SECTION 3: KEY DRIVERS AFFECTING THE FUTURE OF PERTH AND LOCAL GOVERNMENT (Addressing Terms of reference 1 and 2)
The Panel has been asked to identify current and anticipated specific regional, social, environmental and economic issues affecting, or likely to affect, the growth of metropolitan Perth in the next 50 years, as well as current and anticipated national and international factors likely to impact in the next 50 years.
Perth is on the cusp of a period of change due to population growth and economic development. Around the central area of Perth, new developments include the Riverside Development, the Perth Waterfront, the Perth Cultural Centre, the City Link, the new Museum and the Perth Arena. Developments elsewhere include the Fiona Stanley Hospital and the Gateway WA project around the airport.
Perth has the components of greatness in its reach: a commercially and geographically strategic position in the new economic order; wealth that looks sustainable in the medium and perhaps the long term; abundant resources; a talented and cosmopolitan population; and the incalculable advantage of being a city in Australia. … It’s all about building a functioning and attractive community, united by shared goals, stories and values; it’s all about the city’s sense of self.18
The days of ‘roads, rates and rubbish’ are over for local government. Local governments are now expected to tackle issues from the triple-bottom-line perspective – considering prosperity, environmental sustainability and social justice.19 This section of the Panel’s report examines the economic and social context for local government in metropolitan Perth, as well as governance and planning frameworks, and concludes with a consideration of the critical and strategic issues confronting Perth. As such, it addresses the first and second parts of the Panel’s Terms of Reference. These issues are the main drivers for change in Perth’s local government arrangements.
Critical and strategic issues for Perth
Metropolitan Perth faces a considerable number of critical issues in the short, medium and long term that will impact on the community, economy and environment of the metropolitan region. They are issues for all levels of government to consider.
Key challenges for Perth were outlined in a recent submission to the Productivity Commission by the Council of Capital City Lord Mayors:20
18 FORM, Anholt, S (2010), Comparative Capitals, viewed 27 June 2012, http://www.form.net.au/sites/default/files/ComparativeCapitals_Anholt.pdf19 Inayatullah, S (2012) Why City futures?, viewed on 27 June 2012, http://www.metafuture.org/Articles/why_city_futures.htm20 Council of Capital City Lord Mayors (2010), submission to the Productivity Commission, sub 31, p. 22–23, Performance Benchmarking of Australian business regulation: Planning, Zoning and Development Assessments, viewed 27 June 2012, http://pc.gov.au/projects/study/regulationbenchmarking/planning/submissions
32 | P a g e

Metropolitan Local Government ReviewFinal Report of the Independent Panel - July 2012
Provision of affordable housing for people of all ages, incomes and needs. Part of the affordability challenge relates to the lack of diversity in the Perth housing market, which is dominated by single detached housing;
Management of significant population and economic growth as experienced in Western Australia during the last decade and the resultant pressure on existing utility and social infrastructure, transport systems and land supply;
Addressing changes in the natural environment and the impacts of climate change on infrastructure and community. The mitigation of greenhouse gas emissions, the reservation of significant areas of landscape value and the protection of surface and groundwater supplies are just some of the issues that need to be addressed;
Tackling increasing urban congestion and the need to better integrate planning and transport; and
The coordinated planning, management and delivery of projects between all levels of government.
These issues affect the whole Perth metropolitan region, so responding to them is complicated by the fact that they cross local government boundaries. Any solutions will require improved coordination between local governments. The Panel heard that some issues are simply beyond the current capacity of local government to adequately respond to, and a more strategic response is required.
The following discussion arises from the Panel’s Terms of Reference.
33 | P a g e

Metropolitan Local Government ReviewFinal Report of the Independent Panel - July 2012
3.1 ECONOMIC ISSUES
To consider Perth from a global perspective, Perth has been classified by the Globalization and World Cities Research Network as a beta-level city. There are 63 other beta-level cities around the world including Birmingham, Geneva, Osaka, San Diego and Stuttgart. Both Sydney and Melbourne are classified as ‘alpha-level cities, reflecting their importance among 47 the world’s most connected cities that are instrumental in linking their region or state into the world economy and world city network. The significant point about this classification is that Perth’s position has changed, having previously been classified from 2000-2008 as a lower-rated gamma-level city.21 Its future position may be challenged by the continued rise of Asian cities.
21 Cities are assessed in terms of their advanced producer services using the interlocking network model. Indirect measures of flows are derived to compute a city's network connectivity – this measures a city's integration into the world city network.’ Viewed 22 June, 2012 http://www.lboro.ac.uk/gawc/gawcworlds.html
34 | P a g e

Metropolitan Local Government ReviewFinal Report of the Independent Panel - July 2012
Traditionally, Perth’s position was seen as peripheral to the nation, but this has changed due to it now holding a more strategic global position, because it is closer to the Asian economic powerhouses than other Australian cities.22 A shift in global power is evident, with the 21st century witnessing the rising Asian sphere of influence. Despite uncertainty over how long China will maintain its economic boom, China and India will undoubtedly continue growing and are becoming world economic powers too. So the focus on the Indian Ocean rim will increase, foreshadowing an increasing role for Perth as a major hub of this region. It has been noted that ‘other resource-rich nations such as Canada, Namibia, Chile and South Africa will be (Western) Australia's natural competitors in the coming decade’.23 As well as its location, Perth’s other strengths in the international market will continue to be its high standard of health and education services, its skilled workforce and its system of government.
Perth is having an increasing engagement with the world economy as a ‘locale of decision-making and power’.24 In September 2010, Perth accounted for 41 per cent of the corporate locations on the Australian Stock Exchange.25 Perth is becoming one of the global headquarters for the energy and mining sectors. This means that there is an increasing demand for office and industrial floor space and new workers arriving who need accommodation.26
Western Australia emerged from the global financial crisis in a strong financial position with a positive outlook for its resources sector.27 The Commonwealth Bank's State of the States report described Western Australia as the best economy in the country.28 Personal incomes in Perth are‘ ‘rising at a rate that is faster than most other Australian cities.’29
22 Committee for Perth, Huddleston, P & Huddleston, V (2010), Global Competitiveness: Implications for Perth, FACTBase, Bulletin 13, October 2010. Viewed 22 June, 2012 http://www.committeeforperth.com.au/research/researchers23 KPMG (2011), Australia & China: Future Partnerships, viewed 27 June 2012, http://www.kpmg.com/AU/en/IssuesAndInsights/ArticlesPublications/Documents/australia-china-future-partnerships-2011-v2.pdf24 Committee for Perth, Huddleston, P & Huddleston, V (2010), Global Competitiveness: Implications for Perth, FACTBase Bulletin 13, October 2010, p.1 viewed 27 June 2012, http://www.committeeforperth.com.au/research/researchers25 Committee for Perth, Huddleston, P & Huddleston, V (2010), Global Competitiveness: Implications for Perth, FACTBase Bulletin 13, October 2010, p.1 viewed 27 June 2012, http://www.committeeforperth.com.au/research/researchers26 WAPC (2011), Capital City Planning Framework: Part A, p.20, viewed 27 June 2012, http://www.planning.wa.gov.au/publications/2632.asp27 The Chamber of Minerals and Energy of Western Australia (2011), WA Resources and Economics Report, June 2011, viewed 27 June 2012, http://www.cmewa.com/UserDir/CMEPublications/CME10156_Qrt-Economic-Report-June2011B286.pdf28 CommSec (2010), Economic Insights: State of the States, July 2010, viewed 27 June 2012, http://images.comsec.com.au/newsresearch/articles/State%20of%20States%20July.pdf29 Committee for Perth (2010), Perths Decade of Prosperity: 2010 Update, FACTBase Bulletin 15.
35 | P a g e

Metropolitan Local Government ReviewFinal Report of the Independent Panel - July 2012
Given its population and role as an administrative centre for business and government, Perth has a dominant position in the State’s economy. However, since the 1950s, its economy has been changing to favour the service industries. This is likely to continue with finance and business services, education services, public administration, community services, trade and entertainment all growing at the expense of the manufacturing, transport and construction industries.30
During 2000-01, Perth represented 60 per cent of the Western Australian economy. In2010-11, the Perth share dropped to around 52 per cent. This reduction reflects the rapid expansion in mining production (and associated construction and support services) in regional Western Australia.31 Perth (unlike other major Australian capital cities) has experienced a strong increase in GDP growth in 2010-11. This was driven by growth in a range of industries.
Perth records a uniquely high level of employment related to the mining industry, reflecting the significance of fly-in, fly-out operations.32 Perth policy makers need to take care to ensure that mining remains competitive and prosperous while also being aware that reliance on the mining industry raises concerns about dependence and needing to diversify. In other words, ‘while mining will continue to be the driver of the city’s economy for the foreseeable future, the importance of fostering other sectors should not be forgotten’.33 Perth's geographical isolation has limited the development of significant manufacturing industries other than those serving the immediate needs of its residents, mining and agriculture and some specialised areas, such as niche ship-building.34
Perth’s ability to sustain and grow its economy will depend on a number of factors including its ability to attract enough skilled labour. This, in turn, is affected by the metropolitan region’s ability to accommodate and service this increasing population.
Oil price vulnerability, climate change mitigation policies, congestion costs and communications technologies should drive a stronger push for decentralized employment, where workers can access jobs closer to where they live or partly work from home to contain travel costs. For urban development and infrastructure it is likely that this will mean the trend towards user pays approaches to infrastructure provision will continue.35
30 Western Australian Planning Commission (2003) Greater Perth, Economy and Employment, Discussion Paper Three, viewed 27 June 2012 http://www.planning.wa.gov.au/publications/881.asp31 SGS Economics and Planning (2011), GDP by Major Capital City, Australian Cities Accounts, p.20-21, viewed 27 June 2012, http://www.sgsep.com.au/files/GDP_by_Major_Capital_City.pdf32 Committee for Perth, Tonts, M (2010), Perth’s Economic Base: A Comparative Assessment, FACTBase Bulletin 9, 2010. Viewed 22June, 2012 http://www.committeeforperth.com.au/research/researchers33 Committee for Perth, Tonts, M (2010), Perth’s Economic Base: A Comparative Assessment, FACTBase Bulletin 9, 2010. Viewed 22June, 2012 http://www.committeeforperth.com.au/research/researchers34 Western Australian Planning Commission (2003), Greater Perth Economy and Employment, Discussion Paper Three, viewed 27 June 2012, http://www.planning.wa.gov.au/dop_pub_pdf/gpdp3.pdf.35 COAG Reform Council (2011), Drivers of Change in Australian Cities: Discussion Paper, viewed 27 June 2012, http://www.coagreformcouncil.gov.au/reports/docs/capital_cities/ciwp/Think_piece-Pat_Fensham.pdf
36 | P a g e

Metropolitan Local Government ReviewFinal Report of the Independent Panel - July 2012
Liveability factors such as education, health, transport and retail trade will also have an impact on Perth’s ability to sustain and grow its economy. Migration has received increased focus in recent times due to a shortage of skilled labour and growing wage pressures. The further development of Fremantle Port, Perth airport and the Kewdale freight hub are critical as Perth’s economy and links to global markets expand.
Transport infrastructure is critical to enable Perth’s community and economy to expand. Transport infrastructure in Perth includes networks (road, rail and bus) and hubs (railway stations, airports, freight terminals and port facilities). These need to be considered in relation to the activity centres they serve, including the Perth CBD, shopping centres, hospitals, education establishments and other places of employment and service. Most main infrastructure assets are the responsibility of the State Government, including freeways, railways and ports. Metropolitan local governments are responsible for 13,000 kilometres of local roads, with Main Roads WA managing a further 845 kilometres of state roads within the metropolitan area.36 Several state roads traverse multiple local governments, such as Stirling Highway, which is currently subject to a rationalisation of the existing Primary Regional Roads reservation.
3.2 SOCIAL ISSUES
3.2.1 Population
The extraordinary growth expected in Perth over the next few decades is a key trigger for reconsidering Perth’s governance arrangements. Perth added 1 million people to its population between 1971 and 2006 and is expected that the next 1 million will be added in just 20 years. Perth’s population is projected to more than double, increasing to approximately 3.5 million by 2056.37 Other forecasts project a higher rate of growth, suggesting Perth’s population will reach 3.5 million sooner (around 2050).38 Coupled with this high population growth rate, current projections indicate that Perth will continue to experience a falling birth rate, an ageing population, longer life-expectancy, and overseas migration resulting in increased ethnic diversity.
In February 2012, the WAPC released the latest population projections for Western Australia. These forecasts, based on past trends, are the best estimate of population size if trends in fertility, mortality and migration continue. The information is used by various State government agencies to plan for changing demands. At the same time, many government projects (such as Pilbara Cities) will influence population movements and impact future population change.
Overall, there is a projected 24 per cent increase in metropolitan Perth of 481,200 people between 2012 and 2026 (see Table 3.1). Perth (at 102 per cent) and Serpentine-Jarrahdale (at 94 per cent) are the local government areas expected to grow the most. The WAPC notes the figures suggest a stronger rate of growth than previously expected in Armadale, Kwinana, and Perth.
Table 3.1: Population forecasts to 2026 by metropolitan local government
36 Main Roads Western Australia, Metropolitan Road Fact Sheet, viewed 27 June 2012, http://www.mainroads.wa.gov.au/UsingRoads/RoadTrafficInformation/Pages/RoadTrafficInformation.aspx37 Infrastructure Australia, Major Cities Unit (2010), State of Australian cities, p. 32, viewed 27 June 2012, http://www.infrastructureaustralia.gov.au/publications/files/MCU_SOAC.pdf38 Western Australian Planning Commission (2010), Directions 2031 and beyond: metropolitan planning beyond the horizon, p. 9, viewed 27 June 2012, http://www.planning.wa.gov.au/dop_pub_pdf/plan_directions2031_part1.pdf
37 | P a g e
Metropolitan Local Government ReviewFinal Report of the Independent Panel - July 2012
Local Government Population (2012)
Population (2026)
Difference
Population Growth(%)
Perth 22,700 45,900 23,200 102.2Serpentine-Jarrahdale 19,700 38,300 18,600 94.4Wanneroo 170,700 278,100 107,400 62.9Kwinana 32,900 51,900 19,000 57.8Rockingham 114,300 172,900 58,600 51.3Armadale 65,400 93,400 28,000 42.8Swan 123,100 175,700 52,600 42.7Cockburn 97,400 131,000 33,600 34.5Victoria Park 34,400 42,900 8,500 24.7Gosnells 114,500 139,000 24,500 21.4Subiaco 19,400 22,600 3,200 16.5Mosman Park 9,800 11,400 1,600 16.3Fremantle 29,100 33,700 4,600 15.8Belmont 36,200 41,600 5,400 14.9Canning 92,100 105,700 13,600 14.8Vincent 32,900 37,400 4,500 13.7Stirling 208,300 236,200 27,900 13.4East Fremantle 7,700 8,600 900 11.7Mundaring 40,600 45,300 4,700 11.6Cambridge 27,900 31,000 3,100 11.1Joondalup 169,700 188,400 18,700 11.0South Perth 44,900 49,700 4,800 10.7Kalamunda 57,000 62,300 5,300 9.3Bayswater 62,800 67,600 4,800 7.6Cottesloe 8,400 9,000 600 7.1Bassendean 14,900 15,900 1,000 6.7Claremont 9,900 10,100 200 2.0Melville 102,500 104,500 2,000 2.0Nedlands 22,600 23,000 400 1.8Peppermint Grove 1,800 1,700 -100 -5.6METROPOLITAN TOTAL 1,793,600 2,274,800 481,200 24.2
Source: West Australian Planning Commission (2012) Western Australia Tomorrow, Population Report No 7, 2006 to 2026, Forecast Summary, Local Government Areas of WA, pp. 5-73
The results of an increase in metropolitan population include:
greater distances between work and home meaning increased vehicle use, traffic congestion, reduced air quality and increased transport costs
social impacts and health problems from increased travel time (e.g. from pollution)
loss of biodiversity and habitat from clearing for urban purposes
loss of arable land at urban fringe (e.g. for vegetable farming) resulting in transporting food over a longer distance
decreased housing affordability and increased cost of living
increased demand for services and infrastructure such as education, public transport, health, recreation, aged care and community lifestyle villages
Some of these issues are considered in more detail below.
38 | P a g e

Metropolitan Local Government ReviewFinal Report of the Independent Panel - July 2012
3.2.2 Ageing
The proportion of working-age people is projected to fall, with only 2.7 people of working age to support each Australian aged 65 years and over by 2050 (compared to 5 working aged people per aged person in 2010 and 7.5 in 1970). An ageing population will have consequences for economic growth and government finances.39
The ageing population poses challenges for local governments and the Panel notes that several metropolitan local governments already have a high proportion of residents aged over 65, such as Cambridge, Claremont, Cottesloe, Fremantle and East Fremantle.40
An ageing population increases the demand for specific health services, suitable accommodation and diversity in housing stock so that people can age in place. Future generations of older people will have greater expectations about the type and flexibility of care they receive, including a greater desire for independent living and standards of care that address a more culturally and linguistically diverse community. There will be an increase in the need for services that provide the complex care required for conditions associated longevity (e.g. dementia, diabetes).41
While the ‘formal’ aged-care system is currently administered by the Commonwealth under the Aged Care Act 1997, many residential and community services are provided by religious and charitable organisations or by local governments. Several local governments also administer the Home and Community Care (HACC) program, providing support to older people living at home.
The ageing population also impacts on local governments’ rate revenues. As the local population ages, those households reduce their expenditure, affecting local businesses and local government revenue capacity. Pensioners receive a discount on their local government rates, but this is compensated by the State Government. Non-rateable retirement villages have an impact on local government revenues, as under the Local Government Act 1995, land used for religious or charitable purposes is not rateable. A survey undertaken by the DLG in 2010 indicated the amount of rates forgone in the metropolitan area for the provision of Independent Living Units owned by religious or charitable groups to be approximately $3.5 million.42 This deficiency is effectively picked up by other ratepayers within the affected local governments.
The ageing population will also impact the workforce, as the proportion of people leaving the workforce becomes greater than those entering it. There is currently a shortfall of skilled labour across the local government sector, which will become more pronounced as experienced staff retire, unless succession planning measures are introduced.
39 Commonwealth of Australia (2010), Australia to 2050: future challenges, viewed 27 June 2012, http://archive.treasury.gov.au/igr/igr2010/report/pdf/IGR_2010.pdf40 Western Australian Planning Commission (2010), Directions 2031 and Beyond: Sub-regional Strategy- Draft, viewed 27 June 2012, http://www.planning.wa.gov.au/publications/826.asp41 Productivity Commission (2011), Caring for older Australians, Overview, viewed 27 June 2012, http://www.pc.gov.au/projects/inquiry/aged-care/report42 Information provided by the Department of Local Government, September 2011. The Department notes that not all local governments responded to the survey, and several responded that the amount forgone was an estimate only.
39 | P a g e

Metropolitan Local Government ReviewFinal Report of the Independent Panel - July 2012
3.2.3 Changing household structure and demographic diversity
Reflecting on the population projections for Perth’s smaller local governments, the Panel noted that even if these areas achieve some growth, there will still be a dramatic change in their demographic profile (for example, population ageing). This could have a major impact on the socio-economic characteristics of these local governments and their capacity to service their communities.
There has been a trend toward smaller households across Australia over the last decade. Family sizes are decreasing due to people having fewer children, having them later in life, and living longer. The Panel notes that the number of households is increasing at a greater rate than the population.43 Fewer people are living in each household as more people are living alone, or in two-person homes.
In Perth, the average household size has decreased from 2.8 people in 1976 to 2.3 people in 2006. Projections show this is likely to decrease to 2.1 by 2031. This will require changes in types of housing available to suit the needs of different-sized households, which will in turn impact on residential densities and the provision of services and infrastructure.44
The challenges facing metropolitan local governments in planning for a changing population are:
changing community perceptions of housing size and density
fulfilling the demand for a diversity of housing alternatives, including accommodating the ‘empty-nester’ market with housing of suitable size and location
planning sustainable urban forms that retain amenity, liveability and affordability
working with State and Federal government agencies, other local governments, the private sector and the community to maximise urban development opportunities.
The 2006 Census shows the average family income in Perth was $1,490, but this ranged from $1,128 in Kwinana to $2,901 in Peppermint Grove (see Table 3.2). Family incomes in Perth are, on average, among the highest of Australian capital cities (see Table 3.3).
Table 3.2: Average family weekly income in metropolitan Perth, 2006
Local Government Average Family Weekly Income
Peppermint Grove (S) $2,901Cottesloe (T) $2,391Nedlands (C) $2,380Cambridge (T) $2,194Claremont (T) $2,150Subiaco (C) $2,101Mosman Park (T) $2,042
43 Infrastructure Australia, Major Cities Unit (2010), State of Australian cities, p. 38, viewed 27 June 2012, http://www.infrastructureaustralia.gov.au/publications/files/MCU_SOAC.pdf44 Western Australian Planning Commission (2010), Directions 2031 and beyond: metropolitan planning beyond the horizon, p. 9, viewed 27 June 2012, http://www.planning.wa.gov.au/dop_pub_pdf/plan_directions2031_part1.pdf
40 | P a g e

Metropolitan Local Government ReviewFinal Report of the Independent Panel - July 2012
Perth (C) $1,979East Fremantle (T) $1,895South Perth (C) $1,823Vincent (T) $1,764Melville (C) $1,731Joondalup (C) $1,633Fremantle (C) $1,506Stirling (C) $1,493Serpentine-Jarrahdale (S) $1,472Kalamunda (S) $1,457Mundaring (S) $1,449Canning (C) $1,439Victoria Park (T) $1,419Cockburn (C) $1,402Bayswater (C) $1,367Swan (C) $1,312Wanneroo (C) $1,307Rockingham (C) $1,304Bassendean (T) $1,295Gosnells (C) $1,278Armadale (C) $1,246Belmont (C) $1,219Kwinana (T) $1,128Metropolitan Perth $1,490Source: Based on 2006 Census of Population and Housing
Table 3.3: Median family income in Australian cities, 2006
City Median Family Income
Adelaide $1,137
Brisbane $1,262
Melbourne $1,242
Perth $1,298
Sydney $1,350
Australia $1,171
Source: 2006 Census of Population and Housing
The Western Australian Council of Social Service Inc., using data from the Australian Bureau of Statistics, has identified that ‘concentrations of low-income households are located in a narrow band along the eastern side of the City stretching from Balga in
41 | P a g e

Metropolitan Local Government ReviewFinal Report of the Independent Panel - July 2012
the north to Armadale in the south-east; in the southern coastal areas of Kwinana, Rockingham; and in the suburbs to the immediate south of Fremantle … Balga, Midland and Midvale, Bentley, Hamilton Hill and Coolbellup all had more than one third of households classified as low income’.45 There is also a trend towards marginalisation of the urban fringe, where more low-income people are attracted by cheaper housing, but they suffer the disadvantages of poorer access to jobs and services.46
Cultural and linguistic diversity (CaLD) is now a key characteristic of Perth’s population, and is likely to increase over the next 50 years. The main factor influencing immigration is future labour demand, so Western Australia is likely to experience a sustained intake for many years to meet the skills of the State’s resources sector. Western Australia is also likely to maintain its current commitment to accommodate humanitarian entrants and accept significant numbers entering through the Family Migration stream. Nearly 34 per cent (2006 Census) of Perth residents were born overseas, and nearly 15 per cent of Perth’s population speak a language other than English at home. For some local governments, these figures are even higher (for example, Vincent at 21 per cent and Stirling at 20 per cent).
Migration and the resulting cultural and linguistic diversity of the population have brought enormous social and cultural benefits to Perth. However there are also challenges for local government now and into the future including:
ensuring full participation by members of CaLD communities in civic affairs such as planning and service delivery
providing programs and services that are inclusive, appropriate and responsive to the needs of a diverse community
encouraging the development of socially cohesive communities and the successful integration of all residents.
Local government’s role in promoting socially cohesive communities is particularly important for community resilience in the face of social or economic threats. Communities with strong local networks are more resilient during times of crisis, such as economic downturns and localised natural disasters such as bushfires. Social inclusion also influences the health of people in the community, levels of educational achievement and the likelihood of economic investment in the community.47 To meet these challenges, community engagement and consultation needs to be culturally appropriate. Governance structures, including advisory groups and boards, should include representatives from CaLD backgrounds. These approaches are consistent with the Integrated Planning and Reporting Framework and Guidelines that is being applied by local governments in Western Australia.
3.2.4 Urban consolidation and housing
With the expected growth in population and demand for housing, the issues of urban consolidation, housing availability and affordability are inextricably linked as critical issues for the future of metropolitan Perth.
45 Western Australian Council of Social Service Inc (2010), The Rising Cost of Living in WA, viewed 27 June 2012, http://www.wacoss.org.au/Libraries/P_A_Cost_of_Living_Cost_of_Living_in_WA_Papers/The_Rising_Cost_of_Living_in_WA_August_2010.sflb.ashx46 The Smith Institute (2011), Investing in better places: international perspectives, Ch. 7, Spiller, M, Place making, inclusion and governance in the suburban city – a case study of Melbourne, Australia, viewed online 27 June 2012, http://www.smith-institute.org.uk/file/Investing%20in%20Better%20Places.pdf47 MLGR (2011), Perth’s Multicultural Population, http://metroreview.dlg.wa.gov.au/BackgroundInformation.aspx
42 | P a g e

Metropolitan Local Government ReviewFinal Report of the Independent Panel - July 2012
To achieve a connected-city pattern of growth, Directions 2031 sets a target of 328,000 dwellings as a medium- to long-term aspiration, incorporating:
A target of 47 per cent or 154,000 of the required 328,000 dwellings as infill development (a 50 per cent improvement on current infill residential development). 121,000 of these are targeted to be located in the central sub-region of Perth.
A target of 15 dwellings per hectare of gross urban-zoned land in new development areas (a 50 per cent increase on the current average).48
A related challenge concerns housing affordability. In September 2011, the median house price for Perth was $453,000, which is lower than Sydney and Melbourne, but higher than Brisbane and Adelaide. In recent decades, increases in property prices have consistently outstripped the rise in incomes. While the Department of Planning has responsibility for the planning for future communities, the Department of Housing provides public housing, affordable land and housing opportunities for those on low to moderate incomes, and assistance with housing and rental finance. Through the State Government’s Affordable Housing Strategy 2010-2020: Opening Doors to Affordable Housing, the Department of Housing is focused on delivering at least 20,000 more affordable homes by 2020 for low to moderate income earners.49
The activities of local government have a major impact on housing outcomes. Local governments have a most important role in facilitating and guiding the orderly development of their area, including residential development and infill, through local planning schemes. Part of the housing imperative is to increase the range of housing options and solutions that are:
• available (as and when needed)• affordable (within the means of low to moderate income households) • appropriate (meets the needs of individual circumstances).
As previously mentioned, population projections suggest that one- and two-person households will become the dominant household structure over the next couple of decades. Research on older households by the Australian Housing and Urban Research Institute (AHURI) indicates that some 90 per cent of older households prefer to age in their own home rather than in lifestyle or retirement villages.50 At the same time urban infill, smaller houses and living closer to neighbours hold negative public perceptions. There is also a broader economic issues of how the community can best use its existing housing stock and the role of government in facilitating provision of housing stock that meets the diverse needs of the community.
3.2.5 Critical public infrastructure
Major urban infrastructure highlights the complexity of planning and governance issues in the metropolitan area. Some current infrastructure developments in Perth include transport (Perth Airport and Fremantle Port) and the tertiary health and hospital sector. While most of this infrastructure falls outside of the responsibility of
48 Western Australian Planning Commission (2010), Directions 2031 and beyond: metropolitan planning beyond the horizon, p.4, viewed 27 June 2012, http://www.planning.wa.gov.au/dop_pub_pdf/plan_directions2031_part1.pdf49 Department of Housing (2010), Affordable Housing Strategy 2010-2020: Opening Doors to Affordable Housing, viewed 27 June 2012, http://www.housing.wa.gov.au/HousingDocuments/AHS_Report_final.pdf50 Ageing in place: intergenerational and intrafamilial housing transfers and shifts in later life, Dr Diana Olsberg and Mark Winters Australian, Housing and Urban Research Institute, October 2005 AHURI Final Report No. 88, viewed 27 June 2012, http://www.ahuri.edu.au/publications/
43 | P a g e

Metropolitan Local Government ReviewFinal Report of the Independent Panel - July 2012
local government, the development of infrastructure, or lack of it, is important for their communities. Perth’s increasing traffic congestion demonstrates this.
Effective and well-serviced ports and airports are absolutely essential for the state’s economy. Currently, Fremantle Port is under public management and Perth Airport is privately-owned. Both are undergoing significant growth and have expansion plans, which will impact upon communities and therefore local governments. Traffic volumes and heavy vehicle movements are particularly significant. While these facilities serve not only the metropolitan region but the whole State, the impacts are concentrated on a localised area.
Perth Airport’s passenger numbers have experienced significant growth, to 11.5 million in 2010-11,51 with one projection showing passenger numbers of 20.2 million by 2031.52 Perth Airport has been rated poorly by passengers in recent years, for a number of reasons including flight delays, facilities, parking, congestion and access. While improving this experience is important, the further development of the airport will impact on the wider community. For example, the expansion of the airport is connected with the development of the Kewdale freight rail and container-handling facility. Together, these provide a significant employment hub. The efficiency of the Airport also has a critical influence on Perth’s international competiveness and tourism. The State Government has nominated the road upgrades in the vicinity of Perth Airport as a State infrastructure priority. Termed ‘Gateway WA’, it has been nominated as a national infrastructure priority to the Federal Government via the Infrastructure Australia process.53 The Federal Government has recognised the strategic significance of Gateway WA, contributing $350 million of the 2010-11 budget to commence the first phase of construction.54
Additionally, the privately-owned Jandakot Airport, located in the City of Cockburn, is the major general aviation airport in Western Australia. It is the busiest airfield and largest aviation training base in Australia. Directions 2031 flags the need for a feasibility study into another airport in the north-west sub-region.
Given Western Australia’s geographic isolation and economy, the role that the airports play in providing air services is critical. While the whole community benefits from services provided by the airports, local communities can be adversely affected. For example, Perth Airport owners undertake various community engagement initiatives towards mitigation of airport operations, including aircraft noise. The Perth Airport Advisory Board (PAAB) was established in 2007 to provide a further opportunity for government, industry and corporate stakeholders to give input.55
Perth Airport overlaps three local government boundaries; Belmont, Kalamunda and Swan. However, flight paths and noise also affects adjacent local government areas. The Perth Airport Municipalities Group brings together representatives from 11 local governments with residents that have an interest in Perth’s metropolitan airports. This includes Armadale, Bassendean, Bayswater, Belmont, Cockburn, Gosnells,
51 Perth Airport Annual Report 2010-2011, viewed 27 June 2012, http://www.perthairport.com.au/AboutUs/Publications.aspx52 Executive Summary Perth Airport Transport Master Plan, viewed 27 June 2012, http://www.transport.wa.gov.au/mediaFiles/pub_exec_summary_perth_airport_transport_master_plan.pdf53 http://www.dsd.wa.gov.au/4868_7679.aspx viewed on 27 June 2012
54 http://www.minister.infrastructure.gov.au/aa/releases/2011/May/budget-infra_13-2011.aspx viewed on 27 June 2012
55 Perth Airport (2011), Annual Report 2009-10, p. 54, viewed on 27 June 2012, http://www.perthairport.com.au/Libraries/Annual_Reports/Annual_Report_09-10.sflb.ashx
44 | P a g e

Metropolitan Local Government ReviewFinal Report of the Independent Panel - July 2012
Kalamunda, Melville, Mundaring, South Perth and Swan.56 This forum provides a vehicle for community views to be heard and keeps local governments informed of airport developments. The airport owners say they work ‘closely with local councils through the Perth Airport Municipalities Group to ensure that our operations and plans properly consider the interests and concerns of local communities.’57
3.2.6 Impacts of new technology
The Panel acknowledges that an assessment of local government into Perth’s future must give consideration to the impacts of changing technology. This is very difficult, because the speed of technological changes makes it difficult to predict the way that local government may conduct their business in the future.
For example, the Libraries Board of WA submitted to the Panel:
To serve the needs of Western Australians in the next 50 years, the public library network must develop innovative services which meet rapidly growing communities with increased expectations of service outcomes in a technologically focused world. It is the Board’s view that such services need to be developed within and by the whole public library network and not in isolation by individual local government authorities – as is the current situation (DF159).
Technology represents an important tool for metropolitan local government into the future. The opportunities it presents are varied and possibilities being explored and developed currently include:
a free Wi-Fi zone in the central business district (CBD) electronic parking monitoring video-conferencing to remote administrative sites online community panels.
Commentators have also argued that local governments need to ‘investigate new ways to use technology to encourage participation of all citizens in local government decision making. For example, chat rooms, SMS messaging on the future vision for cities, e-democracy and so on.’58
Financial institutions, retailers and service providers have altered their interface with their customers and the community. While face-to-face transactions continue to be the preference for many, the opportunity for swift, economic and convenient trading and enquiry is a growing trend. Local governments will need to continue to provide the opportunity for personal service but investments in technology are capable of providing significant efficiency and convenience.
Ultimately the cost and investment required to implement many of these projects may be out of the reach of local governments in their current form. However, the Panel believes that technology can be part of a broader reshaping of community engagement and local democracy. ‘The counsellor (sic) will need to rethink their fundamental role as that merely of representing their constituents to that of
56 For further details see website: http://pamg.com.au/ viewed on 27 June 2012, 57 Perth Airport (2011), Annual Report 2009-10, p. 7, viewed 27 June 2012, http://www.perthairport.com.au/Libraries/Annual_Reports/Annual_Report_09-10.sflb.ashx58 Inayatullah, S (2012), Cities Create Their Futures, viewed 27 June 2012, http://www.metafuture.org/Articles/Cities_create_their_futures.htm
45 | P a g e

Metropolitan Local Government ReviewFinal Report of the Independent Panel - July 2012
leadership, brokering ideas and mediating disputing visions’. 59 Democracy is thus likely to move from representation to e-governance, with many more types of initiatives and referenda.
3.3 ENVIRONMENTAL ISSUES
It has been argued that climate change is the most significant challenge to Australia’s environment, with major consequences for the economy, water availability and biodiversity.60 Perth’s ecological footprint is very large and growing, and while the region sits in one of the world’s biodiversity hotspots, it is widely accepted that there has been significant loss of biodiversity.61
Improvements to the long-term wellbeing of ecological systems will be one of the main challenges for the city’s future. Responding to the causes and effects of climate change has become a key driver to change planning approaches in the metropolitan region.62 WALGA, in its Climate Change Policy Background Paper, states that as a result of climate change, south-west Western Australia (which includes Perth) is likely to experience:
temperature increase (resulting in peak energy demands, the increased spread of diseases, and health problems for the over-65 population)
decline in rainfall and increased evaporation, resulting in reduced run-off into rivers and increased stress on water supply
more frequent and severe droughts, storms and bushfires
a decline in quality and yield of some agricultural crops, an increased prevalence of weeds and pests, and increased stress on livestock. 63
The document also identifies climate change impacts on Perth local government operations which include:
rising sea levels impacting upon land uses
effects on tourism and its financial impacts
increased severity of hazards, impacting emergency management
risk of litigation for failing to incorporate climate change into strategic and land-use planning
increased vulnerability of essential services
increased rate of degradation of infrastructure, and cost of maintenance and repair
increased pressure for improved management of transport options and energy use.64
59 Inayatullah, S (2012), Why City futures?, viewed 27 June 2012, http://www.metafuture.org/Articles/why_city_futures.htm60 Commonwealth of Australia (2010), Australia to 2050: future challenges, viewed 27 June 2012, http://archive.treasury.gov.au/igr/igr2010/Overview/pdf/IGR_2010_Overview.pdf61 Planning Context (June 2011) Creating liveable cities through regional cooperation and alliances: opportunities for Perth, Discussion paper for the Perth committee of Regional Development Australia, p8, viewed 27 June 2012,http://www.rdaperth.com.au/pages/publications.php
62 Department of Planning (2011), Capital City Planning Framework June 2011, Draft, Part A, p. 22, viewed 27 June 2011, http://www.planning.wa.gov.au/publications/2632.asp63 Western Australian Local Government Association (2009), Climate Change Policy Background Paper, p.8-18viewed 27 June 2012, http://www.walgaclimatechange.com.au/walga-policies.htm64 Western Australian Local Government Association (2009), Climate Change Policy Background Paper, p.8-18
46 | P a g e

Metropolitan Local Government ReviewFinal Report of the Independent Panel - July 2012
The issues described above do not have quick or one-off solutions. Due to their complexity, and the fact that they usually span more than one local government area, they require cooperation and support between agencies, and a joint commitment to reach outcomes. Conversely, not all problems can be solved at the highest level of government, with local solutions or contributions required for many issues.
These issues will increasingly impact on local government, as a result of factors such as:
transference of responsibility from State governments
financial and resource changes from new arrangements (e.g. carbon price scheme)
backlog to maintain and repair existing infrastructure (competing with the need for new, more sustainable infrastructure)
diminished availability of land (e.g. for waste management)
decrease of people volunteering (e.g. for emergency services).
Local governments have a key role in ensuring the sustainability of their communities and environment. However, addressing the critical issues of natural resource management requires a strategic focus and the ability to think about the ‘big picture’. Many environmental issues transcend local government boundaries, and require collective solutions.
3.3.1 Coastal zone management
Perth’s metropolitan coastline is a significant natural asset that typifies the Perth local environment and lifestyle. The increasing growth of urban areas along the coast, together with the development of public infrastructure and industrial facilities, creates competing demands on the coastal resource. The Panel believes that any future development needs to occur in a framework of strategic regional planning, which recognises opportunities and natural constraints and appropriately recognises climate change and sea-level rise.
The Perth Coastal Planning Strategy has been developed for the sustainable planning, conservation, recreation, infrastructure and development of the metropolitan coast. The WAPC Coastal Planning and Coordination Council, which includes local government representatives, is the current body that provides advice to the Minister for Planning, and coordinates planning for and management of the State’s coastal zone.
There are 11 metropolitan local governments, from Wanneroo to Rockingham, that share responsibility for managing the coastline. Given the number of agencies, stakeholders and interest groups, the best ecological and social outcomes for the coastal zone need to be ensured when determining the best governance structure for metropolitan Perth.
3.3.2 Water Management
Metropolitan Perth is facing major water supply constraints into the future. In a medium-demand projection from a study commissioned by the Department of Water, it is estimated that by 2030 the demand for water is expected to rise by 45 per cent from 2008 levels. This estimate is reasonably conservative and more recent
47 | P a g e
Metropolitan Local Government ReviewFinal Report of the Independent Panel - July 2012
projections of population and economic growth may make it even more so.65 Runoff to Perth’s dams has decreased over recent years to less than half of its historic average. Perth is therefore caught between declining supply and increasing demand. In a worst-case scenario, the deficit in Perth’s water supply could grow to over 200 gigalitres per annum in 2030. In spite of these challenges, Perth continues to be a high consumer of water. ‘This brief history of Perth’s water supply has shown that we have had crises which we have been able to adapt to, but the options for new supplies are dwindling and the difficulty of forecasting and managing demand are increasing.’66
Local governments play a crucial role in water management. Public open space is the highest water user for local government, accounting for 3 per cent of the State’s water usage. Groundwater availability and quality is declining in some aquifers, making it difficult for local governments to manage public open space and meet community expectations. Local government can improve water management through planning mechanisms, facilities, public open space management, building controls, infrastructure management, drainage practices and community education. Many metropolitan local governments participate in the International Council for Local Environmental Initiatives (ICLEI) water campaign,67 an international freshwater management program that builds the capacity of local government to reduce water consumption and improve local water quality. It is critical that local government improves water efficiency, invests in new technology, plans strategically and adopts the use of alternative water sources to ensure it meets licensing and community obligations to provide high quality public open space facilities.
65 McFarlane, D (2011), Future Water Yields and Demands: The impact of Climate Change and Rapid Development - Paper to Population WA Forum, Perth, 10 May 2011.
66 Ibid.
67 WA Water CampaignTM provided by ICLEI – Local Governments for Sustainability Oceania. (ICLEI) http://www.water.wa.gov.au/Managing+water/Water+efficiency/ICLEI+Water+Campaign/default.aspx Accessed 10 June 2012.
48 | P a g e

Metropolitan Local Government ReviewFinal Report of the Independent Panel - July 2012
3.3.3 The Swan and Canning River system
The Swan River is an iconic feature of the Perth metropolitan region and the Swan and Canning River system is also a dominant geographic feature with 71 per cent of the State’s population living in its catchment area. Pressure on the system will increase as the number of people living in the catchment area reaches 2 million by 2030.
The Swan River Trust is the primary agency responsible for protecting and managing Perth's river system. The 21 metropolitan local governments with river frontage also play a role and have formed the Swan Canning Policy Forum. As local governments compete against each other for the limited money available to protect foreshore infrastructure, the forum provides a vehicle to lobby for increased funding.
In the Perth Regional Plan, Regional Development Australia (RDA) identifies the Swan and Canning River system as a focus area and includes the action of ‘advocate for appropriate funding from the three levels of government to address issues relating to the health of the river.’68 Overlaying this activity is the Perth Region Natural Resource Management (NRM) (formerly the Swan Catchment Council), a community-led organisation coordinating natural resource management in the Perth region.
The Swan and Canning River system is central to Perth’s environment, lifestyle, identity, heritage and community wellbeing. Given the number of agencies, stakeholders and interest groups, the Panel believes a simplification of Perth’s local government arrangements and the increased capacity of larger local governments will help achieve improved outcomes for the Swan and Canning Rivers.
There is a significant lack of coordination and vision with regards to the future management of the Swan and Canning Rivers. The Perth metropolitan area will not achieve the vision set out in Directions 2031 whilst one of the City's prime assets continues to be contentious and subject to dispute. (IP108).
3.3.4 Waste management
Perth reportedly has the worst landfill and waste recycling record in Australia.69 The metropolitan community is facing a critical shortage of landfill in the metropolitan area as capacity will be exhausted within 20 years.70 Establishing new waste treatment facilities and employing strategies to reduce waste is a major State and local government issue.
Rubbish collection has long been one of the three Rs of local government (roads, rates and rubbish). For decades, each local government looked after its own arrangements for collecting and disposing of household waste. RLGs were established, and have provided a vehicle for more effective waste management, although councils still generally manage their own arrangements for waste collection. The Panel has noted that there is significant variation in the way that waste and recyclables are collected across local governments in Perth.
68 Regional Development Australia (2011), RDA Perth Regional Plan, viewed 27 June 2012, http://www.rdaperth.com.au/pages/publications.php69 Regional Development Australia (2011), RDA Perth Regional Plan, Discussion Paper, viewed 27 June 2012, http://www.rdaperth.com.au/pages/publications.php70 City of Cockburn, Waste, Did you know we can recycle all this?, viewed 27 June 2012, http://www.cockburn.wa.gov.au/Council_Services/Waste/
49 | P a g e

Metropolitan Local Government ReviewFinal Report of the Independent Panel - July 2012
RLGs are established under the Local Government Act 1995 and their membership comprises individual local governments. Local governments in RLGs relevant to this review have effectively delegated their function of waste disposal to the RLG.
While the RLG is a body corporate in its own right, its financial position is guaranteed by the member councils. Accordingly, its assets and liabilities become assets and liabilities of its members in the event that it ceases to operate. So, when the City of Canning recently withdrew its membership from the South Metropolitan Regional Council (SMRC), it also assumed responsibility for a significant portion ($14.1 million) of SMRC's $53.1 million debt. In essence, the debt is covered by its member councils as a charge against the general funds of each local government. Where regional councils have developed significant infrastructure to process waste, this has generally been funded through debt.
Existing RLGs in metropolitan Perth with a waste management function are:
East Metropolitan Regional Council (EMRC) - Bassendean, Bayswater, Belmont, Kalamunda, Mundaring and Swan
Western Metropolitan Regional Council (WMRC) - Claremont, Cottesloe, Mosman Park, Peppermint Grove and Subiaco
Rivers Regional Council – Armadale, Gosnells, Mandurah, South Perth. South Metropolitan Regional Council (SMRC) – Cockburn, East Fremantle,
Fremantle, Kwinana, Melville, Rockingham Mindarie Regional Council (MRC) – Cambridge, Joondalup, Perth, Stirling,
Wanneroo, Victoria Park and Vincent.
These RLGs operate landfill sites such as Red Hill (EMRC), processing facilities such as the Neerabup Aerobic Composting Plant (MRC) and the aerobic composting and materials recovery centre at Canning Vale (SMRC). In recent times, a number of councils (notably Canning, Stirling and Rockingham) have opted out (or are in the process of opting out) of this framework.71 This can reduce long-term effectiveness and diminish economies of scale. It is one sign that there is a need for a new model for waste management.
In the Perth region, the money spent by local government on waste management and related activities exceeds $130 million per year. Additionally, tens of millions of dollars of new capital funds are invested each year to meet increasing demand and adopt new technologies. Success in achieving the municipal solid waste targets in the Western Australian Waste Strategy72 relies on the implementation of alternative waste treatment facilities. The construction of these can take between five and seven years with a total investment of $100 million each. The Environment Protection Authority (EPA) is currently assessing a number of proposed waste-to-energy facilities. As such, the Minister for Environment has announced a review of waste-to-energy facilities.73
The Waste Authority, appointed under part 2 of the Waste Avoidance and Resource Recovery Act 2007, was established in May 2008 and is fully funded through the Waste Avoidance and Resource Recovery Account. This money is derived from a levy placed on waste going to landfill. Initially, all funds collected were used for waste-71 It is understood that Nedlands has never been part of the WMRC.72 Waste Authority (2012), Western Australia Waste Strategy: Creating the Right Environment, viewed 27 June 2012, http://www.zerowaste.wa.gov.au/media/files/documents/WA_Waste_Strategy.pdf73 Minister for Environment, Hon. Marmion, B (2012), Media Statement, Review examines waste to energy facilities, viewed 27 June 2012http://www.mediastatements.wa.gov.au/Pages/WACabinetMinistersSearch.aspx?ItemId=149380&minister=Marmion&admin=Barnett
50 | P a g e

Metropolitan Local Government ReviewFinal Report of the Independent Panel - July 2012
reduction initiatives, but in 2009 the levy was increased by 300 per cent, with the majority of funds being used to offset the general expenditure of the Waste Authority. The Minister has discretionary powers in the allocation of funds.74
Well-managed infrastructure for waste collection, handling, processing and disposal is critical for the community. In recent years, several alternative waste treatment facilities have been established in Perth to pre-treat municipal solid waste and recover materials prior to disposing into landfill. These facilities have contributed to improved recycling, improved diversion from landfill, and improved management of greenhouse gases.
Currently, it seems that Perth will have five or six resource recovery facilities, reflecting the fact that each regional council is tending to implement a solution for its own region, without considering an overall metropolitan solution. Brisbane, with a population greater than Perth, will ultimately only have one or two such facilities. In the Panel’s view, there are potential benefits in having a single metropolitan approach for waste management.
3.4 REGIONAL ISSUES
3.4.1 Governance and planning
All three levels of government are involved in the governance and planning of Australia’s metropolitan regions, including Perth. The governance of metropolitan Perth includes the policies, programs and activities of:
30 local governments and six RLGs (to be examined in Section 4)
State Government departments and agencies Commonwealth Government departments and agencies
Private sector and non-government organisations (civil society).The State Government is traditionally the dominant player in metropolitan governance, being responsible for utility services, infrastructure for transport, health, education and other major community services. It is also responsible for preparation of metropolitan planning strategies and in most cases, approves major development proposals.
The orderly growth and progress of Perth, as a well-planned city with modern facilities and services, has always been a major focus of the successive governments of Western Australia. Management of the metropolitan region is the single most important task for State government; this has been described as the Australian model of metropolitan governance.75 This is reflected by State Government expenditures for the Perth region, which, at around $2 billion, are estimated to be around ten times those of metropolitan local governments.
Metropolitan local governments formerly had greater involvement in providing key public services, including public transport, electricity supply, water and sewerage in Western Australia. However, the fragmentation of local government across the growing city over the last century has created difficulties in coordination. As such, various instrumentalities were formed by the State to run particular services, with the aim of achieving more efficient operations than could be provided by local 74 Professor Syme, G, Global Water Forum (2010), Matching water demand with supply in Perth, Australia, viewed 27 June 2012, http://www.globalwaterforum.org/2010/11/24/matching-water-demand-with-supply-in-perth-australia/75 Sansom, G, Dawkins, J & Tan, S (2012), The Australian Model of Metropolitan Governance: Insights from Perth and South East Queensland, UTS: Centre for Local Government, University of Technology, Sydney, May 2012
51 | P a g e

Metropolitan Local Government ReviewFinal Report of the Independent Panel - July 2012
government. Many of these State agencies have continued to operate in varying forms until the present day. These agencies, which included the Metropolitan Transport Trust, Swan River Management Authority, State Energy Commission and the Metropolitan Regional Planning Authority now manage functions that are the responsibility of local government in other states and countries. 76
Today, as in many large urban regions, there is a range of authorities with varying establishment and management arrangements that form part of Perth’s governance arrangements. Some are special-purpose authorities, such as VenuesWest which was created to manage specialised recreational facilities including Challenge Stadium and the Perth Motorplex. Other examples include:
Botanic Gardens and Parks Authority Burswood Park Board Fremantle Ports Perth Market Authority Swan River Trust Zoological Parks Authority.
Many of these authorities perform functions or have responsibilities that elsewhere in the State are the responsibility of local government, such as parks and gardens, cemeteries, markets, planning and development. This, demonstrates that the complexity or scale of these issues in metropolitan Perth is beyond the abilities of any single local government to manage. Some of these agencies, do however, include local government representation.
An illustrative example is the Metropolitan Cemeteries Board (MCB). The MCB is appointed by the Minister for Local Government and its responsibilities are described in the Cemeteries Act 1986. There are no specific local government representatives on the Board. By-laws gazetted in 1992 set out administrative and general provisions for operating cemeteries under the Board’s control. The MCB is a not-for-profit organisation and revenue raised (from fees charged for various services) is allocated to providing future services and maintenance. The MCB currently manages and maintains six cemetery and memorial garden sites around Perth, spread across five local government areas, and is planning for more sites.
A relatively new player in Perth’s metropolitan governance is the MRA which commenced on 1 January 2012, established under the Metropolitan Redevelopment Authority Act 2011. This new authority replaced existing authorities created separately for Armadale, East Perth, Midland and Subiaco. The MRA is responsible for major infrastructure developments such as Elizabeth Quay (the Perth Waterfront project), Perth City Link and Riverside. The MRA has a board with seven members. There are no specific local government representatives, but the Act provides for one member to be a person who, in the opinion of the Minister, has knowledge of or experience in local government.
The MRA's functions are to control these developments and to prepare and review the redevelopment schemes for those areas.77 The new authority centralises all administrative functions into one entity. Locally-based Land Redevelopment Committees (LRCs) concentrate on fulfilling the MRA’s planning and development functions in each area. These committees are delegated planning powers by the authority’s board for their respective areas. The MRA works closely with the LRCs to 76 Jones, R, Metropolitan Government, in Gentilli, J (ed.) Western Landscapes, UWA Press: Nedlands. (1979: 489)77 Metropolitan Redevelopment Authority (2011), Act and Scheme, viewed 27 June 2012, http://www.mra.wa.gov.au/About-Us/Act-and-Scheme/
52 | P a g e

Metropolitan Local Government ReviewFinal Report of the Independent Panel - July 2012
ensure working relationships are maintained to provide the best outcomes for residents.
The Panel has identified the potential for large institutions such as universities and major hospitals to be removed from local government jurisdiction. An approach similar to that of Kings Park should be adopted, and as such they could come under the MRA.
3.4.2 Urban planning in Perth
It is critical to the success of this Review to consider urban planning arrangements in metropolitan Perth, given the key role played by local government and the importance of planning arrangements for the future growth of Perth.
Town planning powers were conferred on all local governments by the Town Planning and Development Act 1928. After the end of World War II the need for a regional planning authority for Perth started to be debated, culminating in the Stephenson Plan for Perth and the formation of the Metropolitan Regional Planning Authority (MRPA) in 1959. Its members were first appointed in April 1960 and included local government nominees. The MRPA has been described as ‘a rare and arguably effective example of dedicated metropolitan governance in the Australian planning experience’.78 The MRPA existed until 1985 when it was superseded by the creation of the State Planning Commission and subsequently the WAPC.
Western Australia’s planning framework is highly centralised, with the WAPC determining the majority of subdivision applications, setting State planning policies and managing regional schemes, including schemes for metropolitan Perth, such as the MRS. The WAPC, accountable to the Minister for Planning, is the responsible authority for land-use planning and development matters, including determining subdivision applications, administering regional planning schemes and making recommendations to the Minister on local planning schemes. None of the other states in Australia have a dedicated metropolitan planning authority. Perth and Brisbane both have joint state-local government bodies for this purpose, although they have State-wide responsibilities as well.79
Membership of the WAPC consists of local and State government representatives, as well as representatives from special interest groups. It can have up to 15 members, and there is currently one metropolitan and one non-metropolitan local government representative (each with a deputy). The Department of Planning provides professional planning and administrative support to achieve the outcomes of the WAPC, and where appropriate, implements the WAPC’s decisions.
The Planning and Development Act 2005 is the principle town planning legislation in Western Australia. Under the Act, several committees have prescribed roles and functions, such as the Infrastructure Co-ordinating Committee, which advises the WAPC on planning for the provision of infrastructure and promotes interagency cooperation relating to urban development. The over-arching State Planning Strategy (1997) is supported by over 100 State planning policies and planning bulletins. The most recent metropolitan planning strategy is Directions 2031 which supersedes Network City and replaces Metroplan and all other metropolitan strategies.
78 Gleeson, B, Dodson, J and Spiller, M (2010), Metropolitan Governance for the Australian City: The Case for Reform, Issues Paper No. 12, Urban Research Program, Griffith University (Qld)79 Sansom, G, Dawkins, J, Tan, S (2012), The Australian Model of Metropolitan Governance: Insights from Perth and South East Queensland, UTS: Centre for Local Government, University of Technology, Sydney, May 2012
53 | P a g e

Metropolitan Local Government ReviewFinal Report of the Independent Panel - July 2012
Other State government departments play complementary roles in the planning process, such as the Department of State Development, the Office of Heritage, the Environmental Protection Authority and the Department of Environment and Conservation.
The WAPC has the power to raise funds for major projects via the Metropolitan Region Improvement Tax.80 This fund has been used to purchase large areas of open space and to acquire land for transport corridors, infrastructure and public facilities. The fund supports the implementation of strategic land-use plans under the MRS, and works relatively efficiently because land for urban uses is purchased in advance.
There is sometimes tension between local and State government in relation to planning. While local governments have legal authority for local planning schemes, decisions are sometimes overturned by the State. This has been necessary at times to ensure State Government-led initiatives are implemented. The establishment of redevelopment authorities (now replaced by the MRA) and the creation of Development Assessment Panels (DAPs) are examples. These initiatives have responded to the needs of the community, particularly when there are complex governance arrangements in a planning area, or a limited ability to deliver outcomes due to the large financial input required to bring a project to fruition.
Local governments are responsible for controlling land-use planning and development in their areas. They do this via their local planning schemes and strategies. Local governments are required to ensure their schemes are consistent with State and regional planning objectives, including the MRS. Local governments are required to review their schemes every five years, but the Panel notes that some are behind schedule (see Table 3.4).
Table 3.4: Town Planning Schemes (TPS) in metropolitan Perth
Local Government Population (2011) TPS No. TPS Gazettal
Nedlands (C) 22,918 Scheme 2 18/04/1985Serpentine-Jarrahdale (S) 18,395 Scheme 2 04/08/1989Kwinana (T) 30,433 Scheme 2 20/11/1992Canning (C) 89,879 Scheme 40 18/02/1994Mundaring (S) 39,532 Scheme 3 18/03/1994Peppermint Grove (S) 1,779 Scheme 3 02/08/1996Stirling (C) 205,961 Scheme 38 18/07/1997Cambridge (T) 27,442 Scheme 1 31/03/1998Victoria Park (T) 33,745 Scheme 1 30/09/1998Vincent (T) 31,771 Scheme 1 04/12/1998Cottesloe (T) 8,357 Scheme 2 23/12/1998Claremont (T) 10,034 Scheme 3 01/06/1999Mosman Park (T) 9,513 Scheme 2 08/10/1999Melville (C) 103,767 Scheme 5 14/12/1999Subiaco (C) 19,077 Scheme 4 23/03/2001Wanneroo (C) 156,337 Scheme 2 06/07/2001
80 This form of land tax originated from the Metropolitan Region Improvement Tax Act 1959 and is currently (2012) set at 0.14 cent for each $1 of the unimproved value of the land in excess of $300 000, per property in the metropolitan area (excluding exempt land, e.g.. owner’s primary residence).
54 | P a g e
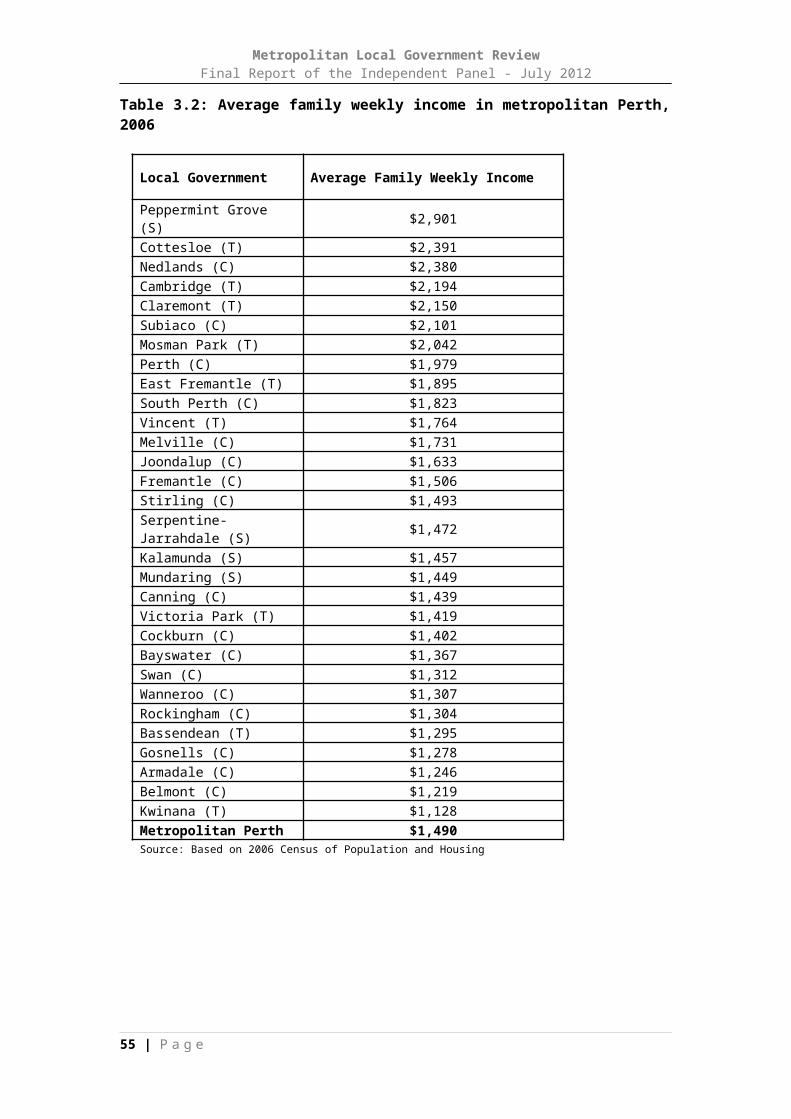
Metropolitan Local Government ReviewFinal Report of the Independent Panel - July 2012
Local Government Population (2011) TPS No. TPS Gazettal
Gosnells (C) 109,041 Scheme 6 15/02/2002Cockburn (C) 94,003 Scheme 3 20/12/2002South Perth (C) 44,760 Scheme 6 29/04/2003Perth (C) 18,616 Scheme 2 09/01/2004Rockingham (C) 108,022 Scheme 2 19/11/2004Bayswater (C) 62,627 Scheme 24 26/11/2004East Fremantle (T) 7,751 Scheme 3 03/12/2004Armadale (C) 64,284 Scheme 4 04/11/2005Fremantle (C) 29,383 Scheme 4 08/03/2007Kalamunda (S) 56,699 Scheme 3 22/03/2007Swan (C) 116,068 Scheme 17 18/02/2008Bassendean (T) 15,000 Scheme 10 24/06/2008Joondalup (C) 167,634 Scheme 2 28/11/2008Belmont (C) 35,979 Scheme 15 01/01/2011Source: http://online.planning.wa.gov.au/lps/localplanningschemes.asp
The Model Scheme Text devised by the WAPC provides a standard basis for developing local planning schemes, but includes scope for local governments to accommodate individual scenarios. The Panel notes that some local governments, such as Bassendean and Victoria Park, have reviewed their schemes to accommodate transit-oriented development and infill-housing targets. However, as individual local governments each have separate planning schemes, this has resulted in fragmented planning decisions and disagreements requiring resolution by the State Administrative Tribunal.
Respondents told the Panel that local planning strategies (LPSs) and Town Planning Schemes (TPSs) should be reviewed regularly, at least every five years, noting that one council had not reviewed its TPS for 27 years (DF179). TPSs need to be reviewed in order to compliment state initiatives, like Directions 2031.
It is very disturbing that a large proportion of LPSs and TPSs have not been updated for many years, some beyond 10 years. This has adverse implications for new property development that complies with state policy but is not supported by LPSs and TPSs. (DF142)
Development Assessment PanelsEstablishing Development Assessment Panels (DAPs) was a recommendation of the 2009 Building a Better Planning System review. Each DAP is made up of five panel members - three specialist members and two local government representatives. DAPs provide independent advice on major development proposals, while ensuring local government representation, thereby maintaining the link between high level strategies for the State and local community views.
The metropolitan Joint Development Assessment Panels currently are:
Metro south-west – Cockburn, East Fremantle, Fremantle, Rockingham, Kwinana
Metro east – Armadale, Gosnells, Kalamunda, Mundaring, Serpentine-Jarrahdale, Swan
Metro north-west – Joondalup, Wanneroo, Stirling
Metro west – Cambridge, Claremont, Cottesloe, Mosman Park, Nedlands, Peppermint Grove, Subiaco, Vincent
55 | P a g e
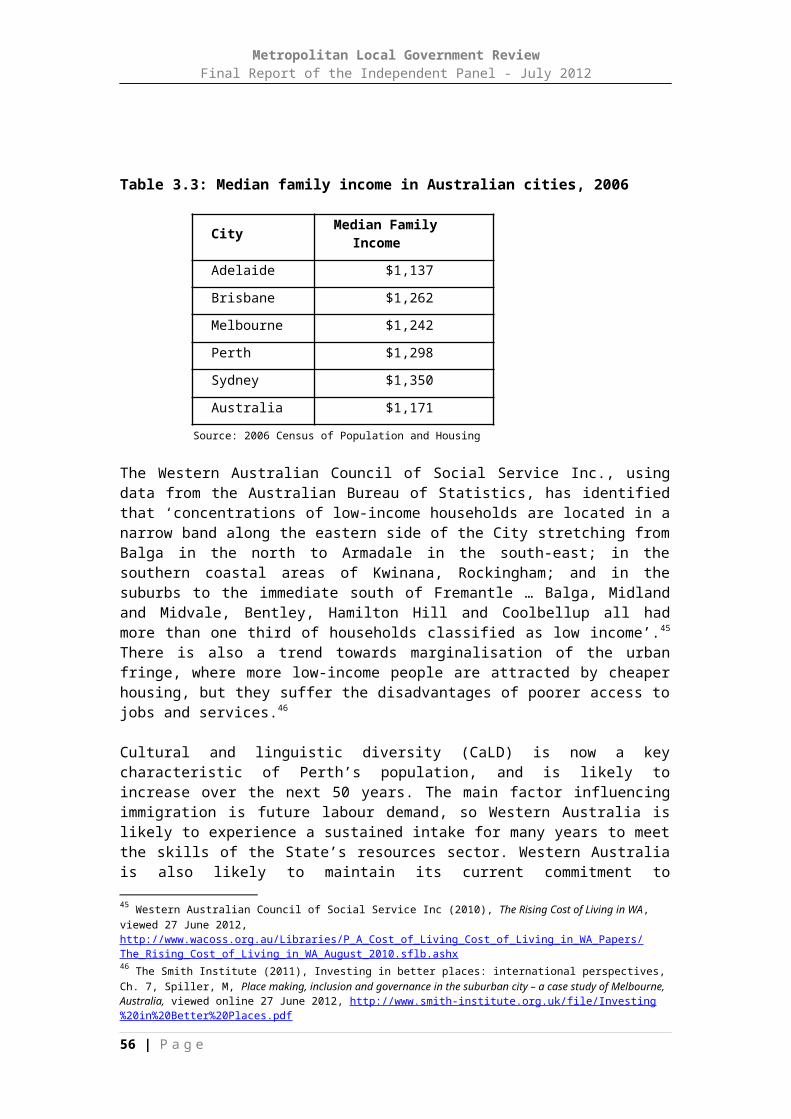
Metropolitan Local Government ReviewFinal Report of the Independent Panel - July 2012
Metro central – Bassendean, Bayswater, Belmont, Canning, Melville, South Perth, Victoria Park.
The City of Perth is the only local government to have a DAP in its own right.
State Administrative TribunalThe State Administrative Tribunal (SAT) was established under the State Administrative Tribunal Act 2004 and commenced operations in 2005. The Tribunal consists of judicial and non-judicial members with a wide range of skills and qualifications and deals with a broad range of matters referred to it by 151 enabling Acts and Regulations.
Many issues involving local governments are dealt with in the Development and Resources (DR) stream of the SAT.
As in previous years, almost 80% of the work of the Development and Resources (DR) Stream in 2010 - 2011 involved the review of decisions of state and local government authorities in relation to planning (mainly development and subdivision and some structure planning) applications. 61% of development and subdivision review applications were ‘class 1 planning applications’ (involving developments with a value of less than $250,000, houses with a value of less than $500,000 and subdivisions of up to three lots) and 39% of development and subdivision review applications were ‘class 2 planning applications’ (all other development and subdivision applications). 65% of planning review applications involved the review of the refusal of an application, 5% stemmed from ‘deemed’ refusals (failure to determine an application within a specified statutory period) and 30% involved the review of conditions imposed on approvals.81
Of DR applications finalised during 2010 and 2011, 65 per cent were from the Perth metropolitan region. Analysis of the register of applications from the DR stream showed that metropolitan local governments were respondents to 654 SAT matters between 2008 and 2011.
The Panel is concerned with the possibility that councils may reject proposals which come before them, in the knowledge that SAT will be responsible for making the final decision. It is evident that some local governments are respondents to a disproportionate number of SAT matters, including Subiaco, Vincent, Fremantle, Nedlands and Stirling, which are generally highly developed, inner-urban local governments.82 This may be because applications in more densely developed local governments are more controversial than in less densely developed areas. Conversely though, Serpentine-Jarrahdale, a developing area on the metropolitan fringe, is also over-represented.
Directions 2031 and beyondDirections 2031 is a high-level spatial framework and strategic plan for the future growth of the Perth region. It provides a framework to guide the detailed planning and delivery of housing, infrastructure and services necessary to accommodate a range of growth scenarios. Directions 2031 is a ‘framework for future growth and development of Perth and Peel within which more detailed policies and programs will be progressively developed and refined.’ It is a ‘long-term strategic guide to decision-
81 State Administrative Tribunal, Annual Report 2010-11, p 12, viewed 27 June 2012, http://www.sat.justice.wa.gov.au/R/reportsPublications.aspx?uid=6002-8957-3771-292182 MLGR (2011), The State Administrative Tribunal, http://metroreview.dlg.wa.gov.au/Page.aspx?PID=BackgroundInformation
56 | P a g e

Metropolitan Local Government ReviewFinal Report of the Independent Panel - July 2012
making’ rather than a statutory plan. It sets out five strategic themes and objectives - liveable, prosperous, accessible, sustainable and responsible.
Activity Centres are also identified. These are hubs that attract a concentration of commercial uses and are supported by other uses. The functions of these centres are to:
provide services, employment and activities that are appropriate for and accessible to the communities they support
be integrated with and encourage the efficient operation of the transport network, with particular emphasis on promoting public transport, walking and cycling and reducing the number and length of trips
be designed based on transit orientated development principles provide opportunities as places to live through higher density housing and the
development of social and cultural networks encourage the agglomeration of economic activity and business synergies support the development of local identity and sense of place.
The Activity Centre hierarchy is identified as follows:
Capital City – the main focus for civic, cultural, administrative, business, retail and tourism activity –, includes Perth, West Perth, East Perth and Northbridge.
Strategic Metropolitan Centres – multipurpose centres that provide a mix of retail, office, community, entertainment, residential and employment activities and are well-serviced by high-frequency public transport – Armadale, Cannington, Fremantle, Joondalup, Mandurah, Morley, Midland, Stirling, Rockingham and Yanchep (emerging). .
Secondary Centres – these generally serve smaller catchments and offer a more limited range of services, facilities and employment opportunities – Alkimos, Claremont, Cockburn, Subiaco, Wanneroo..
District Centres – generally serving the main weekly household shopping, service and community needs of a district, predominantly retail-focused but also associated with civic, community and recreation facilities – e.g. Currambine, Riverton..
Neighbourhood Centres – catering for main daily shopping needs and occasionally other uses and community facilities.
Local Centres – providing for incidental needs within a walkable catchment.
The Activity Centre concept also incorporates the following:
Specialised Centres – Bentley/Curtin, Murdoch, UWA/QEII. Strategic Industrial Centres – Western Trade Coast and Kewdale/Welshpool. Existing Industrial Centres – e.g. Canning Vale, Malaga, O’Connor, Osborne Park. Priority Industrial Sites – South Pinjar, South Forrestdale, Cullacabardee, South
Bullsbrook, North-east Baldivis. Metropolitan Attractors – Burswood Casino, Cottesloe Beach, Fremantle Harbour,
Hillarys Boat Harbour, Kings Park, Perth Zoo, Perth Waterfront, Perth Cultural Centre, Perth Hills, Rockingham Beach, Scarborough Beach, Swan Valley, Yanchep National Park.
Directions 2031’s aim is to align regional, sub-regional and local planning for the:
development of Activity Centres roll-out of infrastructure development of greenfield land
57 | P a g e

Metropolitan Local Government ReviewFinal Report of the Independent Panel - July 2012
facilitation of infill development development of transport networks.
Directions 2031 highlights the importance of integrated planning. This includes economic, natural resource management and biodiversity planning and land use planning with local planning schemes. The strategy discusses congestion and amenity issues, the need for a metropolitan parking framework, the importance of identification and protection of transport and freight corridors and road infrastructure to support development and manage congestion.
Directions 2031 notes that infrastructure sites, freight corridor needs, land use compatibility and buffer requirements need to be considered as part of long-term planning for established industrial precincts. It says that strategic plans and local planning schemes should seek to optimise the operation, economic functions and long-term employment potential of industrial zones. It finds that local governments should plan centres as mixed-use precincts suitable for a range of businesses and local employment.
The Department of Planning, WAPC and other State Government stakeholders have an ongoing role in facilitating the implementation of Directions 2031. They should provide advice and assistance to local governments with responsibilities for implementing initiatives and achieving housing and employment targets.
Cooperation between local authorities is critical and will be encouraged in the achievement of the targets. Local governments need to be responsible for developing realistic, market-oriented plans and strategies for encouraging innovative infill and greenfield development. As part of this, they need to be the advocates for the housing needs of future generations and to take ownership of their community’s part of a larger regional infill obligation.83
Many issues such as NRM, transport and parking have regional importance and will require cross-boundary regional cooperation and consistency. For example, the planned redevelopment along the Stirling Highway corridor, which traverses through seven local governments, makes sound sense as it encourages high-density development around a major public transport route.
Central Metropolitan Perth sub-regional strategyThe central sub-region covers an area of 45,290 hectares and includes 19 local government areas and has a current (2012) population of 789,000. Directions 2031 identifies eight strategic priorities for this sub-region, including increased housing stock and diversity, a diverse mix of services and facilities, transit orientated developments, a balanced distribution of employment, protecting natural and built environments and maximising the efficiency and equity of essential service infrastructure.
Sub-regional strategies address issues that require a regional response, because they extend beyond local government boundaries or are commonly shared issues such as provision of housing choice and affordability.
83 Western Australian Planning Commission (2010), Directions 2031 and beyond – metropolitan planning beyond the horizon, p. 91, viewed 27 June 2012, http://www.planning.wa.gov.au/dop_pub_pdf/plan_directions2031_part1.pdf
58 | P a g e

Metropolitan Local Government ReviewFinal Report of the Independent Panel - July 2012
Figure 3.1: WAPC Central sub-region and local government areas
Outer Metropolitan Perth– Sub-regional strategiesThe Panel notes the Activity Centre Network and Movement Networks identified in strategies, as well as the existing transport, freight and green networks and planned future key public transport connections.
59 | P a g e

Metropolitan Local Government ReviewFinal Report of the Independent Panel - July 2012
Figure 3.2: WAPC Planning sub-regions and local government areas
60 | P a g e
Metropolitan Local Government ReviewFinal Report of the Independent Panel - July 2012
3.4.3 Organisation of State Government agencies
The Panel has found variation in the way State Government agencies organise their administrative districts or sub-regions, including varying definitions of ‘metropolitan’ and ‘regional’ (concerning local governments within the Peel Region)84. While there may be valid reasons for these variations, they may contribute to the complexity of State and local government relationships.
In Directions 2031, the Department of Planning treats Perth and Peel as separate regions, however it has linked planning for the Peel region with that of outer metropolitan Perth. Directions 2031 identifies six sub-regional areas: Central North-west North-east South-east South-west Peel (includes Serpentine-Jarrahdale).
Appendix 3.1 provides a complete list of regional arrangements of government.
The Western Australian Police utilises seven metropolitan districts. The Department of Education operates four metropolitan regions and the Department of Health has two metropolitan service regions. The Department of Housing operates three metropolitan districts.
The Panel believes a redefinition of local government structures will provide an opportunity for a more consistent alignment of boundaries for State Government agencies as well.
3.4.4 The Commonwealth Government
Historically, the Commonwealth Government has played a limited role in metropolitan development, with their policies in immigration, communications, aviation, taxation and economic management setting the context for metropolitan growth. The Commonwealth’s financial dominance over the states allows it to intervene in some policy and expenditure decisions, mostly major infrastructure projects.
The Commonwealth Government has a major interest in the efficiency of Australia’s cities and has recently produced a National Urban Policy. It has formed a Major Cities Unit to advise on issues of policy, planning and infrastructure. The Commonwealth Government is also involved in providing funding for services and initiatives such as the Suburban Jobs Program. It also provides funding for major infrastructure projects, such as $236 million over six years for the Perth City Link project. The Commonwealth oversees and regulates the privately-operated Perth and Jandakot Airports, and maintains major defence installations, including Garden Island and Pearce. It has also established the Perth Committee, an unincorporated advisory body of the RDA network. RDA is an Australian Government initiative that aims to
84 The Regional Development Commissions Act 1993 defines the regional areas of Western Australia with the Peel region defined as including ‘the local government districts of Boddington, Mandurah, Murray, Serpentine-Jarrahdale and Waroona’. The Departments of Regional Development and Lands, Local Government and Sport and Recreation along with Landcorp follow these defined regions, treating the Shire of Serpentine-Jarrahdale as being in the Peel region, not the Perth metropolitan region.
61 | P a g e

Metropolitan Local Government ReviewFinal Report of the Independent Panel - July 2012
bring together all levels of government to provide a strategic framework for economic growth in each region. It has produced a Draft Perth Regional Plan for comment. 85
3.4.5 Other players in metropolitan governance
In addition to the activities of government in metropolitan areas, the private sector also plays a role, largely as a service provider to the community and as a contractor to government including operating major facilities such as Perth Airport.
Non-government organisations also play a role, for example, Perth Region NRM is a community-led organisation responsible for coordinating and delivering natural resource management (NRM) in the Perth region. It has developed a strategic plan to provide direction for future investment in NRM by the Australian Government, the State Government and the regional community.86 A number of non-government organisations have also emerged at the community level to lobby for particular interests, or aim to fill gaps in local area governance. These organisations are part of what can be termed civil society, or the third sector of society, when people associate to advance common interests. While many have the support of local and State government, they remain independent. The following examples provide an indication of the range of these organisations:
Swan Canning Policy Group (C21) CityVision Committee for Perth Future Perth Western Australian Council of Social Service (WACOSS) Shelter WA.
3.4.6 Review of capital city strategic planning systems
The COAG Reform Council reports on reforms of national significance that require cooperative action by Australian governments. In regards to Australia’s cities, COAG asked the Council to:
review capital city strategic planning systems against agreed national criteria support continuous national improvement in capital city strategic planning build and share knowledge of best-practice planning approaches.
COAG’s objective was ‘to ensure Australian cities are globally competitive, productive, sustainable, liveable and socially inclusive and are well placed to meet future challenges and growth.’87 There are nine criteria for future strategic planning of capital cities (see Appendix 3.2). Essentially, the aim of the review was to ensure cities have long-term plans and are prepared to meet the challenges of economic growth, climate change, housing affordability and urban congestion.
The COAG Reform Council’s final report was released in February 2012. It includes an assessment of the strategic planning system in Perth. The following sections of the
85Regional Development Australia (2011), Perth Regional Plan, viewed 27 June 2012, http://www.rdaperth.com.au/pages/publications.php86Perth Region NRM (2006), Swan Region Strategy for Natural Resource Management: Appendix 6, viewed 27 June 2012, http://www.perthregionnrm.com/media/4075/appendix%2006%20%20community%20and%20stakeholder%20engagement.pdf
87 COAG Reform Council (2011), Review of capital city strategic planning systems: Report to the Council of Australian Governments, viewed 27 June 2012, http://www.coagreformcouncil.gov.au/reports/docs/capital_cities/review_of_capital_city_strategic_planning_systems.pdf
62 | P a g e

Metropolitan Local Government ReviewFinal Report of the Independent Panel - July 2012
report were considered relevant to the Metropolitan Local Government Review, as they are central to the consideration of metropolitan governance.
Key points about the COAG Reform Council review are: It is a review of strategic planning, not just statutory planning - meaning that it
looks at infrastructure planning, economic development and other issues broader than the typical planning domains of zoning and approvals.
It is a review of planning systems, not just plans - meaning that it covers institutional and decision-making arrangements as well as strategic planning documents.
The COAG Reform Council review highlighted some particular issues that have not received an adequate response from governments: demographic change - which has implications for the nature, distribution and
diversity of housing stock, for transport and other public services, and for labour market participation
housing affordability - which remains a significant concern in need of an evidence-based and collaborative response from governments
social inclusion - the spatial implications of which are poorly analysed and understood.
A key point of this review is that consistency with the criteria does not guarantee successful policy outcomes, or that the actions needed to deliver outcomes will be done. …To meet these challenges, governments need to reflect on what drives change in cities and find ways to improve policy outcomes and to measure successful implementation.88
Perth’s planning arrangements received a mixed scorecard in the review:
The Western Australian Planning Commission is a strong mechanism for providing integrated advice to Cabinet on strategic planning and investment for Perth. This is supported by sound interagency communication mechanisms for most policy areas.
The breadth of the planning approach in Perth means that it includes a considerable number of different agencies and plans, making integration all the more important. However, Directions 2031 does not yet provide a clear whole of government strategy for delivery of the government’s desired outcomes in Perth.89
A summary of Perth’s performance against the nine criteria is shown in Table 3.5.
Table 3.5: Findings for Perth against the COAG criteria for future strategic planning of capital cities (see Appendix 3.2 for the criteria)
88 COAG Reform Council (2011), Review of capital city strategic planning systems: Report to the Council of Australian Governments, p. 2, viewed 27 June 2012,http://www.coagreformcouncil.gov.au/reports/docs/capital_cities/review_of_capital_city_strategic_planning_systems.pdf
89 COAG Reform Council (2011), Review of capital city strategic planning systems: Report to the Council of Australian Governments, p. 152, viewed 27 June 2012,http://www.coagreformcouncil.gov.au/reports/docs/capital_cities/review_of_capital_city_strategic_planning_systems.pdf
63 | P a g e

Metropolitan Local Government ReviewFinal Report of the Independent Panel - July 2012
Criterion Finding
Criterion one: integration Largely consistent
Criterion two: hierarchy of plans Consistent
Criterion three: nationally significant infrastructure Largely consistent
Criterion four: nationally significant policy issues Largely consistent
Criterion five: capital city networks Largely consistent
Criterion six: planning for future growth Consistent
Criterion seven: frameworks for investment and innovation Partially consistent
Criterion eight: urban design and architecture Partially consistent
Criterion nine (a): accountabilities, timelines and performance measures Partially consistent – reform pending
Criterion nine (b): intergovernmental cooperation Partially consistent
Criterion nine (c): evaluation and review cycles Partially consistent – reform pending
Criterion nine (d): consultation and engagement Partially consistent
Source: COAG Reform Council (2011) Review of capital city strategic planning systems, Report to the Council of Australian Governments.
Relevant COAG Reform Council recommendations include:90
Recommendation 2COAG should encourage governments to continue to focus their efforts on improved integration - complementary and consistent planning and delivery across relevant parts of government, especially transport, economic development and land use, including: integration within governments, including the Commonwealth as well as state
and territory, and local governments integration between governments, based on continued collaboration.
Recommendation 3COAG should focus continuous improvement efforts on outcomes in cities, including through: collaboration by governments to improve information and data about
Australian cities a commitment to evidence-based policy interventions in cities clear frameworks for measuring progress and monitoring implementation of
strategic planning in cities.
Recommendation 4The COAG Reform Council recommends that all governments commit to ongoing engagement with communities, businesses and all stakeholders in setting, implementing and reviewing long-term plans for capital cities.
90 COAG Reform Council (2011), Review of capital city strategic planning systems: Report to the Council of Australian Governments, p. 18, viewed 27 June 2012, http://www.coagreformcouncil.gov.au/reports/docs/capital_cities/review_of_capital_city_strategic_planning_systems.pdf
64 | P a g e

Metropolitan Local Government ReviewFinal Report of the Independent Panel - July 2012
3.5 CONCLUSION
The Panel has concluded there is a need to get the system and structure right, and this applies to services, planning, governance and local government. The Panel believes that the local government status quo in Perth cannot continue; there is simply too much pressure from too many different directions. Changes to local government will contribute to Perth’s capacity to grow and be an efficient, equitable, sustainable city. Changes to local government will help future-proof the city so that it can compete internationally and realise its place in the world as a global city capable of greatness.
As the COAG Reform Council report observed, ‘Australia is at a watershed point for its capital cities and their strategic planning. Population growth, demographic change, increasing energy costs and the shift to a knowledge economy have changed the assumptions underpinning the shape and development of Australian cities. Strategic planning of capital cities must change accordingly, underlining the importance of the COAG criteria to ‘re-shape our cities’.’91
91 COAG Reform Council (2011), Review of capital city strategic planning systems: Report to the Council of Australian Governments, p. 2, viewed 27 June 2012,http://www.coagreformcouncil.gov.au/reports/docs/capital_cities/review_of_capital_city_strategic_planning_systems.pdf
65 | P a g e

Metropolitan Local Government ReviewFinal Report of the Independent Panel - July 2012
SECTION 4: LOCAL GOVERNMENT IN METROPOLITAN PERTH – ROLES AND RELATIONSHIPS(Addressing terms of reference 3 and 5)
4.1 CURRENT STATUS
The Panel’s Terms of Reference require consideration of improved local government structures and governance models, taking into account the matters identified through the Review.
In considering these matters, the Panel has reached conclusions about the relationship between the State and local governments, and the reform of local government roles and functions. The Panel believes that, in addition to local government structures, these are also essential considerations for improving Perth’s governance.
The role of local government and its relationship with State Government is at the core of metropolitan governance. Local government structural reform cannot be considered in isolation. The wider perspective on how services are delivered to the metropolitan community is also important. Metropolitan governance is not the prime focus of the Review, but it is important to capture the insights gathered by the Panel during the Review process, as they provide an important point of reference for its deliberations on structures and governance.
In developing the theme of roles and relationships, this section first looks at the legislative context and then the current role of local government in metropolitan Perth.
4.1.1 The legislative context
Legislation is particularly important in establishing local government’s operating environment and its role in the community. Part 3 of the Local Government Act 1995 concerns the functions of local government in Western Australia. Section 3.1 (1) states:
The general function of a local government is to provide for the good government of persons in its district.
Through this statement, local governments in Western Australia are provided with a power of general competence. That is, they have the discretion to decide which services they provide, and the power to do what they think is necessary to provide good government to their communities. It allows local governments to take into account local community aspirations and values when determining which functions they undertake.
Local governments must comply with other legislation, but few directly dictate the functions they must perform. Many pieces of legislation, perhaps even several hundred92, are relevant to local government. The Panel notes that in a recent inquiry, 92 477 was a number quoted (IP 236), as was 404, comprising 318 State legislative requirements and 86 Federal legislative requirements (IP 148)
66 | P a g e

Metropolitan Local Government ReviewFinal Report of the Independent Panel - July 2012
the Productivity Commission found that no state could provide a comprehensive list of the laws for which local government plays a role in administration, enforcement or referral. Western Australia appears to have more state laws with local government responsibilities than other state.93
Significant legislation relevant to local government includes:
Planning and Development Act 2005 Main Roads Act 1930 Health Act 1911 Bush Fires Act 1954 Fire and Emergency Services Authority of Western Australia Act 1998 Environmental Protection Act 1986 Waste Avoidance and Resource Recovery Act 2007.
The legislative environment for local government is not static. For example, the Building Act 2011 has made changes to the ways in which building permits are issued. Local governments remain the main permit authority responsible for building control, but the new legislation provides for registered building surveyors to certify the building’s design compliance. These building surveyors do not need to be local government employees but can include accredited private practitioners.
Another example is the new Public Health Bill being developed for Western Australia to replace the existing Health Act 1911, which is long overdue for replacement with modern, flexible public health law. The current Act has over 50 regulations, many of which reflect the language and concerns of earlier times and are likely to be repealed. Many will be upgraded and converted into public health policies.
Legislation within the local government portfolio, administered by the DLG, includes:
Dog Act 1976 Control of Vehicles (Off-road Areas) Act 1978 Local Government Grants Act 1978 Caravan Parks and Camping Grounds Act 1995 Cemeteries Act 1986 Cat Act 2011.
In addition, there are regulations under the Local Government Act 1995:
Local Government (Administration) Regulations 1996 Local Government (Audit) Regulations 1996 Local Government (Constitution) Regulations 1998 Local Government (Elections) Regulations 1997 Local Government (Financial Management) Regulations 1996 Local Government (Functions and General) Regulations 1996 Local Government (Long Service Leave) Regulations 1977 Local Government (Parking for Disabled Persons) Regulations 1988 Local Government (Rules of Conduct) Regulations 2007 Local Government (Uniform Local Provisions) Regulations 1996.
As noted elsewhere in this report, there is significant diversity in the size, population and resources of local governments, yet all operate under the same legislative and regulatory framework.93 Productivity Commission (2012), Business Regulation Benchmarking: Role of Local Government as Regulator, Draft Report, viewed 27 June 2012, http://pc.gov.au/__data/assets/pdf_file/0013/116032/local-government-draft.pdf
67 | P a g e

Metropolitan Local Government ReviewFinal Report of the Independent Panel - July 2012
The perceived need for a uniform set of statutory provisions across all local governments in the State has resulted in a situation where large, well-resourced urban local governments must operate under the same rules as small, (generally rural) local governments with the result that performance in some respects tends to average out at the lowest rather than the highest level.94
Rating IssuesAlthough rating is not an issue which is specifically mentioned in the Panel’s Terms of Reference, several rating issues arose during the course of the Review which relate to the ongoing financial sustainability of local governments.
Unimproved rating in the metropolitan area
The Local Government Act 1995 (the Act) provides for rates to be based on either the ‘Gross Rental Value’ (GRV) or ‘Unimproved Value’ (UV) of land. Under section 6.28 of the Act, the Minister for Local Government is responsible for determining the method of land-valuation to be used by a local government as the basis for a rate. In doing so, the Minister is to have regard to the following general principles. The basis for a rate on any land is to be:
land that is used predominantly for rural purposes, the UV of the land land that is used predominantly for non-rural purposes, the GRV of the land.
Local governments are empowered under the Act to seek approval from the Minister to change the method of valuation of land. This allows them to respond quickly to changes in land use in their district. For example, if a former market garden is to be subdivided for residential use, a local government will apply to the Minister for a change of valuation on the land from UV to GRV. The DLG advises local governments that ‘a key to optimising the rating system is to ensure that the appropriate method of valuation of land is used as the basis for rates. Urban land that is rated on its UV would normally attract a lesser rate assessment than it would if rated on its gross rental value GRV.’95
Most metropolitan local government rate revenue (94 per cent) is derived from GRV properties while UV properties make up 4 per cent with interim and ex gratia rates 1 per cent respectively.96
In addition to considering whether land in the metropolitan area can truly be considered rural, several anomalies exist in the metropolitan area which the Panel believes warrant further consideration.
Cambridge Endowment Lands
In 1902, Crown land between the Limekilns Estate (now known as Floreat) and the coast (now known as City Beach) was granted to the City of Perth as a ‘gift to the people of Perth’. In 1917, the City of Perth acquired the Limekilns Estate for
94 Conway Davy and Planning Context (2012), Metropolitan local government reform: Development and analysis of alternative models, p 30, viewed 27 June 2012, http://www.walga.asn.au/downloader.aspx?p=/Portals/0/Templates/Governance_Strategy/712-136%20Metropolitan%20Local%20Government%20Reform%20Models%20(2).pdf95 Department of Local Government, Changing Methods of Valuation of Land, Local Government Operational Guidelines - Number 02 Revised March 2012.96 Back, R, report commissioned by the MLGR Panel (2012) Financial Position Review, p.43
68 | P a g e
Metropolitan Local Government ReviewFinal Report of the Independent Panel - July 2012
£18,000‘’. These two areas were the subject of the Endowment Lands Act 1920 which states that the proceeds from selling council land in the Endowment Lands area is to be used for the development of the area.97 The Act, still in force today as the Cambridge Endowment Lands Act 1920, states that all land within this area is to be rated using UV. Section 7A(3) of the Act states:
In respect of each financial year the Town of Cambridge shall determine the general rate to be imposed in relation to —
(a) the said lands, which general rate shall yield an amount (in this subsection called the endowment lands assessment) equal to the same percentage proportion (calculated to the nearest first decimal place) of the budget deficiency of the local government in respect of that financial year as the percentage proportion which the aggregate of the gross rental values of all land in the said lands bears to the aggregate of the gross rental values of all land in the district; and
(b) the remainder of the district, which general rate shall yield the amount remaining after subtracting the endowment lands assessment from the amount of the budget deficiency of the local government in respect of that financial year.
In other words, the Act requires that the Town must determine what percentage of the district valuation was made up of endowment land valuations utilising GRV. This percentage is used to determine how much of the total rate revenue is to be received from endowment land properties. The Town reproduces the relevant calculations for the last two valuations in its 2011/2012 budget (see Table 4.1).
Table 4.1: Endowment lands rating, Town of Cambridge
July 2008 July 2011
GRV Percentage of Total GRV Percentage
of Total
Non-Endowment Lands Area $104,109,448 47.50% $138,487,340 50.02%
Endowment Lands Area $114,987,231 52.50% $138,402,277 49.98%
Total $219,096,679 100.00% $276,889,617 100.00%Source: Town of Cambridge, Annual Budget 2011/2012, pg. 2.15-2.16.
Therefore, the Endowment Lands Area is required to raise 52.5 per cent of the rates in the district. The amount of rate revenue required from Endowment Lands properties is distributed in proportion to the UV of each property.98 In the 2011/2012 financial year, the Town adopted a rate of 6.4552 cents in the dollar for all GRV land and 0.1785 cents for land included in the Endowment Lands.
In his report for the Panel, Ron Back commented that ‘under a GRV method the more a property is developed the higher the value and subsequently the higher the local government rates. By imposing rates on a UV basis in the Endowment Lands’ area
97 Town of Cambridge Local Government Reform Submission 2009.
98 Town of Cambridge, Annual Budget 2011/2012, pg 2.15-2.16.
69 | P a g e
Metropolitan Local Government ReviewFinal Report of the Independent Panel - July 2012
the rate burden is shifted from the higher GRV properties (City Beach and commercial properties) to lower value properties in the older suburbs.’ 99
Additionally, due to the historical arrangements for these lands, it is likely that an order under the current provisions of the Local Government Act 1995 to transfer only a portion of the lands would not be valid. Additionally, any boundary amendment which sought to transfer only part of the Endowment Lands would not be possible. The Panel anticipates that the transferring all of the Endowment Lands wholly to create a new local government will require specific legislation.
State Agreement Acts
State Agreement Acts are contracts between the State Government and private industry, ratified by Parliament. The Department of State Development describes them as follows:
They specify the rights, obligations, terms and conditions for development of the project and establish a framework for ongoing relations and cooperation between the State and the project proponent. For more than fifty years, State Agreements have been used by successive Western Australian governments to foster major developments, including mineral, petroleum, wood processing and related downstream processing projects, together with associated infrastructure investments. Such projects require long term certainty, extensive or complex land tenure and are often located in relatively remote areas of the State requiring significant infrastructure development.100
Historically, State Agreement Acts have been designed to secure investment in the State. As such, they include provisions which make investment more attractive including limiting the rating ability of local governments. Local governments have argued that this has created considerable inequity in the rating systems they are able to use.
In 2004, the Standing Committee on Public Administration and Finance reported on the impact of State Agreement Acts on local government rating and found the following examples.:101
2.22 Rates received by each local government authority in the Pilbara region from resource company property and mining lease areas subject to State Agreement Acts rating restrictions in 2002-03, in round terms, were:
Shire of Ashburton: $220,000 (7 per cent of total rate revenue) Shire of East Pilbara: $290,000 (9 per cent of total rate revenue) Town of Port Hedland: $30,000 (<1 per cent of total rate revenue) Shire of Roebourne: $90,000 (1.5 per cent of total rate revenue).
2.23 By comparison, in 2002-03 the Shire of Roebourne received $334,643 from the Karratha City Shopping Centre.
The Standing Committee made the following relevant recommendations:102
99 Back, R, report commissioned by the MLGR Panel (2012) Financial Position Review p.45
100 http://www.dsd.wa.gov.au/6641.aspx Last accessed 11/6/2012.101 Report of the Standing Committee on Public Administration and Finance in Relation to the Local Government Rating System and Distribution of Funds, November 2004, pg 11.
70 | P a g e

Metropolitan Local Government ReviewFinal Report of the Independent Panel - July 2012
Recommendation 1: The Committee recommends that if there are to be future State Agreement Acts that:
they do not automatically impose rating restrictions on local government authorities
the State will not generally seek to include such provisions in State Agreement Acts
consistent with recent practice.
Recommendation 9: The Committee recommends that, in relation to existing State Agreement Acts, the State Government should enter into negotiations with the parties to the State Agreement Acts, with a view to negotiating a restitution to negate the impact of the rating restrictions imposed on certain local government authorities under State Agreement Acts.
In 2004, the then Department of Industry and Resources, the then Department of Local Government and Regional Development and the Western Australian Local Government Association signed the Protocol for future State Agreements and resources projects of significance to the State, 2004. This change in State Government policy provides for greater consultation with local government and that rating exemptions not be provided in new Agreements.
While used primarily in regional areas, there are several agreements that cover portions of the metropolitan area. For example, the Department of State Development manages State agreements with industries located in the Kwinana Industrial Area including:
Oil Refinery (Kwinana) Agreement Act 1952 Alumina Refinery Agreement Act 1961 Industrial Lands (Kwinana) Agreement Act 1964 Industrial Lands (CSBP & Farmers Limited) Agreement Act 1976 Mineral Sands (Cooljarloo) Mining and Processing Agreement Act 1988
The underlined Acts have provisions in them which restrict local government rating abilities.
Renegotiation of these Agreements may represent an additional revenue source for local governments such as the Town of Kwinana and any other local government which holds lands subject to Agreements. The extent of the revenue is not known and the willingness of the State and the affected companies to renegotiate is not clear. However the Panel reiterates Recommendation 9 of the Standing Committee.
Rate-equivalent payments
Currently, the Local Government Act 1995 provides a general exemption from rates for the State and Commonwealth. However this has also generally extended to include exemptions for government trading enterprises including utilities and organisations such as LandCorp.
In their submission to the Panel’s Issues Paper, WALGA presented the example of LandCorp. The submission states:
102 Report of the Standing Committee on Public Administration and Finance, Ibid. pg i-iii.
71 | P a g e

Metropolitan Local Government ReviewFinal Report of the Independent Panel - July 2012
A particular example is the exemption granted to LandCorp by the Land Authority Act 1992. In 1998, the Act was amended to include provisions for LandCorp to pay the Treasurer an amount equal to that which would have otherwise been payable in Local Government rates, based on the principle of ‘competitive neutrality’.
This matter is of serious concern to Local Governments with significant LandCorp holdings in their district. The shortfall in rates are effectively paid by other ratepayers, which means ratepayers have to pay increased rates because LandCorp has a presence in the district. (IP246)
Section 32 of the Western Australian Land Authority Act 1992 provides:
(2) Subject to subsection (3), land vested in or acquired by the Authority is not rateable land for the purposes of the Local Government Act 1995.
(3) If the Authority leases or lets land vested in or acquired by the Authority, or holds land jointly with another person who is not a public authority, the land is, by reason of the lease, tenancy or joint holding, rateable land for the purposes of the Local Government Act 1995 in the hands of the lessee, tenant or joint holder.
(4) The Authority is to pay to the Treasurer in respect of each financial year an amount equivalent to the sum of all local government rates and charges that, but for subsection (2) and section 6.26(2)(a)(i) of the Local Government Act 1995, the Authority would have been liable to pay in respect of that financial year.
(5) Subsection (4) does not apply in relation to land that is rateable under subsection (3).
(6) An amount payable under subsection (4) —(a) is to be determined in accordance with such principles; and(b) is to be paid at such time or times,as the Treasurer may direct.
(7) The first payment under subsection (4) is to be in respect of the next full financial year after the commencement of the Western Australian Land Authority Amendment Act 1998.
WALGA also refer to the arrangements for the Perth Airport whereby the Commonwealth Government ‘requires the lessee to make a rate equivalency payment to the relevant Local Government and not the Commonwealth’. They argue that there ‘is no reason why a similar system cannot be adopted for State Government Trading Entities’ (IP 246).
A change to this situation would require variations to the establishment legislation for each trading entity. However, as with the State Agreement Act issues identified previously, a change to the provisions would provide an additional revenue source for local governments.
72 | P a g e

Metropolitan Local Government ReviewFinal Report of the Independent Panel - July 2012
4.1.2 The role of local government in metropolitan Perth
While legislation is key in determining the role of local government, most of the services that local governments traditionally provide, such as community services, recreation, footpaths and parks, do not fall within specific legislation. Instead, they are provided to communities based on demand and local governments’ general competence powers.
Local governments in metropolitan Perth provide a diverse range of services. In addition to their internal corporate services functions their service delivery generally includes:
infrastructure and property services, including local roads, bridges, footpaths, cycleways, drainage, recycling and waste collection and management
development services such as town planning, urban design, streetscape and architectural design, planning and development approval
environmental management for recreational areas, nurseries, beaches, rivers and foreshores
provision of recreational facilities and programs including parks, sporting fields, golf courses, swimming pools, sports centres, halls and caravan parks
health services such as food inspection, immunisation, public toilet facilities, noise control, meat inspection and animal control
community services such as child care, aged care and accommodation, community care, welfare services and security patrols
building services including inspections, licensing, certification and enforcement
regulation of activities including parking cultural facilities and services.103
For many of these functions, local government is not the sole provider – other levels of government have direct or indirect roles such as service provision, regulation and providing funding. The Panel notes the view that ‘the assignment of responsibilities will most often resemble a marbled not a tiered cake.’104
It has been well documented that local government responsibilities have grown and diversified in response to ratepayers’ demands for more and better services, and the shift in responsibilities between levels of government.105 The Panel agrees that local government has expanded its traditional functions, but notes that this has been with little corresponding increase in financial arrangements and capacity.
In some cases, the State and Commonwealth governments have handed functions to local government with accompanying grant funding, however the amount of money has not always kept pace with changes in demands and costs. There is also a view held that there is an element of mission creep as local governments take on more roles in response to community perceptions.
103 Based on Schedule 1, Local Government (Financial Management) Regulations 1996, http://dlg.wa.gov.au/Content/Legislation/ActsRegulations.aspx, viewed 27 June 2012,104
Wiltshire, K (2006), Reforming Australian Governance: Old States, No States or New States? in A.J. Brown and J.A. Bellamy (Eds.), Federalism & Regionalism in Australia: new approaches, new institutions? (Sydney, N.S.W.)105 The Parliament of the Commonwealth of Australia, House of Representatives Standing Committee on Economics, Finance and Public Administration (2003), At the crossroads: a discussion paper, Inquiry into Local Government and Cost Shifting, viewed 27 June 2012, http://www.aph.gov.au/Parliamentary_Business/Committees/House_of_Representatives_Committees?url=efpa/localgovt/report.htm
73 | P a g e

Metropolitan Local Government ReviewFinal Report of the Independent Panel - July 2012
Cost-shifting remains an issue and has led to the formation of an Intergovernmental Agreement on cost shifting between the States, the Federal Government and local government in April 2006.106 Additionally, the Productivity Commission has recognised that local governments’ broader functionality has not been matched by commensurate increases in resourcing.107
The Commonwealth Grants Commission (CGC) was reported as identifying five main causes for the substantial growth in local governments’ responsibilities:108
devolution – where another sphere of government gives local government responsibility for new functions
raising the bar – where local government is required to function at a higher standard
Cost-shifting – where local government assumes increased responsibility or has to provide financial support for a service previously provided or funded by another government
increased community expectations – demands for new or better local government services to which councils feel obliged to respond
policy choice – where councils deliberately choose to expand or improve services or expand their range of operations.
Local governments are not prevented from providing the same services that the State, or other, government does. Section 3.2 of the Local Government Act 1995 states: ‘the scope of the general function of a local government in relation to its district is not limited by reason only that the Government of the State performs or may perform functions of a like nature’. However, section 3.18 (3) states:
A local government is to satisfy itself that services and facilities it provides:
(a) integrate and coordinate, so far as practicable, with any provided by the Commonwealth, State or any public body;
(b) do not duplicate, to an extent that the local government considers inappropriate, services or facilities provided by the Commonwealth, the State or any other body or person, whether public or private; and
(c) are managed efficiently and effectively.
There are a number of agreements between the State and local government that affect service provision in specific fields, such as the framework agreement on the provision of library services,109 and the agreement on the provision of funding for
106 The Australian Local Government Association (2006), The Inter-Governmental Agreement Establishing Principles Guiding Inter-Governmental Relations on Local Government Matters, viewed 27 June 2012,http://www.dpac.tas.gov.au/__data/assets/pdf_file/0006/46392/Intergovernmental_relations_on_local_government_matters.pdf107 Productivity Commission (2012), Performance Benchmarking of Australian Business Regulation: The Role of Local Government as Regulator, Draft Report, p. 9, viewed 27 June 2012, http://pc.gov.au/__data/assets/pdf_file/0013/116032/local-government-draft.pdf108 The Parliament of the Commonwealth of Australia, House of Representatives Standing Committee on Economics, Finance and Public Administration (2003), At the crossroads: a discussion paper, Inquiry into Local Government and Cost Shifting, viewed 27 June 2012, http://www.aph.gov.au/Parliamentary_Business/Committees/House_of_Representatives_Committees?url=efpa/localgovt/report.htm109 WALGA and State Library of Western Australia (2010), Framework Agreement: Between State and Local government for the Provision of Public Library Services in Western Australia, viewed 27 June 2012, http://www.slwa.wa.gov.au/__data/assets/pdf_file/0013/33304/2010_Framework_agreement_web.pdf
74 | P a g e
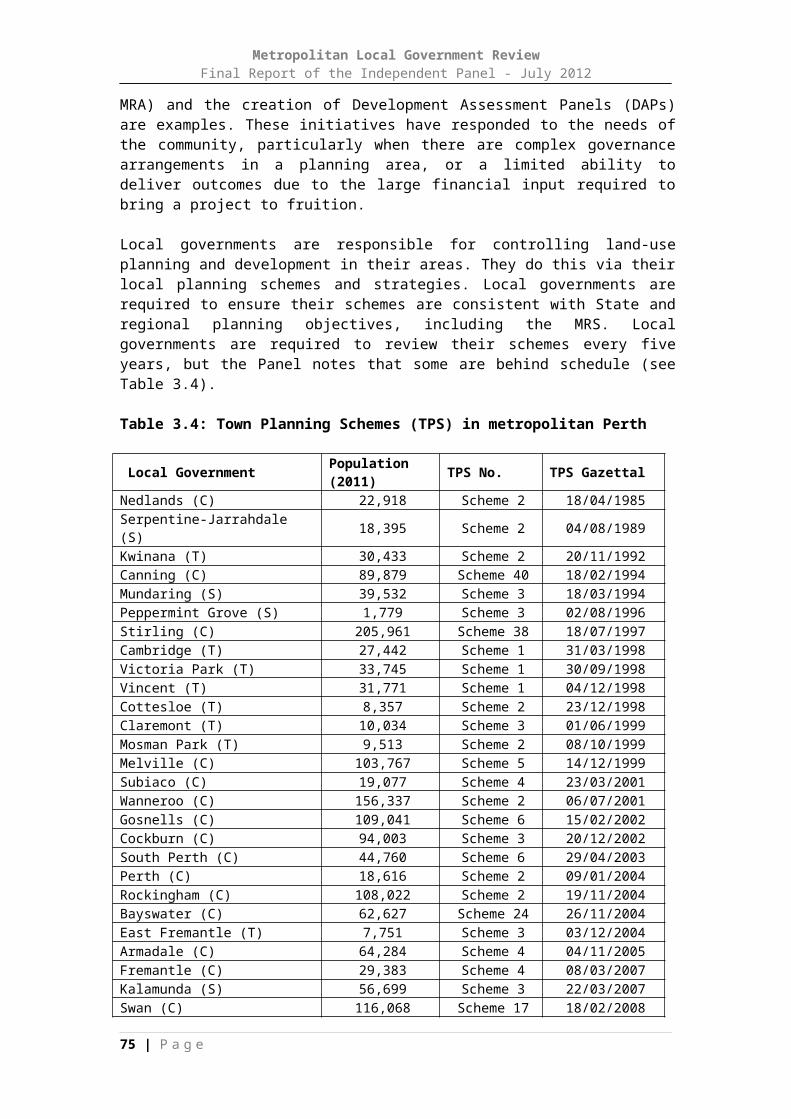
Metropolitan Local Government ReviewFinal Report of the Independent Panel - July 2012
local government roads.110 The State Road Funds to Local Government Agreement, for example, provides local government with funds based on a percentage of revenue from vehicle licensing fees, and the new agreement provides guaranteed funding for the period 2011/12 to 2015/16.111
Service delivery examples
Roads
Local government provides a large majority of the metropolitan road network, including street lighting. It regulates and provides parking, including pay-for-use facilities such as those in the Cities of Fremantle, Joondalup and Vincent. For some local governments, this represents a valuable revenue source. For example, the City of Perth’s parking revenue included $51.5 million in parking fees in 2009/10 and it has a Parking Facilities Development Reserve with a present balance of $31.4 million.
Health and Wellbeing
Local government also has a role in social wellbeing. This originates from the Health Act 1911 which delegates authority to each local government for enforcement of the Act within their district. Within their boundaries, local governments are required to undertake surveillance and monitoring of environmental health nuisances, building construction and maintenance, noise abatement and other environmental issues, public assembly, food legislation and the management and enforcement of public health legislation.
Community Development
While some local governments see provision of welfare and associated community services as a responsibility of other levels of government, some have become increasingly active in this area, such as through the Home and Community Care (HACC) program. HACC provides basic support services to older people, people with a disability and their carers to assist them to continue living independently at home. Local governments providing HACC programs with services including meals on wheels, respite and social support include Bassendean, Bayswater, Belmont, Canning, East Fremantle, Gosnells, Kalamunda, Stirling and Wanneroo..
Some local governments (e.g. Bassendean) have extended their service provision to include retirement facilities. The City of Melville has now outsourced their services to the aged, recognising that there are external organisations specialising in supporting for aged people in their own homes. These organisations deliver the same level of service, but were better positioned to provide a reliable service into the future.112
Six metropolitan local governments currently provide licensed child care services.113 Local governments also regularly provide youth services. For example, the City of Cockburn receives funding from the Department of Child Protection and the Department of Corrective Services to employ youth workers to support young people 110 Main Roads Western Australia (2011), State Road Funds to Local Government Agreement, 2011/12-2015/16, viewed 27 June 2012, http://www.mainroads.wa.gov.au/buildingroads/projects/localgovernment/pages/localgovernment.aspx 111 Metropolitan local governments received $35.7m from this source in 2009/10.112 City of Melville (2011) Notice of New Service Provider, viewed 27 June 2012, www.melvillecity.com.au/community/melville-hacc-services113 Department for Communities, Licensed Child Care Services, List as of May 2012, viewed 27 June 2012, http://www.communities.wa.gov.au/childrenandfamilies/childcare/Documents/120614%20Register%20LDC.pdf
75 | P a g e

Metropolitan Local Government ReviewFinal Report of the Independent Panel - July 2012
aged from 10 to 18 years and their families114. The City of Joondalup also undertakes a range of events, activities, programs and services for young people aged 12 to 18 years designed to enhance life skills and create opportunities.115
4.1.3 State and local government relationship, roles and functions
It is clear to the Panel that the structure and governance arrangements for local government in Perth cannot be considered in isolation from the role and function of State government, and perhaps more significantly, from the relationship between State government and local governments.
The Panel considers that in any analysis of roles, relationships and functions, the principal of ‘subsidiarity’ is critical. Subsidiarity is a widely-accepted principle for organising government responsibilities. It means that services should be delivered by the lowest level of government that has the capacity to effectively deliver them. While some functions are best undertaken by State or Federal government, these levels should not be performing functions that can be provided at a lower level.
The Panel agrees that decision-making should be made at the most appropriate level to get the best result, with no decisions being made by a higher level than necessary. Determining the best level for decision-making is a difficult task, but it is very important.
The Panel believes it was important to examine the functions of local governments and to assess whether some may be better provided by a higher level of government. According to the principle of form follows function, the functions of local government should be considered before resolving the form (i.e. structural arrangements).
Once responsibility for a function has been assigned, it should stay at that level. It should not be continually reassigned up and down the levels of government, nor should it be neglected, with no level wanting to take responsibility for it. This allows the time and space needed for networks and efficient ways of working to develop.116
A central theme that emerged from the Review is that some functions of local government require greater co-ordination across local governments. This may be because the same issue affects many local governments (e.g. river management), that a decision made by one local government has a direct influence on another local government (e.g. parking). When examining the functions of local governments, the Panel is conscious of the need to think of the big picture (i.e. the need to investigate what is best for the people of metropolitan Perth as a whole).
There is merit in using the City of Melville’s community benefit test methodology. This methodology suggests that if a service can be provided by the commercial or not-for-profit sector, then it should be (see submission number (IP 160)). In its meeting with the Panel, a different local government said that it provides services that the community expects, which the State can’t deliver. Others see their main role in some areas, such as aged care, as facilitation. This is consistent with the networked governance view that local government need not be directly involved in the delivery of local services but that it does have a key role to play in orchestrating partnerships 114 City of Cockburn, Youth Centre & Team Contacts, viewed 27 June 2012, www.cockburn.wa.gov.au/Community_Services/Youth_Services/?c=3115 City of Joondalup, Youth, viewed 27 June 2012, www.joondalup.wa.gov.au/Live/Youth.aspx116 Humpage, C (2008), Submission to the Royal Commission on Auckland Governance, p.5, viewed 27 June 2012, http://www.artsfaculty.auckland.ac.nz/images/cms/files/LHumpage/AUCKLAND%20GOVERNANCE%20SUBMISSION%20APRIL%2008.pdf
76 | P a g e
Metropolitan Local Government ReviewFinal Report of the Independent Panel - July 2012
of local providers from across the public, private and voluntary sectors (e.g. HACC).117
Currently there is no specific requirement that local governments plan for or offer services which address social wellbeing issues. While local governments are taking on an increasing role in this field, the approaches vary across the metropolitan local governments. Where people live seems to affect the accessibility of community services, and the current fragmented arrangements suggest a greater role for improved region wide co-ordination.
In the submissions received from the Panel, there was discussion regarding functions and roles which local government could take from the State. The Panel notes a suggestion from the City of Melville that road signage and line marking responsibility could be changed along with Homeswest housing management and maintenance, community policing, management of all reserves and open space. (IP 160)
Similarly the Panel also heard suggestions that functions such as transport, bushfire management, natural resource management and urban and regional planning would be better suited to a metropolitan region or sub-regional approach. There was considerable discussion about the future of waste management in Perth. There was a view that waste management should be controlled by the State, leaving collection and recycling to local government. (IP 111) This view was shared by many local governments, including Melville (IP 160), Mundaring (IP 86), South Perth (IP 97), Victoria Park (IP 221) and Cambridge, which saw ‘no imperative to make major changes to the nature or responsibility of (these) services with the exception of waste disposal.’ (IP 113)
The Panel sees potential for the stronger local governments created through the reform process to have the capacity to do more and provide a greater range of services to the community. As noted earlier in this report, the State has created new approval structures due to problems with local government approval processes. These problems included lack of consistency in the application of conditions, application of conditions that were not appropriate in law and rejection of applications even when they complied with council TPS. With the right training of elected members, and staff with greater skill and capacity, the Panel can thus see in the new structure a basis for greater competency and re-empowerment of local government. These local governments will have the capacity and should have the authority to do more and provide a greater range of services to the community. A return to locally based planning approvals should be a priority.
The consideration of changes to local government functions needs to be considered carefully. Any large scale devolution of additional powers and resources to local government could generate new problems of intra-metropolitan equity, horizontal fiscal imbalance and inefficiencies in service provision.118
The Panel has noted some areas where the current role of local government clearly needs to be reconsidered. The efficient and environmentally sound management of waste treatment and disposal is critical and there would seem to be a strong case for this to be managed at a metropolitan scale, potentially by the State Government, or a joint State/local government body. While RLGs have played a key role in modernising
117 Martin, S (2010), From new public management to networked community governance?: Strategic local public service networks in England, p.337, in The New Public Governance?: Emerging Perspectives on the Theory and Practice of Public Governance, edited by Osborne, P, London: Routledge.118 Sansom, G, Dawkins, J & Tan, S (2012) The Australian Model of Metropolitan Governance: Insights from Perth and South East Queensland, p. 31, UTS: Centre for Local Government, University of Technology, Sydney
77 | P a g e

Metropolitan Local Government ReviewFinal Report of the Independent Panel - July 2012
waste management practice, the level of investment now required for waste treatment facilities is very significant and is stretching the financial capacity of the local government sector. The Panel was told that waste management was getting beyond the capacity of local government, with an investment of $180m required for a small waste to energy plant. This level of investment is unavoidable given the government policy of no more landfills on the Swan coastal plain. For such facilities to be viable, there needs to be guaranteed tonnages, probably 100,000 tonnes plus.
Given the uniformity of the service being delivered and the technical nature of emerging secondary waste treatment infrastructure, it can be argued that greater efficiency could be gained via a single Regional Council servicing the entire Perth metropolitan region (IP90)
The activities of five regional councils independently seeking waste solutions ultimately results in a suboptimal solution for the metropolitan area as a whole. It seems desirable that this issue be approached from a metropolitan perspective. Local government would of course retain its role in managing waste collection services.
The Panel also received suggestions that functions such as transport, bushfire management, natural resource management and urban and regional planning would be better suited to a metropolitan region or sub-regional approach.
Submissions from local government were diverse in their views on reform of the sector. However, there was a consistent theme around the need for better engagement with local government by state agencies.
State government’s trust in local government is reported to be very low, resulting in the highest level of regulation and red tape (DF 167). The poor state of intergovernmental relations was an area of great concern and there was a need for a suitable high-level framework to be developed (IP 243). Even the Committee for Perth acknowledged a need for improved collaboration between local and State agencies (IP 53). The City of Gosnells (IP114) suggested a range of areas where arrangements could be improved between State and local governments, including:
• improvements in funding arrangements • better dialogue between State and local government • improvements in the arrangements between local governments and State utility
providers • more efficient arrangements between local government and the State's
planning agencies • closer ties between the Department of Education and local governments for
increased joint-use of facilities • improved arrangements for community services.
The production of a State Government infrastructure plan, and local government involvement in its development, is one example of where better dialogue could occur. … Within the City of Gosnells, State and Federal government agencies, as well as the City, provide services and programs to the same people. There is an opportunity to improve partnership arrangements between all three spheres of government as all spheres are serving the same community members (IP114).
78 | P a g e

Metropolitan Local Government ReviewFinal Report of the Independent Panel - July 2012
The City supports the need for change … but will throughout its submission point out that change is also required at a state level in order to achieve the desired outcome. … The relationship between the State Government and Local Government sector is one which detracts greatly from the required performance of the industry. Until such issues are adequately resolved and a workable partnership established performance will not reach a satisfactory level (IP108).
A State Government/Local Government Agreement must be put in place and include improved intergovernmental relations and agreed principles and agreements between State Government and Local Government in relation to financing local government, vertical fiscal imbalance and revenue sharing. This is to better define the relative roles, expectations and relationships between the spheres. Local Government must be represented by its appropriate representative organisations in such negotiations (IP243).
In South Australia, State and local government relations are guided by an agreement between the State Government and the South Australian Local Government Association to ‘improve consultation arrangements, communication practices and to build a closer, more productive and collaborative working relationship between State and Local Government’119. This agreement includes a broad statement and a schedule of agreed priorities. The Panel notes that the schedule includes an outline of key priority areas for the State, a commitment to improved governance measures and constitutional recognition for local government.
This is supported by the Minister’s State/Local Government Forum, whose role is to provide advice to the Minister for State/Local Government/Relations, the Premier, the Government and the Local Government Association on ‘issues that are matters of priority to both sectors of government’. The South Australian Department of Planning and Local Government reports that ‘major issues considered by the Forum have included stormwater management and flood mitigation, the State-Local Government Relations Agreement, Community Wastewater Management Systems, South Australia's Strategic Plan, Waste Management and Climate Change”120.
The Forum’s Terms of Reference are:
To advise the Minister for State/Local Government Relations, the Premier, the Government and the Local Government Association on matters referred to the Forum by the Minister that are:
(a) of significance to the State Government and the local government sector and that require a high level of co-operation between State and Local Government for their objectives to be achieved;
(b) at the interface between State and Local Government activities and service delivery that have significance across more than one portfolio unless otherwise agreed by both parties;
(c substantial, achievable and relevant to Local Government generally or at least a substantial part of it;
119 Department of Planning and Local Government, South Australia (2012), State-Local Government Relations Agreement, viewed 27 June 2012, http://www.localgovt.sa.gov.au/policy#agreement,
120 Department of Planning and Local Government, South Australia (2012), Minister’s State/Local Government Forum, viewed 27 June 2012, http://www.localgovt.sa.gov.au/policy/ministers_local_government_forum
79 | P a g e

Metropolitan Local Government ReviewFinal Report of the Independent Panel - July 2012
(d) only capable of being delivered with the support of both spheres of government.121
In Tasmania, a partnership agreement program exists between State and local government. The Tasmanian Department of Premier and Cabinet states that ‘the aim of the partnership agreement program is to find better ways of serving Tasmanian communities by intergovernmental collaboration. Partnership agreements are part of the State Government's broader agenda of developing partnerships with the community to find new opportunities for economic and social development’122. There are four types of agreements in this program:
Bilateral: State and individual local governments Regional: State and regional bodies or groups of local governments Statewide; State and Local Government Association of Tasmania Tripartite: Commonwealth, State and local governments.
While a review of the program identified some issues with its communications strategy and a need for simplification of the agreement process, the Panel notes that the program has proven to be successful in: ‘partnering with individual councils to deliver local outcomes’ addressing ‘issues of social, economic and environmental importance at the
state-wide level and regional levels’ having ‘embedded more efficient service delivery across a number of policy
areas’ ‘the relationship established under the program has served as a platform for
State Government and local government cooperation in other arenas, to the benefit of Tasmanian communities’123.
There is a history of partnership agreements between State and local government in Western Australia including the 1992 Better Government Agreement. Currently, in Western Australia an agreement exists between the State Government, WALGA and Local Government Managers Western Australian Division.
The current Western Australian State Local Government Agreement recognises that local government plays a significant role in community governance. It acknowledges the State Government is responsible for strategic issues of State interest and providing a coordinated approach to issues affecting all Western Australians.124 Underpinning the Agreement is the understanding that the relationship is not a sharing of powers, but rather a delegation of powers from State to local government. The Agreement also signifies a firm commitment by all parties towards the achievement of increased capacity, long term sustainability, and improved outcomes for the community.
The benefit of such agreements also reaches to the heart of ‘joined up’ governance. There are potential benefits to be gained from strong relationships i.e. from State and local government working more closely together. The Panel was provided with
121 Ibid.122 Department of Premier and Cabinet, Tasmania (2011), Partnership Agreements with Local Government, viewed 27 June 2012, http://www.dpac.tas.gov.au/divisions/lgd/partnership_agreements123 Department of Premier and Cabinet, Tasmania (2011), The Partnership Agreements Program: The first ten years, the next ten years Report, December 2008,p. 4 viewed 27 June 2012 http://www.dpac.tas.gov.au/divisions/lgd/partnership_agreements
124 Department of Local Government, Western Australia (2010), Western Australian State Local Government Agreement, viewed 27 June 2012, http://dlg.wa.gov.au/Content/LG/LGAgreement/Default.aspx
80 | P a g e

Metropolitan Local Government ReviewFinal Report of the Independent Panel - July 2012
examples, such as the current hospital developments, which could have benefitted from using this approach.
While the Agreement lays an important foundation for establishing relationship and communication arrangements, the main difference between this and the South Australian and Tasmanian examples given above, is a lack of specific intent or identified result areas.
In its submission to the Panel, WALGA argued the following:
State Government should be at the forefront of developing and articulating a vision for the Local Government sector. A hierarchy of visions is required:
i. A vision for Western Australiaii. A vision for Local Government, andiii. A vision for metropolitan Perth.
The Panel supports this view and recommends that a collaborative process between State and local government should establish a new Agreement which identifies issues of strategic importance to the State and key result areas for both levels of government.
That collaborative process needs to involve stakeholder and community groups, and should include developing a shared vision for metropolitan Perth’s future.
Together with a revamped partnership agreement, there is a need for improved coordination between State Government agencies. This issue was a common theme identified in the local government submissions. Many respondents provided examples where government agencies lacked coordination, delayed responses, or gave conflicting advice. The lack of a whole-of-government approach has, in some of these cases, adversely impacted a local government’s ability to deliver services or facilities, which ultimately impacts the community. As Professor Sansom of ACELG has noted, it is ‘essential that central governments themselves be suitably organised for their involvement in metropolitan management, otherwise their internal failings in coordination of policy making and service delivery will simply add to the problems of fragmented governance.’125
As mentioned above, the role of local government and its relationship with State Government lies at the core of metropolitan governance. Issues of metropolitan governance are under consideration all around Australia and New Zealand at present, and this issue will be considered in more detail in the next section which discusses ideal structures for Perth.
The need for a metropolitan body of some form was acknowledged by some local governments. Belmont described it as a ‘Perth Metropolitan Board’ - a partnership of local governments governing the affairs of the ‘Perth Regional District (IP108). Melville suggested that metropolitan wide governance structures for infrastructure planning and coordination, similar to those in Queensland and Metro Vancouver, should be investigated for Perth and Mandurah (IP160). On the other hand, Gosnells suggested that consideration of a metropolitan-wide local government ‘should be dropped’ (IP114).]
125 Sansom, G (ed.) (2009), Summary report: International Roundtable on Metropolitan Governance, Sydney, 14-15 December 2009, p. 8, viewed 27 June 2012 http://www.acelg.org.au/page.php?pageid=107
81 | P a g e

Metropolitan Local Government ReviewFinal Report of the Independent Panel - July 2012
A Local Government Commission, combining State and local government representatives reporting to the Premier could provide a basis for managing the critical relationship between State and local government. While local government is essentially a ‘creature of the state’ the Local Government Commission could equalise the power relationship. The Local Government Commission could negotiate and oversee future changes in the role of local government. The Commission could also oversee the implementation of the Panel’s recommendations, including the boundary change process. The Local Government Commission would need an independent chair and members with significant experience in State and local government.
An example of an issue that the Local Government Commission could consider, is the integration of state and local planning requirements for government and non-government schools. The Panel has heard from the education sector that different planning requirements are imposed on government and non-government schools, and that these are different in inner and outer areas of the metropolitan region (see submission s IP74 and IP120). A more consistent approach is desirable and would benefit the wider community.
4.1.4 Conclusions
While any State Government will have valid reasons for making policy decisions from time to time which impact upon local government, in a restructured local government sector it will be essential to have a new respect and partnership approach to governing Perth. The Panel’s believes it is in the State’s interest to foster a better relationship between State government agencies and local governments.
The Panel acknowledges the position of local government that the State Government needs to engage better with councils. Part of the difficulty for State Government agencies in engaging with local governments is their number. With fewer, stronger local governments, state agencies will have greater ability to more meaningfully engage with local governments, with better results for metropolitan and local communities.
4.2 RECOMMENDATIONS
The Panel recommends that:
1. The State Government give consideration to the inequities that exist in local government rating, including rate-equivalent payments and State Agreement Acts.
2. A collaborative process between State and local government be commenced to establish a new Partnership Agreement which will progress strategic issues and key result areas for both State Government and local government.
3. The State Government facilitate improved coordination between State Government agencies in the metropolitan area, including between State Government agencies and local government.
82 | P a g e

Metropolitan Local Government ReviewFinal Report of the Independent Panel - July 2012
4. A full review of State and local government functions be undertaken by the proposed Local Government Commission as a second stage in the reform process.
5. In conjunction with the proposed structural and governance reforms, that local government planning approval powers be reinstated in metropolitan Perth by the State Government.
6. The State Government consider the management of waste treatment and disposal at a metropolitan-wide scale either be undertaken by a State authority or through a partnership with local government.
7. A shared vision for the future of Perth be developed by the State Government, in conjunction with local government, stakeholder and community groups.
83 | P a g e
Metropolitan Local Government ReviewFinal Report of the Independent Panel - July 2012
SECTION 5: IMPROVED LOCAL GOVERNMENT STRUCTURES (Addressing Terms of reference 3, 4 and 5)
This section of the report deals with issues specified in Terms of Reference 3, 4 and 5 pertaining to local government structures, boundaries and governance models for the Perth metropolitan area. The section begins with a review of the current local government operating context, considers the submissions received and key issues, options and alternatives and concludes by making recommendations for Perth’s future.
It is clear that local governments need to engage in a discussion about the metropolitan wide picture and what is best for the people of Perth as a whole.126
5.1 CURRENT STATUS - LOCAL GOVERNMENT IN PERTH
As is shown in the following tables (5.1 and 5.2) there is significant diversity between the 30 local governments of metropolitan Perth and indeed between local governments across the State. They vary significantly in population (from 1,750 to 205,000), land area (1.5 km2 to 1043 km2), road length (8.9 km to 1316 km), rate revenue ($1.8 million to over $88 million) and on virtually every other measure. In 2009-10, seven metropolitan local governments had rate revenues of less than $10 million and budgets of less than $20 million.
Table 5.1: Diversity in Western Australian local government sector
Smallest Number Largest NumberArea (km2) Peppermint Grove 1.5 East Pilbara 371,696Estimated resident population (2010) Murchison 112 Stirling 202,014
Elected members Bassendean* 6 Swan, Wanneroo 15
Electors Sandstone 65 Stirling 128,089Staff (full-time equivalents) Wandering 10.10 Stirling 751
Rate assessments Ngaanyatjarraku 71 Stirling 87,190Total rates levied (2009/10) Murchison 142,999 Stirling 88,718,467
Total operating revenue ($) (2009/10)
Nungarin 1,700,132 Stirling 173,853,106
Total operating expenditure ($) (2009/10)
Nungarin 1,389,935 Stirling 159,963,129
Road length (km) Peppermint Grove 10.6 Esperance 4,233.5* Bassendean, Dundas, Exmouth, Murchison, Sandstone, Westonia, Yalgoo and YorkSource: Data provided by the Department of Local GovernmentTable 5.2: Diversity in metropolitan Perth local governments
126 Conway Davy and Planning Context (2012), Metropolitan Local Government Reform: Development and Analysis of Alternative Models, p. 24, viewed 28 June 2012, http://www.walga.asn.au/downloader.aspx?p=/Portals/0/Templates/Governance_Strategy/712-136%20Metropolitan%20Local%20Government%20Reform%20Models%20(2).pdf
84 | P a g e
Metropolitan Local Government ReviewFinal Report of the Independent Panel - July 2012
Smallest Largest
Area (km2) Peppermint Grove 1.5 Swan 1,043Estimated resident population (2010) Peppermint Grove 1,749 Stirling 202,014
Elected members Bassendean 6Swan,
Wanneroo
15
Electors Peppermint Grove 1,088 Stirling 128,089Staff (full-time equivalents) Peppermint Grove 20.00 Stirling 751
Rate assessments Peppermint Grove 644 Stirling 87,190Total rates levied (2009/10) Peppermint Grove 1,793,124 Stirling 88,718,467
Total operating revenue ($) (2009/10)
Peppermint Grove 3,702,472 Stirling 173,853,106
Total operating expenditure ($) (2009/10)
Peppermint Grove 3,591,047 Stirling 159,963,129
Road length (km) Peppermint Grove 10.6 Swan 1,316,84Source: Data provided by the Department of Local Government
The metropolitan area comprises only 0.2 per cent of the land area of Western Australia, but is home to 74 per cent of its population (Table 5.3). Additionally, with a total operating revenue approaching $2 billion, the local governments of the metropolitan area are responsible for maintaining 10 per cent of the State’s road network.
Table 5.3: Metropolitan local government as a percentage of State total
Local Government in Metropolitan Perth
Percentage of State Total (%)
Area (km2) 5,396 0.2
Estimated resident population (2010) 1,696,065 74.0
Elected members 325 25.5
Electors 1,036,914 74.7
Staff (full-time equivalents) 8,660 58.1
Rate assessments 679,892 67.6
Total rates levied (2009/10) 853,121,978 66.0
Total operating revenue ($) (2009/10) 1,858,440,620 58.8
Total operating expenditure ($) (2009/10)
1,593,779,100 59.0
Financial assistance grants (2011-12) 61,928,621 24.3
Road length (km) 13,007 10.2Source: Data provided by the Department of Local Government
85 | P a g e

Metropolitan Local Government ReviewFinal Report of the Independent Panel - July 2012
5.1.1 Local government finance
Collectively, the local governments of Perth are a big business. The 30 metropolitan local governments raised $1.9 billion in operating revenues, including over $957 million in rates in 2010/11, and incurred operating expenditures of $1.7 billion. They engaged over 9,000 full-time equivalent employees and controlled assets of nearly $11 billion. These local governments had borrowings of $295 million and had accumulated reserves of $791 million. The net assets of these communities was $10.3 billion.
The Panel commissioned an independent analysis of the financial position of local governments in the Perth region. Following a procurement process in accordance with Department of Finance guidelines, the Panel appointed Mr Ron Back, a consultant with many years of experience with local government finance in Western Australia.
Mr Back provided a report on the financial position of the 30 local governments in metropolitan Perth. He looked at the region as a whole, and at the individual local government level. Main points from that report include the following (for 2010/11):127
Assets of nearly $11 billion ($9.4 billion fixed and $1.2 current) and $697 million in liabilities although it is noted that only a small proportion of these assets are revenue producing as most represent the future economic service potential in the form of services such as roads, drains and paths.
Borrowings of $295 million, interest expenses of $17.8 million and accumulated reserves of $791 million.
Employee costs make up the largest component of local government operating expenditures at $664 million (39 per cent), followed by materials and contracts at $551 million (32 per cent) and depreciation charges of $313 million (18 per cent).
In 2010/11 operating outlays on road reserves were $379 million (23%), recreation and culture $460 million (27%) and community amenities $341 million (20% including waste management).
Since 2005/06, there has been a shift away from outlays on recreation and transport towards community amenities; a program which includes waste disposal, town planning and protection of the environment.
The group raised in excess of $970 million in rates and service charges in 2010/11, while fees and charges for the same period were over $501 million.
This revenue from rates and fees represents approximately 75 per cent of total revenue.
The dominance of rate revenue is reducing, whilst fees and charges are now forming a larger part of the group’s revenue. However, it was also noted that increases in rate-revenue since 2005/06 have been substantial, with total rate-revenue rising by 7.7 per cent, 8.3 per cent, 13.7 per cent, 7.7 per cent and 9.1 per cent during each financial year since. A substantial proportion of these increases is attributable to valuation increases arising from new developments.
127 Back, R, report commissioned by the MLGR Panel (2012) Financial Position Review
86 | P a g e

Metropolitan Local Government ReviewFinal Report of the Independent Panel - July 2012
94 per cent of the local governments’ rate-revenue is derived from gross rental value properties. Unimproved value properties make up only 4 per cent, with interim and ex gratia rates at 1 per cent each.
The only flexibility local governments have in terms of revenue capacity is in their rating ability. Subsequently, when other forms of revenue are not forthcoming or growing at an acceptable level, the revenue burden shifts towards rates.
Metropolitan local governments only have the capacity to meet existing and future demand if the added responsibilities are revenue-neutral.
Fees and charges are generally linked to the delivery of services and facilities, and the revenues are usually tied to expenditure outlays associated with the services and facilities provided.
Changes in operating outlays between 2005/06 and 2010/11 are mainly attributable to growth in employee costs and materials and contractors. This is linked to the increase in full-time equivalent employees (increasing from 7871 in 2005/06 to 9187 in 2010/11).
Increases in financing costs linked to heavier reliance on debt and substantial increases in utility costs are noted.
These are important findings, highlighting the challenging financial environment that all local governments operate within. Although the Panel notes that the relative financial position of local government is more favourable than the State Government in terms of overall levels of debt and reserves.
The rates levied each year by councils on properties are a major cost for householders. Metropolitan average residential rates in 2009/2010 ranged from $2,670 per assessment (Peppermint Grove) to $714 (City of Perth). This is high compared to average residential rates of $537 in the City of Sydney (highest in metropolitan Sydney in Hunters Hill Council at $1,234) and $995 in the City of Brisbane.128
The increase applied to rates each year is also a major concern for ratepayers. The Panel examined information on rate increases in metropolitan local governments in recent years, and subsequently received commentary on the rationale for rate increases from Local Government Managers Australia (WA). Both documents were available on the Panel’s website.129 Metropolitan rate increases from 2010/11 to 2011/12 ranged from 3.95 per cent (Bassendean) to 10 per cent (Peppermint Grove), with an average increase of 6.23 per cent.
128 Note that rate capping has been in operation in NSW for many years. Premier & Cabinet Division of Local Government, NSW (2009), Snapshot of NSW Local Government, Comparative Information on NSW Local Government Councils 2009/10, viewed 28 June 2012, http://www.dlg.nsw.gov.au/dlg/dlghome/documents/Comparatives/Comparatives_2009_10.pdfDepartment of Local Government and Planning, Queensland ( 2009), Queensland Local Government Comparative Information 2009-10, viewed 28 June 2012, http://www.dlgp.qld.gov.au/resources/publication/local-government/comparative-information-2009-10.xls129MLGR (2011), Metropolitan Local Governments - Average Residential Rates per Assessment 2000/2001 - 2009/2010; Metropolitan Local Governments - Average Rate Increases 2007/08 - 2011/12; Commentary on Local Government Rate Increases, http://metroreview.dlg.wa.gov.au/BackgroundInformation.aspx
87 | P a g e

Metropolitan Local Government ReviewFinal Report of the Independent Panel - July 2012
The ratepayers concerns are understandable, given that property rates are a highly visible and relatively unpopular form of tax. In contrast, the main sources of taxation for other tiers of government, such as income tax and the GST, are relatively invisible and rise automatically as the economy grows. In contrast, councils set rates annually so that increases are inevitably seen as the result of a deliberate council decision and this is always controversial.130
In 2010/11 the metropolitan local governments raised in excess of $970 million in rates and service charges (50 per cent of total revenue), whilst fees and charges for the same period was over $501 million (25 per cent) (see Table 5.4). The changes between 2005/06 and 2010/11 have been dominated by increases in fees, charges and rates. The increase in rate-revenue is due to increasing property valuations, changes in the rate-in-the-dollar levied and new developments resulting in new rateable properties. Collectively, the metropolitan councils provide the majority of their own source revenues through fees, charges and rate revenue.131
Table 5.4: Metropolitan local government operating revenues from 2005/06 to 2010/11
Operating revenues 2005/2006 2006/2007 2007/2008
2008/2009 2009/2010 20010/201
1Rates / specified area rate 618.93 666.32 721.9 820.82 877.92 957.59
Service charges 7.34 26.51 11.02 16.04 17.64 12.81Operating grants/contributions 140.27 134.76 150.31 150.71 152.4 163.59
Capital contributions/grants 57.56 88.52 93.77 130.31 111.95 147.65
Fees and charges 313.24 359.16 401.11 418.11 469.87 501.27Profit/loss on sale of assets 40.01 38.81 26.96 23.83 49.81 32.1
Interest earnings 53.2 65.68 72.01 70.99 66.65 90.66Other revenue 34.61 52.22 55.15 49.74 50.66 58.57Total operating revenue 1,265.16 1,431.98 1,532.25 1,680.55 1,796.90 1,964.23
Source: Ron Back (2012) Financial Position Review, Report commissioned by the Metropolitan Local Government Review Panel.
Notes: A Specified Area Rate (Section 6.37 Local Government Act 1995) is a rate imposed on a certain portion of a district, for a specific work, service or facility whose benefit is generally confined to the ratepayers and residents of the particular area. The money raised through specified area rates can only be used by the local government for the specific purpose it is raised. A Service Charge (Section 6.38) is a charge imposed on a certain portion of a district to fund the provision of a work, service or facility. The money raised through service charges can only be used by the local government for the purpose it is raised. The key difference between the two is that a Specified Area Rate is calculated based on property valuations, while a service charge is a fixed amount, so everyone pays the same.
The dominance of rate revenue has reduced over the years whilst fees and charges are now forming a larger part of revenue. There are less operating grants flowing through to local governments, however there has been a rise in the amount of capital grants. This could be partially offset by the Federal Government’s Roads to Recovery program and some urban renewal projects. During the period 2001 to 2011, interest earnings and investments have had some degree of volatility due to the global financial crisis.132
130 McKinlay Douglas Ltd, Warringah Council (2011), Local Government Reform: Have your say, viewed 26 June 2012, http://yoursaywarringah.com.au/LGovreform131 Back, R, report commissioned by the MLGR Panel (2012) Financial Position Review132 Back, R, report commissioned by the MLGR Panel (2012) Financial Position Review
88 | P a g e

Metropolitan Local Government ReviewFinal Report of the Independent Panel - July 2012
Financial assistance grants are provided by the Federal Government as untied funding to local government. They are allocated through the Local Government Grants Commission on the basis of principles including ‘horizontal equalisation’. The road grant component is allocated on the basis of road preservation needs.133 Given these principles, it is not surprising that metropolitan councils are largely ‘minimum grant councils’ and receive a small share of the grant pool even though they have the majority of the State’s population (see Table 5.5). The general purpose grant is received by the State at roughly $67 per capita, but the metropolitan local governments only receive around $22.50 per capita. The 108 non-metropolitan local governments receive a share in the $192.8 million of financial assistance grants proportionate to their assessed needs, at an average of $117.83 per capita.
Table 5.5: Financial Assistance Grant allocations for 2011/2012
Population (2010)
Percentage (%)
2011/12 General Purpose Grant ($)
Percentage (%)
2011/12 Identified Local Roads Grant ($)
Percentage (%)
2011/12 Total Financial Assistance Grants* ($)
Percentage (%)
Metropolitan local governments
1,696,065 74.0 38,168,227 24.8 23,676,394 25.2 61,928,621 24.3
Non-metropolitan local governments
597,445 26.0 115,481,465 75.2 70,399,45
1 74.8 192,857,334 75.7
Total 2,293,510 100 153,649,692 100 94,075,84
5 100 254,785,955 100
*Includes special project allocationsSource: WA Local Government Grants Commission
The capacity of local governments to provide the additional infrastructure and facilities required to accommodate future growth is limited by available resources. As a result, local governments are increasingly seeking to use development contributions to build infrastructure and facilities beyond the standard requirements, such as car-parking, community centres, recreation centres, sporting facilities, libraries and childcare centers.134
The independent expert analysis of the financial position of the local governments conducted for the Panel by Mr Ron Back included a five-year analysis of sustainability measures. While they are ‘a snapshot in time’, the outcomes of this analysis resulted in local government rankings as follows:135
‘Sustainable (with a comfortable margin)’: Perth and Subiaco. ‘Sustainable’: Melville, Armadale, Canning, Cockburn, Wanneroo, Belmont,
East Fremantle; Gosnells, Stirling, Rockingham, Kalamunda, Joondalup, Mundaring, Nedlands, Swan and Fremantle.
‘Marginal’: Kwinana, Peppermint Grove, South Perth and Victoria Park.
133 WA Local Government Grants Commission (2012), WALGGC Methodology for the Distribution of Commonwealth Financial Assistance to Local Governments in Western Australia, viewed 28 June 2012, http://dlg.wa.gov.au/OpenFile.ashx?Mode=446E37686749376A356D684D2B6E6D6D4D6E555273773D3D&ContentID=73592B6961784E463351513D134 WA Planning Commission, Western Australian Government Gazette (2009), State Planning Policy 3.6, Development contributions for infrastructure, 20 November 2009, No. 211, p. 4689, viewed 28 June 2012, http://www.planning.wa.gov.au/dop_pub_pdf/sps3.6_dev_contributons.pdf135 Back, R, report commissioned by the MLGR Panel (2012) Financial Position Review, p57-64.
89 | P a g e

Metropolitan Local Government ReviewFinal Report of the Independent Panel - July 2012
‘Vulnerable’: Serpentine-Jarrahdale, Bassendean, Bayswater, Cambridge, Cottesloe, Mosman Park and Vincent.
‘Unsustainable/high risk’: Claremont.Claremont was the only metropolitan local government in the group that was categorised ‘unsustainable’ for the period. However, when the five-year average was compared with results from 2010/11, several local governments were identified as experiencing declining performance:
‘Rapid decline’: Kalamunda.
‘Declining’: Cottesloe, Mosman Park and Peppermint Grove.
A further ten local governments were in a declining position, with only two (Bassendean and Claremont) improving.136
The analysis found that larger local governments provided strong and consistent results and the most sustainable were those with a strong mix of commercial and residential rateable properties.137 Local governments’ capacity to provide facilities and services has been augmented to some extent by their participation in Regional Organisations of Councils (ROCs) and RLGs. However, through the analysis, many smaller local governments were identified as vulnerable due to their declining financial position. Notably this was as a result of single events, such as the construction of a shared library in the western suburbs and the fire at Claremont (which destroyed the council chambers, offices and library).138
5.1.2 Regional Local Governments
There are currently six Regional Local Governments (RLGs, also known as Regional Councils) operating within the Perth metropolitan area:
Eastern Metropolitan Regional Council (EMRC) Mindarie Regional Council (MRC) Rivers Regional Council (RRC) Southern Metropolitan Regional Council (SMRC) Tamala Park Regional Council (TPRC) Western Metropolitan Regional Council (WMRC).
The potential for RLGs was introduced with section 329 of the out-dated Local Government Act 1960 and continues to be included in the current Act. Many RLGs were established for the purpose of managing waste disposal, but they have now increased their areas of activity. For example, the EMRC now has a role in safety, environmental management and regional development.139
The Panel notes that the TPRC and the MRC essentially have the same membership but different functions. The MRC focuses on waste management and operates the Tamala Park Landfill site and a resources recovery facility at Neerabup.140 The TPRC
136 Back, R, report commissioned by the MLGR Panel (2012) Financial Position Review, p64.137 Back, R, report commissioned by the MLGR Panel (2012) Financial Position Review, p6.138 Back, R, report commissioned by the MLGR Panel (2012) Financial Position Review, p64.139 Local Government Advisory Board (2006), Ensuring the future sustainability of communities, p. 67, viewed 28 June 2012, http://dlg.wa.gov.au/OpenFile.ashx?Mode=446E37686749376A356D684D2B6E6D6D4D6E555273773D3D&ContentID=796F55516630375A78556B3D140 The designated function accorded to the MRC is: ‘The orderly and efficient treatment and/or disposal of waste delivered to a building or a place provided, managed or controlled for those purposes by the Regional Council. MRC (2012), viewed 28 June 2012, http://www.mrc.wa.gov.au/Home.aspx
90 | P a g e

Metropolitan Local Government ReviewFinal Report of the Independent Panel - July 2012
was formed in 2006 specifically to manage the urban development of 180 hectares of land adjacent to the Tamala Park Landfill site, in the City of Wanneroo. The land is jointly owned by seven local governments. The TPRC coordinates all of the planning for the urban development and will be responsible for all of the accounting, contracting and land sales for the project. When the land is fully developed, the TPRC will have completed its charter and will cease to exist. The life of the Council is currently projected to be another 10 to 12 years.141
Regional Organisations of Councils (ROCs) are a less structured vehicle for local government collaboration on a range of matters. A major advantage of ROCs has been the focus they have provided for local government in liaising with State and Federal Governments. The South West Group has been particularly effective over the years.
Figure 5.1: Regional local government arrangements, 2005Source: Local Government Advisory Board (2006) Ensuring the future sustainability of communities, p.64. Note: Map does not include Tamala Park Regional Council, formed 2006; It has the same membership as the Mindarie Regional Council.
141 TPRC (2011), Annual Report 2010-11, viewed 28 June 2012, http://www.tamalapark.wa.gov.au/public-documents
91 | P a g e

Metropolitan Local Government ReviewFinal Report of the Independent Panel - July 2012
5.1.3 Local government employment
Local government is among the top five largest employers in Western Australia, after the State Government and the mining and resource sector.142 In 2009/10 local government in metropolitan Perth employed 9,187 full-time equivalent staff and reported total employee costs of $663.34 million (in 2010/11),143 representing 40 per cent of local government expenditure. These employees hold a diverse range of occupations, ranging from planners and engineers to plant operators and gardeners (see Table 5.6). The Panel acknowledges that the vast majority of employees are committed and dedicated to the community they serve.
Table 5.6: Employment in Perth metropolitan local governments, by operating program, 2010-11
Operating Program Full-time Part-timeTotal Employees
General purpose funding 929.7 147.6 1,077.3Governance 173.7 47.3 220.9Law, order & public safety 427.9 59.8 487.6 - Fire prevention 35.6 10.2 45.8 - Animal control 86.0 10.2 96.2 - Other 306.3 39.3 345.6Education and welfare 326.4 287.6 614.0Health 208.4 93.6 301.9Community amenities 949.1 109.2 1,058.3 - Sanitation & refuse 511.0 13.4 524.4 - Environment 134.7 13.5 148.2 - Other 303.4 82.3 385.7Recreation and culture 2,264.8 694.8 2,959.5 - Parks and gardens 1,221.1 21.5 1,242.6 - Libraries 348.8 309.4 658.2 - Other 694.8 363.9 1,058.7Transport 1,063.5 31.3 1,094.8 - Technicians 389.7 6.1 395.8 - Other 673.8 25.3 699.1Economic services 375.6 43.2 418.8 - Building control 292.3 25.6 317.9 - Other 83.3 17.6 100.9Other Property and services 520.1 51.6 571.7Other 301.0 99.0 400.0Total 7,540.0 1,664.8 9,204.8
Source: Department of Local Government Note the category ‘general purpose funding’ will include finance managers, rate clerks, etc. The category ‘governance’ will include staff supporting the operation of the council, including the CEO and council clerks.
It is widely acknowledged that the local government sector faces the same skill-shortages as other sectors, given the strong Western Australian economy, competition with the mining sector and problems retaining staff. The Panel notes that under the auspices of the DLG’s reform program, local government is working on long-term strategies to attract skilled staff and promote itself as an attractive employer in the workforce market.
142 WALGA (2008), The Journey: Sustainability into the Future, Shaping the future of local government in Western Australia, viewed 28 June 2012, http://walga.asn.au/downloader.aspx?p=/Portals/0/Templates/docs/the_journey_final_report.pdf
143 Back, R, report commissioned by the MLGR Panel (2012) Financial Position Review, p11, p15.
92 | P a g e

Metropolitan Local Government ReviewFinal Report of the Independent Panel - July 2012
The Panel considers that a restructuring of local government in metropolitan Perth would not affect the job security of most local government employees. While there may be changes to internal administrative structures, put simply, the tasks undertaken now by the majority of local government staff will not disappear in a new structure. In any event, the Local Government Act 1995 provides protection for employees. Schedule 2.1 cl. 11 (4) of the Act states that staff from amalgamating local governments are not to have their contract of employment terminated or varied unless:
a) compensation acceptable to the person is made; or b) a period of at least two years has elapsed since the order had effect.
Experience elsewhere has shown that redundancies are largely restricted to duplicated positions for Chief Executive Officers (CEOs) and senior executives, although the role of some employees may change. Savings can be achieved through employing fewer senior executives. The experience in Queensland was that the number of local government employees actually increased. In Albany, the staff reductions due to duplicated positions was offset by new positions created in community service roles.
The Panel acknowledges that the position of the CEO in each local government is most threatened by a reduction in the number of local governments. The function of a CEO is defined in section 5.41 of the Act. Generally, the role is to manage the daily operations and functions of a local government, and to act as a conduit between council and staff.
The Salaries and Allowances Tribunal (SAT) makes determinations on CEO remuneration. Each year it undertakes a comprehensive survey of the total reward packages of all local government CEOs in Western Australia. Salary bands are determined on a range of factors that influence the size of the local government and the complexity of its operations. This includes the population of a local government, the size of the workforce, the operating and capital expenditure and the estimated population growth. In its July 2012 determination, SAT made the following determinations (see Table 5.7):
Table 5.7: SAT recommendations on CEO salaries
Local government total reward package band Total reward package
Number of metropolitan local governments
Band 1 $238,043-$350,327 13Band 2 $196,338-$295,148 10Band 3 $150,141-$239,327 6Band 4 $121,909 - $184,788 1
Source: 2012 SAT Recommendation Report for Local Government CEOshttp://www.sat.wa.gov.au/LocalGovernmentCEOs/Pages/Default.aspx
5.1.4 Integrated Planning in local government
The Panel notes the State Government’s Local Government Reform Program which aims to create ‘‘stronger, more sustainable local governments into the future’’.144 This has included financial and other support for amalgamating councils, regional transition groups and regional collaborative groups. It also included the development of the Integrated Planning Framework.145 This gives local governments a framework for establishing local priorities and methods on how to link this information to
144 Department of Local Government WA (2011), About Reform, viewed 28 June 2012, http://www.dlg.wa.gov.au/Content/LG/LGReform/About.aspx
93 | P a g e

Metropolitan Local Government ReviewFinal Report of the Independent Panel - July 2012
operations. It includes a strategic community plan and corporate business plan, as well as asset management, financial planning and workforce planning. The Panel believes this is an absolutely critical development for the sector.
A Performance Measurement Framework has been developed by the DLG to identify both sector-wide and individual local government improvements in delivering community services and meeting community needs. Performance measures were developed in the four key capacity building components of the Reform program: integrated planning, workforce planning, financial planning and asset management.
A baseline level for each measure was established by the DLG in 2011.146 A local government was deemed to be at baseline level if it satisfactorily met criteria within the four areas. A local government will be required to have: A Strategic Community Plan with a ten-year timeframe, stating community
aspirations, visions and objectives, adopted by an absolute majority of council and developed with community input.
A Workforce Plan which identifies the current workforce profile and organisational structure, identifies gaps between the current workforce profile and the organisational requirements, identifies organisational activities to foster and develop workforce and is budgeted for.
A Financial Plan which must show the local government having an operating surplus ratio greater than zero.
An Asset Management baseline which requires the local government to be able to calculate the asset consumption ratio, that is, depreciated replacement cost (DRC) of assets (written down value) divided by current replacement costs (CRC) of depreciable assets, expressed as a percentage.
At the time of the 2011 baseline summary, only 16 out of the 30 (53 per cent) metropolitan local governments indicated they had a current Strategic Community Plan. Only seven (23 per cent) indicated that they had a current Workforce Plan. Other results for metropolitan local governments included:
7 per cent met all four baseline levels. 23 per cent met three baseline levels. 33 per cent met two baseline levels. 27 per cent met one baseline level. 10 per cent met no baseline levels. 26 per cent the baseline level for Strategic Community Planning. 15 per cent met the baseline level for Workforce Planning. 87 per cent met the baseline level for Financial Planning. 74 per cent met the baseline level for asset management.
145 Department of Local Government WA (2012), Integrated Planning, Viewed 28 June 2012, http://integratedplanning.dlg.wa.gov.au/146 MLGR (2011) Local Government Performance Measurement Framework - Metropolitan Baseline Survey Results, http://metroreview.dlg.wa.gov.au/Page.aspx?PID=BackgroundInformation
94 | P a g e

Metropolitan Local Government ReviewFinal Report of the Independent Panel - July 2012
Figure 5.2: Local Government Performance Measurement Framework – Metropolitan Baseline Survey ResultsSource: Department of Local Government (2011) Local Government Performance Measurement Framework - Metropolitan Baseline Survey Results. Background paper for the Metropolitan Local Government Review. Available at http://metroreview.dlg.wa.gov.au/Page.aspx?PID=BackgroundInformation
The Town of Kwinana advised the Panel that it was one of only two metropolitan local governments that met all four criteria.
Whilst these initial results are low, the DLG has acknowledged that the baseline was intended as a starting point for measuring improvement as local governments adopt the mandated Integrated Planning Framework that will come into effect on 1 July 2013. Clearly, this work is in its early stages of implementation and improvements in the statistics reported above are expected. The results of the latest sector survey will be available after the end of June 2012. Nevertheless, the Panel found it surprising that such plans were not already standard practice across metropolitan councils, given that they are regarded as leading practice across both the public and private sectors.
5.2 KEY ISSUES
The Panel has made some important conclusions about the financial position of metropolitan local governments, about employment in the sector and about the future of the integrated planning approach. There are both strengths and liabilities across the sector, and there is room for improvement and change. While movement in direction of capacity improvement is expected, the Panel believes such improvements do not offset the need for broader structural reform in the metropolitan area.
In addition, a number of other issues emerged as key considerations in the Review. While the issues are perhaps different for local governments, the State Government, the community and the business sector, they include:
fragmentation of local government in Perth disparity in resources and services the small size of some local governments
95 | P a g e
Percentage of Metropolitan local governments who met the baseline level for each key area
0102030405060708090
100
Strategic CommunityPlanning
Workforce Planning Financial Planning Asset Management
Key Area
Perc
enta
ge o
f Met
ropo
litan
loca
l go
vern
men
ts

Metropolitan Local Government ReviewFinal Report of the Independent Panel - July 2012
maintaining sense of community inconsistent requirements and approval processes.
At present, there is significant disparity in the services received by residents in each local government. This was referred to, for example, in the Library Board of WA’s submission to the Panel (see submission number DF 159). Moreover, there is disparity in the financial resources available to each local government. This, to some extent, is a reflection of size, but is more particularly a reflection of the diversity and mix of the rate-base.
The City of Belmont, for example, serves approximately 35,000 residents and raised over $16 million (2008/09) from commercial and industrial ratepayers. In contrast, the City of Armadale, servicing a population of around 61,000, could only raise $4.5 million (2008/09) from the commercial and industrial sector. This difference in the commercial rate-base helps explain the significant difference in the average rates paid by a residential property in the two cities ($784 and $1,063 respectively, 2009/10) even though the two areas have a similar socio-economic demographic.147
An alternative to structural reform, not previously considered in Australia, is a tax base sharing program, where the tax base of the relatively affluent councils is shared with the less affluent councils.148 To some extent, this is the rationale behind the Federal Financial Assistance Grants system. While the current system redistributes significant funds to rural and RLGs in Western Australia (see Table 5.5), it does little to address the differences in capacity and special needs of metropolitan local governments. While it was suggested that increasing financial assistance grants was the solution to this problem (see submission number DF 63) this is not within the realm of State or local governments and would not address the other critical dimensions of Perth’s governance requirements.
This is where the Panel considers that the academic literature on fiscal federalism provides useful insights into the application of local government reform, including its principles of subsidiarity, correspondence, economies of scale and spill-overs. For example, the principle of correspondence argues:
…that where consumption or use of a particular good or service is limited to the boundaries of a particular jurisdiction, then its provision should be allocated to a sub-national government whose boundaries are defined by the spatial benefit (or market area) boundaries associated with this good or service... The resulting allocation generates economic efficiency since it allows for a matching of local demand and supply, with voters able to move between jurisdictions in search for an optimal mix of provision and associated taxes and charges given their individual needs. An obvious difficulty confronted when putting flesh around this principle is that, carried to the extreme, each good or service provided by governments could conceivably have a different set of spatial benefit (or market area) boundaries leading to a need for a multitude of overlapping levels of government … Clearly, common sense is needed when
147 Council budgets (2010/11) show a residential rate in the dollar of 7.5174c in the dollar for the City of Belmont compared to 10.56 c in the dollar for the City of Armadale.MLGR (2011) Metropolitan Perth Local Governments – Average Residential Rates Per Assessment 2000/2001 – 2009/2010, http://metroreview.dlg.wa.gov.au/Page.aspx?PID=BackgroundInformation
148 This occurs, for example, in Cleveland Ohio, where transfers of $200m are reportedly made each year to the centre city. see Phares, D (Ed), Governing Metropolitan Regions in the 21st Century, p. 42, ME Sharpe: New York, 2009
96 | P a g e

Metropolitan Local Government ReviewFinal Report of the Independent Panel - July 2012
interpreting this principle if only three (or at most four) levels of government are being considered.149
The Panel believes that the case for local government reform in Perth can be framed around many issues, not just economics. The Panel finds that a restructured local government system would provide a basis for equalising the financial resources available to local governments, and hence the services provided to residents and ratepayers would be more equitably spread.
Smaller local governments may provide a more limited range of services, yet some residents fear they would lose services if their local government were absorbed into a larger one. This need not be the case. As part of the negotiated transition process, arrangements could be put in place so that residents of particular areas could continue to receive (and pay for) specific services that they value.
Many submissions to the Panel espoused the benefits of retaining the current small local governments. The Panel does accept that some do an excellent job of serving local communities and have won awards for innovative collaborative projects like The Grove Library. However, it is clear to the Panel that small local governments have significant limitations.
Some of these were identified by the LGAB in its 2006 report and include:
limited opportunity to achieve operational economies of scale and scope
limited capacity to attract specialist human resources
lack of economic strength due to narrow or small rate-base and need for above-average rates
limited ability to maintain infrastructure
duplication of depots, offices, technology, plant and equipment
limited range of services provided.150
The Property Council’s submission stated that smaller councils lack expertise in negotiating complex projects (IP155). A number of State Government agencies made similar comments about the limitations of smaller local governments (for example, see IP149).
As mentioned above, submissions to the Panel were characterised by a diversity of views about the ideal size of a metropolitan local government. It was suggested to the Panel that bigger does not necessarily mean better ( DF 158). The Panel came to the conclusion that the success of a local government is dependent upon a number of factors. Size alone is not an absolute indicator of good governance, efficient performance, or community engagement.
For example, the Panel considered data on the number of complaints about individual local governments which showed no direct relationship with the size of a council (see Table 5.9). If anything, this evidence shows that the number of
149 Smith, C (2006), Quantifying the Costs and Benefits of Change: Towards a Methodology, in A.J. Brown and J.A. Bellamy (Eds), Federalism & Regionalism in Australia: new approaches, new institutions? (2006: Sydney, N.S.W.)150 LGAB (2006), Ensuring the future sustainability of communities, p. 56, viewed 28 June 2012, http://dlg.wa.gov.au/OpenFile.ashx?Mode=446E37686749376A356D684D2B6E6D6D4D6E555273773D3D&ContentID=796F55516630375A78556B3D
97 | P a g e
Metropolitan Local Government ReviewFinal Report of the Independent Panel - July 2012
complaints against smaller local governments is disproportionate to the population that they serve.
Table 5.8: Complaints received by Department of Local Government about metropolitan local governments
Population of local government
Number of councils
Percentage of population
Percentage of complaints
Up to 30,000 13 43.3% 12.4% 29.7%
30,000 to 100,000 10 33.3% 31.9% 41.7%
Larger than 100,000 7 23.3% 55.6% 28.6%
Source: Derived from Department of Local Government data provided to the Panel.
There is an argument that small councils can gain efficiencies by other means, including sharing services with neighbouring councils and using the services of consultants. Indeed, this is often offered as the main alternative to amalgamations.
There will be no cost savings through amalgamation – savings will only be achieved through maintaining the current model of local government and embarking on outreach programs of resource sharing amongst likeminded neighbouring councils (as currently being undertaken between Cottesloe and Mosman Park in sharing works depot and services).(DF122)
By forming shared service arrangements with other local councils (through Regional Organizations of Councils, Strategic Alliances and similar institutional vehicles), securing services from other levels of government, or by contracting out service provision to private sector firms, small local councils can acquire the quantity and quality of services desired by their limited number of constituents and simultaneously enjoy the cost advantages deriving from scale economies in production, especially in large metropolitan areas, such as Perth. (DF63)
Ultimately, there will always be a place for some forms of cooperation, collaboration and resource sharing, but the Panel considers that in Perth, this approach on its own is not the best solution to address the other dimensions required for structural reform.
In relation to using the services of consultants, it has been observed that:
Some councils have partnered in the employment of individual specialists to overcome this shortfall while several others are reliant upon the much more expensive option of engaging consulting firms to address the most fundamental of needs. This is both expensive and limiting in terms of access and control. It is these areas where councils are susceptible to financial stress and a reliance on outsourced advice which, in many cases, may not provide the optimum benefits to council due to its price based nature. This is not to say that these resources lack capability but can only provide what councils can afford to pay.151
A further weakness in this approach is that the quality of outsourced advice may also be constrained by poor consultant selection processes.
151 Local Government Association of Tasmania (2011), Towards improved local government in southern Tasmania, viewed 28 June 2012, http://stca.tas.gov.au/future/wp-content/uploads/2011/09/STCA-Response-LGAT.pdf
98 | P a g e

Metropolitan Local Government ReviewFinal Report of the Independent Panel - July 2012
Some small local governments presented the argument that reform was not warranted because their self-assessment surveys show their residents are happy and prefer a smaller local government. The Panel argues that the size of a local government is not necessarily linked to community satisfaction, as residents from different sized local governments claim to be satisfied in surveys.152 There is evidence from elsewhere in Australia that bigger councils are able to devote more resources to a higher quality of customer service than smaller councils.153
Further, the Panel argues that the satisfaction people feel with where they live is not only attributable to the local government itself. It is also based on complex factors including physical environment and safety. Many concepts of ‘‘place’’ are attributed to streets, neighbourhoods and suburbs, which would not change if local government boundaries were moved.
My experience of a ’sense of place’ in Mosman Park is maintained by the private school network, primary schools, the business networks and the local pockets of different cultures inhabiting the rental market in the Stirling Hwy Corridor of Mosman Park. A perception of shared socio-economic advantage also contributes to this. The local council isn’t holding the suburb together by any means. All of these things will continue to thrive with a larger council (DF71)
In the view of the submitter, any link between “sense of place and local identity” and local government governance is fallacious. While residents might strongly identify with a suburb or locality there is little evidence to suggest that this is adversely affected by (for example) a change in name of the responsible local government or a boundary adjustment to place the suburb in a different local government area. This fallacy is exacerbated in the case of Perth by the number of local government areas that are in essence a single suburb, so that identification with a suburb is misconstrued as identification with a local government (DF139)
The Committee for Perth advocated strongly for change to Perth’s local government arrangements.
With Perth facing growth and change of unprecedented proportions over the next four decades, it is essential that our ability for regional level planning and co‐operation is maximised. ….In particular, fragmentation has a direct negative impact on our ability to address challenges associated with population growth, the need for housing diversity, including higher density housing, social inequity, integrated transport and urban sprawl. There is a substantial amount of research which indicates that fragmented local government significantly correlates with urban dispersion or sprawl and social inequity within regions. This is basically because, acting on behalf of their residents, local governments have a tendency to support and enact land use regulations to secure lifestyle preferences for low density, suburban living environments, and to oppose change that may impact on local residents for broader regional benefit. Fragmentation also leads to big variations in the financial capacity of local authorities– therefore affecting their capacity for service delivery. (IP53)
152 MLGR (2012) Community Perceptions. http://metroreview.dlg.wa.gov.au/Page.aspx?PID=BackgroundInformation
153 Independent Panel to the Southern Tasmanian Councils Authority (2011), Independent Review of Structures for Local Governance & Service Delivery in Southern Tasmania, p 29, viewed 28 June 2012, http://stca.tas.gov.au/future/wp-content/uploads/2011/11/Structural-Project-Final-Report.pdf
99 | P a g e

Metropolitan Local Government ReviewFinal Report of the Independent Panel - July 2012
The fragmentation of local governments has created significant problems for planning. The Panel notes that management of land uses within industrial areas is an example which has attracted recent attention. The absence of a consistent framework for industrial estate planning has seen higher end and more commercial uses with bulky good retail uses, and entertainment uses (such as recreation centres and places of worship) being allowed to operate in industrial estates, particularly in the central sub-region. This has given rise to calls for greater consistency in permitted land uses in industrial estates to be developed as a matter of urgency.154
Efficiency and cost savings were examined in detail by the recent review in southern Tasmania, and the comments have relevance for the current review.
Every aspect of Tasmanian society needs to be as efficient as possible in order for Tasmania to be as competitive as possible. Right across Australia, people are concerned about the cost of living. This is also the case in Southern Tasmania. As well as being of benefit to its community, local government is also an input cost to business. Larger local government units can be run more efficiently than smaller local government units.
While the consultancy firm Deloitte predicts savings of up to 35% from creating a single Southern Tasmanian Regional Council, the independent Panel believes that savings achieved would more likely be in the order of up to 15% of the 12 councils’ combined expenditure. This would be in areas such as governance, senior management, asset management, capital expenditure and procurement of goods and services.
With an estimated $48 million expenditure on asset maintenance by the metropolitan Hobart councils, a progressive 10% to 30% saving per year, arising from a shift from reactive maintenance to scheduled maintenance, would be worth $5 million to $15 million, which could be spent on other necessary council costs, including infrastructure. Another way of looking at these savings is that they would be equivalent to between $60 and $175 per ratepayer in the Greater Hobart area.
Savings in governance, that is direct councillor costs and senior administration, would also be achievable. All these savings would be significant and could be directed to infrastructure and key projects, economic development initiatives, specialist services, improved communication and community engagement, improved services and/or reduced rate increases. 155
Using the Tasmanian panel’s estimate of 15 per cent savings (rather than the Deloitte estimate of 35 per cent) across the Perth metropolitan local government expenditure of nearly $2 billion per annum, would translate to a potential annual saving of $300 million. This is a highly simplistic approach, and it is noted that Tasmanian local governments have some different functions, however the Panel finds that the level of duplication in Perth is greater.
The Panel has not undertaken an in-depth analysis of the potential costs and savings associated with boundary reform in Perth. The Panel argues that while there would
154 WAPC (2012) Economic and Employment Lands Strategy: non-heavy industrial Perth metropolitan and Peel regions, p16, viewed 28 June 2012, http://www.planning.wa.gov.au/publications/6274.asp155 Independent Panel to the Southern Tasmanian Councils Authority (2011), Independent Review of Structures for Local Governance & Service Delivery in Southern Tasmania, p 29, viewed 28 June 2012, http://stca.tas.gov.au/future/wp-content/uploads/2011/11/Structural-Project-Final-Report.pdf
100 | P a g e

Metropolitan Local Government ReviewFinal Report of the Independent Panel - July 2012
undoubtedly be significant transition and implementation costs in the short-term, the long-term savings and benefits could be substantial. Of greatest importance to the Panel is the implementation of reforms, including structural reform, to deliver the best outcomes to the community and to underpin an enhanced role for local government in community life.
5.3 ALTERNATIVE REFORM ARRANGEMENTS
The Panel notes that there are many different approaches to local government reform. Using a classification of models of municipal governance developed by Dollery and Johnson, the LGAB considered the advantages and disadvantages of these approaches:
Existing Small Local Governments. Resource Sharing. Regional Organisations of Councils. Area Integration / Joint Board Model. Virtual Local Government. Agency Model. Amalgamated Large Local Governments. Major Boundary Change. Community Consultation Mechanisms.156
Approaches to restructuring local government range from amalgamation of existing local governments to the use of a ‘clean slate’; determining boundaries from scratch without reference to existing local governments. So, Perth could be treated as a ‘clean slate’ and boundaries designed to capture functional and social communities, or a more administrative approach of sticking to amalgamations could be used.
While the Panel holds the view that there is a need for structural reform of local government in metropolitan Perth, there will still be a place for some forms of collaboration. A range of options are already available to local governments in Western Australia for the delivery of shared services and the achievement of common goals. These include signing a partnership agreement, forming an association under the Associations Incorporation Act 1987, forming a Voluntary Regional Organisation of Councils (VROC), or establishing a statutory Regional Local Government under the Local Government Act 1995.
Existing and proposed collaboration models include: partnership agreements incorporated associations Regional Local Governments Voluntary Regional Organisations of Councils Local Government Enterprises Regional Subsidiary model.157
156 Dollery, B and Johnson, A (2005), Enhancing Efficiency in Australian Local Government: an Evaluation of Alternative Models of Municipal Governance, University of New England, School of Economics Working paper, viewed 28 June 2012,http://www.une.edu.au/business-school/working-papers/economics/1999-2007/econ-2005-1.pdfLocal Government Advisory Board (2006) Ensuring the future sustainability of communities, p.53. viewed 28 June 2012, http://dlg.wa.gov.au/Content/LG/AdvisoryBoard/StructuralElectoralReform.aspx157 MLGR (2011), Regional Collaboration Models for Local Government in Western Australia, http://metroreview.dlg.wa.gov.au/Page.aspx?PID=BackgroundInformation
101 | P a g e

Metropolitan Local Government ReviewFinal Report of the Independent Panel - July 2012
The existing models vary in their characteristics and purposes, the regulatory framework that applies, the flexibility, accountability and governance requirements. Groupings of local governments may choose one or more models to achieve particular goals, depending on their specific circumstances and objectives.
Two further collaboration options, the Local Government Enterprise (LGE) model, and the Regional Subsidiary model, have been put forward by WALGA and some local governments. Neither of these options are currently accommodated in the Act, although the Hon Max Trenorden MLC put forward a Private Members Bill in the Parliament in December 2010 to amend the Act to include the Regional Subsidiary model.
The different types of metropolitan governance structures must be added to the above approaches. The Panel considered the advantages and disadvantages and applicability to Perth of governance arrangements used in other metropolitan areas. These included:
City of Brisbane Auckland Council Metro Vancouver Greater London Authority Metro Portland Greater Melbourne City of Johannesburg Birmingham City Council Toronto City Council Glasgow City Council.
The Panel had no intention of copying any specific model and applying it to Perth ‘‘as is’’. The Panel recognised the significant points of difference between these cities and Perth, but considered there were valuable lessons for developing a ‘‘Perth model’’ of metropolitan governance.
One possibility for Perth is the creation of an overarching metropolitan local government. This could vary in scope from a metropolitan wide local government (e.g. Greater London Authority), a cooperative regional body for service provision (e.g. Metro Vancouver) to a regional lobby and voice (e.g. South East Queensland Council of Mayors). Under these models, a network of smaller local governments is retained, but they operate under a metropolitan umbrella organisation.
All of these models and approaches comprise a toolbox of reform solutions. The Panel has drawn from this toolbox to determine the most appropriate governance structure for metropolitan Perth. Underlying this consideration is an important question: How can community representation and participation be maintained while planning and service delivery for the metropolitan region is enhanced?
5.3.1 The amalgamation debate
The Panel is familiar with the extensive literature canvassing structural reform, and the advantages and disadvantages, costs and benefits and outcomes of local government amalgamations. There are contributions to this debate which extol the
102 | P a g e

Metropolitan Local Government ReviewFinal Report of the Independent Panel - July 2012
benefits of amalgamations, and others that challenge the achievement of financial and other benefits, including economies of scale.158
The Panel notes that some of the literature cited as being critical of amalgamations as a reform option has been commissioned by the local government associations in each state, which typically oppose reform. For example, the South Australian Independent Inquiry into Financial Sustainability of Local Government was commissioned by the South Australian Local Government Association, as were similar reviews in New South Wales and Western Australia.
An exception is the Queensland Size, Shape and Sustainability Review Framework (2006), which, in considering options for structural change in Queensland (prior to the 2008 state-led reforms), argued that the benefits of mergers included:
creating a sufficient resource base for the combined council and a stronger financial structure that helps spread financial and business risks
reducing the total costs of governance providing operating cost savings from economies of scale, reduced staff or the
reduced need for additional staff an opportunity to review customer service and the efficiency and effectiveness
of operations potential to rationalise operating assets including plant and equipment, workshops and depots, administration centres and office technology
opportunities to improve service options and reduce operating costs in many areas, including water supply, sewerage disposal and waste management
addressing cross-border utilisation of facilities and services of one council by residents of the other
an opportunity for improving the promotion of economic development of the combined area
a better basis to manage growth across areas involved formalises communities of interest that may have previously been divided by council boundaries
increases political lobbying power through representation of a larger population base
an opportunity for full-time Mayor and councillors because of increased revenue base.159
Disadvantages of amalgamations included:
residents of each council exposed to assets and liabilities of the other council may expose major differences in rates between areas of the combined council,
although this can be addressed through the use of differential rating may reduce the total amount of the general purpose component of Financial
Assistance Grants cost of integrating the councils can take two or three years to be recovered
from efficiency gains involves integration of sometimes widely differing organisational cultures and
disruption to organisational output during the implementation phase
158 See for example, Aulich, C et al (2011), Consolidation in local government: a fresh look, Volume 2: Appendices, May 2011, p. 23, available from the Australian Centre of Excellence for Local Government website: http://www.acelg.org.au/ ; Dollery, B. E. and Crase, L. ‘Is Bigger Local Government Better? An Evaluation of the Case for Australian Municipal Amalgamation Programs’, Urban Policy and Research, 22(3), 265-276, 2004. See also the paper commissioned by the Western Suburbs Regional Organisation of Council) for this review (DF 109).
159 Local Government Association of Queensland (2005), Size, Shape and Sustainability of Queensland Local Government, Brisbane Qld. (Review Framework, Chapter 4: Options For Change), viewed 28 June 2012, http://lgaq.asn.au/web/guest/library
103 | P a g e
Metropolitan Local Government ReviewFinal Report of the Independent Panel - July 2012
may result in differing levels of services in some areas e.g. smaller communities, although this can be addressed by the use of differential rates or a process to equalise services over time
increases the number of electors per councillor and dilutes the existing levels of representation, although this may not necessarily reduce the effectiveness of representation
smaller communities may lose direct representation, e.g. they may not have a candidate from their own area, although this may be offset by new representational arrangements e.g. community boards.160
The two sides of this debate were reflected in the submissions received by the Panel during the Review, however the Panel notes that many submissions were based on unsubstantiated assertions.
There was opposition to reducing the number of councils and an alternative view that the number of councils across Perth is grossly excessive. This was expressed by various respondents as there being too many local governments, too much bureaucracy and vested interests (IP 93), too much duplication of assets, infrastructure and people (IP 204), too many local governments, most a waste of money’ (IP 94). There should be fewer councils (IP 24) with larger councils better resourced to deliver timely, competent and accountable services (IP 155).
The large number of small local government areas was said to restrict the ability to effectively deliver positive whole city outcomes in a coordinated way (IP220). Government agencies such as Tourism WA and the Swan River Trust suggested that local government reform would simplify the planning process and allow a more integrated approach, with greater consistency in zoning and approval requirements (IP116, IP125).
However, submissions also suggested that small- or medium-sized councils have more of a ‘village atmosphere’ (IP140), deliver a sense of place (IP195) and engage better with the community (IP32). People feel they can be heard (IP179). Large local governments are said to be more politicised (IP25), less democratic, and unable to consult and respond to individual issues, making people feel powerless (IP180).
The ability of small local governments to function well was questioned by respondents, as it was said that they were ineffective and too easily influenced by a vocal minority (IP 14; IP 188; IP 194). Larger councils have more capability and greater depth of technical expertise (IP 151). A contrasting view was that the problem does not lie with the size of councils and that efficiencies can be gained by sharing services with neighbours (IP 20; IP 60). Councils should be left alone unless they are corrupt (IP 197) or out-of-control (IP 136). It was suggested that each local government be reviewed against performance criteria (IP 134; IP 144), with viable local governments retained but working in regional groups (IP 80).
In respect to the latter point, the State Government was seen by local government as the biggest problem, and that the biggest issues facing Perth are State Government problems (IP 169), so local government reform would not address key metropolitan issues (IP 134). Local government was said to have little influence on big issues (IP 96) and the State government was seen as trying to take away local governments’ powers (IP 60). The view was expressed that liveable communities and sustainable Perth will not be facilitated by local government boundary changes (IP 29), but there
160 Local Government Association of Queensland (2005), Size, Shape and Sustainability of Queensland Local Government, Brisbane Qld. (Review Framework, Chapter 4: Options For Change), viewed 28 June 2012, http://lgaq.asn.au/web/guest/library
104 | P a g e

Metropolitan Local Government ReviewFinal Report of the Independent Panel - July 2012
was a need for governance changes and strong partnerships between state and local government (IP 29). The State Government needed to be doing more to decentralise the population (IP 180).
There were some views that some services could be better-managed at a metropolitan-wide level. A regional metropolitan government authority may work (IP 149), with powers to manage specific services and planning for affordable housing, infill development etc. (IP 163).
Some submissions made suggestions as to how the new structure should be determined. Respondents suggested there should be as few as four or five (IP 2) or ten local governments (IP 155). Others said that the current boundaries are out of date (IP 63), so disregard them (IP 141) and start with a clean sheet (IP 132). Water catchments were suggested as a basis for new boundaries (IP 12). There was a view that existing councillors should not have a role in deciding the merits of amalgamation (IP 143), that local governments are prejudiced by self-interest (IP 73) and that an independent body should resolve boundaries (IP 44), though it must avoid ‘a scorched earth approach’ (IP 150). Some said that the new local governments should have new names (IP 187).
While there were views that councils should be amalgamated if they are not sustainable (IP 44), and that small local governments (less than 20,000) could be combined (IP 167), there were diverse views on what the ideal sized of a local government is. As well as the observation that ‘one size does not fit all’, these views included:
population size of at least 30,000 (IP 111) population from 30,000 to 60,000 (IP 133) not larger than 100,000 people (IP 52) local governments of 200,000 people are efficient (IP 7) 350,000 to 500,000 residents is a good compromise (IP 2) support for the Brisbane model (IP 190; IP 204).
While a single super-council (Brisbane model) had some support, there were concerns that it would have ‘too much power and too little democracy’ (IP 34).
The Panel received some specific suggestions about particular areas. For example, corporate submissions supported one local government area for the Kwinana industrial area (IP 181; IP 247) and Perth airport (IP 151), and made suggestions as to which areas should or should not be amalgamated.
There was a diverse range of views in the initial local government submissions about the need and scope of reform. Local governments that were against structural change included Bassendean, Mosman Park, Mundaring, Peppermint Grove, South Perth, Subiaco and Victoria Park. Nedlands supported a need for some tidy-up of municipal boundaries but did not support wholesale changes.
Subiaco’s preference was to retain its independence, but it expressed a preference for the merger of other local governments in the western suburbs into two new entities.
South Perth, while presenting five options for change, ultimately argued that changes to state legislation and policies are more important than changes to the current system of local government. Armadale submitted that no case had been made for reducing the number of local governments. Gosnells was relatively non-committal,
105 | P a g e

Metropolitan Local Government ReviewFinal Report of the Independent Panel - July 2012
saying that ‘if local governments lack the capacity to perform appropriate functions, questions could be raised about their sustainability’. Stirling was silent on the need for metropolitan-wide change, stating that larger local governments are effective, efficient, innovative and responsive.
Vincent did not seek changes to its boundaries, but saw merit in a minimum population size of 30,000 for metropolitan local governments, and this could be considered to be supporting some change across the metropolitan area.
Kalamunda was against amalgamations, but suggested minor boundary changes with its neighbours. Specific boundary extensions were also sought by Belmont, Kwinana and Perth. These local governments tend to support other local government changes across the metropolitan area.
Local governments supporting change include Claremont and Cottesloe, although for both the scale of change was relatively limited. For example, Claremont supports a joining of the Towns of Claremont, Cottesloe and Mosman Park and desirably the Shire of Peppermint Grove, but does not mention Nedlands.
Other local government submissions supporting change included:
Bayswater considered that a sustainable local government would have a population of between 90,000 and 120,000 people, which would combine the benefits of scale with local knowledge and community responsiveness.
Cambridge suggested that all local governments should have a minimum level of capability and financial capacity. It proposed a building-block approach towards a long-term structure, with no urgent need to implement the final structure for the next 50 years. It also had an expansion plan for Cambridge.
Joondalup stated ‘‘focussing on the number of Local Governments in the Perth Metropolitan Area is perhaps too simplistic. Instead, it is argued that Local Governments need to be the preferred size or ‘upper limit’ to serve their communities efficiently and effectively, and clarification of what might be considered the preferred size would assist the community and Local Governments …. the City acknowledges that a reduction in the number Local Governments would most likely result in an increase in the strategic capacity of the industry’’.
Melville recommended an approach similar to Melbourne, which provides for a core city of around 100,000 people, surrounded by a range of sizes of local governments averaging around 100,000 residents, to be developed over the next decade.
Cockburn sees a structure of 10 to 15 local governments in the metropolitan area with a population base of 150,000 to 200,000, with three local governments in the south-west corridor.
Swan supports broad change and provides a preferred option based on nine local governments for the Perth region.
The City of Perth did not promote the restructuring of local government in the metropolitan area, but made a case to strengthen the City’s ability to grow and meet community expectations and the needs of the state as its capital city.
It was thus evident to the Panel that some local government submissions took a broad view of the needs and priorities of the metropolitan region (for example, Swan, Melville, Cockburn). The Panel was surprised that not all metropolitan local governments made a submission on the Issues Paper and the Draft Findings. It noted that Canning, East Fremantle and Fremantle did not make a submission on the
106 | P a g e

Metropolitan Local Government ReviewFinal Report of the Independent Panel - July 2012
Issues Paper. The Panel did not receive a submission in response to the Draft Findings from Claremont or Peppermint Grove.
The Panel noted that with the release of the Draft Findings the positions of local governments changed. For example, the City of Rockingham, after recommending no change in its first submission, cogently argued for an amalgamation with Kwinana and part of Cockburn to provide for one planning authority overseeing the Kwinana Industrial Strip, Henderson Marine Complex and Latitude 32 Industrial Area (DF 145).
Similarly, the City of Melville moved from quite a broad position on the size and scale of local governments (IP 160) to a pragmatic proposal for a new City of Murdoch. They suggested this should comprise the existing City of Melville and part of the Cities of Canning, Gosnells, Fremantle and Cockburn, based on the Murdoch Activity Centre as its civic centre (DF 47). There was no consensus amongst the general public or the local government sector on the ideal size for a metropolitan local government. The Western Metropolitan Regional Council, which works on behalf of five member councils in Perth's western suburbs, submitted that “large councils inevitably become defensive councils in the face of a large pool of complaints and are less likely to embrace innovative community engagement”. (DF 47)
‘Community of interest’ is often raised as a key consideration for local government boundaries. It is a matter prescribed by Schedule 2.1 of the Local Government Act 1995 for the LGAB to take into account. On the one hand, the Panel was presented with a view that urban community interest is very similar and does not change a great deal across the suburbs of Perth (DF 177). In contrast, another suggested that Nedlands has no community of interest with adjoining Subiaco (IP 104).
Community of interest is not something that is unique to small-sized local governments. Communities of interest exist at different scales in a hierarchical, nested or overlapping manner. Some communities of interest are not geographical at all, and may be created by other common factors. The Panel’s view is that communities in the Perth metropolitan area are more alike than they are different, and while the community of interest rationale should play some role in boundary determination, it is not an argument for retention of the local structure.
The Panel received many submissions that were against structural change, particularly from local governments. The Panel heard many arguments against change, including the statement that people are not asking for change. For example, the City of South Perth submitted:
It does not consider that changes to the current system of local government within the metropolitan area are warranted in the absence of clear identification of any major issues that need to be addressed (DF79).
But the Panel is aware that other people support the need for change. The Panel has weighed up these divergent views and come to a judgement in the interests of improved metropolitan governance and the greater good for future generations of Perth.
The LGAB, in its landmark 2006 review of the sustainability of local government in WA, examined the merits of amalgamation as a means of enhancing the efficiency and effectiveness of local government. The Board concluded that ‘there is an urgent
107 | P a g e

Metropolitan Local Government ReviewFinal Report of the Independent Panel - July 2012
need for structural reform of local government in WA … changing the structure of local government from one that is constraining sustainability to one that is enabling sustainability’.161
One of the 49 recommendations in the report states:
That the Minister legislate for the amalgamation of the local governments of Cambridge (part), Claremont, Cottesloe, Mosman Park, Nedlands, Peppermint Grove and Subiaco, to form a new western suburbs council (in conjunction with the transfer of a part of Cambridge to Stirling and part of Stirling to the new western suburbs local government) as soon as possible.162
This recommendation was based on a detailed evidence-based assessment (Appendix 6 of its report) which included the following points:
Residents of the western suburbs would not lose their sense of community identity.
Suburb names, addresses and postcodes would not change. The high level of access to services and facilities enjoyed by residents of the
western suburbs would not be affected. Changes in local government boundaries would not lessen the amenity
enjoyed by residents of the western suburbs. (There would be greater) equity of access to available services in the region. The local governments in the region employ 579 people, and there is likely to
be a degree of duplication in staffing requirements, including senior management levels.
Service gaps have been identified across the region because of the variations in local government.
The size of some local governments places limitations on the range of services able to be offered to the community.
There are multiple planning schemes with different requirements and of different ages, which impact on the landscape and amenity and make it difficult for businesses and developers who operate across different local government areas.
Rationalisation of local government infrastructure in the region would be possible, with the benefit of reducing the overall asset management burden.
(There was) a variation in policies for, and management of, environmental issues.
It is logical for environmental problems to be tackled on a regional level than to have separate local solutions.
The information considered by the LGAB, including the points mentioned above, led it to the conclusion that it would be a logical step to amalgamate the western suburbs local governments. The main reasons identified for this were environmental, equity and efficiency, and to eliminate duplication and overlap in governance.
161 The terms of reference for the 2006 LGAB review were explicit about the economic, environmental and social sustainability of WA communities, but the Board also considered related elements implicit in the terms of reference including:
• Community sustainability.• Population sustainability.• The financial sustainability of local government.• The organisational or corporate sustainability of local government.
LGAB (2006), Ensuring the future sustainability of communities, pp.xix-xx, available on the Department of Local Government website: http://dlg.wa.gov.au/Content/LG/AdvisoryBoard/StructuralElectoralReform.aspx
162 LGAB (2006), Ensuring the future sustainability of communities, p. 118, available on the Department of Local Government website: http://dlg.wa.gov.au/Content/LG/AdvisoryBoard/StructuralElectoralReform.aspx
108 | P a g e
Metropolitan Local Government ReviewFinal Report of the Independent Panel - July 2012
A similar analysis was undertaken for the south-west portion of the metropolitan region (Appendix 7 in its report), culminating in a LGAB recommendation:
That the Minister legislate for the amalgamation of the City of Fremantle and Town of East Fremantle as soon as possible.163
The potential for amalgamations and boundary changes were identified in a number of other parts of the metropolitan area (e.g. Bassendean and Bayswater), but the Board was not able to make a detailed assessment of these areas in the time available to it.
5.3.2 Options for structural change in metropolitan Perth
Apart from some of the boundaries being illogical, and the variations in size, the Panel’s finding is that there are too many local governments in the Perth region. The current arrangement and severely fragmented structure creates a high level of duplication, inconsistencies and difficulties for business, lost opportunities for communities, confusion for consumers, and planning that is complicated, uncoordinated and un-strategic.
Based on the evidence considered during the Review, the Panel supports a reduction in the number of local governments in metropolitan Perth from 30. Based on the information available to it, the Panel, at the time of the release of its Draft Findings, considered that the most relevant options for the future were:
10 to 12 local governments
Five to six local governments
One metropolitan-wide local government.
Research by Conway Davy/Planning Context164 canvassed the advantages and disadvantages of a range of options, including options similar to those listed above. Their options also included the creation of a metropolitan RLG as an additional body, replacing the existing RLGs.
A 20-council option was also canvassed in the Conway Davy/Planning Context paper. The Panel notes that WALGA argued for 15 to 20 local governments as a less extreme and more achievable option (DF 130).
After considering a broad range of information and input from stakeholders, the Panel determined that there is a need for significant change in Perth’s local government arrangements, so the ‘status quo’ was not considered an option by the Panel. It notes that a number of the smaller local governments, including Cottesloe, East Fremantle, Subiaco and Serpentine-Jarrahdale expressed a strong preference for no change to be made to local government structures or rejected the models proposed by the Panel.
163 LGAB (2006), Ensuring the future sustainability of communities, p. 118, available on the Department of Local Government website: http://dlg.wa.gov.au/Content/LG/AdvisoryBoard/StructuralElectoralReform.aspx
164 Conway Davy and Planning Context (2012), Metropolitan Local Government Reform: Development and Analysis of Alternative Models, viewed 28 June 2012, http://www.walga.asn.au/downloader.aspx?p=/Portals/0/Templates/Governance_Strategy/712-136%20Metropolitan%20Local%20Government%20Reform%20Models%20(2).pdf
109 | P a g e

Metropolitan Local Government ReviewFinal Report of the Independent Panel - July 2012
The advantages and disadvantages of each option were examined by the Panel (see Appendix 5.1). In summary, the criteria used to weigh up the advantages and disadvantages of the different options included:
the degree of duplication and fragmentation across the metropolitan area
the potential for functional realignment
capacity for advocacy and lobbying
capacity to access additional funding from State and Federal government, and the ability to demonstrate capability to undertake significant projects
spread of rate-base mix to ensure sustainability
equity and access to services for all individuals across the metropolitan area
ability to generate strategies to deal with metropolitan-wide issues
consistency and uniformity for the business, government and not-for-profit sectors
ability to generate efficiencies and attract quality staff
ability to facilitate an improvement in governance via a significant change in the roles and expectations of elected members
contribution to Perth’s role in the world economy and ability to promote a strong international image
impact on future generations
opportunity cost.
There are also further considerations including the potential to link local government boundaries with state government agency boundaries.
As detailed elsewhere in this report, a major consideration for the Panel is whether local governments should be amalgamated wholly or whether they should be formed along entirely new boundaries which would involve splitting existing local government units. In the case of the latter, there are major issues around apportioning community assets and liabilities.
The Panel is aware of many other considerations, including issues particular to Perth:
differences in the demands of local government in inner and outer areas
the particular challenges faced by local government in the Perth hills area
communities and local governments are at different stages of a lifecycle of growth and renewal
understanding the argument that ‘one size does not fit all’
the size of local government is not about population size, but more about its rate base and socio-economic mix.
The three options for reform defined above were central to the Panel’s deliberations. They were considered in terms of population, capacity, rating mix and community value.
15 to 20 metropolitan local governmentsAs listed above, a 20-council option was canvassed in the Conway Davy/Planning Context report, with WALGA arguing for 15 to 20 local governments as its preferred
110 | P a g e

Metropolitan Local Government ReviewFinal Report of the Independent Panel - July 2012
option (DF 130). Consequently, many local government submissions took the same position (Armadale, Belmont, Canning, Cockburn, Gosnells, Kalamunda, Kwinana and Victoria Park).
The Panel considers that a comprehensive case for this option was not provided, other than suggesting that the three models cited by the Panel in its Draft Findings were too extreme, referencing the need for achievable options, and the population projections for Perth. Current local government boundaries were suggested as the starting point.
The local governments created under this model would have an average population in 2026 (based on the projections in Table 3.1) of between 114,000 and 152,000.
The Panel did not consider the 15 to 20 option any further, as it took the view that the extent of change involved, while being disruptive to the sector, was not strategic and would not resolve the ongoing debate about structure. A reduction in the number of local governments to twenty was not considered sufficient to meaningfully address the constraints within the currently fragmented structure.
10 to 12 metropolitan local governmentsThe 10 to 12 council option provides an opportunity for alignment with the strategic activity centres identified in Directions 2031. These centres will be the focus for Perth’s future development, and there is a strong case for making each centre the hub for a local government. Strategic metropolitan centres will have a future indicative service population (trade area) of 150,000 to 300,000 and secondary centres will have up to 150,000.165 There is a need to take into account the difference in population growth around these activity centres, as some will grow quicker than others.
The Panel has concluded that the activity centres provide a logical basis for its proposed local government entities. By being focused on an activity centre, each local government would be working for the success of that sector. It was put to the Panel (by the CEO of one of the existing local governments) that where a local government does not have a strategic activity centre, it is likely to try to create one. Where a local government has two or more strategic activity centres it won’t be able to focus on one. Indeed, it was perhaps the logic of this argument that inspired the City of Melville’s submission which proposed extended boundaries focused on a new strategic activity centre in Murdoch.
The local governments created under this model would have an average population in 2026 (based on the projections Table 3.1) of between 190,000 and 230,000.
This option was supported by the local governments of Bayswater, Fremantle, Joondalup, Rockingham, Stirling and Swan, all of which are the location of current strategic metropolitan centres.
The Panel supports 12 councils based on strategic metropolitan centres as its preferred option.
Five or six metropolitan local governments
165 WAPC (2010), State Planning Policy 4.2 Activity Centres for Perth and Peel, in Western Australian Government Gazette, 31 August 2010, No.166, viewed 28 June 2012,http://www.planning.wa.gov.au/dop_pub_pdf/activity_centres_policy_2.pdf
111 | P a g e

Metropolitan Local Government ReviewFinal Report of the Independent Panel - July 2012
The five or six council option provides the opportunity for alignment with the five sub-regions identified in Directions 2031 (Figure 3.2), which would greatly assist in the implementation of the State Government’s planning objectives. The potential sixth council relates to the question of whether a separate entity for Perth is formed or the central region is split north and south of the river.
The local governments created under this model would have an average population in 2026 (based on the projections Table 3.1) of around 380,000 to 450,000.However, these numbers would vary considerably if the current planning sub-region boundaries are used (Table 5.8). These areas would clearly be sustainable and would have significant capacity to address issues such as waste, foreshore and natural resource management, as well as ensuring improved and more effective planning outcomes. Each of these sub-regions could be subject to a place-management approach to their various communities to ensure effective local representation.
No local governments supported this option.
Table 5.9: Population projections for planning sub-regions
Sub-regions 2011 2026Central 778,359 898,500North 323,971 466,500East 212,299 283,300South-west 232,458 355,800South-east 191,720 270,700Total Metropolitan 1,740,818 2,276,826
Source: WAPC publication Western Australia Tomorrow (Population Report No.7, February 2012)
One metropolitan local governmentThe Panel saw potential to create one large Perth City Council for the Perth metropolitan region. This would be a very large local government; financially strong with great capacity to provide services to the region and to influence and partner with State and Federal governments. Given its size, representation and community engagement arrangements would need particular attention.
Brisbane might be considered as a model in this vein, although urban growth in the region since its establishment in 1924 (from a merger of 20 local governments) now means that the metropolitan region is comprised of six local governments. The Brisbane City Council has its power divided between a powerful Executive Lord Mayor, a 26-member council representing single-member wards of approximately 23,000 voters, and a Civic Cabinet comprising the Lord Mayor and the chairpersons of the seven standing committees drawn from the membership of Council. The Brisbane City Council, with a population of over one million, is widely regarded as a successful model.166
A former CEO of the Brisbane City Council advised the Panel:
Whenever Brisbane residents are polled - you need to know how much they respect the Council at a very deep level. The current Lord Mayor got a huge turnout and number of votes at the 2012 April elections. There's a 96% recognition and positive response to the Council brand. Local neighbourhood
166 Population 1,067,000.Sansom, G, Dawkins, J & Tan, S (2012), The Australian Model of Metropolitan Governance: Insights from Perth and South East Queensland, UTS: Centre for Local Government, University of Technology, Sydney, May 2012
112 | P a g e

Metropolitan Local Government ReviewFinal Report of the Independent Panel - July 2012
planning and attention to Brisbane's suburbs and villages gives each a distinct feel. There's over 16,000 members of YourCity YourSay -a major ongoing community consultation mechanism.167
Another model to consider adopting for Perth is that of Auckland. The Auckland Council was established in 2010 for a regional population of nearly 1.5 million. Until 2008 Auckland had seven councils and seven Mayors, as well as a regional council chair, and a total of 109 councillors. It also had 30 community boards (in five councils) with 145 board members. The community boards had the job of developing an understanding of the community and representing on their behalf. Overall, it was a large number of elected members, with different voices for Auckland. A Royal Commission was established to consider the governance of the Auckland region, and it found that Auckland needed one voice, one direction.168
As implemented by the New Zealand Government, the new Auckland Council was based on a ‘co-governance model’ which included 21 local boards (for 21 communities of interest, wholly within the 21 wards) of five to nine members (an average representation of 10,000 residents per elected member). The community boards were responsible for local services, local facilities and non-regulatory decision-making, while the Council as governing body would set the rates, determine regional plans, provide advice to the Boards and deliver services. The region-wide approach would promote consistency of standards, although the boards had some discretion to change things, such as to take more of one service or less of another, and pay more rates and charges for more services. The new Auckland Council ended up with a Mayor and 20 councillors elected from wards.169 One of the first tasks for the new Auckland Council was the development of a spatial plan. Perth has the advantage of already having a spatial plan (Directions 2031). There was nothing similar for Auckland.
The New Zealand Council for Infrastructure Development has described the creation of the single Auckland council as a ’huge leap forward’. Democracy is said to have been strengthened (not weakened), and service delivery has been seamless.170
No local governments supported the option of a single metropolitan local government.
5.3.3 Towards metropolitan governance
Metropolitan governance refers to any form of metropolitan- or area-wide government which controls, regulates and provide services within the governed territory. Metropolitan governance does not require a specific governmental structure but can be achieved through voluntary cooperation among major players (government, non-government and private sector) in the metropolitan area.171 Metropolitan governance can be seen as a web of governments, institutions, organisations and citizens engaged in service-provision.
167 Jude Munro, personal communication168 Royal Commission on Auckland Governance (2009), Royal Commission on Auckland Governance: Executive Summary, viewed 28 June 2012, http://auckland.royalcommission.govt.nz/rccms.nsf/0/B764F57542CB4EC1CC25758500470729?open169 Amalgamation: Living the Auckland experience: some comments, Bruce Nicholson and Coreen Adamson, Morrison Low Consultants Pty Ltd, LGMA WA presentation, 22 March 2012
170 James, C (2011), Too big to fail. (Too small to succeed?), Auckland One Year On, viewed 28 June 2012, http://www.colinjames.co.nz/speeches_briefings/Auckland_one_year_on_11Dec13.pdf171 Phares, D (Ed), Governing Metropolitan Regions in the 21st Century, p. 12, ME Sharpe: New York, 2009
113 | P a g e

Metropolitan Local Government ReviewFinal Report of the Independent Panel - July 2012
The Panel also deliberated on the possibility that Perth should have an overarching strategic body at the metropolitan level, either as a formalised second tier or a more informal body. There are a number of possibilities that provide for maintaining local representation and coordinating councils.
Models for this type of arrangement include London (with its Mayor, London Assembly and Greater London Authority), a genuine metropolitan government, but with a relatively limited role in service delivery other than transport.172 Another example is Metro Vancouver (formerly known as the Greater Vancouver Regional District). Both of these models are based on retaining a number of individual local governments (33 and 22 respectively). The advantage of this type of arrangement is that the existing knowledge-capital of local governments is retained.
The Metro Vancouver model has been described as the best to be developed so far for effective metropolitan governance.173 Its strength is the way it combines local self-government through established municipalities with the institutional metropolitan level that provides a framework within which municipalities can voluntarily cooperate with each other. In this way, the regional government is said to serve the local government system without dominating it. The Vancouver City region obtains most of the benefits of having a metropolitan authority without the addition of another competing tier of directly elected local government. However, a challenge for Metro Vancouver is its political legitimacy; there are no directly elected councillors on Metro Vancouver, so speaking on behalf of the region is difficult.174
Another example considered by the Panel is Portland, Oregon. While it falls short of being a true metropolitan local government, Metro Portland is the broadest in scope in the United States, and is geographically big enough to encompass area-wide problems and issues.175
A different kind of metropolitan model is the Council of Mayors of South East Queensland (COMSEQ). It brings together the Mayors of the ten councils in SEQ which serve the region’s 3.2 million people. It has been said that SEQ is no longer just a series of disparate geographic areas but a region that, in practical terms, now functions as a single metropolitan area.176 The COMSEQ model has been described as a nascent form of metropolitan governance.177 COMSEQ is somewhat similar to the council of mayors and councils of governments which have evolved in many parts of the USA.
COMSEQ was established in 2005 as an independent advocacy organisation to represent the interests of Australia’s fastest growing region. COMSEQ proactively seeks the cooperation of the Federal and State governments to ensure the long-term sustainability and liveability of SEQ communities. It does this through seeking appropriate funding and delivering infrastructure and services, ‘‘highlighting the needs of the region in a way that no other organisation is able to do’’. COMSEQ has
172 McKinlay, P (2011), Integration of Urban Services and Good Governance: the Auckland Super City Project, presentation to the PECC Seminar Environmental sustainability in Urban Centres, p. 16, Perth WA, 13 April 2011.173 Sancton, A (2005), ‘The Governance of Metropolitan Areas in Canada’, Public Administration and Development, vol. 25, pp. 317-327174 WALGA (September 2011) Metropolitan Governance Models - Information Paper, viewed 29 November 2011 http://www.walga.asn.au/LGReform/MetropolitanLocalGovernmentReview.aspx175 Phares, D (Ed), Governing Metropolitan Regions in the 21st Century, p. 11, ME Sharpe: New York, 2009176 Council of Mayors, South East Queensland (2012), About the Council of Mayors (SEQ), viewed 28 June 2012, http://www.councilofmayorsseq.qld.gov.au/About/177 McKinlay, P (2011), Integration of Urban Services and Good Governance: the Auckland Super City Project, presentation to the PECC Seminar Environmental sustainability in Urban Centres, p. 16, Perth WA, 13 April 2011.
114 | P a g e
Metropolitan Local Government ReviewFinal Report of the Independent Panel - July 2012
identified infrastructure priorities for its region and has been successful in attracting grants from the Commonwealth.
The Panel believes that these bodies are worth considering, because metropolitan Perth is essentially one large economic and social community.
And yet this compelling community of interest has no status or voice in the Australian government system. …It must tell us something that Australia’s major cities are amongst the few in the developed world without metropolitan governments. It is a major limitation of policy that a ‘nation of cities’ grants city regions no voice, no means for collective expression of content about planning, resource allocation and major strategic issues, such as population growth, economic development and sustainability targets. What is missing is an intervening layer for the negotiation of state and local development ambitions at the regional level. And yet there exists no mechanism for consultation, clarification and leadership at the regional level.178
Three purposes for a regional body have been identified:
Planning – the need for institutionalised capacity to consider regional needs and impacts beyond the current fiscal year.
Production – some services such as transport infrastructure should be administered by a regional body.
Regulation – e.g. environmental issues cross jurisdictional boundaries.179
The Panel supports the view that any new body created needs to be carefully constructed. There is the possibility that where matters are left to decision-makers whose loyalty lies with only one part of the affected region, there could be a risk of parochial interests overwhelming any rational decision-making process.180
The OECD notes that the creation of a large metropolitan government can be a political threat to the central state, impeding its ability to guarantee balanced territorial development.181 This concern is particularly applicable to Western Australia, given the high percentage of the State’s population residing in metropolitan Perth. For a metropolitan region government of some kind to be adopted in Perth, there might be an expectation that services would be devolved from the State Government to the new entity.
While the City of Melville submitted that it did not support the concept of a ‘‘metropolitan wide local government’’ with expanded service delivery roles (DF 47), the City of Belmont described a potential model:
The Metro Vancouver Model could translate to become the Perth Metropolitan Board, a partnership of local governments governing the affairs of the Perth Regional District (perhaps the Peel Regional District as well). The Perth Metropolitan Board would be constituted as its own Regional Government inclusive of decision making powers. The Perth Metropolitan Board would administer those services that are both common across the
178 Gleeson, B, Dodson, J and Spiller, M (2010), Metropolitan Governance for the Australian city: The case for reform, Urban Research Program, Issues Paper 12, March 2010, p. 7, available at http://www.griffith.edu.au/__data/assets/pdf_file/0012/199299/urp-ip12-gleeson-et-al-2010.pdf179 Phares, D (Ed), Governing Metropolitan Regions in the 21st Century, p. 11, ME Sharpe: New York, 2009.180 McKinlay, P (2011), Integration of Urban Services and Good Governance: the Auckland Super City Project, presentation to the PECC Seminar Environmental sustainability in Urban Centres, p. 14, Perth WA, 13 April 2011.181 OECD (2000), The reform of metropolitan governance, viewed 28 June 2012, http://www.oecd.org/dataoecd/3/17/1918016.pdf
115 | P a g e

Metropolitan Local Government ReviewFinal Report of the Independent Panel - July 2012
metropolitan area and essential for the success of Perth. These services could include for example strategic community and development planning, riverine management, waste, transportation, housing, libraries and regional parks. The Perth Metropolitan Board would represent local government on these issues (IP108).
This approach is echoed in the paper by Professor Brian Dollery, commissioned by the Western Suburbs Regional Organisation of Councils (WESROC) (DF 109). The paper argues for a metropolitan-wide body, along the lines of the Greater London Authority, to deal with greater-Perth policy matters, co-existing with the existing Perth local councils.
While no-one would dispute the argument that there is a need for a ‘city-wide’ planning authority to deal with broader advocacy, coordination and planning questions affecting the Greater Perth metropolitan region …. the optimal approach resides in assigning decision-making authority to a regional body which is obliged to consider the metropolitan ramifications of policy decisions. Thus in the case of Greater Perth, a ‘city-wide’ governmental entity would govern functions which affected the whole metropolis (DF109).
Issues of metropolitan governance are under consideration all around Australia and New Zealand at present. To highlight this, the Panel notes the propositions discussed at a recent metropolitan governance roundtable for metropolitan Sydney, which included the following:
Consideration should be given to establishing a new structure for metropolitan governance that would sit within State government but would also:
Establish an effective partnership with local government Have a clear metropolitan region mandate and some independent fiscal
capacity Enjoy a substantial measure of decision-making autonomy Be properly accountable to the metropolitan community.182
The Panel believes there is merit in the metropolitan area having a ‘voice’; a representative body dedicated to advocating for the delivery of appropriate funding of infrastructure and services. The Panel also holds the view that whatever form of metropolitan governance is adopted by Government, this on its own should not be a substitute for structural reform of local government.
5.4 THE PANEL’S CONCLUSIONS ON STRUCTURAL REFORM
5.4.1 Benefits of reform
After considering a broad range of information and hearing from a wide range of stakeholders and community members, the Panel has concluded that there is a need for significant change in Perth’s local government arrangements. This finding is
182 Metropolitan Governance Roundtable Forum (2012), Metropolitan Governance Roundtable Propositions for Discussion, UTS Centre for Local Government, Sydney 7 June 2012. (Available from CLG)http://www.clg.uts.edu.au/newsandevents/events_2012.html#METRO
116 | P a g e

Metropolitan Local Government ReviewFinal Report of the Independent Panel - July 2012
consistent with previous reviews of local government arrangements in Perth, but the Panel sees a need for change at a scale which is greater than previously envisaged.
While there are many positive aspects to local government in metropolitan Perth, the Panel has determined it is not in the best interests of the wider community for the status quo to be maintained into the future.
As noted previously, the Panel heard from many respondents who were against making any changes. But the Panel is also aware that many people support the need for change. After considering a broad range of evidence, and in the interests of improved governance and the greater good for future generations, the Panel concurs with the latter view.
The Panel believes there are significant benefits to be achieved by reform. This is supported by recent work by Deloitte Access Economics (2011), Australian Centre for Excellence in Local Government (2011) and PricewaterhouseCoopers (2006). The Productivity Commission recently identified the wide-ranging potential benefits of local government coordination and consolidation:
gains in economic efficiencies arising from economies of scale and scope in local government functions
gains in regulatory efficiencies; for example, better quality regulation and reduced inconsistency and duplication in regulation across local governments
improved capacity and capability in local governments to carry out their functions, including their regulatory functions
improved financial sustainability of local governments
strategic benefits such as greater economic development and investment in local government areas and more funding from higher levels of government.183
While there have been extensive amalgamations in Australia in the last 20 years or so, there are relatively few Western Australian examples. The Kalgoorlie-Boulder (1989) and Albany (1998) councils have previously reported that substantial benefits from their amalgamations have accrued to their communities.184 These included:
uniformity in the treatment of the whole city major infrastructure development city-wide strategies major plant rationalisation administrative savings and staff specialisation.
The benefits realised in Kalgoorlie-Boulder and Albany are consistent with those identified by the Independent Review Panel in Southern Tasmania regarding their recommendation to form a City of Greater Hobart:
The Panel believes the advantages that would accrue to Hobart in the long term from such a larger grouping would significantly outweigh any disadvantages (largely short term) from the changes. These advantages would include:
183 Productivity Commission (2012), Business Regulation Benchmarking: Role of Local Government as Regulator, Draft Report, p. 202, viewed 27 June 2012, http://pc.gov.au/data/assets/pdf_file/0013/116032/local-government-draft.pdf184 LGAB (2006), Ensuring the future sustainability of communities, p. 78, viewed 3 July 2012, http://dlg.wa.gov.au/OpenFile.ashx?Mode=446E37686749376A356D684D2B6E6D6D4D6E555273773D3D&ContentID=796F55516630375A78556B3D
117 | P a g e

Metropolitan Local Government ReviewFinal Report of the Independent Panel - July 2012
Better integration of service provision across the metropolitan area. Improved capacity for metropolitan-scale strategic planning. A greater capacity to negotiate with State and Commonwealth Governments
on behalf of the metropolitan community. Significant opportunity for more efficient and effective provision of services
and internal management of council operations. The capacity to develop strong council management and community
leadership.185
One submission to the Panel stated ‘‘there isn’t a shred of evidence that larger councils are more efficient or supportive of the local community. In actual fact, it is quite the opposite. Look at Queensland, look at NSW’’ (DF 35). However the Panel was not provided with, nor could it source the evidence to substantiate this claim. It was also suggested that smaller councils are often less complex operations with a greater degree of transparency and consequently more amenable to scrutiny by ratepayers (DF109).
The potential benefits to be realised through reform of the local government sector in metropolitan Perth, as discerned by the Panel, are now presented in more detail.
Building strategic capacity across the local government sector in PerthThe Panel has concluded that reform of the local government sector in Perth will create local governments with more strategic capacity. With greater scale, the quality of advice provided to local governments could improve through the attraction and retention of the best professional staff.
It was suggested to the Panel that there is considerable merit in the argument for small regional and rural local governments, but less merit for local governments in large urban environments such as Perth:
the weight of conceptual and empirical opinion holds that, as a general rule, greater administrative and technical capacity are easier to achieve in larger local government entities. However, the force of this argument is diminished in metropolitan contexts by that fact that sophisticated strategic skills can readily be acquired through the market and from other councils (DF109).
At present, skills are acquired through the job market and other local governments, but the Panel believes that this is not always an effective approach. This is partly to do with the members elected to council, as a respondent indicated ‘drawing staff and leaders from only this one small suburb is short-sighted and stifling’ (DF 71). Another respondent stated ‘I do not believe the current fragmentation of councils - and small size would necessarily allow the best qualified people to always be on the job… local government might have been necessary at some point in Perth’s history, but its form is archaic now. The current system is too reactive and does not have the capacity for strategic planning’ (DF 41).
When it comes to building strategic capability, the evidence suggests that amalgamation is the better approach than shared services ‘provided that we can ensure that this does not undermine local governance and the interests of individual communities’.186
185 Independent Panel to the Southern Tasmanian Councils Authority (2011), Independent Review of Structures for Local Governance & Service Delivery in Southern Tasmania, p 29, viewed 28 June 2012, http://stca.tas.gov.au/future/wp-content/uploads/2011/11/Structural-Project-Final-Report.pdf186 McKinlay Douglas Ltd, Warringah Council (2011), Local Government Reform: Have your say, viewed on 26 June 2012, http://yoursaywarringah.com.au/LGovreform
118 | P a g e
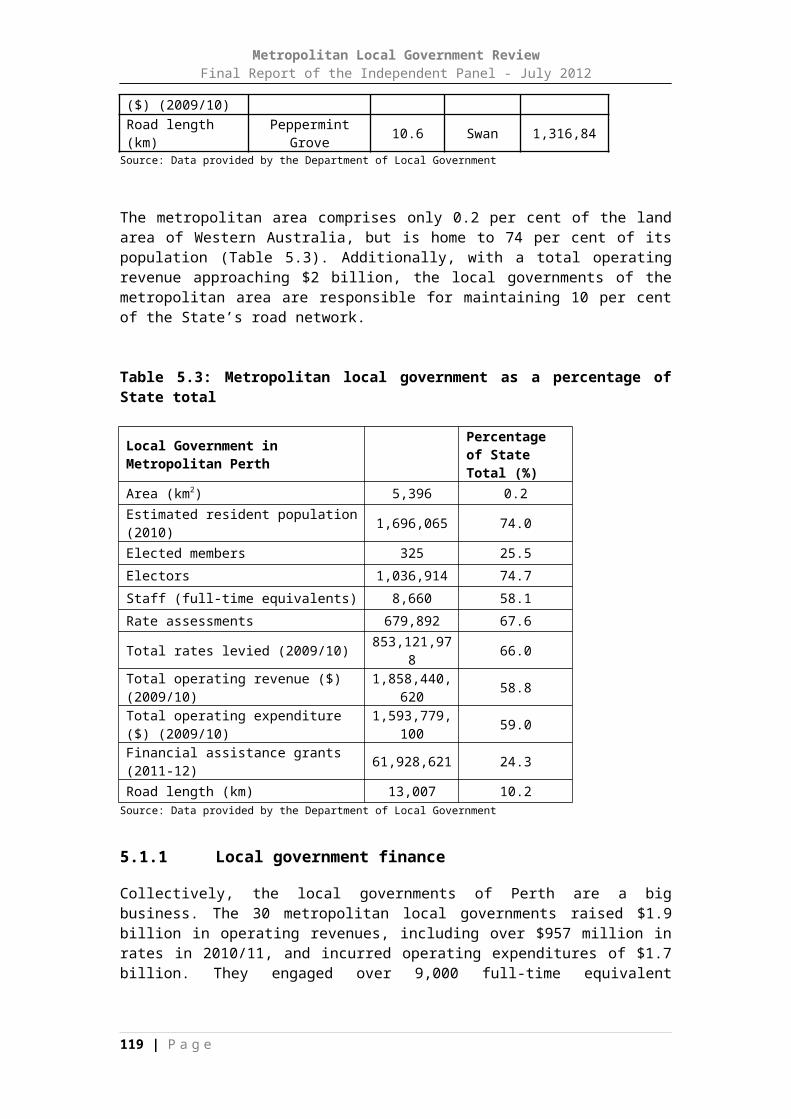
Metropolitan Local Government ReviewFinal Report of the Independent Panel - July 2012
The City of Rockingham submitted detailed comments on the bigger local government/better capacity argument. It stated that this is intrinsically linked to the attributes and performance of the people involved, both at an elected and professional officer level, and that it is not just relative to size or structure.
A well led and managed large local government will arguably have much more capacity to deliver services and manage assets than a considerably smaller entity, also well managed and led.
It follows however that a poorly led or incompetently managed large local government can potentially be a bloated, bureaucratic, organisationally dysfunctional mess that can essentially fail its community. A well-managed and led small local government would in this instance provide a far more beneficial outcome to their community. The challenge remains to attract and retain quality people that can passionately and effectively lead, manage and serve local governments in both elected and appointed roles. Structure, size and form will matter little in the absence of good people (DF145).
The Productivity Commission cited the results of a 2009 survey of the mayors and CEOs of 30 amalgamated local governments in Queensland:
Respondents assessed outcomes of amalgamation to include (on a scale of 1 (very poor) to 5 (very good)): stronger, more efficient and effective local governance (3.93); overall performance of the new local government in terms of representation, decision-making and service delivery relative to community needs (3.73); and efficiency of operations in terms of current workforce numbers, skills and distribution across the local government area (3.43).
54 per cent of respondents believed that amalgamation assisted in attracting better-qualified and experienced staff.
71 per cent of respondents believed that new local government boundaries would facilitate better planning and development controls.187
While one respondent expressed concern that ‘the additional bureaucracy associated with larger local government councils must lead to greater inefficiencies associated with large organisations compared to smaller existing councils’ (DF 49), the Panel does not think that larger councils would be very large bureaucracies compared to State and Federal government departments.
The City of Joondalup submission to the Panel acknowledged that a reduction in the number local governments would most likely result in an increase in the strategic capacity of the industry (DF 108).
There is also the capacity to capture missed opportunities that are presently lost due to limitations of scale and the current structure. For example, projects like the proposed Ocean Reef marina development, a joint venture between State and local government (City of Joondalup) would really only be possible when local governments have sufficient size and scale to partner with the State. Similarly, the Stirling City Centre Alliance and the inner city light rail project are the sorts of projects where strong local government capacity is essential for them to succeed. In the
187 Productivity Commission (2012), Business Regulation Benchmarking: Role of Local Government as Regulator, Draft Report, p. 204, viewed 27 June 2012, http://pc.gov.au/__data/assets/pdf_file/0013/116032/local-government-draft.pdf
119 | P a g e

Metropolitan Local Government ReviewFinal Report of the Independent Panel - July 2012
metropolitan context, increased strategic capacity of local government may be best realised through defining local government boundaries that correspond to areas of strategic significance.188
A more equitable spread of resources across metropolitan Perth and more equitable delivery of services to all residents The Panel has concluded that reform of the local government sector in Perth will generate a more equitable spread of resources across local government in metropolitan Perth, with the potential to more equitably deliver services to all residents.
Some local governments have strong rate-bases due to the size of their business and commercial sectors. This means rates for householders can be kept lower. Other areas which have less commercial development inevitably have higher rates for householders or compromise on service range and quality.
This approach also provides an opportunity to make local governments more sustainable and self-reliant. The Panel considers that a rate revenue of around $100 million is desirable for the new local government entities. Although some of the new units proposed by the Panel fall short of that at present, they will approach that figure as their areas develop.
A simplistic view that ‘there was no reason why land should not be taxed at a standard rate across the entire metro area’ (DF 136) would really only be applicable if there was a single local government. Local governments levy different rates to raise the money required to deliver their planned services and facilities, so it is understandable that there will be differences from one local government to another.
This is not to say that local governments with large financial resources should be shared with those in a less-fortunate position, but the Panel asserts there could be a better distribution of rating resources among local governments in the region. This is not easy to achieve without significant changes in local government boundaries. It has been observed that:
there is a perceptible lack of collective will among those who might effect broad changes in metropolitan boundaries. Middle classes in many countries have shown little desire to contribute financially to the reduction of intra metropolitan wealth disparities, and to the quest for fiscal equity. There has thus been only limited middle-class support for a key principle underlying the push for metropolitan integration.189
Hence, there were submissions to the Panel such as:
a local community will be most unhappy if the rates they pay are not all used in their own local government area: to attempt a socialistic pooling and divvying up of rates culled from a spread of local governments, as the Panel seems to envisage, would amount to a rates grab (DF60).
I am particularly annoyed with the prospect of our rates being pooled and spent in areas over which Nedlands ratepayers will have no control. We live
188 Metropolitan Governance Roundtable Forum (2012), Metropolitan Governance Roundtable Propositions for Discussion, UTS Centre for Local Government, Sydney 7 June 2012. (Available from CLG)http://www.clg.uts.edu.au/newsandevents/events_2012.html#METRO
189 Sellers, J, Hoffmann-Martinot, V (2008), Metropolitan Governance, in United Cities and Local Governments, World Report on Decentralization and Local Democracy, p. 268, Washington, D.C: World Bank
120 | P a g e

Metropolitan Local Government ReviewFinal Report of the Independent Panel - July 2012
in this area because we worked our butts off to get here and even though self-funded retirees pay outrageous amounts of tax a great deal of which is squandered. Larger local government councils will mean our rates will be siphoned out of our community. Very very unhappy with that prospect (DF20).
Larger local governments have a greater capacity to absorb the burden of changing demographics (i.e. an ageing population). Smaller local governments have a limited opportunity to grow and increase their population diversity. As individuals retire and reduce their household expenditure as income reduces, the need of the local government to sustain its services will remain the same. In contrast, larger local governments tend to have a more diverse rating base and a greater diversity within their demographic profile.
Not all residents have equitable level of access to services, both within and across local government boundaries. But the Panel is of the view that the larger local governments in Perth will help the equitable delivery of services. For example, the Panel was advised by the Library Board of WA that:
The extent and nature of library services varies between local governments creating inequalities of service, differing policies and service offerings leading to confusion for the community who use services across a number of local governments based on their needs. The placement of public libraries, are for the most part, dictated in the first instance by local government boundaries rather than population need, travel patterns, targeted use of resources or other factors (DF159).
There is an intergenerational equity issue as well, as to whether current residents are paying sufficient rates for infrastructure and capital replacement or are they passing on a greater burden to future ratepayers.190 This is a matter for individual local governments to address, but it links to the next benefit from local government reform.
Reducing duplication and better use of existing infrastructureThe Panel has concluded that reform of the local government sector in Perth will reduce duplication in administration and lead to the better use of infrastructure.As well as the obvious savings from a reduction in the number of CEOs and other senior and support staff, there could also be rationalisation of infrastructure and services. Ultimately, the system could deliver less administration and more services to the community.
The Panel notes the decision of the Town of Claremont to spend $1.825 million on a library building after its Town Offices and Library were burnt down in November 2010. Given that there are three other public libraries within a 2.5 kilometre radius of the previous site, including the award winning The Grove facility, it seems that an opportunity to reduce duplication and make better use of existing infrastructure will be lost. This is happening in a region which cites an urgent need to upgrade local government infrastructure (DF109). This observation also seems particularly pertinent given the comments from the Library Board of Western Australia noted previously.
190 Western Australian Local Government Association (WALGA) (2008), The Journey - Sustainability into the Future, Western Australian Local Government Association, Perth, p4 viewed 27 June 2012, http://www.walga.asn.au/LGReform/SystemicSustainabilityStudy/FinalReport.aspxAccess Economics, Local government finances in Western Australia, An assessment by Access Economics Pty Ltd for the Systemic Sustainability Study. June 2006. P33-34 viewed 27 June 2012,http://www.walga.asn.au/LGReform/SystemicSustainabilityStudy/SSSPanelReport.aspx
121 | P a g e

Metropolitan Local Government ReviewFinal Report of the Independent Panel - July 2012
Much has been written in recent years about the local government asset management and funding challenge. A number of studies have highlighted concerns about the condition of local government infrastructure. The Size Shape and Sustainability Panel Report, using analysis by Access Economics, identified a $1.75 billion shortfall in infrastructure renewal efforts across the local government sector; although infrastructure backlog ratios for metropolitan local governments were lower than for regional metropolitan local governments.191 With structural reform of local government in the metropolitan area, some rationalisation of local government infrastructure in the region would be possible, with the benefit of reducing the overall asset management burden.
Most local government offices could be retained as customer service centres, but there might be potential to rationalise some facilities. For example, the City of Nedlands’ current office is not part of a local business precinct. While located on a major public transport route, it has relatively poor parking, so it might be considered a surplus asset in a larger western suburbs council. That would be a matter for the new council to decide.
The Queensland SSS program argued that there was potential to rationalise operating assets including plant and equipment, workshops and depots, administration centres and office technology.192 The Queensland Treasury Corporation substantiated the actual savings (as well as costs) from the 2008 mergers for those local governments that submitted information on benefits.193
Experience elsewhere in Western Australia and Queensland has shown that the amalgamation of local governments has led to a reduction in the number of senior managers, but an increase in the number of local government employees dealing directly with the community. In the Albany case, amalgamation eliminated the duplication of staff positions such as CEOs, finance, planning and engineering directors, but enabled the employment of specialist staff including a recreation planner, community development officer, Aboriginal community development officer and youth development officer.194
The recent independent review of local government in Southern Tasmania recommended the formation of a City of Greater Hobart, based on the view that similar benefits would accrue. The savings could be used to employ people with skills that are beyond the resources of individual councils as presently structured.195
To sum up, as one respondent said, ‘gone will be the days of considerable wastage and duplication which is currently alive and well’ (DF26).
191 Western Australian Local Government Association (WALGA) (2008), The Journey - Sustainability into the Future, Western Australian Local Government Association, Perth, p9. viewed 27 June 2012, http://www.walga.asn.au/LGReform/SystemicSustainabilityStudy/FinalReport.aspx192 Local Government Association of Queensland (LGAQ) (2005) The size, shape and sustainability kit, viewed 27 June 2012, http://lgaq.asn.au/web/guest/library
193 Queensland Treasury Corporation (2009) Review of Local Government Amalgamation Costs Funding Submissions – Final Summary Report, viewed 27 June 2012, http://www.dlgp.qld.gov.au/resources/report/local-government/review-local-government-amalgamation-costs.pdf194 Local Government Advisory Board (2006) Ensuring the future sustainability of communities, p.78. Available on the Department of Local Government website: http://dlg.wa.gov.au/Content/LG/AdvisoryBoard/StructuralElectoralReform.aspx195 Independent Panel to the Southern Tasmanian Councils Authority (2011), Independent Review of Structures for Local Governance & Service Delivery in Southern Tasmania, p 13, viewed 28 June 2012, http://stca.tas.gov.au/future/wp-content/uploads/2011/11/Structural-Project-Final-Report.pdf
122 | P a g e

Metropolitan Local Government ReviewFinal Report of the Independent Panel - July 2012
A streamlined regulatory environment with greater transparency, simplicity, consistency, and certainty with attendant cost savingsThe Panel has concluded that reform of the local government sector in Perth will contribute to a more streamlined regulatory environment with greater transparency, simplicity, consistency and certainty with attendant cost savings.
The Western Australian Parliament is responsible for legislation and the State Government through its Ministers, is responsible for regulation. Local governments play a role in enforcing legislation and regulations and can make local laws where empowered to do so. While it is has been suggested that it is up to the State Government to provide a more streamlined regulatory environment (DF151), the Panel is more concerned about the different interpretations to implementation and enforcement by the 30 local governments in the metropolitan region.
Similarly, there was concern expressed that simplifying regulation clutter will result in removing checks and balances (DF166). That is not what the Panel believes is required. It is about a more consistent approach to implementation.
For example, there are differences in the detail and interpretation of requirements and conditions for building developments across the 30 local governments in Perth. Despite operating within a standard legislative framework, there is significant inconsistency in the application of development conditions between local governments.
The Urban Development Institute of Western Australia stated ‘many local governments whilst operating within previously endorsed planning strategies/policies, have over time developed within their own town planning schemes, as well as in terms of their local planning practices, significant variations in terms of development standards, structure plan requirements, etc.’ (DF160). As another review participant said, there are effectively 30 rule books and this makes it difficult for businesses that deal with multiple local governments.
Streamlining requirements is not about clearing the way for developers to proceed with unfettered development. It is about giving builders and developers more certainty and consistency, which is likely to translate to savings for the consumer. A similar argument can be used for a number of sections of the business community, such as food and hospitality. Greater consistency in matters such as eating house standards, traffic management, parking and signage requirements will benefit all businesses. A more consistent regulatory environment will also encourage further investment.
As well as the costs to business, there are the costs to State Government and local government (and ultimately, tax and rate payers) as well. The cost of maintaining 30 different Town Planning Schemes (TPSs), for example, is significant. Each local government dedicates resources to creating and implementing its TPS. Many do not then have the resources to review these schemes as required by law. It is understood that the Department of Planning applies considerable resources to monitor and review each TPS. Many local governments, whilst operating within previously endorsed planning strategies, have over time developed significant variations in development standards, local planning practices and structure plan requirements.
The resources dedicated by both State and local governments to this highly fragmented and complex planning system could be directed elsewhere. Fewer local governments would ultimately result in fewer planning schemes. Beyond cost
123 | P a g e
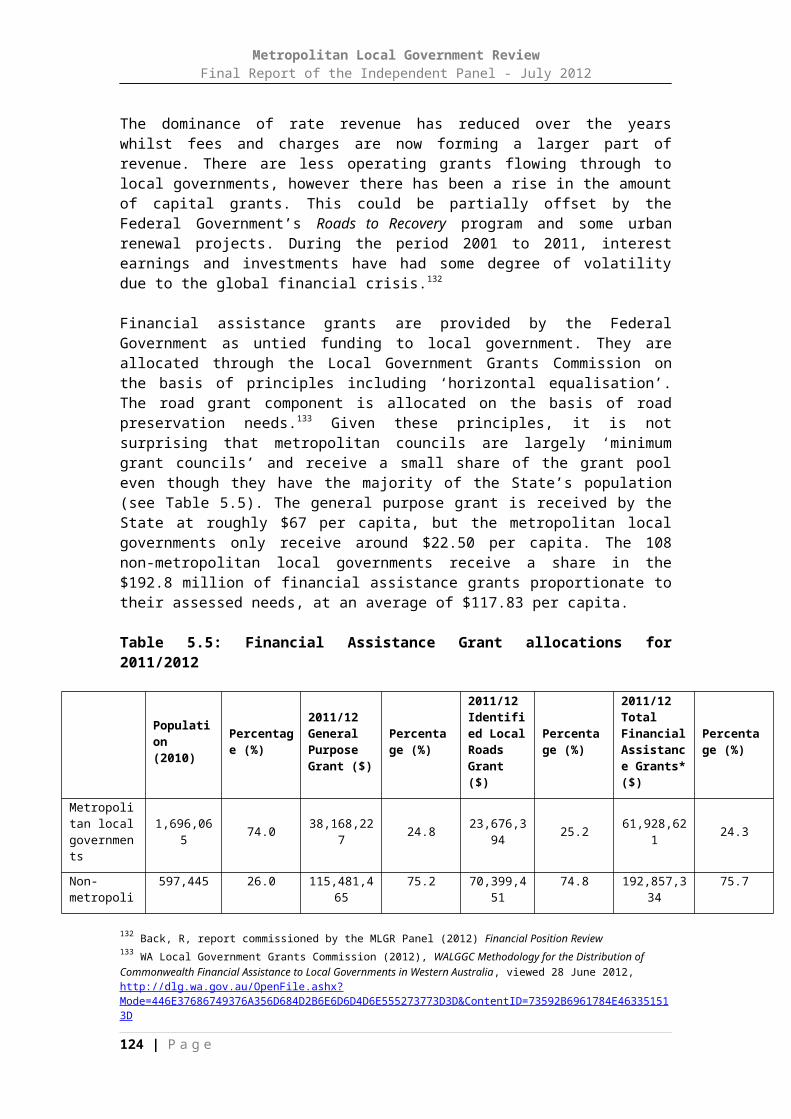
Metropolitan Local Government ReviewFinal Report of the Independent Panel - July 2012
efficiencies, the benefit of a simplified planning system is greater consistency for business and the community.
The lack of consistency has been noticed through a review done by Shelter WA of Local Planning Schemes. The somewhat 30 different local governments have different views and different commitments, especially in terms of housing affordability. What was noticed is that many are in different stages of policy development and some having hardly anything in terms of concrete objectives. On the other hand some have documents which are outdated and cannot facilitate new sustainable development (Greive & McKenzie, 2009). The changes proposed will hopefully allow for a more consistent vision, in terms of better community outcomes, including affordable housing (DF107).
Ideally, there should be clear rules for everybody. The community of metropolitan Perth is not so different that we need so many different sets of local laws, conditions and schemes. The large number of councils in Perth makes it difficult for the private and government sectors to work with local governments, and ultimately the community is the loser.
A subsidiary benefit of amalgamation that it could also reduce compliance costs for people dealing with the amalgamated Council as multiple sets of bylaws, plans and other policies would over time be replaced with a single set.196
The Productivity Commission has found that consolidation of local government regulatory functions has the potential to address the burden for business, particularly where there is duplication or inconsistency across local government areas and inadequate capacity to make or administer regulation. The Productivity Commission found:
‘reducing regulatory inconsistency or duplication amongst neighbouring local governments, thereby reducing the compliance costs for businesses who operate in more than one local government area
improving the capacity and capability of local governments to effectively carry out their regulatory functions, including making more efficient regulation and providing good quality regulatory services to businesses.’197
The gains from addressing regulatory efficiency objectives are not necessarily felt directly by local governments, but are realised by the community. The Panel believes having fewer local governments will also make it easier for local governments to work in partnership with each other.
From a planning perspective a reduction in the number of Local Government Authorities would assist the Department in its planning process when identifying sites that cross multiple municipal boundaries. Correspondence with a single authority could increase development approval rates relating to school sites.
196 McKinlay Douglas Ltd, Warringah Council (2011), Local Government Reform: Have your say, viewed 26 June 2012, http://yoursaywarringah.com.au/LGovreform197 Productivity Commission (2012), Business Regulation Benchmarking: Role of Local Government as Regulator, Draft Report, p. 203, viewed 27 June 2012, http://pc.gov.au/__data/assets/pdf_file/0013/116032/local-government-draft.pdf
124 | P a g e
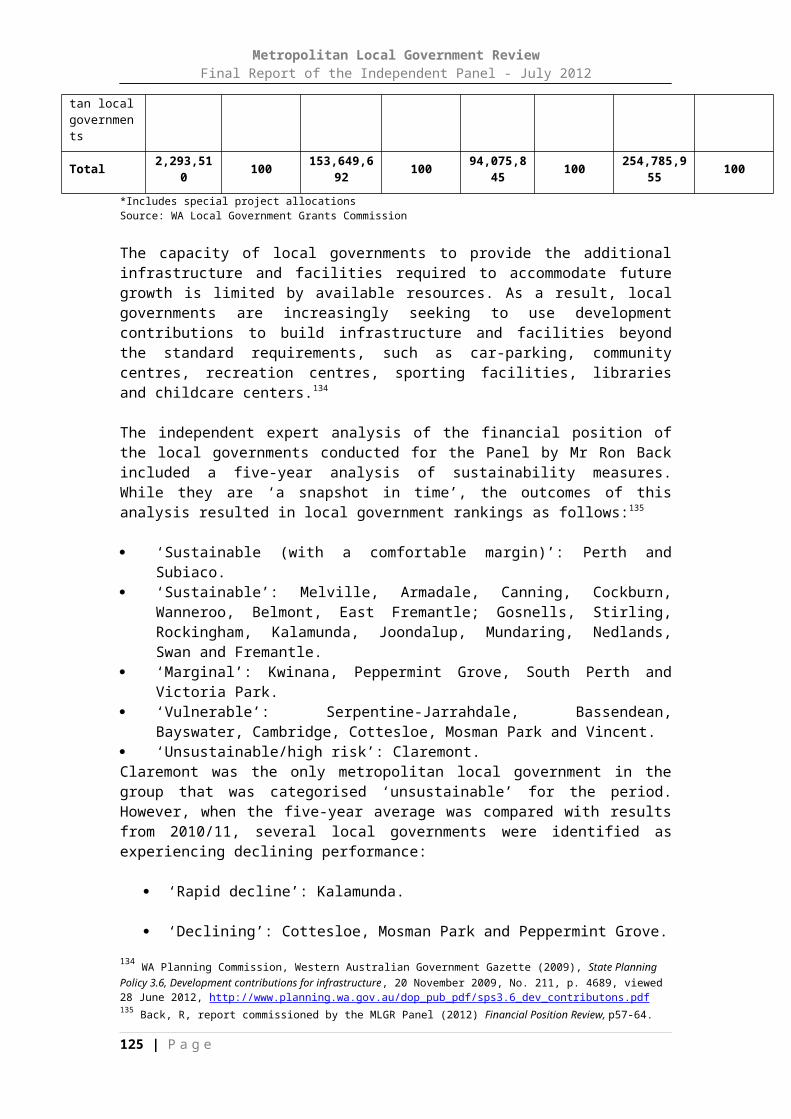
Metropolitan Local Government ReviewFinal Report of the Independent Panel - July 2012
Larger Local Authorities, particularly in development areas, also assist the Department in Ongoing liaison on planning matters. The Department has set up formal liaison groups with the City of Wanneroo and the City of Swan that have significantly benefited ongoing planning processes and outcomes. A reduction in Local Authorities would assist, in mapping school site local intake boundaries with the possibility of less catchment boundaries overlapping those of Local Governments. The Department supports the proposed reduction in Local Government Authorities (DF192).
Potential for achieving greater economies of scale The Panel has concluded that there is potential for economies of scale to be achieved through the proposed new local government structure. The Panel notes the mixed evidence on economies of scale (for example, see DF109), but has come to the view that there are potential economies which should not be discounted.
Various studies have focused on economies of scale in local government. For example, research undertaken by Deloitte Access Economics in 2011 looked at all councils in Australia, and found clear evidence of economies of scale with larger populations.198 There are views, canvassed in the literature by academics such as Professor Brian Dollery, that amalgamation of local governments yields little or no financial benefits and that the benefits of amalgamation can be obtained from other means of collaboration.199 Other research has found strong links between consolidation and increased strategic capacity, efficiency and economies of scale, service improvement and innovation. 200
While the Panel has concluded that economies of scale are potentially achievable, the actual outcomes will vary with each service. There are other intervening variables that can affect the result, such as the standard of leadership and management provided by the Mayor, council and CEO. As noted above, the City of Rockingham has made the linkage between outcomes and the attributes and performance of the people involved, both at an elected and professional officer level (DF 145).
The recent discussion paper on reform produced by Warringah Council in metropolitan Sydney noted that ‘economies of scale are a function of individual services, not of councils as such. Some services achieve full economies of scale at a neighbourhood level; others not until they are serving an entire region. It's the latter which offer the best potential for reduced costs.’’201
The Tasmanian division of the Property Council of Australia commissioned work by Deloitte Access Economics to consider this issue in detail. As this work is among the most recent in Australia, it is worth quoting from their report:202
… if well conceived and effectively managed, efficiency gains in the order of 10% to 20% of operating expenses are achievable from local government
198 Deloitte Access Economics (2011), Local government structural reform in Tasmania, Deloitte Access Economics described the distinction between economies of scale, economies of scope and economies of specialisation.199 See for example Dollery, B and Crase, L, ‘Is Bigger Local Government Better? An Evaluation of the Case for Australian Municipal Amalgamation Programs’, Urban Policy and Research, vol. 22(3), p. 265-276, 2004200 See for example Aulich, C et al (2011), Consolidation in local government: a fresh look. Volume 2: Appendices, May 2011, Available from the Australian Centre of Excellence for local government website: http://www.acelg.org.au/ 201 McKinlay Douglas Ltd, Warringah Council (2011), Local Government Reform: Have your say, viewed 28 June 2012, http://yoursaywarringah.com.au/LGovreform202 Property Council of Australia, Tasmania (2011), Local government structural reform in Tasmania, p. 22, viewed 28 June 2012, http://www.deloitte.com/assets/DcomAustralia/Local%20Assets/Documents/Industries/Government%20Services/Public%20Sector/Deloitte_Local_Govt%20Structural_Reform.pdf
125 | P a g e

Metropolitan Local Government ReviewFinal Report of the Independent Panel - July 2012
structural reform in Tasmania. However, econometric analysis suggests that the gains could potentially exceed this…. Indeed, under a stylised reform scenario modelled in this report, whereby 12 councils in the state’s south are consolidated into a single council, the analysis finds that:• Efficiency gains of up to 35% could be achieved.• Based on the operating expenses of these councils in 2009‐10, a $110 million annual saving in the aggregate cost of administering local government across these regions could be realised.
While these figures should be regarded as a hypothetical optimum, they nonetheless illustrate the magnitude of the potential gains which are achievable if the experiences of local government elsewhere in Australia can be effectively translated to the Tasmanian context.
The findings of the analysis suggest that the provision of local government services in Tasmania exhibits economies of scale. That is, per‐capita operating expenses are lower in larger councils. …. the modelling suggests that when all of Australia’s local governments are taken into account, there is clear evidence of economies of scale.
The estimated savings reflect the Tasmanian situation, and cannot be directly applied to Perth. However, the general conclusion about the potential for savings is strong.
The economies of scale to be achieved from amalgamation are often compared with benefits to be achieved by resource sharing or shared services. Many councils in Perth have entered into agreements for the provision of some services on a shared basis. However, such arrangements are dependent on relationships and may not be robust enough to see long-term benefits. The ability of resource sharing arrangements to assist local governments in tackling emerging challenges ‘‘depends in the first instance on the scope and durability of those cooperative arrangements.’’203 A shared services strategy offers opportunities of achieving short- to medium-term savings, but experience with shared services generally suggests it can be very difficult to gain the full benefit over the long haul. This could be because individual councils within a shared services arrangement will have different preferences and priorities.204
While the Panel believes there is potential for economies of scale to be achieved in some services in some areas of Perth as a result of structural reform, the Panel’s case for change is built on diverse grounds. Achieving economies of scale is not the primary rationale for reform. Given the critical issues for Perth’s local government sector, shared services and resource sharing will not deliver what is required.
Increased influence with State and Commonwealth governmentsThe Panel has concluded that the proposed new local governments will have increased influence with State and Commonwealth governments.
It is difficult for the State and Commonwealth Governments to work with multiple local governments. The latter, in particular, prefers to deal with larger local governments that cover large populations.205 While many of Perth’s local governments use regional
203 Aulich, C et al (2011), Consolidation in local government: a fresh look, Volume 1: Report, p. 23, viewed 27 June 2012, http://www.acelg.org.au/upload/Consolidation%20Final%20Report%20Vol%201_web.pdf204 McKinlay Douglas Ltd, Warringah Council (2011), Local Government Reform: Have your say, viewed 28 June 2012, http://yoursaywarringah.com.au/LGovreform205 It is understood that the recently announced Queensland allocations of the Regional Development Australia Fund all went to new councils formed in the recent restructuring. (8 projects receiving $33.6 million) http://www.regional.gov.au/regional/programs/rdaf.aspx
126 | P a g e

Metropolitan Local Government ReviewFinal Report of the Independent Panel - July 2012
groupings of councils to lobby for State and Federal government grants, there would potentially be increased access to government agencies from having fewer local governments in the Perth region.
It would appear that larger (and fewer) amalgamated councils are more likely to be engaged as partners with state or national governments in regional planning or governance arrangements, and to be able to exert real influence. 206
Other experts agree it is ‘hard to dispute this contention’ (DF 109).
The City of Vincent acknowledged:
Many local governments in Western Australia miss out on Commonwealth funding for services and infrastructure because they’re too small to compete for grants. For those areas reliant on grants to provide basic services, amalgamation will provide a larger and more certain pool of funding, allowing councils to plan with confidence for the future (IP111).
Submissions to the Panel said that local government has little influence on the big issues for metropolitan Perth (IP 243), but this is a reflection of the current structure. Under the new structure, this influence could be greater. On the other hand, another respondent suggested that the ‘mega councils’ might become ‘mega obstacles’ to governments (DF 144).
The fragmentation of local government in the Perth region may be of little importance in terms of metropolitan outcomes although their sheer number impairs their ability to collaborate or negotiate with the state government and their limited fiscal and organizational capacity could certainly affect their ability to enhance community wellbeing as local place shapers and place managers.207
The Panel’s finding is that larger councils will be more likely to be engaged as partners by State or Federal agencies, and will be more able to exert influence when dealing with other levels of government. This influence could extend to increasing funding, as the recent Queensland experience has shown.
Achieving metropolitan-wide social, economic and environmental goalsThe Panel has concluded that reform of the local government sector in Perth will contribute to achieving metropolitan-wide social, economic and environmental goals of prosperity, environmental sustainability and social justice.
The primary responsibility for many of the critical issues facing metropolitan Perth rests with the State Government and its agencies, but local government frequently plays a major role in facilitating services and representing community views. Nevertheless, the large number of small local government areas in metropolitan Perth restricts the ability to effectively deliver positive whole-city outcomes in a coordinated way. The nature and scope of contemporary public problems frequently transcend local government boundaries, and require a strategic response. The metropolitan area is so closely tied together economically, socially and structurally by daily movements and activities that virtually every problem involves a ‘spill over’ between adjoining local government areas.
206 Aulich, C et al (2011), Consolidation in local government: a fresh look, Volume 1: Report, p.10, viewed 27 June 2012, http://www.acelg.org.au/upload/Consolidation%20Final%20Report%20Vol%201_web.pdf207 Sansom, G, Dawkins, J, & Tan, S (2012) The Australian Model of Metropolitan Governance: Insights from Perth and South East Queensland, p. 31, UTS: Centre for Local Government, University of Technology, Sydney
127 | P a g e

Metropolitan Local Government ReviewFinal Report of the Independent Panel - July 2012
At present, due to the number of players involved in Perth’s urban planning, policies are overly complex and do not allow for a strategic, holistic approach to big issues. In addition, the development of strategies to implement planning policies is time consuming, due to the number of parties required to participate in negotiations. While the State Government provides planning frameworks to address its objectives (such as those stated in Directions 2031), the planning capacity and capability to implement them varies greatly across the metropolitan area. As reported to the Panel, there is serious concern from a number of sources about the ability of some local governments to make appropriate decisions.
A new local government structure would provide support for the achievement of the strategic planning goals within Directions 2031. For example, as a growing city, there is the need for substantial raw materials to build the city. Existing sites that provide the basic raw materials of sand, clay and gravel are threatened by urban encroachment.208 The Department of Minerals and Petroleum supported the need for some functions to be managed from a metropolitan-wide perspective, citing that it is essential for access to these resources to be secured for the benefit of the wider community (DF 171).
As the Committee for Perth noted, fragmentation within the region directly undermines the ability to achieve regional-level goals:
fragmentation has a direct negative impact on our ability to address challenges associated with population growth, the need for housing diversity, including higher density housing, social inequity, integrated transport and urban sprawl (IP53).
These challenges would be more easily addressed in a unified region with fewer local governments.
The recent independent review of local government in southern Tasmania recommended the formation of a City of Greater Hobart, based on the view that similar benefits would accrue.
It is highly likely that more unified local government for the Greater Hobart region in particular would result in more efficient and effective strategic and land-use planning, more effective coordination and promotion of economic and community development strategies, better coordination of infrastructure usage and planning, and more effective tourism promotion and marketing efforts.209
Related to the potential to achieve metropolitan-wide goals is the need to have a representative body to speak for Perth. Metropolitan Perth lacks a voice that represents it as a whole. Elsewhere in Western Australia, the Regional Development Commissions promote their respective regions, operating under a State Government framework, but there is no such organisation for the Perth region. Similarly, Regional Development Australia (RDA) is the Commonwealth Government’s mechanism to provide a strategic framework for economic growth in each region. While RDA Perth has representatives from local government, it operates within a federal policy framework, and for this reason it has limited traction with the State Government.
208 Western Australian Planning Commission (2010), Directions 2031 and beyond – Subregional Strategy, draft for public comment, p. 51, viewed 28 June 2012, http://www.planning.wa.gov.au/publications/826.asp209 Independent Panel to the Southern Tasmanian Councils Authority (2011), Independent Review of Structures for Local Governance & Service Delivery in Southern Tasmania, p. 13, viewed 28 June 2012, http://stca.tas.gov.au/future/wp-content/uploads/2011/11/Structural-Project-Final-Report.pdf
128 | P a g e

Metropolitan Local Government ReviewFinal Report of the Independent Panel - July 2012
On some stages, the Lord Mayor of the City of Perth speaks for a larger area than the actual City. However, without a regional voice, the communities outside of the City of Perth will have a limited influence. The role of the Mayor of a large city is significant because of the advocacy role associated with it, and that the Mayor can be seen as the ‘‘spokesperson’’ for a city. In the new local government structure for metropolitan Perth, a forum or council of Perth Mayors, chaired by the Lord Mayor, should be formed.
This would be similar to the South East Queensland (SEQ) Council of Mayors, referenced previously. The Outer Metropolitan Growth Council already operates in this manner, but its membership only comprises the Councils of Armadale, Cockburn, Gosnells, Kwinana, Mandurah, Rockingham, Serpentine-Jarrahdale, Swan and Wanneroo. The South West Group for the south-west corridor and the C21 policy forum of WALGA for the Swan-Canning river system are also similar, but each group is only addressing one part of the metropolitan picture. There would be benefit in having a body to provide and strong, effective and united voice for the whole metropolitan region. It would encourage and facilitate further regional collaboration.
As such, the Panel considers that establishing a defined role, targets and performance measures for the Forum of Mayors would be key to ensuring that the new grouping is an efficient and effective voice for the metropolitan area.
Although the Panel believes there is merit in a representative body for Perth, this on its own should not be a substitute for structural reform.
5.4.2 Community and representation
The ability of local government to connect to the community is a most important asset, and the Panel believes this would not be lost in a structure comprised of larger local governments, provided robust community engagement methods are developed and resourced. The Panel also believes good community engagement is possible in local government, regardless of size. Small size is no guarantee of good engagement, and large size is no barrier.
Overall, there is a need for local governments to increase the extent and effectiveness of their community engagement approaches. Given that loss of representation and reduced access to elected members is a fear expressed by many community members, community engagement will need to be significantly greater in a new structure. Development of a formal community engagement network, including adoption of a place management approach, with new institutional arrangements and structures, will ensure adequate community engagement and access to council.
Community engagement is a significant part of what constitutes good governance in a democratic system; it is about facilitating community involvement in council decision making. Under the Integrated Planning Framework, local governments are required to have a Strategic Community Plan. This plan establishes the community’s needs and aspirations through consultation. Community engagement methods will be of increasing importance as local governments apply the new framework. The outcomes of the current process of community planning will not be lost in a restructuring of local government. It just means that the representatives from those areas in the new arrangements will have a solid foundation for advocating the needs of their communities.
129 | P a g e
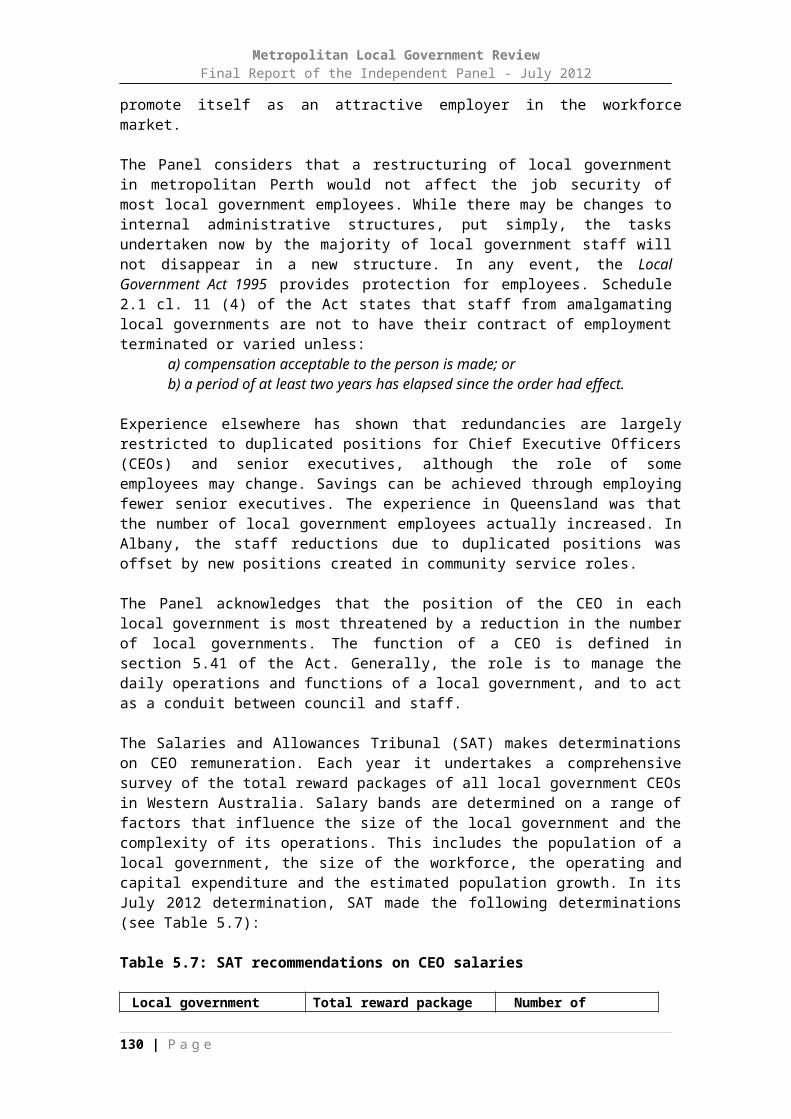
Metropolitan Local Government ReviewFinal Report of the Independent Panel - July 2012
Under the Local Government Act 1995, local governments can utilise mechanisms such as community advisory committees, precinct committees or area management committees to engage with their communities. Jurisdictions elsewhere utilise other means including Community Councils in Scotland, and Local Boards in Auckland. The Panel received submissions (IP133 and DF111), extolling the precinct system of open participatory government, and this too has its merits. For example, it was suggested that the precinct system would strengthen engagement and ‘dissolve special interest groups (from dominating Local Councils)’ (DF 186).
Auckland council has 21 local boards. Such boards have the capacity to provide a local voice, based on local communities of interest. Local boards are given the same purpose as local authorities, but are unincorporated bodies and not local authorities or committees of the governing body. They are not able to acquire, hold or dispense property or appoint or remove employees. The boards must communicate with community organisations, and may exercise powers delegated by the governing body and consider and report on any matter of concern. Local boards prepare plans with a three year focus which are critical to the functioning of the boards and included in council Long Term Plan. They include default levels of service for local activities and any proposed variations, together with an estimate of the cost or saving resulting from the variation. Having a large number of local boards may create new difficulties in coordination and transaction costs. A key challenge is determining how to balance the demands for enhancing local board areas with the demands of providing for a vibrant metropolitan city.210
The Panel was encouraged by what it saw in the place management approach used by the City of Swan and others. Place management is a mechanism for a local government to communicate with multiple communities within one area, and tailor services to suit each of them. It involves creating a partnership with a community, and working with them to offer solutions that suit their unique aspirations.
In a council organisation that has fully adopted an effectiveness, efficiency and fairness structure, place management should apply to the whole of the council area, not just to redevelopment or dysfunctional areas, or the promotion of retail centres, although these localities are likely to be the centre of concentrated attention. Place management is a method of general rather than exceptional management.211
Place management is increasingly seen as a solution for governments, especially at the local government level, to improve ‘places’. Place management provides local government with the potential to gain hands-on knowledge of their community and tailor service delivery to particular needs. The concept can be particularly useful in the context of creating larger local governments.
A number of programs have been adopted in Victoria, under Melbourne 2030 in which 13 cities have embraced place management methodologies as part of the long-term plan for managing Melbourne's growth.212 While the concept has been employed to deal with short-term crisis situations on an ad hoc basis, the concept is also being applied to longer-term governance structures, such as in the City of Swan. The primary objective of this initiative for Swan is to ensure that the organisation is
210 Institute of Public Administration New Zealand, Auckland One Year On Conference - 13 December 2011
http://www.ipanz.org.nz/Category?Action=View&Category_id=139211 Mant, J (2011), ‘A reformed local government’, Local Government Law Journal, p. 136, vol. 16, part 3, Dec 2011212 Department of Planning and Community Development, Victoria (2008), Melbourne 2030 Activity Centre and the Role of Place Management, viewed 28 June 2012, http://www.dpcd.vic.gov.au/__data/assets/pdf_file/0012/43203/Role_of_Place_Management.pdf
130 | P a g e

Metropolitan Local Government ReviewFinal Report of the Independent Panel - July 2012
working in a cross-functional and integrated manner in its planning and delivery of services, programs and infrastructure unique to ‘place’. The City feels place management enables them to have a greater understanding of local culture, needs, aspirations and identity in such a large and diverse council area. It allows the City to tailor assistance and services to suit specific needs. The scheme works internally across the City and provides a platform for different departments to work in unison. This creates a coordinated approach to service delivery, saving time and money. The five place offices provide the public with a single point of contact and a clear system of communication. The place offices can evolve as community hubs, collocated with State and local government services.
Consideration must be given to community engagement through new and evolving media. In the future, and particularly for the emerging generations, community engagement will increasingly occur online (IP246 ). Examples of creative use of technologies that other jurisdictions have established include:
E-panels, such as the Metro Portland Opt In online panel (http://www.oregonmetro.gov/index.cfm/go/by.web/id=35824).
Online reporting modules such as See Click Fix (http://www.seeclickfix.com/) in use in approximately 25,000 towns in the USA.
Phone apps such as the City of Port Adelaide’s NeatStreets app (http://www.loc-gov-focus.aus.net/index.php?view=editions/2011/march/neatstreets.php) or the pin2fix smart phone app.
Similarly, the Birmingham City Council has embraced transformational change in its approach, including providing its community with online access to virtually everything. ‘The Council wants Birmingham residents to have access to all the information they need in order that they become involved in the council’s work’.213 This is about giving the community access to more information and input to decisions.
Participatory governance and best practice community engagement in the democratic process are an essential part of good government. However, there needs to be caution exercised so that increased community participation does not come at the cost of professional and strategic decision-making. A key element of leadership is making unpopular decisions. A balance needs to be achieved between making decisions on behalf of the community, and allowing the community to make its own. This is part of the challenge of representing the whole community, not just the 5 per cent who may participate in engagement processes. For this reason, best practice models that encourage a collaborative approach, where communities and local governments work together to find outcomes, could be the most appropriate for local government in metropolitan Perth.
5.4.3 The future of regional local governments
In the Panel’s recommended structure for local government in metropolitan Perth it can see little or no need for regional local governments (RLGs) to continue.
In a restructured local government environment, waste management could become a centralised responsibility and the regional councils that currently have waste management as their sole function could be dissolved. The land development activities of the Tamala Park regional council, expected to last another ten years or so, would need to continue under some arrangement. If the RLGs continue in something similar to their current form, the basis for membership would need to be 213 http://www.birmingham.gov.uk/publication-scheme viewed 28 June 2012,
131 | P a g e
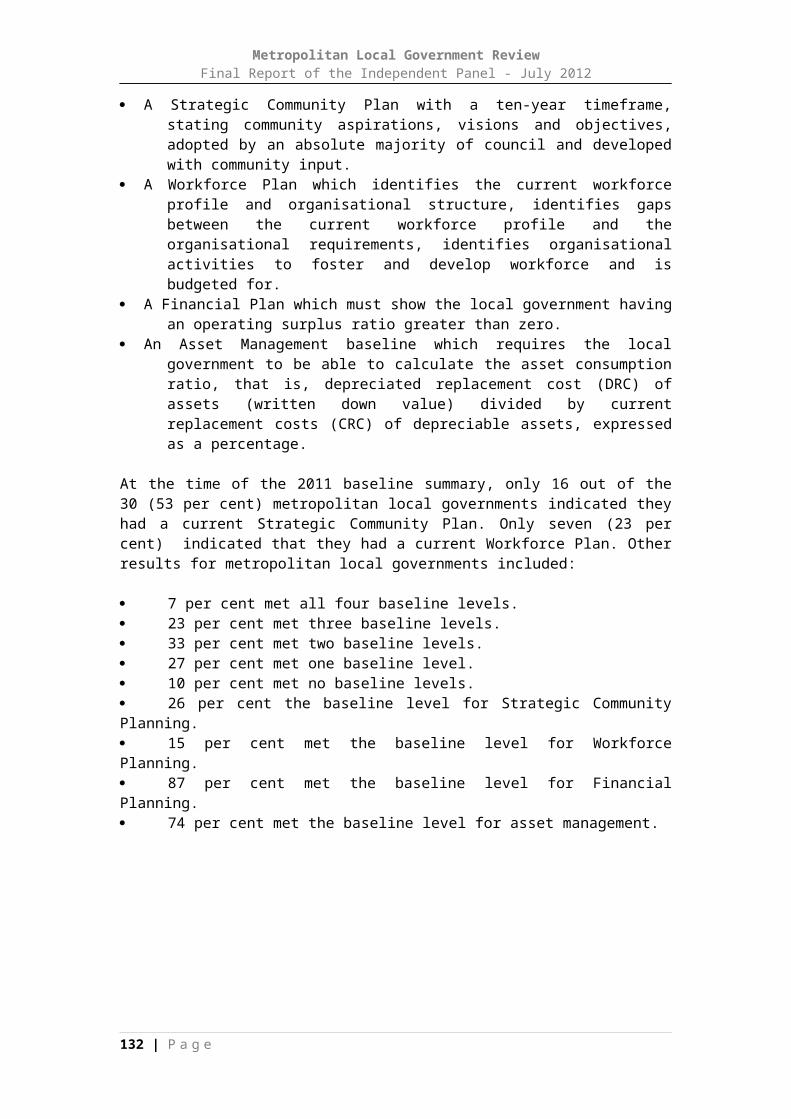
Metropolitan Local Government ReviewFinal Report of the Independent Panel - July 2012
examined. In the interests of regional strategic planning, there should be a strengthened onus on continued membership with less scope for councils to withdraw. The current regional council model operates with flawed accountability, in that there is no direct election of members. Accountability for such functions is best served by directly elected authorities. If RLGs are to continue, this matter requires further consideration.
There would still be a need for voluntary regional groupings of local governments to cooperate on common issues of joint lobbying. The Perth Forum of mayors will be one such body; there may be need for others. In essence, there may be space in Perth’s governance arrangements for regional groupings, but they are not the solution to Perth’s issues.
5.4.4 Potential for Council Controlled Organisations/Local Government Enterprises
Another key area of interest is the scope for local governments to be given greater power to establish and manage local government enterprises (LGEs), or council controlled organisation (CCOs) (such as in New Zealand). The Panel believes this is a reasonable and logical consideration in the context of local government reform. The stronger local governments created as a result of the Panel’s recommendations would have greater capacity to manage LGEs and CCOs. While the operating framework and governance arrangements for these entities would need to be considered carefully, the empowerment of local government could be a benefit of reform.
5.4.5 Institutions
The Panel identified a further consideration related to boundaries, structure, and role. The Panel believes that large institutions such as hospitals, universities and airports should not be split across different local government boundaries, as they are at present. One option is to take the institutions out of local government jurisdiction, similar to the existing situation with Kings Park or Rottnest Island, which both have controlling boards. The developments at the airports, hospitals and universities, could, given their scale, come under the jurisdiction of the MRA.
5.4.6 A process for periodic boundary reviews
An issue considered by the Panel is the need for periodic boundary reviews. These should be undertaken by an independent body, similar to the way the Electoral Commission reviews electoral boundaries. One suggestion was that the role and functions of the LGAB should be reviewed to have a stronger role in the reform process. The Board should be:
required to recommend to the Minister for Local Government any changes to local government boundaries every 8 to 10 years to account for the growing and changing nature of the City … It is important that the reform process should be seen as an ongoing one to take into account the changing needs of a growing Metropolitan Region. 214
214 Conway Davy and Planning Context (2012), Metropolitan Local Government Reform: Development and Analysis of Alternative Models, p. 14, viewed 28 June 2012, http://www.walga.asn.au/downloader.aspx?p=/Portals/0/Templates/Governance_Strategy/712-136%20Metropolitan%20Local%20Government%20Reform%20Models%20(2).pdf
132 | P a g e

Metropolitan Local Government ReviewFinal Report of the Independent Panel - July 2012
The Panel agrees that the changing requirements of the metropolitan region need to be accommodated through a boundary review process. Given the ongoing population growth in both inner and outer suburbs, the Panel believes this should be undertaken on a fixed interval of 15 years to ensure the city’s local government structure is optimal for the changing demographics. This view is consistent with a recommendation of the LGAB in their 2006 report:
…as this review has shown, there has been precious little boundary change in recent decades. While the arrangements under Schedule 2.1 of the Act have been in place for the last 10 years or so, the provisions have not been effective in encouraging or facilitating significant change. The system of leaving it to local governments, and to communities through the proposals to the Board, has had limited impact on the overall structure. 215
Without such a mechanism, the structure is likely to stay the same for too long. These reviews should not be about the population numbers in a local government area, but it should be about ensuring that the boundaries remain relevant as Perth evolves. This is particularly relevant given the expected growth in locations such as Yanchep and Keralup. A new local government may be required in Yanchep in the future, but it is not required at present.
The implementation of changes under such a system would prevent a situation occurring as at the present where the current boundaries are significantly out-dated and out of step with modern communities of interest and modes of communication and transport. 216
As a local government respondent told the Panel, the current process is clunky, and there is a need for a system that is more responsive. Another local government respondent said the current mechanism was not an effective way to undertake reform, with past experience showing that a council opposed to a change distributes propaganda to influence community opinion, such that it becomes a ‘boundary war’ which hinders relationships between neighbours.
With these points in mind, the Panel believes that consideration should be given to instituting a system of periodic reviews of the structure of local government, and of boundaries in particular. Such a review should happen every 15 years.
With this process in place, the LGAB could be dissolved, and the current provisions of the Local Government Act 1995 which provide for polls on amalgamations (the so-called Dadour amendment) could be rescinded, with the proposed Local Government Commission taking over its roles, including consideration of representation reviews.
5.4.7 The size of the City of Perth
The size of the City of Perth emerged as a consideration in the review, especially since the spilt of the former City of Perth into four local governments in 1993. As previously discussed, the Panel believes there is a strong case for increasing the size of the City of Perth and giving it an enhanced role.
215 LGAB (2006), Ensuring the future sustainability of communities, p. 135, viewed 28 June 2012, http://dlg.wa.gov.au/Content/LG/AdvisoryBoard/StructuralElectoralReform.aspx216 LGAB (2006), Ensuring the future sustainability of communities, p. 135, viewed 28 June 2012, http://dlg.wa.gov.au/Content/LG/AdvisoryBoard/StructuralElectoralReform.aspx
133 | P a g e

Metropolitan Local Government ReviewFinal Report of the Independent Panel - July 2012
The City must be of a sufficient size to be a serious national and international player, and to advocate for the whole of the metropolitan area, perhaps even the State. One respondent supported expansion of the City of Perth to a 25 km radius around the CBD (DF179). The Panel does not see the City of Perth as being this large, but it does see a need for it to be larger. This is reflected in the Panel’s preferred model presented below.
By increasing its size, the City will boost its capability and responsiveness, diversify its population, and enhance its international standing. It is, in the words of a respondent, an ‘opportunity to create a capital city worthy of the name’ (DF 24).
5.4.8 The edge of the metropolitan area
The Panel believes there are issues associated with local government around the edge of the metropolitan area. This includes the position of the City of Mandurah. Perth’s continuing growth, together with that of Mandurah, will see the region move into the ‘mega city’ class, as a cluster of contiguous, administratively separate and highly networked centres, similar to Brisbane-Gold Coast-Sunshine Coast and Melbourne-Geelong.
Although Mandurah is not within the Perth metropolitan area and therefore not part of this Review, the Panel received submissions referring to the position of Mandurah. Even the Mandurah community newspaper reported the Panel’s findings. The Panel notes that Mandurah has a strong connection with the metropolitan area and as a strategic activity centre in its own right under Directions 2031, there would seem to be a case for re-examining its boundaries and regional position.
The Panel notes that the future urban expansion area of Keralup spans both Rockingham and Mandurah, highlighting the difficulties of defining boundaries for metropolitan local governments when there is urban spill-over occurring. It seems likely that Mandurah will be the main strategic activity centre to service the future Keralup community. The City of Rockingham’s submission to the Panel foresees a future need for some boundary adjustments between Rockingham and Mandurah, which could bring Singleton, Golden Bay and portions of Keralup into the control of the City of Mandurah (DF145).
The Panel has also seen issues with the edge of the metropolitan area as it abuts the Shire of Murray. In its preferred model below, it is proposing a transfer of a portion of the southern part of the current Shire of Serpentine-Jarrahdale to the Shire of Murray. This proposal may best be considered in the context of a more thorough review of the local government structure of the Peel region.
In time, there may be other issues associated with the edge of the metropolitan area, but they should be addressed through the periodic review process proposed above.
5.5 THE PANEL’S PREFERRED MODEL: RECOMMENDATIONS ON NEW LOCAL GOVERNMENT BOUNDARIES
As foreshadowed above, the Panel’s preferred option is a structure of 12 local governments in metropolitan Perth.
134 | P a g e

Metropolitan Local Government ReviewFinal Report of the Independent Panel - July 2012
This model provides an opportunity for alignment with the ten strategic activity centres identified in Directions 2031: Armadale, Cannington, Fremantle, Joondalup, Midland, Morley, Perth, Rockingham, Stirling and Yanchep (proposed). The Panel has identified two secondary centres, Claremont and Cockburn, to complement the primary activity centres and to fill what might be considered to be ‘voids’ between the centres of Perth and Fremantle, and Fremantle and Rockingham.
The Panel believes these ten activity centres and two secondary centres are a logical basis for the new local government entities. By being focused on an activity centre, in addition to its support for the communities within its district, each local government would be working for the success of that activity centre which would more effectively link the strategic directions of State and local government. The centres will also be the focus for Perth’s future development, further making the case for each centre to be the hub for local government. The 12 local government model supports the aims of Directions 2031 by aligning regional, sub-regional and local planning and the roll-out of infrastructure, development of greenfield land, facilitation of infill development, and the development of transport networks. The 12 local governments created under this model would have an average population in 2026 (based on the projections Table 3.1) of around 190,000.
The Panel notes that this option was supported by the local governments of Bayswater, Fremantle, Joondalup, Rockingham, Stirling and Swan, all of which are the location of current strategic metropolitan centres.
The Panel has considered a comprehensive range of information in arriving at its recommendation on the final structure and boundaries. It has reflected on, but is not bound by, the factors prescribed by Schedule 2.1 of the Local Government Act 1995 that the LGAB takes into account when making boundary changes. In addition, anticipated population growth, the financial viability of the proposed local governments, communities of interest, transport and topographic features have been particular considerations for the Panel. The size of the proposed local governments is also geared towards increasing strategic capacity across the sector.
5.5.1 A new structure and boundaries for local government in metropolitan Perth
The Panel examined two options for the arrangement of the proposed 12 local governments. The first option (A) was based on a straight amalgamation of existing entities. The second option (B) involved splitting some local government areas to create more strategically focussed boundaries.
During the consultation phase, the Panel received advice that splitting local governments should be avoided, in favour of amalgamating existing local governments without adjusting their boundaries. The added complexity of splitting local governments, in terms of asset rationalisation, debt allocation, land transfers and contract management, were presented as reasons to avoid splitting local governments.
However, the Panel concluded that the second option was preferred as it is both more strategic and will result in more well-founded and balanced local government areas. This model also provides the opportunity to address some of the current boundary anomalies and inconsistencies. The Panel has noted the added complexities of this option, and acknowledges it will be more difficult to implement. Nevertheless, the Panel still considers this to be achievable and has come to the judgement that the complexities are not insurmountable. In order to better meet the
135 | P a g e

Metropolitan Local Government ReviewFinal Report of the Independent Panel - July 2012
needs of the community in the long term, splitting local governments will be necessary.
While not optimum, the first approach is still acceptable. If this approach is adopted by government, then it should be seen as a first step only, as further work would need to be done in the future to refine the boundaries for a more strategic fit.
The two 12 model options are discussed in further detail below.
136 | P a g e

Metropolitan Local Government ReviewFinal Report of the Independent Panel - July 2012
Figure 5.3: Option A: Amalgamations only
137 | P a g e

Metropolitan Local Government ReviewFinal Report of the Independent Panel - July 2012
Table 5.10: Option A Amalgamations only
Strategic Metropolitan Centre(local governments included)
Population 2011
Population(projected)2026
Total Rates Levied(2009/10)
Total Operating Expenditure (2009/10)
7 Armadale (Armadale, Serpentine- Jarrahdale) 82,679 131,700 40,071,583 72,555,332
11 Cannington(Canning, Gosnells) 198,920 244,700 77,719,086 145,803,790
2Claremont*(Cambridge, Claremont, Cottesloe, Mosman Park, Nedlands, Subiaco, Peppermint Grove)
80,043 86,200 51,837,313 90,727,578
9 Cockburn* (Cockburn) 94,003 131,000 40,122,744 82,665,314
10Fremantle(East Fremantle, Fremantle, Melville (includes Rottnest))
140,901 146,800 75,891,170 137,508,600
4 Joondalup (Joondalup) 167,634 188,400 62,789,709 107,723,161
6 Midland(Swan, Mundaring, Kalamunda) 212,299 283,300 97,449,641 166,192,290
12 Morley(Bassendean, Bayswater, Belmont) 113,606 125,100 58,402,498 108,126,062
8 Rockingham(Kwinana, Rockingham) 138,455 224,800 56,051,946 139,520,833
1Perth(Perth, South Perth, Victoria Park, Vincent)
147,969 198,500 132,270,721 259,724,654
3 Stirling (Stirling) 205,961 236,200 88,718,467 159,963,1295 Wanneroo** (Wanneroo) 156,337 278,100 71,797,100 123,268,357
* Secondary centre** Based on Wanneroo as a secondary centre, but with future boundary review based on the future growth of Yanchep as a Strategic Metropolitan Centre.
Option A comprises the amalgamation of existing local governments into 12 new local governments, with two points of difference. Firstly, it is proposed that Rottnest Island be incorporated for electoral and other relevant administrative purposes as part of the City of Fremantle, rather than with the City of Cockburn. This has relatively little implication for the island, and Fremantle is the more natural link given the ferry connection and the provision of services through the port.
Secondly, it is recommended that the boundaries of the local governments abutting the Swan and Canning Rivers be extended out to the midpoint of the river, to provide for better control of developments over the river and management of the riverine environment.
138 | P a g e

Metropolitan Local Government ReviewFinal Report of the Independent Panel - July 2012
Figure 5.4: Preferred Option B: Amalgamation and splitting of local government areas
139 | P a g e

Metropolitan Local Government ReviewFinal Report of the Independent Panel - July 2012
Table 5.11: Preferred Option B: Amalgamations and splitting of local government areas
Strategic Metropolitan Centre
Comprising Local Governments
Projected Population2006
Population2011
Population(projected)2016
Population(projected)2021
Population(projected)2026
7 ArmadaleArmadale, with most of
Gosnells, most of Serpentine-Jarrahdale#
157,287 189,569 224,145 258,569 291,569
12 MorleyBassendean,
Bayswater, Belmont, plus part Swan, Stirling
160,789 171,483 176,901 181,572 186,210
11 CanningtonCanning (less Canning Vale) plus part South Perth, part Melville, part Victoria Park
115,681 120,854 127,647 132,769 137,902
2 Claremont*
Cambridge (less West Leederville),
Claremont, Cottesloe, Fremantle (part), Mosman Park,
Nedlands, Peppermint Grove, Subiaco
90,582 94,212 100,988 106,333 110,093
9 Cockburn*Cockburn (less Coolbellup, part
Hamilton Hill, North Lake)
65,750 78,849 92,234 103,351 110,204
10 FremantleFremantle (less part
North Fremantle), East Fremantle, most
Melville, part Cockburn
109,890 118,069 123,639 128,269 132,682
4 Joondalup Joondalup 157,900 167,900 175,600 181,900 188,400
6 Midland
Swan (less Ballajura, Beechboro, Kiara,
Lockridge, Malaga), Kalamunda, Mundaring
145,012 165,858 191,920 220,533 247,024
8 Rockingham Rockingham, Kwinana 111,955 136,595 159,285 181,251 202,312
1 PerthPerth, part Cambridge, part Stirling, part South
Perth, part Victoria Park, Vincent
103,217 116,500 127,721 134,956 143,169
3 StirlingStirling (less Coolbinia,
Dianella (50%), Inglewood, Menora,
Mount Lawley)
157,668 169,147 179,483 188,588 196,321
5 Wanneroo** Wanneroo 115,892 156,329 199,148 237,851 272,216
* Secondary centre** Based on Wanneroo as a secondary centre, but with future boundary review based on the future growth of Yanchep as a Strategic Metropolitan Centre.# Balance of Shire of Serpentine-Jarrahdale to the Shire of Murray.
(The population projections, a broad indicator of the future size of the proposed local governments, have been derived from a combination of sources, including the WAPC publication Western Australia Tomorrow (Population Report No.7, February 2012) and those produced for most metropolitan local governments by the demographic company .id.)
140 | P a g e

Metropolitan Local Government ReviewFinal Report of the Independent Panel - July 2012
Option B is the Panel’s preferred option. Specific features of the proposed arrangements include:
reducing the number of local governments that have a Swan or Canning River foreshore from 21 to 7
reducing of the number of ‘‘hills’’-based councils from 6 to 2
reducing of the number of coastal councils from 11 to 7
linking the western suburbs from Cambridge to Mosman Park, including the addition of North Fremantle
incorporating all portions of the Swan and Canning Rivers to a local government (when some were previously unallocated)
attaching Rottnest to the City of Fremantle (rather than the City of Cockburn).
The Panel is not making recommendations on names for the proposed local governments.
5.5.2 Proposed local government entities
1. Modified City of Perth (name to be determined)
The Panel’s Draft Findings identified a need to increase the size of the City of Perth. This was confirmed throughout the Review.
Under the Panel’s proposal, the City of Perth is extended by amalgamation with the City of Vincent, together with portions of the current cities of Stirling and South Perth and Towns of Cambridge and Victoria Park. Specifically, it would include the residential areas of Coolbinia, Menora, Mount Lawley and Mount Hawthorn and mixed use and commercial areas south of Vincent Street. It integrates Northbridge and surrounds (West Leederville, West Perth and Highgate) with the CBD. The southern area includes the localities of South Perth, Kensington, Como, Burswood, Victoria Park and Lathlain. Inclusion of these localities into the City of Perth will frame the Swan River into a central focus for the City, encompassing the southern and northern foreshores of Perth Water. This is important to the Panel’s proposal and designed to facilitate improved management of the foreshore environment and assets. For perhaps the first time, the City would embrace all of the ‘‘Perth’’ localities – North, South, East and West.
The population of the modified City of Perth is estimated at around 116,500, growing to a projected 143,000 by 2026.
The modified City of Perth encompasses public transport infrastructure servicing the Perth CBD, e.g. freeways, ferry, rail and bus terminals, and the proposed light rail system. The CBD is a major destination and the primary activity centre of the Perth and Peel regions, so planning for the integration of transport will be a key consideration. Transport activities, especially car-parking, CAT bus and ferry services, could be integrated to promote the achievement of transport initiatives, which facilitate the enhancement of CBD activities and the role of the CBD as the capital city of Western Australia.
The Panel understands the boundary changes which split the City of Perth in 1993, however the changes being proposed are not about putting the old boundaries back together. The City that Perth is now a different place to that of the past, and these
141 | P a g e

Metropolitan Local Government ReviewFinal Report of the Independent Panel - July 2012
changes are about creating what is the most strategic boundary for now and the future.
2. New western suburbs local government (name to be determined)
A new western suburbs local government would be focussed on the secondary activity centre of Claremont. It consolidates seven local governments (Cambridge, Claremont, Cottesloe, Mosman Park, Nedlands, Peppermint Grove and Subiaco), with two variations. The locality of West Leederville, currently in Cambridge, would be part of the modified City of Perth. It is also proposed that most of North Fremantle would be included in this new entity. The Panel has considered the evidence of a significant common community of interest across these areas, even in the commonly used appellation of the ‘western suburbs’. The river and coastline provide logical boundaries as they neatly encapsulate these areas that are relatively similar in socio-economic and demographic terms. The proposed western suburbs local government includes a significant expanse of developed residential areas, with some having further potential for residential development and infill, particularly in the transit-oriented developments around railway stations and central shopping areas. The population of the proposed combined western suburbs council is estimated at around 94,000, growing to a projected 110,000 by 2026 This means it would be perhaps the smallest local government (in population terms) under the proposed structure.
Whilst there is not a strategic regional centre in this proposed local government, the Panel is of the view that the secondary activity centre of Claremont occupies a key position between Perth and Fremantle, and provides a commercial focus for further development of these areas.
The proposed local government has a strong base for financial sustainability because of the commercial development dispersed throughout the area, particularly in the centres of Subiaco, Floreat and Cottesloe, together with the strong residential property valuation base (relative to the rest of metropolitan Perth).
This area contains the specialised areas of the University of Western Australia and QEII Medical Centre and would help resolve development, transport and planning issues in the area. This local government provides a basis for a more consistent approach to infill housing, and the rationalisation of town planning schemes and development standards which currently vary between existing councils.
The proposed western suburbs local government will have a stronger focus and more consistent regional approach to managing river and coastal foreshore areas. This will be enhanced through the proposal to extend the boundary out to the midpoint of the Swan River.
As previously mentioned, Stirling Highway is a key transport corridor for the metropolitan region. Together with the Perth to Fremantle railway, which currently runs through multiple local governments, it provides a key spine for the proposed western suburbs council. The existing Primary Regional Roads reservation is currently subject to rationalisation through the WAPC. A single local government would facilitate a consistent approach to planning and development along this important route. There is also the potential for Stirling Highway to be linked with a light rail network, particularly to the University of Western Australia and QEII.
142 | P a g e

Metropolitan Local Government ReviewFinal Report of the Independent Panel - July 2012
3. Modified City of Stirling (name to be determined)
The current City of Stirling is a financially strong and sustainable local government. The Panel’s proposal largely retains the existing City of Stirling, but excises some suburbs in its south-eastern sector. Inglewood and Dianella (east of Alexander Drive) will be assigned to the Morley-focused local government, and Coolbinia, Menora and Mount Lawley will be incorporated into Perth. These areas are considered to have more links in common with the Perth and Morley strategic centres than with the balance of Stirling.
This local government area is focussed on the key activity centre of Stirling, the development of which is currently being progressed through the Stirling City Centre Alliance. It also retains the commercial areas of Karrinyup and Mirrabooka shopping centres, and the Osborne Park and Balcatta industrial areas. The proposed area has a wide range of residential housing and densities with a significant commercial and industrial, so it will continue to be financially strong. The modified area will facilitate an integrated approach to the catchments of the centres and a consolidated approach to housing strategies for the areas surrounding the activity centres. The area will be traversed by the proposed light rail link from Mirrabooka, although its route may in part overlap the proposed boundary (Alexander Drive).
The area provides for the ongoing sustainable management of a number of environmental elements such as Herdsman Lake and the Indian Ocean beaches.
The population of the modified City of Stirling is estimated at around 169,000, growing to a projected 196,000 by 2026. This is lower than the population of the City in its current form with 206,000 and a 2026 projection of 236,000. The City of Stirling will clearly remain a large and sustainable local government into the future. The Stirling City Centre Alliance and the inner city light rail project need strong local government capacity.
4. City of Joondalup
Under the current boundaries, the City of Joondalup has a population of 168,000, growing only slightly to a projected 188,000 by 2026.
No changes are proposed to its boundaries217.
5. City of Wanneroo
Under the current boundaries, the City of Wanneroo has an estimated population of 156,000, but significant growth is expected, rising to 272,000 by 2026.
No changes are proposed to its boundaries, but with the expected population growth it is likely that some changes around the developing strategic centre of Yanchep will need to be considered in a future review.
6. Proposed eastern hills local government (name to be determined)
217 Under both options, the current Cities of Joondalup and Wanneroo are not affected by the Panel’s proposed changes. While this reflects a Panel view that the two existing local governments are sustainable and effective in their current form, more significantly, it reflects the need for the issue of the boundaries to be considered further in future in light of further development in this region generally, and around the proposed strategic activity centre of Yanchep in particular over the longer term.
143 | P a g e

Metropolitan Local Government ReviewFinal Report of the Independent Panel - July 2012
The proposed local government for the eastern hills is focussed on the strategic metropolitan centre of Midland. It is essentially the consolidation of the current City of Swan and the Shires of Kalamunda and Mundaring. However, some localities from the western side of Swan will be transferred to the proposed local government centred on the activity centre of Morley.
This north-eastern quadrant of the Perth metropolitan area is a region of diversity ranging from Bullsbrook in the north, Mundaring with its hills villages to the east, the hills suburbs of Kalamunda and Lesmurdie to the south and the built up areas in the foothills surrounding Midland, including the heritage precinct of Guildford. The area includes significant rural zones, as well as areas of national parks, water catchments and the upper reaches of the Swan and Helena river systems. The Swan Valley area is protected by the Swan Valley Planning Act 1995. The proposed local government brings together the strong Swan Valley and hills regional community of interest, centred on the strategic regional centre of Midland.
The population of the proposed eastern hills local government is estimated at around 165,000, growing to a projected 220,000 by 2026. As such, it would be among the largest local government areas in terms of population. It would also be the largest local government in terms of land area. Population growth is expected through infill, particularly around Midland and the foothills, and greenfields development in West Swan and Ellenbrook.
The strength of this new local government would be greatly enhanced if the commendable place based approach currently undertaken by the City of Swan were extended to the additional communities.
The strategic centre of Midland, the secondary centre of Ellenbrook and regional industrial centre of Hazelmere provide the economic base for this local government. It is understood that in Directions 2031, South Bullsbrook, Cullacabardee and Hazelmere are being considered for possible future industrial development, and this will add to the financial sustainability of this area.
There are significant environmental issues in the area, with rural subdivisions, State forest and the Avon Valley, Walyunga and John Forrest National Parks. Bushfire management is a critical issue, and the creation of a single local government for this sensitive hills environment will facilitate a coordinated approach.
Transport planning is also critical in the region, given the important transport linkages that traverse the area, including the Great Northern Highway, Brand Highway, Toodyay Road, Great Eastern Highway and Roe Highway, and the potential railway corridor to Ellenbrook.
7. Proposed south-eastern local government (name to be determined)
The proposed south-eastern local government is focused on the strategic activity centre of Armadale. As with the eastern hills local government, this will facilitate a coordinated approach to bushfire management in this high risk area. It is also similar to the proposed eastern hills local government in terms of its environmental issues because it includes significant water catchments, State forests and national parks.
This proposed local government is largely a consolidation of the current Gosnells, Armadale and Serpentine-Jarrahdale local governments, with a few variations. It is proposed that the locality of Serpentine will be transferred to the Shire of Murray, and the localities of Langford and Beckenham will be transferred to the proposed local
144 | P a g e

Metropolitan Local Government ReviewFinal Report of the Independent Panel - July 2012
government centred on Cannington. An important addition to this local government would be the residential and industrial areas of Canning Vale. These changes result from using Roe Highway as a boundary.
The population of the proposed south-eastern local government is estimated at around 190,000, approaching 260,000 by 2026, making it the most populous local government area in the Perth region.
The area has a significant combination of urban, commercial and industrial development, the regional centre of Maddington and the regional industrial centres of Maddington, Kenwick and Forrestdale. It includes the hills settlements of Roleystone and Bedfordale and the town sites of Byford and Mundijong. The addition of the Canning Vale industrial area will enhance the financial sustainability of this area.
8. Proposed consolidation of Rockingham and Kwinana (name to be determined)
The consolidation of the current Cities of Rockingham and Kwinana creates an enlarged local government focussed on the strategic centre of Rockingham. The population of the new entity is estimated at around 137,000, growing only to a projected 181,000 by 2026, with further significant population growth expected in subsequent years.
This proposal has a modified eastern boundary along Nicholson Road through to the south of Mandogalup Road. The southern boundary abuts the City of Mandurah and includes part of the future urban development of Keralup. The Panel considers that the future development of Keralup will, in time, create the need to revisit the local government boundaries in this area.
This region contains the Rockingham regional centre and its associated residential catchments, and the regional town centre of Kwinana. Importantly, it also contains the strategic industrial strips of Kwinana Beach and East Rockingham. This is a key strategic area for the State and the Perth region and is at present fragmented between two local governments.
Environmental management of this area is significant due to the need to contain pollution from industrial activity. It also includes significant regional open space and lake areas and the Port Kennedy regional open space which is home to a very fragile vegetation complex. The ocean foreshore and beaches are a community asset and will also need sensitive management. Consolidating the management of these issues into a single local government should bring benefits.
9. Modified City of Cockburn
As noted above, the Panel has concluded there is scope to retain a local government based on the secondary centre of Cockburn Central to fill what might be considered a ‘void’ between the strategic centres of Fremantle and Rockingham.
The Panel recommends the retention of the existing City of Cockburn, with some slight boundary modification on its eastern side. More significantly, it proposes to transfer some areas to the enlarged City of Fremantle to the north. By using the MRS road reservation associated with the Roe Highway extension, the result is a shift of the localities of Coolbellup, North Lake and part of Hamilton Hill to the City of Fremantle.
145 | P a g e

Metropolitan Local Government ReviewFinal Report of the Independent Panel - July 2012
The population of the modified City of Cockburn is estimated at around 79,000, growing to a projected 110,000 by 2026. As such, Cockburn would be among the smaller local governments in the metropolitan region.
Even with the proposed transfers, this local government is considered diverse and sustainable, as it comprises significant areas of industrial development, the developing Cockburn Central, and other key areas such as Jandakot Airport.
A significant parkland system associated with Beeliar Lake and the Beeliar Wetlands occurs in this area. The proposed local government would also need to focus on the Cockburn Sound foreshores and regional open space, and the ongoing management of industrial development.
In addition to ongoing greenfields development south of Yangebup and Beeliar, housing infill will continue to occur in Success and Atwell, together with significant development in the Spearwood and Coogee localities. This proposed local government will be a strategic and diversified area with industrial activities located on the coast and important linkages to the north. This includes the north Coogee industrial area, an important industrial strip which will continue to be developed in conjunction with Henderson.
10. Modified City of Fremantle (name to be determined)
This local government is focussed on the strategic centre of Fremantle, the metropolitan region’s port and significant heritage centre. The population of the modified City of Fremantle is estimated at around 118,000, growing only slightly to a projected 138,000 by 2026.
The proposed local government is essentially a consolidation of the Fremantle port city and its catchments to the east, comprising the Town of East Fremantle and the City of Melville. It would be bounded by the Swan River (at its midpoint, including Melville Water), the Kwinana Freeway, Roe Highway and the associated future road reservation (west of the current Kwinana Freeway). The Panel proposes a variation on the current boundaries, with the residential areas of North Fremantle to be incorporated into the new western suburbs council. The tanks and container storage areas abutting the Port would be retained within the City of Fremantle as they are integral to the Port.
This area brings a focus to the Swan River and its foreshore. Management can be more coordinated, in conjunction with port activities and the outer harbour around South Fremantle Fishing Boat Harbour. It is also proposed that Rottnest Island be incorporated as part of this local government area.
This local government would have a focus on the strategic metropolitan centre of Fremantle, in conjunction with the secondary regional centre of Garden City (Booragoon) and the specialist centre of Murdoch which includes the Murdoch University and the new Fiona Stanley Hospital. Thus, there is significant diversity in land uses, ranging from port activities to commercial activities, small industrial areas and a larger mixture of urban zoned land containing significant variation in housing types and eras.
Key issues will be continuing housing infill and ongoing development of the port and associated activities, including freight logistics and tourism development. Integrated transport planning in this locality is critical due to freight movements into the Fremantle and North Fremantle localities.
146 | P a g e

Metropolitan Local Government ReviewFinal Report of the Independent Panel - July 2012
11. Modified City of Canning (name to be determined)
The modified City of Canning is focussed on the strategic metropolitan centre of Cannington. This would incorporate most of the current City of Canning (except the residential and industrial areas of Canning Vale), together with the inclusion of selected areas from other local governments to the north and south:
Beckenham (currently Gosnells) Langford (currently Gosnells) Bull Creek (currently Melville) Leeming (currently Melville) Carlisle (currently Victoria Park) East Victoria Park (currently Victoria Park) Manning (south of Manning Road) (currently South Perth) Salter Point (currently South Perth) Waterford (currently South Perth).
The inclusion of the whole suburb of Leeming resolves the current illogical boundaries in the area, which sees the suburb currently split between three local governments. The Roe Highway provides a logical southern boundary to the proposed local government. The inclusion of the listed areas extends the City’s coverage of the Canning River foreshore, which, together with the regional open space reservation is an environmental asset to the area, bringing an important management challenge. Consolidation of the expertise and management of the foreshore into fewer authorities should enhance environmental outcomes.
The population of the proposed greater City of Canning is estimated at around 121,000, growing only slightly to a projected 138,000 by 2026.
This is a very diverse area in terms of housing stock, commercial development and industrial areas. Along with the strategic metropolitan centre of Cannington, there are the industrial areas of Kewdale and Welshpool. These areas are linked by the developing integrated freight system between Perth International Airport and the Port of Fremantle. Other major transport routes such as Albany Highway will evolve as extensive mixed-use development corridors.
12. New local government focused on Morley (name to be determined)
The proposed new local government focussed on the strategic activity centre of Morley is essentially a consolidation of the current local governments of Bassendean, Bayswater and Belmont. This local government would span both sides of the Swan River and adjoin the City of Perth at its southern boundary. It is also proposed that selected areas from the south-eastern segment of the City of Swan (Ballajura, Beechboro, Kiara, Lockridge and Malaga) be attached to this local government, on the basis that the areas involved are closer to, and more connected to, the commercial centre of Morley rather than Midland.
The population of the proposed new local government focused on Morley is estimated at around 171,000, growing only slightly to a projected 186,000 by 2026. Population growth in this area will largely come through infill of existing suburbs.
With the combination of industrial areas at Belmont and Malaga, and the Morley retail centre, this will be a financially strong local government. With the further development of the airport precinct, transport links through the area, such as the Tonkin Highway, are critical. All of the Perth Airport is brought into this proposed new
147 | P a g e

Metropolitan Local Government ReviewFinal Report of the Independent Panel - July 2012
local government This is an improvement on the current situation, which sees it spread across three local governments.
The residential areas being brought together are similar in housing stock and socio-economic status.
An important aspect of this proposed local government is making the Swan River a central feature, providing the basis for pooled expertise and a consistent approach to management of associated issues.
Implementation
In order to expedite the process of implementation of the Panel’s recommendations, State government intervention will be required. It will be especially necessary to assist with the complex negotiations that arise when local governments are split, which could otherwise be used as grounds to postpone action. As the Panel’s preferred option is proposing much more than simple amalgamations requiring changes to the Local Government Act 1995, its associated regulations and possibly other pieces of legislation, it suggests that the provisions of the current Act pertaining to boundary change are not sufficient, and that the proposed changes be implemented through the drafting of new specific legislation.
On the issue of ward boundaries and representation for the newly created local governments the Panel considers that in the first instance, no wards be created and that representation be generally in line with the current State Government preferred policy. It is considered that the creation of wards would serve only to entrench local government allegiances, when a spirit of change and a focus on creating a successful new entity is required. This could be reviewed by each local government at its first review of boundaries and representation following establishment of the new entities.
The following section of the Panel’s Report provides a more detailed discussion on implementation of the reforms.
5.6 RECOMMENDATIONS
The Panel recommends that:
8. A Forum of Mayors be formed to facilitate regional collaboration and effective lobbying for the needs of the metropolitan area and to provide a ‘voice’ for Perth.
9. The Forum of Mayors be chaired by the Lord Mayor of the modified City of Perth in the first instance.
10. The newly created local governments should make the development and support of best practice community engagement a priority, including consideration of place management approaches and participatory governance modes, recognition of new and emerging social media channels and the use of open-government platforms.
11. The existing Regional Local Governments in the metropolitan area be dissolved, the provisions in the Local Government Act 1995 be
148 | P a g e

Metropolitan Local Government ReviewFinal Report of the Independent Panel - July 2012
repealed for the metropolitan area and a transitional plan for dissolving the existing bodies in the metropolitan area be developed.
12. The State Government give consideration to transferring oversight responsibility for developments at Perth’s airports, major hospitals and universities to the Metropolitan Redevelopment Authority.
13. Periodic local government boundary reviews are undertaken by an independent body every 15 years to ensure the city’s local government structure continues to be optimal as the metropolitan region develops.
14. The Local Government Advisory Board be dissolved and its operating and process provisions in the Local Government Act 1995 be rescinded with the Local Government Commission taking over its roles, including consideration of representation reviews.
15. A new structure of local government in metropolitan Perth be created through specific legislation which:
(a) incorporates all of the Swan and Canning Rivers within applicable local government areas
(b) transfers Rottnest Island to the proposed local government centred around the City of Fremantle;
(c) reduces the number of local governments in metropolitan Perth to 12, with boundaries as detailed in Section 5 of this report.
149 | P a g e

Metropolitan Local Government ReviewFinal Report of the Independent Panel - July 2012
SECTION 6: IMPROVED MODELS OF GOVERNANCE (Addressing Terms of reference 3 and 5)
This section presents a range of revised governance proposals in accordance with the Panels Terms of Reference.
The Panel notes the importance of ensuring the ongoing legitimacy of local government through establishing governance arrangements which support and strengthen local government authority. Priorities for the Panel are ensuring that declining rates of participation in local government elections are addressed and that the roles and responsibilities of all players are adequately defined.
6.1 CURRENT GOVERNANCE ARRANGEMENTS
In Western Australia there are two ways to exercise a vote in a local government election. A person must be:
enrolled on the State electoral roll for a residence in that local government district; or
an owner/occupier of rateable property within the local government district but on the State or Commonwealth electoral roll outside the local government district.
Ordinary local government elections are held for 50 per cent of members every two years (councillors are elected for four years, with half of the positions becoming vacant every two years to ensure continuity within the council). There is no limit to the number of times that an elected member can hold office.
The process for electing a Mayor or President differs between local governments with each making a choice between a vote of councillors or a vote of electors. Duties, once elected, are the same. Local governments may divide their areas into wards and elect councillors for each ward.
Voting in local government elections is not compulsory in Western Australia and candidates are elected using the first-past-the-post system.
6.1.1 Local government elections
The Panel believes, as a guiding principle, that local government elections should be conducted in a manner as similar as possible to State and Commonwealth elections. It recommends that these should be conducted as in person elections with compulsory enrolment and voting every four years. It is suggested that local government elections be conducted on a fixed date half-way through the State government cycle, so that there is either a State or local government election every two years.
The Panel’s Terms of Reference restrict it to recommendations for the metropolitan area only. However, the Panel believes that these proposals would benefit the whole local government sector. Additionally, implementation for the metropolitan area only would be complex and could cause voter confusion. As such the State government may wish to consider applying these measures to the whole State.
150 | P a g e

Metropolitan Local Government ReviewFinal Report of the Independent Panel - July 2012
If each local government implemented these changes, it would be costly and administratively onerous. Therefore, the Panel recommends that the Western Australian Electoral Commission should be responsible for conducting all local government elections. This is appropriate given the existing knowledge and experience of the Western Australian Electoral Commission and it is in accordance with practice in other states.
The Panel has found evidence of decline across key markers of electoral performance which strongly support the need to change the existing processes. Continued decline in participation by both electors and candidates is a serious issue for the ongoing legitimacy of local government and presents a threat to electoral accountability.
In 2011, the voter turnout at the local government elections was 30.5 per cent across the State and was an average of 28.5 per cent in the metropolitan area. This is lower than the 31.8 per cent recorded in 2009, and continues a gradual decline since 2005.218 The individual participation rates in the metropolitan area for 2011 are detailed in Table 6.1.
Table 6.1: Participation rates in metropolitan local government general elections 2005-2011
Local Government
2011 2009 2007 2005
Armadale 29.7% 30.6% 31.3% 35.7%
Bassendean 32.3% 37.3% 35.3% 40.7%
Bayswater 26.1% 31.7% 31.7% Data not available
Belmont 30.3% 35.9% 37.2% 38.1%
Cambridge 31.6% 31.8% 37.8% 43.5%
Canning 28.1% 30.8% 34.9% 33.2%
Claremont 39.9% 43.9% 38.1% 49.3%
Cockburn 26.4% 32.9% 32.2% 37.2%
Cottesloe 38.0% 50.8% 46.4% 55.4%
East Fremantle Elections uncontested 12.7% Elections
uncontestedData not available
Fremantle 35.6% 46.9% 43.2% 50.6%
Gosnells 23.0% 25.4% 26.6% 30.4%
Joondalup 23.4% 26.9% 27.2% Data not available
Kalamunda 34.1% 36.6% 36.1% 38.2%
Kwinana 25.6% 32.5% 33.0% 30.6%
Melville 34.3% 36.2% 37.6% 36.2%
Mosman Park 34.7% 33.5% 13.1% Data not available
Mundaring 31.7% 34.4% 37.0% 37.4%
218 Information provided by the Department of Local Government.
151 | P a g e

Metropolitan Local Government ReviewFinal Report of the Independent Panel - July 2012
Local Government
2011 2009 2007 2005
Nedlands 35.6% 39.5% 38.9% 39.7%
Peppermint Grove 43.9% 51.3% Elections
uncontestedData not available
Perth 44.3% 34.9% 47.8% 42.7%
Rockingham 30.5% 33.6% 33.2% 33.2%
Serpentine-Jarrahdale 32.3% 36.6% 36.0% 40.4%
South Perth 30.9% 35.2% 31.4% 35.4%
Stirling 27.1% 29.9% 29.8% 32.5%
Subiaco 38.1% 40.7% 37.1% 44.8%
Swan 29.0% 31.9% 32.4% 34.8%
Victoria Park Elections uncontested 33.2% 38.4% 34.8%
Vincent 37.7% 31.1% 36.7% 34.4%
Wanneroo 23.9% 28.0% 24.3% 32.1%
Sources: Department of Local Government and Western Australian Electoral Commission
The number of contested seats is also an indicator of local government capacity to attract new people to run for council and encourage robust competition. In 2011 in the metropolitan area there were 40 seats from a possible 124, or 32.35 per cent, which were uncontested.
Viewing figures from previous years also demonstrates a gradually declining position with 19.83 per cent (24 seats out of a possible 121) uncontested in 2009, and 16.53 per cent (20 seats out of a possible 121) uncontested in 2007.219 Of particular interest were those local governments where more than one position was elected unopposed or where unopposed elections are occurring over a number of years. The East Fremantle Council, for example, has been elected unopposed in the main at the last three general elections.
Analysis of national systems shows that Western Australia is the only State currently utilising the first-past-the-post (FPTP) counting system and stands only with South Australia and Tasmania in not providing for compulsory voting.
219 Information provided by the Department of Local Government
152 | P a g e

Metropolitan Local Government ReviewFinal Report of the Independent Panel - July 2012
Table 6.2: Interstate electoral systems comparative data
State / Territory Compulsory Voting Enrolment
Provisions Count System Participation Rate
Party Nomination
WA NoResidents and non-resident
property ownersFirst-past-the-post 30.5% No
SA NoResidents and non-resident
property owners
Proportional representation 32.88% No
QLD YesResident / individual
enrolment only
Optional preferential for local governments with divisions (wards). First-
past-the-post for undivided local governments.
84.5% Yes
VIC
Yes except if the voter is 70 years of age or
more; or in the case of a non-resident voter; or
in the case of a CEO list voter.
City of Melbourne: voting is compulsory for all voters on voters roll
– the only exception being if the voter is 70 years of age or more.
Residents and non-resident
property owners (but once per
district)
Preferential for single member wards.
Proportional for multi-member wards or local governments without
wards.City of Melbourne:
Preferential for Lord Mayor and Deputy
Mayor. Proportional for councillors.
74.36%
No.
Except for the City of
Melbourne where two or
more candidates can form a ‘‘group’’.
NSW
Yes for electors on the residential roll for council/mayoral
elections, referendums but not council polls.No for electors on the non-residential rolls.
Residents and non-resident
property owners
For one position, optional preferential.For two or more then
proportional.For Mayoral elections, optional preferential.
83.4%
Yes. Additionally two or more candidates can form a
‘group’.
TAS NoResidents and non-resident
property owners
Proportional representation 54.31% No
NT YesResident / individual
enrolment only
Proportional representation 49.7% No
Currently, voter turnout to local government elections in Western Australia, particularly in urban areas, is relatively low, when compared to other elections where voting is compulsory.
In the submissions received on the Panel’s Draft Findings, 58 per cent of respondents who addressed the finding on compulsory voting indicated their support for the proposal.
The Panel finds that compulsory voting will both increase the participation of communities in local government and increase the diversity of voters, in terms of age, gender, occupation and interests. It is also anticipated that it will also lead to more representative councils with an improved diversity of elected members as the broader community will have a greater focus on who they are electing. Elected members will be subject to greater scrutiny, but once elected will have greater legitimacy.
A common argument against compulsory voting is that it would encourage party politics in local government with opponents referring to the political party representation which occurs in other states. Despite this, analysis of the most recent
153 | P a g e

Metropolitan Local Government ReviewFinal Report of the Independent Panel - July 2012
Queensland elections demonstrates that of the 234 Mayoral candidates, only three were party nominations. Further, of the 1,281 councillor candidates, only 81 were party nominations.220 As such, the ‘politicisation’ of local government may not be as widespread as critics perceive.
While the involvement of political parties in local government is generally presented as a negative by many within the sector, no evidence has been presented to demonstrate whether or not this is actually the case. Factions and voting blocs already exist in local government and this is the natural result of any decision-making process. Political parties may bring increased structure, the ability to reach a broader audience and the likelihood of candidates with agendas and aspirations which are broader than singular, small issues. The Panel also notes that many current and former members of State Parliament have been involved in local government.
Ultimately, the Panel finds that if the community feels that the presence of political parties in local government is as negative as opponents suggest, then this would be expressed at the ballot box and that electors would swiftly reject candidates who demonstrate political bias. In this context, the Panel notes the example of the continuing success of the independent Lord Mayor in the City of Sydney. As such, the Panel recommends that party or group nomination be facilitated.
The Panel has given consideration to whether businesses and property owners would continue to receive a vote or if the ability to vote be limited to one vote per individual as is the case for State and Federal elections. The Panel notes that in Queensland, for example, the ‘property franchise’ has been removed, including for the City of Brisbane.
The major implication of compulsory voting for non-residents will be for owners of properties who will find themselves compelled to vote more than once in each district, or multiple times across districts. It is anticipated that the community would find the exercise of multiple votes inconsistent with both State and Commonwealth elections and not generally in the spirit of the electoral system.
Despite this, owners of properties continue to be ratepayers and consumers of local government services. As such, it may not be reasonable to expect that they be denied a right to vote. It is therefore suggested that the right to a property-based vote be granted if applied for, rather than as an automatic right, and that voting for non-resident owners should not be compulsory. This is consistent with provisions in Victoria and New South Wales.
A perception that businesses may be inappropriately powerful through the exercise of multiple votes may be ameliorated by the boundary reforms proposed by the Panel which create local governments with an improved balance between residents and non-resident property owners.
It has been suggested that local government elections be conducted at the same time as State elections as it would provide some cost savings as the existing infrastructure and arrangements of the Western Australian Electoral Commission would be utilised. However, there is the potential that this would create confusion amongst electors. Local government candidates may also struggle to compete with State candidates in distributing their messages to electors.
220 Electoral Commission Queensland (2012), Election Information and Results, viewed 28 June 2012, http://www.ecq.qld.gov.au/elections/index.html
154 | P a g e
Metropolitan Local Government ReviewFinal Report of the Independent Panel - July 2012
The first-past-the-post system currently used in local government is very simple, electors mark the box or boxes of their preferred candidate and the candidate with the most votes is elected. The Electoral Reform Society of the United Kingdom has produced the following information on the first-past-the-post system. Extracts relevant to the local government context are shown below.221
Table 6.3: First-past-the-post voting – Electoral Reform Society arguments
The Case For The Arguments Against
It's simple to understand and thus doesn't cost much to administer and doesn't
alienate people who can't count.
Representatives can get elected on tiny amounts of public support as it does not matter by how much they win, only that
they get more votes than other candidates.
It doesn't take very long to count all the votes and work out who's won, meaning
results can be declared a handful of hours after polls close.
It encourages tactical voting, as voters vote not for the candidate they most
prefer, but against the candidate they most dislike.
The voter can clearly express a view.
It wastes huge numbers of votes, as votes cast for losing candidates, or for the
winning candidate above the level they need to win that seat, count for nothing.
Source: Electoral Reform Society
In small, single vacancy elections, the disadvantages of the FPTP system are not evident. However, if a compulsory voting system was applied to local governments with multiple vacancies, then it is not considered appropriate to retain the FPTP system.
In the preferential voting system, a candidate must receive an absolute majority (more than 50 per cent) of the total formal votes to be elected. The full preferential system requires electors to indicate a preference for each candidate on the ballot paper.
As a count proceeds, if after all first preference votes have been counted, no candidate has obtained an absolute majority, then the candidate with the fewest number of first preference votes is excluded from the count and their second preference votes are distributed to the remaining candidates. This process is continued until one candidate obtains an absolute majority.
The proportional system is used in multi-member electorates such as the Legislative Council. A candidate is required to receive enough votes to reach a quota (not an absolute majority) which is based on the number of formal votes and the number of candidates to be elected. The Western Australian Electoral Commission argues that this system is designed to ensure that the mix of successful candidates in a multi-member electorate reflects as closely as possible the proportional break-up of all the valid votes cast in an election.222
221 Electoral Reform Society (2012), First Past the Post, viewed 28 June 2012, http://www.electoral-reform.org.uk/first-past-the-post/222 WAEC (2008), Proportional Representation System – Legislative Council, viewed 28 June 2012, www.waec.wa.gov.au/voting/state_elections/counting_of_votes/proportional_representation_voting_system_-_legislative_council.php
155 | P a g e

Metropolitan Local Government ReviewFinal Report of the Independent Panel - July 2012
A further issue which was raised in submissions made to the Panel is a limit to the number of consecutive terms that an elected member can serve. The Panel notes that this proposal would necessitate consideration of shorter initial terms for some members following implementation. However, it is considered that this proposal could increase diversity, especially in those local governments where unopposed elections are prevalent. It would provide an opportunity for potential candidates who may be discouraged from nominating due to the perception that elected member positions are decided outside of the electoral process, or that some long-standing elected members have an automatic right to hold positions.
A limit of three terms, or 12 years, is considered ample opportunity for an elected member to achieve a great deal for his or her community. This would facilitate sharing of knowledge and experience across a broader generational and cultural range. It is suggested that the term limit apply to both councillor and Mayor positions, providing for 12 years as a councillor and eight years as a Mayor.
6.1.2 Election of Mayors
Currently the Local Government Act 1995 provides each local government a choice as to whether their Mayor or President is elected by council or directly by the community. As such, the process differs between local governments. There is a fairly even division of election method among the metropolitan local governments with slightly more favouring the direct election method:
Direct election (17) – Cambridge, Canning, Claremont, Cockburn, Cottesloe, East Fremantle, Fremantle, Joondalup, Melville, Mosman Park, Nedlands, Perth, South Perth, Subiaco, Victoria Park, Vincent and Wanneroo.
Election by council (13) – Armadale, Bassendean, Bayswater, Belmont, Gosnells, Kalamunda, Kwinana, Mundaring, Peppermint Grove, Rockingham, Serpentine-Jarrahdale, Stirling and Swan.
There is a perception that problems associated with elected member cohesion are more prevalent among councils with directly elected Mayors. While it is noted that several Inquiries have been held into local governments with directly elected Mayors, the Panel finds no evidence to link direct election to these problems, and notes that issues and complaints still arise in local governments with council-elected Mayors. It can also be argued that disagreements arising among council groups may also stem from improperly defined roles for Mayors, elected members and senior local government staff. The Panel will make recommendations to address these matters.
The benefits of direct election are that a Mayor will have a greater visibility and accountability within the community and that the Mayor will truly represent the entire district. In a new structure, it is considered vital that the community have a readily identifiable figure and that they are confident in the Mayor as a representative of the whole area. This will assist in ensuring that perceptions of bias to old local government boundaries or specific small areas are avoided.
6.1.3 Roles, remuneration and training
The role of the Mayor or President is set out in section 2.8 of the Local Government Act 1995. Broadly, the role is to provide leadership to the community and carry out ceremonial duties. The role of the CEO of a local government is defined in section
156 | P a g e

Metropolitan Local Government ReviewFinal Report of the Independent Panel - July 2012
5.41 of the Act, and is to manage the daily operations and functions of a local government, and to implement council policies and decisions.
A key issue which has emerged from this Review is the need to clarify the roles of elected members and CEOs. Local governments have raised this issue directly with the Panel and it is noted that many of the recent large-scale inquiries into local government have stemmed from problems in the relationship between council and senior staff. The Panel supports the findings of the Australian Centre for Excellence in Local Government that ‘the success of the political management relationship at the top of a local government organisation – council and administration – is central to the ongoing effectiveness of this level of government’.223
Chief Executive OfficersThe Panel believes that the current role for CEOs as defined in the legislation is sufficient and that instead of changing the definition, a strong and consistent framework for recruitment and performance assessment is what is required. Currently there is great variance in the way CEOs are recruited and in the ongoing management of CEO performance and contracts.
As the employing body it is the council of each local government who appoints and manages its CEO. Therefore, the variation identified above relates to the experience of councillors in these matters and is often as a product of a fractured relationship between council, CEOs and other senior staff. The State plays a role in determining CEO remuneration through the Salaries and Allowances Tribunal.
All CEOs of State Government agencies are employed by the Public Sector Commissioner and the Public Sector Commission provides recruitment, contract and management services to facilitate this. The Panel argues that there is a role for the Public Sector Commission in the recruitment and performance management of local government CEOs. The Panel does not wish to provide for the State Government to have direction or control over recruitment and management, rather it recommends that there should be representation from the Public Sector Commission on CEO recruitment panels and in contract negotiations and performance management.
It is argued that this arrangement would facilitate improved consistency in these processes for CEOs and would provide councils with guidance and assistance through this critical process. Again, while the Panel's Terms of Reference restrict it to making recommendations for the metropolitan area, the State Government should consider applying this proposal state-wide.
Elected MembersFollowing on from this is the need to consider whether the roles of elected members are sufficiently defined and what, if any, training and performance measures should be placed on elected members.
The Local Government Act 1995 provides the following definition of the role of the council:
(1) The council — (a) governs the local government’s affairs; and
223 Martin, J & Aulich, C, Political management in Australian Local Government: Exploring Roles and Relationships between Mayors and CEOs, viewed 28 June 2012, http://www.acelg.org.au/upload/Political_Management_J%20Martin%20and%20C%20Aulich.pdf
157 | P a g e

Metropolitan Local Government ReviewFinal Report of the Independent Panel - July 2012
(b) is responsible for the performance of the local government’s functions.
(2) Without limiting subsection (1), the council is to — (a) oversee the allocation of the local government’s finances and
resources; and(b) determine the local government’s policies.
The Panel believes that this definition is appropriate; however there is a need to ensure that elected members are adequately resourced to meet these directions. This will require not only a focus on the methods of election but on the training and remuneration available.
The model for elected members needs to be updated to encourage an increased capacity for strategic decision-making. The Panel believes elected members need to exhibit a higher standard of executive governance, similar to that of a board. This can be reinforced by training which is encouraged by appropriate remuneration. The demonstration of board-like behaviour will be particularly important in a restructured environment where metropolitan local governments will typically serve large populations and have budgets of $200 million or more. Elected members will need to move from a representative role to more of a leadership role. In the larger local governments, where there is more diversity in areas and needs, elected members will have to consider the big picture and be less focussed on matters of a very localised nature.
The Panel believes that elected members must represent their whole district, not just a small ward. Indeed, within the newly created local governments, a renewed focus on the broader district will be vital. Elected members will need to work towards the advancement of the community as a whole, rather than represent small pockets or narrow interests. This is why the Panel suggests that ward systems not be utilised initially in the newly created districts.
Both WALGA and DLG are active in providing training for elected members and other opportunities for professional development, including sessions on roles and responsibilities, ethics, strategic planning, change management and policy development. Training is also available for newly elected members. CEOs are encouraged to produce an induction manual and provide an induction program for new members.
The Local Government Reform Steering Committee Report of May 2010, noted a number of problems within the sector arising from the lack of adequate training for elected members.224 As part of the Steering Committee’s report, the Training and Capacity Building Working Group discussed whether elected member training should be compulsory or if, following the South Australian model, that there be a legislative requirement for a local government to prepare a training policy and report on it in their annual report. The Panel appreciates that extra difficulties for businesses and families arise for elected members who take on additional duties, such as training. However this must also be balanced with the community’s expectation that their elected representatives are adequately trained.
Suggestions of mandatory training prior to election or of training as a prequalification for election are noted. It is argued that the same provisions do not apply to State and
224 Local Government Reform Steering Committee Report, viewed 27 June 2012, http://www.dlg.wa.gov.au/Content/LG/LGReform/CommitteesWorkingGroups/SteeringCommitteeReport.aspx
158 | P a g e

Metropolitan Local Government ReviewFinal Report of the Independent Panel - July 2012
Federal government and additionally in light of the candidate diversity and contest issues discussed previously, the Panel does not consider prequalification to be appropriate. The Panel believes elected members of metropolitan councils should be strongly encouraged to undertake training, similar to that provided by the Australian Institute of Company Directors, although the breadth and scope of the training would need to be considered further. The training would provide elected members with a better understanding of the required relationship between the CEO and the council. Successful completion of training should be rewarded through increased remuneration.
There may be a case for a training policy as suggested by the Training and Capacity Building Working Group and specific reporting on training completed by elected members. This would ensure greater standardisation and consistency in the material provided to elected members.
In Western Australia, being an elected member is currently considered a voluntary contribution to the community, not a source of paid employment. Notwithstanding this, for some elected members the current level of remuneration represents an important source of income. The potential incomes for elected members who hold positions on both local governments and RLGs or other paid boards and committees are significant.
Under the Local Government Act 1995 and the Local Government (Administration) Regulations 1996, sitting fees for elected members are set individually by each local government within the fixed minimum and maximum provided:
Mayors or Presidents are entitled to receive a maximum of $14,000 in meeting fees and a $60,000 allowance per year.
The Deputy Mayor or President is entitled to receive a maximum of $7,000 in meeting fees and an allowance of 25 per cent of that of the Mayor or President.
Council members are entitled to receive $7,000 in meeting fees. Elected members who sit on Regional Councils also receive sitting fees.
159 | P a g e

Metropolitan Local Government ReviewFinal Report of the Independent Panel - July 2012
Table 6.4: Elected member remuneration legislative provisions
Act & Regulations
Elected Member Type Minimum Maximum Annual Total is
not to exceed
S5.98(1)Admin 30 (1-3)
Ordinary councillor
Council meetings $60 per meeting
$140 per meeting
$7,000Committee meetings
$30 per meeting $70 per meeting
Other prescribed meetings
$30 per meeting $70 per meeting
S5.98(1)
Admin 30 (4-5)Mayor or President Council meetings $120 per
meeting$280 per meeting
$14,000
(for any meeting type)
S5.98(5)
Admin 33Mayor /
President Allowance $600 per year
$12,000 or 0.002% of operating revenue
$60,000
S5.98a
Admin 33a
Deputy Mayor /
PresidentAllowance 25% of Mayor / President
entitlement $15,000
S5.99
Admin 34Ordinary councillor
Optional annual fee in lieu of meeting fee
$2,400 per year $7,000 per year $7,000
S5.99
Admin 34Mayor or President
Optional annual fee in lieu of meeting fee
$6,000 per year
$14,000 per year $14,000
S5.99a
Admin 34a (a-c)All council members
Optional allowance in lieu
of expense reimbursement
Telecommunications: $2,400 per year
IT: $1,000 per year
Travel: as per Public Service Award 1992
Source: Local Government Act 1995
Table 6.5 details remuneration of metropolitan area elected members in 2009-10. While it is noted that there are differences in what councils report as elected member expenses, some include council expenses such as travel, conferences and training whereas others report only on allowances, fees and reimbursements paid directly to elected members. The data shows that the relatively large local governments of Joondalup, Stirling, Wanneroo and Gosnells have significantly lower costs per resident than the average. The local governments with the highest cost per resident are the comparatively small local governments of Perth, Mosman Park, Claremont and Bassendean.
There have been calls from the local government sector to increase the payment levels for elected members and the maximum allowances for Mayors in particular, with some arguing that the demands of the role exceed the remuneration available. The Panel concurs with this as long as any remuneration increase is accompanied by increased responsibility, accountability and training.
160 | P a g e

Metropolitan Local Government ReviewFinal Report of the Independent Panel - July 2012
Table 6.5: Payments to elected members by metropolitan local government
Estimated resident Population
Number of elected members
Cost elected members
Cost per elected member
Cost per resident
Armadale (C) 60,983 14 $249,238 $17,802 $4.09
Bassendean (T) 14,790 6 $126,699 $21,116 $8.57
Bayswater (C) 61,865 11 $184,847 $16,804 $2.99
Belmont (C) 35,082 10 $188,398 $18,839 $5.37
Cambridge (T) 26,959 9 $151,240 $16,804 $5.61
Canning (C) 88,433 11 $229,347 $20,8493 $2.59
Claremont (T) 9,891 10 $96,482 $9,648 $9.75
Cockburn (C) 91,313 10 $196,663 $19,666 $2.15
Cottesloe (T) 8,222 9 $55,697 $6,188 $6.77
East Fremantle (T) 7,534 9 Information not available online
Fremantle (C) 28,626 13 $230,489 $17,729 $8.05
Gosnells (C) 106,724 12 $194,937 $16,244 $1.83
Joondalup (C) 164,445 13 $310,957 $23,919 $1.89
Kalamunda (S) 55,814 12 $148,180 $12,348 $2.65
Kwinana (T) 29,029 8 $99,203 $12,400 $3.42
Melville (C) 102,434 13 $248,661 $19,127 $2.43
Mosman Park (T) 9,440 7 $108,100 $15,442 $11.45
Mundaring (S) 38,910 12 $225,075 $18,756 $5.78
Nedlands (C) 22,508 13 $167,860 $12,912 $7.46
Peppermint Grove (S) 1,749 7 $0.00 $0.00 $0.00
Perth (C) 17,955 9 $249,952 $27,772 $13.92
Rockingham (C) 104,130 10 $208,420 $20,842 $2.00
Serpentine-Jarrahdale (S) 17,212 9 $121,418 $13,490 $7.05
South Perth (C) 43,908 13 $214,829 $16,525 $4.89
Stirling (C) 202,014 14 $242,778 $17,341 $1.20
Subiaco (C) 18,862 13 $112,478 $8,652 $5.96
Swan (C) 112,960 15 $362,073 $24,138 $3.21
Victoria Park (T) 32,958 9 $185,921 $20,657 $5.64
Vincent (T) 31,209 9 $145,066 $16,118 $4.65
Wanneroo (C) 150,106 15 $169,060 $11,270 $1.13
Total 1,696,065 325 $5,224,068
Average* $16,324 $4.91
(*Excludes East Fremantle) Source: Population and number of elected member information provided by Department of Local Government for 2009/10. Claremont data from 2008/09. Financial information on elected member spending extracted from individual local government websites in August 2011.
161 | P a g e
Metropolitan Local Government ReviewFinal Report of the Independent Panel - July 2012
The Panel notes that submission number DF109, for example, refers to remuneration for elected members at levels similar to Queensland, and notes that remuneration in Western Australia is low when compared to other states. However the Panel does not foresee a change to the role of elected members, even within a new structure, which would justify increases to such levels. The argument that ordinary elected members in larger local governments will be required to serve full-time or be unable to represent their communities effectively is not supported by the existing examples of Stirling, Joondalup and Wanneroo. In these local governments, the populations are in excess of 150,000 and are managed both capably and for among the lowest costs to the community.
Further, it is evident from the data that sufficient savings could exist within the $5.2 million currently spent on 325 elected members in the metropolitan area to accommodate increases within a revised structure.
The LGAB in its 2006 Report, Local Government Structural and Electoral Reform in Western Australia - Ensuring the Future Sustainability of Communities recommended:
That the Western Australian Salaries and Allowances Tribunal be given the responsibility for establishing the range of fees and allowances for elected members, with each local government having the ability to set a fee within this range. The Tribunal also be required to update the fees and allowance on an annual basis.225
The Panel notes this recommendation and supports a transfer of responsibility for the setting of elected member fees to the Salaries and Allowances Tribunal. This is consistent with the setting of payments for CEOs and members of State Parliament. The Panel notes the forthcoming changes to the legislation to support this change.
The Panel also notes that the City of Melbourne has determined that expenses provided to elected members will be published on a quarterly basis on the City's website.226 Consistent with this, the Panel considers it appropriate that a register be developed which would show elected member expenses for each local government in a standard format. This would allow for the community to compare expenses across districts.
6.2 RECOMMENDATIONS
The Panel recommends that:
16. Consideration be given to all local government elections being conducted by the Western Australian Electoral Commission.
17. Compulsory voting for local government elections be enacted.
18. All Mayors and Presidents be directly elected by the community.
19. Party and group nominations for local government electoral vacancies be permitted.
225 LGAB (2006), Ensuring the future sustainability of communities, p. 142, viewed 28 June 2012, http://dlg.wa.gov.au/Content/LG/AdvisoryBoard/StructuralElectoralReform.aspx226 http://www.melbourne.vic.gov.au/AboutCouncil/MayorCouncillors/Pages/Expenses.aspx
162 | P a g e

Metropolitan Local Government ReviewFinal Report of the Independent Panel - July 2012
20. Elected members be limited to serving three consecutive terms as councillor and two consecutive terms as Mayor/President.
21. Elected members be provided with appropriate training to encourage strategic leadership and board-like behaviour.
22. A full review of current legislation be conducted to address the issue of the property franchise and the most appropriate voting system (noting the Panel considers that first-past-the-post is inappropriate for the larger districts that it has recommended).
23. Implementation of the proposed setting of fees and allowances for elected members as set by the Salaries and Allowances Tribunal.
24. Payments made to elected members be reported to the community on a regular basis by each local government.
25. The Public Sector Commission provide advice and assistance to local governments in the appointment and performance management of local government Chief Executive Officers with consideration given to the Public Sector Commission being represented on relevant selection panels and committees.
163 | P a g e
Metropolitan Local Government ReviewFinal Report of the Independent Panel - July 2012
SECTION 7: IMPLEMENTATION ISSUES (Addressing Terms of Reference 6)
The implementation of the Panel’s recommendations is a very important aspect of the Metropolitan Local Government Review. It is crucial that there is continued engagement with the Association, the Local Government sector and the community throughout the implementation phase…. There are many issues that amalgamating Local Governments need to address including integrating systems, workforces, finances and contracts. Clearly, change processes of this scale and complexity require significant resources and will take significant time… (IP246).
Throughout the course of the Review questions about implementation were raised by many stakeholders. As the Panel’s Terms of Reference requires it to ‘present a limited list of achievable options together with a recommendation on the preferred option’ the Panel has sought information on ensuring its recommendations are ‘achievable’.
The Panel has been provided with information from individuals and organisations that have experienced reform, which it has noted, but a detailed implementation plan does not form part of this report. Such a plan was not within the Terms of Reference and it is also difficult to formulate a detailed plan without knowing if the Panel’s recommendations will be adopted by the Minister. However, the Panel provides the following comments about implementation for the Minister’s consideration.
A very clear message received by the Panel was the need for swift implementation once a decision has been made. Draft Finding number 5 noted the need for prompt decision-making, and this was generally supported by submissions. Some respondents cautioned against making rushed or poorly thought through decisions, and some even suggested swift decision-making was a deliberate means to exclude the public from the process and impose an unwanted outcome upon them.
The uncertainty of the reform process and the length of time being taken is having a significant impact on staff within the sector. If decisions are not swift and a transition period clear, the sector will see a ‘brain drain’ of its best and brightest to other sectors and it is highly unlikely the sector will achieve the reform goals of superior strategic thinking and innovative leadership if it does not have the skilled professionals on the ground to drive the change (DF69).
Timely and decisive reform implementation is necessary to maintain morale and reduce the loss of local government expertise... as both will be essential for the ongoing success of reform (DF97).
The above proposals should be implemented as quickly as possible. Once the changes for metropolitan Perth have been settled, local government reform should continue without delay to the rest of WA (DF85).
If the State Government truly believes that local government reform is needed, then once the Review Panel has concluded its consultation and research into metropolitan and regional reform, then the State should implement local government reform without undue delay (DF117).
Irrespective or what happens with regards the outcomes of this process, decisions should be made in a considered and prompt fashion.
164 | P a g e
Metropolitan Local Government ReviewFinal Report of the Independent Panel - July 2012
Implementation of decisions should be carried out within practical timeframes with due regard for affected stakeholders. Leaving this reform process ‘up in the air’ will create massive uncertainty within the local government human resource and create a talent drain to other sectors, particularly mining and resources. Such a drain in an already very difficult and competitive labour market could be catastrophic to the proper operation and function of local governments across the metropolitan area (DF145).
It is contended that it is unlikely that the Panel’s recommendations will be implemented prior to the 2013 State election, which means there will be a considerable period of uncertainty between the release of the Panel’s report and implementation of the recommendations. This period of uncertainty is a major concern… During this time there will be an impact on staff, who may believe that their job is unlikely to exist into the future. This will certainly have an impact on some Local Governments’ ability to retain and attract staff, particularly Local Governments named in recommendations. The Local Government sector more broadly may also be affected. Attracting and retaining skilled professionals is currently difficult for the Local Government sector given the current strength of the Western Australian economy. With the uncertainty of tenure of employment facing the future of the sector, potential employees may find the sector unattractive and the difficulty in attracting skilled staff may be amplified as a result of the looming structural change. There may also be impacts on the finances of Local Governments if there is a move to ensure that the reserves of a Local Government earmarked for amalgamation are expended earlier than otherwise intended (IP246).
Appropriate consideration must be given to the current and future uncertainty created for employees in local government that has been created as a consequence of the drive for structural reform over recent years. This is not submitted as an argument to not undertake such reform but as a statement that as the process evolves the impact on employees must be given the highest priority. Demographics indicate that staff will be hard to attract and retain in future years. The structural reform process must not be allowed to drive high quality experienced staff from local government. If this happens local government and the community will suffer despite all the perceived increased effectiveness and efficiencies generated by reform (IP243).
The Panel agrees that a decision on reform should be made as soon as practical and, if the decision is to proceed, the process of implementation should then begin without delay.
Concerns about the responsibility for the cost of implementation was another theme identified in the submissions, with a number of respondents stating that the State government should be fully responsible for the cost.
A timeline for implementation must be mapped out and transition costs fully funded by the State government to ensure local authorities are not disadvantaged by the reform process (DF96).
The financial costs of implementing new local governance structures would be significant and the state would be expected to finance that cost (DF123).
The Association has consistently and strongly argued that any State Government imposed reform should be State Government funded. If this does
165 | P a g e

Metropolitan Local Government ReviewFinal Report of the Independent Panel - July 2012
not occur, affected communities will pay for reform which they may not have endorsed or supported (DF130).
Another key issue for the Panel to consider is the funding of any reform processes or amalgamations of Local Governments. The Association contends that State Government reform or State Government imposed amalgamations should be entirely State Government funded. To this end, the Association, in its Budget Submission to the State Government, requested a $100 million allocation for structural reform funding. It must be acknowledged that structural reform requires significant resources to plan and then implement. If structural reform is recommended on efficiency or cost-saving grounds, it is likely to take several years for cost-savings to be realised. For this reason, if structural change is not State Government funded, costs to local communities are likely to increase for several years before costs are reduced (IP246).
The Panel understands the cost of implementation will be significant, but this is not a reason to delay or avoid reform. The costs of doing nothing must also be considered. The Panel notes that the greatest expenditure will be in the earliest phases of implementation, before all of the benefits are fully realised. As Aulich et al. note:
It became clear from our research that in most cases the costs of change and dislocation were underestimated and too rarely factored into the cost-benefit equation for adopting particular options. However, this comment also applies to the ‘do-nothing’ option, which may well have significant opportunity costs by retaining arrangements that clearly need to be improved. Those ‘do-nothing’ costs also need to carefully and openly examined.227
Aulich et al. go on to note the critical role of planning to the success of the new entity:
Potential benefits are reduced or lost when the process is flawed due to inadequate planning and consultation or a failure to consider all the options available and precisely what each could achieve… It follows that moves to consolidation of whatever form should not be rushed. Time is needed to consult widely and properly consider all options and their implications. Appropriate expertise needs to be engaged to explore the issues involved and potential costs and benefits. The additional expenditure and extended timeframe involved are likely to prove less costly than having to repair (or unwind) sub-optimal solutions. 228
In its review of structural reform of Tasmania, Deloitte Access Economics confirms these views ‘…a clear message from this research is that the conditions under which structural reform is conducted (the characteristics of the councils (particularly size and population density) and the structural reform process) are critical to the success of reforms. Poorly conceived or poorly managed structural reforms have been considerably less likely to deliver identifiable economic benefits.’ 229
Implementation must ensure minimum disruption to service delivery and interruptions to existing projects.227 Aulich, C et al (2011), Consolidation in local government: a fresh look, Volume 1: Report, p. 9, viewed 28 June 2012, http://www.acelg.org.au/upload/Consolidation%20Final%20Report%20Vol%201_web.pdf228 Aulich, C et al (2011), Consolidation in local government: a fresh look, Volume 1: Report, p. 7-9, viewed 28 June 2012, http://www.acelg.org.au/upload/Consolidation%20Final%20Report%20Vol%201_web.pdf229 Property Council of Australia, Tasmania (2011), Local government structural reform in Tasmania, p. 22, viewed 28 June 2012, http://www.deloitte.com/assets/DcomAustralia/Local%20Assets/Documents/Industries/Government%20Services/Public%20Sector/Deloitte_Local_Govt%20Structural_Reform.pdf
166 | P a g e

Metropolitan Local Government ReviewFinal Report of the Independent Panel - July 2012
In any recommendations for change, a significant focus needs to be on the transition arrangements that minimize disruption to local government service delivery and allow many of the key strategic projects that are planned or underway to continue without delay, as in many instances those projects are critical to the longer term future of local communities (DF123).
Careful planning will be the responsibility of both State and local government. The State Government should assist by developing an overarching communication and change management strategy and by providing other tools to support local governments undergoing change. Ideally, councils should be taking on a leadership role in this debate and preparing their residents now for the possibility of changes in the future.
In implementing the structural reforms, consideration must be given to the way that community support can be garnered and maintained, and the appropriate resources, guidance and governance provided to councils involved.230
The DLG produced a guide in 2010 containing advice on the strategic and practical considerations of bringing together different local governments. It is based on previous experiences in Western Australia and provides a basis for planning implementation. The guide highlights the need to address issues of identity and perceptions of loss, noting that an effective communication strategy will allay these concerns.231
The guide also notes that the success of any amalgamation is dependent upon the commitment and willingness of staff to embrace the process:
The process of amalgamation will be a stressful time for employees and elected members, they may experience feelings of insecurity brought about by the uncertainty that comes with change. During this time it is imperative that the leadership group responsible for bringing the organisations together have the vision, drive and skills to ensure a seamless and effective transition. The inclusion of employees in the process, combined with regular and clear communication on the progress of the amalgamation will create an environment where employees feel part of the process rather than a victim of it. 232
7.1 THE NEED FOR AN INDEPENDENT BODY
Draft Finding 11 proposed a Local Government Commission (see Section 6). Support for the proposed Commission was mixed, with some respondents objecting to it on the basis that it created an additional layer of bureaucracy, duplicated structures that already exist, or that it would remove decision-making from the hands of the community. However, there was support for the Commission having a specific role in overseeing the implementation process.230 Property Council of Australia, Tasmania (2011), Local government structural reform in Tasmania, p. 3, viewed 28 June 2012, http://www.deloitte.com/assets/DcomAustralia/Local%20Assets/Documents/Industries/Government%20Services/Public%20Sector/Deloitte_Local_Govt%20Structural_Reform.pdf231 Department of Local Government, WA (2010), Local Government Amalgamation Guide 2010, a guide to assist local governments, viewed 28 June 2012, http://dlg.wa.gov.au/OpenFile.ashx?Mode=446E37686749376A356D684D2B6E6D6D4D6E555273773D3D&ContentID=7938336E48634B6E455A733D232 Department of Local Government, WA (2010), Local Government Amalgamation Guide 2010, a guide to assist local governments, p. 5, viewed 28 June 2012, http://dlg.wa.gov.au/OpenFile.ashx?Mode=446E37686749376A356D684D2B6E6D6D4D6E555273773D3D&ContentID=7938336E48634B6E455A733D
167 | P a g e

Metropolitan Local Government ReviewFinal Report of the Independent Panel - July 2012
There is no existing body to oversee what looks like being a significant reform agenda. The Local Government Advisory Board only deals with boundaries and is not considered appropriate for this task (DF123).
Setting up a Local Government Commission will at least send a message to the industry that the reform agenda is to be implemented with clearer guidelines and timeframes (DF150).
If a Local Government Commission is established as proposed in this submission, one of its first major roles could be oversight of the implementation of any reforms stemming from this process. Another option would be to establish a high-level implementation oversight committee. Such a committee should include broad Local Government sector representation. The oversight committee should report on the evaluation of the reforms including social, environmental and economic efficiencies…. At the local level, if structural change is envisaged, implementation committees should be established with Councillor representation from affected Local Governments. Local implementation committees must also be provided with resources to undertake a thorough process in the lead-up to structural reform (IP246).
We agree that a Local Government Commission should be established to oversee the implementation of the local government reform process. Although the Local Government Advisory Board (LGAB) already exists to make recommendations to the Minister on local government reform, history shows that these recommendations are rarely acted upon (DF115).
We believe that this review will provide the potential for a stronger, more effective and more capable local government sector, as long as the findings of the Panel are implemented in a timely and effective manner (DF91).
The Panel supports the idea of an independent Commission being established to oversee reform.
While some local governments may have the capacity and specialised staff to provide the necessary skills and leadership, not all will. In the Tasmanian context it was observed that it is:
‘…likely that amalgamated councils will in many cases lack the knowledge and expertise to manage the implementation process in the most effective fashion. Therefore, there is an important role for state government – or an appropriate independent authority – to provide advice and resources to councils throughout the early stages of the reform. Ensuring councils are adequately equipped to reconfigure their asset management strategies; staffing profiles; maintenance contracts and fiscal strategies will be imperative to realisation of the potential benefits and to minimisation of the transition costs. As such, it may be prudent for the relevant state agency responsible for implementing council restructuring to provide guidelines and support for managing this process’. 233
There are similar arguments for State Government support to the implementation process in metropolitan Perth.
233 Property Council of Australia, Tasmania (2011), Local government structural reform in Tasmania, p. 36, viewed 28 June 2012, http://www.deloitte.com/assets/DcomAustralia/Local%20Assets/Documents/Industries/Government%20Services/Public%20Sector/Deloitte_Local_Govt%20Structural_Reform.pdf
168 | P a g e
Metropolitan Local Government ReviewFinal Report of the Independent Panel - July 2012
There is a danger that the benefits of restructuring will be lost for some years to come if too great a reliance is placed on the ability of the reformed local governments to implement change. Matters such as the integration of financial systems, strategic plans, budgets, asset management, staffing structures and local planning schemes need to be addressed prior to the new entities coming into being so that the new bodies can ‘hit the ground running’ from a given implementation date (DF139).
Experiences in Auckland suggest a dedicated Transition Agency may be useful to oversee the implementation. As one submission proposed, the Agency (or Agencies if there were fewer than 10 proposed local governments, one for each City) would have wide-ranging powers, and require different skills and functions to the policy-oriented functions of the Commission. It would operate over a transition period of approximately two years.
The Transition Agency/ies would be charged with the responsibility to consolidate the budgets, annual plans, asset management and financial systems and to establish new staffing structures for each of the proposed new local governments. During this period, the existing local governments would continue to operate as normal except that they would require the approval of the Transition Agency to any major commercial transaction, policy initiative or staff recruitment.
The Transition Agency/ies would be responsible for the appointment of interim Chief Executives on limited term contracts for each proposed new local government, and would operate with a combination of staff seconded from within local government and experienced external personnel. Funding should be through a combination of one-off State funding and the disposal of surplus property assets held by local governments
Following elections conducted by the Australian Electoral Commission and on a nominated date, the existing local governments would be legally disestablished and new ones created with their initial Councils, budgets, staffing and systems already in place. In the event that the State endorses the concept of local government enterprises/Council controlled organisations, these should also be established in the transition period and the Boards and management put in place prior to ownership passing to the new entities (DF139).
The Auckland example is unique in that it was transitioning to one entity. In Queensland, the Local Government Reform Commission’s responsibility was to make recommendations for the implementation of local government boundary changes which the State Government managed. It was established by legislation (the Local Government Reform Implementation Act 2007 (Qld)), which also allowed for the creation of reform implementation regulations. A regulation was subsequently made under the Local Government Act 1993 (Qld) to establish the framework for the transfer of employees, assets, liabilities and property between local governments in accordance with an agreed allocation methodology.234
Establishing a Local Government Commission may mean that the role of the DLG will need to be reconsidered, particularly during the implementation phase, and 234 Department of Local Government, Sport and Recreation, Queensland (2007), Local Government Reform: Transferring Areas Allocation Methodology, viewed 28 June 2012,
http://www.dlgp.qld.gov.au/resources/guideline/local-government/transferring-areas-allocation-methodology.pdf
169 | P a g e

Metropolitan Local Government ReviewFinal Report of the Independent Panel - July 2012
afterwards if Commission continued to exist. In the short-term, the Panel prefers that the responsibility of implementation should belong to an independent body and the Department should act in an advisory capacity. In the long-term, its role should be evaluated in conjunction with the role of the Commission. WALGA noted in its submission on the Issues Paper, that there is a potential conflict of interest in the Department’s dual roles of compliance and capacity building (IP246). This could be resolved by leaving responsibility for compliance with the Department and moving the role of training and capacity building to the Commission.
A Local Government Commission, combining State and local government representatives reporting to the Premier could help manage the critical relationship between State and local government. While local government is essentially a ‘creature of the state’, the Commission would go some way towards equalising the power in the relationship. The Commission could negotiate and oversee future changes in the role of local government. It could also oversee the implementation of the Panel’s recommendations, including the boundary change process. The Local Government Commission would need an independent chair and members with significant experience in State and local government.
For example, the Local Government Commission could consider the integration of State and local planning requirements for government and non-government schools. The Panel has heard from the education sector that different planning requirements are imposed on government and non-government schools, and that these are different in inner and outer areas of the metropolitan region (IP74; IP120). A more consistent approach would seem desirable and would benefit the wider community.
7.2 ISSUES FOR CONSIDERATION IF BOUNDARY CHANGES OCCUR
The DLG amalgamation guide235 provides advice on the strategic and practical considerations when bringing together different local governments: strategic issues – change management, combining cultures, due diligence
operational issues – accommodation, badging, compliance
human resources – awards and agreements, job descriptions, grievances
systems – asset management, communications, finance, human resources, information technology
finance – budget, annual report, bank accounts, capital works, grants
legal issues – contracts, leases, local laws
electoral matters – elections, wards, representation
council – meetings, fees, committees, elections.
Throughout the course of the Review various stakeholders also presented practical suggestions for implementation. Of the many complex issues brought to the Panel’s attention, the following are particularly significant, and require further detailed consideration as part of the implementation phase.
Rates
235 Department of Local Government, WA (2010), Local Government Amalgamation Guide 2010, a guide to assist local governments, viewed 28 June 2012, http://dlg.wa.gov.au/OpenFile.ashx?Mode=446E37686749376A356D684D2B6E6D6D4D6E555273773D3D&ContentID=7938336E48634B6E455A733D
170 | P a g e

Metropolitan Local Government ReviewFinal Report of the Independent Panel - July 2012
Local governments rate properties differently, and there is the potential for rates to rise in some areas. For example, in local governments where the residential rates are subsidised by commercial rates, residential rates may rise after boundary changes occur. In other local governments they may be reduced. Managing the equalisation of rates will require careful planning and communication. It may be desirable for rates increases to be capped at the consumer price index for the first two years after amalgamation, pending a phased introduction of new rating levels.
LegislationThere is the possibility to operate the Local Government Act 1995 on a transitional basis, i.e. to defer requirements under the Act. This possibility should be used to the fullest extent possible.
There is some legislation specific to individual local governments that might require consideration, e.g. City of Fremantle and Town of East Fremantle Trust Funds Act 1961 and Cambridge Endowment Lands Act 1920.
The Panel has reviewed the progress of voluntary reform to date, and has concluded a local government reform Act will be necessary for implementation to occur swiftly. The proposed Act will establish the Local Government Commission, and remove the impediments to reform from the current Act. As noted above, the Panel considers swift implementation to be in the best interests of the sector and the community.
Human resourcesOne implication of reform is the difference in salary between employees of different local governments due to variation in their enterprise agreements. Any merger of local governments across the metropolitan area will have major budget implications due to the need for salary and wage equalisation. Salaries tend to rise to the level of the highest paid workers.
Furthermore, schedule 2.1 cl.11(4) of the Local Government Act 1995 states that staff from amalgamating local governments are not to have their contract of employment terminated or varied unless:
a) compensation acceptable to the person is made; or b) a period of at least 2 years has elapsed since the order had effect.
The clause is designed to protect employees from the effects of amalgamation, but it also means that some savings will not be seen for at least two years.
Splitting existing local governmentsAs previously discussed in the Panel’s preferred model section, the Panel was advised amalgamating local governments was preferred to splitting them. The Panel has examined numerous options for reconfigured boundaries and is not convinced that amalgamations alone will produce the optimum result. The Panel has noted the complexities associated with splitting local governments, but it has come to the conclusion they are not insurmountable. In order to meet the needs of the community in the long-term, splitting local governments is necessary.
As noted earlier, in order to expedite the implementation process, State Government intervention will be required, especially to assist with the complex negotiations that arise when local governments are split. Otherwise, this could be used as grounds to postpone action.
171 | P a g e

Metropolitan Local Government ReviewFinal Report of the Independent Panel - July 2012
7.3 THE PANEL’S VIEW AND FINDINGS
Whilst accepting that there are many issues relating to implementation, the Panel believes that its proposed options are achievable.
Timely implementation will be critical to the success of the proposal. The sector has consistently expressed concern with the damage caused by the uncertainty of the process to date, in terms of loss of staff to other sectors, loss of morale, and an inability to attract new staff. Further delay after a decision has been made is likely to cause further damage.
An exceptional level of planning will be required to ensure a smooth transition period and reduce interruptions to service delivery. Inadequate planning could result in the failure of the new entity, either through financial or other difficulties, or a lack of community support for it.
Responsibility for the implementation of the proposals should not solely rest with the local governments concerned. Oversight of the process is required by an independent body, either through a Local Government Commission or a Transition Agency.
Change management will form an essential part of the transition period, to address the variety of concerns and anxieties expressed by stakeholders. It will also need to mitigate attempts to delay or stall the process from those who do not support change. A Transition Committees that ensures community involvement is one way to assist change management.
The cost of implementation will be significant, with the greatest expenditure in the earliest phase of implementation before all of the benefits are fully realised. However, this is not a good reason to maintain the status quo.
Although it will be complex, splitting existing local governments is necessary in order to produce the best outcomes for communities in the long term.
Legislative change, that sets up an independent body to oversee reform, and removes the impediments in the existing Act, is required to progress implementation in a timely manner.
Throughout the Review the Panel has come to the conclusion that if change is to happen, it should be done fully and properly. The Panel has carefully considered the many components required to bring about effective change, in light of the many pressures and challenges for metropolitan Perth. It has carefully chosen its recommendations to work together as a suite. While some of the recommendations may bring benefit if adopted alone, the Panel strongly recommends they be considered as a complete reform package and be implemented in their entirety.
7.4 RECOMMENDATIONS
The Panel recommends that:
26. A State Government decision on reform should be made as soon as possible, and if the decision is to proceed with structural reforms, the process of implementation should begin without delay.
172 | P a g e

Metropolitan Local Government ReviewFinal Report of the Independent Panel - July 2012
27. Councils take on a leadership role in the reform debate and prepare their residents now for the possibility of changes in the future.
28. The State Government assist and support local governments by providing tools to cope with change and developing an overarching communication and change management strategy.
29 A Local Government Commission be established as an independent body to administer and implement the structural and governance reforms recommended by the Panel, and facilitate the ongoing relationship between State Government and local government.
30. The recommendations from the Panel should be considered as a complete reform package and be implemented in their entirety.
173 | P a g e

Metropolitan Local Government ReviewFinal Report of the Independent Panel - July 2012
APPENDICES
Appendix 1.1 – Submissions received on the Issues Paper
Appendix 1.2 –Submissions received on the Draft Findings
Appendix 2 – Engagement and consultation by the Panel during the Review process
Appendix 3.1 – Regional arrangements for government in metropolitan Perth
Appendix. 3.2 – COAG Criteria for future strategic planning of capital cities
Appendix 4 – Advantages and disadvantages of options considered by the Panel
174 | P a g e

Metropolitan Local Government ReviewFinal Report of the Independent Panel - July 2012
Appendix 1.1 Issues Paper submissions
IP1 Peter BestIP2 Confidential submission, name withheldIP3 Janet ReidIP4 Confidential submission, name withheldIP5 Ken WatersIP6 Confidential submission, name withheldIP7 Colin HughesIP8 Ian CarlisleIP9 Robert ElliottIP10 Colin EdwardsIP11 Confidential submission, name withheldIP12 Confidential submission, name withheldIP13 Confidential submission, name withheldIP14 Confidential submission, name withheldIP15 Confidential submission, name withheldIP16 Peter Best no. 2IP17 Colette WiltshireIP18 Keith HayesIP19 Laurie TaylorIP20 Peter Best no. 3IP21 Peter McGowanIP22 Sandra BrownIP23 Trevor Vaughan (Mayor, Victoria Park)IP24 David KarrIP25 Kevin WulffIP26 Peter TallentireIP27 Rebecca JoelIP28 Ross KendallIP29 Confidential submission, name withheldIP30 Confidential submission, name withheldIP31 Mary JenkinsIP32 Tom StannageIP33 Confidential submission, name withheld IP34 Confidential submission, name withheldIP35 Confidential submission, name withheldIP36 Confidential submission, name withheldIP37 Confidential submission, name withheldIP38 Confidential submission, name withheldIP39 Prapti MehtaIP40 Glenys GodfreyIP41 Confidential submission, name withheldIP42 Robert MitchellIP43 Bevan and Jennie Carter IP44 Carol EverettIP45 Confidential submission, name withheldIP46 Neil McleanIP47 Ian WynessIP48 Karry-Leeanne FisherIP49 DonnaIP50 Blake WoodIP51 Lee Bond
IP52 Bayswater City Residents AssociationIP53 Committee for PerthIP54 Confidential submission, name withheldIP55 Peter Best no. 4IP56 City of PerthIP57 City of Perth no. 2IP58 City of Perth no. 3IP59 Confidential submission, name withheldIP60 Tony NoakesIP61 Confidential submission, name withheldIP62 Graeme KingIP63 Confidential submission, name withheldIP64 Tom BurbidgeIP65 Tim PriestIP66 JimIP67 Neville HillsIP68 Linda MacriIP69 Town of Mosman Park no. 2IP70 Eastern Metropolitan Regional CouncilIP71 Hovea Residents & Ratepayers
AssociationIP72 Cleaver Precinct Action GroupIP73 Keith HughesIP74 Catholic Education Office of Western
AustraliaIP75 Richard and Stephanie BarsdenIP76 Lynley HewettIP77 Confidential submission, name withheldIP78 Confidential submission, name withheldIP79 Des MillsIP80 Jenny JohnsonIP81 Mitchell HicksonIP82 Confidential submission, name withheldIP83 Peter J Tallentire no. 2IP84 Town of ClaremontIP85 Shire of KalamundaIP86 Shire of MundaringIP87 John KitchingIP88 Jenny Johnson no. 2IP89 Shire of Lake GraceIP90 City of SwanIP91 Tim Priest no.2IP92 City of CockburnIP93 Rob WelshIP94 Confidential submission, name withheldIP95 City of ArmadaleIP96 Gwyneth DeanIP97 City of South PerthIP98 Tony FowlerIP99 City of SubiacoIP100 Confidential submission, name withheld
175 | P a g e

Metropolitan Local Government ReviewFinal Report of the Independent Panel - July 2012
IP101 City of BayswaterIP102 Confidential submission, name withheldIP103 Confidential submission, name withheldIP104 Bill HassellIP105 Stephen FoxIP106 Kevin Wulff no. 2IP107 A J DowningIP108 Confidential submission, name withheldIP109 Helen Dullard (Shire of Mundaring,
President)IP110 Confidential submission, name withheldIP111 City of VincentIP112 Town of BassendeanIP113 Town of CambridgeIP114 City of GosnellsIP115 City of JoondalupIP116 Tourism Western AustraliaIP117 Rottnest Island AuthorityIP118 Confidential submission, name withheldIP119 Confidential submission, name withheldIP120 Association of Independent Schools of
Western AustraliaIP121 Confidential submission, name withheldIP122 Confidential submission, name withheldIP123 Confidential submission, name withheldIP124 State Heritage CouncilIP125 Swan River TrustIP126 Confidential submission, name withheldIP127 Rivers Regional CouncilIP128 Regional Development Australia (Perth
Committee)IP129 Australian Hotels Association (WA)IP130 Clubs WAIP131 Confidential submission, name withheldIP132 Confidential submission, name withheldIP133 Marie SlythIP134 Confidential submission, name withheldIP135 Confidential submission, name withheldIP136 Richard ZawadaIP137 Confidential submission, name withheldIP138 Confidential submission, name withheldIP139 Confidential submission, name withheld IP140 Confidential submission, name withheldIP141 Confidential submission, name withheldIP142 Confidential submission, name withheldIP143 Roy SonnemannIP144 Confidential submission, name withheldIP145 Confidential submission, name withheldIP146 Richard SloanIP147 Confidential submission, name withheldIP148 Town of KwinanaIP149 Confidential submission, name withheldIP150 Confidential submission, name withheld
IP151 Confidential submission, name withheld
IP152 Confidential submission, name withheldIP153 Town of CottesloeIP154 Shire of Peppermint GroveIP155 Property Council of Australia (WA)IP156 Confidential submission, name withheldIP157 A J Downing no. 2IP158 Be Active WAIP159 Bruce HaynesIP160 City of MelvilleIP161 City of NedlandsIP162 David LeithIP163 Shelter WAIP164 Future Perth Inc.IP165 LandgateIP166 Owen LonerganIP167 Peter and Jeanette HowatIP168 Ralph PrestageIP169 Ranjan RayIP170 Physical Activity TaskforceIP171 Richard and Stephanie Barsden no. 2IP172 Richard and Sue FoxIP173 Confidential submission, name withheldIP174 Robert Mitchell no. 2IP175 Scott ArbuckleIP176 City of Armadale no. 2IP177 Confidential submission, name withheldIP178 Confidential submission, name withheldIP179 Confidential submission, name withheldIP180 Confidential submission, name withheldIP181 Confidential submission, name withheldIP182 Confidential submission, name withheldIP183 Confidential submission, name withheldIP184 Confidential submission, name withheldIP185 E JonesIP186 Effie NicholsonIP187 Confidential submission, name withheldIP188 Confidential submission, name withheldIP189 Confidential submission, name withheldIP190 Confidential submission, name withheldIP191 Confidential submission, name withheldIP192 Confidential submission, name withheldIP193 Luis Garcia-ValleIP194 Matthew NegusIP195 Confidential submission, name withheldIP196 Confidential submission, name withheldIP197 Confidential submission, name withheldIP198 P ForrestIP199 Confidential submission, name withheldIP200 Confidential submission, name withheldIP201 Confidential submission, name withheldIP202 Confidential submission, name withheldIP203 Confidential submission, name withheldIP204 Confidential submission, name withheld
176 | P a g e

Metropolitan Local Government ReviewFinal Report of the Independent Panel - July 2012
IP205 Trevor PrestageIP206 Confidential submission, name withheldIP207 Confidential submission, name withheldIP208 John LangfordIP209 Confidential submission, name withheldIP210 Nicola Dilorio IP211 A Beautiful CityIP212 Confidential submission, name withheldIP213 Confidential submission, name withheldIP214 Confidential submission, name withheldIP215 Confidential submission, name withheldIP216 City of MandurahIP217 Confidential submission, name withheldIP218 Confidential submission, name withheldIP219 Confidential submission, name withheldIP220 Confidential submission, name withheldIP221 Town of Victoria ParkIP222 Confidential submission, name withheldIP223 Confidential submission, name withheld IP224 City of WannerooIP225 Mindarie Regional CouncilIP226 Department of HealthIP227 LotterywestIP228 Confidential submission, name withheldIP229 William KenworthyIP230 Department of Culture and ArtsIP231 National TrustIP232 Confidential submission, name withheldIP233 Confidential submission, name withheldIP234 Confidential submission, name withheldIP235 Confidential submission, name withheldIP236 Confidential submission, name withheldIP237 Confidential submission, name withheldIP238 Confidential submission, name withheldIP239 Confidential submission, name withheldIP240 Confidential submission, name withheldIP241 Jan StarIP242 Swan Chamber of CommerceIP243 Local Government Managers Australia
WA (LGMA)IP244 City of RockinghamIP245 Confidential submission, name withheldIP246 Western Australian Local Government
Association (WALGA)IP247 Confidential submission, name withheldIP248 Municipal Waste Advisory Council
(MWAC)IP249 Dennis Grimwood no. 2
177 | P a g e

Metropolitan Local Government ReviewFinal Report of the Independent Panel - July 2012
Appendix 1.2 Submissions received on the Draft Findings
DF1 David McGarrDF2 Colin HughesDF3 Confidential submission, name withheldDF4 David KarrDF5 Paul CluneDF6 Confidential submission, name withheldDF7 Meta DohertyDF8 Confidential submission, name withheldDF9 Vince RussoDF10 Russell KyteDF11 Confidential submission, name withheldDF12 Chilla BulbeckDF13 Bruce HaynesDF14 Irene TanDF15 Dante GiacominDF16 Reg KellyDF17 Confidential submission, name withheldDF18 Confidential submission, name withheldDF19 Confidential submission, name withheldDF20 Faye BlytheDF21 Jon Van Der PeylDF22 Helen LeederDF23 Hugh RichardsonDF24 Frank RobertsDF25 David GrahamDF26 Confidential submission, name withheldDF27 Reg Kelly no. 2DF28 Town of Victoria ParkDF29 State Heritage CouncilDF30 Confidential submission, name withheldDF31 Rob McEvoyDF32 John & Rosemary SmithDF33 Peter RavineDF34 Confidential submission, name withheldDF35 Gavin WilkinsonDF36 Jeremy MoweDF37 Lynley HewettDF38 Edwin SchuetzDF39 Eigil NielsenDF40 Confidential submission, name withheldDF41 Confidential submission, name withheldDF42 GregDF43 Gail HarwoodDF44 Mary JenkinsDF45 Des MillsDF46 Angela HamersleyDF47 City of MelvilleDF48 Gail McGowanDF49 Ken EastwoodDF50 Shire of DumbleyungDF51 Confidential submission, name withheldDF52 Ian Foster
DF53 Robert MitchellDF54 BlakeDF55 Ron PawsonDF56 City of PerthDF57 Central Country Zone of WALGADF58 JMH Action GroupDF59 Great Eastern Country Zone of WALGADF60 Confidential submission, name withheldDF61 Swan Chamber CommerceDF62 Confidential submission, name withheldDF63 Town of Mosman ParkDF64 City of NedlandsDF65 Confidential submission, name withheldDF66 Peter WoodwardDF67 Shire of WaginDF68 Lesley FisherDF69 Shire of KalamundaDF70 John Hyde MLADF71 Cynthia PickeringDF72 Confidential submission, name withheldDF73 PaulDF74 Derek LeederDF75 Pamela MeehanDF76 Confidential submission, name withheldDF77 Peter ForrestDF78 Max Hipkins (City of Nedlands, Mayor)DF79 City of South PerthDF80 Mark WilsonDF81 Confidential submission, name withheldDF82 Confidential submission, name withheldDF83 Tom BurbidgeDF84 Ines JancaDF85 Confidential submission, name withheldDF86 Ranjan and Linda RayDF87 Confidential submission, name withheldDF88 Confidential submission, name withheldDF89 City of GosnellsDF90 Mount Helena Ratepayers AssociationDF91 Committee for PerthDF92 City of BayswaterDF93 Shire of KulinDF94 Eastern Metropolitan Regional CouncilDF95 Future Perth Inc.DF96 City of SwanDF97 Western Metropolitan Regional CouncilDF98 Neville HillsDF99 Shire of MundaringDF100 Lorraine DellaDF101 Aidan TunneyDF102 Confidential submission, name withheldDF103 Confidential submission, name withheldDF104 Confidential submission, name withheld
178 | P a g e

Metropolitan Local Government ReviewFinal Report of the Independent Panel - July 2012
DF105 City of StirlingDF106 City of WannerooDF107 Shelter WADF108 City of JoondalupDF109 Western Suburbs Regional Organisation of
CouncilsDF110 Coogee Beach Progress AssociationDF111 Confidential submission, name withheldDF112 Leah CarterDF113 Rivers Regional CouncilDF114 Confidential submission, name withheldDF115 City of MandurahDF116 Banjup Residents GroupDF117 Peter HowatDF118 Robin Chapple MLCDF119 Linda RogersDF120 Confidential submission, name withheldDF121 Heather Henderson (City of Subiaco, Mayor)DF122 Sally PyvisDF123 City of FremantleDF124 Peter OlneyDF125 City of BelmontDF126 SOS CottesloeDF127 Peter StephensonDF128 Town CambridgeDF129 City of BusseltonDF130 Western Australian Local Government Association (WALGA)DF131 Local Government Managers Australia WA (LGMA)DF132 John LangfordDF133 Jan StarDF134 Confidential submission, name withheldDF135 Jim DowningDF136 Dennis GrimwoodDF137 Confidential submission, name withheldDF138 Confidential submission, name withheldDF139 Raymond DavyDF140 Confidential submission, name withheldDF141 Lee HemsleyDF142 Confidential submission, name withheldDF143 Town of CottesloeDF144 Judy BlythDF145 City of RockinghamDF146 Confidential submission, name withheldDF147 Municipal Waste Advisory Council (MWAC)DF148 Bayswater City Residents AssociationDF149 Wheatbelt Development Commission
DF150 Shire of DardanupDF151 City of ArmadaleDF152 City of CockburnDF153 Alan LonsdaleDF154 Owen LoneraganDF155 Confidential submission, name withheldDF156 Marlon AllmarkDF157 Peter HodgeDF158 Institute of Public Works Engineering Australia (WA) (IPWEA)DF159 Library Board of Western AustraliaDF160 Urban Development Institute of Australia (WA Division)DF161 City of CanningDF162 Town of East FremantleDF163 Clubs WADF164 Colin LatchemDF165 Neil KentishDF166 Michael Le VauxDF167 David Smith (City of Bunbury, Mayor)DF168 Confidential submission, name withheldDF169 Lee BondDF170 Margaret NowakDF171 Department of Mines and PetroleumDF172 Esme and Humphery ParkDF173 Jean LaingDF174 Town of KwinanaDF175 Confidential submission, name withheldDF176 City of VincentDF177 Confidential submission, name withheldDF178 Confidential submission, name withheldDF179 Confidential submission, name withheldDF180 Confidential submission, name withheldDF181 Confidential submission, name withheldDF182 The University of Western AustraliaDF183 Confidential submission, name withheldDF184 David BigginsDF185 Confidential submission, name withheldDF186 Confidential submission, name withheldDF187 Confidential submission, name withheldDF188 Confidential submission, name withheldDF189 Karl Herbert TiteliusDF190 Confidential submission, name withheldDF191 Office of Commissioner of PoliceDF192 Department of EducationDF193 Confidential submission, name withheldDF194 Confidential submission, name withheldDF195 Department of TreasuryDF196 Peel-Harvey Catchment Council
179 | P a g e

Metropolitan Local Government ReviewFinal Report of the Independent Panel - July 2012
Appendix 2 Engagement and consultation by the Panel during the ReviewForumsThe Panel held three consultation forums in November 2011. The first was targeted at local governments only, the next two were open to members of the public but local government representatives were invited to attend if they had been unable to attend the first session.
The two community forums were promoted by: A letter from the Panel directly to 170 key stakeholders, including all
identifiable ratepayer organisations, State government agencies, WALGA and community groups. Stakeholders were asked to circulate information about the forums to their members.
A letter directly to all members of Parliament.
Advertisements (1/4 page sized) placed in the West Australian, the WA Business News, and all 17 Community Newspapers.
A prominent box was placed on the home page of the Metro Review website (www.metroreview.dlg.wa.gov.au) with a link to a page dedicated to the forums (see below). The forum page included maps of the venues where the forums were held.
Two stakeholders placed notice of the forums via their social media.
WALGA provided information on the sessions in its Metro Reform Update newsletter to the local government sector.
The Minister sent letters or emails to 190 individuals and organisations that had contacted him in relation to local government during the last twelve months, and to 76 organisations identified by the Office of Multicultural Interests. The letter directed recipients to the website for information on the forums.
In addition, metropolitan local governments were specifically invited via: a letter from the Chairman directly to Mayors and Presidents
an email directly to all local government CEOs, with a second follow-up email reminder
a circular to all 139 local governments in the state
an email to all metropolitan elected members.
Metropolitan local governments were asked to promote the forums to their residents. At least five metropolitan local governments assisted and placed a link to the Metro Review website on their home pages. At least one Member of Parliament placed a link to the forums on thier website.
Forum OneDate: 12 November 2011Audience: Local government representativesLocation: University of Western Australia, NedlandsAttendees: Approximately 60
Forum TwoDate: 19 November 2011Audience: General publicLocation: Curtin University, BentleyAttendees: Approximately 27
180 | P a g e
Metropolitan Local Government ReviewFinal Report of the Independent Panel - July 2012
181 | P a g e

Metropolitan Local Government ReviewFinal Report of the Independent Panel - July 2012
Forum ThreeDate: 26 November 2011Audience: General publicLocation: Edith Cowan University, Mount LawleyAttendees: Approximately 40
Meetings with metropolitan local government representativesWhen the Issues Paper was released in October 2011, the 30 metropolitan local governments were invited to meet one-on-one with the Panel, 25 of which accepted. The following local governments accepted the Panel’s invitation to meet:
ArmadaleBassendeanBayswaterBelmontCambridgeCockburnEast FremantleFremantleGosnells JoondalupKalamundaKwinanaMelville
Mosman ParkMundaringNedlandsPerthRockinghamSerpentine-JarrahdaleSouth PerthStirlingSubiacoSwanVincentWanneroo
Claremont, Cottesloe, Peppermint Grove and Victoria Park provided the Panel with written submissions on the Issues Paper, but did not meet with the Panel. Fremantle and East Fremantle met with the Panel but did not provide written submissions. Canning did not make a submission or meet with the Panel.
Meetings with other local governments, stakeholders and organisationsThe Panel also met with representatives from the following organisations:
Association of Independent SchoolsCatholic Education Office WAChamber of Commerce and IndustryCity of MandurahCommittee for PerthDepartment of CommunitiesDepartment of EducationDepartment of Environment and ConservationDepartment of HealthDepartment of HousingDepartment of Local GovernmentDepartment of PlanningDepartment of Sport and RecreationDepartment of TransportDepartment of TreasuryDepartment of WaterEast Metropolitan Regional CouncilFuture PerthLandcorpLocal Government Advisory Board Local Government Managers Association, WA division
182 | P a g e

Metropolitan Local Government ReviewFinal Report of the Independent Panel - July 2012
Municipal Waste Advisory CouncilRivers Regional CouncilWA Electoral CommissionWestern Australian Local Government Association
The Panel also met with Mike Balfe, a community member.
Issues Paper and Draft FindingsThe Panel released two documents for public comment during the Review: an Issues Paper in October 2011 and Draft Findings in April 2012. Both documents were available in multiple formats on the Panel’s website, and in hard copy.
The release of both the Issues Paper and Draft Findings were accompanied by advertising in printed media and significant coverage in electronic and printed media. Copies of the documents were sent directly to all stakeholders. Over 250 and 190 submissions were received on each paper respectively. The majority of submissions were available to read on the Panel’s website (the remainder declined permission to make their submission public).
Panel websiteFrom October 2011, the Panel maintained a website, where all relevant documents were publicly available. This include the papers and information it considered , and the submissions on the Issues Paper and Draft Findings. The Panel also used its website to post information about upcoming events. At the time of submitting this Final Report, the Panel’s website has had almost 20,000 hits.
183 | P a g e
Metropolitan Local Government ReviewFinal Report of the Independent Panel - July 2012
Appendix 3.1
Regional arrangements for government in metropolitan Perth
Local government
WALGA Zone
ABS region
NRM region
Regional Councils
Regional Organisation of Councils
Regional Road Group
Regional Road sub-group
Development Assessment Panel
Planning subregion (D31)
District Planning Committee*
Perth Airport Municipalities Group (PAMG)
C21 Policy forum
Perth Central Central Perth Mindarie, Tamala Park Perth Central Perth Central Central Perth C21
Vincent Central Central Perth Mindarie, Tamala Park Perth Central West Central North West C21
Cambridge Central Central Perth Mindarie, Tamala Park Perth Western West Central Western
suburbs
Subiaco Central Central Perth WMRC WESROC Perth Central West Central Western suburbs C21
Nedlands Central Central Perth WESROC Perth Western West Central Western suburbs C21
Claremont Central Central Perth WMRC WESROC Perth Western West Central Western suburbs C21
Cottesloe Central Central Perth WMRC WESROC Perth Western West Central Western suburbs C21
Peppermint Grove Central Central Perth WMRC WESROC Perth Western West Central Western
suburbs C21
Mosman Park Central Central Perth WMRC WESROC Perth Western West Central Western suburbs C21
Fremantle SouthSouth-west metro
Perth SMRC South-west group Perth South-west South-west
metro Central South-west C21
East Fremantle South
South-west metro
Perth SMRC South-west group Perth South-west South-west
metro Central South-west C21
Melville SouthSouth-west metro
Perth SMRC South-west group Perth South-west Central Central South-west PAMG C21
Cockburn South South-west
Perth SMRC South-west group
Perth South-west South-west metro
South-west South-west PAMG
184 | P a g e

Metropolitan Local Government ReviewFinal Report of the Independent Panel - July 2012
Local government
WALGA Zone
ABS region
NRM region
Regional Councils
Regional Organisation of Councils
Regional Road Group
Regional Road sub-group
Development Assessment Panel
Planning subregion (D31)
District Planning Committee*
Perth Airport Municipalities Group (PAMG)
C21 Policy forum
metro
Kwinana SouthSouth-west metro
Perth SMRC South-west group Perth South-west South-west
metro South-west South-west
Rockingham SouthSouth-west metro
Perth SMRC South-west group Perth South-west South-west
metro South-west South-west
Serpentine-Jarrahdale
South-east
South-east metro
Peel Rivers Perth South-east East metro South-east South-east C21
Armadale South-east
South-east metro
Perth Rivers Perth South-east East metro South-east South-east PAMG C21
Gosnells South-east
South-east metro
Perth Rivers Perth South-east East metro South-east South-east PAMG C21
Canning South-east
South-east metro
Perth Perth South-east Central Central South-east C21
South Perth South-east
South-east metro
Perth Rivers Perth South-east Central Central South-east PAMG C21
Victoria Park South-east
South-east metro
Perth Mindarie, Tamala Park Perth South-east Central Central South-east C21
Kalamunda East East metro Perth EMRC Perth Eastern East metro North-east Eastern PAMG C21
Mundaring East East metro Perth EMRC Perth Eastern East metro North-east Eastern PAMG C21
Swan East East metro Perth EMRC Perth Eastern East metro North-east Eastern PAMG C21
Belmont EastSouth-east metro
Perth EMRC Perth South-east Central Central Eastern PAMG C21
Bassendean East East metro Perth EMRC Perth Eastern Central Central Eastern PAMG C21
185 | P a g e

Metropolitan Local Government ReviewFinal Report of the Independent Panel - July 2012
Local government
WALGA Zone
ABS region
NRM region
Regional Councils
Regional Organisation of Councils
Regional Road Group
Regional Road sub-group
Development Assessment Panel
Planning subregion (D31)
District Planning Committee*
Perth Airport Municipalities Group (PAMG)
C21 Policy forum
Bayswater East East metro Perth EMRC Perth Eastern Central Central Eastern PAMG C21
Stirling North North Perth Mindarie,* Tamala Park Perth North-west North-west
metro Central North-west C21
Joondalup North North Perth Mindarie, Tamala Park Perth North-west North-west
metro North-west North-west
Wanneroo North North Perth Mindarie, Tamala Park Perth North-west North-west
metro North-west North-west
186 | P a g e

Metropolitan Local Government ReviewFinal Report of the Independent Panel - July 2012
Local government
RDA Regional Development
Chamber of Commerce
Health Community Advisory Council
Local Emergency Management Committee
District Emergency Management Committee
Police sub-districts
Department of Health
Department of Education
Other Other
Perth Perth Perth Perth Central Central North (Lower North West Metro)
West Coast Council of Capital City Lord Mayors
World Energy Cities Partnership
Vincent Perth Western Central Central Central North (Lower North West Metro)
West Coast
Cambridge Perth Western Central Central Central North (Lower North West Metro)
West Coast
Subiaco Perth Subiaco Western Central Central Central North (Lower North West Metro)
West Coast
Nedlands Perth Western Central Central Central North (Lower North West Metro)
West Coast
Claremont Perth Western Central Central Central North (Lower North West Metro)
West Coast
Cottesloe Perth Western Central Central Central North (Lower North West Metro)
West Coast
Peppermint Grove
Perth Western Central Central Central North (Lower North West Metro)
West Coast
Mosman Park Perth Western Central Central Central North (Lower North West Metro)
West Coast
Fremantle Perth Fremantle Fremantle-East Fremantle
South South South (Fremantle)
Fremantle - Peel
East Fremantle
Perth Fremantle-East Fremantle
South South South (Fremantle)
Fremantle - Peel
Melville Perth Melville Cockburn
Melville South South South (Fremantle)
Fremantle - Peel
187 | P a g e

Metropolitan Local Government ReviewFinal Report of the Independent Panel - July 2012
Local government
RDA Regional Development
Chamber of Commerce
Health Community Advisory Council
Local Emergency Management Committee
District Emergency Management Committee
Police sub-districts
Department of Health
Department of Education
Other Other
Cockburn Perth Melville Cockburn
Cockburn South South South (Fremantle)
Fremantle - Peel
Cockburn Sound Management Council
Kwinana Industries Council, National Growth Councils Alliance
Kwinana Perth Rockingham Kwinana Planning and Development Taskforce
Rockingham Kwinana
Rockingham Kwinana
Kwinana South South South (Rockingham – Kwinana)
Fremantle - Peel
Cockburn Sound Management Council
Kwinana Industries Council, National Growth Councils Alliance
Rockingham Perth Rockingham Kwinana Planning and Development Taskforce
Rockingham Kwinana
Rockingham Kwinana
Rockingham South South South (Rockingham – Kwinana)
Fremantle - Peel
Cockburn Sound Management Council
Kwinana Industries Council, National Growth Councils Alliance
Serpentine-Jarrahdale
Peel Peel RDC Peel Armadale Serpentine-Jarrahdale
Peel Peel South (Armadale)
Canning National Growth Councils Alliance
Armadale Perth Armadale Armadale Armadale South-east South-east
South (Armadale)
Canning National Growth Councils Alliance
Gosnells Perth Gosnells Armadale Gosnells South-east South-east
South (Armadale)
Canning National Growth Councils Alliance
Canning Perth Canning Canning/South Perth
South-east South-east
South (Bentley)
Canning
South Perth Perth South Perth Canning/South Perth
South-east South-east
South (Bentley)
Canning
Victoria Park Perth Victoria Park Belmont Victoria Park
South-east South-east
South (Bentley)
Canning
Kalamunda Perth Kalamunda Kalamunda East East North (Kalamunda)
Canning North Eastern Metropolitan Recreation Advisory Committee
Mundaring Perth Mundaring Mundaring East East North (Swan-Mundaring)
Swan
Swan Perth Swan, Bullsbrook, Ellenbrook, Malaga
Swan East East North (Swan-Mundaring)
Swan National Growth Councils Alliance
188 | P a g e

Metropolitan Local Government ReviewFinal Report of the Independent Panel - July 2012
Local government
RDA Regional Development
Chamber of Commerce
Health Community Advisory Council
Local Emergency Management Committee
District Emergency Management Committee
Police sub-districts
Department of Health
Department of Education
Other Other
Belmont Perth Belmont Belmont Victoria Park
South-east South-east
South (Bentley)
Canning
Bassendean Perth Bassendean East East North (Bayswater –Bassendean)
Swan North Eastern Metropolitan Recreation Advisory Committee
Bayswater Perth Bayswater West West North (Bayswater –Bassendean)
Swan
Stirling Perth Stirling Stirling Stirling West West North (Stirling) Swan/West Coast
Joondalup Perth Joondalup Joondalup Joondalup Wanneroo
North-west North-west
North (Joondalup)
West Coast
Wanneroo Perth Joondalup Joondalup Wanneroo
North-west North-west
North (Wanneroo)
West Coast National Growth Councils Alliance
North Metropolitan Recreation Advisory Committee
189 | P a g e

Metropolitan Local Government ReviewFinal Report of the Independent Panel - July 2012
Appendix 3.1 Regional arrangements for government in metropolitan Perth (continued)
Committees of Council Major government departments Special purpose authorities
community advisory committees Commerce Botanic Gardens and Parks Authority
precinct committees Communities Disability Services Commission
management committees Culture and the Arts Fire and Emergency Services Authority
reference groups Education Fremantle Port Authority
working groups Environment and Conservation Heritage Council
standing committees of council Health Library Board of WA
neighbourhood watch committees Housing Metropolitan Cemeteries Board
Landcorp Metropolitan Redevelopment Authority
Unique committees within a single local government area: Minerals and Petroleum
Land Redevelopment Committees:
Armadale, Central Perth, Midland and Subiaco
Burswood Park Board Planning Perth Market Authority
Port Kennedy Management Board. Racing, Gaming and Liquor Perth Theatre Trust
North Swan Land Conservation District Committee Regional Development and Lands Swan River Trust
Serpentine Jarrahdale Land Conservation District Committee Sport and Recreation VenuesWest
Transport WA Electoral Commission
Transperth WA Planning Commission
Main Roads WA Waste Authority
WA Police Zoological Parks Authority
Water
190 | P a g e

Metropolitan Local Government ReviewFinal Report of the Independent Panel - July 2012
Appendix 3.2 COAG Criteria for future strategic planning of capital cities
Capital city strategic planning systems should:
1. Be integrated:a. across functions, including land-use and transport planning, economic and infrastructure
development, environmental assessment and urban development, and b. across government agencies;
2. Provide for a consistent hierarchy of future oriented and publicly available plans, including:a. long term (for example, 15-30 year) integrated strategic plans, b. medium term (for example, 5-15 year) prioritised infrastructure and land-use plans, and c. near term prioritised infrastructure project pipeline backed by appropriately detailed
project plans.
3. Provide for nationally-significant economic infrastructure (both new and upgrade of existing) including:a. transport corridors, b. international gateways, c. intermodal connections, d. major communications and utilities infrastructure, and e. reservation of appropriate lands to support future expansion.
4. Address nationally-significant policy issues including:a. population growth and demographic change, b. productivity and global competitiveness, c. climate change mitigation and adaptation, d. efficient development and use of existing and new infrastructure and other public assets, e. connectivity of people to jobs and businesses to markets, f. development of major urban corridors, g. social inclusion, h. health, liveability, and community wellbeing, i. housing affordability, and j. matters of national environmental significance.
5. Consider and strengthen the networks between capital cities and major regional centres, and other important domestic and international connections;
6. Provide for planned, sequenced and evidence-based land release and an appropriate balance of infill and greenfields development;
7. Clearly identify priorities for investment and policy effort by governments, and provide an effective framework for private sector investment and innovation;
8. Encourage world-class urban design and architecture; and
9. Provide effective implementation arrangements and supporting mechanisms, including: a. clear accountabilities, timelines and appropriate performance measures, b. coordination between all three levels of government, with opportunities for
Commonwealth and Local Government input, and linked, streamlined and efficient approval processes including under the Commonwealth Environment Protection and Biodiversity Conservation Act 1999,
c. evaluation and review cycles that support the need for balance between flexibility and certainty, including trigger points that identify the need for change in policy settings, and
d. appropriate consultation and engagement with external stakeholders, experts and the wider community. 236
236 www.coagreformcouncil.gov.au/agenda/cities.cfm
191 | P a g e

Metropolitan Local Government ReviewFinal Report of the Independent Panel - July 2012
Appendix 4 Advantages and disadvantages of options considered by the Panel
Status quo (30 local governments)Average population per local government in 2012: 59,837Average population per local government in 2026: 75,897
Advantages Disadvantages
No cost to implement. Very large degree of fragmentation, duplication, inconsistency and inequality.
No ‘human’ impact i.e. no changes to peoples’ jobs etc.
No mechanism for governance of city-wide issues. Additional layers of governance may be needed.
No threat to local identity and local values.
Difficult to gain consensus on city-wide issues. Decision making remains ad hoc, personality based, and dependent upon local preferences.
Pleases the section of the community who are opposed to change.
Unsustainable – unable to operate effectively in the long term. Lack of rate base mix and growth opportunities in some local governments.
High value given to the past, tradition, and the ways things have always been.
With population growth, aspects of local government that are not functioning optimally now will be significantly worse in the future.
Relationships established between local governments and residents continue uninterrupted.
Ignores the evidence that change is needed. Prolongs uncertainty as discussions continue. Loss of momentum gathered by reform to date.Beneficial to a small number of people at the cost of the majority.High cost to future generations.Opportunity cost - loss of investment and growth opportunities. Very inconsistent environment for business, such as multiple sets of planning rules.Lost opportunity to receive greater funding from State and Federal governments. Relationships remain fractured.Demonstrating an attachment to ways of doing things that are outdated.
192 | P a g e

Metropolitan Local Government ReviewFinal Report of the Independent Panel - July 2012
20 local governmentsAverage population per local government in 2012: 89,755Average population per local government in 2026: 113,845
Advantages Disadvantages
Achieves desired result of reducing number of local governments.
Large degree of fragmentation, duplication, inconsistency and inequality will continue.
Moderate reduction in duplication and fragmentation.
No mechanism for governance of city-wide issues. Additional layers of governance may be needed.
Moderate cost and complexity of implementation, as some local governments will remain largely unchanged.
Difficult to gain consensus on city-wide issues. Decision making remains ad hoc, personality based, and dependent upon local preferences.
Low ‘human’ impact i.e. minimal changes to peoples’ jobs etc.
Local governments unlikely to increase rate base mix to necessary degree to become sustainable.
Small change could potentially be viewed as an acceptable compromise.
Remains inconsistent for business, government and the not-for-profit sector. Different sets of planning rules, regulations etc.
Potential for some functional realignment.
Lost opportunity to receive greater funding from State and Federal governments. Relationships remain fractured.Demonstrating an attachment to ways of doing things that are outdated.No-one wins – those who want things the same and those who support change. lose-lose situation.Token effort, no significant change, a poor compromise.Public reactions to loss of identity, access to elected members. Negative aspects of amalgamations elsewhere to be cited as evidence against change.Cost of implementation, without full range of benefits.
193 | P a g e

Metropolitan Local Government ReviewFinal Report of the Independent Panel - July 2012
10 – 12 local governmentsAverage population per local government in 2012: 163,190Average population per local government in 2026: 206,990
Advantages Disadvantages
Achieves desired result of reducing number of local governments.
Moderate degree of fragmentation, duplication, inconsistency and inequality will continue.
Significant reduction in duplication and fragmentation.
No mechanism for governance of city-wide issues. Additional layers of governance may be needed.
Somewhat reduced cost of implementation, as some local governments could remain largely unchanged.
Somewhat difficult to gain consensus on city-wide issues. Decision making could still be somewhat ad hoc, personality based, and dependent upon local preferences.
Reasonable potential for some functional realignment.
Remains inconsistent for business, government and the not-for-profit sector. Different sets of planning rules, regulations etc.
Some increased potential to receive funding from State and Federal governments. Ability to demonstrate capacity, more effective lobbying.
Public reactions to loss of identity, access to elected members. Negative aspects of amalgamations elsewhere to be cited as evidence against change.
Some consistency for business, government and not-for-profit sector – fewer sets of planning rules and regulations etc.
Relatively high cost and complexity of implementation, as most local governments will undergo change.
Each local government would have a greater spread of rate base mix.Opportunity for local government to be linked to strategic activity centres for enhanced development and more equitable distribution of resources.Would be easier to generate unified strategies to deal with metropolitan-wide issues. Consensus of fewer local voices required.Local governments would be large enough to generate efficiencies, attract quality staff, and facilitate a change in the expectations and role of elected members.Benefits similar to resource sharing will be gained, but without ad hoc nature of current arrangements. A more permanent regional structure.
194 | P a g e

Metropolitan Local Government ReviewFinal Report of the Independent Panel - July 2012
Five to six local governmentsAverage population per local government in 2012: 359,020Average population per local government in 2026: 455,380
Advantages Disadvantages
Achieves desired result of reducing number of local governments.
No mechanism for governance of city-wide issues. Additional layers of governance may be needed.
Very significant reduction in duplication and fragmentation. High degree of consistency and uniformity.
Still somewhat inconsistent for business, government and the not-for-profit sector.
High potential for functional realignment.
Public reactions to loss of identity, access to elected members. Negative aspects of amalgamations elsewhere to be cited as evidence against change.
Increased potential to receive funding from State and Federal governments. Ability to demonstrate capacity, more effective lobbying.
High cost and complexity of implementation, as nearly all local governments will undergo change.
Greater consistency for business, government and not-for-profit sector – fewer sets of planning rules and regulations etc.Each local government would have a balanced spread of rate base mix.Would be easier to generate unified strategies to deal with metropolitan-wide issues. Consensus of fewer local voices required.Local governments would be large enough to generate efficiencies, attract quality staff, and facilitate a change in the expectations and role of elected members.Benefits similar to resource sharing will be gained, but without ad hoc nature of current arrangements. A more permanent regional structure.Alignment with Directions 2031 sub-regions provides opportunity to assist with implementation of State government planning objectives.
195 | P a g e

Metropolitan Local Government ReviewFinal Report of the Independent Panel - July 2012
A single local governmentAverage population per local government in 2012: 1,795,100
Average population per local government in 2026: 2,276,900
Advantages Disadvantages
Achieves desired result of reducing number of local governments.
Unlikely to be acceptable to the general public – difficult transition phase is a risk to the new structure.
Complete reduction in duplication and fragmentation. Complete consistency across metropolitan area.
Very high cost and complexity of implementation, as all local governments will undergo change.
Very high potential for functional realignment.
Changes the meaning of ‘local’ government in the Perth context.
Increased potential to receive funding from State and Federal governments. Ability to demonstrate capacity, more effective lobbying.
Powerful Mayor and local government sector are a potential threat to State government.
Absolute certainty for business, government and the not-for-profit sector – the rules are the same for everyone in the metropolitan area.
Complete rate base mix.
Ability to generate highly unified strategies to deal with key metropolitan-wide issues - leads to better outcomes for environment (e.g. Swan River), for community (e.g. bushfire management) and for business (e.g. food handling rules).
The local government would be large enough to generate efficiencies, attract quality staff, and facilitate a change in the expectations and role of elected members. Long-term efficiencies arising from complete uniformity of systems (information technology, payroll etc).
No need for additional layers of regional governance to deal with city-wide issues.
Equal opportunities to access services across metropolitan area.
Enables metropolitan Perth to function as an urban region in the world economy.
United voice from one Mayor to represent whole of City – advocate, promote. Strong international reputation and image.
196 | P a g e

Metropolitan Local Government ReviewFinal Report of the Independent Panel - July 2012
Benefit to other levels of government, streamlining – only dealing with one organisation. Ability to build relationships, facilitate faster decision-making, consistency. Better outcome for community in long-term (projects get off the ground etc.).
Setting a cutting-edge example to Australia and the world. Demonstrating innovation, forward thinking, creativity, and an ability to make difficult changes for long-term benefit.
197 | P a g e