€¦ · web viewthe purpose of this study was to determine if the implementation of a structured...
TRANSCRIPT

PILOT STUDY:
THE IMPACT OF THE MINICHESS PROGRAMME ON SCHOOLREADINESS IN AN INFORMAL SETTLEMENT IN SOUTH AFRICAJoreta Parsons
Dept. Educational Psychology, University of Pretoria, South Africa.
AbstractEnhancing South-African learners from disadvantaged communities’ ability to perform successful in an academic environment
currently proves to be challenging. Intervention at an early age seems to be critically important. The purpose of this study was
to determine if the implementation of a structured chess programme at early childhood level could address this crisis
successfully. A Pilot study with pre-school learners was implemented in the informal settlement region of Tembisa, with
positive results. Statistical analysis shows that while no significant statistical differences in performance were indicated with
the Control Group there were significant differences between the pre-test and post-test performances of learners in the
Experimental Group. All experimental participants had a significant better post-score than pre-score on all 7 dimensions.
Learners in the Experimental Group significantly increased their performance in relation to the control group. This means that
the learners in the Control Group that did not take part in the programme, showed no significant increase in ability over this
period of time, despite the fact that they did attend pre-school with the Experimental Group. The MiniChess programme
proved to be a reputable instrument to increase the performance of early childhood learners by means of an instrument that is
based on play. Learners become actively involved in the process. While opportunities do not present themselves sufficiently,
learners in disadvantaged areas have the ability to enhance their performance significantly. The MiniChess programme
presents a solution.
Keywords: Cognitive development, disadvantaged learners, limited pre-knowledge, performance enhancement, chess.

Limited academic progress and achievements, especially in Mathematics and Science is a current problem is South Africa. This leads to negative
consequences in development, education and training, job opportunities and general economic growth (HSRC 2009). According to the Annual National
Assessment (ANA), a South African home ground initiative to assess basic literacy and numeracy in order to assess the progress of learners, the following
came to light:
Table 1: Performance spread across levels of achievement for Grade 1 - 4 in % achievement levels (ANA 2011:8).
Grade % Of leaners that achieved over 50% % Learners below 50%
1 67% learners >50% 30% (1/3)
2 57% learners >50% +40%
3 41.9 % learners >50% Almost 60%
4 16.9% learners >50% More than 80%
The decline in the 1st four years of performance in schools, leave us with 80% of learners performing below the 50% level. It is evident that backlogs that
lead to high dropout levels starts at the early learning stages. Cognitive developmental theories from both Piaget and Vygotsky claim that infants are born
with basic materials/abilities for intellectual development (Barohny 2010:403). Questions arise as to “Why do these backlogs exist?” and “What can be done
to access the undeveloped potential of underachieving children?” Current assumptions are that learners start school with limited pre-knowledge needed for
formal schooling. Basic academic developmental skills and building blocks needed for future learning is not significantly present. Intervention at an early
age seems to be critically important. The Numeracy Handbook for Foundation Phase Teachers: Grades R – 3 (2009:1) states: “There is a very good
chance that those children who do not develop a strong sense of numbers were not given sufficient opportunities to work with concrete objects, and those
who struggle with space and shape concepts later in life were not given opportunities to play/work with building blocks at an early age”. Teaching children
from a young age to master skills this way has become a priority.
In 2011 I was asked by Marisa van der Merwe, developer of the MiniChess programme (Van der Merwe 2007), to perform school-readiness testing in
Tembisa, a township near Johannesburg, South Africa. The Moves for Life Organisation wanted to implement the MiniChess program as part of a pre-
school development initiative in this informal settlement area. They needed pre- and post-testing in order to evaluate the significance of the MiniChess
program, not only as a chess programme, but rather as an educational school readiness initiative.
As soon as the project started, a world unaware to most of us was opened up. As an educational psychologist one are prepared for the expectations of a
testing environment, but these circumstances proved to be challenging and very different. Our appointment at the school was for 9 o’clock, but the learners
only started to arrive around that time. Small groups arrived in drips and drabs and it took some time to become organised for the procedures. The testing
procedures only started almost two hours later.
One of the major challenges we immediately had to cope with was the language barrier. Learners came from different ethnic language backgrounds and we
had to divide the class in small language groups. Each group had their own teacher, who had to translate the instructions to the specific group. Surprisingly
the learners were unable to execute group instructions by themselves. It was not certain whether they did not understand the instructions or just did not
know the answers to the questions. It was probably a bit of both.
What was evident though was that these learners were not up to the demands expected from them. It seemed as though they were not trained to operate in
a classroom environment or execute tasks by themselves. They did not know how to react to group assignments and most of the learners waited for
individual help or attention, before they tried to execute a task. Instructions had to be repeated several times and obviously the testing took a lot of time.
The procedures could not be finished in a single day and the testing had to be stretched over two consecutive days.
Another surprising observation was that some of the learners did not know how to hold or handle a pencil. Some were not sure how to go about with a book
- how to turn pages and work from left to right. Most, if not all learners did not know left from right. Ultimately these learners were not ready or equipped for
the task at hand and certainly showed no signs of being on route for school readiness.
Due to the challenges presented to us we decided to change plan and thought it to be a good idea working with a smaller group. At that time we met an
extraordinary woman with an extraordinary school. Her name is Olga Sinobolo and she started Mvelaphanda Pre-school in the informal settlement area of
Tembisa. Olga cleaned up an old rubbish dump area and built the school there. There is no running water or electricity but Olga provides basic care and
schooling plus two meals a day for the children. We decided to do the pilot study in this informal settlement area.
As soon as we started with the programme we realised the learners were not up to the programme level at all. Basic adaptions were made to meet the
challenges we were presented with. We realised they were not acquainted with forms such as squires, circles and triangles. They did not know colours and
could not distinguish left from right, top from bottom and did not understand mathematical concepts such as halves or the middle. Ability is an individual’s
existing potential to perform. These learners ability to work with basic educational concepts were limited and we had to start at the level they presented to
us.

Piaget and Vygotsky believe that young children are curious and actively involved in their own learning as well as in the discovery and development of new
understandings/schemata (Doolittle 1995:4). One of the main characteristics of the human brain is plasticity. Functional plasticity is the ability to change
behaviour based on experience” (Thomas & Knowland 2009:1). When children are exposed to structured educational environments such as schools or to a
programme such as MiniChess, they can acquire high-level cognitive skills. Abilities that are put in place early are the relevant perceptual discriminations
on which later academic skills rely. Chess can be considered a possible instrument to establish a foundation, irrespective of background, deficits or
possible shortfalls. Studies have shown that gr 2-7 pupils’ ability (as part of an educational curriculum) in problem solving was raised from 62% - 81%
(Kemm & Cloete 2009:3). “The capacity of kids to learn this game far exceeds that of any adult” (Kitsis 2009:5). This confirms the importance of utilizing
sensitive periods in cognitive development.
One critical goal is to teach children to reason and think critically. The MiniChess programme involves learners in this process by means of play.
Programme
The MiniChess programme was developed my Marisa van der Merwe over a period of ten years, working on a practical basis with learners and teachers in
the classroom environment. The concepts of chess are used as an educational tool to develop and enhance numeracy skills, self discipline, life skills
analytical and critical thinking, The programme is age-specific, developing progressively for learners from pre-school to approximately 9 years of age (See
appendix for sample material). This programme empowers and supports teachers by means of structured lesson plans, teaching tools and assessment
instruments. Ongoing teacher training and support systems ensures the quality, sustainability and success of this programme. The method in which this
programme can be applied, lends it towards successful application for educational benefit on a broader scale. For more information see
http://www.minichess.co.za/
Methods
Participants

The pre-school group was tested and 25 learners whose parents signed permission took part in the MiniChess programme. This group was compiled of 14
girls and 11 boys between the ages of 5 ½ and 6 ½ years old, about to attend school the following year. Some of the children in the experimental group
attended school on an irregular bases and none of the children attended the full programme. Unfortunately, at the time we did the post-test, many of the
children had already left for the end of the year vacation (this time-schedule was unknown to us) and only 9 of the experimental participants were available
for post-testing. The control group was made up of 6 participants at the same school who attended the pre-school during the year.
Materials
The Aptitude Test for School Beginners was used. This is a group, sifting test to determine what the basic skills are that the child is familiar with, and are
needed to perform and learn in a structured school environment. It gives an indication of the child’s potential for basic academic achievement. It also gives
an indication of areas where the specific child is not achieving and that can lead to potential causes for backlogs. It is a structured group test with norms
and standardisations.
This battery includes the following tests:
Perception: This test shows pictures of everyday objects such as animals, plants and houses – in other words concepts known to the child. With each item
there are four pictures and the child must recognise the correct one, and marks this specific picture. This tests visual perception. The focus is on analytical
perception and the ability to recognise similarities and differences. This is needed for reading- and writing skills.
Spatial: In this test the child must identify which picture, out of an irregular arrangement of four pictures, looks the same as the first one when it is rotated to
the left or right. The first few items consist of known objects while the later items are more abstract figures. This does not include three- dimensional figures
and rotation is on a flat surface only, and not rotated more than 180 degrees. This measures the child’s ability to rotate a given object in an imaginary way.
Primary abilities needed to do this include visualisation and spatial orientation. This has an affect on general academic success.
Reasoning: This test consists of four pictures and the child must indicate the pictures that do not fit with the others. The child must be able to perceive the
connection between the pictures and then make a conclusion. This item consists of everyday objects such as three cats and one bird; whereas the bird will
be different. This tests understanding, logical thinking and the ability to classify. Understanding and logical thinking are important aspects of the learning
process, and predict successful school performance.

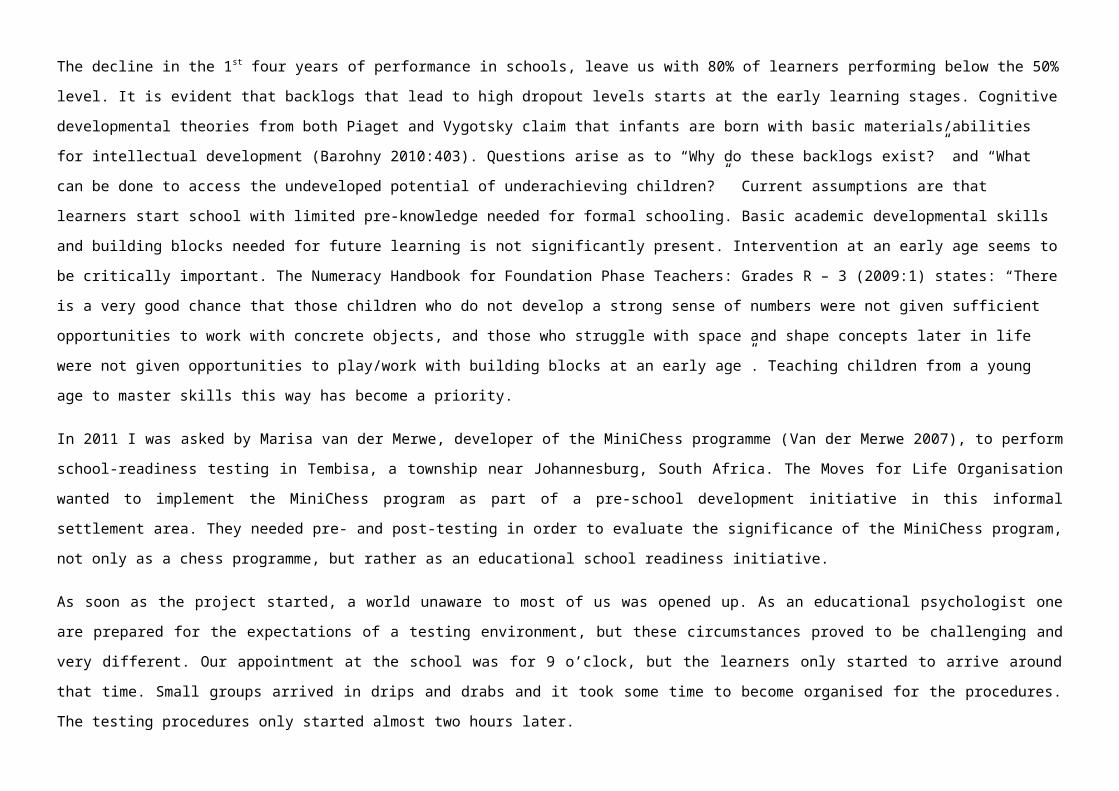
Numerical: This test gives an indication of the child’s counting ability, quantity-, relation- and numerical understanding. Verbal understanding, logical
thinking and ability to concentrate are important.
Gestalt: With this test the child is expected to copy a specific pattern drawn by connecting a given arrangement of dots. The patterns are mostly known
objects such as boats, birds etc. Gestalt refers to the physical structures, physiological and psychological functions of symbolic units. The child has to have
the ability to copy simple objects correctly. The position of horizontal, vertical and diagonal lines must be copied on the dots according to the perceived
example.
This is needed for writing and reading to develop as indicated in the distinguishing of ‘b’ and ‘d’. It involves the ability to perceive letters and words in
sequence and also place them in the correct sequence in sentences. It also involves accurate visual perception and spatial relations. Awareness,
concentration, foreground – background perception is also needed for this test. Motor ability may play a role but is not what is tested.
Coordination: This item consists of two lines, 5mm apart and the child must draw a line in between these, starting with a dot and ending at the star. The
child should not lift his/her pencil and must not touch the lines. These line items come in different patterns. This tests the fine motor coordination and
indicates the child’s ability to work with pencil and paper – needed for writing.
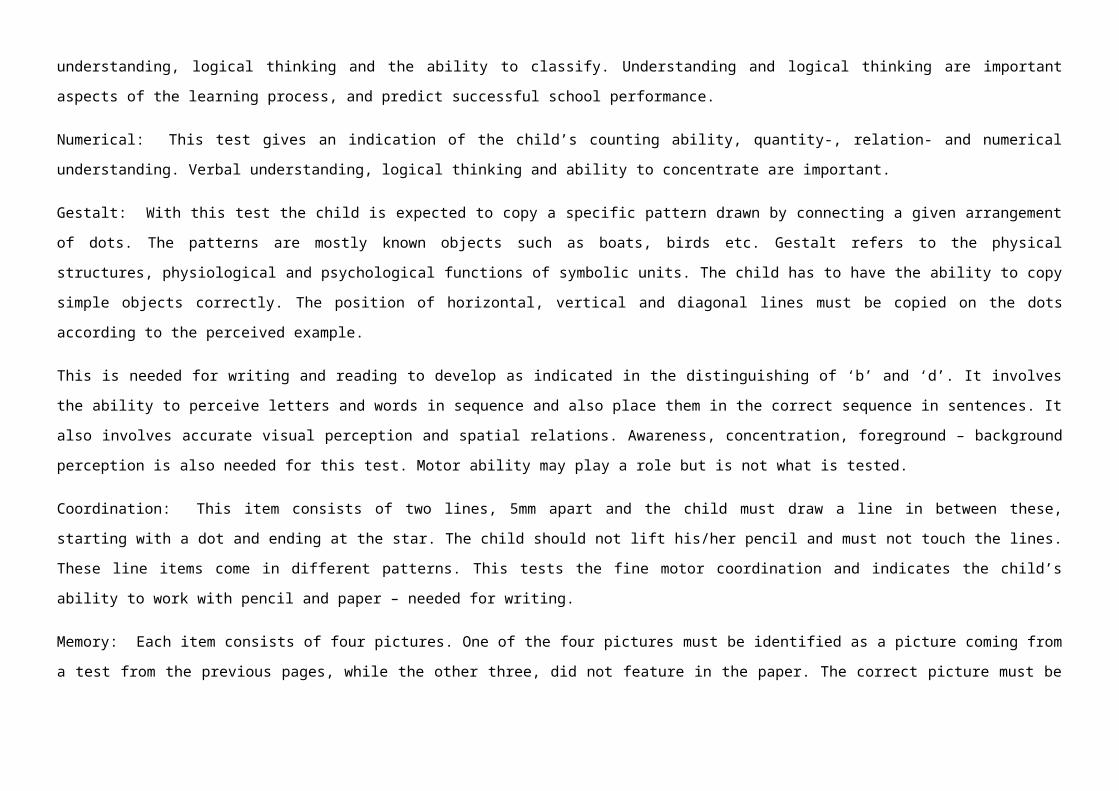
Memory: Each item consists of four pictures. One of the four pictures must be identified as a picture coming from a test from the previous pages, while the
other three, did not feature in the paper. The correct picture must be identified and marked. The child was not advised to be aware of these pictures before.
Thus the unintentional memory is tested. This indicates the child’s visual memory ability needed for general scholastic success.
Table 2: Norms used for the ASB raw scores
Standard mark Test 1 Test 2 Test 3 Test 4 Test 5 Test 6 Test 7
Perception Spatial Reasoning Numerical Gestalt Co-ordination Memory
1 0-5 0-1 0-2 0-2 0-35 0-8 0-1
2 6-7 2-3 3-6 3-4 36-62 9-17 2-7
3 8 4-6 7-8 5-7 63-86 18-24 8
4 9 7-9 9 8-9 87-98 25-28 9

5 10 10 10 10 99-100 29-30 10
Table 3: Five-point scale
Standard point: Percentage: Grading:
1
2
3
4
5
Lowest 7%
Next 24%
Middle 38%
Next 24%
Top 7%
Very weak
Weak
Average
Good
Very good
Procedures
All the learners attending the pre-school class at the Mvelaphanda Pre-School took part in the testing procedures. The ASB is a group test and two learners
sat side by side at their desks, facing the front of the class. Each tasks was explained in English, and then translated by the teacher and two colleagues
who at the same time moved around in the classroom, making sure the learners understand and complete the given tasks. Language does present a
problem and there is uncertainty whether the instructions are translated correctly and to what extend the teacher and helpers corrects the learners
responses. Examples from the test was enlarged and used to visually demonstrate the tasks that had to be completed. Breaks were given in between tests
and the procedures were spread over two days. The post-test though was concluded in a single day.
Results
Data analysis:
A Non-Parametric t-test, the Wilcoxon Signed Rank Test was used for data analysis of the dependant means. This test was used due to the small sample
group that took part in the test procedures. A cut off difference of 0,05 is used as indication for significance. A score bigger p>0.05 would not be significant
but if the statistical difference is smaller than p<0,05 it will indicate a significant difference in performance.
Table 4: Control group standard scores
Test description Z distribution P - value
Perception - 1,361 0,174
Spatial - 1,000 0.317
Reasoning - 1,604 0.109
Numerical - 1,414 0,157
Gestalt - 0,577 0,564
Co-ordination - 0,966 0,334
Memory - 2,271 0.023
Statistical results that describe the Control group standard scores were as follows:
The Wilcoxon Signed Rank test showed that there were no significant differences between the pre-test and post-test performances of learners in the
Control Group except for the test on memory ability. Although there was a significant increase in their memory ability, the cause for this could be assigned
to the nature of this specific subtest. (See discussion)
Figure 1: Average percentages achieved - Control Group Results

1 2 3 4 5 6 70
10
20
30
40
50
60
70
80
90
100
Average Score: Pre-TestAverage Score: Post-test
Spa-tial
Perception
Reasoning
Numerical
GestaltCo-ordination
Memory

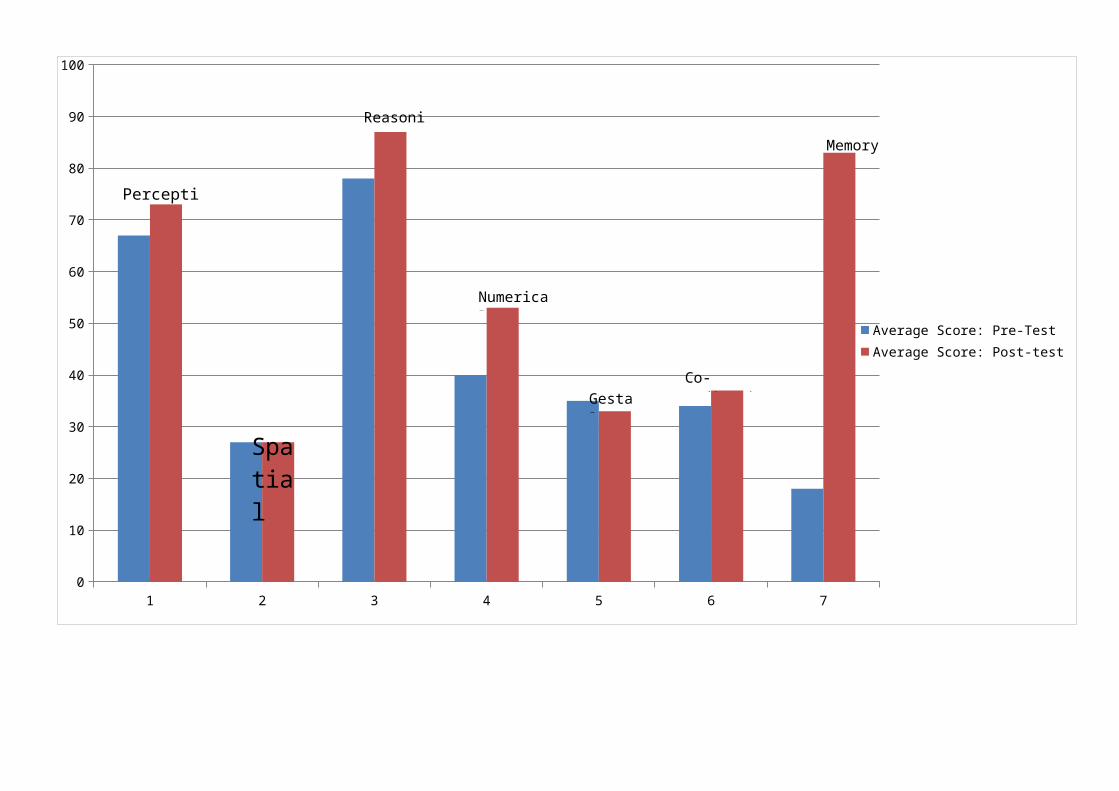
Statistical results that describe the Experimental group standard scores were as follows:
The Wilcoxon Signed Rank test showed that there were significant differences between the pre-test and post-test performances of learners in the
Experimental Group. All participants had a better post-score than pre-score on all 7 dimensions.
Table 5: Experimental group standard scores
Test description Z distribution P - value
Perception - 2,549 0,011
Spatial - 2,530 0.011
Reasoning - 2,232 0.026
Numerical - 2,460 0,014
Gestalt - 2,401 0,016
Co-ordination - 2,121 0,034
Memory - 2,694 0.007
Figure 2: Average percentages achieved - Experimental Group

1 2 3 4 5 6 70
20
40
60
80
100
120
Average Score: Pre-testAverage score: Post-test
Levene’s Test for Equality of Variances.
Perception
Spatial
Reasoning
Numerical
Gestalt
Co-ordination
Memory
An independent t-test was conducted to compare the groups’ scores, with definite differences noted. T-tests for equal variances were used for the following
tests: Pre- and Post-Perception, Pre- and Post-Spatial, Pre-and Post-Reasoning, Post-Numerical, Pre-Gestalt, Pre-and Post-Co-ordination and Pre-and
Post-Memory. Unequal variances were used for Pre-Numerical, Post-Spatial and Post-Gestalt tests because the scores were not normally distributed
(p>0,05) and differences in F and significant levels.
Figure 3: Significant differences between Perception scores.
No
statistical significant differences in performance were indicated on the pre-test results - no difference in performance between the experimental- and control
groups occurred. Statistical significant differences in performance were indicated on the post-test results. Learners in the experimental group significantly
F Sig. T Df Sig. 2-tailed
Mean Difference
Std. Error Difference
95% Confidence Interval of the Difference
Lower Upper
Pre-Perception
Equal variances
assumed.650 .435 .834 13 .420 .500 .600 -.796 1.796
Equal variances
not assumed.873 12.401 .399 .500 .573 -.743 1.743
Post-Perception
Equal variances
assumed
3.284 .093 2.239 13 .043 1.000 .447 .035 1.975
Equal variances
not assumed1.917 6.151 .103 1.000 .522 -.269 2.269

increased their performance in relation to the control group.
Figure 4: Significant differences between Spatial scores.
No statistical significant differences in performance were indicated on the pre-test results - no difference in performance between the experimental- and
control groups occurred. Statistical significant differences in performance were indicated on the post-test results. Learners in the experimental group
significantly increased their performance in relation to the control group.
Figure 6: Significant differences between Numerical scores.
F Sig. t Df Sig. 2-tailed
Mean Difference
Std. Error Difference
95% Confidence Interval of the Difference
Lower Upper
Pre-Spatial Equal variances
assumed.163 .693 .000 13 1.000 .000 .358 -.774 .774
Equal variances
not assumed.000 11.719 1.000 .000 .350 -.764 .764Post-
SpatialEqual variances
assumed5.491 .036 5.001 13 .000 1.278 .256 .726 1.830
Equal variances
not assumed5.277 12.578 .000 1.278 .242 .753 1.803

No statistical significant differences in performance were indicated on the pre-test results - no difference in performance between the experimental- and
control groups occurred. Statistical significant differences in performance were indicated on the post-test results. Learners in the experimental group
significantly increased their performance in relation to the control group.
Figure 7: Significant differences between Gestalt scores.
F Sig. t Df Sig. 2-tailed
Mean Difference
Std. Error Difference
95% Confidence Interval of the Difference
Lower Upper
Pre-Numerical
Equal variances
assumed3.949 .068 2.561 13 .024 .722 .282 .133 1.331
Equal variances
not assumed2.210 6.325 .067 .722 .327 -.068 1.512
Post-Numerical
Equal variances
assumed3.191 .097 2.316 13 .038 1.056 .456 .071 2.040
Equal variances
not assumed2.039 6.785 .082 1.056 .518 -.176 2.287

No statistical significant differences in performance were indicated on the pre-test results - no difference in performance between the experimental- and
control groups occurred. Statistical significant differences in performance were indicated on the post-test results. Learners in the experimental group
significantly increased their performance in relation to the control group.
Sample Study
Figure 10: Percentages achieved: Sample learner - Experimental Group
F Sig. t Df Sig. 2-tailed
Mean Difference
Std. Error Difference
95% Confidence Interval of the Difference
Lower Upper
Pre-Gestalt
Equal variances
assumed.065 .803 -.197 13 .847 -.056 .282 -.665 .554
Equal variances
not assumed-.195 10.563 .849 -.056 .284 -.685 .574
Post-Gestalt
Equal variances
assumed4.699 .049 2.304 13 .038 1.111 .482 .069 2.153
Equal variances
not assumed2.640 12.087 .021 1.111 .421 .195 2.027

1 2 3 4 5 6 70
20
40
60
80
100
120
Pre-Test: Example LearnerPost-test: Example Learner
Prior to the intervention, learner A was not equipped with the necessary skills needed to make progress and adapt in a formal scholastic environment.
Significant improvements took place during the intervention period; Perception – 10%, Spatial – 40%, Reasoning – 60%, Numerical – 40%, Gestalt – 52%,
Perception
Spatial
Reasoning
Numerical
Gestalt
Co-ordination
Memory

Co-ordination – 12% and Memory – 80%. Evidently adequate learning took place during the limited intervention period, indicating that appropriate
stimulation by means of the MiniChess programme leads to significant educational skills development.
Discussion (note…)
Statistic analysis showed there were no significant differences between the pre-test and post-test performances of learners in the Control Group except for
the test on memory ability. Although there was a significant increase in the memory ability of the control group, the cause for this could be assigned to the
nature of this specific subtest. As it is a non-intentional memory test, the learners are required to indicate what specific items were remembered from the
test information they worked with, without informing them beforehand. The second time they perform the test, learners are aware that this data will be
required and are therefor better prepared. Another aspect that can be considered is the cultural impact on learners from developing backgrounds. Some
current speculation suggests that emphasis is put on obedient behaviour rather than reasoning ability. This may result in learners developing rote memory
rather than critical thinking skills. These speculations have not been scientifically concluded. The language barrier is always prevalent but not
insurmountable. One is unsure though to what extend language influences learner performance.
Statistic analysis did show that there were significant differences between the pre-test and post-test performances of learners in the Experimental Group.
All participants in the Experimental Group had a better post-score than pre-score on all 7 dimensions. Keep in mind that all the participant’s pre-tests
indicated their performance on a similar level.
This means that the learners in the Control Group that did not take part in the programme, showed no significant increase in ability over this period of time,
despite the fact that they did attend pre-school. Results on the ASB showed that these learners were not equipped to go to school the following year.
Predictions are that these learners, among hundreds of others in these same circumstances, will be part of the statistical group that does not make
adequate progression in the educational environment and will drop out at some level.
Learners in the Experimental Group’s performance did improve significantly. During the pre-test they did not achieve adequate levels for school readiness.
During the post-test, the Experimental Group showed enhanced performance ability and will be able to attend school successfully the following year.
Significant differences in performance were created between the learners attending the programme and those not attending the programme. A foundation
for future learning has successfully been created with the Experimental Group by means of the MiniChess programme.

Conclusion
The achievement levels for Gr 1- 4 Annual National Assessments show that South African schools have significant education and developmental backlogs
that must be overcome. The MiniChess programme proved to address this situation successfully as this programme implements education principles by
actively involving learners in the learning process by means of play. “Playing a game is not a luxury but rather a crucial dynamic of healthy physical,
intellectual and social-emotional development at all age levels”, say Copple and Bredenkamp (Riley & Jones 2010:146). “Play is developmentally
appropriate for primary-aged children and can provide them with opportunities that enrich the learning experience”. One critical goal is to teach children to
reason and think critically. To accomplish this, children have to be reached at an early cognitive developmental phase in order to establish knowledge
organisation to embed and connect new information (Knudsen 2004:1415). Chess is such a tool. (Dauvergne 2000:5).
The MiniChess programme proved to address this situation successfully, by overcoming pre-learning backlogs of learners in disadvantaged communities.
No statistical significant differences in performance were indicated by the pre-test results between the Experimental and Control Groups of learners.
Statistical significant differences in performance were indicated in the post-test results. Learners in the Experimental Group significantly increased their
performance in relation to the control group.
References
Annual National Assessments. 2011 - a guideline for the interpretation and use of the ANA results. (Online) Available at: http://www.users/joretaparsons/Desktop/ANA%20-%20Powered%20by%20Google%20Docs.webarchive (accessed 26/09/2011).

Barohny, E. 2010. From learning to development: a sociocultural approach to instruction. Cambridge Journal of Education. Vol. 40, No. 4, 401-418. Downloaded by the University of Pretoria (Accessed 29/09/2011).
Buky, J. 2006. Chess in education. www.thechessacademy.org/Workshop_Slides/Workshop_2006.html (Online) Available at: http:/www.chessforeducation.com (Accessed: 25/10/2009).
Creswell, J.W. 2003. Research design. Qualitative, quantitative, and mixed methods approaches (2nd Ed). London: Sage.
Dauvergne, P. 2000. The Case of Chess as a Tool to Develop Our Children’s Minds . In: The Benefits of Chess in Education. A Collection of Studies and Papers on Chess and Education, compiled by Patrick, S. McDonald. (Online) Available at: http:/www.chess.ca/misc2008/benefitsofchess.pdf (Accessed: 23/10/2009).
Department of Basic Education. 2009 Numeracy Handbook for Foundation Phase Teachers: Grades R- 3. (Online) Available at: http://www.education.gov.za (accessed 26/09/2011).
De Vos, A. S. 2002. Research at Grass Roots for the social sciences and human service professions, 2nd Edition. Pretoria. Van Schaik Publishers.
Doolittle, P. E. 1995. Understanding Cooperative Learning Through Vygotsky’s Zone of Proximal Development. Downloaded by the University of Pretoria (Accessed 29/09/2011).
Erasmus, J & Breier, M. 2009. Skills Shortage in South Africa. Pretoria. Human Sciences Research Council Press.
Ferguson, R. C. 1995. Chess in Education Research. In: The Benefits of Chess in Education. A Collection of Studies and Papers on Chess and Education, compiled by Patrick, S. McDonald. (Online) Available at: http:/www.chess.ca/misc2008/benefitsofchess.pdf (Accessed: 23/10/2009).
Foxcroft, C. and Roodt, G. 2006. An Introduction to Psychological Assessment in the South African Context, 2nd Edition. Cape Town. Oxford University Press.
Gersmehl, P. J. and Gersmehl, C. A. 2007. Spatial Thinking by Young Children: Neurologic evidence for Early Development and “Educability ”. Journal of Geography 106:181-191 (Accessed 18/09/2011).
Hein, S. 2007. Ability, Skill and Potential. Emotional Intelligence. (Online) http:/www.stevenhein.com (accessed 12/09/2011).
Hermelin, R. 2004. The effect of playing chess on the mathematics achievement of Primary School learners in two schools in KZN . Master of Education Thesis. Faculty of Education, University of KwaZulu Natal. (Unpublished).
Kemm, K.R. & Cloete, C.E. 2009. Chess as a Logical and Lateral Thinking Training Intervention for Thematic and Science Education in South Africa. Dept. of Construction Economics, University of Pretoria.

Kitsis, A. Benefits of Chess for Academic Performance and Creative Thinking. (Online) Available at: http:/www.vivacityinc.com/chess (Accessed: 22/10/2009).
Knudsen, E. I. 2004. Sensitive Periods in the Development of the Brain and Behaviour. Journal of Cognitive Neuroscience 16:8, p 1412-1425.
Lacrimosa, L. 1995. Chess is Cool for Kids. In: The Benefits of Chess in Education. A Collection of Studies and Papers on Chess and Education, compiled by Patrick, S. McDonald. (Online) Available at: http:/www.chess.ca/misc2008/benefitsofchess.pdf (Accessed: 23/10/2009).
Mcleod, S. 2007) Vygotsky. (Online) Available at: http://www.simplypsychology.org/vygotsky.html (accessed 23/09/2011).
Milat, M. 1995. The Role of Chess in Modern Education . In: Benefits of Chess for Academic Performance and Creative Thinking. (Online) Available at: http:/www.vivacityinc.com/chess (Accessed: 22/10/2009).
Reber, S. and Reber, E. 2002. The Penguin Dictionary of Psychology, 3rd Edition. London. Penguin Books.
Riley, J. G. and Jones, R. B. 2010. Acknowledging Learning Through Play in the Primary Grades. Childhood Education, Volume 86 Issue 3.
Ross, P. E. 2006. The Expert Mind. Scientific American, August 2006, Pg. 46.
Thomas, M. and Knowland, V. 2009. Sensitive Periods in Brain Development – Implications for Education Policy. Developmental Neuro-cognition Laboratory, School of Psychology, Birkbeck College University of London.
Van der Merwe, M. 2007. MiniChess training program, (Online) Available at: http://www.minichess.co.za/ (accessed 26/09/2010).
Van der Merwe, M. 2007. MiniChess Learner Workbook, phase 1. (Online) Available at: http://www.minichess.co.za/ (accessed 26/09/2010)
Appendix: Sample Material

Note: Learner book - grade R. Educational outcomes: Colouring and personalization – fine motor skills

Note: Educational outcome: pre-reading, shape recognition and fine motor skill.

Note: Page from teacher manual illustrating structure of lesson preparation, layout and assessment.

Flanks are the files (vertical lines a and b, g and h) on the sides of the board.
The centre of the board is divided into 2 areas:
Small centre - middle 4 squares (show and count together)
Large centre – the 12 squares around the small centre (show and count together)
Important places on the chessboard:
Educational outcomes: counting, visual memory and spatial awareness (2-dimentional)