0 copyright © 2002 by harcourt, inc.all rights reserved. chapter 1 an overview of financial...
TRANSCRIPT
1
Copyright © 2002 by Harcourt, Inc. All rights reserved.
CHAPTER 1An Overview of Financial Management
Role of financial management
Career opportunities
Forms of business organization
Goals of the corporation
Issues of the new millenium
Agency relationships

2
Copyright © 2002 by Harcourt, Inc. All rights reserved.
The primary goal is shareholder wealth maximization, which translates to maximizing stock price.Should firms behave ethically? YES!Do firms have any responsibilities to
society at large? YES! Shareholders are also members of society.
Goals of the Corporation
3
Copyright © 2002 by Harcourt, Inc. All rights reserved.
Is maximizing stock price good for society, employees, and customers?
Employment growth is higher in firms that try to maximize stock price. On average, employment goes up in: firms that make managers into
owners (such as LBO firms)firms that were owned by the
government but that have been sold to private investors

4
Copyright © 2002 by Harcourt, Inc. All rights reserved.
Consumer welfare is higher in capitalist free market economies than in communist or socialist economies.
Fortune lists the most admired firms. In addition to high stock returns, these firms have:high quality from customers’ viewemployees who like working there
5
Copyright © 2002 by Harcourt, Inc. All rights reserved.
Magnitude of cash flows expected by shareholders
Riskiness of the cash flows
Timing of the cash flow stream
Factors that Affect Stock Price
“M.R.T.”
6
Copyright © 2002 by Harcourt, Inc. All rights reserved.
SalesCurrent levelShort-term growth rate in salesLong-term sustainable growth rate in
sales
Operating expenses
Capital expenditures / R&D / Advertising / Net Working Capital
Three Determinants of Cash Flows

7
Copyright © 2002 by Harcourt, Inc. All rights reserved.
Factors that Affect the Level and Risk of Cash Flows
Decisions made by financial managers:Investment decisions (product lines,
production processes, geographic market, use of technology, marketing strategy)
Financing decisions (choice of debt policy and dividend policy)
The external environment

8
Copyright © 2002 by Harcourt, Inc. All rights reserved.
An agency relationship exists whenever a principal hires an agent to act on his or her behalf.
Within a corporation, agency relationships exist between:
Shareholders and managersShareholders and creditors
Agency Relationships

9
Copyright © 2002 by Harcourt, Inc. All rights reserved.
Managers are naturally inclined to act in their own best interests.
But the following factors affect managerial behavior:Managerial compensation plansDirect intervention by shareholdersThe threat of firingThe threat of takeover
Shareholders versus Managers

10
Copyright © 2002 by Harcourt, Inc. All rights reserved.
Shareholders (through managers) could take actions to maximize stock price that are detrimental to creditors.
In the long run, such actions will raise the cost of debt and ultimately lower stock price.
Shareholders versus Creditors

11
Copyright © 2002 by Harcourt, Inc. All rights reserved.
CHAPTER 5The Financial Environment:
Markets, Institutions,and Interest Rates
Financial marketsTypes of financial institutionsDeterminants of interest ratesYield curves
12
Copyright © 2002 by Harcourt, Inc. All rights reserved.
Define these markets
Markets in generalMarkets for physical assetsMarkets for financial assetsMoney versus capital marketsPrimary versus secondary marketsSpot versus future markets

13
Copyright © 2002 by Harcourt, Inc. All rights reserved.
Direct transferThrough an investment banking
houseThrough a financial intermediary
Three Primary Ways Capital Is Transferred Between Savers and
Borrowers
14
Copyright © 2002 by Harcourt, Inc. All rights reserved.
Organized Exchanges versusOver-the-Counter Market
Auction markets versus dealer markets (exchanges versus the OTC market)
NYSE versus Nasdaq system
Differences are narrowing
Nasdaq vs. true OTC

15
Copyright © 2002 by Harcourt, Inc. All rights reserved.
What do we call the price, or cost, of debt capital?
The interest rate
What do we call the price, or cost, of equity capital?
Required Dividend Capital return yield gain= + .

16
Copyright © 2002 by Harcourt, Inc. All rights reserved.
k = k* + IP + DRP + LP + MRP.
Here:
k = Required rate of return on a debt security.
k* = Real risk-free rate.
IP = Inflation premium.
DRP = Default risk premium.
LP = Liquidity premium.
MRP = Maturity risk premium.

17
Copyright © 2002 by Harcourt, Inc. All rights reserved.
Ratio analysis
Du Pont system
Effects of improving ratios
Limitations of ratio analysis
Qualitative factors
CHAPTER 3 Analysis of Financial Statements

18
Copyright © 2002 by Harcourt, Inc. All rights reserved.
Standardize numbers; facilitate comparisons
Used to highlight weaknesses and strengths
Why are ratios useful?

19
Copyright © 2002 by Harcourt, Inc. All rights reserved.
Application to Microsoft Corporation Using Selected 2002 Financial Data:
Balance Sheet $ Bil. Income Statement
CA 48.6 CL 15.5 Sales 28.4
NFA 2.3 LTD 0.0 Oper. Exp. 16.5
Other 16.8 CE 52.2 EBIT 11.9
TA 67.7 TL+CE 67.7 Interest Exp. 0.0
Depreciation 1.1 EBT 11.9
Capital Exp. 0.8 Taxes 4.1
Net W.C. +0.4 Net Income 7.8
Free Cash Flow $11.9 – 4.1 + 1.1 – 0.8 – 0.4 = +$7.7 Billion

20
Copyright © 2002 by Harcourt, Inc. All rights reserved.
Liquidity: Can we make required payments as they fall due?
Asset management: Do we have the right amount of assets for the level of sales?
What are the five major categories of ratios, and what questions do they
answer?
(More…)
21
Copyright © 2002 by Harcourt, Inc. All rights reserved.
Debt management: Do we have the right mix of debt and equity?
Profitability: Do sales prices exceed unit costs, and are sales high enough as reflected in PM, ROE, and ROA?
Market value: Do investors like what they see as reflected in P/E and M/B ratios?
22
Copyright © 2002 by Harcourt, Inc. All rights reserved.
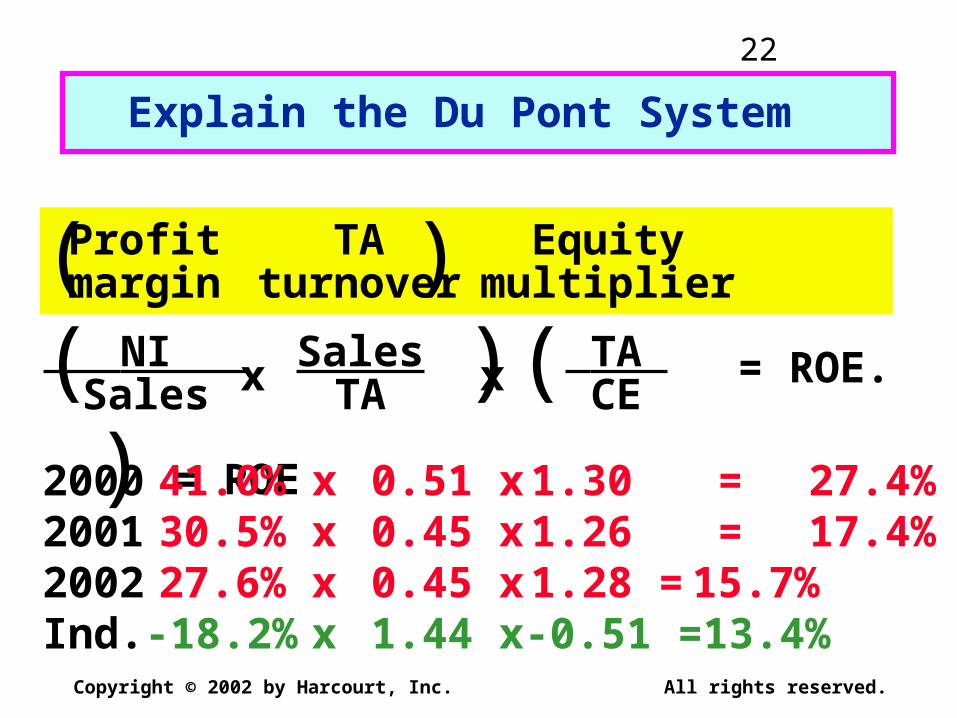
( )( )( ) = ROE
Profitmargin
TAturnover
Equitymultiplier
NI Sales
SalesTA
TA CE
2000 41.0% x 0.51 x 1.30 = 27.4%2001 30.5% x 0.45 x 1.26 = 17.4%2002 27.6% x 0.45 x 1.28 = 15.7%Ind. -18.2% x 1.44 x -0.51 = 13.4%
Explain the Du Pont System
x x = ROE.
23
Copyright © 2002 by Harcourt, Inc. All rights reserved.
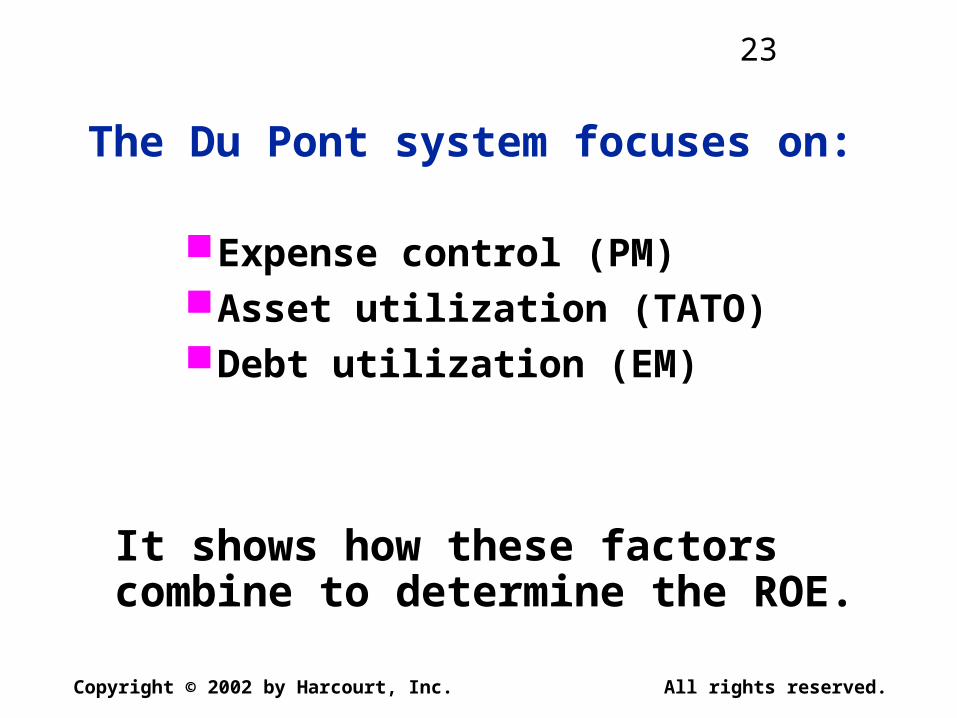
The Du Pont system focuses on:
Expense control (PM)Asset utilization (TATO)Debt utilization (EM)
It shows how these factors combine to determine the ROE.

24
Copyright © 2002 by Harcourt, Inc. All rights reserved.
Window dressing techniques can make statements and ratios look better.
Different accounting and operating practices can distort comparisons.
Sometimes it is difficult to tell if a ratio value is “good” or “bad.”
Often, different ratios give different signals, so it is difficult to tell, on balance, whether a company is in a strong or weak financial condition.
25
Copyright © 2002 by Harcourt, Inc. All rights reserved.
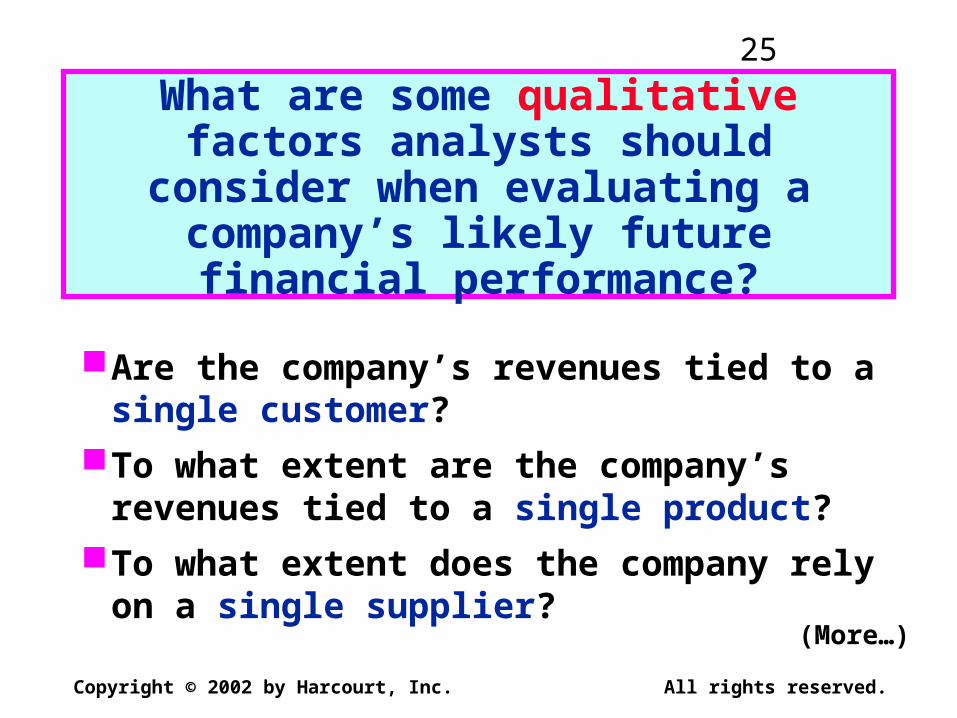
What are some qualitative factors analysts should consider when
evaluating a company’s likely future financial performance?
Are the company’s revenues tied to a single customer?
To what extent are the company’s revenues tied to a single product?
To what extent does the company rely on a single supplier?
(More…)

26
Copyright © 2002 by Harcourt, Inc. All rights reserved.
What percentage of the company’s business is generated overseas?
What is the competitive situation?What does the future have in store?What is the company’s legal and
regulatory environment?

27
Copyright © 2002 by Harcourt, Inc. All rights reserved.
CHAPTER 11The Cost of Capital
Cost of Capital Components
Debt
Preferred
Common Equity
WACC

28
Copyright © 2002 by Harcourt, Inc. All rights reserved.
Should we focus on before-tax or after-tax capital costs?
Tax effects associated with financing can be incorporated either in capital budgeting cash flows or in cost of capital.
Most firms incorporate tax effects in the cost of capital. Therefore, focus on after-tax costs.
Only cost of debt is affected.
29
Copyright © 2002 by Harcourt, Inc. All rights reserved.
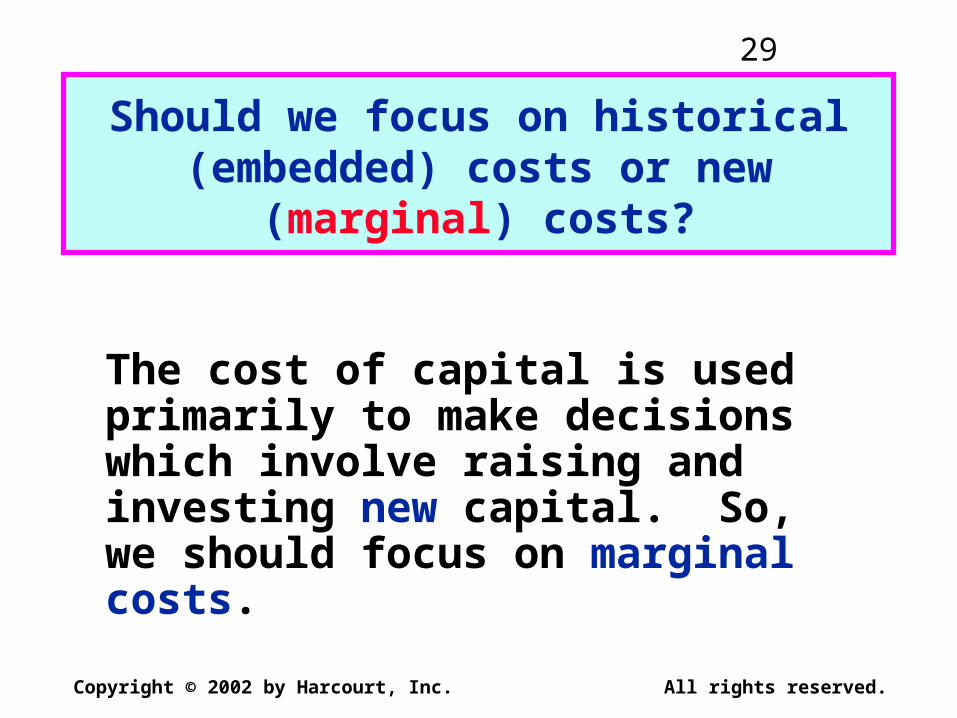
Should we focus on historical (embedded) costs or new (marginal)
costs?
The cost of capital is used primarily to make decisions which involve raising and investing new capital. So, we should focus on marginal costs.

30
Copyright © 2002 by Harcourt, Inc. All rights reserved.
Component Cost of Debt
Interest is tax deductible, so
kd AT = kd BT(1 - T)
= 10%(1 - 0.40) = 6%.
Use nominal rate.
Flotation costs small, so ignore.
Note: kd BT = Krf + DRP + LP

31
Copyright © 2002 by Harcourt, Inc. All rights reserved.
What’s the cost of preferred stock? PP = $113.10; 10%Q; Par = $100; F = $2.
%.0.9090.010.111$
10$
00.2$10.113$
100$ 1.0
n
psps P
Dk
Use this formula:

32
Copyright © 2002 by Harcourt, Inc. All rights reserved.
Companies can issue new shares of common stock.
Companies can reinvest earnings.
What are the two ways that companies can raise common equity?

33
Copyright © 2002 by Harcourt, Inc. All rights reserved.
Earnings can be reinvested or paid out as dividends.
Investors could buy other securities, earn a return.
Thus, there is an opportunity cost if earnings are reinvested.
Why is there a cost for reinvested earnings?

34
Copyright © 2002 by Harcourt, Inc. All rights reserved.
Opportunity cost: The return stockholders could earn on alternative investments of equal risk.
They could buy similar stocks and earn ks, or company could repurchase its own stock and earn ks. So, ks, is the cost of reinvested earnings and it is the cost of equity.

35
Copyright © 2002 by Harcourt, Inc. All rights reserved.
Three ways to determine the cost of equity, ks:
1. CAPM: ks = kRF + (kM - kRF)= kRF + (RPM)
2. DCF: ks = (D1/P0) + g
3. Own-Bond-Yield-Plus-Risk Premium:
ks = kd + RP

36
Copyright © 2002 by Harcourt, Inc. All rights reserved.
Suppose the company has been earning 15% on equity (ROE = 15%) and retaining 35% (dividend payout = 65%), and this situation is expected to continue.
What’s the expected future g?

37
Copyright © 2002 by Harcourt, Inc. All rights reserved.
Retention growth rate:
g = b(ROE) = 0.35(15%) = 5.25%.
Here, b = Fraction retained (a.k.a. RR).
Close to g = 5% given earlier. Think of bank account paying 10% with b = 0, b = 1.0, and b = 0.5. What’s g?
38
Copyright © 2002 by Harcourt, Inc. All rights reserved.
What’s the WACC?
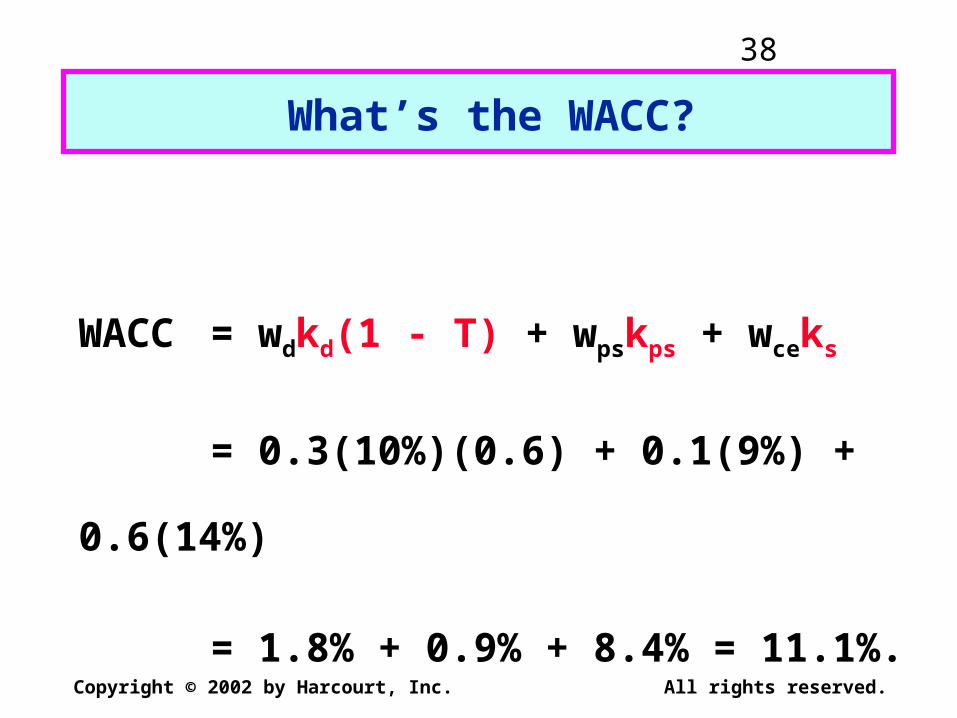
WACC = wdkd(1 - T) + wpskps + wceks
= 0.3(10%)(0.6) + 0.1(9%) + 0.6(14%)
= 1.8% + 0.9% + 8.4% = 11.1%.
39
Copyright © 2002 by Harcourt, Inc. All rights reserved.
What factors influence a company’s WACC?
Market conditions, especially interest rates and tax rates.
The firm’s capital structure and dividend policy.
The firm’s investment policy. Firms with riskier projects generally have a higher WACC.

40
Copyright © 2002 by Harcourt, Inc. All rights reserved.
Should the company use the composite WACC as the hurdle rate for
each of its projects?
NO! The composite WACC reflects the risk of an average project undertaken by the firm. Therefore, the WACC only represents the “hurdle rate” for a typical project with average risk.
Different projects have different risks. The project’s WACC should be adjusted to reflect the project’s risk.

41
Copyright © 2002 by Harcourt, Inc. All rights reserved.
Risk and the Cost of Capital
Rate of Return(%)
WACC
Rejection Region
Acceptance Region
Risk
L
B
A
H12.0
8.0
10.010.5
9.5
0 RiskL RiskA RiskH

42
Copyright © 2002 by Harcourt, Inc. All rights reserved.
Divisional Cost of CapitalRate of Return
(%)WACC
Project H
Division H’s WACC
Risk
Project LComposite WACCfor Firm A
13.0
7.0
10.0
11.0
9.0
Division L’s WACC
0 RiskL RiskAverage RiskH

43
Copyright © 2002 by Harcourt, Inc. All rights reserved.
What are the three types of project risk?
Stand-alone riskCorporate risk (not as relevant!)Market risk
44
Copyright © 2002 by Harcourt, Inc. All rights reserved.
Four Mistakes to Avoid
1. When estimating the cost of debt, use the current interest rate on new debt, not the coupon rate on existing debt.
2. When estimating the risk premium for the CAPM approach, don’t subtract the current long-term T-bond rate from the historical average return on common stocks.
(More ...)

45
Copyright © 2002 by Harcourt, Inc. All rights reserved.
For example, if the historical kM has been about 12.7% and inflation drives the current kRF up to 10%, the current market risk premium is not 12.7% - 10% = 2.7%!
(More ...)

46
Copyright © 2002 by Harcourt, Inc. All rights reserved.
3. Use the target capital structure to determine the weights.
If you don’t know the target weights, then use the current market value of equity, and never the book value of equity.
If you don’t know the market value of debt, then the book value of debt often is a reasonable approximation, especially for short-term debt. (More...)
47
Copyright © 2002 by Harcourt, Inc. All rights reserved.
4. Capital components are sources of funding that come from investors.
Accounts payable, accruals, and deferred taxes are not sources of funding that come from investors, so they are not included in the calculation of the WACC.
We do adjust for these items when calculating the cash flows of the project, but not when calculating the WACC.

48
Copyright © 2002 by Harcourt, Inc. All rights reserved.
Should we build thisplant?
CHAPTER 13The Basics of Capital Budgeting:
Evaluating Cash Flows
49
Copyright © 2002 by Harcourt, Inc. All rights reserved.
What is capital budgeting?
Analysis of potential additions to fixed assets.
Long-term decisions; involve large expenditures.
Very important to firm’s future.
50
Copyright © 2002 by Harcourt, Inc. All rights reserved.
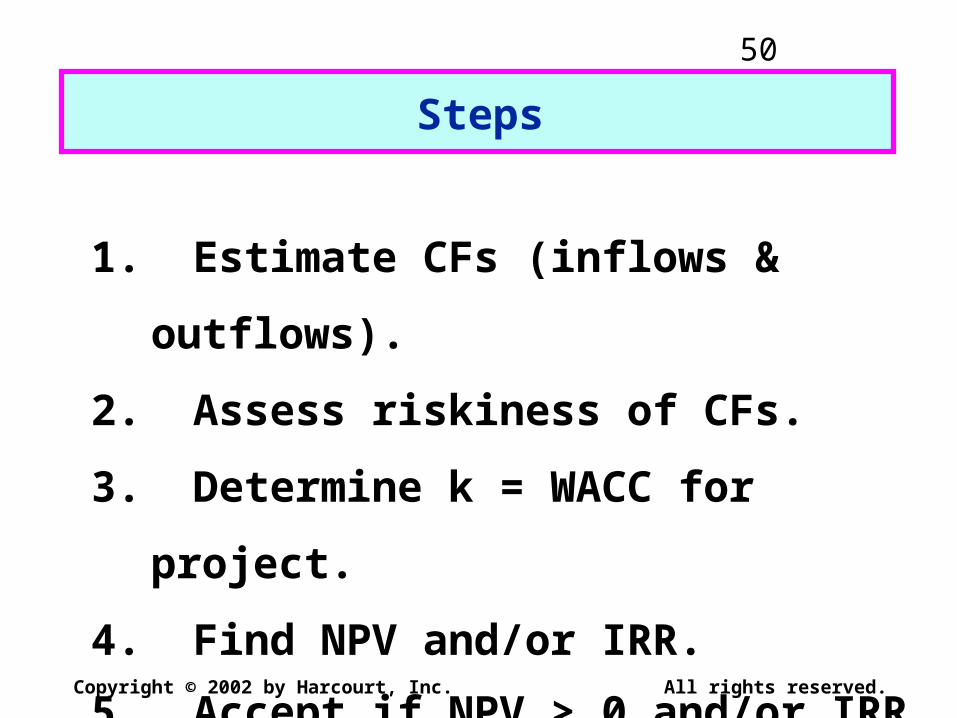
Steps
1. Estimate CFs (inflows & outflows).
2. Assess riskiness of CFs.
3. Determine k = WACC for project.
4. Find NPV and/or IRR.
5. Accept if NPV > 0 and/or IRR > WACC.

51
Copyright © 2002 by Harcourt, Inc. All rights reserved.
What is the difference between independent and mutually exclusive
projects?
Projects are:
independent, if the cash flows of one are unaffected by the acceptance of the other.
mutually exclusive, if the cash flows of one can be adversely impacted by the acceptance of the other.

52
Copyright © 2002 by Harcourt, Inc. All rights reserved.
An Example of Mutually Exclusive Projects
BRIDGE vs. BOAT to get products across a river.
53
Copyright © 2002 by Harcourt, Inc. All rights reserved.
What is the payback period?
The number of years required to recover a project’s cost,
or how long does it take to get the business’s money back?
54
Copyright © 2002 by Harcourt, Inc. All rights reserved.
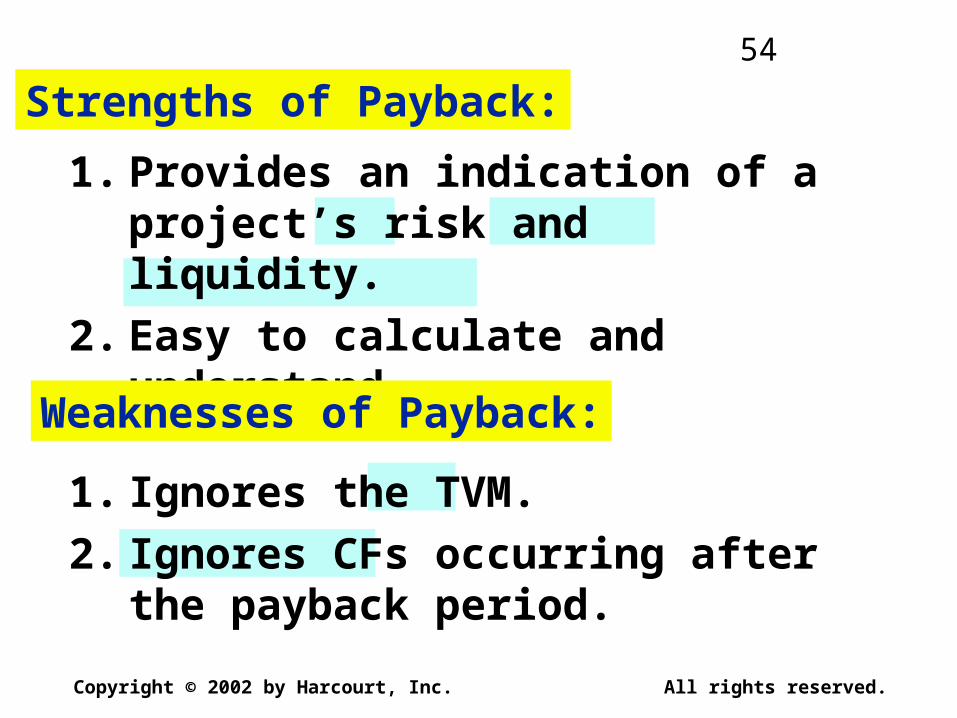
Strengths of Payback:
1. Provides an indication of a project’s risk and liquidity.
2. Easy to calculate and understand.
Weaknesses of Payback:
1. Ignores the TVM.
2. Ignores CFs occurring after the payback period.

55
Copyright © 2002 by Harcourt, Inc. All rights reserved.
NPV
CF
kt
nt
t 0 1
.
NPV: Sum of the PVs of inflows and outflows.
Cost often is CF0 and is negative.
.CF
k1
CFNPV 0t
tn
1t

56
Copyright © 2002 by Harcourt, Inc. All rights reserved.
Rationale for the NPV Method
NPV = PV inflows - Cost= Net gain in wealth.
Accept project if NPV > 0.
Choose between mutually exclusive projects on basis ofhigher NPV. Adds most value.
57
Copyright © 2002 by Harcourt, Inc. All rights reserved.
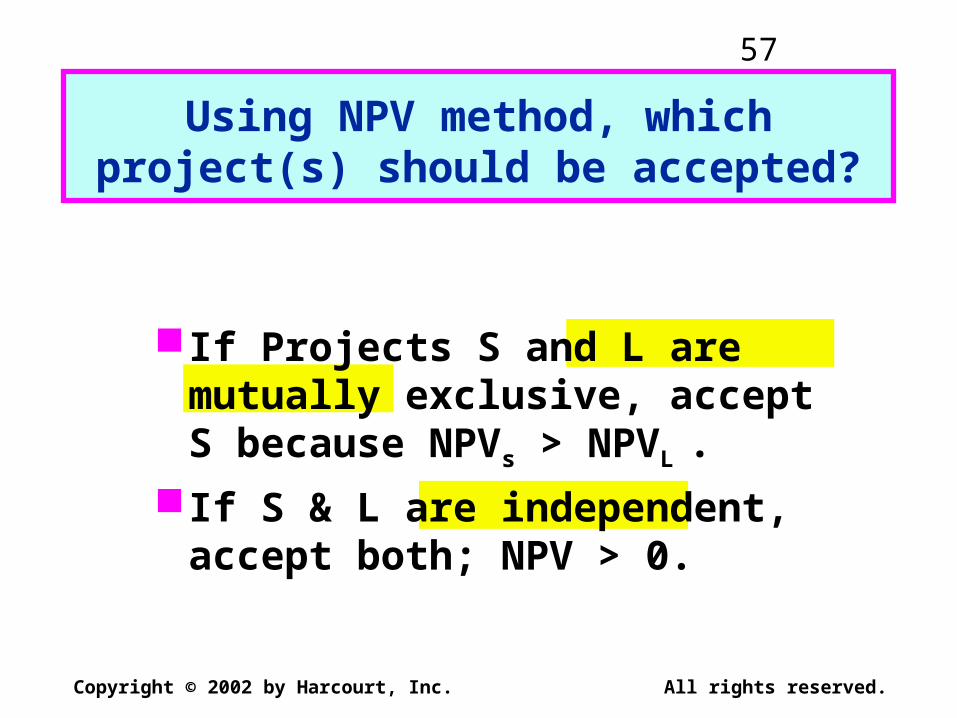
Using NPV method, which project(s) should be accepted?
If Projects S and L are mutually exclusive, accept S because NPVs > NPVL .
If S & L are independent, accept both; NPV > 0.
58
Copyright © 2002 by Harcourt, Inc. All rights reserved.
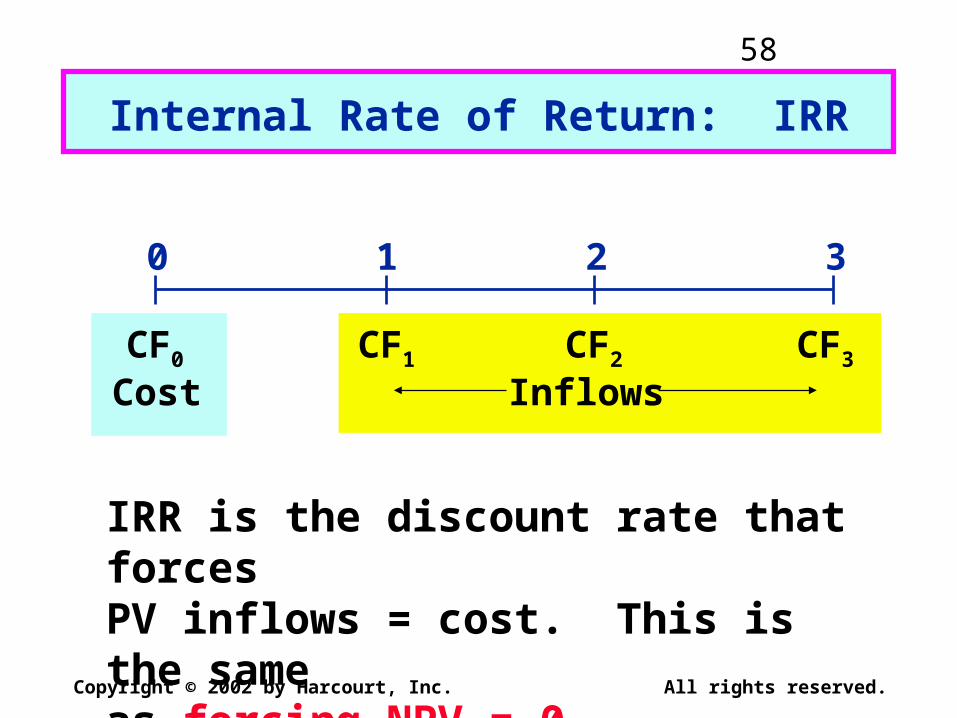
Internal Rate of Return: IRR
0 1 2 3
CF0 CF1 CF2 CF3
Cost Inflows
IRR is the discount rate that forcesPV inflows = cost. This is the sameas forcing NPV = 0.

59
Copyright © 2002 by Harcourt, Inc. All rights reserved.
Rationale for the IRR Method
If IRR > WACC, then the project’s rate of return is greater than its cost-- some return is left over to boost stockholders’ returns.
Example: WACC = 10%, IRR = 15%.Profitable.

60
Copyright © 2002 by Harcourt, Inc. All rights reserved.
-10
0
10
20
30
40
50
60
0 5 10 15 20 23.6
NPV ($)
Discount Rate (%)
IRRL = 18.1%
IRRS = 23.6%
Crossover Point = 8.7%
k
0
5
10
15
20
NPVL
50
33
19
7
(4)
NPVS
40
29
20
12
5
S
L

61
Copyright © 2002 by Harcourt, Inc. All rights reserved.
Reinvestment Rate Assumptions
NPV assumes reinvest at k (opportunity cost of capital).
IRR assumes reinvest at IRR.Reinvest at opportunity cost, k, is
more realistic, so NPV method is best. NPV should be used to choose between mutually exclusive projects.

62
Copyright © 2002 by Harcourt, Inc. All rights reserved.
Managers like rates--prefer IRR to NPV comparisons. Can we give them a
better IRR?
Yes, MIRR is the discount rate whichcauses the PV of a project’s terminalvalue (TV) to equal the PV of costs.TV is found by compounding inflowsat WACC.
Thus, MIRR assumes cash inflows are reinvested at WACC.

63
Copyright © 2002 by Harcourt, Inc. All rights reserved.
MIRR = 16.5%
10.0 80.060.0
0 1 2 310%
66.0 12.1
158.1
MIRR for Project L (k = 10%)
-100.010%
10%
TV inflows-100.0
PV outflowsMIRRL = 16.5%
$100 = $158.1
(1+MIRRL)3

64
Copyright © 2002 by Harcourt, Inc. All rights reserved.
Relevant cash flowsWorking capital treatmentInflationRisk Analysis: Sensitivity
Analysis, Scenario Analysis, and Simulation Analysis
CHAPTER 14Cash Flow Estimation and Risk
Analysis

65
Copyright © 2002 by Harcourt, Inc. All rights reserved.
0 1 2 3 4
InitialOutlay
OCF1 OCF2 OCF3 OCF4
+ Terminal CF
NCF0 NCF1 NCF2 NCF3 NCF4
Set up without numbers a time line for the project CFs.

66
Copyright © 2002 by Harcourt, Inc. All rights reserved.
= Corporate cash flow with project
minus
Corporate cash flow without project
Incremental Cash Flow
67
Copyright © 2002 by Harcourt, Inc. All rights reserved.
NO. The costs of capital are already incorporated in the analysis since we use them in discounting.
If we included them as cash flows, we would be double counting capital costs.
Should CFs include interest expense? Dividends?
68
Copyright © 2002 by Harcourt, Inc. All rights reserved.
NO. This is a sunk cost. Focus on incremental investment and operating cash flows.
Suppose $100,000 had been spent last year to improve the production line
site. Should this cost be included in the analysis?

69
Copyright © 2002 by Harcourt, Inc. All rights reserved.
Yes. Accepting the project means we will not receive the $25,000. This is an opportunity cost and it should be charged to the project.
A.T. opportunity cost = $25,000 (1 - T) = $15,000 annual cost.
Suppose the plant space could be leased out for $25,000 a year. Would
this affect the analysis?

70
Copyright © 2002 by Harcourt, Inc. All rights reserved.
Yes. The effects on the other projects’ CFs are “externalities”.
Net CF loss per year on other lines would be a cost to this project.
Externalities will be positive if new projects are complements to existing assets, negative if substitutes.
If the new product line would decrease sales of the firm’s other products by
$50,000 per year, would this affect the analysis?
71
Copyright © 2002 by Harcourt, Inc. All rights reserved.
What three types of risk are relevant in capital budgeting?
Stand-alone risk
Corporate risk (not as useful!)
Market (or beta) risk

72
Copyright © 2002 by Harcourt, Inc. All rights reserved.
How is each type of risk measured, and how do they relate to one another?
1. Stand-Alone Risk:
The project’s risk if it were the firm’s only asset and there were no shareholders.
Ignores both firm and shareholder diversification.
Measured by the or CV of NPV, IRR, or MIRR.
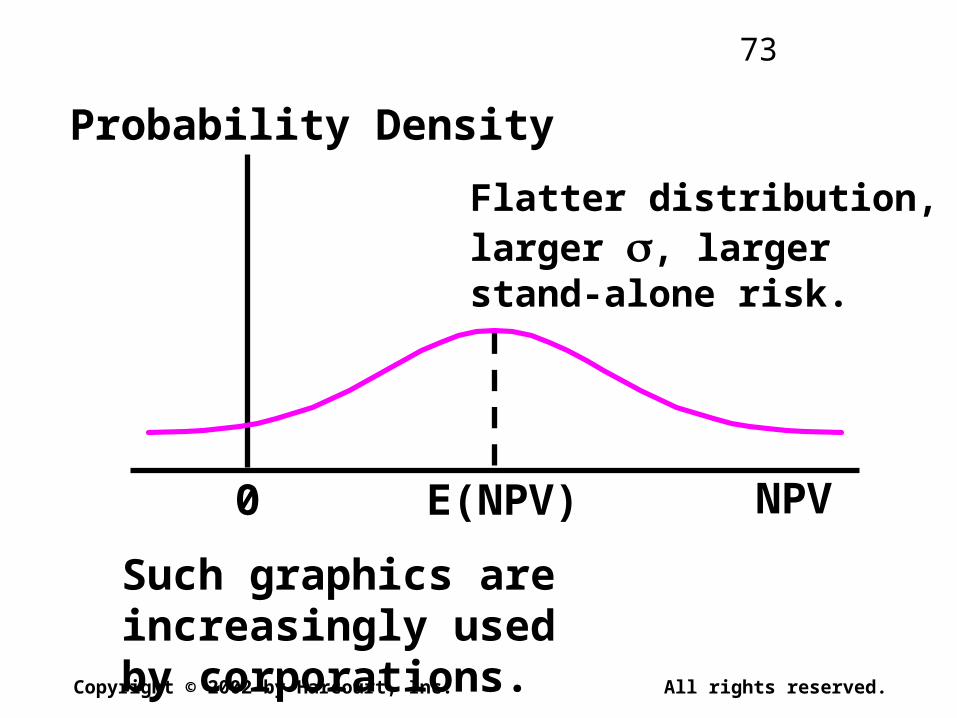
73
Copyright © 2002 by Harcourt, Inc. All rights reserved.
0 E(NPV)
Probability Density
Flatter distribution,larger , largerstand-alone risk.
Such graphics are increasingly usedby corporations.
NPV

74
Copyright © 2002 by Harcourt, Inc. All rights reserved.
3. Market Risk:
Reflects the project’s effect on a well-diversified stock portfolio.
Takes account of stockholders’ other assets.
Depends on project’s and correlation with the stock market.
Measured by the project’s market beta.
75
Copyright © 2002 by Harcourt, Inc. All rights reserved.
What is sensitivity analysis?
Shows how changes in a variable such as unit sales affect NPV or IRR.
Each variable is fixed except one. Change this one variable to see the effect on NPV or IRR.
Answers “what if” questions, e.g. “What if sales decline by 30%?”

76
Copyright © 2002 by Harcourt, Inc. All rights reserved.
What are the weaknesses ofsensitivity analysis?
Does not reflect diversification.
Says nothing about the likelihood of change in a variable, i.e. a steep sales line is not a problem if sales won’t fall.
Ignores relationships among variables.

77
Copyright © 2002 by Harcourt, Inc. All rights reserved.
What is scenario analysis?
Examines several possible situations, usually worst case, most likely case, and best case.
Provides a range of possible outcomes.

78
Copyright © 2002 by Harcourt, Inc. All rights reserved.
Assume we know with certainty all variables except unit sales, which
could range from 900 to 1,600.
E(NPV) = $ 82(NPV) = 47
C.V.(NPV) = (NPV) / E(NPV) = 0.57
Scenario Probability NPV(000)
Worst 0.25 $ 15
Base 0.50 82
Best 0.25 148

79
Copyright © 2002 by Harcourt, Inc. All rights reserved.
Should subjective risk factors be considered?
Yes. A numerical analysis may not capture all of the risk factors inherent in the project.
For example, if the project has the potential for bringing on harmful lawsuits, then it might be riskier than a standard analysis would indicate.
80
Copyright © 2002 by Harcourt, Inc. All rights reserved.
Are there any problems with scenario analysis?
Only considers a few possible out-comes.
Assumes that inputs are perfectly correlated--all “bad” values occur together and all “good” values occur together.
Focuses on stand-alone risk, although subjective adjustments can be made.

81
Copyright © 2002 by Harcourt, Inc. All rights reserved.
What is a simulation analysis?
A computerized version of scenario analysis which uses continuous probability distributions.
Computer selects values for each variable based on given probability distributions.
(More...)
82
Copyright © 2002 by Harcourt, Inc. All rights reserved.
NPV and IRR are calculated.
Process is repeated many times (1,000 or more).
End result: Probability distribution of NPV and IRR based on sample of simulated values.
Generally shown graphically.

83
Copyright © 2002 by Harcourt, Inc. All rights reserved.
0 E(NPV) NPV
Probability Density
Also gives NPV, CVNPV, probability of NPV > 0.
x x x x x x x x x x x x x x x x x x x x x x x x x x x x
xx xx x x x
x x x x x xx x x x x
x x x x x x x x x x x x x x x x x x x x x x x x x
84
Copyright © 2002 by Harcourt, Inc. All rights reserved.
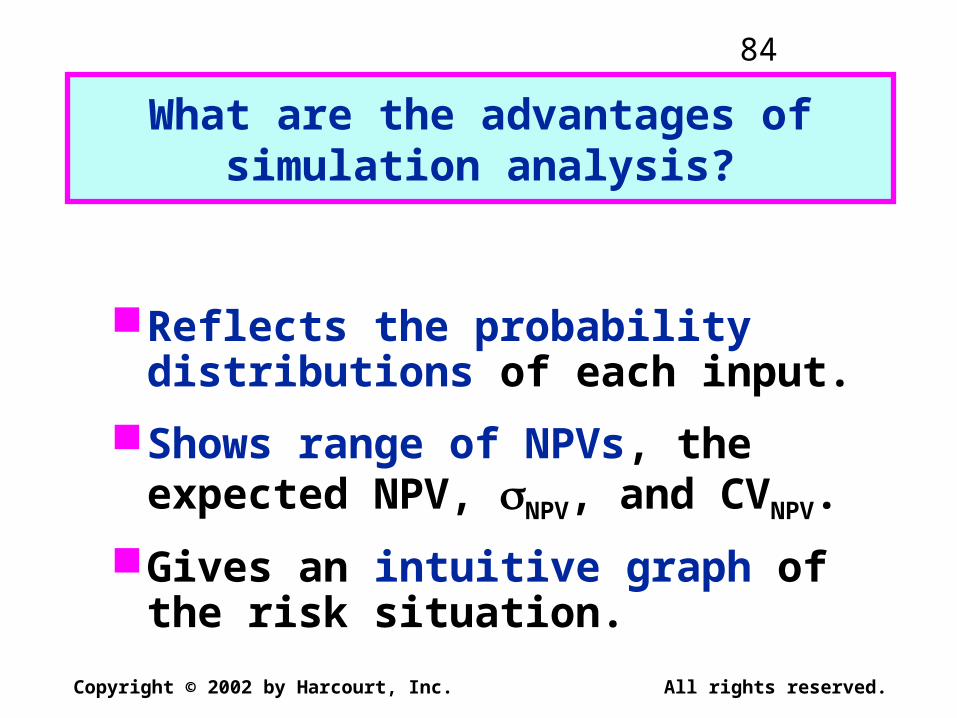
What are the advantages of simulation analysis?
Reflects the probability distributions of each input.
Shows range of NPVs, the expected NPV, NPV, and CVNPV.
Gives an intuitive graph of the risk situation.

85
Copyright © 2002 by Harcourt, Inc. All rights reserved.
What are the disadvantages of simulation?
Difficult to specify probability distributions and correlations.
If inputs are bad, output will be bad:“Garbage in, garbage out.”
(More...)

86
Copyright © 2002 by Harcourt, Inc. All rights reserved.
Sensitivity, scenario, and simulation analyses do not provide a decision rule. They do not indicate whether a project’s expected return is sufficient to compensate for its risk.
Sensitivity, scenario, and simulation analyses all ignore diversification. Thus they measure only stand-alone risk, which may not be the most relevant risk in capital budgeting.

87
Copyright © 2002 by Harcourt, Inc. All rights reserved.
Financial optionsBlack-Scholes Option Pricing ModelReal optionsDecision treesApplication of financial options to
real options
CHAPTER 15Financial Options with Applications to
Real Options

88
Copyright © 2002 by Harcourt, Inc. All rights reserved.
What is a real option?
Real options exist when managers can influence the size and risk of a project’s cash flows by taking different actions during the project’s life in response to changing market conditions.
Alert managers always look for real options in projects.
Smarter managers try to create real options.

89
Copyright © 2002 by Harcourt, Inc. All rights reserved.
An option is a contract which gives its holder the right, but not the obligation, to buy (or sell) an asset at some predetermined price within a specified period of time.
What is a financial option?
90
Copyright © 2002 by Harcourt, Inc. All rights reserved.
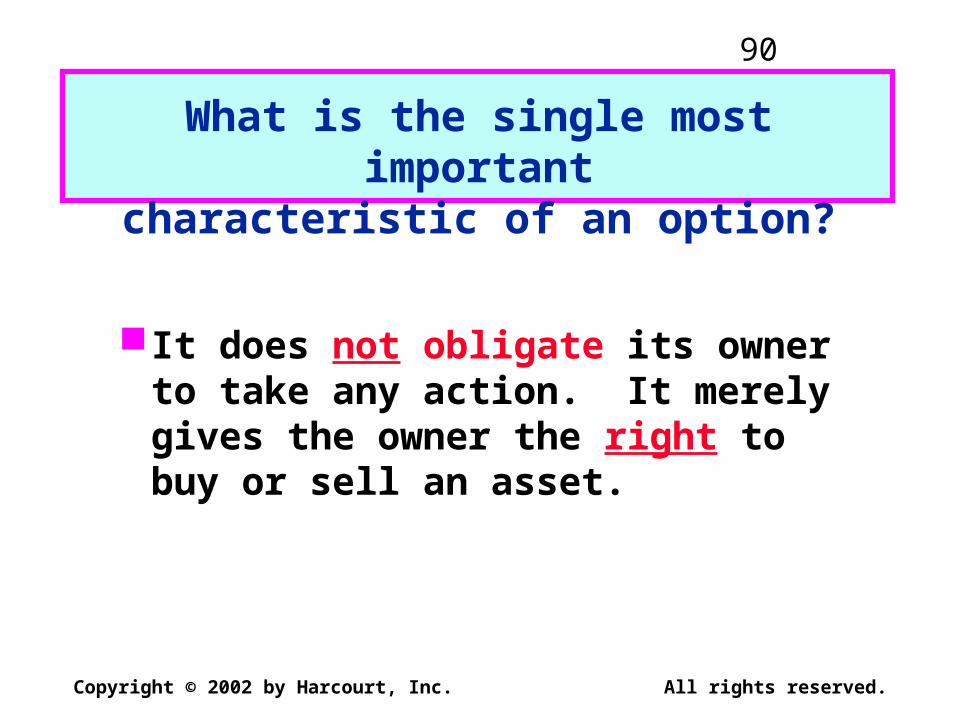
It does not obligate its owner to take any action. It merely gives the owner the right to buy or sell an asset.
What is the single most importantcharacteristic of an option?

91
Copyright © 2002 by Harcourt, Inc. All rights reserved.
Call option: An option to buy a specified number of shares of a security within some future period.
Put option: An option to sell a specified number of shares of a security within some future period.
Exercise (or strike) price: The price stated in the option contract at which the security can be bought or sold.
Key Option Terminology

92
Copyright © 2002 by Harcourt, Inc. All rights reserved.
The stock underlying the call option provides no dividends during the call option’s life.
There are no transactions costs for the sale/purchase of either the stock or the option.
kRF is known and constant during the option’s life.
What are the assumptions of theBlack-Scholes Option Pricing Model?
(More...)

93
Copyright © 2002 by Harcourt, Inc. All rights reserved.
Security buyers may borrow any fraction of the purchase price at the short-term risk-free rate.
No penalty for short selling and sellers receive immediately full cash proceeds at today’s price.
Call option can be exercised only on its expiration date.
Security trading takes place in continuous time, and stock prices move randomly in continuous time.
94
Copyright © 2002 by Harcourt, Inc. All rights reserved.
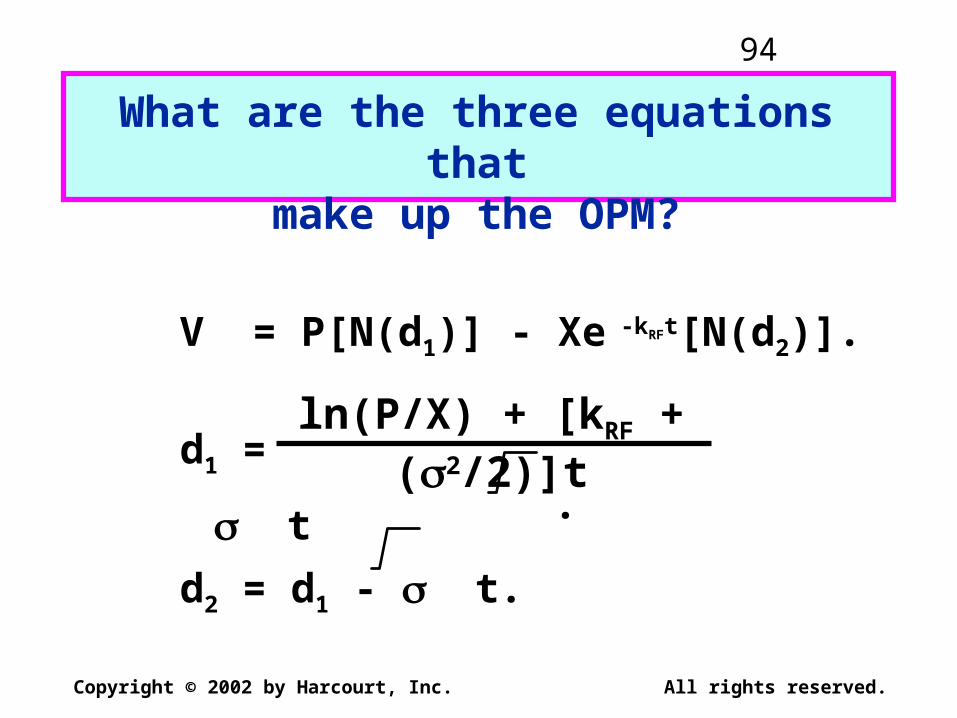
V = P[N(d1)] - Xe -kRFt[N(d2)].
d1 = . t
d2 = d1 - t.
What are the three equations thatmake up the OPM?
ln(P/X) + [kRF + (2/2)]t

95
Copyright © 2002 by Harcourt, Inc. All rights reserved.
Current stock price: Call option value increases as the current stock price increases.
Exercise price: As the exercise price increases, a call option’s value decreases.
What impact do the following para-meters have on a call option’s value?

96
Copyright © 2002 by Harcourt, Inc. All rights reserved.
Option period: As the expiration date is lengthened, a call option’s value increases (more chance of becoming in the money.)
Risk-free rate: Call option’s value tends to increase as kRF increases (reduces the PV of the exercise price).
Stock return variance: Option value increases with variance of the underlying stock (more chance of becoming in the money).

97
Copyright © 2002 by Harcourt, Inc. All rights reserved.
Introduction to Real Option Valuation
Alternative, yet complementary, approach to DCF-based Capital Budgeting.
Many corporate investments (especially “strategic” ones) have embedded options.
Overlooking these options can lead to
under-valuing investment projects. Using Real Options approach can improve
project management as well as valuations.

98
Copyright © 2002 by Harcourt, Inc. All rights reserved.
Types of Real Options
Abandonment Contraction
Temporary suspension
Permanent Switch / Transition
Change Product Mix
Change Input MixTechnical
Obsolescence
Wait / TimingResolve
UncertaintyIdentify Demand
ExpansionExisting ProductsNew Geographic
Markets Growth
New ProductsR&D

99
Copyright © 2002 by Harcourt, Inc. All rights reserved.
Relation between Financial Options & Real Options
Corporate Project Variable Financial Call Option
Expenditures to acquire asset
X Exercise Price
PV of acquired asset
S Stock Price
Time that decision can be deferred
t Time to Expiration
Riskiness of asset Variance of Return
Time value of money
r Risk-free Rate

100
Copyright © 2002 by Harcourt, Inc. All rights reserved.
Calculating the NPV Quotient (NPVq)
_____ NPVq < 1.0____|____NPVq > 1.0_____
Negative NPV Positive NPV
Calls Out-of-Money Calls In-the-Money
)(es)Expenditur Capital(
Flows)Cash Net (
XPV
S
PV
ExpectedPVNPVq
101
Copyright © 2002 by Harcourt, Inc. All rights reserved.
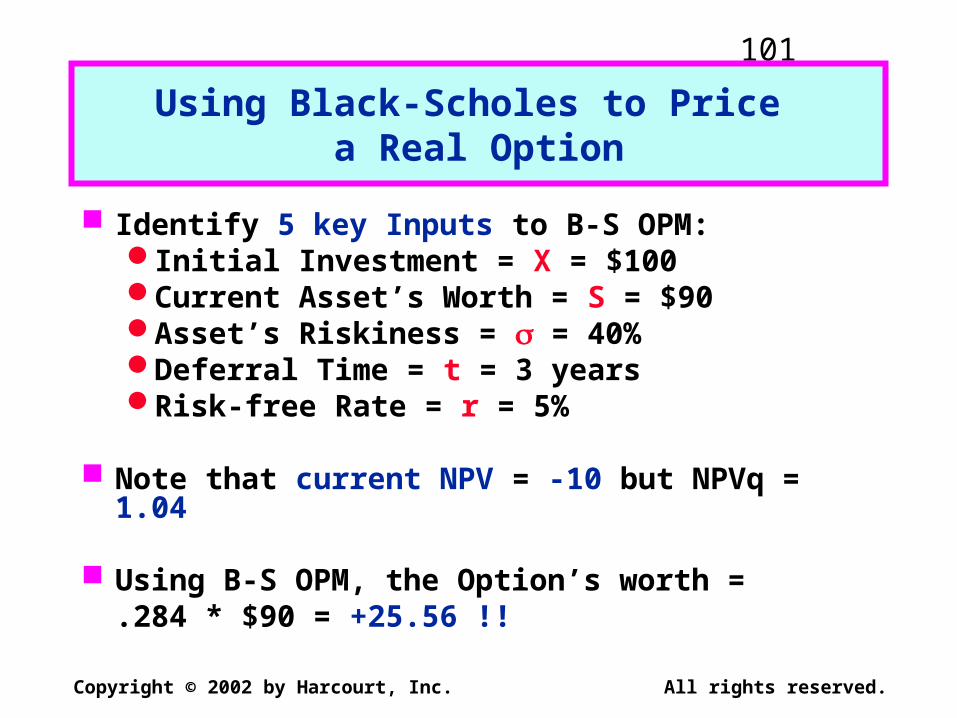
Using Black-Scholes to Price a Real Option
Identify 5 key Inputs to B-S OPM:Initial Investment = X = $100Current Asset’s Worth = S = $90Asset’s Riskiness = = 40%Deferral Time = t = 3 yearsRisk-free Rate = r = 5%
Note that current NPV = -10 but NPVq = 1.04
Using B-S OPM, the Option’s worth = .284 * $90 = +25.56 !!

102
Copyright © 2002 by Harcourt, Inc. All rights reserved.
“Tomato Gardens” & Real Options
Cumul. Variance
Out of the Money (NPVq < 1.0)
In the Money
(NPVq > 1.0)
Very Low Exercise Never Exercise Now
Low Doubtful: NPV<0; NPVq<1; & 2 is low.
Wait if possible. Otherwise, exercise early.
High Less Promising: NPV < 0 and NPVq < 1; but 2 is high.
Very Promising:
NPV < 0 but NPVq > 1

103
Copyright © 2002 by Harcourt, Inc. All rights reserved.
Real Option Implementation Issues
Need to Simplify Complex Projects.
Difficulties in Estimating Volatility (use simulation, judgment, coefficient of variation)
Checking Model Validity (distributions, decision trees).
Interpreting Results:
(sensitivity analysis is a must!)

104
Copyright © 2002 by Harcourt, Inc. All rights reserved.
Three Ways to Estimate 2
Judgment.The direct approach, using the
results from the scenarios.The indirect approach, using the
expected distribution of the project’s value.
105
Copyright © 2002 by Harcourt, Inc. All rights reserved.
Estimating 2 with Judgment
The typical stock has 2 of about 12%.A project should be riskier than the
firm as a whole, since the firm is a portfolio of projects.
The company in this example has 2 = 10%, so we might expect the project to have 2 between 12% and 19%.

106
Copyright © 2002 by Harcourt, Inc. All rights reserved.
Estimating 2 with the Direct Approach
Use the previous scenario analysis to estimate the return from the present until the option must be exercised. Do this for each scenario
Find the variance of these returns, given the probability of each scenario.
107
Copyright © 2002 by Harcourt, Inc. All rights reserved.
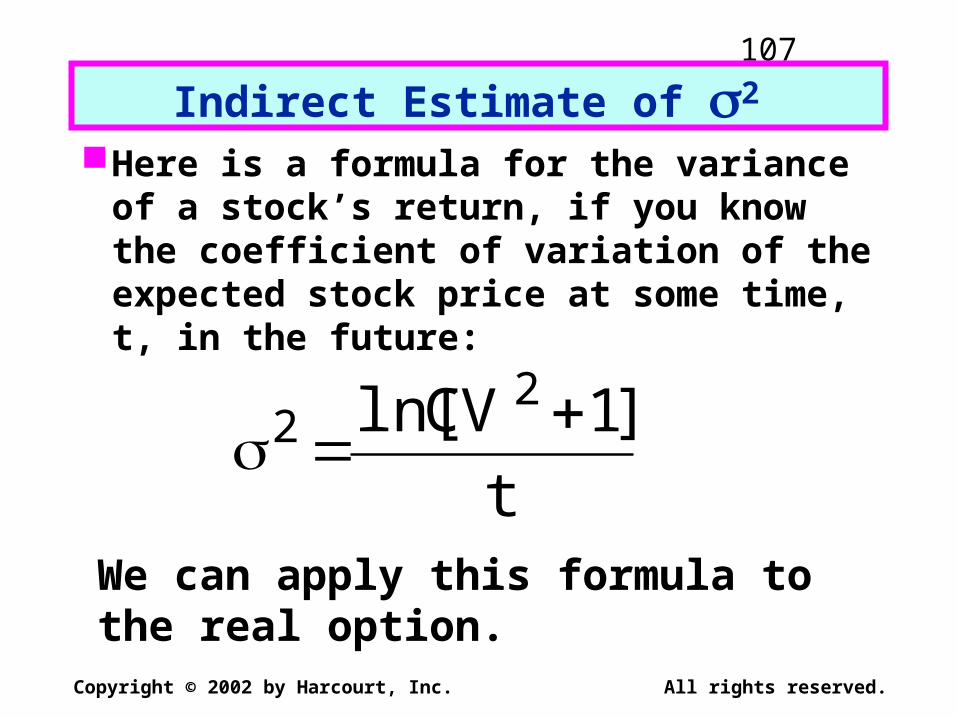
Indirect Estimate of 2 Here is a formula for the variance of a
stock’s return, if you know the coefficient of variation of the expected stock price at some time, t, in the future:
t
]1CVln[ 22
We can apply this formula to the real option.
108
Copyright © 2002 by Harcourt, Inc. All rights reserved.
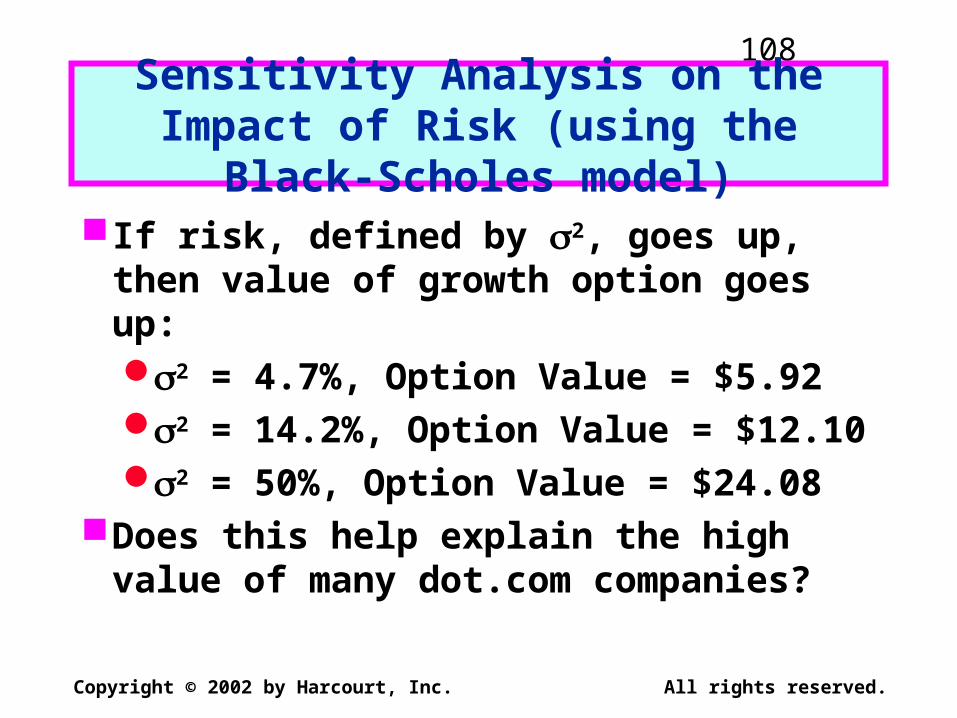
Sensitivity Analysis on the Impact of Risk (using the Black-Scholes model)
If risk, defined by 2, goes up, then value of growth option goes up:2 = 4.7%, Option Value = $5.922 = 14.2%, Option Value = $12.102 = 50%, Option Value = $24.08
Does this help explain the high value of many dot.com companies?
109
Copyright © 2002 by Harcourt, Inc. All rights reserved.
CHAPTER 16Capital Structure Decisions:
The Basics
Impact of leverage on returns
Business versus financial risk
Capital structure theory
Perpetual cash flow example
Setting the optimal capital structure in practice
110
Copyright © 2002 by Harcourt, Inc. All rights reserved.
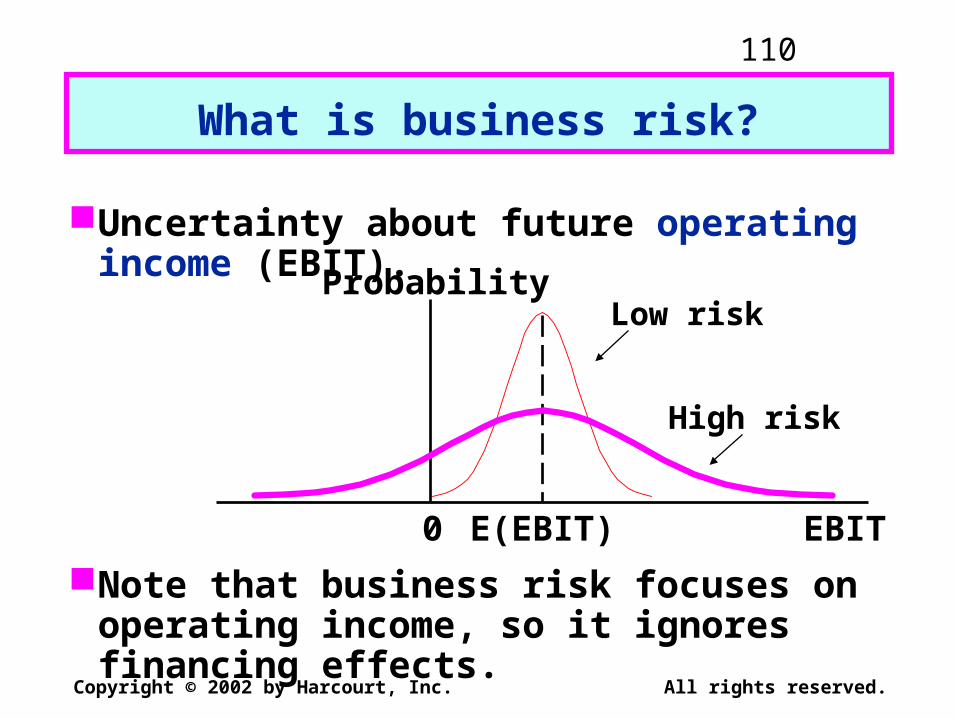
Uncertainty about future operating income (EBIT).
Note that business risk focuses on operating income, so it ignores financing effects.
What is business risk?
Probability
EBITE(EBIT)0
Low risk
High risk

111
Copyright © 2002 by Harcourt, Inc. All rights reserved.
Business Risk versus Financial RiskBusiness risk:
Uncertainty in future EBIT.Depends on business factors such as
competition, operating leverage.Financial risk:
Additional risk concentrated on common stockholders when financial leverage is used.
Depends on the amount of debt and preferred stock financing.

112
Copyright © 2002 by Harcourt, Inc. All rights reserved.
From a shareholder’s perspective, how are financial and business risk
measured in the stand-alone sense?
Stand-alone Business Financialrisk risk risk= + .
Stand-alone risk = ROE.
Business risk = ROE(U).
Financial risk = ROE - ROE(U).

113
Copyright © 2002 by Harcourt, Inc. All rights reserved.
Capital Structure Theory
MM theoryZero taxesCorporate taxesCorporate and personal taxes
Trade-off theory
Signaling theory
Debt financing as a managerial constraint

114
Copyright © 2002 by Harcourt, Inc. All rights reserved.
MM Theory: Zero Taxes
MM prove, under a very restrictive set of assumptions, that a firm’s value is unaffected by its financing mix.
Therefore, capital structure is irrelevant.
Any increase in ROE resulting from financial leverage is exactly offset by the increase in risk.

115
Copyright © 2002 by Harcourt, Inc. All rights reserved.
MM Theory: Corporate Taxes
Corporate tax laws favor debt financing over equity financing.
With corporate taxes, the benefits of financial leverage exceed the risks: More EBIT goes to investors and less to taxes when leverage is used.
Firms should use almost 100% debt financing to maximize value.
116
Copyright © 2002 by Harcourt, Inc. All rights reserved.
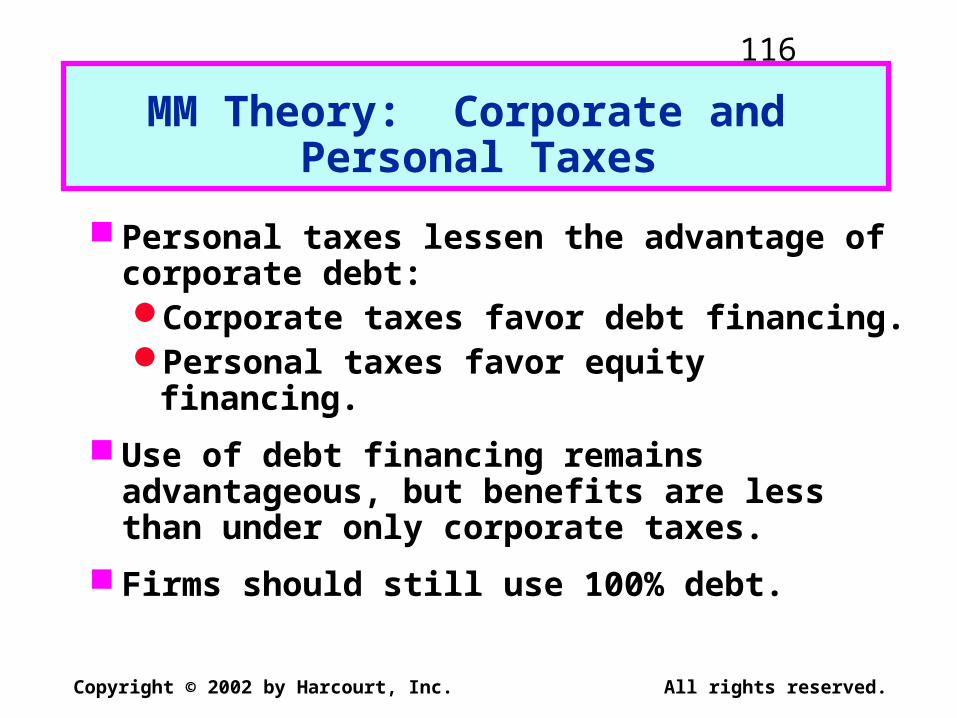
MM Theory: Corporate and Personal Taxes
Personal taxes lessen the advantage of corporate debt:Corporate taxes favor debt financing.Personal taxes favor equity financing.
Use of debt financing remains advantageous, but benefits are less than under only corporate taxes.
Firms should still use 100% debt.

117
Copyright © 2002 by Harcourt, Inc. All rights reserved.
Hamada’s Equation
MM theory implies that CAPM’s beta changes with leverage (but no empirical support!).
bU is the beta of a firm when it has no debt (the unlevered beta)
bL = bU(1 + (1 - T)(D/E))
In practice, D/E is measured in book values when bL is calculated.
118
Copyright © 2002 by Harcourt, Inc. All rights reserved.
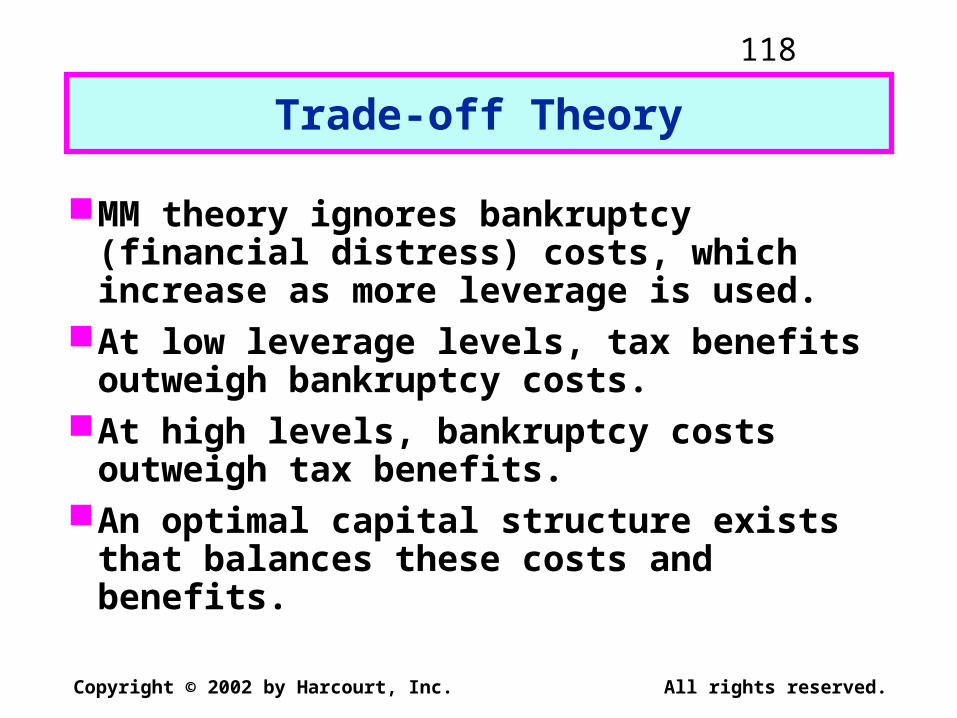
Trade-off Theory
MM theory ignores bankruptcy (financial distress) costs, which increase as more leverage is used.
At low leverage levels, tax benefits outweigh bankruptcy costs.
At high levels, bankruptcy costs outweigh tax benefits.
An optimal capital structure exists that balances these costs and benefits.

119
Copyright © 2002 by Harcourt, Inc. All rights reserved.
Signaling Theory
MM assumed that investors and managers have the same information.
But, managers often have better information. Thus, they would:Sell stock if stock is overvalued.Sell bonds if stock is undervalued.
Investors understand this, so view new stock sales as a negative signal.
Implications? Pecking Order may exist.

120
Copyright © 2002 by Harcourt, Inc. All rights reserved.
Debt Financing As a Managerial Constraint
One agency problem is that managers can use corporate funds for non-value maximizing purposes.
The use of financial leverage:Binds “free cash flow.”Forces discipline on managers.
However, it also increases risk of financial distress.

121
Copyright © 2002 by Harcourt, Inc. All rights reserved.
Debt ratios of other firms in the industry.
Pro forma coverage ratios at different capital structures under different economic scenarios.
Lender and rating agency attitudes(impact on bond ratings).
What other factors would managers consider when setting the target
capital structure?

122
Copyright © 2002 by Harcourt, Inc. All rights reserved.
Reserve borrowing capacity.
Effects on control.
Type of assets: Are they tangible, and hence suitable as collateral?
Tax rates.
123
Copyright © 2002 by Harcourt, Inc. All rights reserved.
CHAPTER 18Distributions to Shareholders:Dividends and Repurchases
Theories of investor preferencesSignaling effectsResidual modelDividend reinvestment plansStock dividends and stock splitsStock repurchases
124
Copyright © 2002 by Harcourt, Inc. All rights reserved.
What is “dividend policy”?
It’s the decision to pay out earnings versus retaining and reinvesting them. Includes these elements:
1. High or low payout?
2. Stable or irregular dividends?
3. How frequent?
4. Do we announce the policy?
125
Copyright © 2002 by Harcourt, Inc. All rights reserved.
Do investors prefer high or low payouts? There are three theories:
Dividends are irrelevant: Investors don’t care about payout.
Bird-in-the-hand: Investors prefer a high payout.
Tax preference: Investors prefer a low payout, hence growth.

126
Copyright © 2002 by Harcourt, Inc. All rights reserved.
Dividend Irrelevance Theory
Investors are indifferent between dividends and retention-generated capital gains. If they want cash, they can sell stock. If they don’t want cash, they can use dividends to buy stock.
Modigliani-Miller support irrelevance.Theory is based on unrealistic
assumptions (no taxes or brokerage costs), hence may not be true. Need empirical test.

127
Copyright © 2002 by Harcourt, Inc. All rights reserved.
Bird-in-the-Hand Theory
Investors think dividends are less risky than potential future capital gains, hence they like dividends.
If so, investors would value high payout firms more highly, i.e., a high payout would result in a high P0.

128
Copyright © 2002 by Harcourt, Inc. All rights reserved.
Tax Preference Theory
Retained earnings lead to capital gains, which are taxed at lower rates than dividends: 28% maximum vs. up to 39.6%. Capital gains taxes are also deferred.
This could cause investors to prefer firms with low payouts, i.e., a high payout results in a low P0.
129
Copyright © 2002 by Harcourt, Inc. All rights reserved.
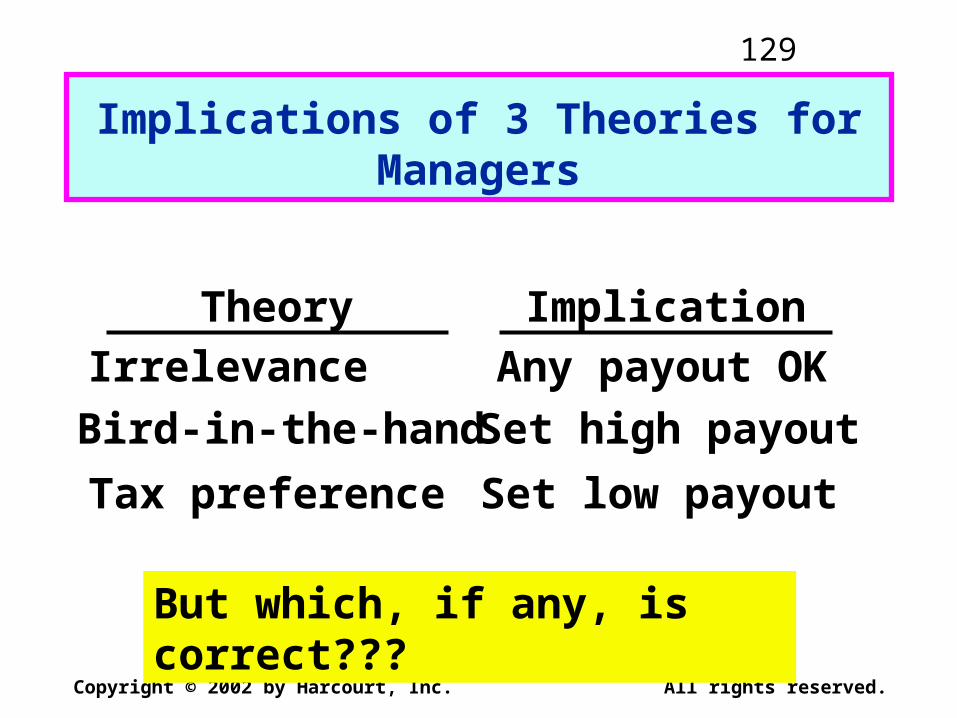
Implications of 3 Theories for Managers
Theory Implication
Irrelevance Any payout OK
Bird-in-the-hand Set high payout
Tax preference Set low payout
But which, if any, is correct???

130
Copyright © 2002 by Harcourt, Inc. All rights reserved.
Possible Stock Price Effects
Stock Price ($)
Payout 50% 100%
40
30
20
10
Bird-in-Hand
Indifference
Tax preference
0

131
Copyright © 2002 by Harcourt, Inc. All rights reserved.
Which theory is most correct?
Empirical testing has not been able to determine which theory, if any, is correct.
Thus, managers use judgment when setting policy.
Analysis is used, but it must be applied with judgment.

132
Copyright © 2002 by Harcourt, Inc. All rights reserved.
What’s the “information content,” or “signaling,” hypothesis?
Managers hate to cut dividends, so won’t raise dividends unless they think raise is sustainable. So, investors view dividend increases as signals of management’s view of the future.
Therefore, a stock price increase at time of a dividend increase could reflect higher expectations for future EPS, not a desire for dividends.

133
Copyright © 2002 by Harcourt, Inc. All rights reserved.
What’s the “clientele effect”?
Different groups of investors, or clienteles, prefer different dividend policies.
Firm’s past dividend policy determines its current clientele of investors.
Clientele effects impede changing dividend policy. Taxes & brokerage costs hurt investors who have to switch companies.

134
Copyright © 2002 by Harcourt, Inc. All rights reserved.
What’s the “residual dividend model”?
Find the retained earnings needed for the capital budget.
Pay out any leftover earnings (the residual) as dividends.
This policy minimizes flotation and equity signaling costs, hence minimizes the WACC.
135
Copyright © 2002 by Harcourt, Inc. All rights reserved.
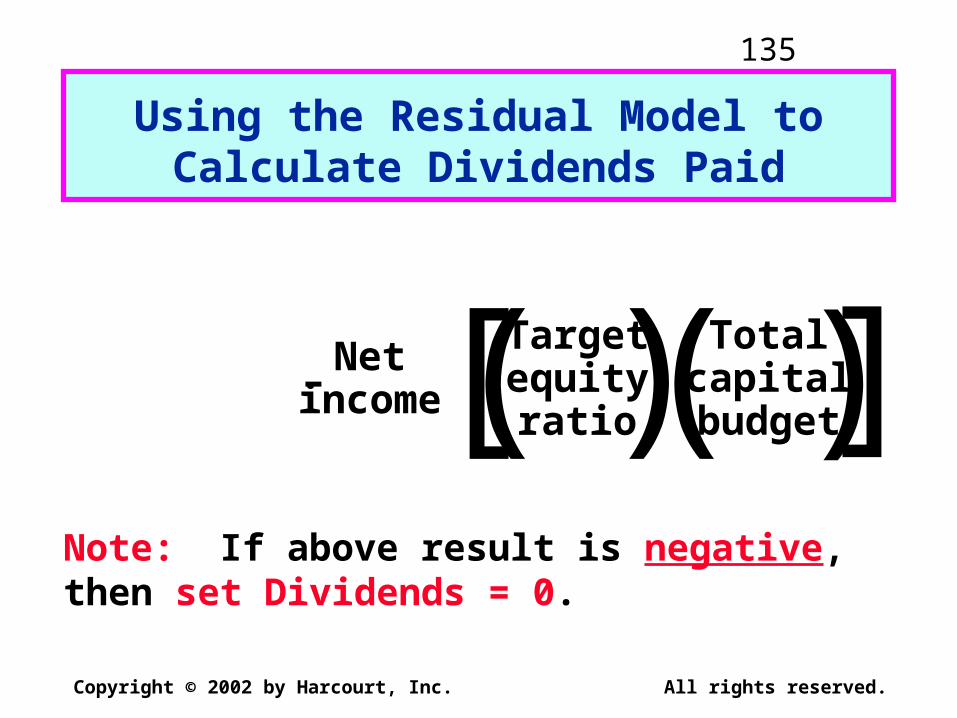
Using the Residual Model to Calculate Dividends Paid
Dividends = – .Net
income
Targetequityratio
Totalcapitalbudget[ ]))((
Note: If above result is negative, then set Dividends = 0.

136
Copyright © 2002 by Harcourt, Inc. All rights reserved.
Advantages and Disadvantages of the Residual Dividend Policy
Advantages: Minimizes new stock issues and flotation costs.
Disadvantages: Results in variable dividends, sends conflicting signals, increases risk, and doesn’t appeal to any specific clientele.
Conclusion: Consider residual policy when setting target payout, but don’t follow it rigidly.

137
Copyright © 2002 by Harcourt, Inc. All rights reserved.
Setting Dividend Policy
Forecast capital needs over a planning horizon, often 5 years.
Set a target capital structure.Estimate annual equity needs.Set target payout based on the
residual model.Generally, some dividend growth rate
emerges. Maintain target growth rate if possible, varying capital structure somewhat if necessary.

138
Copyright © 2002 by Harcourt, Inc. All rights reserved.
Stock Repurchases
Reasons for repurchases:As an alternative to distributing cash as
dividends.To dispose of one-time cash from an
asset sale.To make a large capital structure
change.
Repurchases: Buying own stock back from stockholders.

139
Copyright © 2002 by Harcourt, Inc. All rights reserved.
Advantages of Repurchases
Stockholders can tender or not. Helps avoid setting a high dividend that
cannot be maintained. Repurchased stock can be used in takeovers
or resold to raise cash as needed. Income received is capital gains rather than
higher-taxed dividends. Stockholders may take as a positive signal--
management thinks stock is undervalued.
140
Copyright © 2002 by Harcourt, Inc. All rights reserved.
Disadvantages of Repurchases
May be viewed as a negative signal (firm has poor investment opportunities).
IRS could impose penalties if repurchases were primarily to avoid taxes on dividends.
Selling stockholders may not be well informed, hence be treated unfairly.
Firm may have to bid up price to complete purchase, thus paying too much for its own stock.
141
Copyright © 2002 by Harcourt, Inc. All rights reserved.
Initial Public OfferingsInvestment Banking and RegulationThe Maturity Structure of DebtRefunding OperationsThe Risk Structure of Debt
CHAPTER 19Initial Public Offerings, Investment
Banking, and Financial Restructuring

142
Copyright © 2002 by Harcourt, Inc. All rights reserved.
How are start-up firms usually financed?
Founder’s resourcesAngelsVenture capital funds
Most capital in fund is provided by institutional investors
Managers of fund are called venture capitalists
Venture capitalists (VCs) sit on boards of companies they fund
143
Copyright © 2002 by Harcourt, Inc. All rights reserved.
In a private placement, such as to angels or VCs, securities are sold to a few investors rather than to the public at large.
In a public offering, securities are offered to the public and must be registered with SEC.
Differentiate between a privateplacement and a public offering.
(More...)

144
Copyright © 2002 by Harcourt, Inc. All rights reserved.
Advantages of going publicCurrent stockholders can diversify.Liquidity is increased.Easier to raise capital in the future.Going public establishes firm value.Makes it more feasible to use stock as
employee incentives.Increases customer recognition.
Why would a company considergoing public?
(More...)

145
Copyright © 2002 by Harcourt, Inc. All rights reserved.
Disadvantages of Going PublicMust file numerous reports.Operating data must be disclosed.Officers must disclose holdings.Special “deals” to insiders will be
more difficult to undertake.Small new issue may not be actively
traded, so market-determined price may not reflect true value.
Managing investor relations is time-consuming.

146
Copyright © 2002 by Harcourt, Inc. All rights reserved.
What are the steps of an IPO?
Select investment bankerFile registration document (S-1) with
SECChoose price range for preliminary (or
“red herring”) prospectusGo on roadshowSet final offer price in final prospectus

147
Copyright © 2002 by Harcourt, Inc. All rights reserved.
What criteria are important in choosing an investment banker?
Reputation and experience in this industry
Existing mix of institutional and retail (i.e., individual) clients
Support in the post-IPO secondary marketReputation of analyst covering the
stock

148
Copyright © 2002 by Harcourt, Inc. All rights reserved.
What are the long-term returns to investors in IPOs?
Two-year return following IPO is lower than for comparable non-IPO firms.
On average, the IPO offer price is too low, and the first-day run-up is too high.
149
Copyright © 2002 by Harcourt, Inc. All rights reserved.
What are the direct costs of an IPO?
Underwriter usually charges a 7% spread between offer price and proceeds to issuer.
Direct costs to lawyers, printers, accountants, etc. can be over $400,000.

150
Copyright © 2002 by Harcourt, Inc. All rights reserved.
Risk management and stock value maximization.
Derivative securities.Fundamentals of risk management.Using derivatives to reduce interest
rate risk.
CHAPTER 24Derivatives and Risk Management

151
Copyright © 2002 by Harcourt, Inc. All rights reserved.
How can risk management increase the value of a corporation?
Risk management allows firms to: Have greater debt capacity, which
has a larger tax shield of interest payments.
Implement the optimal capital budget without having to raise external equity in years that would have had low cash flow due to volatility. (More...)

152
Copyright © 2002 by Harcourt, Inc. All rights reserved.
Risk management allows firms to: Avoid costs of financial distress.
Weakened relationships with suppliers.
Loss of potential customers.
Distractions to managers. Utilize comparative advantage in hedging
relative to hedging ability of investors. Also, signaling and agency issues can be factors.

153
Copyright © 2002 by Harcourt, Inc. All rights reserved.
Speculative risks: Those that offer the chance of a gain as well as a loss.
Pure risks: Those that offer only the prospect of a loss.
Demand risks: Those associated with the demand for a firm’s products or services.
Input risks: Those associated with a firm’s input costs.
Definitions of Different Types of Risk
(More...)
154
Copyright © 2002 by Harcourt, Inc. All rights reserved.
Financial risks: Those that result from financial transactions.
Property risks: Those associated with loss of a firm’s productive assets.
Personnel risk: Risks that result from human actions.
Environmental risk: Risk associated with polluting the environment.
Liability risks: Connected with product, service, or employee liability.
Insurable risks: Those which typically can be covered by insurance.

155
Copyright © 2002 by Harcourt, Inc. All rights reserved.
Step 1. Identify the risks faced by the firm.
Step 2. Measure the potential impact of the identified risks.
Step 3. Decide how each relevant risk should be dealt with.
Step 4. Monitor the performance of the risk management program.
What are the four steps of corporate risk management?

156
Copyright © 2002 by Harcourt, Inc. All rights reserved.
Transfer risk to an insurance company by paying periodic premiums.
Transfer functions which produce risk to third parties.
Purchase derivatives contracts to reduce input and financial risks.
What are some actions thatcompanies can take to minimize
or reduce risk exposures?
(More...)

157
Copyright © 2002 by Harcourt, Inc. All rights reserved.
Take actions to reduce the probability of occurrence of adverse events.
Take actions to reduce the magnitude of the loss associated with adverse events.
Avoid the activities that give rise to risk.
158
Copyright © 2002 by Harcourt, Inc. All rights reserved.
Derivative: Security whose value stems or is derived from the value of other assets. Swaps, options, and futures are used to manage financial risk exposures.
Futures: Contracts which call for the purchase or sale of a financial (or real) asset at some future date, but at a price determined today. Futures (and other derivatives) can be used either as highly leveraged speculations or to hedge and thus reduce risk.
Financial Risk Management Concepts
(More...)

159
Copyright © 2002 by Harcourt, Inc. All rights reserved.
Hedging: Generally conducted where a price change could negatively affect a firm’s profits / cash flow.
Long hedge: Involves the purchase of a futures contract to guard against a price increase.
Short hedge: Involves the sale of a futures contract to protect against a price decline in commodities or financial securities.

160
Copyright © 2002 by Harcourt, Inc. All rights reserved.
Types of leasesTax treatment of leasesEffects on financial statementsLessee’s analysisLessor’s analysisOther issues in lease analysis
CHAPTER 20Lease Financing
161
Copyright © 2002 by Harcourt, Inc. All rights reserved.
The lessee, who uses the asset and makes the lease, or rental, payments.
The lessor, who owns the asset and receives the rental payments.
Note that the lease decision is a financing decision for the lessee and an investment decision for the lessor.
Who are the two parties to a lease transaction?

162
Copyright © 2002 by Harcourt, Inc. All rights reserved.
Operating leaseShort-term and normally cancelableMaintenance usually included
Financial leaseLong-term and normally noncancelableMaintenance usually not included
Sale and leasebackCombination lease
What are the four primary lease types?

163
Copyright © 2002 by Harcourt, Inc. All rights reserved.
Leases are classified by the IRS as either guideline or nonguideline.
For a guideline lease, the entire lease payment is deductible to the lessee.
For a nonguideline lease, only the imputed interest payment is deductible.
Why should the IRS be concerned about lease provisions?
How are leases treated for tax purposes?

164
Copyright © 2002 by Harcourt, Inc. All rights reserved.
For accounting purposes, leases are classified as either capital or operating.
Capital leases must be shown directly on the lessee’s balance sheet.
Operating leases, sometimes referred to as off-balance sheet financing, must be disclosed in the footnotes.
Why are these rules in place?
How does leasing affect afirm’s balance sheet?

165
Copyright © 2002 by Harcourt, Inc. All rights reserved.
Leasing is a substitute for debt.As such, leasing uses up a firm’s debt
capacity.Assume a firm has a 50/50 target
capital structure. Half of its assets are leased. How should the remaining assets be financed?
What impact does leasing have ona firm’s capital structure?
166
Copyright © 2002 by Harcourt, Inc. All rights reserved.
What effect would increased uncertainty about the residual value
have on the lessee’s decision?
The lessor owns the equipment when the lease expires.
Therefore, residual value risk is passed from the lessee to the lessor.
Increased residual value risk makes the lease more attractive to the lessee.
167
Copyright © 2002 by Harcourt, Inc. All rights reserved.
A cancellation clause would lower the risk of the lease to the lessee but raise the lessor’s risk.
To account for this, the lessor would increase the annual lease payment or else impose a penalty for early cancellation.
What impact would a cancellation clause have on the lease’s riskiness from the lessee’s standpoint? From
the lessor’s standpoint?

168
Copyright © 2002 by Harcourt, Inc. All rights reserved.
Do higher residual values make leasing less attractive to the lessee?
Is lease financing more available or “better” than debt financing?
Is the lease analysis presented here applicable to real estate leases? To auto leases?
Other Issues in Lease Analysis
(More...)

169
Copyright © 2002 by Harcourt, Inc. All rights reserved.
Would spreadsheet models be useful in lease analyses?
What impact do tax laws have on the attractiveness of leasing? Consider the following provisions:Investment tax credit (when
available)Tax rate differentials between the
lessee and the lessorAlternative minimum tax (AMT)

170
Copyright © 2002 by Harcourt, Inc. All rights reserved.
Provision of maintenance services.Risk reduction for the lessee.
Project lifeResidual valueOperating risk
Portfolio risk reduction enables lessor to better bear these risks.
Numerical analyses often indicate that owning is less costly than leasing. Why, then, is leasing so popular?
171
Copyright © 2002 by Harcourt, Inc. All rights reserved.
CHAPTER 22Current Asset Management
Alternative working capital policies
Cash managementInventory managementAccounts receivable management
172
Copyright © 2002 by Harcourt, Inc. All rights reserved.
Basic Definitions
Gross working capital:
Total current assets.Net working capital:
Current assets - Current liabilities.Working capital policy:
The level of each current asset.How current assets are financed.
(More…)

173
Copyright © 2002 by Harcourt, Inc. All rights reserved.
Working capital management: Includes both establishing working
capital policy and then the day-to-day control of:CashInventoriesReceivablesShort-term liabilities
174
Copyright © 2002 by Harcourt, Inc. All rights reserved.
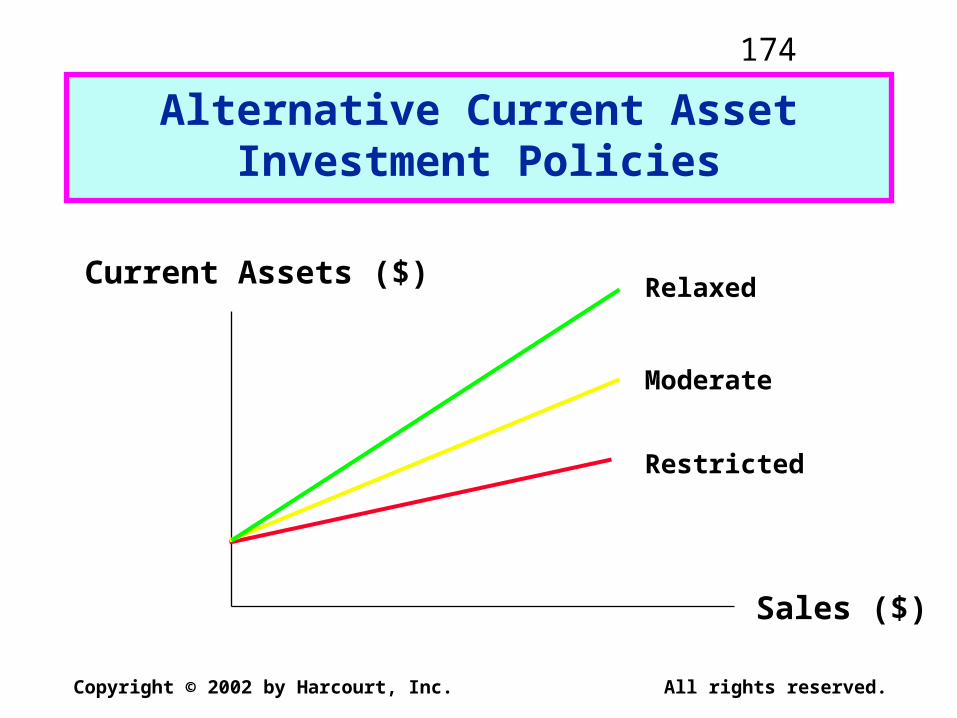
Alternative Current AssetInvestment Policies
Current Assets ($)
Sales ($)
Restricted
Moderate
Relaxed

175
Copyright © 2002 by Harcourt, Inc. All rights reserved.
The cash conversion cycle focuses on the time between payments made for materials and labor and payments received from sales:
Cash Inventory Receivables Payables conversion = conversion + collection - deferral . cycle period period period
Cash Conversion Cycle

176
Copyright © 2002 by Harcourt, Inc. All rights reserved.
Cash Management:Cash doesn’t earn interest,
so why hold it?
Transactions: Must have some cash to pay current bills.
Precaution: “Safety stock.” But lessened by credit line and marketable securities.
Compensating balances: For loans and/or services provided.
Speculation: To take advantage of bargains, to take discounts, and so on. Reduced by credit line, marketable securities.

177
Copyright © 2002 by Harcourt, Inc. All rights reserved.
Ways to Minimize Cash Holdings
Use lockboxes.Insist on wire transfers from
customers.Synchronize inflows and outflows.Use a remote disbursement
account.
(More…)
178
Copyright © 2002 by Harcourt, Inc. All rights reserved.
Increase forecast accuracy to reduce the need for a cash “safety stock.”
Hold marketable securities instead of a cash “safety stock.”
Negotiate a line of credit (also reduces need for a “safety stock”).

179
Copyright © 2002 by Harcourt, Inc. All rights reserved.
Inventory Management:Categories of Inventory Costs
Carrying Costs: Storage and handling costs, insurance, property taxes, depreciation, and obsolescence.
Ordering Costs: Cost of placing orders, shipping, and handling costs.
Costs of Running Short: Loss of sales, loss of customer goodwill, and the disruption of production schedules.

180
Copyright © 2002 by Harcourt, Inc. All rights reserved.
Effect of Inventory Size on Costs
Reducing the average amount of inventory held generally:
Reduces carrying costs.
Increases ordering costs.
Increases probability of a stockout.
181
Copyright © 2002 by Harcourt, Inc. All rights reserved.
Cash Discounts: Lowers price. Attracts new customers and reduces DSO.
Credit Period: How long to pay? Shorter period reduces DSO and average A/R, but it may discourage sales.
Elements of Credit Policy
(More…)
182
Copyright © 2002 by Harcourt, Inc. All rights reserved.
Credit Standards: Tighter standards reduce bad debt losses, but may reduce sales. Fewer bad debts reduces DSO.
Collection Policy: Tougher policy will reduce DSO, but may damage customer relationships.