00051: numerical prediction of erosion-corrosion … · numerical prediction of erosion-corrosion...
TRANSCRIPT
NUMERICAL PREDICTION OF EROSION-CORROSION IN BENDS
Anthony Keating and Srdjan Ne~i~ Department of Mechanical Engineering,
The University of Queensland Brisbane, Queensland, Australia, 4072
ABSTRACT
A combination of computational fluid dynamics (CFD) and Lagrangian particle tracking has been used to pre- dict two-phase erosion-corrosion in a three-dimensional square-sectioned U-bend. A commercial CFD code has been used to predict fluid flow fields using the k-e turbulence model. These predictions have been verified against ex- perimental results. Mass transfer controlled oxygen corrosion was calculated using species concentration fields. The Lam-Bremhorst low Reynolds number modification was used in near-wall regions to accurately resolve the diffusional controlled sublayer. A Lagrangian particle tracking algorithm coupled with the eddy interaction model has been de- veloped and verified for turbulent particle dispersion. Erosion has been predicted from wall impact data through the use of an empirical erosion model. Erosion rates for sand particles are presented. The effect of Reynolds number and bend orientation on erosion rates was investigated. Finally predictions of two-phase erosion-corrosion are presented.
INTRODUCTION
Erosion-corrosion, defined here as the accelerated metal loss due to the combination of: rapid corrosion following the removal of protective films and base metal erosion by solid particles, has been investigated for two-phase flow through bends using numerical techniques. Two-phase flow through bends is commonplace in industry and the erosion-corrosion caused by the disturbance in the flow is a known cause of equipment failure. Numerical tools, such as computational fluid dynamics (CFD) and particle tracking methods, provide researchers with an additional tool to investigate erosion-corrosion. The combination of Eulerian CFD modeling (of the fluid or continuous phase) and Lagrangian particle tracking (of the solid or particulate phase) is a common and effective method of dealing with particulate two-phase flow. This technique is especially effective when dealing with low volumes of particles.
Single-phase flow through bends has been investigated by a number of researchers, both experimentally and numerically. Chang et. al. 1 reported both experimental and numerical results for flow through a square-sectioned U-bend, and it is their work which will be used for comparison in the present paper. Only a very limited amount of experimental research has been carried out on mass transfer or corrosion in single-phase flow through bends in the past 2;3. As far as numerical studies of single-phase mass transfer or corrosion in bends, the only research currently available is that by Bergstrom et. al. 4 for mass transfer in a two-dimensional 90" bend. Bergstrom et. al. 4 used the same method for mass transfer prediction as outlined in the present work.
As would be expected, even less research has been undertaken for two-phase flow through bends. The authors were unable to find any experimental results with which to verify the current numerical predictions. Some numerical
Copyright O20oo by NACE International.Requests for permission to publish this manuscript in any form, in part or in whole must be in writing to NACE International, Conferences Division, RO. Box 218340, Houston, Texas 77218-8340. The material presented and the views expressed in this paper are solely those of the author(s) and are not necessarily endorsed by the Association. Printed in U.S.A.
work has been carried out for two-phase flow in bends, however only for a two-dimensional case. Wang et. al. 5 coupled Eulerian CFD with Lagrangian particle tracking to predict erosion rates in 90" bends. However the Lagrangian particle tracking method used failed to account for the effect of turbulence on particle motion (which was found in this s tudy to have a large effect on particle motion).
In order to perform verification of the models presented here, single and two-phase flow through a sudden axi- symmetric expansion was simulated. The sudden axi-symmetric expansion is an excellent geometry for verification as it contains a number of features which have strong effects on both corrosion (mass transfer) and erosion rates. Additionally, extensive experimental results and numerical predictions are available.
THEORY
Fluid flow modeling
Computat ional fluid dynamics (CFD) involves the solution of the Navier-Stokes and continuity equations 6. These equations are highly non-linear and do not have an anlytical solution except in some very simple cases. Full numerical solution (using a technique known as direct numerical simulation) requires fine grids and small t ime steps to resolve all scales of turbulence. As this requires large amounts of computational time and memory, researchers have in the past used the Reynolds Averaged Navier-Stokes (RANS) equations 6.
The turbulent flux term in the RANS equations still needs approximations. In the present work this is achieved using an isotropic eddy-viscosity assumption coupled with the s tandard two-equation k-e model of turbulence 6.
Near-wall turbulence modeling. In corrosion the behaviour of the flow in the near-wall region is of particular interest. Two methods of dealing with solid surfaces are commonly used along with the two-equation k-e turbulence model: wall functions and low Reynolds number modifications. Wall functions are empirically determined functions which bridge the viscous sublayer from the turbulent region to the wall. While being economical (fine near wall grids are not required), they are of little use in mass transfer studies at high Schmidt numbers typical for aqueous corrosion systems. The reason for this is tha t when calculating mass transfer rates it is necessary to fully-resolve the diffusional controlled mass transfer sublayer, which (at high Schmidt numbers) is embedded deep within the viscous sublayer. Therefore, a low Reynolds number modification of the k-e turbulence model has been used in the past so that this mass transfer sublayer can be resolved using fine near wall grids 7. In this work the Lam-Bremhorst s low Reynolds number modification was employed which uses damping functions to modify the turbulence parameters as the wall is approached.
Mass transfer modeling
In order to calculate mass transfer through the domain of interest, it is necessary to solve the equation for conservation of a species. As with the Navier-Stokes and continuity equations, the equation for conservation of a species can be Reynolds averaged. This equation includes a single term containing fluctuation components which is modeled in analogy to momentum 7.
Corrosion modeling
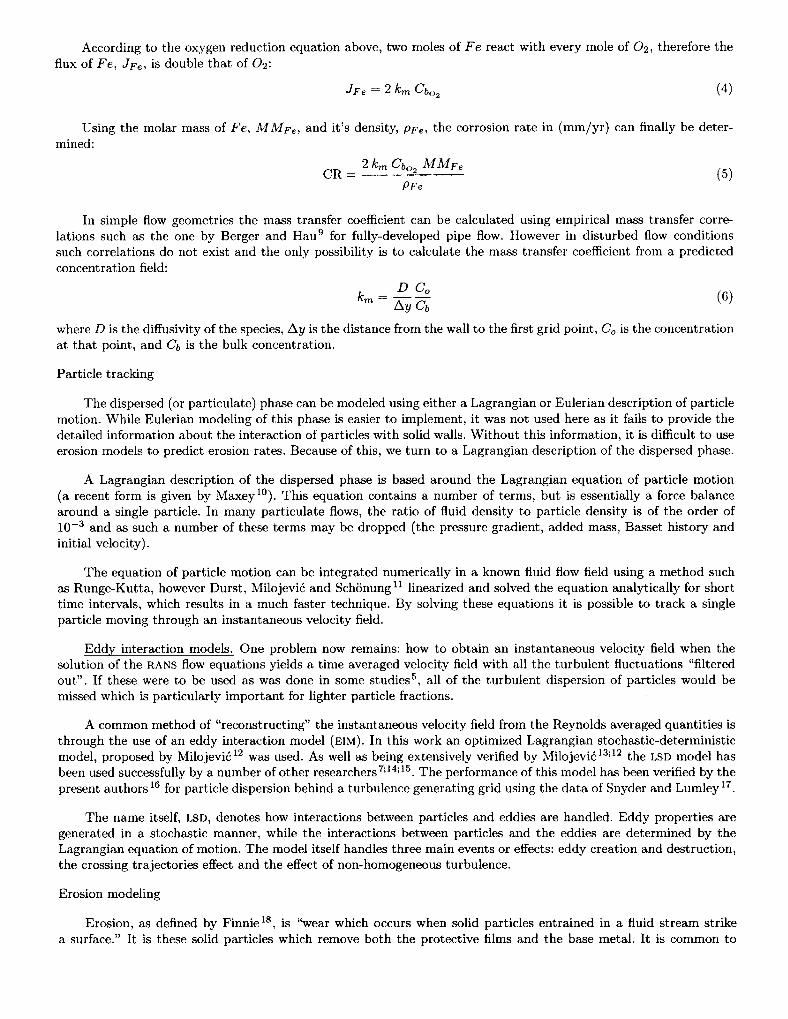
The equations presented in the previous sections, when solved, yield velocity, pressure and concentration fields for a particular species throughout the domain. In many cases, corrosion in under diffusional control tha t is the corrosion rate is determined from the rate of mass transfer of a particular species from the bulk of the solution to the corrosion site. A common example of diffusional controlled corrosion is oxygen corrosion:
2Fe ~ 2Fe ++ + 4e- (1)
02 + 2H20 + 4e- ~ 4 O H - (2)
If the wall mass transfer coefficient, kin, is known, the flux of corrosive species (e.g. O2) can be determined using:
Jo~ : km(Cbo2 - Cwo2) (3)
where Cbo2 is the bulk concentration of 02 and Cwo2 is the concentration of 02 at the wall (equal to zero).
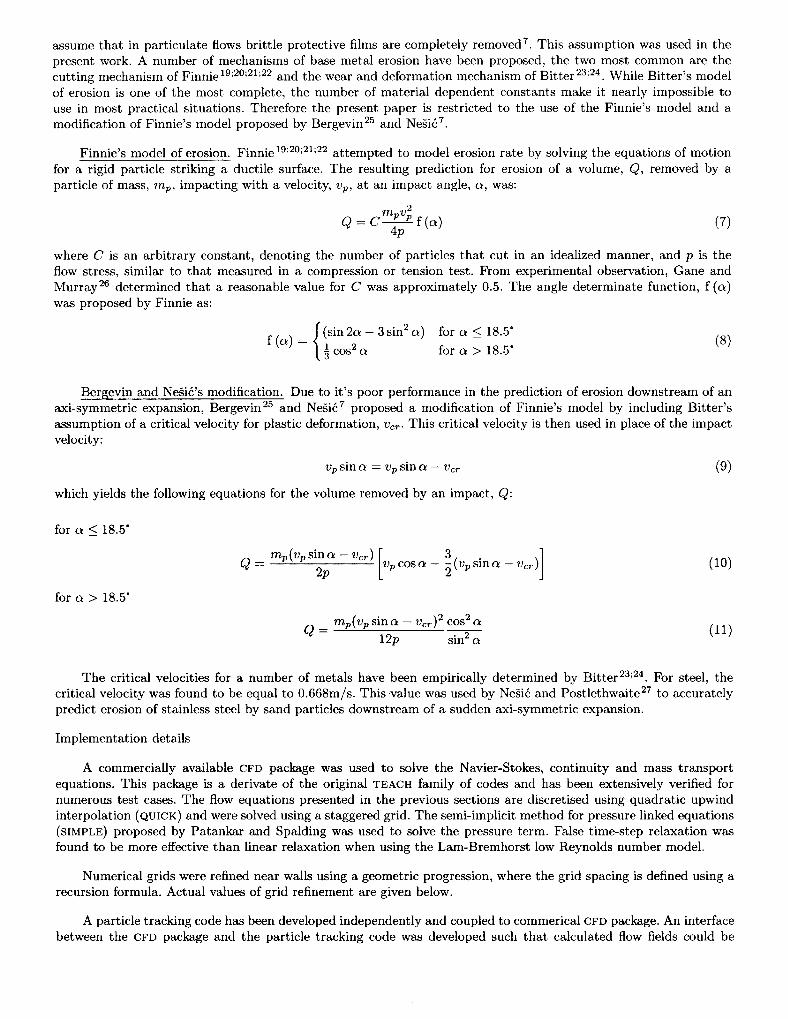
According to the oxygen reduction equation above, two moles of Fe react with every mole of O2, therefore the flux of Fe, JF¢, is double that of O2:
JF~ = 2 km Cb()~ (4)
Using the molar mass of Fe, MMFe, and it's density, PFe, the corrosion rate in (mm/yr ) can finally be deter- mined:
2 km Cbo2 Ml~l"Fe c a = (5)
PFe
In simple flow geometries the mass transfer coefficient can be calculated using empirical mass transfer corre- lations such as the one by Berger and Hau 9 for fully-developed pipe flow. However in disturbed flow conditions such correlations do not exist and the only possibility is to calculate the mass transfer coefficient from a predicted concentration field:
DCo km - (6)
Ay Cb
where D is the diffusivity of the species, Ay is the distance from the wall to the first grid point, Co is the concentration at that point, and Cb is the bulk concentration.
Particle tracking
The dispersed (or particulate) phase can be modeled using either a Lagrangian or Eulerian description of particle motion. While Eulerian modeling of this phase is easier to implement, it was not used here as it fails to provide the detailed information about the interaction of particles with solid walls. Without this information, it is difficult to use erosion models to predict erosion rates. Because of this, we turn to a Lagrangian description of the dispersed phase.
A Lagrangian description of the dispersed phase is based around the Lagrangian equation of particle motion (a recent form is given by Mmxeyl°). This equation contains a number of terms, but is essentially a force balance around a single particle. In many particulate flows, the ratio of fluid density to particle density is of the order of 10 -3 and as such a number of these terms may be dropped (the pressure gradient, added mass, Basset history and initial velocity).
The equation of particle motion can be integrated numerically in a known fluid flow field using a method such as Runge-Kutta, however Durst, Milojevi6 and SchSnung 11 linearized and solved the equation analytically for short t ime intervals, which results in a much faster technique. By solving these equations it is possible to track a single particle moving through an instantaneous velocity field.
Eddy interaction models. One problem now remains: how to obtain an instantaneous velocity field when the solution of the RANS flOW equations yields a t ime averaged velocity field with all the turbulent fluctuations "filtered out". If these were to be used as was done in some studies 5, all of the turbulent dispersion of particles would be missed which is particularly important for lighter particle fractions.
A common method of "reconstructing" the instantaneous velocity field from the Reynolds averaged quantities is through the use of an eddy interaction model (EIM). In this work an optimized Lagrangian stochastic-deterministic model, proposed by Milojevid 12 was used. As well as being extensively verified by Milojevi513;12 the LSD model has been used successfully by a number of other researchers 7;14;15. The performance of this model has been verified by the present authors 16 for particle dispersion behind a turbulence generating grid using the data of Snyder and Lumley 17
The name itself, LSD, denotes how interactions between particles and eddies are handled. Eddy properties are generated in a stochastic manner, while the interactions between particles and the eddies are determined by the Lagrangian equation of motion. The model itself handles three main events or effects: eddy creation and destruction, the crossing trajectories effect and the effect of non-homogeneous turbulence.
Erosion modeling
Erosion, as defined by Finnie is, is "wear which occurs when solid particles entrained in a fluid stream strike a surface." It is these solid particles which remove both the protective films and the base metal. It is common to
assume that in particulate flows brittle protective films are completely removed 7. This assumption was used in the present work. A number of mechanisms of base metal erosion have been proposed, the two most common are the cutting mechanism of Finnie 19;20;21;22 and the wear and deformation mechanism of Bitter 23;24. While Bit ter 's model of erosion is one of the most complete, the number of material dependent constants make it nearly impossible to use in most practical situations. Therefore the present paper is restricted to the use of the Finnie's model and a modification of Finnie's model proposed by Bergevin 25 and Ne~iC.
Finnie's model of erosion. Finnie 19;20;21;22 a t tempted to model erosion rate by solving the equations of motion for a rigid particle striking a ductile surface. The resulting prediction for erosion of a volume, Q, removed by a particle of mass, rap, impacting with a velocity, Vp, at an impact angle, a, was:
mp Vp 2 Q = C - ~ p - f (a) (7)
where C is an arbi t rary constant, denoting the number of particles tha t cut in an idealized manner, and p is the flow stress, similar to tha t measured in a compression or tension test. From experimental observation, Gane and Murray 26 determined that a reasonable value for C was approximately 0.5. The angle determinate function, f (a) was proposed by Finnie as:
( s i n 2 a - 3sin 2a ) for a _< 18.5" f ( a ) = ½cos 2 a f o r a >18.5" (8)
Bergevin and Ne~i6's modification. Due to it's poor performance in the prediction of erosion downstream of an axi-symmetric expansion, Bergevin 25 and Ne~i6 7 proposed a modification of Finnie's model by including Bitter 's assumption of a critical velocity for plastic deformation, Vcr. This critical velocity is then used in place of the impact velocity:
Vp sin a = Vp sin a - Vcr ( 9 )
which yields the following equations for the volume removed by an impact, Q:
for a _< 18.5"
for a > 18.5"
Q = m p ( v p s i n a - Vcr) [ 3 2p Vp COS a -- ~ (Vp sin
Q = mp(Vp s ina - vcr) 2 cos 2 a
12p sin 2 a
- vcr) l (i0)
(II)
The critical velocities for a number of metals have been empirically determined by Bit ter 23;24. For steel, the critical velocity was found to be equal to 0.668m/s. This value was used by Ne~i6 and Postlethwaite 27 to accurately predict erosion of stainless steel by sand particles downstream of a sudden axi-symmetric expansion.
Implementation details
A commercially available CFD package was used to solve the Navier-Stokes, continuity and mass t ransport equations. This package is a derivate of the original TEACH family of codes and has been extensively verified for numerous test cases. The flow equations presented in the previous sections are discretised using quadratic upwind interpolation (QUICK) and were solved using a staggered grid. The semi-implicit method for pressure linked equations (SIMPLE) proposed by Patankar and Spalding was used to solve the pressure term. False time-step relaxation was found to be more effective than linear relaxation when using the Lam-Bremhorst low Reynolds number model.
Numerical grids were refined near walls using a geometric progression, where the grid spacing is defined using a recursion formula. Actual values of grid refinement are given below.
A particle tracking code has been developed independently and coupled to commerical CFD package. An interface between the CFD package and the particle tracking code was developed such that calculated flow fields could be

easily imported into the particle tracking code. This method allows the use of the developed particle tracking code in conjunction with any other CFD package. Finnie's erosion model, as well as Bergevin and Nell5 modification to Finnie's erosion model were implimented in the particle tracking code. A number of stochastic averaging techniques were used to calculate average particle statistics and erosion rates.
VERIFICATION OF TH E MODEL
As stated in the introduction, little experimental data exists for two-phase erosion-corrosion in bends. Therefore, verification of the numerical models used in the present s tudy had to be done for two-phase flow through a sudden axi-symmetric expansion, where extensive experimental da ta and numerical predictions are available Details of the verification are presented elsewhere 16 and here only the main conclusions will be presented.
Hydrodynamics
Predictions for single phase flow were compared to the experimental results of Blatt et. al. 2s. The results of Blat t et. al. 2s were choosen as parallel results exist for particle statistics. The hydrodynamic predictions revealed a number of shortcomings, especially in the prediction of flow near the re-at tachment point. However in the actual test case which were the main focus of the present s tudy (the three-dimensional bend), no seperation and re-at tachment is expected, so these problems were not a huge concern.
Mass transfer
Predictions of mass transfer in an axi-symmetric sudden expansion were compared to the experimental results of Sydberger and Lotz 29 at a Schmidt number of 1460 (corresponding to a ferro/ferricyanide solution) and an inlet Reynolds number of 2.1 x 10⁴. The predictions were also compared to the Berger and Hau correlation 9 for fully- developed turbulent flow in a straight pipe.
In summary, relatively poor agreement between predictions and experimental results was shown in the verification of mass transfer predictions using the Lam-Bremhorst near wall model. Other near wall turbulence models have shown to be more effective than the Lam-Bremhorst model in predicting mass transfer, however are unavailable in most commerical CFD packages. The most significant problem encountered in the predictions was an abrupt peak in mass transfer coefficient near the re-attachment point which is not seen in the experiments. For the same conditions, the predictions of Ne~i6 et. al. 3° do not show such a peak, while the predictions of Herrero et. al. 31 clearly do. The cause of this problem was found to be linked to the large values of turbulent kinetic energy at this point. Problematic implementation of the Lam-Bremhorst low Reynolds number model in the CFD package is suspected to be the cause. Again, since no separation and reat tachment is expected in bends, the resolution of this problem was postponed.
Particle tracking
Blatt et. al. 28 presented detailed particle statistics for solid glass particles (spheres) travelling through a sudden expansion. The particles had a diameter of 0.8mm with a particle loading of 0.1%. Comparisons between predictions and measurements of mean particle axial velocity at the centerline and the near-wall region showed good overall agreement. On the other hand mean particle radial velocity near the wall showed poor agreement. Milojevi~ 13, and Ne~i5 and Postlewaite 27 reported similar problems in the near wall region. They suggested that particles interfere with the shape of the wall functions applied in this region. Overall, the agreement between the predictions and experimental results is satisfactory.
Erosion
Erosion measurements of stainless steel (yield strength, S u = 276 MPa) for flow of a 2% sand slurry through a sudden axi-symmetric expansion have been reported by Lotz and Postlethwaite 32, and Postlethwaite and Ne~i5 a3. Results at an inlet Reynolds number of 3.4 × 10⁵ were reported. Predictions obtained using Finnie's erosion model were found to be clearly an order of magnitude larger than experimental results. As well, the predicted shape of the erosion curve did not match that of the experimental results. The asumption that every particle impact causes erosion is believed to be the cause of this discrepency, and it was these results tha t led Ne~i6 to propose his modification to Finnie's model based on Bergevin's ideas.
A much bet ter agreement with the experimental results was obtained using Bergevin and Nesic's modification. The magnitude and peak of the erosion curve was predicted with some accuracy. However the model failed to

prediction erosion near the re-at tachment point due to the underlying Finnie erosion model's failure to predict erosion at high impact angles.
Generally, the erosion models exhibited a number of problems in the prediction of erosion in the sudden axi- symmetric expansion. Bergevin and Ne~i~'s modification of Finnie's original erosion model improved the situation somewhat, however the prediction of erosion at high impact angles near the re-at tachment point is still an issue.
RESULTS
Hydrodynamics
A detailed experimental s tudy of turbulent flow through a three-dimensional square-sectioned U-bend has been reported by Chang et. al. 1. Using their experimental results allowed us to verify the accuracy of the CFD modeling of the fluid flow. Figure 1 shows the layout of the geometry, including definitions of the inner, outer and side walls used in the following discussion. Overall, six computational grids were used to verify grid indepence, however only three are shown here. Table 1 presents a summary of the numerical and experimental parameters used in this section. Wall functions were used initially in order to save computational effort. The mass transfer predictions using the LRN model are shown in the next section.
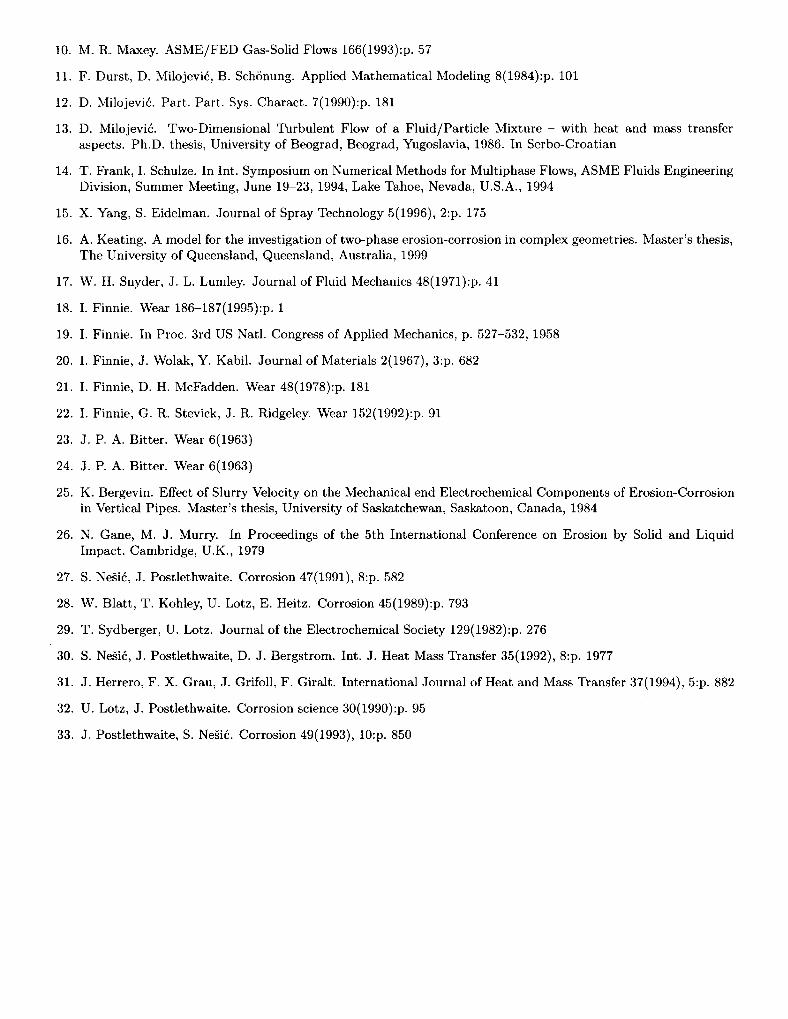
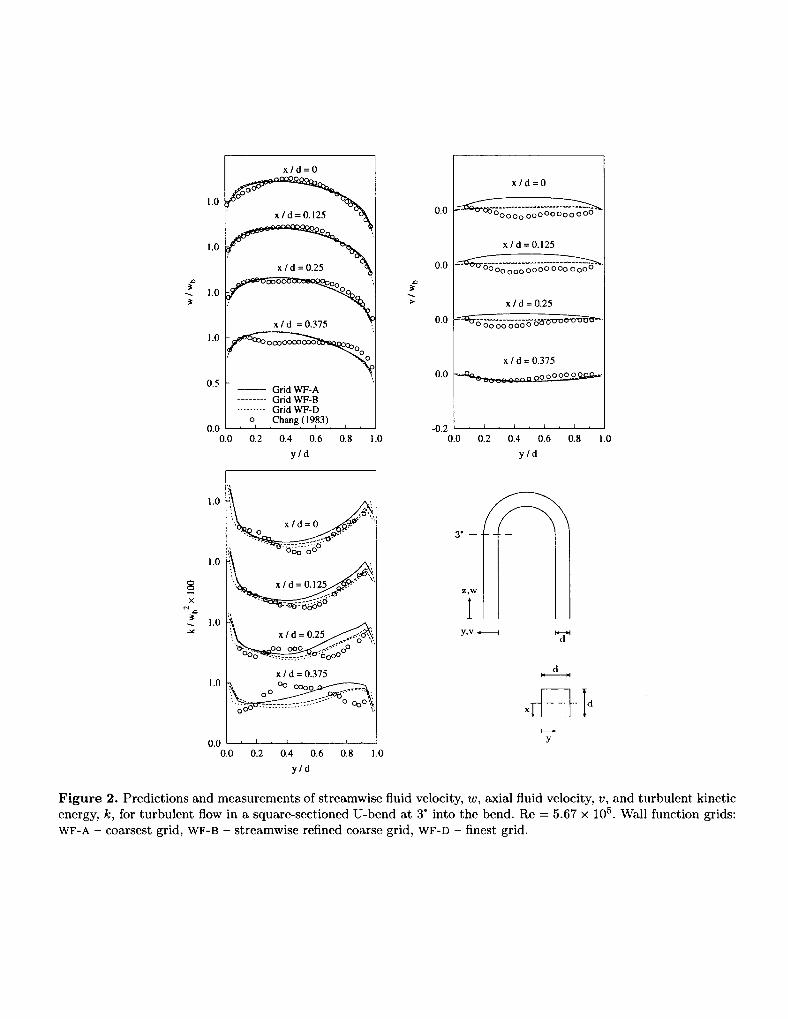
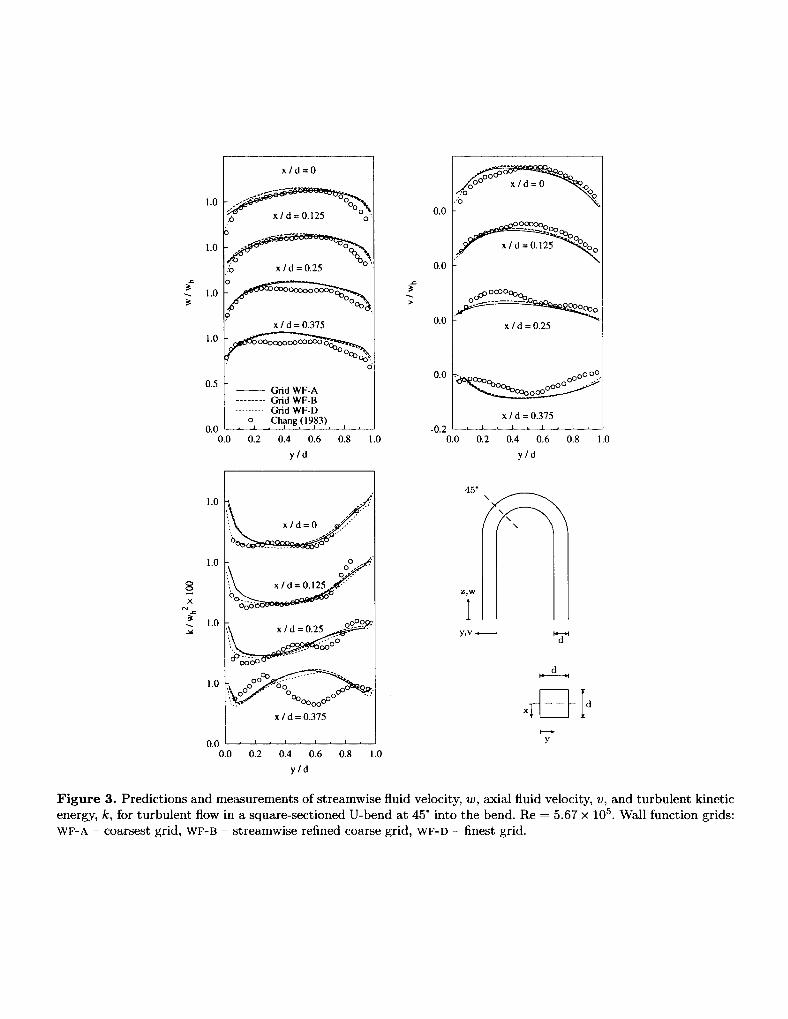
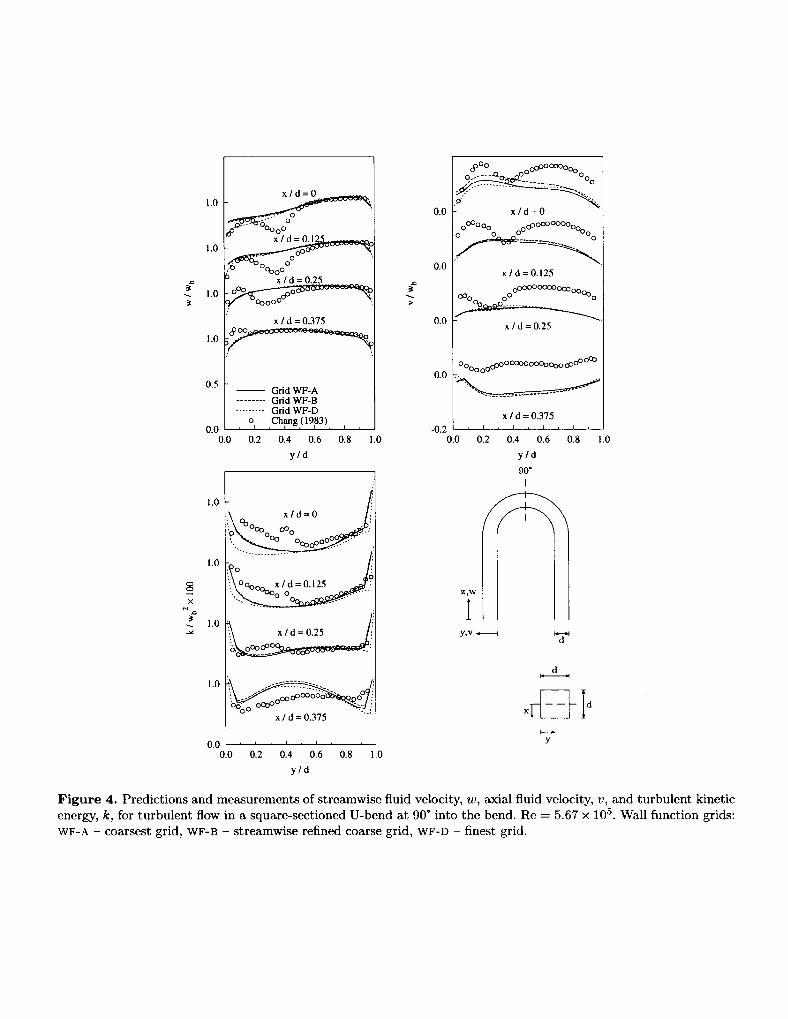
Figures 2, 3 and 4 show predictions and measurements of streamwise (w) and radial (v) fluid velocity and turbulent kinetic energy (k) for three measuring planes in the bend, 3", 45" and 90". Comparisons at 177" are available elsewhere 16.
At the measuring plane 3" in the bend, observed discrepencies can be directly a t t r ibuted to the failure of the isotropic k-e turbulence model in the prediction of secondary velocity driven by the cross-sectional shape of the duct. Similar results were obtained by the authors in the prediction of flow through a straight duct 16. Predictions of turbulent kinetic energy at this plane are good, especially in the near wall region. As the flow moves through the bend, experimental evidence shows the peak in streamwise velocity moving towards the outer wall (due to secondary velocity relaxing the pressure on the outer wall). It was here that predictions by the authors using a two-dimensional model 16 failed, however the three-dimensional predictions presented here accurately predict this movement.
Good general agreement with experimental results is seen throughout the bend, except for the local minimum of streamwise velocity and the magnitude of radial velocity at 90". This local minimum was identified experimentally by Chang et. al. 1 as being caused by the "pumping of low speed fluid from the peripheral region of the duct into the core of the flow." The magnitude of radial velocity in the predictions is only approximately 70% of the measurements, it is suggested that this is due to the flow re-developing in the bend, with secondary motion being caused by the cross-sectional shape of the duct (which we cannot predict using an isotropic turbulence model).
Figure 5 shows vector plots of secondary velocity at various measuring planes through the bend. These plots indicate the initial formation of two counter rotating vortices at the inlet plane of the bend. These vortices are driven by the pressure difference between the inner and outer walls. At the bend entrance, the two vortices fully occupy their respective haffs of the cross-sectional plane. As the flow moves through the bend, these vortices shrink towards the side walls. At the exit to the bend, each vortex has been stretched and there may be up to four vortices in the duct. It is believed that these vortices (in the predictions) have been predicted due to the curvature of the bend, not the cross-sectional shape.
In summary, the predictions for the three-dimensional square-sectioned U-bend are reasonable accurate, espe- cially near the plane of symmetry. A number of failings have been identified, the main one being the failure of the isotropic eddy viscosity to predict secondary motion due to the cross-sectional shape of the duct.
Mass transfer and corrosion
Predictions of mass transfer in a three-dimensional square-sectioned U-bend at a Reynolds number, Re = 5.67 x 10⁴ are presented here. Schmidt number was varied from Sc = 1460 (corresponding to a ferro/ferricyanide solution) to Sc = 520 (oxygen). The Lam-Bremhorst low Reynolds number modication was used to allow for integration through the viscous sublayer to resolve the embedded diffusional controlled sublayer. Table 2 summarizes the experimental and numerical parameters used in this section.
Figure 6 presents profiles of predictions (no experimental da ta was available) of Sherwood number along the
outer, inner and side walls at five measuring planes in the bend. Two main features are evident: a peak in mass transfer at the corner of the inner and side walls, and a drop in mass t ransfer at the corner of the outer and side walls. The peak is caused by a local peak in turbulent kinetic energy in the near wall region, due to the turning of the fluid (in the vortices) by secondary motion. The drop in Sherwood number (at the corner of the outer and side walls) is again caused by secondary motion, this t ime the vortices move fluid away from the outer wall towards the inner wall. This results in low values of turbulent kinetic energy in this region.
A peak can also be seen (especially evident in the higher Schmidt number case) at the outer and side walls in the first half of the bend. The reason for this is unknown, however it is speculated tha t this may be a region of seperation and re-a t tachment at the corner of the vortex.
Corrosion rates for oxygen corrosion have been calculated and are sumarized in Table 3. The predicted corrosion rates predicted by the three-dimensional bend in the bend itself are much larger than those predicted previously using the two-dimensional bend 16. This is due to the secondary motion causing peaks in mass transfer at the corners of the duct. The magnitude of these predictions is questionable due to the failure of the mass transfer verification presented earlier, however the percentage increase (up to 175%) is probably correct.
Particle tracking and erosion
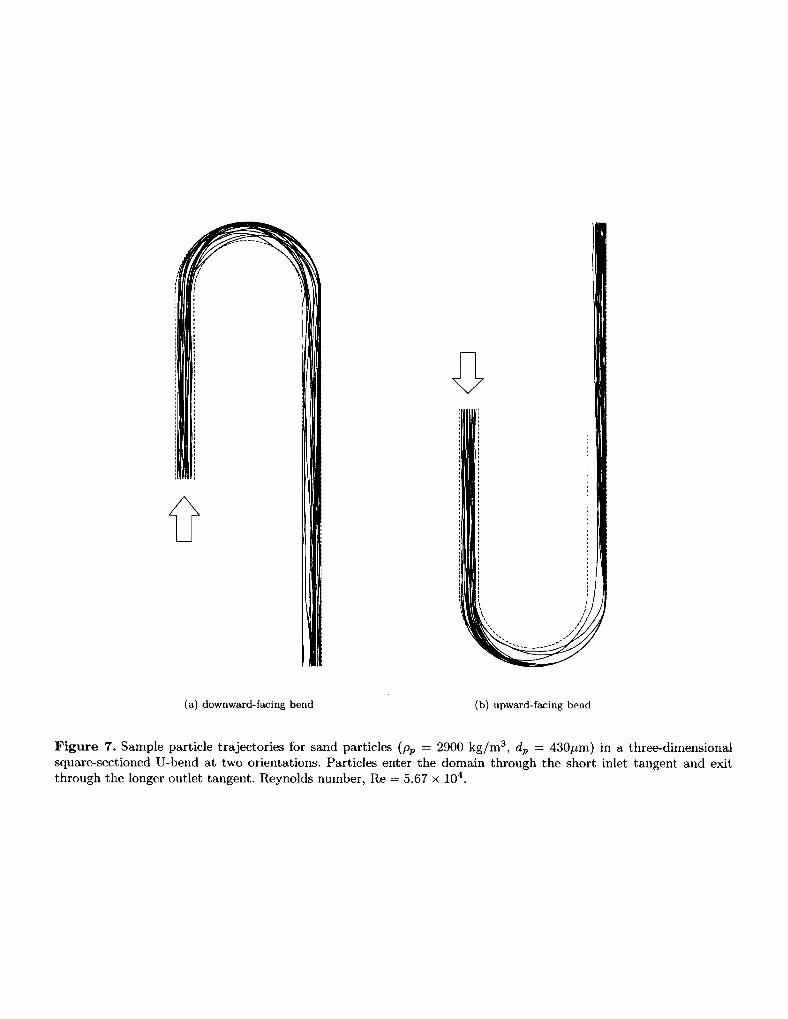
Sinmlations of two-phase flow of sand particles (pp = 2700 k g / m 3, dp = 430#m) in upward and downward-facing three-dimensional square-sectioned U-bends have been carried out. The Reynolds number was fixed at Re = 5.67 × 10⁴, with a base metal of 304A stainless steel (Sy = 276 MPa) and a particle loading of 2%. Sample particle trajectories for both bend orientations are shown in Figure 7. Two lines of s tar t ing locations were used at different depths in the duct (x/D = 0.2 and x /D = 0.4). Ten star t ing locations located along each of these lines with one t ra jectory sample from each shown. Bend orientation is shown to have a large influence on particle motion in the bend. Particle motion in a three-dimensional bend is extremely complex, and amounts to a balance of three main forces: i) gravity, ii) particle interia and iii) fluid's velocity - pr imary (streamwise) and secondary (cross-sectional). A detailed explanation of particle motion is given by Keating 16
Average erosion rates have been obtained through the stochastic averaging of 16000 particle trajectories, released from an rectangular array in the inlet of the bend. Bergevin and Ne~i6's modification to Finnie 's erosion model failed to predict any erosion. This was due to low particle impact angles resulting in values of perpendicular velocity less than the critical value. All erosion rates presented in this section were calculated using Finnie 's original model. Figure 8 shows predictions of erosion rate at five measuring planes in the bend (similar to the profiles shown for mass transfer in the previous section) for an upward-facing bend. Figure 9 shows the same profiles for a downward-facing bend. Note the much greater erosion rates for the upwards-facing bend.
For a downward-facing bend, erosion occurs at the corner of the outer and side walls, and at the corner of the inner and side walls. The max imum erosion rate is predicted to occur at the exit of the bend at the corner of the outer and side walls. The erosion on the outer wall is caused by the motion of particles towards this wall due to their inertia and the fluids secondary motion. Particles which enter the bend near the side walls are moved towards the inner wall (and cause erosion) due to gravity and secondary motion in the lower half of the duct.
In a upward-facing bend, gravity now acts concurrently with particle inertia, and no erosion occurs on the inner wall. The peak in erosion rate is also moved from the exit of the bend to the second half of the bend. Due to particles moving towards the outer wall faster, the erosion is more pronounced in the corner of the outer and side walls than was found of the downward-facing bend.
Predictions of peak erosion rate and the position of the peak are given in Table 4. Due to the limitations of CPU t ime and memory, the effect of Reynolds number on erosion rate has not been investigated.
Erosion-corrosion
Predictions of erosion-corrosion at peak values of erosion and corrosion are given in Tables 5 and 6. Erosion- corrosion rates at a single Reynolds number, Re = 5.67 x 10⁴ are shown. Peak values of erosion-corrosion were found to occur in the corner of outer and side walls of the duct at 131" (upward-facing) or 180" (downward-facing). The dominate mechanism was found to be erosion, especially on the outer and side walls of the duct. At points of max imum corrosion, the contribution of corrosion to the overall erosion-corrosion rate was much greater, however the magni tude of erosion-corrosion in these areas is much smaller than tha t in areas of max imum erosion.

CONCLUSIONS
A combination of Eulerian computational fluid dynamics (CFD) coupled with a Lagrangian particle tracking method have been used to predict erosion-corrosion in a three-dimensional square-sectioned U-bend.The model pre- sented has been verified against experimental da ta for flow through a sudden axi-symmetric expansion. Comparisons of predicted hydrodynamic flow fields against experimental da ta for the expansion yield good results, discrepencies in the re-at tachment length and region upstream of the re-at tachment were identified to be known failures of the CFD models. Mass transfer predictions for the expansion were inaccurate in the re-attachment region, the reason thought to be a problem with the implementation of the Lam-Bremhorst low Reynolds number model.
The predictions obtained using the Lagrangian particle tracking model compared well with experiment, the discrepencies here were identified as failure in the accurate prediction of the underlying flow field. Erosion rates in the sudden expansion were predicted using Finnie's erosion model and Bergevin and Ne~i6's modification of Finnie's model. Bergevin and Ne~i~'s modification was found to yield much improved results. A problem was identified where the underlying Finnie model failed to predict erosion at high angles of impact.
Hydrodynamic modeling of flow in a three-dimensional square-sectioned U-bend has been performed. Comparison against experimental data showed some discrepencies, however overall agreement was good. Secondary velocities due to the curvature of the bend were predicted, however secondary velocities due to the cross-sectional shape of the duct were not (due to the isotropic turbulence model). Predictions of mass transfer in the three-dimensional bend have been presented, with peaks in mass transfer found to occur at the corner of the inner and side walls (caused by the secondary velocities). Corrosion rates were calculated using these predictions, the maximum corrosion rate was found to occur on the inner wall in the first half of the bend.
The particle tracking method and Finnie's erosion model has been used to predict erosion in the three-dimensional bend. Bend orientation was found to have a significant effect on erosion rates. Maximum erosion rates occur in the corner of the outer and side walls of the bend for both orientations. For a downward-facing bend, this occured at the exit plane, for an upward-facing bend at 131". Erosion rates on the inner wall were very low (downward-facing bend) or non-existant (upward-facing bend). Bergevin and Ne~i5's erosion model predicted no erosion due to low normal impact velocities.
Erosion-corrosion predictions for the three-dimensional bend have been presented. It was found tha t in all cases, erosion-corrosion was dominated by erosion.
The majori ty of the work presented here was not backed up by experimental data. It is essential tha t before further numerical work is carried out in this area that a number of experiments be carried out which provide detailed information on mass transfer, corrosion and erosion in similar geometries.
REFERENCES
1. S. M. Chang, J. A. C. Humphrey, A. Modavi. PhysicoChemical Hydrodynamics 4(1983), 3:p. 243
2. B. Poulson, R. Robinson. International Journal of Heat and Mass Transfer 31(1988), 6:p. 1289
3. P. J. Sprague, M. A. Patrick, A. A. Wragg, M. W. E. Coney. In Proceedings of the 8th European Corrosion Congress, volume 1. Nice, France, 1985
4. D. J. Bergstrom, T. Bender, G. Adamopoulos, J. Postlethwaite. The Canadian Journal of Chemical Engineering 76(1998):p. 728
5. J. Wang, S. A. Shirazi, J. R. Shadley, E. F. Rybicki. In FED-Vol. 236, 1996 Fluids Engineering Division Conference, volume 1, p. 725-734, 1996
6. J. H. Ferziger, M. Peri6. Computat ional Methods for Fluid Dynamics. Springer-Verlag, Berlin, 1997
7. S. Ne~id. Computat ion of Localized Erosion-Corrosion in Disturbed Two-Phase Flow. Ph.D. thesis, University of Saskatchewan, Saskatoon, Canada, 1991
8. C. K. G. Lam, K. Bremhorst. ASME Journal of Fluids Engineering 103(1981):p. 456
9. F. P. Berger, K.-F. F.-L. Hau. International Journal of Heat and Mass Transfer 20(1977):p. 1185
10. M. R. Maxey. ASME/FED Gas-Solid Flows 166(1993):p. 57
11. F. Durst, D. Milojevid, B. Sch6nung. Applied Mathematical Modeling 8(1984):p. 101
12. D. Milojevid. Part. Part. Sys. Charact. 7(1990):p. 181
13. D. Milojevid. Two-Dimensional Turbulent Flow of a Fluid/Particle Mixture - with heat and mass transfer aspects. Ph.D. thesis, University of Beograd, Beograd, Yugoslavia, 1986. In Serbo-Croatian
14. T. Frank, I. Schulze. In Int. Symposium on Numerical Methods for Multiphase Flows, ASME Fluids Engineering Division, Summer Meeting, June 19-23, 1994, Lake Tahoe, Nevada, U.S.A., 1994
15. X. Yang, S. Eidelman. Journal of Spray Technology 5(1996), 2:p. 175
16. A. Keating. A model for the investigation of two-phase erosion-corrosion in complex geometries. Master's thesis, The University of Queensland, Queensland, Australia, 1999
17. W. H. Snyder, J. L. Lumley. Journal of Fluid Mechanics 48(1971):p. 41
18. I. Finnie. Wear 186-187(1995):p. 1
19. I. Finnie. In Proc. 3rd US Natl. Congress of Applied Mechanics, p. 527-532, 1958
20. I. Finnie, J. Wolak, Y. Kabil. Journal of Materials 2(1967), 3:p. 682
21. I. Finnie, D. H. McFadden. Wear 48(1978):p. 181
22. I. Finnie, G. R. Stevick, J. R. Ridgeley. Wear 152(1992):p. 91
23. J. P. A. Bitter. Wear 6(1963)
24. J. P. A. Bitter. Wear 6(1963)
25. K. Bergevin. Effect of Slurry Velocity on the Mechanical end Electrochemical Components of Erosion-Corrosion in Vertical Pipes. Master's thesis, University of Saskatchewan, Saskatoon, Canada, 1984
26. N. Gane, M. J. Murry. In Proceedings of the 5th International Conference on Erosion by Solid and Liquid Impact. Cambridge, U.K., 1979
27. S. Negid, J. Postlethwaite. Corrosion 47(1991), 8:p. 582
28. W. Blatt, T. Kohley, U. Lotz, E. Heitz. Corrosion 45(1989):p. 793
29. T. Sydberger, U. Lotz. Journal of the Electrochemical Society 129(1982):p. 276
30. S. Negid, J. Postlethwaite, D. J. Bergstrom. Int. J. Heat Mass Transfer 35(1992), 8:p. 1977
31. J. Herrero, F. X. Grau, J. Grifoll, F. Giralt. International Journal of Heat and Mass Transfer 37(1994), 5:p. 882
32. U. Lotz, J. Postlethwaite. Corrosion science 30(1990):p. 95
33. J. Postlethwaite, S. Ne~id. Corrosion 49(1993), 10:p. 850
O = 90"
0 = 180"
I I
I
I
i I I
- i . . . . . I
Outer w a l l
0 = 0 "
d
Inner w a i l
S i d e w a l l s
f Plane of symmetry
Figure 1. Geometric layout of the three-dimensional square-sectioned U-bend, including definitions of inner, outer and side walls.
¢
1.0
1.O
1.0
1.0
0.5
0.0 0.0
x / d = 0
o6~5' o
x /d =0.375
- - Grid WF-A . . . . . . . . Grid WF-B ......... Grid WF-D
o Ch lang (1983) I , , ~ I
0.2 0.4 0.6 0.8 1.0
y / d
0.0
0.0
0.0
0.0
-0.2 0.0
x / d = 0
":t~'° ~'6ooo o oooOOOoo ooO"
x/d=O.125
x/d=0.25
x / d = 0.375 - 0 0 0 0 0 0
I I I L
0.2 0.4 0.6 0.8 1.0
y / d
g X
e,l¢~
1.0
l.O
l.O
l.O
0.0 0.0
L ^ x / d = 0 ~ ;
~ x /d = 0 . 2 ~ - ~ , , , , : a ~ j . . ~ : Y ~ o o - .,
x / d = 0.375
0.2 0.4 0.6 0.8 1.0
y /d
3" - -
z ~ w
I y ,v
d
d
x Id y
F i g u r e 2. Predict ions and measurements of s t reamwise fluid velocity, w, axial fluid velocity, v, and turbulen t kinetic energy, k, for tu rbulen t flow in a square-sect ioned U-bend at 3" into the bend. Re = 5.67 x 10⁵. Wall funct ion grids: WF-A - coarsest grid, WF-B - s t reamwise refined coarse grid, WF-D - finest grid.
¢
1.0
1.0
1.0
1.0
0.5
0.0 0.0
x / d = O
• = . ' o x / d 025
x / d =0.375
- - Grid WF-A . . . . . . . . Grid WF-B ......... Grid WF-D , °l ,Chlang,(19183), L
0.2 0.4 0.6 0.8
y / d
1.0
¢
0.0
0.0
0.0
0.0
-0.2 0.0
ooO oo°°OOo o 0 ~ . . . . . . ~.Q
x / d =0.25
x / d = 0 . 3 7 5 I I I I
0.2 0.4 0.6 0.8 1.0
y / d
×
¢
1.O
1.0
1.0
1.0
0.0 0.0
- ° 1 2 5 j " x / d = 0 .
\ x / d = 0 . 2 5 - ~ "
; , o o o ~ ~ ~ °°
I ° ~ ~°°%oooooo°°~' , I ,x/Id=0"3175, I ,
0.2 0.4 0.6 0.8 1.0
y / d
45"
Z ~ W
i y ~ v t
d
d
y
F i g u r e 3. Predictions and measurements of streamwise fluid velocity, w, axial fluid velocity, v, and turbulent kinetic energy, k, for turbulent flow in a square-sectioned U-bend at 45" into the bend. Re = 5.67 × 10⁵. Wall function grids: WF-A - coarsest grid, WF-B - streamwise refined coarse grid, WF-D - finest grid.
¢
g ×
1.0
1.0
1.0
l.O
0.5
0.0 0.0
1.0
I.O
1.0
x / d = ~ e e e ~ e ~ e ~
~" 0 0 0
× / d =0.25
f ~ 0 0 0 0 0 ~
x / d = 0 . 3 7 5
- - Grid WF-A . . . . . . . . Grid WF-B ......... Grid WF-D
o Chang (1983). ,
0.2 0.4 0.6 0.8
y / d
l.O
t.o~oo x / d = O 00% oO o ^ ~ i
I i ° ~
x / d = 0 . 2 5 _~!
¢
0.0
0.0
0.0
0.0
-0.2 0.0
~Oo oooOOOOOOoo_ o;:==2zo~ ° o
2 x / d = 0
o ° ° ° °o o o ° ° ° ° ° ° ° ° ° o ° 0 0 0 0
x / d = O . 1 2 5
~o o°°°°°°°°°°°°°°°Oo
x 1d=0.25
Ooo ° oooooOOOoOcOOOOoo coo ° ~
i
0.2
/
Z,W
] y , v ,
x / d = 0 . 3 7 5 I I I
0.4 0.6 0.8 1.0
y / d
90 ° I
d
d
1.0 :i ..-" . . . . . . . . . . . . . "--. i ": ::
e x / d = 0 . 3 7 5 "'" x
0.0 ! ' I , I , I , I , I Y
0.0 0.2 0.4 0.6 0.8 1.0
yld F i g u r e 4. Predictions and measurements of streamwise fluid velocity, w, axial fluid velocity, v, and turbulent kinetic energy, k, for turbulent flow in a square-sectioned U-bend at 90 ° into the bend. Re = 5.67 × 10⁵. Wall function grids: WF-A - coarsest grid, WF-B - streamwise refined coarse grid, WF-D - finest grid.

side wall
I r , , , , . . . . . . . - ~ . ~ > ~ , x r t
" ' . . . . . . . . . . . ;;;]III II~'~ ,, . . . . . . . . . . . / / t l J
" . . . . . . . . . . . . . . . ~ / 1 1
~ , , . . . . . . . . . . . . . . > > ) ]
. . . . . . . . . . . . . . . .,~tll ,, . . . . . . . . . . . . . . ;',tit l~,tl, , . . . . . . . ' . . . . . . . . . . . . . . . ~ , ~ t {
45 degrees 90 degrees
. . . . . . . . . . . - x
. . . . . . . . . . . . . . . . . I i i i
• . . . . . . . . . . ~ 1 t { i J , . . . . . . . i t ! . .
i J b r , ,
' ' ' . . . . . . . i . 1. L " L Z. ~ / I
.22 . . . . . . . . . . . . . . . . . . . . . . . . . . . . . . j ~ l . . . . . . . . . . . . . . . . . . , s l
!
:~ ' ,~.~. .L2. Z. 2. 2. ~- 2~ L 2 . 2 . . 2 . ~ , ,
135 degrees 180 degrees
F i g u r e 5. Predictions of secondary motion in a three-dimensional squared-sectioned U-bend at five planes in the bend. Re = 5.67 × 10⁴.

1000
500
1000
500
1000
500
1000
500
1000
500
1000
500
0
0
180 degrees
135 degrees
. ~ . . . . . . . . . . . . . . . . . . . . . . . . . . . . . . . . . . . . . . . . . . .
90 degrees
, t ~ . . . . . . . . . . . . . . . . . . . . . . . . . . . . . . . .
45 degrees ~ / ~
f - ~ . . . . . . . . . . . . . . . . . . . . . . . . . . . . . . . . . .
0 degrees . . . . . . . . . . . . . . . . . . . . . . . . . . . . . . . . . . . . . . . . . . . . . . . . . . . . . . . . . . . . . . . . . . . . . . .
fully-developed
Sc = 1460 - - Sc = 520 . . . . . . . .
I I I I
0.25 0 0.25 0.5 0.75
outer wall side walls
1
0.25
inner wall
F i g u r e 6. Predictions of Sherwood number along the outer, inner and side walls of a three-dimensional square- sectioned U-bend at five planes in the bend. Sc -- 520, 1460. Re = 5.67 x 10⁴.
i i
i E I I
i , I I
i E I I I I
i
(a) downward-facing bend (b) upward-facing bend
F i g u r e 7. Sample particle trajectories for sand particles (pp = 2900 kg/m 3, dp = 430#m) in a three-dimensional square-sectioned U-bend at two orientations. Particles enter the domain through the short inlet tangent and exit through the longer outlet tangent. Reynolds number, Re = 5.67 x 10⁴.

g
8
1 0 0 0 -
0
1000 -
o! ,J
1 0 0 0 -
o
1000
0 ~ ~
1000
0
1000
0
I
0.5 0.25
outer wall
downstream
180 degrees
135 degrees
90 degrees
45 degrees
I 0 degrees
I I I I
0.75 0.5 0.25 0 0.25 0.5
side walls inner wall
F i g u r e 8. Predicted erosion rate for sand (pv = 2700 k g / m 3) particles on the outer, side and inner walls of an upwards-facing three-dimensional square-sectioned U-Bend. Reynolds number, Re = 5.67 × 10⁴. Averaged over 16000 trajectories.
25
0
-~ 25
g o 25 ~_
25
25
0
25
0
- - - - - - - - - - - . . 1 - - . - - . - - - - - - - - -
0.5 0.25
outer wall
downstream
~ r e e s
135 degrees
~ . _ _ _ . . _ _ . 9 0 degrees
t x
j \
J \ _
45 degrees _ _ j / ~ ..
0 degrees
~ _._____x______ 0.75 0.5 0.25 0.25 0.5
side walls inner wall
F i g u r e 9. Predicted erosion rate for sand (pp = 2700 k g / m 3) particles on the outer, side and inner walls of a downwards-facing three-dimensional square-sectioned U-Bend. Reynolds number, Re = 5.67 × 10⁴. Averaged over 16000 trajectories.

T a b l e 1. S u m m a r y of numer ica l and e x p e r i m e n t a l p a r a m e t e r s used in t he s imu la t i on of t u r b u l e n t flow t h r o u g h a squa re - sec t ioned U- bend.
Grid WF-A Grid WF-B Grid WF-D
Reynolds number, Re 5.67 x 10 a 5.67 × 10⁴ 5.67 x 10⁴
Wid th of duct, d (mm) 44.5 44.5 44.5
Bulk velocity, Wb (m/s) 1.28 1.28 1.28
Radius of curvature, Rc/d 3.35 3.35 3.35
Number of x grid points 10 10 10
Number of y grid points 20 20 20
Number of z planes 48 96 96
Grid refinement factor 1.00 1.00 1.15
First node wall distance (#m) 2200 2200 1095.88
Discretisation scheme QUICK QUICK QUICK
Wall t reatment W F W F W F
Number of i terations 600 600 1000
CPU time (min) 10.05 20.10 32.35
T a b l e 2. S u m m a r y of numer i ca l a n d expe r imen- ta l p a r a m e t e r s used in t he s imu la t i on of tu r - bu len t flow t h r o u g h a t h r e e - d i m e n s i o n a l square- sec t ioned U-bend . L a m - B r e m h o r s t low Reyno lds n u m b e r modi f i ca t ion grids.
Grid LRN-A
Reynolds number, Re 5.67 × 10⁴
Wid th of duct, d (mm) 44.5
Bulk velocity, wb (m/s) 1.28
Radius of curvature, Rc/d 3.35
Number of x grid points 40
Number of y grid points 80
Number of z planes 96
Grid refinement factor 1.15
Last grid point wall distance (,urn) 6.25
Discretisation scheme QUICK
Wall t reatment LB-LRN
Number of i terations 6000
CPU time (hours) 74.5

T a b l e 3. P r e d i c t i o n s of peak cor ros ion ra tes , t he posi- t ion of the peak and the increase in cor ros ion r a t e a t th is po in t for oxygen cor ros ion in a t h r e e - d i m e n s i o n a l squa re - sec t ioned U-bend . Re = 5.67 x 10⁴.
3D U-Bend
Fully-developed upstream values
Mass transfer coefficient, km x 105 (m/s) 2.03
Corrosion rate, CR (mm/yr) 0.12
Peak values on inner wall
Mass transfer coefficient, km x 105 (m/s) 5.59
Corrosion rate, CR (mm/yr) 0.33
Position in bend 49"
x (distance from centerline) 0.0214
Percentage increase 175%
Peak wlues on outer wall
Mass transfer coefficient, km x 105 (m/s) 3.04
Corrosion rate, CR (mm/yr) 0.18
Position in bend 64"
x (distance from centerline) 0.0054
Percentage increase 50%
Peak values on side walls
Mass transfer coefficient, km x 105 (m/s) 4.62
Corrosion rate, CR (mm/yr) 0.27
Position in bend 180"
y (distance from inner wall) 0.0007
Percentage increase 128%
T a b l e 4. P r ed i c t i ons of peak eros ion r a t e and the pos i t i on of t he p e a k for s and pa r t i c l es (pp = 2700 k g / m 3) in a t h r e e - d i m e n s i o n a l squa re - sec t ioned U-Bend. Re = 5.67 × 10⁴.
downward-facing upward-facing
Inner wall
Erosion rate (mm/yr ) 35.52
Position in bend 49 °
x (distance from centreline) 0.0205
Outer wall
Erosion rate (mm/yr ) 180.19
Position in bend 180 °
x (distance from centerline) 0.0217
Side walls
Erosion rate (mm/yr ) 161.22
Position in bend 180"
y (distance from inner wall) 0.0440
3055.76
131"
0.0217
2733.99
131"
0.0440
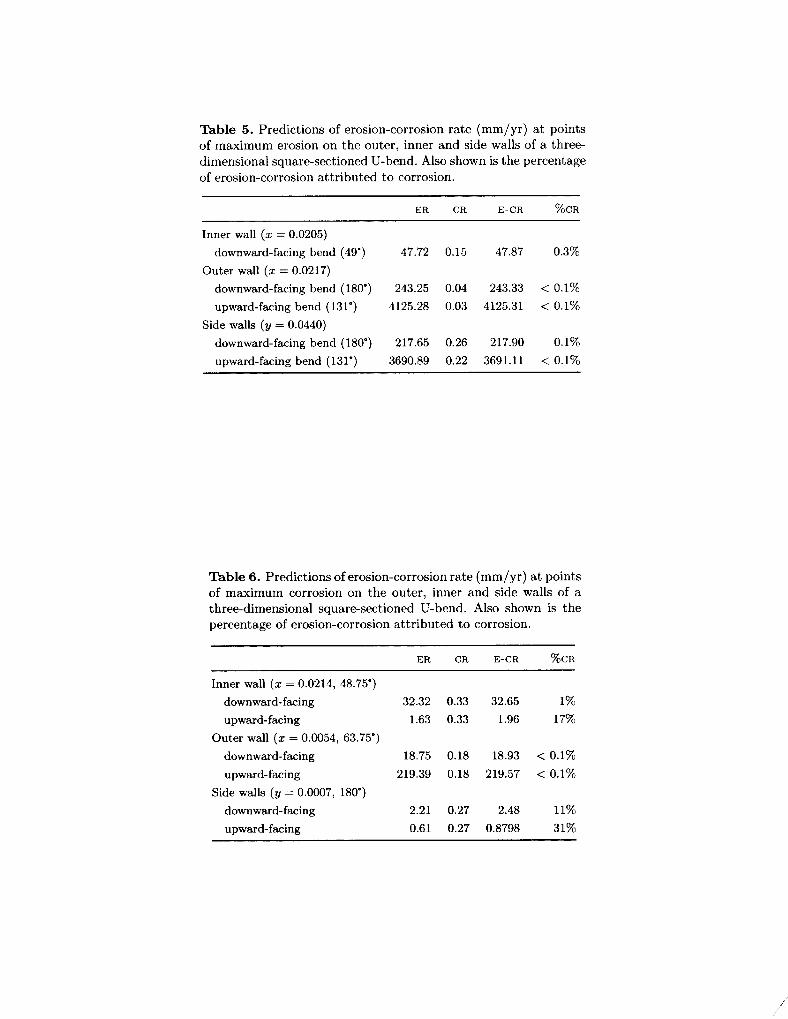
Table 5. Predictions of erosion-corrosion rate (mm/yr) at points of maximum erosion on the outer, inner and side walls of a three- dimensional square-sectioned U-bend. Also shown is the percentage of erosion-corrosion at tr ibuted to corrosion.
E R ca E-CR ~oca
Inner wall (x = 0.0205)
downward-facing bend (49") 47.72 0.15 47.87 0.3%
Outer wall (x = 0.0217)
downward-facing bend (180") 243.25 0.04 243.33 < 0.1%
upward-facing bend (131") 4125.28 0.03 4125.31 < 0.1%
Side walls (y = 0.0440)
downward-facing bend (180") 217.65 0.26 217.90 0.1%
upward-facing bend (131") 3690.89 0.22 3691.11 < 0.1%
Tab le 6. Predictions of erosion-corrosion rate (mm/yr) at points of maximum corrosion on the outer, inner and side walls of a three-dimensional square-sectioned U-bend. Also shown is the percentage of erosion-corrosion attr ibuted to corrosion.
ER CR E-CR %CR
Inner wall (x = 0.0214, 48.75")
downward-facing 32.32 0.33 32.65 1%
upward-facing 1.63 0.33 1.96 17%
Outer wall (x = 0.0054, 63.75")
downward-facing 18.75 0.18 18.93 < 0.1%
upward-facing 219.39 0.18 219.57 < 0.1%
Side walls (y = 0.0007, 180")
downward-facing 2.21 0.27 2.48 11%
upward-facing 0.61 0.27 0.8798 31%