04094 - online monitoring of corrosion under cathodic ... · online monitoring of corrosion under...
TRANSCRIPT

ONLINE MONITORING OF CORROSION UNDER CATHODIC PROTECTION CONDITIONS
UTILIZING COUPLED MULTIELECTRODE SENSORS
Xiaodong Sun Corr Instruments, LLC San Antonio TX, USA
ABSTRACT
Real-time corrosion monitoring for carbon steel materials in simulated seawater under cathodic protection conditions was conducted, utilizing coupled multielectrode sensors. It was demonstrated that the coupled multielectrode sensor is an effective real-time tool for monitoring the effectiveness of cathodic protection and for measurement of the threshold value of the protection potential for specific equipment.
Keywords: Cathodic protection, corrosion monitoring, corrosion sensor, localized corrosion, online corrosion sensor, real-time corrosion sensor, multielectrode sensor, coupled multiple electrodes.
INTRODUCTION
Cathodic protection (CP) is widely used to protect metallic structures and components in many industries, including infrastructure, transportation, oil and gas transmission and chemical processes. According to a recent NACE report,1 the total estimated cost for cathodic and anodic protection in the U.S. alone in 1998 was $2.22 billion, of which the majority cost was associated with the CP. The protection provided by the CP depends on the distribution of the cathodic current density. Due to the variations in geometry of protected structures or components, or to the location of anodes, certain areas of the protected structure or component may not receive the minimum cathodic current density that is required to provide sufficient protection. Corrosion may take place in these areas and cause catastrophic failures, if not identified and mitigated at an early stage. Because corrosion in these areas is not easily detected, an effective monitoring technique is required to identify the problem at an early stage, in order to alleviate the problem in a timely manner. An online monitoring tool placed near these hard-to-protect and critical locations may provide a real-time indication of the effectiveness of the CP system. Often, the protection potential or current density is set at overly conservative values. An online monitoring tool may make it possible to automate the CP system, to enable the protection current or potential to be set at a value that is just sufficient to protect the critical areas and that, at the same time, can reduce the cost involved in the process. In addition, the values of conservative potentials or current densities for different

applications are often determined on the basis of past experiences or tests conducted under only selected conditions. These values may be either insufficient or excessive, when the conditions in the field change. Therefore, an online corrosion monitor that works under cathodic protection conditions is an ideal tool for both the real-time monitoring of the effectiveness of the CP system and for minimizing the cost of the process.
Coupled multielectrode sensors have been recently used as in situ or online monitors for localized
corrosion, in laboratories and industry applications2-5. In this study, coupled multielectrode corrosion sensors were used as the online monitors under cathodic protection conditions. The experimental results of corrosion rates at different potentials and the critical protection potentials for carbon steel under simulated sea salt solution are presented.
EXPERIMENTAL
The sensing electrodes of the coupled multielectrode sensors were made from an annealed mild carbon steel wire (concrete rebar wire), 1.5 mm in diameter and 1.77 mm2 in electrode surface area. Each sensor had 16 electrodes flush-mounted in epoxy. Typical sensors that were used in the experiment are shown in Figure 1. Prior to the test, surfaces of sensing electrodes for each multielectrode sensor were polished to 320 grit and rinsed with distilled water and acetone. The sensors were tested in distilled water, a simulated 3%wt of sea salt water (Vigo Importing Co., Tampa, Florida), and a solution of 3%wt sea salt plus 10 mM H2O2. The experiments were conducted at 27oC. A nanoCorrTM*–50 coupled multielectrode analyzer,5,6 manufactured by Corr Instruments (San Antonio, TX, USA), was used in the experiment. This coupled multielectrode analyzer has a high current resolution (10–12 A) and allows the measurement of coupling currents up to 50 electrodes in up to six separate sensors at the same time. Figure 2 shows that three sensors were connected to the coupled multielectrode analyzer and measured at same time. The common coupling joint of each sensor was connected to a carbon steel coil made of the same wire as the sensing electrodes and immersed in the same solution, to stabilize the potential during the normal measurements. The coupling joint of the sensor was connected to a power supply during the measurements, under cathodic or anodic polarization conditions. A stainless steel tube was used as the counter electrode for the polarization of the sensing electrodes. The potential of the common joint of each sensor (the electrochemical potential of the sensor electrodes) was measured by the multielectrode analyzer, against a saturated calomel reference electrode (SCE). A notebook computer and the factory-supplied software, CorrVisualTM*, were used in conjunction with the multielectrode analyzer. The currents from each electrode, the electrochemical potential of each sensor, and the temperature were logged at a user-specified interval (usually 20 to 120 seconds) and saved in a computer file. Processed signals, such as the localized corrosion current, the cumulative charge for each sensor, and the corrosion rate and cumulative corrosion damage (or penetration depth) for each sensor were also saved in one or more separate data files at user’s choice. During the measurements, all the directly measured currents and the processed results (such as the minimum current, maximum current, mean current, current densities, corrosion rates, cumulative charges, penetration depth, and electrochemical potential), as well as the set-up parameters for data acquisition, were also dynamically available from the computer screen in both numerical and graphical forms.
* nanoCorr and CorrVisual are trade marks of Corr Instruments, LLC.

RESULTS AND DISCUSSIONS Sensor Responses to Different Solution Chemistries
To verify the performance of the multielectrode analyzer system, it was tested with carbon steel sensors in different solutions. Figure 3 shows a typical response curve obtained from the different solutions. The sensor signal (corrosion rate) was about 1.4x10⁻² micrometer/year (14 nanometer/year, or 0.00055 mil/year) in air, which is close to the lower detection limit of the sensor measurement system (1.4 nanometer/year). Upon the immersion of the sensor in distilled water, the signal increased instantaneously by 3 orders of magnitude, indicating a slight corrosion for carbon steel in distilled water (10 micrometer/year or 0.39 mil/year). As corrosion that took place on the sensor may alter the local chemistry, such as pH near the corroded electrodes, the corrosion signal gradually increased in the distilled water. Over a period of 12 hours, the corrosion rate increased, from 10 micrometer/year (0.39 mil/year) to 20 micrometer/year (0.78 mil/year). When the sensor was immersed in the simulated seawater (3%wt salt solution), the signal increased to 800 micrometer/year (31.5 mil/year) and stabilized at this value. When the sensor was immersed in the distilled water again, the corrosion rate decreased and stabilized at a value that is slightly higher than the previous value measured in the same water, suggesting that the previous value was not stabilized. Another reason for the slightly higher value in the second immersion in the same distilled water was that the sensing electrode had been corroded before the second immersion. The corrosion products, or the residue sea salt that was trapped on the sensor surface and not completely removed during the rinsing prior to the second immersion, may also have caused the increase of the corrosion rate. When the sensor was returned to the simulated seawater, the corrosion rate returned to the value measured previously in the same solution.
Upon the addition of H2O2 to the 3% sea salt solution (10 mM H2O2 concentration), the corrosion
rate increased significantly and stabilized at about 10 mm/year (394 mil/year) in a few data sampling cycles (the sampling interval was set to 2 minutes). The sensor reproduced the previous signals when it was re-immersed in the same simulated seawater or placed in air. The response curve also showed good reproducibility and stability of the sensor, whether after decreasing from a higher value or after increasing from a lower value in the simulated seawater, over the testing period. The signal measured in air showed that the sensor is extremely sensitive and capable of measuring corrosion rate near the designed lower detection limit—1.4 nanometer per year.
Measurement of Critical Protection Potential
Typical responses of the carbon steel sensor signals to the CP potential are shown in Figure 4. The signal for each sensor was automatically calculated by the factory-supplied software during the measurement, based on the current from the most corroding or the most active electrode among all the sensing electrodes.2 (The signals based on the mean plus 2.5 or 3 times the standard deviation of the currents are also available from the software.) At the start of the test, the potential was controlled near the free open circuit potential, by connecting the common joints of the sensors to a separate large carbon steel coil that was made from the same wire as the sensing electrodes. The signal was 8x10⁻⁵ to 1.2x10⁻⁴ A/cm2 (corresponding to approximately 1 mm/year) at the free open circuit potential, which is consistent with the result measured in the same solution as shown in Figure 3. The corrosion signals increased to approximately 2x10⁻³ A/cm2 (corresponding to approximately 30 mm/year), when the potential was increased by approximately 0.08V. The corrosion rate gradually decreased with the decrease of potential,

sharply dropped when the potential was near, and became negative when the potential was below the critical protection potential. In this paper, the critical protection potential is defined as the highest potential at which all the carbon steel electrodes were fully protected.
Figure 5 pictures the enlargement of the responses of the absolute values of the sensor corrosion
signals near and below the critical protection potential. The corrosion signals stabilized at –4x10⁻⁵ A/cm2 for sensor #2, at –3x10⁻⁶ A/cm2 for sensor #1, and were relatively independent of the potential, when the cathodic protection potential was changed between the value slightly below the critical protection potential and -1.18 VSCE. In Figure 5, the corrosion signal was the current density measured from the most corroding or most active electrode among all the sensing electrodes in the sensor. The negative corrosion signal suggests that the most active electrode in the sensor was actually a cathode (equivalent to the most active site in a metal piece being a cathodic site) and effectively protected, when the potential was below the critical protection potential. This implies that all the electrodes in the sensor (equivalent to all areas of the metal piece) were effectively protected by the cathodic protection, when the potential was below the critical protection potential.
Measurement of Corrosion Rate Under Cathodic Protection Conditions
Three sensors (sensors #1, #2, and #3) were used in the measurements. Sensor #1 was cathodically polarized to approximately –0.9 VSEC, which is well below the protection critical potential. Sensor #2 was slightly anodically polarized, to simulate a faulty polarity connection in the CP system. Sensor #3 was left at the free corrosion potential, to simulate an inefficient protection from the CP system or the unprotected condition. Figure 6 shows the measured corrosion current density signals and the potentials of the three sensors during the monitoring period. In Figure 6, the corrosion current density signal for each sensor was automatically calculated by the software based on the mean value plus 2.5 times the standard deviation of the currents2 during the measurement. The corrosion current from sensor #1 was negative throughout the monitoring period, indicating that there was no corrosion on the sensing electrodes of sensor #1. The corrosion current of sensor #3 was approximately 10-4 A/cm2 during the first 4 days of monitoring and decreased to approximately 10-5 A/cm2 on the 5th day. The corrosion current signal from sensor #2 was approximately 10-3 A/cm2 throughout the monitoring period, indicating that the corrosion increased by more than one order of magnitude, when the potential was raised by approximately 0.07 V from the free corrosion potential. The slight decrease of the free corrosion potential of sensor #2 over the monitoring period was probably due to the pH increase caused by the relatively large cathodic reaction of oxygen on the stainless steel counter electrode used to anodically polarize sensor #2. At the end of the test, a large amount of rust deposit was observed at the electrochemical cell, suggesting a high pH solution.
The corrosion rates for the three sensors were also available from the software during the
measurement (Figure 7). The corrosion rate of the unprotected sensor—sensor #2—in the first 4 days was approximately the same as the value measured in the previous measurements, which were conducted with similar sensors in the simulated seawater (Figure 2). However, the rate was slightly lower after the 5th day. The difference between the values measured in the first 4 days and the values measured after the 5th day (Figure 7) is within the expected range of variations for localized corrosions in a given environment. The corrosion rate for sensor #1 was automatically set to the lower detection limit of the instrument because its corrosion current signal was negative, indicating that there was no corrosion.
Figure 8 shows the appearance of the sensor electrodes after the monitoring period. Clearly, all
the electrodes of sensor #2 (except the one with faulty connection at the location of row 3 and column 2) were severely corroded. Slight pitting corrosion can be noticed on some of the electrodes of sensor #3. No
significant pitting corrosion was observed on the electrodes of sensor #1. The result, as shown in Figure 8, is in agreement with the measured corrosion rate shown in Figure 7. In addition, Figure 7 shows that the average corrosion rate for sensor #2 was 12.7 mm/year. Hence, the total penetration depth for the most corroded electrode on sensor #2 should be 0.38 mm, after the 11 days of exposure. The measured depth of the most corroded electrode on sensor #2, as shown in Figure 8, was approximately 0.4 mm, which is in excellent agreement with the depth estimated by the coupled multielectrode sensor.
CONCLUSION
It was demonstrated that coupled multielectrode sensors are effective tools for real-time
measurement of the critical protection potential for cathodic protection. The sensors can also be used as online tools to measure the corrosion rate under cathodic protection potentials. If placed near the critical locations of engineering components, they can be used to detect either the effectiveness or faulty conditions of the cathodic protection system in real-time.
REFERENCES 1. G. H. Koch, M.P.H. Brongers, N.H. Thompson, Y. P. Virmani, and J.H. Payer, “Corrosion Cost
and Preventive Strategies in the United States,” NACE Report, FHWA-RD-01-156, (Houston, TX: NACE, 2001).
2. L. Yang, N. Sridhar, O. Pensado, and D.S. Dunn, Corrosion, 58 (2002), p.1004. 3. L. Yang, R.T. Pabalan, L. Browning, and G.C. Cragnolino, “Measurement of Corrosion in
Saturated Solutions under Salt Deposits Using Coupled Multielectrode Array Sensors,” CORROSION/2003, paper no. 426 (Houston, TX: NACE, 2003).
4. C.S. Brossia and L. Yang, “Studies of Microbiologically Induced Corrosion Using a Coupled
Multielectrode Array Sensor,” CORROSION/2003, paper no. 575 (Houston, TX: NACE, 2003). 5. X. Sun, “Online Monitoring of Undercoating Corrosions Utilizing Coupled Multielectrode
Sensors,” CORROSION/2004, paper no.04033 (Houston, TX: NACE, 2004). 6. Web site: http://www.corrinstruments.com.

Figure 1. Typical coupled multielectrode sensors used in the experiment.

Figure 2. Coupled multielectrode corrosion analyzer system used in the experiment.

Figure 3. Typical responses of carbon steel sensors to the changes of solution chemistry. The signals measured in dry air (~14 nm/year) are close to the lower detection limit of the sensor system (1.4 nm/year).
0.01
0.10
1.00
10.00
100.00
1000.00
10000.00
100000.00
0.0 1.0 2.0 3.0 4.0 5.0 6.0
Time (day)
Cor
rosi
on R
ate
(mic
rom
eter
/yea
r)
0
0
0
0
1
10
100
1000
Cor
rosi
on R
ate
(m
il/ye
ar)
Distilled Water
3%wt Sea Salt
3%wt Sea Salt+10 mM H2O2
3%wt Sea Salt
Dry Air Dry Air
3937
394
39.4
3.94
0.394
0.0394
0.00394
0.000394
Distilled Water

Figure 4. Responses of the corrosion signals (anodic current densities) of the sensors to the changes of the cathodic protection potential in a 3%wt sea salt solution. For detailed signal changes near and below the critical protection potential, see Figure 5.
1.0E-07
1.0E-06
1.0E-05
1.0E-04
1.0E-03
1.0E-02
0.5 1.5 2.5 3.5 4.5
Time (day)
Cor
rosi
on S
igna
l (A
/cm
2 )
-1.3
-1.1
-0.9
-0.7
-0.5
-0.3
-0.1
0.1
Pot
entia
l [
V (S
CE
) ]
Sensor 1 SignalSensor 2 SignalPotential
Corrosion Signals Became Negative
Critical Protection Potential: -0.72--0.74 VSCE

Figure 5. Responses of the absolute values of the sensor corrosion signals to the changes of the cathodic protection potential near and below the critical protection potential in the 3%wt sea salt solution. The sensor corrosion signals became negative upon reaching the critical protection potential, indicating there was no corrosion on the sensing electrodes when the potential was below the critical protection potential.
1.0E-10
1.0E-09
1.0E-08
1.0E-07
1.0E-06
1.0E-05
1.0E-04
1.0E-03
2.1 2.2 2.3 2.4 2.5 2.6
Time (day)
| Cor
rosi
on S
igna
l | (A
/cm
2 )
-0.9
-0.85
-0.8
-0.75
-0.7
-0.65
-0.6
-0.55
-0.5
Pot
entia
l [
V (S
CE
) ]
Sensor 1 SignalNegative of Sensor 1 SignalSensor 2 SignalNegative of Sensor 2 SignalPotential
Sensor 2Critical ProtectionPotential: -0.72 VSCE
Signal Negative --Non-corroding
Signal Positive--Corroding
Sensor 1Critical ProtectionPotential: -0.74 VSCE

Figure 6. Corrosion current signals and the potentials of the sensors during the monitoring period. The corrosion signal from sensor #1 was negative (-6x10⁻⁶ to -1x10⁻⁵ A/cm2), indicating no corrosion was taking place on sensor #1 electrodes.
1.00E-09
1.00E-08
1.00E-07
1.00E-06
1.00E-05
1.00E-04
1.00E-03
1.00E-02
0 2 4 6 8 10 12
Time (day)
Cor
rosi
on C
urre
nt S
igna
l (A
/cm
2 )
-1.05
-0.95
-0.85
-0.75
-0.65
-0.55
-0.45
-0.35
-0.25
-0.15
-0.05
0.05
0.15
Pot
entia
l [V
(SE
C)]
Negative of Sensor 1 Signal
Sensor 1 Potential
Sensor 3 Potential
Sensor 2 Potential
Sensor 2 Signal
Sensor 3 Signal

Figure 7. Measured corrosion rate during the monitoring period. Sensor 1 corrosion rate was set to the lower detection limit (1.4 nm/year) by the instrument, because its current was negative, indicating there was no corrosion on the sensing electrodes.
0.001
0.010
0.100
1.000
10.000
100.000
1000.000
10000.000
100000.000
0 2 4 6 8 10 12
Time (day)
Cor
rosi
on R
ate
(mic
rom
eter
/yea
r)
0.00E+00
2.00E-04
4.00E-04
6.00E-04
8.00E-04
1.00E-03
1.20E-03
1.40E-03
1.60E-03
Cor
rosi
on R
ate
(mil/
year
)
Sensor 1 corrosion current was negative; Corrosion rate was set to lower limit by instrument
Sensor 2
Sensor 3
3937
394
39.4
3.94
0.394
0.0394
0.00394
0.000394
0.000039
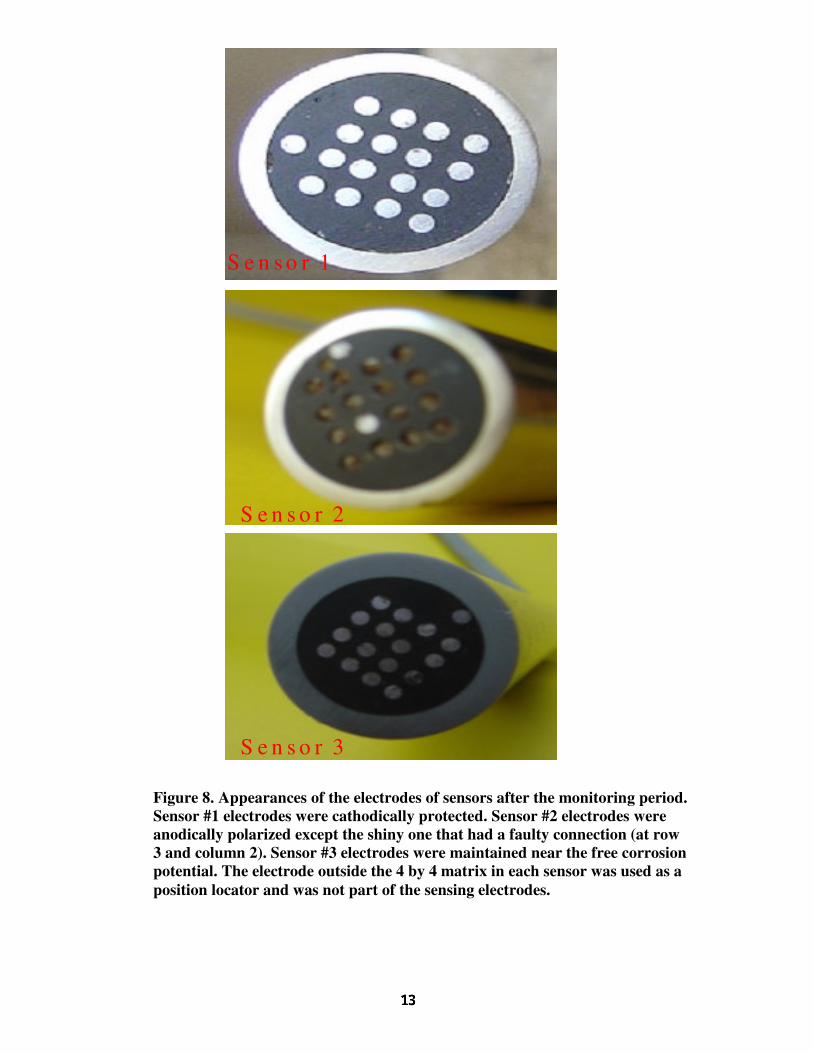
Figure 8. Appearances of the electrodes of sensors after the monitoring period. Sensor #1 electrodes were cathodically protected. Sensor #2 electrodes were anodically polarized except the shiny one that had a faulty connection (at row 3 and column 2). Sensor #3 electrodes were maintained near the free corrosion potential. The electrode outside the 4 by 4 matrix in each sensor was used as a position locator and was not part of the sensing electrodes.
S e n s o r 1
S e n s o r 3
S e n s o r 2