0evaluating the effectiveness of the use of …
TRANSCRIPT

0EVALUATING THE EFFECTIVENESS OF THE USE OF INFORMATION AND
COMMUNICATION TECHNOLOGY IN THE TEACHING AND LEARNING OF
TRIGONOMETRY FUNCTIONS IN
Grade 12
By
Nthabiseng Mamotho Mosese
Submitted in accordance with the requirements for
The degree of
MASTER OF SCIENCE
In the subject
MATHEMATICS EDUCATION
At the
UNIVERSITY OF SOUTH AFRICA
SUPERVISOR: DR U. I OGBONNAYA
FEBRUARY 2017

I
ABSTRACT
The high school pass rate, for mathematics, in South Africa is very low. This is
particularly so in trigonometry functions. One of the possible factors leading to this is
the traditional method of teaching and learning. This study was undertaken to
determine whether the use of Information and Communication Technology (ICT)
would influence students’ learning of trigonometry functions. In order to answer this
question the teaching and learning instructions developed were based on activity
theory (AT) and action, process, object, and schema (APOS) theory. The study
followed a non-equivalent control group, quasi-experimental design with a pre- post-
test approach. Since it was not possible to randomly select participants for the study,
intact groups were used. There were two groups: a control and an experimental one.
Both groups wrote a standardized achievement pre-test to establish their
comparability at the beginning of the study. While the control group was taught in the
traditional way (grade 10-12 syllabus), the experimental group used the software
Geogebra. The computer software (Geogebra) and the South African grade 10-12
syllabus for trigonometry functions were used during the lessons of the experimental
group. At the end of the study, a similar post-test was administered on both groups
to measure the comparative effects of either of the teaching methods on the
performance of students. A t-test independent sample statistical analysis was
performed on the findings using a statistics package, SPSS. The results of this
investigation indicated that the use of the computer software, Geogebra, in the
teaching and learning of trigonometry functions improved the performance of the
Grade 12 students.
Key Terms:
Mathematics; Trigonometry functions; Geogebra; Information and Communication
Technology; Positivism; Pre- Post-test

II
DECLARATION
Name: Nthabiseng Mamotho Mosese
Student number: 46985484
Degree: M Sc. MATHEMATICS, SCIENCE AND TECHNOLOGY
EDUCATION
Evaluating the effectiveness of the use of Information and Communication
Technology (ICT) in the teaching and learning of trigonometry functions in grade 12
I declare that the above dissertation/thesis is my own work and that all the sources
that I have used or quoted have been indicated and acknowledged by means of
complete references.
02/10/2017
___________________. _______
SIGNATURE DATE
NM MOSESE

III
ACKNOWLEDGEMENT
Firstly, I would like to thank my God, the “Great I Am”- for making this feasible at
long last.
I thank Dr Ogbonnaya, for having been so patiently assisting me and guiding me
throughout this study.
I also would like to thank Prof Mogari for ensuring that my studies continued without
fail.
Next I thank my husband, Dr TD Kawadza, for being patiently there all the time with
me.
I would also like to acknowledge both my Mother and Father (posthumously) and my
brothers, Tshepo, Suwi, and Tsupane who have always believed in me and
encouraged me to pursue further education at all costs. I also have to say thanks to
Khulu, my father in law.
I thank my kids (Tafadzwa, Amani, Tokoloho, Namara and Bangiwe) for believing in
me.
I extend my appreciation to my cousin, Ndu Makutwane, for being the support she
gave me as a fellow part-time student.
I would also like to thank all the people who participated in this study.

IV
DEDICATION
This work is dedicated to my 5 children
Tafadzwa
Amani
Tokoloho
Namara
And
Bangiwe

V
TABLE OF CONTENT
ABSTRACT ............................................................................................................................................ I
DECLARATION .................................................................................................................................... II
DEDICATION ....................................................................................................................................... IV
TABLE OF CONTENT ......................................................................................................................... V
LIST OF TABLES ................................................................................................................................. X
LIST OF FIGURES .............................................................................................................................. XI
LIST OF ABBREVIATIONS .............................................................................................................. XII
CHAPTER ONE .................................................................................................................................... 1
BACKGROUND AND OVERVIEW OF THE STUDY ..................................................................... 1
1.1 BACKGROUND OF THE STUDY ...................................................................................... 1
1.2 STATEMENT OF THE PROBLEM .................................................................................... 5
1.3 RATIONALE FOR THE STUDY ......................................................................................... 6
1.4 SIGNIFICANCE OF THE STUDY ...................................................................................... 7
1.5 RESEARCH QUESTIONS .................................................................................................. 7
1.6 HYPOTHESES ..................................................................................................................... 8
1.7 SCOPE AND LIMITATIONS OF THE STUDY................................................................. 8
1.8 DEFINITION OF TERMS .................................................................................................... 9
1.9 STRUCTURE OF THESIS ................................................................................................ 11
1.10 SUMMARY OF THE CHAPTER ...................................................................................... 12
CHAPTER TWO ................................................................................................................................. 13
THEORETICAL FRAMEWORK AND REVIEW OF LITERATURE ............................................ 13
2.1 THEORETICAL FRAMEWORKS .................................................................................... 13
2.1.1 APOS THEORY .......................................................................................................... 13
2.1.2 ACTIVITY THEORY (AT) .......................................................................................... 17
2.1.3 INTERGRATING THE TWO THEORETICAL PERSPECTIVES ........................ 20
2.2 LITERATURE REVIEW ..................................................................................................... 22
2.2.1 THE MATHEMATICAL CONCEPT OF TRIGONOMETRY FUNCTIONS ......... 22
VI
2.2.2 ICT IN TEACHING AND LEARNING ...................................................................... 28
2.2.3 ICT IN TEACHING AND LEARNING OF MATHEMATICS .................................. 30
2.2.4 ICT IN THE TEACHING AND LEARNING OF TRIGONOMETRY ..................... 35
2.3 SUMMARY .......................................................................................................................... 38
CHAPTER THREE ............................................................................................................................. 39
RESEARCH METHODOLOGY ........................................................................................................ 39
3.1 THE RESEARCH PARADIGM ......................................................................................... 39
3.1.1 POSITIVISM ................................................................................................................ 39
3.2 RESEARCH DESIGN ........................................................................................................ 43
3.2.1 CHOOSING THE QUANTITATIVE APPROACH .................................................. 45
3.2.2 DESCRIPTION OF THE SITE .................................................................................. 45
3.3. STUDY SAMPLE AND POPULATION ........................................................................... 46
3.4 CONDUCTING THE STUDY ............................................................................................ 47
3.4.1 INSTRUMENTS .......................................................................................................... 48
3.4.2 DEVELOPMENT OF ACHIEVEMENT TESTS ...................................................... 48
3.4.3 ELABORATION OF TASKS IN THE TESTS ......................................................... 56
3.4.4 RELIABILITY AND VALIDITY .................................................................................. 58
3.4.5 METHODS USED IN THE CLASSROOMS ........................................................... 61
3.4.6 DATA ANALYSIS ....................................................................................................... 69
3.5 PILOT STUDY .................................................................................................................... 41
3.6 ETHICAL CONSIDERATIONS ......................................................................................... 70
3.7 SUMMARY .......................................................................................................................... 71
CHAPTER FOUR ............................................................................................................................... 72
FINDINGS ........................................................................................................................................... 72
4.1 PRE-TEST RESULTS ....................................................................................................... 73
4.2 POST-TEST RESULTS ..................................................................................................... 75
4.2.1 RESULT OF THE GENERAL PERFORMANCE IN THE POST-TEST ............. 75
4.2.2 RESULTS OF GROUPED QUESTIONS ................................................................ 77

VII
4.3 ADDRESSING THE RESEARCH QUESTIONS ........................................................... 83
4.3.1 MAIN RESEARCH QUESTION ............................................................................... 83
4.4 SUMMARY .......................................................................................................................... 85
CHAPTER FIVE ................................................................................................................................. 87
DISCUSSION OF FINDINGS, CONCLUSION AND RECOMMENDATIONS .......................... 87
5.1 SUMMARY OF THE STUDY ............................................................................................ 87
5.2 SUMMARY OF THE FINDINGS ...................................................................................... 88
5.3 DISCUSSION OF FINDINGS ........................................................................................... 89
5.3.1 THE OVERALL PERFORMANCE OF THE STUDENTS ..................................... 89
5.3.2 CONNECTIONS OF TRIGONOMETRY FUNCTIONS ........................................ 89
5.3.3 INTERPRETATION AND ANALYSIS OF TRIGONOMETRY FUNCTIONS ..... 89
5.3.4 TRANSFORMATION OF TRIGONOMETRY FUNCTIONS ................................ 90
5.3.5 DERIVATIONS OF GENERAL AND SPECIFIC SOLUTIONS OF
TRIGONOMETRY FUNCTIONS .............................................................................................. 90
5.4 CONCLUSION .................................................................................................................... 91
5.5 IMPLICATIONS OF THE FINDINGS AND RECOMMENDATIONS .......................... 92
5.6 LIMITATIONS OF THE STUDY AND RECOMMENDATIONS FOR FUTURE
STUDY ............................................................................................................................................. 92
REFERENCES ................................................................................................................................... 95
APPENDICES ................................................................................................................................... 104
APPENDIX 1: PRE-TEST:- TRIGONOMETRY FUNCTIONS TEST ................................... 104
APPENDIX 2: POST-TEST- TRIGOMOMETRY FUNCTIONS ............................................. 110
APPENDIX 3 : INSTRUMENT VALIDATION FORM FOR SMEs ..................................... 116
APPENDIX 4: PERMISSION LETTER TO REGISTER FOR THESIS ................................ 118
APPENDIX 5: PERMISSION LETTER FROM SGB MASCCOM ......................................... 121
APPENDIX 6: PERMISSION LETTER FROM NW EDUCATION DEPARTMENT ............ 123
APPENDIX 7: PERMISSION LETTER ..................................................................................... 126
APPENDIX 8: STUDENTS’ CONSENT FORM ....................................................................... 129

VIII
APPENDIX 9: ACHIEVEMENT LEVEL DESCRIPTIONS OF COMPETENCE
PERCENTAGE BANDS (DBE, 2015) ....................................................................................... 131
APPENDIX 10: CORRELATIONS OF TWO EQUIVALENT GROUPS ............................... 132
APPENDIX 11: GROUPS’ MEAN ACHIEVEMENTS BY QUESTION ................................ 133
APPENDIX 12A: STUDENTS’ MEAN ACHIEVEMENT ON QUESTION 1_1a .................. 134
APPENDIX 12B: t-test ON STUDENTS’ ACHIEVEMENT IN QUESTION 1_1a................ 134
APPENDIX 13A: STUDENTS’ MEAN ACHIEVEMENT ON QUESTION 1_1b .................. 135
APPENDIX 13B: t-test ON STUDENTS’ ACHIEVEMENT ON QUESTION 1_1b.............. 135
APPENDIX 14A: STUDENTS’ MEAN ACHIEVEMENT ON QUESTION 1_1c .................. 136
APPENDIX 14B: t-test ON STUDENTS’ ACHIEVEMENT IN QUESTION 1_1c ................ 136
APPENDIX 15A: STUDENTS’ MEAN ACHIEVEMENT ON QUESTION 12a .................... 137
APPENDIX 15B: t-test ON STUDENTS’ ACHIEVEMENT ON QUESTION 1.2a ............... 137
APPENDIX 16A: STUDENTS’ MEAN ACHIEVEMENT ON QUESTION 1.2b ................... 138
APPENDIX 16B: t-test ON STUDENTS’ ACHIEVEMENT ON QUESTION 1.2b ............... 138
APPENDIX 17A: STUDENTS’ MEAN ACHIEVEMENT ON QUESTION 1.2c ................... 139
APPENDIX 17B: t-test ON STUDENTS’ ACHIEVEMENT ON QUESTION 1.2c ............... 139
APPENDIX 18A: STUDENTS’ MEAN ACHIEVEMENT ON QUESTION 1.2d ................... 140
APPENDIX 18B: t-test ON STUDENTS’ ACHIEVEMENT ON QUESTION 1.2d ............... 140
APPENDIX 19A: STUDENTS’ MEAN ACHIEVEMENT ON QUESTION 1.2e ................... 141
APPENDIX 19B: t-test ON STUDENTS’ ACHIEVEMENT ON QUESTION 1.2e ............... 141
APPENDIX 20A: STUDENTS’ MEAN ACHIEVEMENT ON QUESTION 1.2f .................... 142
APPENDIX 20B: t-test ON STUDENTS’ ACHIEVEMENT ON QUESTION 1.2f ................ 142
APPENDIX 21A: STUDENTS’ MEAN ACHIEVEMENT ON QUESTION 1.2g ................... 143
APPENDIX 21B: t-test ON STUDENTS’ ACHIEVEMENT ON QUESTION 1.2g ............... 143
APPENDIX 22A: STUDENTS’ MEAN ACHIEVEMENT ON QUESTION 1.2h ................... 144
APPENDIX 22B: t-test ON STUDENTS’ ACHIEVEMENT ON QUESTION 1.2h ............... 144
APPENDIX 23A: STUDENTS’ MEAN ACHIEVEMENT ON QUESTION 1.2i .................... 145
APPENDIX 23B: t-test ON STUDENTS’ ACHIEVEMENT -QUESTION 1.2i ...................... 145

IX
APPENDIX 24A: STUDENTS’ MEAN ACHIEVEMENT ON QUESTION 4 ......................... 146
APPENDIX 24B: t-test ON STUDENTS’ ACHIEVEMENT -QUESTION 4 .......................... 146
APPENDIX 25A: STUDENTS’ MEAN ACHIEVEMENT ON QUESTION 2a ...................... 147
APPENDIX 25B: t-test ON STUDENTS’ ACHIEVEMENT -QUESTION 2a ........................ 147
APPENDIX 26A: STUDENTS’ MEAN ACHIEVEMENT ON QUESTION 2b ...................... 148
APPENDIX 26B: t-test ON STUDENTS’ ACHIEVEMENT -QUESTION 2b ........................ 148
APPENDIX 27A: STUDENTS’ MEAN ACHIEVEMENT ON QUESTION 2c ....................... 149
APPENDIX 27B:t-test ON STUDENTS’ ACHIEVEMENT -QUESTION 2c ......................... 149
APPENDIX 28A: STUDENTS’ MEAN ACHIEVEMENT ON QUESTION 3a ...................... 150
APPENDIX 28B: t-test ON STUDENTS’ ACHIEVEMENT- QUESTION 3a ........................ 150
APPENDIX 29A: STUDENTS’ MEAN ACHIEVEMENT ON QUESTION 3b ...................... 151
APPENDIX 29B: t-test ON STUDENTS’ ACHIEVEMENT -QUESTION 3b ........................ 151
APPENDIX 30A: STUDENTS’ MEAN ACHIEVEMENT ON QUESTION 3c ....................... 152
APPENDIX 30B: t-test ON STUDENTS’ ACHIEVEMENT -QUESTION 3c ........................ 152
APPENDIX 31A: STUDENTS’ MEAN ACHIEVEMENT ON QUESTION 3di ...................... 153
APPENDIX 31B: t-test on STUDENTS’ ACHIEVEMENT -QUESTION 3di ........................ 153
APPENDIX 32A: STUDENTS’ MEAN ACHIEVEMENT ON QUESTION 3dii ..................... 154
APPENDIX 32B: t-test ON STUDENTS’ ACHIEVEMENT- QUESTION 3dii ...................... 154
APPENDIX 33A: STUDENTS’ MEAN ACHIEVEMENT ON QUESTION 3e ...................... 155
APPENDIX 33B: t-test ON STUDENTS’ ACHIEVEMENT -QUESTION 3e ........................ 155
APPENDIX 34A: STUDENTS’ MEAN ACHIEVEMENT ON QUESTION 5_1_1 ................ 156
APPENDIX 35A: STUDENTS’ MEAN ACHIEVEMENT ON QUESTION 5_1_2 ................ 157
APPENDIX 35B: t-test ON STUDENTS’ ACHIEVEMENT -QUESTION 5_1_2 ................. 157
APPENDIX 36A: STUDENTS’ MEAN ACHIEVEMENT ON QUESTION 5_1_3 ................ 158
APPENDIX 36b: t-test ON STUDENTS’ ACHIEVEMENT -QUESTION 5_1_3.................. 158
APPENDIX 37A: STUDENTS’ MEAN ACHIEVEMENT ON QUESTION 5_2_1 ................ 159
APPENDIX 37B: t-test ON STUDENTS’ MEAN ACHIEVEMENT QUESTION 5_2_1 ...... 159

X
LIST OF TABLES
Table 1.1: Overall Achievement Rates in Mathematics .........................................2
Table 2.1: APOS as pertaining to this study is shown below .................................16
Table 2.2: General description of components of AT ............................................19
Table 2.3: Elements of the Activity Theory in Trigonometry functions ...................20
Table 2.4: Overview of Trigonometry functions in Grades 10, 11 & 12 .................24
Table 3.1: APS on Trigonometry content (Grades 10-12) .....................................50
Table 3.2: Amended Bloom’s Cognitive levels ......................................................55
Table 3.3: Topics covered in Pre- and Post-tests ..................................................57
Table 3.4: CVR values for the different questions .................................................60
Table 4.1: Groups mean achievement in the pre-test............................................73
Table 4.2: t-test analyses of the students’ achievement in the pre-test ................74
Table 4.3: Overall students’ performance in the Post-test ....................................75
Table 4.4: t-test analyses of the students’ achievement in the post-test ..............76
Table 4.5: Students’ mean achievement on connections ...............................79
Table 4.6: t-test on students’ ability to make connections of representations of
trigonometry functions ..................................................................79
Table 4.7: Students’ mean achievement on interpretations of trigonometry
functions ....................................................................................................... 80
Table 4.8: t-test on students’ interpretations of trigonometry functions ..........80
Table 4.9: Students’ mean achievement on transformations ................................81
Table 4.10: t-test on students’ transformation of trigonometry functions ..............81
Table 4.11: Students’ mean achievement on general and specific solutions .......82
Table 4.12: t-test on students’ general and specific solutions of trigonometry
functions ..........................................................................................82

XI
LIST OF FIGURES
Figure 2.1: General Framework for APOS Research ...........................................15
Figure 2.2: Basic Vygotskian triangular representation of mediation ...................17
Figure 2.3: Components of the Activity System .....................................................18
Figure 2.4: Activity, Actions and Operations ..........................................................20
Figure 2.5: Some of the trigonometry representations ..........................................26
Figure 3.1: Blue-print of the quasi-experimental design ........................................44
Figure 3.2: Right angle triangle .............................................................................62
Figure 3.3: Quadrants showing trigonometry functions signs (CAST) ...................63
Figure 3.4 The Unit Circle representations ............................................................63
Figure 3.5: Trigonometry functions graphs ...........................................................64
Figure 3.6: Geogebra applet 1a ............................................................................66
Figure 3.7: Geogebra applet 1b ............................................................................66
Figure 3.8: Geogebra applet 1c .............................................................................67
Figure 3.9: Geogebra applet 1d ............................................................................67
Figure 3.10: Geogebra applet 1e ..........................................................................68
Figure 3.11: Geogebra applet for analysis of trigonometry functions ....................69
Figure 4.1: Graphical representation of grouped characteristics ...........................78

XII
LIST OF ABBREVIATIONS
AT: Activity theory
APOS: Activity, Processes, Objects and Schema
CAPS: Curriculum Assessment Policy Statement
CAS: Computer Algebra System
DBE: Department of Education
DGS: Dynamic geometry software
DMS: Dynamic mathematics software (e.g. Geogebra)
E-Education: Electronically supported education
EMDC: Education Management and Development Centre
FET: Further Education and Training
GET: General Education and Training
HSRC: Human Science Research Council
ICT: Information and Communication Technology
NCS: National Curriculum Statement
TIMMS: Trends in International Mathematics and Science Studies
SME: Subject matter Experts
SPSS: Statistical Product and Service Solutions

1
CHAPTER ONE
BACKGROUND AND OVERVIEW OF THE STUDY
In this study, Information and Communication Technology (ICT) was introduced into
the teaching and learning of trigonometry functions in order to evaluate its
effectiveness compared to the traditional method of instruction (chalk and talk) in the
classroom.
This chapter starts with the background of the study, which includes the students’
performance in mathematics in South Africa, the problem of students’ poor
performance in trigonometry functions, a brief overview of previous research and the
teaching methods used in classes. This is followed by the statement of the problem,
the context within which the study took place, the rationale for the study conducted,
and the significance of the study are then discussed. The research questions and the
null hypotheses are developed. Limitations of the study are then pointed out. The
chapter ends with an overall structure of the thesis.
1.1 BACKGROUND OF THE STUDY
Mathematics is the foundation of scientific and technological knowledge that
contributes to personal and socio-economic development of a nation (DBE, 2003;
Mbugua, Kibet, Muthaa, & Nkonke, 2012). Mathematics is also used as an entry
requirement into many of the tertiary disciplines such as medicine and engineering
(Weber, 2005). Despite the important role that Mathematics plays in society, very
few studies are carried out to understand students’ attitudes and performance in it.
Recent students’ performance assessment analyses of the Matric (grade 12)
examination show that many students in South Africa performed extremely poorly in
the results for the period between 2011 to 2015 (DBE, 2011, 2014, 2015). This was
especially so in trigonometry functions.
Trigonometry is a branch of mathematics that deals with the relationships of sides
and angles in triangles (Laridon, Jawurek, Kitto, Pike, Myburgh, Rhodes-Houghton,
& van Rooyen, 2002; Orhun, 2010). Trigonometry is also seen as one of the
important subjects in the high school curriculum which requires an integration of

2
algebraic, geometric and graphical reasoning (DBE, 2009; Stols, 2011; NCTM,
2012). The connection of all these contexts is important for the comprehension of
trigonometry functions.
In South African schools, trigonometry functions are taught in grades 10, 11 and 12.
The Matric examination is written at the end of grade 12 and mathematics is a
requirement for admission to many programs at the tertiary level (college and
university level).
Table 1.1 shows that the general performance of students declined in 2015 to 49.1%
from previous perfomances which were above 50% for the candidates achieving
30% and above. While the performance in 2015 for candidates who achieved 40%
and above was down to 31.9% compared to 35.1% previously.
Table 1.1: Overall Achievement Rates in Mathematics (DBE, 2015)
YEAR No. wrote No. achieved at
30% and above
% achieved at
30% and above
No. achieved at
40% and above
% achieved at
40% and above
2012 225874 121970 54.0 80716 35.7
2013 241509 142666 59.1 97790 40.5
2014 225458 120523 53.5 79050 35.1
2015 263903 129461 49.1 84297 31.9
In addition, the National Senior Certificate Examination 2015 Diagnostic report (DBE,
2015) presented a general overview of the problems that were detected in the paper
with trigonometry (Mathematics Paper II). Some of the problems are indicated below:
It is evident that many of the errors/misconceptions made by candidates in
answering Paper II have their origins in a poor understanding of the basics
and foundational competencies taught and learnt in the earlier grades (DBE,
2015). This is confirmed by Blackett and Tall (1991) who state that the initial
stages of learning trigonometry functions are filled with difficulty.
A lack of knowledge that a trigonometry ratio is equal to some numeric value;
The inability to recall reduction formulae and all other trigonometry identities;

3
The inability to relate angles in a diagram and the inability to provide
justification for statements.
The item-by-item analysis revealed that many candidates were mostly familiar
with routine type questions. Candidates showed confidence in dealing with
work that they had seen previously. They struggled with concepts in the
curriculum that required deeper conceptual understanding.
Questions where candidates had to interpret information or provide
justification, presented the most challenges. This is in agreement with
(Zaslavsky, 2008) who says that students have difficulty in interpreting graphs
of functions.
The problems stated in the Deapartment of Basic Education Diagnostic report (2015)
have also been variously described in other articles where it is said students have
problems with:
The process-object duality: students often find it difficult to perceive a
mathematical concept both on an operational process and a structural object
side of it (Gray & Tall, 1994).
Connections: students have difficulties in making connections between the
representations of the concepts (Brown, 2005; Weber, 2005; Challenger,
2009).
Variables: students often misunderstand the concept of variables and how
variables help them construct mathematical meanings (Graham & Thomas,
2000).
The main reasons related to these problems can be attributed to the conventional
method of teaching and learning of trigonometry functions. Firstly, as stated above,
the initial stages of learning trigonometry functions are filled with difficulty (Blackett &
Tall, 1991). This is because students are normally introduced to trigonometry
function using definitions as the ratios of the lengths of sides in a right angled
triangle (Pritchard & Simpson, 1999). Secondly, trigonometry functions are often
taught as a completely mechanical series of routines, without engaging students in
any non-routine mathematical thinking (Breidenbach, Dubinsky, Hawks, & Nichols,
1992). This could give the impression that the numerical procedures are the only

4
ways to get accurate results causing a possible disconnection between the use of
different contexts (right angled triangles, the unit circle and the graphs) of
trigonometry functions (Blackett & Tall, 1991). This is in agreement with Moore
(2009) who stated that in order to address this dilemma, firstly, trigonometry should
be taught with the emphasis on the connections of their contexts as opposed to the
current situation (traditional form of teaching) where it is presented as separate
contexts of right angled triangles, the unit circle and the graphs. Moreover, the
traditional form of teaching is teacher-focused, is also based on rote-learning and
memorisation (Molefe & Brodie, 2010; Addelman, 2012). The above stated problems
that students face will continue unless there are possible interventions that educators
adopt to replace or augment the traditional form of instruction in classrooms (DBE,
2013). Information and Communication Technology (ICT) is proposed here as such
an intervention that can be used to facilitate the teaching and learning of
trigonometry functions.
ICT has become an essential tool in the teaching and learning of mathematics,
especially in understanding mathematical concepts (Hohenwarter & Jones, 2007)
and in helping improve students’ marks on standardised tests (Bain & Ross, 1999).
ICT can facilitate mathematical problem solving, communication, as well as
reasoning and proof. ICT can also provide students with opportunities to explore
different representations of mathematical ideas and support them in making
connections/relationships among different representations of mathematics (Kaput,
1992; NRC, 2000).
In line with the above, many governments have embarked on information
technology-related programmes being developed for integration into school curricula
(Hew & Brush, 2007). In South Africa, for example, a government policy was
introduced in 1994 to ensure that all schools have access to computers (DBE, 2004;
Mdlongwa, 2012). This policy has recorded some progress over the years. Projects
such as the Khanya Project of the Western Cape (Western Cape Education
Department & Africa, 2001), the ‘Gauteng Online’ in Gauteng, as well as the
Northern Cape’s Connectivity Project have come up (DBE, 2004). In addition, by
2007, approximately 22 000 educators had been trained to use computers and an
educational portal known as Thutong, giving educators access to a range of quality
curricula, learner support material, and professional development programmes was

5
introduced by the South African government (Pandor, 2007). Also, computers (some
with internet access) were donated to some schools across the country (Pandor,
2007; Mdlongwa, 2012).
In this digital/information era, students are constantly exposed to and actively
involved in the use of ICT in their everyday lives (Lopez-Morteo & Lopez, 2007).
Research shows that many students exposed to ICT advocate for its integration into
mathematics teaching and learning (De Villiers, 2004) and seem to be more
motivated to learn (Tall, 2000; Shelly, Cashman, Gunter, & Gunter, 2008). Thus,
effective integration of ICT in teaching and learning is crucial and non-avoidable.
Over the past few years, several studies have documented successful integration of
ICT in teaching and learning (Wilson-Strydom & Thomson, 2005; Ogbonnaya, 2010).
In South Africa, many studies have been conducted on the use of ICT in the teaching
and learning of mathematics (Jaffer, Ng'ambi, & Czerniewicz, 2007; Ogbonnaya,
2010; Stols, 2011). From the review of literature carried out, it was found that no
study, in South Africa, focused specifically on the use of ICT in the teaching and
learning of trigonometry functions. Thus, this study focused on assessing the
effectiveness of using ICT in the teaching and learning of trigonometry functions at
two South African schools while the instruction focused on the three contexts and
representations (the right angled triangles, the unit circle and the graphs) as well as
the connections among them.
1.2 STATEMENT OF THE PROBLEM
As a researcher with many years of teaching grade 12 mathematics, witnessing the
students’ continual low performance in mathematics, with the students always
complaining of the difficulty they experience in comprehending trigonometry
functions, the researcher has been prompted to investigate possible alternative ways
of teaching trigonometry functions.
In 2011, in the international mathematics performance assessments of Trends in
International Mathematics and Science Studies (TIMMS), South Africa was the
second lowest performing country with an average scale score of 352 while the
international average was 500 (TIMSS, 2011). Even though by 2015 South Africa’s
scale score improved to 372, it was still among the lowest performing countries

6
(Reddy et al., 2016). The problem of performance in mathematics is more apparent
in the matric results of 2015, which were at the lowest in 4 years. (See Table1.1).
The National Senior Certificate Examination (2015) diagnostic report stated that
some of the problems that were reported in trigonometry functions include the
following:
Students found the interpretation of trigonometry graphs to be very
challenging. A number of students were unable to identify which was the sine
function and which was the cosine function in the sketches.
It is evident that students were not aware of the transformations that are
applied to the basic trigonometry functions and how these transformations
impact on the equation of a trigonometry function.
Many students were able to correctly identify the critical values for the
required interval but used the incorrect notation. They included the endpoints
when the question required determining the interval for which f (x) > g(x).
Many students could not describe the transformation (DBE, 2015).
ICT has been said to be an intervention that can hasten the students’ learning of
functions and their properties (Demir, 2012). Thus, the study investigated the
effectiveness of the use of ICT in the teaching and learning of trigonometry functions
to grade 12 students. This study also provided an integrated method of introducing
trigonometry functions by addressing the three trigonometry functions contexts and
representations (the right angled triangles, the unit circle and the graphs) and the
connections among them.
1.3 RATIONALE FOR THE STUDY
It has been said that ICT use promotes cooperative learning and students’ active
participation (Rodrigo, 2001). It also reduces the load from teachers and encourages
creative learning from students. This leads to educators having more time to work
with students individually and in groups. This has been of interest to me as a grade
12 educator considering the large number of students we have to deal with in the
classrooms on a daily basis. This could enable educators to spend more time
assisting students individually.
7
Students spend more time on their mobile phones (a form of ICT) than on books.
This is why in many school policies, mobile phones are not allowed in the school
premises. However, because of the students’ preference for ICT, ICT could be used
to channel academic work. This is the reason why the DBE, together with various
donor institutions, have provided computers and tablets to schools to be used for
teaching and learning of various subjects.
1.4 SIGNIFICANCE OF THE STUDY
This study is significant for two main reasons. Firstly, the study was inspired by the
need to find an alternative approach to teaching mathematics so as to improve
students’ performance. It attempts to determine an effective way of teaching and
learning trigonometry functions. It does this by using a method of teaching
trigonometry functions which is based on addressing the three contexts of
trigonometry and the connections among them. ICT is used as a mediating tool (see
Figure 2.3) in the teaching and learning process.
Secondly, only a few studies have dealt with evaluating the effectiveness of using
ICT in teaching and learning of trigonometry functions, although it has often been
reported as a difficult topic for students (Brown, 2005; Weber, 2005; Demir, 2012).
Since research on the use of ICT in the teaching of trigonometry in the classroom is
sparse and quite limited, this study addresses that gap.
1.5 RESEARCH QUESTIONS
The main question addressed by this study is: what is the effect of ICT on students’
learning of trigonometry functions? To answer the main question the following sub-
questions were posed:
I. Does the use of ICT in the teaching and learning of trigonometry
functions have an effect on students making connections between
representations of trigonometry functions?
II. Does the use of ICT in the teaching and learning of trigonometry
functions have an effect on students’ analysis and interpretations of
trigonometry functions?

8
III. Does the use of ICT in the teaching and learning of trigonometry
functions have an effect on students’ learning of transformation of
trigonometry functions?
IV. Does the use of ICT in the teaching and learning of trigonometry
functions have an effect on students’ derivation of general and specific
solutions of trigonometry functions?
V. Does the teaching and learning of trigonometry functions with ICT have
an effect on students’ (creation and learning of) proofs of trigonometry
functions identities?
1.6 HYPOTHESES
The following null hypotheses were formulated
Null Hypothesis (H0)1: The use of ICT in the teaching and learning of trigonometry
functions has no statistically significant difference on students making connections
on multiple representations of trigonometry functions.
Null Hypothesis (H0)2: The use of ICT in the teaching and learning of trigonometry
functions has no statistically significant difference in the analysis and interpretations
of trigonometry functions.
Null Hypothesis (H0)3: The use of ICT in the teaching and learning of trigonometry
functions has no statistically significant difference on students’ learning of
transformation of trigonometry functions.
Null Hypothesis (H0)4: The use of ICT in the teaching and learning of trigonometry
functions has no statistically significant difference on students’ derivation of general
and specific solutions of trigonometry functions.
Null Hypothesis (H0)5: The use of ICT in the teaching and learning of trigonometry
functions has no statistically significant difference on students (creation and learning
of) proofs of trigonometry functions identities.
1.7 SCOPE AND LIMITATIONS OF THE STUDY
The current research was conducted in two schools with a total of 305 mathematics
grade 12 students. The schools are located in the Ngaka Modiri Molema district in
Mafikeng in the North West province. Of the 305 students only 61 students, whose

9
classes were allowed to participate in the study from the two schools, took part in the
study. A total of 34 students were in the control group and 27 were in the
experimental group. The choice of the schools was due to their availability and
proximity to the researcher.
There were limitations to the study.
The research did not consider the qualification of the teachers involved in the
study;
The research was a small–scale study, thus the results could not be
generalised beyond the schools;
Since the students had to prepare for final national examinations, the time
allotted for the study was very short.
1.8 DEFINITION OF TERMS
Computer Algebra System (CAS): A computer software package comprising a set
of algorithms for performing symbolic manipulation on algebraic objects, a language
to implement them, and an environment in which to use the language.
Dynamic Geometry Software (DGS): A dynamic geometry (DG) program is a
computer program for interactive creation and manipulation of geometric
constructions. A characteristic feature of such programs is that they build a
geometric model of objects, such as points, lines, circles, etc., together with the
dependencies that may relate the objects to each other. The user can manipulate the
model by moving some of its parts, and the program accordingly – and instantly –
changes the other parts, so that the constraints are preserved (Bantchev, 2010).
Dynamic mathematics software (DMS): This is a software that combines DGS with
some of the features of CAS and therefore, allowing for bridging the gap between the
mathematical disciplines of geometry, algebra, and even calculus (Hohenwarter &
Jones, 2007).
Functions: these are relations between sets of inputs and sets of permissible
outputs, with the property that each input is related to exactly one output
Geogebra: Geogebra is a DMS, that is, it is both a computer algebra system (CAS)
and dynamic geometry software (DGS) because it includes both symbolic and

10
visualization features related to coordinates, equations and functions, along with
geometric concepts and dynamic relations (Zengin, Furkan, & Kutluca, 2012).
Information and Communication Technology (ICT): ICT refers to an umbrella
term that includes any communication device or application, encompassing: radio,
television, calculators, cellular phones, computer and network hardware and
software, satellite systems and so on as well as the various services and
applications associated with them, such as video-conferencing and distance
learning.
Learning: This is the act of acquiring new, or modifying and reinforcing existing
knowledge, behaviours, skills, values, or preferences and may involve synthesizing
different types of information.
Mathematics: is a language that makes use of symbols and notations for describing
algebraic, geometric and graphical relationships. It is a human activity that involving
observing, representing and investigating patterns relationships in physical and
social phenomena and between mathematical objects themselves. It helps to
develop mental processes that enhance logical and critical thinking, accuracy and
problem solving that will contribute in decision-making. Mathematical problem
solving enables us to understand the world (physical, economic and social) around
us, and, most of all, to teach us to think creatively (DBE, 2011).
Matric: The National Senior Certificate (NSC) examinations commonly referred to as
“matric” has become an annual event of major public significance. It not only denotes
the finale of twelve years of formal schooling, but also reflects the nature of the
national academic aptitude.
Nonequivalent control group design: An experimental design involving at least
two groups, both of which may be pretested: one group receives the experimental
treatment, and both groups are post-tested. Individuals are not randomly assigned to
treatments.
Teaching: this is the process of attending to people’s needs, experiences and
feelings, and making specific interventions to help them learn particular things.
Trigonometry (Trigonometry): Trigonometry functions describe relations between
sides of triangles and the angles between the sides. Trigonometry functions

11
developed as a branch of geometry. The branch of mathematics dealing with the
relations of the sides and angles of triangles and with the relevant functions of any
angles.
1.9 STRUCTURE OF THESIS
Chapter 1 provides an overview of the research study. This chapter provides the
introduction and the background to the research, the problem statement, the
rationale and significance of the study, the research questions, clarification of
abbreviations and the terminology used in the study.
Chapter 2 gives the conceptual framework which provides a basis and direction for
the whole research study, as well as the review of the literature relevant to the study.
This starts with the descriptions of APOS theory and the Activity theory. Both of
these theories are used in the design and implementation of teaching and learning in
the classroom using ICT (Geogebra software in this study). Geogebra and
trigonometry are important aspects of the study, therefore theoretical considerations
of both are provided. The chapter ends with a review of literature on ICT in teaching
and learning of Mathematics and ICT in the teaching and learning of trigonometry
functions.
Chapter 3 discusses the methodology that is the approach that is taken in
conducting the current study. This therefore includes the paradigm, which informed
the study, the research design and the research methods (e.g. the study sample and
population, the procedure for conducting the research and the research instruments,
the different instructional methods used in the experimental and control groups, data
analysis and the ethical considerations).
Chapter 4 This Chapter presents the findings of the study. The statistical package
SPSS is used to analyze the data collected from the two instruments, (pre-test and
post-test) on the two groups. The descriptive and inferential statistical analyses are
determined and interpreted in order to respond to the research questions.
Chapter 5 This gives the summary to the findings, a discussion of the findings, a
conclusion and recommendations from the study.

12
1.10 SUMMARY OF THE CHAPTER
In this chapter the need for a new or alternative method of teaching and learning
trigonometry functions was highlighted. From that need, an alternative method
integrating ICT, based on AT and APOS was presented. Reasons for carrying out
this research were explained in the background and rationale for the study. A brief
literature review was given in the background. The statement of the problem and the
significance of the study followed. The questions and hypothesis to be tested during
the study were then posed and stated. Lastly, an outline of the thesis chapters was
given.

13
CHAPTER TWO
THEORETICAL FRAMEWORK AND REVIEW OF LITERATURE
This chapter presents the theoretical basis of the study. Two theoretical frameworks:
the Action, Process, Object and Schema (APOS) together with the Activity Theory
(AT) are discussed separately and their integration in and for the study follows.
These frameworks acted as the basis for constructing the classroom environment,
the instructional process and sequence as well as how the study was implemented.
The chapter also provides a review of literature on studies relating to ICT in teaching
and learning.
2.1 THEORETICAL FRAMEWORKS
A large number of theoretical frameworks from different paradigms exist and are
being used for research in mathematics and other fields to inform the way in which
learning occurs (NRC, 2001, 2009; Miller, 2011; NCTM, 2014). This affects the way
research on teaching and learning, as well as the results thereof can be
conceptualised. Integrating the view points from the different theoretical frameworks
has the potential to explain what a singular perspective may not, thereby giving more
insight into how students learn and may thus assist in improving the mathematics
classroom interaction (Arzarello, Bosch, Lenfant, & Prediger, 2007).
The two theoretical frameworks: Action, Process, Object and Schema (APOS) (a
constructivist theory) and the Activity Theory (AT) (a socio-cultural and socio
historical theory) were chosen for this study. Both of these theories are prominent in
mathematics and ICT education research (Dubinsky & McDonald, 2001; Russell,
2002). These theories are discussed separately in sections 2.1.1 and 2.1.2 and then
brought together in section 2.1.3 to show their possible roles in this study.
2.1.1 APOS THEORY
The APOS theory is a general theory of mathematical conception and its acquisition.
The theory focuses on the mental constructions (abstractions) that can be made by
the students during instructional phases in their attempt to understand mathematical
concepts (Dubinsky & McDonald, 2001). Basic to APOS theory is that all
mathematical conception can be understood as actions, processes, objects and

14
schemas (APOS). These are mental structures that students use to make sense of a
given mathematical concept (Bowie, 2000).
The four components of APOS are defined below:
Action: an action is a repeatable physical or mental manipulation that
transforms objects. In the case of a trigonometry function, for example, an
action conception is shown by a learner evaluating a function at a point.
Process: a process is an action that takes place entirely in the mind.
Object: the distinction between a process and an object is drawn by stating that
a process becomes an object when it is perceived as an entity upon which
actions and processes can be made.
Schema: a schema is a more or less rational collection of cognitive objects and
internal processes for manipulating these objects. A schema could aid students
to comprehend, deal with, organize, or make sense out of a perceived problem
situation (Dubinsky, 1991).
APOS theory has its source in the Piaget’s constructivist theory (Arnon, Cottrill,
Dubinsky, Oktaç, Fuentes, Trigueros, & Weller, 2014). Underlying Piaget’s theory
were three modes of abstraction: empirical abstraction, pseudo-empirical
abstraction, and reflective abstraction (Dubinsky, 1991). APOS grows largely from
Dubinsky’s attempt to elaborate on Piaget’s notion of the latter (Dubinsky, 1991). In
fact, Piaget regarded the acquisition of mathematical cognition to be associated with
reflective abstraction (Brijlall & Maharaj, 2004). Reflective abstraction is understood
as the construction of logico-mathematical structures by a learner during the process
of cognitive development (Dubinsky, 1991). The five types of construction in
reflective abstraction as explained by Dubinsky (1991) are:
Interiorization: the ability to apply symbols, language, pictures and mental
images to construct internal processes as a way of making sense out of
perceived phenomena. Actions on objects are interiorized into a system of
operations;
Coordination: two or more processes are coordinated to form a new process;
Encapsulation: the ability to conceive a previous process as an object;
Generalization: the ability to apply existing schema to a wider range of
contexts;

15
Reversal: the ability to reverse thought processes of previously interiorized
processes
The main mental mechanisms for building mental constructions (structures)
according to APOS are called interiorization and encapsulation (Dubinsky, 2010). An
action conception can become a process conception through a mental mechanism
called interiorization. Then, the student can think about the result of the process
without actually having done it and, in particular, can imagine reversing the process.
A student who has an object conception of a mathematical idea can imagine it in its
entirety and, in particular, can act on it with higher-level actions or processes.
Processes can be encapsulated into objects, and it is sometimes useful if the student
is able to de-encapsulate an object to focus on the underlying process. Schemas are
coordinated collections of actions, processes, objects, and other schemas, which
can themselves be encapsulated into objects (Arnawa, Sumarno, Kartasasmita, &
Baskoro, 2007).
Asiala et al., (1996) proposed a specific framework for APOS: theory-centered
research and curriculum development. The framework consists of the following three
components: theoretical analysis; instructional treatment based on this theoretical
analysis; collection and analysis of data to test and refine the theoretical analysis
and instruction (Dubinsky & McDonald, 2001) in Figure 2.1. The theoretical analysis
occurs relative to the researcher’s knowledge of the concepts in the research
problem and knowledge of APOS Theory (Asiala, Brown, De Vries, Dubinsky,
Mathews, & Thomas, 1996).
Figure 2.1: General Framework for APOS Research (Adapted from Dubinsky &
McDonald, 2001).

16
This theoretical analysis helps to predict the mental structures that are required to
learn the trigonometry functions concept. For a given mathematical concept, the
theoretical analysis informs the design and implementation of instruction. These are
then used for collection and analysis of data. The theoretical analysis guides the
design and implementation of the teaching and learning of trigonometry functions, as
indicated in Table 2.1.
Table 2.1: APOS as it pertains to this study
Cognitive
Level
Characterisations
Action Utilising discrete points of a function: plotting, reading & projecting.
Performing graphs of functions in an analytical context by substituting values in them one by one and by operating the graph of the function based on the evaluation of independent points
Using ICT to type in equations to make the graphs
Process Comparing coefficients or algebraic terms
Investigating graphs, making predictions from previous graphs and trying them on the software
Object Describing and relating properties or behaviour of functions in terms of comparing shapes or contours and looking at a number of graphs several times
Interpreting and relating parts of algebraic expressions or equations
Knowing the rules and properties, students can describe how they transform functions and predict how functions are transformed by looking at the graphs of transformed functions
Making conclusions of the properties of graphs relating to different equations
Making use of properties of functions through ICT
Schema Linking graphic and symbolic forms to construct a precise symbolisation for the information available in the given graph
Having the whole understanding of the concept of how all multiple representations of functions link together
Flexibly using ICT to present their concept of function
Adapted from: Lu Yu-Wen, 2008

17
2.1.2 ACTIVITY THEORY (AT)
Activity Theory (AT) was proposed by Engeström (1987) and is based on the
cultural-historical psychology of Vygotsky. The conception is that a child never
approaches the world empty, rather, every experience the child has is mediated
through socio-cultural tools. He adds that, humans use tools to change the world and
are also transformed through the use of tools (Vygotsky, 1978). This is illustrated in
figure 2.2. This theory is rooted in Kant and Hegel’s philosophy which emphasises
both the historical development of ideas and the active and constructive role of the
human mind (Kuutti, 1995).
Figure 2.2: Basic Vygotskian triangular representation of mediation (Adapted from:
Vygotsky, 1978)
This, however, lacks in articulating the roles and relationship between the individual
and his or her environment in an activity (Hardman, 2005).
AT expands on this to accommodate the socio-cultural structure (elements of the
community, their rules and the division of labour). The Activity Theory is a
philosophical and multidisciplinary framework that can be used to study all forms of
human actions and practices (Spasser, 1999). It is a psychological theory of human
consciousness, thinking and learning (Miettinen, Samra-Fredericks, & Yanow, 2009).
Activity theory postulates that conscious learning arises from activity, not as an
originator of it.
18
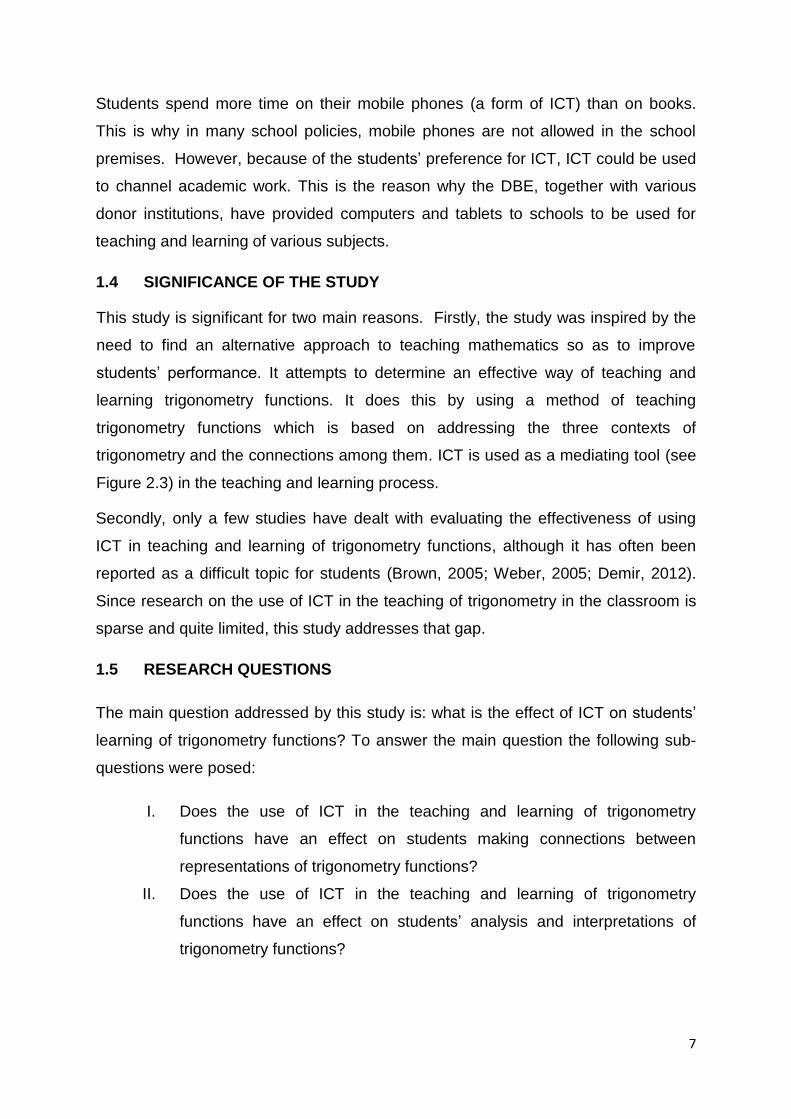
The activity theory cannot be understood or analysed outside the context in which it
occurs. So when analysing human activity, one should examine not only the kinds of
activities that people engage in but also who is engaging in that activity, the rules
and norms that circumscribe the activity, and the larger community in which the
activity occurs (Engeström, 1987). These form parts of the main structure (the
Activity System) as shown in Figure 2.3.
Figure 2.3: Components of the Activity System (Adapted from: Engeström, 1987)
As shown in Figure 2.3, all the components of AT influence each other. For example,
the object is transformed in the course of activity, and it in turn transforms the
activity. Tools alter the activity that they are in and are in turn transformed by the
activity. These are also briefly described and explained in Table 2.2.

19
TABLE 2.2: General description of the components of AT
AT CONCEPTS DESCRIPTIONS
SUBJECT An individual or individuals acting on an object
INSTRUMENTS/TOOLS Anything used in the transformation process
OBJECT The physical or mental product that is sought. The
object is acted upon by the subject. It represents the
intention that motivates the activity
COMMUNITY Consists of the interdependent aggregates who
share (at least to some degree) a set of social
meanings.
RULES Inherently guide the actions acceptable to the
community, so the tools that the community use will
mediate the process
DIVISION OF LABOUR Prescribes the task specialization by individuals
members in a community. That is, While sharing and
acting on an object there are different roles played by
the community and the subject. These different roles
fall under division of labour.
OUTCOME form of instruction that is developed and
implemented
Adapted from: Hardman, 2008
An activity (Activity System) consists of a goal-directed hierarchy of actions that are
used to transform the object (Jonassen & Rohrer-Murphy, 1999). Activities comprise
of chains of actions, while actions, in turn consist of sets of operations as shown in
Figure 2.4. The relationship between activities, actions, and operations is dynamic.

20
For example, all operations are actions when first performed because they require
conscious effort to perform. With practice and internalization, activities collapse into
actions and eventually into operations, as they become more automatic, requiring
less conscious effort. In reverse, operations can be disrupted and become actions
(Jonassen & Rohrer-Murphy, 1999).
Activity - Object/ Motive
Action - Goal
Operation - Conditions
Figure 2.4: Activity, Actions and Operations (Adapted from: Jonassen & Rohrer-
Murphy, 1999)
Table 2.3 below shows AT as it applies in this study.
Table 2.3: Elements of the Activity Theory in Trigonometry functions
Element An example of the element
Subject or actor Student
Outcome What students can show at the end of the actions
Object Trigonometry equations, expressions, graphs etc.
Tools Geogebra, symbols, mathematics statements and questions
Rules Computer-lab rules, school rules, rules as applicable to
Geogebra
Community Educators, and students.
Division of labour Educators act as instructors and facilitators, students as
enquirers
2.1.3 INTERGRATING THE TWO THEORETICAL PERSPECTIVES
Theoretical approaches can be connected in various ways and degrees: from
complete integration to extreme mutual exclusion (Arzarello et al., 2007). However,

21
at the same time, whatever the choice, the pluralism of independent theories should
be respected (Arzarello et al., 2007). In addition, it has been suggested that
characteristics of different and relevant theoretical perspectives can be merged to
complement each other but still maintain their own identities (Pegg & Tall, 2005). As
such APOS and AT were brought together in this study and their individuality was
still retained.
AT is seen as a strong framework in analysing needs, tasks and outcomes for
designing the constructivist learning environments. This is because the assumptions
of AT are in agreement with those of constructivism, social cognition and situated
learning (Jonassen & Rohrer-Murphy, 1999).
In addition, APOS theory is a prescriptive model for constructing teaching-learning
units and a descriptive model for determining and analyzing the success or failure of
students on a task in relation to their specific mental constructions (Cottrill, Nichols,
Schwingendorf, Thomas, & Vidakovic, 1996). AT, on the other hand, is more of a
descriptive framework than a prescriptive theory. It considers an entire work/activity
system (including teams, organizations, etc.) beyond just one actor or user. It
accounts for the environment, history of the person, culture, role of the artefacts,
motivations, and complexity of real life activity (Nardi, 1995).
The unit of analysis in AT is tool-mediated transformation of an activity system,
while, in contrast, APOS, as being based on a constructivist theory, deals more on
the mental development of the individual in the system. Despite a difference of focus,
the driving force and common point of change, or learning, in both theories is that the
individual and the Activity System with which the two viewpoints deal are
interdependent complex adaptive systems (Nelson, 2002).
The contrast between these two perspectives comes from identifying learning as a
process of individual sense making or as a process of participation in activity. In
other words, students learn as they evolve in their ways of thinking. A sociocultural
perspective identifies learning in terms of the extent to which an individual
participates in the social practices (John-Steiner & Mahn, 1996).

22
2.2 LITERATURE REVIEW
This section presents a review of literature for the study in accordance with the
statement of the problem: Evaluating the effectiveness of the use of Information and
Communication Technology in the Teaching and Learning of Trigonometry functions
In Grade 12.
For this purpose this section was structured into four main subsections:
The mathematical concept of Trigonometry functions;
ICT in teaching and learning;
ICT in the teaching and learning of mathematics and
ICT in the teaching and learning of trigonometry functions.
2.2.1 THE MATHEMATICAL CONCEPT OF TRIGONOMETRY FUNCTIONS
The focus in this section was on trigonometry functions as this is one of the most
important topics in the secondary school curriculum requiring integration of algebraic,
geometric and graphical representations. To ensure that trigonometry functions are
learnt with the integration of their representations, would need one to introduce them
with focus based on connections among the three different contexts of trigonometry
functions:
• Triangle Trigonometry, where trigonometry is based on ratio definitions in right
triangles;
• Unit Circle Trigonometry, where trigonometry functions are defined as
coordinates of points on the unit circle based on rotational angles;
• Trigonometry Function Graphs, where trigonometry functions are defined in the
domain of real numbers (Weber, 2005). In the South African school system, the
trigonometry functions are defined in the domain of angles which are in degrees.
Trigonometry functions are some of the sections in the mathematics curriculum
where students experience acute difficulties in learning (Adamek, Penkalski, &
Valentine, 2005; Brown, 2005; Weber, 2005; Tatar, Okur, & Tuna, 2008; Kutluca &
Baki, 2009; Demir, 2012).
Regardless of the importance of trigonometry functions in the mathematics
curriculum, and the difficulties that students experience with them - little attention has

23
been given to trigonometry and the various ways it is taught in classroom teaching
(Davis, 2005). In addition, research on the teaching and learning of trigonometry,
with or without technological aids, lags behind research conducted in other domains
of mathematics education (Ross, Bruce, & Sibbald, 2011). The interconnectedness
of its contexts could be one of the reasons why it is rarely researched. Another
reason could be due to the different ways in which the domain is expressed (Brown,
2005). Brown, (2005) also states that another possible reason for the scarcity of
research on trigonometry functions could be due to the different ways in which
trigonometry functions are defined in the school curricula.
It is unfortunate that this topic area has been neglected, as not only is it an important
section in the high school mathematics curriculum, but knowledge of trigonometry is
crucial for success in many college/university programs. Understanding trigonometry
functions is a pre-requisite for understanding topics in Newtonian physics,
architecture and many branches of engineering (Weber, 2005). The standards of the
National Council of Teachers of Mathematics (NCTM, 2010) highlight the importance
of trigonometry in the study of functions, particularly periodic functions and
emphasize trigonometry’s utility in investigating real-world phenomena.
2.2.1.1 TRIGONOMETRY FUNCTIONS IN THE SOUTH AFRICAN SCHOOL
SYSTEM
Trigonometry functions are first introduced in grade 10 and continue to grades 11
and 12. Even though students first encounter trigonometry in grade 10, the basic
prior knowledge concepts that they need for trigonometry functions are taught during
the earlier years. These include various triangles and their properties, such as
similar triangles, congruent triangles as well as parallel lines and their properties. At
the end of the final year of grade 12, matric students write 2 mathematics papers
(Papers 1 & 2). Trigonometry functions appear in Paper 2.
The South African curriculum emphasizes the importance of understanding
trigonometry functions concepts and the relationships between the concepts. By the
end of grade 12, the curriculum demands that the students should be able to:
demonstrate the ability to work with various types of trigonometry functions
such as
𝑦 = 𝑠𝑖𝑛𝑘(𝑥 + 𝑝) + 𝑞; 𝑦 = 𝑎𝑐𝑜𝑠𝑘(𝑥 + 𝑝) + 𝑞

24
And be able to make and test conjectures about the effect of the parameters
k, p, a and q for the functions.
Communicate by using descriptions in words, graphs, symbols, tables and
diagrams and be able to convert flexibly between these representations (DBE,
2011).
A summary showing the South African curriculum on trigonometry is given in Table
2.4.
Table 2.4: Overview of Trigonometry functions in Grades 10, 11 & 12
Grade 10 Grade 11 Grade 12
Work with relationships between variables in terms of numerical, graphical, verbal and symbolic representations of functions and convert flexibly between these representations (tables, graphs, words and formulae).
Extend Grade 10 work on the relationships between variables in terms of numerical, graphical, verbal and symbolic representations of functions and convert flexibly between these representations (tables, graphs, words and formulae).
Introduce a more formal definition of a function and extend Grade 11 work on the relationships between variables in terms of numerical, graphical, verbal and symbolic representations of functions and convert flexibly between these representations (tables, graphs, words and formulae).
Generate as many graphs as necessary, initially by means of point-by-point plotting, supported by available technology, to make and test conjectures and hence generalize the effect of the parameter which results in a vertical shift and that which results in a vertical stretch and /or a reflection about the x axis.
Generate as many graphs as necessary, initially by means of point-by-point plotting, supported by available technology, to make and test conjectures and hence generalize the effects of the parameter which results in a horizontal shift and that which results in a horizontal stretch and/or reflection about the y axis.
The inverses of prescribed functions and be aware of the fact that, in the case of many-to-one functions, the domain has to be restricted if the inverse is to be a function.
Problem solving and graph work involving the prescribed functions.
Problem solving and graph work involving the prescribed functions. Average gradient between two points.
Problem solving and graph work involving the prescribed functions (including the logarithmic function).
(a) Definitions of the trigonometry ratios sin θ, cos θ and tan θ in a
right-angled triangles. (b) Extend the definitions of sin θ, cos θ and tan θ to 0o ≤ θ ≤ 360°.
(c) Derive and use values of the trigonometry ratios (without using a calculator for the special angles θ ∈ {0°; 30°; 45°; 60°; 90°}
(d) Define the reciprocals of trigonometry ratios.
(a) Derive and use the identities:
sin θ
tan θ = cos θ and sin2 θ + sin2
θ = 1.
(b) Derive the reduction formulae.
(c) Determine the general solution and / or specific solutions of trigonometry equations.
(d) Establish the sine, cosine and area rules.
Proof and use of the compound angle and double angle identities.
Solve problems in two dimensions.
Solve problems in 2-dimensions. Solve problems in two and three dimensions.
(Adapted from: DBE, 2011)

25
In order to explain the approach normally used for teaching and learning
trigonometry, the researcher used her experience, the CAPS curriculum (see Table
3.1) and CAPS compliant textbooks. The approach used illustrates the traditional
way of teaching trigonometry functions, a method where the contexts of trigonometry
functions are presented and learnt in a sequential or linear format. The method of
teaching and learning in this study emphasises connection of the different contexts
of trigonometry functions, right-angle triangle, the unit circle, and trigonometry
function graphs. A summary of how trigonometry appears in books and CAPS
curriculum follows:
At the beginning, students encounter trigonometry functions with 3 distinct contexts
(Figure 2.5). In the South African curriculum, in the first context, trigonometry
concepts are defined as ratios in right–angle triangles. The important idea is that
trigonometry ratios are useful in setting relationships between angles and side
lengths, and that these ratios can be defined as trigonometry values of angles
(Laridon et al., 2002; Smith, 2012). The right angled triangle deals with angles
between 0° and 90°. Students learn to compute the basic trigonometry functions
(sines, cosines and tangents) given specific side lengths of right triangles (Figure
2.5a). However, at this point in the curriculum the basic trigonometry functions are
not treated as functions, but only as ratios. Students encounter trigonometry
functions later in the curriculum in the context of the unit circle, where the
hypotenuse is defined as the radius, r, of the unit circle (Figure 2.5b). This is where
the rotation of the terminal arm moves in such a way that the angles go beyond 90°
to beyond 360° and in the reverse direction to form negative angles. Later, the third
context- the graphs are introduced using the formulae and the table method (Figure
2.5c) In South Africa, the Cartesian plane represents trigonometry functions where
the independent variable/domain represents angles measured in degrees, and the
dependent variable represents the sine, cosine, or tangent of the angle (Laridon et
al., 2002).
It seems that there are two primary challenges for students studying trigonometry
functions starting with the ratios defined from right triangles. Initially, when students
study sine, cosine and tangent ratios in right triangle trigonometry, the connections
between geometric figures and numerical relationships create challenges for
students in making connections between other different representations (Thompson,

26
Carlson, & Silverman, 2007; Thompson, 2008; Bressoud, 2010). That means, the
transition from studying sine, cosine and tangent ratios on right-angled triangles to
studying sine, cosine and tangent functions on the unit circle and then on the
Cartesian plane seems to be difficult for students.
Figure 2.5: Some of the trigonometry representations/ contexts (Adapted from: Dejarnette, 2014)
The difficult transition from right triangle trigonometry to the unit circle is especially
problematic given that the unit circle provides the basis for understanding
trigonometry functions. In addition, according to Thompson (2008) students who first
encounter trigonometry functions as ratios in right triangles are more disposed
incorrectly to think that trigonometry functions take the sides of right triangles, rather
than angles, as their inputs.
2.2.1.2 RESEARCH ON THE TEACHING AND LEARNING OF
TRIGONOMETRY FUNCTIONS
Despite the documented problems students have with learning trigonometry
functions, the literature in this area is still sparse (Weber, 2005; Moore, 2010). To
reiterate, research on the teaching and learning of trigonometry, with or without
technological aids, lags behind research conducted in other domains of mathematics
education (Ross, Bruce, & Sibbald, 2011).
Research into students’ learning of trigonometry functions has focused on identifying
teaching activities to support students to depart from the traditional form of teaching

27
and learning through memorization of isolated facts and procedures and paper-and-
pencil tests– towards programs that emphasize conceptual understanding, multiple
representations and connections together with mathematical modeling (Hirsch,
Weinhold, & Nichols, 1991). For example, in one of a few studies which investigated
students’ understanding of trigonometry functions, Weber (2005) studied two groups
of college students on their understanding of trigonometry functions. The
experimental group was taught using instructional sequence based on Tall’s (2009)
notion of procepts and the current process/object theories of learning while the
control group was taught using the lecture method of teaching. The teaching and
learning sequence involved activities which were mostly hands-on, for example,
using protractors and rulers. Students constructed unit circles, drew angles and
related line segments corresponding to their trigonometry values. The experimental
group of students performed much better than the control group in the post-test.
However, from the types of questions asked, it became obvious that the
experimental students would perform better, since they would have been taught in
this direction within the instructional design. For example, one of the test items
examined students’ estimation of a trigonometry function value, and the control
group did not performed as well as the experimental group. Considering that these
types of tasks are not normally included in the traditional discourse and they were
presented in the experimental group, it would be expected that the experimental
group would outperform the control students.
Even though the unit circle method was shown to be more effective than the
traditional method in the teaching and learning of trigonometry, it cannot be said that
it would lead to successful student learning in all forms of trigonometry. This was
confirmed by the findings of the research conducted by Kendal and Stacey (1997),
where students who first learnt with the right triangle model perfomed better than the
students who were first introduced to trigonometry functions through unit circle
method. However, since Kendall and Stacey (1997) assessed students’ learning with
problems of solving triangles. It follows that the students taught using the right
angled triangle method would get better results on solving triangle tasks.
From the studies of Kendal and Stacey (1997) and of Weber (2005) one can deduce
that performance is directly proportional to the main focus in teaching or aspects
emphasised in the lesson design.

28
Brown (2005) developed a model on students’ understanding of sine and cosine
functions of angles measured in degrees. From her model, the trigonometry
functions were first taught using the triangle context, followed by the co-ordinate
system, moving onto the unit circle context and onto the graphical representations. It
should be stated that the steps of introducing the trigonometry function concepts in
her model, were non-sequential or they were non-linear. Brown (2005) asserted that
students who developed the most robust understanding were able to work with the
sine and cosine in a way that connects the three contexts of trigonometry functions.
2.2.2 ICT IN TEACHING AND LEARNING
During the 1990s, Information Technology (IT) was a term reserved for computers
and other electronic data handling and storage devices used to provide speedy
automatic functions, capacity and range (Monaghan, 1993; Andrews, 1996 ). More
recently, the term ‘communication’ has been incorporated to acknowledge the
increase in interaction between people and technology; this is widely known as
Information and Communication Technology (ICT) (Kennewell, 2004). Kennewell,
(2004) explains that the term ICT covers all aspects of computers, networks
(including the internet) and certain other devices with information storage and
processing capacity, such as calculators, mobile phones and automate control
devices. In this study, the term ICT is used to refer to new technologies with an
emphasis on communication.
In a move from the traditional form of teaching, many educational institutions and
scholars have taken into consideration the potential of ICT in teaching and learning.
There has been an increasing awareness that interactions between humans and ICT
can facilitate effective teaching and learning (Arcavi, 2003; Hennessy, Ruthven, &
Brindley, 2005). The great potential of ICT in mathematics education is in that it is
bringing transformation and new possibilities in teaching and learning. ICT
integration in mathematics teaching and learning enables mathematical
investigations by students and educators, supports conceptual development of
mathematics, and thus influences how mathematics is taught and learnt (Wilson &
Lowry, 2000). Using ICT in teaching and learning has also been found to:
Promote learner’s higher-order learning skills (Lincoln, 2008);
Develop and maintain students’ computation and communication skills;

29
Introduce students to collection and analysis of data;
Facilitate students’ algebraic and geometric thinking;
Show students the role of mathematics in an interdisciplinary setting
(Mistretta, 2005).
Technological tools (ICT) such as computers and calculators can overhaul the
existing traditional mathematics instruction by providing more powerful mathematical
problem-solving and graphing opportunities and offering new possibilities in the
learning and teaching of mathematics (Fey, 1989; Heid, 1998; Hennessy, Fung, &
Scanlon, 2001). Wright (2005) asserts that ICT, particularly mathematical software,
helps to provide better visual and dynamic representations of abstract ideas and the
links between symbols, variables and graphs. Consequently, the study investigated
the ways in which students learn trigonometry functions by using ICT.
The use of computers as a tool facilitates communication among students and
encourages them to play a more active role in a lesson (Tarmizi, Ayub, Bakar, &
Yunus, 2010). Tarmizi et al., (2010) further highlight that the role of students in a
computer-oriented lesson is to actively generate, process, and manipulate
knowledge. The use of ICT enables more students to be active processors of
knowledge, to appropriately sort out the given knowledge and to be able to act
accordingly on the knowledge being considered than would be the case in typical
teacher-led lessons. Students are in a position to define their goals, make design
decisions and evaluate their progress through the aid of computers (Tarmizi et al.,
2010).
In an ICT integrated teaching and learning environment, the teacher’s role changes
and they are no longer the centre of attention and information as providers of
knowledge, but rather they play the role of facilitators. As students work on their
computer-supported products, the teacher provides necessary assistance and
guides them through the activities and stages of a lesson by monitoring what they
are doing during the lesson.
The use of ICT in education can enhance meaningful learning better than the
traditional classroom instructions. The ICT can engage a wider range of aptitudes,
connecting academic work with the real world, supporting interaction, offering
dynamic displays, multiple and linked representations, interactive models,

30
simulations, the storage and retrieval of multiple categorized information (Ashburn &
Floden, 2006). In this way, by integrating ICT into the teaching and learning process,
educators aim to increase students’ abilities to understand complex ideas and learn
challenging content.
2.2.3 ICT IN TEACHING AND LEARNING OF MATHEMATICS
One of the major goals in mathematics teaching and learning is to ensure that all
students achieve favourable outcomes. Mathematics is considered as one of the
most challenging and problematic subjects in the education system. But at the same
time it is one of the most important and rewarding areas of science, given that
mathematical skills and knowledge are important in everyday life, and there are also
many mathematical applications in other subjects and sciences (Christy, 1993). For
these reasons, mathematics is a subject which should be taken seriously. Many
students find it difficult to engage with mathematical concepts. For learning to take
place, students need to be actively engaged with the explored concepts or objects –
whether abstract or concrete (Liang & Sedig, 2010).
According to Duval (1999), mathematical activity has two sides:
the visible side which is the mathematical objects; mathematical objects are
abstract and not amenable to any concrete imagination or manipulation; they
are immaterial, not tangible and directly accessible to our thinking like the
physical objects (Chiappini & Bottino, 1999) and
the cognitive operations or procedures; the cognitive operations are also a
difficult part of mathematical activities for students, given that very often
teachers attach more importance to the mathematical processes than to their
applications to daily life situations or to physical problems (Duval, 1999). This
leads students to solve problems mechanically, by following the algorithm
steps without real awareness of their actual meaning (Milovanović, Takači, &
Milajić, 2011).
ICT is useful in helping students to perceive mathematics not only as a set of
procedures, but more as reasoning, exploring, discovering, solving problems,
generating new information and asking new questions. Furthermore, ICT helps them
to better visualize certain mathematical concepts (Van Voorst, 1999). Studies have

31
revealed that activities encouraging the construction of images can greatly enhance
mathematics learning (Wheatley & Brown, 1994).
Greeno and Hall (1997) made several observations about the importance of
representations, concluding that:
- computer technologies are powerful tools for thinking;
- the learning of mathematical concepts and procedures is enhanced when
students can make connections among different representations;
- they can give students useful tools for building communicating information and
demonstrating reasoning (Greeno & Hall, 1997).
Ashburn and Floden (2006) also emphasize the importance of using technology in
mathematics, noting that tools that instantly relate the graphical and symbolic
representations of mathematical expressions can help make understanding goals
more accessible to students. Models that make intangible perceptions visible and
interactive can help students comprehend the nature and application of fundamental
concepts (Ashburn & Floden, 2006).
There are several studies which investigated the integration of ICT into the different
topical areas of mathematics teaching and learning (Gonzales & Herbst, 2009;
Hoyles & Lagrande, 2010; Liang & Sedig, 2010; Milovanović et al., 2011; Lotfi &
Mafi, 2012) concluding that ICT can help to visualize and represent better the
mathematical objects and procedures by exploring different graphical
representations.
However, some studies have found no significant impact of using ICT in the teaching
and learning of mathematics (Smith & Hardman, 2014). In a Cape Town study, the
impact of computer contribution on performance of school leavers Senior Certificate
mathematics scores was investigated across 31 schools in the Education
Management and Development Centre (EMDC) East education district of Cape
Town, South Africa. This was done by comparing the performance between two
groups: a control and an experimental group (Smith & Hardman, 2014). The
experimental group (14 high schools) had access to computers from 2001 while the
control schools, as part of the Khanya project, received computers between 2006
and early 2007. The experimental schools could be expected to be more immersed
in computer technology than the control schools. Findings indicated that there was

32
no significant difference between the final Senior Certificate mathematics results of
the schools with the computers and those without; no significant change in the
results after the Khanya labs were installed; no significant change in the percentage
of students that passed Senior Certificate Mathematics; and no significant change in
Mathematics enrolment rates. These findings point to the need for caution in the
implementation of ICT’s into schools as a potential panacea for mathematical failure
in our context. Hardman (2008) recommended that further work be done to provide
a better picture in the usage of ICT.
2.2.3.1 SOFTWARE USED IN TEACHING MATHEMATICS
Some software giving students some freedom to investigate and express their own
ideas, but constrained in ways so as to focus their attention on the mathematics is
needed (Hoyles, 2001). Although using virtual manipulatives might be convenient for
teachers, their limitation of mathematical experiments to a certain range of activities
and topics are obvious. Therefore, many teachers use educational software
packages that allow more flexibility and enable both teachers and students to
visualize and explore mathematical concepts in their own creative ways (Barzel,
2007).
The awareness of integrating graphical, numerical and algebraic representations has
become noticeable in recent years. Numerous studies note that ICT positively
influences students’ understanding of mathematical concepts and attitudes towards
mathematics (Dwyer, 1994; Ogbonnaya, 2010). This is so because ICT appears to
symbolize the concept of functions in terms of the strong connection among their
representations (Ruthven, 1990; Penglase & Arnold, 1996). Possibly it is for this
reason that Raines and Clarke (2011) argue that students working with appropriate
software can work with more graphs in a short space of time. This is corroborated by
Hennessy et al. (2001) who state that because ICT software speeds up the graphing
process, this frees students to analyse and reflect on the relationships between
graphs and their patterns. In addition to this Raines and Clarke (2011), state that
computers seemingly enable students to participate fully in class.
Mostly, there are several types of software used in the teaching of mathematics:
Computer Algebra System (CAS), Dynamic Geometry Software (DGS)
Spreadsheets, etc. (such as GSP, Cabri-géomètre), and open source software-Java

33
Applets, Geogebra (Laborde, 2001; Strässer, 2001; Kokol-Voljc, 2003; Laborde,
2003, 2007). Each software type is normally associated with particular aspects of
mathematical teaching and learning. For example, CAS is often used for teaching
algebraic topics, whilst DGS programmes are used for geometrical topics
(Schneider, Carnoy, Kilpatrick, Schmidt, & Shavelson, 2007). However, such
distinctions are not always clear with considerable overlap due to the duality of
mathematics in terms of geometry and algebra. Schumann and Green (2000) state
that graphical, numerical and algebraic contexts should not be considered
separately, but rather as constituting a holistic comprehensive computer-aided
approach.
Trigonometry is a topic in geometry that involves both geometry and algebra, thus a
need to use software that includes both features. A dynamic mathematics software
(DMS) package, n amely Geogebra, was used as a tool in this study.
Geogebra is a dynamic mathematics software (DMS) designed for teaching and
learning mathematics in secondary school and at college/university level. The
software combines the ease of use of a dynamic geometry software (DGS) with
certain features of a computer algebra system (CAS) and therefore, allows for
bridging the gap between the mathematical disciplines of geometry, algebra, and
even calculus (Hohenwarter & Jones, 2007). it includes both symbolic and
visualization features related to coordinates, equations and functions, along with
geometric concepts and dynamic relations (Hohenwater & Fuchs, 2004; Zengin et
al., 2012). On one hand, Geogebra can be used to visualize mathematical concepts
as well as to create instructional materials. On the other hand, Geogebra has the
potential to foster active and student-centered learning by allowing for mathematical
investigation, interactive explorations, as well as discovery learning (Bruner, 1961;
Tessema, 2012). In addition, Geogebra can encourage discussion and group work
thus making mathematics a much more open and practical subject, which is
accessible and manageable to more students (Hohenwater & Fuchs, 2004).
The development of Geogebra began in 2001 as Markus Hohenwarter’s Master’s
thesis project at the University of Salzburg, Austria (Hohenwarter, 2002). Geogebra
is freely available on the internet. Furthermore there are applets, tutorials,
worksheets and an interactive platform that is also freely available on the internet to
assist in the optimal use of the software. Accordingly, Geogebra can be used as a

34
presentation tool as well as for the creation of instructional materials, such as notes
or interactive worksheets (Hohenwater & Fuchs, 2004).
Dogan (2010) conducted an experimental design study using a pre‐ post-test to
evaluate the success of students learning using the Geogebra software. It was a
twelve hour course held over a period of two weeks involving two eighth grade
classes. It was observed that computer based activities could efficiently be used in
the learning process and the Geogebra software encouraged higher order thinking
skills. The software was also observed as having a positive effect in motivating
students toward learning and retaining the knowledge for a longer period. This was
based on a recall tests conducted a month later. In another study, Herceg and
Herceg (2010) conducted a study on two groups of students. One group used
applets only, whilst the other used the Geogebra software and applets. The study
tested how to incorporate computer‐based learning to reduce the working process of
numerical integration (Herceg & Herceg, 2010). The results of this study showed that
the Geogebra experimental group gained more knowledge and skills than the
control. This study also suggested that Geogebra use is helpful for students who
face difficulty in solving mathematical problems since they do not have to spend so
much time solving by hand.
Bakar, Ayub, Luan and Tarzimi (2002) compared Geogebra to a software program
created by them on two groups of Malaysian secondary school students and found
that students using the Geogebra software to study the transformation topic
achieved better results than students using the created software.
The purpose of yet another study was to determine the possible effects of the
dynamic mathematics software Geogebra on student achievement in the teaching of
trigonometry. The sample of that study consisted of 51 students. The experimental
group was taught using the Geogebra software in computer assisted presentations,
while the control group was taught the lessons using constructivist instruction. The
data collected after 5 weeks of application showed that there was a meaningful
difference between the experimental and control groups’ achievement in
trigonometry. This difference was in favour of the experimental group which had
lessons with Geogebra (Zengin, Furkan, & Kutluca, 2012).

35
The purpose of another study was to determine the effect of Geogebra on
conceptual and procedural knowledge of functions (Zulnaidi & Zakaria, 2010). The
study involved 124 high school students from Indonesia. A total of 60 students were
in the treatment group whilst 64 students were in the control group. The treatment
group were taught using Geogebra and the traditional method was used in the
control group. The data were collected using the conceptual and procedural
knowledge test of functions. The results showed significant differences between
treatment and control groups in that the treatment group had significantly higher
conceptual knowledge compared to control group.
2.2.4 ICT IN THE TEACHING AND LEARNING OF TRIGONOMETRY
Research on the teaching and learning of trigonometry, with or without ICT has not
been carried out to the same extent as in other fields of mathematics education
(Ross, Bruce, & Sibbald, 2011). In addition, Davis (2005) notes that little attention
has been given to trigonometry and the various ways it has been represented in
classroom teaching.
Regarding the learning of trigonometry functions, Park (1994) points out the role of
simulations, which can be used to highlight how a numerical output is linked to
certain unknown symbolic representations through a graphical approach. This is
because graphing motion can bring to the students’ attention the critical features and
their relations to other components that might not easily be grasped in an abstract
system. Simulations can also illustrate procedural relationships (Park, 1994). For
example, while transforming trigonometry curves that involve four transformations,
students can see the sequential steps to achieving the end result.
Jonassen (2000) also suggests that students will learn trigonometry functions better
and more conceptually if they are able to inter-relate numerical and symbolic
representations with their graphical outputs. With respect to the way trigonometry is
taught, Blacket and Tall (1991) point out the advantages of the computer approach
relative to the traditional approach, stating that it can allow students to manipulate
the picture and relate its dynamically changing state to the corresponding numerical
concepts, having the potential to improve performance. Steckroth, 2007) found that
software that included animation and visualization produced greater learning than
software limited to graphing functions.

36
The studies which incorporated ICT, even though sparse, into the teaching of
trigonometry have demonstrated largely positive effects on student achievement
(Blackett & Tall, 1991; Choi-koh, 2003; Moore, 2009; Ross et al., 2011; Zengin et al.,
2012). Although the studies show positive effects of the use of ICT on students’
learning and performance, the possible effects of ICT on students’ ability to make
connections between different representations and contexts of trigonometry
functions is limited, even though this is basic and fundamental to the learning of
trigonometry functions (Brown, 2005; Demir, 2012). Studies on the interpretation and
analysis of trigonometry functions were also found to be limited. In addition, the
researcher could not find any study that puts focus on tangent functions. This study
is focusing on connections between interpretation and transformation of trigonometry
function. Moreover, the tangent function is included in the study.
Blackett and Tall (1991) employed a computer program that draws the desired right
triangles to facilitate students’ exploration of the relationship between numerical and
geometric data. The results of the study show that computer representation enabled
students to make this exploration in an interactive manner. They were encouraged to
make dynamic links between visual and numerical data, which is less apparent in a
traditional approach. The authors conclude that even the least able became adept at
using the computer and, though they had some difficulty writing down their results,
they had few difficulties with visualization.
Wilson, (2008) studied the role of dynamic web tools in trigonometry lessons, and he
concluded that there was improvement both in the quality of students work and in
their interest toward the subject. He points out that these tools provide excellent
vehicles to monitor drill and practice and to foster conceptual understanding in many
situations.
Choi- Koh (2003) investigated the patterns of one student's mathematical thinking
processes and described the nature of the learning experience that the student
encountered in trigonometry as he engaged in independent explorations within an
interactive technology environment. He concluded that representations offer students
an opportunity to explore and conjecture mathematics which fosters a balance
between procedural and conceptual knowledge. Students can effectively use a
graphing calculator as an instructional tool to help them understand the connection
between graphical and algebraic concepts, and not use it just to get quick answers.

37
He also emphasized the role of technology in enhancing students’ attitudes to
mathematics learning.
Dynamic interactive features enable the software to illustrate mathematical changes
that might not otherwise be visible and helps students visualize a dynamic model
containing trigonometry relationships that are difficult to depict with static images (Ng
& Hu, 2006).
Using technology in lessons does not lead automatically to better results in terms of
students’ learning and understanding. Of crucial importance are how technological
tools are used in lessons, the kind of support students receive, and interactions
between the tools and students. In this regard, Thompson (2002) mentioned the use
of technological tools as educational objects which promote reflective mathematics
discourse for knowledge construction, but that an object is not instructive on its own.
Moore (2009) used Geometer’s Sketchpad as an educational object enabling
supportive mathematical dialogue. Moore (2009) used two applets for angle measure
and two co-varying elements, namely arc length and vertical position, in a dynamic
way for students to use and found positive effects on students’ understanding based
on quantitative and covariational reasoning. He stated that such applets led to better
learning of the sine graph which is not easy to draw because of the concavity.
Moore’s (2009) study indicates an effective use of technology in mathematics
lessons. To increase effectiveness of technology for students’ learning, ICT must be
integrated into classroom teaching in ways which will foster students’ concept
development and understanding, and address their learning difficulties.
The optimal sequence for integrating ICT with mathematics instruction has not yet
been determined (Ross et al., 2011). Lesser & Tchoshanov, (2005) presented
evidence that students need to be taught abstract, visual and concrete
representations to develop function sense (the ability to integrate and flexibly apply
multiple representations of functions). They found that the working sequence for
introducing representations in trigonometry was to present the abstract first; that is,
the visual and concrete became meaningful only after the abstract had been learned.
This form of sequence of teaching trigonometry in technological environments was
substantiated by Ross et al., (2011) who concluded that better learning is promoted
when ICT is used after the teacher explains the content. In their study Ross et al.,
(2011) used sliders from a software to investigate the students’ performance on

38
transformations of trigonometry functions. In one set of groups the formal teaching
was followed by the use of sliders in another set of groups ICT preceded the normal
teaching in the class. They found that, in the case of transformations of the
trigonometry functions, using a dynamic software package, after whole class
teaching of core concepts, was more effective than beginning the learning unit with
the software. Also at the end of the learning unit there was almost no difference
between the students’ performance levels in the two groups. Hence, they suggested
an integrated method of whole class teaching and technology use.
2.3 SUMMARY
The choice of method and the frameworks for the study were established. Two
theoretical frameworks APOS and AT were incorporated in developing the delivery of
the teaching and learning of trigonometry. The literature on the mathematical
concept of trigonometry functions was presented followed by the use of ICT in
teaching and learning, thereafter ICT in teaching and learning of mathematics and
finally the literature on the use of ICT in the teaching and learning of various aspects
of trigonometry.
While some studies have been done on the use of ICT on a wide range of teaching
and learning of trigonometry functions in Europe, the United States of America and in
the Far East, no similar studies have been carried out on the use of ICT on
trigonometry functions in South Africa. Moreover, there is a limited, if any, research
on interpretations, connections and transformation of trigonometry functions.

39
CHAPTER THREE
RESEARCH METHODOLOGY
Research methodology (approach) involves the paradigm, the research design, and
methods (procedures) for answering questions in the study (Creswell, 2014). Thus in
this chapter, the following topics are addressed: the paradigm underlying the
research, the research design, the sample and the population it is coming from, the
instruments for data collection, the steps taken to ensure the validity and reliability of
the instruments, the ethical issues considered in the study and the data analysis
techniques employed in the study.
3.1 THE RESEARCH PARADIGM
Paradigm can be said to be a set of shared ideals, beliefs and values about a
concept to be studied. The term paradigm comes from the Greek word paradeigma
which means pattern and was used by Thomas Kuhn (1977) to denote prevailing
patterns of thought shared by scientists which provided them with a suitable model
for investigating problems and finding solutions. (Wisker, 2001) explains a paradigm
as an underlying set of beliefs about how the elements of the research area fit
together and how one can enquire of it and make meaning of discoveries. Similarly,
paradigm is said to be a research culture held by a community of researchers that is
based on discipline orientations and past experiences (Kuhn, 1977; Creswell &
Plano Clark, 2011; Creswell, 2014).
There are different kinds of paradigms such as positivism (for quantitative research),
interpretive (for qualitative research), critical (for civil actions) and pragmatic (for
mixed methods). Quantitative research is usually associated with the positivism
paradigm (Williams, 1998). This research study was thus based on Positivism
(Anderson, 1983).
3.1.1 POSITIVISM
There are various ways in which positivism may be described. As a philosophy,
positivism adheres to the view that only factual knowledge gained through
observation (the senses – hearing, sight, touch, taste and smell), including
measurement, is trustworthy. Therefore, things that cannot be observed or

40
scientifically measured, e.g. people’s thoughts and attitudes cannot be accepted as
factual knowledge. Hence APOS, which concentrates on mental constructions of
students when acting on an object and AT are only used in designing and
implementing the instructional process of the experimental group, not in the analysis
and interpretation in the current study. In addition, in positivism studies the role of the
researcher is limited to data collection and interpretation through objective approach
and the research findings are usually observable and quantifiable (Collins, 2010).
Positivism is a philosophical theory stating that positive knowledge is based on
natural phenomena and their properties and relations. Thus, information derived
from sensory experience, interpreted through reason and logic, forms the exclusive
source of all authoritative knowledge. Positivism holds that valid knowledge
(certitude or truth) is found only in this derived knowledge (Sanchez, 2016).
Positivism is also the term used to describe an approach to the study of society that
relies specifically on scientific evidence, such as experiments and statistics, to reveal
the true nature of how society operates. The term originated in the 19th century,
when Auguste Comte described his ideas in his books The Course in Positive
Philosophy and A General View of Positivism. Within the positivist research
paradigm, it is assumed that the only way that people can be confident that the
knowledge is true is if it was created using the scientific method. Here, data is
derived from experiments and observation in order to yield supportive evidence
(Rohmann, 1999).
Positivism depends on quantifiable observations that lead themselves to statistical
analysis. It has been noted that “as a philosophy, positivism is in accordance with the
empiricist view that knowledge stems from human experience. It has an atomistic,
ontological view of the world as comprising discrete, observable elements and
events that interact in an observable, determined and regular manner (Collins,
2010).
Moreover, in positivism studies the researcher is independent from the study and
there are no provisions for human interests within the study. As a general rule,
positivist studies usually adopt deductive approach, whereas inductive research
approach is usually associated with a phenomenology philosophy (Crowther &

41
Lancaster, 2008). Moreover, positivism relates to the viewpoint that the researcher
needs to concentrate on facts, whereas phenomenology concentrates on the
meaning and has provision for human interest.
Researchers warn that if one assumes a positivist approach to a study, then it is the
belief that one is independent of the research and the research can be purely
objective. Independent means that one maintains minimal interaction with your
research participants when carrying out your research (Wilson, 2010). In other
words, studies with positivist paradigm are based purely on facts and consider the
world to be external and objective.
One of the aims of the positivist research paradigm is to explain cause and effect
relationships (Creswell, 2009). A cause-effect relationship relates independent
variable(s) (which is the treatment and may be a cause of any improvement) to the
dependent variable (which is the outcome of the treatment).
The scientific approach to research consists of posing questions and related
hypotheses as explanations of phenomena and then designing experiments to test
and verify the questions and hypotheses. The steps involved in putting this idea
under scientific examination (sampling, data collection, data analysis) must be
repeatable (called reliability, from Latin religare, to bind fast) so scholars can predict
any future results generated using the same methods. It is imperative that the entire
research process be objective (value free) to reduce biased interpretations of the
results (Creswell, 2014). A wide range of statistical measures have been developed
as a means of measuring reliability and validity.
True experimental and quasi-experimental designs are both experimental; with the
main difference being that the sample in the quasi-experimental is not assigned
randomly (Best & Kahn, 1998). The current study is of a quasi-experimental design.
3.2 PILOT STUDY
A pilot study was conducted in two schools from Mafikeng in the North West
Province of South Africa. Four groups, two from each school, participated. In total,
the pilot study consisted of 138 students, with 75 students in the control groups and
63 students in the experimental groups. The experimental groups were taught the
lessons arranged mainly with the Geogebra software and the Whiteboard, while the

42
control group was taught using the traditional teaching methods. The computer
(experimental) groups (63) were chosen because of the availability of computers at
their school.
The data were collected before and after 10 lessons of teaching and learning. In
both schools they all wrote the pre- and post-test, followed by interviews with four
(4) of them. As part of the study six (6) students were supposed to be interviewed.
This could not be done due to a lack of time as the researcher was trying to avoid
disturbing the normal teaching and learning process. This also led to the students
not being asked all the questions.
The data gathered through the pre- and post-test, and the interview in the pilot
study strongly supported the argument that computers are useful in teaching and
learning trigonometry (c.f. Weber, 2005; Demir, 2012). The results from students’
interviews showed that they enjoyed learning trigonometry graphs using Geogebra.
However, except for trigonometry graphs, all students were not keen on using
computers to solve or simplify trigonometry equations and expressions. They
perceived it as time consuming as grade 12 students, who were preparing for final
examination, they said they could not afford to spend a lot of time on one topic.
They also indicated that in tests and examinations computers are not allowed in the
assessment rooms, thus at that time they preferred using calculators to Geogebra.
Based on the results and analysis of the pilot study, it was concluded that the main
study would be feasible. Thus, the continuance to the main study. Many of the
questions in the final study were generated from the pilot study. Some of the
questions were modified since it was noticed in the pilot study that some students
just memorised the memorandum from the pre-tests. Furthermore, from the advice
of a mathematics subject advisor, the question: Plot the graph of 𝑠𝑖𝑛 (90 – 𝑡ℎ𝑒𝑡𝑎)
was changed to 𝑐𝑜𝑠 𝑡ℎ𝑒𝑡𝑎. The content, and tasks still adhered to the CAPS syllabus.
In response to the students’ reluctance to use the software for the teaching and
learning of the equations and expressions in the pilot study, Geogebra was excluded
for the teaching and learning of these sections in the main study.

43
3.3 RESEARCH DESIGN
Various designs have been described: the quantitative, qualitative and mixed
methods designs. A quantitative research design is one that is based on positivism
paradigm and measurability, it aims to establish cause and effect relationships, on
the other hand, a qualitative research design is based on multiple socially
constructed realities and aims to understand a social phenomenon from participants’
perspective, (McMillan & Schumacher, 2010; Creswell, 2014). This study adopted a
quantitative research approach since the research problem addressed in the study is
concerned with whether intervention works better than no intervention in influencing
the outcome.
Quantitative methods make use of numerical variables. The analyses are usually
statistical, the results of which are normally accepted as legitimate confirmation of
collected data (McKnight, Magid, Murphy, & McKnight, 2000). Quasi-experimental
designs are included in the quantitative approach to research (Creswell, 2014).
A non-equivalent group, with pre- post-test, and quasi-experimental design (Oaks &
Feldman, 2001) was chosen for this study, the blue-print of which is shown in Figure
3.1. This is a type of evaluation that sought to determine whether a program or
intervention had the intended causal effect on program participants, i.e., whether a
specific intervention had an influence on the outcome (Creswell, 2014). The two
classes were non-randomised, thus non-equivalent groups (McKnight et al., 2000).
There are four key components in this quasi-experimental study design: 1) the
experimental group 2) pre- post-test 3) treatment/intervention and 4) the control
group.
1) The experimental group – The group that received the intervention or
treatment;
2) Pre- post-test –An evaluation of students’ understanding of a concept
before and after the material is taught or before and after the
intervention;
3) A treatment – The intervention that will be administered to the
experimental group.
4) A control group – this group received no treatment or intervention.

44
The blue print
Figure 3.1: Blue-print of the quasi-experimental design (Adapted from: MLE, 2013)
The non -equivalent design was chosen in order to preserve the normal running of
the two schools. The groups were intact as they were placed into their various
classes by the schools depending on the combination of subjects the students were
registered for. The status of the groups was not altered in any way for the study. The
schools’ schedules, time-table, etc. were not disturbed or altered in any way and the
Trigonometry functions were taught as prescribed by the school time-table and the
teaching schedule. One section of school trigonometry - (the 2- and 3-dimentional
problems section) was excluded from the study since, according to the schools’
schedule, these trigonometry problems were meant to be taught in the third term.
The pre-test and -tests had also to adhere to the school time-table, so as not to
disturb the students’ attendance to other classes.
The two teachers in the 2 schools were both teaching mathematics in their
respective schools. One school had computers and the other did not. The
experimental group was selected from the school with computers and the control
group came from the school without. The teacher in the experimental group was
introduced to Geogebra by the researcher and the trajectory of teaching trigonometry
functions in that classroom. To develop the instructional trajectory in the
experimental group, the researcher used CAPS text books, her experience,

45
colleagues, Geogebra and Geogebra applets. In both groups, the experimental and
the control groups, the content covered adhered to the schools schedules, which in
turn followed the prescribed grade 10, 11 and 12 syllabi. The control group was
taught using the traditional teaching. This was so as to compare the instruction using
ICT with the traditional instruction to determine the effectiveness of either in the
teaching and learning of trigonometry functions.
3.3.1 CHOOSING THE QUANTITATIVE APPROACH
According to McMillan and Schumacher (2010), the quantitative approach is
objective, value free and unbiased. One of the factors that influenced the researcher
to choose the quantitative approach above the others was because of the main aim
of the research: to evaluate the relative effectiveness of using ICT in the teaching of
trigonometry functions in a classroom. This was essentially to determine whether the
use of ICT would have an effect in the performance of the students than the
traditional form of teaching. This is an example of determining the best method to
test a theory or explanation, thus the quantitative approach was used (Creswell,
2014).
Moreover, the researcher is a mathematics educator and therefore is acquainted
with the language that is used in quantitative research, as the quantitative approach
relies on variable, numerical values, and measurements to generate numbers that
can be analysed, using statistics.
3.3.2 DESCRIPTION OF THE SITE
The research was conducted at two schools in the Ngaka Modiri Molema district in
Mafikeng, North West Province. The schools were selected due to convenience and
availability. The schools were about 15 km from each other thus a reduction in
external influences among the students. The Deputy Director (Education), principals,
the teachers, the students and school governing bodies gave permission for the
research at the two schools.
The experimental group was situated at a school that had a fully equipped computer
laboratory with computers, a server, printer, whiteboard, and security cameras. The
computers had not been used for content subjects (Life Sciences, Physical Sciences
and Mathematics) at the school. Geogebra was installed by the researcher with the

46
assistance of two mathematics educators. The two teachers at the school were
trained to use the software and the subject content to be taught in the experimental
group were communicated to them.
The school where the control group was did not have a computer room but all the
students were doing the same subjects which followed after the CAPS curriculum.
3.4. STUDY SAMPLE AND POPULATION
A population is defined as a group of elements which can be people or objects that
conform to specific criteria and to which a researcher intends to generalize the
findings of the study (McMillan & Schumacher, 2010). In this instance, our population
was a group of students who sat for grade 12 examination in Ngaka Modiri Molema
District in the North West Province, South Africa.
A convenience sampling method was used to select the two schools that participated
in this study. The North-West province is a multicultural province and the main
language spoken is Setswana whilst Mathematics is taught in English, a second
language.
In this study, two groups of students from two schools which are physically apart
(about 15 kilometres), and who were due to write the grade 12 final CAPS
examination at the end of the year were chosen. There were 61 students in total.
The sample was chosen by the researcher for reasons of convenience and
accessibility (McMillan & Schumacher, 2010). This was a convenient sample since
the schools were selected on the basis of their accessibility and ICT availability for
the treatment group. Both schools are from a historically disadvantaged
environment. They are situated in the Mafikeng area, in the Ngaka Modiri Molema
District, in the North West province of South Africa. The age range of the students
was between 18 and 20. The students were mainly from not so well-to-do to middle
income homes, and they commute using private transport, public transport or walk to
school daily. The school where the experimental group came from had 245
mathematics students in total whilst, the school where the control group came from
had 63 mathematics students in total. In both cases only one class from each school
participated in the study.

47
The schools chosen were upgrading and remedial institutions. These institutions
cater for students who sat for grade 12 examinations previously but either failed or
did not obtain the requisite credit levels (Appendix 9) for whatever program they
intended to pursue at the tertiary level. Most students at both schools came with
level 1 (0-29%), which meant that the students came to the schools with virtually no
achievement in mathematics. For all the possible levels of achievements, see
Appendix 9.
3.5 CONDUCTING THE STUDY
This study examined students’ performance on trigonometry functions before and
after an intervention. The purpose here was to determine whether the use of
computers would have any effect on the students’ performance. To develop the
instructional trajectory in the experimental group, the researcher used literature,
CAPS text books, her experience, colleagues, Geogebra and the Geogebra applets.
The students were informed of the research and upcoming assessments a week
before the study began. The pre-test was given to the students a day before the
lessons started. Sixty one students wrote both the pre- and post-tests in the two
schools. Thirty four (34) students were in the control group and twenty seven (27) in
the experimental group. The groups were taken as they were allocated in the two
schools. Since the assessment was out of 80, the students were asked to complete
the test during one and half hours. They were again informed at the beginning of the
assessment that the test was mainly for research purpose. The complete pre-test
and post-test can be found in Appendices 1 and 2.
The teacher in the experimental group was introduced to Geogebra and the
trajectory of teaching trigonometry functions in that classroom. Although general
tools allow students and teachers much more freedom to shape and modify how to
use them (Barzel, 2007), the introduction of an all-purpose tool for mathematics
education requires more time and effort from both teachers and students than simply
using virtual manipulatives. While students need hardly any computer skills in order
to be able to work with prepared virtual manipulatives, both teachers and students
need to learn the basic skills concerning the operation of a specific mathematics
software before being able to effectively integrate it into teaching and learning.
Although many teachers do not want to spend this time to familiarise a software

48
package to their students, teaching them the basic use of the tool usually pays off in
the long run, and especially if the software package is a versatile tool that allows
teachers to cover different mathematical topics at different grade levels
(Hohenwarter & Jones, 2007).
The educator in the experimental group introduced Geogebra to the students. In both
groups, the lessons were conducted by the schools’ educators during the normal
scheduled mathematics periods. The content taught followed the content that the
teachers would normally teach during that time. The study was carried out during the
second half of the first term. After the intervention, both groups were given a post-
test to compare whether there was any difference in the students’ performance. The
findings are presented in chapter 4.
3.5.1 INSTRUMENTS
The instruments for data collection were the Trigonometry functions achievement
tests (Appendices 1 and 2). These achievement tests were administered by the
educators at the schools before and after the implementation of the intervention. The
tests consisted of five questions that added up to 80 marks. In Question 1, students
were supposed to draw trigonometry graphs and to write down their respective
properties. Question 2 involved the derivation of graphs of trigonometry functions
from given formulae. Question 3 dealt with analysis of intersecting graphs. Question
4 required students to translate trigonometry formulae to graphs and or to words.
Question 5.1-3 involved the integration of the unit circles, algebra, right angle
triangle, and graphs. In Questions 5.2, 5.3 and 5.4 students were required to solve
equations and prove an identity.
The following section describes how the instruments were developed, how the
validity and the reliability of the tests and scores, respectively, were determined.
3.5.2 DEVELOPMENT OF ACHIEVEMENT TESTS
According to La Marca, (2001), in order to make valid and reliable decisions on
students’ achievements, a study should use assessments which are aligned with the
curriculum standards. This means that there should be a high degree of match
between the test tasks and subject matter content as identified through government
educational standards. The test questions were thus constructed by using the

49
specification and clarification of the trigonometry functions content (see Table 3.1)
guided by the Curriculum and Assessment Policy statement (Grade 10-12). This
confirms the statement from the mathematics examination guidelines (DBE, 2015)
which states that the purpose of the clarification of the topics is to give guidance to
the teacher in terms of depth of content necessary for examination purposes.
Previous CAPS compliant grade 12 examination papers were also used to develop
the instruments.

50
Table 3.1: Curriculum and Assessment Policy statement (CAPS) on Trigonometry
content (Grades 10-12) (Adapted from: DBE, 2015)
TOPIC CURRICULUM STATEMENT CLARIFICATION
TRIG
GR
AD
E 1
0 T
erm
1
TRIG
GR
AD
E 1
0 T
erm
3
1. Define the trigonometric ratios sin θ, cos θ and tan θ, using right-angled triangles.
2. Extend the definitions of sin θ, cos θ and tan θ for 0° ≤ θ ≤ 360°.
3. Define the reciprocals of the trigonometric ratios cosec θ, sec θ and cot θ, using right-angled triangles (these three reciprocals should be examined in grade 10 only).
4. Derive values of the trigonometric ratios for the special cases (without using a calculator)
θ ∈ {0°; 30°; 45°; 60°; 90°}.
5. Solve two-dimensional problems involving right-angled triangles.
6. Solve simple trigonometric equations for angles between 0° and 90°.
7. Use diagrams to determine the numerical values of ratios for angles from 0° to 360°.
Problems in two dimensions.
Comment:
It is important to stress that:
• similarity of triangles is fundamental to the trigonometric ratios sin θ, cos θ and tan θ;
• trigonometric ratios are independent of the lengths of the sides of a similar right-angled triangle and depend (uniquely) only on the angles, hence we consider them as functions of the angles;
• doubling a ratio has a different effect from doubling an angle, for example, generally 2sin θ ≠ sin 2θ; and
• solve equation of the form sin x = c, or 2cos x = c, or tan 2x = c, where c is a constant.
Examples:
1. If 5sin θ + 4 = 0 and 0° ≤ θ ≤ 270° , calculate the
value of sin2 𝜃 + cos2 𝜃 without using a calculator (R)
2. Let ABCD be a rectangle, with AB = 2cm. Let E be
on AD such that A�̂�E= = 45°
and BÊC = 75°. Determine the area of the rectangle. (P)
3. Determine the length of the hypotenuse of a right-angled triangle ABC, where
�̂� = 90°, �̂� = 30° and AB = 10cm (K)
4. Solve for x:4sin𝑥 − 1 = 3 for 𝑥 ∈[0°;90°] (C)
Example:
Two flagpoles are 30 m apart. The one has height 10 m, while the other has height 15 m. Two tight ropes connect the top of each pole to the foot of the other. At what height above the ground do the two ropes intersect? What if the poles were at different distance apart? (P)

51
TRIG
ON
OM
ETR
Y G
RA
DE
11
1. Derive and use the identities
tan 𝜃 =sinθ
cos 𝜃, θ≠ 𝑘. 90°, 𝑘 an odd
integer;
and sin sin2 𝜃 + cos2𝜃=1
2. Derive and use reduction formulae to
simplify the following expressions:
2.1. sin (90° ± θ); cos(90° ± θ);
2.2. sin(180 ° ± 𝜃; cos 180 ° ± 𝜃; tan(180° ± 𝜃)
2.3. sin(360° ± 𝜃); cos(360 ± 𝜃)
tan(360° ± 𝜃) and
2.4. sin (−𝜃); cos (−𝜃); tan (−𝜃)
3. Determine for which values of a variable an identity holds.
4. Determine the general solutions of trigonometric equations. Also, determine solutions in specific intervals.
Comment:
• Teachers should explain where reduction formulae come from.
Examples:
1. Prove that 1
tan𝜃+ tan 𝜃 =
tan 𝜃
sin2 𝜃. (R)
2. For which values of θ is 1
tan 𝜃+ tan 𝜃 =
tan 𝜃
sin2 𝜃 undefined? (R)
3. Simplify cos(180°− 𝑥) sin( 𝑥−90°)−1
tan2(540°+𝑥) sin(90°+𝑥)cos (−𝑥) (R)
4. Determine the general solutions of cos2𝜃 +3 sin 𝜃 = −3. (C)
1. Prove and apply the sine, cosine and area rules.
2. Solve problems in two dimensions using the sine, cosine and area rules.
Comment:
• The proofs of the sine, cosine and area rules are examinable.
Example:
In ∆𝐴𝐵𝐶 D is on BC, ADC = θ, DA = DC = r, bd = 2r,
AC = k, and 𝐵𝐴 = 2𝑘
Show that cos 𝜃 =1
4

52
TRIG
ON
OM
ETR
Y G
RA
DE
11
Point by point plotting of basic graphs
defined by𝑦 = sin 𝜃, 𝑦 − cos 𝜃, and
tan 𝜃 for 𝜃 ∈ [−360°; 360°]
4. Investigate the effect of the parameter k
on the graphs of the functions defined by
y = sin(kx), 𝑦 = cos (k𝑥) and 𝑦 =tan(𝑘𝑥)
5. Investigate the effect of the parameter
p on the graphs of the functions defined
by y = sin(x + p), , y = cos(x + p), and
y = tan(x + p),
6. Draw sketch graphs defined by:
𝑦=𝑎 𝑠𝑖𝑛 𝑘 (𝑥+𝑝),
𝑦=𝑎 𝑐𝑜𝑠 𝑘 (𝑥+𝑝) and
𝑦= 𝑘 (𝑥+𝑝) at most two parameters at a time.
Comments:
• A more formal definition of a function follows in Grade 12. At this level it is enough to investigate the way (unique) output values depend on how input values vary. The terms independent (input) and dependent (output) variables might be useful.
• After summaries have been compiled about basic features of prescribed graphs and the effects of parameters a and q have been investigated: a: a vertical stretch (and/or a reflection about the x-axis) and q a vertical shift. The following examples might be appropriate:
• Remember that graphs in some practical applications may be either discrete or continuous.
Comment:
• Once the effects of the parameters have been established, various problems need to be set: drawing sketch graphs, determining the defining equations of functions from sufficient data, making deductions from graphs. Real life applications of the prescribed functions should be studied.
• Two parameters at a time can be varied in tests or examinations.
Example:
Sketch the graphs defined by 𝑦 = −1
2sin(𝑥 + 30°)
and f (x) = cos(2x − 120°)
on the same set of axes, where −360° ≤ 𝜃 ≤ 360°.

53
TRIG
ON
OM
ETR
Y G
RA
DE
12
1. Definition of a function.
3.
Focus on the following characteristics:
domain and range, intercepts with the axes,
turning points, minima, maxima,
shape
and symmetry,
intervals on which the
function increases /decreases.
Compound angle identities:
cos(𝛼 ± 𝛽) = cosαcosβ∓sinαsinβ;
sin(α ± β) = sinαcosβ ± cosαsinβ;
sin2α = 2sinαcosα;
cos2α = coscos2 𝛼 − sin2𝛼;
cos2α = 2cos2𝛼 − 1; and
cos2α = 1 − sin2𝛼
2. Accepting cos(α − β) = cos 𝛼cosβ + sinα sinβ, derive the other compound angle identities. (C)
3. Determine the general solution of
sin 2𝑥 + cos 𝑥 = 0 (R)
4. Prove that 1+sin 2𝑥
cos 2𝑥=
cos 𝑥+sin 𝑥
cos 𝑥−sin 𝑥 (C)

54
TRIG
ON
OM
ETR
Y G
RA
DE
12
1. Solve problems in two and three dimensions.
1.𝑇𝑃 is a tower. Its foot, P, and the points Q and R are on the same horizontal plane.
From Q the angle of elevation to the top of the building is x. Furthermore,
y and the distance between P and R is a metres. Prove that
TP = a tan 𝑥cos 𝑦–√3 sin 𝑦 (C)
2. In ∆𝐴𝐵𝐶, 𝐴𝐵 ⊥ 𝐵𝐶. Prove that:
2.1 𝑎 = 𝑏cos𝐶 + 𝑐cos𝐵 where 𝑎 = 𝐵𝐶; 𝑏 =𝐴𝐶; 𝑐 = 𝐴𝐵 (R)
2.2 cos 𝐵
cos 𝐶=
𝑐−𝑏cos𝐴
𝑏−𝑐cos 𝐴 on condition that �̂� ≠90°)
(P)
2.3 tan𝐴 =𝑎sin𝐶
𝑏−acos𝐶 (on condition that �̂� ≠90°)
(P)
2.4 a + b + c = (b + c) cos A + (c + a) cosB + (a + b) cosC. (P)

55
Along with utilizing the CAPS curriculum guidelines, Bloom’s cognitive levels were
also applied to develop the teaching program and the instruments. Four cognitive
levels were used in this study. The cognitive demand levels are in accordance with
the South African curriculum standards and are based on Bloom’s Taxonomy (DBE,
2011). Descriptors for each cognitive level and the approximate percentages of tasks
in tests and examinations which should be at each level are given in Table 3.2.
The first two levels (knowledge and recall (K), performing routine procedures (R)) are
regarded as demanding low-level cognitive skills according to Boston and Smith
(2009) classification, while the last two categories (performing complex procedures
(C) and problem solving (P)) are regarded as requiring high-level cognitive skills
(critical and creative thinking skills) (Boston & Smith, 2009).
Table 3.2: Amended Bloom’s Cognitive Levels
Cognitive levels
Description of skills to be demonstrated
Examples
Knowledge (K)
20%
Straight recall
Identification of correct formula on the information sheet (no changing of the subject)
Use of mathematical facts
Appropriate use of mathematical vocabulary
1. Write down the domain of the function y = h(x) = 3sinx + 2; x ∈ [−180°; 180°]
2. Write down the equation of the function of x if moved 30° to the left and two units up.
Routine (R) Procedures
35%
• Estimation and appropriate rounding of numbers
• Proofs of prescribed theorems and derivation of formulae
• Identification and direct use of correct formula on the information sheet (no changing of the subject)
• Perform well known procedures
• Simple applications and calculations which might involve few steps
• Derivation from given information may be involved
• Identification and use (after changing the subject) of correct formula
• Generally similar to those encountered in class
1.Solve for sin x = cos 3𝑥 where x ∈(−180°; 180°)
2. Determine the general solution of the equation
2 sin(𝑥 − 30 °) + 1 = 0
3. Prove that: cos 2x−2𝑠𝑖𝑛2x
cosx−sin 2x =
1+2sinx
cosx
Complex (C) Procedures
30%
Problems involve complex calculations and/or higher order reasoning
• There is often not an obvious
1. Write down the coordinates of a point on the graph of sinθ which corresponds to P
on the unit circle.

56
route to the solution
• Problems need not be based on a real world context
• Could involve making significant connections between different representations
• Require conceptual understanding
Problem (P) Solving
15%
• Non-routine problems (which are not necessarily difficult)
• Higher order reasoning and processes are involved
• Might require the ability to break the problem down into its constituent parts
1.Prove that: cos 2x−2𝑠𝑖𝑛2x
cosx−sin 2x =
1+2sinx
cosx
2. If f(x) = cos x and g(x) = −2 cos(2x − 30) − 2 ,
describe the transformation from f to g.
,
(From DBE, 2011)
According to DBE (2011c), tests should cover the following four cognitive levels; (1)
knowledge (20%); (2) routine procedures (35%); (3) complex procedures (30%); and,
(4) problem solving (15%). This was the format followed in the current study to
ensure that a representative sample of all content areas and all instructional levels
were included in the test. This could not be followed exactly since the test had to
cover exactly what was taught in the class and some of the questions that are
normally asked at the end of the year could not be asked at this time, e.g. the 2 and
3 dimensional problems. In this regard, questions were selected in such a way that
they covered the four cognitive levels (see, Table 3.2).
3.5.3 ELABORATION OF TASKS IN THE TESTS
It should be noted here that some of the theoretical tasks for post-test were slightly
modified so as to avoid memorisation of the memo from the pre-test, and to see the
improvement of students in performance of the concepts (McKnight et al., 2000). For
example, in the pre-test students were required to draw ℎ(𝑥) = 3𝑠𝑖𝑛𝑥 − 2. In the
post-test the question was to draw ℎ(𝑥) = 3𝑠𝑖𝑛𝑥 + 2.
The achievement tests (see Appendices 1 & 2), included 5 open-ended questions.
Table 3.3 presents the concepts addressed by the tasks of each test-item. The tasks
were grouped according to the main subsections that they were intended to assess,
i.e., connections between relationships of trigonometry functions, properties of
functions, etc.

57
Table 3.3: Topics covered by the questions in the pre- and post-test
QUESTION CONCEPT CLARIFICATION
Q1.1a-c Connection of algebra to graphical representations
Translating or construction of graphs from given equations/ formulae
Q1a Connection of algebra to graphical representations
Plotting the graph
Q1b Connection of algebra to graphical representations
Plotting of graphs
Q1c Connection of algebra to graphical representations
Plotting of graphs
Q1.2 a-h
Interpretation and analysis
Interpretation or Determination of properties of trigonometry functions from given formulae and drawn graphs
Q1.2a Amplitude
Q1.2b Amplitude
Q1.2c Period
Q1.2d Domain
Q1.2e Range
Q1.2f Maximum value
Q1.2g Maximum value
Q1.2h Asymptotes
Q1.2i; Q4 Transformations Explaining transformation in words, and or by using equations, and or graphically.
Q2a-c Connecting Graphical representations to algebra
Deriving equations of trigonometry functions from given graphical representations
Q3 Graphical
analysis from Multiple graphs
Graphical
Comparing and Analysing given multiple graphs and their formulae
Q3a y-intercept
Q3b x-intercepts
Q3c Labelling on a graph

58
Q3d analysis from Multiple graphs
Determining x-coordinate from the graph
Q3e Point(s) of intersection
Q3f Shading
Q5.1.1 -5.1.2
Integrating a unit circle to a right angled triangle
Relating the movement of a point on a unit circle to vertical and horizontal displacements on a triangle/ x and y-coordinates of the point
Q5.1.3 Connecting unit circle to graphs
Relating the movement of a point on a unit circle to a point on a graph
Q5.2 Prove the identity
Simplify and equate the expression
1Q 5.3 ; Q5.4
Derive general solutions and specific solutions
Use of rotation angles and periodicity
3.5.4 RELIABILITY AND VALIDITY
Reliability and validity measure the quality of the research instruments. Reliability is
concerned with the degree of consistency, stability and repeatability of the attributes
to be measured (Brink & Wood, 1998; Bush, 2002). Validity of an assessment, on
the other hand, is the degree to which it measures what it is supposed to measure
(Creswell, 2008).
3.5.4.1 VALIDITY OF THE TRIGONOMETRY FUNCTION TESTS
Types of validity include, content, construct, and criterion validity (Kothari, 1990;
McKnight et al., 2000). Content validity was determined on the test.
Content validity is the degree to which the content of an instrument covers the extent
and depth of the topic it is supposed to cover (Creswell, 2008). It is useful for
evaluating educational research tests (Lewis, 1999). Content validity is most often
measured by relying on the knowledge of people who are familiar with the concepts
being measured. These subject-matter experts (SMEs) are usually provided with the
instruments and are asked to offer responses on how well each question measures
the concepts in question. Their responses are then statistically analyzed (Creswell,
2008). In addition to using subject matter experts’ inputs and judgement for content
validity, McKnight et al., (2000), add that one could first use one’s professional
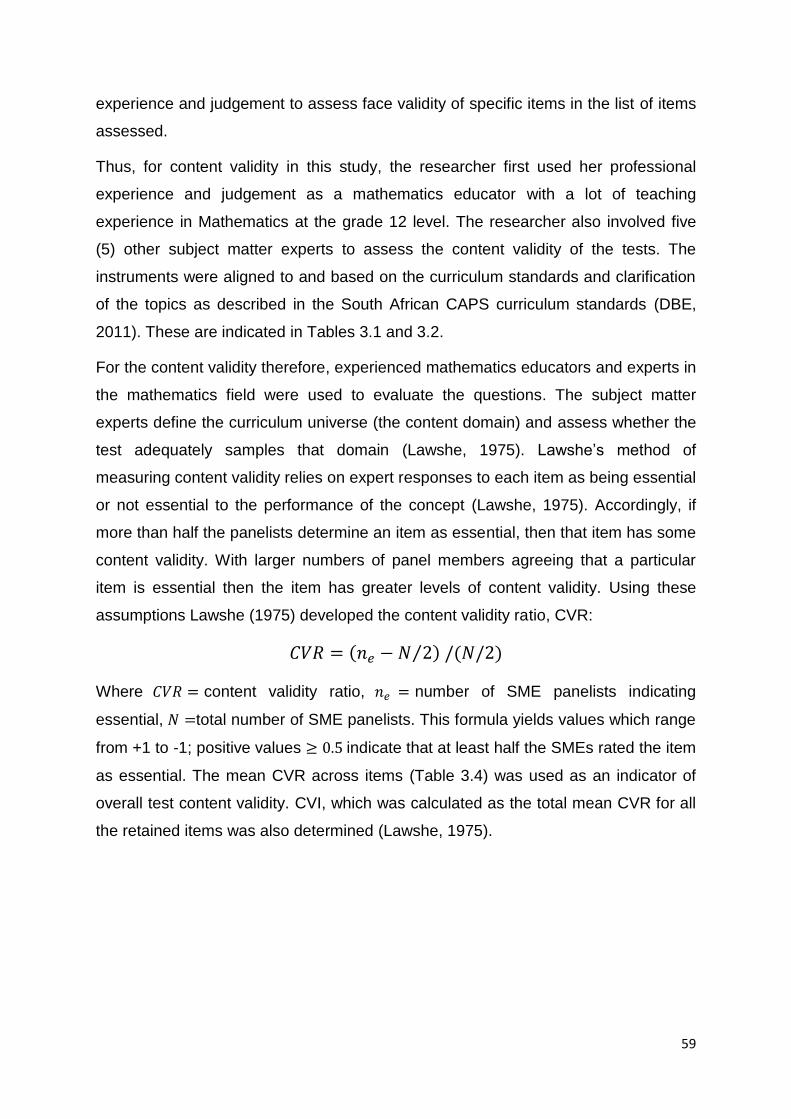
59
experience and judgement to assess face validity of specific items in the list of items
assessed.
Thus, for content validity in this study, the researcher first used her professional
experience and judgement as a mathematics educator with a lot of teaching
experience in Mathematics at the grade 12 level. The researcher also involved five
(5) other subject matter experts to assess the content validity of the tests. The
instruments were aligned to and based on the curriculum standards and clarification
of the topics as described in the South African CAPS curriculum standards (DBE,
2011). These are indicated in Tables 3.1 and 3.2.
For the content validity therefore, experienced mathematics educators and experts in
the mathematics field were used to evaluate the questions. The subject matter
experts define the curriculum universe (the content domain) and assess whether the
test adequately samples that domain (Lawshe, 1975). Lawshe’s method of
measuring content validity relies on expert responses to each item as being essential
or not essential to the performance of the concept (Lawshe, 1975). Accordingly, if
more than half the panelists determine an item as essential, then that item has some
content validity. With larger numbers of panel members agreeing that a particular
item is essential then the item has greater levels of content validity. Using these
assumptions Lawshe (1975) developed the content validity ratio, CVR:
𝐶𝑉𝑅 = (𝑛𝑒 − 𝑁 2⁄ ) /(𝑁/2)
Where 𝐶𝑉𝑅 = content validity ratio, 𝑛𝑒 = number of SME panelists indicating
essential, 𝑁 =total number of SME panelists. This formula yields values which range
from +1 to -1; positive values ≥ 0.5 indicate that at least half the SMEs rated the item
as essential. The mean CVR across items (Table 3.4) was used as an indicator of
overall test content validity. CVI, which was calculated as the total mean CVR for all
the retained items was also determined (Lawshe, 1975).

60
Table 3.4: CVR values for the different questions
QUESTIONS
Q1.1a 4 5 0.80
Q1.1b 5 5 1.0
Q1.1c 5 5 1.0
Q 1.2a 5 5 1.0
Q1.2b 5 5 1.0
Q1.2c 5 5 1.0
Q1.2d 5 5 1.0
Q1.2e 5 5 1.0
Q1.2f 5 5 1.0
Q1.2g 5 5 1.0
Q1.2h 5 5 1.0
Q1.2i 5 5 1.0
Q2a 5 5 1.0
Q2b 5 5 1.0
Q2c 5 5 1.0
Q 3a 5 5 1.0
Q3b 5 5 1.0
Q3c 5 5 1.0
Q3d 5 5 1.0
Q3e 5 5 1.0
Q3f 5 5 1.0
Q4 5 5 1.0
Q5.1.1 5 5 1.0
Q5.1.2 5 5 1.0
Q5.1.3 4 5 0.80
Q5.2 5 5 1.0
Q5.3 5 5 1.0
Q5.4 5 5 1.0
Total Mean CVR
0.99

61
In this study the content validity of the instruments was ensured by firstly requesting
inputs, comments and moderation from the subject experts. The experts consisted of
two high school mathematics educators, two high school mathematics head of
departments (HODs) and one mathematics subject advisor. The experts were asked
to determine whether the content reflected the content domain. The experts were
given the question papers and tables on which to respond. From the experts’
responses the content validity was calculated and presented in Table 3.5. For each
test item CVR was greater than 0.8 therefore the items in the instruments were
considered to be content valid. The CVI which is equal to 0.99 was considered to be
highly relevant.
3.5.4.2 RELIABILITY OF THE TESTS
Four methods are used to estimate reliability. These are test-retest, alternate form,
split halves and internal consistency (McKnight, Magid, Murphy, & McKnight, 2000).
Reliability measures consistency over time and over similar samples. According to
Gay and Airasian (2003), for a cognitive test in which the questions are not scored
dichotomously the reliability can be calculated by using the Spearman Brown formula
R = 2r/(1+r), where r is the correlation coefficient between split half test results, or
between test and the re-test results, or between two equivalent randomly assigned
groups. In this study two randomly assigned groups were used. The correlation
coefficient must be significant at 95% or higher confidence interval (Cohen, Manion,
& Morrison, 2007). According to (Wells & Wollack, 2003), if the Spearman Brown
coefficient (R ) ranges from 0 to 1.00 and the values are close to 1.00 this indicates
high consistency. The results in this study showed significant correlation coefficient
of 0.68 (see Appendix 10). Hence, the reliability coefficient of the test using the
Spearman Brown formula R = 2r/ (1+r) was 0.81. Thus the results obtained in this
study implied that the testing was very reliable.
3.5.5 METHODS USED IN THE CLASSROOMS
In the control group, how an educator introduces trigonometry depends solely on the
educator. Normally two different approaches are taken: the right-angled or unit circle
approaches, could be used for its introduction. The traditional method explained here
is as the educator in the control group, as is the norm with most teachers, described
his approach to trigonometry teaching. The teaching and learning here followed after
the Grade 10, 11, and 12 trigonometry syllabi as prescribed in the CAPS curriculum.
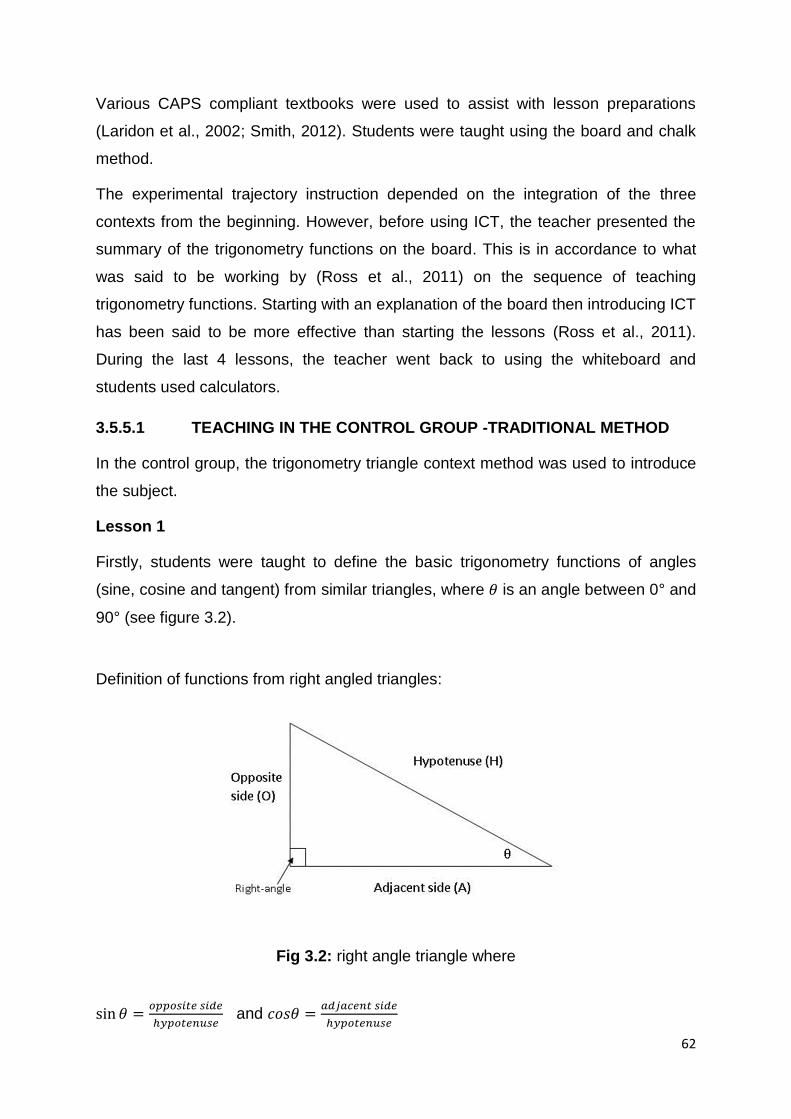
62
Various CAPS compliant textbooks were used to assist with lesson preparations
(Laridon et al., 2002; Smith, 2012). Students were taught using the board and chalk
method.
The experimental trajectory instruction depended on the integration of the three
contexts from the beginning. However, before using ICT, the teacher presented the
summary of the trigonometry functions on the board. This is in accordance to what
was said to be working by (Ross et al., 2011) on the sequence of teaching
trigonometry functions. Starting with an explanation of the board then introducing ICT
has been said to be more effective than starting the lessons (Ross et al., 2011).
During the last 4 lessons, the teacher went back to using the whiteboard and
students used calculators.
3.5.5.1 TEACHING IN THE CONTROL GROUP -TRADITIONAL METHOD
In the control group, the trigonometry triangle context method was used to introduce
the subject.
Lesson 1
Firstly, students were taught to define the basic trigonometry functions of angles
(sine, cosine and tangent) from similar triangles, where 𝜃 is an angle between 0° and
90° (see figure 3.2).
Definition of functions from right angled triangles:
Fig 3.2: right angle triangle where
sin 𝜃 =𝑜𝑝𝑝𝑜𝑠𝑖𝑡𝑒 𝑠𝑖𝑑𝑒
ℎ𝑦𝑝𝑜𝑡𝑒𝑛𝑢𝑠𝑒 and 𝑐𝑜𝑠𝜃 =
𝑎𝑑𝑗𝑎𝑐𝑒𝑛𝑡 𝑠𝑖𝑑𝑒
ℎ𝑦𝑝𝑜𝑡𝑒𝑛𝑢𝑠𝑒

63
This was followed by the definition and derivation of the tangent relation:
𝑡𝑎𝑛𝜃 =𝑠𝑖𝑛𝜃
𝑐𝑜𝑠𝜃 =
𝑜𝑝𝑝𝑜𝑠𝑖𝑡𝑒 𝑠𝑖𝑑𝑒
ℎ𝑦𝑝𝑜𝑡𝑒𝑛𝑢𝑠𝑒 ÷
𝑎𝑑𝑗𝑎𝑐𝑒𝑛𝑡 𝑠𝑖𝑑𝑒
ℎ𝑦𝑝𝑜𝑡𝑒𝑛𝑢𝑠𝑒 =
𝑜𝑝𝑝𝑜𝑠𝑖𝑡𝑒 𝑠𝑖𝑑𝑒
ℎ𝑦𝑝𝑜𝑡𝑒𝑛𝑢𝑠𝑒 ×
ℎ𝑦𝑝𝑜𝑡𝑒𝑛𝑢𝑠𝑒
𝑎𝑎𝑑𝑗𝑎𝑐𝑒𝑛𝑡 𝑠𝑖𝑑𝑒 =
𝑜𝑝𝑝𝑜𝑠𝑖𝑡𝑒 𝑠𝑖𝑑𝑒
𝑎𝑑𝑗𝑎𝑐𝑒𝑛𝑡 𝑠𝑖𝑑𝑒
Note: the hypotenuse was described as a radius of a circle from right at the
beginning.
Reciprocals of the trigonometry functions namely: 𝑐𝑜𝑠𝑒𝑐𝜃, 𝑠𝑒𝑐𝜃 and 𝑐𝑜𝑡𝜃 were then
defined. Thereafter, angles, change of angles made by rotation of a vector arm in a
clockwise and or anti-clockwise directions were presented and explained. A
Mnemonic, CAST- (Cos,All,Sin,Tan), was used to show the signs of the basic
trigonometry functions in the different quadrants. CAST starts from the fourth
quadrant. One would say 𝑐𝑜𝑠 is positive in the fourth quadrant, all trig functions are
positive in the first quadrant, etc.
Fig 3.3: Quadrants showing trigonometry function signs
Figure 3.4: The Unit circle representation

64
Figure 3.5: Trigonometry function graphs
Just before class activities were assigned, a few examples were given by the
teacher. When working with a Cartesian plane, the educator emphasised that the
students should first join the terminal end of the vector arm to the x-axis to make a
right angled triangle. Students were allowed to work in groups.
Lesson 2
Special angles diagrams were drawn and explained. One example of a task using
special angles was worked on by the educator as a demonstration. Square identities
were derived and explained. Examples that involve simplification of trigonometry
expressions and solving of basic equations were shown to students. The students
were then given exercises to work on. Solutions were given on the board. More
complex tasks were given to students as homework.
Lesson 3
At the beginning of the lesson, corrections from the previous day’s homework were
reviewed, written and explained. Graphical representations of the basic trigonometry
functions were presented. The properties of the functions were also described.
Students were then taught how to plot the trigonometry functions whilst using the
table method. Class activities were given and the educator assisted the students in
the plotting of various graphs. Homework that required the plotting of various graphs
and the analysis thereof, was given.

65
Lesson 4
Corrections of homework from the previous day were given and explained using
translation. Tasks on plotting of graphs, translation and derivation of formulae from
given graphs were given. Students were encouraged to work in groups. Corrections
were given.
The lesson ended with students being introduced to reduction formulae and
compound angles. Homework on solving and simplifying expressions and equations
was given.
Lesson 5
Solutions to the given homework were discussed. Students were shown how to work
on tasks that require general solutions, i.e., θ = 𝛼 + 𝑘360°;𝑘 ∈ ℤ. Class activities on
simplifying expressions, proving identities and determining general and specific
solutions of given equations were given and worked on in the classroom.
3.5.5.2 TEACHING IN THE EXPERIMENTAL METHOD
Geogebra was used in this class. At the beginning of each lesson, the educator
placed an outline on the blackboard of what was going to be covered. The educator
created a classroom environment in which social interaction was highly encouraged.
This was an environment where students used computers (Geogebra) to act on
trigonometry functions. The students were learning and transforming different
representations and how they relate to each other.
Since the study on the experimental group was based on the use of ICT, Geogebra,
in the teaching and learning of trigonometry, a sample of the activities used during
the lessons is presented below.
Lesson 1
At the beginning, the white board, projector and computers were used for the
introduction of trigonometry concepts and representations. The educator then
introduced Geogebra and its facets. This was then followed with the students
working on the computers both individually and in pairs. The students were also
seen to be moving from one computer to another to seek assistance or to assist
others whenever necessary.
The following applets were used:

66
Figure 3.6: Geogebra applet 1a
This was used to introduce Geogebra and to familirialize students with the use of
computers in general.
Figure 3.7: Geogebra applet 1b
The applet in Figure 3.7 was used to introduce:
quadrants,
angles,
basic trigonometry functions per quadrant,
trigonometry functions on general angles
Pythagoras theorem and
Other Geogebra operations
Algebra View Graphics View
Perspectives sidebar
Input Bar
Toolbar
Undo / Redo

67
Negative and positive angles
Figure 3.8: Geogebra applet 1c
The applet was to assist students in relating the movement of a point about a
unit circle to the basic trigonometry functions using the vertical displacement
(y-coordinate) and horizontal displacement (x-coordinate).
Figure 3.9: Geogebra applet 1d
The applet represented in figure 3.4 was to assist student in relating movement of a
point around a unit circle, to the development of any trigonometry graph.

68
Lesson 2
Homework was first corrected in class. After that an Applet was used to demonstrate
how to plot trigonometry graphs. Thereafter students were seen trying out a variety
of graphs.
Students then drew different kinds of graphs. They were given tasks to assist them in
developing the required objectives.
Students had to use two applets on their computers.
𝑌 = asin(𝑥 + 𝑏) + 𝑐
𝑌 = acos(𝑥 + 𝑏) + 𝑐
From here they were required to determine the characteristics of the graphs such as
the amplitude, intercepts, period, range and domain. Thereafter students were seen
trying out a variety of graphs among themselves while constantly receiving
assistance from the educator.
Homework was then given on the plotting and transformation for the 𝑡𝑎𝑛 function.
Lesson3
Corrections to the homework on 𝑡𝑎𝑛 functions was done by the educator and
students in using:
applet3.1 (the effects of 𝑎, 𝑏, 𝑐 and 𝑑 on the basic trig function)
Figure 3.10: Geogebra applet showing the effects of applet 1e showing the effects
of 𝑎, 𝑏, 𝑐 and 𝑑 on the basic trigonometry functions

69
The students were then given tasks to analyze relationships between different
functions such as points of intersection and 𝑓(𝑥)< 𝑔(𝑥). Figure 3.6 is an example of
the applets they were given to students to work on.
Figure 3.11: Geogebra applet for the analysis of trigonometry graphs
They played around with different kinds of graphs, discussed them in class and then
worked on their own sets of graphs and analyses.
Lesson 4-5
From the computer laboratory, the students moved to their normal classroom, where
the teacher used the whiteboard and the projector to discuss and explain the various
concepts. Students were still seen to be actively working individually or in groups of
four or five.
In these lessons the following topics were dealt with:
Simplifying expressions;
General solutions and solving equations were dealt with here;
Reduction formulae, negative angles, compound angles were used in all this
Self- and peer-assessments were used during the last two lessons.
3.5.6 DATA ANALYSIS
Data analysis is the process of making sense out of data, which involves interpreting,
transforming and modelling what participants have said, how they have responded
and what the researcher has seen and read in order to derive or make meaning out
of the process.

70
Researchers go through similar steps for both qualitative and quantitative data
analysis. Creswell and Plano Clark (2011) list the data analysis steps as follows:
• preparing the data for analysis
• exploring the data
• analysing the data
• representing the analysis
• interpreting the analysis
• validating the data and interpretation
In this study, descriptive and inferential statistics were used for the quantitative data
analyses. The type of statistical analysis employed in the study was the t-test. The t-
test is the most commonly used test in mathematics education that involves small
sample sizes (McKnight et al., 2000). In addition to the t-test being more favourable
for a two-grouped sample, (Laerd, 2013) states that ANOVA is normally used on
three or more independent groups. Hence the t-test was used. Computationally, the
statistical software package Statistical Package for the Social Sciences (SPSS)
(version 23) was used.
3.6 ETHICAL CONSIDERATIONS
Ethics is a philosophical term derived from the Greek word, ethos, meaning
character or custom and a social code that conveys moral integrity and consistent
values (Partington, 2003). According to (Babbie & Mouton, 2001), ethics of science
is concerned with what is right or wrong when conducting research. To this end, all
researchers are subjected to ethical considerations, regardless of their choice of
research methodologies (Gratton & Jones, 2010). Therefore, in the current study, the
ethical considerations required a right of entry; voluntary participation; anonymity and
confidentiality; and ethical clearance from the University of South Africa (UNISA).
During all aspects of the study, the following ethical considerations were taken into account:
Ethical clearance was sought for, from the research committee of UNISA for
permission to conduct the study. The permission was granted (see Appendix 3)
The Deputy Director of Education granted consent for research in schools (see
Appendix 5)
Permission was requested from the schools, school governing bodies and each
teacher and student. Parents were not informed since the students were all

71
above 18 years. All the appropriate individuals signed the approval and
voluntary participation forms. All the involved participants were informed of the
nature of the study, research process participation requirements, confidentiality
and the researcher’s contact details.
For confidentiality, the names of the schools and the names of the students /
educators were not disclosed in the study. For professional reasons and
anonymity, the content and results of the study were discussed with relevant
people only
To minimise income or digital exposure disparity - It was expected that some
students may have studied computers before or had computers at home and
some may not have used computers at all before, so in order to avoid disparity
it was imperative that all the students in the experimental class were first
introduced to the Geogebra (Voronkov, 2004).
3.7 SUMMARY
This chapter discussed the methodology adopted in the study, that is , the paradigm,
which informed the study, the research design and the research methods (e.g. the
study sample and population, the procedure for conducting the research and the
research instruments, the different instructional methods used in the experimental
and control groups, data analysis and the ethical considerations). The methodology
was developed with the objective of obtaining reliable and valid data to respond to
the main purpose of the study: to determine which instructional method was more
effective in the teaching and learning of trigonometry functions.

72
CHAPTER FOUR
FINDINGS
This chapter presents the analysis and interpretation of data that were collected from
the 61 students in the two (2) sampled schools. Data were collected using
achievement tests (pre/posttests) (Appendices 1 & 2). Independent-samples t-test
was used as the statistical measure to establish the comparability of the two groups
(the experimental and control) before and after the intervention. Using the Statistical
Package for the Social Sciences (SPSS) the independent-samples t-test output
gives two tables: a descriptive and an inferential statistics table.
The Descriptive/Group Statistics (e.g. mean)
– Statistical procedures used for summarizing, organizing, graphing and
describing data. This statistics cannot be generalized beyond the analyzed
sample data.
Inferential Statistics (e.g. t-test)
– Statistical procedures that allow one to draw inferences to the population on
the basis of sample data. Represented as tests of significance (test
relationships and differences) (Devonish, Gay, Alleyne, & Alleyne, 2006).
The group/ descriptive statistic table provides the sample groups’ means, standard
deviation, and the number of participants per group. From this, the mean difference
between the two groups can be worked out. A 𝑡 − 𝑡𝑒𝑠𝑡 was carried out in order to
determine whether the mean difference between the two groups was statistically
significantly different. The 𝑡 − 𝑡𝑒𝑠𝑡 is a statistic that assesses whether the means
from data of one or two groups are reliably different from each other (Rice, 2006).
In the inferential table, firstly the Levene test is used to determine the equality of
variance between the two groups (Levene, 1960), that is, the test determines
whether the two groups have about the same or different amounts of variability
between their scores. If the significant value is less than 0.05, then one could
conclude ‘equal variance is not assumed’ and the second row is used for the 𝑡 −
𝑡𝑒𝑠𝑡 , otherwise if significant value is greater than 0.05 then equality of variance
between the two groups is assumed and the first row is used to work on the 𝑡 − 𝑡𝑒𝑠𝑡.

73
Using the 𝑡 − 𝑡𝑒𝑠𝑡, if 𝑠𝑖𝑔 p<0.05 one concludes that there is a statistically significant
difference between the mean scores of the two groups.
The present chapter presents the findings from the assessments and the statistical
analyses of the data. In answering the research questions focusing on the overall
performance on the achievement tests; the connections; the interpretations; solving
equations; and proving identities of trigonometry functions.
The chapter is organized into three main sections,
The statistical analysis and interpretation of the pre-test,
the statistical analyses of the general post-tests,
the statistical analysis and interpretations of the grouped questions in the
post-test, and finally
A summary of the chapter.
4.1 PRE-TEST RESULTS
The pre-test was administered before the treatment to determine whether the means
of the two groups were comparable. It was found that no statistically significant
difference existed between the pre-test scores of both the control and the treatment
groups. This showed that the two groups had similar basic understanding and
knowledge of trigonometry functions before the intervention. This is indicated in
Tables 4.1 and 4.2.
Table 4.1: Groups mean achievement in the pre-test
N Mean Std. Deviation Std. Error Mean
Pretests Experimental 27 15.8519 9.29724 1.78926
Control 34 13.5294 9.45239 1.62107
The total number of students who wrote the pre-test was 61. Of the 61 students, 27
participated in the experimental group whilst 34 were in the control group. From the

74
table above it can also be deduced that with a mean difference of 2.3225, on
average, the difference between the students’ results in both groups was similar.
Using the Levene test as showing in the first column of Table 4.2, the significant
value = 0.916 (sig >0.05). This meant that the scores in both groups did not vary
significantly, that is, the variability in the scores was about the same. The 𝑡 − 𝑡𝑒𝑠𝑡
results would thus be read from the first row. Here, the sig (2-Tailed) =0.34 >0.05. It
was thus concluded that there was no statistically significant difference between the
scores for the pre-tests of the two groups (the experimental and the control groups).
Table 4.2: t-test analyses of the students’ achievement in the pre-test
Independent samples test
Levene's
Test for
Equality of
Variances t-test for Equality of Means
F Sig. T Df
Sig. (2-
tailed)
Mean
Difference
Std. Error
Difference
95% Confidence
Interval of the
Difference
Lower Upper
Pre_Tests Equal
variances
assumed
.011 .916 .960 59 .341 2.32244 2.41906 -2.51809 7.16297
Equal
variances
not
assumed
.962 56.310 .340 2.32244 2.41440 -2.51359 7.15847

75
4.2 RESULTS OF THE GENERAL PERFORMANCE IN THE POST-TEST
The post-test (see Appendix 2), which was to assess students’ knowledge and
understanding of the key points from the lesson sequence, was administered to the
students three days after the intervention ended. All the students in the study took
the test. They were requested to complete the test in one and half hours, and were
told that their marks were only for research purposes and thus would not count
towards their final end-of-year mathematics grade.
This section provided the statistical results and analyses of the overall performances
in the post-test, the students’ performance on connections, interpretation of
trigonometry functions etc. This was to assist us in answering the questions in the
main study. Statistical analysis on individual questions was also carried out (see
Appendices 12-37).
4.2.1 RESULT OF THE GENERAL PERFORMANCE IN THE POST-TEST
To determine whether any significant statistical difference existed between the post-
test scores of both the control and the experimental group, a descriptive statistics
and an inferential statistics table are presented in Tables 4.3 and 4.4.
Table 4.3: Overall students’ performance in the Post-test
Group Statistics
SchoolNames N Mean Std. Deviation Std. Error Mean
Post_Tests Experimental 27 35.5185 11.20910 2.15719
Control 34 20.4412 14.52937 2.49177
All students who wrote the pre-test also wrote the post-test. The total number of
students who wrote the post-test was 61. Of the 61 students, 27 were in the
experimental group whilst 34 were in the control group. From Table 4.3 it can be
seen that the mean difference between the two groups was 15.08. It can also be
seen that for each group the mean difference between the pre_test and post_test
increased, with the control group mean increasing by 6.91 and the experimental
group mean increasing by 19.67. This means there was an improvement in both
groups, even though, it was evident that the improvement was considerably higher in

76
the experimental group than in the control group. The standard deviation of the
experimental group had a smaller increase than the standard deviation of the control
group. This shows that there was a wider gap of performance between students
who understood trigonometry functions in the control group than the gap in the
experimental group.
Inferential statistics (𝒕 − 𝒕𝒆𝒔𝒕)
Using the Levene test as is shown in the first column of table 4.4, the significant
value = 0.275 (sig <0.5). This means that there was a statistically significant
difference between the two post-tests of the groups. The 𝑡 − 𝑡𝑒𝑠𝑡 results were thus
read from the second row. Here, the sig (2-Tailed) =0.000, which is smaller than
0.05. It can thus be concluded that there was a statistically significant difference
between the scores of the post-tests of the two groups. One can then conclude that
the difference between the two means are not likely due to chance but probably due
to the intervention (the use of ICT in the experimental group).
TABLE 4.4: t-test analyses of the students’ achievement in the post-test
Independent Samples Test
Levene's Test
for Equality of
Variances t-test for Equality of Means
F Sig. T df
Sig.
(2-
taile
d)
Mean
Differen
ce
Std.
Error
Differen
ce
95% Confidence
Interval of the
Difference
Lower Upper
Post_
Tests
Equal variances
assumed 1.214 .275 4.441 59 .000
15.0773
4 3.39486 8.28425 21.87044
Equal variances
not assumed 4.575 58.964 .000
15.0773
4 3.29581 8.48235 21.67233

77
4.2.2 RESULTS OF GROUPED QUESTIONS
For the analysis. The tasks/questions in the pre_post-test were grouped according to
their common characteristics.
Questions 1.1 a-c, 2a-2c and 5.1.1-5.1.3 were grouped into the group for
connections of different representations of trigonometry functions;
Questions 1.2a-h and Q3 were grouped under interpretations on trigonometry
functions;
Question 1.2i and 4 were grouped into the transformations of trigonometry
functions;
Questions 5.2 and 5.3 were placed into the derivation of general and specific
solutions group; and
Question 5.4 dealt with proving a trigonometry identity.
The clarification of the questions is given in Table 3.3. Figure 4.1 shows a graphical
representation of students’ performance on grouped and general questions of the
post-test.

78
Figure 4.1: Graphical representation showing students’ performance on grouped
questions in the Post-test
4.2.2.1 CONNECTIONS
An independent samples 𝑡 − 𝑡𝑒𝑠𝑡 was used to test for the possible effect of using
Geogebra in the teaching and learning of connections between representations of
trigonometry functions.
From the Table 4.6 the 𝑠𝑖𝑔 (2-tailed) =0.00 <0.05, the experimental group was
associated with higher achievement in making connections between various
representations of trigonometry functions (Experimental M= 14.41; Control M= 7.65).
As such it can then be concluded that the difference between the two means is not
likely due to chance but probably due to the intervention

79
Table 4.5: Students’ mean achievement on connections
N Mean Std. Deviation Std. Error Mean
Experimental 27 14.41 2.978 .573
Control 34 7.65 4.735 .812
Table 4.6: t-test on students’ ability to make connections of representations of
trigonometry functions
Levene's Test for
Equality of
Variances t-test for Equality of Means
F Sig. t Df
Sig. (2-
tailed)
Mean
Difference
Std. Error
Difference
95% Confidence
Interval of the
Difference
Lower Upper
Equal variances
assumed 1.684 .199 6.467 59 .000 6.760 1.045 4.669 8.852
Equal variances
not assumed 6.802 56.324 .000 6.760 .994 4.770 8.751
4.2.2.2 INTERPRETATION
An independent samples 𝑡 − 𝑡𝑒𝑠𝑡 was used to test for the effectiveness of Geogebra
in the students interpretations of trigonometry functions tasks as shown on Table 4.8.
The result (t (59) =2.23, the sig (2-tailed) =0.03< 0.05 shows that there was a
statistically significant difference between the performance of the experimental group
and the control group on interpretation of representations of trigonometry functions
with the experimental group being associated with higher performance (Experimental
M= 10.89; Control M= 7.74).

80
Table 4.7: Students’ mean achievement on interpretations of trigonometry functions
Group Statistics
1 N Mean Std. Deviation Std. Error Mean
8 Experimental 27 10.89 4.870 .937
Control 34 7.74 5.925 1.016
Table 4.8: t-test on students’ interpretations of trigonometry functions
Levene's Test for
Equality of
Variances t-test for Equality of Means
F Sig. T Df
Sig. (2-
tailed)
Mean
Difference
Std. Error
Difference
95% Confidence
Interval of the
Difference
Lower Upper
8 Equal variances
assumed 2.044 .158 2.230 59 .030 3.154 1.414 .324 5.983
Equal variances
not assumed 2.281 58.914 .026 3.154 1.382 .387 5.920

81
4.2.2.3 TRANSFORMATION
From the Table 4.10 𝑡 (59) =5.56, p=0.00 with the experimental group being
associated with higher performance in transformation of various representations of
trigonometry functions (Experimental M= 2.52; Control M= 0.35). This represented
statistically significant difference between the two groups.
Table 4.9: Students’ mean achievement on transformations
1 N Mean Std. Deviation Std. Error Mean
1 Experimental 27 2.52 2.026 .390
Control 34 .35 .917 .157
Table 4.10: t-test on students’ transformation of trigonometry functions
Independent Samples Test
Levene's Test
for Equality of
Variances t-test for Equality of Means
F Sig. T Df
Sig. (2-
tailed)
Mean
Difference
Std. Error
Difference
95% Confidence
Interval of the
Difference
Lower Upper
1 Equal variances
assumed 26.248 .000 5.564 59 .000 2.166 .389 1.387 2.944
Equal variances
not assumed 5.150 34.433 .000 2.166 .420 1.311 3.020
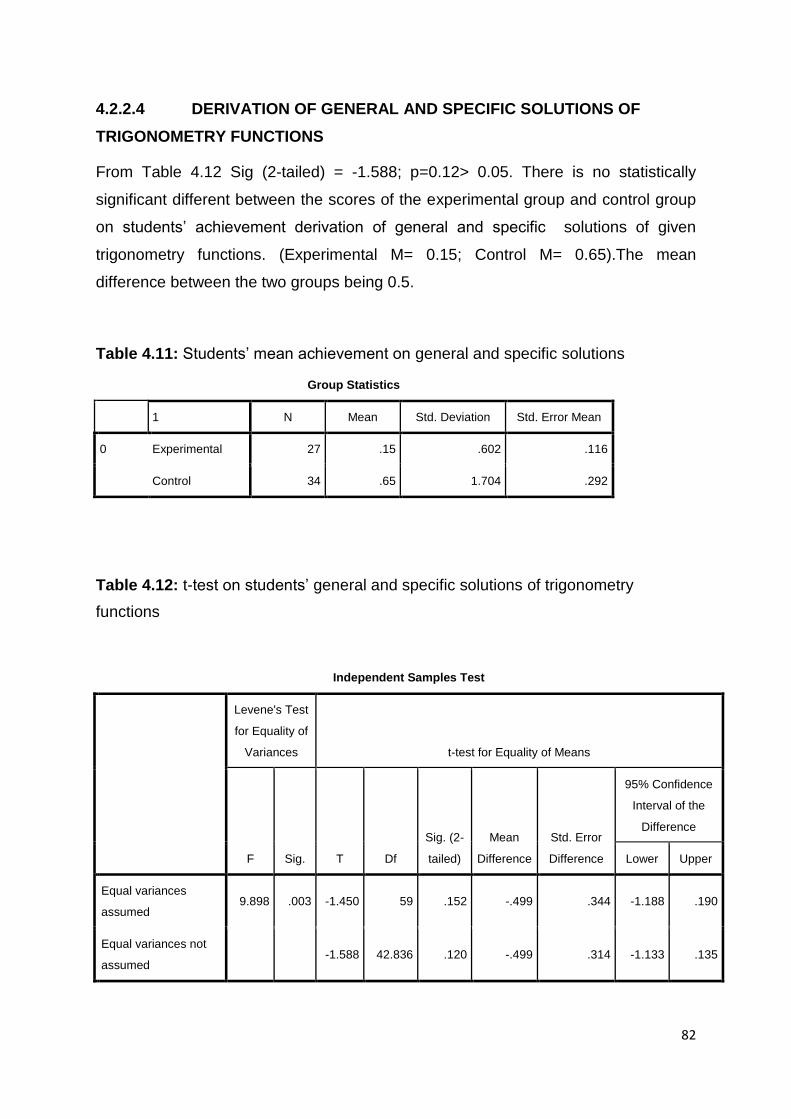
82
4.2.2.4 DERIVATION OF GENERAL AND SPECIFIC SOLUTIONS OF
TRIGONOMETRY FUNCTIONS
From Table 4.12 Sig (2-tailed) = -1.588; p=0.12> 0.05. There is no statistically
significant different between the scores of the experimental group and control group
on students’ achievement derivation of general and specific solutions of given
trigonometry functions. (Experimental M= 0.15; Control M= 0.65).The mean
difference between the two groups being 0.5.
Table 4.11: Students’ mean achievement on general and specific solutions
Group Statistics
1 N Mean Std. Deviation Std. Error Mean
0 Experimental 27 .15 .602 .116
Control 34 .65 1.704 .292
Table 4.12: t-test on students’ general and specific solutions of trigonometry
functions
Independent Samples Test
Levene's Test
for Equality of
Variances t-test for Equality of Means
F Sig. T Df
Sig. (2-
tailed)
Mean
Difference
Std. Error
Difference
95% Confidence
Interval of the
Difference
Lower Upper
0 Equal variances
assumed 9.898 .003 -1.450 59 .152 -.499 .344 -1.188 .190
Equal variances not
assumed -1.588 42.836 .120 -.499 .314 -1.133 .135

83
4.2.2.5 PROOF ON TRIGONOMETRY IDENTITIES
None of the students in either of the two groups answered this question.
4.2.2.6 EQUATIONS
The solving of equations problems showed that neither the use of ICT nor the
traditional method of teaching could be said to have influenced the results. The two
groups were actually taught using the traditional method.
4.3 ADDRESSING THE RESEARCH QUESTIONS
To complete the study, the analysis from the data collected was used here to test the
research hypotheses and answer the main and sub-research questions.
4.3.1 MAIN RESEARCH QUESTION
The main question in this study was: What is the effect of ICT on students’ learning
of trigonometry functions? To respond to this question, firstly, the independent
samples 𝑡 − 𝑡𝑒𝑠𝑡 was carried out, presented, and interpreted in section 4.2.1. This
was to statistically analyse the overall performance of students on trigonometry
functions. ICT was shown to have had a positive effect on students’ learning of
trigonometry functions.
Secondly, to answer the main question the following sub-questions were generated:
I. Does the use of ICT in the teaching and learning of trigonometry
functions have an effect on students making connections between
representations of trigonometry functions?
II. Does the use of ICT in the teaching and learning of trigonometry
functions have an effect on students’ analysis and interpretations of
trigonometry functions?
III. Does the use of ICT in the teaching and learning of trigonometry
functions have an effect on students learning transformation of
trigonometry functions?
IV. Does the use of ICT in the teaching and learning of trigonometry
functions have an effect on students’ derivation of general and specific
solutions of trigonometry functions?

84
V. Does the teaching and learning of trigonometry functions with ICT have
an effect on students’ proof of trigonometry functions identities?
In order to answer these questions, the related null hypotheses were tested.
NULL HYPOTHESIS 1
Null Hypothesis 1: There is no statistically significant difference between the
achievement of students taught using ICT and those taught using the traditional
method in making connections between different representations of trigonometry
functions.
Students in the experimental group performed better than the students in the control
group in questions which involved connections between trigonometry functions;
graphs; formulae and unit circles. This was evidenced by the results of the
independent sample 𝑡 − 𝑡𝑒𝑠𝑡 analysis on connections (see Tables 4.5 and 4.6). The
results showed that the mean performance score of the experimental group
(Experimental M= 14.41) were statistically significantly higher than the mean of the
control group (Control M= 7.65). Therefore it can be concluded that the Null
Hypothesis 1 can be rejected. The use of ICT in the teaching and learning of
trigonometry functions had a positive effect on students’ making of connections
between different representations of trigonometry graphs.
NULL HYPOTHESIS 2:
Null Hypothesis 2: The use of ICT in the teaching and learning of trigonometry
functions has no statistically significant difference in learning of properties of
trigonometry functions.
On the interpretation of trigonometry functions (Q1.2a to Q1.2h) there was significant
difference between the mean of the experimental and the control group,
(Experimental M= 10.89; Control M= 7.74). Not that much significant difference
between the two groups could be noticed as far as student’s determination of domain
and range of given functions (see Appendices 12A-21B; 28-337B). Thus, the
hypothesis was rejected.

85
NULL HYPOTHESIS 3:
Null Hypothesis 3: The use of ICT in the teaching and learning of trigonometry
functions has no statistically significant difference on students learning
transformation of trigonometry functions.
The statistical analysis showed that there was a significant difference between the
mean scores of the two groups (see Tables 4.9 and 4.10) on transformation of
trigonometry functions. This shows that ICT has a positive effect on students’
learning of transformations of trigonometry functions. This means that the null
hypothesis 3 can be rejected.
NULL HYPOTHESIS 4
Null Hypothesis 4: The use of ICT in the teaching and learning of trigonometry
functions has no statistically significant difference on students’ derivation of general
and specific solutions of trigonometry functions.
The results in Tables 4.11 and 4.12 showed that there was no statistically significant
difference between the means of the two groups on general and specific solutions of
trigonometry functions in the study. Thus it could be said from this that the
performance of students on solving of equations could not be attributed to any of the
teaching methods used in the study. This means that the differences between the
means are likely due to chance and not likely due to either the intervention or the
traditional method of teaching.
NULL HYPOTHESIS 5
Null Hypothesis 5: The use of ICT in the teaching and learning of trigonometry
functions has no statistically significant difference on students’ proof of trigonometry
functions identities.
The students did not answer this question.
4.4 SUMMARY
The purpose of this study was to evaluate the effectiveness of the use of Information
and Communication Technology in the teaching and learning of trigonometry
functions on Grade 12 between students who received instruction that used ICT and

86
those who received traditional method instructions. Data were collected using a pre-
test, and a post-test. The pre-test and post-test scores were analysed using 𝑡 − 𝑡𝑒𝑠𝑡.
The students’ performance on individual test questions for the post-test were also
analyzed and interpreted. The 𝑡 − 𝑡𝑒𝑠𝑡 was used for the general and individual
questions. The statistical analysis for individual questions is presented in Appendices
12-38.
The analyses of the data meant to provide answers to the research questions were
carried out. The results of the analyses showed that a positive relationship existed
between ICT use and students’ achievement in making connections, interpretations
and transformations of various representations of trigonometric functions.
87
CHAPTER FIVE
DISCUSSION OF FINDINGS, CONCLUSION AND
RECOMMENDATIONS
The main purpose of the study was to evaluate the effectiveness of the use of
Information and Communication Technology (ICT) in the form of using Geogebra in a
teaching and learning environment. APOS and AT were used in designing the
intervention in the study.
In this chapter a summary of the study is presented, this is then followed by a
summary of the findings/results from the experimental study. The chapter also
presents the main discussion emanating from the findings, and then puts forward the
conclusion and implications of the findings. The chapter ends with the limitations of
the study and recommendations for future studies.
5.1 SUMMARY OF THE STUDY
The current study was motivated by continued poor performance by students in
mathematics subjects (specifically, trigonometry functions). Trigonometry, a branch
of mathematics, has been found to be a major challenge for students in the high
school curriculum. From the literature review, some of the reasons for these
challenges have been said to be due to the method of teaching (chalk and talk) and
the inability of students to connect or link the different contexts of trigonometry
functions. In this study the theoretical frameworks, APOS and AT were used to
advise on the instruction process in the classroom. The ICT software (Geogebra)
was used as a teaching and learning tool. ICT has been said to assist more in
alleviating the problems encountered by students in the learning of trigonometry
functions (Tall, 2009). This provided the impetus for the study.
The review of the literature on the use of ICT in the teaching and learning of
trigonometry functions followed the introduction. The literature review focused on
some of the available studies on trigonometry, the research carried out on the
teaching and learning of trigonometry functions, ICT in teaching and learning, the
software used (Geogebra), and ICT in the teaching and learning of trigonometry
functions. It was found that there is still a scarcity of studies that have been carried

88
out on the use of ICT on trigonometry, especially in South Africa. This study centred
on a quantitative research approach, in which non-equivalent groups, pre- post-test
and quasi-experimental design (or methodology) were employed.
In this study, two schools in the Mafikeng area which is in the North West province
were selected. The sample consisted of 61 participants, with 27 students in the
experimental group and 34 in the control group, both who were going to sit for the
matric examinations at the end of 2016. Before the lessons both groups wrote the
pre-test (see Appendix 1). This was to determine the comparability of the students
before the intervention. The results of the pre-tests showed that the students from
both groups were of comparable ability.
After the lessons, a post-test (see Appendix 2) was administered to all the students
in the two groups. Overall, the experimental group (which used Geogebra)
performed much better than the control group (where the traditional method of
teaching and learning was used). This means the use of ICT had a positive effect on
the teaching and learning of trigonometry functions. Students’ answers to the
grouped questions of the post-test were presented, statistically analysed and
interpreted.
The 𝑡 − 𝑡𝑒𝑠𝑡 (using the statistical software SPSS) was used for the analysis to first
determine the equivalence or non-equivalence between the two groups and then to
determine whether the two groups’ results after intervention were significantly
different or not.
5.2 SUMMARY OF THE FINDINGS
In response to the main question of the current study: What the effect of ICT on
students’ learning of trigonometry functions is, five sub-questions were developed to
assist in answering the main question. It was found that ICT had a significant positive
effect on students’ ability to make connections between different representations of
trigonometry functions, on the analysis and interpretations of the given tasks of
various contexts of trigonometry functions and on transformations of trigonometry
functions.
Neither the traditional method of teaching and learning nor the teaching with ICT was
found to have had an effect on the students’ derivation of general and specific

89
solutions of trigonometry functions (see Table 4.11 and 4.12). It can thus be said that
ICT has positively influenced the performance of the students. For individual
analyses before the questions were grouped, see appendices 11-37B.
5.3 DISCUSSION OF FINDINGS
5.3.1 THE OVERALL PERFORMANCE OF THE STUDENTS
The overall performance of the students (in the assessment test on trigonometry
functions) from the experimental group was better than that of the control group.
That means ICT, Geogebra in this study, was shown to be more effective in the
teaching and learning of trigonometry functions. This is consistent with the studies by
Zengin et al., (2011); Demir, (2012) who found that the students’ achievement after
instruction that involved Geogebra improved more than for the students who did not
receive such instruction.
5.3.2 CONNECTIONS OF TRIGONOMETRY FUNCTIONS
On connections of trigonometry functions, the experimental group was found to have
scored higher than the control group. Here it can be deduced that the use of ICT is
effective in the students’ ability to make connections between different
representations and contexts of trigonometry functions. The tasks that involved
connections included drawing of graphs from given algebraic representations,
derivation of formulae (equations) of graphs, and connecting a unit circle to a point
on the graph (Table 3.3). Most of the students in this study managed to plot the
graphs, which is in contradiction to what Demir (2012) found in his study that most
students could not draw the cosine graphs. Similar to the results of Demir (2012),
many students in this study, could connect a point on the unit circle to a point on a
graph, which is in contrast to the findings of Brown (2005). Only a few studies have
dealt with connections of trig functions and even less have been seen to be dealing
with tangent functions. This study is the first comprehensive study that involves all
the basic trigonometry functions and their connections.
5.3.3 INTERPRETATION AND ANALYSIS OF TRIGONOMETRY FUNCTIONS
When it comes to interpretation and analysis of trigonometry functions, the
experimental group was found to have performed significantly better than the control
group. Here we can deduce that the use of ICT is effective in improving the students’

90
ability to interpret and analyze trigonometry functions. During the lesson in the
experimental group the students only needed to type in equations which produced
different trigonometry graphs. This allowed and gave them time to explore,
investigate and interpret the properties of the different graphs. This was unlike
situations where students would have to draw graphs manually from point to point
and then analyse them. This is confirmed by (Clements, 2000) who stated that
instant feedback from ICT programs encourages students to use conjectures and to
keep exploring.
5.3.4 TRANSFORMATION OF TRIGONOMETRY FUNCTIONS
With transformation of trigonometry functions, the results of the 𝑡 − 𝑡𝑒𝑠𝑡 in Table 4.10
show that there was a statistically significant difference between the mean of the
experimental group and that of the control group. The experimental group performed
much better than the control group. Similar results were found on individual
questions based on transformation (Appendices 12-21; Appendices 24A, 24B; 28-
337B). The findings suggest ICT-assisted instruction is preferable in supporting
student learning of transformations of trigonometric functions. The finding was in
agreement with the findings of Bakar, Ayub, Luan, & Tarmizi, 2010; Ross et al.,
2011).
5.3.5 DERIVATIONS OF GENERAL AND SPECIFIC SOLUTIONS OF TRIGONOMETRY
FUNCTIONS
On derivations of general and specific solutions of trigonometry functions, there was
no statistically significant difference between the experimental and the control group
(See Table 4.12). It was then concluded from the results of solving equations, that
neither the use of ICT nor the traditional method of teaching could be said to have
influenced the results. It should be noted here that after the teaching and learning of
trigonometry functions, the students in the experimental group did not use Geogebra
in the remaining lessons which involved solving equations, simplifying expressions
and proving identities. The students showed a preference to using calculators. This
was a preference which was also observed in the pilot study (Section 3.5). The
students in the pilot study expressed that they prefer to use calculators since this is
what they use during the examinations. They indicated that the use of the computer
would be more time consuming and unnecessary.

91
The students in both groups omitted the question on proving identities. The reasons
could be their inability to prove identities of trigonometric functions. As noted by
Demir, (2012), who found that an overwhelming number of students in his study
were not able to prove a trigonometric relationship with a variable. This he said was
most probably related to students’ capabilities in doing mathematical proofs. Another
reason for the omission could be due to a lack of motivation (Jakwerth, Stancavage,
& Reed, 1999), since students were informed beforehand that they were not going to
be graded for the study.
In the current research, ICT has been statistically proven to be more effective in the
teaching and learning of trigonometry functions, specifically with connections
between, interpretation of, and transformation of trigonometry functions. However
there are variables which were not considered, such as the teachers’ experience and
qualification. Which means that the qualifications of the teacher is a factor in any
experiment carried out in the classroom teaching and learning. It has been found that
the level of teachers’ content knowledge of trigonometry functions is directly
proportional to the level of students’ achievement. That is, the students’ poor
achievement in trigonometry functions could be related to teacher’s lack of content
knowledge of the same topic (Hanssen; Ogbonnaya & Mogari, 2014).
5.4 CONCLUSION
The investigation was based on AT and APOS as the theoretical frameworks. Both
AT and APOS were therefore used in advising and constructing the teaching and
learning instructions and the classroom environment. The use of ICT encouraged
the students to explore the effects of certain inputs on the trigonometry functions.
In this way students became creatively and actively involved in solving trigonometry
functions tasks by plotting and transforming graphs, determining properties of
trigonometry functions, and connecting various representations of trigonometry
functions. This encouraged peer to peer interaction and students were seen to
participate more in the classroom. The teacher mainly acted as a facilitator in the
experimental class.
The aim of the study was to investigate the effectiveness of the use of ICT in the
teaching and learning of trigonometry functions. The results of the investigation
indicate that the use of ICT had a markedly positive impact on students’

92
achievements, and influenced the way trigonometry functions were taught and
learnt in the classroom. According to Raines and Clarke (2011), computers enable
students to actively participate in class.
5.5 IMPLICATIONS OF THE FINDINGS AND RECOMMENDATIONS
This study was based on Geogebra use on trigonometry functions. Encouraging
results were obtained.
From the overall results, it can be seen that the AT and APOS constructed
instruction with the use of ICT software (Geogebra) assists positively when it comes
to the teaching and learning of trigonometry functions. This is more-so when it
comes to connections of trigonometry functions, interpretations of graphs and the
analysis thereof. The study also indicated that introducing theory before using ICT is
important in producing positive outcomes.
The study may also inform and demonstrate to other educators, the role of
technology, specifically of Geogebra, in teaching and learning of trigonometry
functions. The study may be used as an example and a guide that other
mathematics educators could consider for incorporation in the delivery of their
lessons and materials in classrooms.
5.6 LIMITATIONS OF THE STUDY AND RECOMMENDATIONS FOR FUTURE
STUDY
The results from this study, that ICT is effective in the teaching and learning of
Trigonometry functions cannot be generalised, as the study was conducted in only
two schools, with specific conditions, in the North West Province, South Africa.
The duration of the study was rather short, seeing that lessons had to be completed
within 10 hours during the normal class times unlike in the pilot study whereby the
study and the teaching took place after the normal classes. The students in the main
study were having extra classes in the afternoon so interviews could not be
conducted after the post-test. Everything had to be rushed. An upgrading school
has to finish the syllabus of grades 10-12 within a shorter time frame. Considering
that most of the students come with level ones (< 30%) in the upgrading schools
from their previous schools and already expressed their dislike of trigonometry

93
because they fail to understand it (results from the pre-test), the duration of doing
trigonometry of three years in ten hours is quite a challenge. Again because of this
time-limit, while the students were being prepared for grade 12 final examinations,
the schools were reluctant to grant more time for the teaching of trigonometry. The
question paper had to comply with the prescribed syllabus as directed by the CAPS
syllabus. This is the reason why the application section of trigonometry (e.g. the two
dimensional and the three dimensional sections which were supposed to be dealt
with in the third term could not be included in the assessment) was excluded from
the taught and assessed materials.
At the end of the study, interviews were supposed to be conducted, however these
could not be carried out due to time constraints seeing that, unlike in the pilot, the
study had to be carried out in the normal designated time slots in the mornings. A
similar study should be carried out in formal grades 10 and 11 high school
environment where there is more time and less pressure so as to be able to
incorporate more than one assessment method.
Based on these findings many more schools and educators would be encouraged to
adopt and utilize Geogebra for the teaching of Trigonometry functions. From what
has been seen, educators should not depend on Geogebra alone but should also
use the whiteboard and books. During the learning and teaching process, as far as
the trigonometry functions are concerned, Geogebra encourages students to focus
on connections between geometric and algebraic representations. It is
recommended that schools are provided with computers and software such as
Geogebra be installed for the incorporation of ICT in the teaching and learning of
subject content. Schools should also have policies in place to monitor, encourage
and ensure that ICT is used effectively for the teaching and learning of different
subjects. Teachers should also be encouraged to attend workshops and in-service
training that deal with ICT in the teaching and learning of subject matter.
The results of this study showed that there is good potential in using ICT in the
teaching and learning of trigonometry functions, but more research needs to be
carried out to examine the long-term effects of the use of ICT in the students’
mathematical achievements. More research on the use of ICT in teaching
mathematics should be carried out by educators themselves since they are the ones

94
in class every day. In addition, future studies should focus on what it is in this study
that caused the results of students’ responses to questions on determining the
general and specific solutions of equations to not be significantly different between
the experimental and the control group.
Furthermore, more studies should also concentrate on finding larger groups to
participate in similar research, as larger sample sizes may bring more accurate
results and thereby remove any doubts that may exist concerning the results of the
present study, particularly the significant differences in scores between the students
using Geogebra and those that did not use it.
Lastly, since only quantitative research was used in the study, in future research
triangulation can be used to incorporate both qualitative and quantitative
approaches.

95
REFERENCES
Adamek, T., Penkalski, K., & Valentine, G. (2005). The History Of Trigonometry. http://www.math.rutgers.edu/~mjraman/History Of Trig.pdf.
Addelman, M. (2012). Traditional Teaching Methods still dominant in Maths Classrooms [Press release]. Retrieved from www.manchester.ac.uk/discover/news/traditional-teaching-methods-still-dominant-in maths classrooms.
Anderson, P. F. (1983). Marketing, Scientific Progress and Scientific Method. Journal of Marketing, 47, 18-31.
Andrews, P. P. (1996 ). The impact of first computer encounters on mathematics teachers’ computer competence, . Journal of Information Technology for Teacher Education,, 5, 301-316.
Arcavi, A. (2003). The role of visual representations in the learning of mathematics. Educational Studies in Mathematics, 52, 215-241.
Arnawa, I. M., Sumarno, U., Kartasasmita, B., & Baskoro, E. T. (2007). APPLYING THE APOS THEORY TO IMPROVE STUDENTS ABILITY TO PROVE IN ELEMENTARY ABSTRACT ALGEBRA. Journal of the Indonesian Mathematical Society (MIHMI), 13( 1), 133-148.
Arnon, I., Cottrill, J., Dubinsky, E., Oktaç, A., Fuentes, S. R., Trigueros, M., & Weller, K. (2014). From Piaget’s Theory to APOS Theory: Reflective Abstraction in Learning Mathematics and the Historical Development of APOS Theory in APOS Theory: A Framework for Research and Curriculum Development in Mathematics Education (pp. 5-15). New York, NY: Springer New York.
Arzarello, F., Bosch, M., Lenfant, A., & Prediger, S. (2007). Different Theoretical Perspectives in Research from Teaching Problems to Research Problems. Paper presented at the Proceedings of the Fifth Congress of the European Society for Research in Mathematics Education (CERME 5). , Larnaca, Cyprus.
Ashburn, A., & Floden, R. E. (2006). Meaningful Learning Using Technology: What Educators Need to Know From Meaningful Learning Using Technology. Denvars, MA: Teachers College, Columbia University.
Asiala, M., Brown, A., De Vries, D. J., Dubinsky, E., Mathews, D., & Thomas, K. (1996). A Framework for Research and Development in Undergraduate Mathematics Education. Research in Collegiate Mathematics Education, 2, 1-32.
Babbie, E., & Mouton, J. (2001). The practice of social research. Cape Town: Oxford University Press Southern Africa. .
Bain, A., & Ross, K. (1999). School re-engineering and SAT-1 performance: A case study. International Journal of Education Reform, 9(2), 148-153.
Bakar, K. A., Ayub, A. F. M., Luan, W. S., & Tarmizi, R. A. (2010). Exploring secondary school students’ motivation using technologies in teaching and learning mathematics. Paper presented at the Procedia-Social and Behavioral Sciences.
Bantchev, B. B. (2010). A Brief Tour to Dynamic Geometry Software. http://www.math.bas.bg/omi/DidMod/Articles/BB-dgs.pdf.
Barzel, B. (2007). "New technology? New ways of teaching - No time left for that!”. International Journal for Technology in Mathematics Education, 14(2), 77 -86.
Best, J. W., & Kahn, J. V. (1998). RESEARCH IN EDUCATION (8th EDITION ed.). Allyn and Bacon Blackett, N., & Tall, D. (1991). Gender and the Versatile learning of trigonometry using computer
software. Paper presented at the Proceedings of the 15th conference of the International group for the Psychology of Mathematics Education, Assissi, Italy.
Boston, M., & Smith, M. S. (2009). Transforming Secondary Mathematics Teaching: Increasing the Cognitive Demands of Instructional Tasks Used in Teachers' Classrooms. Journal of Research in Mathematics Education, 40(2), 119-156.
Bowie, L. (2000). A learning theory approach to students' errors in a calculus course. Pythagorus, 52, 2-14.

96
Breidenbach, D., Dubinsky, E., Hawks, J., & Nichols, D. (1992). Development of the process conception of function. Educational Studies in Mathematics, 23, 247-285.
Bressoud, D. M. (2010). Historical reflections on teaching trigonometry. Mathematics Teacher, 104(2), 106-112.
Brijlall, D., & Maharaj, A. (2004). Applying APOS theory as a theoretical framework for collaborative learning in teacher education. http://tsg.icme11.org/document/get/857. http://tsg.icme11.org/document/get/857
Brink, P. J., & Wood, M. J. (1998). Advanced Design in Nursing Research (2 ed.). Thousand Oaks, California: Sage Publications.
Brown, S. (2005). The trigonometric connection: Students' understanding of sine and cosine. (Ph D), University of Illinois, Unpublished. (UMI 3233908)
Bruner, J. (1961). The act of discovery. Harvard Educational Review, 31(1), 21-32. Bush, T. (2002). Authenticity-reliability, validity and triangulation (2 ed.). Thousand Oaks, California:
Sage Publications. Challenger, M. (2009). From triangles to a concept: a phenomenographic study of A-level students'
development of the concept of trigonometry. University of Warwick. Chiappini, G., & Bottino, R., M. (1999). Visualisation in tyeaching-learning mathematics: the role of
the computer. In Graphs and visualization education. Coimbra, Portugal (pp147-152). Choi-koh, S. S. (2003). Effect of a graphing calculator on a 10th-grade student’s study of
trigonometry,. The Journal of Educational Research, 96(6), 359-368. Christy, D. T. (1993). Essentials of precalculus algebra and trigonometry (I. A. Dubuque & W. C.
Brown Eds. (5thed.). ed.). Clements, D. H. (2000). From exercises and tasks to problems and projects - Unique contributions of
computers to innovative mathematics education.’ The Journal of Mathematical Behavior, 19( (1)), pp. 9-47.
Cohen, L., Manion, L., & Morrison, K. (2007). Research Methods in Education (6th ed.). London: Routledge
Collins, H. (2010). Creative Research: The Theory and Practice of Research for the Creative Industries: AVA Publications.
Cottrill, J., Nichols, D., Schwingendorf, K., Thomas, K., & Vidakovic, D. (1996). Undrestanding the limit concept:Beginning with a coordinated process schema. Journal of Mathematical Behavior, 15(2), 167-192.
Creswell. (2014). Research Design_Qualitative, Quantitative, and Mixed Methods Approaches (4 ed.). Los Angeles: SAGE.
Creswell, J. W. (2008). Educational Research: Planning, conducting, and evaluating quantitative and qualitative research (3 ed.). New-Jersey: Pearson Education, Inc.
Creswell, J. W., & Plano Clark, V. L. (2011 ). Designing and conducting mixed methods research (2nd ed ed.): Thousand Oaks, CA: Sage. .
Crowther, D., & Lancaster, G. (2008 ). Research Methods: A Concise Introduction to Research in Management and Business Consultancy: Butterworth-Heinemann.
Davis, J. (2005). Connecting procedural and conceptual knowledge of functions. Mathematics Teacher, 99, 36-39.
DBE. (2003). National Curriculum Statement Grades 10-12 (General) mathematics. Pretoria: Government Printers.
DBE. (2004). White Paper on e-Education. Pretoria: Government Printers. DBE. (2009). Mathematics Examination Guidelines. Pretoria: Government Printers. DBE. (2011). Curriculum and Assessment Policy Statement for Mathematics Foundation Phase. DBE. (2014). 2014 NSC Diagnostic report.pdf. Pretoria: Government Publishers. DBE. (2015). National Senior Certificate Examination 2015 -Diagnostic Report.

97
De Villiers, M. (2004). Using dynamic geometry to expand mathematics teachers' understanding of proof. International Journal of Mathematics Education, Science and Technology, 35(5), 703-724.
Demir, O. (2012). STUDENTS’ CONCEPT DEVELOPMENT AND UNDERSTANDING OF SINE AND COSINE FUNCTIONS A New Theoretical and Educational Approach (Thesis submitted for MSc in Mathematics and Science Education ), Universiteit van Amsterdam
Devonish, D., Gay, G., Alleyne, P., & Alleyne, P. (2006). Perceptions of information and communication technology among undergraduate management students in Barbados International Journal of Education and Development using Information and Communication Technology (IJEDICT), 2(4 ), pp. 617.
Dubinsky, E. (1991). Reflective Abstraction in advanced Mathematical Thinking, in 'Tall. Paper presented at the Advanced Mathematical Thinking, The Netherlands Kluwer.
Dubinsky, E. (2010). The APOS theory of learning Mathematics: Pedagogical Applications and Results. Paper presented at the Eighteenth Annual Meeting of the Southern African Association for Research in Mathematics (SAARM), Durban, South Africa.
Dubinsky, E., & McDonald, M. (2001). APOS: A Constructivist Theory of Learning in Undergraduate Mathematics Education Research in Derek Holton, et al. (eds.), The Teaching and Learning of Mathematics at University Level: An ICMI Study, Kluwer Academic Publishers, Dordrecht, Netherlands, pp. 273–280..
Duval, R. (1999). Representation, vision and visualization: cognitive functions in mathematical thinking. Basic issues for Learning (Plenary address). In F. Hitt and M. Santos (Eds), Proc. 21st PME-NA Conference, 1 (pp. 3-26). Cuernavaca, Morelos, Mexico.
Dwyer, D. (1994). Realizing the Promise of Technology Educational Leadership 51( 7 ), 4-10 Engeström, Y. (1987). Learning by expanding: an activity-theoretical approach to developmental
research. . Paper presented at the Orienta-Konsultit., Helsinki. Fey, J. T. (1989). Technology and mathematics education: A survey of recent developments and
important problems. . Educational Studies in Mathematics,, 20(3), 237- 272. Gonzales, K., & Herbst, P. (2009). Students' conceptions of congruency through the use of dynamic
geometry software. International Journal of Computers for Mathematical Learning, 14(2), 153-182.
Graham, A. T., & Thomas, M. O. J. (2000). Building a versatile understanding of algebraic variables with a graphic calculator. Educational Studies in Mathematics 41( 3), 265-282.
Gratton, C., & Jones, i. (2010). Research Methods for Sports Studies ( 2nd Edition ed. Vol. Volume 1). Gray, E. M., & Tall, D. (1994). Duality, Ambiguity and flexibility: Proceptual view of simple Arithmetic.
Journal of Research in Mathematics Education, 26(2), 115-141. Greeno, J. G., & Hall, R. (1997). Practicing Representation: Learning with and about Representational
Forms. Hanssen, C. E. (2006). A path model for evaluating teacher and student effects. Paper presented at
The Milwaukee Mathematics Partnership. Hardman, J. (2005). Activity theory as a potential framework for technology research in an unequal
terrain. South African journal of Higher education., 19(2), 378-392. Hardman, J. (2008). Researching Pedagogy: an Activity Theory approach. Journal of Education, 45. Heid, M. K. (1998). The impact of computing technology on the teaching and learning of
mathematics at the secondary level: Implications for Standards 2000. http://mathforum.org/technology/papers/papers/heid/heid.html
Hennessy, S., Fung, P., & Scanlon, E. ( 2001). The role of graphic calculator in mediating graphing activity. International Journal of Mathematical Education in Science and Technology, 32 (2), 267-290.
Hennessy, S., Ruthven, K., & Brindley, S. (2005). Teacher perspectives on integrating ICT into subject teaching: commitment, constraints, caution and change. Journal of Curriculum Studies, 37(2), 155-192.
98
Herceg, D., & Herceg, D. (2010). Numerical Integration with GeoGebra in High School. International Journal for Technology in Mathematics Education, 17(4), 205-210.
Hew, K. F., & Brush, T. (2007). Integrating technology into K-12 teaching and learning: current knowledge gaps and recommendations for future research. Education Tech Research Dev, 55, 223-252.
Hirsch, C. R., Weinhold, M., & Nichols, C. (1991). Trigonometry today. Mathematics Teacher, 84, 98-106.
Hohenwarter, M. (2002). GeoGebra - ein Softwaresystem für dynamische Geometrie und Algebra der Ebene. (Master’s thesis), Universität Salzburg.
Hohenwarter, M., & Jones, K. (2007). Ways of linking geometry and algebra: the case of Geogebra. Paper presented at the Proceedings of the British Society for Research into Learning Mathematics.
Hohenwater, M., & Fuchs, K. (2004). Combination of dynamic geometry, algebra and calculus in the software system GeoGebra
Hoyles, C. (2001). Steering Between Skills and Creativity: A Role for the Computer?í. For the Learning of Mathematics. 21 (1), 33-39.
Hoyles, C., & Lagrande, J. B. (2010). Mathematics Education and Technology-Rethinking the Terrain. New York: Springer.
Jaffer, S., Ng'ambi, D., & Czerniewicz, L. (2007). The role of ICTs in higher education in South Africa: one strategy for addressing teaching and learning challenges. International Journal of Education and Development using Information and Communication Technology (IJEDICT), 2007, Vol. 3, Issue 4, pp. 131-142, retrieved from http://www.vvob.be/vietnam/files/SubmissionGlobalLearnJP_v2.pdf.
Jakwerth, P. M., Stancavage, F. B., & Reed, E. D. (1999). An investigation of why students do not respond to questions, NAEP Validity Studies, Working Paper Series, American Institutes for Research, Palo Alto, CA.
John-Steiner, V., & Mahn, H. (1996). Sociocultural Approaches to Learning and Development: A Vygotskian Framework. Educational Psychologist, 31(3–4): 191–206.
Jonassen, D. H., & Rohrer-Murphy, L. (1999). Activity Theory as a framework for Designing Constructivist Learning Environments. Educational Technology Research and Development, 47(1), 61-79.
Kaput, J. J. (1992). Information technology and mathematics: Opening new representational windows. The Journal of Mathematical Behavior, 5(2), 187-207.
Kennewell, S. (2004). The influence of interactive presentation tools on pedagogy. Paper presented at the British Educational Research Association Conference, University of Manchester. http://www.leeds.ac.uk/educol/documents/151717.htm
Kokol-Voljc, V. (2003). Early Development of Mathematical Concepts Using Dynamic Geometry. Paper presented at the The 8th Asian Technology Conference in Mathematics (ATCM 2003), Taipei, Taiwan
Kothari, C. R. (1990). Research Methology:Methods and Techniques (2nd ed.): New Age International Publishers.
Kuhn, T. S. (1977). The essential tension : selected studies in scientific tradition and change. Chicago: University of Chicago Press.
Kutluca, T., & Baki, A. (2009). Investigating of views of students, student teachers and teachers about difficult subjects in 10th grade mathematics class. Kastamonu Education Journal, 17(2), 609-624.
Kuutti, K. (1995). Activity Theory as a potential framework for human-computer interaction research. Cambridge: MIT Press.
Laborde, C. (2001). Integration of technology in the design of geometry tasks with cabri-geometry. International Journal of Computers for Mathematical Learning. 6(3), 283–317.

99
Laborde, C. (2003). Technology used as a tool for mediating knowledge in the teaching of mathematics: the case of Cabri-geometry. Paper presented at the Proceedings of the 8th Asian Technology Conference in Mathematics, Hsinchu, Taiwan ROC: Chung Hua University.
Laborde, C. (2007). The role and uses of technologies in mathematics classrooms: Between challenge and modus vivendi. Canadian Journal of Science, Mathematics and Technology Education, 7(1), 68-92.
Laerd, L. S. (2013). Everything you need to complete your data analysis. https://statistics.laerd.com/features-overview.php
Laridon, P. J., Jawurek, A., Kitto, A., Pike, M., Myburgh, M., Rhodes-Houghton, R., & van Rooyen, R. (2002). Classroom Mathematics Grade 12 Learners’ Book. Pretoria: Heinemann.
Lawshe, C. H. (1975). A QUANTITATIVE APPROACH TO CONTENT VALIDITY. PHRSONNHL PSYCHOI.OGY, 28.
Lesser, L., & Tchoshanov, M. (2005). The effect of representation and representational sequence on students’ understanding. In (Eds.).
Lesser, L. and Tchoshanov, M. Paper presented at the Proceedings of the 27th annual meeting of the North American Chapter of the International Group for the Psychology of Mathematics Education.
Levene, H. (1960 ). Robust tests for equality of variances. Stanford University Press, Contributions to Probability and Statistics: Essays in Honor of Harold Hotelling.
Lewis, T. (1999). Research in Technology Education - Some Areas of Need. Journal of Technology Education, 10(2).
Liang, H., & Sedig, K. (2010). Can Interactive Visualization Tools Engage and Support Pre-University Students in Exploring Non-Trivial Mathematics Concepts? Computers & Education, 54(4), 972-991.
Lincoln, M. (2008). Higher Order Thinking through ICT: What do middle years teachers think really matters? Paper presented at the AARE 2008 International Education Conference : Changing Climates: Education for Sustainable Futures, Brisbane, Queensland University of Technology, AUSTRALIA.
Lopez-Morteo, G., & Lopez, G. (2007). Computer support for learning mathematics: A learning environment based on recreational learning objects. Computers & Education, 48, 618-641.
Lotfi, F. H., & Mafi, E. (2012). Efficacy of Computer Software on Trigonometry. Applied Mathematical Sciences, 6(5), 229 - 236.
Mbugua, Z. K., Kibet, K., Muthaa, G. M., & Nkonke, G., R. (2012). Factors Contributing To Students’ Poor Performance in Mathematics at Kenya Certificate of Secondary Education in Kenya: A Case of Baringo County, Kenya. American International Journal of Contemporary Research, 2(6).
McKnight, C., Magid, A., Murphy, T., & McKnight, M. (2000). Mathematics Education Research: A Guide for the Research Mathematician: American Mathematical Society.
McMillan, J. H., & Schumacher, S. (2010). Research in Education: Evidence-Based Inquiry. (7th ed.). Boston, MA: Pearson. .
Mdlongwa, T. (2012). Information and Communication Technology (ICT) as a Means of Enhancing Education in Schools in South Africa: Challenges, Benefits and Recommendations. AFRICA INSTITUTE OF SOUTH AFRICA.
Miettinen, R., Samra-Fredericks, D., & Yanow, D. (2009). Re-turn to practice: an introductory essay. Organization Studies, 30(12), 1309-1327.
Miller, A. (2011). Assessing the Common Core Standards: Real Life Mathematics. San Rafael, CA. Edutopia, the George Lucas Educational Foundation. http://www.edutopia.org/blog/assessingcommon-core-standards-real-life-mathematics (accessed March 28, 2014)

100
Milovanović, M., Takači, D., & Milajić, A. (2011). Multimedia approach in teaching mathematics - example of lesson about the definite integral application for determining an area. International Journal of Mathematical Education in Science and Technology, 42(2), 175-187.
Mistretta, R. (2005). Integrating technology into the mathematics classroom: The role of the teacher preparation programs. The Mathematics Educator, 15(1), 18-24.
Molefe, N., & Brodie, K. (2010). Teaching mathematics in the context of curriculum change. Pythagoras, 71, 3-12.
Monaghan, J. (1993). IT in mathematics initial teacher training: factors influencing school experience. Journal of Computer Assisted Learning 9, pp, 149-160.
Moore, K. C. (2009). Trigonometry, technology, and didactic objects. Paper presented at the Proceedings of the 31st annual meeting of the North American Chapter of the international Group for psychology of Mathematics Education, Atlanta, GA.
Moore, K. C. (2010). The Role of Quantitative Reasoning in Precalculus Students Learning Central Concepts of Trigonometry. Arizona State University.
Mullis, I. V. S., Martin, M. O., Foy, P., & Hooper, M. (2016). TIMSS 2011 International Results in Mathematics.Retrieved from Boston College, TIMSS & PIRLS International Study Center website: http://timssandpirls.bc.edu/timss2011/international-results/
Nardi, B. (1995). Context and Consciousness: Activity Theory and Human-Computer interaction: MIT Press. Cambridge, Massachussettees
National Council of Teachers of Mathematics (2010). 2010 MetAnnual National Council of Teachers of Mathematics. Reston, VA.
National Council of Teachers of Mathematics. (2012). Research Pre-Session National Council of Teachers of Mathematics. Reston, VA: NCTM.
National Council of Teachers of Mathematics (2014). Illuminations National Council of Teachers of Mathematics. Reston, VA.
Nelson, J., C. P. (2002). Contradictions in Learning to Write in a Second Language Classroom_Insights from Radical Constructivism, Activity Theory, and Complexity Theory. (Ph D), University of Texas at Austin. (UMI Microform 3115510)
Ng, B. K., & Hu, C. (2006 ). Use Web-based Simulation to Learn Trigonometric Curves”. International Journal for Mathematics Teaching and Learning.
NRC. (2000). How people learn National Research Council. (National Research Council). Washington, DC: National Academy Press.
NRC. (2001). Adding it Up: Helping Children Learn Mathematics National Research Council. Washington, DC: National Academy Press.
NRC. (2009). Committee on Early Childhood Mathematics. Mathematics Learning in Early Childhood: Paths Toward Excellence and Equity National Research Council. Washington, DC: National Academy Press.
Oaks, J. M., & Feldman, H. A. (2001). Statistical power for non-equivalent pretest-posttest designs. The impact of change score versus ANCOVA models. Evaluation Review, 25, 3-28.
Ogbonnaya, U., & Mogari, D. (2014). The Relationship between grade 11 achievements in trigonometric functions and their teachers' content knowledge. Mediterranean Journal of Social Sciences, 5(4), 443.
Ogbonnaya, U. I. (2010). Improving the teaching and learning of parabolic functions by the use of Information and Communication Technology (ICT). African journal of research in Mathematics, Science and technology education, 14 (1), 49 - 60.
Orhun. (2010). The gap between real numbers and trigonometric relations. Quaderni di Ricerca in Ditattica, 20, 175-184.
Pandor, N. (2007). World Ministerial Seminar on Technology in Education - Moving Young Minds - E-learning in South Africa. Queen Elizabeth II Conference Centre in Westminster, London: Government Printers.

101
Park, O. (1994). Dynamic visual displays in media-based instruction. Educational Technology, 34(4), 21-25.
Partington. (2003). Why Indigenous Issues are an Essential Component of Teacher Education Programs. Australian Jopurnal of Teacher Education, 27(2): 39-48.
Pegg, J., & Tall, D. (2005). The fundamental cycle of concept construction underlying various theoretical frameworks. from http://homepages.warwick.ac.uk/staff/David.Tall/pdfs/dot2005h-zdm-pegg-tall.pdf
Penglase, M., & Arnold, S. (1996). The graphics calculator in mathematics education: a critical review of recent research. Mathematics Education Research Journal, 8(1), 58-90.
Pritchard, L., & Simpson, A. (1999). The Role of pictorial images in trigonometry problems. Paper presented at the Proceedings of the 23rd PME International Conference.
Rice, J. A. (2006). Mathematical Statistics and Data Analysis, (Third Edition ed.): Duxbury Advanced. Rodrigo, M. T. (2001). Information and communication technology use in philippine public and
private schools. Loyola Schools Review: School of Science and Engineering, 1, 122-139. Rohmann, C. (1999 ). The world of ideas. NY Ballantine Books. Ross, J., Bruce, C., & Sibbald, T. (2011). Sequencing Computer-Assisted Learning of Transformations
of Trigonometric Functions. Teaching Mathematics and Its Applications. Oxford Press. Toronto.
Ross, J. A., Bruce, C. B., & Sibbald, T. (2011). Sequencing computer-assisted learning of transformations of trigonometric functions. . Teaching Mathematics and Its Applications, 30, 120-137.
Russell, D. (2002). Looking beyond the interphase: Activity Theory and Distributed learning. London: Routledge.
Ruthven, K. (1990). The influence of graphic calculator use on translation from graphic to symbolic forms. Educational Studies in Mathematics, 21 (5), 431-450.
Sanchez, L. (2016). Positivism. Schneider, B., Carnoy, M., Kilpatrick, J., Schmidt, W., & Shavelson, R. J. (2007). Estimating Causal
Effects Using Experimental and Observational Designs. Washington DC: American Educational Research Association.
Shelly, G. B., Cashman, T. J., Gunter, R. E., & Gunter, G. A. (2008). Teachers discovering computers- Integrating technology and digital media in the classroom. (5th ed.). Boston, Massachussets: Thomson Course Technology.
Smith, G. S., & Hardman, J. (2014). The impact of computer and mathematics software usage on performance of school leavers in the Western Cape Province of South Africa: A comparative analysis. International Journal of Education and Development using nformation and Communication Technology, 10(1), 22-40.
Smith, K. (2012). MATHS Handbook and Study Guide- Maths Made Easy. JOHANNESBURG: BERLUT BOOKS.
Spasser, M. A. (1999). Informing information science: The case for activity theory. Journal of the American society for information Society, 50(12), 1136-1138.
Steckroth, J. J. (2007). Technology-Enhanced Mathematics Instruction: Effects of Visualization on Student Understanding of Trigonometry. (Unpublished PhD Thesis, ), University of Virginia,Virginia, USA.
Stols, G. (2011). Geogebra (Open Source Software) for High School Teachers. Paper presented at the Proceedings of the Seventeenth National Congress of the Association For Mathematics Education of South Africa“ Mathematics in a Globalised World”, University of the Witwatersrand, Johannesburg.
Strässer, R. (2001). Does Dynamic Geometry Software (DGS) Change Geometry and its Teaching and Learning? International Journal of Computers for Mathematical Learning, 6(3), 319-333.
Tall, D. (1998). Information Technology and Mathematics Education: Enthusiasms, Possibilities and Realities. In C. Alsina, J.M. Alvarez, M. Niss, A. Perez, L. Rico, A. Sfard (Eds), Proceedings of
the 8th International Congress on Mathematical Education, Seville: SAEM Thales, 65-82.

102
Tall, D. (2000). Biological Brain, Mathematical Mind & Computational Computers (how the computer can support mathematical thinking and learning). Paper presented at the Proceedings of the Fifth Asian Technology Conference in Mathematics, Chiang Mai, Thailand.
Tarmizi, A. R., Ayub, M. F., Bakar, A. K., & Yunus, S. A. (2010). Effects of Technology Enhanced Teaching on Performance and Cognitive Load in Calculus. International Journal of Education and Information Technologies, 4(2), 109-120.
Tatar, E., Okur, M., & Tuna, A. (2008). A study to determine learning difficulties In secondary mathematics education. Kastamonu University Kastamonu Education Journal, 16(2), 507-516.
Tessema, A. (2012). Teacher Educators’ Professional Development towards Educational Research in Student-Centered Instruction Supported by Dynamic Mathematics Software. (Master of Science), University of Amsterdam,The Netherlands.
Thompson, P. W. (2008). Conceptual analysis of mathematical ideas: Some spadework at the foundation of mathematics education. Paper presented at the Proceedings of the Joint Meeting of PME 32 and PME-NA XXX Morélia, Mexico.
Thompson, P. W., Carlson, M. P., & Silverman, J. (2007). The design of tasks in support of teachers’ development of coherent mathematical meanings. . Journal of Mathematics Teacher Education, 10, 415-432.
Van Voorst, C. (1999). Technology in mathematics teacher education. Retrieved October 6, 2015, from http://www.icte.org/t99_library/t99_54.pdf.
Voronkov, Y. (2004). State-of-the-Art in Ethical and Legal Aspects of ICTs in Education (pp. 10-20). In: Johnson, D.G. (Ed.). Ethical, psychological and societal problems of the application of ICTs in education. Moscow: UNESCO Institute for Information Technologies in Education.
Vygotsky, L. S. (1978). Mind in society: The development of higher psychological processes. Cambridge, MA: Harvard University Press.
Weber, K. (2005). Students’ understanding of trigonometric functions. Mathematics Education Research Journal, 17(3), 91-112.
Wells, C. S., & Wollack, J., A. (2003). An Instructor's Guide to Understanding Test Reliability, Testing and evaluation services. University of Wisconsin.
Western Cape Education Department, & Africa, S. (2001). Khanya Technology in Education Project [Press release]. Retrieved from
http://downloads01.smarttech.com/media/sitecore/en/pdf/research_library/implementation_profiles/110104_southafrican_moe_profile.pdf.
Wheatley, G. H., & Brown, D. (1994). The Construction and Re-presentation of Images in Mathematical Activity. Paper presented at the 18th Conference of the International Group for the Psychology of Mathematics Education.
Wilson-Strydom, M., & Thomson, J. (2005). Understanding ICT integration in South African Classrooms. Perspectives in Education, 23(4), 71-85.
Wilson, B., & Lowry, M. (2000). Constructivist learning on the web. New Directions for Adults and Continuing Education, 88, 79-88.
Wilson, J. (2008). Dynamic Web Tools for trigonometry. Innovations in Math Technology, 2. Retrieved from https://eric.ed.gov/?id=EJ1078520.
Wisker, G. (2001). The Postgraduate Research Handbook. Succeed with your MA, MPhil, EdD and PhD (Palgrave Study Guides. Palgrave, Houndmills, Basingstoke.).
Zaslavsky, O. (2008). Attention to similarities and differences: A fundamental principle for task design and implementation in Mathematics. Paper presented at the Topic Study Group34: 11th International Congress on Mathematics Education, Mexico.
Zengin, Y., Furkan, H., & Kutluca, T. (2012). The effect of dynamic mathematics software geogebra on student achievement in teaching of trigonometry. Procedia - Social and Behavioral Sciences, 31, 183-187. doi: http://dx.doi.org/10.1016/j.sbspro.2011.12.038
103
Zulnaidi, H., & Zakaria, E. (2010). The Effect of Using GeoGebra on Conceptual and Procedural Knowledge of High School Mathematics Students. Asian Social Science.

104
APPENDICES
APPENDIX 1: PRE-TEST:- TRIGONOMETRY FUNCTIONS TEST
The test includes 5 questions. You have 1 hour and 30 minutes to complete the test.
Write your answers clearly in the parts allocated for each question. Try to be as
much explanatory as possible.
Programmable calculators are not allowed.
INSTRUCTIONS AND INFORMATION
Read the following instructions carefully before answering the questions.
1. This question paper consists of 5 questions.
2. Answer ALL the questions.
3. Clearly show ALL calculations, diagrams, graphs, et cetera which you have
used in determining your answers.
4. You may use an approved non-programmable scientific calculator.
5. A Graph paper and a diagram sheet for QUESTIONS 1, and QUESTION 3
are attached at the end of this question paper.
6. Number the answers correctly according to the numbering system used in
this question paper.

105
TOTAL MARKS: 80
TIME: 11
2HOURS
QUESTION 1
1.1 Draw, on the same system of axes, the graphs of the following functions:
1.1.a y = f(x) = 3 tan 2x; x ∈ [−180°; 180°]
1.1b y = g(x) = cos(2x) ; x ∈ [−180°; 180°]
1.1c y = h(x) = 3sinx − 2; x ∈ [−180°; 180°]
Clearly show all the important points. (12)
1.2 For each graph, answer the following questions:
a) Write down the amplitude of g. (1)
b) Write down the amplitude of h. (1)
c) Give the period of 𝑓. (1)
d) Give the domain of 𝑔. (1)
e) Give the range of ℎ. (1)
f) Give the maximum value of ℎ (1)
g) Write down the maximum value of 𝑔. (1)
h) Write down the asymptotes of 𝑓. (2)
i) Write down the equation of the function of x if moved 30° to the left and
two units up. (2)
[23]
QUESTION 2
Write down the value(s) of a, b, p and q from the graphs below:

106
a) y = asin bx + q (6)
b) y = atan bx
(3)
c) y = acos(x + p) (4)

107
[13]
QUESTION 3
The diagram below represents the graphs of y = f(x) = 2 cos 3x and y = g(x) =
3 sin 2x for x ∈ [−90°; 90°]
a) Write down the coordinates of P, the y-intercept of f. (2)
b) Write down the coordinates of the x-intercepts of f and g.
(4)

108
c) On the graph, show where the points of intersection of f and g are. LABEL
the points as A, B and C. (3)
d) From the graph determine the value(s) of ( x) for which
i) f(x) = 3 (1)
ii) f(x) − g(x) = 0 (3)
e) On the graph, shade the regions where f(x) ≥ g(x). (3)
[16]
QUESTION 4
a)
QUESTION 4
a) If f(x) = cos x and g(x) = −2 cos(2x − 30) + 3 , describe the transformation
from f to g. , (5)
[5]
QUESTION 5;
5.1 Given:
A, P and C are points on the unit circle in the figure above. They correspond to
rotation about the origin in the anti-clockwise direction starting from A (1, 0). ‹ POQ =
65

109
5.1.1 Write down sin 65 (1)
5.12 Write down cos 65 (1)
5.1.3 Write down the coordinates of a point on the graph of sinθ which corresponds
to P on the unit circle. (2)
5.2 Consider the identity: cos 2A
1+sin 2A =
1−tan A
1+tan A
5.2.1 Prove the identity. (7)
5.2.2 For which value(s) of x in the interval 0< x <180° will the identity
be undefined? (2)
5.3 Determine the general solution of 4cos2A + sin2θ –3=0. (5)
5.4 Solve sin x = cos 3x where x ∈ (−180°; 180°) (5)
[23]

110
APPENDIX 2: POST-TEST- TRIGOMOMETRY FUNCTIONS
TOTAL MARKS: 80
TIME: 11
2HOURS
INSTRUCTIONS AND INFORMATION
Read the following instructions carefully before answering the questions.
1. This question paper consists of 5 questions.
2. Answer ALL the questions.
3. Clearly show ALL calculations, diagrams, graphs, et cetera which you have
used in determining your answers.
4. You may use an approved scientific non-programmable calculator.
5. Graph paper and a diagram sheet for QUESTIONS 1, and QUESTION 3 are
attached at the end of this question paper.
6. Number the answers correctly according to the numbering system used in this
question paper.
TOTAL MARKS: 80
TIME: 11
2HOURS

111
QUESTION 1
Draw, on the same system of axes, the graphs of the following functions:
1.1a y = f(x) = −3 tan 2x; x ∈ [−180°; 180°]
1.1b 𝑦 = 𝑔(𝑥) = 𝑐𝑜𝑠 (2𝑥); 𝑥 ∈ [−180°; 180°]
1.1c 𝑦 = ℎ(𝑥) = 3𝑠𝑖𝑛𝑥 + 2; 𝑥 ∈ [−180°; 180°]
Clearly show all the important points. (12)
2. For each graph, answer the following questions:
a) Write down the amplitude of g. (1)
b) Write down the amplitude of h. (1)
c) Give the period of f. (1)
d) Give the domain of g. (1)
e) Give the range of h. (1)
f) Give the maximum value of h. (1)
g) Write down the maximum value of g. (1)
h) Write down the asymptotes of f. (2)
i) Write down the equation of the function of x if moved 30° to the left and two
units up. (2)
[23]
QUESTION 2

112
Write down the value(s) of a, b, p and q from the graphs below:
a) y = asin bx + q (6)
b) y = atan bx
(3)

113
c) y = acos(x + p) (4)
[13]
QUESTION 3
The diagram below represents the graphs of y = f(x) = 2 cos 3x and y = g(x) =
3 sin 2x for x ∈ [−90°; 90°]
a) Write down the coordinates of P, the y-intercept of g. (2)
b) Write down the coordinates of the x-intercepts of f and g. (4)

114
c) On the graph, show where the points of intersection of f and g are. LABEL
the points as S, T and U. (3)
d) From the graph determine the value(s) of ( x) for which
i) g(x) = 3 (1)
ii) f(x) = g(x) (3)
e) On the graph, shade the regions where f(x) ≥ g(x). (3)
[16]
QUESTION 4
a) If f(x) = cos x and g(x) = −2 cos(2x − 30) − 2 , describe the transformation
from f to g. , (5)
[5]
QUESTION 5;
5.1 Given:

115
A, P and C are points on the unit circle in the figure above. They correspond to
rotation about the origin in the anti-clockwise direction starting from A (1, 0). ‹ POQ =
65
5.1.1 Write down sin 65 (1)
5.12 Write down cos 65 (1)
5.1.3 Write down the coordinates of a point on the graph of sinθ which
corresponds to P on the unit circle. (2)
5.2 Determine the general solution of 4cos2A + sin2θ –3=0. (5)
5.3 Solve sin x = cos 3x where x ∈ (−180°; 180°) (5)
5.4 Consider the identity: cos 2x−2𝑠𝑖𝑛2x
cosx−sin 2x =
1+2sinx
cosx
5.4.1 Prove the identity. (7)
5.4.2 For which value(s) of x in the interval 0< x <180° will the identity
be undefined? (2)
[23]

116
APPENDIX 3 : INSTRUMENT VALIDATION FORM FOR SMEs
To ensure validity of the academic tests, the attached instrument –was developed
and given to SMEs for moderation of the assessment instruments for compliance to
the grade 12 CAPs curriculum.
The SMEs were requested to evaluate the questions and indicate the level of
significance of each question to test grade 12 students knowledge of trigonometry
functions in line with the CAPS curriculum using a three-point scale: 0= Not
Significant; 1= Slightly significant; 2= Totally significant.
Questions Significance Comment
Q1.1a
Q1.1b
Q1.1c
Q1.2a
Q1.2b
Q1.2c
Q1.2d
Q1.2e
Q1.2f
Q1.2g
Q1.2h
Q1.2i
Q4
Q2a
Q2b
Q2c
Q3a
Q3b
Q3c
Q3d(i)
Q3(ii)
Q3e

117
Q5.1.1
Q5.1.2
Q5.1.3
Q5.2.1
Q5.2.2
Q5.3
Q5.4

118
APPENDIX 4: PERMISSION LETTER TO REGISTER FOR THESIS

119

120

121
APPENDIX 5: PERMISSION LETTER FROM SGB MASCCOM

122

123
APPENDIX 6: PERMISSION LETTER FROM NW EDUCATION DEPARTMENT
MASCOMM
P.O. Box 464
MAFIKENG, 2745
The Director/ Deputy Director,
North West Department of
Education, Private Bag X 2044,
Mmabatho, 2735.
Dear Sir / Madam
Permission to participate in
research
I, Nthabiseng Mmamotho Mosese, am currently studying for a Masters’ Degree in
Mathematics, Science and Technology Education with the University of South Africa
(UNISA). Part of the requirements for the degree is that I am expected to conduct a
research study. Two schools in the Mafikeng area, namely MASCCOM and
Sebonego Upgrading have been identified as those with the appropriate
infrastructure and the human capacity for me to carry out the study. The research
will not in any way disrupt normal academic processes at these institutions.
The title of my proposed dissertation is: Evaluating the effectiveness of the use of Information and Communication Technology (ICT) in the teaching and learning of trigonometry functions.
I hereby humbly request that by signing, and so indicating, you grant me the
permission to conduct this study at these schools.
I pledge to maintain professional and research ethical conduct. This implies that:
• Participation in this research remains voluntary and they may, at any time,
withdraw from the research
• Personal information, at all times, will be treated as confidential
• No demands will be made on their academic teaching program
• Should you be interested, the research findings will be made available to you.

124
May you thus provide me with your written consent by filling in the section on the
next page? Please return the consent form to me. Your input and opinions are
highly appreciated! Yours sincerely
_______________________________
N.M. Mosese
MSc Ed Candidate, UNISA
Student number: 46985484
Office number: +27 18 384 5211
Fax number: +27 18 384 4146

125

126
APPENDIX 7: PERMISSION LETTER

127

128

129
APPENDIX 8: STUDENTS’ CONSENT FORM
TITLE OF RESEARCH PROJECT
Evaluating the effectiveness of the use of Information and Communication Technology (ICT) in the teaching and learning of trigonometric functions
Dear Mr/Miss/Ms _______________________________ Date: ……/ ….…/2016
NATURE AND PURPOSE OF THE STUDY
The purpose of this research project is to explore the possible effects of teaching and
learning trigonometry through the use of Information Communication and Technology (ICT).
The study makes use of qualitative and quantitative (a mixed) method of study.
RESEARCH PROCESS (thorough and clear description of all data gathering processes that will take
place)
1 The study requires your participation in a pre-test and a post-test.
2 The study requires your participation in an interview.
3 You do not need to prepare anything in advance.
CONFIDENTIALITY
No data published in dissertations and journals will contain any information through which
members involved in the study or interviews may be identified. Your anonymity is therefore
ensured.
WITHDRAWAL CLAUSE
You may withdraw from the research at any time, you therefore participate voluntarily until
such time as you indicate otherwise.
POTENTIAL BENEFITS OF THE STUDY (brief as in the research proposal)
In light of the continued low performance of learners in Mathematics and specifically in
Trigonometry, this study investigates possible teaching strategies to address the low pass
rate. The study will probe alternative ways of teaching trigonometry as well as possibly
improve learner understanding of Trigonometry. Researchers may increase or moderate my
findings. The teachers may use ICT in their classes and take up the software which is freely
available.
INFORMATION (contact information of supervisor)
If you have any questions concerning the study, you may contact the researcher Ms N.M.
Mosese, on 083 586 1936 (OR the supervisor Prof D Mogari on 011 670 9422 and Dr
Ogbonnaya on 0737208026).

130
CONSENT
I, the undersigned, ……………………………………………………………….… (full name)
have read the above information relating to the study and have also heard the verbal
version, and declare that I understand it. I have been afforded the opportunity to discuss
relevant aspects of the project with the researcher, and hereby declare that I agree
voluntarily to participate in the project.
I have received a signed copy of this consent form.
Participant
Name : ____________________________ Signature : _____________________________
Signed at: __________________________ on: ___________________________________
Researcher:
Nthabiseng Mosese
Name: ____________________________. Signature:_______________________________

131
APPENDIX 9: ACHIEVEMENT LEVEL DESCRIPTIONS OF COMPETENCE
PERCENTAGE BANDS (DBE, 2015)
RATING CODE DESCRIPTION OF COMPETENCE PERCENTAGE
7 Outstanding achievement 80 – 100
6 Meritorious achievement 70 – 79
5 Substantial achievement 60 – 69
4 Adequate achievement 50 – 59
3 Moderate achievement 40 – 49
2 Elementary achievement 30 – 39
1 Not achieved 0 – 29

132
APPENDIX 10: CORRELATIONS OF TWO EQUIVALENT GROUPS
Correlations
Group A Group B
Group
A
Pearson Correlation 1 .677*
Sig. (2-tailed) .011
N 13 13
Group
B
Pearson Correlation .677* 1
Sig. (2-tailed) .011
N 13 13
*. Correlation is significant at the 0.05 level (2-tailed).

133
APPENDIX 11: GROUPS’ MEAN ACHIEVEMENTS BY QUESTION

134
APPENDIX 12A: STUDENTS’ MEAN ACHIEVEMENT ON QUESTION 1_1a
N Mean Std. Deviation Std. Error Mean
Experimental group 27 .926 1.2066 .2322
Control group 34 .235 .9553 .1638
APPENDIX 12B: t-test ON STUDENTS’ ACHIEVEMENT IN QUESTION 1_1a
Levene's Test
for Equality of
Variances t-test for Equality of Means
F Sig. t Df
Sig. (2-
tailed)
Mean
Difference
Std. Error
Difference
95% Confidence
Interval of the
Difference
Lower Upper
Equal
variances
assumed
6.527 .013 2.496 59 .015 .6906 .2767 .1370 1.2443
Equal variances
not assumed 2.430 48.802 .019 .6906 .2842 .1195 1.2618

135
APPENDIX 13A: STUDENTS’ MEAN ACHIEVEMENT ON QUESTION 1_1b
N Mean Std. Deviation Std. Error Mean
Experimental group 27 3.296 .4653 .0896
Control group 34 2.794 1.0668 .1830
APPENDIX 13B: t-test ON STUDENTS’ ACHIEVEMENT ON QUESTION 1_1b
Levene's Test for
Equality of
Variances t-test for Equality of Means
F Sig. t df
Sig. (2-
tailed)
Mean
Difference
Std. Error
Difference
95% Confidence
Interval of the
Difference
Lower Upper
Equal variances
assumed 9.230 .004 2.277 59 .026 .5022 .2205 .0609 .9435
Equal variances
not assumed 2.465 47.262 .017 .5022 .2037 .0924 .9119

136
APPENDIX 14A: STUDENTS’ MEAN ACHIEVEMENT ON QUESTION 1_1c
N Mean Std. Deviation Std. Error Mean
Experimental group 27 3.148 .6015 .1158
Control group 34 1.471 1.3977 .2397
APPENDIX 14B: t-test ON STUDENTS’ ACHIEVEMENT IN QUESTION 1_1c
Levene's Test for
Equality of
Variances t-test for Equality of Means
F Sig. t Df
Sig. (2-
tailed)
Mean
Difference
Std. Error
Difference
95% Confidence
Interval of the
Difference
Lower Upper
1 Equal variances
assumed 23.636 .000 5.816 59 .000 1.6776 .2885 1.1004 2.2548
Equal variances not
assumed 6.302 46.946 .000 1.6776 .2662 1.1420 2.2131

137
APPENDIX 15A: STUDENTS’ MEAN ACHIEVEMENT ON QUESTION 12a
N Mean Std. Deviation Std. Error Mean
Experimental group 27 1.00 .000 .000
Control group 33 .58 .502 .087
APPENDIX 15B: t-test ON STUDENTS’ ACHIEVEMENT ON QUESTION 1.2a
Levene's Test for
Equality of
Variances t-test for Equality of Means
F Sig. T Df
Sig. (2-
tailed)
Mean
Difference
Std. Error
Difference
95%
Confidence
Interval of the
Difference
Lower Upper
1 Equal variances
assumed 1110.816 .000 4.385 58 .000 .424 .097 .231 .618
Equal variances
not assumed 4.856 32.000 .000 .424 .087 .246 .602

138
APPENDIX 16A: STUDENTS’ MEAN ACHIEVEMENT ON QUESTION 1.2b
N Mean Std. Deviation Std. Error Mean
Experimental group 27 1.000 .0000 .0000
Control group 34 .353 .4851 .0832
APPENDIX 16B: t-test ON STUDENTS’ ACHIEVEMENT ON QUESTION 1.2b
Levene's Test
for Equality of
Variances t-test for Equality of Means
F Sig. t df
Sig. (2-
tailed)
Mean
Difference
Std. Error
Difference
95%
Confidence
Interval of the
Difference
Lower Upper
1 Equal variances assumed 275.772 .000 6.919 59 .000 .6471 .0935 .4599 .8342
Equal variances not
assumed 7.778 33.000 .000 .6471 .0832 .4778 .8163

139
APPENDIX 17A: STUDENTS’ MEAN ACHIEVEMENT ON QUESTION 1.2c
N Mean Std. Deviation Std. Error Mean
Experimental group 27 .667 .4804 .0925
Control group 34 .235 .4306 .0738
APPENDIX 17B: t-test ON STUDENTS’ ACHIEVEMENT ON QUESTION 1.2c
Levene's Test for
Equality of
Variances t-test for Equality of Means
F Sig. t Df
Sig. (2-
tailed)
Mean
Difference
Std. Error
Difference
95% Confidence
Interval of the
Difference
Lower Upper
Equal variances
assumed 2.668 .108 3.693 59 .000 .4314 .1168 .1976 .6651
Equal variances
not assumed 3.646 52.818 .001 .4314 .1183 .1940 .6687

140
APPENDIX 18A: STUDENTS’ MEAN ACHIEVEMENT ON QUESTION 1.2d
N Mean Std. Deviation Std. Error Mean
Experimental
group 27 .259 .4466 .0859
Control group 34 .206 .4104 .0704
APPENDIX 18B: t-test ON STUDENTS’ ACHIEVEMENT ON QUESTION 1.2d
Levene's Test
for Equality of
Variances t-test for Equality of Means
F Sig. t Df
Sig. (2-
tailed)
Mean
Difference
Std. Error
Difference
95% Confidence
Interval of the
Difference
Lower Upper
Equal variances
assumed .926 .340 .485 59 .629 .0534 .1100 -.1667 .2735
Equal variances
not assumed .480 53.583 .633 .0534 .1111 -.1694 .2761

141
APPENDIX 19A: STUDENTS’ MEAN ACHIEVEMENT ON QUESTION 1.2e
1_2e N Mean Std. Deviation Std. Error Mean
Experimental group 27 .333 .4804 .0925
Control group 34 .294 .4625 .0793
APPENDIX 19B: t-test ON STUDENTS’ ACHIEVEMENT ON QUESTION 1.2e
Levene's Test for
Equality of
Variances t-test for Equality of Means
F Sig. t Df
Sig. (2-
tailed)
Mean
Difference
Std. Error
Difference
95% Confidence
Interval of the
Difference
Lower Upper
Equal variances
assumed .407 .526 .323 59 .748 .0392 .1213 -.2035 .2819
Equal variances not
assumed .322 54.919 .749 .0392 .1218 -.2049 .2833

142
APPENDIX 20A: STUDENTS’ MEAN ACHIEVEMENT ON QUESTION 1.2f
N Mean Std. Deviation Std. Error Mean
Experimental group 27 .852 .3620 .0697
Control group 34 .265 .4478 .0768
APPENDIX 20B: t-test ON STUDENTS’ ACHIEVEMENT ON QUESTION 1.2f
Levene's Test for
Equality of
Variances t-test for Equality of Means
F Sig. t Df
Sig. (2-
tailed)
Mean
Difference
Std. Error
Difference
95% Confidence
Interval of the
Difference
Lower Upper
Equal variances
assumed 5.276 .025 5.526 59 .000 .5871 .1063 .3745 .7998
Equal variances
not assumed 5.662 58.972 .000 .5871 .1037 .3797 .7946

143
APPENDIX 21A: STUDENTS’ MEAN ACHIEVEMENT ON QUESTION 1.2g
N Mean Std. Deviation Std. Error Mean
Experimental group 27 .889 .3203 .0616
Control group 34 .471 .5066 .0869
APPENDIX 21B: t-test ON STUDENTS’ ACHIEVEMENT ON QUESTION 1.2g
Levene's Test
for Equality of
Variances t-test for Equality of Means
F Sig. t df
Sig. (2-
tailed)
Mean
Difference
Std. Error
Difference
95% Confidence
Interval of the
Difference
Lower Upper
Equal variances
assumed 48.893 .000 3.735 59 .000 .4183 .1120 .1942 .6424
Equal variances
not assumed 3.927 56.430 .000 .4183 .1065 .2049 .6317

144
APPENDIX 22A: STUDENTS’ MEAN ACHIEVEMENT ON QUESTION 1.2h
N Mean Std. Deviation Std. Error Mean
Experimental group 27 1.148 .9885 .1902
Control group 34 .147 .5004 .0858
APPENDIX 22B: t-test ON STUDENTS’ ACHIEVEMENT ON QUESTION 1.2h
Levene's Test for
Equality of
Variances t-test for Equality of Means
F Sig. t Df
Sig. (2-
tailed)
Mean
Difference
Std. Error
Difference
95% Confidence
Interval of the
Difference
Lower Upper
Equal variances
assumed 58.045 .000 5.141 59 .000 1.0011 .1947 .6114 1.3908
Equal variances
not assumed 4.797 36.470 .000 1.0011 .2087 .5780 1.4242

145
APPENDIX 23A: STUDENTS’ MEAN ACHIEVEMENT ON QUESTION 1.2i
N Mean Std. Deviation Std. Error Mean
Experimental group 27 1.148 .8640 .1663
Control group 34 .059 .3430 .0588
APPENDIX 23B: t-test ON STUDENTS’ ACHIEVEMENT -QUESTION 1.2i
Levene's Test for
Equality of
Variances t-test for Equality of Means
F Sig. t Df
Sig. (2-
tailed)
Mean
Difference
Std. Error
Difference
95% Confidence
Interval of the
Difference
Lower Upper
Equal variances
assumed 49.840 .000 6.726 59 .000 1.0893 .1620 .7652 1.4134
Equal variances
not assumed 6.176 32.514 .000 1.0893 .1764 .7303 1.4484

146
APPENDIX 24A: STUDENTS’ MEAN ACHIEVEMENT ON QUESTION 4
N Mean Std. Deviation Std. Error Mean
Experimental group 27 1.370 1.5479 .2979
Control group 34 .294 .7190 .1233
APPENDIX 24B: t-test ON STUDENTS’ ACHIEVEMENT -QUESTION 4
Levene's Test for
Equality of
Variances t-test for Equality of Means
F Sig. t df
Sig. (2-
tailed)
Mean
Difference
Std. Error
Difference
95%
Confidence
Interval of the
Difference
Lower Upper
Equal variances
assumed 23.541 .000 3.600 59 .001 1.0763 .2990 .4780 1.6745
Equal variances
not assumed 3.338 34.866 .002 1.0763 .3224 .4216 1.7309

147
APPENDIX 25A: STUDENTS’ MEAN ACHIEVEMENT ON QUESTION 2a
N Mean Std. Deviation Std. Error Mean
Experimental group 27 1.037 1.1596 .2232
Control group 34 .824 1.3136 .2253
APPENDIX 25B: t-test ON STUDENTS’ ACHIEVEMENT -QUESTION 2a
Levene's Test
for Equality of
Variances t-test for Equality of Means
F Sig. t df
Sig. (2-
tailed)
Mean
Difference
Std. Error
Difference
95% Confidence
Interval of the
Difference
Lower Upper
Equal variances
assumed .004 .951 .664 59 .510 .2135 .3217 -.4303 .8573
Equal variances
not assumed .673 58.294 .503 .2135 .3171 -.4212 .8482

148
APPENDIX 26A: STUDENTS’ MEAN ACHIEVEMENT ON QUESTION 2b
N Mean Std. Deviation Std. Error Mean
Experimental group 27 .148 .4560 .0878
Control group 34 .000 .0000 .0000
APPENDIX 26B: t-test ON STUDENTS’ ACHIEVEMENT -QUESTION 2b
Levene's Test for
Equality of
Variances t-test for Equality of Means
F Sig. t Df
Sig. (2-
tailed)
Mean
Difference
Std. Error
Difference
95% Confidence
Interval of the
Difference
Lower Upper
Equal variances
assumed 17.425 .000 1.898 59 .063 .1481 .0780 -.0080 .3043
Equal variances
not assumed 1.688 26.000 .103 .1481 .0878 -.0323 .3286

149
APPENDIX 27A: STUDENTS’ MEAN ACHIEVEMENT ON QUESTION 2c
N Mean Std. Deviation Std. Error Mean
Experimental group 27 2.704 1.1706 .2253
Control group 34 .971 1.1142 .1911
APPENDIX 27B:t-test ON STUDENTS’ ACHIEVEMENT -QUESTION 2c
Levene's Test
for Equality of
Variances t-test for Equality of Means
F Sig. T df
Sig. (2-
tailed)
Mean
Difference
Std. Error
Difference
95% Confidence
Interval of the
Difference
Lower Upper
Equal variances
assumed .052 .820 5.901 59 .000 1.7331 .2937 1.1454 2.3208
Equal variances
not assumed 5.867 54.602 .000 1.7331 .2954 1.1410 2.3252

150
APPENDIX 28A: STUDENTS’ MEAN ACHIEVEMENT ON QUESTION 3a
N Mean Std. Deviation Std. Error Mean
Experimental group 27 .407 .5007 .0964
Control group 34 .882 .8077 .1385
APPENDIX 28B: t-test ON STUDENTS’ ACHIEVEMENT- QUESTION 3a
Levene's Test
for Equality of
Variances t-test for Equality of Means
F Sig. T Df
Sig. (2-
tailed)
Mean
Difference
Std. Error
Difference
95% Confidence
Interval of the
Difference
Lower Upper
Equal variances
assumed 5.211 .026 -2.672 59 .010 -.4749 .1777 -.8306 -.1193
Equal variances
not assumed -2.815 56.017 .007 -.4749 .1687 -.8130 -.1369

151
APPENDIX 29A: STUDENTS’ MEAN ACHIEVEMENT ON QUESTION 3b
N Mean Std. Deviation Std. Error Mean
Experimental group 27 .815 1.0014 .1927
Control group 34 .912 1.1901 .2041
APPENDIX 29B: t-test ON STUDENTS’ ACHIEVEMENT -QUESTION 3b
Levene's Test for
Equality of
Variances t-test for Equality of Means
F Sig. T Df
Sig. (2-
tailed)
Mean
Difference
Std. Error
Difference
95% Confidence
Interval of the
Difference
Lower Upper
Equal variances
assumed .205 .652 -.339 59 .736 -.0969 .2864 -.6700 .4761
Equal variances
not assumed -.345 58.775 .731 -.0969 .2807 -.6587 .4648

152
APPENDIX 30A: STUDENTS’ MEAN ACHIEVEMENT ON QUESTION 3c
N Mean Std. Deviation Std. Error Mean
Experimental group 27 2.778 .8006 .1541
Control group 34 1.882 1.4515 .2489
APPENDIX 30B: t-test ON STUDENTS’ ACHIEVEMENT -QUESTION 3c
Levene's Test
for Equality of
Variances t-test for Equality of Means
F Sig. t df
Sig. (2-
tailed)
Mean
Difference
Std. Error
Difference
95% Confidence
Interval of the
Difference
Lower Upper
3 Equal variances
assumed 49.590 .000 2.874 59 .006 .8954 .3116 .2720 1.5189
Equal variances
not assumed 3.059 53.216 .003 .8954 .2928 .3083 1.4826

153
APPENDIX 31A: STUDENTS’ MEAN ACHIEVEMENT ON QUESTION 3di
N Mean Std. Deviation Std. Error Mean
Experimental group 27 .148 .3620 .0697
Control group 34 .235 .4306 .0738
APPENDIX 31B: t-test on STUDENTS’ ACHIEVEMENT -QUESTION 3di
Levene's Test for
Equality of
Variances t-test for Equality of Means
F Sig. t df
Sig. (2-
tailed)
Mean
Difference
Std. Error
Difference
95% Confidence
Interval of the
Difference
Lower Upper
Equal variances
assumed 3.014 .088 -.841 59 .404 -.0871 .1036 -.2944 .1201
Equal variances
not assumed -.858 58.781 .394 -.0871 .1015 -.2903 .1160

154
APPENDIX 32A: STUDENTS’ MEAN ACHIEVEMENT ON QUESTION 3dii
N Mean Std. Deviation Std. Error Mean
Experimental group 27 .444 1.0860 .2090
Control group 34 .588 .9572 .1642
APPENDIX 32B: t-test ON STUDENTS’ ACHIEVEMENT- QUESTION 3dii
Levene's Test for
Equality of
Variances t-test for Equality of Means
F Sig. T df
Sig. (2-
tailed)
Mean
Difference
Std. Error
Difference
95% Confidence
Interval of the
Difference
Lower Upper
Equal variances
assumed .056 .815 -.549 59 .585 -.1438 .2619 -.6678 .3803
Equal variances
not assumed -.541 52.293 .591 -.1438 .2658 -.6770 .3894

155
APPENDIX 33A: STUDENTS’ MEAN ACHIEVEMENT ON QUESTION 3e
N Mean Std. Deviation Std. Error Mean
Experimental group 27 .519 1.0874 .2093
Control group 34 .706 1.2917 .2215
APPENDIX 33B: t-test ON STUDENTS’ ACHIEVEMENT -QUESTION 3e
Levene's Test
for Equality of
Variances t-test for Equality of Means
F Sig. T df
Sig. (2-
tailed)
Mean
Difference
Std. Error
Difference
95% Confidence
Interval of the
Difference
Lower Upper
Equal variances
assumed 2.313 .134 -.603 59 .549 -.1874 .3109 -.8094 .4347
Equal variances
not assumed -.615
58.77
3 .541 -.1874 .3047 -.7972 .4225
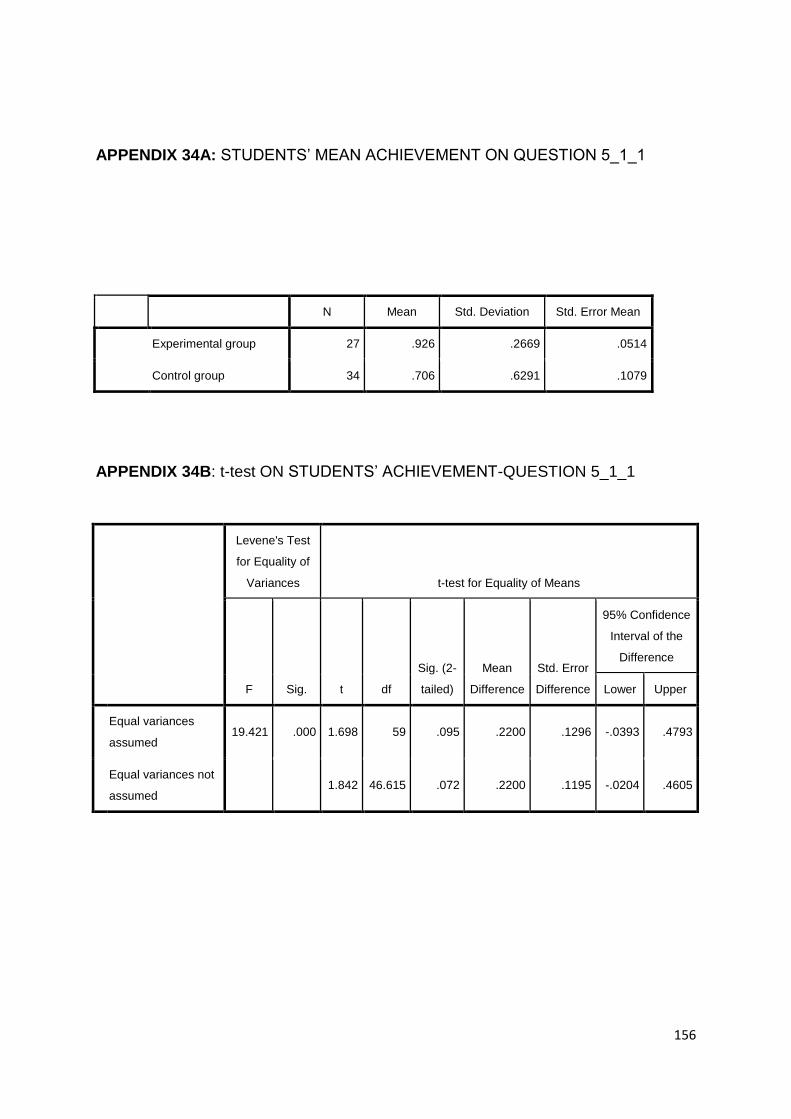
156
APPENDIX 34A: STUDENTS’ MEAN ACHIEVEMENT ON QUESTION 5_1_1
N Mean Std. Deviation Std. Error Mean
Experimental group 27 .926 .2669 .0514
Control group 34 .706 .6291 .1079
APPENDIX 34B: t-test ON STUDENTS’ ACHIEVEMENT-QUESTION 5_1_1
Levene's Test
for Equality of
Variances t-test for Equality of Means
F Sig. t df
Sig. (2-
tailed)
Mean
Difference
Std. Error
Difference
95% Confidence
Interval of the
Difference
Lower Upper
Equal variances
assumed 19.421 .000 1.698 59 .095 .2200 .1296 -.0393 .4793
Equal variances not
assumed 1.842 46.615 .072 .2200 .1195 -.0204 .4605

157
APPENDIX 35A: STUDENTS’ MEAN ACHIEVEMENT ON QUESTION 5_1_2
N Mean Std. Deviation Std. Error Mean
Experimental group 27 .926 .2669 .0514
Control group 34 .647 .4851 .0832
APPENDIX 35B: t-test ON STUDENTS’ ACHIEVEMENT -QUESTION 5_1_2
Levene's Test for
Equality of
Variances t-test for Equality of Means
F Sig. t df
Sig. (2-
tailed)
Mean
Difference
Std. Error
Difference
95% Confidence
Interval of the
Difference
Lower Upper
Equal variances
assumed 44.991 .000 2.680 59 .010 .2789 .1041 .0706 .4871
Equal variances
not assumed 2.852 53.151 .006 .2789 .0978 .0828 .4749

158
APPENDIX 36A: STUDENTS’ MEAN ACHIEVEMENT ON QUESTION 5_1_3
N Mean Std. Deviation Std. Error Mean
Experimental group 27 1.296 .9533 .1835
Control group 34 .000 .0000 .0000
APPENDIX 36b: t-test ON STUDENTS’ ACHIEVEMENT -QUESTION 5_1_3
Levene's Test for
Equality of
Variances t-test for Equality of Means
F Sig. t Df
Sig. (2-
tailed)
Mean
Difference
Std. Error
Difference
95% Confidence
Interval of the
Difference
Lower Upper
Equal variances
assumed 287.187 .000 7.946 59 .000 1.2963 .1631 .9699 1.6227
Equal variances
not assumed 7.066 26.000 .000 1.2963 .1835 .9192 1.6734

159
APPENDIX 37A: STUDENTS’ MEAN ACHIEVEMENT ON QUESTION 5_2_1
N Mean Std. Deviation Std. Error Mean
Experimental group 27 .148 .6015 .1158
Control group 34 .647 1.7035 .2922
APPENDIX 37B: t-test ON STUDENTS’ MEAN ACHIEVEMENT QUESTION 5_2_1
Levene's Test for
Equality of
Variances t-test for Equality of Means
F Sig. t Df
Sig. (2-
tailed)
Mean
Difference
Std. Error
Difference
95% Confidence
Interval of the
Difference
Lower Upper
Equal variances
assumed 9.898 .003 -1.450 59 .152 -.4989 .3442 -1.1876 .1898
Equal variances
not assumed -1.588 42.836 .120 -.4989 .3142 -1.1327 .1349